As filed with the Securities and Exchange Commission on April 23, 201226, 2013
UNITED STATES SECURITIES AND EXCHANGE COMMISSION
Washington, D.C. 20549
FORM 20-F
| ¨ | REGISTRATION STATEMENT PURSUANT TO SECTION 12(B) OR 12(G) OF THE SECURITIES EXCHANGE ACT OF 1934 OR |
| x | ANNUAL REPORT PURSUANT TO SECTION 13 OR 15(D) OF THE SECURITIES EXCHANGE ACT OF 1934 OR |
| ¨ | TRANSITION REPORT PURSUANT TO SECTION 13 OR 15(D) OF THE SECURITIES EXCHANGE ACT OF 1934 OR |
| ¨ | SHELL COMPANY REPORT PURSUANT TO SECTION 13 OR 15(D) OF THE SECURITIES EXCHANGE ACT OF 1934 |
FOR THE FINANCIAL YEAR ENDED DECEMBER 31, 20112012
Commission file number: 1-14846
AngloGold Ashanti Limited
(Exact Name of Registrant as Specified in its Charter)
Republic of South Africa
(Jurisdiction of Incorporation or Organization)
76 Jeppe Street, Newtown, Johannesburg, 2001
(P.O. Box 62117, Marshalltown, 2107)
South Africa
(Address of Principal Executive Offices)
Lynda Eatwell,ME Sanz Perez, Company Secretary, Telephone: +27 11 6376128,6376306, Facsimile: +27 11 637667786 6750137
E-mail: leatwell@anglogoldashanti.com,rsanz@anglogoldashanti.com, 76 Jeppe Street, Newtown, Johannesburg, 2001, South Africa
(Name, Telephone, E-mail and/or Facsimile number and Address of Company Contact Person)
Securities registered pursuant to Section 12(b) of the Act:
| Title of each class | Name of each exchange on which registered | |
American Depositary Shares | New York Stock Exchange | |
Ordinary Shares | New York Stock Exchange* | |
6.00 Percent Mandatory Convertible Subordinated Bonds due 2013 | New York Stock Exchange |
| * | Not for trading, but only in connection with the registration of American Depositary Shares pursuant to the requirements of the Securities and Exchange Commission |
Securities registered pursuant to Section 12(g) of the Act:
None
Securities for which there is a reporting obligation pursuant to Section 15(d) of the Act:
None
Indicate the number of outstanding shares of each of the issuer’s classes of capital or common stock as of the close of the period covered by the annual report:
Ordinary Shares of 25 ZAR cents each | ||||
E Ordinary Shares of 25 ZAR cents each | ||||
A Redeemable Preference Shares of 50 ZAR cents each | 2,000,000 | |||
B Redeemable Preference Shares of 1 ZAR cent each | 778,896 |
Indicate by check mark if the registrant is a well-known seasoned issuer, as defined in Rule 405 of the Securities Act.
| Yes x No ¨ |
If this report is an annual or transition report, indicate by check mark if the registrant is not required to file reports pursuant to Section 13 or 15(d) of the
Securities Exchange Act of 1934. | Yes ¨ No x |
Indicate by check mark whether the registrant (1) has filed all reports required to be filed by Section 13 or 15(d) of the Securities Exchange Act of 1934 during the preceding 12 months (or for such shorter period that the registrant was required to file such reports), and (2) has been subject to such filing
requirements for the past 90 days. | Yes x No ¨ |
Indicate by check mark whether the registrant (1) has submitted electronically and posted on its corporate web site, if any, every Interactive Data File required to be submitted and posted pursuant to Rule 405 of Regulation S-T during the preceding 12 months (or for such shorter period that the registrant was
required to submit and post such files). | Yes x No ¨ |
Indicate by check mark whether the registrant is a large accelerated filer, an accelerated filer, or a non-accelerated filer. See definition of “accelerated filer and large accelerated filer” in Rule 12b-2 of the Exchange Act.
(Check one): Large Accelerated Filer x | Accelerated Filer¨ | Non-Accelerated Filer ¨ |
Indicate by check mark which basis of accounting the registrant has used to prepare the financial statements included in this filing:
| U.S. GAAP x |
International Financial Reporting Standards as issued by the International Accounting Standards Board¨Other¨
If this is an annual report, indicate by check mark whether the registrant is a shell company (as defined in Rule 12b-2 of the Exchange Act). | Yes ¨ No x |
| TABLE OF CONTENTS | Page | |||||||||
| 3 | ||||||||||
| 4 | ||||||||||
| 5 | ||||||||||
| 8 | ||||||||||
| 8 | ||||||||||
| 9 | ||||||||||
Item 1: | 10 | |||||||||
Item 2: | 10 | |||||||||
Item 3: | ||||||||||
| 3A. | 10 | |||||||||
| 3B. | 14 | |||||||||
| 3C. | 14 | |||||||||
| 3D. | 14 | |||||||||
Item 4: | 41 | |||||||||
| 4A. | 41 | |||||||||
| 4B. | 42 | |||||||||
| 4C. | 95 | |||||||||
| 4D. | 96 | |||||||||
Item 4A: | 121 | |||||||||
Item 5: | 122 | |||||||||
| 5A. | 123 | |||||||||
| 5B. | 149 | |||||||||
| 5C. | 158 | |||||||||
| 5D. | 158 | |||||||||
| 5E. | 158 | |||||||||
| 5F. | 158 | |||||||||
Item 6: | ||||||||||
| 6A. | 159 | |||||||||
| 6B. | 166 | |||||||||
| 6C. | 172 | |||||||||
| 6D. | 177 | |||||||||
| 6E. | 179 | |||||||||
Item 7: | 186 | |||||||||
| 7A. | 188 | |||||||||
| 7B. | 189 | |||||||||
| 7C. | 189 | |||||||||
Item 8: | ||||||||||
| 8A. | Consolidated financial statements and other financial information | 190 | ||||||||
| 190 | ||||||||||
| 196 | ||||||||||
| 8B. | 196 | |||||||||
Item 9: | ||||||||
| 9A. | ||||||||
| 9B. | ||||||||
| 9C. | ||||||||
| 9D. | ||||||||
| 9E. | ||||||||
| 9F. | ||||||||
Item 10: | ||||||||
| 10A. | ||||||||
| 10B. | ||||||||
| 10C. | ||||||||
| 10D. | ||||||||
| 10E. | ||||||||
| 10F. | ||||||||
| 10G. | ||||||||
| 10H. | ||||||||
| 10I. | ||||||||
Item 11: | ||||||||
Item 12: | ||||||||
| 12A. | ||||||||
| 12B. | ||||||||
| 12C. | ||||||||
| 12D. | ||||||||
Item 13: | ||||||||
Item 14: | Material modifications to the rights of security holders and use of proceeds | |||||||
Item 15: | ||||||||
Item 16A: | ||||||||
Item 16B: | ||||||||
Item 16C: | ||||||||
Item 16D: | ||||||||
Item 16E: | Purchases of equity securities by the issuer and affiliated purchasers | |||||||
Item 16F: | ||||||||
Item 16G: | ||||||||
Item 16H: | ||||||||
Item 17: | ||||||||
Item 18: | ||||||||
Item | Exhibits | E pages | ||||||
AngloGold Ashanti Limited
In this annual report on Form 20-F, unless the context otherwise requires, references to AngloGold, or AngloGold Ashanti, the company, or the Company and the group are references to AngloGold Ashanti Limited or,including, as appropriate, subsidiaries and associate companies of AngloGold Ashanti.
US GAAP financial statements
The audited consolidated financial statements contained in this annual report on Form 20-F for the years ended December 31, 2012, 2011 2010 and 20092010 and as at December 31, 20112012 and 20102011 have been prepared in accordance with U.S. generally accepted accounting principles (US GAAP).
IFRS financial statements
As a company incorporated in the Republic of South Africa, AngloGold Ashanti also prepares annual audited consolidated financial statements and unaudited consolidated quarterly financial statements in accordance with International Financial Reporting Standards (IFRS) as issued by the International Accounting Standards Board (“IASB”)(IASB). These financial statements (referred to as IFRS statements) are distributed to shareholders and are submitted to the JSE Limited (JSE), as well as the London, New York, Australian and Ghana stock exchanges and are furnished to the US Securities and Exchange Commission (SEC) on Form 6-K.
Currency
AngloGold Ashanti presents its consolidated financial statements in United States dollars.
In this annual report, references to rands, ZAR and R are to the lawful currency of the Republic of South Africa, references to US dollars, dollar or $ are to the lawful currency of the United States, references to€ are to the lawful currency of the European Union, references to C$ or CAD are to the lawful currency of Canada, references to ARS and peso are to the lawful currency of Argentina, references to AUD and A$ are to the lawful currency of Australia, references to BRL are to the lawful currency of Brazil, reference to NAD and N$ are to the lawful currency of Namibia, reference to Tsh is to the lawful currency of the United Republic of Tanzania and references to GHC, cedi or ¢ are to the lawful currency of Ghana.
See “Item 3A.: Selected financial data – Exchange rate information” for historical information regarding the US dollar/South African rand exchange rate. On April 16, 201219, 2013 the interbank US dollar/South African rand exchange rate as reported by OANDA Corporation was R7.90/R9.17/$1.00.
Non-GAAP financial measures
In this annual report on Form 20-F, AngloGold Ashanti presents the financial items “total cash costs”, “total cash costs per ounce”, “total production costs” and “total production costs per ounce” which have been determined using industry guidelines and practices promulgated by the Gold Institute and are not US GAAP measures. An investor should not consider these items in isolation or as alternatives to production costs, net income/(loss) applicable to common shareholders, income/(loss) before income tax provision, net cash provided by operating activities or any other measure of financial performance presented in accordance with US GAAP. While the Gold Institute has provided definitions for the calculation of total cash costs and total production costs, the calculation of total cash costs, total cash costs per ounce, total production costs and total production costs per ounce may vary significantly among gold mining companies, and by themselves do not necessarily provide a basis for comparison with other gold mining companies. See “Glossary of selected terms – Financial terms – Total cash costs” and –“Total production costs” and “Item 5A.: Operating results – Total cash costs and total production costs”.
Shares and shareholders
In this annual report on Form 20-F, references to ordinary shares, ordinary shareholders and shareholders/members, should be read as common stock, common stockholders and stockholders, respectively, and vice versa.
CERTAIN FORWARD-LOOKING STATEMENTS
Certain statements contained in this document, other than statements of historical fact, including, without limitation, those concerning the economic outlook for the gold mining industry, expectations regarding gold prices, production, cash costs and other operating results, return on equity, productivity improvements, growth prospects and outlook of AngloGold Ashanti’s operations, individually or in the aggregate, including the achievement of project milestones, the completion and commencement of commercial operations of certain of AngloGold Ashanti’s exploration and production projects and the completion of acquisitions and dispositions, AngloGold Ashanti’s liquidity and capital resources and capital expenditure,expenditures and the outcome and consequence of any potential or pending litigation or regulatory proceedings or environmental issues, are forward-looking statements regarding AngloGold Ashanti’s operations, economic performance and financial condition.
These forward-looking statements or forecasts involve known and unknown risks, uncertainties and other factors that may cause AngloGold Ashanti’s actual results, performance or achievements to differ materially from the anticipated results, performance or achievements expressed or implied in these forward-looking statements. Although AngloGold Ashanti believes that the expectations reflected in such forward-looking statements are reasonable, no assurance can be given that such expectations will prove to have been correct. Accordingly, results and forecasts could differ materially from those set out in the forward-looking statements as a result of amongstamong other factors, changes in economic, social and political and market conditions, success of business and operating initiatives,initiative, changes in the regulatory environment and other government actions, including environmental approval, fluctuations in gold prices and exchange rates, the outcome of pending or future litigation proceedings and business and operational risk management and other factors as determined in “Item“item 3D.: Risk factors” and elsewhere in this annual report. These factors are not necessarily all of the important factors that could cause AngloGold Ashanti’s actual results to differ materially from those expressed in any forward-looking statements. Other unknown or unpredictable factors could also have material adverse effects on future results. Consequently, readers are cautioned not to place undue reliance on forward-looking statements.
AngloGold Ashanti undertakes no obligation to update publicly or release any revisions to these forward-looking statements to reflect events or circumstances after the date of this annual report or to reflect the occurrence of unanticipated events, except to the extent required by applicable law. All subsequent written or oral forward-looking statements attributable to AngloGold Ashanti or any person acting on its behalf are qualified by the cautionary statements herein.
The following explanations are not intended as technical definitions but should assist the reader in understanding terminology used in this annual report. Unless expressly stated otherwise, all explanations are applicable to both underground and surface mining operations.
All injury frequency rate:The total number of injuries and fatalities that occurs per million hours worked.
BIF:Banded Ironstone Formation. A chemically formed iron-rich sedimentary rock.
By-products:Any products that emanate from the core process of producing gold, including silver, uranium and sulfuric acid.
Calc-silicate rock:A metamorphic rock consisting mainly of calcium-bearing silicates such as diopside and wollastonite, and formed by metamorphism of impure limestone or dolomite.
Carbon-in-leach (CIL):Gold is leached from a slurry of gold ore with cyanide in agitated tanks and adsorbed on to carbon granules in the same circuit. The carbon granules are separated from the slurry and treated in an elution circuit to remove the gold.
Carbon-in-pulp (CIP):Gold is leached conventionally from a slurry of gold ore with cyanide in agitated tanks. The leached slurry then passes into the CIP circuit where carbon granules are mixed with the slurry and gold is adsorbed on to the carbon. The granules are separated from the slurry and treated in an elution circuit to remove the gold.
Comminution:Comminution is the crushing and grinding of ore to make gold available for treatment. (See also “Milling”).
Contained gold:The total gold content (tons multiplied by grade) of the material being described.
Cut-off grade (surface mines):The minimum grade at which a unit of ore will be mined to achieve the desired economic outcome.
Depletion:The decrease in the quantity of ore in a deposit or property resulting from extraction or production.
Development:The process of accessing an orebody through shafts and/or tunneling in underground mining operations.
Diorite:An igneous rock formed by the solidification of molten material (magma).
Doré:Impure alloy of gold and silver produced at a mine to be refined to a higher purity, usually consisting of 85 percent gold on average.
Electro-winning:A process of recovering gold from solution by means of electrolytic chemical reaction into a form that can be smelted easily into gold bars.
Elution:Recovery of the gold from the activated carbon into solution before zinc precipitation or electro-winning.
Gold Produced:Refined gold in a saleable form derived from the mining process.
Grade:The quantity of gold contained within a unit weight of gold-bearing material generally expressed in ounces per short ton of ore (oz/t), or grams per metric tonne (g/t).
Greenschist:A schistose metamorphic rock whose green color is due to the presence of chlorite, epidote or actinolite.
Leaching:Dissolution of gold from crushed or milled material, including reclaimed slime, prior to adsorption on to activated carbon.
Life of mine (LOM):Number of years for which an operation is planning to mine and treat ore, and is taken from the current mine plan.
Metallurgical plant:A processing plant constructed to treat ore and extract gold.
Metallurgical recovery factor (MetRF): A measure of the efficiency in extracting gold from the ore deposit.
Milling:A process of reducing broken ore to a size at which concentrating can be undertaken. (See also “Comminution”).
Mine call factor:The ratio, expressed as a percentage, of the total quantity of recovered and unrecovered mineral product after processing with the amount estimated in the ore based on sampling. The ratio of contained gold delivered to the metallurgical plant divided by the estimated contained gold of ore mined based on sampling.
Mineral deposit:A mineral deposit is a concentration (or occurrence) of material of possible economic interest in or on the earth’s crust.
Ore Reserve:That part of a mineral deposit which could be economically and legally extracted or produced at the time of the Ore Reserve determination.
Ounce (oz) (troy):Used in imperial statistics. A kilogram is equal to 32.1507 ounces. A troy ounce is equal to 31.1035 grams.
Pay limit:The grade of a unit of ore at which the revenue from the recovered mineral content of the ore is equal to the sum of total cash costs, closure costs, Ore Reserve development and stay-in-business capital. This grade is expressed as an in-situ value in grams per tonne or ounces per short ton (before dilution and mineral losses).
Precipitate:The solid product of chemical reaction by fluids such as the zinc precipitation referred to below.
Probable Ore Reserve:Ore Reserve for which quantity and grade are computed from information similar to that used for Proven Reserves, but the sites for inspection, sampling, and measurement are further apart or are otherwise less adequately spaced. The degree of assurance, although lower than that for Proven Reserves, is high enough to assume continuity between points of observation.
Productivity:An expression of labor productivity based on the ratio of grams of gold produced per month to the total number of employees in mining operations.
Proven Ore Reserve:Ore Reserve for which the (a) quantity is computed from dimensions revealed in outcrops, trenches, workings or drill holes; grade is computed from the results of detailed sampling and (b) the sites for inspection, sampling and measurement are spaced so closely and the geologic character is so well defined that size, shape, depth and mineral content of the Ore Reserve are well established.
Project capital:Capital expenditure to either bring a new operation into production; to materially increase production capacity; or to materially extend the productive life of an asset.
Reclamation:In the South African context, reclamation describes the process of reclaiming slimes (tailings) dumps using high-pressure water cannons to form a slurry which is pumped back to the metallurgical plants for processing.
Recovered grade:The recovered mineral content per unit of ore treated.
Reef:A gold-bearing sedimentary horizon, normally a conglomerate band that may contain economic levels of gold.
Refining:The final purification process of a metal or mineral.
Rehabilitation:The process of reclaiming land disturbed by mining to allow an appropriate post-mining use. Rehabilitation standards are defined by country-specific laws, including but not limited to the South African Department of Mineral Resources, the US Bureau of Land Management, the US Forest Service, and the relevant Australian mining authorities, and address among other issues, ground and surface water, topsoil, final slope gradient, waste handling and re-vegetation issues.
Seismic event:A sudden inelastic deformation within a given volume of rock that radiates detectable seismic energy.
Shaft:A vertical or subvertical excavation used for accessing an underground mine; for transporting personnel, equipment and supplies; for hoisting ore and waste; for ventilation and utilities; and/or as an auxiliary exit.
Short ton:Used in imperial statistics. Equal to 2,000 pounds.
Skarn:A rock of complex mineralogical composition, formed by contact metamorphism and metasomatism of carbonate rocks.
SmeltingSmelting::A pyro-metallurgical operation in which gold is further separated from impurities.
Stope:Underground excavation where the orebody is extracted.
Stripping ratio:The ratio of waste tonnes to ore tonnes mined calculated as total tonnes mined divided by ore tonnes mined.
Stoping:The process of excavating ore underground.
Syngenetic:Formed contemporaneously with the deposition of the sediment.
Tailings:Finely ground rock of low residual value from which valuable minerals have been extracted.
Tailings dam (slimes dam):Dam facilities designed to store discarded tailings.
Tonne:Used in metric statistics. Equal to 1,000 kilograms.
Tonnage:Quantity of material measured in tonnes or tons.
Waste:Material that contains insufficient mineralization for consideration for future treatment and, as such, is discarded.
Yield:The amount of valuable mineral or metal recovered from each unit mass of ore expressed as ounces per short ton or grams per metric tonne.
Zinc precipitation:Zinc precipitation is the chemical reaction using zinc dust that converts gold in solution to a solid form for smelting into unrefined gold bars.
Average number of employees:The monthly average number of production and non-production employees and contractors employed during the year, where contractors are defined as individuals who have entered into a fixed-term contract of employment with a group company or subsidiary. Employee numbers of joint ventures represents the group’s attributable share.
Capital expenditure:Total capital expenditure on tangible assets.
Discontinued operation:A component of an entity that, pursuant to a single plan, has been disposed of or abandoned or is classified as held for sale until conditions precedent to the sale have been fulfilled.
Effective tax rate:Current and deferred taxation charge for the year as a percentage of profit before taxation.
Monetary asset:An asset which will be settled in a fixed or easily determinable amount of money.
OANDA:OANDA Corporation:An internet-based provider of forex trading and currency information services.
Rated bonds:The $700 million 5.375 percent bonds due 2020, and the $300 million 6.5 percent bonds due 2040.2040 and the $750 million 5.125 percent bonds due 2022.
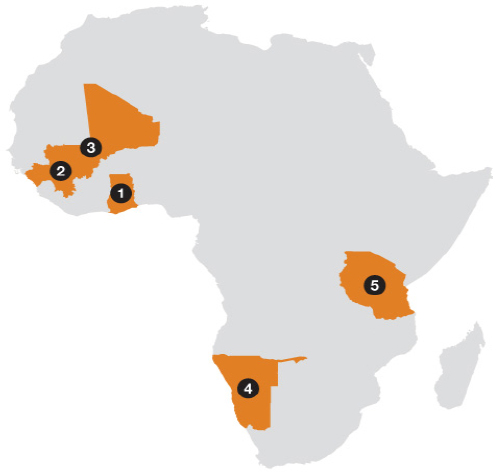
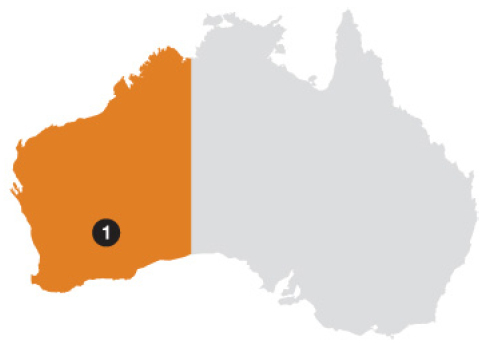
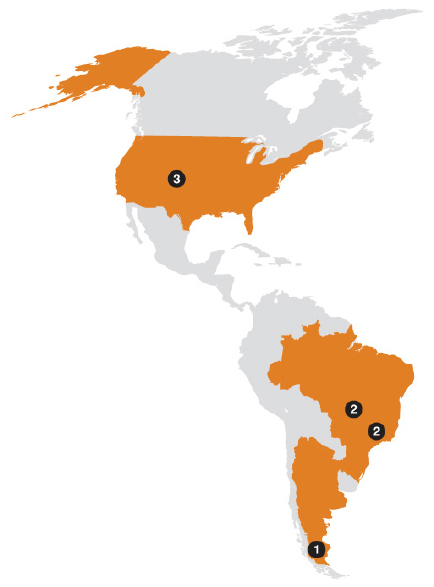
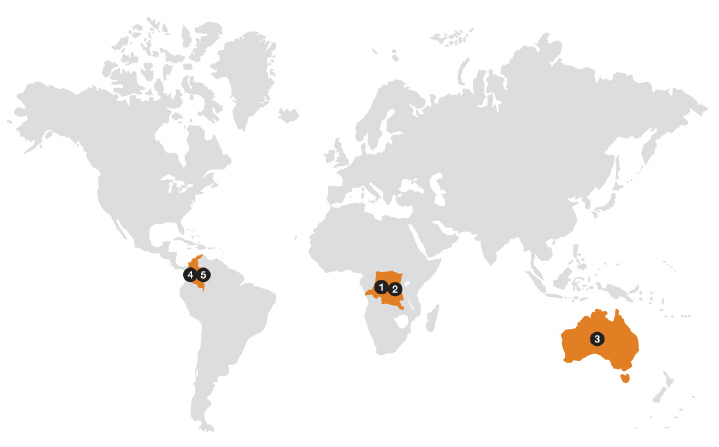
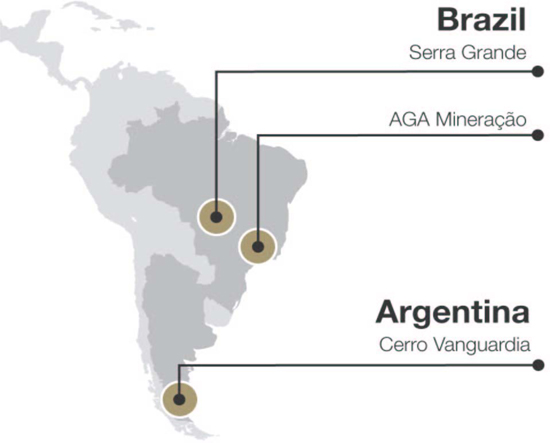
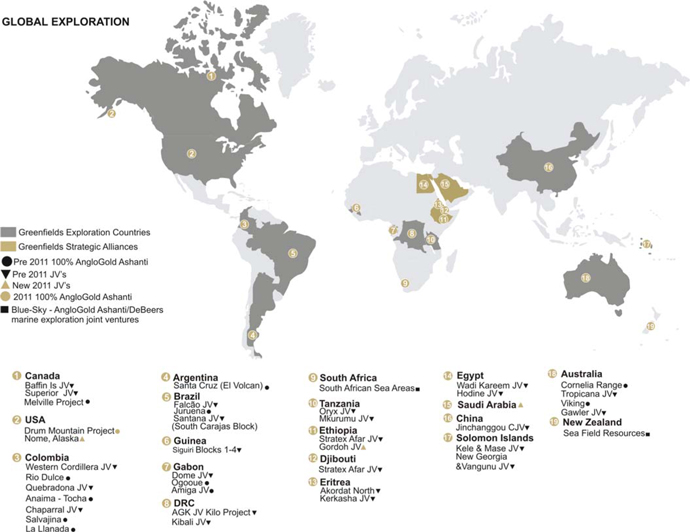
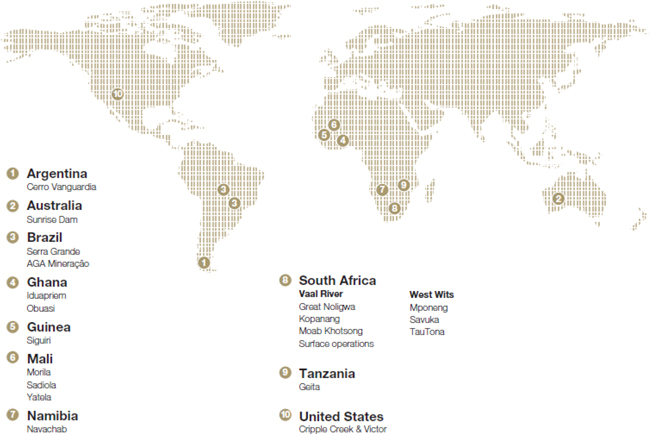
Region:Defines the operational management divisions within AngloGold Ashanti Limited, namely South Africa, Continental Africa (Ghana, Guinea, Mali, Namibia and Tanzania), Australasia, and the Americas (Argentina, Brazil and United States of America).
Related party:Parties are considered related if one party has the ability to control the other party or exercise significant influence over the other party in making financial and operating decisions.
Significant influence:The ability, directly or indirectly, to participate in, but not exercise control over, the financial and operating policy decision of an entity so as to obtain economic benefit from its activities.
STRATE:The licensed Central Securities Depository (CSD) for the electronic settlement of financial instruments in South Africa.
Total cash costs:Total cash costs include site costs for all mining, processing and administration, reduced by contributions from by-products and are inclusive of royalties and production taxes. Depreciation, depletion and amortization, rehabilitation, corporate administration, employee severance costs, capital and exploration costs are excluded. Total cash costs per ounce are the attributable total cash costs divided by the attributable ounces of gold produced.
Total production costs:Total cash costs plus depreciation, depletion and amortization, employee severance costs, rehabilitation and other non-cash costs. Corporate administration and exploration costs are excluded. Total production costs per ounce are the attributable total production costs divided by the attributable ounces of gold produced.
Weighted average number of ordinary shares:The number of ordinary shares in issue at the beginning of the year, increased by shares issued during the year, weighted on a time basis for the period during which they have participated in the income of the group, and increased by share options that are virtually certain to be exercised.
$, US$ or dollar | United States dollars | |||||
ARS | Argentinean peso | |||||
A$ or AUD | Australian dollars | |||||
BRL | Brazilian real | |||||
€ or Euro | European Euro | |||||
C$ or CAD | Canadian dollars | |||||
GHC, cedi or ¢ | Ghanaian cedi | |||||
N$ or NAD | Namibian dollars | |||||
Tsh | Tanzanian Shillings | |||||
ZAR, R or rand | South African rands |
ADS | American Depositary Share | |
ADR | American Depositary Receipt | |
AIFR | All injury frequency rate | |
ASX | Australian Securities Exchange | |
Au | Contained gold | |
BBSY | Bank Bill Swap Bid Rate | |
bn | Billion | |
BEE | Black Economic Empowerment | |
capex | Capital expenditure | |
CDI | Chess Depositary Interests | |
CLR | Carbon Leader Reef | |
Companies Act | South African Companies Act 71, of 2008 | |
DMTNP | Domestic medium-term notes program | |
ERP | Enterprise resource planning | |
FIFR | Fatal injury frequency rate | |
G or g | Grams | |
g/t | Grams per tonne | |
GhDS | Ghanaian Depositary Share | |
GhSE | Ghana Stock Exchange | |
|
| |
|
| |
JORC | Australasian Code for Reporting Exploration Results, Mineral Resources and Ore Reserves | |
JIBAR | Johannesburg Interbank Agreed Rate | |
JSE | JSE Limited (Johannesburg Stock Exchange) | |
King III | South African King Code on Corporate Governance, 2009 | |
Kg or kg | Kilograms | |
Km or km | Kilometers | |
|
| |
LSE | London Stock Exchange | |
LIBOR | London Interbank Offer Rate | |
LOM | Life of mine | |
|
| |
M or m | Meter or million, depending on the context | |
Moz | Million ounces | |
Mt | Million tonnes or tons | |
Mtpa | Million tonnes/tons per annum | |
NYSE | New York Stock Exchange | |
|
| |
Oz or oz | Ounces (troy) | |
oz/t | Ounces per ton | |
oz/TEC | Ounces per total employee costed | |
SAMREC | South African Code for the Reporting of Mineral Resources and Mineral Reserves 2007 Edition | |
SEC | United States Securities and Exchange Commission | |
SOX | Sarbanes-Oxley Act of 2002 | |
T or t | Tons (short) or tonnes (metric) | |
Tpa or tpa | Tonnes/tons per annum | |
US/USA/United States | United States of America | |
VCR | Ventersdorp Contact Reef |
Note:Rounding of figures in this report may result in computational discrepancies.
ITEM 1: IDENTITY OF DIRECTORS, SENIOR MANAGEMENT AND ADVISORS
Not applicable.
ITEM 2: OFFER STATISTICS AND EXPECTED TIMETABLE
Not applicable.
| 3A. | SELECTED FINANCIAL DATA |
The selected financial information set forth below for the years ended December 31, 2009, 2010, 2011 and 20112012 and as at December 31, 20102011 and 20112012 has been derived from, and should be read in conjunction with, the US GAAP financial statements included under Item 18 of this annual report. The selected financial information for the years ended December 31, 20072008 and 20082009 and as at December 31, 2007, 2008, 2009 and 20092010 has been derived from the US GAAP financial statements not included in this annual report.
Year ended December 31,
| Year ended December 31,
| |||||||||||||||||||||||||||||||||||||||
| 2007 (1) | 2008 (2) | 2009 | 2010 | 2011 | 2008 (1) | 2009 | 2010 | 2011 | 2012 | |||||||||||||||||||||||||||||||
| $ | $ | $ | $ | $ | $ | $ | $ | $ | $ | |||||||||||||||||||||||||||||||
| (in millions, except share and per share amounts) | (in millions, except share and per share amounts) | |||||||||||||||||||||||||||||||||||||||
Consolidated statement of income | ||||||||||||||||||||||||||||||||||||||||
Sales and other income | 3,095 | 3,730 | 3,954 | 5,402 | 6,642 | 3,730 | 3,954 | 5,402 | 6,642 | 6,428 | ||||||||||||||||||||||||||||||
Product sales(3) | 3,048 | 3,655 | 3,784 | 5,334 | 6,570 | |||||||||||||||||||||||||||||||||||
Product sales(2) | 3,655 | 3,784 | 5,334 | 6,570 | 6,353 | |||||||||||||||||||||||||||||||||||
Interest, dividends and other | 47 | 75 | 170 | 68 | 72 | 75 | 170 | 68 | 72 | 75 | ||||||||||||||||||||||||||||||
Costs and expenses | 3,806 | 4,103 | 4,852 | 5,021 | 4,521 | 4,103 | 4,852 | 5,021 | 4,521 | 5,217 | ||||||||||||||||||||||||||||||
Operating costs(4) | 2,167 | 2,452 | 2,543 | 3,112 | 3,555 | |||||||||||||||||||||||||||||||||||
Operating costs(3) | 2,452 | 2,543 | 3,112 | 3,555 | 3,876 | |||||||||||||||||||||||||||||||||||
Royalties | 70 | 78 | 84 | 142 | 193 | 78 | 84 | 142 | 193 | 164 | ||||||||||||||||||||||||||||||
Depreciation, depletion and amortization | 655 | 615 | 615 | 720 | 789 | 615 | 615 | 720 | 789 | 794 | ||||||||||||||||||||||||||||||
Impairment of assets | 1 | 670 | 8 | 91 | 17 | 670 | 8 | 91 | 17 | 367 | ||||||||||||||||||||||||||||||
Interest expense | 75 | 72 | 123 | 151 | 178 | 72 | 123 | 151 | 178 | 213 | ||||||||||||||||||||||||||||||
Accretion expense | 20 | 22 | 17 | 22 | 28 | 22 | 17 | 22 | 28 | 33 | ||||||||||||||||||||||||||||||
Loss/(profit) on sale of assets, realization of loans, indirect taxes and other | 10 | (64 | ) | 10 | (3 | ) | (43 | ) | ||||||||||||||||||||||||||||||||
(Profit)/loss on sale of assets, realization of loans, indirect taxes and other | (64 | ) | 10 | (3 | ) | (43 | ) | 35 | ||||||||||||||||||||||||||||||||
Non-hedge derivative loss/(gain) and movement on bonds | 808 | 258 | 1,452 | 786 | (196 | ) | 258 | 1,452 | 786 | (196 | ) | (265 | ) | |||||||||||||||||||||||||||
(Loss)/income from continuing operations before income tax and equity income in associates | (711 | ) | (373 | ) | (898 | ) | 381 | 2,121 | (373 | ) | (898 | ) | 381 | 2,121 | 1,211 | |||||||||||||||||||||||||
Taxation(expense)/benefit | (118 | ) | (22 | ) | 33 | (255 | ) | (705 | ) | |||||||||||||||||||||||||||||||
Taxation (expense)/benefit | (22 | ) | 33 | (255 | ) | (705 | ) | (340 | ) | |||||||||||||||||||||||||||||||
Equity income/(loss) in associates | 41 | (149 | ) | 88 | 40 | 59 | ||||||||||||||||||||||||||||||||||
Equity (loss)/income in associates | (149 | ) | 88 | 40 | 59 | (23 | ) | |||||||||||||||||||||||||||||||||
Net (loss)/income from continuing operations | (788 | ) | (544 | ) | (777 | ) | 166 | 1,475 | (544 | ) | (777 | ) | 166 | 1,475 | 848 | |||||||||||||||||||||||||
Discontinued operations | 2 | 23 | - | - | - | 23 | - | - | - | - | ||||||||||||||||||||||||||||||
Net (loss)/income | (786 | ) | (521 | ) | (777 | ) | 166 | 1,475 | (521 | ) | (777 | ) | 166 | 1,475 | 848 | |||||||||||||||||||||||||
Less: Net income attributable to noncontrolling interests | (28 | ) | (42 | ) | (48 | ) | (54 | ) | (50 | ) | (42 | ) | (48 | ) | (54 | ) | (50 | ) | (19 | ) | ||||||||||||||||||||
Net (loss)/income - attributable to AngloGold Ashanti | (814 | ) | (563 | ) | (825 | ) | 112 | 1,425 | (563 | ) | (825 | ) | 112 | 1,425 | 829 | |||||||||||||||||||||||||
Net (loss)/income - attributable to AngloGold Ashanti | ||||||||||||||||||||||||||||||||||||||||
(Loss)/income from continuing operations | (816 | ) | (586 | ) | (825 | ) | 112 | 1,425 | (586 | ) | (825 | ) | 112 | 1,425 | 829 | |||||||||||||||||||||||||
Discontinued operations | 2 | 23 | - | - | - | 23 | - | - | - | - | ||||||||||||||||||||||||||||||
| (814 | ) | (563 | ) | (825 | ) | 112 | 1,425 | (563 | ) | (825 | ) | 112 | 1,425 | 829 | ||||||||||||||||||||||||||
Basic (loss)/earnings per common share (in $)(5) | ||||||||||||||||||||||||||||||||||||||||
Basic (loss)/earnings per common share (in $)(4) | ||||||||||||||||||||||||||||||||||||||||
From continuing operations | (2.93 | ) | (1.86 | ) | (2.30 | ) | 0.30 | 3.71 | (1.86 | ) | (2.30 | ) | 0.30 | 3.71 | 2.15 | |||||||||||||||||||||||||
Discontinued operations | 0.01 | 0.07 | - | - | - | 0.07 | - | - | - | - | ||||||||||||||||||||||||||||||
Net (loss)/income - attributable to AngloGold Ashanti common stockholders | (1.79 | ) | (2.30 | ) | 0.30 | 3.71 | 2.15 | |||||||||||||||||||||||||||||||||
| (2.92 | ) | (1.79 | ) | (2.30 | ) | 0.30 | 3.71 | |||||||||||||||||||||||||||||||||
Net (loss)/income - attributable to AngloGold Ashanti common stockholders | (2.92 | ) | (1.79 | ) | (2.30 | ) | 0.30 | 3.71 | ||||||||||||||||||||||||||||||||
Diluted (loss)/income per common share (in $)(5) | ||||||||||||||||||||||||||||||||||||||||
Diluted (loss)/income per common share (in $)(4) | ||||||||||||||||||||||||||||||||||||||||
From continuing operations | (2.93 | ) | (1.86 | ) | (2.30 | ) | 0.30 | 3.17 | (1.86 | ) | (2.30 | ) | 0.30 | 3.17 | 1.61 | |||||||||||||||||||||||||
Discontinued operations | 0.01 | 0.07 | - | - | - | 0.07 | - | - | - | - | ||||||||||||||||||||||||||||||
| (2.92 | ) | (1.79 | ) | (2.30 | ) | 0.30 | 3.17 | |||||||||||||||||||||||||||||||||
Net (loss)/income - attributable to common stockholders | (2.92 | ) | (1.79 | ) | (2.30 | ) | 0.30 | 3.71 | (1.79 | ) | (2.30 | ) | 0.30 | 3.17 | 1.61 | |||||||||||||||||||||||||
Dividend per common share (cents) | 44 | 13 | 13 | 18 | 34 | 13 | 13 | 18 | 34 | 56 | ||||||||||||||||||||||||||||||
|
|
| ||||||||||||||||||||||||||||||||||||||
| 2007 (1) | 2008 (2) | 2009 | 2010 | 2011 | 2008 | 2009 | 2010 | 2011 | 2012 | |||||||||||||||||||||||||||||||
| $ | $ | $ | $ | $ | $ | $ | $ | $ | $ | |||||||||||||||||||||||||||||||
| (in millions, except share and per share amounts) | (in millions, except share and per share amounts) | |||||||||||||||||||||||||||||||||||||||
|
|
| ||||||||||||||||||||||||||||||||||||||
Consolidated balance sheet data (as at period end) | ||||||||||||||||||||||||||||||||||||||||
Cash and cash equivalents and restricted cash | 514 | 585 | 1,112 | 585 | 1,147 | 585 | 1,112 | 585 | 1,147 | 927 | ||||||||||||||||||||||||||||||
Other current assets | 1,599 | 2,328 | 1,646 | 1,412 | 1,484 | 2,328 | 1,646 | 1,412 | 1,484 | 1,863 | ||||||||||||||||||||||||||||||
Property, plant and equipment and acquired properties, net | 6,807 | 5,579 | 6,285 | 6,762 | 6,902 | 5,579 | 6,285 | 6,762 | 6,902 | 7,983 | ||||||||||||||||||||||||||||||
Goodwill and other intangibles, net | 591 | 152 | 180 | 197 | 213 | 152 | 180 | 197 | 213 | 305 | ||||||||||||||||||||||||||||||
Materials on the leach pad (long-term) | 190 | 261 | 324 | 331 | 393 | 261 | 324 | 331 | 393 | 445 | ||||||||||||||||||||||||||||||
| Other long-term assets, derivatives, deferred taxation assets and other long-term inventory | 680 | 546 | 1,115 | 1,101 | 1,046 | 546 | 1,115 | 1,101 | 1,046 | 1,579 | ||||||||||||||||||||||||||||||
|
|
|
| |||||||||||||||||||||||||||||||||||||
Total assets | 10,381 | 9,451 | 10,662 | 10,388 | 11,185 | 9,451 | 10,662 | 10,388 | 11,185 | 13,102 | ||||||||||||||||||||||||||||||
|
|
|
| |||||||||||||||||||||||||||||||||||||
Current liabilities | 3,795 | 3,458 | 4,475 | 1,004 | 919 | 3,458 | 4,475 | 1,004 | 919 | 1,959 | ||||||||||||||||||||||||||||||
Provision for environmental rehabilitation | 394 | 302 | 385 | 530 | 653 | 302 | 385 | 530 | 653 | 758 | ||||||||||||||||||||||||||||||
Deferred taxation liabilities | 1,345 | 1,008 | 1,171 | 1,200 | 1,242 | 1,008 | 1,171 | 1,200 | 1,242 | 1,157 | ||||||||||||||||||||||||||||||
Other long-term liabilities, and derivatives | 2,232 | 1,277 | 1,186 | 3,065 | 2,849 | |||||||||||||||||||||||||||||||||||
Equity(6) | 2,615 | 3,406 | 3,445 | 4,589 | 5,522 | |||||||||||||||||||||||||||||||||||
Other long-term liabilities and derivatives | 1,277 | 1,186 | 3,065 | 2,849 | 3,380 | |||||||||||||||||||||||||||||||||||
Equity(5) | 3,406 | 3,445 | 4,589 | 5,522 | 5,848 | |||||||||||||||||||||||||||||||||||
|
|
|
| |||||||||||||||||||||||||||||||||||||
Total liabilities and equity | 10,381 | 9,451 | 10,662 | 10,388 | 11,185 | 9,451 | 10,662 | 10,388 | 11,185 | 13,102 | ||||||||||||||||||||||||||||||
|
|
|
| |||||||||||||||||||||||||||||||||||||
Capital stock (exclusive of long-term debt and redeemable preferred stock)
| 10 | 12 | 12 | 13 | 13 | 12 | 12 | 13 | 13 | 13 | ||||||||||||||||||||||||||||||
Number of common shares as adjusted to reflect changes in capital stock
| 277,457,471 | 353,483,410 | 362,240,669 | 381,204,080 | 382,242,343 | 353,483,410 | 362,240,669 | 381,204,080 | 382,242,343 | 383,320,962 | ||||||||||||||||||||||||||||||
Net assets | 2,615 | 3,406 | 3,445 | 4,589 | 5,522 | 3,406 | 3,445 | 4,589 | 5,522 | 5,848 | ||||||||||||||||||||||||||||||
|
|
| ||||||||||||||||||||||||||||||||||||||
| (1) |
|
2008 results included the acquisition of the remaining 33 percent shareholding in the Cripple Creek and Victor Gold Mining Company with effect from July 1, 2008. In prior years, the investment was consolidated as a subsidiary. The 2008 accounting treatment is therefore consistent with that of prior years. |
Product sales represent revenue from the sale of gold. |
Operating costs include production costs, exploration costs, related party transactions, general and administrative, market development costs, |
The calculations of basic and diluted (loss)/earnings per common share are described in note 8 to the consolidated financial statements “Income/(loss) per common share”. Amounts reflected exclude E Ordinary shares. |
Includes noncontrolling interests. |
Annual dividends
The table below sets forth the amounts of interim, final and total dividends paid in respect of the past five years in cents per ordinary share. In respect of 2011, AngloGold Ashanti’s board of directors declared two dividends of 90 South African cents per ordinary share, one in August 2011 and the other in November 2011. A2012, a fourth quarter dividend of 20050 South African cents per ordinary share was declared on February 14, 2012,18, 2013, with a record date of March 11, 201215, 2013 and a payment date of March 16, 2012.28, 2013.
| Year ended December 31(1) | 2007 | 2008 | 2009 | 2010 | 2011 | 2008 | 2009 | 2010 | 2011 | 2012 | ||||||||||||||||||||||||||||||
South African cents per ordinary share | ||||||||||||||||||||||||||||||||||||||||
First quarter | 100 | |||||||||||||||||||||||||||||||||||||||
Second quarter | 90 | 50 | 60 | 65 | 90 | 50 | 60 | 65 | 90 | 100 | ||||||||||||||||||||||||||||||
Third quarter | 90 | 90 | 50 | |||||||||||||||||||||||||||||||||||||
Fourth quarter | 53 | 50 | 70 | 80 | 200 | 50 | 70 | 80 | 200 | 50 | ||||||||||||||||||||||||||||||
Total | 143 | 100 | 130 | 145 | 380 | 100 | 130 | 145 | 380 | 300 | ||||||||||||||||||||||||||||||
US cents per ordinary share(2) | ||||||||||||||||||||||||||||||||||||||||
First quarter | 11.81 | |||||||||||||||||||||||||||||||||||||||
Second quarter | 12.44 | 6.45 | 7.66 | 9.00 | 12.08 | 6.45 | 7.66 | 9.00 | 12.08 | 12.10 | ||||||||||||||||||||||||||||||
Third quarter | 10.87 | 10.87 | 5.76 | |||||||||||||||||||||||||||||||||||||
Fourth quarter | 6.60 | 5.00 | 9.50 | 11.26 | 27.50 | 5.00 | 9.50 | 11.26 | 27.50 | 5.40 | ||||||||||||||||||||||||||||||
Total | 19.04 | 11.45 | 17.16 | 20.26 | 50.45 | 11.45 | 17.16 | 20.26 | 50.45 | 35.07 | ||||||||||||||||||||||||||||||
| (1) | During quarter three of 2011, the Company changed the frequency of dividend payments from half-yearly to quarterly. |
| (2) | Dividends for these periods were declared in South African cents. US dollar cents per share figures have been calculated based on exchange rates prevailing on each of the respective payment dates. |
For further information on the company’s policy on dividend distributions, see “Item 8A: Consolidated statements and other financial information – Annual dividend”.
Exchange rate information
The following table sets forth, for the periods and dates indicated, certain information concerning US dollar/South African rand exchange rates expressed in rands per $1.00. On April 16, 2012,19, 2013, the interbank rate between South African rands and US dollars as reported by OANDA Corporation was R7.90/R9.17/$1.00.
| Year ended December 31 | High | Low | Year end | Average (1) | High | Low | Year end | Average (1) | ||||||||||||||||||||||||
2007(2) | 7.49 | 6.45 | 6.81 | 7.03 | ||||||||||||||||||||||||||||
2008(2) | 11.27 | 6.74 | 9.30 | 8.26 | 11.27 | 6.74 | 9.30 | 8.26 | ||||||||||||||||||||||||
2009(3) | 10.70 | 7.21 | 7.41 | 8.44 | 10.70 | 7.21 | 7.41 | 8.44 | ||||||||||||||||||||||||
2010(3) | 8.08 | 6.57 | 6.64 | 7.34 | 8.08 | 6.57 | 6.64 | 7.34 | ||||||||||||||||||||||||
2011(3) | 8.60 | 6.49 | 8.14 | 7.27 | 8.60 | 6.49 | 8.14 | 7.27 | ||||||||||||||||||||||||
2012(4) | 8.16 | 7.46 | 7.90 | 7.75 | ||||||||||||||||||||||||||||
2012(3) | 8.95 | 7.46 | 8.47 | 8.20 | ||||||||||||||||||||||||||||
2013(3)(4) | 9.31 | 8.47 | 9.17 | 8.96 | ||||||||||||||||||||||||||||
| (1) | The average rate of exchange on the last business day of each month during the year. |
| (2) | Based on the noon buying rate in New York City for cable transfers as certified for customs purposes by the Federal Reserve Bank of New York. |
| (3) | Based on the interbank rate as reported by OANDA Corporation. |
| (4) | Through to April |
| Exchange rate information for the months of (1) | High | Low | ||||||
October 2011 | 8.35 | 7.65 | ||||||
November 2011 | 8.60 | 7.66 | ||||||
December 2011 | 8.46 | 7.95 | ||||||
January 2012 | 8.23 | 7.70 | ||||||
February 2012 | 7.88 | 7.47 | ||||||
March 2012 | 7.78 | 7.40 | ||||||
April 2012(2) | 7.98 | 7.62 | ||||||
| Exchange rate information for the months of (1) | High | Low | ||||||
October 2012 | 8.84 | 8.30 | ||||||
November 2012 | 8.95 | 8.63 | ||||||
December 2012 | 8.90 | 8.47 | ||||||
January 2013 | 9.07 | 8.47 | ||||||
February 2013 | 8.99 | 8.81 | ||||||
March 2013 | 9.31 | 8.89 | ||||||
April 2013(2) | 9.23 | 9.08 | ||||||
| (1) | Based on the interbank rate as reported by OANDA Corporation. |
| (2) | Through to April |
| 3B. | CAPITALIZATION AND INDEBTEDNESS |
Not applicable.
| 3C. | REASONS FOR THE OFFER AND USE OF PROCEEDS |
Not applicable.
| 3D. | RISK FACTORS |
This section describes many of the risks that could affect AngloGold Ashanti. There may however be additional risks unknown to AngloGold Ashanti and other risks, currently believed to be immaterial, that could turn out to be material. Additional risks may arise or become material subsequent to the date of this document. These risks, either individually or simultaneously, could significantly affect the group’s business, financial results and the price of its securities.
Risks related to AngloGold Ashanti’s results of operations and its financial condition as a result of factors that impact the gold mining industry generally.
Commodity market price fluctuations could adversely affect the profitability of operations.
AngloGold Ashanti’s revenues are primarily derived from the sale of gold and, to a lesser extent, uranium, silver and sulfuric acid. The company’s current policy is to sell its products at prevailing market prices and not to enter into price hedging arrangements. The market prices for these commodities fluctuate widely. These fluctuations are caused by numerous factors beyond the company’s control. For example, the market price of gold may change for a variety of reasons, including:
speculative positions taken by investors or traders in gold;
monetary policies announced or implemented by central banks, including the US Federal Reserve;
changes in the demand for gold as an investment or as a result of leasing arrangements;
changes in the demand for gold used in jewellery and for other industrial uses, including as a result of prevailing economic conditions;
changes in the supply of gold from production, divestment, scrap and hedging;
financial market expectations regarding the rate of inflation;
the strength of the US dollar (the currency in which the gold price trades internationally) relative to other currencies;
changes in interest rates;
actual or anticipated sales or purchases of gold by central banks and the International Monetary Fund;
gold hedging and de-hedging by gold producers;
global or regional political or economic events; and
the cost of gold production in major gold producing countries.
The market price of gold has been and continues to be significantly volatile. During 2011,2012, the gold price traded from a low of $1,313$1,540 per ounce to a high of $1,900$1,790 per ounce. On December 30, 2011,April 19, 2013, the closing price of gold was $1,563$1,404 per ounce. The price of gold is often subject to sharp, short-term changes as a result of speculative activities. Forchanges; for example, in early March 2012,during the period from Friday, April 12, 2013 through Monday, April 15, 2013, the price of gold dropped by almost $100$228 per ounce in one day.ounce. While the overall supply of and demand for gold can affect its market price, the considerable size of historical mined (i.e., above ground) stocks of the metal means that these factors typically do not affect the gold price in the same manner or degree as for other commodities. In addition, the shift in demand from physical gold to investment and speculative demand may exacerbate the volatility of the gold price.
In 2011, price volatility dampened demand in the key jewellery markets of India and China, which both experienced mixed fortunes during the year. In the fourth quarter of 2011 and intoDuring 2012, goldthere appeared to trade asdevelop a risk asset, experiencing selling pressurerelationship between the central banks and the price of gold with the price falling at the prospect of the end of quantitative easing in timessome of heightened turmoil, rather than as the safe haven asset it is generally deemed to be.main economies.
A sustained period of significant gold price volatility may adversely affect the company’s ability to evaluate the feasibility of undertaking new capital projects, or the continuingcontinuity of existing operations, or to make other long-term strategic decisions. The use of lower gold prices in reserve calculations and life-of-mine plans could result in material write-downs of the company’s investment in mining properties and increased amortization, reclamation and closure charges.
The spot price of uranium has been significantly volatile in past years. During 2011,2012, the price varied between a low of about $47approximately $41 per pound and a high of $72$53 per pound. On April 19, 2013, the spot price of uranium was $41 per pound. Uranium prices can be affected by several factors, including demand for nuclear reactors, uranium production shortfalls and restocking by utilities. Events like those surrounding the earthquake and tsunami that occurred in Japan in 2011 can also have a material impact on the price of and demand for uranium.
The price of silver has also experienced significant fluctuations. From a low of $26 per ounce in January 2011,2012, the price rose steadily to reach a high of $49$37 per ounce in April 2011.February 2012. By December 2011,2012, the price had dropped to around $28approximately $30 per ounce again.ounce. Factors affecting the price of silver include investor demand, physical demand for silver bars, industrial and retail off take,off-take, and silver coin minting. On April 19, 2013, the price of silver was $23 per ounce.
If revenue from sales of gold, uranium, silver andor sulfuric acid falls below thetheir respective cost of production for an extended period, AngloGold Ashanti may experience losses andor be forced to change its dividend payment policies and curtail or suspend some or all of its exploration capital projects and existing operations. Declining commodities prices may also force a reassessment of the feasibility of a particular project or projects, which could cause substantial delays or interrupt operations until the reassessment can be completed.
Foreign exchange fluctuations could have a material adverse effect on operationalAngloGold Ashanti’s results of operations and financial condition.
Gold is principally a US dollar-priced commodity and most of the company’s revenues are realized in, or linked to, US dollars while production costs are largely incurred in the local currency where the relevant operation is located. Given the company’s global operations and local foreign exchange regulations, some of its funds are held in local currencies, such as the South African rand, Ghanaian cedi, Brazilian real, Argentinean peso and the Australian dollar. The weakening of the dollar, without a corresponding increase in the dollar price of gold against these local currencies, results in higher production costs in dollar terms. Conversely, the strengthening of the dollar, without a corresponding decrease in the dollar price of gold against these local currencies, yields lower production costs in dollar terms.
Exchange rate movements may have a material impact on AngloGold Ashanti’s operating results. For example, the company estimates that a 1 percent strengthening of eitherall of the South African rand, Brazilian real, the Argentinean peso andor the Australian dollar against the US dollar will, other factors remaining equal, result in an increase in total cash costs under IFRS of around $5approximately $6 per ounce or approximately 1 percent of the company’s total cash costs. The impact on cash costs determined under US GAAP may be different.
The profitability of operations and the cash flows generated by these operations are significantly affected by fluctuations in input production prices, many of which are linked to the prices of oil and steel.
Fuel, energy and consumables, including diesel, heavy fuel oil, chemical reagents, explosives, tires,tyres, steel and mining equipment consumed in mining operations form a relatively large part of the operating costs and capital expenditure of any mining company.
AngloGold Ashanti has no influence over the cost of these consumables, many of which are linked to some degree to the price of oil and steel.
The price of oil has recently been volatile, fluctuating between $94$88.40 and $122$130.57 per barrel of Brent crude in 2011.2012. As of April 19, 2013, the price of oil was at $100.09 per barrel of Brent Crude. AngloGold Ashanti estimates that for each $1US dollar per barrel rise in the oil price, other factors remaining equal, the averagetotal cash costs under IFRS of all its operations increases by about $0.70approximately $0.90 per ounce with theounce. The impact on cash costs determined under US GAAP may be different. The cash costs of certain of the company’s mines, particularly Yatela, Sadiola, Siguiri, Geita, Navachab, Morila, and Cripple Creek & Victor, Siguiri and Sadiola, which, being more dependent on fuel, are moremost sensitive to changes in the price of oil.
Furthermore, the price of steel has also been volatile. Steel is used in the manufacture of most forms of fixed and mobile mining equipment, which is a relatively large contributor to the operating costs and capital expenditure of a mine. For example, the price of flat hot rolled coil (North American Domestic FOB) steel traded between $635$590 per tonne and $875$733 per tonne in 2011.2012. On April 19, 2013, the price of flat hot rolled coil (North American Domestic FOB) was $609 per tonne.
Fluctuations in oil and steel prices have a significant impact on operating costs and capital expenditure estimates and, in the absence of other economic fluctuations, could result in significant changes in the total expenditure estimates for new mining projects or render certain projects non-viable.
Energy cost increases and power fluctuations and stoppages could adversely impact the company’s results of operations and its financial condition.
Increasing global demand for energy, concerns about nuclear power, and the limited growth of new supply are impacting the price and supply of energy. The transition of emerging markets to higher energy consumption, carbon taxation as well as unrest and potential conflict in the Middle East, among other factors, could result in increased demand or constrained supply and sharply escalating oil and energy prices.
AngloGold Ashanti’s mining operations are substantially dependent upon electrical power generated by local utilities or by power plants situated at some of its operations. The unreliability of these local sources of power can have a material effect on the company’s operations, as large amounts of power are required for exploration, development, extraction, processing and other mining activities on the company’s properties.
In South Africa, the company’s operations are dependent on electricity supplied by one nationalstate-owned power generation company, Eskom the state-owned utility.Eskom. Electricity is used for most business and safety-critical operations that include cooling, hoisting and dewatering. Loss of power couldcan therefore impact production, employee safety and prolonged outages could lead to flooding of workings and ore sterilization. In 2008, Eskom and the South African government declared a national emergency and warned itthat they could no longer guarantee the availability of electricity due to a national supply shortage blamed on coal supply shortages and unplanned generation-set outages as a result of maintenance backlog and asset age. The entire country went into a program of rolling blackouts and AngloGold Ashanti and other mining companies operating in South Africa were forced in late January until mid-March of 2008 to temporarily suspend mining operations at their mines. In addition, lightning damage to power stations can result in power interruptions at our operations. In this regard, AngloGold Ashanti’s two main operational sites in the West Wits region in South Africa had all main power interrupted between March 13, 2013 and March 15, 2013 after a fire caused by lightning damaged a transformer at a main regional substation. The power supply to AngloGold Ashanti’s South African mining industry.operations may be curtailed or interrupted again in the future. A warning of the ‘very high’“very high” risk of blackouts was re-issued at the start of 2011.2011 and again in 2012. While a national energy conservation program is in place, Eskom cannot guarantee that there will be no power interruptions. In 2008, AngloGold Ashantiinterruptions and other mining companies operatingis again facing very tight supply reserve margins in South Africa were forced2013, which we expect to temporarily suspend mining operationscontinue at their mines, after whichleast until the company implemented various initiatives at its South African minesnew coal fired Medupi Power Station starts to reduce electricity consumption while operating at full capacity. AngloGold Ashanti cannot offer assurance that the power supply to its South African operations will not be curtailed or interrupted again.come on line in early 2014.
Eskom and the National Energy Regulator of South Africa (NERSA) recognize the need to increase electricity supply capacity and a series of tariff increases and proposals have been enacted to assist in the funding of this expansion. In 2010, NERSA approved an annual increase of 24.8 percent for 2010, 25.8 percent for 2011, and 25.9 percent for 2012, and is now reportedly considering requesting another two similar increases, one each16.0 percent for 2013. The actual increase implemented for 2012 was lowered to 16.09 percent after government intervention, but there can be no assurance as to the existence or nature of any government intervention in the future. In February 2013, NERSA announced that Eskom would be allowed to increase electricity tarriffs at an average yearly rate of 8 percent between 2013 and 2014.2018. This increase is half the 16 percent sought by the utility in its application. As energy represents a large proportion of the company’s operating costs in South Africa, these increases have anhad, and any future increases will have, a materially adverse impact on the cash costs of its South African operations.
The company has also identified a risk of energy shortages in Argentina and the DRC. Furthermore, all of the company’s mining operations in Ghana depend on hydroelectric power supplied by the state-controlled Volta River Authority (VRA), which is supplemented by thermal power from the Takoradi plant and a smaller unit at Tema. During periods of below average inflows from the Volta reservoir, electricity supplies from the Akosombo Dam, the VRA’s primary generation source, may be curtailed as occurred in 1998, 2006 and the first half of 2007. During periods of limited electricity availability, the grid is subject to disturbances and voltage fluctuations which can damage equipment. Recent disruptions in natural gas supply from Nigeria, via the West Africa Gas Pipeline, has led to some reduction in thermal generation capacity and the use of more expensive light crude oil which is putting upward pressure on power tariffs. In the past, the VRA has obtained power from neighboring Côte d’Ivoire, which has intermittently experienced political instability and civil unrest. AngloGold Ashanti negotiates rates directly with the VRA and there can be no assurance that the VRA willmay not agree to a satisfactory rate during future rounds of negotiations.
The company’s mining operations in Guinea, Tanzania and Mali are dependent on power supplied by outside contractors and supplies of fuel are delivered by road. Power supplies have been disrupted in the past, resulting in production losses due to equipment failure.
Increased energy prices could negatively impact operating costs and cash flow of AngloGold Ashanti’s operations.
Global economic conditions could adversely affect the profitability of operations.
AngloGold Ashanti’s operations and performance depend significantly on worldwide economic conditions. The global financial markets have recently experienced increasedconsiderable volatility due tofrom uncertainty surrounding the level and sustainability of the sovereign debt of various countries. In addition, some economists, observers and market participants have expressed concernConcerns remain regarding the sustainability of the European Monetary Union and its common currency, the euro, in their current form.form, as well as the negative impacts of the recent downgrade of the sovereign credit rating of the Republic of South Africa. These conditions and other disruptions to international credit markets and financial systems have caused a loss of investor confidence and resulted in widening credit spreads, a lack of price transparency, increased credit losses and tighter credit conditions. Despite the aggressive measures taken by governments and central banks thusso far, economic recovery has been extremely slow. A significant risk remains that these measures may not prevent the global economy from falling back into an even deeper and longer lasting recession or even a depression.
A global economic downturn and recession may have follow-on effects on AngloGold Ashanti’s business that include inflationary cost pressures and commodity market fluctuations.
Other effects could, for example, include:
the insolvency of key suppliers or contractors which could result in contractual breaches and in a supply chain breakdown;
the insolvency of ourone or more joint venture partners which could result in contractual breaches and disruptions at the operations of ourthe company’s joint ventures;
changes in other income and expense which could vary materially from expectations, depending on gains or losses realized on the sale or exchange of financial instruments, and impairment charges that may be incurred with respect to our investments;
AngloGold Ashanti’s defined benefit pension fund may not achieve expected returns on its investments, which could require the company to make substantial cash payments to fund any resulting deficits;
a reduction in the availability of credit which may make it more difficult for the company to obtain financing for its operations and capital expenditures or make that financing more costly; and
exposure to the liquidity and insolvency risks of the company’s lenders and customerscustomers;
any of which could negatively affect AngloGold Ashanti’s financial condition and operational results.
Uncertainty regarding global economic conditions may increase volatility or negatively impact the market value of the company’s securities.
Inflation may have a material adverse effect on results of operations.
General inflationary pressures affecting the mining industry and accelerating inflation across South American jurisdictions resulted in significant cost pressure during 2011. In Argentina, in particular, rising inflation resulted in higher labor costs and consumables costs in 2011, which could adversely affect procurement and recruitment activities as well as labor relations in 2012.
MostMany of AngloGold Ashanti’s operations are located in countries that have experienced high rates of inflation during certain periods.
It is possible that significantly higher future inflation in the countries in which the company operates may result in an increase in operational costs in local currencies (without a concurrent devaluation of the local currency of operations against the dollar or an increase in the dollar price of gold). This could have a material adverse effect uponon the company’s results of operations and its financial condition. Significantly higher and sustained inflation, with a consequent increase in operational costs, could result in the rationalization of higher cost mines or projects.
Mining companies face many risks related to the development of mining projects that may adversely affect the company’s results of operations and profitability.
The profitability of mining companies depends partly on the actual costs of developing and operating mines, which may differ significantly from estimates determined at the time the relevant project was approved following completion of its feasibility study. Development of mining projects may also be subject to unexpected problems and delays that could increase the development and operating costs of the relevant project.
AngloGold Ashanti’s decision to develop a mineral property is typically based on the results of a feasibility study, which estimatesstudy. Feasibility studies estimate the expected or anticipated economic returns from the project. These estimates are based on assumptions regarding:
future prices of gold, uranium, silver and other metals;
future currency exchange rates;
tonnage, grades and metallurgical characteristics of ore to be mined and processed;
anticipated recovery rates of gold, uranium, silver and other metals extracted from the ore;
anticipated capital expenditure and cash operating costs; and
required return on investment.
Actual cash operating costs, production and economic returns may differ significantly from those anticipated by such studies and estimates. Operating costs and capital expenditure are to a significant extent driven by the cost of commodity inputs consumed in mining, including fuel, chemical reagents, explosives, tirestyres and steel, and also by credits from by-products, such as silver and uranium. They could also fluctuate considerably as a result of changes in the prices of mining equipment used in the construction and operation of mining projects.
There are a number of uncertainties inherent in the development and construction of a new mine or the extension toof an existing mine. In addition to those discussed above, these uncertainties include the:
timing and cost of construction of mining and processing facilities, which can be considerable;
availability and cost of mining and processing equipment;
availability and cost of skilled labor, power, water and transportation;
availability and cost of appropriate smelting and refining arrangements;
requirementapplicable requirements and time needed to obtain the necessary environmental and other governmental permits; and
availability of funds to finance construction and development activities.
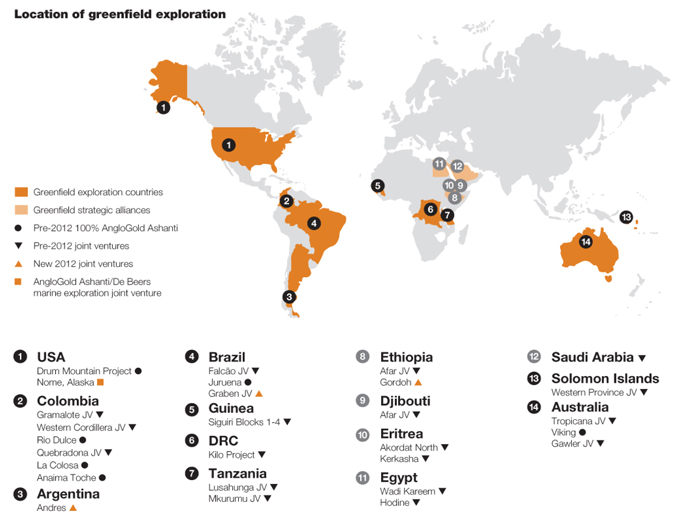
The remote location of many mining properties, permitting requirements and/or delays, third-party legal challenges to individual mining projects and broader social or political opposition to mining may increase the cost, timing and complexity of mine development and construction. New mining operations could experience unexpected problems and delays during the development, construction, commissioning and commencement of production. For example, a number of targets for greenfield exploration were missed in 2010, especially those relatingAngloGold Ashanti may prove unable to resource drilling and prefeasibility studies atsuccessfully develop the La Colosa and Gramalote projects as well as other potential exploration sites in Colombia due to difficulties that could arise in relation to, for example, social and at Central Mongbwalucommunity opposition, litigation, ore body grades, definition of adequate reserves and resources, and the time taken to prove project feasibility that could result in the DRC. The total numberexpiry of meters drilledpermits. For example, on March 11, 2013, Cortolima, a regional environmental authority in Colombia, issued an injunction against AngloGold Ashanti’s Colombian subsidiary, alleging that the subsidiary was significantly lower than expected dueoperating without proper permits and was engaging in activity that was harmful to delaysthe environment. Furthermore, at around the same period in the approvaltime, access to an AngloGold Ashanti drilling site was blockaded by residents of the necessary environmental (water use) and access permits. Contractual and legal issues delayed the start of regional exploration drilling on the Kilo joint venture in the DRC until the fourth quarter of 2010.a nearby community.
Accordingly, AngloGold Ashanti’s future development activities may not result in the expansion or replacement of current production, or one or more new production sites or facilities may be less profitable than anticipated or may be loss-making. The company’s operating results and financial condition are directly related to the success of its project developments. A failure in the company’s ability to develop and operate mining projects in accordance with, or in excess of, expectations could negatively impact its results of operations, as well as its financial condition and prospects.
Mining companies face uncertainty and risks in exploration, feasibility studies and other project evaluation activities.
AngloGold Ashanti must continually replace Ore Reserve depleted by mining and production to maintain or increase gold production levels in the long-term.long term. This is undertaken by exploration activities that are speculative in nature. The ability of the company to sustain or increase its present levels of gold production depends in part on the success of its projects.projects and it may be unable to sustain or increase such levels. For example, in South Africa, the company experienced declining production rates (1.213 million ounces of gold in 2012, compared with 1.624 million ounces of gold in 2011 and 1.784 million ounces in 2010), principally due to continued safety and associated stoppages, mining flexibility constraints and overall falls in grades. The significant decrease in 2012 was also mainly attributable to the industrial strike action at the company’s South African mines, which resulted in the loss of production of 235,000 ounces of gold.
Feasibility studies and other project evaluation activities necessary to determine the current or future viability of a mining operation are often unproductive. Such activities often require substantial expenditure on exploration drilling to establish the presence, extent and grade (metal content) of mineralized material. AngloGold Ashanti undertakes feasibility studies to estimate the technical and economic viability of mining projects and to determine appropriate mining methods and metallurgical recovery processes. These activities are undertaken to estimate the Ore Reserve.
Once mineralization is discovered, it may take several years to determine whether an adequate Ore Reserve exists, during which time the economic feasibility of the project may change due to fluctuations in factors that affect both revenue and costs, including:
future prices of metals and other commodities;
future foreign currency exchange rates;
the required return on investment as based on the cost and availability of capital; and
applicable regulatory requirements, including environmental, health and safety matters.
Feasibility studies also include activities to estimate the anticipated:
tonnages, grades and metallurgical characteristics of the ore to be mined and processed;
recovery rates of gold, uranium and other metals from the ore; and
capital expenditure and cash operating costs.
These estimates depend on assumptions made on available data. Ore Reserve estimates are not precise calculations and depend on the interpretation of limited information on the location, shape and continuity of the mineral occurrence and on available sampling results. Further exploration and feasibility studies can result in new data becoming available that may change previous Ore Reserve estimates and impact the technical and economic viability of production from the project. Changes in the forecast prices of commodities, exchange rates, production costs or recovery rates may change the economic status of reserves resulting in revisions to previous Ore Reserve estimates. These revisions could impact depreciation and amortization rates, asset-carrying amounts, provisions for closedown, restoration and environmental cleanuprehabilitation costs.
AngloGold Ashanti undertakes annual revisions to its Ore Reserve estimates based upon actual exploration and production results, depletion, new information on geology, model revisions and fluctuations in production, economic assumptions and operating and other costs. These factors may result in reductions in Ore Reserve estimates, which could adversely affect life-of-mine plans and consequently the total value of the company’s mining asset base. Ore Reserve restatements could negatively affect the company’s results of operations, as well as its financial condition and prospects.
The increased overall demand for gold and other commodities, combined with a declining rate of discovery of new gold Ore Reserve in recent years, has resulted in the accelerated depletion of the existing Ore Reserve across the global gold sector. AngloGold Ashanti therefore faces intense competition for the acquisition of attractive mining properties. From time to time, the company evaluates the acquisition of an Ore Reserve, development properties or operating mines, either as stand-alone assets or as part of companies. AngloGold Ashanti’s decision to acquire these properties has been based on a variety of factors including historical operating results, estimates and assumptions regarding the extent of the Ore Reserve, cash and other operating costs, gold prices, projected economic returns and evaluations of existing or potential liabilities associated with the relevant property and its operations and how these factors may change in future. Other than historical operating results, these factors are uncertain and could have an impact on revenue, cash and other operating costs, as well as the process used to estimate the Ore Reserve.
As a result of these uncertainties, exploration and acquisitions by the company may not result in the expansion or replacement of current production or the maintenance of its existing Ore Reserve net of production or an increase in Ore Reserve. AngloGold Ashanti’s results of operations and its financial condition are directly related to the success of its exploration and acquisition efforts and its ability to replace or increase the existing Ore Reserve. If the company is not able to maintain or increase its Ore Reserve, its results of operations as well as its financial condition and prospects could be adversely affected.
Mining companies face many risks related to their operations that may adversely impact cash flows and overall profitability.
Gold mining is susceptible to events that may adversely impact a mining company’s ability to produce gold and meet production and cost targets. These events include, but are not limited to:
environmental, as well as health and safety hazards, including dust generation, dischargeincidents during production or transportation resulting in injury, loss of metals, pollutants, radioactivitylife, or hazardous chemicals; industrial accidents or accidents during transportation;damage to equipment;
ground and surface water pollution;
social or community disputes or interventions;
security incidents;
surface or underground fires or explosions;
electrocution;
falls from heights and accidents relating to mobile machinery, including shaft conveyances and elevators, drilling blasting and mining operations;
labor force disputes and disruptions;
loss of information integrity or data;
activities of illegal or artisanal miners;
shortages in material and equipment availability;equipment;
mechanical failure or breakdowns and ageing infrastructure;
failure of unproven or evolving technologies;
energy and electrical power supply interruptions or rationing;
unusual or unexpected geological formations, ground conditions, including lack of mineable face length, and ore-pass blockages;
water ingress and flooding;
process water shortages;
metallurgical conditions and gold recovery;
unexpected decline of ore grade;
unanticipated increases in gold lock-up and inventory levels at heap-leach operations;
fall-of-ground accidents in underground operations;
cave-ins, sinkholes, subsidence, rock falls, rock bursts, or landslides;
failure of mining pit slopes, heap-leach facilities, water or solution dams, waste stockpiles and tailings dam walls;
legal and regulatory restrictions and changes to such restrictions;
safety-related stoppages;
gold bullion theft;
corruption, fraud and theft;
allegations of human rights abuses;
seismic activity; and
other natural phenomena, such as floods, droughts or weather conditions, potentially exacerbated by climate change.
Seismic activity is of particular concern in underground mining operations, particularly in South Africa due to the extent and extreme depth of mining, and also in Australia and Brazil due to the depth of mining and residual tectonic stresses. Despite modifications to mine layouts and support technology, as well as other technological improvements employed with a view to minimizing the incidence and impact of seismic activity, seismic events have caused death and injury to employees and contractors and may do so again in future.future, and have in the past and may again result in safety-related stoppages.
Seismic activity may also cause the loss of mining equipment, damage to or destruction of mineral properties or production facilities, monetary losses, environmental damage and potential legal liabilities at operations where seismic activity may be a factor.liabilities. As a result, these events may have a material adverse effect on AngloGold Ashanti’s results of operations and financial condition. For example, in early 2011, mining of the Ventersdorp Contact Reef shaft pillar at TauTonaTau Tona was suspended following a significant seismic event. New equipment had to be purchased and the shutdown contributed to the decline in the operational output of the mine as compared to the previous year.
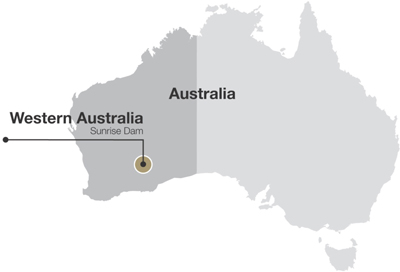
In the past, floods have also disrupted the operations of some of ourthe company’s mines. For example, unprecedented heavy rains in February and March 2011 in Australia flooded the Sunrise Dam Gold Mine and forced a temporary shutdown of operations. The flood event impacted underground production for approximately four months and open pit production for approximately six months. FullDespite the shutdown, full costs were incurred despite the shutdown, as the mining contractors worked on remedial activities to repair damage and rehabilitate flooded areas. The considerable remedial work required adversely impacted cash costs per ounce and the impact of the flood event and the pit wall failure together significantly reduced planned production at the plant.
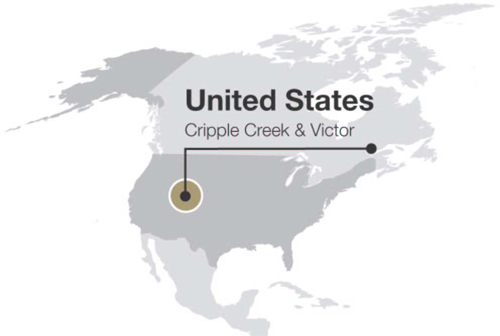
Water scarcity has been identified as a significant risk at AngloGold Ashanti’s US operation. Production at the Cripple Creek & Victor Gold Mining Company’s Cresson Project continued to be affected by a severe drought in 2011. The lack of water reduced percolation through the heap-leach pad, which curtailed production and productivity.
Mining companies’ operations are vulnerable to infrastructure constraints.
Mining, processing, development and exploration activities depend on adequate infrastructure. Reliable rail, ports, roads, bridges, power sources, power transmission facilities and water supply are critical to ourthe company’s business operations and affect capital and operating costs. These infrastructure and services are often provided by third parties whose operational activities are outside the control of the company.
Interferences in the maintenance or provision of infrastructure, including unusual weather phenomena, sabotage and social unrest, could impede the company’s ability to deliver its products on time and adversely affect AngloGold Ashanti’s business, financial condition and results of operations.operations and financial condition.
Establishing infrastructure for the company’s development projects requires significant resources, identification of adequate sources of raw materials and supplies, and necessary co-operation from national and regional governments, none of which can be assured.
AngloGold Ashanti has operations or potential development projects in countries where government-provided infrastructure may be inadequate and regulatory regimes for access to infrastructure may be uncertain, which could adversely impact the efficient operation and expansion of ourits business. There is no guarantee that AngloGold Ashanti willmay not secure and maintain access to adequate infrastructure in the future, nor thator it canmay not do so on reasonable terms.
WeMining companies face strong competition from our peers.competition.
The mining industry is competitive in all of its phases. AngloGold Ashanti competes with other mining companies and individuals for specialized equipment, components and supplies necessary for exploration and development, for mining claims and leases on exploration properties and for the acquisition of mining assets. These competitors may have greater financial resources, operational experience and technical capabilities than AngloGold Ashanti. Competition may increase AngloGold Ashanti’s cost of acquiring suitable claims, properties and assets, should they become available to the company.assets.
Mining companies are subject to extensive health and safety laws and regulations.
Gold mining operations are subject to a variety of industry-specificextensive health and safety laws and regulations depending on whichin every jurisdiction they areoperate in. These laws and regulations, arealong with international and industry standards, designed to protect and improve the safety and health of employees. AngloGold Ashanti is also in the process of implementing an enhanced safety program, including improved incident investigation and reporting systems, which could result in significant additional costs for the company.employees, require extensive compliance measures.
From time to time, new or improvedupdated health and safety laws, regulations and regulationsstandards are introduced in jurisdictions in which AngloGold Ashanti operates.introduced. Should compliance with new standardsthese require a material increase in expenditure or material changes or interruptions to operations or production, including as a result of any temporary failure to comply with applicable regulations, the company’s results of operations and the financial condition of the company could be adversely affected. Furthermore, AngloGold Ashanti is implementing an enhanced safety program, which could result in additional costs for the company.
In some of the jurisdictions in which we operate,AngloGold Ashanti operates, the government enforces compulsory shutdowns of operations to enable investigations into the cause of accidents at those operations.accidents. Certain of the company’s operations have been temporarily suspended for safety reasons in the past. In South Africa, in particular, so-called Section‘Section 54 safety stoppagesstoppages’ have become a significant issue. In 2011, the Inspector of Mines ordered the shutdown of entire mines in cases of relatively minor violations, which had a material impact on production at these mines. In particular, the Inspector issued Kopanang 11eleven Section 54 directivesnotices during the year.2011. Each directivenotice resulted in Kopanang suspending operations either fully or partially in order to comply with the inspector’s recommendations on safety.
Safety-related stoppages resulted in the direct loss of 72,900 and 72,400 ounces of gold production during 2011 and 2012, respectively, in South Africa.
A working group comprisingcomprised of the inspectorate, the mining industry and organized labor has been formed to address the trend of increasing safety stoppages.stoppages in South Africa. However, the working group may not agree on how to address this issue and the number of safety stoppages may continue or even increase in the future.
AngloGold Ashanti’s reputation as a responsible company and employer could be damaged by any significant governmental investigation or enforcement of health and safety laws, regulations or standards. Any of these factors could have a material adverse effect on the company’s results of operations and financial condition.
Mining companies are increasingly required to consider and take steps to developoperate in a sustainable manner and to provide benefits to the communities and countries in which they operate.affected communities. Failure to consider suchcomply with these requirements can result in legal suits, additional operational costs, adverse reactions by investorsinvestor divestment, loss of ‘social licence to operate’, and otherwise adversely impact mining companies’ financial condition and social license to operate.condition.
As a result of public concern about the perceived ill effects of economic globalization, businesses in general and large multinational mining corporations such as AngloGold Ashanti in particular face increasing public scrutiny of their activities.
These businesses are under pressure to demonstrate that while they seek a satisfactory return on investment for shareholders, human rights are respected and other social partners, including employees, host communities and more broadly the countries in which they operate, also benefit from their commercial activities. Such pressures tend to be particularly focused on companies whose activities are perceived to have, or have, a high impact on their social and physical environment. The potential consequences of these pressures and the adverse publicity in cases where companies are believed not to be creating sufficient social and economic benefit may result in additional operating costs, reputational damage, active community opposition, allegations of human rights abuses, legal suits and investor withdrawal.
Existing and proposed mining operations are often located at or near existing towns and villages, natural water courses and other infrastructure. As the impacts of dust generation, waste storage, water pollution or shortage, in particular, may be immediate and directly adverse to those communities, poor environmental management of eitherpractices, or adverse changes in the supply or the quality of water can result in community protest, regulatory sanctions or ultimately in the withdrawal of community and government support for company operations. For example, opposition to mining activity in the Tolima province of Colombia, which hosts the La Colosa deposit, has centered on the perception that large-scale mining activity will have a detrimental impact on the region’s river systems.
Mining operations must therefore be designed to minimize their impact on such communities and the environment, either by changing mining plans to avoid such impact, by modifying mining plans and operations, or by relocating the affected people to an agreed location. Responsive measures may also include agreed levelsthe full restoration of compensation for any adverse impact ongoing mining operations may continue to have upon the community.livelihoods of those impacted.
In addition, as AngloGold Ashanti has a long history of mining operations in certain regions, issues may arise regarding historical as well as potential future environmental or health impacts toin those areas. For example, certain parties, including NGOs,non-governmental organizations, community groups and institutional investors, have raised concerns about surface and groundwater quality, among other issues, in the area surrounding the company’s Obuasi and Iduapriem mines in Ghana, including potential impacts to local rivers and wells used for water from heavy metals, arsenic and cyanide as well as sediment and mine rock waste. Following temporary shutdowns at both mines in 2010, the company has made improvements in effluent quality management and constructed new tailings impoundments to reduce the risk of incidents that have the potential to degrade local water sources. AngloGold Ashanti is continuing to investigate allegations of impacts by the company’s operations on water quality in mining areas and to consider, as appropriate, potential additional responsive actions such as remediation, engineering and operational changes at the mine sites and community outreach programs.
Disputes with surrounding communities may also affect mining operations, by the restrictionparticularly where they result in restrictions of access to supplies and of the workforce to mining operations. The mines’miners’ access to land may be subject to the rights or asserted rights of various community stakeholders, including indigenous people. Access to land and land use is of critical importance to the company for exploration and mining, as well as for ancillary infrastructure. In some cases, AngloGold Ashanti has had difficulty gaining access to new land because of perceived poor community compensation practices. For example, compensation remains a significant area of concern in Siguiri in Guinea. In 2011, a violent community protest interrupted operations for three days, which contributed to the project’s decline in production as compared to 2010. Delays in projects attributable to a lack of community support can translate directly into a decrease in the value of a project or into an inability to bring the project to production.
The cost of measures and other issues relating to the sustainable development of mining operations could place significant demands on personnel resources, could increase capital and operating costs and could have an adverse impact uponon AngloGold Ashanti’s reputation, results of operations and financial condition.
Mining companies are subject to extensive environmental laws and regulations.
Mining companies are subject to extensive environmental laws and regulations in the various jurisdictions in which they operate.operate in addition to international standards. These regulations and standards establish limits and conditions on a producer’sminer’s ability to conduct its operations and govern, among other things, extraction, use and conservation of water resources; air emissions (including dust control) and water treatment and discharge; regulatory and community reporting; clean-up of contamination; worker safety and community health; and the generation, transportation, storage and disposal of solid and hazardous wastes, such as acids, radioactive materials, and mine tailings.
The cost of compliance with environmental laws and regulations is expected to continue to be significant to AngloGold Ashanti. AngloGold Ashanti could incur fines, penalties and other sanctions, clean-up costs, and third-party claims for personal injury or property damages;damages, suffer reputational damage; anddamage, or be required to install costly pollution control equipment or to modify or suspend operations, as a result of actual or alleged violations or liabilities underof environmental laws and regulations. In addition, unknown environmental hazards may exist on the company’s properties which may have been caused by previous owners or by existing operators.
For example, in 2010 AngloGold Ashanti’s Obuasi mine in Ghana suspended gold processing operations for five days to implement a revised water management strategy aimed at reducing contaminants contained in its discharge. Brief stoppages after environmental incidents, such as pipeline failures, have occurred more recently at that mine. Furthermore, following a temporary suspension of operations at the Iduapriem mine, the company, with the approval of the Ghana Environmental Protection Agency, constructed an interim tailings storage facility for tailings deposition for a year while the greenfieldsa new tailings storage facility was being constructed. InThe company continues to seek to make improvements in water quality management to reduce the risk of unpermitted and/or accidental discharges and, in addition, the companyit is currently investigating allegations of impacts on water quality in the area of these mines.
Failure to comply with applicable environmental laws and regulations may also result in the suspension or revocation of operating permits. AngloGold Ashanti’s ability to obtain and maintain permits and to successfully operate in particular communities may be adversely impacted by real or perceived effects on the environment or human health and safety associated with AngloGold Ashanti’s or other mining companies’ activities.
For example, in Colombia, various plaintiffs, including associations that represent local communities, have brought legal proceedings against AngloGold Ashanti Colombia S.A. (AGAC) alleging that AGAC has violated applicable environmental laws in connection with the La Colosa project. If the plaintiffs were to prevail, AGAC’s three core concession contracts relating to the La Colosa project may be canceled, the companycancelled, AGAC would be required to abandon the La Colosa project and all other existing mining concession contracts and pending proposals for new mining concession contracts of AGAC, butthough not also those of other companies of the AngloGold Ashanti group operating in Colombia, would also be canceled.Colombia. In addition, AGAC would be banned from doing business with the Colombian government for a period of five years. See “ItemItem 8A.: Consolidated statements and other financial information – Legal proceedings““Legal proceedings”.
Environmental laws and regulations are continually changing and are generally becoming more restrictive.stringent. Changes to AngloGold Ashanti’s environmental compliance obligations or operating practices could adversely affect the company’s rate of production and revenue. Variations in laws and regulations, assumptions made to estimate liabilities, standards or operating procedures, more stringent emission or pollution thresholds or controls, or the occurrence of unanticipated conditions, may require operations to be suspended or permanently closed, and could increase AngloGold Ashanti’s expenses and provisions. These expenses and provisions could adversely affect the company’s results of operations and its financial condition.
For example, the use of sodium cyanide in metallurgical processing is under increasing environmental scrutiny and is prohibited infor certain jurisdictions. As there are few, if any, effective substitutes in extracting gold from the ore, any ban or material restrictions on the use of sodium cyanide in mining operations in the jurisdictions where AngloGold Ashanti conducts its operations could adversely affect the company’s results of operations and its financial condition. In addition, leaks or discharges of sodium cyanide or other hazardous materials could result in liabilities for clean-up liabilitiesor personal injury that may not be covered by insurance.
AngloGold Ashanti’s operations are heavily dependent upon access to substantial volumes of water for use in the mining and extractive processes and typically are subject to water-use permits that govern usage and require, among other things, that mining operations maintain certain water quality upon discharge. Water quality and usage are areas of concern globally, but are particularly significant forsuch as with respect to the company’s mining operations in Ghana and South Africa and forits exploration projects in Colombia, where there is significant potential environmental and social impact and a high level of stakeholder scrutiny. Any failure by the company to secure access to suitable water supplies, or achieve and maintain compliance with theapplicable requirements of the permits or licenses, could result in curtailment or halting of production at the affected operation. Incidents of water pollution or shortage can, in extreme cases, lead to community protest and ultimately to the withdrawal of community and government support for our operations. Water scarcity has been identified as a significant risk at AngloGold Ashanti’s US operation in particular. Production at the company’s operations.Cripple Creek & Victor Gold Mining Company’s Cresson mine continued to be affected by a severe drought in 2011 and 2012. The lack of water reduced percolation through the heap-leach pad, which curtailed production and productivity.
Mining and mineral processing operations generate waste rock and tailings. The impact of adust generation, breach, leak, or other failure of a waste rock or tailings storage facility, can be significant. An incident at AngloGold Ashanti’s operations could lead to, among others, obligations to remediate environmental contamination and claims for property damage and personal injury.injury from adjacent communities. Incidents at other companies’ operations could result in governments tightening regulatory requirements and restricting mining activities.
In addition, mining companies are required by law to close their operations at the end of the mine life and rehabilitate the lands mined. Estimates of total ultimate closure and rehabilitation costs for gold mining operations are significant and based principally on life-of-mine profiles, changing inflation and discount rate assumptions, changing designs of tailing storage facilities and current legal and regulatory requirements that may change materially. Environmental liabilities are accrued when they become known, probable and can be reasonably estimated. Increasingly, regulators are seeking security in the form of cash collateral or bank guarantees in respect of environmental obligations, which could have an adverse impact on AngloGold Ashanti’s financial condition.
AngloGold Ashanti’s discounted closure liability was US$758 million as at December 31, 2012 compared with US$653 million as at December 31, 2011. The reasons for the change were new damage from current mining operations, new damage from building of new mining areas, the acquisition of Mine Waste Solutions, changes in
estimates for new life of mine calculations and changes in discount rates. Costs associated with rehabilitating land disturbed by mining processes and addressing environmental, health and community issues are estimated and financial provision made based upon current available information. Estimates may, however, be insufficient and further costs may be identified at any stage.stage that may exceed the provisions that AngloGold Ashanti has made. Any underestimated or unidentified rehabilitation costs would reduce earnings and could materially and adversely affect the company’s asset values, earnings and cash flows.
Compliance with emerging climate change regulations could result in significant costs and climate change may present physical risks to a mining company’s operations.
Greenhouse gases (GHGs) are emitted directly by AngloGold Ashanti’s operations, as well as by external utilities from which AngloGold Ashanti purchases power. Currently, a number of international and national measures to address or limit GHG emissions, including the Kyoto Protocol, the Copenhagen Accord and the Durban Platform, are in various phases of discussion or implementation in the countries in which the company operates. In particular, the Durban Platform commits all parties to the conference to develop a global mitigation regime which could take effect in 2020, with the specific terms of that legally binding accord, including individual targets, to be finalized by 2015. These, or future, measures could require AngloGold Ashanti to reduce its direct GHG emissions or energy use or to incur significant costs for GHG emissions permits or taxes or have these costs or taxes passed on by electricity utilities which supply the company.company’s operations. AngloGold Ashanti also could incur significant costs associated with capital equipment, GHG monitoring and reporting and other obligations to comply with applicable requirements. For example, Australia has passed legislation that will implementon July 1, 2012, the Australian Government introduced a carbon tax on GHG emissions. It also plans to implement an emissions trading scheme commencingbeginning in July 2012.2015. Other countries, including South Africa, Brazil and the United States, have passed or are considering GHG trading or tax schemes, and/or other regulation of GHG emissions, thoughalthough the precise impact on AngloGold Ashanti’s operations cannot yet be determined.
In addition, AngloGold Ashanti’s operations could be exposed to a number of physical risks from climate change, such as changes in rainfall rates, rising sea levels, reduced water availability, higher temperatures and extreme weather events. Events or conditions such as flooding or inadequate water supplies could disrupt mining and transport operations, mineral processing and rehabilitation efforts, could create resource shortages and couldor damage the company’s property or equipment and increase health and safety risks on site. Such events or conditions could have other adverse effects on the company’s workforce and on the communities around ourits mines, such as an increased risk of food insecurity, water scarcity and prevalence of disease.
Compliance with emerging ‘conflict minerals’materials’ and ‘responsible gold’ legislation and standards could result in significant costs.
There is increasing legislation and initiativesare ever more stringent standards relating to ‘conflict’‘conflict minerals’ and ‘responsible’ gold that include the: US Dodd-Frank Act; World Gold Council Conflict Free Gold Standard; Organization for Economic Cooperation and Development Due Diligence Guidelines for Responsible Supply Chain of Minerals from Conflict-Affected and High-Risk Areas; and London Bullion Market Association Responsible Gold Guidance. This
Any such legislation and standards may result in the increased cost of demonstratingsignificant costs to ensure and demonstrate compliance, and difficulties in the sale of gold emanating from certain areas, such as the Democratic Republic of the Congo (DRC) and its neighbors.areas. The complexities of the gold supply chain, especially as they relate to ‘scrap’ or recycled gold, and the fragmented and often unregulated supply of artisanal and small-scale mined gold are such that there may be significant uncertainties at each stage in the chain as to the provenance of the gold, and as a result of uncertainties in the process, the costs of due diligence and audit, or the reputational risks of defining their product or a constituent part as containing a ‘conflict mineral’ would be too burdensome for the company’s customers. Accordingly, manufacturers may decide to switch supply sources or to substitute gold with other minerals not covered by the initiatives. This could have a material negative impact on the gold industry, including on AngloGold Ashanti’s financial results.
Mining operations and projects are vulnerable to supply chain disruption with the result that operations and development projects could be adversely affected by shortages of, as well as the lead times to deliver, strategic spares, critical consumables, mining equipment or metallurgical plant.
AngloGold Ashanti’s operations and development projects could be adversely affected by both shortages and long lead times to deliver strategic spares, critical consumables, mining equipment and metallurgical plant. Import restrictions, such as those introduced by the Argentine government in 2011, can also delay the delivery of parts and equipment. In the past, the company and other gold mining companies experienced shortages in critical consumables, particularly as
production capacity in the global mining industry expanded in response to increased demand for commodities. AngloGold Ashanti has also experienced increased delivery times for these items. Shortages have resulted in unanticipated price increases and production delays and shortfalls, resulting in a rise in both operating costs and in the capital expenditure necessary to maintain and develop mining operations.
Individually, AngloGold Ashanti and other gold mining companies have limited influence over manufacturers and suppliers of these items. In certain cases there are a limited number of suppliers for certain strategic spares, critical consumables, mining equipment or metallurgical plant who command superior bargaining power relative to the company. The company could at times face limited supply or increased lead time in the delivery of such items. For example, during 2012, supply of caustic soda was delayed in the Continental Africa Region. In addition, the unreliability of oxygen and lime supply similarly affected production at the Vaal River and West Wits surface operations in South Africa throughout 2011 and poor availability of drill rigs, heavy machinery and fleet equipment hampered underground drilling and overall operational performance at the Serra Grande mine in Brazil in 2011. In addition, the unreliability of oxygen and lime supply similarly affected production at the Vaal River and West Wits Surface Operations in South Africa throughout the year.
The company’s procurement policy is to source mining and processing equipment and consumables from suppliers that meet its corporate values and ethical standards although risk remains around the management of ethical supply chains. In certain locations, where a limited number of suppliers meet these standards, furtheradditional strain is placed on the supply chain, thereby increasing the cost of supply and delivery times.
Furthermore, supply chains and rates can be impacted by natural disasters, and other phenomena, such as earthquakes, extreme weather patterns and climate change.change, as well as other phenomena that include unrest, strikes, theft and fires. For example, the 2011 earthquake and tsunamia three-week transport strike in Japan has had a limited knock-on effect on2012 delayed the supply of consumables in South Africa. Potential supply chain disruption in Mali, as a result of the coup d’état and subsequent state of emergency, has been avoided to date by well managed consumable stock holding. Potential gold doré export disruptions at Geita, the result of an attempted gold heist, and in Mali, following the closure of Bamako International Airport, were minimized with the introduction of alternative transportation arrangements. In February 2013, a fire destroyed the heavy mining equipment lead timesstock of spares and costs of certain supplies.components at the Geita gold mine. If AngloGold Ashanti experiences shortages, or increased lead times in the delivery of strategic spares, critical consumables, mining equipment or processing plant, the company might have to suspend some of its operations and its results of operations and financial condition could be adversely impacted.
Diversity in interpretation and application of accounting literature in the mining industry may impact reported financial results.
The mining industry has limited industry-specific accounting literature. As a result, there is diverse interpretation and application of accounting literature on mining specific issues. AngloGold Ashanti, for example, capitalizes drilling and costs related to defining and delineating a residual mineral deposit that has not been classified as a Proven‘Proven and Probable ReserveReserve’ at a development project or production stage mine. Some companies, however, expense such costs.
As and when this diverse interpretation and application is addressed, the company’s reported results could be adversely impacted should the adopted interpretation differ from the position it currently follows.
AFailure to comply with laws, regulations, standards, contractual obligations whether following a breach or breaches in governance processes or fraud, bribery and corruption may lead to regulatory penalties, loss of licenseslicences or permits, and loss of reputation.
Since AngloGold Ashanti operates globally in multiple jurisdictions and with numerous and complex frameworks, its governance and compliance processes may not prevent potential breaches of law, accounting principles or other governance practices.
AngloGold Ashanti’s Code of Business Principles and Ethics, among other policies, standards and guidance, and training thereon may not prevent instances of fraudulent behavior and dishonesty,unethical or unlawful behaviour, including bribery or corruption, nor guarantee compliance with legal and regulatory requirements. Such a breach orrequirements, and breaches may leadnot be detected by management.
Sanctions for failure by the company or others acting on its behalf to regulatorycomply with these laws, regulations, standards and contractual obligations could include fines, penalties, imprisonment of officers, litigation, and loss of operating licenseslicences or permits, suspensions of operations, and may damage the company’s reputation. Such sanctions could have a material adverse impact on the company’s financial condition and results of operations.
Breaches in information technology security and governance process may adversely impact business activities.
AngloGold Ashanti maintains global information technology and communication networks and applications to support its business activities. Information technology security processes may not prevent future malicious actions, denial-of-service attacks, or fraud, resulting in corruption of operating systems, theft of commercially sensitive data, misappropriation of funds and business and operational disruption. Material system breaches and failures could result in significant interruptions that could in turn affect AngloGold Ashanti’s operating results and reputation.
Risks related to AngloGold Ashanti’s results of operations and its financial condition as a result of factors specific to the company and its operations
AngloGold Ashanti has removed the last of its gold hedging instruments and long-term sales contracts which exposesexposing the company to potential gains from subsequent commodity price increases but exposes it entirely to subsequent commodity price decreases.
AngloGold Ashanti removed the last of its gold hedging instruments in October 2010 to provide greater participation in a rising gold price environment. As a result, AngloGold Ashanti no longer has any protection against declines in the market price of gold compared with previous years.gold.
A sustained decline in the price of gold could adversely impact the company’s operating results and its financial condition.
Any downgrade of credit ratings assigned to AngloGold Ashanti’s debt securities could increase future interest costs and adversely affect the availability of new financing.
An actual or expected negative development of AngloGold Ashanti’s results of operations or cash flows, country risk, financial metrics, or an increase in net debt position could result in the deterioration of the company’s credit ratings. AngloGold Ashanti’s ratings are influenced by the location of its domicile and its operations. Following the downgrade of South Africa’s sovereign debt rating as a result of strikes, social tension and policy uncertainty in South Africa, AngloGold Ashanti was placed on “credit watch negative” by Standard & Poor’s on October 17, 2012. On December 10, 2012, Standard & Poor’s affirmed the investment grade rating of the company’s publicly traded debt, but warned that it could lower the rating in the future.
Any such downgrade by ratings agencies could increase the cost of capital, reduce the investor base and negatively and materially affect AngloGold Ashanti’s business, results of operations and financial condition.
Labor disruptions could have a material adverse effect on AngloGold Ashanti’s results of operations and financial condition.
AngloGold Ashanti employees in South Africa, Ghana, Guinea and Argentina, are highly unionized. Trade unions, therefore, have a significant impact on the company’s labor relations, as well as on social and political reforms, most notably in South Africa. There is a risk that strikes or other types of conflict with unions or employees may occur at any of the company’s operations, particularly where the labor force is unionized or there is inter-union rivalry. Labor disruptions may be used to advocate labor, political or social goals in the future. For example, labor disruptions may occur in sympathy with strikes or labor unrest in other sectors of the economy and for political goals. Labor unrest in South Africa can also be fuelled by migrant labor conditions and mine worker debt levels. Furthermore, such labor disruptions may themselves affect or be perceived to affect local political and social stability. Acts or vandalism affecting mines and mine equipment are possible during periods of labor unrest.
For example, following a wave of labor unrest and unprotected strike action that took place throughout the South African mining, transport and agricultural sectors since early August 2012, workers from AngloGold Ashanti’s Kopanang mine, three West Wits mines and the Vaal River region’s other operations engaged in unprotected strikes in September 2012. More than 100,000 miners were involved in the strikes across the mining sector during the last four months of 2012. Workers at AngloGold Ashanti mines in South Africa have also staged sit-ins which prompted the company to suspend operations at some of its mines. These work stoppages pose significant safety risks and operating challenges. The protracted period of inactivity caused by the strike, coupled by the depth of the affected mines, has complicated the consequent ramping up of production following the termination of the strikes and has resulted in a lengthened ramp-up period to ensure employee safety. The unprotected strike action at the South African operations had an adverse impact
on the company’s third quarter results and significantly adversely impacted its fourth quarter results. The company estimates that the unprotected strike action cost approximately 235,000 ounces in lost production due to the work stoppages and the slow ramp-up to full production.
Lower production and payroll increases resulting from the labor disruptions have adversely impacted the financial performance of all South African operations, threatening viability in some cases and similar disruptions in the future may have a material adverse effect on the company’s results of operations and financial condition. For example, subsequent to the 2012 strikes, AngloGold Ashanti, along with its major gold-producing peers in South Africa, increased the entry-level pay of employees; established a new pay category for equipment operators; provided an allowance for rock-drill operators; and increased pay by 2 percent for most categories of workers. The net impact of the settlement on the payroll cost for AngloGold Ashanti is $16 million per annum.
Increased labor costs could have a material adverse effect on AngloGold Ashanti’s results of operations and financial condition.
Labor costs represent a substantial proportion of the company’s total operating costs and at many operations, including its South African, Ghanaian and Tanzanian operations, constitute the company’s single largest component of operating costs. Failing to obtain any simultaneous increase in productivity, any change to the company’s wage agreements or other factors that could increase labor costs may have a material adverse effect on AngloGold Ashanti’s results of operations and financial condition. In 2012, the cost of salaries and wages increased by 7 percent over 2011 levels.
In South Africa, the established practice is to negotiate wages and conditions of employment with the unions every two years through the Chamber of Mines of South Africa. South African employment law sets out minimum terms and conditions of employment for employees, which form the benchmark for all employment contracts. As at December 31, 2012, approximately 62 percent of the company’s workforce, excluding contractors, or approximately 52 percent of its total workforce was located in South Africa. At present, the mining unions and gold mining companies are in the second year of this two-year wage agreement, with the latest increases (ranging from 8 percent to 10 percent) awarded to the workforce in July 2012 and additional improvements to the current pay structure offered to workers on October 18, 2012. Further negotiations on this agreement are expected in 2013, which may result in an increase in labor actions. In addition, any new agreement could result in increased labor costs for the company.
AngloGold Ashanti’s results may be further impaired if it incurs penalties for failing to meet standards set by labor laws regarding workers’ rights or incurs costs complying with new labor laws, rules and regulations. For example, employment law in South Africa imposes monetary penalties for neglecting to report to government authorities on progress made towards achieving employment equity in the workplace. Ghanaian law also contains broad provisions requiring mining companies to recruit and train Ghanaian personnel and to use the services of Ghanaian companies. In Australia, the federal government has recently introduced a new industrial relations system that includes ‘good faith bargaining’ obligations for employers, fewer restrictions on the content of collective agreements and an enhanced role for union officials as bargaining representatives, parties to agreements and participants in dispute resolution. Penalties and compliance costs, as well as increased costs due to laws and regulations less favourable to employers, could have a material adverse effect on the company’s results of operations and financial condition.
AngloGold Ashanti’s mining rights in the countries in which it operates could be altered, suspended or cancelled for a variety of reasons, including breaches in its obligations in respect of its mining rights.
AngloGold Ashanti’s right to own and exploit Mineral Reserves and deposits is governed by the laws and regulations of the jurisdictions in which the mineral properties are located. Currently, a significant portion of the company’s Mineral Reserves and deposits are located in countries where mining rights could be suspended or cancelled should it breach its obligations in respect of the acquisition and exploitation of these rights.
In alleach of the countries in which AngloGold Ashanti operates, the formulation or implementation of government policies on certain issues may be unpredictable. This may include changes in laws relating to mineral rights and ownership of mining assets and the right to prospect and mine, and in extreme cases, nationalization, expropriation or nullification of existing concessions, licenses, permits, agreements and contracts.
For In May 2012, for example, the GuineanArgentine government has announced in media reports that it will seek to increase its equity interest in mines and there is a call for debate on nationalization and increased state ownership in South Africa. nationalized the oil company Yacimientos Petrolíferos Fiscales (YPF) by expropriating 51 percent of the shares from the majority Spanish shareholder.
Any existing and new mining and exploration operations and projects are subject to various national and local laws, policies and regulations governing the ownership and the right to prospect or mine or develop proposed projects. For more details on the risks surrounding ownership of mining assets, see the section entitled “Title“– Title to AngloGold Ashanti’s properties may be uncertain and subject to challenge” and “– AngloGold Ashanti’s Mineral Reserve, deposits and mining operations are located in countries that face political, economic and security risks that may affect both the terms of its mining concessions, as well as its ability to conduct operations in certain countries”.
Project implementation delays could result in licences not being renewed and the loss of mining rights. Some of AngloGold Ashanti’s mining concessions, authorizations, licences and permits are subject to expiry, limitations on renewal and to various other risks and uncertainties. For example, the company’s license to mine at the Mongbwalu concession in the DRC is up for renewal in 2014, but the company must seek renewal a year in advance of the license’s expiration. The company may not be successful in the renewal process or in retaining the license on the same terms. If the company is unsuccessful in the renewal process, it will need to record an impairment. In October 2012, the DRC announced a proposed overhaul of the DRC’s mining code, which could affect the company’s ability to renew the license or its terms. This overhaul is still in progress.
If AngloGold Ashanti is not able to obtain or maintain necessary permits, authorizations or agreements to prospect or mine or to implement planned projects, or continue its operations, under conditions, or comply with all laws, regulations or requirements, or do so within time-frames that make such plans and operations economically viable, or if the laws impacting the company’s ownership of its mineral rights, or the right to prospect or mine change materially, or should governments increase their ownership in the mines or nationalize them, AngloGold Ashanti’s results of operations and its financial condition could be adversely affected.
In South Africa, mining rights are linked to meeting various obligations that include the Broad-Based Socio-Economic Empowerment Charter for the South African Mining Industry, referred to as the Mining Charter. The Mining Charter was amended in 2010 (the Revised Charter). Compliance with the Revised Charter, measured using a designated scorecard, requires that every mining company achieve 26 percent ownership by historically disadvantaged South Africans (HDSAs) of its South African mining assets by May 2014, and achieve targeted levels of participation by HDSAs in various other aspects of management. The company will incur expenses in giving further effect to the Revised Charter and the scorecard.
The outcome of the review of the Mining Charter five years after promulgation was made public in September 2010. While compliant with ownership targets to be achieved by May 2014, AngloGold Ashanti must make further progress to achieve future targets, including further participation by HDSAs in various aspects of management, the upgrade of housing and accommodation at the company’s mines, further human resource development, mine community development, sustainable development and growth as well as procurement and enterprise development, certain of which are also included under the Code of Good Practice for the Minerals Industry and Housing and Living Conditions Standard, as defined and discussed below and which targets must also be achieved by May 2014.
As required by the South African Mineral and Petroleum Resources Development Act (MPRDA), the Minister of Mineral Resources published a Code of Good Practice for the Minerals Industry (Code) and the Housing and Living Conditions Standard (Standard) in April 2009. The Code was developed to create principles to facilitate effective implementation of minerals and mining legislation and enhance implementation of the Mining Charter applicable to the mining industry. The Standard aims to include the provision of housing as an integral part of infrastructure during the development of a mine. Both the Code and the Standard provide that non-compliance equates to non-compliance with the MPRDA. It is unclear whether non-compliance with the Code or the Standard would lead to the cancellation or suspension of a mining right. Subsequent to the publication of the Code and the Standard, representatives of the Department of Mineral Resources, organized labor and the South African mining industry have engaged in discussions in an effort to address the concerns of the mining industry and to possibly amend the Code and the Standard. Furthermore, discussions related to the Code and Standard have become related to the review of the Mining Charter. It is anticipated that the contents of the Code and Standard will ultimately be amended to bring them in line with the Revised Charter. Details of the final Code and Standard are currently uncertain.
AngloGold Ashanti’s mining rights in South Africa can be suspended or cancelled by the Minister of Mineral Resources and AngloGold Ashanti may be unable to obtain any new mining rights if the company breaches its obligations in complying with the MPRDA or the Revised Charter.
Title to AngloGold Ashanti’s properties may be uncertain and subject to challenge.
AngloGold Ashanti has operations in several countries where ownership of land is uncertain and where disputes may arise in relation to ownership. Certain of the company’s properties may be subject to the rights or the asserted rights of various community stakeholders, including indigenous people. The presence of those stakeholders may have an impact on AngloGold Ashanti’s ability to develop or operate its mining interests. For example, in Australia, the Native Title Act (1993) provides for the establishment and recognition of native title under certain circumstances. In South Africa, the Extension of Security of Tenure Act (1997) and the Restitution of Land Rights Act (1994) provide for various landholding rights. Such legislation is complex, difficult to predict and outside of the company’s control, and could therefore negatively affect the business results of new or existing projects. Where consultation with stakeholders is statutorily or otherwise mandated, there can be no assurance that relations willmay not remain amicable and disputes may lead to reduced access to properties or delays in operations.
Title to the company’s properties, particularly undeveloped ones, may also be defective or subject to challenge. Title insurance generally is not available, and title review does not necessarily preclude third parties from contesting ownership. Where surveys have not been conducted, the precise area and location of the company’s claims may be in doubt. Accordingly, AngloGold Ashanti’s mineral properties may be subject to prior unregistered liens, agreements, transfers or claims, including native land claims, and title may be affected by, among other things, undetected defects.
AngloGold Ashanti may experience unforeseen difficulties, delays or costs in successfully implementing its business strategy and projects, including any cost-cutting initiatives, and itsany such strategy or project may not result in the anticipated benefits.
The successful implementation of the company’s business strategy and projects depends upon many factors, including those outside its control. For example: the successful management of costs will depend on prevailing market prices for input costs; the ability to grow the business will depend on the successful implementation of the company’s existing and proposed project development initiatives and continued exploration success, as well as on the availability of attractive merger and acquisition opportunities, all of which are subject to the relevant mining and company specific risks as outlined in these risk factors.
AngloGold Ashanti is in the process of implementing initiatives relating to strategic alignment, portfolio review, restructuring and cost-cutting, including in connection with the consolidation of its business activities and assets. Any future contribution of these measures to profitability will be influenced by the actual savings achieved and by the company’s ability to sustain these ongoing efforts. Strategic alignment, restructuring and cost-cutting initiatives may involve various risks, including, for example, labor unrest and operating licence withdrawal. The risk is highest in South Africa, given recent calls for withdrawal of mining licences for ‘mothballed shafts’ and hostile reaction to proposed
mining industry retrenchments. In addition, these measures may not be implemented as planned; turn out to be less effective than anticipated; only become effective later than anticipated; or not be effective at all. Any of these outcomes, individually or in combination, may adversely impact the company’s business, results of operations and financial condition.
AngloGold Ashanti’s business strategy also includes divesting activities in some business areas and strengthening others, including through mergers and acquisitions. With respect to dispositions, AngloGold Ashanti may not be able to divest some of its activities as planned or to obtain all of the required approvals, and the divestitures that are carried out could have a negative impact on its business, results of operations, financial condition and reputation.
AngloGold Ashanti may also prove unable to deliver on production targets, including in potentially critical areas, such as the Obuasi turnaround plan in Ghana, as well as on the timely, cost-effective and successful execution of key capital project execution,projects, including at the Tropicana project in Australia, the Kibali project in the DRC, and with regard to the implementation of the company’s new Enterprise Resource Planning (ERP) system. For more details on the risks surrounding the ERP implementation, see the section entitled – “The implementation of an integrated Enterprise Resource Planning (ERP)ERP system could have an adverse effect on AngloGold Ashanti’s operational results of operations and its financial condition.”
AngloGold Ashanti cannot give assurance that unforeseenUnforeseen difficulties, delays or costs will notmay adversely affect the successful implementation of itsAngloGold Ashanti’s business strategy, or that the strategy and projects, willand such strategy and projects may not result in the anticipated benefits.
Any acquisition or acquisitions that AngloGold Ashanti may complete may expose the company to new geographic, political, legal, social, operating, financial and geological risks.
AngloGold Ashanti may pursue the acquisition of producing, development and advanced stage exploration properties and companies. Any such acquisition may change the scale of the company’s business and operations and may expose it to new geographic, geological, political, social, operating, financial, legal, regulatory and contractual risks. For example: there may be a significant change in commodity prices after the company has committed to complete the transaction and established the purchase price or share exchange ratio; a material orebodyore body may prove below expectations; AngloGold Ashanti may have difficulty integrating and assimilating the operations and personnel of any acquired companies, realizing anticipated synergies and maximizing the financial and strategic position of the combined enterprise, and maintaining uniform standards, policies and controls; the integration may disrupt the company’s on-goingongoing business and its relationships with employees, suppliers and contractors; and the acquisition may divert management’s attention from AngloGold Ashanti’s day-to-day business;business. Furthermore, the company operates and the acquired business may have undetected liabilities which may be significant. Furthermore, we operate and acquireacquires businesses in different countries, with different regulatory and operating cultures, which may exacerbate the risks described above. In addition, the acquired business may have undetected liabilities which may be significant.
In the event that the company chooses to raise debt capital to finance any such acquisition, the company’s leverage will be increased. Should the company choose to use equity as consideration for an acquisition, existing shareholders may suffer dilution. Alternatively, the company may choose to finance any acquisition with its existing resources, which could decrease its ability to fund future capital expenditures.
There can be no assurance that theThe company wouldmay not be successful in overcoming these risks or any other problems encountered in connection with acquisitions. Failure by AngloGold Ashanti to implement ourits acquisition strategy or to integrate acquired businesses successfully could have material adverse effects on the company’sits growth and business results.
Ageing infrastructure at some of AngloGold Ashanti’s operations could adversely impact its business.
Deep level gold mining shafts are usually designed with a lifespan of 25 to 30 years. Vertical shafts consist of large quantities of infrastructure steelwork for guiding conveyances and accommodating services such as high and low tension electric cables, air and water pipe columns. Rising temperatures in the deeper mining areas can also lead to increased cooling requirements in the form of upgraded and expanded ice plants. Maintaining this infrastructure requires skilled human resources, capital allocation, management and planned maintenance.
Once a shaft has reached the end of its intended lifespan, higher than normal maintenance and care is required. Incidents resulting in production delays, increased costs or industrial accidents may occur. Such incidents may have an adverse effect on the company’s results of operations and financial position.condition. Asset integrity issues relating to ageing infrastructure are of particular concern in South Africa and at the Obuasi mine in Ghana.
For example, cracks were discovered in the mill feed end in September 2008 and at the discharge end in February 2010 at the Geita gold mine. The Geita gold mine is one of the group’s principal assets and sources of cash flow. After initial repairs, the feed end was replaced during May and June 2011. A decision was subsequently taken to replace the entire mill as a result of shell distortion. After new mill manufacture delays, installation was completed during March 2013. Production throughput in 2011 was 1 million tonnes less than planned, as a result of mill downtime that included feed-end replacement; ore grade was however sufficient to achieve 494,000 ounces. The Geita gold mine produced approximately 531,000 ounces in 2012, with production throughput of some 100,000 tonnes short of budget.
Some of AngloGold Ashanti’s technologies are unproven and failure could adversely impact costs and production.
AngloGold Ashanti has teamed up with various specialists to engineer new solutions to environmental management, mine design, rock breaking and underground logistics, among others. The company has invested in new technologies, including phyto-technologies to reduce seepage and address soil and groundwaterground water contamination, and in mine support technologies to minimize the impact of seismic activity. The company is also attempting to develop technologies to access the deeper reaches of South African mines. One of the chief initiatives expected to be implemented in 2012 is a vertical transport optimization project to accelerate the delivery of consumables and other essential items to work crews, in order to increase production time at the face.
Some aspects of these technologies are unproven and their eventual operational outcome or viability cannot be assessed with certainty. The costs, productivity and other benefits from these initiatives, and the consequent effects on AngloGold Ashanti’s future earnings and financial condition, may vary from expectations. Failure of the company’s conditioncompany to realize the anticipated benefits could result in increased costs, an inability to realize production or growth plans, or could adversely affect its operational performance.
The level of AngloGold Ashanti’s indebtedness could adversely impact its business.
As at December 31, 2011,2012, AngloGold Ashanti had gross borrowings (excludingof approximately $3.0 billion, (2011: approximately $1.7 billion) excluding the mandatory convertible bonds amounting to $588 million (2011: $760 million) of approximately $1.7 billion..
AngloGold Ashanti’s indebtedness could have a material adverse effect on its flexibility to conduct business. For example, the company may be required to use a large portion of its cash flow to pay the principal and interest on its debt, which will reduce funds available to finance existing operations and the development of new organic growth opportunities and further acquisitions. In addition, under the terms of the company’s borrowing facilities from its banks, AngloGold Ashanti is obliged to meet certain financial and other covenants. The company’s ability to continue to meet these covenants and to service its debt will depend on its future financial performance which will be affected by its operating performance as well as by financial and other factors, certain of which are beyond the control of the company.
Should the cash flow from operations be insufficient, AngloGold Ashanti could breach its financial and other covenants. Covenant breaches, if interpreted as events of default under one or more debt agreements, could allow lenders to accelerate payment of thesuch debt. Any such acceleration could result in the acceleration of indebtedness under other financial instruments. As a result, the company may be required to refinance all or part of the existing debt, use existing cash balances, issue additional equity or sell assets. AngloGold Ashanti cannot be sure that it will be able to refinance its debt on commercially reasonable terms, if at all. The company’s ability to access the bank, public debt or equity capital markets on an efficient basis may be constrained by dislocation in the credit markets or capital and liquidity constraints in the banking, debt or equity markets at the time of issuance.
Certain factors may affect AngloGold Ashanti’s ability to support the carrying amount of its property, plant and equipment, acquired properties, investments and goodwill on the balance sheet. If the carrying amount of its assets is not recoverable, AngloGold Ashanti may be required to recognize an impairment charge, which could be significant.
AngloGold Ashanti reviews and tests the carrying amount of its assets when events or changes in circumstances suggest that the carrying amount may not be recoverable. The company values individual mining assets at the lowest level for which cash flows are identifiable and independent of cash flows of other mining assets and liabilities.
If there are indications that impairment may have occurred, AngloGold Ashanti prepares estimates of expected future cash flows for each group of assets. Expected future cash flows are inherently uncertain, and could materially change over time. They are significantly affected by reserve and production estimates, together with economic factors such as spot and forward gold prices, discount rates, currency exchange rates, estimates of costs to produce reserves and future capital expenditure. Estimated rehabilitation and closure costs could also materially affect the company’s financial performance and could result in the need to recognize an impairment charge.
If any of these uncertainties occur, either alone or in combination, management could be required to recognize an impairment, which could have a material adverse effect on the company’s financial condition and results of operations.operations and financial condition.
AngloGold Ashanti expects to have significant financing requirements.
AngloGold Ashanti’s existing board-approved development projects and exploration initiatives will require significant funding. These include: Tropicana in Australia; the Cerro Vanguardia heap leach project in Argentina; the Mponeng Ventersdorp Contact Reef, Mponeng CLR and Zaaiplaats projectsBelow 120 Project in South Africa; Córrego do Sítiothe Mongbwalu and LamegoKibali projects in Brazil;the DRC; and the mine life extension project (MLE1)(MLE2) at Cripple Creek & Victor in the US.United States.
Potential future development projects will also require significant funding, if and when approved by the AngloGold Ashanti board.board of directors. These include the: La Colosa and Gramalote projects in Colombia; Kibali and Mongbwalu projectsMoab Khotsong Zaaiplaats in the DRC; Cerro VanguardiaSouth Africa; Iduapriem expansion project in Ghana, Sadiola Deeps project in Mali; Geita underground mining project in Argentina;Tanzania; Nova Lima Sul project in Brazil; Sadiola Deeps project in Mali; Cripple Creek & Victora further mine life extension project (MLE2)(MLE3) at Cripple Creek & Victor in the US;United States; as well as various other exploration projects and feasibility studies.
AngloGold Ashanti estimates that over the next three years, growth initiatives will require project capital expenditure (excluding stay in business and ore reserve development capital expenditure) of approximately $3.4$4.0 billion (subject to escalation)escalation and based on certain assumptions, including exchange rates). The company’s capital expenditure plans and requirements are subject to a number of risks, contingencies and other factors, some of which are beyond its control, and therefore the actual future capital expenditure and investments may differ significantly from the current planned amounts.
AngloGold Ashanti’s operating cash flow and credit facilities may be insufficient to meet all of these expenditures, depending on the timing and cost of development of these and other projects as well as operating performance and available headroom under its credit facilities. As a result, new sources of capital may be needed to meet the funding requirements of these developments, to fund ongoing business activities and to pay dividends. AngloGold Ashanti’s ability to raise and service significant new sources of capital will be a function of macroeconomic conditions, the condition of the financial markets, future gold prices, the company’s operational performance and operating cash flow and debt position, among other factors. The company’s ability to raise further debt financing in the future and the cost of such financing will depend on, among other factors, its prevailing credit rating, which may be affected by the company’s ability to maintain its outstanding debt and financial ratios at levels acceptable to the credit ratings agencies, its business prospects risks relating to the countries in which it operates or other factors. As a result, in the event of lower gold prices, unanticipated operating or financial challenges, any dislocation in financial markets or new funding limitations, AngloGold Ashanti’s ability to pursue new business opportunities, invest in existing and new projects, fund its ongoing business activities and retire or service outstanding debt and pay dividends, could be significantly constrained, all of which could adversely impact the company’s results of operations and its financial condition.
AngloGold Ashanti does not operatehave full management control over some of its significant joint venture projects and other interests. If the operators of these projects do not performmanage these effectively and efficiently, the company’s investment in these projects could be adversely affected and its reputation could be harmed.
AngloGold Ashanti’s joint ventures at Morila in Mali and at Kibali in the DRC are operatedmanaged by the company’s joint venture partner Randgold Resources Limited (“Randgold”)(Randgold). In addition, certain of AngloGold Ashanti’s exploration ventures are operatedmanaged by the relevant joint venture partner. AngloGold Ashanti’s marine gold joint venture with De Beers is operatedmanaged by an independent company jointly owned by AngloGold Ashanti and De Beers, with a significant part of the technical input subcontracted to De Beers or other marine service providers.
In South Africa, AngloGold Ashanti’s Ergo operations are currently operated by Ergo Mining, a subsidiary of DRDGOLD Limited (DRDGOLD). The Ergo operations were sold in 2007 to DRDGOLD and DRDGOLD has been managing and operating the assets pending the transfer of the mining rights from AngloGold Ashanti to DRDGOLD.
While AngloGold Ashanti provides strategic management and operational advice to its joint venture partners in respect of these projects, the company cannot ensure that these projects are operated in compliance with the standards that AngloGold Ashanti applies in its other operations. If these joint ventures are not operated effectively or efficiently, including as a result of weaknesses in the policies, procedures and controls implemented by the joint venture partners, the company’s investment in the relevant project could be adversely affected. In addition, negative publicity associated with operations that are ineffective and inefficient operatorship,or inefficiently operated, particularly relating to any resulting accidents or environmental incidents, could harm the company’s reputation and therefore its prospects and potentially its financial condition. Further, any failure of joint venture partners to meet their obligations to AngloGold Ashanti or to third parties, or any disputes with respect to the parties’ respective rights and obligations, could have a material adverse impact on AngloGold Ashanti’s results of operations and its financial condition. In particular, the company and Randgold retain equal representation, with neither party holding a deciding vote on the board of the two companies that have overall management control of
the Morila project in Mali and the Kibali project in the DRC, respectively, and all major
management decisions for each of these two projects, including approval of the budget, require board approval. If a dispute arises between the company and Randgold with respect to the Kibali or Morila project and the parties are unable to amicably resolve such dispute, it may be difficult for the parties to make strategic decisions relating to the project affected by such dispute, the day-to-day operations and the development of such project may be adversely affected and the company may have to participate in arbitration or other proceedings to resolve the dispute, which could adversely affect the company’s results of operations and financial condition.
AngloGold Ashanti’s joint ventures and other strategic alliances may not be successful.
AngloGold Ashanti’s joint venture partners may have economic or business interests or goals that are not consistent with the company’s or may, as a result of financial or other difficulties, be unable or unwilling to fulfill their obligations under the joint venture or other agreements. Disputes between AngloGold Ashanti and its joint venture partners may lead to legal action, including litigation between AngloGold Ashanti and joint venture partners. Such disputes could adversely affect the operation of the joint venture and may prevent the realization of the joint ventures goals. There is no assurance that the company’s joint venture partners will continue their relationship with the company in the future or that the company will be able to achieve its financial or strategic objectives relating to the joint ventures.
For example, AngloGold Ashanti has a 50:50 strategic alliance with Thani Investments LLC (TI), a company based in Dubai. During 2011, AngloGold Ashanti advanced a loan of $35 million to Thani Ashanti Alliance Limited, the joint entity it owns together with TI. This loan was impaired during 2012. TI guaranteed the loan. AngloGold Ashanti has brought legal action against TI over non-payment of the loan. The resolution to this dispute may affect the overall relationship between TI and the company. The failure of the company’s joint venture partners to fulfil their obligations or their unwillingness to continue these relationships may have an adverse effect on the company’s results of operations and financial condition.
AngloGold Ashanti’s Mineral Reserve, deposits and mining operations are located in countries that facewhere political, economic and security risks.
Some of AngloGold Ashanti’s mineral deposits and mining and exploration operations are located in countries that have experienced political instabilitytax and economic uncertainty. In alllaws and policies may change rapidly and unpredictably and such changes and policies may adversely affect both the terms of the countries where the company operates, there is a focus on resource nationalism with governments seeking to get more economic benefits from the high commodity prices. This entails review ofits mining codes and stability agreements, which were designed under different economic environments. The formulation or implementation of government policies include regulations which impactconcessions, as well as its operations and changes in laws relating to issues such as mineral rights and asset ownership, royalties, taxation and taxation disputes, ‘windfall’ or ‘super’ taxation, and non-recovery of taxation refunds, import and export duties, currency transfers, restrictions on foreign currency holdings and repatriation of earnings. These regulations are continually changing and generally require progressively higher payments to governments, notably in the form of royalties and taxes.
For example, the Argentine government has introduced stricter exchange controls, which may limit the company’s ability to repatriate dividends from its Argentine subsidiaries. In addition, on March 15, 2012, the Mwanza office of the Tanzania Revenue Authority notified Geita Gold Mine Limited (Geita Gold Mine) that it intends to issue additional tax assessments against Geita Gold Mine andconduct operations in connection with such assessments it also challenged the validity of the existing mining development agreement (MDA) relating to the Geita gold mine, which was entered into with the Tanzanian government in June 1999. In the event that the MDA is held to be invalid, the tax burden on the company’s Tanzanian operations would increase and the company would have to pay additional taxes for prior periods.certain countries.
Any existing and new mining, exploration operations and projects that the company carries out will continue to beare subject to various national and local laws, policies and regulations governing the ownership, prospecting, development and mining of mineral reserves, taxation and royalties, exchange controls, import and export duties and restrictions, investment approvals, employee and social community relations and other matters.
In most of the countries in which AngloGold Ashanti operates, there is a focus on resource nationalism with governments seeking to reap greater economic benefit from high commodity prices. This entails the review of mining codes and stability agreements, which were designed under different economic environments, and the formulation or amendment of laws, policies and regulations relating to issues such as mineral rights and asset ownership, royalties, taxation and taxation disputes, ‘windfall’ or ‘super’ taxation, non-recovery of taxation refunds, import and export duties, currency transfers, restrictions on foreign currency holdings and repatriation of earnings. Laws, policies and regulations in such countries are uncertain, changing and generally require progressively higher payments to governments, notably in the form of increased royalties and taxes, mandated beneficiation, export levies and increasing or retaining state or national ownership of resources. Changes in particular to the fiscal terms governing AngloGold Ashanti’s operations may have a material adverse impact on the company’s results of operations or financial condition, as well as discourage future investments in certain jurisdictions, which may have an adverse impact on the company’s ability to access new assets and could potentially reduce future growth opportunities.
For example on September 9, 2011, a new mining code for Guinea was enacted. The new mining code significantly increases the share of state ownership in the mining industry, extending a 15 percent share of future mining projects to the government, without financial compensation. The government also has the option to purchase up to an additional 20 percent of each project. However, the new mining code was withdrawn in October 2012 due to unfavorable reception and is yet to be re-issued. The Guinean government also announced its intention to carry out a review of the mining conventions currently in force in Guinea. This mining convention review is currently in progress. The outcome of this review may have a material adverse effect on the company’s results of operations or financial condition.
In late 2011 and early 2012, the government of Ghana amended its fiscal mining regime, increased its corporate taxation and royalty rates and may impose a windfall profit tax. Furthermore, the government of Ghana has constituted a review committee to review and re-negotiate stability agreements with mining companies. AngloGold Ashanti is currently participating in negotiations with the Ghanaian review committee. The outcome of these negotiations may have a material adverse effect on the company’s results of operations or financial condition.
AngloGold Ashanti Limited and other major mining companies are in talks with the Tanzanian government regarding new mining legislation and its impact on existing mining agreements; such talks follow an earlier declaration in July 2012 by the Tanzanian Minister of Energy and Minerals that the mining contracts were under review. The new mining legislation and the outcome of the review of the mining contracts may have a material adverse impact on the company’s results of operations and financial condition. Recently, the Tanzanian Minister of Energy and Minerals unexpectedly increased the royalty rate levied on gold extracted in Tanzania by AngloGold Ashanti’s operations by 1 percent. Further unanticipated increases in royalty rates in Tanzania or other countries could have a material adverse impact on the company’s results of operations and financial condition.
In the DRC, in October 2012 the Mines Minister announced a proposed overhaul of the DRC’s mining code. The proposed laws seek to, among other things, increase the government stake in mining operations to 35 percent from the existing 5 percent, double royalties on some minerals, and introduce a 50 percent levy on certain profits. Should such laws be enacted in the future, these may have a material adverse impact on the company’s results of operations in the DRC.
On July 1, 2012, Australia’s Minerals Resource Rent Tax (MRRT) came into effect after the legislation was passed in March 2012. The MRRT applies only to the bulk commodities of coal and iron ore, and replaced the previously proposed Resource Super Profit Tax (RSPT), which covered all minerals. The Australian federal government did not include gold and uranium in the final MRRT. However, should Australia consider reintroducing the RSPT, or if similar ‘super profit’ taxes were to be introduced and implemented in any other country in which AngloGold Ashanti operates, the company’s results of operations and financial condition could be materially adversely affected.
In addition, some of AngloGold Ashanti’s mineral deposits and mining and exploration operations are located in countries that are experiencing political instability and economic uncertainty. For example, in South Africa, country risk has increased recently in light of the violent strike action, social unrest, high levels of unemployment, poverty and concern that the government may take measures unfavorable to business.
In December 2012, while the ruling African National Congress rejected the concept of wholesale nationalization, it nevertheless favoured a ‘resource rent’ tax on windfall profits. Political instability and the resulting unstable business environment in which companies operate may discourage future investments in certain jurisdictions, which may have an adverse impact on the company’s ability to access new assets and could potentially reduce future growth opportunities.
AngloGold Ashanti is subject to an uncertain tax environment. Increased taxes are expected in most countries of operation. Changes in tax laws could result in higher tax expense and payments. Furthermore, legislation changes could materially impact AngloGold Ashanti’s tax receivables and liabilities as well as deferred tax assets and deferred tax liabilities. In addition, the uncertain tax environment in some regions could limit AngloGold Ashanti’s ability to enforce its rights. As a global company, AngloGold Ashanti conducts its business in countries subject to complex tax rules, which may be interpreted in different ways. Further interpretations or developments of tax regimes may affect the company’s tax liability, return on investments and business operations. AngloGold Ashanti is regularly examined by tax authorities in the various jurisdictions of operation.
For example, on March 15, 2012, the Mwanza office of the Tanzania Revenue Authority notified Geita Gold Mine Limited (Geita Gold Mine) that it intended to issue additional tax assessments against Geita Gold Mine. In connection with such assessments, the Tanzania Revenue Authority also challenged the validity of the existing mining development agreement (MDA) relating to the Geita Gold Mine, which was entered into with the Tanzanian government in June 1999. AngloGold Ashanti was served with a demand to pay the increased assessments, which it is currently paying under protest while awaiting a discussion with the government. In the event that the MDA is held to be invalid, the tax burden on the company’s Tanzanian operations would increase and the company would have to pay additional taxes for prior periods.
Furthermore, in Guinea, Mali and Tanzania, AngloGold Ashanti is due refunds of input tax and fuel duties which remain outstanding for periods longer than those provided for in the respective statutes.
The countries in which the company operates may also introduce strict exchange controls, impose restrictions to source materials and services locally, or impose other similar restrictions that hinder foreign companies’ operations within such countries. For example, the Argentine government introduced stricter exchange controls and related protracted approval processes, which may limit the company’s ability to repatriate dividends from its Argentine subsidiaries. In October 2011, the Argentina government has decreed that mining, oil and energy companies must repatriate export earnings. Additionally, the purchase of US dollars requires authorization from the Argentine tax agency and the purpose for which the currency will be used must be stated. In May 2012, the Argentine Mining Secretariat issued new regulations requiring mining companies in Argentina to boost their domestic purchases of equipment and services. Mining companies are now required to resort exclusively to locally established suppliers for their export-related shipping and logistics operations. A separate norm requires companies to open an import substitution division which will be in charge of submitting procurement plans to the Mining Secretariat on a quarterly basis. Such requirements are hindering the company’s operations within Argentina and these or similar requirements may continue to do so in the future and may have a material adverse effect on AngloGold Ashanti’s results of operations and financial condition.
If, in one or more of thesethe countries in which it operates, AngloGold Ashanti were not able to obtain or maintain necessary permits, authorizations or agreements to implement planned projects or continue its operations under conditions or within time framestimeframes that make such plans and operations economic,economically viable, or if the applicable legal, ownership, fiscal (including all royalties and duties), exchange control, employment, environmental and social laws andor regimes change materially, or if the governing political authorities change materially, resulting in changesamendments to such laws and regimes, this could have a material adverse effect on AngloGold Ashanti’s operating results, financial condition, and, in extreme cases,situations, on the viability of an operation.
For example, in South Africa mining rights are linked to meeting various obligations that include the broad-based socio-economic empowerment charter for the mining industry (the Revised Charter). Compliance with the Revised Charter is measured using a designated scorecard relating to equity ownership and management control of mining companies by historically disadvantaged South Africans (HDSAs) by no later than May 2014 and that HDSAs must constitute 40 percent of all levels of management by 2014. While AngloGold Ashanti believes that it is compliant with ownership targets to be achieved by May 2014, it must make further progress to achieve future targets, including further participation by HDSAs in senior and top management levels, the upgrade of housing and accommodation at the company’s mines, further human resource development, mine community development, sustainable development and growth as well as procurement and enterprise development, certain of which are also included under the Revised Charter’s targets that must also be achieved by May 2014.
The company will incur expenses in giving further effect to the Revised Charter and the scorecard. AngloGold Ashanti may not meet all of the various requirements by the required dates. Additionally, the South African government may decide that the Mining Charter has not gone far enough to achieve its underlying goals and therefore decide to expand the obligations of mining companies thereunder. Should AngloGold Ashanti breach its obligations in complying with the Mineral and Petroleum Resources Development Act, Revised Charter or any future amendments to the Mining Charter, its mining rights in South Africa could be suspended or cancelled by the Minister of Mineral Resources and it may be unable to obtain any new mining rights. Any such suspension or cancellation could have a material adverse effect on Anglo Ashanti’s results of operations and financial condition.
AngloGold Ashanti’s Mineral Reserve, deposits and mining operations are located in countries that face instability and security risks that may adversely affect both the terms of its mining concessions, as well as its ability to conduct operations in certain countries.
Some of AngloGold Ashanti’s mineral deposits and mining and exploration operations are located in countries that are experiencing political instability and economic uncertainty.
Certain of the countries in which AngloGold Ashanti has mineral deposits or mining or exploration operations, including the DRC, Mali, Guinea and Colombia, have in the past experienced, and in certain cases continue to experience, a difficult security environment as well as political instability.environment. In particular, various illegal groups active in regions in which the company is present may pose a credible threat of military repression, terrorism, civil unrest, extortion and kidnapping, which could have an adverse effect on its operations in these and other regions forregions.
For example, Mali continues to experience a difficult security environment since the military coup in March 20122012. The situation in Mali oneremains of heightened concern as a result of the countriesinstability in which the company operates, experienced a military coup. Although on April 6, 2012, the opposing factions reached a settlement, agreed to reinstate the Malian constitution and implemented certain transitional political arrangements, the countrynorthern Mali.
Eastern DRC also continues to be exposed to significant politicalexperience tension consistent with the cycles of unrest experienced since the late 2000s. Fighting has caused instability in the area and security threats. could expand or intensify.
In some instances, risk assessments categorize threats as serious enough to require resort to public security forces,2012, and for the first time in approximately seven years, Anglo Gold Ashanti Colombia’s (AGAC) assets and employees were the targets of direct attacks by hostile actors around the La Colosa project’s area of influence. These and other such as national police or military units on a near-permanent basis. In the event that continued operation in these countries compromiseattacks could adversely affect the company’s security or business principles, AngloGold Ashanti may withdraw from these countries on a temporary or permanent basis. This could have a material adverse impact on AngloGold Ashanti’s results of operations.operations in Colombia.
Since 2009, the company has recorded an almost five-fold increase in the instances of injury to security personnel, including members of AngloGold Ashanti’s internal security, private security companies and public security forces in certain jurisdictions. The rise in the number and severity of security incidents has come as a result of both increased illegal and artisanal mining due to a steady migration of people into the areas and an increase in the level of organization and funding of criminal activity around some of the company’s Continental African operations, spurred on by an escalating gold price. The most significant security challenges occurhave occurred in Tanzania and Ghana in areas where there is endemic poverty and high levels of unemployment. If the security environment surrounding the company’s operations that are most exposed to these challenges does not improve or further
deteriorates, employee, third-party and community member injuries and fatalities could also increase. Any such increase could disrupt the company’s operations in certain mines and adversely affect its reputation, and results of operation.operations and financial condition.
In some instances, risk assessments categorize threats as serious enough to require resort to public security forces, such as national police or military units on a near-permanent basis. In the event that continued operations in any of the company’s countries of operations compromise the company’s security or business principles, AngloGold Ashanti may withdraw from any such countries on a temporary or permanent basis. This could have a material adverse impact on AngloGold Ashanti’s results of operations and financial condition.
Furthermore, the company has at times experienced strained relationships with somecertain of the communities in which it operates.its host communities. AngloGold Ashanti operates in several regions where poverty, unemployment and the lack of access to alternative livelihoods mean that the creation and distribution of economic benefit from mining operations is a significant area of focus for community and government. Conflict with communities has led to community protests and business interruptions, particularly at the Siguiri mine in Guinea whereduring 2010 and 2011. In 2012, there were five recorded community members protested in four separate incidents in 2010 over issues relating to electricity supply, land compensationprotests at Cerro Vanguardia, Obuasi and employment, and a violent community protest interrupted operations for three days in 2011.Geita.
AngloGold Ashanti may be impacted by the outcome of elections in jurisdictions in which it has operations and ancillary political processes leading up to elections. Presidential elections are planned in the United States, Mali, Ghana, and Guinea during 2012.
Political instability and uncertainty or government changes to the fiscal terms governing AngloGold Ashanti’s operations may discourage future investments in certain jurisdictions, which may have an adverse impact on the company’s ability to access new assets and could potentially reduce future growth opportunities.
Early in 2011 the Guinean government confirmed its intention to review all mining contracts under the auspices of international law, indicating that Guinea would seek to own a stake of at least a third of all mining projects located in Guinea. Currently the Government of Guinea holds a stake of 15 percent in the Siguiri Gold Mine. The review process has not yet commenced and AngloGold Ashanti is currently unable to predict the timing and outcome of such review. On April 26, 2011, it was announced by Reuters that a copy of the new draft mining code includes a compulsory 15 percent stake for the government in operations, with an option to acquire an additional 20 percent. Also according to Reuters, included in the draft mining code are provisions for a new “Local Empowerment Fund”, which will be funded from tax levies, and changes to the price reference point used for tax purposes from free-on-board to a rolling three-month average from the London Metals Exchange.
In Guinea, Mali and Tanzania, AngloGold Ashanti is due refunds of input tax and fuel duties which remain outstanding for periods longer than those provided for in the respective statutes. In addition, the company has other outstanding assessments and unresolved tax disputes in a number of countries, including Brazil, Argentina and Ghana. If the outstanding value-added tax on inputs is not received, the disputes are not resolved and assessments favorable to AngloGold Ashanti are not made, there could be an adverse effect upon the company’s results of operations and its financial condition.
The Government of Ghana recently amended its fiscal mining regime, increased its corporate taxation rates and imposed a windfall profit tax. AngloGold Ashanti may challenge some of these in light of the stability agreement entered into by the company with the government of Ghana in December 2003 and ratified by the Ghanaian Parliament in 2004. However, the Government of Ghana has recently announced that it has constituted a team to re-negotiate stability agreements with mining companies and AngloGold Ashanti expects to participate in these negotiations. No assurance can be given that the outcome of the company’s negotiations with the Government of Ghana will not have a material adverse impact on the company’s financial condition or operational results.
In November 2011, the lower house of the Australian Parliament passed the Mineral Resource Rent Tax (MRRT), which replaced the previously proposed Resource Super Profit Tax (RSPT) and would require a tax of 30 percent on profits above certain levels from coal and iron ore mining starting July 1, 2012. The Senate is due to debate the bill in 2012. Should the government of Australia reintroduce the RSPT or extend the MRRT to the gold mining industry, or if similar “super profit” taxes were introduced in Australia or any other country in which the company operates, this could have a material adverse effect on AngloGold Ashanti’s results of operations and its financial condition.
Illegal and artisanal mining occurs on AngloGold Ashanti’s properties, which can disrupt the company’s business and expose the company to liability.
Illegal and artisanal miners are active on, or adjacent to, some of AngloGold Ashanti’s Continental African and South American properties, which leads at times to interference with the company’s operations and results in conflict situations that present a security threat to property and human life. Artisanal mining is associated with a number of negative impacts, including environmental degradation, flouting of land rights, poor working practices, erosion of civil society, human rights abuse and funding of conflict. The environmental, social, safety and health impacts of artisanal mining are frequently attributed to formal mining activity, and it is often assumed that artisanally-mined gold is channeled through large-scale mining operators, even though artisanal and large-scale miners have distinct supply chains. These misconceptions impact negatively on the reputation of the industry.
The activities of the illegal miners, which include theft and shrinkage, could cause damage to AngloGold Ashanti’s properties, including pollution, underground fires, or personal injury or death, for which AngloGold Ashanti could potentially be held responsible. Illegal mining could result in the depletion of mineral deposits, potentially making the future mining of such deposits uneconomic. The presence of illegal miners could lead to project delays and disputes regarding the development or operation of commercial gold deposits. Illegal mining and theft including by AngloGold Ashanti employees or contractors, could also result in lost gold reserves, mine stoppages, and have a material adverse effect on AngloGold Ashanti’s financial condition or results of operations.operations or financial condition.
In 2011,2012, the company recorded an increase in the number and severity of security incidents, due in part to a greatersteady migration of people into the areas and an increase in the level of organization amongand funding of criminal elements and syndicates in AngloGold Ashanti’s areas of operation as well as an increase in artisanal, small-scale and illegal mining activity in general.
Labor disruptions and increased labor costs could have an adverse effect on AngloGold Ashanti’s results of operations and financial condition.
AngloGold Ashanti employees in South Africa, Ghana, Guinea andaround some South American countries, are highly unionized. Trade unions, therefore, have a significant impact on the company’s labor relations, as well as on social and political reforms, most notably in South Africa. There is a risk that strikes or other types of conflict with unions or employees may occur at any of the company’s Continental African operations, particularlyspurred on by an escalating gold price. The most significant security challenges have occurred in Tanzania and Ghana in areas where the labor forcethere is unionized. Labor disruptions may be used to advocate labor, political or social goals in the future. For example, labor disruptions may occur in sympathy with strikes or labor unrest in other sectorsendemic poverty and high levels of the economy. In late July 2011, AngloGold Ashanti miners joined others in the South African petroleum, coal and diamond industries in a wage-related strike. The action at AngloGold Ashanti’s operation lasted five days and the subsequent ramp-up of production was slower than expected. The resulting payroll increases have impacted the financial performance of all South African operations. Material labor disruptions could have an adverse effect on AngloGold Ashanti’s results of operations and financial condition.
In South Africa, it has become established practice to negotiate wages and conditions of employment with the unions every two years through the Chamber of Mines of South Africa. South African employment law sets out minimum terms and conditions of employment for employees, which form the benchmark for all employment contracts. As at December 31, 2011, approximately 61 percent of the company’s workforce, excluding contractors, or approximately 52 percent of its total workforce, was located in South Africa.
An agreement was signed with the unions in August 2011, following negotiations between the Chamber of Mines and the National Union of Mineworkers (NUM), the United Associations of South Africa, (UASA) (on behalf of some clerical and junior management staff) and Solidarity (on behalf of a small number of miners). The mining unions and gold mining companies signed a two-year agreement for an increase of between 8 percent and 10 percent, depending on the level of worker experience. AngloGold Ashanti cannot give assurance that it will be able to renegotiate this agreement on satisfactory terms when it next expires.
In Ghana, a three-year, wage agreement for the years 2009 to 2011, effective from January 1, 2009, was reached towards the end of 2009. The next round of negotiations is expected to take place in April 2012. As at December 31, 2011, approximately 11 percent of the company’s workforce, excluding contractors, or approximately 12 percent of the total workforce, was located in Ghana. AngloGold Ashanti cannot give assurance that it will be able to renegotiate this agreement on satisfactory terms following its expiry at the end of December 2011.
In Argentina, where the collective bargaining agreement that applies to the company’s employees at Cerro Vanguardia is due to expire in May 2012, the trade unions have requested significant salary increases. The company and the unions have entered into a transitional agreement that provides for an average salary increase across all wage categories of approximately 17 percent and expect to negotiate a final salary increase in connection with the new collectiveunemployment.
bargaining agreement. The company may not be able to renegotiate this agreement on satisfactory terms when it expires. In particular, the new agreement may result in significantly higher labor costs for the company’s Argentine operations. The unions may also resort to industrial action in connection with the renegotiation of the agreement.
Labor costs represent a substantial proportion of the company’s total operating costs and at many operations, including its South African, Ghanaian and Tanzanian operations, is the company’s single largest component of operating costs. Any increases in labor costs have to be offset by greater productivity efforts by all operations and employees, failing which such increase in labor costs could have a material adverse effect on AngloGold Ashanti’s results of operations and its financial condition.
Results may be further impaired if the company incurs penalties for failing to meet standards set by labor laws regarding worker rights. For example, employment law in South Africa imposes monetary penalties for neglecting to report to government authorities on progress made towards achieving employment equity in the workplace, and Ghanaian law contains broad provisions requiring mining companies to recruit and train Ghanaian personnel and to use the services of Ghanaian companies. In Australia, the federal government has recently introduced a new industrial relations system that includes “good faith bargaining” obligations for employers, fewer restrictions on the content of collective agreements and an enhanced role for union officials as bargaining representatives, parties to agreements and participants in dispute resolution.
The use of contractors at certain of the company’s operations may expose AngloGold Ashanti to delays or suspensions in mining activities and increases in mining costs.
AngloGold Ashanti uses contractors at certain of its operations to mine and deliver ore to processing plants as well as for other purposes. At mines employing mining contractors, contracting costs represent a significant proportion of the total operating costs of these operations and the company does not own all of the mining equipment. For example, increased contractor rates at the Sadiola mine in Mali contributed to a significant rise in total cash costs in the final quarter of 2011. Increased contractor costs at Sunrise Dam in Australia and Geita in Tanzania contributed to higher production costs in the first quarter of 2012.
AngloGold Ashanti’s operations could be disrupted, resulting in additional costs and liabilities, if the mining contractors at affected mines have financial difficulties or if a dispute arises in renegotiating a contract, or if there is a delay in replacing an existing contractor and its operating equipment to meet business needs at expected cost levels. Increases in contract mining rates, in the absence of associated productivity increases, will also have an adverse impact on the company’s results of operations and financial condition.
For example, on October 13, 2012, AngloGold Ashanti terminated the underground development contract with a third-party contractor at the Obuasi mine in Ghana. The costs of the termination amounted to $17 million.
In addition, AngloGold Ashanti’s reduced control over those aspects of operations which are the responsibility of contractors, contractortheir failure to comply with applicable legal, human rights and regulatory requirements, andor their inability to manage their workforce or provide high quality services or a high level of productivity could adversely affect AngloGold Ashanti’s reputation, results of operations and financial position,condition, and may result in the company incurring liability to third parties due to the actions of the contractor.contractors.
AngloGold Ashanti competes with mining and other companies for key human resources.resources and its inability to retain key personnel could have an adverse effect on its business.
AngloGold Ashanti competes on a global basis with mining and other companies, to attract and retain key human resources at all levels with the appropriate technical skills and operating and managerial experience necessary to operate and supervise its business. This is further exacerbated in the current environment of increased mining activity across the globe, combined with the global shortage of key mining skills, including geologists, mining engineers, metallurgists and skilled artisans.
The retention of staff is particularly challenging in South Africa, where, in addition to the impacts of global industry shortages of skilled labor, AngloGold Ashanti is required to achieve employment equity targets of participation by HDSAs in management and other positions. AngloGold Ashanti competes with all companies in South Africa to attract and retain a small but growing pool of HDSAs with the necessary skills and experience. AngloGold Ashanti has historically faced difficulty recruiting and retaining young graduates and qualified mid-level management in South Africa. Recruitment of skilled personnel has been challenging in Continental Africa due to university offerings that are often not well-suited to the specific needs of the mining industry, as well as other factors such as language barriers and low literacy skills.
The recruitment of skilled workers is becoming increasinglyalso highly competitive in ArgentinaSouth America as well, as more mining development occurs nationally and regionally. Also material is the scarcitya result of a shortage of skills in the resource sector of Western Australia dueand intense competition between mining companies.
The company may not be able to the mining boom currently underway in the region, particularly with regard to safety management. If safety systemsretain and training cannot be strengthened to ensure that operators achieve the required level of competence, the incidence of accidents may rise.
There can be no assurance that the company will attract and retainsufficient skilled and experienced employees.employees in all areas of the business. Should it fail to do so or lose any of its key personnel, business and growth prospects may be harmed and this could have an adverse impact on AngloGold Ashanti’s results of operations and financial condition.
AngloGold Ashanti’s inability to retain its senior management may have an adverse effect on its business.
The company’s success depends largely upon the continued service of its senior management, including its chief executive officer, chief financial officer and the executive officers at each of its business divisions and general managers at its mines. The loss of one or more members of senior management, such as the recently announced departure of AngloGold Ashanti Chief Executive Officer, Mark Cutifani, to take the same position at Anglo American PLC as of April 3, 2013, could lead to other members of the management team leaving, disrupt the company’s operations, and have a material adverse impact on the company’s business, results of operations and financial condition.
The prevalence of occupational health diseases and the potential costs and liabilities related thereto may have an adverse effect on the business and results of operations of AngloGold Ashanti.
The primary areas of focus in respect of occupational health of employees within the company’s operations are noise-induced hearing loss (NIHL) and occupational lung diseases (OLD), which include pulmonary diseases such as tuberculosis (TB) from various causes and silicosis in individuals exposed to silica dust. These require active dust management strategies in underground operations, particularly in South Africa where a significant number of silicosis cases by current and former employees alleging past exposures are still reported each year to the board for statutory compensation. AngloGold Ashanti provides occupational health services to its employees at its occupational health centers and clinics and continues to improve preventative occupational hygiene initiatives, such as implementing various dust control measures and supplying its employees with respiratory protection equipment. If the costs associated with providing such occupational health services, implementing such dust control measures or supplying such equipment increase significantly beyond anticipated or budgeted amounts, this could have an adverse effect on theAngloGold Ashanti’s results of operations of AngloGold Ashanti and its financial condition. Actual and alleged health and safety incidents or breaches of standards may also adversely impact the company’s reputation.
A claim filed by a former employee of AngloGold Ashanti’s predecessor, Vaal Reefs Mining and Exploration Company Limited, seeks approximately R2.6 million for damages resulting from silicosis allegedly contracted while working on a mine. In March 2011, the Constitutional Court rejected the lower court’s decision that the claim was precluded by statutory compensation and granted leave to the decedent’s executor to proceed with his case in the High Court and seek a claim for damages under common law against AngloGold Ashanti. This will comprise, among other elements, providing evidence that Mr. Mankayi contracted silicosis as a result of negligent conduct on the part of AngloGold Ashanti’s predecessor. AngloGold Ashanti will continue to defend this case on its merits.
As a result of the Constitutional Court decision permitting miners with OLD to sue their current or former employers for damages outside the statutory compensation scheme, AngloGold Ashanti could be subject to numerous similar claims, including a potential class action or similar group claim. AngloGold Ashanti is studying the details of the Constitutional Court judgment and will defend any subsequent claims, if and when filed, on their merits. In view of the limited information currently available, no reliable estimate can be made for this potential liability at this time. Shouldsubject to class action litigation with respect to alleged occupational lung diseases (see “– AngloGold Ashanti be unsuccessful in defending actions by any other individuals or groups that lodge similar claims inis subject to the future, such claims would have an adverse impact on AngloGold Ashanti’s financial conditionrisk of litigation, the causes and costs of which could potentially be material.
In light of the Constitutional Court judgment,are not always known”). AngloGold Ashanti is calling for the industry to engage with government (and other stakeholders) to seek an appropriate industry-wide solution. AngloGold Ashanti can provide no assurances that anAn industry-wide solution canmay not be reached or that the terms thereof will notmay have a material adverse effect on AngloGold Ashanti’s financial condition.
In response to the effects of silicosis in labor-sending communities, a number of mining companies (under the auspices of the Chamber of Mines of South Africa) together with the NUM, which is the largest union in the mining sector in South Africa, and the national and regional departments of health, have embarked on a project to assist in delivering compensation and relief by mining companies under the Occupational Diseases in Mines and Works Act (ODMWA) to affected communities.
AngloGold Ashanti faces certain risks in dealing with HIV/AIDS, particularly at its South African operations and with tropical disease outbreaks such as malaria, and other diseases which may have an adverse effect on the company’s results of operations and financial condition.
AIDS and associated diseases remain one of the major health care challenges faced by AngloGold Ashanti’s South African operations. Workforce prevalence studies indicate that HIV prevalence rates among AngloGold Ashanti’s South African workforce may be as high as 30 percent. AngloGold Ashanti continues to develop and implement programs to help those infected with HIV and prevent new infections from spreading. Since 2001, the company has offered a voluntary counseling and HIV testing program for employees in South Africa. In 2002, it began to offer anti-retroviral therapy (ART) to HIV positive employees who met the current medical criteria for the initiation of ART. From April 2003, AngloGold Ashanti began a roll-out of the treatment to all eligible employees desiring it. As at December 2011, approximately 2,400 employees were receiving treatment using anti-retroviral drugs.
Malaria and other tropical diseases pose significant health risks at all of the company’s operations in central, west and east Africa where such diseases may assume epidemic proportions because of ineffective national control programs. Malaria is a major cause of death in young children and pregnant women but also gives rise to fatalities and absenteeism in adult men. Other conditions such as heart disease, chronic diseases, and obesity are of increasing incidence and concern.
Such diseases impair the health of workers and negatively affect productivity and profitability as a result of workers’ diminished focus or skill, absenteeism, treatment costs and allocated resources. AngloGold Ashanti cannot guarantee that anyAny current or future medical program willmay not be successful in preventing or reducing the infection rate among itsAngloGold Ashanti’s employees or in affecting consequent illness or mortality rates. AngloGold Ashanti may incur significant costs in addressing this issue in the future, which could also adversely impact the company’s results of operations and financial condition.
The costs and impacts associated with the pumping of water inflows from closed mines adjacent to the company’s operations could have an adverse effect on its results of operations.
Certain of AngloGold Ashanti’s mining operations are located adjacent to the mining operations of other mining companies. The closure of a mining operation may have an impact upon continued operations at the adjacent mine if appropriate preventative steps are not taken. In particular, this can include the ingress of underground water where pumping operations at the adjacent closed mine are suspended. Such ingress could have an adverse effect on any one of the company’s mining operations as a result of property damage, disruption to operations, additional pollution liabilities and pumping costs and consequently could have an adverse impact uponon its results of operations and financial condition.
The potential costs associated with the remediation and prevention of groundwater contamination from the company’s operations or due to flooding from closed mines adjacent to the company’s operations could have a material adverse effect on theAngloGold Ashanti’s results of operations of AngloGold Ashanti and its financial condition.
AngloGold Ashanti has identified groundwater contamination plumes at certain of its operations. Numerous scientific, technical and legal studiesoperations that have been undertaken to assist in determining the magnitudeoccurred primarily as a result of the contamination and to find sustainable remediation solutions, and, based thereon, the company has instituted processes to reduce seepage and to address soil and groundwater contamination, including monitored natural attenuation by the existing environment and phyto-technologies. Subject to the completion of trials, and the technology being a proven remediation technique, no reliable estimate can be made for the potential costs of remediation and prevention of groundwater contamination at AngloGold Ashanti’s operations. Should these costs be significant, this could have a material adverse impact upon AngloGold Ashanti’s results offrom surface operations and its financial condition.facilities including tailings storage facilities and waste rock.
Deep groundwater contamination is a significant issue in South Africa, where groundwater in some older mining regions has infiltrated mined-out workings. It becomes acidic if exposed to sulfide minerals in these workings, presenting a potentialPotential contamination risk to shallow groundwaterground and eventually surface water resources if allowedcan occur when water is exposed to spread.sulfide-bearing rock in such situations. AngloGold Ashanti has identified a flooding and future pollution risk posed by deep groundwater in the Klerksdorp and Far West Rand goldfields. AngloGold Ashanti’s Vaal River operations are part of the Klerksdorp goldfieldgoldfields and its West Wits operations are part of the Far West Rand goldfield. Various studies have been undertaken by AngloGold Ashanti since 1999. Due togoldfields. As a result of the interconnected nature of underground mining operations in South Africa, any proposed solution needs to be a combined one supported by all the companies owning mines located in these goldfields. As a result, the South African Department of Mineral Resources and affected mining companies are now involved in the development of a “Regional Mine Closure Strategy”.
In view of the limitation of current information for the accurate estimation of a liability,liabilities, no reliable estimate can be made for this obligation, whichthese obligations. The potential costs of remediation and prevention of groundwater contamination at AngloGold Ashanti’s operations could be materialsignificant and may have ana material adverse impact on AngloGold Ashanti’s results of operations and financial condition.
The occurrence of events for which AngloGold Ashanti is not insured or for which its insurance is inadequate may adversely affect cash flows and overall profitability.
AngloGold Ashanti maintains insurance to protect only against catastrophic events which could have a significant adverse effect on its operations and profitability. This insurance is maintained in amounts that the company believes to be reasonable depending upon the circumstances surrounding each identified risk. However, damage and third-party claims arising from catastrophic events may exceed the limit of liability on insurance policies the company has in place. Furthermore, AngloGold Ashanti’s insurance does not cover all potential risks associated with its business and may exclude certain parts of its business. AngloGold Ashanti may elect not to insure certain risks due to the high premiums or for various other reasons, including an assessment that the risks are remote.
The company may not be able to obtain insurance coverage at acceptable premiums. The company believes negotiations with insurance providers have become more difficult for a number of reasons, including prevailing macroeconomic conditions and the risk profile of the mining industry. Insurance for certain risks in particular, such as loss of title to mineral property, political risks in certain jurisdictions, environmental pollution, or other hazards resulting from exploration and production, is not generally available to mining companies on acceptable terms. The availability and cost of insurance coverage can vary considerably from year to year as a result of events beyond the company’s control or from claims, and this can result in higher premiums and periodically being unable to maintain the levels or types of insurance carried.
The failure to obtain adequate insurance could impair the company’s ability to continue to operate in the normal course or could result in the occurrence of events for which AngloGold Ashanti is not insured, willeither of which could adversely impact its cash flows, its results of operations and its financial condition.
AngloGold Ashanti is subject to the risk of litigation, the causes and costs of which are not always known.
AngloGold Ashanti is subject to litigation, arbitration and other legal proceedings arising in the normal course of business and may be involved in disputes that may result in litigation. The causes of potential future litigation cannot be known and may arise from, among other things, business activities, environmental and health and safety concerns, share price volatility or failure to comply with disclosure obligations. The results of litigation cannot be predicted with certainty but could include costly damage awards or settlements, fines, and the loss of licenses, concessions, or rights, among other things.
In the event of a dispute involving foreign operations of the company, AngloGold Ashanti may be subject to the exclusive jurisdiction of foreign courts or may not be successful in subjecting foreign persons to the jurisdiction of courts in South Africa or the United States.
A claimAngloGold Ashanti is subject to numerous claims, including class actions or similar group claims relating to silicosis and other OLD, and could be subject to similar claims in the future.
AngloGold Ashanti has received notice of two applications for class certification relating to silicosis in which the company is a respondent. It has also received notice of individual claims. For further information, please refer to “Item 8.: Financial Information – Legal Proceedings – South Africa – Silicosis litigation”.
It is possible that additional class actions and/or individual claims relating to silicosis and/or other OLD will be filed by a former employee ofagainst AngloGold Ashanti’s predecessor, Vaal Reefs MiningAshanti in the future. AngloGold Ashanti will defend all and Exploration Company Limited, seeks approximately R2.6 million for damages resulting from silicosis allegedly contracted while workingany subsequent claims as filed on a mine. In March 2011,their merits. Should AngloGold Ashanti be unsuccessful in defending any such claims, or in otherwise favorably resolving perceived deficiencies in the national occupational disease compensation framework that were identified in an earlier decision by the Constitutional Court rejected the lower court’s decision that the claim was precluded by statutory compensation and granted leave to the decedent’s executor to proceed with his case in the High Court and seek a claim for damages under common law against AngloGold Ashanti. of South Africa, such matters would have an adverse effect on its financial position, which could be material.
In Colombia, the company is also involved in five class action lawsuits in relation to AGAC Santa Maria-Montecristo and La Colosa projects. One of these class action lawsuits led to a preliminary injunction suspending the mining concession contracts of the Santa Maria-Montecristo project in September 2011. Additionally, in Colombia, AGAC is involved in an action in the Administrative Superior Court of the Cundinamarca District against the Environmental MinistryDepartment of the Environment, Housing and Territorial Development (DoE) following theits issuance of a fine against AngloGold Ashanti; and six class action lawsuits flowingAGAC on the basis that AGAC was in part from the alleged breach of Article 34its mining terms of the Mining Code and in part from allegations that activities in ‘restricted areas’ contravene environmental legislation. See “Item 8A.: Consolidated statements and other financial information – Legal proceedings“.reference.
Should the company be unable to resolve disputes favorably or be able to enforce its rights, this may have a material adverse impact on the company’s financial performance, cash flow and results of operations.
The implementation of an integrated Enterprise Resource Planning (ERP) system could have an adverse effect on AngloGold Ashanti’s results of operations and financial condition.
AngloGold Ashanti is implementing a single, global ERP system to support all the operations managed by AngloGold Ashanti. The ERP system is being implemented over a three-and-a-half-year period which commenced in August 2011. The contemplated implementation of an ERP system on a global basis is inherently a high-risk initiative due to the potential for implementation cost and time overruns. In addition, such implementation could affect the ability of AngloGold Ashanti to report and manage technical and financial information if difficulties in the implementation and operation of the system are experienced, which could have an adverse effect on AngloGold Ashanti’s results of operations and financial condition. The first sites went live during February 2013.
Sales of large quantities of AngloGold Ashanti‘s ordinary shares and American Depository Shares (ADSs), and the perception that these sales may occur or other dilution of the company’s equity, could adversely affect the prevailing market price of the company’s securities.
The bulk of AngloGold Ashanti’s shares are held by a relatively small number of investors withinvestors. According to information available to the topcompany, AngloGold Ashanti’s four institutional holders controlling around 24largest shareholders beneficially owned approximately 23.29 percent of free float.AngloGold Ashanti’s ordinary shares as at December 31, 2012.
Poor returns, soaring costs, higher capital expenditure, ill-conceived corporate activity, rising geopolitical and labor risk and low dividend yields over the past few years have resulted in a change in market sentiment towards gold equities. The market price of the company’s securities could fall if large quantities of ordinary shares or ADSs are sold in the public market, if there is divestment by certain types or groupings of investors, or if there is the perception in the marketplace that such sales could occur. Subject to applicable securities laws, holders of AngloGold Ashanti‘the company‘s ordinary shares or ADSs may decide to sell them at any time. The market price of the company’s ordinary shares or ADSs could also fall as a result of any future offerings AngloGold Ashanti makes of its ordinary shares, ADSs, or securities exchangeable or exercisable for the company’s ordinary shares or ADSs, or the perception in the market place that these offerings might occur. AngloGold Ashanti may make such offerings, including offerings of additional ADS rights, share rights or similar securities, at any time or from time to time in the future.
Fluctuations in the exchange rate of currencies may reduce the market value of AngloGold Ashanti’s securities, as well as the market value of any dividends or distributions paid by the company.
AngloGold Ashanti has historically declared all dividends in South African rands. As a result, exchange rate movements may have affected and may continue to affect the Australian dollar, the British pound, the Ghanaian cedi and the US dollar value of these dividends, as well as of any other distributions paid by the relevant depositary to investors that hold the company’s securities. This may reduce the value of these securities to investors.
AngloGold Ashanti’s memorandum and articles of association allow for dividends and distributions to be declared in any currency at the discretion of the board of directors, or the company’s shareholders at a general meeting. If and to the extent that AngloGold Ashanti opts to declare dividends and distributions in US dollars, exchange rate movements will not affect the US dollar value of any dividends or distributions. Nevertheless, the value of any dividend or distribution in Australian dollars, British pounds, Ghanaian cedis or South African rands will continue to be affected. If and to the extent that dividends and distributions are declared in South African rands, exchange rate movements will continue to affect the Australian dollar, British pound, Ghanaian cedi and US dollar value of these dividends and distributions. Furthermore, the market value of AngloGold Ashanti’s securities as expressed in Australian dollars, British pounds, Ghanaian cedis, US dollars and South African rands will continue to fluctuate in part as a result of foreign exchange fluctuations.
The announcement by the South African government to replace the Secondary Tax on Companies with a withholding tax on dividends and other distributions may impact the amount of dividends or other distributions received by AngloGold Ashanti’s shareholders.
On February 21, 2007, the South African government announced that a 10 percent withholding tax on dividends and other distributions payable to shareholders would be implemented. In his budget speech on February 22, 2012, the South African Minister of Finance announced that the withholding tax on dividends and other distributions payable to shareholders will be 15 percent effective April 1, 2012.
This withholding tax replaces the Secondary Tax on Companies and although this may reduce the tax payable by AngloGold Ashanti’s South African operations, thereby potentially increasing distributable earnings, the withholding tax on dividends and other distributions will generally reduce the amount of dividends or other distributions received by AngloGold Ashanti shareholders.
AngloGold Ashanti may not pay dividends or make similar payments to shareholders in the future.
AngloGold Ashanti pays cash dividends only if there are sufficient funds available for that purpose. Fund availability depends upon many factors that include the amount of cash available in relation to AngloGold Ashanti’s capital expenditure on existing infrastructure and exploration and other projects.
Under South African law, companies are entitled to pay a dividend or similar payment to its shareholders only if the company meets the solvency and liquidity tests set out in legislation, and the company’s articles of association.founding documents.
Given these factors, including the capital and investment needs of the company, and the board of directors’ discretion to declare a dividend that includes the amount and timing thereof, cash dividends may not be paid in the future.
The implementation of an integrated Enterprise Resource Planning (ERP) system could have an adverse effect on AngloGold Ashanti’s operational results and its financial condition.
AngloGold Ashanti is implementing a single, global ERP system to support all operations managed by AngloGold Ashanti. The ERP system is being implemented over a three-and-a-half-year period which commenced in August 2011. The contemplated implementation of an ERP system on a global basis is inherently a high-risk initiative due to the potential for implementation cost and time overruns. In addition, such implementation could affect the ability of AngloGold Ashanti to report and manage information if difficulties in the implementation and operation of the system are experienced, which could have an adverse effect upon AngloGold Ashanti’s operational results and its financial condition.
ITEM 4: INFORMATION ON THE COMPANY
| 4A. | HISTORY AND DEVELOPMENT OF THE COMPANY |
GROUP INFORMATION
AngloGold Limited was foundedformed in June 1998 with the consolidation of the gold mining interests of Anglo American plc. AngloGold Ashanti Limited, as the company exists today, was formed on April 26, 2004 following the business combination between AngloGold and Ashanti Goldfields Company Limited.
CURRENT PROFILE
AngloGold Ashanti Limited is headquartered in Johannesburg, South Africa. The company (Registration number 1944/017354/06) was incorporated in the Republic of South Africa in 1944 under the name of Vaal Reefs Exploration and Mining Company Limited and operates under the South African Companies Act 71 of 2008 (Companies Act), as amended.
Its registered office is at 76 Jeppe Street, Newtown, Johannesburg, South Africa, 2001. Telephone: +27 11 6376000.
While AngloGold Ashanti’s primary listing is on the Johannesburg Stock Exchange (JSE), the company is also listed on the London Stock Exchange (LSE), the New York Stock Exchange (NYSE), the Ghana Stock Exchange (GhSE) and the Australian Securities Exchange (ASX).
AngloGold Ashanti delisted from Euronext Paris on December 23, 2011 and from Euronext Brussels on December 30, 2011.
HISTORY AND SIGNIFICANT DEVELOPMENTS
Below are highlights of key corporate activities from 1998:
1998
Formation of AngloGold Limited through the consolidation of East Rand Gold and Uranium Company Limited; Eastvaal Gold Holdings Limited; Southvaal Holdings Limited; Free State Consolidated Gold Mines Limited; Elandsrand Gold Mining Company Limited; H.J. Joel Gold Mining Company Limited and Western Deep Levels Limited into a single, focused, independent, gold mining company. Vaal Reefs Exploration and Mining Company Limited (Vaal Reefs), the vehicle for the consolidation, changed its name to AngloGold Limited and increased its authorized share capital, effective March 30, 1998.
1998-2004
Expansion of AngloGold Limited’s operations outside of South Africa.
2004
Concluded the business combination with Ashanti Goldfields Company Limited, at which time the company changed its name to AngloGold Ashanti Limited.
2007
Anglo American plc sold 69,100,000 ordinary shares of AngloGold Ashanti, thereby reducing Anglo American’s shareholding in AngloGold Ashanti from 41.7 percent to 16.6 percent.
2009
Anglo American plc sold its remaining shareholding to Paulson & Co. Inc.
2010
AngloGold Ashanti eliminated its hedge book, thereby gaining full exposure to spot gold prices.
2012
AngloGold Ashanti acquired the remaining 50 percent interest in Serra Grande in Brazil for $215 million.
The company acquired 100 percent of First Uranium (Proprietary) Limited for $335 million.
| 4B. | BUSINESS OVERVIEW |
AngloGold Ashanti, is a globalone of the world’s major gold company withexploration, mining and marketing companies, holds a portfolio of assetsoperations and differing orebody types in key gold producing regions.projects on four continents, and has a worldwide exploration program. The company is currentlyworks across the third-largest gold producer infull spectrum of the world.mining value chain.
PRODUCTS
AngloGold Ashanti’s main product is gold. In the course of processing the ore mined, by-products such as silver, uranium oxide and sulfuric acid are produced at the Argentinian, South African and Brazilian operations.
OPERATIONS
AngloGold Ashanti’s 2021 operations are located in 10 countries (Argentina, Australia, Brazil, Ghana, Guinea, Mali, Namibia, South Africa, Tanzania and the United States). These include six deep-level mines and one surface operationoperations in South Africa as well as a combination of surface and underground mining operations in the Americas, Australia and elsewhere on the African continent.
EXPLORATION
The group’s exploration program, which covers greenfield, brownfield, and, more recently, marine exploration, is conducted either directly orexploration. Major development projects are Tropicana in collaboration with partners. The group’s most recent greenfield discovery isAustralia, Kibali in the Democratic Republic of the Congo (DRC) and La Colosa deposit in Colombia. BrownfieldOur extensive brownfield, greenfield and marine exploration is conducted around existing operations. In October 2009, the groupprograms extend to 14 countries, in both established aand new gold-producing regions through managed and non-managed joint venture to explore for marine mineral deposits on the continental shelf. This complements AngloGold Ashanti’s existing terrestrial explorationventures, strategic alliances and mining activities.wholly owned ground holdings.
DEVELOPMENT
AngloGold Ashanti utilizes its exploration team to build on its record of new gold discoveries and to grow its gold endowment. The company has increased its capacity to fund a significant project pipeline by incurring longer-term debt, while maintaining capital discipline and improving shareholder returns.
MARKETING
Once processed to the doré (unrefined gold bar) stage at AngloGold Ashanti’s operations, this product is dispatched to various precious metal refineries where the gold is refined to a purity of at least 99.5 percent, in accordance with the standards of ‘good delivery’“good delivery” as determined by the London Bullion Market Association. It is then sold to bullion banks or refiners. Gold has been a much sought after source of wealth over the centuries, be it as an investment, a store of value or as jewellery. AngloGold Ashanti campaigns actively to promote the demand for gold.
GOLD MARKET
AngloGold Ashanti’s gold is refined at various precious metal refineries. In refined and marketable form, gold normally takes the shape of bars, varying in size from 12.5 kilogram to smaller bars weighing some 1 kilogram or less, all of which contain 99.5 percent gold. Through the refineries the gold is sold directly to bullion banks. Bullion banks are registered commercial banks which deal in gold, distributing bullion bought from mining companies and refineries to markets worldwide. These banks hold consignment stocks in all major physical markets and finance these inventories from the margins they charge physical buyers.
The physical gold market is dominated by the jewellery and investment sectors, which together account for over 8078 percent of total demand. The balance of gold supplydemand is used infrom the electronics and dentistry.dentistry industry, as well as the uptake from central banks. While the quantity of gold used in jewellery consumption has decreased over the last decade with the steadily rising gold price, the investment market has largely absorbed available supply. Investment in physical gold involves bar and coin hoarding, medals and other retail investment instruments, as well as the now significant market for exchange traded funds (ETFs).
InThe gold price averaged $1,668 per ounce for 2012, marking the eleventh consecutive year of average annual price increases. After reaching a record of $1,921 per ounce in September 2011, the gold price failed to reach the same level during 2012.
Although gold has traditional “safe haven” status among financial assets, it did not benefit significantly in 2012. This was largely on account of the continued negative correlation between the dollar gold price and the dollar, in which a stronger dollar tended to cap appreciation in the gold price. This pattern was exacerbated by the fact that investors often sold profitable gold positions.
The announcement by the US Federal Reserve of a further round of quantitative easing in mid-September correlated with a boost in the gold price, however, having averaged $1,651 per ounce over the first three quarters of 2012, the announcement of the third round of quantitative easing (QE3) corresponding with an increase in the gold price average to $1,717 per ounce for the final quarter. As of April 19, 2013, the gold price was $1,404 per ounce.
Investment market
Holdings within the ETF universe showed reasonable growth. Although growth in total gold holdings was lower than that experienced in 2009 and 2010, it was an improvement over 2011. ETF holdings grew by 6.4 million ounces in 2011 which represents growth of 9 percent over the year. In 2012, ETF holdings grew by almost 9.4 million ounces or 12 percent.
Among ETFs, which now include some 32 different funds, the NYSE-listed SPDR Gold Shares (GLD) remained the largest at 43.4 million ounces, or almost half of combined holdings of 88.8 million ounces (as at end 2012). This fund grew by 3.1 million ounces in 2012 and alone accounted for over a third of overall growth in holdings during 2012.
The official sector continued to be profoundly influenceda significant source of demand through 2012 with estimates of around 17.2 million ounces (net) bought by ongoing economic turmoil, particularlyvarious central banks across the globe. The most dominant sources of demand from this sector remain those countries which are not members of the Organization for Economic Co-operation and Development (OECD), such as Brazil, Mexico and South Korea, which added to their gold reserves. In contrast, the third year of the Central Bank Gold Agreement ended at the end of September and total sales of 5 tonnes by its signatories were recorded. This represents the lowest annual sales in any of the United Statesagreements.
Bar and coin demand for 2012 failed to match the levels of America2011, declining by 260 tonnes year-on-year. Demand experienced from Europe in 2011 did not materialize again in 2012. However, after a slow start to the first half of the year, Indian demand for bars and latterly bycoins began to emerge and amounted some 25 percent of total demand for 2012. Demand from China, another important source of demand, was flat at 265 tonnes, primarily due to the crisis triggered by the deteriorationslowing of the sovereign debt markets in the Eurozone. This trend persisted until the fourth quarter, during which the situation in Europe deteriorated, the euro started slipping against the dollar in the face of the inability of the European countries to resolve the funding crisis and the gold price failed to react favorably to these conditions. Despite this trend in the fourth quarter of 2011, the year-end spot gold price gained 11 percent in 2011 compared to 2010 and averaged $1,572 per ounce in 2011, which is 28 percent higher than the average spot price of $1,227 in 2010. However, prospects for the gold market continued to deteriorate in the first quarter of 2012 as uncertainty about sovereign debt and inflation eased, European economic prospects improved, investor interest for gold slowed and physical demand in India decreased. As at March 31, 2012, the price of gold was $1,664 per ounce.
Investment market
As 2011 drew to a close, the gold price failed to respond favorably to the worsening crisis in Europe. Nevertheless, ETF holdings grew over the course of the fourth quarter of 2011, improving on a sluggish first quarter and reversing the negative trend of the second and third quarters.
As at December 31, 2011, aggregate holdings for the major ETFs totaled almost 78 million ounces, which represents a 7 percent increase of 5.2 million ounces for the year. This growth is modest when compared to the significant increases in ETF holdings of 2009 and 2010 (19.84 million ounces and 9.97 million ounces respectively). Combined ETFs rank sixth behind official sector holdings of the United States (267 million ounces), Germany (109 million ounces), IMF (91 million ounces), Italy (79 million ounces) and France (78 million ounces). As was the case in 2010, official sector demand in the gold market remained significant in 2011, with governments continuing to increase their gold holdings in the face of extreme economic uncertainty.
More traditional gold investment products such as bar and coin experienced a very mixed year. In India, the world’s biggest single gold market, gold price volatility and a weakening rupee severely dampened gold demand in both investment and jewellery. In China, such volatility also played a negative role but since the value of the Yuan is so closely managed, the impacts were not as marked. Unlike India, China recorded growth in both investment and jewellery demand in 2011. In the developed markets, Europe was by far the strongest for bar and coin hoarding, and in the third quarter European demand exceeded that of India and China – a highly rare occurrence. Much of this activity was driven by the debt crisis in the Eurozone.Chinese economy.
Jewellery markets
The key jewellery marketsA jewellers’ strike and doubling of India and China both experienced mixed fortunes duringimport duties meant that the year. After a record year in 2010, India’s first two quarters remained strong but fell off in the second half of the year on price volatility and rupee weakness. Price volatility also dampenedwitnessed very poor demand in China, but unlikeout of India which experienced a contractionrelative to 2011, down by 24 percent. Sentiment improved in the thirdlatter half of the year and fourth quarters, China still recorded increases all year round, with totalIndia remained the strongest performing market for gold jewellery and, in 2012, accounted for 29 percent of global jewellery fabrication.
Slowing fortunes of the Chinese economy had an impact on jewellery demand growingfrom this region, down 4.5 tonnes year-on-year, as consumers cut back on their discretionary spending. Hong Kong maintained its levels of jewellery demand year-on-year at 27 tonnes.
European jewellery demand was similarly affected by 16 percent to reach 524 tonnes. Ineconomic woes and austerity measures.
The outlook for the gold price remains broadly supportive given the continuation of loose monetary policies in both the United States and Europe. However, there is growing confidence that monetary authorities may have managed the worst of these crises. Austerity measures may continue across Europe and this may weigh on European jewellery sector showed modest growth of around 3 percent asdemand while further measures by the market finally beganIndian authorities to settle after years of turmoil. The high end of thecurb gold imports mean that jewellery marketdemand from this region will also likely decrease in the United States showedshort term.
RAW MATERIALS
AngloGold Ashanti uses chemicals including cyanide and lime in the greatest growth for the second year as the wealthyproduction of gold. These chemicals are less affected byavailable from a financial downturn than low to middle income earners.large number of suppliers.
COMPETITIONSouth Africa
As gold mining(Address of Principal Executive Offices)
ME Sanz Perez, Company Secretary, Telephone: +27 11 6376306, Facsimile: +27 86 6750137
E-mail: rsanz@anglogoldashanti.com, 76 Jeppe Street, Newtown, Johannesburg, 2001, South Africa
(Name, Telephone, E-mail and/or Facsimile number and Address of Company Contact Person)
Securities registered pursuant to Section 12(b) of the Act:
| Title of each class | Name of each exchange on which registered | |
American Depositary Shares | New York Stock Exchange | |
Ordinary Shares | New York Stock Exchange* | |
6.00 Percent Mandatory Convertible Subordinated Bonds due 2013 | New York Stock Exchange |
| * | Not for trading, but only in connection with the registration of American Depositary Shares pursuant to the requirements of the Securities and Exchange Commission |
Securities registered pursuant to Section 12(g) of the Act:
None
Securities for which there is a mature and regulated industry, and very significant volumes of gold and gold derivatives trade in the world markets independent of gold mine supply, AngloGold Ashanti does not consider that competition for sales plays any role in its operations as a gold producer. However, gold producers do compete against each other for acquisition of mining assets, exploration opportunities and human resources.
INTELLECTUAL PROPERTY
AngloGold Ashanti, as a group, is not dependent on intellectual property for the conduct of its business as a whole.
STRATEGY
At the end of March 2008, AngloGold Ashanti adopted a new business strategy. The company defined its strategic focus in five components:
Promote the organizational developmentreporting obligation pursuant to Section 15(d) of the group as a strategic value driver;Act:
Maximize marginsby managing both revenue and costs to ensure delivery and protectionNone
Indicate the number of returns throughout the economic cycle;
Manage the business as an asset portfolioby using capital deployment optimization approaches to support delivery of return targets;
Grow the business by having a definite strategy for both organic growth and growth by acquisition and be opportunistic in seeking value accretive targets; and
Embrace sustainability principles by developing business and social partnerships based on mutual value creation, while maintaining a focus on ensuring the safety and well-being of employees and managing environmental and other impacts.
The key featuresoutstanding shares of each of these componentsthe issuer’s classes of capital or common stock as of the company’s strategy are:close of the period covered by the annual report:
Ordinary Shares of 25 ZAR cents each | 383,320,962 | |||
E Ordinary Shares of 25 ZAR cents each | 1,617,752 | |||
A Redeemable Preference Shares of 50 ZAR cents each | 2,000,000 | |||
B Redeemable Preference Shares of 1 ZAR cent each | 778,896 |
Indicate by check mark if the registrant is a well-known seasoned issuer, as defined in Rule 405 of the Securities Act.
| Yes x No ¨ |
If this report is an annual or transition report, indicate by check mark if the registrant is not required to file reports pursuant to Section 13 or 15(d) of the
Securities Exchange Act of 1934. | Yes ¨ No x |
Indicate by check mark whether the registrant (1) has filed all reports required to be filed by Section 13 or 15(d) of the Securities Exchange Act of 1934 during the preceding 12 months (or for such shorter period that the registrant was required to file such reports), and (2) has been subject to such filing
requirements for the past 90 days. | Yes x No ¨ |
Indicate by check mark whether the registrant (1) has submitted electronically and posted on its corporate web site, if any, every Interactive Data File required to be submitted and posted pursuant to Rule 405 of Regulation S-T during the preceding 12 months (or for such shorter period that the registrant was
required to submit and post such files). | Yes x No ¨ |
Indicate by check mark whether the registrant is a large accelerated filer, an accelerated filer, or a non-accelerated filer. See definition of “accelerated filer and large accelerated filer” in Rule 12b-2 of the Exchange Act.
(Check one): Large Accelerated Filer x | Accelerated Filer¨ | Non-Accelerated Filer ¨ |
Indicate by check mark which basis of accounting the registrant has used to prepare the financial statements included in this filing:
| U.S. GAAP x |
International Financial Reporting Standards as issued by the International Accounting Standards Board¨Other¨
If this is an annual report, indicate by check mark whether the registrant is a shell company (as defined in Rule 12b-2 of the Exchange Act). | Yes ¨ No x |
| TABLE OF CONTENTS | Page | |||||
| 3 | ||||||
| 4 | ||||||
| 5 | ||||||
| 8 | ||||||
| 8 | ||||||
| 9 | ||||||
Item 1: | 10 | |||||
Item 2: | 10 | |||||
Item 3: | ||||||
| 3A. | 10 | |||||
| 3B. | 14 | |||||
| 3C. | 14 | |||||
| 3D. | 14 | |||||
Item 4: | 41 | |||||
| 4A. | 41 | |||||
| 4B. | 42 | |||||
| 4C. | 95 | |||||
| 4D. | 96 | |||||
Item 4A: | 121 | |||||
Item 5: | 122 | |||||
| 5A. | 123 | |||||
| 5B. | 149 | |||||
| 5C. | 158 | |||||
| 5D. | 158 | |||||
| 5E. | 158 | |||||
| 5F. | 158 | |||||
Item 6: | ||||||
| 6A. | 159 | |||||
| 6B. | 166 | |||||
| 6C. | 172 | |||||
| 6D. | 177 | |||||
| 6E. | 179 | |||||
Item 7: | 186 | |||||
| 7A. | 188 | |||||
| 7B. | 189 | |||||
| 7C. | 189 | |||||
Item 8: | ||||||
| 8A. | Consolidated financial statements and other financial information | 190 | ||||
| 190 | ||||||
| 196 | ||||||
| 8B. | 196 | |||||
Item 9: | ||||||||
| 9A. | 197 | |||||||
| 9B. | 197 | |||||||
| 9C. | 198 | |||||||
| 9D. | 198 | |||||||
| 9E. | 198 | |||||||
| 9F. | 198 | |||||||
Item 10: | ||||||||
| 10A. | 199 | |||||||
| 10B. | 202 | |||||||
| 10C. | 213 | |||||||
| 10D. | 216 | |||||||
| 10E. | 217 | |||||||
| 10F. | 221 | |||||||
| 10G. | 221 | |||||||
| 10H. | 221 | |||||||
| 10I. | 221 | |||||||
Item 11: | 222 | |||||||
Item 12: | ||||||||
| 12A. | 229 | |||||||
| 12B. | 229 | |||||||
| 12C. | 229 | |||||||
| 12D. | ||||||||
| 229 | ||||||||
| 229 | ||||||||
Item 13: | 230 | |||||||
Item 14: | Material modifications to the rights of security holders and use of proceeds | 231 | ||||||
Item 15: | 232 | |||||||
Item 16A: | 234 | |||||||
Item 16B: | 235 | |||||||
Item 16C: | 236 | |||||||
Item 16D: | 236 | |||||||
Item 16E: | Purchases of equity securities by the issuer and affiliated purchasers | 236 | ||||||
Item 16F: | 237 | |||||||
Item 16G: | 237 | |||||||
Item 16H: | 237 | |||||||
Item 17: | 238 | |||||||
Item 18: | 239 and F pages | |||||||
Item 19 | Exhibits | E pages | ||||||
AngloGold Ashanti Limited
In this annual report on Form 20-F, unless the context otherwise requires, references to AngloGold, AngloGold Ashanti, the company, the Company and the group are references to AngloGold Ashanti Limited including, as appropriate, subsidiaries and associate companies of AngloGold Ashanti.
PromoteUS GAAP financial statements
The audited consolidated financial statements contained in this annual report on Form 20-F for the organizational developmentyears ended December 31, 2012, 2011 and 2010 and as at December 31, 2012 and 2011 have been prepared in accordance with U.S. generally accepted accounting principles (US GAAP).
IFRS financial statements
As a company incorporated in the Republic of South Africa, AngloGold Ashanti also prepares annual audited consolidated financial statements and unaudited consolidated quarterly financial statements in accordance with International Financial Reporting Standards (IFRS) as issued by the groupInternational Accounting Standards Board (IASB). These financial statements (referred to as IFRS statements) are distributed to shareholders and are submitted to the JSE Limited (JSE), as well as the London, New York, Australian and Ghana stock exchanges and are furnished to the US Securities and Exchange Commission (SEC) on Form 6-K.
Currency
AngloGold Ashanti recognizespresents its consolidated financial statements in United States dollars.
In this annual report, references to rands, ZAR and R are to the strategic importancelawful currency of the group’s organizational development and through its:
Mission, it seeksRepublic of South Africa, references to define a clear viewUS dollars, dollar or $ are to the lawful currency of the organization;United States, references to€
Vision, its seeks are to reflect a clear and consistent viewthe lawful currency of the organization’s future;European Union, references to C$ or CAD are to the lawful currency of Canada, references to ARS and peso are to the lawful currency of Argentina, references to AUD and A$ are to the lawful currency of Australia, references to BRL are to the lawful currency of Brazil, reference to NAD and N$ are to the lawful currency of Namibia, reference to Tsh is to the lawful currency of the United Republic of Tanzania and references to GHC, cedi or ¢ are to the lawful currency of Ghana.
See “Item 3A.: Selected financial data – Exchange rate information” for historical information regarding the US dollar/South African rand exchange rate. On April 19, 2013 the interbank US dollar/South African rand exchange rate as reported by OANDA Corporation was R9.17/$1.00.
ValuesNon-GAAP financial measures
In this annual report on Form 20-F, AngloGold Ashanti presents the financial items “total cash costs”, it recognizes“total cash costs per ounce”, “total production costs” and “total production costs per ounce” which have been determined using industry guidelines and practices promulgated by the Gold Institute and are not US GAAP measures. An investor should not consider these items in isolation or as alternatives to production costs, net income/(loss) applicable to common shareholders, income/(loss) before income tax provision, net cash provided by operating activities or any other measure of financial performance presented in accordance with US GAAP. While the Gold Institute has provided definitions for the calculation of total cash costs and total production costs, the calculation of total cash costs, total cash costs per ounce, total production costs and total production costs per ounce may vary significantly among gold mining companies, and by themselves do not necessarily provide a basis for comparison with other gold mining companies. See “Glossary of selected terms – Financial terms – Total cash costs” and –“Total production costs” and “Item 5A.: Operating results – Total cash costs and total production costs”.
Shares and shareholders
In this annual report on Form 20-F, references to ordinary shares, ordinary shareholders and shareholders/members, should be read as common stock, common stockholders and stockholders, respectively, and vice versa.
CERTAIN FORWARD-LOOKING STATEMENTS
Certain statements contained in this document, other than statements of historical fact, including, without limitation, those concerning the economic outlook for the gold mining industry, expectations regarding gold prices, production, cash costs and other operating results, return on equity, productivity improvements, growth prospects and outlook of AngloGold Ashanti’s operations, individually or in the aggregate, including the achievement of project milestones, the completion and commencement of commercial operations of certain of AngloGold Ashanti’s exploration and production projects and the completion of acquisitions and dispositions, AngloGold Ashanti’s liquidity and capital resources and capital expenditures and the outcome and consequence of any potential or pending litigation or regulatory proceedings or environmental issues, are forward-looking statements regarding AngloGold Ashanti’s operations, economic performance and financial condition.
These forward-looking statements or forecasts involve known and unknown risks, uncertainties and other factors that may cause AngloGold Ashanti’s actual results, performance or achievements to differ materially from the anticipated results, performance or achievements expressed or implied in these forward-looking statements. Although AngloGold Ashanti believes that the process usedexpectations reflected in such forward-looking statements are reasonable, no assurance can be given that such expectations will prove to achievehave been correct. Accordingly, results isand forecasts could differ materially from those set out in the forward-looking statements as important as the results themselves;
Business Process Framework, it seeks to define the policy, standardsa result of among other factors, changes in economic, social and political and market conditions, success of business and operating framework necessary to establish a flexible and responsive work model within which people have the opportunity to be creative and realize their potential; and
Organizational model, it seeks to ensure that the right person, does the right work,initiative, changes in the right wayregulatory environment and atother government actions, including environmental approval, fluctuations in gold prices and exchange rates, the right time.
Maximize marginsoutcome of pending or future litigation proceedings and business and operational risk management and other factors as determined in “item 3D.: Risk factors” and elsewhere in this annual report. These factors are not necessarily all of the important factors that could cause AngloGold Ashanti’s actual results to differ materially from those expressed in any forward-looking statements. Other unknown or unpredictable factors could also have material adverse effects on future results. Consequently, readers are cautioned not to place undue reliance on forward-looking statements.
AngloGold Ashanti seeksundertakes no obligation to maximize marginsupdate publicly or release any revisions to these forward-looking statements to events or circumstances after the date of this annual report or to reflect the occurrence of unanticipated events, except to the extent required by actively managing revenuesapplicable law. All subsequent written or oral forward-looking statements attributable to AngloGold Ashanti or any person acting on its behalf are qualified by the cautionary statements herein.
The following explanations are not intended as technical definitions but should assist the reader in understanding terminology used in this annual report. Unless expressly stated otherwise, all explanations are applicable to both underground and costs. In particular, it seekssurface mining operations.
All injury frequency rate:The total number of injuries and fatalities that occurs per million hours worked.
BIF:Banded Ironstone Formation. A chemically formed iron-rich sedimentary rock.
By-products:Any products that emanate from the core process of producing gold, including silver, uranium and sulfuric acid.
Calc-silicate rock:A metamorphic rock consisting mainly of calcium-bearing silicates such as diopside and wollastonite, and formed by metamorphism of impure limestone or dolomite.
Carbon-in-leach (CIL):Gold is leached from a slurry of gold ore with cyanide in agitated tanks and adsorbed on to maximizecarbon granules in the same circuit. The carbon granules are separated from the slurry and treated in an elution circuit to remove the gold.
Carbon-in-pulp (CIP):Gold is leached conventionally from a slurry of gold ore with cyanide in agitated tanks. The leached slurry then passes into the CIP circuit where carbon granules are mixed with the slurry and gold is adsorbed on to the carbon. The granules are separated from the slurry and treated in an elution circuit to remove the gold.
Comminution:Comminution is the crushing and grinding of ore to make gold available for treatment. (See also “Milling”).
Contained gold:The total gold content (tons multiplied by grade) of the material being described.
Cut-off grade (surface mines):The minimum grade at which a unit of ore will be mined to achieve the desired economic outcome.
Depletion:The decrease in the quantity of ore in a deposit or property resulting from extraction or production.
Development:The process of accessing an orebody through shafts and/or tunneling in underground mining operations.
Diorite:An igneous rock formed by the solidification of molten material (magma).
Doré:Impure alloy of gold and silver produced at a mine to be refined to a higher purity, usually consisting of 85 percent gold on average.
Electro-winning:A process of recovering gold from solution by means of electrolytic chemical reaction into a form that can be smelted easily into gold bars.
Elution:Recovery of the gold from the activated carbon into solution before zinc precipitation or electro-winning.
Gold Produced:Refined gold in a saleable form derived from the mining process.
Grade:The quantity of gold contained within a unit weight of gold-bearing material generally expressed in ounces per short ton of ore (oz/t), or grams per metric tonne (g/t).
Greenschist:A schistose metamorphic rock whose green color is due to the presence of chlorite, epidote or actinolite.
Leaching:Dissolution of gold from crushed or milled material, including reclaimed slime, prior to adsorption on to activated carbon.
Life of mine (LOM):Number of years for which an operation is planning to mine and treat ore, and is taken from the current mine plan.
Metallurgical plant:A processing plant constructed to treat ore and extract gold.
Metallurgical recovery factor (MetRF): A measure of the efficiency in extracting gold from the ore deposit.
Milling:A process of reducing broken ore to a size at which concentrating can be undertaken. (See also “Comminution”).
Mine call factor:The ratio, expressed as a percentage, of the total quantity of recovered and unrecovered mineral product after processing with the amount estimated in the ore based on sampling. The ratio of contained gold delivered to the metallurgical plant divided by the estimated contained gold of ore mined based on sampling.
Mineral deposit:A mineral deposit is a concentration (or occurrence) of material of possible economic interest in or on the earth’s crust.
Ore Reserve:That part of a mineral deposit which could be economically and legally extracted or produced at the time of the Ore Reserve determination.
Ounce (oz) (troy):Used in imperial statistics. A kilogram is equal to 32.1507 ounces. A troy ounce is equal to 31.1035 grams.
Pay limit:The grade of a unit of ore at which the revenue from the recovered mineral content of the ore is equal to the sum of total cash costs, closure costs, Ore Reserve development and stay-in-business capital. This grade is expressed as an in-situ value in grams per tonne or ounces per short ton (before dilution and mineral losses).
Precipitate:The solid product of chemical reaction by fluids such as the zinc precipitation referred to below.
Probable Ore Reserve:Ore Reserve for which quantity and grade are computed from information similar to that used for Proven Reserves, but the sites for inspection, sampling, and measurement are further apart or are otherwise less adequately spaced. The degree of assurance, although lower than that for Proven Reserves, is high enough to assume continuity between points of observation.
Productivity:An expression of labor productivity based on the ratio of grams of gold produced per month to the total number of employees in mining operations.
Proven Ore Reserve:Ore Reserve for which the (a) quantity is computed from dimensions revealed in outcrops, trenches, workings or drill holes; grade is computed from the results of detailed sampling and (b) the sites for inspection, sampling and measurement are spaced so closely and the geologic character is so well defined that size, shape, depth and mineral content of the Ore Reserve are well established.
Project capital:Capital expenditure to either bring a new operation into production; to materially increase production capacity; or to materially extend the productive life of an asset.
Recovered grade:The recovered mineral content per unit of ore treated.
Reef:A gold-bearing sedimentary horizon, normally a conglomerate band that may contain economic levels of gold.
Refining:The final purification process of a metal or mineral.
Rehabilitation:The process of reclaiming land disturbed by mining to allow an appropriate post-mining use. Rehabilitation standards are defined by country-specific laws, including but not limited to the South African Department of Mineral Resources, the US Bureau of Land Management, the US Forest Service, and the relevant Australian mining authorities, and address among other issues, ground and surface water, topsoil, final slope gradient, waste handling and re-vegetation issues.
Seismic event:A sudden inelastic deformation within a given volume of rock that radiates detectable seismic energy.
Shaft:A vertical or subvertical excavation used for accessing an underground mine; for transporting personnel, equipment and supplies; for hoisting ore and waste; for ventilation and utilities; and/or as an auxiliary exit.
Short ton:Used in imperial statistics. Equal to 2,000 pounds.
Skarn:A rock of complex mineralogical composition, formed by contact metamorphism and metasomatism of carbonate rocks.
Smelting:A pyro-metallurgical operation in which gold is further separated from impurities.
Stope:Underground excavation where the orebody is extracted.
Stripping ratio:The ratio of waste tonnes to ore tonnes mined calculated as total tonnes mined divided by ore tonnes mined.
Stoping:The process of excavating ore underground.
Syngenetic:Formed contemporaneously with the deposition of the sediment.
Tailings:Finely ground rock of low residual value from its products by:which valuable minerals have been extracted.
offering exposureTailings dam (slimes dam):Dam facilities designed to spot prices;store discarded tailings.
delivering products
Tonne:Used in metric statistics. Equal to 1,000 kilograms.
Tonnage:Quantity of material measured in tonnes or tons.
Waste:Material that contains insufficient mineralization for consideration for future treatment and, as such, is discarded.
Yield:The amount of valuable mineral or metal recovered from each unit mass of ore expressed as ounces per short ton or grams per metric tonne.
Zinc precipitation:Zinc precipitation is the chemical reaction using zinc dust that converts gold in solution to a consistent qualitysolid form for smelting into unrefined gold bars.
Average number of employees:The monthly average number of production and non-production employees and contractors employed during the year, where contractors are defined as individuals who have entered into a fixed-term contract of employment with a group company or subsidiary. Employee numbers of joint ventures represents the group’s attributable share.
Capital expenditure:Total capital expenditure on time;tangible assets.
seeking
Discontinued operation:A component of an entity that, pursuant to maintain cost inflation belowa single plan, has been disposed of or abandoned or is classified as held for sale until conditions precedent to the industry average;sale have been fulfilled.
Effective tax rate:Current and deferred taxation charge for the year as a percentage of profit before taxation.
applying resource development strategies
OANDA Corporation:An internet-based provider of forex trading and currency information services.
Rated bonds:The $700 million 5.375 percent bonds due 2020, $300 million 6.5 percent bonds due 2040 and the $750 million 5.125 percent bonds due 2022.
Region:Defines the operational management divisions within AngloGold Ashanti Limited, namely South Africa, Continental Africa (Ghana, Guinea, Mali, Namibia and Tanzania), Australasia, and the Americas (Argentina, Brazil and United States of America).
Related party:Parties are considered related if one party has the ability to maintain operating marginscontrol the other party or exercise significant influence over the lifecycleother party in making financial and operating decisions.
Significant influence:The ability, directly or indirectly, to participate in, but not exercise control over, the financial and operating policy decision of an asset.entity so as to obtain economic benefit from its activities.
ManageSTRATE:The licensed Central Securities Depository (CSD) for the electronic settlement of financial instruments in South Africa.
Total cash costs:Total cash costs include site costs for all mining, processing and administration, reduced by contributions from by-products and are inclusive of royalties and production taxes. Depreciation, depletion and amortization, rehabilitation, corporate administration, employee severance costs, capital and exploration costs are excluded. Total cash costs per ounce are the attributable total cash costs divided by the attributable ounces of gold produced.
Total production costs:Total cash costs plus depreciation, depletion and amortization, employee severance costs, rehabilitation and other non-cash costs. Corporate administration and exploration costs are excluded. Total production costs per ounce are the attributable total production costs divided by the attributable ounces of gold produced.
Weighted average number of ordinary shares:The number of ordinary shares in issue at the beginning of the year, increased by shares issued during the year, weighted on a time basis for the period during which they have participated in the income of the group, and increased by share options that are virtually certain to be exercised.
$, US$ or dollar | United States dollars | |||||
ARS | Argentinean peso | |||||
A$ or AUD | Australian dollars | |||||
BRL | Brazilian real | |||||
€ or Euro | European Euro | |||||
C$ or CAD | Canadian dollars | |||||
GHC, cedi or ¢ | Ghanaian cedi | |||||
N$ or NAD | Namibian dollars | |||||
Tsh | Tanzanian Shillings | |||||
ZAR, R or rand | South African rands |
ADS | American Depositary Share | |
ADR | American Depositary Receipt | |
AIFR | All injury frequency rate | |
ASX | Australian Securities Exchange | |
Au | Contained gold | |
BBSY | Bank Bill Swap Bid Rate | |
bn | Billion | |
BEE | Black Economic Empowerment | |
capex | Capital expenditure | |
CDI | Chess Depositary Interests | |
CLR | Carbon Leader Reef | |
Companies Act | South African Companies Act 71, of 2008 | |
DMTNP | Domestic medium-term notes program | |
ERP | Enterprise resource planning | |
FIFR | Fatal injury frequency rate | |
G or g | Grams | |
g/t | Grams per tonne | |
GhDS | Ghanaian Depositary Share | |
GhSE | Ghana Stock Exchange | |
JORC | Australasian Code for Reporting Exploration Results, Mineral Resources and Ore Reserves | |
JIBAR | Johannesburg Interbank Agreed Rate | |
JSE | JSE Limited (Johannesburg Stock Exchange) | |
King III | South African King Code on Corporate Governance, 2009 | |
Kg or kg | Kilograms | |
Km or km | Kilometers | |
LSE | London Stock Exchange | |
LIBOR | London Interbank Offer Rate | |
LOM | Life of mine | |
M or m | Meter or million, depending on the context | |
Moz | Million ounces | |
Mt | Million tonnes or tons | |
Mtpa | Million tonnes/tons per annum | |
NYSE | New York Stock Exchange | |
Oz or oz | Ounces (troy) | |
oz/t | Ounces per ton | |
oz/TEC | Ounces per total employee costed | |
SAMREC | South African Code for the Reporting of Mineral Resources and Mineral Reserves 2007 Edition | |
SEC | United States Securities and Exchange Commission | |
SOX | Sarbanes-Oxley Act of 2002 | |
T or t | Tons (short) or tonnes (metric) | |
Tpa or tpa | Tonnes/tons per annum | |
US/USA/United States | United States of America | |
VCR | Ventersdorp Contact Reef |
Note:Rounding of figures in this report may result in computational discrepancies.
ITEM 1: IDENTITY OF DIRECTORS, SENIOR MANAGEMENT AND ADVISORS
Not applicable.
ITEM 2: OFFER STATISTICS AND EXPECTED TIMETABLE
Not applicable.
| 3A. | SELECTED FINANCIAL DATA |
The selected financial information set forth below for the years ended December 31, 2010, 2011 and 2012 and as at December 31, 2011 and 2012 has been derived from, and should be read in conjunction with, the US GAAP financial statements included under Item 18 of this annual report. The selected financial information for the years ended December 31, 2008 and 2009 and as at December 31, 2008, 2009 and 2010 has been derived from the US GAAP financial statements not included in this annual report.
Year ended December 31, Consolidated statement of income Sales and other income Product sales(2) Interest, dividends and other Costs and expenses Operating costs(3) Royalties Depreciation, depletion and amortization Impairment of assets Interest expense Accretion expense (Profit)/loss on sale of assets, realization of loans, indirect taxes and other Non-hedge derivative loss/(gain) and movement on bonds (Loss)/income from continuing operations before income tax and equity income in associates Taxation (expense)/benefit Equity (loss)/income in associates Net (loss)/income from continuing operations Discontinued operations Net (loss)/income Less: Net income attributable to noncontrolling interests Net (loss)/income - attributable to AngloGold Ashanti Net (loss)/income - attributable to AngloGold Ashanti (Loss)/income from continuing operations Discontinued operations Basic (loss)/earnings per common share (in $)(4) From continuing operations Discontinued operations Net (loss)/income - attributable to AngloGold Ashanti common stockholders Diluted (loss)/income per common share (in $)(4) From continuing operations Discontinued operations Net (loss)/income - attributable to common stockholders Dividend per common share (cents) 2008 (1) 2009 2010 2011 2012 $ $ $ $ $ (in millions, except share and per share amounts) 3,730 3,954 5,402 6,642 6,428 3,655 3,784 5,334 6,570 6,353 75 170 68 72 75 4,103 4,852 5,021 4,521 5,217 2,452 2,543 3,112 3,555 3,876 78 84 142 193 164 615 615 720 789 794 670 8 91 17 367 72 123 151 178 213 22 17 22 28 33 (64 ) 10 (3 ) (43 ) 35 258 1,452 786 (196 ) (265 ) (373 ) (898 ) 381 2,121 1,211 (22 ) 33 (255 ) (705 ) (340 ) (149 ) 88 40 59 (23 ) (544 ) (777 ) 166 1,475 848 23 - - - - (521 ) (777 ) 166 1,475 848 (42 ) (48 ) (54 ) (50 ) (19 ) (563 ) (825 ) 112 1,425 829 (586 ) (825 ) 112 1,425 829 23 - - - - (563 ) (825 ) 112 1,425 829 (1.86 ) (2.30 ) 0.30 3.71 2.15 0.07 - - - - (1.79 ) (2.30 ) 0.30 3.71 2.15 (1.86 ) (2.30 ) 0.30 3.17 1.61 0.07 - - - - (1.79 ) (2.30 ) 0.30 3.17 1.61 13 13 18 34 56
Consolidated balance sheet data (as at period end) Cash and cash equivalents and restricted cash Other current assets Property, plant and equipment and acquired properties, net Goodwill and other intangibles, net Materials on the leach pad (long-term) Total assets Current liabilities Provision for environmental rehabilitation Deferred taxation liabilities Other long-term liabilities and derivatives Equity(5) Total liabilities and equity Capital stock (exclusive of long-term debt and redeemable preferred stock) Number of common shares as adjusted to reflect changes in capital stock Net assets 2008 2009 2010 2011 2012 $ $ $ $ $ (in millions, except share and per share amounts) 585 1,112 585 1,147 927 2,328 1,646 1,412 1,484 1,863 5,579 6,285 6,762 6,902 7,983 152 180 197 213 305 261 324 331 393 445 Other long-term assets, derivatives, deferred taxation assets and other long-term inventory 546 1,115 1,101 1,046 1,579 9,451 10,662 10,388 11,185 13,102 3,458 4,475 1,004 919 1,959 302 385 530 653 758 1,008 1,171 1,200 1,242 1,157 1,277 1,186 3,065 2,849 3,380 3,406 3,445 4,589 5,522 5,848 9,451 10,662 10,388 11,185 13,102 12 12 13 13 13 353,483,410 362,240,669 381,204,080 382,242,343 383,320,962 3,406 3,445 4,589 5,522 5,848
| (1) | 2008 results included the acquisition of the remaining 33 percent shareholding in the Cripple Creek and Victor Gold Mining Company with effect from July 1, 2008. In prior years, the investment was consolidated as a subsidiary. The 2008 accounting treatment is therefore consistent with that of prior years. |
| (2) | Product sales represent revenue from the sale of gold. |
| (3) | Operating costs include production costs, exploration costs, related party transactions, general and administrative, market development costs, employment severance costs and other. |
| (4) | The calculations of basic and diluted (loss)/earnings per common share are described in note 8 to the consolidated financial statements “Income/(loss) per common share”. Amounts reflected exclude E Ordinary shares. |
| (5) | Includes noncontrolling interests. |
Annual dividends
The table below sets forth the amounts of interim, final and total dividends paid in respect of the past five years in cents per ordinary share. In respect of 2012, a fourth quarter dividend of 50 South African cents per ordinary share was declared on February 18, 2013, with a record date of March 15, 2013 and a payment date of March 28, 2013.
| Year ended December 31(1) | 2008 | 2009 | 2010 | 2011 | 2012 | |||||||||||||||
South African cents per ordinary share | ||||||||||||||||||||
First quarter | 100 | |||||||||||||||||||
Second quarter | 50 | 60 | 65 | 90 | 100 | |||||||||||||||
Third quarter | 90 | 50 | ||||||||||||||||||
Fourth quarter | 50 | 70 | 80 | 200 | 50 | |||||||||||||||
Total | 100 | 130 | 145 | 380 | 300 | |||||||||||||||
US cents per ordinary share(2) | ||||||||||||||||||||
First quarter | 11.81 | |||||||||||||||||||
Second quarter | 6.45 | 7.66 | 9.00 | 12.08 | 12.10 | |||||||||||||||
Third quarter | 10.87 | 5.76 | ||||||||||||||||||
Fourth quarter | 5.00 | 9.50 | 11.26 | 27.50 | 5.40 | |||||||||||||||
Total | 11.45 | 17.16 | 20.26 | 50.45 | 35.07 | |||||||||||||||
| (1) | During quarter three of 2011, the Company changed the frequency of dividend payments from half-yearly to quarterly. |
| (2) | Dividends for these periods were declared in South African cents. US dollar cents per share figures have been calculated based on exchange rates prevailing on each of the respective payment dates. |
For further information on the company’s policy on dividend distributions, see “Item 8A: Consolidated statements and other financial information – Annual dividend”.
Exchange rate information
The following table sets forth, for the periods and dates indicated, certain information concerning US dollar/South African rand exchange rates expressed in rands per $1.00. On April 19, 2013, the interbank rate between South African rands and US dollars as reported by OANDA Corporation was R9.17/$1.00.
| Year ended December 31 | High | Low | Year end | Average (1) | ||||||||||||
2008(2) | 11.27 | 6.74 | 9.30 | 8.26 | ||||||||||||
2009(3) | 10.70 | 7.21 | 7.41 | 8.44 | ||||||||||||
2010(3) | 8.08 | 6.57 | 6.64 | 7.34 | ||||||||||||
2011(3) | 8.60 | 6.49 | 8.14 | 7.27 | ||||||||||||
2012(3) | 8.95 | 7.46 | 8.47 | 8.20 | ||||||||||||
2013(3)(4) | 9.31 | 8.47 | 9.17 | 8.96 | ||||||||||||
| (1) | The average rate of exchange on the last business day of each month during the year. |
| (2) | Based on the noon buying rate in New York City for cable transfers as certified for customs purposes by the Federal Reserve Bank of New York. |
| (3) | Based on the interbank rate as reported by OANDA Corporation. |
| (4) | Through to April 19, 2013. |
| Exchange rate information for the months of (1) | High | Low | ||||||
October 2012 | 8.84 | 8.30 | ||||||
November 2012 | 8.95 | 8.63 | ||||||
December 2012 | 8.90 | 8.47 | ||||||
January 2013 | 9.07 | 8.47 | ||||||
February 2013 | 8.99 | 8.81 | ||||||
March 2013 | 9.31 | 8.89 | ||||||
April 2013(2) | 9.23 | 9.08 | ||||||
| (1) | Based on the interbank rate as reported by OANDA Corporation. |
| (2) | Through to April 19, 2013. |
| 3B. | CAPITALIZATION AND INDEBTEDNESS |
Not applicable.
| 3C. | REASONS FOR THE OFFER AND USE OF PROCEEDS |
Not applicable.
| 3D. | RISK FACTORS |
This section describes many of the risks that could affect AngloGold Ashanti. There may however be additional risks unknown to AngloGold Ashanti and other risks, currently believed to be immaterial, that could turn out to be material. Additional risks may arise or become material subsequent to the date of this document. These risks, either individually or simultaneously, could significantly affect the group’s business, financial results and the price of its securities.
Risks related to AngloGold Ashanti’s results of operations and financial condition as an asset portfolioa result of factors that impact the gold mining industry generally.
AngloGold Ashanti seeks to optimize capital deployment by investing only in assets and growth opportunities that offer attractive returns. The company ranks each asset and project as partCommodity market price fluctuations could adversely affect the profitability of its business planning process, both in absolute terms and relative to its peer group, with the aim of:
ensuring that individual assets and projects meet or exceed specified risk-adjusted rates of return;
identifying the strengths and weaknesses of the portfolio, with a particular focus on portfolio risk;
implementing strategies to optimize orebody capability;
applying methods and design to optimize operating performance;
ensuring the application of detailed planning and scheduling, together with the use of best-practice operating methods associated with each asset;
optimizing returns from existing assets and growth opportunities; and
selling those assets that no longer meet the company’s criteria at attractive valuations.
Grow the business
AngloGold Ashanti seeks to further enhance shareholder value by:
Greenfield exploration: building upon its asset portfolio and landholdings to develop new projects, whilst continually reviewing and analyzing potential opportunities;
Brownfield exploration and project development: promoting organic growth and utilizing the existing infrastructural base;
Mergers and acquisitions: selectively pursuing value accretive merger and acquisition opportunities; and
Other commodities: maximizing the value of other commodities within the company’s existing and developing asset portfolio.
Embrace sustainability principlesoperations.
AngloGold Ashanti’s sustainable development framework seeksrevenues are primarily derived from the sale of gold and, to address a numberlesser extent, uranium, silver and sulfuric acid. The company’s current policy is to sell its products at prevailing market prices and not to enter into price hedging arrangements. The market prices for these commodities fluctuate widely. These fluctuations are caused by numerous factors beyond the company’s control. For example, the market price of interlinked issues that are critical to business sustainability. In particular:
gold may change for a variety of reasons, including:
speculative positions taken by investors or traders in gold;
monetary policies announced or implemented by central banks, including the US Federal Reserve;
changes in the demand for gold as an investment or as a result of leasing arrangements;
changes in the demand for gold used in jewellery and for other industrial uses, including as a result of prevailing economic conditions;
changes in the supply of gold from production, divestment, scrap and hedging;
financial market expectations regarding the rate of inflation;
the strength of the US dollar (the currency in which the gold price trades internationally) relative to other currencies;
changes in interest rates;
actual or anticipated sales or purchases of gold by central banks and the International Monetary Fund;
gold hedging and de-hedging by gold producers;
global or regional political or economic events; and
the cost of gold production in major gold producing countries.
The market price of gold has been and continues to be significantly volatile. During 2012, the gold price traded from a low of $1,540 per ounce to a high of $1,790 per ounce. On April 19, 2013, the closing price of gold was $1,404 per ounce. The price of gold is often subject to sharp, short-term changes; for example, during the period from Friday, April 12, 2013 through Monday, April 15, 2013, the price of gold dropped $228 per ounce. While the overall supply of and demand for gold can affect its market price, the considerable size of historical mined (i.e., above ground) stocks of the metal means that these factors typically do not affect the gold price in the same manner or degree as for other commodities. In addition, the shift in demand from physical gold to investment and speculative demand may exacerbate the volatility of the gold price.
During 2012, there appeared to develop a climaterelationship between the central banks and the price of gold with the price falling at the prospect of the end of quantitative easing in some of the main economies.
A sustained period of significant gold price volatility may adversely affect the company’s ability to evaluate the feasibility of undertaking new capital projects, or the continuity of existing operations, or to make other long-term strategic decisions. The use of lower gold prices in reserve calculations and life-of-mine plans could result in material write-downs of the company’s investment in mining properties and increased resource competition, this framework seeksamortization, reclamation and closure charges.
The spot price of uranium has been volatile in past years. During 2012, the price varied between a low of approximately $41 per pound and a high of $53 per pound. On April 19, 2013, the spot price of uranium was $41 per pound. Uranium prices can be affected by several factors, including demand for nuclear reactors, uranium production shortfalls and restocking by utilities. Events like those surrounding the earthquake and tsunami that occurred in Japan in 2011 can also have a material impact on the price of and demand for uranium.
The price of silver has experienced significant fluctuations. From a low of $26 per ounce in January 2012, the price rose steadily to enable countriesreach a high of $37 per ounce in February 2012. By December 2012, the price had dropped to approximately $30 per ounce. Factors affecting the price of silver include investor demand, physical demand for silver bars, industrial and retail off-take, and silver coin minting. On April 19, 2013, the price of silver was $23 per ounce.
If revenue from sales of gold, uranium, silver or sulfuric acid falls below their respective cost of production for an extended period, AngloGold Ashanti may experience losses or be forced to change its dividend payment policies and curtail or suspend some or all of its exploration projects and existing operations. Declining commodities prices may also force a reassessment of the feasibility of a particular project or projects, which could cause substantial delays or interrupt operations until the reassessment can be completed.
Foreign exchange fluctuations could have a material adverse effect on AngloGold Ashanti’s results of operations and financial condition.
Gold is principally a US dollar-priced commodity and most of the company’s revenues are realized in, or linked to, US dollars while production costs are largely incurred in the local currency where the relevant operation is located. Given the company’s global operations and local communitiesforeign exchange regulations, some of its funds are held in local currencies, such as the South African rand, Ghanaian cedi, Brazilian real, Argentinean peso and the Australian dollar.
Exchange rate movements may have a material impact on AngloGold Ashanti’s operating results. For example, the company estimates that a 1 percent strengthening of all of the South African rand, Brazilian real, the Argentinean peso or the Australian dollar against the US dollar will, other factors remaining equal, result in an increase in total cash costs under IFRS of approximately $6 per ounce or approximately 1 percent of the company’s total cash costs. The impact on cash costs determined under US GAAP may be different.
The profitability of operations and the cash flows generated by these operations are significantly affected by fluctuations in input production prices, many of which are linked to the prices of oil and steel.
Fuel, energy and consumables, including diesel, heavy fuel oil, chemical reagents, explosives, tyres, steel and mining equipment consumed in mining operations form a relatively large part of the operating costs and capital expenditure of any mining company.
AngloGold Ashanti has no influence over the cost of these consumables, many of which are linked to some degree to the price of oil and steel.
The price of oil has recently been volatile, fluctuating between $88.40 and $130.57 per barrel of Brent crude in 2012. As of April 19, 2013, the price of oil was at $100.09 per barrel of Brent Crude. AngloGold Ashanti estimates that for each US dollar per barrel rise in the oil price, other factors remaining equal, the total cash costs under IFRS of all its operations increases by approximately $0.90 per ounce. The impact on cash costs determined under US GAAP may be different. The cash costs of certain of the company’s mines, particularly Yatela, Sadiola, Siguiri, Geita, Navachab, Morila, and Cripple Creek & Victor, are most sensitive to changes in the price of oil.
Furthermore, the price of steel has also been volatile. Steel is used in the manufacture of most forms of fixed and mobile mining equipment, which is a relatively large contributor to the operating costs and capital expenditure of a mine. For example, the price of flat hot rolled coil (North American Domestic FOB) steel traded between $590 per tonne and $733 per tonne in 2012. On April 19, 2013, the price of flat hot rolled coil (North American Domestic FOB) was $609 per tonne.
Fluctuations in oil and steel prices have a significant impact on operating costs and capital expenditure estimates and, in the absence of other economic fluctuations, could result in significant changes in the total expenditure estimates for new mining projects or render certain projects non-viable.
Energy cost increases and power fluctuations and stoppages could adversely impact the company’s results of operations and financial condition.
Increasing global demand for energy, concerns about nuclear power, and the limited growth of new supply are impacting the price and supply of energy. The transition of emerging markets to higher energy consumption, carbon taxation as well as unrest and potential conflict in the Middle East, among other factors, could result in increased demand or constrained supply and sharply escalating oil and energy prices.
AngloGold Ashanti’s mining operations are substantially dependent upon electrical power generated by local utilities or by power plants situated at some of its operations. The unreliability of these local sources of power can have a material effect on the company’s operations, as large amounts of power are required for exploration, development, extraction, processing and other mining activities on the company’s properties.
In South Africa, the company’s operations are dependent on electricity supplied by one state-owned power generation company, Eskom. Electricity is used for most business and safety-critical operations that include cooling, hoisting and dewatering. Loss of power can therefore impact production, employee safety and prolonged outages could lead to flooding of workings and ore sterilization. In 2008, Eskom and the South African government declared a national emergency and warned that they could no longer guarantee the availability of electricity due to a national supply shortage blamed on coal supply shortages and unplanned generation-set outages as a result of maintenance backlog and asset age. The entire country went into a program of rolling blackouts and AngloGold Ashanti and other mining companies operating in South Africa were forced in late January until mid-March of 2008 to temporarily suspend mining operations at their mines. In addition, lightning damage to power stations can result in power interruptions at our operations. In this regard, AngloGold Ashanti’s two main operational sites in the West Wits region in South Africa had all main power interrupted between March 13, 2013 and March 15, 2013 after a fire caused by lightning damaged a transformer at a main regional substation. The power supply to AngloGold Ashanti’s South African operations may be curtailed or interrupted again in the future. A warning of the “very high” risk of blackouts was re-issued at the start of 2011 and again in 2012. While a national energy conservation program is in place, Eskom cannot guarantee that there will be no power interruptions and is again facing very tight supply reserve margins in 2013, which we expect to continue at least until the new coal fired Medupi Power Station starts to come on line in early 2014.
Eskom and the National Energy Regulator of South Africa (NERSA) recognize the need to increase electricity supply capacity and a series of tariff increases and proposals have been enacted to assist in the funding of this expansion. In 2010, NERSA approved an annual increase of 24.8 percent for 2010, 25.8 percent for 2011, 25.9 percent for 2012, and 16.0 percent for 2013. The actual increase implemented for 2012 was lowered to 16.09 percent after government intervention, but there can be no assurance as to the existence or nature of any government intervention in the future. In February 2013, NERSA announced that Eskom would be allowed to increase electricity tarriffs at an average yearly rate of 8 percent between 2013 and 2018. This increase is half the 16 percent sought by the utility in its application. As energy represents a large proportion of the company’s operating costs in South Africa, these increases have had, and any future increases will have, a materially adverse impact on the cash costs of its South African operations.
The company has also identified a risk of energy shortages in Argentina and the DRC. Furthermore, all of the company’s mining operations in Ghana depend on hydroelectric power supplied by the state-controlled Volta River Authority (VRA), which is supplemented by thermal power from the Takoradi plant and a smaller unit at Tema. During periods of below average inflows from the Volta reservoir, electricity supplies from the Akosombo Dam, the VRA’s primary generation source, may be curtailed as occurred in 1998, 2006 and the first half of 2007. During periods of limited electricity availability, the grid is subject to disturbances and voltage fluctuations which can damage equipment. Recent disruptions in natural gas supply from Nigeria, via the West Africa Gas Pipeline, has led to some reduction in thermal generation capacity and the use of more expensive light crude oil which is putting upward pressure on power tariffs. In the past, the VRA has obtained power from neighboring Côte d’Ivoire, which has intermittently experienced political instability and civil unrest. AngloGold Ashanti negotiates rates directly with the VRA and the VRA may not agree to a satisfactory rate during future rounds of negotiations.
The company’s mining operations in Guinea, Tanzania and Mali are dependent on power supplied by outside contractors and supplies of fuel are delivered by road. Power supplies have been disrupted in the past, resulting in production losses due to equipment failure.
Increased energy prices could negatively impact operating costs and cash flow of AngloGold Ashanti’s operations.
Global economic conditions could adversely affect the profitability of operations.
AngloGold Ashanti’s operations and performance depend significantly on worldwide economic conditions. The global financial markets have experienced considerable volatility from uncertainty surrounding the level and sustainability of the sovereign debt of various countries. Concerns remain regarding the sustainability of the European Monetary Union and its common currency, the euro, in their current form, as well as the negative impacts of the recent downgrade of the sovereign credit rating of the Republic of South Africa. These conditions and other disruptions to international credit markets and financial systems have caused a loss of investor confidence and resulted in widening credit spreads, a lack of price transparency, increased credit losses and tighter credit conditions. Despite the aggressive measures taken by governments and central banks so far, economic recovery has been extremely slow. A significant risk remains that these measures may not prevent the global economy from falling back into an even deeper and longer lasting recession or even a depression.
A global economic downturn and recession may have follow-on effects on AngloGold Ashanti’s business that include inflationary cost pressures and commodity market fluctuations.
Other effects could, for example, include:
the insolvency of key suppliers or contractors which could result in contractual breaches and in a supply chain breakdown;
the insolvency of one or more joint venture partners which could result in contractual breaches and disruptions at the operations of the company’s joint ventures;
changes in other income and expense which could vary materially from expectations, depending on gains or losses realized on the sale or exchange of financial instruments, and impairment charges that may be incurred with respect to investments;
AngloGold Ashanti’s defined benefit pension fund may not achieve expected returns on its investments, which could require the company to make substantial cash payments to fund any resulting deficits;
a reduction in the availability of credit which may make it more difficult for the company to obtain financing for its operations and capital expenditures or make that financing more costly; and
exposure to the liquidity and insolvency risks of the company’s lenders and customers;
any of which could negatively affect AngloGold Ashanti’s financial results.
Inflation may have a material adverse effect on results of operations.
Many of AngloGold Ashanti’s operations are located in countries that have experienced high rates of inflation during certain periods. It is possible that significantly higher future inflation in the countries in which the company operates may result in an increase in operational costs in local currencies (without a concurrent devaluation of the local currency of operations against the dollar or an increase in the dollar price of gold). This could have a material adverse effect on the company’s results of operations and financial condition. Significantly higher and sustained inflation, with a consequent increase in operational costs, could result in the rationalization of higher cost mines or projects.
Mining companies face many risks related to derive sustainablethe development of mining projects that may adversely affect the company’s results of operations and profitability.
The profitability of mining companies depends partly on the actual costs of developing and operating mines, which may differ significantly from estimates determined at the time the relevant project was approved following completion of its feasibility study. Development of mining projects may also be subject to unexpected problems and delays that could increase the development and operating costs of the relevant project.
AngloGold Ashanti’s decision to develop a mineral property is typically based on the results of a feasibility study. Feasibility studies estimate the expected or anticipated economic benefitsreturns from the project. These estimates are based on assumptions regarding:
future prices of gold, uranium, silver and other metals;
future currency exchange rates;
tonnage, grades and metallurgical characteristics of ore to be mined and processed;
anticipated recovery rates of gold, uranium, silver and other metals extracted from the ore;
anticipated capital expenditure and cash operating costs; and
required return on investment.
Actual cash operating costs, production and economic returns may differ significantly from those anticipated by such studies and estimates. Operating costs and capital expenditure are to a significant extent driven by the cost of commodity inputs consumed in mining, including fuel, chemical reagents, explosives, tyres and steel, and also by credits from by-products, such as silver and uranium. They could also fluctuate considerably as a result of changes in the prices of mining equipment used in the construction and operation of mining projects.
There are a number of uncertainties inherent in the development and construction of a new mine or the extension of an existing mine. In addition to those discussed above, these uncertainties include the:
timing and cost of construction of mining and processing facilities, which can be considerable;
availability and cost of mining and processing equipment;
availability and cost of skilled labor, power, water and transportation;
availability and cost of appropriate smelting and refining arrangements;
applicable requirements and time needed to obtain the necessary environmental and other governmental permits; and
availability of funds to finance construction and development activities.
The remote location of many mining properties, permitting requirements and/or delays, third-party legal challenges to individual mining projects and broader social or political opposition to mining may increase the cost, timing and complexity of mine development and construction. New mining operations could experience unexpected problems and delays during the development, construction, commissioning and commencement of production. AngloGold Ashanti may prove unable to successfully develop the La Colosa and Gramalote projects as well as other potential exploration sites in Colombia due to difficulties that could arise in relation to, for example, social and community opposition, litigation, ore body grades, definition of adequate reserves and resources, and the time taken to prove project feasibility that could result in the expiry of permits. For example, on March 11, 2013, Cortolima, a regional environmental authority in Colombia, issued an injunction against AngloGold Ashanti’s Colombian subsidiary, alleging that the subsidiary was operating without proper permits and was engaging in activity that was harmful to the environment. Furthermore, at around the same period in time, access to an AngloGold Ashanti drilling site was blockaded by residents of a nearby community.
Accordingly, AngloGold Ashanti’s future development activities may not result in the expansion or replacement of current production, or one or more new production sites or facilities may be less profitable than anticipated or may be loss-making. The company’s operating results and financial condition are directly related to the success of its project developments. A failure in the company’s ability to develop and operate mining projects in accordance with, or in excess of, expectations could negatively impact its results of operations, as well as its financial condition and prospects.
Mining companies face uncertainty and risks in exploration, feasibility studies and other project evaluation activities.
AngloGold Ashanti must continually replace Ore Reserve depleted by mining and production to maintain or increase production levels in the long term. This is undertaken by exploration activities that are speculative in nature. The ability of the company to sustain or increase its present levels of gold production depends in part on the success of its projects and it may be unable to sustain or increase such levels. For example, in South Africa, the company experienced declining production rates (1.213 million ounces of gold in 2012, compared with 1.624 million ounces of gold in 2011 and 1.784 million ounces in 2010), principally due to continued safety and associated stoppages, mining flexibility constraints and overall falls in grades. The significant decrease in 2012 was also mainly attributable to the industrial strike action at the company’s South African mines, which resulted in the loss of production of 235,000 ounces of gold.
Feasibility studies and other project evaluation activities necessary to determine the current or future viability of a mining operation are often unproductive. Such activities often require substantial expenditure on exploration drilling to establish the presence, extent and grade (metal content) of mineralized material. AngloGold Ashanti undertakes feasibility studies to estimate the technical and economic viability of mining projects and to determine appropriate mining methods and metallurgical recovery processes. These activities are undertaken to estimate the Ore Reserve.
Once mineralization is discovered, it may take several years to determine whether an adequate Ore Reserve exists, during which time the economic feasibility of the project may change due to fluctuations in factors that affect both revenue and costs, including:
future prices of metals and other commodities;
future foreign currency exchange rates;
the required return on investment as based on the cost and availability of capital; and
applicable regulatory requirements, including environmental, health and safety matters.
Feasibility studies also include activities to estimate the anticipated:
tonnages, grades and metallurgical characteristics of the ore to be mined and processed;
recovery rates of gold, uranium and other metals from the ore; and
capital expenditure and cash operating costs.
These estimates depend on assumptions made on available data. Ore Reserve estimates are not precise calculations and depend on the interpretation of limited information on the location, shape and continuity of the mineral occurrence and on available sampling results. Further exploration and feasibility studies can result in new data becoming available that may change previous Ore Reserve estimates and impact the technical and economic viability of production from the project. Changes in the forecast prices of commodities, exchange rates, production costs or recovery rates may change the economic status of reserves resulting in revisions to previous Ore Reserve estimates. These revisions could impact depreciation and amortization rates, asset-carrying amounts, provisions for closedown, restoration and environmental rehabilitation costs.
AngloGold Ashanti undertakes annual revisions to its Ore Reserve estimates based upon actual exploration and production results, depletion, new information on geology, model revisions and fluctuations in production, economic assumptions and operating and other costs. These factors may result in reductions in Ore Reserve estimates, which could adversely affect life-of-mine plans and consequently the total value of the company’s mining asset base. Ore Reserve restatements could negatively affect the company’s results of operations, by developing mutually-beneficial partnershipsas well as its financial condition and prospects.
The increased overall demand for gold and other commodities, combined with host governments and local communities and participatinga declining rate of discovery of new gold Ore Reserve in recent years, has resulted in the co-designaccelerated depletion of projectsthe existing Ore Reserve across the global gold sector. AngloGold Ashanti therefore faces intense competition for the acquisition of attractive mining properties. From time to time, the company evaluates the acquisition of an Ore Reserve, development properties or operating mines, either as stand-alone assets or as part of companies. AngloGold Ashanti’s decision to acquire these properties has been based on a variety of factors including historical operating results, estimates and assumptions regarding the extent of the Ore Reserve, cash and other operating costs, gold prices, projected economic returns and evaluations of existing or potential liabilities associated with the relevant property and its operations and how these factors may change in future. Other than historical operating results, these factors are uncertain and could have an impact on revenue, cash and other operating costs, as well as the process used to estimate the Ore Reserve.
As a result of these uncertainties, exploration and acquisitions by the company may not result in the expansion or replacement of current production or the maintenance of its existing Ore Reserve net of production or an increase in Ore Reserve. AngloGold Ashanti’s results of operations and financial condition are directly related to the success of its exploration and acquisition efforts and ability to replace or increase the existing Ore Reserve. If the company is not able to maintain or increase its Ore Reserve, its results of operations as well as its financial condition and prospects could be adversely affected.
Mining companies face many risks related to their operations that contributemay adversely impact cash flows and overall profitability.
Gold mining is susceptible to achieving local development goals.events that may adversely impact a mining company’s ability to produce gold and meet production and cost targets. These events include, but are not limited to:
environmental, as well as health and safety incidents during production or transportation resulting in injury, loss of life, or damage to equipment;
ground and surface water pollution;
social or community disputes or interventions;
security incidents;
surface or underground fires or explosions;
electrocution;
falls from heights and accidents relating to mobile machinery, including shaft conveyances and elevators, drilling blasting and mining operations;
labor force disputes and disruptions;
loss of information integrity or data;
activities of illegal or artisanal miners;
shortages in material and equipment;
mechanical failure or breakdowns and ageing infrastructure;
failure of unproven or evolving technologies;
energy and electrical power supply interruptions or rationing;
unusual or unexpected geological formations, ground conditions, including lack of mineable face length, and ore-pass blockages;
water ingress and flooding;
process water shortages;
metallurgical conditions and gold recovery;
unexpected decline of ore grade;
unanticipated increases in gold lock-up and inventory levels at heap-leach operations;
fall-of-ground accidents in underground operations;
cave-ins, sinkholes, subsidence, rock falls, rock bursts, or landslides;
failure of mining pit slopes, heap-leach facilities, water or solution dams, waste stockpiles and tailings dam walls;
legal and regulatory restrictions and changes to such restrictions;
safety-related stoppages;
gold bullion theft;
corruption, fraud and theft;
allegations of human rights abuses;
seismic activity; and
other natural phenomena, such as floods, droughts or weather conditions, potentially exacerbated by climate change.
Seismic activity is of particular concern in underground mining operations, particularly in South Africa due to the extent and extreme depth of mining, and also in Australia and Brazil due to the depth of mining and residual tectonic stresses. Despite modifications to mine layouts and support technology, as well as other technological improvements employed with a view to minimizing the incidence and impact of seismic activity, seismic events have caused death and injury to employees and contractors and may do so again in future, and have in the past and may again result in safety-related stoppages.
Seismic activity may also cause the loss of mining equipment, damage to or destruction of mineral properties or production facilities, monetary losses, environmental damage and potential legal liabilities. As a result, these events may have a material adverse effect on AngloGold Ashanti’s results of operations and financial condition. For example, in early 2011, mining of the Ventersdorp Contact Reef shaft pillar at Tau Tona was suspended following a significant seismic event. New equipment had to be purchased and the shutdown contributed to the decline in the operational output of the mine as compared to the previous year.
In the past, floods have also disrupted the operations of some of the company’s mines. For example, unprecedented heavy rains in February and March 2011 in Australia flooded the Sunrise Dam Gold Mine and forced a temporary shutdown of operations. The flood event impacted underground production for approximately four months and open pit production for approximately six months. Despite the shutdown, full costs were incurred as the mining contractors worked on remedial activities to repair damage and rehabilitate flooded areas. The considerable remedial work required adversely impacted cash costs per ounce and the impact of the flood event and the pit wall failure together significantly reduced planned production at the plant.
Mining companies’ operations are vulnerable to infrastructure constraints.
Mining, processing, development and exploration activities depend on adequate infrastructure. Reliable rail, ports, roads, bridges, power sources, power transmission facilities and water supply are critical to the company’s business operations and affect capital and operating costs. These infrastructure and services are often provided by third parties whose operational activities are outside the control of the company.
Interferences in the maintenance or provision of infrastructure, including unusual weather phenomena, sabotage and social unrest, could impede the company’s ability to deliver its products on time and adversely affect AngloGold Ashanti’s business, results of operations and financial condition.
Establishing infrastructure for the company’s development projects requires among other things, energy, watersignificant resources, identification of adequate sources of raw materials and supplies, and necessary co-operation from national and regional governments, none of which can be assured.
AngloGold Ashanti has operations or potential development projects in countries where government-provided infrastructure may be inadequate and regulatory regimes for access to land,infrastructure may be uncertain, which could adversely impact the company seeksefficient operation and expansion of its business. AngloGold Ashanti may not secure and maintain access to manage theseadequate infrastructure in the future, or it may not do so on reasonable terms.
Mining companies face strong competition.
The mining industry is competitive in all of its phases. AngloGold Ashanti competes with other mining companies and individuals for specialized equipment, components and supplies necessary for exploration and development, for mining claims and leases on exploration properties and for the acquisition of mining assets. These competitors may have greater financial resources, operational experience and technical capabilities than AngloGold Ashanti. Competition may increase AngloGold Ashanti’s cost of acquiring suitable claims, properties and assets.
Mining companies are subject to extensive health and safety laws and regulations.
Gold mining operations are subject to extensive health and safety laws and regulations in a way that limits any adverse impact on community relationshipsevery jurisdiction they operate in. These laws and production costs.
The company seeksregulations, along with international and industry standards, designed to protect and improve the safety and health of its employees.employees, require extensive compliance measures.
The companyFrom time to time, new or updated health and safety laws, regulations and standards are introduced. Should compliance with these require a material increase in expenditure or material changes or interruptions to operations or production, including as a result of any failure to comply with applicable regulations, the company’s results of operations and financial condition could be adversely affected. Furthermore, AngloGold Ashanti is committed to respecting human rights as reflectedimplementing an enhanced safety program, which could result in its implementation of the voluntary principles on security and human rights (VPSHR) in its security management strategies as well as the development of a human rights frameworkadditional costs for the business based on the UN guidelines on business and human rights.
As effective stakeholder engagement is required to support the company’s management of its sustainability initiatives, the company continues to work on devising and implementing a company-wide engagement standard to improve performance in this area.
The implementation of this business strategy has resulted in the significant restructuring of the company’s portfolio of operations as well as the strengthening of the company’s balance sheet and created the operating and financial foundation to achieve production growth. In addition, operating cash flow has increased markedly following the elimination of the hedge book, the rise in gold prices, as well as the implementation of Project ONE.
Project ONE, which the company also developed in 2008, consists of two integrated initiatives: the System for People (SP) and the Business Process Framework (BPF). The SP is a managerial effectiveness system focused on ensuring that individuals at each level of the organization are held directly accountable for their work responsibilities. The BPF defines business expectations, sets operational targets and seeks to create operating methodologies that can reduce volatility and increase average productivity. Since deploying a successful pilot project at South Africa’s Mponeng mine in 2009, AngloGold Ashanti has gradually rolled out Project ONE across all of its operations.company.
In 2008, AngloGold Ashanti also began developing and implementing its Safety Transformation, an initiative that seeks to embed the concepts of physical risk, health and wellbeing into both components of Project ONE. More recently, in 2010, the board of directors approved a policy for the transformation and localization of labor, which aims to take into account the legislative framework of host countries, as well as the company’s own values, in order to redress historical imbalances, promote gender equality and employment of local citizens at all levels, as well as the equitable employment of people with disabilities.
AngloGold Ashanti reviews its business strategy regularly to determine progress in its implementation against the backdrop of a dynamic operating and regulatory environment.
Achieving strategic and performance objectives will be impacted by any portfolio changes and is subject to a number of risks, uncertainties and other factors, some of which are beyond the company’s control and any of which may prevent or delay AngloGold Ashanti from achieving its stated goals. Certain of these risks, uncertainties and other factors are described in “Item 3D.: Risk factors”. See also “Note regarding forward-looking statements”.
THE REGULATORY ENVIRONMENT ENABLING ANGLOGOLD ASHANTI TO MINE
AngloGold Ashanti’s rights to own and exploit mineral reserves and deposits are governed by the laws and regulations of the jurisdictions in which AngloGold Ashanti operates, the government enforces compulsory shutdowns of operations to enable investigations into the cause of accidents. Certain of the company’s operations have been temporarily suspended for safety reasons in the past. In South Africa, in particular, so-called ‘Section 54 safety stoppages’ have become a significant issue. In 2011, the Inspector of Mines ordered the shutdown of entire mines in cases of relatively minor violations, which had a material impact on production at these mineral properties lie.mines. In particular, the Inspector issued Kopanang eleven Section 54 notices during 2011. Each notice resulted in Kopanang suspending operations either fully or partially in order to comply with the inspector’s recommendations on safety.
ThereSafety-related stoppages resulted in the direct loss of 72,900 and 72,400 ounces of gold production during 2011 and 2012, respectively, in South Africa.
A working group comprised of the inspectorate, the mining industry and organized labor has been formed to address the trend of increasing safety stoppages in South Africa. However, the working group may not agree on how to address this issue and the number of safety stoppages may continue or even increase in the future.
AngloGold Ashanti’s reputation could be damaged by any significant governmental investigation or enforcement of health and safety laws, regulations or standards. Any of these factors could have a material adverse effect on the company’s results of operations and financial condition.
Mining companies are increasingly required to operate in a sustainable manner and to provide benefits to affected communities. Failure to comply with these requirements can result in legal suits, additional operational costs, investor divestment, loss of ‘social licence to operate’, and adversely impact mining companies’ financial condition.
As a result of public concern about the perceived ill effects of economic globalization, businesses in general and large multinational mining corporations such as AngloGold Ashanti in particular face increasing public scrutiny of their activities.
These businesses are under pressure to demonstrate that while they seek a satisfactory return on investment for shareholders, human rights are respected and other social partners, including employees, host communities and more broadly the countries in which they operate, also benefit from their commercial activities. Such pressures tend to be particularly focused on companies whose activities are perceived to have, or have, a high impact on their social and physical environment. The potential consequences of these pressures and the adverse publicity in cases where companies are believed not to be creating sufficient social and economic benefit may result in additional operating costs, reputational damage, active community opposition, allegations of human rights abuses, legal suits and investor withdrawal.
Existing and proposed mining operations are often located at or near existing towns and villages, natural water courses and other infrastructure. As the impacts of dust generation, waste storage, water pollution or shortage, in particular, may be immediate and directly adverse to those communities, poor environmental management practices, or adverse changes in the supply or quality of water can result in community protest, regulatory sanctions or ultimately in the withdrawal of community and government support for company operations. For example, opposition to mining activity in the Tolima province of Colombia, which hosts the La Colosa deposit, has centered on the perception that large-scale mining activity will have a detrimental impact on the region’s river systems.
Mining operations must be designed to minimize their impact on such communities and the environment, either by changing mining plans to avoid such impact, by modifying operations, or by relocating the affected people to an agreed location. Responsive measures may also include the full restoration of livelihoods of those impacted.
In addition, as AngloGold Ashanti has a long history of mining operations in certain regions, issues may arise regarding historical as well as potential future environmental or health impacts in those areas. For example, certain parties, including non-governmental organizations, community groups and institutional investors, have raised concerns about surface and groundwater quality, among other issues, in the area surrounding the company’s Obuasi and Iduapriem mines in Ghana, including potential impacts to local rivers and wells used for water from heavy metals, arsenic and cyanide as well as sediment and mine rock waste.
Disputes with surrounding communities may also affect mining operations, particularly where they result in restrictions of access to supplies and to mining operations. The miners’ access to land may be subject to the rights or asserted rights of various community stakeholders, including indigenous people. Access to land and land use is of critical importance to the company for exploration and mining, as well as for ancillary infrastructure. In some cases, certain restrictionsAngloGold Ashanti has had difficulty gaining access to new land because of perceived poor community compensation practices. For example, compensation remains a significant area of concern in Siguiri in Guinea. In 2011, a violent community protest interrupted operations for three days, which contributed to the project’s decline in production as compared to 2010. Delays in projects attributable to a lack of community support can translate directly into a decrease in the value of a project or into an inability to bring the project to production.
The cost of measures and other issues relating to the sustainable development of mining operations could place significant demands on personnel resources, could increase capital and operating costs and could have an adverse impact on AngloGold Ashanti’s reputation, results of operations and financial condition.
Mining companies are subject to extensive environmental laws and regulations.
Mining companies are subject to extensive environmental laws and regulations in the various jurisdictions in which they operate in addition to international standards. These regulations and standards establish limits and conditions on a miner’s ability to conduct its operations and govern, among other things, extraction, use and conservation of water resources; air emissions (including dust control) and water treatment and discharge; regulatory and community reporting; clean-up of contamination; worker safety and community health; and the generation, transportation, storage and disposal of solid and hazardous wastes, such as acids, radioactive materials, and mine tailings.
The cost of compliance with environmental laws and regulations is expected to continue to be significant to AngloGold Ashanti. AngloGold Ashanti could incur fines, penalties and other sanctions, clean-up costs, and third-party claims for personal injury or property damages, suffer reputational damage, or be required to install costly pollution control equipment or to modify or suspend operations, as a result of actual or alleged violations of environmental laws and regulations. In addition, unknown environmental hazards may exist on the company’s properties which may have been caused by previous owners or operators.
For example, in 2010 AngloGold Ashanti’s Obuasi mine in Ghana suspended gold processing operations for five days to implement a revised water management strategy aimed at reducing contaminants contained in its discharge. Brief stoppages after environmental incidents, such as pipeline failures, have occurred more recently at that mine. Furthermore, following a temporary suspension of operations at the Iduapriem mine, the company, with the approval of the Ghana Environmental Protection Agency, constructed an interim tailings storage facility for tailings deposition for a year while a new tailings storage facility was being constructed. The company continues to seek to make improvements in water quality management to reduce the risk of unpermitted and/or accidental discharges and, in addition, it is currently investigating allegations of impacts on water quality in the area of these mines.
Failure to comply with applicable environmental laws and regulations may also result in the suspension or revocation of operating permits. AngloGold Ashanti’s ability to independently move assets out of certain countriesobtain and maintain permits and to successfully operate in which it has operations,particular communities may be adversely impacted by real or transfer assets within the group, without the prior consent of the local government or minority shareholders involved. See “Item 10D.: Exchange controls” for details.
For more informationperceived effects on the risksenvironment or human health and uncertaintiessafety associated with AngloGold Ashanti’s or other mining rights, see “Item 3D.companies’ activities.
For example, in Colombia, various plaintiffs, including associations that represent local communities, have brought legal proceedings against AngloGold Ashanti Colombia S.A. (AGAC) alleging that AGAC has violated applicable environmental laws in connection with the La Colosa project. If the plaintiffs were to prevail, AGAC’s three core concession contracts relating to the La Colosa project may be cancelled, AGAC would be required to abandon the La Colosa project and all other existing mining concession contracts and pending proposals for new mining concession contracts of AGAC, though not those of other companies of the AngloGold Ashanti group operating in Colombia. In addition, AGAC would be banned from doing business with the Colombian government for a period of five years. See Item 8A.: Risk factors”,– “Legal proceedings”.
Environmental laws and regulations are continually changing and are generally becoming more stringent. Changes to AngloGold Ashanti’s environmental compliance obligations or operating practices could adversely affect the company’s rate of production and revenue. Variations in laws and regulations, assumptions made to estimate liabilities, standards or operating procedures, more stringent emission or pollution thresholds or controls, or the occurrence of unanticipated conditions, may require operations to be suspended or permanently closed, and could increase AngloGold Ashanti’s expenses and provisions. These expenses and provisions could adversely affect the company’s results of operations and financial condition.
For example, the use of sodium cyanide in metallurgical processing is under increasing environmental scrutiny and is prohibited for certain jurisdictions. As there are few, if any, effective substitutes in extracting gold from the ore, any ban or material restrictions on the use of sodium cyanide in mining operations in the jurisdictions where AngloGold Ashanti conducts its operations could adversely affect the company’s results of operations and financial condition. In addition, leaks or discharges of sodium cyanide or other hazardous materials could result in liabilities for clean-up or personal injury that may not be covered by insurance.
AngloGold Ashanti’s operations are heavily dependent upon access to substantial volumes of water for use in the mining and extractive processes and typically are subject to water-use permits that govern usage and require, among other things, that mining operations maintain certain water quality upon discharge. Water quality and usage are areas of concern globally, such as with respect to the company’s mining operations in Ghana and South Africa and its exploration projects in Colombia, where there is significant potential environmental and social impact and a high level of stakeholder scrutiny. Any failure by the company to secure access to suitable water supplies, or achieve and maintain compliance with applicable requirements of the permits or licenses, could result in curtailment or halting of production at the affected operation. Incidents of water pollution or shortage can, in extreme cases, lead to community protest and ultimately to the withdrawal of community and government support for our operations. Water scarcity has been identified as a significant risk at AngloGold Ashanti’s US operation in particular. Production at the Cripple Creek & Victor Gold Mining Company’s Cresson mine continued to be affected by a severe drought in 2011 and 2012. The lack of water reduced percolation through the heap-leach pad, which curtailed production and productivity.
Mining and mineral processing operations generate waste rock and tailings. The impact of dust generation, breach, leak, or failure of a waste rock or tailings storage facility, can be significant. An incident at AngloGold Ashanti’s operations could lead to, among others, obligations to remediate environmental contamination and claims for property damage and personal injury from adjacent communities. Incidents at other companies’ operations could result in governments tightening regulatory requirements and restricting mining activities.
In addition, mining companies are required by law to close their operations at the end of the mine life and rehabilitate the lands mined. Estimates of total ultimate closure and rehabilitation costs for gold mining operations are significant and based principally on life-of-mine profiles, changing inflation and discount rate assumptions, changing designs of tailing storage facilities and current legal and regulatory requirements that may change materially. Environmental liabilities are accrued when they become known, probable and can be reasonably estimated. Increasingly, regulators are seeking security in the form of cash collateral or bank guarantees in respect of environmental obligations, which could have an adverse impact on AngloGold Ashanti’s financial condition.
AngloGold Ashanti’s discounted closure liability was US$758 million as at December 31, 2012 compared with US$653 million as at December 31, 2011. The reasons for the change were new damage from current mining operations, new damage from building of new mining areas, the acquisition of Mine Waste Solutions, changes in
estimates for new life of mine calculations and changes in discount rates. Costs associated with rehabilitating land disturbed by mining processes and addressing environmental, health and community issues are estimated and financial provision made based upon current available information. Estimates may, however, be insufficient and further costs may be identified at any stage that may exceed the provisions that AngloGold Ashanti has made. Any underestimated or unidentified rehabilitation costs would reduce earnings and could materially and adversely affect the company’s asset values, earnings and cash flows.
Compliance with emerging climate change regulations could result in significant costs and climate change may present physical risks to a mining company’s operations.
Greenhouse gases (GHGs) are emitted directly by AngloGold Ashanti’s operations, as well as by external utilities from which AngloGold Ashanti purchases power. Currently, a number of international and national measures to address or limit GHG emissions, including the Kyoto Protocol, the Copenhagen Accord and the Durban Platform, are in various phases of discussion or implementation in the countries in which the company operates. In particular, the Durban Platform commits all parties to the conference to develop a global mitigation regime which could take effect in 2020, with the specific terms of that legally binding accord, including individual targets, to be finalized by 2015. These, or future, measures could require AngloGold Ashanti to reduce its direct GHG emissions or energy use or to incur significant costs for GHG emissions permits or taxes or have these costs or taxes passed on by electricity utilities which supply the company’s operations. AngloGold Ashanti also could incur significant costs associated with capital equipment, GHG monitoring and reporting and other obligations to comply with applicable requirements. For example, on July 1, 2012, the Australian Government introduced a carbon tax on GHG emissions. It also plans to implement an emissions trading scheme beginning in July 2015. Other countries, including South Africa, Brazil and the United States, have passed or are considering GHG trading or tax schemes, and/or other regulation of GHG emissions, although the precise impact on AngloGold Ashanti’s operations cannot yet be determined.
In addition, AngloGold Ashanti’s operations could be exposed to a number of physical risks from climate change, such as changes in rainfall rates, rising sea levels, reduced water availability, higher temperatures and extreme weather events. Events or conditions such as flooding or inadequate water supplies could disrupt mining and transport operations, mineral processing and rehabilitation efforts, create resource shortages or damage the company’s property or equipment and increase health and safety risks on site. Such events or conditions could have other adverse effects on the company’s workforce and on the communities around its mines, such as an increased risk factor entitled “AngloGoldof food insecurity, water scarcity and prevalence of disease.
Compliance with ‘conflict materials’ and ‘responsible gold’ legislation and standards could result in significant costs.
There are ever more stringent standards relating to ‘conflict minerals’ and ‘responsible’ gold that include the: US Dodd-Frank Act; World Gold Council Conflict Free Gold Standard; Organization for Economic Cooperation and Development Due Diligence Guidelines for Responsible Supply Chain of Minerals from Conflict-Affected and High-Risk Areas; and London Bullion Market Association Responsible Gold Guidance.
Any such legislation and standards may result in significant costs to ensure and demonstrate compliance, and difficulties in the sale of gold emanating from certain areas. The complexities of the gold supply chain, especially as they relate to ‘scrap’ or recycled gold, and the fragmented and often unregulated supply of artisanal and small-scale mined gold are such that there may be significant uncertainties at each stage in the chain as to the provenance of the gold, and as a result of uncertainties in the process, the costs of due diligence and audit, or the reputational risks of defining their product or a constituent part as containing a ‘conflict mineral’ would be too burdensome for the company’s customers. Accordingly, manufacturers may decide to switch supply sources or to substitute gold with other minerals not covered by the initiatives. This could have a material negative impact on the gold industry, including on AngloGold Ashanti’s financial results.
Mining operations and projects are vulnerable to supply chain disruption with the result that operations and development projects could be adversely affected by shortages of, as well as the lead times to deliver, strategic spares, critical consumables, mining equipment or metallurgical plant.
AngloGold Ashanti’s operations and development projects could be adversely affected by both shortages and long lead times to deliver strategic spares, critical consumables, mining equipment and metallurgical plant. Import restrictions, such as those introduced by the Argentine government in 2011, can also delay the delivery of parts and equipment. In the past, the company and other gold mining companies experienced shortages in critical consumables, particularly as
production capacity in the global mining industry expanded in response to increased demand for commodities. AngloGold Ashanti has also experienced increased delivery times for these items. Shortages have resulted in unanticipated price increases and production delays and shortfalls, resulting in a rise in both operating costs and in the capital expenditure necessary to maintain and develop mining operations.
Individually, AngloGold Ashanti and other gold mining companies have limited influence over manufacturers and suppliers of these items. In certain cases there are a limited number of suppliers for certain strategic spares, critical consumables, mining equipment or metallurgical plant who command superior bargaining power relative to the company. The company could at times face limited supply or increased lead time in the delivery of such items. For example, during 2012, supply of caustic soda was delayed in the Continental Africa Region. In addition, the unreliability of oxygen and lime supply similarly affected production at the Vaal River and West Wits surface operations in South Africa throughout 2011 and poor availability of drill rigs, heavy machinery and fleet equipment hampered underground drilling and overall operational performance at the Serra Grande mine in Brazil in 2011.
The company’s procurement policy is to source mining and processing equipment and consumables from suppliers that meet its corporate values and ethical standards although risk remains around the management of ethical supply chains. In certain locations, where a limited number of suppliers meet these standards, additional strain is placed on the supply chain, thereby increasing the cost of supply and delivery times.
Furthermore, supply chains and rates can be impacted by natural disasters, such as earthquakes, extreme weather patterns and climate change, as well as other phenomena that include unrest, strikes, theft and fires. For example, a three-week transport strike in 2012 delayed the supply of consumables in South Africa. Potential supply chain disruption in Mali, as a result of the coup d’état and subsequent state of emergency, has been avoided to date by well managed consumable stock holding. Potential gold doré export disruptions at Geita, the result of an attempted gold heist, and in Mali, following the closure of Bamako International Airport, were minimized with the introduction of alternative transportation arrangements. In February 2013, a fire destroyed the heavy mining equipment stock of spares and components at the Geita gold mine. If AngloGold Ashanti experiences shortages, or increased lead times in the delivery of strategic spares, critical consumables, mining equipment or processing plant, the company might have to suspend some of its operations and its results of operations and financial condition could be adversely impacted.
Diversity in interpretation and application of accounting literature in the mining industry may impact reported financial results.
The mining industry has limited industry-specific accounting literature. As a result, there is diverse interpretation and application of accounting literature on mining specific issues. AngloGold Ashanti, for example, capitalizes drilling and costs related to defining and delineating a residual mineral deposit that has not been classified as a ‘Proven and Probable Reserve’ at a development project or production stage mine. Some companies, however, expense such costs.
As and when this diverse interpretation and application is addressed, the company’s reported results could be adversely impacted should the adopted interpretation differ from the position it currently follows.
Failure to comply with laws, regulations, standards, contractual obligations whether following a breach or breaches in governance processes or fraud, bribery and corruption may lead to regulatory penalties, loss of licences or permits, and loss of reputation.
Since AngloGold Ashanti operates globally in multiple jurisdictions and with numerous and complex frameworks, its governance and compliance processes may not prevent potential breaches of law, accounting principles or other governance practices.
AngloGold Ashanti’s Code of Business Principles and Ethics, among other policies, standards and guidance, and training thereon may not prevent instances of unethical or unlawful behaviour, including bribery or corruption, nor guarantee compliance with legal and regulatory requirements, and breaches may not be detected by management.
Sanctions for failure by the company or others acting on its behalf to comply with these laws, regulations, standards and contractual obligations could include fines, penalties, imprisonment of officers, litigation, and loss of operating licences or permits, suspensions of operations, and may damage the company’s reputation. Such sanctions could have a material adverse impact on the company’s financial condition and results of operations.
Breaches in information technology security and governance process may adversely impact business activities.
AngloGold Ashanti maintains global information technology and communication networks and applications to support its business activities. Information technology security processes may not prevent future malicious actions, denial-of-service attacks, or fraud, resulting in corruption of operating systems, theft of commercially sensitive data, misappropriation of funds and business and operational disruption. Material system breaches and failures could result in significant interruptions that could in turn affect AngloGold Ashanti’s operating results and reputation.
Risks related to AngloGold Ashanti’s results of operations and financial condition as a result of factors specific to the company and its operations
AngloGold Ashanti removed the last of its gold hedging instruments and long-term sales contracts exposing the company to potential gains from subsequent commodity price increases but exposes it entirely to subsequent commodity price decreases.
AngloGold Ashanti removed the last of its gold hedging instruments in October 2010 to provide greater participation in a rising gold price environment. As a result, AngloGold Ashanti no longer has any protection against declines in the market price of gold.
A sustained decline in the price of gold could adversely impact the company’s operating results and its financial condition.
Any downgrade of credit ratings assigned to AngloGold Ashanti’s debt securities could increase future interest costs and adversely affect the availability of new financing.
An actual or expected negative development of AngloGold Ashanti’s results of operations or cash flows, country risk, financial metrics, or an increase in net debt position could result in the deterioration of the company’s credit ratings. AngloGold Ashanti’s ratings are influenced by the location of its domicile and its operations. Following the downgrade of South Africa’s sovereign debt rating as a result of strikes, social tension and policy uncertainty in South Africa, AngloGold Ashanti was placed on “credit watch negative” by Standard & Poor’s on October 17, 2012. On December 10, 2012, Standard & Poor’s affirmed the investment grade rating of the company’s publicly traded debt, but warned that it could lower the rating in the future.
Any such downgrade by ratings agencies could increase the cost of capital, reduce the investor base and negatively and materially affect AngloGold Ashanti’s business, results of operations and financial condition.
Labor disruptions could have a material adverse effect on AngloGold Ashanti’s results of operations and financial condition.
AngloGold Ashanti employees in South Africa, Ghana, Guinea and Argentina, are highly unionized. Trade unions, therefore, have a significant impact on the company’s labor relations, as well as on social and political reforms, most notably in South Africa. There is a risk that strikes or other types of conflict with unions or employees may occur at any of the company’s operations, particularly where the labor force is unionized or there is inter-union rivalry. Labor disruptions may be used to advocate labor, political or social goals in the future. For example, labor disruptions may occur in sympathy with strikes or labor unrest in other sectors of the economy and for political goals. Labor unrest in South Africa can also be fuelled by migrant labor conditions and mine worker debt levels. Furthermore, such labor disruptions may themselves affect or be perceived to affect local political and social stability. Acts or vandalism affecting mines and mine equipment are possible during periods of labor unrest.
For example, following a wave of labor unrest and unprotected strike action that took place throughout the South African mining, transport and agricultural sectors since early August 2012, workers from AngloGold Ashanti’s Kopanang mine, three West Wits mines and the Vaal River region’s other operations engaged in unprotected strikes in September 2012. More than 100,000 miners were involved in the strikes across the mining sector during the last four months of 2012. Workers at AngloGold Ashanti mines in South Africa have also staged sit-ins which prompted the company to suspend operations at some of its mines. These work stoppages pose significant safety risks and operating challenges. The protracted period of inactivity caused by the strike, coupled by the depth of the affected mines, has complicated the consequent ramping up of production following the termination of the strikes and has resulted in a lengthened ramp-up period to ensure employee safety. The unprotected strike action at the South African operations had an adverse impact
on the company’s third quarter results and significantly adversely impacted its fourth quarter results. The company estimates that the unprotected strike action cost approximately 235,000 ounces in lost production due to the work stoppages and the slow ramp-up to full production.
Lower production and payroll increases resulting from the labor disruptions have adversely impacted the financial performance of all South African operations, threatening viability in some cases and similar disruptions in the future may have a material adverse effect on the company’s results of operations and financial condition. For example, subsequent to the 2012 strikes, AngloGold Ashanti, along with its major gold-producing peers in South Africa, increased the entry-level pay of employees; established a new pay category for equipment operators; provided an allowance for rock-drill operators; and increased pay by 2 percent for most categories of workers. The net impact of the settlement on the payroll cost for AngloGold Ashanti is $16 million per annum.
Increased labor costs could have a material adverse effect on AngloGold Ashanti’s results of operations and financial condition.
Labor costs represent a substantial proportion of the company’s total operating costs and at many operations, including its South African, Ghanaian and Tanzanian operations, constitute the company’s single largest component of operating costs. Failing to obtain any simultaneous increase in productivity, any change to the company’s wage agreements or other factors that could increase labor costs may have a material adverse effect on AngloGold Ashanti’s results of operations and financial condition. In 2012, the cost of salaries and wages increased by 7 percent over 2011 levels.
In South Africa, the established practice is to negotiate wages and conditions of employment with the unions every two years through the Chamber of Mines of South Africa. South African employment law sets out minimum terms and conditions of employment for employees, which form the benchmark for all employment contracts. As at December 31, 2012, approximately 62 percent of the company’s workforce, excluding contractors, or approximately 52 percent of its total workforce was located in South Africa. At present, the mining unions and gold mining companies are in the second year of this two-year wage agreement, with the latest increases (ranging from 8 percent to 10 percent) awarded to the workforce in July 2012 and additional improvements to the current pay structure offered to workers on October 18, 2012. Further negotiations on this agreement are expected in 2013, which may result in an increase in labor actions. In addition, any new agreement could result in increased labor costs for the company.
AngloGold Ashanti’s results may be further impaired if it incurs penalties for failing to meet standards set by labor laws regarding workers’ rights or incurs costs complying with new labor laws, rules and regulations. For example, employment law in South Africa imposes monetary penalties for neglecting to report to government authorities on progress made towards achieving employment equity in the workplace. Ghanaian law also contains broad provisions requiring mining companies to recruit and train Ghanaian personnel and to use the services of Ghanaian companies. In Australia, the federal government has recently introduced a new industrial relations system that includes ‘good faith bargaining’ obligations for employers, fewer restrictions on the content of collective agreements and an enhanced role for union officials as bargaining representatives, parties to agreements and participants in dispute resolution. Penalties and compliance costs, as well as increased costs due to laws and regulations less favourable to employers, could have a material adverse effect on the company’s results of operations and financial condition.
AngloGold Ashanti’s mining rights in the countries in which it operates could be altered, suspended or canceledcancelled for a variety of reasons, including breaches in its obligations in respect of its mining rights”rights.
AngloGold Ashanti’s right to own and exploit Mineral Reserves and deposits is governed by the laws and regulations of the jurisdictions in which the mineral properties are located. Currently, a significant portion of the company’s Mineral Reserves and deposits are located in countries where mining rights could be suspended or cancelled should it breach its obligations in respect of the acquisition and exploitation of these rights.
In each of the countries in which AngloGold Ashanti operates, the formulation or implementation of government policies on certain issues may be unpredictable. This may include changes in laws relating to mineral rights and ownership of mining assets and the right to prospect and mine, and in extreme cases, nationalization, expropriation or nullification of existing concessions, licenses, permits, agreements and contracts. In May 2012, for example, the Argentine government nationalized the oil company Yacimientos Petrolíferos Fiscales (YPF) by expropriating 51 percent of the shares from the majority Spanish shareholder.
Any existing and new mining and exploration operations and projects are subject to various national and local laws, policies and regulations governing the ownership and the right to prospect or mine or develop proposed projects. For more details on the risks surrounding ownership of mining assets, see “– Title to AngloGold Ashanti’s properties may be uncertain and subject to challenge” and “– AngloGold Ashanti’s Mineral Reserve, deposits and mining operations are located in countries that face political, economic and security risks that may affect both the terms of its mining concessions, as well as its ability to conduct operations in certain countries”.
Project implementation delays could result in licences not being renewed and the loss of mining rights. Some of AngloGold Ashanti’s mining concessions, authorizations, licences and permits are subject to expiry, limitations on renewal and to various other risks and uncertainties. For example, the company’s license to mine at the Mongbwalu concession in the DRC is up for renewal in 2014, but the company must seek renewal a year in advance of the license’s expiration. The company may not be successful in the renewal process or in retaining the license on the same terms. If the company is unsuccessful in the renewal process, it will need to record an impairment. In October 2012, the DRC announced a proposed overhaul of the DRC’s mining code, which could affect the company’s ability to renew the license or its terms. This overhaul is still in progress.
If AngloGold Ashanti is not able to obtain or maintain necessary permits, authorizations or agreements to prospect or mine or to implement planned projects, or continue its operations, or comply with all laws, regulations or requirements, or do so within time-frames that make such plans and operations economically viable, or if the laws impacting the company’s ownership of its mineral rights, or the right to prospect or mine change materially, or should governments increase their ownership in the mines or nationalize them, AngloGold Ashanti’s results of operations and financial condition could be adversely affected.
Title to AngloGold Ashanti’s properties may be uncertain and subject to challenge.
AngloGold Ashanti has operations in several countries where ownership of land is uncertain and where disputes may arise in relation to ownership. Certain of the company’s properties may be subject to the rights or the asserted rights of various community stakeholders, including indigenous people. The presence of those stakeholders may have an impact on AngloGold Ashanti’s ability to develop or operate its mining interests. For example, in Australia, the Native Title Act (1993) provides for the establishment and recognition of native title under certain circumstances. In South Africa, the Extension of Security of Tenure Act (1997) and the Restitution of Land Rights Act (1994) provide for various landholding rights. Such legislation is complex, difficult to predict and outside of the company’s control, and could therefore negatively affect the business results of new or existing projects. Where consultation with stakeholders is statutorily or otherwise mandated, relations may not remain amicable and disputes may lead to reduced access to properties or delays in operations.
Title to the company’s properties, particularly undeveloped ones, may also be defective or subject to challenge. Title insurance generally is not available, and title review does not necessarily preclude third parties from contesting ownership. Where surveys have not been conducted, the precise area and location of the company’s claims may be in doubt. Accordingly, AngloGold Ashanti’s mineral properties may be subject to prior unregistered liens, agreements, transfers or claims, including native land claims, and title may be affected by, among other things, undetected defects.
AngloGold Ashanti may experience unforeseen difficulties, delays or costs in successfully implementing its business strategy and projects, including any cost-cutting initiatives, and any such strategy or project may not result in the anticipated benefits.
The successful implementation of the company’s business strategy and projects depends upon many factors, including those outside its control. For example: the successful management of costs will depend on prevailing market prices for input costs; the ability to grow the business will depend on the successful implementation of the company’s existing and proposed project development initiatives and continued exploration success, as well as on the availability of attractive merger and acquisition opportunities, all of which are subject to the relevant mining and company specific risks as outlined in these risk factors.
AngloGold Ashanti is in the process of implementing initiatives relating to strategic alignment, portfolio review, restructuring and cost-cutting, including in connection with the consolidation of its business activities and assets. Any future contribution of these measures to profitability will be influenced by the actual savings achieved and by the company’s ability to sustain these ongoing efforts. Strategic alignment, restructuring and cost-cutting initiatives may involve various risks, including, for example, labor unrest and operating licence withdrawal. The risk is highest in South Africa, given recent calls for withdrawal of mining licences for ‘mothballed shafts’ and hostile reaction to proposed
mining industry retrenchments. In addition, these measures may not be implemented as planned; turn out to be less effective than anticipated; only become effective later than anticipated; or not be effective at all. Any of these outcomes, individually or in combination, may adversely impact the company’s business, results of operations and financial condition.
AngloGold Ashanti’s business strategy also includes divesting activities in some business areas and strengthening others, including through mergers and acquisitions. With respect to dispositions, AngloGold Ashanti may not be able to divest some of its activities as planned or to obtain all of the required approvals, and the divestitures that are carried out could have a negative impact on its business, results of operations, financial condition and reputation.
AngloGold Ashanti may also prove unable to deliver on production targets, including in potentially critical areas, such as the Obuasi turnaround plan in Ghana, as well as on the timely, cost-effective and successful execution of key capital projects, including at the Tropicana project in Australia, the Kibali project in the DRC, and with regard to the implementation of the company’s new Enterprise Resource Planning (ERP) system. For more details on the risks surrounding the ERP implementation, see the section entitled – “The implementation of an integrated ERP system could have an adverse effect on AngloGold Ashanti’s results of operations and financial condition.”
Unforeseen difficulties, delays or costs may adversely affect the successful implementation of AngloGold Ashanti’s business strategy and projects, and such strategy and projects may not result in the anticipated benefits.
Any acquisition or acquisitions that AngloGold Ashanti may complete may expose the company to new geographic, political, legal, social, operating, financial and geological risks.
AngloGold Ashanti may pursue the acquisition of producing, development and advanced stage exploration properties and companies. Any such acquisition may change the scale of the company’s business and operations and may expose it to new geographic, geological, political, social, operating, financial, legal, regulatory and contractual risks. For example: there may be a significant change in commodity prices after the company has committed to complete the transaction and established the purchase price or share exchange ratio; a material ore body may prove below expectations; AngloGold Ashanti may have difficulty integrating and assimilating the operations and personnel of any acquired companies, realizing anticipated synergies and maximizing the financial and strategic position of the combined enterprise, and maintaining uniform standards, policies and controls; the integration may disrupt the company’s ongoing business and its relationships with employees, suppliers and contractors; and the acquisition may divert management’s attention from AngloGold Ashanti’s day-to-day business. Furthermore, the company operates and acquires businesses in different countries, with different regulatory and operating cultures, which may exacerbate the risks described above. In addition, the acquired business may have undetected liabilities which may be significant.
In the event that the company chooses to raise debt capital to finance any acquisition, the company’s leverage will be increased. Should the company choose to use equity as consideration for an acquisition, existing shareholders may suffer dilution. Alternatively, the company may choose to finance any acquisition with its existing resources, which could decrease its ability to fund future capital expenditures.
The company may not be successful in overcoming these risks or any other problems encountered in connection with acquisitions. Failure by AngloGold Ashanti to implement its acquisition strategy or to integrate acquired businesses successfully could have material adverse effects on its growth and business results.
Ageing infrastructure at some of AngloGold Ashanti’s operations could adversely impact its business.
Deep level gold mining shafts are usually designed with a lifespan of 25 to 30 years. Vertical shafts consist of large quantities of infrastructure steelwork for guiding conveyances and accommodating services such as high and low tension electric cables, air and water pipe columns. Rising temperatures in the deeper mining areas can also lead to increased cooling requirements in the form of upgraded and expanded ice plants. Maintaining this infrastructure requires skilled human resources, capital allocation, management and planned maintenance.
Once a shaft has reached the end of its intended lifespan, higher than normal maintenance and care is required. Incidents resulting in production delays, increased costs or industrial accidents may occur. Such incidents may have an adverse effect on the company’s results of operations and financial condition. Asset integrity issues relating to ageing infrastructure are of particular concern in South Africa and at the Obuasi mine in Ghana.
For example, cracks were discovered in the mill feed end in September 2008 and at the discharge end in February 2010 at the Geita gold mine. The Geita gold mine is one of the group’s principal assets and sources of cash flow. After initial repairs, the feed end was replaced during May and June 2011. A decision was subsequently taken to replace the entire mill as a result of shell distortion. After new mill manufacture delays, installation was completed during March 2013. Production throughput in 2011 was 1 million tonnes less than planned, as a result of mill downtime that included feed-end replacement; ore grade was however sufficient to achieve 494,000 ounces. The Geita gold mine produced approximately 531,000 ounces in 2012, with production throughput of some 100,000 tonnes short of budget.
Some of AngloGold Ashanti’s technologies are unproven and failure could adversely impact costs and production.
AngloGold Ashanti has teamed up with various specialists to engineer new solutions to environmental management, mine design, rock breaking and underground logistics, among others. The company has invested in new technologies, including phyto-technologies to reduce seepage and address soil and ground water contamination, and in mine support technologies to minimize the impact of seismic activity. The company is also attempting to develop technologies to access the deeper reaches of South African mines.
Some aspects of these technologies are unproven and their eventual operational outcome or viability cannot be assessed with certainty. The costs, productivity and other benefits from these initiatives, and the consequent effects on AngloGold Ashanti’s future earnings and financial condition, may vary from expectations. Failure of the company to realize the anticipated benefits could result in increased costs, an inability to realize production or growth plans, or adversely affect its operational performance.
The level of AngloGold Ashanti’s indebtedness could adversely impact its business.
As at December 31, 2012, AngloGold Ashanti had gross borrowings of approximately $3.0 billion, (2011: approximately $1.7 billion) excluding the mandatory convertible bonds amounting to $588 million (2011: $760 million).
AngloGold Ashanti’s indebtedness could have a material adverse effect on its flexibility to conduct business. For example, the company may be required to use a large portion of its cash flow to pay the principal and interest on its debt, which will reduce funds available to finance existing operations and the development of new organic growth opportunities and further acquisitions. In addition, under the terms of the company’s borrowing facilities from its banks, AngloGold Ashanti is obliged to meet certain financial and other covenants. The company’s ability to continue to meet these covenants and to service its debt will depend on its future financial performance which will be affected by its operating performance as well as by financial and other factors, certain of which are beyond the control of the company.
Should the cash flow from operations be insufficient, AngloGold Ashanti could breach its financial and other covenants. Covenant breaches, if interpreted as events of default under one or more debt agreements, could allow lenders to accelerate payment of such debt. Any such acceleration could result in the acceleration of indebtedness under other financial instruments. As a result, the company may be required to refinance all or part of the existing debt, use existing cash balances, issue additional equity or sell assets. AngloGold Ashanti cannot be sure that it will be able to refinance its debt on commercially reasonable terms, if at all. The company’s ability to access the bank, public debt or equity capital markets on an efficient basis may be constrained by dislocation in the credit markets or capital and liquidity constraints in the banking, debt or equity markets at the time of issuance.
Certain factors may affect AngloGold Ashanti’s ability to support the carrying amount of its property, plant and equipment, acquired properties, investments and goodwill on the balance sheet. If the carrying amount of its assets is not recoverable, AngloGold Ashanti may be required to recognize an impairment charge, which could be significant.
AngloGold Ashanti reviews and tests the carrying amount of its assets when events or changes in circumstances suggest that the carrying amount may not be recoverable. The company values individual mining assets at the lowest level for which cash flows are identifiable and independent of cash flows of other mining assets and liabilities.
If there are indications that impairment may have occurred, AngloGold Ashanti prepares estimates of expected future cash flows for each group of assets. Expected future cash flows are inherently uncertain, and could materially change over time. They are significantly affected by reserve and production estimates, together with economic factors such as spot and forward gold prices, discount rates, currency exchange rates, estimates of costs to produce reserves and future capital expenditure. Estimated rehabilitation and closure costs could also materially affect the company’s financial performance and could result in the need to recognize an impairment charge.
If any of these uncertainties occur, either alone or in combination, management could be required to recognize an impairment, which could have a material adverse effect on the company’s results of operations and financial condition.
AngloGold Ashanti expects to have significant financing requirements.
AngloGold Ashanti’s existing board-approved development projects and exploration initiatives will require significant funding. These include: Tropicana in Australia; Mponeng Below 120 Project in South Africa; the Mongbwalu and Kibali projects in the DRC; and the mine life extension project (MLE2) at Cripple Creek & Victor in the United States.
Potential future development projects will also require significant funding, if and when approved by the AngloGold Ashanti board of directors. These include the: La Colosa and Gramalote projects in Colombia; Moab Khotsong Zaaiplaats in South Africa; Iduapriem expansion project in Ghana, Sadiola Deeps project in Mali; Geita underground mining project in Tanzania; Nova Lima Sul project in Brazil; a further mine life extension project (MLE3) at Cripple Creek & Victor in the United States; as well as various other exploration projects and feasibility studies.
AngloGold Ashanti estimates that over the next three years, growth initiatives will require project capital expenditure (excluding stay in business and ore reserve development capital expenditure) of approximately $4.0 billion (subject to escalation and based on certain assumptions, including exchange rates). The company’s capital expenditure plans and requirements are subject to a number of risks, contingencies and other factors, some of which are beyond its control, and therefore the actual future capital expenditure and investments may differ significantly from the current planned amounts.
AngloGold Ashanti’s operating cash flow and credit facilities may be insufficient to meet all of these expenditures, depending on the timing and cost of development of these and other projects as well as operating performance and available headroom under its credit facilities. As a result, new sources of capital may be needed to meet the funding requirements of these developments, to fund ongoing business activities and to pay dividends. AngloGold Ashanti’s ability to raise and service significant new sources of capital will be a function of macroeconomic conditions, the condition of the financial markets, future gold prices, the company’s operational performance and operating cash flow and debt position, among other factors. The company’s ability to raise further debt financing in the future and the cost of such financing will depend on, among other factors, its prevailing credit rating, which may be affected by the company’s ability to maintain its outstanding debt and financial ratios at levels acceptable to the credit ratings agencies, its business prospects risks relating to the countries in which it operates or other factors. As a result, in the event of lower gold prices, unanticipated operating or financial challenges, any dislocation in financial markets or new funding limitations, AngloGold Ashanti’s ability to pursue new business opportunities, invest in existing and new projects, fund its ongoing business activities and retire or service outstanding debt and pay dividends, could be significantly constrained, all of which could adversely impact the company’s results of operations and financial condition.
AngloGold Ashanti does not have full management control over some of its significant joint venture projects and other interests. If the operators of these projects do not manage these effectively and efficiently, the company’s investment in these projects could be adversely affected and its reputation could be harmed.
AngloGold Ashanti’s joint ventures at Morila in Mali and at Kibali in the DRC are managed by the company’s joint venture partner Randgold Resources Limited (Randgold). In addition, certain of AngloGold Ashanti’s exploration ventures are managed by the relevant joint venture partner. AngloGold Ashanti’s marine gold joint venture with De Beers is managed by an independent company jointly owned by AngloGold Ashanti and De Beers, with a significant part of the technical input subcontracted to De Beers or other marine service providers.
While AngloGold Ashanti provides strategic management and operational advice to its joint venture partners in respect of these projects, the company cannot ensure that these projects are operated in compliance with the standards that AngloGold Ashanti applies in its other operations. If these joint ventures are not operated effectively or efficiently, including as a result of weaknesses in the policies, procedures and controls implemented by the joint venture partners, the company’s investment in the relevant project could be adversely affected. In addition, negative publicity associated with operations that are ineffective or inefficiently operated, particularly relating to any resulting accidents or environmental incidents, could harm the company’s reputation and therefore its prospects and potentially its financial condition. Further, any failure of joint venture partners to meet their obligations to AngloGold Ashanti or to third parties, or any disputes with respect to the parties’ respective rights and obligations, could have a material adverse impact on AngloGold Ashanti’s results of operations and financial condition. In particular, the company and Randgold retain equal representation, with neither party holding a deciding vote on the board of the two companies that have overall management control of the Morila project in Mali and the Kibali project in the DRC, respectively, and all major
management decisions for each of these two projects, including approval of the budget, require board approval. If a dispute arises between the company and Randgold with respect to the Kibali or Morila project and the parties are unable to amicably resolve such dispute, it may be difficult for the parties to make strategic decisions relating to the project affected by such dispute, the day-to-day operations and the development of such project may be adversely affected and the company may have to participate in proceedings to resolve the dispute, which could adversely affect the company’s results of operations and financial condition.
AngloGold Ashanti’s joint ventures and other strategic alliances may not be successful.
AngloGold Ashanti’s joint venture partners may have economic or business interests or goals that are not consistent with the company’s or may, as a result of financial or other difficulties, be unable or unwilling to fulfill their obligations under the joint venture or other agreements. Disputes between AngloGold Ashanti and its joint venture partners may lead to legal action, including litigation between AngloGold Ashanti and joint venture partners. Such disputes could adversely affect the operation of the joint venture and may prevent the realization of the joint ventures goals. There is no assurance that the company’s joint venture partners will continue their relationship with the company in the future or that the company will be able to achieve its financial or strategic objectives relating to the joint ventures.
For example, AngloGold Ashanti has a 50:50 strategic alliance with Thani Investments LLC (TI), a company based in Dubai. During 2011, AngloGold Ashanti advanced a loan of $35 million to Thani Ashanti Alliance Limited, the joint entity it owns together with TI. This loan was impaired during 2012. TI guaranteed the loan. AngloGold Ashanti has brought legal action against TI over non-payment of the loan. The resolution to this dispute may affect the overall relationship between TI and the company. The failure of the company’s joint venture partners to fulfil their obligations or their unwillingness to continue these relationships may have an adverse effect on the company’s results of operations and financial condition.
AngloGold Ashanti’s Mineral Reserve, deposits and mining operations are located in countries where political, tax and economic laws and policies may change rapidly and unpredictably and such changes and policies may adversely affect both the terms of its mining concessions, as well as its ability to conduct operations in certain countries.
Any existing and new mining, exploration operations and projects that the company carries out are subject to various national and local laws, policies and regulations governing the ownership, prospecting, development and mining of mineral reserves, taxation and royalties, exchange controls, import and export duties and restrictions, investment approvals, employee and social community relations and other matters.
In most of the countries in which AngloGold Ashanti operates, there is a focus on resource nationalism with governments seeking to reap greater economic benefit from high commodity prices. This entails the review of mining codes and stability agreements, which were designed under different economic environments, and the formulation or amendment of laws, policies and regulations relating to issues such as mineral rights and asset ownership, royalties, taxation and taxation disputes, ‘windfall’ or ‘super’ taxation, non-recovery of taxation refunds, import and export duties, currency transfers, restrictions on foreign currency holdings and repatriation of earnings. Laws, policies and regulations in such countries are uncertain, changing and generally require progressively higher payments to governments, notably in the form of increased royalties and taxes, mandated beneficiation, export levies and increasing or retaining state or national ownership of resources. Changes in particular to the fiscal terms governing AngloGold Ashanti’s operations may have a material adverse impact on the company’s results of operations or financial condition, as well as discourage future investments in certain jurisdictions, which may have an adverse impact on the company’s ability to access new assets and could potentially reduce future growth opportunities.
For example on September 9, 2011, a new mining code for Guinea was enacted. The new mining code significantly increases the share of state ownership in the mining industry, extending a 15 percent share of future mining projects to the government, without financial compensation. The government also has the option to purchase up to an additional 20 percent of each project. However, the new mining code was withdrawn in October 2012 due to unfavorable reception and is yet to be re-issued. The Guinean government also announced its intention to carry out a review of the mining conventions currently in force in Guinea. This mining convention review is currently in progress. The outcome of this review may have a material adverse effect on the company’s results of operations or financial condition.
In late 2011 and early 2012, the government of Ghana amended its fiscal mining regime, increased its corporate taxation and royalty rates and may impose a windfall profit tax. Furthermore, the government of Ghana has constituted a review committee to review and re-negotiate stability agreements with mining companies. AngloGold Ashanti is currently participating in negotiations with the Ghanaian review committee. The outcome of these negotiations may have a material adverse effect on the company’s results of operations or financial condition.
AngloGold Ashanti Limited and other major mining companies are in talks with the Tanzanian government regarding new mining legislation and its impact on existing mining agreements; such talks follow an earlier declaration in July 2012 by the Tanzanian Minister of Energy and Minerals that the mining contracts were under review. The new mining legislation and the outcome of the review of the mining contracts may have a material adverse impact on the company’s results of operations and financial condition. Recently, the Tanzanian Minister of Energy and Minerals unexpectedly increased the royalty rate levied on gold extracted in Tanzania by AngloGold Ashanti’s operations by 1 percent. Further unanticipated increases in royalty rates in Tanzania or other countries could have a material adverse impact on the company’s results of operations and financial condition.
In the DRC, in October 2012 the Mines Minister announced a proposed overhaul of the DRC’s mining code. The proposed laws seek to, among other things, increase the government stake in mining operations to 35 percent from the existing 5 percent, double royalties on some minerals, and introduce a 50 percent levy on certain profits. Should such laws be enacted in the future, these may have a material adverse impact on the company’s results of operations in the DRC.
On July 1, 2012, Australia’s Minerals Resource Rent Tax (MRRT) came into effect after the legislation was passed in March 2012. The MRRT applies only to the bulk commodities of coal and iron ore, and replaced the previously proposed Resource Super Profit Tax (RSPT), which covered all minerals. The Australian federal government did not include gold and uranium in the final MRRT. However, should Australia consider reintroducing the RSPT, or if similar ‘super profit’ taxes were to be introduced and implemented in any other country in which AngloGold Ashanti operates, the company’s results of operations and financial condition could be materially adversely affected.
In addition, some of AngloGold Ashanti’s mineral deposits and mining and exploration operations are located in countries that are experiencing political instability and economic uncertainty. For example, in South Africa, country risk has increased recently in light of the violent strike action, social unrest, high levels of unemployment, poverty and concern that the government may take measures unfavorable to business.
In December 2012, while the ruling African National Congress rejected the concept of wholesale nationalization, it nevertheless favoured a ‘resource rent’ tax on windfall profits. Political instability and the resulting unstable business environment in which companies operate may discourage future investments in certain jurisdictions, which may have an adverse impact on the company’s ability to access new assets and could potentially reduce future growth opportunities.
AngloGold Ashanti is subject to an uncertain tax environment. Increased taxes are expected in most countries of operation. Changes in tax laws could result in higher tax expense and payments. Furthermore, legislation changes could materially impact AngloGold Ashanti’s tax receivables and liabilities as well as deferred tax assets and deferred tax liabilities. In addition, the uncertain tax environment in some regions could limit AngloGold Ashanti’s ability to enforce its rights. As a global company, AngloGold Ashanti conducts its business in countries subject to complex tax rules, which may be interpreted in different ways. Further interpretations or developments of tax regimes may affect the company’s tax liability, return on investments and business operations. AngloGold Ashanti is regularly examined by tax authorities in the various jurisdictions of operation.
For example, on March 15, 2012, the Mwanza office of the Tanzania Revenue Authority notified Geita Gold Mine Limited (Geita Gold Mine) that it intended to issue additional tax assessments against Geita Gold Mine. In connection with such assessments, the Tanzania Revenue Authority also challenged the validity of the existing mining development agreement (MDA) relating to the Geita Gold Mine, which was entered into with the Tanzanian government in June 1999. AngloGold Ashanti was served with a demand to pay the increased assessments, which it is currently paying under protest while awaiting a discussion with the government. In the event that the MDA is held to be invalid, the tax burden on the company’s Tanzanian operations would increase and the company would have to pay additional taxes for prior periods.
Furthermore, in Guinea, Mali and Tanzania, AngloGold Ashanti is due refunds of input tax and fuel duties which remain outstanding for periods longer than those provided for in the respective statutes.
The countries in which the company operates may also introduce strict exchange controls, impose restrictions to source materials and services locally, or impose other similar restrictions that hinder foreign companies’ operations within such countries. For example, the Argentine government introduced stricter exchange controls and related protracted approval processes, which may limit the company’s ability to repatriate dividends from its Argentine subsidiaries. In October 2011, the Argentina government has decreed that mining, oil and energy companies must repatriate export earnings. Additionally, the purchase of US dollars requires authorization from the Argentine tax agency and the purpose for which the currency will be used must be stated. In May 2012, the Argentine Mining Secretariat issued new regulations requiring mining companies in Argentina to boost their domestic purchases of equipment and services. Mining companies are now required to resort exclusively to locally established suppliers for their export-related shipping and logistics operations. A separate norm requires companies to open an import substitution division which will be in charge of submitting procurement plans to the Mining Secretariat on a quarterly basis. Such requirements are hindering the company’s operations within Argentina and these or similar requirements may continue to do so in the future and may have a material adverse effect on AngloGold Ashanti’s results of operations and financial condition.
If, in one or more of the countries in which it operates, AngloGold Ashanti were not able to obtain or maintain necessary permits, authorizations or agreements to implement planned projects or continue its operations under conditions or within timeframes that make such plans and operations economically viable, or if the applicable legal, ownership, fiscal (including all royalties and duties), exchange control, employment, environmental and social laws or regimes change materially, or if the governing political authorities change resulting in amendments to such laws and regimes, this could have a material adverse effect on AngloGold Ashanti’s operating results, financial condition, and, in extreme situations, on the viability of an operation.
For example, in South Africa mining rights are linked to meeting various obligations that include the broad-based socio-economic empowerment charter for the mining industry (the Revised Charter). Compliance with the Revised Charter is measured using a designated scorecard relating to equity ownership and management control of mining companies by historically disadvantaged South Africans (HDSAs) by no later than May 2014 and that HDSAs must constitute 40 percent of all levels of management by 2014. While AngloGold Ashanti believes that it is compliant with ownership targets to be achieved by May 2014, it must make further progress to achieve future targets, including further participation by HDSAs in senior and top management levels, the upgrade of housing and accommodation at the company’s mines, further human resource development, mine community development, sustainable development and growth as well as procurement and enterprise development, certain of which are also included under the Revised Charter’s targets that must also be achieved by May 2014.
The company will incur expenses in giving further effect to the Revised Charter and the scorecard. AngloGold Ashanti may not meet all of the various requirements by the required dates. Additionally, the South African government may decide that the Mining Charter has not gone far enough to achieve its underlying goals and therefore decide to expand the obligations of mining companies thereunder. Should AngloGold Ashanti breach its obligations in complying with the Mineral and Petroleum Resources Development Act, Revised Charter or any future amendments to the Mining Charter, its mining rights in South Africa could be suspended or cancelled by the Minister of Mineral Resources and it may be unable to obtain any new mining rights. Any such suspension or cancellation could have a material adverse effect on Anglo Ashanti’s results of operations and financial condition.
AngloGold Ashanti’s Mineral Reserve, deposits and mining operations are located in countries that face instability and security risks that may adversely affect both the terms of its mining concessions, as well as its ability to conduct operations in certain countries.
Some of AngloGold Ashanti’s mineral deposits and mining and exploration operations are located in countries that are experiencing political instability and economic uncertainty.
Certain of the countries in which AngloGold Ashanti has mineral deposits or mining or exploration operations, including the DRC, Mali, Guinea and Colombia, have in the past experienced, and in certain cases continue to experience, a difficult security environment. In particular, various illegal groups active in regions in which the company is present may pose a credible threat of military repression, terrorism, civil unrest, extortion and kidnapping, which could have an adverse effect on its operations in these and other regions.
For example, Mali continues to experience a difficult security environment since the military coup in March 2012. The situation in Mali remains of heightened concern as a result of the instability in northern Mali.
Eastern DRC also continues to experience tension consistent with the cycles of unrest experienced since the late 2000s. Fighting has caused instability in the area and could expand or intensify.
In 2012, and for the first time in approximately seven years, Anglo Gold Ashanti Colombia’s (AGAC) assets and employees were the targets of direct attacks by hostile actors around the La Colosa project’s area of influence. These and other such attacks could adversely affect the company’s operations in Colombia.
Since 2009, the company has recorded an almost five-fold increase in the instances of injury to security personnel, including members of AngloGold Ashanti’s internal security, private security companies and public security forces in certain jurisdictions. The rise in the number and severity of security incidents has come as a result of both increased illegal and artisanal mining due to a steady migration of people into the areas and an increase in the level of organization and funding of criminal activity around some of the company’s Continental African operations, spurred on by an escalating gold price. The most significant security challenges have occurred in Tanzania and Ghana in areas where there is endemic poverty and high levels of unemployment. If the security environment surrounding the company’s operations that are most exposed to these challenges does not improve or further deteriorates, employee, third-party and community member injuries and fatalities could also increase. Any such increase could disrupt the company’s operations in certain mines and adversely affect its reputation, results of operations and financial condition.
In some instances, risk assessments categorize threats as serious enough to require resort to public security forces, such as national police or military units on a near-permanent basis. In the event that continued operations in any of the company’s countries of operations compromise the company’s security or business principles, AngloGold Ashanti may withdraw from any such countries on a temporary or permanent basis. This could have a material adverse impact on AngloGold Ashanti’s results of operations and financial condition.
Furthermore, the company has at times experienced strained relationships with certain of its host communities. AngloGold Ashanti operates in several regions where poverty, unemployment and the lack of access to alternative livelihoods mean that the creation and distribution of economic benefit from mining operations is a significant area of focus for community and government. Conflict with communities has led to community protests and business interruptions, particularly at the Siguiri mine in Guinea during 2010 and 2011. In 2012, there were five recorded community protests at Cerro Vanguardia, Obuasi and Geita.
Illegal and artisanal mining occurs on AngloGold Ashanti’s properties, which can disrupt the company’s business and expose the company to liability.
Illegal and artisanal miners are active on, or adjacent to, some of AngloGold Ashanti’s Continental African and South American properties, which leads at times to interference with the company’s operations and results in conflict situations that present a security threat to property and human life. Artisanal mining is associated with a number of negative impacts, including environmental degradation, flouting of land rights, poor working practices, erosion of civil society, human rights abuse and funding of conflict. The environmental, social, safety and health impacts of artisanal mining are frequently attributed to formal mining activity, and it is often assumed that artisanally-mined gold is channeled through large-scale mining operators, even though artisanal and large-scale miners have distinct supply chains. These misconceptions impact negatively on the reputation of the industry.
The activities of the illegal miners, which include theft and shrinkage, could cause damage to AngloGold Ashanti’s properties, including pollution, underground fires, or personal injury or death, for which AngloGold Ashanti could potentially be held responsible. Illegal mining could result in the depletion of mineral deposits, potentially making the future mining of such deposits uneconomic. The presence of illegal miners could lead to project delays and disputes regarding the development or operation of commercial gold deposits. Illegal mining and theft could also result in lost gold reserves, mine stoppages, and have a material adverse effect on AngloGold Ashanti’s results of operations or financial condition.
In 2012, the company recorded an increase in the number and severity of security incidents, due to a steady migration of people into the areas and an increase in the level of organization and funding of criminal activity around some of the company’s Continental African operations, spurred on by an escalating gold price. The most significant security challenges have occurred in Tanzania and Ghana in areas where there is endemic poverty and high levels of unemployment.
The use of contractors at certain of the company’s operations may expose AngloGold Ashanti to delays or suspensions in mining activities and increases in mining costs.
AngloGold Ashanti uses contractors at certain of its operations to mine and deliver ore to processing plants as well as for other purposes. At mines employing mining contractors, contracting costs represent a significant proportion of the total operating costs of these operations and the company does not own all of the mining equipment. For example, increased contractor rates at the Sadiola mine in Mali contributed to a significant rise in total cash costs in the final quarter of 2011. Increased contractor costs at Sunrise Dam in Australia and Geita in Tanzania contributed to higher production costs in the first quarter of 2012.
AngloGold Ashanti’s operations could be disrupted, resulting in additional costs and liabilities, if the mining contractors at affected mines have financial difficulties or if a dispute arises in renegotiating a contract, or if there is a delay in replacing an existing contractor and its operating equipment to meet business needs at expected cost levels. Increases in contract mining rates, in the absence of associated productivity increases, will also have an adverse impact on the company’s results of operations and financial condition.
For example, on October 13, 2012, AngloGold Ashanti terminated the underground development contract with a third-party contractor at the Obuasi mine in Ghana. The costs of the termination amounted to $17 million.
In addition, AngloGold Ashanti’s reduced control over those aspects of operations which are the responsibility of contractors, their failure to comply with applicable legal, human rights and regulatory requirements, or their inability to manage their workforce or provide high quality services or a high level of productivity could adversely affect AngloGold Ashanti’s reputation, results of operations and financial condition, and may result in the company incurring liability to third parties due to the actions of contractors.
AngloGold Ashanti competes with mining and other companies for key human resources and its inability to retain key personnel could have an adverse effect on its business.
AngloGold Ashanti competes on a global basis with mining and other companies, to attract and retain key human resources at all levels with the appropriate technical skills and operating and managerial experience necessary to operate and supervise its business. This is further exacerbated in the current environment of increased mining activity across the globe, combined with the global shortage of key mining skills, including geologists, mining engineers, metallurgists and skilled artisans.
The retention of staff is particularly challenging in South Africa, where, in addition to the impacts of global industry shortages of skilled labor, AngloGold Ashanti is required to achieve employment equity targets of participation by HDSAs in management and other positions. AngloGold Ashanti competes with all companies in South Africa to attract and retain a small but growing pool of HDSAs with the necessary skills and experience. AngloGold Ashanti has historically faced difficulty recruiting and retaining young graduates and qualified mid-level management in South Africa. Recruitment of skilled personnel has been challenging in Continental Africa due to university offerings that are often not well-suited to the specific needs of the mining industry, as well as other factors such as language barriers and low literacy skills.
The recruitment of skilled workers is also highly competitive in South America as a result of a shortage of skills and intense competition between mining companies.
The company may not be able to retain and attract sufficient skilled and experienced employees in all areas of the business. Should it fail to do so or lose any of its key personnel, business and growth prospects may be harmed and this could have an adverse impact on AngloGold Ashanti’s results of operations and financial condition.
AngloGold Ashanti’s inability to retain its senior management may have an adverse effect on its business.
The company’s success depends largely upon the continued service of its senior management, including its chief executive officer, chief financial officer and the executive officers at each of its business divisions and general managers at its mines. The loss of one or more members of senior management, such as the recently announced departure of AngloGold Ashanti Chief Executive Officer, Mark Cutifani, to take the same position at Anglo American PLC as of April 3, 2013, could lead to other members of the management team leaving, disrupt the company’s operations, and have a material adverse impact on the company’s business, results of operations and financial condition.
The prevalence of occupational health diseases and the potential costs and liabilities related thereto may have an adverse effect on the business and results of operations of AngloGold Ashanti.
The primary areas of focus in respect of occupational health of employees within the company’s operations are noise-induced hearing loss and occupational lung diseases (OLD), which include pulmonary diseases such as tuberculosis from various causes and silicosis in individuals exposed to silica dust. These require active dust management strategies in underground operations, particularly in South Africa where a significant number of silicosis cases by current and former employees alleging past exposures are still reported each year to the board for statutory compensation. AngloGold Ashanti provides occupational health services to its employees at its occupational health centers and clinics and continues to improve preventative occupational hygiene initiatives, such as implementing various dust control measures and supplying its employees with respiratory protection equipment. If the costs associated with providing such occupational health services, implementing such dust control measures or supplying such equipment increase significantly beyond anticipated or budgeted amounts, this could have an adverse effect on AngloGold Ashanti’s results of operations and financial condition. Actual and alleged health and safety incidents or breaches of standards may also adversely impact the company’s reputation.
AngloGold Ashanti is currently subject to class action litigation with respect to alleged occupational lung diseases (see “– AngloGold Ashanti is subject to the risk of litigation, the causes and costs of which are not always known”). AngloGold Ashanti is calling for the industry to engage with government (and other stakeholders) to seek an appropriate industry-wide solution. An industry-wide solution may not be reached or the terms thereof may have a material adverse effect on AngloGold Ashanti’s financial condition.
In response to the effects of silicosis in labor-sending communities, a number of mining companies (under the auspices of the Chamber of Mines of South Africa) together with the NUM, which is the largest union in the mining sector in South Africa, and the national and regional departments of health, have embarked on a project to assist in delivering compensation and relief by mining companies under the Occupational Diseases in Mines and Works Act (ODMWA) to affected communities.
AngloGold Ashanti faces certain risks in dealing with HIV/AIDS, particularly at its South African operations and with tropical disease outbreaks such as malaria, and other diseases which may have an adverse effect on the company’s results of operations and financial condition.
AIDS and associated diseases remain one of the major health care challenges faced by AngloGold Ashanti’s South African operations. Workforce prevalence studies indicate that HIV prevalence rates among AngloGold Ashanti’s South African workforce may be as high as 30 percent.
Malaria and other tropical diseases pose significant health risks at all of the company’s operations in central, west and east Africa where such diseases may assume epidemic proportions because of ineffective national control programs. Malaria is a major cause of death in young children and pregnant women but also gives rise to fatalities and absenteeism in adult men. Other conditions such as heart disease, chronic diseases, and obesity are of increasing incidence and concern.
Such diseases impair the health of workers and negatively affect productivity and profitability as a result of workers’ diminished focus or skill, absenteeism, treatment costs and allocated resources. Any current or future medical program may not be successful in preventing or reducing the infection rate among AngloGold Ashanti’s employees or in affecting consequent illness or mortality rates. AngloGold Ashanti may incur significant costs in addressing this issue in the future, which could also adversely impact the company’s results of operations and financial condition.
The costs and impacts associated with the pumping of water inflows from closed mines adjacent to the company’s operations could have an adverse effect on its results of operations.
Certain of AngloGold Ashanti’s mining operations are located adjacent to the mining operations of other mining companies. The closure of a mining operation may have an impact upon continued operations at the adjacent mine if appropriate preventative steps are not taken. In particular, this can include the ingress of underground water where pumping operations at the adjacent closed mine are suspended. Such ingress could have an adverse effect on any one of the company’s mining operations as a result of property damage, disruption to operations, additional pollution liabilities and pumping costs and consequently could have an adverse impact on its results of operations and financial condition.
The potential costs associated with the remediation and prevention of groundwater contamination from the company’s operations or due to flooding from closed mines adjacent to the company’s operations could have a material adverse effect on AngloGold Ashanti’s results of operations and financial condition.
AngloGold Ashanti has identified groundwater contamination plumes at certain of its operations that have occurred primarily as a result of seepage from surface operations and facilities including tailings storage facilities and waste rock.
Deep groundwater contamination is a significant issue in South Africa, where groundwater in some older mining regions has infiltrated mined-out workings. Potential contamination risk to shallow ground and surface water resources can occur when water is exposed to sulfide-bearing rock in such situations. AngloGold Ashanti has identified a flooding and future pollution risk posed by deep groundwater in the Klerksdorp and Far West Rand goldfields. AngloGold Ashanti’s Vaal River operations are part of the Klerksdorp goldfields and its West Wits operations are part of the Far West Rand goldfields. As a result of the interconnected nature of underground mining operations in South Africa, any proposed solution needs to be a combined one supported by all the companies owning mines located in these goldfields.
In view of the limitation of current information for the accurate estimation of liabilities, no reliable estimate can be made for these obligations. The potential costs of remediation and prevention of groundwater contamination at AngloGold Ashanti’s operations could be significant and may have a material adverse impact on AngloGold Ashanti’s results of operations and financial condition.
The occurrence of events for which AngloGold Ashanti is not insured or for which its insurance is inadequate may adversely affect cash flows and overall profitability.
AngloGold Ashanti maintains insurance to protect only against catastrophic events which could have a significant adverse effect on its operations and profitability. This insurance is maintained in amounts that the company believes to be reasonable depending upon the circumstances surrounding each identified risk. However, damage and third-party claims arising from catastrophic events may exceed the limit of liability on insurance policies the company has in place. Furthermore, AngloGold Ashanti’s insurance does not cover all potential risks associated with its business and may exclude certain parts of its business. AngloGold Ashanti may elect not to insure certain risks due to the high premiums or for various other reasons, including an assessment that the risks are remote.
The company may not be able to obtain insurance coverage at acceptable premiums. The company believes negotiations with insurance providers have become more difficult for a number of reasons, including prevailing macroeconomic conditions and the risk profile of the mining industry. Insurance for certain risks in particular, such as loss of title to mineral property, political risks in certain jurisdictions, environmental pollution, or other hazards resulting from exploration and production, is not generally available to mining companies on acceptable terms. The availability and cost of insurance coverage can vary considerably from year to year as a result of events beyond the company’s control or from claims, and this can result in higher premiums and periodically being unable to maintain the levels or types of insurance the company typically carries.
The failure to obtain adequate insurance could impair the company’s ability to continue to operate in the normal course or could result in the occurrence of events for which AngloGold Ashanti is not insured, either of which could adversely impact its cash flows, results of operations and financial condition.
AngloGold Ashanti is subject to the risk of litigation, the causes and costs of which are not always known.
AngloGold Ashanti is subject to litigation, arbitration and other legal proceedings arising in the normal course of business and may be involved in disputes that may result in litigation. The causes of potential future litigation cannot be known and may arise from, among other things, business activities, environmental and health and safety concerns, share price volatility or failure to comply with disclosure obligations. The results of litigation cannot be predicted with certainty but could include costly damage awards or settlements, fines, and the loss of licenses, concessions, or rights, among other things.
In the event of a dispute AngloGold Ashanti may be subject to the exclusive jurisdiction of foreign courts or may not be successful in subjecting foreign persons to the jurisdiction of courts in South Africa or the United States.
AngloGold Ashanti is subject to numerous claims, including class actions or similar group claims relating to silicosis and other OLD, and could be subject to similar claims in the future.
AngloGold Ashanti has received notice of two applications for class certification relating to silicosis in which the company is a respondent. It has also received notice of individual claims. For further information, please refer to “Item 8.: Financial Information – Legal Proceedings – South Africa – Silicosis litigation”.
It is possible that additional class actions and/or individual claims relating to silicosis and/or other OLD will be filed against AngloGold Ashanti in the future. AngloGold Ashanti will defend all and any subsequent claims as filed on their merits. Should AngloGold Ashanti be unsuccessful in defending any such claims, or in otherwise favorably resolving perceived deficiencies in the national occupational disease compensation framework that were identified in an earlier decision by the Constitutional Court of South Africa, such matters would have an adverse effect on its financial position, which could be material.
In Colombia, the company is also involved in five class action lawsuits in relation to AGAC Santa Maria-Montecristo and La Colosa projects. One of these class action lawsuits led to a preliminary injunction suspending the mining concession contracts of the Santa Maria-Montecristo project in September 2011. Additionally, in Colombia, AGAC is involved in an action in the Administrative Superior Court of the Cundinamarca District against the Department of the Environment, Housing and Territorial Development (DoE) following its issuance of a fine against AGAC on the basis that AGAC was in breach of its mining terms of reference.
Should the company be unable to resolve disputes favorably or to enforce its rights, this may have a material adverse impact on the company’s financial performance, cash flow and results of operations.
The implementation of an integrated Enterprise Resource Planning (ERP) system could have an adverse effect on AngloGold Ashanti’s results of operations and financial condition.
AngloGold Ashanti is implementing a single, global ERP system to support all the operations managed by AngloGold Ashanti. The ERP system is being implemented over a three-and-a-half-year period which commenced in August 2011. The contemplated implementation of an ERP system on a global basis is inherently a high-risk initiative due to the potential for implementation cost and time overruns. In addition, such implementation could affect the ability of AngloGold Ashanti to report and manage technical and financial information if difficulties in the implementation and operation of the system are experienced, which could have an adverse effect on AngloGold Ashanti’s results of operations and financial condition. The first sites went live during February 2013.
Sales of large quantities of AngloGold Ashanti‘s ordinary shares and American Depository Shares (ADSs), and the perception that these sales may occur or other dilution of the company’s equity, could adversely affect the prevailing market price of the company’s securities.
The bulk of AngloGold Ashanti’s shares are held by a relatively small number of investors. According to information available to the company, AngloGold Ashanti’s four largest shareholders beneficially owned approximately 23.29 percent of AngloGold Ashanti’s ordinary shares as at December 31, 2012.
Poor returns, soaring costs, higher capital expenditure, ill-conceived corporate activity, rising geopolitical and labor risk and low dividend yields over the past few years have resulted in a change in market sentiment towards gold equities. The market price of the company’s securities could fall if large quantities of ordinary shares or ADSs are sold in the public market, if there is divestment by certain types or groupings of investors, or if there is the perception in the marketplace that such sales could occur. Subject to applicable securities laws, holders of the company‘s ordinary shares or ADSs may decide to sell them at any time. The market price of the company’s ordinary shares or ADSs could also fall as a result of any future offerings AngloGold Ashanti makes of its ordinary shares, ADSs, or securities exchangeable or exercisable for the company’s ordinary shares or ADSs, or the perception in the market place that these offerings might occur. AngloGold Ashanti may make such offerings, including offerings of additional ADS rights, share rights or similar securities, at any time or from time to time in the future.
Fluctuations in the exchange rate of currencies may reduce the market value of AngloGold Ashanti’s securities, as well as the market value of any dividends or distributions paid by the company.
AngloGold Ashanti has historically declared all dividends in South African rands. As a result, exchange rate movements may have affected and may continue to affect the Australian dollar, the British pound, the Ghanaian cedi and the US dollar value of these dividends, as well as of any other distributions paid by the relevant depositary to investors that hold the company’s securities. This may reduce the value of these securities to investors.
AngloGold Ashanti’s memorandum and articles of association allow for dividends and distributions to be declared in any currency at the discretion of the board of directors, or the company’s shareholders at a general meeting. If and to the extent that AngloGold Ashanti opts to declare dividends and distributions in US dollars, exchange rate movements will not affect the US dollar value of any dividends or distributions. Nevertheless, the value of any dividend or distribution in Australian dollars, British pounds, Ghanaian cedis or South African rands will continue to be affected. If and to the extent that dividends and distributions are declared in South African rands, exchange rate movements will continue to affect the Australian dollar, British pound, Ghanaian cedi and US dollar value of these dividends and distributions. Furthermore, the market value of AngloGold Ashanti’s securities as expressed in Australian dollars, British pounds, Ghanaian cedis, US dollars and South African rands will continue to fluctuate in part as a result of foreign exchange fluctuations.
AngloGold Ashanti may not pay dividends or make similar payments to shareholders in the future.
AngloGold Ashanti pays cash dividends only if there are sufficient funds available for that purpose. Fund availability depends upon many factors that include the amount of cash available in relation to AngloGold Ashanti’s capital expenditure on existing infrastructure and exploration and other projects.
Under South African law, companies are entitled to pay a dividend or similar payment to its shareholders only if the company meets the solvency and liquidity tests set out in legislation, and the company’s founding documents.
Given these factors, including the capital and investment needs of the company, and the board of directors’ discretion to declare a dividend that includes the amount and timing thereof, cash dividends may not be paid in the future.
ITEM 4: INFORMATION ON THE COMPANY
| 4A. | HISTORY AND DEVELOPMENT OF THE COMPANY |
GROUP INFORMATION
AngloGold Limited was formed in June 1998 with the consolidation of the gold mining interests of Anglo American plc. AngloGold Ashanti Limited, as the company exists today, was formed on April 26, 2004 following the business combination between AngloGold and Ashanti Goldfields Company Limited.
CURRENT PROFILE
AngloGold Ashanti Limited is headquartered in Johannesburg, South Africa. The company (Registration number 1944/017354/06) was incorporated in the Republic of South Africa in 1944 under the name of Vaal Reefs Exploration and Mining Company Limited and operates under the South African Companies Act 71 of 2008 (Companies Act), as amended.
Its registered office is at 76 Jeppe Street, Newtown, Johannesburg, South Africa, 2001. Telephone: +27 11 6376000.
While AngloGold Ashanti’s primary listing is on the Johannesburg Stock Exchange (JSE), the company is also listed on the London Stock Exchange (LSE), the New York Stock Exchange (NYSE), the Ghana Stock Exchange (GhSE) and the Australian Securities Exchange (ASX).
HISTORY AND SIGNIFICANT DEVELOPMENTS
Below are highlights of key corporate activities from 1998:
1998
Formation of AngloGold Limited through the consolidation of East Rand Gold and Uranium Company Limited; Eastvaal Gold Holdings Limited; Southvaal Holdings Limited; Free State Consolidated Gold Mines Limited; Elandsrand Gold Mining Company Limited; H.J. Joel Gold Mining Company Limited and Western Deep Levels Limited into a single, focused, independent, gold mining company. Vaal Reefs Exploration and Mining Company Limited (Vaal Reefs), the vehicle for the consolidation, changed its name to AngloGold Limited and increased its authorized share capital, effective March 30, 1998.
1998-2004
Expansion of AngloGold Limited’s operations outside of South Africa.
2004
Concluded the business combination with Ashanti Goldfields Company Limited, at which time the company changed its name to AngloGold Ashanti Limited.
2007
Anglo American plc sold 69,100,000 ordinary shares of AngloGold Ashanti, thereby reducing Anglo American’s shareholding in AngloGold Ashanti from 41.7 percent to 16.6 percent.
2009
Anglo American plc sold its remaining shareholding to Paulson & Co. Inc.
2010
AngloGold Ashanti eliminated its hedge book, thereby gaining full exposure to spot gold prices.
2012
AngloGold Ashanti acquired the remaining 50 percent interest in Serra Grande in Brazil for $215 million.
The company acquired 100 percent of First Uranium (Proprietary) Limited for $335 million.
| 4B. | BUSINESS OVERVIEW |
AngloGold Ashanti, one of the world’s major gold exploration, mining and marketing companies, holds a portfolio of operations and projects on four continents, and has a worldwide exploration program. The company works across the full spectrum of the mining value chain.
PRODUCTS
AngloGold Ashanti’s main product is gold. In the course of processing the ore mined, by-products such as silver, uranium oxide and sulfuric acid are produced at the Argentinian, South African and Brazilian operations.
OPERATIONS
AngloGold Ashanti’s 21 operations are located in 10 countries (Argentina, Australia, Brazil, Ghana, Guinea, Mali, Namibia, South Africa, Tanzania and the United States). These include six deep-level mines and surface operations in South Africa as well as a combination of surface and underground mining operations in the Americas, Australia and elsewhere on the African continent.
EXPLORATION
The group’s exploration program, covers greenfield, brownfield, and, more recently, marine exploration. Major development projects are Tropicana in Australia, Kibali in the Democratic Republic of the Congo (DRC) and La Colosa in Colombia. Our extensive brownfield, greenfield and marine exploration programs extend to 14 countries, in both established and new gold-producing regions through managed and non-managed joint ventures, strategic alliances and wholly owned ground holdings.
DEVELOPMENT
AngloGold Ashanti utilizes its exploration team to build on its record of new gold discoveries and to grow its gold endowment. The company has increased its capacity to fund a significant project pipeline by incurring longer-term debt, while maintaining capital discipline and improving returns.
MARKETING
Once processed to the doré (unrefined gold bar) stage at AngloGold Ashanti’s operations, this product is dispatched to various precious metal refineries where the gold is refined to a purity of at least 99.5 percent, in accordance with the standards of “good delivery” as determined by the London Bullion Market Association. It is then sold to bullion banks or refiners. Gold has been a much sought after source of wealth over the centuries, be it as an investment, a store of value or as jewellery. AngloGold Ashanti campaigns actively to promote the demand for gold.
GOLD MARKET
AngloGold Ashanti’s gold is refined at various precious metal refineries. In refined and marketable form, gold normally takes the shape of bars, varying in size from 12.5 kilogram to smaller bars weighing some 1 kilogram or less, all of which contain 99.5 percent gold. Through the refineries the gold is sold directly to bullion banks. Bullion banks are registered commercial banks which deal in gold, distributing bullion bought from mining companies and refineries to markets worldwide. These banks hold consignment stocks in all major physical markets and finance these inventories from the margins they charge physical buyers.
The physical gold market is dominated by the jewellery and investment sectors, which together account for 78 percent of total demand. The balance of gold demand is from the electronics and dentistry industry, as well as the uptake from central banks. While the quantity of gold used in jewellery consumption has decreased over the last decade with the steadily rising gold price, the investment market has largely absorbed available supply. Investment in physical gold involves bar and coin hoarding, medals and other retail investment instruments, as well as the now significant market for exchange traded funds (ETFs).
The gold price averaged $1,668 per ounce for 2012, marking the eleventh consecutive year of average annual price increases. After reaching a record of $1,921 per ounce in September 2011, the gold price failed to reach the same level during 2012.
Although gold has traditional “safe haven” status among financial assets, it did not benefit significantly in 2012. This was largely on account of the continued negative correlation between the dollar gold price and the dollar, in which a stronger dollar tended to cap appreciation in the gold price. This pattern was exacerbated by the fact that investors often sold profitable gold positions.
The announcement by the US Federal Reserve of a further round of quantitative easing in mid-September correlated with a boost in the gold price, however, having averaged $1,651 per ounce over the first three quarters of 2012, the announcement of the third round of quantitative easing (QE3) corresponding with an increase in the gold price average to $1,717 per ounce for the final quarter. As of April 19, 2013, the gold price was $1,404 per ounce.
Investment market
Holdings within the ETF universe showed reasonable growth. Although growth in total gold holdings was lower than that experienced in 2009 and 2010, it was an improvement over 2011. ETF holdings grew by 6.4 million ounces in 2011 which represents growth of 9 percent over the year. In 2012, ETF holdings grew by almost 9.4 million ounces or 12 percent.
Among ETFs, which now include some 32 different funds, the NYSE-listed SPDR Gold Shares (GLD) remained the largest at 43.4 million ounces, or almost half of combined holdings of 88.8 million ounces (as at end 2012). This fund grew by 3.1 million ounces in 2012 and alone accounted for over a third of overall growth in holdings during 2012.
The official sector continued to be a significant source of demand through 2012 with estimates of around 17.2 million ounces (net) bought by various central banks across the globe. The most dominant sources of demand from this sector remain those countries which are not members of the Organization for Economic Co-operation and Development (OECD), such as Brazil, Mexico and South Korea, which added to their gold reserves. In contrast, the third year of the Central Bank Gold Agreement ended at the end of September and total sales of 5 tonnes by its signatories were recorded. This represents the lowest annual sales in any of the agreements.
Bar and coin demand for 2012 failed to match the levels of 2011, declining by 260 tonnes year-on-year. Demand experienced from Europe in 2011 did not materialize again in 2012. However, after a slow start to the first half of the year, Indian demand for bars and coins began to emerge and amounted some 25 percent of total demand for 2012. Demand from China, another important source of demand, was flat at 265 tonnes, primarily due to the slowing of the Chinese economy.
Jewellery markets
A jewellers’ strike and doubling of import duties meant that the first half of the year witnessed very poor demand out of India relative to 2011, down by 24 percent. Sentiment improved in the latter half of the year and India remained the strongest performing market for gold jewellery and, in 2012, accounted for 29 percent of global jewellery fabrication.
Slowing fortunes of the Chinese economy had an impact on jewellery demand from this region, down 4.5 tonnes year-on-year, as consumers cut back on their discretionary spending. Hong Kong maintained its levels of jewellery demand year-on-year at 27 tonnes.
European jewellery demand was similarly affected by economic woes and austerity measures.
The outlook for the gold price remains broadly supportive given the continuation of loose monetary policies in both the United States and Europe. However, there is growing confidence that monetary authorities may have managed the worst of these crises. Austerity measures may continue across Europe and this may weigh on European jewellery demand while further measures by the Indian authorities to curb gold imports mean that jewellery demand from this region will also likely decrease in the short term.
RAW MATERIALS
AngloGold Ashanti uses chemicals including cyanide and lime in the production of gold. These chemicals are available from a large number of suppliers.
South Africa
(Address of Principal Executive Offices)
ME Sanz Perez, Company Secretary, Telephone: +27 11 6376306, Facsimile: +27 86 6750137
E-mail: rsanz@anglogoldashanti.com, 76 Jeppe Street, Newtown, Johannesburg, 2001, South Africa
(Name, Telephone, E-mail and/or Facsimile number and Address of Company Contact Person)
Securities registered pursuant to Section 12(b) of the Act:
| Title of each class | Name of each exchange on which registered | |
American Depositary Shares | New York Stock Exchange | |
Ordinary Shares | New York Stock Exchange* | |
6.00 Percent Mandatory Convertible Subordinated Bonds due 2013 | New York Stock Exchange |
| * | Not for trading, but only in connection with the registration of American Depositary Shares pursuant to the requirements of the Securities and Exchange Commission |
Securities registered pursuant to Section 12(g) of the Act:
None
Securities for which there is a reporting obligation pursuant to Section 15(d) of the Act:
None
Indicate the number of outstanding shares of each of the issuer’s classes of capital or common stock as of the close of the period covered by the annual report:
Ordinary Shares of 25 ZAR cents each | 383,320,962 | |||
E Ordinary Shares of 25 ZAR cents each | 1,617,752 | |||
A Redeemable Preference Shares of 50 ZAR cents each | 2,000,000 | |||
B Redeemable Preference Shares of 1 ZAR cent each | 778,896 |
Indicate by check mark if the registrant is a well-known seasoned issuer, as defined in Rule 405 of the Securities Act.
| Yes x No ¨ |
If this report is an annual or transition report, indicate by check mark if the registrant is not required to file reports pursuant to Section 13 or 15(d) of the
Securities Exchange Act of 1934. | Yes ¨ No x |
Indicate by check mark whether the registrant (1) has filed all reports required to be filed by Section 13 or 15(d) of the Securities Exchange Act of 1934 during the preceding 12 months (or for such shorter period that the registrant was required to file such reports), and (2) has been subject to such filing
requirements for the past 90 days. | Yes x No ¨ |
Indicate by check mark whether the registrant (1) has submitted electronically and posted on its corporate web site, if any, every Interactive Data File required to be submitted and posted pursuant to Rule 405 of Regulation S-T during the preceding 12 months (or for such shorter period that the registrant was
required to submit and post such files). | Yes x No ¨ |
Indicate by check mark whether the registrant is a large accelerated filer, an accelerated filer, or a non-accelerated filer. See definition of “accelerated filer and large accelerated filer” in Rule 12b-2 of the Exchange Act.
(Check one): Large Accelerated Filer x | Accelerated Filer¨ | Non-Accelerated Filer ¨ |
Indicate by check mark which basis of accounting the registrant has used to prepare the financial statements included in this filing:
| U.S. GAAP x |
International Financial Reporting Standards as issued by the International Accounting Standards Board¨Other¨
If this is an annual report, indicate by check mark whether the registrant is a shell company (as defined in Rule 12b-2 of the Exchange Act). | Yes ¨ No x |
| TABLE OF CONTENTS | Page | |||||
| 3 | ||||||
| 4 | ||||||
| 5 | ||||||
| 8 | ||||||
| 8 | ||||||
| 9 | ||||||
Item 1: | 10 | |||||
Item 2: | 10 | |||||
Item 3: | ||||||
| 3A. | 10 | |||||
| 3B. | 14 | |||||
| 3C. | 14 | |||||
| 3D. | 14 | |||||
Item 4: | 41 | |||||
| 4A. | 41 | |||||
| 4B. | 42 | |||||
| 4C. | 95 | |||||
| 4D. | 96 | |||||
Item 4A: | 121 | |||||
Item 5: | 122 | |||||
| 5A. | 123 | |||||
| 5B. | 149 | |||||
| 5C. | 158 | |||||
| 5D. | 158 | |||||
| 5E. | 158 | |||||
| 5F. | 158 | |||||
Item 6: | ||||||
| 6A. | 159 | |||||
| 6B. | 166 | |||||
| 6C. | 172 | |||||
| 6D. | 177 | |||||
| 6E. | 179 | |||||
Item 7: | 186 | |||||
| 7A. | 188 | |||||
| 7B. | 189 | |||||
| 7C. | 189 | |||||
Item 8: | ||||||
| 8A. | Consolidated financial statements and other financial information | 190 | ||||
| 190 | ||||||
| 196 | ||||||
| 8B. | 196 | |||||
Item 9: | ||||||||
| 9A. | 197 | |||||||
| 9B. | 197 | |||||||
| 9C. | 198 | |||||||
| 9D. | 198 | |||||||
| 9E. | 198 | |||||||
| 9F. | 198 | |||||||
Item 10: | ||||||||
| 10A. | 199 | |||||||
| 10B. | 202 | |||||||
| 10C. | 213 | |||||||
| 10D. | 216 | |||||||
| 10E. | 217 | |||||||
| 10F. | 221 | |||||||
| 10G. | 221 | |||||||
| 10H. | 221 | |||||||
| 10I. | 221 | |||||||
Item 11: | 222 | |||||||
Item 12: | ||||||||
| 12A. | 229 | |||||||
| 12B. | 229 | |||||||
| 12C. | 229 | |||||||
| 12D. | ||||||||
| 229 | ||||||||
| 229 | ||||||||
Item 13: | 230 | |||||||
Item 14: | Material modifications to the rights of security holders and use of proceeds | 231 | ||||||
Item 15: | 232 | |||||||
Item 16A: | 234 | |||||||
Item 16B: | 235 | |||||||
Item 16C: | 236 | |||||||
Item 16D: | 236 | |||||||
Item 16E: | Purchases of equity securities by the issuer and affiliated purchasers | 236 | ||||||
Item 16F: | 237 | |||||||
Item 16G: | 237 | |||||||
Item 16H: | 237 | |||||||
Item 17: | 238 | |||||||
Item 18: | 239 and F pages | |||||||
Item 19 | Exhibits | E pages | ||||||
AngloGold Ashanti Limited
In this annual report on Form 20-F, unless the context otherwise requires, references to AngloGold, AngloGold Ashanti, the company, the Company and the group are references to AngloGold Ashanti Limited including, as appropriate, subsidiaries and associate companies of AngloGold Ashanti.
US GAAP financial statements
The audited consolidated financial statements contained in this annual report on Form 20-F for the years ended December 31, 2012, 2011 and 2010 and as at December 31, 2012 and 2011 have been prepared in accordance with U.S. generally accepted accounting principles (US GAAP).
IFRS financial statements
As a company incorporated in the Republic of South Africa, AngloGold Ashanti also prepares annual audited consolidated financial statements and unaudited consolidated quarterly financial statements in accordance with International Financial Reporting Standards (IFRS) as issued by the International Accounting Standards Board (IASB). These financial statements (referred to as IFRS statements) are distributed to shareholders and are submitted to the JSE Limited (JSE), as well as the London, New York, Australian and Ghana stock exchanges and are furnished to the US Securities and Exchange Commission (SEC) on Form 6-K.
Currency
AngloGold Ashanti presents its consolidated financial statements in United States dollars.
In this annual report, references to rands, ZAR and R are to the lawful currency of the Republic of South Africa, references to US dollars, dollar or $ are to the lawful currency of the United States, references to€ are to the lawful currency of the European Union, references to C$ or CAD are to the lawful currency of Canada, references to ARS and peso are to the lawful currency of Argentina, references to AUD and A$ are to the lawful currency of Australia, references to BRL are to the lawful currency of Brazil, reference to NAD and N$ are to the lawful currency of Namibia, reference to Tsh is to the lawful currency of the United Republic of Tanzania and references to GHC, cedi or ¢ are to the lawful currency of Ghana.
See “Item 3A.: Selected financial data – Exchange rate information” for historical information regarding the US dollar/South African rand exchange rate. On April 19, 2013 the interbank US dollar/South African rand exchange rate as reported by OANDA Corporation was R9.17/$1.00.
Non-GAAP financial measures
In this annual report on Form 20-F, AngloGold Ashanti presents the financial items “total cash costs”, “total cash costs per ounce”, “total production costs” and “total production costs per ounce” which have been determined using industry guidelines and practices promulgated by the Gold Institute and are not US GAAP measures. An investor should not consider these items in isolation or as alternatives to production costs, net income/(loss) applicable to common shareholders, income/(loss) before income tax provision, net cash provided by operating activities or any other measure of financial performance presented in accordance with US GAAP. While the Gold Institute has provided definitions for the calculation of total cash costs and total production costs, the calculation of total cash costs, total cash costs per ounce, total production costs and total production costs per ounce may vary significantly among gold mining companies, and by themselves do not necessarily provide a basis for comparison with other gold mining companies. See “Glossary of selected terms – Financial terms – Total cash costs” and –“Total production costs” and “Item 5A.: Operating results – Total cash costs and total production costs”.
Shares and shareholders
In this annual report on Form 20-F, references to ordinary shares, ordinary shareholders and shareholders/members, should be read as common stock, common stockholders and stockholders, respectively, and vice versa.
CERTAIN FORWARD-LOOKING STATEMENTS
Certain statements contained in this document, other than statements of historical fact, including, without limitation, those concerning the economic outlook for the gold mining industry, expectations regarding gold prices, production, cash costs and other operating results, return on equity, productivity improvements, growth prospects and outlook of AngloGold Ashanti’s operations, individually or in the aggregate, including the achievement of project milestones, the completion and commencement of commercial operations of certain of AngloGold Ashanti’s exploration and production projects and the completion of acquisitions and dispositions, AngloGold Ashanti’s liquidity and capital resources and capital expenditures and the outcome and consequence of any potential or pending litigation or regulatory proceedings or environmental issues, are forward-looking statements regarding AngloGold Ashanti’s operations, economic performance and financial condition.
These forward-looking statements or forecasts involve known and unknown risks, uncertainties and other factors that may cause AngloGold Ashanti’s actual results, performance or achievements to differ materially from the anticipated results, performance or achievements expressed or implied in these forward-looking statements. Although AngloGold Ashanti believes that the expectations reflected in such forward-looking statements are reasonable, no assurance can be given that such expectations will prove to have been correct. Accordingly, results and forecasts could differ materially from those set out in the forward-looking statements as a result of among other factors, changes in economic, social and political and market conditions, success of business and operating initiative, changes in the regulatory environment and other government actions, including environmental approval, fluctuations in gold prices and exchange rates, the outcome of pending or future litigation proceedings and business and operational risk management and other factors as determined in “item 3D.: Risk factors” and elsewhere in this annual report. These factors are not necessarily all of the important factors that could cause AngloGold Ashanti’s actual results to differ materially from those expressed in any forward-looking statements. Other unknown or unpredictable factors could also have material adverse effects on future results. Consequently, readers are cautioned not to place undue reliance on forward-looking statements.
AngloGold Ashanti undertakes no obligation to update publicly or release any revisions to these forward-looking statements to events or circumstances after the date of this annual report or to reflect the occurrence of unanticipated events, except to the extent required by applicable law. All subsequent written or oral forward-looking statements attributable to AngloGold Ashanti or any person acting on its behalf are qualified by the cautionary statements herein.
The following explanations are not intended as technical definitions but should assist the reader in understanding terminology used in this annual report. Unless expressly stated otherwise, all explanations are applicable to both underground and surface mining operations.
All injury frequency rate:The total number of injuries and fatalities that occurs per million hours worked.
BIF:Banded Ironstone Formation. A chemically formed iron-rich sedimentary rock.
By-products:Any products that emanate from the core process of producing gold, including silver, uranium and sulfuric acid.
Calc-silicate rock:A metamorphic rock consisting mainly of calcium-bearing silicates such as diopside and wollastonite, and formed by metamorphism of impure limestone or dolomite.
Carbon-in-leach (CIL):Gold is leached from a slurry of gold ore with cyanide in agitated tanks and adsorbed on to carbon granules in the same circuit. The carbon granules are separated from the slurry and treated in an elution circuit to remove the gold.
Carbon-in-pulp (CIP):Gold is leached conventionally from a slurry of gold ore with cyanide in agitated tanks. The leached slurry then passes into the CIP circuit where carbon granules are mixed with the slurry and gold is adsorbed on to the carbon. The granules are separated from the slurry and treated in an elution circuit to remove the gold.
Comminution:Comminution is the crushing and grinding of ore to make gold available for treatment. (See also “Milling”).
Contained gold:The total gold content (tons multiplied by grade) of the material being described.
Cut-off grade (surface mines):The minimum grade at which a unit of ore will be mined to achieve the desired economic outcome.
Depletion:The decrease in the quantity of ore in a deposit or property resulting from extraction or production.
Development:The process of accessing an orebody through shafts and/or tunneling in underground mining operations.
Diorite:An igneous rock formed by the solidification of molten material (magma).
Doré:Impure alloy of gold and silver produced at a mine to be refined to a higher purity, usually consisting of 85 percent gold on average.
Electro-winning:A process of recovering gold from solution by means of electrolytic chemical reaction into a form that can be smelted easily into gold bars.
Elution:Recovery of the gold from the activated carbon into solution before zinc precipitation or electro-winning.
Gold Produced:Refined gold in a saleable form derived from the mining process.
Grade:The quantity of gold contained within a unit weight of gold-bearing material generally expressed in ounces per short ton of ore (oz/t), or grams per metric tonne (g/t).
Greenschist:A schistose metamorphic rock whose green color is due to the presence of chlorite, epidote or actinolite.
Leaching:Dissolution of gold from crushed or milled material, including reclaimed slime, prior to adsorption on to activated carbon.
Life of mine (LOM):Number of years for which an operation is planning to mine and treat ore, and is taken from the current mine plan.
Metallurgical plant:A processing plant constructed to treat ore and extract gold.
Metallurgical recovery factor (MetRF): A measure of the efficiency in extracting gold from the ore deposit.
Milling:A process of reducing broken ore to a size at which concentrating can be undertaken. (See also “Comminution”).
Mine call factor:The ratio, expressed as a percentage, of the total quantity of recovered and unrecovered mineral product after processing with the amount estimated in the ore based on sampling. The ratio of contained gold delivered to the metallurgical plant divided by the estimated contained gold of ore mined based on sampling.
Mineral deposit:A mineral deposit is a concentration (or occurrence) of material of possible economic interest in or on the earth’s crust.
Ore Reserve:That part of a mineral deposit which could be economically and legally extracted or produced at the time of the Ore Reserve determination.
Ounce (oz) (troy):Used in imperial statistics. A kilogram is equal to 32.1507 ounces. A troy ounce is equal to 31.1035 grams.
Pay limit:The grade of a unit of ore at which the revenue from the recovered mineral content of the ore is equal to the sum of total cash costs, closure costs, Ore Reserve development and stay-in-business capital. This grade is expressed as an in-situ value in grams per tonne or ounces per short ton (before dilution and mineral losses).
Precipitate:The solid product of chemical reaction by fluids such as the zinc precipitation referred to below.
Probable Ore Reserve:Ore Reserve for which quantity and grade are computed from information similar to that used for Proven Reserves, but the sites for inspection, sampling, and measurement are further apart or are otherwise less adequately spaced. The degree of assurance, although lower than that for Proven Reserves, is high enough to assume continuity between points of observation.
Productivity:An expression of labor productivity based on the ratio of grams of gold produced per month to the total number of employees in mining operations.
Proven Ore Reserve:Ore Reserve for which the (a) quantity is computed from dimensions revealed in outcrops, trenches, workings or drill holes; grade is computed from the results of detailed sampling and (b) the sites for inspection, sampling and measurement are spaced so closely and the geologic character is so well defined that size, shape, depth and mineral content of the Ore Reserve are well established.
Project capital:Capital expenditure to either bring a new operation into production; to materially increase production capacity; or to materially extend the productive life of an asset.
Recovered grade:The recovered mineral content per unit of ore treated.
Reef:A gold-bearing sedimentary horizon, normally a conglomerate band that may contain economic levels of gold.
Refining:The final purification process of a metal or mineral.
Rehabilitation:The process of reclaiming land disturbed by mining to allow an appropriate post-mining use. Rehabilitation standards are defined by country-specific laws, including but not limited to the South African Department of Mineral Resources, the US Bureau of Land Management, the US Forest Service, and the relevant Australian mining authorities, and address among other issues, ground and surface water, topsoil, final slope gradient, waste handling and re-vegetation issues.
Seismic event:A sudden inelastic deformation within a given volume of rock that radiates detectable seismic energy.
Shaft:A vertical or subvertical excavation used for accessing an underground mine; for transporting personnel, equipment and supplies; for hoisting ore and waste; for ventilation and utilities; and/or as an auxiliary exit.
Short ton:Used in imperial statistics. Equal to 2,000 pounds.
Skarn:A rock of complex mineralogical composition, formed by contact metamorphism and metasomatism of carbonate rocks.
Smelting:A pyro-metallurgical operation in which gold is further separated from impurities.
Stope:Underground excavation where the orebody is extracted.
Stripping ratio:The ratio of waste tonnes to ore tonnes mined calculated as total tonnes mined divided by ore tonnes mined.
Stoping:The process of excavating ore underground.
Syngenetic:Formed contemporaneously with the deposition of the sediment.
Tailings:Finely ground rock of low residual value from which valuable minerals have been extracted.
Tailings dam (slimes dam):Dam facilities designed to store discarded tailings.
Tonne:Used in metric statistics. Equal to 1,000 kilograms.
Tonnage:Quantity of material measured in tonnes or tons.
Waste:Material that contains insufficient mineralization for consideration for future treatment and, as such, is discarded.
Yield:The amount of valuable mineral or metal recovered from each unit mass of ore expressed as ounces per short ton or grams per metric tonne.
Zinc precipitation:Zinc precipitation is the chemical reaction using zinc dust that converts gold in solution to a solid form for smelting into unrefined gold bars.
Average number of employees:The monthly average number of production and non-production employees and contractors employed during the year, where contractors are defined as individuals who have entered into a fixed-term contract of employment with a group company or subsidiary. Employee numbers of joint ventures represents the group’s attributable share.
Capital expenditure:Total capital expenditure on tangible assets.
Discontinued operation:A component of an entity that, pursuant to a single plan, has been disposed of or abandoned or is classified as held for sale until conditions precedent to the sale have been fulfilled.
Effective tax rate:Current and deferred taxation charge for the year as a percentage of profit before taxation.
OANDA Corporation:An internet-based provider of forex trading and currency information services.
Rated bonds:The $700 million 5.375 percent bonds due 2020, $300 million 6.5 percent bonds due 2040 and the $750 million 5.125 percent bonds due 2022.
Region:Defines the operational management divisions within AngloGold Ashanti Limited, namely South Africa, Continental Africa (Ghana, Guinea, Mali, Namibia and Tanzania), Australasia, and the Americas (Argentina, Brazil and United States of America).
Related party:Parties are considered related if one party has the ability to control the other party or exercise significant influence over the other party in making financial and operating decisions.
Significant influence:The ability, directly or indirectly, to participate in, but not exercise control over, the financial and operating policy decision of an entity so as to obtain economic benefit from its activities.
STRATE:The licensed Central Securities Depository (CSD) for the electronic settlement of financial instruments in South Africa.
Total cash costs:Total cash costs include site costs for all mining, processing and administration, reduced by contributions from by-products and are inclusive of royalties and production taxes. Depreciation, depletion and amortization, rehabilitation, corporate administration, employee severance costs, capital and exploration costs are excluded. Total cash costs per ounce are the attributable total cash costs divided by the attributable ounces of gold produced.
Total production costs:Total cash costs plus depreciation, depletion and amortization, employee severance costs, rehabilitation and other non-cash costs. Corporate administration and exploration costs are excluded. Total production costs per ounce are the attributable total production costs divided by the attributable ounces of gold produced.
Weighted average number of ordinary shares:The number of ordinary shares in issue at the beginning of the year, increased by shares issued during the year, weighted on a time basis for the period during which they have participated in the income of the group, and increased by share options that are virtually certain to be exercised.
$, US$ or dollar | United States dollars | |||||
ARS | Argentinean peso | |||||
A$ or AUD | Australian dollars | |||||
BRL | Brazilian real | |||||
€ or Euro | European Euro | |||||
C$ or CAD | Canadian dollars | |||||
GHC, cedi or ¢ | Ghanaian cedi | |||||
N$ or NAD | Namibian dollars | |||||
Tsh | Tanzanian Shillings | |||||
ZAR, R or rand | South African rands |
ADS | American Depositary Share | |
ADR | American Depositary Receipt | |
AIFR | All injury frequency rate | |
ASX | Australian Securities Exchange | |
Au | Contained gold | |
BBSY | Bank Bill Swap Bid Rate | |
bn | Billion | |
BEE | Black Economic Empowerment | |
capex | Capital expenditure | |
CDI | Chess Depositary Interests | |
CLR | Carbon Leader Reef | |
Companies Act | South African Companies Act 71, of 2008 | |
DMTNP | Domestic medium-term notes program | |
ERP | Enterprise resource planning | |
FIFR | Fatal injury frequency rate | |
G or g | Grams | |
g/t | Grams per tonne | |
GhDS | Ghanaian Depositary Share | |
GhSE | Ghana Stock Exchange | |
JORC | Australasian Code for Reporting Exploration Results, Mineral Resources and Ore Reserves | |
JIBAR | Johannesburg Interbank Agreed Rate | |
JSE | JSE Limited (Johannesburg Stock Exchange) | |
King III | South African King Code on Corporate Governance, 2009 | |
Kg or kg | Kilograms | |
Km or km | Kilometers | |
LSE | London Stock Exchange | |
LIBOR | London Interbank Offer Rate | |
LOM | Life of mine | |
M or m | Meter or million, depending on the context | |
Moz | Million ounces | |
Mt | Million tonnes or tons | |
Mtpa | Million tonnes/tons per annum | |
NYSE | New York Stock Exchange | |
Oz or oz | Ounces (troy) | |
oz/t | Ounces per ton | |
oz/TEC | Ounces per total employee costed | |
SAMREC | South African Code for the Reporting of Mineral Resources and Mineral Reserves 2007 Edition | |
SEC | United States Securities and Exchange Commission | |
SOX | Sarbanes-Oxley Act of 2002 | |
T or t | Tons (short) or tonnes (metric) | |
Tpa or tpa | Tonnes/tons per annum | |
US/USA/United States | United States of America | |
VCR | Ventersdorp Contact Reef |
Note:Rounding of figures in this report may result in computational discrepancies.
ITEM 1: IDENTITY OF DIRECTORS, SENIOR MANAGEMENT AND ADVISORS
Not applicable.
ITEM 2: OFFER STATISTICS AND EXPECTED TIMETABLE
Not applicable.
| 3A. | SELECTED FINANCIAL DATA |
The selected financial information set forth below for the years ended December 31, 2010, 2011 and 2012 and as at December 31, 2011 and 2012 has been derived from, and should be read in conjunction with, the US GAAP financial statements included under Item 18 of this annual report. The selected financial information for the years ended December 31, 2008 and 2009 and as at December 31, 2008, 2009 and 2010 has been derived from the US GAAP financial statements not included in this annual report.
Year ended December 31, Consolidated statement of income Sales and other income Product sales(2) Interest, dividends and other Costs and expenses Operating costs(3) Royalties Depreciation, depletion and amortization Impairment of assets Interest expense Accretion expense (Profit)/loss on sale of assets, realization of loans, indirect taxes and other Non-hedge derivative loss/(gain) and movement on bonds (Loss)/income from continuing operations before income tax and equity income in associates Taxation (expense)/benefit Equity (loss)/income in associates Net (loss)/income from continuing operations Discontinued operations Net (loss)/income Less: Net income attributable to noncontrolling interests Net (loss)/income - attributable to AngloGold Ashanti Net (loss)/income - attributable to AngloGold Ashanti (Loss)/income from continuing operations Discontinued operations Basic (loss)/earnings per common share (in $)(4) From continuing operations Discontinued operations Net (loss)/income - attributable to AngloGold Ashanti common stockholders Diluted (loss)/income per common share (in $)(4) From continuing operations Discontinued operations Net (loss)/income - attributable to common stockholders Dividend per common share (cents) 2008 (1) 2009 2010 2011 2012 $ $ $ $ $ (in millions, except share and per share amounts) 3,730 3,954 5,402 6,642 6,428 3,655 3,784 5,334 6,570 6,353 75 170 68 72 75 4,103 4,852 5,021 4,521 5,217 2,452 2,543 3,112 3,555 3,876 78 84 142 193 164 615 615 720 789 794 670 8 91 17 367 72 123 151 178 213 22 17 22 28 33 (64 ) 10 (3 ) (43 ) 35 258 1,452 786 (196 ) (265 ) (373 ) (898 ) 381 2,121 1,211 (22 ) 33 (255 ) (705 ) (340 ) (149 ) 88 40 59 (23 ) (544 ) (777 ) 166 1,475 848 23 - - - - (521 ) (777 ) 166 1,475 848 (42 ) (48 ) (54 ) (50 ) (19 ) (563 ) (825 ) 112 1,425 829 (586 ) (825 ) 112 1,425 829 23 - - - - (563 ) (825 ) 112 1,425 829 (1.86 ) (2.30 ) 0.30 3.71 2.15 0.07 - - - - (1.79 ) (2.30 ) 0.30 3.71 2.15 (1.86 ) (2.30 ) 0.30 3.17 1.61 0.07 - - - - (1.79 ) (2.30 ) 0.30 3.17 1.61 13 13 18 34 56
Consolidated balance sheet data (as at period end) Cash and cash equivalents and restricted cash Other current assets Property, plant and equipment and acquired properties, net Goodwill and other intangibles, net Materials on the leach pad (long-term) Total assets Current liabilities Provision for environmental rehabilitation Deferred taxation liabilities Other long-term liabilities and derivatives Equity(5) Total liabilities and equity Capital stock (exclusive of long-term debt and redeemable preferred stock) Number of common shares as adjusted to reflect changes in capital stock Net assets 2008 2009 2010 2011 2012 $ $ $ $ $ (in millions, except share and per share amounts) 585 1,112 585 1,147 927 2,328 1,646 1,412 1,484 1,863 5,579 6,285 6,762 6,902 7,983 152 180 197 213 305 261 324 331 393 445 Other long-term assets, derivatives, deferred taxation assets and other long-term inventory 546 1,115 1,101 1,046 1,579 9,451 10,662 10,388 11,185 13,102 3,458 4,475 1,004 919 1,959 302 385 530 653 758 1,008 1,171 1,200 1,242 1,157 1,277 1,186 3,065 2,849 3,380 3,406 3,445 4,589 5,522 5,848 9,451 10,662 10,388 11,185 13,102 12 12 13 13 13 353,483,410 362,240,669 381,204,080 382,242,343 383,320,962 3,406 3,445 4,589 5,522 5,848
| (1) | 2008 results included the acquisition of the remaining 33 percent shareholding in the Cripple Creek and Victor Gold Mining Company with effect from July 1, 2008. In prior years, the investment was consolidated as a subsidiary. The 2008 accounting treatment is therefore consistent with that of prior years. |
| (2) | Product sales represent revenue from the sale of gold. |
| (3) | Operating costs include production costs, exploration costs, related party transactions, general and administrative, market development costs, employment severance costs and other. |
| (4) | The calculations of basic and diluted (loss)/earnings per common share are described in note 8 to the consolidated financial statements “Income/(loss) per common share”. Amounts reflected exclude E Ordinary shares. |
| (5) | Includes noncontrolling interests. |
Annual dividends
The table below sets forth the amounts of interim, final and total dividends paid in respect of the past five years in cents per ordinary share. In respect of 2012, a fourth quarter dividend of 50 South African cents per ordinary share was declared on February 18, 2013, with a record date of March 15, 2013 and a payment date of March 28, 2013.
| Year ended December 31(1) | 2008 | 2009 | 2010 | 2011 | 2012 | |||||||||||||||
South African cents per ordinary share | ||||||||||||||||||||
First quarter | 100 | |||||||||||||||||||
Second quarter | 50 | 60 | 65 | 90 | 100 | |||||||||||||||
Third quarter | 90 | 50 | ||||||||||||||||||
Fourth quarter | 50 | 70 | 80 | 200 | 50 | |||||||||||||||
Total | 100 | 130 | 145 | 380 | 300 | |||||||||||||||
US cents per ordinary share(2) | ||||||||||||||||||||
First quarter | 11.81 | |||||||||||||||||||
Second quarter | 6.45 | 7.66 | 9.00 | 12.08 | 12.10 | |||||||||||||||
Third quarter | 10.87 | 5.76 | ||||||||||||||||||
Fourth quarter | 5.00 | 9.50 | 11.26 | 27.50 | 5.40 | |||||||||||||||
Total | 11.45 | 17.16 | 20.26 | 50.45 | 35.07 | |||||||||||||||
| (1) | During quarter three of 2011, the Company changed the frequency of dividend payments from half-yearly to quarterly. |
| (2) | Dividends for these periods were declared in South African cents. US dollar cents per share figures have been calculated based on exchange rates prevailing on each of the respective payment dates. |
For further information on the company’s policy on dividend distributions, see “Item 8A: Consolidated statements and other financial information – Annual dividend”.
Exchange rate information
The following table sets forth, for the periods and dates indicated, certain information concerning US dollar/South African rand exchange rates expressed in rands per $1.00. On April 19, 2013, the interbank rate between South African rands and US dollars as reported by OANDA Corporation was R9.17/$1.00.
| Year ended December 31 | High | Low | Year end | Average (1) | ||||||||||||
2008(2) | 11.27 | 6.74 | 9.30 | 8.26 | ||||||||||||
2009(3) | 10.70 | 7.21 | 7.41 | 8.44 | ||||||||||||
2010(3) | 8.08 | 6.57 | 6.64 | 7.34 | ||||||||||||
2011(3) | 8.60 | 6.49 | 8.14 | 7.27 | ||||||||||||
2012(3) | 8.95 | 7.46 | 8.47 | 8.20 | ||||||||||||
2013(3)(4) | 9.31 | 8.47 | 9.17 | 8.96 | ||||||||||||
| (1) | The average rate of exchange on the last business day of each month during the year. |
| (2) | Based on the noon buying rate in New York City for cable transfers as certified for customs purposes by the Federal Reserve Bank of New York. |
| (3) | Based on the interbank rate as reported by OANDA Corporation. |
| (4) | Through to April 19, 2013. |
| Exchange rate information for the months of (1) | High | Low | ||||||
October 2012 | 8.84 | 8.30 | ||||||
November 2012 | 8.95 | 8.63 | ||||||
December 2012 | 8.90 | 8.47 | ||||||
January 2013 | 9.07 | 8.47 | ||||||
February 2013 | 8.99 | 8.81 | ||||||
March 2013 | 9.31 | 8.89 | ||||||
April 2013(2) | 9.23 | 9.08 | ||||||
| (1) | Based on the interbank rate as reported by OANDA Corporation. |
| (2) | Through to April 19, 2013. |
| 3B. | CAPITALIZATION AND INDEBTEDNESS |
Not applicable.
| 3C. | REASONS FOR THE OFFER AND USE OF PROCEEDS |
Not applicable.
| 3D. | RISK FACTORS |
This section describes many of the risks that could affect AngloGold Ashanti. There may however be additional risks unknown to AngloGold Ashanti and other risks, currently believed to be immaterial, that could turn out to be material. Additional risks may arise or become material subsequent to the date of this document. These risks, either individually or simultaneously, could significantly affect the group’s business, financial results and the price of its securities.
Risks related to AngloGold Ashanti’s results of operations and financial condition as a result of factors that impact the gold mining industry generally.
Commodity market price fluctuations could adversely affect the profitability of operations.
AngloGold Ashanti’s revenues are primarily derived from the sale of gold and, to a lesser extent, uranium, silver and sulfuric acid. The company’s current policy is to sell its products at prevailing market prices and not to enter into price hedging arrangements. The market prices for these commodities fluctuate widely. These fluctuations are caused by numerous factors beyond the company’s control. For example, the market price of gold may change for a variety of reasons, including:
speculative positions taken by investors or traders in gold;
monetary policies announced or implemented by central banks, including the US Federal Reserve;
changes in the demand for gold as an investment or as a result of leasing arrangements;
changes in the demand for gold used in jewellery and for other industrial uses, including as a result of prevailing economic conditions;
changes in the supply of gold from production, divestment, scrap and hedging;
financial market expectations regarding the rate of inflation;
the strength of the US dollar (the currency in which the gold price trades internationally) relative to other currencies;
changes in interest rates;
actual or anticipated sales or purchases of gold by central banks and the International Monetary Fund;
gold hedging and de-hedging by gold producers;
global or regional political or economic events; and
the cost of gold production in major gold producing countries.
The market price of gold has been and continues to be significantly volatile. During 2012, the gold price traded from a low of $1,540 per ounce to a high of $1,790 per ounce. On April 19, 2013, the closing price of gold was $1,404 per ounce. The price of gold is often subject to sharp, short-term changes; for example, during the period from Friday, April 12, 2013 through Monday, April 15, 2013, the price of gold dropped $228 per ounce. While the overall supply of and demand for gold can affect its market price, the considerable size of historical mined (i.e., above ground) stocks of the metal means that these factors typically do not affect the gold price in the same manner or degree as for other commodities. In addition, the shift in demand from physical gold to investment and speculative demand may exacerbate the volatility of the gold price.
During 2012, there appeared to develop a relationship between the central banks and the price of gold with the price falling at the prospect of the end of quantitative easing in some of the main economies.
A sustained period of significant gold price volatility may adversely affect the company’s ability to evaluate the feasibility of undertaking new capital projects, or the continuity of existing operations, or to make other long-term strategic decisions. The use of lower gold prices in reserve calculations and life-of-mine plans could result in material write-downs of the company’s investment in mining properties and increased amortization, reclamation and closure charges.
The spot price of uranium has been volatile in past years. During 2012, the price varied between a low of approximately $41 per pound and a high of $53 per pound. On April 19, 2013, the spot price of uranium was $41 per pound. Uranium prices can be affected by several factors, including demand for nuclear reactors, uranium production shortfalls and restocking by utilities. Events like those surrounding the earthquake and tsunami that occurred in Japan in 2011 can also have a material impact on the price of and demand for uranium.
The price of silver has experienced significant fluctuations. From a low of $26 per ounce in January 2012, the price rose steadily to reach a high of $37 per ounce in February 2012. By December 2012, the price had dropped to approximately $30 per ounce. Factors affecting the price of silver include investor demand, physical demand for silver bars, industrial and retail off-take, and silver coin minting. On April 19, 2013, the price of silver was $23 per ounce.
If revenue from sales of gold, uranium, silver or sulfuric acid falls below their respective cost of production for an extended period, AngloGold Ashanti may experience losses or be forced to change its dividend payment policies and curtail or suspend some or all of its exploration projects and existing operations. Declining commodities prices may also force a reassessment of the feasibility of a particular project or projects, which could cause substantial delays or interrupt operations until the reassessment can be completed.
Foreign exchange fluctuations could have a material adverse effect on AngloGold Ashanti’s results of operations and financial condition.
Gold is principally a US dollar-priced commodity and most of the company’s revenues are realized in, or linked to, US dollars while production costs are largely incurred in the local currency where the relevant operation is located. Given the company’s global operations and local foreign exchange regulations, some of its funds are held in local currencies, such as the South African rand, Ghanaian cedi, Brazilian real, Argentinean peso and the Australian dollar.
Exchange rate movements may have a material impact on AngloGold Ashanti’s operating results. For example, the company estimates that a 1 percent strengthening of all of the South African rand, Brazilian real, the Argentinean peso or the Australian dollar against the US dollar will, other factors remaining equal, result in an increase in total cash costs under IFRS of approximately $6 per ounce or approximately 1 percent of the company’s total cash costs. The impact on cash costs determined under US GAAP may be different.
The profitability of operations and the cash flows generated by these operations are significantly affected by fluctuations in input production prices, many of which are linked to the prices of oil and steel.
Fuel, energy and consumables, including diesel, heavy fuel oil, chemical reagents, explosives, tyres, steel and mining equipment consumed in mining operations form a relatively large part of the operating costs and capital expenditure of any mining company.
AngloGold Ashanti has no influence over the cost of these consumables, many of which are linked to some degree to the price of oil and steel.
The price of oil has recently been volatile, fluctuating between $88.40 and $130.57 per barrel of Brent crude in 2012. As of April 19, 2013, the price of oil was at $100.09 per barrel of Brent Crude. AngloGold Ashanti estimates that for each US dollar per barrel rise in the oil price, other factors remaining equal, the total cash costs under IFRS of all its operations increases by approximately $0.90 per ounce. The impact on cash costs determined under US GAAP may be different. The cash costs of certain of the company’s mines, particularly Yatela, Sadiola, Siguiri, Geita, Navachab, Morila, and Cripple Creek & Victor, are most sensitive to changes in the price of oil.
Furthermore, the price of steel has also been volatile. Steel is used in the manufacture of most forms of fixed and mobile mining equipment, which is a relatively large contributor to the operating costs and capital expenditure of a mine. For example, the price of flat hot rolled coil (North American Domestic FOB) steel traded between $590 per tonne and $733 per tonne in 2012. On April 19, 2013, the price of flat hot rolled coil (North American Domestic FOB) was $609 per tonne.
Fluctuations in oil and steel prices have a significant impact on operating costs and capital expenditure estimates and, in the absence of other economic fluctuations, could result in significant changes in the total expenditure estimates for new mining projects or render certain projects non-viable.
Energy cost increases and power fluctuations and stoppages could adversely impact the company’s results of operations and financial condition.
Increasing global demand for energy, concerns about nuclear power, and the limited growth of new supply are impacting the price and supply of energy. The transition of emerging markets to higher energy consumption, carbon taxation as well as unrest and potential conflict in the Middle East, among other factors, could result in increased demand or constrained supply and sharply escalating oil and energy prices.
AngloGold Ashanti’s mining operations are substantially dependent upon electrical power generated by local utilities or by power plants situated at some of its operations. The unreliability of these local sources of power can have a material effect on the company’s operations, as large amounts of power are required for exploration, development, extraction, processing and other mining activities on the company’s properties.
In South Africa, the company’s operations are dependent on electricity supplied by one state-owned power generation company, Eskom. Electricity is used for most business and safety-critical operations that include cooling, hoisting and dewatering. Loss of power can therefore impact production, employee safety and prolonged outages could lead to flooding of workings and ore sterilization. In 2008, Eskom and the South African government declared a national emergency and warned that they could no longer guarantee the availability of electricity due to a national supply shortage blamed on coal supply shortages and unplanned generation-set outages as a result of maintenance backlog and asset age. The entire country went into a program of rolling blackouts and AngloGold Ashanti and other mining companies operating in South Africa were forced in late January until mid-March of 2008 to temporarily suspend mining operations at their mines. In addition, lightning damage to power stations can result in power interruptions at our operations. In this regard, AngloGold Ashanti’s two main operational sites in the West Wits region in South Africa had all main power interrupted between March 13, 2013 and March 15, 2013 after a fire caused by lightning damaged a transformer at a main regional substation. The power supply to AngloGold Ashanti’s South African operations may be curtailed or interrupted again in the future. A warning of the “very high” risk of blackouts was re-issued at the start of 2011 and again in 2012. While a national energy conservation program is in place, Eskom cannot guarantee that there will be no power interruptions and is again facing very tight supply reserve margins in 2013, which we expect to continue at least until the new coal fired Medupi Power Station starts to come on line in early 2014.
Eskom and the National Energy Regulator of South Africa (NERSA) recognize the need to increase electricity supply capacity and a series of tariff increases and proposals have been enacted to assist in the funding of this expansion. In 2010, NERSA approved an annual increase of 24.8 percent for 2010, 25.8 percent for 2011, 25.9 percent for 2012, and 16.0 percent for 2013. The actual increase implemented for 2012 was lowered to 16.09 percent after government intervention, but there can be no assurance as to the existence or nature of any government intervention in the future. In February 2013, NERSA announced that Eskom would be allowed to increase electricity tarriffs at an average yearly rate of 8 percent between 2013 and 2018. This increase is half the 16 percent sought by the utility in its application. As energy represents a large proportion of the company’s operating costs in South Africa, these increases have had, and any future increases will have, a materially adverse impact on the cash costs of its South African operations.
The company has also identified a risk of energy shortages in Argentina and the DRC. Furthermore, all of the company’s mining operations in Ghana depend on hydroelectric power supplied by the state-controlled Volta River Authority (VRA), which is supplemented by thermal power from the Takoradi plant and a smaller unit at Tema. During periods of below average inflows from the Volta reservoir, electricity supplies from the Akosombo Dam, the VRA’s primary generation source, may be curtailed as occurred in 1998, 2006 and the first half of 2007. During periods of limited electricity availability, the grid is subject to disturbances and voltage fluctuations which can damage equipment. Recent disruptions in natural gas supply from Nigeria, via the West Africa Gas Pipeline, has led to some reduction in thermal generation capacity and the use of more expensive light crude oil which is putting upward pressure on power tariffs. In the past, the VRA has obtained power from neighboring Côte d’Ivoire, which has intermittently experienced political instability and civil unrest. AngloGold Ashanti negotiates rates directly with the VRA and the VRA may not agree to a satisfactory rate during future rounds of negotiations.
The company’s mining operations in Guinea, Tanzania and Mali are dependent on power supplied by outside contractors and supplies of fuel are delivered by road. Power supplies have been disrupted in the past, resulting in production losses due to equipment failure.
Increased energy prices could negatively impact operating costs and cash flow of AngloGold Ashanti’s operations.
Global economic conditions could adversely affect the profitability of operations.
AngloGold Ashanti’s operations and performance depend significantly on worldwide economic conditions. The global financial markets have experienced considerable volatility from uncertainty surrounding the level and sustainability of the sovereign debt of various countries. Concerns remain regarding the sustainability of the European Monetary Union and its common currency, the euro, in their current form, as well as the negative impacts of the recent downgrade of the sovereign credit rating of the Republic of South Africa. These conditions and other disruptions to international credit markets and financial systems have caused a loss of investor confidence and resulted in widening credit spreads, a lack of price transparency, increased credit losses and tighter credit conditions. Despite the aggressive measures taken by governments and central banks so far, economic recovery has been extremely slow. A significant risk remains that these measures may not prevent the global economy from falling back into an even deeper and longer lasting recession or even a depression.
A global economic downturn and recession may have follow-on effects on AngloGold Ashanti’s business that include inflationary cost pressures and commodity market fluctuations.
Other effects could, for example, include:
the insolvency of key suppliers or contractors which could result in contractual breaches and in a supply chain breakdown;
the insolvency of one or more joint venture partners which could result in contractual breaches and disruptions at the operations of the company’s joint ventures;
changes in other income and expense which could vary materially from expectations, depending on gains or losses realized on the sale or exchange of financial instruments, and impairment charges that may be incurred with respect to investments;
AngloGold Ashanti’s defined benefit pension fund may not achieve expected returns on its investments, which could require the company to make substantial cash payments to fund any resulting deficits;
a reduction in the availability of credit which may make it more difficult for the company to obtain financing for its operations and capital expenditures or make that financing more costly; and
exposure to the liquidity and insolvency risks of the company’s lenders and customers;
any of which could negatively affect AngloGold Ashanti’s financial results.
Inflation may have a material adverse effect on results of operations.
Many of AngloGold Ashanti’s operations are located in countries that have experienced high rates of inflation during certain periods. It is possible that significantly higher future inflation in the countries in which the company operates may result in an increase in operational costs in local currencies (without a concurrent devaluation of the local currency of operations against the dollar or an increase in the dollar price of gold). This could have a material adverse effect on the company’s results of operations and financial condition. Significantly higher and sustained inflation, with a consequent increase in operational costs, could result in the rationalization of higher cost mines or projects.
Mining companies face many risks related to the development of mining projects that may adversely affect the company’s results of operations and profitability.
The profitability of mining companies depends partly on the actual costs of developing and operating mines, which may differ significantly from estimates determined at the time the relevant project was approved following completion of its feasibility study. Development of mining projects may also be subject to unexpected problems and delays that could increase the development and operating costs of the relevant project.
AngloGold Ashanti’s decision to develop a mineral property is typically based on the results of a feasibility study. Feasibility studies estimate the expected or anticipated economic returns from the project. These estimates are based on assumptions regarding:
future prices of gold, uranium, silver and other metals;
future currency exchange rates;
tonnage, grades and metallurgical characteristics of ore to be mined and processed;
anticipated recovery rates of gold, uranium, silver and other metals extracted from the ore;
anticipated capital expenditure and cash operating costs; and
required return on investment.
Actual cash operating costs, production and economic returns may differ significantly from those anticipated by such studies and estimates. Operating costs and capital expenditure are to a significant extent driven by the cost of commodity inputs consumed in mining, including fuel, chemical reagents, explosives, tyres and steel, and also by credits from by-products, such as silver and uranium. They could also fluctuate considerably as a result of changes in the prices of mining equipment used in the construction and operation of mining projects.
There are a number of uncertainties inherent in the development and construction of a new mine or the extension of an existing mine. In addition to those discussed above, these uncertainties include the:
timing and cost of construction of mining and processing facilities, which can be considerable;
availability and cost of mining and processing equipment;
availability and cost of skilled labor, power, water and transportation;
availability and cost of appropriate smelting and refining arrangements;
applicable requirements and time needed to obtain the necessary environmental and other governmental permits; and
availability of funds to finance construction and development activities.
The remote location of many mining properties, permitting requirements and/or delays, third-party legal challenges to individual mining projects and broader social or political opposition to mining may increase the cost, timing and complexity of mine development and construction. New mining operations could experience unexpected problems and delays during the development, construction, commissioning and commencement of production. AngloGold Ashanti may prove unable to successfully develop the La Colosa and Gramalote projects as well as other potential exploration sites in Colombia due to difficulties that could arise in relation to, for example, social and community opposition, litigation, ore body grades, definition of adequate reserves and resources, and the time taken to prove project feasibility that could result in the expiry of permits. For example, on March 11, 2013, Cortolima, a regional environmental authority in Colombia, issued an injunction against AngloGold Ashanti’s Colombian subsidiary, alleging that the subsidiary was operating without proper permits and was engaging in activity that was harmful to the environment. Furthermore, at around the same period in time, access to an AngloGold Ashanti drilling site was blockaded by residents of a nearby community.
Accordingly, AngloGold Ashanti’s future development activities may not result in the expansion or replacement of current production, or one or more new production sites or facilities may be less profitable than anticipated or may be loss-making. The company’s operating results and financial condition are directly related to the success of its project developments. A failure in the company’s ability to develop and operate mining projects in accordance with, or in excess of, expectations could negatively impact its results of operations, as well as its financial condition and prospects.
Mining companies face uncertainty and risks in exploration, feasibility studies and other project evaluation activities.
AngloGold Ashanti must continually replace Ore Reserve depleted by mining and production to maintain or increase production levels in the long term. This is undertaken by exploration activities that are speculative in nature. The ability of the company to sustain or increase its present levels of gold production depends in part on the success of its projects and it may be unable to sustain or increase such levels. For example, in South Africa, the company experienced declining production rates (1.213 million ounces of gold in 2012, compared with 1.624 million ounces of gold in 2011 and 1.784 million ounces in 2010), principally due to continued safety and associated stoppages, mining flexibility constraints and overall falls in grades. The significant decrease in 2012 was also mainly attributable to the industrial strike action at the company’s South African mines, which resulted in the loss of production of 235,000 ounces of gold.
Feasibility studies and other project evaluation activities necessary to determine the current or future viability of a mining operation are often unproductive. Such activities often require substantial expenditure on exploration drilling to establish the presence, extent and grade (metal content) of mineralized material. AngloGold Ashanti undertakes feasibility studies to estimate the technical and economic viability of mining projects and to determine appropriate mining methods and metallurgical recovery processes. These activities are undertaken to estimate the Ore Reserve.
Once mineralization is discovered, it may take several years to determine whether an adequate Ore Reserve exists, during which time the economic feasibility of the project may change due to fluctuations in factors that affect both revenue and costs, including:
future prices of metals and other commodities;
future foreign currency exchange rates;
the required return on investment as based on the cost and availability of capital; and
applicable regulatory requirements, including environmental, health and safety matters.
Feasibility studies also include activities to estimate the anticipated:
tonnages, grades and metallurgical characteristics of the ore to be mined and processed;
recovery rates of gold, uranium and other metals from the ore; and
capital expenditure and cash operating costs.
These estimates depend on assumptions made on available data. Ore Reserve estimates are not precise calculations and depend on the interpretation of limited information on the location, shape and continuity of the mineral occurrence and on available sampling results. Further exploration and feasibility studies can result in new data becoming available that may change previous Ore Reserve estimates and impact the technical and economic viability of production from the project. Changes in the forecast prices of commodities, exchange rates, production costs or recovery rates may change the economic status of reserves resulting in revisions to previous Ore Reserve estimates. These revisions could impact depreciation and amortization rates, asset-carrying amounts, provisions for closedown, restoration and environmental rehabilitation costs.
AngloGold Ashanti undertakes annual revisions to its Ore Reserve estimates based upon actual exploration and production results, depletion, new information on geology, model revisions and fluctuations in production, economic assumptions and operating and other costs. These factors may result in reductions in Ore Reserve estimates, which could adversely affect life-of-mine plans and consequently the total value of the company’s mining asset base. Ore Reserve restatements could negatively affect the company’s results of operations, as well as its financial condition and prospects.
The increased overall demand for gold and other commodities, combined with a declining rate of discovery of new gold Ore Reserve in recent years, has resulted in the accelerated depletion of the existing Ore Reserve across the global gold sector. AngloGold Ashanti therefore faces intense competition for the acquisition of attractive mining properties. From time to time, the company evaluates the acquisition of an Ore Reserve, development properties or operating mines, either as stand-alone assets or as part of companies. AngloGold Ashanti’s decision to acquire these properties has been based on a variety of factors including historical operating results, estimates and assumptions regarding the extent of the Ore Reserve, cash and other operating costs, gold prices, projected economic returns and evaluations of existing or potential liabilities associated with the relevant property and its operations and how these factors may change in future. Other than historical operating results, these factors are uncertain and could have an impact on revenue, cash and other operating costs, as well as the process used to estimate the Ore Reserve.
As a result of these uncertainties, exploration and acquisitions by the company may not result in the expansion or replacement of current production or the maintenance of its existing Ore Reserve net of production or an increase in Ore Reserve. AngloGold Ashanti’s results of operations and financial condition are directly related to the success of its exploration and acquisition efforts and ability to replace or increase the existing Ore Reserve. If the company is not able to maintain or increase its Ore Reserve, its results of operations as well as its financial condition and prospects could be adversely affected.
Mining companies face many risks related to their operations that may adversely impact cash flows and overall profitability.
Gold mining is susceptible to events that may adversely impact a mining company’s ability to produce gold and meet production and cost targets. These events include, but are not limited to:
environmental, as well as health and safety incidents during production or transportation resulting in injury, loss of life, or damage to equipment;
ground and surface water pollution;
social or community disputes or interventions;
security incidents;
surface or underground fires or explosions;
electrocution;
falls from heights and accidents relating to mobile machinery, including shaft conveyances and elevators, drilling blasting and mining operations;
labor force disputes and disruptions;
loss of information integrity or data;
activities of illegal or artisanal miners;
shortages in material and equipment;
mechanical failure or breakdowns and ageing infrastructure;
failure of unproven or evolving technologies;
energy and electrical power supply interruptions or rationing;
unusual or unexpected geological formations, ground conditions, including lack of mineable face length, and ore-pass blockages;
water ingress and flooding;
process water shortages;
metallurgical conditions and gold recovery;
unexpected decline of ore grade;
unanticipated increases in gold lock-up and inventory levels at heap-leach operations;
fall-of-ground accidents in underground operations;
cave-ins, sinkholes, subsidence, rock falls, rock bursts, or landslides;
failure of mining pit slopes, heap-leach facilities, water or solution dams, waste stockpiles and tailings dam walls;
legal and regulatory restrictions and changes to such restrictions;
safety-related stoppages;
gold bullion theft;
corruption, fraud and theft;
allegations of human rights abuses;
seismic activity; and
other natural phenomena, such as floods, droughts or weather conditions, potentially exacerbated by climate change.
Seismic activity is of particular concern in underground mining operations, particularly in South Africa due to the extent and extreme depth of mining, and also in Australia and Brazil due to the depth of mining and residual tectonic stresses. Despite modifications to mine layouts and support technology, as well as other technological improvements employed with a view to minimizing the incidence and impact of seismic activity, seismic events have caused death and injury to employees and contractors and may do so again in future, and have in the past and may again result in safety-related stoppages.
Seismic activity may also cause the loss of mining equipment, damage to or destruction of mineral properties or production facilities, monetary losses, environmental damage and potential legal liabilities. As a result, these events may have a material adverse effect on AngloGold Ashanti’s results of operations and financial condition. For example, in early 2011, mining of the Ventersdorp Contact Reef shaft pillar at Tau Tona was suspended following a significant seismic event. New equipment had to be purchased and the shutdown contributed to the decline in the operational output of the mine as compared to the previous year.
In the past, floods have also disrupted the operations of some of the company’s mines. For example, unprecedented heavy rains in February and March 2011 in Australia flooded the Sunrise Dam Gold Mine and forced a temporary shutdown of operations. The flood event impacted underground production for approximately four months and open pit production for approximately six months. Despite the shutdown, full costs were incurred as the mining contractors worked on remedial activities to repair damage and rehabilitate flooded areas. The considerable remedial work required adversely impacted cash costs per ounce and the impact of the flood event and the pit wall failure together significantly reduced planned production at the plant.
Mining companies’ operations are vulnerable to infrastructure constraints.
Mining, processing, development and exploration activities depend on adequate infrastructure. Reliable rail, ports, roads, bridges, power sources, power transmission facilities and water supply are critical to the company’s business operations and affect capital and operating costs. These infrastructure and services are often provided by third parties whose operational activities are outside the control of the company.
Interferences in the maintenance or provision of infrastructure, including unusual weather phenomena, sabotage and social unrest, could impede the company’s ability to deliver its products on time and adversely affect AngloGold Ashanti’s business, results of operations and financial condition.
Establishing infrastructure for the company’s development projects requires significant resources, identification of adequate sources of raw materials and supplies, and necessary co-operation from national and regional governments, none of which can be assured.
AngloGold Ashanti has operations or potential development projects in countries where government-provided infrastructure may be inadequate and regulatory regimes for access to infrastructure may be uncertain, which could adversely impact the efficient operation and expansion of its business. AngloGold Ashanti may not secure and maintain access to adequate infrastructure in the future, or it may not do so on reasonable terms.
Mining companies face strong competition.
The mining industry is competitive in all of its phases. AngloGold Ashanti competes with other mining companies and individuals for specialized equipment, components and supplies necessary for exploration and development, for mining claims and leases on exploration properties and for the acquisition of mining assets. These competitors may have greater financial resources, operational experience and technical capabilities than AngloGold Ashanti. Competition may increase AngloGold Ashanti’s cost of acquiring suitable claims, properties and assets.
Mining companies are subject to extensive health and safety laws and regulations.
Gold mining operations are subject to extensive health and safety laws and regulations in every jurisdiction they operate in. These laws and regulations, along with international and industry standards, designed to protect and improve the safety and health of employees, require extensive compliance measures.
From time to time, new or updated health and safety laws, regulations and standards are introduced. Should compliance with these require a material increase in expenditure or material changes or interruptions to operations or production, including as a result of any failure to comply with applicable regulations, the company’s results of operations and financial condition could be adversely affected. Furthermore, AngloGold Ashanti is implementing an enhanced safety program, which could result in additional costs for the company.
In some of the jurisdictions in which AngloGold Ashanti operates, the government enforces compulsory shutdowns of operations to enable investigations into the cause of accidents. Certain of the company’s operations have been temporarily suspended for safety reasons in the past. In South Africa, in particular, so-called ‘Section 54 safety stoppages’ have become a significant issue. In 2011, the Inspector of Mines ordered the shutdown of entire mines in cases of relatively minor violations, which had a material impact on production at these mines. In particular, the Inspector issued Kopanang eleven Section 54 notices during 2011. Each notice resulted in Kopanang suspending operations either fully or partially in order to comply with the inspector’s recommendations on safety.
Safety-related stoppages resulted in the direct loss of 72,900 and 72,400 ounces of gold production during 2011 and 2012, respectively, in South Africa.
A working group comprised of the inspectorate, the mining industry and organized labor has been formed to address the trend of increasing safety stoppages in South Africa. However, the working group may not agree on how to address this issue and the number of safety stoppages may continue or even increase in the future.
AngloGold Ashanti’s reputation could be damaged by any significant governmental investigation or enforcement of health and safety laws, regulations or standards. Any of these factors could have a material adverse effect on the company’s results of operations and financial condition.
Mining companies are increasingly required to operate in a sustainable manner and to provide benefits to affected communities. Failure to comply with these requirements can result in legal suits, additional operational costs, investor divestment, loss of ‘social licence to operate’, and adversely impact mining companies’ financial condition.
As a result of public concern about the perceived ill effects of economic globalization, businesses in general and large multinational mining corporations such as AngloGold Ashanti in particular face increasing public scrutiny of their activities.
These businesses are under pressure to demonstrate that while they seek a satisfactory return on investment for shareholders, human rights are respected and other social partners, including employees, host communities and more broadly the countries in which they operate, also benefit from their commercial activities. Such pressures tend to be particularly focused on companies whose activities are perceived to have, or have, a high impact on their social and physical environment. The potential consequences of these pressures and the adverse publicity in cases where companies are believed not to be creating sufficient social and economic benefit may result in additional operating costs, reputational damage, active community opposition, allegations of human rights abuses, legal suits and investor withdrawal.
Existing and proposed mining operations are often located at or near existing towns and villages, natural water courses and other infrastructure. As the impacts of dust generation, waste storage, water pollution or shortage, in particular, may be immediate and directly adverse to those communities, poor environmental management practices, or adverse changes in the supply or quality of water can result in community protest, regulatory sanctions or ultimately in the withdrawal of community and government support for company operations. For example, opposition to mining activity in the Tolima province of Colombia, which hosts the La Colosa deposit, has centered on the perception that large-scale mining activity will have a detrimental impact on the region’s river systems.
Mining operations must be designed to minimize their impact on such communities and the environment, either by changing mining plans to avoid such impact, by modifying operations, or by relocating the affected people to an agreed location. Responsive measures may also include the full restoration of livelihoods of those impacted.
In addition, as AngloGold Ashanti has a long history of mining operations in certain regions, issues may arise regarding historical as well as potential future environmental or health impacts in those areas. For example, certain parties, including non-governmental organizations, community groups and institutional investors, have raised concerns about surface and groundwater quality, among other issues, in the area surrounding the company’s Obuasi and Iduapriem mines in Ghana, including potential impacts to local rivers and wells used for water from heavy metals, arsenic and cyanide as well as sediment and mine rock waste.
Disputes with surrounding communities may also affect mining operations, particularly where they result in restrictions of access to supplies and to mining operations. The miners’ access to land may be subject to the rights or asserted rights of various community stakeholders, including indigenous people. Access to land and land use is of critical importance to the company for exploration and mining, as well as for ancillary infrastructure. In some cases, AngloGold Ashanti has had difficulty gaining access to new land because of perceived poor community compensation practices. For example, compensation remains a significant area of concern in Siguiri in Guinea. In 2011, a violent community protest interrupted operations for three days, which contributed to the project’s decline in production as compared to 2010. Delays in projects attributable to a lack of community support can translate directly into a decrease in the value of a project or into an inability to bring the project to production.
The cost of measures and other issues relating to the sustainable development of mining operations could place significant demands on personnel resources, could increase capital and operating costs and could have an adverse impact on AngloGold Ashanti’s reputation, results of operations and financial condition.
Mining companies are subject to extensive environmental laws and regulations.
Mining companies are subject to extensive environmental laws and regulations in the various jurisdictions in which they operate in addition to international standards. These regulations and standards establish limits and conditions on a miner’s ability to conduct its operations and govern, among other things, extraction, use and conservation of water resources; air emissions (including dust control) and water treatment and discharge; regulatory and community reporting; clean-up of contamination; worker safety and community health; and the generation, transportation, storage and disposal of solid and hazardous wastes, such as acids, radioactive materials, and mine tailings.
The cost of compliance with environmental laws and regulations is expected to continue to be significant to AngloGold Ashanti. AngloGold Ashanti could incur fines, penalties and other sanctions, clean-up costs, and third-party claims for personal injury or property damages, suffer reputational damage, or be required to install costly pollution control equipment or to modify or suspend operations, as a result of actual or alleged violations of environmental laws and regulations. In addition, unknown environmental hazards may exist on the company’s properties which may have been caused by previous owners or operators.
For example, in 2010 AngloGold Ashanti’s Obuasi mine in Ghana suspended gold processing operations for five days to implement a revised water management strategy aimed at reducing contaminants contained in its discharge. Brief stoppages after environmental incidents, such as pipeline failures, have occurred more recently at that mine. Furthermore, following a temporary suspension of operations at the Iduapriem mine, the company, with the approval of the Ghana Environmental Protection Agency, constructed an interim tailings storage facility for tailings deposition for a year while a new tailings storage facility was being constructed. The company continues to seek to make improvements in water quality management to reduce the risk of unpermitted and/or accidental discharges and, in addition, it is currently investigating allegations of impacts on water quality in the area of these mines.
Failure to comply with applicable environmental laws and regulations may also result in the suspension or revocation of operating permits. AngloGold Ashanti’s ability to obtain and maintain permits and to successfully operate in particular communities may be adversely impacted by real or perceived effects on the environment or human health and safety associated with AngloGold Ashanti’s or other mining companies’ activities.
For example, in Colombia, various plaintiffs, including associations that represent local communities, have brought legal proceedings against AngloGold Ashanti Colombia S.A. (AGAC) alleging that AGAC has violated applicable environmental laws in connection with the La Colosa project. If the plaintiffs were to prevail, AGAC’s three core concession contracts relating to the La Colosa project may be cancelled, AGAC would be required to abandon the La Colosa project and all other existing mining concession contracts and pending proposals for new mining concession contracts of AGAC, though not those of other companies of the AngloGold Ashanti group operating in Colombia. In addition, AGAC would be banned from doing business with the Colombian government for a period of five years. See Item 8A.: – “Legal proceedings”.
Environmental laws and regulations are continually changing and are generally becoming more stringent. Changes to AngloGold Ashanti’s environmental compliance obligations or operating practices could adversely affect the company’s rate of production and revenue. Variations in laws and regulations, assumptions made to estimate liabilities, standards or operating procedures, more stringent emission or pollution thresholds or controls, or the occurrence of unanticipated conditions, may require operations to be suspended or permanently closed, and could increase AngloGold Ashanti’s expenses and provisions. These expenses and provisions could adversely affect the company’s results of operations and financial condition.
For example, the use of sodium cyanide in metallurgical processing is under increasing environmental scrutiny and is prohibited for certain jurisdictions. As there are few, if any, effective substitutes in extracting gold from the ore, any ban or material restrictions on the use of sodium cyanide in mining operations in the jurisdictions where AngloGold Ashanti conducts its operations could adversely affect the company’s results of operations and financial condition. In addition, leaks or discharges of sodium cyanide or other hazardous materials could result in liabilities for clean-up or personal injury that may not be covered by insurance.
AngloGold Ashanti’s operations are heavily dependent upon access to substantial volumes of water for use in the mining and extractive processes and typically are subject to water-use permits that govern usage and require, among other things, that mining operations maintain certain water quality upon discharge. Water quality and usage are areas of concern globally, such as with respect to the company’s mining operations in Ghana and South Africa and its exploration projects in Colombia, where there is significant potential environmental and social impact and a high level of stakeholder scrutiny. Any failure by the company to secure access to suitable water supplies, or achieve and maintain compliance with applicable requirements of the permits or licenses, could result in curtailment or halting of production at the affected operation. Incidents of water pollution or shortage can, in extreme cases, lead to community protest and ultimately to the withdrawal of community and government support for our operations. Water scarcity has been identified as a significant risk at AngloGold Ashanti’s US operation in particular. Production at the Cripple Creek & Victor Gold Mining Company’s Cresson mine continued to be affected by a severe drought in 2011 and 2012. The lack of water reduced percolation through the heap-leach pad, which curtailed production and productivity.
Mining and mineral processing operations generate waste rock and tailings. The impact of dust generation, breach, leak, or failure of a waste rock or tailings storage facility, can be significant. An incident at AngloGold Ashanti’s operations could lead to, among others, obligations to remediate environmental contamination and claims for property damage and personal injury from adjacent communities. Incidents at other companies’ operations could result in governments tightening regulatory requirements and restricting mining activities.
In addition, mining companies are required by law to close their operations at the end of the mine life and rehabilitate the lands mined. Estimates of total ultimate closure and rehabilitation costs for gold mining operations are significant and based principally on life-of-mine profiles, changing inflation and discount rate assumptions, changing designs of tailing storage facilities and current legal and regulatory requirements that may change materially. Environmental liabilities are accrued when they become known, probable and can be reasonably estimated. Increasingly, regulators are seeking security in the form of cash collateral or bank guarantees in respect of environmental obligations, which could have an adverse impact on AngloGold Ashanti’s financial condition.
AngloGold Ashanti’s discounted closure liability was US$758 million as at December 31, 2012 compared with US$653 million as at December 31, 2011. The reasons for the change were new damage from current mining operations, new damage from building of new mining areas, the acquisition of Mine Waste Solutions, changes in
estimates for new life of mine calculations and changes in discount rates. Costs associated with rehabilitating land disturbed by mining processes and addressing environmental, health and community issues are estimated and financial provision made based upon current available information. Estimates may, however, be insufficient and further costs may be identified at any stage that may exceed the provisions that AngloGold Ashanti has made. Any underestimated or unidentified rehabilitation costs would reduce earnings and could materially and adversely affect the company’s asset values, earnings and cash flows.
Compliance with emerging climate change regulations could result in significant costs and climate change may present physical risks to a mining company’s operations.
Greenhouse gases (GHGs) are emitted directly by AngloGold Ashanti’s operations, as well as by external utilities from which AngloGold Ashanti purchases power. Currently, a number of international and national measures to address or limit GHG emissions, including the Kyoto Protocol, the Copenhagen Accord and the Durban Platform, are in various phases of discussion or implementation in the countries in which the company operates. In particular, the Durban Platform commits all parties to the conference to develop a global mitigation regime which could take effect in 2020, with the specific terms of that legally binding accord, including individual targets, to be finalized by 2015. These, or future, measures could require AngloGold Ashanti to reduce its direct GHG emissions or energy use or to incur significant costs for GHG emissions permits or taxes or have these costs or taxes passed on by electricity utilities which supply the company’s operations. AngloGold Ashanti also could incur significant costs associated with capital equipment, GHG monitoring and reporting and other obligations to comply with applicable requirements. For example, on July 1, 2012, the Australian Government introduced a carbon tax on GHG emissions. It also plans to implement an emissions trading scheme beginning in July 2015. Other countries, including South Africa, Brazil and the United States, have passed or are considering GHG trading or tax schemes, and/or other regulation of GHG emissions, although the precise impact on AngloGold Ashanti’s operations cannot yet be determined.
In addition, AngloGold Ashanti’s operations could be exposed to a number of physical risks from climate change, such as changes in rainfall rates, rising sea levels, reduced water availability, higher temperatures and extreme weather events. Events or conditions such as flooding or inadequate water supplies could disrupt mining and transport operations, mineral processing and rehabilitation efforts, create resource shortages or damage the company’s property or equipment and increase health and safety risks on site. Such events or conditions could have other adverse effects on the company’s workforce and on the communities around its mines, such as an increased risk of food insecurity, water scarcity and prevalence of disease.
Compliance with ‘conflict materials’ and ‘responsible gold’ legislation and standards could result in significant costs.
There are ever more stringent standards relating to ‘conflict minerals’ and ‘responsible’ gold that include the: US Dodd-Frank Act; World Gold Council Conflict Free Gold Standard; Organization for Economic Cooperation and Development Due Diligence Guidelines for Responsible Supply Chain of Minerals from Conflict-Affected and High-Risk Areas; and London Bullion Market Association Responsible Gold Guidance.
Any such legislation and standards may result in significant costs to ensure and demonstrate compliance, and difficulties in the sale of gold emanating from certain areas. The complexities of the gold supply chain, especially as they relate to ‘scrap’ or recycled gold, and the fragmented and often unregulated supply of artisanal and small-scale mined gold are such that there may be significant uncertainties at each stage in the chain as to the provenance of the gold, and as a result of uncertainties in the process, the costs of due diligence and audit, or the reputational risks of defining their product or a constituent part as containing a ‘conflict mineral’ would be too burdensome for the company’s customers. Accordingly, manufacturers may decide to switch supply sources or to substitute gold with other minerals not covered by the initiatives. This could have a material negative impact on the gold industry, including on AngloGold Ashanti’s financial results.
Mining operations and projects are vulnerable to supply chain disruption with the result that operations and development projects could be adversely affected by shortages of, as well as the lead times to deliver, strategic spares, critical consumables, mining equipment or metallurgical plant.
AngloGold Ashanti’s operations and development projects could be adversely affected by both shortages and long lead times to deliver strategic spares, critical consumables, mining equipment and metallurgical plant. Import restrictions, such as those introduced by the Argentine government in 2011, can also delay the delivery of parts and equipment. In the past, the company and other gold mining companies experienced shortages in critical consumables, particularly as
production capacity in the global mining industry expanded in response to increased demand for commodities. AngloGold Ashanti has also experienced increased delivery times for these items. Shortages have resulted in unanticipated price increases and production delays and shortfalls, resulting in a rise in both operating costs and in the capital expenditure necessary to maintain and develop mining operations.
Individually, AngloGold Ashanti and other gold mining companies have limited influence over manufacturers and suppliers of these items. In certain cases there are a limited number of suppliers for certain strategic spares, critical consumables, mining equipment or metallurgical plant who command superior bargaining power relative to the company. The company could at times face limited supply or increased lead time in the delivery of such items. For example, during 2012, supply of caustic soda was delayed in the Continental Africa Region. In addition, the unreliability of oxygen and lime supply similarly affected production at the Vaal River and West Wits surface operations in South Africa throughout 2011 and poor availability of drill rigs, heavy machinery and fleet equipment hampered underground drilling and overall operational performance at the Serra Grande mine in Brazil in 2011.
The company’s procurement policy is to source mining and processing equipment and consumables from suppliers that meet its corporate values and ethical standards although risk remains around the management of ethical supply chains. In certain locations, where a limited number of suppliers meet these standards, additional strain is placed on the supply chain, thereby increasing the cost of supply and delivery times.
Furthermore, supply chains and rates can be impacted by natural disasters, such as earthquakes, extreme weather patterns and climate change, as well as other phenomena that include unrest, strikes, theft and fires. For example, a three-week transport strike in 2012 delayed the supply of consumables in South Africa. Potential supply chain disruption in Mali, as a result of the coup d’état and subsequent state of emergency, has been avoided to date by well managed consumable stock holding. Potential gold doré export disruptions at Geita, the result of an attempted gold heist, and in Mali, following the closure of Bamako International Airport, were minimized with the introduction of alternative transportation arrangements. In February 2013, a fire destroyed the heavy mining equipment stock of spares and components at the Geita gold mine. If AngloGold Ashanti experiences shortages, or increased lead times in the delivery of strategic spares, critical consumables, mining equipment or processing plant, the company might have to suspend some of its operations and its results of operations and financial condition could be adversely impacted.
Diversity in interpretation and application of accounting literature in the mining industry may impact reported financial results.
The mining industry has limited industry-specific accounting literature. As a result, there is diverse interpretation and application of accounting literature on mining specific issues. AngloGold Ashanti, for example, capitalizes drilling and costs related to defining and delineating a residual mineral deposit that has not been classified as a ‘Proven and Probable Reserve’ at a development project or production stage mine. Some companies, however, expense such costs.
As and when this diverse interpretation and application is addressed, the company’s reported results could be adversely impacted should the adopted interpretation differ from the position it currently follows.
Failure to comply with laws, regulations, standards, contractual obligations whether following a breach or breaches in governance processes or fraud, bribery and corruption may lead to regulatory penalties, loss of licences or permits, and loss of reputation.
Since AngloGold Ashanti operates globally in multiple jurisdictions and with numerous and complex frameworks, its governance and compliance processes may not prevent potential breaches of law, accounting principles or other governance practices.
AngloGold Ashanti’s Code of Business Principles and Ethics, among other policies, standards and guidance, and training thereon may not prevent instances of unethical or unlawful behaviour, including bribery or corruption, nor guarantee compliance with legal and regulatory requirements, and breaches may not be detected by management.
Sanctions for failure by the company or others acting on its behalf to comply with these laws, regulations, standards and contractual obligations could include fines, penalties, imprisonment of officers, litigation, and loss of operating licences or permits, suspensions of operations, and may damage the company’s reputation. Such sanctions could have a material adverse impact on the company’s financial condition and results of operations.
Breaches in information technology security and governance process may adversely impact business activities.
AngloGold Ashanti maintains global information technology and communication networks and applications to support its business activities. Information technology security processes may not prevent future malicious actions, denial-of-service attacks, or fraud, resulting in corruption of operating systems, theft of commercially sensitive data, misappropriation of funds and business and operational disruption. Material system breaches and failures could result in significant interruptions that could in turn affect AngloGold Ashanti’s operating results and reputation.
Risks related to AngloGold Ashanti’s results of operations and financial condition as a result of factors specific to the company and its operations
AngloGold Ashanti removed the last of its gold hedging instruments and long-term sales contracts exposing the company to potential gains from subsequent commodity price increases but exposes it entirely to subsequent commodity price decreases.
AngloGold Ashanti removed the last of its gold hedging instruments in October 2010 to provide greater participation in a rising gold price environment. As a result, AngloGold Ashanti no longer has any protection against declines in the market price of gold.
A sustained decline in the price of gold could adversely impact the company’s operating results and its financial condition.
Any downgrade of credit ratings assigned to AngloGold Ashanti’s debt securities could increase future interest costs and adversely affect the availability of new financing.
An actual or expected negative development of AngloGold Ashanti’s results of operations or cash flows, country risk, financial metrics, or an increase in net debt position could result in the deterioration of the company’s credit ratings. AngloGold Ashanti’s ratings are influenced by the location of its domicile and its operations. Following the downgrade of South Africa’s sovereign debt rating as a result of strikes, social tension and policy uncertainty in South Africa, AngloGold Ashanti was placed on “credit watch negative” by Standard & Poor’s on October 17, 2012. On December 10, 2012, Standard & Poor’s affirmed the investment grade rating of the company’s publicly traded debt, but warned that it could lower the rating in the future.
Any such downgrade by ratings agencies could increase the cost of capital, reduce the investor base and negatively and materially affect AngloGold Ashanti’s business, results of operations and financial condition.
Labor disruptions could have a material adverse effect on AngloGold Ashanti’s results of operations and financial condition.
AngloGold Ashanti employees in South Africa, Ghana, Guinea and Argentina, are highly unionized. Trade unions, therefore, have a significant impact on the company’s labor relations, as well as on social and political reforms, most notably in South Africa. There is a risk that strikes or other types of conflict with unions or employees may occur at any of the company’s operations, particularly where the labor force is unionized or there is inter-union rivalry. Labor disruptions may be used to advocate labor, political or social goals in the future. For example, labor disruptions may occur in sympathy with strikes or labor unrest in other sectors of the economy and for political goals. Labor unrest in South Africa can also be fuelled by migrant labor conditions and mine worker debt levels. Furthermore, such labor disruptions may themselves affect or be perceived to affect local political and social stability. Acts or vandalism affecting mines and mine equipment are possible during periods of labor unrest.
For example, following a wave of labor unrest and unprotected strike action that took place throughout the South African mining, transport and agricultural sectors since early August 2012, workers from AngloGold Ashanti’s Kopanang mine, three West Wits mines and the Vaal River region’s other operations engaged in unprotected strikes in September 2012. More than 100,000 miners were involved in the strikes across the mining sector during the last four months of 2012. Workers at AngloGold Ashanti mines in South Africa have also staged sit-ins which prompted the company to suspend operations at some of its mines. These work stoppages pose significant safety risks and operating challenges. The protracted period of inactivity caused by the strike, coupled by the depth of the affected mines, has complicated the consequent ramping up of production following the termination of the strikes and has resulted in a lengthened ramp-up period to ensure employee safety. The unprotected strike action at the South African operations had an adverse impact
on the company’s third quarter results and significantly adversely impacted its fourth quarter results. The company estimates that the unprotected strike action cost approximately 235,000 ounces in lost production due to the work stoppages and the slow ramp-up to full production.
Lower production and payroll increases resulting from the labor disruptions have adversely impacted the financial performance of all South African operations, threatening viability in some cases and similar disruptions in the future may have a material adverse effect on the company’s results of operations and financial condition. For example, subsequent to the 2012 strikes, AngloGold Ashanti, along with its major gold-producing peers in South Africa, increased the entry-level pay of employees; established a new pay category for equipment operators; provided an allowance for rock-drill operators; and increased pay by 2 percent for most categories of workers. The net impact of the settlement on the payroll cost for AngloGold Ashanti is $16 million per annum.
Increased labor costs could have a material adverse effect on AngloGold Ashanti’s results of operations and financial condition.
Labor costs represent a substantial proportion of the company’s total operating costs and at many operations, including its South African, Ghanaian and Tanzanian operations, constitute the company’s single largest component of operating costs. Failing to obtain any simultaneous increase in productivity, any change to the company’s wage agreements or other factors that could increase labor costs may have a material adverse effect on AngloGold Ashanti’s results of operations and financial condition. In 2012, the cost of salaries and wages increased by 7 percent over 2011 levels.
In South Africa, the established practice is to negotiate wages and conditions of employment with the unions every two years through the Chamber of Mines of South Africa. South African employment law sets out minimum terms and conditions of employment for employees, which form the benchmark for all employment contracts. As at December 31, 2012, approximately 62 percent of the company’s workforce, excluding contractors, or approximately 52 percent of its total workforce was located in South Africa. At present, the mining unions and gold mining companies are in the second year of this two-year wage agreement, with the latest increases (ranging from 8 percent to 10 percent) awarded to the workforce in July 2012 and additional improvements to the current pay structure offered to workers on October 18, 2012. Further negotiations on this agreement are expected in 2013, which may result in an increase in labor actions. In addition, any new agreement could result in increased labor costs for the company.
AngloGold Ashanti’s results may be further impaired if it incurs penalties for failing to meet standards set by labor laws regarding workers’ rights or incurs costs complying with new labor laws, rules and regulations. For example, employment law in South Africa imposes monetary penalties for neglecting to report to government authorities on progress made towards achieving employment equity in the workplace. Ghanaian law also contains broad provisions requiring mining companies to recruit and train Ghanaian personnel and to use the services of Ghanaian companies. In Australia, the federal government has recently introduced a new industrial relations system that includes ‘good faith bargaining’ obligations for employers, fewer restrictions on the content of collective agreements and an enhanced role for union officials as bargaining representatives, parties to agreements and participants in dispute resolution. Penalties and compliance costs, as well as increased costs due to laws and regulations less favourable to employers, could have a material adverse effect on the company’s results of operations and financial condition.
AngloGold Ashanti’s mining rights in the countries in which it operates could be altered, suspended or cancelled for a variety of reasons, including breaches in its obligations in respect of its mining rights.
AngloGold Ashanti’s right to own and exploit Mineral Reserves and deposits is governed by the laws and regulations of the jurisdictions in which the mineral properties are located. Currently, a significant portion of the company’s Mineral Reserves and deposits are located in countries where mining rights could be suspended or cancelled should it breach its obligations in respect of the acquisition and exploitation of these rights.
In each of the countries in which AngloGold Ashanti operates, the formulation or implementation of government policies on certain issues may be unpredictable. This may include changes in laws relating to mineral rights and ownership of mining assets and the right to prospect and mine, and in extreme cases, nationalization, expropriation or nullification of existing concessions, licenses, permits, agreements and contracts. In May 2012, for example, the Argentine government nationalized the oil company Yacimientos Petrolíferos Fiscales (YPF) by expropriating 51 percent of the shares from the majority Spanish shareholder.
Any existing and new mining and exploration operations and projects are subject to various national and local laws, policies and regulations governing the ownership and the right to prospect or mine or develop proposed projects. For more details on the risks surrounding ownership of mining assets, see “– Title to AngloGold Ashanti’s properties may be uncertain and subject to challenge” and “– AngloGold Ashanti’s Mineral Reserve, deposits and mining operations are located in countries that face political, economic and security risks that may affect both the terms of its mining concessions, as well as its ability to conduct operations in certain countries”.
Project implementation delays could result in licences not being renewed and the loss of mining rights. Some of AngloGold Ashanti’s mining concessions, authorizations, licences and permits are subject to expiry, limitations on renewal and to various other risks and uncertainties. For example, the company’s license to mine at the Mongbwalu concession in the DRC is up for renewal in 2014, but the company must seek renewal a year in advance of the license’s expiration. The company may not be successful in the renewal process or in retaining the license on the same terms. If the company is unsuccessful in the renewal process, it will need to record an impairment. In October 2012, the DRC announced a proposed overhaul of the DRC’s mining code, which could affect the company’s ability to renew the license or its terms. This overhaul is still in progress.
If AngloGold Ashanti is not able to obtain or maintain necessary permits, authorizations or agreements to prospect or mine or to implement planned projects, or continue its operations, or comply with all laws, regulations or requirements, or do so within time-frames that make such plans and operations economically viable, or if the laws impacting the company’s ownership of its mineral rights, or the right to prospect or mine change materially, or should governments increase their ownership in the mines or nationalize them, AngloGold Ashanti’s results of operations and financial condition could be adversely affected.
Title to AngloGold Ashanti’s properties may be uncertain and subject to challenge.
AngloGold Ashanti has operations in several countries where ownership of land is uncertain and where disputes may arise in relation to ownership. Certain of the company’s properties may be subject to the rights or the asserted rights of various community stakeholders, including indigenous people. The presence of those stakeholders may have an impact on AngloGold Ashanti’s ability to develop or operate its mining interests. For example, in Australia, the Native Title Act (1993) provides for the establishment and recognition of native title under certain circumstances. In South Africa, the Extension of Security of Tenure Act (1997) and the Restitution of Land Rights Act (1994) provide for various landholding rights. Such legislation is complex, difficult to predict and outside of the company’s control, and could therefore negatively affect the business results of new or existing projects. Where consultation with stakeholders is statutorily or otherwise mandated, relations may not remain amicable and disputes may lead to reduced access to properties or delays in operations.
Title to the company’s properties, particularly undeveloped ones, may also be defective or subject to challenge. Title insurance generally is not available, and title review does not necessarily preclude third parties from contesting ownership. Where surveys have not been conducted, the precise area and location of the company’s claims may be in doubt. Accordingly, AngloGold Ashanti’s mineral properties may be subject to prior unregistered liens, agreements, transfers or claims, including native land claims, and title may be affected by, among other things, undetected defects.
AngloGold Ashanti may experience unforeseen difficulties, delays or costs in successfully implementing its business strategy and projects, including any cost-cutting initiatives, and any such strategy or project may not result in the anticipated benefits.
The successful implementation of the company’s business strategy and projects depends upon many factors, including those outside its control. For example: the successful management of costs will depend on prevailing market prices for input costs; the ability to grow the business will depend on the successful implementation of the company’s existing and proposed project development initiatives and continued exploration success, as well as on the availability of attractive merger and acquisition opportunities, all of which are subject to the relevant mining and company specific risks as outlined in these risk factors.
AngloGold Ashanti is in the process of implementing initiatives relating to strategic alignment, portfolio review, restructuring and cost-cutting, including in connection with the consolidation of its business activities and assets. Any future contribution of these measures to profitability will be influenced by the actual savings achieved and by the company’s ability to sustain these ongoing efforts. Strategic alignment, restructuring and cost-cutting initiatives may involve various risks, including, for example, labor unrest and operating licence withdrawal. The risk is highest in South Africa, given recent calls for withdrawal of mining licences for ‘mothballed shafts’ and hostile reaction to proposed
mining industry retrenchments. In addition, these measures may not be implemented as planned; turn out to be less effective than anticipated; only become effective later than anticipated; or not be effective at all. Any of these outcomes, individually or in combination, may adversely impact the company’s business, results of operations and financial condition.
AngloGold Ashanti’s business strategy also includes divesting activities in some business areas and strengthening others, including through mergers and acquisitions. With respect to dispositions, AngloGold Ashanti may not be able to divest some of its activities as planned or to obtain all of the required approvals, and the divestitures that are carried out could have a negative impact on its business, results of operations, financial condition and reputation.
AngloGold Ashanti may also prove unable to deliver on production targets, including in potentially critical areas, such as the Obuasi turnaround plan in Ghana, as well as on the timely, cost-effective and successful execution of key capital projects, including at the Tropicana project in Australia, the Kibali project in the DRC, and with regard to the implementation of the company’s new Enterprise Resource Planning (ERP) system. For more details on the risks surrounding the ERP implementation, see the section entitled – “The implementation of an integrated ERP system could have an adverse effect on AngloGold Ashanti’s results of operations and financial condition.”
Unforeseen difficulties, delays or costs may adversely affect the successful implementation of AngloGold Ashanti’s business strategy and projects, and such strategy and projects may not result in the anticipated benefits.
Any acquisition or acquisitions that AngloGold Ashanti may complete may expose the company to new geographic, political, legal, social, operating, financial and geological risks.
AngloGold Ashanti may pursue the acquisition of producing, development and advanced stage exploration properties and companies. Any such acquisition may change the scale of the company’s business and operations and may expose it to new geographic, geological, political, social, operating, financial, legal, regulatory and contractual risks. For example: there may be a significant change in commodity prices after the company has committed to complete the transaction and established the purchase price or share exchange ratio; a material ore body may prove below expectations; AngloGold Ashanti may have difficulty integrating and assimilating the operations and personnel of any acquired companies, realizing anticipated synergies and maximizing the financial and strategic position of the combined enterprise, and maintaining uniform standards, policies and controls; the integration may disrupt the company’s ongoing business and its relationships with employees, suppliers and contractors; and the acquisition may divert management’s attention from AngloGold Ashanti’s day-to-day business. Furthermore, the company operates and acquires businesses in different countries, with different regulatory and operating cultures, which may exacerbate the risks described above. In addition, the acquired business may have undetected liabilities which may be significant.
In the event that the company chooses to raise debt capital to finance any acquisition, the company’s leverage will be increased. Should the company choose to use equity as consideration for an acquisition, existing shareholders may suffer dilution. Alternatively, the company may choose to finance any acquisition with its existing resources, which could decrease its ability to fund future capital expenditures.
The company may not be successful in overcoming these risks or any other problems encountered in connection with acquisitions. Failure by AngloGold Ashanti to implement its acquisition strategy or to integrate acquired businesses successfully could have material adverse effects on its growth and business results.
Ageing infrastructure at some of AngloGold Ashanti’s operations could adversely impact its business.
Deep level gold mining shafts are usually designed with a lifespan of 25 to 30 years. Vertical shafts consist of large quantities of infrastructure steelwork for guiding conveyances and accommodating services such as high and low tension electric cables, air and water pipe columns. Rising temperatures in the deeper mining areas can also lead to increased cooling requirements in the form of upgraded and expanded ice plants. Maintaining this infrastructure requires skilled human resources, capital allocation, management and planned maintenance.
Once a shaft has reached the end of its intended lifespan, higher than normal maintenance and care is required. Incidents resulting in production delays, increased costs or industrial accidents may occur. Such incidents may have an adverse effect on the company’s results of operations and financial condition. Asset integrity issues relating to ageing infrastructure are of particular concern in South Africa and at the Obuasi mine in Ghana.
For example, cracks were discovered in the mill feed end in September 2008 and at the discharge end in February 2010 at the Geita gold mine. The Geita gold mine is one of the group’s principal assets and sources of cash flow. After initial repairs, the feed end was replaced during May and June 2011. A decision was subsequently taken to replace the entire mill as a result of shell distortion. After new mill manufacture delays, installation was completed during March 2013. Production throughput in 2011 was 1 million tonnes less than planned, as a result of mill downtime that included feed-end replacement; ore grade was however sufficient to achieve 494,000 ounces. The Geita gold mine produced approximately 531,000 ounces in 2012, with production throughput of some 100,000 tonnes short of budget.
Some of AngloGold Ashanti’s technologies are unproven and failure could adversely impact costs and production.
AngloGold Ashanti has teamed up with various specialists to engineer new solutions to environmental management, mine design, rock breaking and underground logistics, among others. The company has invested in new technologies, including phyto-technologies to reduce seepage and address soil and ground water contamination, and in mine support technologies to minimize the impact of seismic activity. The company is also attempting to develop technologies to access the deeper reaches of South African mines.
Some aspects of these technologies are unproven and their eventual operational outcome or viability cannot be assessed with certainty. The costs, productivity and other benefits from these initiatives, and the consequent effects on AngloGold Ashanti’s future earnings and financial condition, may vary from expectations. Failure of the company to realize the anticipated benefits could result in increased costs, an inability to realize production or growth plans, or adversely affect its operational performance.
The level of AngloGold Ashanti’s indebtedness could adversely impact its business.
As at December 31, 2012, AngloGold Ashanti had gross borrowings of approximately $3.0 billion, (2011: approximately $1.7 billion) excluding the mandatory convertible bonds amounting to $588 million (2011: $760 million).
AngloGold Ashanti’s indebtedness could have a material adverse effect on its flexibility to conduct business. For example, the company may be required to use a large portion of its cash flow to pay the principal and interest on its debt, which will reduce funds available to finance existing operations and the development of new organic growth opportunities and further acquisitions. In addition, under the terms of the company’s borrowing facilities from its banks, AngloGold Ashanti is obliged to meet certain financial and other covenants. The company’s ability to continue to meet these covenants and to service its debt will depend on its future financial performance which will be affected by its operating performance as well as by financial and other factors, certain of which are beyond the control of the company.
Should the cash flow from operations be insufficient, AngloGold Ashanti could breach its financial and other covenants. Covenant breaches, if interpreted as events of default under one or more debt agreements, could allow lenders to accelerate payment of such debt. Any such acceleration could result in the acceleration of indebtedness under other financial instruments. As a result, the company may be required to refinance all or part of the existing debt, use existing cash balances, issue additional equity or sell assets. AngloGold Ashanti cannot be sure that it will be able to refinance its debt on commercially reasonable terms, if at all. The company’s ability to access the bank, public debt or equity capital markets on an efficient basis may be constrained by dislocation in the credit markets or capital and liquidity constraints in the banking, debt or equity markets at the time of issuance.
Certain factors may affect AngloGold Ashanti’s ability to support the carrying amount of its property, plant and equipment, acquired properties, investments and goodwill on the balance sheet. If the carrying amount of its assets is not recoverable, AngloGold Ashanti may be required to recognize an impairment charge, which could be significant.
AngloGold Ashanti reviews and tests the carrying amount of its assets when events or changes in circumstances suggest that the carrying amount may not be recoverable. The company values individual mining assets at the lowest level for which cash flows are identifiable and independent of cash flows of other mining assets and liabilities.
If there are indications that impairment may have occurred, AngloGold Ashanti prepares estimates of expected future cash flows for each group of assets. Expected future cash flows are inherently uncertain, and could materially change over time. They are significantly affected by reserve and production estimates, together with economic factors such as spot and forward gold prices, discount rates, currency exchange rates, estimates of costs to produce reserves and future capital expenditure. Estimated rehabilitation and closure costs could also materially affect the company’s financial performance and could result in the need to recognize an impairment charge.
If any of these uncertainties occur, either alone or in combination, management could be required to recognize an impairment, which could have a material adverse effect on the company’s results of operations and financial condition.
AngloGold Ashanti expects to have significant financing requirements.
AngloGold Ashanti’s existing board-approved development projects and exploration initiatives will require significant funding. These include: Tropicana in Australia; Mponeng Below 120 Project in South Africa; the Mongbwalu and Kibali projects in the DRC; and the mine life extension project (MLE2) at Cripple Creek & Victor in the United States.
Potential future development projects will also require significant funding, if and when approved by the AngloGold Ashanti board of directors. These include the: La Colosa and Gramalote projects in Colombia; Moab Khotsong Zaaiplaats in South Africa; Iduapriem expansion project in Ghana, Sadiola Deeps project in Mali; Geita underground mining project in Tanzania; Nova Lima Sul project in Brazil; a further mine life extension project (MLE3) at Cripple Creek & Victor in the United States; as well as various other exploration projects and feasibility studies.
AngloGold Ashanti estimates that over the next three years, growth initiatives will require project capital expenditure (excluding stay in business and ore reserve development capital expenditure) of approximately $4.0 billion (subject to escalation and based on certain assumptions, including exchange rates). The company’s capital expenditure plans and requirements are subject to a number of risks, contingencies and other factors, some of which are beyond its control, and therefore the actual future capital expenditure and investments may differ significantly from the current planned amounts.
AngloGold Ashanti’s operating cash flow and credit facilities may be insufficient to meet all of these expenditures, depending on the timing and cost of development of these and other projects as well as operating performance and available headroom under its credit facilities. As a result, new sources of capital may be needed to meet the funding requirements of these developments, to fund ongoing business activities and to pay dividends. AngloGold Ashanti’s ability to raise and service significant new sources of capital will be a function of macroeconomic conditions, the condition of the financial markets, future gold prices, the company’s operational performance and operating cash flow and debt position, among other factors. The company’s ability to raise further debt financing in the future and the cost of such financing will depend on, among other factors, its prevailing credit rating, which may be affected by the company’s ability to maintain its outstanding debt and financial ratios at levels acceptable to the credit ratings agencies, its business prospects risks relating to the countries in which it operates or other factors. As a result, in the event of lower gold prices, unanticipated operating or financial challenges, any dislocation in financial markets or new funding limitations, AngloGold Ashanti’s ability to pursue new business opportunities, invest in existing and new projects, fund its ongoing business activities and retire or service outstanding debt and pay dividends, could be significantly constrained, all of which could adversely impact the company’s results of operations and financial condition.
AngloGold Ashanti does not have full management control over some of its significant joint venture projects and other interests. If the operators of these projects do not manage these effectively and efficiently, the company’s investment in these projects could be adversely affected and its reputation could be harmed.
AngloGold Ashanti’s joint ventures at Morila in Mali and at Kibali in the DRC are managed by the company’s joint venture partner Randgold Resources Limited (Randgold). In addition, certain of AngloGold Ashanti’s exploration ventures are managed by the relevant joint venture partner. AngloGold Ashanti’s marine gold joint venture with De Beers is managed by an independent company jointly owned by AngloGold Ashanti and De Beers, with a significant part of the technical input subcontracted to De Beers or other marine service providers.
While AngloGold Ashanti provides strategic management and operational advice to its joint venture partners in respect of these projects, the company cannot ensure that these projects are operated in compliance with the standards that AngloGold Ashanti applies in its other operations. If these joint ventures are not operated effectively or efficiently, including as a result of weaknesses in the policies, procedures and controls implemented by the joint venture partners, the company’s investment in the relevant project could be adversely affected. In addition, negative publicity associated with operations that are ineffective or inefficiently operated, particularly relating to any resulting accidents or environmental incidents, could harm the company’s reputation and therefore its prospects and potentially its financial condition. Further, any failure of joint venture partners to meet their obligations to AngloGold Ashanti or to third parties, or any disputes with respect to the parties’ respective rights and obligations, could have a material adverse impact on AngloGold Ashanti’s results of operations and financial condition. In particular, the company and Randgold retain equal representation, with neither party holding a deciding vote on the board of the two companies that have overall management control of the Morila project in Mali and the Kibali project in the DRC, respectively, and all major
management decisions for each of these two projects, including approval of the budget, require board approval. If a dispute arises between the company and Randgold with respect to the Kibali or Morila project and the parties are unable to amicably resolve such dispute, it may be difficult for the parties to make strategic decisions relating to the project affected by such dispute, the day-to-day operations and the development of such project may be adversely affected and the company may have to participate in proceedings to resolve the dispute, which could adversely affect the company’s results of operations and financial condition.
AngloGold Ashanti’s joint ventures and other strategic alliances may not be successful.
AngloGold Ashanti’s joint venture partners may have economic or business interests or goals that are not consistent with the company’s or may, as a result of financial or other difficulties, be unable or unwilling to fulfill their obligations under the joint venture or other agreements. Disputes between AngloGold Ashanti and its joint venture partners may lead to legal action, including litigation between AngloGold Ashanti and joint venture partners. Such disputes could adversely affect the operation of the joint venture and may prevent the realization of the joint ventures goals. There is no assurance that the company’s joint venture partners will continue their relationship with the company in the future or that the company will be able to achieve its financial or strategic objectives relating to the joint ventures.
For example, AngloGold Ashanti has a 50:50 strategic alliance with Thani Investments LLC (TI), a company based in Dubai. During 2011, AngloGold Ashanti advanced a loan of $35 million to Thani Ashanti Alliance Limited, the joint entity it owns together with TI. This loan was impaired during 2012. TI guaranteed the loan. AngloGold Ashanti has brought legal action against TI over non-payment of the loan. The resolution to this dispute may affect the overall relationship between TI and the company. The failure of the company’s joint venture partners to fulfil their obligations or their unwillingness to continue these relationships may have an adverse effect on the company’s results of operations and financial condition.
AngloGold Ashanti’s Mineral Reserve, deposits and mining operations are located in countries where political, tax and economic laws and policies may change rapidly and unpredictably and such changes and policies may adversely affect both the terms of its mining concessions, as well as its ability to conduct operations in certain countries.
Any existing and new mining, exploration operations and projects that the company carries out are subject to various national and local laws, policies and regulations governing the ownership, prospecting, development and mining of mineral reserves, taxation and royalties, exchange controls, import and export duties and restrictions, investment approvals, employee and social community relations and other matters.
In most of the countries in which AngloGold Ashanti operates, there is a focus on resource nationalism with governments seeking to reap greater economic benefit from high commodity prices. This entails the review of mining codes and stability agreements, which were designed under different economic environments, and the formulation or amendment of laws, policies and regulations relating to issues such as mineral rights and asset ownership, royalties, taxation and taxation disputes, ‘windfall’ or ‘super’ taxation, non-recovery of taxation refunds, import and export duties, currency transfers, restrictions on foreign currency holdings and repatriation of earnings. Laws, policies and regulations in such countries are uncertain, changing and generally require progressively higher payments to governments, notably in the form of increased royalties and taxes, mandated beneficiation, export levies and increasing or retaining state or national ownership of resources. Changes in particular to the fiscal terms governing AngloGold Ashanti’s operations may have a material adverse impact on the company’s results of operations or financial condition, as well as discourage future investments in certain jurisdictions, which may have an adverse impact on the company’s ability to access new assets and could potentially reduce future growth opportunities.
For example on September 9, 2011, a new mining code for Guinea was enacted. The new mining code significantly increases the share of state ownership in the mining industry, extending a 15 percent share of future mining projects to the government, without financial compensation. The government also has the option to purchase up to an additional 20 percent of each project. However, the new mining code was withdrawn in October 2012 due to unfavorable reception and is yet to be re-issued. The Guinean government also announced its intention to carry out a review of the mining conventions currently in force in Guinea. This mining convention review is currently in progress. The outcome of this review may have a material adverse effect on the company’s results of operations or financial condition.
In late 2011 and early 2012, the government of Ghana amended its fiscal mining regime, increased its corporate taxation and royalty rates and may impose a windfall profit tax. Furthermore, the government of Ghana has constituted a review committee to review and re-negotiate stability agreements with mining companies. AngloGold Ashanti is currently participating in negotiations with the Ghanaian review committee. The outcome of these negotiations may have a material adverse effect on the company’s results of operations or financial condition.
AngloGold Ashanti Limited and other major mining companies are in talks with the Tanzanian government regarding new mining legislation and its impact on existing mining agreements; such talks follow an earlier declaration in July 2012 by the Tanzanian Minister of Energy and Minerals that the mining contracts were under review. The new mining legislation and the outcome of the review of the mining contracts may have a material adverse impact on the company’s results of operations and financial condition. Recently, the Tanzanian Minister of Energy and Minerals unexpectedly increased the royalty rate levied on gold extracted in Tanzania by AngloGold Ashanti’s operations by 1 percent. Further unanticipated increases in royalty rates in Tanzania or other countries could have a material adverse impact on the company’s results of operations and financial condition.
In the DRC, in October 2012 the Mines Minister announced a proposed overhaul of the DRC’s mining code. The proposed laws seek to, among other things, increase the government stake in mining operations to 35 percent from the existing 5 percent, double royalties on some minerals, and introduce a 50 percent levy on certain profits. Should such laws be enacted in the future, these may have a material adverse impact on the company’s results of operations in the DRC.
On July 1, 2012, Australia’s Minerals Resource Rent Tax (MRRT) came into effect after the legislation was passed in March 2012. The MRRT applies only to the bulk commodities of coal and iron ore, and replaced the previously proposed Resource Super Profit Tax (RSPT), which covered all minerals. The Australian federal government did not include gold and uranium in the final MRRT. However, should Australia consider reintroducing the RSPT, or if similar ‘super profit’ taxes were to be introduced and implemented in any other country in which AngloGold Ashanti operates, the company’s results of operations and financial condition could be materially adversely affected.
In addition, some of AngloGold Ashanti’s mineral deposits and mining and exploration operations are located in countries that are experiencing political instability and economic uncertainty. For example, in South Africa, country risk has increased recently in light of the violent strike action, social unrest, high levels of unemployment, poverty and concern that the government may take measures unfavorable to business.
In December 2012, while the ruling African National Congress rejected the concept of wholesale nationalization, it nevertheless favoured a ‘resource rent’ tax on windfall profits. Political instability and the resulting unstable business environment in which companies operate may discourage future investments in certain jurisdictions, which may have an adverse impact on the company’s ability to access new assets and could potentially reduce future growth opportunities.
AngloGold Ashanti is subject to an uncertain tax environment. Increased taxes are expected in most countries of operation. Changes in tax laws could result in higher tax expense and payments. Furthermore, legislation changes could materially impact AngloGold Ashanti’s tax receivables and liabilities as well as deferred tax assets and deferred tax liabilities. In addition, the uncertain tax environment in some regions could limit AngloGold Ashanti’s ability to enforce its rights. As a global company, AngloGold Ashanti conducts its business in countries subject to complex tax rules, which may be interpreted in different ways. Further interpretations or developments of tax regimes may affect the company’s tax liability, return on investments and business operations. AngloGold Ashanti is regularly examined by tax authorities in the various jurisdictions of operation.
For example, on March 15, 2012, the Mwanza office of the Tanzania Revenue Authority notified Geita Gold Mine Limited (Geita Gold Mine) that it intended to issue additional tax assessments against Geita Gold Mine. In connection with such assessments, the Tanzania Revenue Authority also challenged the validity of the existing mining development agreement (MDA) relating to the Geita Gold Mine, which was entered into with the Tanzanian government in June 1999. AngloGold Ashanti was served with a demand to pay the increased assessments, which it is currently paying under protest while awaiting a discussion with the government. In the event that the MDA is held to be invalid, the tax burden on the company’s Tanzanian operations would increase and the company would have to pay additional taxes for prior periods.
Furthermore, in Guinea, Mali and Tanzania, AngloGold Ashanti is due refunds of input tax and fuel duties which remain outstanding for periods longer than those provided for in the respective statutes.
The countries in which the company operates may also introduce strict exchange controls, impose restrictions to source materials and services locally, or impose other similar restrictions that hinder foreign companies’ operations within such countries. For example, the Argentine government introduced stricter exchange controls and related protracted approval processes, which may limit the company’s ability to repatriate dividends from its Argentine subsidiaries. In October 2011, the Argentina government has decreed that mining, oil and energy companies must repatriate export earnings. Additionally, the purchase of US dollars requires authorization from the Argentine tax agency and the purpose for which the currency will be used must be stated. In May 2012, the Argentine Mining Secretariat issued new regulations requiring mining companies in Argentina to boost their domestic purchases of equipment and services. Mining companies are now required to resort exclusively to locally established suppliers for their export-related shipping and logistics operations. A separate norm requires companies to open an import substitution division which will be in charge of submitting procurement plans to the Mining Secretariat on a quarterly basis. Such requirements are hindering the company’s operations within Argentina and these or similar requirements may continue to do so in the future and may have a material adverse effect on AngloGold Ashanti’s results of operations and financial condition.
If, in one or more of the countries in which it operates, AngloGold Ashanti were not able to obtain or maintain necessary permits, authorizations or agreements to implement planned projects or continue its operations under conditions or within timeframes that make such plans and operations economically viable, or if the applicable legal, ownership, fiscal (including all royalties and duties), exchange control, employment, environmental and social laws or regimes change materially, or if the governing political authorities change resulting in amendments to such laws and regimes, this could have a material adverse effect on AngloGold Ashanti’s operating results, financial condition, and, in extreme situations, on the viability of an operation.
For example, in South Africa mining rights are linked to meeting various obligations that include the broad-based socio-economic empowerment charter for the mining industry (the Revised Charter). Compliance with the Revised Charter is measured using a designated scorecard relating to equity ownership and management control of mining companies by historically disadvantaged South Africans (HDSAs) by no later than May 2014 and that HDSAs must constitute 40 percent of all levels of management by 2014. While AngloGold Ashanti believes that it is compliant with ownership targets to be achieved by May 2014, it must make further progress to achieve future targets, including further participation by HDSAs in senior and top management levels, the upgrade of housing and accommodation at the company’s mines, further human resource development, mine community development, sustainable development and growth as well as procurement and enterprise development, certain of which are also included under the Revised Charter’s targets that must also be achieved by May 2014.
The company will incur expenses in giving further effect to the Revised Charter and the scorecard. AngloGold Ashanti may not meet all of the various requirements by the required dates. Additionally, the South African government may decide that the Mining Charter has not gone far enough to achieve its underlying goals and therefore decide to expand the obligations of mining companies thereunder. Should AngloGold Ashanti breach its obligations in complying with the Mineral and Petroleum Resources Development Act, Revised Charter or any future amendments to the Mining Charter, its mining rights in South Africa could be suspended or cancelled by the Minister of Mineral Resources and it may be unable to obtain any new mining rights. Any such suspension or cancellation could have a material adverse effect on Anglo Ashanti’s results of operations and financial condition.
AngloGold Ashanti’s Mineral Reserve, deposits and mining operations are located in countries that face instability and security risks that may adversely affect both the terms of its mining concessions, as well as its ability to conduct operations in certain countries.
Some of AngloGold Ashanti’s mineral deposits and mining and exploration operations are located in countries that are experiencing political instability and economic uncertainty.
Certain of the countries in which AngloGold Ashanti has mineral deposits or mining or exploration operations, including the DRC, Mali, Guinea and Colombia, have in the past experienced, and in certain cases continue to experience, a difficult security environment. In particular, various illegal groups active in regions in which the company is present may pose a credible threat of military repression, terrorism, civil unrest, extortion and kidnapping, which could have an adverse effect on its operations in these and other regions.
For example, Mali continues to experience a difficult security environment since the military coup in March 2012. The situation in Mali remains of heightened concern as a result of the instability in northern Mali.
Eastern DRC also continues to experience tension consistent with the cycles of unrest experienced since the late 2000s. Fighting has caused instability in the area and could expand or intensify.
In 2012, and for the first time in approximately seven years, Anglo Gold Ashanti Colombia’s (AGAC) assets and employees were the targets of direct attacks by hostile actors around the La Colosa project’s area of influence. These and other such attacks could adversely affect the company’s operations in Colombia.
Since 2009, the company has recorded an almost five-fold increase in the instances of injury to security personnel, including members of AngloGold Ashanti’s internal security, private security companies and public security forces in certain jurisdictions. The rise in the number and severity of security incidents has come as a result of both increased illegal and artisanal mining due to a steady migration of people into the areas and an increase in the level of organization and funding of criminal activity around some of the company’s Continental African operations, spurred on by an escalating gold price. The most significant security challenges have occurred in Tanzania and Ghana in areas where there is endemic poverty and high levels of unemployment. If the security environment surrounding the company’s operations that are most exposed to these challenges does not improve or further deteriorates, employee, third-party and community member injuries and fatalities could also increase. Any such increase could disrupt the company’s operations in certain mines and adversely affect its reputation, results of operations and financial condition.
In some instances, risk assessments categorize threats as serious enough to require resort to public security forces, such as national police or military units on a near-permanent basis. In the event that continued operations in any of the company’s countries of operations compromise the company’s security or business principles, AngloGold Ashanti may withdraw from any such countries on a temporary or permanent basis. This could have a material adverse impact on AngloGold Ashanti’s results of operations and financial condition.
Furthermore, the company has at times experienced strained relationships with certain of its host communities. AngloGold Ashanti operates in several regions where poverty, unemployment and the lack of access to alternative livelihoods mean that the creation and distribution of economic benefit from mining operations is a significant area of focus for community and government. Conflict with communities has led to community protests and business interruptions, particularly at the Siguiri mine in Guinea during 2010 and 2011. In 2012, there were five recorded community protests at Cerro Vanguardia, Obuasi and Geita.
Illegal and artisanal mining occurs on AngloGold Ashanti’s properties, which can disrupt the company’s business and expose the company to liability.
Illegal and artisanal miners are active on, or adjacent to, some of AngloGold Ashanti’s Continental African and South American properties, which leads at times to interference with the company’s operations and results in conflict situations that present a security threat to property and human life. Artisanal mining is associated with a number of negative impacts, including environmental degradation, flouting of land rights, poor working practices, erosion of civil society, human rights abuse and funding of conflict. The environmental, social, safety and health impacts of artisanal mining are frequently attributed to formal mining activity, and it is often assumed that artisanally-mined gold is channeled through large-scale mining operators, even though artisanal and large-scale miners have distinct supply chains. These misconceptions impact negatively on the reputation of the industry.
The activities of the illegal miners, which include theft and shrinkage, could cause damage to AngloGold Ashanti’s properties, including pollution, underground fires, or personal injury or death, for which AngloGold Ashanti could potentially be held responsible. Illegal mining could result in the depletion of mineral deposits, potentially making the future mining of such deposits uneconomic. The presence of illegal miners could lead to project delays and disputes regarding the development or operation of commercial gold deposits. Illegal mining and theft could also result in lost gold reserves, mine stoppages, and have a material adverse effect on AngloGold Ashanti’s results of operations or financial condition.
In 2012, the company recorded an increase in the number and severity of security incidents, due to a steady migration of people into the areas and an increase in the level of organization and funding of criminal activity around some of the company’s Continental African operations, spurred on by an escalating gold price. The most significant security challenges have occurred in Tanzania and Ghana in areas where there is endemic poverty and high levels of unemployment.
The use of contractors at certain of the company’s operations may expose AngloGold Ashanti to delays or suspensions in mining activities and increases in mining costs.
AngloGold Ashanti uses contractors at certain of its operations to mine and deliver ore to processing plants as well as for other purposes. At mines employing mining contractors, contracting costs represent a significant proportion of the total operating costs of these operations and the company does not own all of the mining equipment. For example, increased contractor rates at the Sadiola mine in Mali contributed to a significant rise in total cash costs in the final quarter of 2011. Increased contractor costs at Sunrise Dam in Australia and Geita in Tanzania contributed to higher production costs in the first quarter of 2012.
AngloGold Ashanti’s operations could be disrupted, resulting in additional costs and liabilities, if the mining contractors at affected mines have financial difficulties or if a dispute arises in renegotiating a contract, or if there is a delay in replacing an existing contractor and its operating equipment to meet business needs at expected cost levels. Increases in contract mining rates, in the absence of associated productivity increases, will also have an adverse impact on the company’s results of operations and financial condition.
For example, on October 13, 2012, AngloGold Ashanti terminated the underground development contract with a third-party contractor at the Obuasi mine in Ghana. The costs of the termination amounted to $17 million.
In addition, AngloGold Ashanti’s reduced control over those aspects of operations which are the responsibility of contractors, their failure to comply with applicable legal, human rights and regulatory requirements, or their inability to manage their workforce or provide high quality services or a high level of productivity could adversely affect AngloGold Ashanti’s reputation, results of operations and financial condition, and may result in the company incurring liability to third parties due to the actions of contractors.
AngloGold Ashanti competes with mining and other companies for key human resources and its inability to retain key personnel could have an adverse effect on its business.
AngloGold Ashanti competes on a global basis with mining and other companies, to attract and retain key human resources at all levels with the appropriate technical skills and operating and managerial experience necessary to operate and supervise its business. This is further exacerbated in the current environment of increased mining activity across the globe, combined with the global shortage of key mining skills, including geologists, mining engineers, metallurgists and skilled artisans.
The retention of staff is particularly challenging in South Africa, where, in addition to the impacts of global industry shortages of skilled labor, AngloGold Ashanti is required to achieve employment equity targets of participation by HDSAs in management and other positions. AngloGold Ashanti competes with all companies in South Africa to attract and retain a small but growing pool of HDSAs with the necessary skills and experience. AngloGold Ashanti has historically faced difficulty recruiting and retaining young graduates and qualified mid-level management in South Africa. Recruitment of skilled personnel has been challenging in Continental Africa due to university offerings that are often not well-suited to the specific needs of the mining industry, as well as other factors such as language barriers and low literacy skills.
The recruitment of skilled workers is also highly competitive in South America as a result of a shortage of skills and intense competition between mining companies.
The company may not be able to retain and attract sufficient skilled and experienced employees in all areas of the business. Should it fail to do so or lose any of its key personnel, business and growth prospects may be harmed and this could have an adverse impact on AngloGold Ashanti’s results of operations and financial condition.
AngloGold Ashanti’s inability to retain its senior management may have an adverse effect on its business.
The company’s success depends largely upon the continued service of its senior management, including its chief executive officer, chief financial officer and the executive officers at each of its business divisions and general managers at its mines. The loss of one or more members of senior management, such as the recently announced departure of AngloGold Ashanti Chief Executive Officer, Mark Cutifani, to take the same position at Anglo American PLC as of April 3, 2013, could lead to other members of the management team leaving, disrupt the company’s operations, and have a material adverse impact on the company’s business, results of operations and financial condition.
The prevalence of occupational health diseases and the potential costs and liabilities related thereto may have an adverse effect on the business and results of operations of AngloGold Ashanti.
The primary areas of focus in respect of occupational health of employees within the company’s operations are noise-induced hearing loss and occupational lung diseases (OLD), which include pulmonary diseases such as tuberculosis from various causes and silicosis in individuals exposed to silica dust. These require active dust management strategies in underground operations, particularly in South Africa where a significant number of silicosis cases by current and former employees alleging past exposures are still reported each year to the board for statutory compensation. AngloGold Ashanti provides occupational health services to its employees at its occupational health centers and clinics and continues to improve preventative occupational hygiene initiatives, such as implementing various dust control measures and supplying its employees with respiratory protection equipment. If the costs associated with providing such occupational health services, implementing such dust control measures or supplying such equipment increase significantly beyond anticipated or budgeted amounts, this could have an adverse effect on AngloGold Ashanti’s results of operations and financial condition. Actual and alleged health and safety incidents or breaches of standards may also adversely impact the company’s reputation.
AngloGold Ashanti is currently subject to class action litigation with respect to alleged occupational lung diseases (see “– AngloGold Ashanti is subject to the risk of litigation, the causes and costs of which are not always known”). AngloGold Ashanti is calling for the industry to engage with government (and other stakeholders) to seek an appropriate industry-wide solution. An industry-wide solution may not be reached or the terms thereof may have a material adverse effect on AngloGold Ashanti’s financial condition.
In response to the effects of silicosis in labor-sending communities, a number of mining companies (under the auspices of the Chamber of Mines of South Africa) together with the NUM, which is the largest union in the mining sector in South Africa, and the national and regional departments of health, have embarked on a project to assist in delivering compensation and relief by mining companies under the Occupational Diseases in Mines and Works Act (ODMWA) to affected communities.
AngloGold Ashanti faces certain risks in dealing with HIV/AIDS, particularly at its South African operations and with tropical disease outbreaks such as malaria, and other diseases which may have an adverse effect on the company’s results of operations and financial condition.
AIDS and associated diseases remain one of the major health care challenges faced by AngloGold Ashanti’s South African operations. Workforce prevalence studies indicate that HIV prevalence rates among AngloGold Ashanti’s South African workforce may be as high as 30 percent.
Malaria and other tropical diseases pose significant health risks at all of the company’s operations in central, west and east Africa where such diseases may assume epidemic proportions because of ineffective national control programs. Malaria is a major cause of death in young children and pregnant women but also gives rise to fatalities and absenteeism in adult men. Other conditions such as heart disease, chronic diseases, and obesity are of increasing incidence and concern.
Such diseases impair the health of workers and negatively affect productivity and profitability as a result of workers’ diminished focus or skill, absenteeism, treatment costs and allocated resources. Any current or future medical program may not be successful in preventing or reducing the infection rate among AngloGold Ashanti’s employees or in affecting consequent illness or mortality rates. AngloGold Ashanti may incur significant costs in addressing this issue in the future, which could also adversely impact the company’s results of operations and financial condition.
The costs and impacts associated with the pumping of water inflows from closed mines adjacent to the company’s operations could have an adverse effect on its results of operations.
Certain of AngloGold Ashanti’s mining operations are located adjacent to the mining operations of other mining companies. The closure of a mining operation may have an impact upon continued operations at the adjacent mine if appropriate preventative steps are not taken. In particular, this can include the ingress of underground water where pumping operations at the adjacent closed mine are suspended. Such ingress could have an adverse effect on any one of the company’s mining operations as a result of property damage, disruption to operations, additional pollution liabilities and pumping costs and consequently could have an adverse impact on its results of operations and financial condition.
The potential costs associated with the remediation and prevention of groundwater contamination from the company’s operations or due to flooding from closed mines adjacent to the company’s operations could have a material adverse effect on AngloGold Ashanti’s results of operations and financial condition.
AngloGold Ashanti has identified groundwater contamination plumes at certain of its operations that have occurred primarily as a result of seepage from surface operations and facilities including tailings storage facilities and waste rock.
Deep groundwater contamination is a significant issue in South Africa, where groundwater in some older mining regions has infiltrated mined-out workings. Potential contamination risk to shallow ground and surface water resources can occur when water is exposed to sulfide-bearing rock in such situations. AngloGold Ashanti has identified a flooding and future pollution risk posed by deep groundwater in the Klerksdorp and Far West Rand goldfields. AngloGold Ashanti’s Vaal River operations are part of the Klerksdorp goldfields and its West Wits operations are part of the Far West Rand goldfields. As a result of the interconnected nature of underground mining operations in South Africa, any proposed solution needs to be a combined one supported by all the companies owning mines located in these goldfields.
In view of the limitation of current information for the accurate estimation of liabilities, no reliable estimate can be made for these obligations. The potential costs of remediation and prevention of groundwater contamination at AngloGold Ashanti’s operations could be significant and may have a material adverse impact on AngloGold Ashanti’s results of operations and financial condition.
The occurrence of events for which AngloGold Ashanti is not insured or for which its insurance is inadequate may adversely affect cash flows and overall profitability.
AngloGold Ashanti maintains insurance to protect only against catastrophic events which could have a significant adverse effect on its operations and profitability. This insurance is maintained in amounts that the company believes to be reasonable depending upon the circumstances surrounding each identified risk. However, damage and third-party claims arising from catastrophic events may exceed the limit of liability on insurance policies the company has in place. Furthermore, AngloGold Ashanti’s insurance does not cover all potential risks associated with its business and may exclude certain parts of its business. AngloGold Ashanti may elect not to insure certain risks due to the high premiums or for various other reasons, including an assessment that the risks are remote.
The company may not be able to obtain insurance coverage at acceptable premiums. The company believes negotiations with insurance providers have become more difficult for a number of reasons, including prevailing macroeconomic conditions and the risk profile of the mining industry. Insurance for certain risks in particular, such as loss of title to mineral property, political risks in certain jurisdictions, environmental pollution, or other hazards resulting from exploration and production, is not generally available to mining companies on acceptable terms. The availability and cost of insurance coverage can vary considerably from year to year as a result of events beyond the company’s control or from claims, and this can result in higher premiums and periodically being unable to maintain the levels or types of insurance the company typically carries.
The failure to obtain adequate insurance could impair the company’s ability to continue to operate in the normal course or could result in the occurrence of events for which AngloGold Ashanti is not insured, either of which could adversely impact its cash flows, results of operations and financial condition.
AngloGold Ashanti is subject to the risk of litigation, the causes and costs of which are not always known.
AngloGold Ashanti is subject to litigation, arbitration and other legal proceedings arising in the normal course of business and may be involved in disputes that may result in litigation. The causes of potential future litigation cannot be known and may arise from, among other things, business activities, environmental and health and safety concerns, share price volatility or failure to comply with disclosure obligations. The results of litigation cannot be predicted with certainty but could include costly damage awards or settlements, fines, and the loss of licenses, concessions, or rights, among other things.
In the event of a dispute AngloGold Ashanti may be subject to the exclusive jurisdiction of foreign courts or may not be successful in subjecting foreign persons to the jurisdiction of courts in South Africa or the United States.
AngloGold Ashanti is subject to numerous claims, including class actions or similar group claims relating to silicosis and other OLD, and could be subject to similar claims in the future.
AngloGold Ashanti has received notice of two applications for class certification relating to silicosis in which the company is a respondent. It has also received notice of individual claims. For further information, please refer to “Item 8.: Financial Information – Legal Proceedings – South Africa – Silicosis litigation”.
It is possible that additional class actions and/or individual claims relating to silicosis and/or other OLD will be filed against AngloGold Ashanti in the future. AngloGold Ashanti will defend all and any subsequent claims as filed on their merits. Should AngloGold Ashanti be unsuccessful in defending any such claims, or in otherwise favorably resolving perceived deficiencies in the national occupational disease compensation framework that were identified in an earlier decision by the Constitutional Court of South Africa, such matters would have an adverse effect on its financial position, which could be material.
In Colombia, the company is also involved in five class action lawsuits in relation to AGAC Santa Maria-Montecristo and La Colosa projects. One of these class action lawsuits led to a preliminary injunction suspending the mining concession contracts of the Santa Maria-Montecristo project in September 2011. Additionally, in Colombia, AGAC is involved in an action in the Administrative Superior Court of the Cundinamarca District against the Department of the Environment, Housing and Territorial Development (DoE) following its issuance of a fine against AGAC on the basis that AGAC was in breach of its mining terms of reference.
Should the company be unable to resolve disputes favorably or to enforce its rights, this may have a material adverse impact on the company’s financial performance, cash flow and results of operations.
The implementation of an integrated Enterprise Resource Planning (ERP) system could have an adverse effect on AngloGold Ashanti’s results of operations and financial condition.
AngloGold Ashanti is implementing a single, global ERP system to support all the operations managed by AngloGold Ashanti. The ERP system is being implemented over a three-and-a-half-year period which commenced in August 2011. The contemplated implementation of an ERP system on a global basis is inherently a high-risk initiative due to the potential for implementation cost and time overruns. In addition, such implementation could affect the ability of AngloGold Ashanti to report and manage technical and financial information if difficulties in the implementation and operation of the system are experienced, which could have an adverse effect on AngloGold Ashanti’s results of operations and financial condition. The first sites went live during February 2013.
Sales of large quantities of AngloGold Ashanti‘s ordinary shares and American Depository Shares (ADSs), and the perception that these sales may occur or other dilution of the company’s equity, could adversely affect the prevailing market price of the company’s securities.
The bulk of AngloGold Ashanti’s shares are held by a relatively small number of investors. According to information available to the company, AngloGold Ashanti’s four largest shareholders beneficially owned approximately 23.29 percent of AngloGold Ashanti’s ordinary shares as at December 31, 2012.
Poor returns, soaring costs, higher capital expenditure, ill-conceived corporate activity, rising geopolitical and labor risk and low dividend yields over the past few years have resulted in a change in market sentiment towards gold equities. The market price of the company’s securities could fall if large quantities of ordinary shares or ADSs are sold in the public market, if there is divestment by certain types or groupings of investors, or if there is the perception in the marketplace that such sales could occur. Subject to applicable securities laws, holders of the company‘s ordinary shares or ADSs may decide to sell them at any time. The market price of the company’s ordinary shares or ADSs could also fall as a result of any future offerings AngloGold Ashanti makes of its ordinary shares, ADSs, or securities exchangeable or exercisable for the company’s ordinary shares or ADSs, or the perception in the market place that these offerings might occur. AngloGold Ashanti may make such offerings, including offerings of additional ADS rights, share rights or similar securities, at any time or from time to time in the future.
Fluctuations in the exchange rate of currencies may reduce the market value of AngloGold Ashanti’s securities, as well as the market value of any dividends or distributions paid by the company.
AngloGold Ashanti has historically declared all dividends in South African rands. As a result, exchange rate movements may have affected and may continue to affect the Australian dollar, the British pound, the Ghanaian cedi and the US dollar value of these dividends, as well as of any other distributions paid by the relevant depositary to investors that hold the company’s securities. This may reduce the value of these securities to investors.
AngloGold Ashanti’s memorandum and articles of association allow for dividends and distributions to be declared in any currency at the discretion of the board of directors, or the company’s shareholders at a general meeting. If and to the extent that AngloGold Ashanti opts to declare dividends and distributions in US dollars, exchange rate movements will not affect the US dollar value of any dividends or distributions. Nevertheless, the value of any dividend or distribution in Australian dollars, British pounds, Ghanaian cedis or South African rands will continue to be affected. If and to the extent that dividends and distributions are declared in South African rands, exchange rate movements will continue to affect the Australian dollar, British pound, Ghanaian cedi and US dollar value of these dividends and distributions. Furthermore, the market value of AngloGold Ashanti’s securities as expressed in Australian dollars, British pounds, Ghanaian cedis, US dollars and South African rands will continue to fluctuate in part as a result of foreign exchange fluctuations.
AngloGold Ashanti may not pay dividends or make similar payments to shareholders in the future.
AngloGold Ashanti pays cash dividends only if there are sufficient funds available for that purpose. Fund availability depends upon many factors that include the amount of cash available in relation to AngloGold Ashanti’s capital expenditure on existing infrastructure and exploration and other projects.
Under South African law, companies are entitled to pay a dividend or similar payment to its shareholders only if the company meets the solvency and liquidity tests set out in legislation, and the company’s founding documents.
Given these factors, including the capital and investment needs of the company, and the board of directors’ discretion to declare a dividend that includes the amount and timing thereof, cash dividends may not be paid in the future.
ITEM 4: INFORMATION ON THE COMPANY
| 4A. | HISTORY AND DEVELOPMENT OF THE COMPANY |
GROUP INFORMATION
AngloGold Limited was formed in June 1998 with the consolidation of the gold mining interests of Anglo American plc. AngloGold Ashanti Limited, as the company exists today, was formed on April 26, 2004 following the business combination between AngloGold and Ashanti Goldfields Company Limited.
CURRENT PROFILE
AngloGold Ashanti Limited is headquartered in Johannesburg, South Africa. The company (Registration number 1944/017354/06) was incorporated in the Republic of South Africa in 1944 under the name of Vaal Reefs Exploration and Mining Company Limited and operates under the South African Companies Act 71 of 2008 (Companies Act), as amended.
Its registered office is at 76 Jeppe Street, Newtown, Johannesburg, South Africa, 2001. Telephone: +27 11 6376000.
While AngloGold Ashanti’s primary listing is on the Johannesburg Stock Exchange (JSE), the company is also listed on the London Stock Exchange (LSE), the New York Stock Exchange (NYSE), the Ghana Stock Exchange (GhSE) and the Australian Securities Exchange (ASX).
HISTORY AND SIGNIFICANT DEVELOPMENTS
Below are highlights of key corporate activities from 1998:
1998
Formation of AngloGold Limited through the consolidation of East Rand Gold and Uranium Company Limited; Eastvaal Gold Holdings Limited; Southvaal Holdings Limited; Free State Consolidated Gold Mines Limited; Elandsrand Gold Mining Company Limited; H.J. Joel Gold Mining Company Limited and Western Deep Levels Limited into a single, focused, independent, gold mining company. Vaal Reefs Exploration and Mining Company Limited (Vaal Reefs), the vehicle for the consolidation, changed its name to AngloGold Limited and increased its authorized share capital, effective March 30, 1998.
1998-2004
Expansion of AngloGold Limited’s operations outside of South Africa.
2004
Concluded the business combination with Ashanti Goldfields Company Limited, at which time the company changed its name to AngloGold Ashanti Limited.
2007
Anglo American plc sold 69,100,000 ordinary shares of AngloGold Ashanti, thereby reducing Anglo American’s shareholding in AngloGold Ashanti from 41.7 percent to 16.6 percent.
2009
Anglo American plc sold its remaining shareholding to Paulson & Co. Inc.
2010
AngloGold Ashanti eliminated its hedge book, thereby gaining full exposure to spot gold prices.
2012
AngloGold Ashanti acquired the remaining 50 percent interest in Serra Grande in Brazil for $215 million.
The company acquired 100 percent of First Uranium (Proprietary) Limited for $335 million.
| 4B. | BUSINESS OVERVIEW |
AngloGold Ashanti, one of the world’s major gold exploration, mining and marketing companies, holds a portfolio of operations and projects on four continents, and has a worldwide exploration program. The company works across the full spectrum of the mining value chain.
PRODUCTS
AngloGold Ashanti’s main product is gold. In the course of processing the ore mined, by-products such as silver, uranium oxide and sulfuric acid are produced at the Argentinian, South African and Brazilian operations.
OPERATIONS
AngloGold Ashanti’s 21 operations are located in 10 countries (Argentina, Australia, Brazil, Ghana, Guinea, Mali, Namibia, South Africa, Tanzania and the United States). These include six deep-level mines and surface operations in South Africa as well as a combination of surface and underground mining operations in the Americas, Australia and elsewhere on the African continent.
EXPLORATION
The group’s exploration program, covers greenfield, brownfield, and, more recently, marine exploration. Major development projects are Tropicana in Australia, Kibali in the Democratic Republic of the Congo (DRC) and La Colosa in Colombia. Our extensive brownfield, greenfield and marine exploration programs extend to 14 countries, in both established and new gold-producing regions through managed and non-managed joint ventures, strategic alliances and wholly owned ground holdings.
DEVELOPMENT
AngloGold Ashanti utilizes its exploration team to build on its record of new gold discoveries and to grow its gold endowment. The company has increased its capacity to fund a significant project pipeline by incurring longer-term debt, while maintaining capital discipline and improving returns.
MARKETING
Once processed to the doré (unrefined gold bar) stage at AngloGold Ashanti’s operations, this product is dispatched to various precious metal refineries where the gold is refined to a purity of at least 99.5 percent, in accordance with the standards of “good delivery” as determined by the London Bullion Market Association. It is then sold to bullion banks or refiners. Gold has been a much sought after source of wealth over the centuries, be it as an investment, a store of value or as jewellery. AngloGold Ashanti campaigns actively to promote the demand for gold.
GOLD MARKET
AngloGold Ashanti’s gold is refined at various precious metal refineries. In refined and marketable form, gold normally takes the shape of bars, varying in size from 12.5 kilogram to smaller bars weighing some 1 kilogram or less, all of which contain 99.5 percent gold. Through the refineries the gold is sold directly to bullion banks. Bullion banks are registered commercial banks which deal in gold, distributing bullion bought from mining companies and refineries to markets worldwide. These banks hold consignment stocks in all major physical markets and finance these inventories from the margins they charge physical buyers.
The physical gold market is dominated by the jewellery and investment sectors, which together account for 78 percent of total demand. The balance of gold demand is from the electronics and dentistry industry, as well as the uptake from central banks. While the quantity of gold used in jewellery consumption has decreased over the last decade with the steadily rising gold price, the investment market has largely absorbed available supply. Investment in physical gold involves bar and coin hoarding, medals and other retail investment instruments, as well as the now significant market for exchange traded funds (ETFs).
The gold price averaged $1,668 per ounce for 2012, marking the eleventh consecutive year of average annual price increases. After reaching a record of $1,921 per ounce in September 2011, the gold price failed to reach the same level during 2012.
Although gold has traditional “safe haven” status among financial assets, it did not benefit significantly in 2012. This was largely on account of the continued negative correlation between the dollar gold price and the dollar, in which a stronger dollar tended to cap appreciation in the gold price. This pattern was exacerbated by the fact that investors often sold profitable gold positions.
The announcement by the US Federal Reserve of a further round of quantitative easing in mid-September correlated with a boost in the gold price, however, having averaged $1,651 per ounce over the first three quarters of 2012, the announcement of the third round of quantitative easing (QE3) corresponding with an increase in the gold price average to $1,717 per ounce for the final quarter. As of April 19, 2013, the gold price was $1,404 per ounce.
Investment market
Holdings within the ETF universe showed reasonable growth. Although growth in total gold holdings was lower than that experienced in 2009 and 2010, it was an improvement over 2011. ETF holdings grew by 6.4 million ounces in 2011 which represents growth of 9 percent over the year. In 2012, ETF holdings grew by almost 9.4 million ounces or 12 percent.
Among ETFs, which now include some 32 different funds, the NYSE-listed SPDR Gold Shares (GLD) remained the largest at 43.4 million ounces, or almost half of combined holdings of 88.8 million ounces (as at end 2012). This fund grew by 3.1 million ounces in 2012 and alone accounted for over a third of overall growth in holdings during 2012.
The official sector continued to be a significant source of demand through 2012 with estimates of around 17.2 million ounces (net) bought by various central banks across the globe. The most dominant sources of demand from this sector remain those countries which are not members of the Organization for Economic Co-operation and Development (OECD), such as Brazil, Mexico and South Korea, which added to their gold reserves. In contrast, the third year of the Central Bank Gold Agreement ended at the end of September and total sales of 5 tonnes by its signatories were recorded. This represents the lowest annual sales in any of the agreements.
Bar and coin demand for 2012 failed to match the levels of 2011, declining by 260 tonnes year-on-year. Demand experienced from Europe in 2011 did not materialize again in 2012. However, after a slow start to the first half of the year, Indian demand for bars and coins began to emerge and amounted some 25 percent of total demand for 2012. Demand from China, another important source of demand, was flat at 265 tonnes, primarily due to the slowing of the Chinese economy.
Jewellery markets
A jewellers’ strike and doubling of import duties meant that the first half of the year witnessed very poor demand out of India relative to 2011, down by 24 percent. Sentiment improved in the latter half of the year and India remained the strongest performing market for gold jewellery and, in 2012, accounted for 29 percent of global jewellery fabrication.
Slowing fortunes of the Chinese economy had an impact on jewellery demand from this region, down 4.5 tonnes year-on-year, as consumers cut back on their discretionary spending. Hong Kong maintained its levels of jewellery demand year-on-year at 27 tonnes.
European jewellery demand was similarly affected by economic woes and austerity measures.
The outlook for the gold price remains broadly supportive given the continuation of loose monetary policies in both the United States and Europe. However, there is growing confidence that monetary authorities may have managed the worst of these crises. Austerity measures may continue across Europe and this may weigh on European jewellery demand while further measures by the Indian authorities to curb gold imports mean that jewellery demand from this region will also likely decrease in the short term.
RAW MATERIALS
AngloGold Ashanti uses chemicals including cyanide and lime in the production of gold. These chemicals are available from a large number of suppliers.
COMPETITION
As gold mining is a mature and regulated industry, and very significant volumes of gold and gold derivatives trade in the world markets independent of gold mine supply, AngloGold Ashanti does not consider that competition for sales plays any role in its operations as a gold producer. However, gold producers do compete against each other for acquisition of mining assets, exploration opportunities and human resources.
INTELLECTUAL PROPERTY
AngloGold Ashanti, as a group, is not dependent on intellectual property for the conduct of its business as a whole.
SEASONALITY
AngloGold Ashanti’s business is not generally seasonal.
STRATEGY
To achieve its vision to be the leading mining company, AngloGold Ashanti must fulfill its mission to create value for shareholders, employees and business and social partners by safely and responsibly exploring for, mining and marketing its products. Although the primary focus is gold, AngloGold Ashanti will pursue value-creating opportunities in other minerals where it can leverage existing assets, skills and experience to enhance the delivery of value.
Strategic focus areas
AngloGold Ashanti’s five strategic focus areas are set out below:
People are the business, providing the leadership and the supporting management processes to ensure that the right people are in the right roles, doing the right work to deliver against the goals.
Maximize margins, managing revenues to ensure that full value is realized from its products by delivering a quality product and managing costs to protect margins and returns on capital employed.
Manage the business as an asset portfolio, optimizing asset and project portfolios to meet or exceed specified rates of returns. To achieve this, each asset is regularly reviewed and ranked in both absolute terms and relative to its peer group.
Grow the business, developing a range of options for growth, including greenfield and brownfield exploration, new opportunities for promoting organic growth, value-accretive merger and acquisition opportunities, and maximizing the value of commodities other than gold within its portfolio.
Embrace sustainability principles, developing business and social partnerships based on mutual value creation while maintaining a focus on ensuring the safety and well-being of employees, and managing environmental and other impacts.
Management framework
AngloGold Ashanti’s internally developed Project ONE management framework is being implemented throughout the business to support the achievement of its broader strategic objectives. The framework is designed to reduce variability in performance and support a seamless flow from strategy to delivery. This framework prescribes strong leadership, considered role description, appropriate resourcing to the task at hand, well-defined and documented business processes in all areas, clear accountability and consistent analysis of improvement of work undertaken.
Managing performance
The five strategic focus areas are reflected in the role descriptions of each executive and senior manager in the group and form the basis for evaluating and rewarding their performance.
THE REGULATORY ENVIRONMENT ENABLING ANGLOGOLD ASHANTI TO MINE
AngloGold Ashanti’s rights to own and exploit mineral reserves and deposits are governed by the laws and regulations of the jurisdictions in which these mineral properties lie.
AngloGold Ashanti is subject to a wide range of laws and regulations governing all aspects of its operations, including such areas as environmental protection, reclamation, exploration, development, production, taxes, immigration, labor standards and employment issues, occupational health, mine safety, toxic substances, securities and foreign corrupt practices. AngloGold Ashanti has made, and expects to, among other things, make in the future, significant expenditures to comply with these laws and regulations. Non-compliance can result in violations and legal claims, as well as substantial fines, penalties and delays in day-to-day operations. Pending or proposed changes to existing laws and regulations, as well as any proposed or contemplated new laws or regulations could also have significant impacts on AngloGold Ashanti’s business and results of operations, the extent of which cannot be predicted.
There are in some cases certain restrictions on AngloGold Ashanti’s ability to independently move assets out of certain countries in which it has operations, or transfer assets within the group, without the prior consent of the local government or minority shareholders involved. See “Item 10D.: Exchange controls” for details.
For more information on the risks and uncertainties associated with AngloGold Ashanti’s mining rights, see “Item 3D.: Risk factors”, in particular the risk factors entitled “AngloGold Ashanti’s mining rights in the countries in which it operates could be altered, suspended or cancelled for a variety of reasons, including breaches in its obligations in respect of its mining rights”, “Failure to comply with laws, regulations, standards, contractual obligations whether following a breach or breaches in governance processes or fraud, bribery and corruption may lead to regulatory penalties, loss of licenses or permits, and loss of reputation”, “Title to AngloGold Ashanti’s properties may be uncertain and subject to challenge”, “AngloGold Ashanti’s Mineral Reserve, deposits and mining operations are located in countries where political, tax and economic laws and policies may change rapidly and unpredictably and such changes and policies may adversely affect both the terms of its mining concessions, as well as its ability to conduct operations in certain countries” and “AngloGold Ashanti’s Mineral Reserve, deposits and mining operations are located in countries that face instability and security risks that may adversely affect both the terms of its mining concessions, as well as its ability to conduct operations in certain countries”.
South Africa
The MPRDA and the Revised Mining Charter
The Mineral and Petroleum Resources Development Act (MPRDA) came into effect on May 1, 2004. The objectives of the MPRDA are, among other things, to allow for state sovereignty over all mineral and petroleum resources in the country, to promote economic growth and the development of these resources and to expand opportunities for the historically disadvantaged. Another objective of the MPRDA is to ensure security of tenure for the respective operations concerning prospecting, exploration, mining and production. By virtue of the provisions of the MPRDA, the state ensures that holders of mining and prospecting rights contribute to the socio-economicsocioeconomic development of the areas in which they operate.
The Mineral and Petroleum Resources Development Amendment Act (MPRDAA) was passed by Parliament in 2008 and has been signed by the State President and published, but is not yet in effect. Its purpose is to amend the MPRDA in order to, inter alia:among other things:
make the Minister of Mineral Resources (Minister) the responsible authority for implementing environmental matters in termsthe requirements of the National Environmental Management Act, 1998 (NEMA) and specific environmental legislation as it relatesthey relate to prospecting, mining, exploration, production and related activities incidental thereto on the prospecting, mining, exploration or production area;
align the MPRDA with the NEMA in order to provide for one environmental management system;
remove ambiguities in certain definitions;
add functions to the Regional Mining Development and Environmental Committee;
amend transitional arrangements so as to further afford statutory protection to certain existing old order rights; and
provide for matters connected therewith.
On December 27, 2012, the Minister published the Draft Mineral and Petroleum Resources Development Bill, 2012 (Bill) and invited the mining industry and interested and affected parties to comment on it. The Bill seeks to amend the MPRDAA, which itself has not yet come into effect, as described above. It is not clearunclear when if ever, the MPRDAA will come into force. All indications areforce or to what extent the Bill will amend the MPRDAA.
The Bill, as currently drafted, contains, among others, the following provisions:
Residue stockpiles: The MPRDAA proposed including residue deposits and residue stockpiles in the definition of land, creating a “statutory accession” of movable dumps back to the land. The Bill extends this definition to include historic mines and dumps created before the implementation of the MPRDA.
Partitioning of rights and transfers of interests in companies: Section 11 of the MPRDA requires that a controlling interest in an unlisted company be consented to by the Minister. The MPRDAA amended this section so that consent by the Minister must also be obtained for the transfer of a controlling interest in a listed company. The Bill as drafted would amend Section 11 of the MPRDA so that a transfer of “any interest” in a listed company must be consented to by the Minister before such transfer, raising the possibility that the DMRtrading of shares of listed companies could be prohibited.
Mine closure: The Bill makes provision for two major changes to mine closure under the MPRDA. Firstly, the MPRDA would be amended so that a mining company could still incur environmental liability even after a closure certificate relative to a mine is currently working on a set of amendmentsobtained. Secondly, the financial provision paid to the MPRDAA and that a billMinister in terms of section 41 of the MPRDA will be publishedretained for comment in 2012.20 years after the granting of the closure certificate.
Penalties: The Bill would also provide for revised penalties for violations of the MPRDA by making provision for both an administrative fine not exceeding 10 per cent of the person or holder’s annual turnover and exports during the preceding year, and imprisonment not exceeding four years.
The Bill is subject to change and any changes to it could be significant.
The Broad-Based Socio-Economic Empowerment Charter for the South African Mining Industry (the Mining(Mining Charter) sprang from the MPRDA and also took effect on May 1, 2004. The Mining Charter committed all stakeholders in the mining industry to transfer ownership of 26 percent of their assets to black or historically disadvantaged South Africans (HDSAs) within 10 years. The Charter also sets targets for, among other things, the advancement of HDSAs into management positions, the employment of women, procurement of goods and services from HDSA-owned companies, training, community development and the upgrading of mine housing. Mining companies are required to devise plans to achieve these targets, must identify current levels of beneficiation and must indicate opportunities for growth.
The objectives of the Mining Charter are to:
promote equitable access to the nation’s mineral resources by all the people of South Africa;
substantially and meaningfully expand opportunities for HDSAs, including women, to enter the mining and minerals industry and to benefit from the exploitation of the nation’s mineral resources;
use the industry’s existing skills base for the empowerment of HDSAs;
expand the skills base of HDSAs in order to serve the community;
promote employment and advance the social and economic welfare of mining communities and the major labor-sending areas; and
promote beneficiation of South Africa’s mineral commodities.
The Mining Charter envisages measuring progress on transformation of ownership by:
taking into account, among other things, attributable units of production controlled by HDSAs;
allowing flexibility by credits or offsets, so that, for example, where HDSA participation exceeds any set target in a particular operation, the excess may be offset against shortfalls in another operation;
taking into account previous empowerment deals in determining credits and offsets; and
considering special incentives to encourage the retention by HDSAs of newly acquired equity for a reasonable period.
Under the Charter, the mining industry as a whole agreed to assist HDSA companies in securing finance to fund participation in an amount of Rand 100 billion ($10.9 billion) over the first five years. Beyond the Rand 100 billion commitment, HDSA participation will be increased on a willing seller-willingseller, willing buyer basis, at fair market value, where the mining companies are not at risk.
Following a review, the DMRDepartment of Mineral Resources (DMR) amended the Mining Charter and the Revised Mining Charter was released on September 13, 2010. The requirement under the Mining Charter for mining entities to achieve a 26 percent HDSA ownership of mining assets by the year 2014 has beenwas retained. Amendments to the Mining Charter in the Revised Mining Charter include, inter alia, the requirement byrequire mining companies to:
facilitate local beneficiation of mineral commodities;
procure a minimum of 40 percent of capital goods, 70 percent of services and 50 percent of consumer goods from HDSA suppliers (i.e., suppliers ofin which a minimum of 25 percent + 1 vote of their share capital must beis owned by HDSAs) by 2014, these targets being, however, exclusive of non-discretionary procurement expenditure;
ensure that multinational suppliers of capital goods put a minimum of 0.5 percent of their annual income generated from South African mining companies into a social development fund beginning in 2010, to contribute to the socioeconomic development of South African communities;
achieve a minimum of 40 percent HDSA demographic representation by 2014 at executive management (board) level, senior management (EXCO) level,as well as in those positions requiring core and critical skills, middle management level and junior management level;
invest up to 5 percent of annual payroll in essential skills development activities; and
implement measures to improve the standards of housing and living conditions for mineworkers by converting or upgrading mineworkers’ hostels into family units, attaining an occupancy rate of one person per room and facilitating home ownership options for all mineworkers in consultation with organized labor, all of which must be achieved by April 30, 2014.
In addition, mining companies are required to monitor and evaluate their compliance with the Revised Mining Charter, and must submit annual compliance reports to the DMR.
The government takes a “Scorecard” approach to the different facets of promoting the objectives of the Charter. It uses the Scorecard when considering applications for the conversion of existing old order rights into new order rights. The Scorecard sets out the requirements of the Charter in tabular form which allows the DMR to “tick off” areas where a mining company is in compliance. It covers the following areas:
human resource development;
employment equity;
migrant labor;
mine community and rural development;
housing and living conditions;
ownership and joint ventures;
beneficiation; and
reporting.
The new Scorecard attached to the Revised Mining Charter makes provision for a phased-in approach for compliance with the above targets over the 5-year period ending on April 30, 2014. For measurement purposes, the Scorecard allocates various weightings to the different elements of the Revised Mining Charter. Failure to comply with the provisions of the Revised Mining Charter will amount to a breach of the MPRDA, may result in the cancellation or suspension of a mining company’s existing mining rights and may prevent AngloGold Ashanti’Ashanti’s South African operations from obtaining any new mining rights.
On April 29, 2009, as required by section 100(1)(b) of the MPRDA, the Minister published the Code of Good Practice for the South African Mineral Industry (the Code)(Code). The purpose of the Code was to set out administrative principles to enhance implementation of the Mining Charter and the MPRDA. The Code is to be read in combination with the Mining Charter and other legislation relating to measurement of socio-economic transformation in the South African mining industry.
A mining right will be granted to a successful applicant for a period not exceeding 30 years. Mining rights may be renewed for additional periods not exceeding 30 years at a time. A mining right can be canceledcancelled if the mineral to which such mining right relates is not mined at an “optimal” rate.
AngloGold Ashanti holds eightseven mining rights in South Africa five of which have been successfully converted, executed and registered as new order mining rights at the Mineral and Petroleum Resources Titles Office (MPRTO). One old order mining right has been converted and executed and is currently awaiting registration in the MPRTO, whilst two old order mining rights are still awaiting conversion by the Minister of Mineral Resources. The deadline for the conversion process from old to new order rights was the end of April 2009 and AngloGold Ashanti has taken all necessary steps to pursue the conversion of its old order mining rights.
A prospecting right will be granted to a successful applicant for a period not exceeding five years, and may only be renewed once for three years. The MPRDA also provides for a retention period of up to three years after prospecting, with one renewal up to two years, subject to certain conditions.
AngloGold Ashanti holds threefour prospecting rights, one of which is in the process of being converted into a mining right. Six new prospecting right applications have been submitted to the Department of Mineral Resources (DMR)DMR since the end of March 2011, after the moratorium on the issuing of rights was lifted.
AngloGold Ashanti also holds a mining permit for the recovery of sand and clay.clay, which is in the process of being renewed.
AngloGold Ashanti applied for and has been granted a refining license and an import and export permit by the South African Diamond and Precious Metals Regulator.
The BBBEE Amendment Bill
In December 2011, the Department of Trade and Industry (DTI) published the Broad-based Black Empowerment Amendment Bill, 2011 (the(2011 BBBEE Amendment Bill) for public comment. If enacted, theThe BBBEE Amendment Bill willsought to amend the Broad-based Black Economic Empowerment Act 53 of 2003 (the BBBEE(BBBEE Act) to provide a framework of principles, strategies and guidelines aimed at promoting the broad-based socio-economic empowerment of HDSAs across the South African economy and society in the form of ownership, management, employment equity, skills development, preferential procurement, enterprise development and socio-economic development. The public comment period expired in February 2012. Following this public participation process, the 2011 BBBEE bill was revised and a new bill published in November 2012 and(2012 BBBEE Amended Bill). As of April 19, 2013, the 2012 BBBEE Amendment Bill iswas still pending in parliament. If enacted in its current form, theThe 2012 BBBEE Amendment Bill will introduceincludes a number of changes to the current framework under the BBBEE Act, including:
amending and clarifying the definition of the intended beneficiaries of such framework;
amending the definition of “Broad-Based Black Economic Empowerment”, or BBBEE, to introduce the concept of sustainableviable BBBEE and to indicateproviding standards for that preferential procurement includes the promotion of local content procurement, which refers to locally produced goods, services or works that meet a certain minimum local content threshold;procurement;
expanding the scope of the Codes of Good Practice, and the related transformation charters, on BBBEE matters that the Minister of Trade and Industry can issue under the BBBEE Act for specific sectors of the South African economy and making it compulsory for public authorities, governmental agencies and other public entities to apply such codes;
introducing into the BBBEE Act itself the definition of fronting BBBEE practices, which to date has been developed outside of the BBBEE Act and has now been expanded to capture the more sophisticated and unsuspecting fronting transactions, making fronting a criminal offense that is punishable with imprisonment and fines under certain circumstances, reasserting in the BBBEE Act the common law remedies for misrepresentation and more generally enhancing the enforcement mechanism against fronting;
establishing a BBBEE Commission responsible for overseeing, supervising and promoting compliance with the BBBEE Act, as well as receiving and investigating BBBEE-related complaints; and
introducing a new clause providing that in the event of a conflict between the BBBEE Act and any other South African law, the BBBEE Act will prevail.DTI may impose special requirements for specific industries.
Currently, it is unclear whether, when or in which final form the BBBEE Amendment Bill will be enacted.
To date, mining companies operating in South Africa have been required to comply with the BBBEE regime set out under the MPRDA and the Revised Mining Charter, which is specific to the mining industry. See “–The MPRDA and the Revised Mining Charter”. Currently, there is uncertainty as to whether and to what extent the BBBEE Amendment Bill, if and when enacted in its current form, will add to and conflict with the BBBEE requirements applicable to mining
companies under the Revised Mining Charter. The potential implications of any such additional or conflicting regulatory requirements are also unclear. In addition, in connection with BBBEE-related matters mining companies may become subject to the regulatory authority of the DTI and the BBBEE Commission in addition to that of the DMR, which may increase the regulatory burden and compliance costs for mining companies.
The Royalty Act
The Mineral and Petroleum Resources Royalty Act, 2008, or the Royalty Act, was promulgated on November 24, 2008 and came into operation on March 1, 2010. The Royalty Act imposes a royalty on refined and unrefined minerals payable to the State.state.
The royalty in respect of refined minerals (which include gold and platinum) is calculated by dividing earnings before interest and taxes, or EBIT, as calculated under IFRS, by the product of 12.5 times gross revenue calculated as a percentage, plus an additional 0.5 percent. EBIT refers to taxable mining income (with certain exceptions such as no deduction for interest payable and foreign exchange losses) before assessed losses but after capital expenditure. A maximum royalty of 5 percent of revenue has been introduced for refined minerals.
The royalty in respect of unrefined minerals (which include uranium) is calculated by dividing EBIT by the product of nine times gross revenue calculated as a percentage, plus an additional 0.5 percent. A maximum royalty of 7 percent of revenue was introduced for unrefined minerals. Where unrefined mineral resources (such as uranium) constitute less than 10 percent in value of the total composite mineral resources, the royalty rate in respect of refined mineral resources may be used for all gross sales and a separate calculation of EBIT for each class of mineral resources is not required. For AngloGold Ashanti, this means that currently the company will pay a royalty based on refined mineral resources (as the unrefined mineral resources (such as uranium) for AngloGold Ashanti for 20112012 constituted less than 10 percent in value of the total composite mineral resources). The rate of royalty tax payable for 20112012 was 2.971.3 percent of revenue of the company’s South African operations.
CONTINENTAL AFRICA
Democratic Republic of the Congo
The mining industry in the Democratic Republic of the Congo (DRC) is regulated primarily by the Mining Code enacted in July 2002 and its ancillary Mining Regulations, promulgated in March 2003 (DRC Mining Code). The DRC Mining Code vests the Minister of Mines with the authority to grant, refuse, suspend and terminate mineral rights. Mineral rights may be granted in the form of exploration permits for an initial period of four years or in the form of mining permits which are granted for an initial period of 30 years. An exploration permit may, at any time before expiry, be transformed partially into a mining license or a small-scale mining permit. ExploitationMining permits are granted upon successful completion of exploration and satisfaction of certain requirements, including approval of an environmental impact study and an environmental management plan.
The holder of a mining permit is required to commence development and mine construction within three years of the award of such permit. Failure to do so may lead to forfeiture of the mining permit. A permit holder must comply with specific rules relating to, among others, protection of the environment, cultural heritage, health and safety, construction and infrastructure planning. Mining and exploration activities are required to be undertaken so as to affect as little as possible the interests of lawful occupants of land and surface rights holders, including their customary rights. The exercise of mineral rights by title holders which effectively deprives or interferes with the rights of occupants and surface rights holders, requires payment of fair compensation by the mineral title holder.
To protect and enforce rights acquired under an exploration or mining permit, the DRC Mining Code provides, depending on the nature of a dispute or threat, administrative, judicial and national or international arbitral recourses.
The DRC Mining Code sets out taxes, charges, royalties and other fees payable to the treasury by a mining title holder in respect of its activities. It also provides for a level of fiscal stability, in that existing tax, customs, exchange and benefits applicable to mining activities are guaranteed to remain unchanged for a period of 10 years in favor of a mining title holder in the event that amendments to the DRC Mining Code would result in less favorable payment obligations. In 2011,
On January 1, 2012, a value added tax (VAT) replaced the previously applicable sales tax. The standard rate of VAT is 16 percent and is applicable to mining companies.
On January 1, 2013, a withholding tax of 14 percent became effective. The tax is applicable to services fees payable to a non-resident service provider by a resident of the DRC.
On July 18, 2012 the Convention between the Government of the Republic of South Africa and the Government of the Democratic Republic of Congo for the avoidance of double taxation and the prevention of fiscal evasion with respect to taxes on income (Convention) came into effect, and is applicable to:
withholding taxes on amounts paid or credited on or after 1 January 2013; and
other income taxes, levied in respect of taxable periods beginning on or after 1 January 2013.
The Convention reduces the withholding tax on dividends paid by companies resident in the DRC Government passedto companies resident in South Africa from 20 percent to 5 percent and on interest paid by companies resident in the DRC to companies resident in South Africa from 20 percent to 10 percent. A South African company must own at least 25 percent of a law introducing VAT at a rate of 16 percent. As this new tax framework conflicts with somerelevant DRC entity’s outstanding shares in order to take advantage of the provisionsreduced rates.
In October 2012, the DRC Minister of Mines announced a proposed overhaul of the DRC Mining Code,Code. An informal review process has commenced. The proposals seek to, among others, increase the Chamber of Mines is now seeking clarificationgovernment stake to 35 percent from the DRC Government. This may result inexisting 5 percent, increase the DRC Mining Code being amended in the coming year.royalty rates from 2.5 percent to 6 percent on some minerals, and introduce a windfall tax of 50 percent levy on certain “super profits”. No formal timeframe or process has been announced for this review.
AngloGold Ashanti holds the majority stake and is the operator of Ashanti Goldfields Kilo (AGK) (86.22 percent), an exploration and mining joint venture with Société Minière de Kilo-Moto (SOKIMO) (13.78 percent), a state-owned gold company.
AngloGold Ashanti also holds a stake in the Kibali gold project located in northeastern DRC. The project is operated by Randgold Resources and is owned by Randgold Resources (45 percent), AngloGold Ashanti (45 percent) and SOKIMO (10 percent), which latter share represents the interest of the DRC government in the Kibali gold project. This project is currently in construction phase with first production anticipated in 2014.
Ghana
The Constitution of Ghana as well as the Minerals and Mining Act, 2006 (Act 703) (the GMM(GMM Act) provide that all minerals in Ghana in their natural state are the property of the State and title to them is vested in the President on behalf of and in trust for the people of Ghana, with rights of prospecting, recovery and associated land usage being granted under license or lease.
The grant of a mining lease by the Ghana Minister of Mines is normally subject to parliamentary ratification unless the mining lease falls into a class of transactions exempted by Parliament.
Control of mining companies
The Ghana Minister of Mines has the power to object to a person becoming or remaining a ‘shareholder controller’,shareholder controller, a ‘majoritymajority shareholder controller’controller or an ‘indirect controller’“indirect controller” of a company which has been granted a mining lease if the Minister believes the public interest would be prejudiced by the person concerned becoming or remaining such a controller.
Stability agreement
The GMM Act provides for stability agreements as a mechanism to ensure that the incentives and protection afforded by laws in force at the time of the stability agreement are guaranteed for a period of 15 years. A stability agreement is subject to ratification by Parliament.
Prior to the business combination between AngloGold and Ashanti in April 2004, AngloGold and the government of Ghana agreed on the terms of a stability agreement (the “Ghana Stability Agreement”) to govern certain aspects of the fiscal and regulatory framework under which AngloGold Ashanti would operate in Ghana following the implementation of the business combination. The stability agreementGhana Stability Agreement necessitated the amendment of the Obuasi mining lease which had been ratified by Parliament.
Under the stability agreement,Ghana Stability Agreement, the government of Ghana agreed:
to extend the term of the mining lease relating to the Obuasi mine until 2054 on terms existing prior to the business combination;
to maintain, for a period of 15 years, the royalties payable by AngloGold Ashanti with respect to its mining operations in Ghana at a rate of 3 percent per annum of the total revenue from minerals obtained by AngloGold Ashanti from such mining operations;
to ensure the income tax rate would be 30 percent for a period of 15 years. The agreement was amended in December 2006 to make the tax rate equal to the prevailing corporate rate for listed companies; and
to permit AngloGold Ashanti and any or all of its subsidiaries in Ghana to retain up to 80 percent of export proceeds in foreign currencies offshore, or if such foreign currency is held in Ghana, to guarantee the availability of such foreign currency.
The stability agreementGhana Stability Agreement also stipulates that a sale of AngloGold Ashanti’s or any of its subsidiaries’ assets located in Ghana remains subject to the government’s approval. Furthermore, the government retains its special rights (Golden Share) under the provisions of the GMM Act pertaining to the control of a mining company, in respect of its assets and operations in Ghana.
The Governmentgovernment of Ghana agreed that AngloGold Ashanti’s Ghanaian operations will not be adversely affected by any new enactments or orders, or by changes to the level of payments of any customs or other duties relating to mining operations, taxes, fees and other fiscal imports or laws relating to exchange control, transfer of capital and dividend remittance for a period of 15 years after the completion of the business combination. For example, AngloGold Ashanti
The government of Ghana has been exempted fromconstituted a review committee to review and renegotiate stability agreements with the applicationmining companies. Within the committee’s powers of review are the redrafting of such stability agreements, the determination of whether stability agreements comply with the mining laws of Ghana and the Ghanaian legal regime for mining (fiscal requirements, foreign exchange regulations and the provisions of the National Fiscal Stabilization Act 2009 (Act 785) (NFS Act). The NFS Act
imposed a 5 percent levy on all profits beforeIn March 2012 the tax for mining companies for fiscal years 2009 and 2010, as a temporary measure to raise additional revenue to meet critical expenditures, while maintaining the government’s fiscal objectives. In its 2011 Budget Statement and Economic Policy, the Government extended the applicationlaws of the NFS Act for another fiscal year. AngloGold Ashanti has also been exempted from the application of the March 2010 amendmentGhana were amended. Changes to the GMM Act. The Minerals and Mining (Amendment) Act, 2010 (Act 794) fixedtax laws include:
An increase in the royaltyincome tax rate at 5 percent, whereas the prior GMM Act provision had stated that royalties payable would not be more than 6 percent or less than 3 percent of the total revenue of minerals obtained by the holder.
Foreseeable impact of Ghana’s 2012 Budget Statement on AGA operations in Ghana
Accordingapplicable to the November 2011 Budget Statement, Corporate Tax for mining companies will be increasedbusinesses from 25 percent to 35 percent. AngloGold Ashanti is currently protected until 2019 from any increase of its income tax rate to greater than the rate provided for under the Ghana Stability Agreement.
Introduction of a new capital allowance regime for class 3 assets (which include mineral and petroleum exploration and production rights, buildings, structures and works of a permanent nature used in mineral and petroleum exploration and production and plant and machinery used in mining and petroleum operations) that provides for a 20 percent andstraight line rate for a further Windfall Profit Taxperiod of 10five years. Pursuant to the Ghana Stability Agreement, this change will not affect AngloGold Ashanti until 2019.
Elimination of the 5 percent was imposedallowance on profit with effect fromprior year additions. Prior to the 2012 amendment, the tax code granted an additional 5 percent of the value of assets acquired and qualified to be classified as class 3 assets for the purpose of granting capital allowances. Capital allowance is now 20 percent each year on the total value of the assets. Pursuant to the Ghana fiscal year, which commenced January 2012. This will have the overall effect of increasing mining companies’ tax liability by 20 percent. Additionally, when determining chargeable income for tax purposes, the costs incurred by a mining company in one contract area or siteStability Agreement, this change will not be allowedaffect AngloGold Ashanti until 2019.
A ring fencing rule to be setprevent mining businesses from deducting or setting off against profitscosts from another contractone mining area or site belongingwith another’s income. Pursuant to such mining company.the Ghana Stability Agreement, this change will not affect AngloGold Ashanti until 2019.
While the stability agreement (as amended) between AGA and the Government of Ghana caps AGA’s Corporate Tax liability at 30 percent and precludes AGAStability Agreement protects AngloGold Ashanti from being adversely affected by any new enactments that would impose obligations upon AGAAngloGold Ashanti or any of its Ghanaian subsidiaries, the Government of Ghana has announced that it has constituted a team to re-negotiaterenegotiate stability agreements with mining companies. To date, no formal communicationA government committee has been received by AGA in this regard.invited AngloGold Ashanti for discussions and requested certain information. The government may intend to review the Ghana Stability Agreement.
Retention of foreign earnings
AngloGold Ashanti’s operations in Ghana are permitted to retain 80 percent of their foreign exchange earnings in an offshore foreign exchange account. In addition, the company has permission from the Bank of Ghana to retain and use US dollars, outside of Ghana, required to meet payments to the company’s hedge counterpartscounterparties which cannot be met from the cash resources of its treasury company.
Localization policy
AMining companies must submit a detailed program must be submitted for the recruitment and training of Ghanaians with a view to achieving ‘localization’“localization”, which is the replacement of expatriate personnel in a company’s Ghanaian operations by Ghanaian personnel. In addition, the holdermining companies must give preference to Ghanaian products and personnel, to the maximum extent possible, consistent with safety, efficiency and economies. Recently passed Minerals and Mining (General) Regulations, 2012 (L.I. 2173) give further details on the localization policy.
Except as otherwise provided in a specific mining lease, all immovable assets of the holder underof the mining lease vest in the State upon termination, as does all moveable property that is fully depreciated for tax purposes. Moveable property that is not fully depreciated is to be offered to the Statestate at the depreciated cost. The holder must exercise his rights subject to such limitations relating to surface rights as the Minister of Mines may prescribe.
Mining properties
The company is required to pay ground rent to the government of Ghana and such other fees as are prescribed by legislation, including royalties on timber felled within the lease area.
Obuasi
The current mining lease for the Obuasi area was granted by the Governmentgovernment of Ghana on March 5, 1994. It grants mining rights to land with an area of approximately 334 square kilometers in the Amansie East and Adansi West districts of the Ashanti region for a term of 30 years from the date of the agreement. In addition, the application for a mining lease over thean adjacent 140 square kilometers haswas also been granted, resulting in the total area under the mining lease conditions increasing to 474 square kilometers, (the Lease Area). The company is required to pay rent to the Government of Ghana (subject to review every five years, when the rent may be increased by up to 20 percent) at a rate of approximately $5 per square kilometer and such royalties as are prescribed by legislation, including royalties on timber felled within the Lease Area. kilometers.
The Government of Ghana agreed to extend the term of the mining lease relating to the Obuasi mine until 2054. The mining lease was formally ratified by Parliament on October 23, 2008.
Iduapriem and Teberebie
Iduapriem has title to a 33 square kilometer mining lease granted on April 19, 1989 for a period of 30 years. The terms and conditions of the lease are consistent with similar leases granted in respect of the Obuasi mining lease. Teberebie has two leases, one granted in February 1998 for a term of 30 years, and another granted in June 1992 for a term of 26 years. In January 2009 Iduapriem obtained a new mining lease, the Ajopa Concession, for a period of 10 years. The concession covers an area of 48.34 square kilometers. In December 2011 the Minister of Lands and Natural Resources gave his consent for Teberebie’s title to a 25.83 square kilometer mining lease, granted in June 1992 for a period of 30 years, to be assigned to Iduapriem. While ownership of the lease has passed to Iduapriem, the registration of the transfer of the lease is still in process.
Guinea
In Guinea, all mineral substances are the property of the state. Mining activities are currently regulated by the Mining Code, 1995. However, a new Mining Code was promulgated on September 9, 2011 and published in the official gazette in January 2012 (New Mining Code). The New Mining Code will come into force once a presidential decree has been published. See “New Mining Code” below.
The right to undertake mining operations can only be acquired by virtue of one of the following mining titles: surveying permit, small-scale mining license, mining prospecting license, mining license or mining concession. The holders of mining titles are guaranteed the right to dispose freely of their assets, to organize their enterprises as they wish, to engage and discharge staff in accordance with the regulations in force, to freely move their staff and their products throughout Guinea and to dispose of their products in international markets.
The group’s Guinea subsidiary, Société AngloGold Ashanti Goldfields de Guinée SA (SAG), has title to the Siguiri mining concession area which was granted on November 11, 1993 for a period of 25 years. The agreement provides for an eventual extension/renegotiation after 23 years for such periods as may be required to exhaust the economic Ore Reserve.
At Siguiri, the original area granted of 8,384 square kilometers was reduced to a concession area of four blocks totaling 1,495 square kilometers.
SAG has the exclusive right to explore and mine in the remaining Siguiri concession area for an additional 22-year period from November 11, 1996 under conditions detailed in a Convention de Base which predates the Guinea Mining Code 1995.(described below).
Key elements of the Convention de Base are that:
The Republic of Guinea (the State)(Guinea) holds a 15 percent free-carried or non- contributorynon-contributory interest; is entitled to a royalty of 3 percent based on a spot gold price of less than $475 per ounce; and is owed 5 percent of the value of gold exported, based on a spot gold price above $475 per ounce, as fixed on the London Gold Bullion Market;
A local development tax of 0.4 percent is payable on gross sales revenue;
Salaries of expatriate employees are subject to a 10 percent income tax;
Mining goods imported into Guinea are exempt from all import taxes and duties for the first two years of commercial production; and
SAG is committed to adopting and progressively implementing a plan for the effective rehabilitation of the mining areas disturbed or affected by operations.
The Convention de Base is subject to early termination if both parties formally and expressly agree to it, if all project activities are voluntarily suspended for a continuous period of eight months or are permanently abandoned by AngloGold Ashanti’s subsidiary;SAG or if SAG goes into voluntary liquidation or is placed into liquidation by a court of competent jurisdiction.
NewGuinea Mining Code
The government enacted a mining code in September 2011 (Guinea Mining Code). However, the government suspended the application of the Guinea Mining Code pending the finalization of certain further amendments. In November 2012, a draft bill modifying certain provisions of the Guinea Mining Code was circulated for comment (Draft Bill). The revised Guinea Mining Code has not yet been finalized.
Pursuant to the NewGuinea Mining Code, existing mining titles in effect on the date on which the NewGuinea Mining Code comes into force remain valid for their duration and for the substances for which they have been issued.
The NewGuinea Mining Code provides for the establishment of a State mining company which will hold the interests that the StateGuinea has in all the mining companies present in Guinea. The granting of a mining title by the StateGuinea gives rise to a State shareholding of 15 percent in the mining company, which may not be diluted. This interest is acquired upon signing of the mining title and no financial contribution may be requested from the StateGuinea in return. The StateGuinea further reserves the right to acquire an additional share of 20 percent in cash in accordance with the terms established with each company concerned, which could bring the total shareholding of the StateGuinea to 35 percent.
The provisions contained in the NewGuinea Mining Code concerning mining tax, customs duties, transparency, anti-corruption and labor (Mandatory Provisions) shall apply within 60 days following the effective date of the NewGuinea Mining Code to all mining companies having reached the exploitation phase. The NewGuinea Mining Code does not provide for transitional, stability or harmonization provisions concerning these Mandatory Provisions. To the extent that non-mandatory provisions of the NewGuinea Mining Code are inconsistent with the Convention de Base, the Government of Guinea and AGA are required to work together as soon as possible after the NewGuinea Mining Code comes into force to harmonize the Convention de Base with the NewGuinea Mining Code.
The aforementioned Mandatory Provisions may be applicable to AGAAngloGold Ashanti as it is currently in exploitation phase. To date, AGA has not received any formal communication from the Government of Guinea relating to the renegotiation of its Convention de Base.
The NewGuinea Mining Code also contains a formal commitment to the principles of the Extractive Industries Transparency Initiative (EITI). The EITI sets a global standard for oil, gas and mining companies to publish what they pay and for governments to disclose what they receive. In addition to binding the government to EITI, the code requires all mining companies working in Guinea – even those from countries that have not committed to EITI – to respect the initiative'sinitiative’s principles and processes.
Currently, the government holds a stake of 15 percent in the Siguiri gold mine. Following the adoption of the Guinea Mining Code, the Guinean government also announced its intention to carry out a review of the mining conventions currently in force in Guinea (including the Convention de Base). According to the Guinean government’s description of the review, the review will focus, among other things, on the financial model of each mining convention, the discrepancies between the content of each existing convention and the new mining code, the legal status of each convention, and the specific challenges associated with the development of each project.
The Government has established a technical committee (the “Technical Committee”) tasked with negotiating amendments to mining conventions currently in place between the Government and the mining companies, to ensure the progressive implementation of the provisions of the Guinea Mining Code. The Draft Bill provides that the amendment agreements need to be finalized at the latest 24 months following the publication of the Guinea Mining Code. To date, SAG has not received any formal communication from the Government of Guinea relating to the renegotiation of its Convention de Base, but it expects that it may be invited by the Technical Committee to renegotiate its Convention de Base during the course of 2013 or 2014.
Mali
Mineral rights in Mali are governed by Ordinance No. 99-32/P- RMP-RM of August 19, 1999 enacting the mining code, as amended by No. 013/2000/P-RM of February 10, 2000 and ratified by Law No. 00-011 of May 30, 2000 (the “Mali Mining Code)Code”), and Decree No. 99-255/P-RM of September 15, 1999 implementing the Mali Mining Code.
Prospecting activities are carried out under prospecting authorizations (authorization(authorization de prospection)prospection). The authorizations give an individual or corporate entity the exclusive right to carry out prospecting activities over a given area for a period of three years renewable once for a period of 3 years without a reduction in the area covered by the authorization. Exploration activities may be carried out under exploration permits (permis(permis de recherche)recherche). The latter are granted to corporate entities only by order of the Minister of Mines. Exploration permits are granted for a period of three years, renewable twice for additional three-year periods. Each renewal requires the permit holder to relinquish 50 percent of the area covered by such permit. The entity applying for such a permit must provide proof of technical and financial capabilities.
An exploitation permit (permis d’exploitation)(permis d’exploitation) is required to mine a deposit located within the area of a prospecting authorization or an exploration permit. The exploitation permit grants an exclusive right to prospect, explore and exploit the named substances for a maximum period of 30 years renewable three times for an additional 10 years. The exploitation permit is granted only to the holder of an exploration permit or of a prospecting authorization and covers only the area governed by the exploration permit or the prospecting authorization. An application must be submitted to the Minister of Mines and to the National Director of Mines.
As soon as the exploitation permit is granted, the permit holder must incorporate a company under the law of Mali. The permit holder will assign the permit for free to this company. The StateMali will have a 10 percent free carried interest in the company. This interest will be converted into priority shares and the State'sMali’s participation will not be diluted in case of an increase in capital.
Applications for exploitation permits must contain various documents attesting to the financial and technical capacity of the applicant, a detailed environmental study in respect of the impact of the project on the environment, a feasibility study and a bank deposit. The permit is granted by decree of the Head of Government. Refusal to grant a permit may only be based on two grounds: insufficient evidence to support the exploitation of the deposit or the failure of the environmental study.
Applications for prospecting authorizations and exploration permits must contain various documents attesting to the financial and technical capacity of the applicant, a detailed works and costs program, a map defining the area which is being requested and providing geographical coordinates, the exact details relating to the identity of the applicant and evidence of the authority of the signatory of the application. Such titles are granted by ministerial order. Any refusal to grant such titles shall be notified by letter from the Minister of Mines to the applicant.
All mining titles mentioned above require an establishment convention (convention d'etablissement)d’etablissement) to be signed by the StateMali and the titleholder defining their rights and obligations. A standard form of such establishment convention has been approved by decree of the Head of Government.
AngloGold Ashanti has interests in Morila, Sadiola and Yatela, all of which are governed by establishment conventions covering exploration, mining, treatment and marketing in a comprehensive document. These documents include general provisions regarding exploration (work program, fiscal and customs framework) and exploitation (formation of a local limited liability mining company, State interest, fiscal and customs framework governing construction and exploitation phases, exchange controls, marketing of the product, accounting regime, training programs for local labor, protection of the environment, reclamation, safety, hygiene and dispute settlement).
As the establishment conventions contain stabilization clauses, the mining operations carried out by the AngloGold Ashanti entities in Mali are subject to the provisions of the previous mining codes of 1970 and 1991 but also, for residual matters, to the provisions of the Mining Code of 1999.
AngloGold Ashanti has complied with all applicable requirements and the relevant permits have been issued. Morila, Sadiola and Yatela have 30-year permits which expire in 2024, 2020 and 2024, respectively.
Namibia
The Minerals (Prospecting and Mining) Act 33 of 1992 (the MPM(MPM Act) provides that all rights to minerals in the Republic of Namibia vest in the State.state. The Mining Rights and Mineral Resources division of the Directorate of Mining handles all applications for and allocation of rights in relation to minerals in the Republic of Namibia.
Prospecting and mining activities are regulated by the MPM Act which, among others, provides for the granting, refusal, suspension and termination of rights in relation to minerals. The right to undertake prospecting and mining operations can only be acquired by virtue of one of the following mining titles:
Non-exclusive Prospecting Licenses;
Reconnaissance Licenses;
Mining Claims;
Exclusive Prospecting Licenses;
Mineral Deposit Retention Licenses; and
Mining Licenses.
To enable a company to prospect or mine,for minerals, the Ministry of Mines and Energy may grant an Exclusive Prospecting License (oror a Mining Claim in some instances).Non-exclusive Prospecting License. Upon application and presentation of a feasibility study, the Ministry then grants a Mining License. Alternatively, the holder of a Non-Exclusive Prospecting License may peg and register a Mining Claim. Licensing decisions take into account the abilities of the company (including its mining, financial and technical capabilities), projected rehabilitation programs and the payment of royalties. Mining Licenses are only awarded to Namibian citizens and companies registered in Namibia, which includes foreign companies registered with the Namibian registrar of companies. A Mining Claim, on the other hand, may only be pegged by Namibian citizens or companies whose articles of association limits shareholding in those companies to Namibian citizens.
In 2011, the government adopted the New Equitable Economic Empowerment Framework (NEEEF). The objectives of the NEEEF are aimed at redressing past inequalities and providing measures for empowerment. No legislation implementing the NEEEF has to date been enacted. In addition, the Chamber of Mines is in the process of negotiating its own charter with the government.
AngloGold Namibia (Pty) Ltd was granted the necessary licenses in respect of its mining and prospecting activities in Namibia. Its current 15-year Mining License expires in October 2018. An application has been submittedpresented to the Ministry of Mines and Energy for the extension of the aforementioned Mining License to 2030. This application includes the mining area known as the Anomaly 16.
Taxes
The Namibian Government appears to have withdrawn or deferred the mining tax proposals that it made in 2011. These proposals included, amongstamong others, a requirement for mines to pay a value added tax of 15 percent on the export value of unprocessed minerals, a 5 percent export duty and an increased corporate tax rate of 44 percent, up from 37.5 percent. The minimum historic corporate tax rate on mining companies is 25 percent. Most mining companies currently pay between 25 and 40 percent, with diamond mines taxed at 55 percent. A corporate tax of 40 percent applies to profits from non-mining activities. There is a 10 percent withholding tax on interest earned by foreigners on their deposits held with Namibian banks or unit trust schemes. There is also a 25 percent withholding tax on certain services, management and consultancy fees rendered by foreigners.
An amount received from the sale or other disposal of a mineral license or the shares in a company holding a mineral license is deemed to be an income source in Namibia for purposes of calculating income tax, regardless of where the
transaction takes place.
Royalties
In 2008, the Government confirmed a royalty schedule that originally had been introduced in 2004. Since then all mining companies, at the discretion of the Minister of Mines and Energy, pay a royalty of between 3 percent and 10 percent on the market value of base, precious, and rare metals and non-nuclear mineral fuels. AGAAngloGold Namibia (Pty) Ltd currently pays a royalty of 3 percent. The government also introduced a windfall royalty, (now in effect), which is payable at the discretion of the Minister, and a new type of royalty in respect of all minerals other than precious stones and dimension stones, which might function as a penalty royalty. For example, this penalty may be imposed on minerals that are not in their most refined state that have been or are about to be exported and are of such a nature that their value can be increased by way of a practical and economical refining process that is available in Namibia.
Tanzania
Mineral rights in the United Republic of Tanzania are principally governed by the Mining Act of 2010 (the(Tanzania Mining Act), and the Mining Regulations, 2010 (Tanzania Mining Regulations), which include: Mining (Mineral Rights) Regulations 2010; Mining (Environmental Protection For Small Scale Mining) Regulations 2010; Mining (Mineral Beneficiation) Regulations 2010; Mining (Mineral Trading) Regulations 2010; Mining (Safety, Occupational Health and Environmental Protection) Regulations 2010; and the Mining (Radioactive Mineral) Regulations 2010.
The Tanzania Mining Act and the Tanzania Mining Regulations came into force in November 2010. Ownership of and control over minerals on, in or under the land vest in the President of the United Republic of Tanzania. No person is allowed to prospect for minerals or carry on mining operations except pursuant to the authority of a mineral right license granted, or deemed to have been granted, under the Tanzania Mining Act or its predecessor acts.
To enable a company to prospect or mine, the Ministry of Energy and Minerals (the MEM)(MEM) initially grants an exclusive prospecting license. Upon presentation of a feasibility study, together with certain other environmental, social and financial assurances, the MEM may then grantsgrant a form of license for mining. Licensing decisions take into account the abilities of the company (including its mining, financial and technical capabilities), projected rehabilitation programs, environmental compliance and the payment of royalties.
The following licenses can be applied for under the Tanzania Mining Act:
Licenses for Exploration:
Prospectingprospecting license;
Gemstonegemstone prospecting license; and
Retentionretention license.
Licenses for Mining:
Specialspecial mining license (if the proposed capital investment is equal to at least US$100 million);
Miningmining license (if the proposed capital investment is equal to between US$100,000 and US$100 million); and
Primaryprimary mining license (reserved for Tanzanian citizens).
Licenses for Ancillary Activities:
Processingprocessing license;
Smeltingsmelting license; and
Refiningrefining license.
For purpose of AngloGold Ashanti’s Geita Gold Mine, only prospecting, retention and special mining licenses are relevant.
A prospecting license grants the holder the exclusive right to prospect in the area covered by the license for all minerals within the class of minerals applied for. The classes that can be applied for include (amongst others):
metallic minerals;
energy minerals;
gemstones other than kimberlitic diamonds; and
kimberlistickimberlitic diamonds.
An application for a prospecting license is made to the Commissioner for Minerals and the license is valid for a period of four years. Thereafter, the license is renewable for three further periods – the first period being for three years and the second and third periods being for two years each. Upon each renewal, 50 percent of the area covered by the license must be relinquished. A company applying for a prospecting license must, inter alia,among other things, state the financial and technical resources available to it.
If the holder of a prospecting license has identified a mineral deposit within the prospecting area that is potentially of commercial significance but that cannot be developed immediately because of technical constraints, adverse market conditions or other economic factors of a temporary character, it can apply for a retention license. A retention license can also be requested from the Minister after the expiry of a prospecting license period, for reasons ranging from financial to technical considerations. A retention license is valid for a period not exceeding five years and is thereafter renewable for a single period of five years. The advantage of converting a prospecting license into a retention license is that the MEM may not revoke a retention license if the license holder fails to meet its obligations within the time frame agreed on application for the license (as would be the case with a prospecting license).
Holders of prospecting or retention licenses over a tenement will not automatically have first right to any mining license granted over that tenement. However, in practice, they will be best positioned to meet the requirements to be granted a form of license for mining.
Mining is mainly carried out through either a mining license or a special mining license, both of which confer on their holder the exclusive right to conduct mining operations in or on the area covered by the license. A special mining license is granted for the shorter of either the estimated life of the ore body indicated in the feasibility study report or such period as the applicant may request. It is renewable for a further period not exceeding the estimated life of the remaining ore body.
Except in the case of a special mining license, a mineral right may be freely transferred by its holder (in whole or in part) to another person or entity without requiring consent from the MEM. However, the Commissioner for Minerals must be notified of any transfer of a prospecting or retention license and will refuse to register the transfer unless the transferee proves that it meets the financial and technical capability criteria required to apply for such licenses. The assignment of a special mining license generally requires the prior consent of the MEM, such consent not to be unreasonably withheld or delayed. There are limited exceptions to the requirement for the Minister’s consent (such as transfers to an affiliate company of the license holder or to a financial institution or bank as security for any loan or guarantee in respect of mining operations).
Special mining licenses have certain fiscal and other advantages over mining licenses, as the holder of a special mining license may enter into a mining development agreement with the government of Tanzania to guarantee the fiscal stability of a long-term mining project and make special provision for the payment of royalties, taxes, fees and other fiscal imposts and a special mining license holder may, in certain circumstances, unilaterally amend the program of the mining operations agreed with the MEM.
AngloGold Ashanti has concluded a development agreement with the Ministry and was issued a mining license for a period of 25 years, which expires in 2023.
The Finance Act 2012 which was passed on October 11, 2012 introduced some important changes to the fiscal regime with effect from July 1, 2012 that impact upon AngloGold Ashanti, in particular:
Introduction of a 30 percent capital gains tax on the sale of shares by an off-shore parent company. Changes were also made to the procedure for payment of capital gains tax by the seller of shares. Tax at the rate of 30 percent is payable by way of an initial installment of 20 percent on the transfer, based on the notional gain that the seller would make where after a further installment of the remaining 10 percent is due.
Prior to 2012 budgetary changes under the VAT Act 1997, mining companies were entitled to 100 percent VAT relief. This implied that no VAT was applicable on purchases made by mining companies. Following amendments to the VAT Act through the Finance Act 2012, the provision providing VAT relief to mining companies was repealed. As a result mining companies are no longer eligible for VAT relief.
AUSTRALASIA
Australia
In Australia, with a few exceptions, all onshore minerals are owned by the Crown (in right of the State).Crown. The respective Minister for each Statestate and Territoryterritory is responsible for administering the relevant mining legislation enacted by the Statesstates and Territories.territories.
Native Title legislation applies to certain mining tenures within Australia. Australia recognizes and protects a form of Native Title that reflects the entitlement of Aboriginal people to their traditional lands in accordance with their traditional custom and laws. Should Native Title claims or determinations exist, certain Native Title processes and procedures will apply under the Native Title Act 1993 (Cth) before the tenure is granted. Tenure may be granted subject to conditions relating to Native Title rights. In the mining context, Native Title matters are managed as part of the tenement grant process. If disputes arise in relation to the grant of a particular tenement, they can be referred to the National Native Title Tribunal, established under the Native Title Act, for resolution.
Other Federalfederal and Statestate Aboriginal heritage laws operate in parallel to the Native Title legislation. They exist predominantly for the purposes of protecting Aboriginal sites and areas of significance from disturbance. To date, there has not been any significant impact on any of AngloGold Ashanti’s tenure due to Native Title or Aboriginal Heritage legislation.
AngloGold Ashanti’s operating properties are located in the state of Western Australia where tenure is issued under, and mining operations are governed by, the Mining Act 1978 (WA). The most common forms of tenure are exploration and prospecting licenses, mining leases, miscellaneous licenses and general purpose leases. In most Australian states, if the holder of an exploration license establishes indications of an economic mineral deposit in the area covered by the exploration license and complies with the conditions of the grant, the holder of the exploration license has a priority right against all others to be granted a mining lease which gives the holder exclusive mining rights with respect to minerals on the property. A general purpose lease may also be granted for one or more of a number of permitted purposes. These purposes include erecting, placing and operating machinery and plantplants in connection with mining operations, depositing or treating minerals or tailings and using the land for any other specified purpose directly connected with mining operations.
Mining tenures will be granted with conditions relating to protection of the environment. Exploration and mining operations may also require separate approval from the State, Territorystate, territory or Federal Environment Minister underfederal environment minister, which may require completion of an environmental impact assessment andpursuant to applicable protection legislation prior to commencement. Further, an operating license under the State or Territoryrelevant environmental protection legislation in the state or territory may also be required for certain mine processing or mining-related operations.
It is possible for an individual or entity to own an area of land and for another individual or entity to be granted the right to explore for or mine any minerals located on or under the surface of the same area. Typically, the maximum initial term of a mining lease is 21 years and the holder has the right to renew the lease for an additional 21 years. Subsequent renewals are granted at the discretion of the respective Statestate or Territory’sterritory’s minister responsible for mining rights. In Western Australia, mining leases can only be assigned with the prior written consent of the minister.
Government royalties are payable by the holder of mining tenure in respect of minerals obtained from the relevant area of land, at the rates specified in the relevant legislation in each Statestate or Territory.territory. The royalty on gold production in Western Australia is payable quarterly at a fixed rate of 2.5 percent of the royalty value of gold metal produced and sold. The royalty value is calculated by multiplying the amount of gold produced during a given month by the average gold spot price for that month. In addition, the holder of mining tenure may be required to pay annual rent in respect of the tenure. In Western Australia there is a minimum annual expenditure requirement for prospecting and exploration licenses and mining leases. Exemptions from the expenditure requirement can be obtained if certain conditions are satisfied.
AngloGold Ashanti has been granted 21-year term mining leases with rights of renewal to all of its mining areas in Australia, including its proportionate share of joint venture operations and accordingly it has, together with its joint venture partners where applicable, the exclusive right to mine in those areas. Both the group and its joint venture partners are fully authorized to conduct operations in accordance with relevant laws and regulations. The mining leases and rights of renewal cover the current life-of-mine at AngloGold Ashanti’s operations in Australia.
AMERICAS
Argentina
Land ownership & mining rights
The ArgentineArgentinean Mining Code governs mining activity in the country. Special regimes exist for hydrocarbons and nuclear minerals. In the case of most minerals, the Argentinean Mining Code establishes that the owner of the land is not the owner of the mineral rights; these are held by the national or provincial governments (depending on the location of the minerals). The national or provincial government, as applicable, is required by the ArgentineArgentinean Mining Code to grant whomever discovers a new mine title to the mining concession.
The ArgentineArgentinean Mining Code regulates exploration permits and mining concessions. Exploration permits grant their holders exclusivity rights to any mineral discoveries, including those made by a third party within the exploration area covered by the permit. Exploration permits are limited in time and as to the extent of the exploration area, are subject to the payment of a single-time fee, and also require a minimum exploration work program and schedule to keep the permit in force.
The ArgentineArgentinean Mining Code also regulates mining concessions, or exploitation rights. Priority for receiving a mining concession is given to the registered discoverer of the mine, which holds the exploration permit. Once the application for a mine has been submitted, the applicant may commence works and must submit a legal survey of the units
requested for the new mine. The application and the legal survey may be opposed by third parties following specific proceedings set forth in the ArgentineArgentinean Mining Code. Approval and registration of the legal survey by the Provincial mining authority constitutes formal title to the mining concession.
Any mining company wishing to commence or modify any mining-related activity, as defined by the ArgentineArgentinean Mining Code, including prospecting, exploration, exploitation, development, preparation, extraction, and storage of mineral substances, as well as property abandonment or mine closure activity, is required to prepare and submit to the competent Provincial environmental authority an Environmental Impact Assessment (EIA) prior to commencing the work. Each EIA is required to describe the nature of the proposed work, its potential risk to the environment, and the measures that will be taken to mitigate that risk. If accepted by the competent authority, the EIA is used as the basis to create a Declaration of Environmental Impact (DEI) to which the mining company is required to adhere during the mining-related activity at issue. The DEI is required to be updated at least on a bi-annualbiannual basis. Sanctions and penalties for non-compliance with the DEI are outlined in the Environmental Protection section of the ArgentineArgentinean Mining Code, and may include warnings, fines, suspension of quality certifications, restoration of the environment, temporary or permanent closure of activities, and withdrawal of authorization to conduct mining-related activities.
Holders of mining concessions must comply with three main conditions: payment of an annual fee, investment of a minimum amount of capital, and the carrying out of a reasonable level of exploitation. Failure to do so could lead to forfeiture of the mining concession, which would then revert back to the Province.
In the case of Cerro Vanguardia, AngloGold Ashanti’s operation in Argentina, the mining concession holder is AngloGold Ashanti’s partner, Fomento Minero de Santa Cruz S.A. (“Fomicruz”)(Fomicruz). On December 27, 1996, Fomicruz entered into a usufruct agreement whereby Cerro Vanguardia S.A. was granted an irrevocable right to exploit the Cerro Vanguardia deposit for a 40-year period, which expires on December 27, 2036. Cerro Vanguardia S.A. is an ArgentineArgentinean company controlled by AngloGold Ashanti, with Fomicruz as minority shareholder.
In addition to the ArgentineArgentinean Mining Code, between 1993 and 1995, Argentina implemented several federal laws to offer foreign companies attractive incentives for exploration and mining in Argentina, the Mining Investment Law (Law No. 24, 196, as amended, and related legal provisions) being the most important one. Such incentives include, among others, import duty exemptions, accelerated depreciation of fixed assets, a 3 percent cap on Provincial royalties, value added tax refunds for exploration-related expenses incurred by companies registered under the Mining Investment Law, and, subject to the filing of a feasibility study for the relevant mining project, a 30-year stability as to tax, customs and foreign exchange duties. Cerro Vanguardia S.A. obtained its tax, customs and foreign exchange stability certificate in 1996.
Recent and potential regulatory changes
On September 30, 2010, the National Law on Minimum Requirements for the Protection of Glaciers was enacted in Argentina, banning new mining exploration and exploitation activities on glaciers and “peri-glacial” areas. The law also subjects the ongoing mining activities to an environmental audit. If such audit results in material impacts on glaciers and “peri-glacial” areas, the relevant authority is empowered to take action, including suspension or relocation of the activity. The law establishes a broad definition of “peri-glacial” areas that, together with glacial areas, must yet be surveyed by an existing national Government Agency specifically appointed to this end. The constitutionality of the law has been challenged by the Province of San Juan (which hosts large mining projects), resulting in the granting of injunctions that have suspended the application of the law in that Province. The National Supreme Court of Justice of Argentina presides over the case, which is in its early stages.
On October 26, 2011, Decree 1722/2011 (the “Repatriation Decree”)(Repatriation Decree) was issued, which imposes on oil, gas and mining companies operating in Argentina the obligation to repatriate all the proceeds of their exports from Argentina and to exchange such proceeds for ArgentineArgentinean legal currency in the domestic banking system. All exporters, other than oil, gas and mining companies, have been operating under such regime since late 2001. Mining companies, on the other hand, were entitled to two exceptions: (i) a decree of 2003 applicable to mining companies with tax, customs and foreign exchange stability certificates obtained prior to the date on which such a decree was enacted (which is the case of Cerro Vanguardia S.A.); and (ii) a decree of 2004 applicable to mining companies with tax, customs and foreign exchange stability certificates obtained after the date on which such decree was enacted. Both exceptions have not been formally superseded by the Repatriation Decree, but appear to conflict with it, and such conflict may result, in some cases, in a violation of mining companies’ rights under the Mining Investment Law.
On December 27, 2011, the ArgentineArgentinean National Congress passed Law 26,737 which implemented a set of rules restricting the ownership of rural land by foreigners (including foreign individuals or any kind of legal entity controlled by foreign individuals or legal entities). The main restrictions are as follows: (i) foreigners cannot own in the aggregate more than 15 percent of the entire rural land of Argentina, the same cap being applicable to each province and municipality; (ii) foreigners will not be allowed to purchase more than 1,000 hectares in the so-called “zona nùcleo”, which comprises the main agricultural areas of central Argentina or an “equivalent” surface depending on the location of the land and its productive potential; and (iii) foreigners will not be allowed to buy land that contains, or is adjacent to, relevant and permanent water bodies (such as rivers and lakes). Although exploration permits and mining concessions are not the subject matter of the restrictions placed by this law, certain rights granted to foreign mining companies under the ArgentineArgentinean Mining Code may be restricted by this new law. For example, the right that holders of mining concessions currently have to force the surface owner to sell the land to the holder of the mining concession might be restricted if the concession holder is a foreign individual or a legal entity controlled by foreigners.
Ten provinces in whose territories the main mining projects of Argentina are located, signed a document with the Federal Government entitled Federal Mining Agreement, or FMA.(FMA). The purpose of the FMA is, among other things, to increase provincial revenues from the mining industry by creating legal entities owned by provincial governments that would work in association with private mining companies. This scheme is not new in Argentina and it has been used by some provincial governments, among them Santa Cruz Province (through Fomicruz), in the Cerro Vanguardia project. The FMA also contemplates other forms of revenues such as the formation of special trusts to be funded by mining companies in order to finance education, health and other programs. Increase in royalty rates is not specifically contemplated in the FMA. The Provinces that signed the FMA had previously formed a special association of provinces, supported by the National Government.
In Argentina, the current regulatory regime of royalty payments is expected to change and several different options and payment thresholds have been discussed. However, no immediate change is anticipated.The Santa Cruz Province has changed the mining royalty from 1 percent to 3 percent.
Brazil
Land ownership and mining rights
General legal aspects
The Brazilian Constitution of 1934 states that, for purposes of exploration and exploitation, deposits and other mineral resources constitute property separate from the soil and belong to the Federal Union. Exploration and exploitation of such mineral resources may take place only with the Federal Union’s authorization or concession and in such a way as to protect the national interest. Federal law sets out penal and administrative sanctions for conduct and activities deemed to be harmful to the environment.
In Brazil, the National Department of Mineral Production (DNPM) is the Statestate body within the Mines and Energy Ministry (MME)(the “MME”) that is responsible for: (i) the registration of mining titles, (ii) the grant of authorizations and concessions, (iii) the supervision of mining activities and mining titleholders, and (iv) the issuance of supplementary rules in relation to mining activity.
Under the current Mining Code, there are two kinds of mines: (i) claimstake mines (“Minas Manifestadas”), for which rights were acquired before 1934 and exist independently of any mining license or authorization from the Federal Government and for which the mineral resources constitute property of the landowner and (ii) granted mines, which are those that rely on grants from the Federal Government for mineral exploration or exploitation (pursuant to the Constitution). All of AngloGold Ashanti’s operations in Brazil areconsist of both claimstake mines and granted mines.
Mining activities in granted mines must be performed in two defined stages: (i) exploration, which entails defining and evaluating the deposit and determining the feasibility of exploitation, and (ii) exploitation, which involves coordinating operations aimed at the industrial exploitation of the mineral deposit, from the extraction of useful minerals to their processing. Exploration authorizations issued by DNPM are valid for one to three years. Extensions can be obtained if necessary. In contrast, exploitation rights, once granted, are valid for the lifetime of the deposit, provided the mining titleholder complies with all legal requirements. Pursuant to these requirements, for example, titleholders must (i) start work on mineral exploitation within six (6) months from the date of publication of the Exploitation Concession, (ii) continue their mining activities until the mineral deposit has been exhausted, in accordance with the Economic Exploitation Plan (Plano de Aproveitamento Econômico) approved by DNPM and (iii) refrain from suspending mining activities without prior notice to DNPM.
During the exploration period, the mining titleholder has to pay an Annual Rate per Hectare (TAH(“TAH” – Taxa Anual por Hectare), subject to a maximum value set by law. In the exploitation period, regardless of the legal regime governing the project (whether claimstake or granted mines), the mining titleholder has to pay the Financial Compensation for Exploiting Mineral Resources (CFEM(“CFEM” – Compensação Financeira pela Exploração Mineral). The CFEM is currently calculated based on revenues, minus some deductions authorized by mining law.
At the end of 2011 and the beginning of 2012 the Statesstates of Minas Gerais, Pará, Amapá and AmapáMato Grosso do Sul each created a new tax (duty) on research, extraction and exploration activities as well as on the use of mineral resources carried out in those States.states. This tax could range from BRL3.00 to BRL6.50 per ton. In the Statestate of Minas Gerais, however, gold ore was exempted from the collection of this new duty.
Potential regulatory changes
The Federal Government is contemplating changes to the mining legislation. Its goals would be to (i) strengthen the role of the Federal Government in regulating the mining industry, (ii) attract more and better investments to the mineral sector, (iii) encourage maximal use of mineral reserves and (iv) encourage members of the industry to add value to mineral products.
The government’s proposals have institutional, legal and financial facets. Institutionally, the proposals would create a National Council of Mineral Policy to advise the Presidency of Brazil and the MME on, and develop guidelines and directives for, the mining sector. They would also transform the DNPM into a regulatory agency with negotiation and inspection powers.
On the legal front,Legally, the proposals would change the rules governing access to mining titles. While exploration authorizations would be effective for a longer period of five (5) years, they would be renewable for only one extra year, at the discretion of authorities.
Companies would also have to demonstrate that they are investing in exploration activities on a yearly basis. Exploitation rights would be limited to 35- or 40-year grants renewable at the discretion of authorities. The granting of rights would become a more discretionary process and would result in a Formal Adhesion Contract for Exploitation rather than in an open-ended concession.
On the financial front, theThe proposals would raise CFEM rates for trade in gold ore from 1 percent on net invoicing to 2 percent on gross invoicing. They would also create new calculation methods and incidence hypotheses, notably with regard to transactions between related parties.
The MME has suspended the granting of new mining concessions until it promulgates changes to the mining legislation.
Colombia
Land ownership and mining rights
In Colombia, all mineral substances are the property of the Statestate of Colombia. The underlying principle of Colombian mining legislation is first-in-time, first-in-right.
Mining activities are regulated by the Mining Code, Act 685, 2001. Amendments to the Mining Code enacted in 2010 pursuant to Act 1382 were found unconstitutional. The Constitutional Court stayed its ruling for two years to give the government the opportunity to present a new law. The government iswas expected to make its new changes to the Mining Code public in the second half of 2012.2012, but has not yet presented any project of law yet to Congress.
The filing of an exploration and exploitation proposal triggers a right of preference to obtain rights over the targeted area, provided it is available. Such area cannot exceed 10,000 hectares. Upon receipt of a proposal, the relevant government agency determines whether another proposal or contract already governs the area. If there are no pre-existing claims, the government agency grants the applicant a “free zone”.
The concession contract
The government agency grants exclusive concession contracts for exploration and exploitation. Such concessions allow concessionaires to conduct the studies, works and installations necessary to establish the existence of minerals and to organize their exploitation. Upon being awarded a mining concession, a company must take out an insurance policy to cover any possible environmental damage as well as breaches of its mining obligations. It may then proceed with exploration activities. Once the exploration phase is complete, the concessionaire files a new plan regarding works and installations. An environmental impact study must also be filed and approved in order for the concessionaire to receive an environmental license prior to beginning construction and development.
The initial term of concessions is 30 years. To receive an extension, a concessionaire must file a request two years before the termination of the initial term, and must substantiate the application with economic, environmental and technical information. Because the extension is not automatic, the concessionaire must renegotiate the conditions of the grant. The term of a concession and all the contractual obligations that arise from it are deemed to take effect as of the date of registration of the contract at the National Mining Register.
AngloGold Ashanti’s core mining concession contracts at the La Colosa project provide that Ingeominas,Agencia Nacional Minera (ANM), the new Colombian regulatory agency for mining activities, has the discretion to declare the underlying concession void if AngloGold Ashanti Colombia S.A. (AGAC) breaches applicable environmental laws or regulations. If IngeominasANM were to exercise such discretion against AGAC, AGAC would be required to abandon the La Colosa project and all of its other existing mining concession contracts. Pending proposals for new mining concession contracts would also be canceledcancelled and AGAC would be banned from doing business with the Colombian government for a period of five years. As a result, AGAC would be unable to conduct any mining exploration or development activities during such period. However, this would not affect other AngloGold Ashanti subsidiaries operating in Colombia, which hold singularly or in concert with joint venture partners the majority of the company’s concession contracts in Colombia.
There are some areas where mining activity is prohibited. These areas are:
National parks;
Regional parks;
Protected forest reserves;
Paramus (included in Act 1382, introduced in 2010); and
Wetlands, pursuant to the Ramsar Convention.
Some forest reserves are not ‘protected’“protected”, but are set aside for active forestry purposes. Such forest reserves must be ‘extracted’“extracted” after initial prospection, meaning that the concessionaire must obtain a specific permit to partially and temporarily change the use of the soil before pursuing exploration activities.
Cannon fees and royalties
Cannon fees are due from the moment the area is declared available for the company (rather than from the time the concession contract is signed). Such fees change based on the number of years that the company has been a concessionaire, as follows:
From 1 to 5 years: approximately $9.00 per hectare per year.
For years 6 and after, approximately $11.00 per hectare per year.
Once exploration is complete and the mining infrastructure is in place, the concessionaire must begin paying royalties. Royalties paid to the Colombian government consist of a percentage of the primary product and sub-products being exploited. For gold, the percentage to be paid is 4 percent.
Potential regulatory changes
In 2012,2013, the government is expected to modify the process for obtaining a mining concession. Instead of using a first-in-time, first-in-right approach in all cases, the government plans on subjecting some areas to a bidding process open to any qualified entity.
United States of America
Land ownership & mining rights
Mineral and surface rights in the United States are owned by private parties, state governments or the federal government. Although not the case at Cripple Creek & Victor Gold Mining Company’s (CC&V) Cresson Project, the majority of land utilized for precious metals exploration, development and mining in the western United States is owned by the federal government. The right to mine on such land is governed by the General Mining Law of 1872, as amended (General Mining Law). The General Mining Law allows mining claims on certain federal lands upon the discovery of a valuable mineral deposit and proper compliance with claim location and maintenance requirements. Until 1993, unpatented mining claim holders could apply for patents to their claims from the federal government, and, if granted, those patented mining claims became private lands owned by the mining claimant, limited only by reservations and restrictions contained in the patent from the federal government, and subject to the same permitting, environmental and reclamation laws and regulations as other private lands.
Individual states, including Colorado, typically follow a leasing system for state-owned minerals. Private parties have the right to sell, lease or enter into other agreements, such as joint ventures, with respect to minerals that they own or control. CC&V’s Cresson Project covers approximately 7,100 acres, the vast majority of which consists of owned, patented mining claims from former public lands, with a small percentage of private and state lands, some of which are critical to the Cresson Project, being leased. All of the Cresson Project’s current reserves are within the patented claims.
State permittingPermitting and reclamation
In addition to the permits required in connection with the laws and regulations described above, CC&V’s Cresson Project is subject to a number of state and local permitting requirements, including permitting requirements imposed by the Colorado Mined Land Reclamation Act (MLRA) and Teller County. Under the MLRA, the Colorado Mined Land Reclamation Board (MLRB) issues and enforces mining and reclamation permits for all non-coal mines in Colorado on state, federal or private lands. In carrying out the statutory requirements of the MLRA, the MLRB (i) reviews mine permit applications and amendments and related matters, (ii) inspects active mine sites and prospecting sites and (iii) ensures financial warranties are posted for the actual cost of reclamation.
CC&V’s Cresson Project is currently operating under a permit generally referred to as mine life extension one (MLE1) issued by the MLRB and Teller County. Among other things, MLE1 permits CC&V to continue active mining at the Cresson Project through 2016 and imposes reclamation and other requirements on CC&V, including requiring (i) the stabilization and re-vegetation of disturbed lands, (ii) the control of storm water and drainage from portals and waste rock dumps,overburden storage areas, (iii) the removal of roads and structures, (iv) the treatment and the elimination of process solutions, (v) the treatment of mine water prior to discharge into the environment and (vi) visual mitigation. In September 2012, CC&V’s permit application for mine life extension two (MLE2) was approved by both the MRLB and Teller County.
Potential regulatory changes
In recentOver the years, the U.S. Congress has considered a number of proposed amendments to the General Mining Law. Among the significant features contained in previously proposed legislation were a production royalty obligation, new and more stringent environmental standards and conditions, additional reclamation requirements, extensive new procedural steps which would likely result in delays in permitting, and granting counties the ability to petition the Secretary of the Interior to make certain areas unavailable for the location of unpatented mining claims. The ultimate content of future proposed legislation, if enacted, is uncertain. If any of the above-referenced provisions were imposed, CC&V’s operations could be adversely affected. Although no such legislation has been adopted to date, there can be no assurance that such legislation will not be adopted in the future.
MINE SITE REHABILITATION AND CLOSURE
Closure, an integral part of operations
All mining operations eventually cease. An integral aspect of operating our mines is the on-going planning for closure, planning, together with estimatesan estimate of associated liability costs and the assuranceplacement of adequate financial provisions and assurances to cover these costs.
AAngloGold Ashanti completed a group closure and rehabilitation management standard was completed in 2009 and all of our operations were required to comply with the standard by December 2011. The Continental Africa operations have beenwere granted an extension to December 2012.
Closure planning is an activity that starts at the exploration and mine design stage and continues throughout the life of mine:
The evaluation of new projects includes a conceptual closure plan, which takes into account future closure and associated costs in a conceptual closure plan.costs.
Our standard requires that an interim closure plan be prepared within three years of commissioning an operation, or earlier if required by legislation.
This plan is reviewed and updated every three years (annually in the final three years of a mine’s life) or whenever significant changes are made, and takes into account operational conditions, planning and legislative requirements, international protocols, technological developments and advances in practice.
For many of the older mines, closure planning and the evaluation of environmental liabilities is a complex process. This is particularly so in Brazil, Ghana and South Africa, where many of the long-life operations present environmental legacies that may have developed over a century or more.
A particular challenge is concurrent rehabilitation, which is carried out while a mine is still operational. This practice serves to decrease the current liability and reduces the final rehabilitation and closure work that must be undertaken, but has the potential to sterilize mineral reserves, which the company might wish to exploit should conditions, such as the gold price, change.
Our closure standard stipulates that closure planning must be undertaken in consultation with the community. In the course of these consultations, different issues are raised which require site-specific solutions. Livelihood preservation and infrastructure are often key requirements. Local people, who were previously employed at the mine, may receive education and training so as to seek viable employment alternatives. Communities also require information on the Company’s rehabilitation of the landscape and on any lasting environmental impacts.
OurIn addition, long-term remediation obligations includeincluding decommissioning and restoration liabilities relating to past operations and are based on our environmental management plans and comply with current environmental and regulatory requirements.
Provisions for remediation costs are made when there is a present obligation, it is probable that expenditure on remediation work will be required and the cost can be estimated within a reasonable range of possible outcomes. These costs are based on facts currently available facts, technology expected to be available at the time of the clean-up, laws and regulations presently or virtually certain to be enacted, and previous experience in the remediation of contaminated sites.
Provision forDecommissioning costs and restoration and decommissioning costs are madeprovided at the present value of the expenditures expected to settle the obligation, using estimated cash flows based on current prices andprices. Estimates are discounted at a pre-tax rate that reflects current market assessments of the time value of money. An assessment of closure liabilities is undertaken annually.
Discounted closure liabilities (excluding joint ventures) increased from $530 million in 2010 to $653 million in 2011.2011 to $758 million in 2012. This change is largely attributable to a change in mine plans resulting in accelerated cash flows, change in economic assumptions and discount rates, change in design of tailings storage facilities and change in methodology following requests from the Ghana Environmental Protection Agency.rates.
ENVIRONMENTAL, HEALTH AND SAFETY MATTERS
In addition to post-mining land reclamation and closure requirements, AngloGold Ashanti is subject to extensive environmental, health and safety (EHS) laws and regulations in the various jurisdictions in which the company operates. These requirements govern, among other things, extraction, use, conservation and discharge of water; air emissions (including dust control); regulatory and community reporting; clean-up of contamination; worker health and safety and community health; and the generation, transportation, storage and disposal of solid and hazardous wastes, such as acids, radioactive materials, and mine tailings. In addition, environmental laws and regulations, including the requirements contained in environmental permits, are generally becoming more restrictive or more strictly enforced. Significant EHS requirements, risks and trends affecting our mining and processing operations are described below. For additional discussion of EHS performance on a mine-by-mine basis, see “Item 4B.: Business overview – Operating performance.”
Regulatory Compliance
Capital and operating costs to comply with EHS laws and regulations have been, and are expected to continue to be, significant to AngloGold Ashanti. In addition, AngloGold Ashanti could incur fines, penalties and other sanctions, environmental clean-up costs, and third-party claims for personal injury or property or natural resources damages; suffer reputational damages; and be required to install costly pollution control equipment or to modify or suspend operations, as a result of actual or alleged violations or liabilities under EHS laws and regulations. Failure to comply with applicable EHS laws and regulations may also result in the suspension or revocation of permits. AngloGold Ashanti’s ability to obtain and maintain permits and to successfully operate in particular communities may be adversely impacted by real or perceived effects on the environment or human health and safety associated with AngloGold Ashanti’s or other mining companies’ activities.
AngloGold Ashanti is involved in two EHS-related legal proceedings in Colombia. See “Item 8A.: Financial information – Legal proceedings” for details.
Water Management
AngloGold Ashanti’s mining and processing operations are heavily dependent upon access to substantial volumes of water required for such operations. Typically, water-use permits or water rights in each country impose limits on the quantity of water that can be extracted from certain sources and require, among other things, that wastewater from mining operations meet certain water quality criteria upon discharge. Water quality and usage are areas of concern globally, but are particularly significant for operations in Ghana and South Africa, and for exploration projects in Colombia, where there is significant potential environmental and social impact and a high level of stakeholder scrutiny. Any failure to secure access to suitable water supplies, or achieve and maintain compliance with the requirements of the permits or licenses, could result in curtailment or suspension of production at the affected operation. Incidents of water pollution or shortage can, in extreme cases, lead to community protest and ultimately result in the withdrawal of community and government support for our operations.
Where feasible, we operate a “closed loop” system recyclingwhich recycles the water used in our operations without discharging it to the environment. In some areas, however, such as Ghana, high levels of rainfall and surface water runoff mean that a closed loop system is not feasible and that discharges, after water treatment, must take place. During 2011, we commissioned a reverse osmosis plant in the northern section of the Obuasi mine which functions in conjunction with complementary water treatment technologies to ensure that water released is compliant with Ghana’s water quality standards. At the southern section of the mine, additional equipmenta 250m3/hour water treatment plant was commissioned in 2011 to increase the volume of water that can be recycled into the production process.early 2012 and another 500 m3/hour plant is under construction. At the Iduapriem mine, a water treatment plant extension was commissioned in 2010 to ensure that the operation can release excess water while meeting effluent discharge standards.
Waste Management
Mining and mineral processing operations generate waste rock and tailings.
During open-pit mining, large volumes of soil and/or rock (overburden) are generated to expose the orebody.ore body. Similarly, waste rock is generated during drilling and developing access to underground ore bodies. Overburden and waste rock typically contain sub-economic levels of gold and are deposited as large waste rock dumps. Mine tailings are the process effluentswaste generated once grinding and extraction of gold from the ore is completed in the milling process and are deposited as slurry in large storage facilities specifically designed for this purpose.
The impact of a breach, leak or other failure of a tailings storage facility can be significant, and the company therefore monitors such facilities closely to ensure that their management is in accordance with national regulatory requirements and commitments made to local communities. The occasional well-publicized failure of a tailings facility and the potential impact of such failure also mean that these facilities are generally tightly regulated. An incident at our operations could result, among other things, in enforcement, obligations to remediate environmental contamination, and claims for property damageor natural resources damages and personal injury.injury and negative press coverage. Even an incident at another company’s operations has potential to result in governments tightening regulatory requirements and restricting miningother mine operators in response.
Groundwater Impacts and Environmental Remediation
AngloGold Ashanti has identified groundwater contamination plumes at certain of its operations. Numerous scientific, technical and legal studies have been undertaken to assist in determining the magnitude of the impact and to find sustainable remediation solutions. Based on those studies as well as discussion with regulators, the company has taken steps, including monitored natural attenuation and phyto-technologies, to reduce seepage and to address soil and groundwater
contamination. Subject to the completion of trials and the technology being a proven remediation technique, no reliable estimate can be made for the obligation. Should these costs be significant, this could have a material adverse impact upon AngloGold Ashanti’s results of operations and its financial condition.
In addition, asAs AngloGold Ashanti or its predecessors has a long history of mining operations in certain regions, issues may arise regarding historical as well as potential future environmental impacts to those areas. For example, certain parties, including NGOs, community groups and institutional investors, have raised concerns about surface and groundwater quality, among other issues, in the area surrounding the company’s Obuasi and Iduapriem mines in Ghana, including potential impacts to local rivers and wells used for water from heavy metals, arsenic and cyanide as well as sediment and mine rock waste. Following temporary shutdowns at both mines in 2010, the company has made improvements in effluent quality management and constructed a new tailings impoundmentsimpoundment at Iduapriem as well as three additional water treatment plants at Obuasi to reduce the risk of incidents that have the potential to degrade local water sources. AngloGold Ashanti is continuing to investigate allegations of impacts by the company’s operations on water quality in mining areas and to consider, as appropriate, potential additional responsive actions, such as remediation, engineering and operational changes at the mine sites and community outreach programs.
In addition, AngloGold Ashanti has identified a flooding and future pollution risk to deep groundwater in the Klerksdorp and Far West Rand goldfields in South Africa. AngloGold Ashanti’s Vaal River operations are part of the Klerksdorp goldfieldgoldfields and its West Wits operations are part of the Far West Rand goldfield.goldfields. Various studies have been undertaken by AngloGold Ashanti since 1999 to better understand groundwater conditions in mined-out workings, including potential groundwater infiltration and acidification concerns. Due to the interconnected nature of underground mining operations in South Africa, any proposed solution needs to be a combined one supported by all the companies owning mines located in these goldfields. As a result, the South African Department of Mineral Resources and affected mining companies are now involved in the development of a “Regional Mine Closure Strategy”. In view of the limitation of currentlimited information for the accurate estimation of a liability,currently available, no reliable estimate can be made for the obligation.obligation at this time. If material, obligations for this matter could have an adverse impact on AngloGold Ashanti’s financial condition.
Climate Change and Greenhouse Gas Regulation
Greenhouse gases, or GHGs,“GHGs”, are emitted directly by AngloGold Ashanti’s operations, as well as by external utilities from which AngloGold Ashanti purchases power. Currently, a number of international and national measures to address or limit GHG emissions, including the Kyoto Protocol, the Copenhagen Accord and the Durban Platform, are in various phases of discussion or implementation in the countries in which the company operates. In particular,
The outcome of the Durban Platform extendsclimate change negotiations may, in due time, have the Kyoto Protocol for up to eight years and commits all parties to the UN climate convention to develop a global mitigation regime which could take effect in 2020, with the specific terms of that legally binding accord, including individual targets, to be finalized by 2015. These, or future, measures could requirerequiring AngloGold Ashanti to reduce its direct GHG emissions or energy use or to incur significant costs for GHG emissions permits or taxes or have theseincluding through costs or taxes passed on by electricity utilities which supply the company. AngloGold Ashanti also could incur significant costs associated with capital equipment, GHG monitoring and reporting and other obligations to comply with applicable requirements. The most likely source of these company-level obligations is unlikely to be by operation of international law but more likely to come through domestic implementation of state obligations pursuant to evolving climate change legal regimes.
For example, the Australian government approved legislation that will implementimplemented a carbon trading scheme commencing in July 2012. Under the applicable requirements, approximately five hundred500 of Australia’s biggest emitters, including AngloGold Ashanti, willstarted to pay A$23 per tonne of carbon dioxide generated or equivalent from July 2012. The charge will increase by 2.5approximately 5 percent each year until 2015, when it will be set by the market under a trading scheme, similar to the existing Emissions Trading Scheme in the European Union.
InAlso, in 2011, the South African government released a climate change response white paper. In February 2012,2013, the South African Minister of Finance announced his intention to introduce a carbon tax in 2013, with a draft discussion paper setting out proposed details to be published in 2012.2015. AngloGold Ashanti already pays a levy of ZAR0.025ZAR0.035 per kilowatt hour of electricity that it purchases and that is generated from fossil fuels.
The Minister2013 Budget Review provides an indication of Financethe expected levels of the carbon tax rate as being ZAR 120 (approximately US$13) per tonne of CO2e emitted above certain thresholds. Under the proposal, the tax rate would increase by 10 percent a year, reaching ZAR 193 (approximately US$21) per tonne by 2020. The end of the decade also announcedmarks the end of the first phase of the carbon tax. Depending on the nature of the emitter, a basic tax-free threshold of up to 60 percent of the tax liability will apply.
It is probable that thisthe tax will be levied on sectors that comprise elements of the AngloGold Ashanti supply chain. Consequently, it is likely that the costs associated with those elements of the supply chain will increase to ZAR0.035 per kilowatt hour.for the medium- and long-term.
In 2010, Brazil launched sector-specific plans to meet a voluntary reduction target of 1.2 billion tonnes of CO2by 2020. Amongst other plans, it is intended to reduce de-forestation in the Cerrado biome, where AngloGold Ashanti operates, by 40 percent and expand renewable energy production and energy efficiency programs. The decree also provided for a Brazilian GHG trading scheme, which is yet to be designed. While Brazil is not yet formally regulating GHG emissions at the national level, some state environmental agencies have requested companies to voluntarily submit GHG emissions management plans.
In addition, potential physical risks to our operations as a result of climate change include changes in rainfall rates or reduced water availability, rising sea levels, higher temperatures and extreme weather events. Events or conditions such as flooding or inadequate water supplies could disrupt mining and transport operations, mineral processing and rehabilitation efforts, could create resource shortages and could damage the company’s property or equipment and increase health and safety risks on site. Such events or conditions could have other adverse effects on the company’s workforce and on the communities in the area around our mines, such as an increased risk of food insecurity, water scarcity and prevalence of disease.
Occupational and Community Safety and Health and Tropical Diseases
AngloGold Ashanti’s operations are subject to a variety of laws and regulations designed to protect and improve the safety and health of employees. In some of the jurisdictions in which we operate, the government enforces compulsory shutdowns of operations to enable investigations into the cause of accidents at those operations. Certain of the company’s operations have been temporarily suspended for safety reasons in the past. In South Africa, in particular, so-called Section 54 safety stoppages have become a significant issue.issue for mining companies. In 2011, the State Inspector of Mines ordered the shutdown of entire mines in cases of relatively minor violations, which2012, stoppages occurred as follows:
• Moab Khotsong | 9 | |
• Savuka | 3 | |
• Great Noligwa | 9 | |
• Mponeng | 6 | |
• TauTona | 2 |
This had a material impact on production at these mines. In particular, the Inspector issued Kopanang 11 Section 54 directives during the year. Each directive resulted in Kopanang suspending operations either fully or partially in order to comply with the inspector’s recommendations on safety. A working group comprising the inspectorate, the mining industry and organized labor has been formed to address the trend of increasing safety stoppages. AngloGold Ashanti is also enhancing safety programs, in line with the process of implementing an enhanced safety program, including improved incident investigationoverall ONE initiative and reporting systems,industry Best Practice, which could result in significant additional costs for the company.
In addition, AngloGold Ashanti is subject to health and safety regulations relating to occupational disease. The primary areas of focus in respect of occupational health of employees within the company’s operations are noise-induced hearing loss (NIHL)(“NIHL”) and occupational lung diseases (OLD)(“OLD”), which include pulmonary tuberculosis (TB)(“TB”) from various causes and silicosis in individuals exposed to silica dust. This issue has been particularly prevalent in South Africa and has also arisen at the company’s Continental Africa and Brazilian operations, albeit to a lesser extent. AngloGold Ashanti provides occupational health services to its employees at its occupational health centers and clinics, and continues to improve preventative occupational hygiene initiatives, such as implementing various dust control measures and supplying its employees with respiratory protectionprotective equipment. If the costs associated with providing such occupational health services, implementing such dust control measures or supplying such equipment increase significantly beyond anticipated or budgeted amounts, this could have an adverse effect on theAngloGold Ashanti’s results of operations of AngloGold Ashanti and its financial condition. Actual and alleged health and safety incidents or breaches of standards may also adversely impact the company’s reputation.
The South African government, by way of a cabinet resolution in 1999, proposed a possible combination and alignment of benefits of the Occupational Diseases in Mines and Works Act (ODMWA)(“ODMWA”) that provides for compensation to miners who have OLD, and the Compensation for Occupational Injuries and Diseases Act (COIDA)(“COIDA”), that provides for compensation in respect of job related injuries and compensation of non-miners who have OLD. It appears less likely that the proposed combination of the two acts will occur in the short to medium term, but some alignment of benefits may be considered in the future. COIDA provides for compensation payments to workers suffering permanent
disabilities from OLD, which are classified as pension liabilities if the permanent disability is above a certain threshold, or a lump sum compensation payment if the permanent disability is below a certain threshold. ODMWA only provides for a lump sum compensation payment to workers suffering from OLD as well as the payment of medical expenses over the claimant’s lifetime. If the proposed combination of COIDA and ODMWA were to occur, this could further increase the amount of statutory compensation that miners employed by AngloGold Ashanti could claim, which consequently could have an adverse effect on AngloGold Ashanti’s financial condition.
On November 23, 2010, the Chamber of Mines of South Africa applied to the North Gauteng High Court for a declaratory order as to whether or not the Compensation Commissioner may include in the levy to be paid by any specific mine under ODMWA any amount that is intended to be used for funding benefits payable to: (1) ex-mine workers who had never worked at that mine; or (2) ex-mine workers who used to work at the mine, but no longer work at the mine. On April 29, 2011, the Honorable Judge Zondo dismissed the Chamber’s application with costs. The judge concluded that the Compensation Commissioner has authority under ODMWA to address an historical or actuarial deficit in the Compensation Fund by increasing the levy payable by current mines and works to cover the shortfall in respect of all ex-mine workers. The Chamber is considering whether to appeal the judgment. Should the Chamber’s appeal be unsuccessful this could further increase the levy payable by AngloGold Ashanti to the ODMWA fund, which could have material adverse effect on its business, financial condition or results of operations.
In October 2006, Mr. Thembekile Mankayi instituted legal action against AngloGold Ashanti in the South Gauteng High Court, claiming approximately R2.6 million for damages allegedly suffered by him as a result of silicosis allegedly contracted while working on a mine of Vaal Reefs Mining and Exploration Company Limited (Vaal Reefs). Vaal Reefs was renamed AngloGold Limited in 1998 and AngloGold Ashanti Limited in 2004. On June 26, 2008, judgment was rendered in the company’s favor on the basis that mine employers are indemnified under ODMWA and COIDA against claims by employees against employers for damages relating to compensable diseases. Mr. Mankayi’slodged an appeal to the Supreme Court of AppealAppeal. The appeal was dismissed with costs. The effect of South Africa was dismissed. On August 17, 2010, the Constitutional Courtjudgment is that ODMWA levies may be increased in respect of South Africa heard Mr. Mankayi’s application for leavethe category of former employees referred to appeal to the Constitutional Court. The Constitutional Court rendered its decision on March 3, 2011, granting the application for leave to appeal and then addressing the matter as a full appeal. The Constitutional Court rejected the lower court’s decision that Mr. Mankayi’s claim was precluded by statutory compensation, and granted leave to Mr. Mankayi’s executor, as the plaintiff was deceased prior to this judgment in the Constitutional Court, to proceed with his case in the High Court and seek a claim for damages under common law against AngloGold Ashanti. This will comprise, amongst other elements, providing evidence that Mr. Mankayi contracted silicosis as a result of negligent conduct on the part of above.
AngloGold Ashanti is subject to numerous claims, including class actions or its predecessor. AngloGold Ashanti will continuesimilar group claims related to defend this case on its merits.
As a result of the Constitutional Court decision permitting miners withsilicosis and other OLD, to sue their current or former employers for damages outside the statutory compensation scheme, AngloGold Ashantiand could be subject to numerous similar claims, including a potential class action or similar group claim. AngloGold Ashanti is studying the details of the Constitutional Court judgment and will defend any subsequent claims, if and when filed, on their merits. In view of the limited information currently available, no reliable estimate can be made for this potential liability at this time. Should AngloGold Ashanti be unsuccessful in defending actions by any other individuals or groups that lodge similar claims in the future, such claims would have an adverse impact on AngloGold Ashanti’s financial condition which could potentially be material.
In light of the Constitutional Court judgment,future. AngloGold Ashanti has received notice of two applications for class certification relating to silicosis in which the company is calling for the industrya respondent. It has also received notice of individual claims. Please refer to engage with government (and other stakeholders) to seek an appropriate industry-wide solution. AngloGold Ashanti can provide no assurances that an industry-wide solution can be reached or that the terms thereof will not have a material adverse effect on AngloGold Ashanti’s financial condition.“Item 8: Financial Information – Legal Proceedings – South Africa – Silicosis litigation.”
In addition to OLD, AIDS and associated diseases remain major health care challenges faced by AngloGold Ashanti’s South African operations. Workforce prevalence studies indicate that HIV prevalence rates among AngloGold Ashanti’s South African workforce may be as high as thirty30 percent. AngloGold Ashanti continues to develop and implement programs to help those infected with HIV and prevent new infections from spreading. Since 2001, the company has offered a voluntary counseling and HIV testing program for employees in South Africa and, since 2003, has offered anti-retroviral therapy or ART, to HIV positive employees who met the current medical criteria and who desire this treatment.
Malaria and other tropical diseases also pose significant health risks at all of the company’s operations in Central, West and East Africa where such diseases may assume epidemic proportions because of ineffective national control programs. Malaria is a major cause of death in young children and pregnant women but also gives rise to fatalities and absenteeism in adult men. Other conditions such as heart disease, chronic diseases and obesity are of increasing incidence and concern.
Such diseases impair the health of workers and negatively affect productivity and profitability as a result of workers’ diminished focus or skill, absenteeism, treatment costs and allocated resources. AngloGold Ashanti cannot guarantee that any current or future medical program will be successful in preventing or reducing the injury and illness rates amongst its employees or in affecting consequent morbidity or mortality rates. AngloGold Ashanti may incur significant costs in addressing this issue in the future, which could also adversely impact the company’s results of operations and financial condition.
ANGLOGOLD ASHANTI GLOBAL OPERATIONS: 20112012
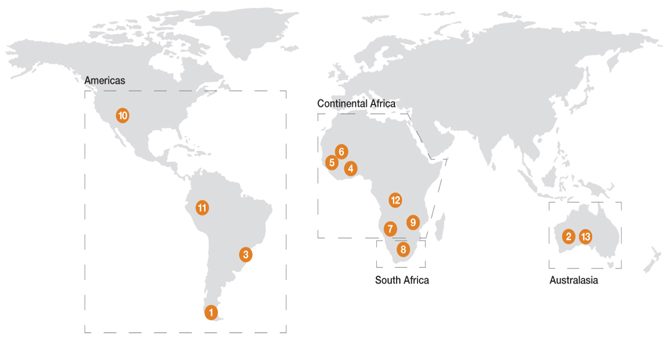
Operations
| 1. | Argentina | 5. | Guinea | 8. | South Africa | 9. | Tanzania | |||||||
| Cerro Vanguardia (92.5%) | Siguiri (85%) | Vaal River | Geita | |||||||||||
| 2. | Australia | 6. | Mali | Great Noligwa | 10. | United States | ||||||||
| Sunrise Dam | Morila (40%) | Kopanang | Cripple Creek & Victor (CC&V) | |||||||||||
| 3. | Brazil | Sadiola (41%) | Moab Khotsong | |||||||||||
| Serra Grande(1) | Yatela (40%) | Surface operations | ||||||||||||
| AGA Mineração | 7. | Namibia | Mine Waste Solutions | |||||||||||
| 4. | Ghana | Navachab | West Wits | |||||||||||
| Iduapriem | Mponeng | |||||||||||||
| Obuasi | Savuka | |||||||||||||
| TauTona | ||||||||||||||
(1) Effective July 1, 2012, AngloGold Ashanti increased its shareholding in Serra Grande from 50 percent to 100 percent. | ||||||||||||||
Major Projects | ||||||||||||||
11. | Colombia | 12. | DRC | 13. | Australia | |||||||||
| Gramalote (51%) | Kibali (45%) | Tropicana (70%) | ||||||||||||
| La Colosa | Mongbwalu (86.2%) | |||||||||||||
Percentages indicate the ownership interest of AngloGold Ashanti, whether held directly or indirectly. All operations and projects are 100%-owned unless otherwise indicated.
OPERATING PERFORMANCE
Group description
Headquartered in Johannesburg, South Africa, AngloGold Ashanti’sAshanti has 21 operations in 10 countries. Major development projects are divided intoTropicana in Australia, Kibali in the Democratic Republic of the Congo (DRC) and La Colosa in Colombia. Our extensive brownfield, greenfield and marine exploration programs extend to 14 countries, in both established and new gold-producing regions through managed and non- managed joint ventures, strategic alliances and wholly owned ground holdings. We have an equity interest in Rand Refinery, a gold refining and smelting complex in South Africa, and own and operate the Queiroz refinery in Brazil.
The group is managed according to four regions:geographic regions, namely:
South Africa, which comprises two mining areas and associated infrastructure – operations innamely West Wits and Vaal River, which together comprise six deep-level mining operations and West Wits;surface operations. In July 2012, AngloGold Ashanti concluded the acquisition of First Uranium (Pty) Limited, the owner of Mine Waste Solutions (MWS), which operates in the same area of South Africa.
Continental Africa, –which comprises the operations in Ghana, Guinea, Mali, Namibia and Tanzania;
Australasia – operationTanzania, as well as projects in Australia; andthe DRC.
Americas, –comprising operations in Argentina, Brazil and the United States.States, as well as projects in Colombia. AngloGold Ashanti concluded the acquisition of the remaining 50 percent interest in Serra Grande in Brazil during the year.
Australasia, which currently focuses on a mine and project in Australia.
The above four regionsgroup also correspond to has a pipeline of greenfield, brownfield and marine exploration programs.
AngloGold Ashanti’s four business segments.operations and joint ventures employed, on average, 65,822 people (including contractors) in 2012 (2011: 61,242).
Performance
In 2011,2012, AngloGold Ashanti produced 4.333.94 million ounces of gold (2010: 4.52(2011: 4.33 million ounces) as well as 1.381.21 million pounds of uranium, 2.962.36 million ounces of silver and 206.54186.37 tonnes of sulfuric acid as by-products. In all, 61,242 people, including contractors, were employed.
Given the focus on optimizing operational performance and maintaining costs, AngloGold Ashanti continued to investinvested significantly in capital expenditure.expenditure as the group is building and developing new projects in Continental Africa (Kibali and Mongwbalu in the DRC), Australia (Tropicana), Americas (Cripple Creek & Victor expansion in the US and other projects in Brazil) and South Africa (most notably Mponeng). Capital expenditure, including equity accounted joint ventures, in 20112012 amounted to $1,527$2,154 million (2010: $1,015(2011: $1,527 million).
Safety
Regrettably, there were 1518 fatalities across the group’s operations in 2011.2012. The all injury frequency rate improved to 9.767.72 per million hours worked compared to 9.76 in 2011 and 11.50 in 2010 and 12.88 in 2009.2010.
OPERATIONS AT A GLANCEfor the years ended December 31
| Attributable tonnes treated/milled (Mt) | Average grade recovered (g/t) | Attributable gold Production (000oz) | Total cash costs ($/oz) | Attributable Capital Expenditure ($m) | ||||||||||||||||||||||||||||||||||||||||||||||||||||||||
| 2011 | 2010 | 2009 | 2011 | 2010 | 2009 | 2011 | 2010 | 2009 | 2011 | 2010 | 2009 | 2011 | 2010 | 2009 | ||||||||||||||||||||||||||||||||||||||||||||||
SOUTH AFRICA | ||||||||||||||||||||||||||||||||||||||||||||||||||||||||||||
Vaal River | ||||||||||||||||||||||||||||||||||||||||||||||||||||||||||||
Great Noligwa | 0.5 | 0.7 | 0.9 | 5.58 | 5.99 | 5.73 | 94 | 132 | 158 | 1,191 | 894 | 791 | 29 | 24 | 24 | |||||||||||||||||||||||||||||||||||||||||||||
Kopanang | 1.5 | 1.6 | 1.6 | 6.47 | 6.13 | 6.74 | 307 | 305 | 336 | 684 | 613 | 408 | 92 | 61 | 58 | |||||||||||||||||||||||||||||||||||||||||||||
Moab Khotsong | 0.9 | 1.0 | 0.8 | 9.39 | 9.03 | 9.36 | 266 | 292 | 247 | 688 | 586 | 421 | 147 | 120 | 104 | |||||||||||||||||||||||||||||||||||||||||||||
Tau Lekoa(1) | - | 0.6 | 1.2 | - | 3.32 | 3.32 | - | 63 | 124 | - | 905 | 718 | - | 10 | 17 | |||||||||||||||||||||||||||||||||||||||||||||
Surface operations | 10.7 | 10.2 | 9.7 | 0.48 | 0.54 | 0.53 | 164 | 179 | 164 | 665 | 486 | 378 | 5 | 3 | 3 | |||||||||||||||||||||||||||||||||||||||||||||
West Wits | ||||||||||||||||||||||||||||||||||||||||||||||||||||||||||||
Mponeng | 1.6 | 1.7 | 1.9 | 9.71 | 9.48 | 8.66 | 500 | 532 | 520 | 547 | 452 | 331 | 172 | 122 | 109 | |||||||||||||||||||||||||||||||||||||||||||||
Savuka | 0.2 | 0.1 | 0.2 | 6.69 | 5.30 | 5.45 | 49 | 22 | 30 | 857 | 1,136 | 1,133 | 8 | 9 | 13 | |||||||||||||||||||||||||||||||||||||||||||||
TauTona(2) | 1.0 | 1.1 | 1.5 | 7.55 | 7.01 | 7.29 | 244 | 259 | 218 | 816 | 699 | 532 | 79 | 75 | 57 | |||||||||||||||||||||||||||||||||||||||||||||
CONTINENTAL AFRICA | ||||||||||||||||||||||||||||||||||||||||||||||||||||||||||||
Ghana | ||||||||||||||||||||||||||||||||||||||||||||||||||||||||||||
Iduapriem | 4.3 | 3.4 | 3.4 | 1.44 | 1.70 | 1.72 | 199 | 185 | 190 | 839 | 778 | 658 | 73 | 17 | 28 | |||||||||||||||||||||||||||||||||||||||||||||
Obuasi(2) | 2.0 | 2.6 | 4.6 | 4.82 | 5.16 | 5.18 | 313 | 317 | 381 | 859 | 760 | 630 | 132 | 109 | 94 | |||||||||||||||||||||||||||||||||||||||||||||
Guinea | ||||||||||||||||||||||||||||||||||||||||||||||||||||||||||||
Siguiri (85 percent) | 9.7 | 8.8 | 8.8 | 0.79 | 0.97 | 1.11 | 249 | 273 | 316 | 871 | 656 | 513 | 15 | 10 | 22 | |||||||||||||||||||||||||||||||||||||||||||||
Mali | ||||||||||||||||||||||||||||||||||||||||||||||||||||||||||||
Morila (40 percent)(5) | 1.8 | 1.7 | 1.7 | 1.70 | 1.70 | 2.47 | 99 | 95 | 137 | 818 | 716 | 526 | 1 | 1 | 4 | |||||||||||||||||||||||||||||||||||||||||||||
Sadiola (41 percent)(4)(5) | 2.0 | 1.8 | 1.7 | 1.90 | 2.04 | 2.52 | 121 | 118 | 135 | 835 | 686 | 489 | 14 | 8 | 4 | |||||||||||||||||||||||||||||||||||||||||||||
Yatela (40 percent)(3)(5) | 1.1 | 1.2 | 1.1 | 1.04 | 1.23 | 3.62 | 29 | 60 | 89 | 1,483 | 817 | 326 | 1 | 2 | 1 | |||||||||||||||||||||||||||||||||||||||||||||
Namibia | . | |||||||||||||||||||||||||||||||||||||||||||||||||||||||||||
Navachab | 1.4 | 1.5 | 1.3 | 1.46 | 1.80 | 1.58 | 66 | 86 | 65 | 939 | 721 | 677 | 48 | 14 | 20 | |||||||||||||||||||||||||||||||||||||||||||||
Tanzania | ||||||||||||||||||||||||||||||||||||||||||||||||||||||||||||
Geita | 3.9 | 4.7 | 4.5 | 3.98 | 2.36 | 1.89 | 494 | 357 | 272 | 488 | 697 | 985 | 58 | 38 | 19 | |||||||||||||||||||||||||||||||||||||||||||||
AUSTRALASIA | ||||||||||||||||||||||||||||||||||||||||||||||||||||||||||||
Australia | ||||||||||||||||||||||||||||||||||||||||||||||||||||||||||||
Boddington (33.33 percent) | – | – | – | – | – | – | – | – | – | – | – | – | – | – | 146 | |||||||||||||||||||||||||||||||||||||||||||||
Sunrise Dam | 3.6 | 3.6 | 3.9 | 2.16 | 3.22 | 2.87 | 246 | 396 | 401 | 1,362 | 692 | 631 | 27 | 29 | 31 | |||||||||||||||||||||||||||||||||||||||||||||
AMERICAS | ||||||||||||||||||||||||||||||||||||||||||||||||||||||||||||
Argentina | ||||||||||||||||||||||||||||||||||||||||||||||||||||||||||||
Cerro Vanguardia (92.5 percent) | 1.0 | 1.0 | 0.9 | 6.23 | 6.11 | 6.51 | 196 | 194 | 192 | 403 | 366 | 359 | 73 | 38 | 17 | |||||||||||||||||||||||||||||||||||||||||||||
Brazil | ||||||||||||||||||||||||||||||||||||||||||||||||||||||||||||
AGA Mineração(2) | 1.7 | 1.6 | 1.5 | 7.43 | 7.21 | 7.02 | 361 | 338 | 329 | 571 | 444 | 347 | 259 | 142 | 84 | |||||||||||||||||||||||||||||||||||||||||||||
Serra Grande (50 percent) | 0.6 | 0.6 | 0.5 | 3.59 | 4.05 | 4.52 | 67 | 77 | 77 | 851 | 481 | 429 | 22 | 26 | 33 | |||||||||||||||||||||||||||||||||||||||||||||
United States of America | ||||||||||||||||||||||||||||||||||||||||||||||||||||||||||||
Cripple Creek & Victor(3) | 20.3 | 20.6 | 18.7 | 0.39 | 0.43 | 0.46 | 267 | 233 | 218 | 569 | 500 | 371 | 67 | 73 | 87 | |||||||||||||||||||||||||||||||||||||||||||||
|
|
|
|
|
SOUTH AFRICA
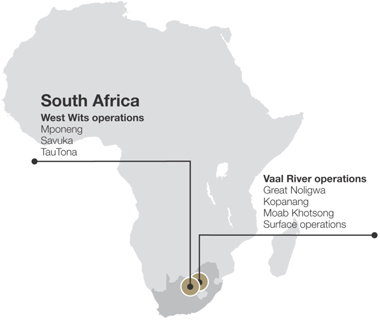
AngloGold Ashanti’s South African operations comprise six deep-level mines and a surface operation. They are:
The Vaal River operations – Great Noligwa, Kopanang, Moab Khotsong and the surface operation; and
The West Wits operations – Mponeng, Savuka and TauTona.
Performance
These operations produced 1.62 million ounces of gold in 2011, or 37 percent of group production, (Vaal River operations, 51 percent and West Wits operations, 49 percent) and 1.38 million pounds of uranium as a by-product. The South African operations employed an average of 32,082 people in 2011.
Total capital expenditure in South Africa in 2011 was $549 million (2010: $430 million). The bulk of this was spent at Mponeng $172 million, Moab Khotsong $147 million, Kopanang $92 million and TauTona $79 million.
In 2011, all South African mines felt the impact of Section 54 safety stoppages imposed by the state mines inspector, as well as power-price increases, the industry-wide wage strike and resultant payroll increase, and increases in the price of steel, oil and fuel.
Geology
The Witwatersrand Basin comprises a six-kilometer thick sequence of inter-bedded argillaceous and arenaceous sediments that extend laterally for some 300 kilometers north-east/south-west and 100 kilometers north-west/south-east on the Kaapvaal Craton. The upper portion of the basin, which contains the orebodies, crops out at its northern extent near Johannesburg. Further west, south and east the basin is overlain by up to four kilometers of Archaean, Proterozoic and Mesozoic volcanic and sedimentary rocks. The Witwatersrand Basin is late Archaean in age and is considered to be in the order of 2.7 to 2.8 billion years old.
Gold occurs in laterally extensive quartz pebble conglomerate horizons or reefs, generally less than two meters thick, which are widely considered to represent laterally extensive braided fluvial deposits. Separate fan systems were developed at different entry points and these are preserved as distinct goldfields. The most fundamental control to the gold distribution in the Basin remains the sedimentary features, such as facies variations and channel directions. Gold generally occurs in native form often associated with pyrite and carbon, with quartz being the main gangue mineral.
Safety
Regrettably, there were nine fatalities during the year. The all injury frequency rate (AIFR) improved to 15.56 per million hours worked in 2011 from 16.69 in 2010.
The South African operations’ ‘three-pillar’ strategy focuses on removing people from areas of risk, modifying behaviour and attitudes to risk and improving planning. Teams of employees have attended the Simunye training process. The introduction of the Safety Management Program is expected to assist in further improving safety through its requirements to ensure regular inspections, behavior observations, group meetings and frequent workplace risk assessments. Simunye translates as “we are ONE”, indicating its relation to Project ONE and the desired training outcome of safe and productive teams who are united in a common purpose.
Growth and improvement
Socio-economic development is an essential aspect of the South Africa region’s business strategy, both from the perspective of compliance to ensure the retention of mining licenses and because a downward trend in the region’s gold production profile, together with a strategy of removing employees from high-risk areas, will inevitably lead to significant reductions in the labor force over the medium term.
Following extensive stakeholder engagement, the region has designed a framework to integrate community development into core business activities, while providing support for national and international development policies and objectives, particularly those addressing youth unemployment.
South African Revised Mining Charter
The management teams of the South African operations have held and will continue to hold regular meetings with labor unions to track progress towards reaching the employment equity target of 40 percent of management roles held by historically disadvantaged South Africans.
Vaal River operations
Description
The Vaal River operations consist of Great Noligwa, Kopanang, Moab Khotsong as well as surface operations.
Geology
In order of importance, the reefs mined at the Vaal River operations are the Vaal Reef, the VCR and the “C” Reef:
The Vaal Reef contains approximately 85 percent of the reserve tonnage with mining grades between 10 and 20g/t and comprises a series of oligomictic conglomerates and quartzite packages developed on successive unconformities. Several distinct facies have been identified, each with its unique gold distribution and grade characteristic.
The VCR has a lower grade than the Vaal Reef, and contains approximately 15 percent of the estimated reserves. The economic portion is mainly concentrated in the western part of the lease area and can take the form of a massive conglomerate, a pyritic sand unit with intermittent pebble layers or a thin conglomerate horizon. The reef is located at the contact between the overlying Kliprivierberg Lavas of the Ventersdorp SuperGroup and the underlying sediments of the Witwatersrand SuperGroup which creates a distinctive seismic reflector. The VCR is located up to one kilometer above the Vaal Reef.
The “C” Reef is a thin, small pebble conglomerate with a carbon-rich basal contact, located approximately 270 meters above the Vaal Reef. It has less than 1 percent of the estimated reserves with grades similar to the Vaal Reef, but more erratic. The most significant structural features are the north-east striking normal faults which dip to the north-west and south-east, resulting in zones of fault loss.
Vaal River – Summary of metallurgical operations
| West Gold Plant | East Gold Acid and Float Plant | Noligwa Gold Plant | Mispah Gold Plant | Kopanang Gold Plant | ||||||||||||||||
Gold plants | ||||||||||||||||||||
Capacity (000 tonnes/month) | 180 | 309 | 210 | 140 | 420 | |||||||||||||||
Uranium plants | ||||||||||||||||||||
Capacity (000 tonnes/month) | – | – | 210 | – | – | |||||||||||||||
Pyrite flotation plants | ||||||||||||||||||||
Capacity (000 tonnes/month) | – | 250 | 145 | – | – | |||||||||||||||
Sulfuric acid plants | ||||||||||||||||||||
Production (tonnes/month) | – | 7,500 | – | – | – | |||||||||||||||
Operating and production data for Vaal River Operations
| Great Noligwa | Kopanang | Moab Khotsong | Tau Lekoa(3) | Vaal River and West Wits surface | ||||||||||||||||
2011 | ||||||||||||||||||||
Pay limit (oz/t) | 0.58 | 0.48 | 0.57 | 0.01 | ||||||||||||||||
Pay limit (g/t) | 13.14 | 10.93 | 12.84 | 0.21 | ||||||||||||||||
Recovered grade (oz/t) | 0.163 | 0.189 | 0.274 | 0.014 | ||||||||||||||||
Recovered grade (g/t) | 5.58 | 6.47 | 9.39 | 0.48 | ||||||||||||||||
Gold production (000 oz) | 94 | 307 | 266 | 164 | ||||||||||||||||
Total cash costs ($/oz)(1) | 1,191 | 684 | 688 | 665 | ||||||||||||||||
Total production costs ($/oz)(1) | 1,447 | 951 | 1,071 | 689 | ||||||||||||||||
Capital expenditure ($ million) | 29 | 92 | 147 | 5 | ||||||||||||||||
Employees(2) | 2,884 | 5,468 | 4,618 | 745 | ||||||||||||||||
Outside contractors(2) | 83 | 424 | 1,963 | - | ||||||||||||||||
All injury frequency rate | 23.92 | 23.18 | 20.48 | 21.32 | ||||||||||||||||
2010 | ||||||||||||||||||||
Pay limit (oz/t) | 0.36 | 0.41 | 0.49 | 0.01 | ||||||||||||||||
Pay limit (g/t) | 11.69 | 13.08 | 15.87 | 0.29 | ||||||||||||||||
Recovered grade (oz/t) | 0.175 | 0.179 | 0.263 | 0.016 | ||||||||||||||||
Recovered grade (g/t) | 5.99 | 6.13 | 9.03 | 3.32 | 0.54 | |||||||||||||||
Gold production (000 oz) | 132 | 305 | 292 | 63 | 179 | |||||||||||||||
Total cash costs ($/oz)(1) | 894 | 613 | 586 | 905 | 486 | |||||||||||||||
Total production costs ($/oz)(1) | 1,152 | 879 | 997 | 937 | 520 | |||||||||||||||
Capital expenditure ($ million) | 24 | 61 | 120 | 10 | 3 | |||||||||||||||
Employees(2) | 3,225 | 5,484 | 4,651 | 374 | ||||||||||||||||
Outside contractors(2) | 90 | 454 | 1,801 | – | ||||||||||||||||
All injury frequency rate | 21.63 | 21.86 | 19.72 | 5.99 | ||||||||||||||||
2009 | ||||||||||||||||||||
Pay limit (oz/t) | 0.43 | 0.40 | 0.60 | 0.21 | 0.007 | |||||||||||||||
Pay limit (g/t) | 14.90 | 13.85 | 20.57 | 7.27 | 0.225 | |||||||||||||||
Recovered grade (oz/t) | 0.167 | 0.197 | 0.273 | 0.097 | 0.015 | |||||||||||||||
Recovered grade (g/t) | 5.73 | 6.74 | 9.36 | 3.32 | 0.53 | |||||||||||||||
Gold production (000 oz) | 158 | 336 | 247 | 124 | 164 | |||||||||||||||
Total cash costs ($/oz)(1) | 791 | 408 | 421 | 718 | 378 | |||||||||||||||
Total production costs ($/oz)(1) | 994 | 598 | 749 | 766 | 390 | |||||||||||||||
Capital expenditure ($ million) | 24 | 58 | 104 | 17 | 3 | |||||||||||||||
Employees(2) | 4,612 | 5,612 | 4,334 | 2,700 | 228 | |||||||||||||||
Outside contractors(2) | 127 | 447 | 1,735 | 414 | 6 | |||||||||||||||
All injury frequency rate | 17.51 | 22.71 | 28.82 | 26.39 | 9.10 | |||||||||||||||
Key statistics – Surface sources - Uranium
| 2011 | 2010 | 2009 | ||||||||||||||
Pay limit (lb/t) | 0.368 | 0.316 | 0.362 | |||||||||||||
Pay limit (g/t) | 0.167 | 0.143 | 0.164 | |||||||||||||
Recovered grade (lb/t) | 0.635 | 0.622 | 0.584 | |||||||||||||
Recovered grade (g/t) | 0.288 | 0.282 | 0.265 | |||||||||||||
Uranium production (000lbs) | 1,380 | 1,462 | 1,442 | |||||||||||||
Capital expenditure ($ million) | 29 | 12 | 5 | |||||||||||||
Employees(2) | 172 | 185 | 194 | |||||||||||||
Contractors(2) | 27 | 28 | 27 | |||||||||||||
|
|
|
Vaal River – Great Noligwa
Description
Great Noligwa is a mature operation which adjoins Kopanang and Moab Khotsong and is located close to the town of Orkney, near the Vaal River. The Vaal Reef, the operation’s primary reef, and the Crystalkop Reef, a secondary reef, are mined from a twin-shaft system over eight main levels at an average depth of 2,400 meters. Given the geological complexity of the orebody at Great Noligwa, a pillar mining method is employed.
The mine shares a milling and treatment circuit with Moab Khotsong and Kopanang.
Performance
Great Noligwa produced 94,000 ounces at a total cash cost of $1,191 per ounce in 2011, compared with 132,000 ounces at a total cash cost of $894 per ounce the previous year. The strategy at the operations has shifted from conventional mining to pillar extraction, given its limited remaining life and the fact that mining has reached boundary limits.
The mine faced a challenging year in 2011, with a combination of factors curtailing production and pushing costs higher. These included a lack of mineable face length caused by the intersection of unexpected geological features, followed by difficulties encountered in quickly re-establishing and equipping pillars. Ore-pass blockages caused by poor ground conditions further limited output.
An 81 percent improvement in contribution from uranium by-product output helped mitigate some of those headwinds, following an increase in the price for the nuclear fuel and opportunistic sales to take advantage of the higher prices.
Growth and improvement
Great Noligwa is a mature mine with little opportunity to significantly increase the production base. Growth initiatives in 2012 will consist mainly of vamping operations in old working areas and extraction of higher-grade pillars. The mine’s Crystalkop reef will be used to test technology which, if successful, may be used on other group mines. In the meantime, the rollout of Project ONE at the mine aims to improve overall operating efficiencies by improving the capability and accountability of all crews and management, and enhancing planning and scheduling activities.
A high-grade block of ore, named Fish, within a large fault loss area, was initially identified in 2006. Access required extensive opening up, rehabilitation and re-equipping of old haulages in order to start development. Subsequent to initiation of access procedure, a seismic event caused extensive damage. The area was modelled from a rock engineering point of view during 2010 and a recommendation was made that a second escape was required to enable safe mining. Additional capital for this work was approved at the beginning 2011 and this is expected to be completed during 2013.
Although reef meters improved from 2010 levels, improved flexibility is only expected to be realized in 12 to 18 months. Being a pillar mine, flexibility is partially created by development and partially by re-establishment of previously abandoned face length which often poses delays and difficulty when accessing old workings. Alternate access methods are being explored with the help of external experts. Holing into old workings revealed increased requirements for re-support of the holing areas due to deteriorated ground conditions, further delaying development. Given its age and the large database of information on the orebody, grade estimation is not a significant risk. As far as practically possible, however, geological drilling into pillars that were abandoned in past years will be undertaken.
Pillar mining introduces a constraint on the mine call factor mainly due to multiple ore handling stages before the product is delivered to the plant, as well as the effect of dilution in negotiating geological structures. Recovered grade remains fairly constant and is only disrupted by unforeseen anomalies, if and when they occur.
Safety
Tragically, one fatality was recorded in January 2011 during scraper winch operations.
The mine recorded 500,000 fatality-free shifts during September 2011. The OHSAS 18001 and ISO 14001 certification was maintained. However, the all injury frequency rate was 23.92 per million hours worked compared with 21.63 the previous year.
Vaal River – Kopanang
Description
Kopanang is located in the Free State province, roughly 170 kilometers south-west of Johannesburg and approximately 10 kilometers southeast of the town of Orkney on a lease area of 35km2. The operation is west of neighbour Great Noligwa and bound to the south by the Jersey Fault. Gold is the primary output with uranium oxide as a by-product from a single shaft system to a depth of 2,600 meters.
Kopanang almost exclusively exploits the Vaal Reef, although minor amounts of gold are also extracted from the secondary Crystalkop Reef. Given the geologically complex orebody, scattered mining is used.
Performance
Kopanang produced 307,000 ounces at a total cash cost of $684 per ounce in 2011, compared with 305,000 ounces at a total cash cost of $613 per ounce the previous year.
Progress was made in reducing the number of mine-wide safety stoppages through a forum comprising government, labor and management. During 2011, 20 shifts were lost compared with 29 in 2010. In addition, a combination of pipe failures underground, engineering work required to rehabilitate a portion of the shaft, along with a shortage of key underground mining skills, limited the increase in production.
Despite these challenges, the cost increase was contained at 12 percent with the help of an improved by-product contribution and a 6 percent increase in reef yield. The latter resulted from the operation’s improved efficiency rate, or mine-call factor, less reef dilution and higher mining grades compared with 2010. Geological drilling targets were achieved, which improved confidence in planning for face length and reef meters. Reserve availability also increased, improving the flexibility of the operation. Overall productivity improved 3 percent from 2010, despite the skills shortage. Additional apprentices were employed and training increased in order to obviate this scarcity.
Growth and improvement
Production at Kopanang is expected to remain stable. In addition there is continued focus on improving mine-call factor, which rose by two percentage points in 2011. This measure of efficiency in extracting available gold has been historically low at Kopanang and efforts to improve it are focused on retrieving ‘old gold’ from abandoned working areas, reducing fragmentation and improving sampling quality.
Additional production crews will be used to sustain production targets when Simunye training continues. Pillar crews are expected to be in place by mid-year.
Life extension projects identified in 2011 include the Shaft Fault area, pillars and potential resources above 42 level, offlease opportunities and the Ventersdorp Contact Reef (VCR). Additional information will be obtained from ongoing exploration to convert resources to reserve. Reef was intersected west of the current mining front, above 42 level, returning encouraging values of 16.35g/t. Incorporation of new sampling data from drilling and underground chip sampling added to Mineral Resource during 2011.
The Shaft Fault remains a very prospective target area for new ounces and exploration will continue during 2012. Below 68 level drilling has commenced. The major structure, the Jersey Fault, has been intersected, resulting in more accurate modelling of the fault to identify reef target blocks.
Three surface drill rigs have also been mobilized to explore the Vaal Reef and VCR both on- and off-lease. This exploration plan will continue during 2012. The mining rights application for the Altona area has been lodged with the Department of Mineral Resources.
Six strategic thrusts – consistent daily blast, improving the quality of mining and the mine-call factor, meeting business expectations and life-of-mine extension, re-design of western mining front, and adoption of off-the-shelf technology to achieve productivity – have been identified to achieve targets and reduce unit costs.
Energy efficiency is expected to be addressed with the introduction of the cooling auxiliary project to reduce electricity usage by the refrigeration plants. This project also involves the implementation of compressed air valves to control pressure at the stations and to minimize power consumption during offpeak periods. In addition, water jets will be modified to reduce the pumping load, and thus energy demand.
Safety
Tragically, four fatalities occurred at the mine during the year. The first occurred in August when a rescue triage member was inundated by super-fine ore during silo maintenance. In October, a stope team leader was fatally injured in an accident during waterjet cleaning operations and in December a winch operator and an acting team leader were fatally injured in two separate fall of ground incidents. Specific new strategies for operating waterjets and for cleaning ore boxes and silos for maintenance purposes have been employed. Strategic plans to prevent falls of ground were also revised and rolled out. These accidents followed Kopanang’s achievement of more than 1 million fatality free shifts and more than a year without a fatality related to a fall of ground.
Kopanang maintained its OHSAS 18001 and ISO 14001 certifications during the year.
Vaal River – Moab Khotsong
Description
Moab Khotsong is AGA’s newest gold mine in South Africa. It is situated near Orkney, Klerksdorp and Viljoenskroon, about 180 kilometers southwest of Johannesburg. Stoping operations began in November 2003, with the mine expected to reach full production in 2013. Given the geological complexity of the Vaal Reef, scattered mining is employed.
The Zaaiplaats orebody in the Moab Khotsong lease area presents a significant growth opportunity and capital has been allocated to support its development in phases.
Performance
Moab Khotsong produced 266,000 ounces at a total cash cost of $688 per ounce in 2011, compared with 292,000 ounces at a total cash cost of $586 per ounce the previous year. The 9 percent decline in production and the resultant increase in costs were due to Section 54 safety-related stoppages enforced by the state mine inspector, as well as complex geological structures which complicated normal mining operations.
Notwithstanding a difficult operating environment, the mine achieved a strong development performance which helped create more face length than that depleted and, as a result, maintain flexibility in terms of the area to mine in future years. Ore Reserve development and long-inclined borehole drilling (LIB) proceeded according to plan in 2011.
In order to obtain critical information on a timely basis, a comprehensive risk-drilling program was revised to include macro drilling up to three cross-cuts ahead of the current development ends, thus improving grade prediction and development planning. This allowed more proactive mine design and the opening up of reef, while the development of new raises provided additional grade information. The active drilling program employs five LIB drilling and ten hydraulic drilling machines to ameliorate the risk of intersecting dip features within the 12-month mining plan.
Moab Khotsong improved overall efficiency, evidenced in the improvement of its mine-call factor by two percentage points to 84.2 percent.
Growth and improvement
The Simunye training component of Project ONE commenced midway through 2011 and will continue in 2012, with the aim of improving productivity rates. The continued ramp-up of Project ONE, and specifically its work management component, are expected to assist in mitigating cost inflation at the mine.
The key focus areas identified for Project ONE are the area mined in square meters, Ore Reserve development, reef development, tonnes hoisted and grade.
Project Zaaiplaats is designed to extend the operation’s life by exploiting the Zaaiplaats block southwest of the current mine, unlocking 5.4 million ounces of gold. Phase 1, which was approved in August 2010, is currently underway. It will establish the infrastructure required for phase 2 which in turn will create a drilling platform to further increase the geological (structural) confidence of a bigger portion of the Zaaiplaats orebody, while delivering first production from the project to bridge the gap between current mining activities and access to the main portion of the Zaaiplaats orebody.
Phase 1 is expected to conclude in 2012 with the establishment of the infrastructure to continue with phase 2. Phase 2 will follow with development of the eastern access. Redesign and supplementary studies will continue along the way, with changes incorporated from drilling information and practical experience of the use of trackless equipment. During phase 3, scheduled for 2014, full approval of the remaining phase of the Zaaiplaats project will be sought.
Phase 1 is currently in the implementation stage and access development has been completed ahead of schedule.
Construction of two 800 tonne ore-storage silos is in process and is expected to be completed in 2012. This crucial component of phase 1 will increase rock-handling capacity on 101 and 102 levels in anticipation of phase 2 and phase 3.
The Zaaiplaats project will use a modified approach to predevelopment to facilitate drilling platforms for gathering orebody and structural information, together with the possibility of earlier gold production given the anticipated drilling outcomes. A mechanized development contract is expected to be negotiated in 2012.
Safety
Tragically, a fatality was recorded at Moab Khotsong as a result of a tramming incident. Despite this, the mine sustained a year-on-year improvement in the fatal injury frequency rate, from 0.13 per million hours worked in 2010 to 0.06 in 2011. This improvement aligns the mine’s performance with industry milestones for 2013.
Moab Khotsong mine recorded 1.96 million fatality-free shifts in August 2011, a new record for this operation. There were also 2.5 million fall-of-ground fatality-free shifts, which milestone was achieved over a period of 18 months.
The mine retained its OHSAS 18001 and ISO 14001 certification during 2011.
Vaal River and West Wits – Surface operations
Description
The surface operation (metallurgy) extracts gold from marginal ore dumps and tailings storage facilities at surface as there is more metallurgical capacity than reef mined. Uranium is produced as a by-product. In addition, backfill product is produced for mining operations. Operating units are: Noligwa Gold Plant, which takes feed from the Vaal River mines and processes marginal ore-dump material; Mispah plant, which also treats marginal ore-dump materials; Kopanang Gold Plant, which treats marginal oredump material and Kopanang reef; West Gold Plant, which treats marginal ore-dump material; East Gold Plant, which treats feed from the Sulphur Pay dam and environmental clean-up material; Mponeng Gold Plant, dedicated to reef from the Mponeng mine; Savuka Gold Plant, which services TauTona and Savuka and treats dump material; South Uranium Plant, which operates in reverse leach mode with Noligwa Gold Plant; and Nufcor, which undertakes Calcining of South Uranium Plant’s final product. Metallurgy also has rail transport infrastructure, the Vaal River and West Wits Laboratories and tailings management facilities.
Performance
The surface operation produced 164,000 ounces of gold at a total cash cost of $665 per ounce in 2011, compared to 179,000 ounces at a total cash cost of $486 per ounce the previous year. Uranium production was 1.38 million pounds compared with 1.46 million pounds the previous year.
Following unseasonal rains, the water containment circuits were unable to manage the amount of water resulting in a number of overflows. A new water management regime was introduced to improve available stormwater dam capacity. Since its introduction, there have been no overflows. Later in the year, unseasonal late rainfall resulted in a water shortage which necessitated a stoppage of the East Gold Plant for three days. Short-term action minimized the impact. In addition, a pipeline is being installed which will make it possible to take some mildly saline water from neighboring third-party operations, currently discharged into the Koekemoerspruit, into AngloGold Ashanti’s metallurgical circuit. A second project has been undertaken which will allow well-field water to be pumped into the metallurgical circuit.
Surface operations experienced 12 reportable environmental incidents during 2011, of which eight were due to dam overflows. The water management philosophy has been revised taking into consideration the infrastructure and operational management of the total water balance. The actions that were put in place ensured that water could be managed during the wet fourth quarter. The replacement of the Mponeng residue pipeline and improvements in operational management have reduced the overall risk of major pipe failures.
The failure of the Mispah mill further impacted production, motivating the redesign of the lubrication system on this and similar mills. The unexpected decline of grade in marginal ore dumps is a concern and has been met with increased focus on optimizing mill use, while an additional dump was equipped for mining to improve flexibility. Poor reliability of oxygen and lime supply also affected production. An oxygen plant has now been built on site to ensure supply and a new lime-slaking facility has been constructed to facilitate the use of powdered instead of unslaked lime.
Growth and improvement
Project ONE – and in particular its business process framework component – has been rolled out at all plants in South Africa. As part of the second phase, processes are being optimized to ensure maximum benefits are derived. Data based process management is being used at all plants to determine the appropriate measures to be monitored to reduce variability. Encouraging results have been achieved at the South Uranium plant and Mispah plant. The methodologies employed have been implemented at all other plants.
There are three focus areas for growth and improvement, namely:
Uranium Expansion Project to upgrade infrastructure to transport Kopanang ore to the South Uranium Plant to recover additional uranium. Completion is scheduled for July 2012;
Replacement of the uranium solvent extraction section within the plant to ensure sustainable operations over the life of the operation. Completion is scheduled for the end of the third quarter 2013; and
Uranium tailings storage facility (TSF) project designed to recover uranium and gold from existing tailing storage facilities.
A project was initiated to conduct test work to improve understanding of each surface resource. The potential upgrade to material from marginal ore dumps is being investigated.
Community complaints were received regarding dust in the Vaal River area. A “best practice” guideline was developed regarding dust mitigation and is being implemented. The initial focus was on the western extension TSF which contributes most of the dust. Capital of $0.2 million was made available for phase 1, involving the installation of wind curtains and water spray systems on this TSF. This has been completed. Phase 2, which involves the grassing of high-risk areas on the TSF, is due for completion in 2012.
Safety
Metallurgy holds the following certifications:
ISO 14001 – Environment;
OHSAS 18001 – Occupational Health and Safety;
ICMI – Internal Cyanide Management Institute Certification; and
ISO/17025/IEC – International Standard for Testing Laboratories (Vaal River laboratory).
West Wits operations
Description
The Mponeng, Savuka and TauTona mines are situated on the West Wits Line near the town of Carletonville, straddling the border of Gauteng and North West Province. Mponeng has its own gold processing plant, while the Savuka and TauTona operations share a plant.
Geology
Two reef horizons are exploited at the West Wits operations, the Ventersdorp contact Reef (VCR) located at the top of the Central Rand Group and the Carbon Leader Reef (CLR) near the base. The separation between the two reefs increases from east to west from 400 tp 900 meters, due to unconformity in the VCR. TauTona and Savuka exploit both reefs, whereas Mponeng only mines the VCR. Faults of greater than 70 meters are rare. The CLR consists of one or more conglomerate units and varies from several centimeters to more than three meters in thickness. Regionally, the VCR dips at approximately 21 degrees but may vary between 5 degrees and 50 degrees, accompanied by changes in thickness of the conglomerate units. Where the conglomerate has the attitude of the regional dip, it tends to be thick, well-developed and accompanied by higher gold accumulations. Where the attitude departs significantly from the regional dip, the reef is thin, varying from several centimeters to more than three meters in thickness.
Operating and production data for West Wits operations
| ||||||||||||
| Mponeng | Savuka | TauTona | ||||||||||
| ||||||||||||
2011 | ||||||||||||
Pay limit (oz/t) | 0.41 | 0.46 | 0.78 | |||||||||
Pay limit (g/t) | 9.16 | 10.36 | 17.63 | |||||||||
Recovered grade (oz/t) | 0.283 | 0.195 | 0.220 | |||||||||
Recovered grade (g/t) | 9.71 | 6.69 | 7.55 | |||||||||
Gold production (000 oz) | 500 | 49 | 244 | |||||||||
Total cash costs ($/oz)(1) | 547 | 857 | 816 | |||||||||
Total production costs ($/oz)(1) | 691 | 918 | 1,135 | |||||||||
Capital expenditure ($ million) | 172 | 8 | 79 | |||||||||
Employees(2) | 5,624 | 785 | 4,023 | |||||||||
Outside contractors(2) | 164 | 30 | 484 | |||||||||
All injury frequency rate | 15.39 | 8.39 | 13.36 | |||||||||
2010 | ||||||||||||
Pay limit (oz/t) | 0.28 | 0.56 | 0.60 | |||||||||
Pay limit (g/t) | 9.14 | 17.86 | 19.27 | |||||||||
Recovered grade (oz/t) | 0.276 | 0.155 | 0.204 | |||||||||
Recovered grade (g/t) | 9.48 | 5.30 | 7.01 | |||||||||
Gold production (000 oz) | 532 | 22 | 259 | |||||||||
Total cash costs ($/oz)(1) | 452 | 1,136 | 699 | |||||||||
Total production costs ($/oz)(1) | 580 | 1,409 | 996 | |||||||||
Capital expenditure ($ million) | 122 | 9 | 75 | |||||||||
Employees(2) | 5,732 | 952 | 4,137 | |||||||||
Outside contractors(2) | 46 | 29 | 472 | |||||||||
All injury frequency rate | 15.93 | 7.69 | 19.03 | |||||||||
2009 | ||||||||||||
Pay limit (oz/t) | 0.25 | 0.78 | 0.74 | |||||||||
Pay limit (g/t) | 8.53 | 26.74 | 25.33 | |||||||||
Recovered grade (oz/t) | 0.253 | 0.159 | 0.213 | |||||||||
Recovered grade (g/t) | 8.66 | 5.45 | 7.29 | |||||||||
Gold production (000 oz) | 520 | 30 | 218 | |||||||||
Total cash costs ($/oz)(1) | 331 | 1,133 | 532 | |||||||||
Total production costs ($/oz)(1) | 404 | 1,400 | 766 | |||||||||
Capital expenditure ($ million) | 109 | 13 | 57 | |||||||||
Employees(2) | 5,926 | 1,019 | 3,842 | |||||||||
Outside contractors(2) | 103 | 35 | 451 | |||||||||
All injury frequency rate | 14.31 | 13.23 | 15.84 | |||||||||
|
|
West Wits – Mponeng
Description
Mponeng is located between the towns of Carletonville and Fochville on the border between Gauteng and the North West Province, southwest of Johannesburg. The operation, the world’s deepest mine, extracts the Ventersdorp Contact Reef (VCR) at depths between 2,400 meters and 3,900 meters through sequential-grid mining. The Mponeng lease area is constrained to the north by the TauTona and Savuka mines, to the east by Gold Fields’ Driefontein mine and to the west by Harmony’s Kusasalethu. Mponeng comprises a twin-shaft system housing two surface shafts and two sub-shafts. Ore is treated and smelted at the mine’s gold plant.
Performance
Mponeng produced 500,000 ounces at a total cash cost of $547 per ounce in 2011, compared with 532,000 ounces at a total cash cost of $452 per ounce the previous year. The decline in production was due to a combination of factors which interrupted normal operations at various periods throughout the year and higher than- anticipated temperatures in the deeper mining areas. An upgrade and expansion of the ice plant on surface, which contributed to higher costs, was necessitated by the increased cooling requirements as underground operations at Mponeng deepened. Work on this upgrade began in 2010 and was completed in 2011.
The Mponeng operating teams contended with the breakdown of a winder and also trackless equipment used for the deepening project. An increase in the number of Section 54 safety stoppages, ordered by the state mine inspector, caused considerable disruption during the year. Management teams have intensified efforts to avoid these stoppages by continuing to improve overall safety at the mine and ensuring compliance with all relevant safety regulations. Improving development performance remains a key area of focus.
Growth and improvement
Mponeng hosts the most significant of the group’s South African investments in its below 120 deepening project, which will extend the life of this operation. This project, which will access the Carbon Leader and Ventersdorp Contact reefs below the current 120 level, is being tackled in a phased approach with the development of a decline from the existing infrastructure to gain quicker access to the ore and improve payback, project returns and future expansion options.
The CLR portion of the project will ultimately access 11.3 million ounces and the VCR another 3.2 million ounces. Phase 1 refers to the VCR below 120 project, currently being implemented to develop four declines from 120 level to the 126/127 levels to exploit the VCR orebody. It includes the installation of the supporting infrastructure (refrigeration, backfill, decline equipping, etc) required to service a 10,000m2/month production plan.
The feasibility study is underway for phase 2, which will focus on the CLR on two levels from 120 level down to 126 level. The access design showing best fit with existing infrastructure and schedule, as well as the best returns and potential for expansion, is the construction of a central ramp, supported by an extension of the SS2 shaft for long-term transportation of men and material. The rock will be trucked up the ramp from 126 and 123 level to 119 level and hoisted to surface through the SS1 shaft rock hoisting system. Phase 2 is expected to be mined at a rate of 12,000m2 per month. The dedicated decline ramp from 120 level will provide fast access to ounces and will minimize the dependence of phase 2 on phase 1 infrastructure, making phase 1 infrastructure available for a phase 3 project opportunity. Phase 2 will be implemented following board approval which is anticipated during 2012.
At the existing Mponeng operation, additional exploration was undertaken to gain greater knowledge of the orebody and its geological structures in order to improve planning, scheduling and confidence in production targets. Along with this program, a decision has been taken to minimize ongoing mining activities in the lower-grade eastern sections of the mine.
The grade mined at Mponeng was marginally higher than that achieved in 2010 following the decision to move crews from the eastern areas of the mine, where values were found to decline significantly. The mine call factor improved marginally to 79.2 percent.
The introduction of Project ONE at Mponeng will focus on safety transformation to reduce injury rates and eliminate disruptive stoppages; improvement of compliance with mining cycles; improving blast frequency; and optimizing vertical transport. Gains in these areas are expected to result in ongoing productivity improvements at the mine through improvements in face advance, mitigating occasional shortages in certain underground mining skills. Rail-bound drill rigs will also be introduced to accelerate development rates and – as with all the mines in the South Africa region – work crews will undergo the Simunye training program.
New technologies that are introduced at Mponeng to increase productivity are the use of high pressure drill rigs and drill jigs that achieve better development advancement compared to conventional mining equipment. Ore handling improvements at Mponeng are achieved through the use of bigger hoppers that transport higher tonnage of ore and the use of front driven trains. Wi-fi communication was installed underground to assist with better scheduling of handling of material and ore to save time and cost.
Water and waste management in the West Wits region is another key area of focus. Construction of storm water diversion trenches, containment evaporation ponds, waste water control dams and the upgrade of the salvage yard were initiated in 2011. The only work completed in 2011 was the salvage yard upgrade and about 70 percent of the storm water diversion trenches.
During 2011 the majority of the cooling towers were converted from potable to service water use as part of the goal of cutting potable water consumption to 120,000 kiloliters a month. This was surpassed, with use now stabilized at between 80,000 kiloliters and 100,000 kiloliters a month.
A similar focus will be placed on energy use in 2012, with targets set for the reduction of compressed-air and pumping costs. The flow meters installed at each level help to minimize pumping during Eskom’s high-demand times, thus assisting with reduced power consumption.
Safety
Tragically, two fatalities were recorded at Mponeng. In May 2011, an employee died when a seismic event of 0.6 magnitude resulted in a fall of ground. In August 2011, another employee died when a seismic event of local magnitude 2.0 again led to an extensive fall of ground.
Management believes that the improved planning and scheduling that stem from Project ONE, as well as the more cohesive and productive teams resulting from the Simunye training, will help achieve further improvements in safety. Crews have also been initiated into the Simunye training process. The introduction of the safety management program is expected to assist in further improving safety through its requirements to ensure regular inspections, behavior observations, group meetings and frequent workplace risk assessments.
During 2011, the all injury frequency rate improved to 15.39 per million hours worked, from 15.93 in 2010 and the mine also achieved 500,000 fatality-free shifts. Improved engagement with the entire workforce regarding every aspect of their responsibilities and daily tasks will be an ongoing responsibility for management.
Mponeng has the following certification:
ISO 14001 – Environments; and
OHSAS 18001 – Occupational health and safety.
The company plans to have employees and contractors at Mponeng undergo hazardous substance training during 2012.
West Wits – Savuka
Description
Savuka is situated on the West Wits line in the province of Gauteng, close to the town of Carletonville and approximately 70 kilometers southwest of Johannesburg. The Carbon Leader Reef (CLR) is mined at depths varying between 3,137 meters and 3,457 meters below surface and the Ventersdorp Contact Reef (VCR) at a depth of 1,808 meters below surface.
Savuka shares a processing plant with neighbouring TauTona.
Performance
Savuka produced 49,000 ounces at a total cash cost of $857 per ounce in 2011, compared with 22,000 ounces at a total cash cost of $1,136 per ounce the previous year. The mine was placed on care and maintenance during 2011 following a shaft accident that damaged underground infrastructure in May 2009. Limited operations continued throughout 2011 using previously developed reserves. Parts of the Savuka deposit will be accessed from the neighbouring Mponeng operation.
Growth and improvement
The mine’s infrastructure was mothballed at the end of 2011. Ongoing maintenance is required in order to continue water pumping activities for AngloGold Ashanti’s remaining mines in the immediate vicinity.
Safety
Savuka has received the following certifications:
ISO 14001 – Environment; and
OHSAS 18001 – Occupational health and safety.
West Wits – TauTona
Description
TauTona lies on the West Wits Line, just south of Carletonville in Gauteng, about 70 kilometers southwest of Johannesburg. Mining takes place at depths of 1,850 meters to 3,450 meters. The mine has a three-shaft system, supported by secondary and tertiary shafts, and is in the process of converting from longwall to scattered-grid mining. The change in mining method was necessitated by the increasingly complex geology being encountered and the unsuitability of the current method for mining through the Pretorius fault. This change is also expected to improve safety.
Performance
TauTona produced 244,000 ounces at a total cash cost of $816 per ounce in 2011, compared with 259,000 ounce at a total cash cost of $699 per ounce the previous year.
A decision was taken early in 2011, following a significant seismic event, to cease mining of the Ventersdorp Contact Reef (VCR) shaft pillar and remove it from the immediate mine plan in the interests of safety. This decision contributed to the decline in output.
The increase in costs resulted from lower production, replacement of equipment and additional shifts needed to claw back some of the lost production.
Production crews were deployed to focus on increased sweeping and vamping of old production areas to capture valuable ore-chips and gold displaced after blasting and left behind after work areas were vacated. This helped improve the overall mine-call factor of the operation. Increased geological drilling enhanced the overall knowledge of the orebody and contributed to the improved grade in the second half of the year.
Growth and improvement
In line with the rollout of the Project ONE business improvement initiative across the South African operations in 2011, continued focus will be placed on productivity improvements through improved scheduling and planning, as well as continued training of work crews through the Simunye initiative.
One of the chief initiatives expected to be implemented in 2012 is a vertical transport optimization project to accelerate the delivery of consumables and other essential items to work crews, in order to increase production time at the face. Similarly, management expects that the Carbon Leader transfer system will significantly reduce times for horizontal transport, or tramming, due to the reduction in tramming kilometers and elimination of inter-level transfers.
The following energy projects are currently being undertaken:
Installation of a pre-cooling tower at the surface fridge plant – this project was started and completed in 2011. The pre-cooling tower results in improved power consumption in ambient temperatures, as the fridge plant does not have to be activated.
Compressed air automation – this project is expected to be completed in the third quarter of 2012 and should also result in lower power consumption.
Energy recovery turbine – this project is expected to be completed by March 2012.
There will be continued emphasis on the management of seismicity to further improve safety and limit production interruption.
Following the success achieved in 2011, additional geological drilling will be undertaken to enhance knowledge of geological structures. Plans and schedules will be revised accordingly. At year-end, more than half the mine had converted to scattered grid mining and increased efforts were made to achieve development targets to improve future underground flexibility.
AngloGold Ashanti has also reached an agreement to drill in the IC2 block, an area belonging to Gold Fields that is adjacent to TauTona’s existing workings and can be more quickly accessed from there. Drilling started in December 2011 and is expected to be completed by the end of 2012. Scoping work is also underway to determine the viability of mining parts of the Savuka orebody from TauTona, by establishing a link between the two mines.
Safety
There were no fatalities in 2011. The all injury frequency rate improved significantly to 13.36 per million hours worked, as AngloGold Ashanti employees at all levels focused on implementation of the safety transformation plan and the basic tenets of Project ONE. The mine achieved more than 1 million shifts without a fatality and more than three years without a fatality related to falls of ground.
TauTona has received the following certification:
ISO 14001 – Environment; and
OHSAS 18001 – Occupational Health and Safety.
Attributable gold production (000oz) Total cash costs ($ per ounce) SOUTH AFRICA Vaal River Great Noligwa Kopanang Moab Khotsong Tau Lekoa(1) Surface operations Mine Waste Solutions(2) West Wits Mponeng Savuka TauTona(3) CONTINENTAL AFRICA Ghana Obuasi(3) Guinea Siguiri (85 percent) Mali Morila (40 percent)(5) Sadiola (41 percent)(5) Yatela (40 percent)(4)(5) Namibia Navachab Tanzania Geita AUSTRALASIA Australia Sunrise Dam AMERICAS Argentina Cerro Vanguardia (92.5 percent) Brazil AGA Mineração(3) Serra Grande(6) United States of America Cripple Creek & Victor(4) Sold effective August 1, 2010. Effective July 20, 2012, AngloGold Ashanti Effective July 1, 2012 AngloGold Ashanti Rounding of figures may result in computational discrepancies. Attributable tonnes
treated/milled (Mt) Average grade
recovered (g/t) Attributable capital
expenditure ($m) 2012 2011 2010 2012 2011 2010 2012 2011 2010 2012 2011 2010 2012 2011 2010 0.5 0.5 0.7 5.72 5.58 5.99 84 94 132 1,226 1,191 894 27 29 24 0.9 1.5 1.6 5.40 6.47 6.13 164 307 305 1,018 684 613 93 92 61 0.6 0.9 1.0 8.16 9.39 9.03 162 266 292 1,043 688 586 159 147 120 - - 0.6 - - 3.32 - - 63 - - 905 - - 10 10.8 10.7 10.2 0.42 0.48 0.54 144 164 179 833 665 486 8 5 3 7.2 - - 0.12 - - 28 - - 1,036 - - 7 - - 1.3 1.6 1.7 9.40 9.71 9.48 405 500 532 640 547 452 194 172 122 0.2 0.2 0.1 6.09 6.69 5.30 37 49 22 1,027 857 1,136 20 8 9 0.8 1.0 1.1 7.63 7.55 7.01 189 244 259 921 816 699 73 79 75 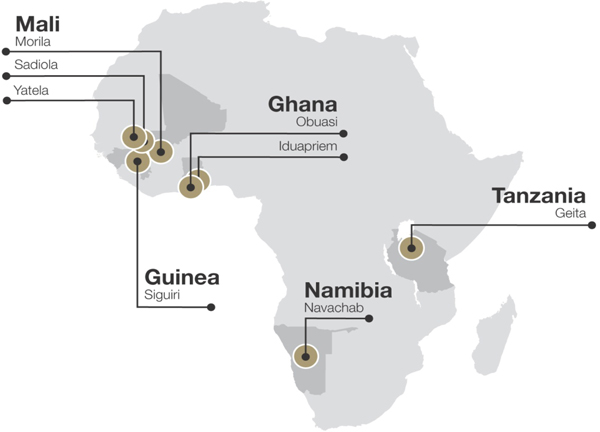
4.6 4.3 3.4 1.22 1.44 1.70 180 199 185 922 839 778 95 73 17 2.1 2.0 2.6 4.79 4.82 5.16 280 313 317 1,189 859 760 185 132 109 10.1 9.7 8.8 0.76 0.79 0.97 247 249 273 935 871 656 28 15 10 1.8 1.8 1.7 1.41 1.70 1.70 81 99 95 765 818 716 1 1 1 1.9 2.0 1.8 1.64 1.90 2.04 100 121 118 1,220 835 686 37 14 8 1.1 1.1 1.2 1.06 1.04 1.23 29 29 60 1,793 1,483 817 2 1 2 1.4 1.4 1.5 1.59 1.46 1.80 74 66 86 1,014 939 721 15 48 14 4.8 3.9 4.7 3.47 3.98 2.36 531 494 357 652 488 697 81 58 38 3.4 3.6 3.6 2.39 2.16 3.22 258 246 396 1,178 1,362 692 35 27 29 1.7 1.0 1.0 6.48 6.23 6.11 219 196 194 644 403 366 70 73 38 2.2 1.7 1.6 6.07 7.43 7.21 388 361 338 711 571 444 162 259 142 0.9 0.6 0.6 3.36 3.59 4.05 98 67 77 827 851 481 33 22 26 20.9 20.3 20.6 0.40 0.39 0.43 247 267 233 640 569 500 100 67 73 (1) (2) has eight mining operations in its Continental Africa region:acquired 100 percent of First Uranium (Pty) Limited which, owns MWS.(3) IduapriemThe yields of TauTona, Obuasi and Obuasi in Ghana;AGA Mineração represent underground operations.(4) Siguiri in Guinea;Morila, SadiolaThe yields of Yatela and Yatela in Mali;Cripple Creek & Victor reflect recoverable gold placed/tonnes placed from heap leach operations.(5) Navachab in Namibia; andEquity-accounted investments.(6) Geita in Tanzania.also conducts an active greenfield exploration program, principallyincreased its holding from 50 percent to 100 percent.
SOUTH AFRICA
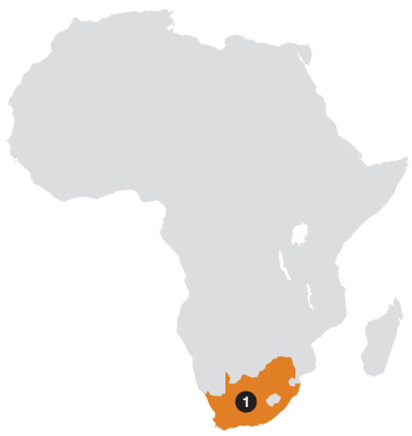
AngloGold Ashanti’s South African operations comprise six deep-level mines and surface operations including MWS. They are:
The Vaal River operations – Great Noligwa, Kopanang, Moab Khotsong and the surface operations; and
The West Wits operations – Mponeng, Savuka and TauTona.
| Gold production (000oz) | Average number of employees | |||||||
Operations |
| |||||||
1. South Africa | ||||||||
Vaal River | ||||||||
Great Noligwa | 84 | 3,063 | ||||||
Kopanang | 164 | 6,014 | ||||||
Moab Khotsong | 162 | 6,645 | ||||||
Surface operations | 144 | 1,147 | ||||||
Mine Waste Solutions(1) | 28 | 727 | ||||||
West Wits | ||||||||
Mponeng | 405 | 6,262 | ||||||
Savuka | 37 | 1,157 | ||||||
TauTona | 189 | 4,472 | ||||||
| (1) | On July 20, 2012, AngloGold Ashanti acquired First Uranium (Pty) Limited, which owns MWS. MWS is a recently commissioned retreatment operation in South Africa’s Vaal River area in the |
South Africa Key Statistics
| Unit | 2012 | 2011 | 2010 | |||||
Operation | ||||||||
Tonnes treated/milled | Mt | 22.3 | 16.4 | 17.0 | ||||
Pay limit | oz/t | 0.40 | 0.54 | 0.53 | ||||
| g/t | 12.41 | 11.98 | 12.02 | |||||
Recovered grade | oz/t | 0.219 | 0.232 | 0.212 | ||||
| g/t | 7.50 | 7.95 | 7.28 | |||||
Gold production | 000oz | 1,213 | 1,624 | 1,784 | ||||
Total cash costs(1) | $/oz | 873 | 695 | 598 | ||||
Total production costs(1) | $/oz | 1,101 | 920 | 819 | ||||
Capital expenditure | $m | 619 | 549 | 430 | ||||
Safety | ||||||||
Number of fatalities | 11 | 9 | 10 | |||||
AIFR | Per million hours worked | 13.24 | 15.57 | 16.69 | ||||
People | ||||||||
Average no of employees: Total | 34,186 | 32,082 | 35,660 | |||||
Permanent employees | 29,740 | 28,176 | 31,723 | |||||
Contractors | 4,446 | 3,906 | 3,937 |