SECURITIES AND EXCHANGE COMMISSION
Washington, D.C. 20549
FORM 20-F
(Mark One)
| ¨ | REGISTRATION STATEMENT PURSUANT TO SECTION 12(b) OR (g) OF THE SECURITIES EXCHANGE ACT OF 1934 |
OR
| x | ANNUAL REPORT PURSUANT TO SECTION 13 OR 15(d) OF THE SECURITIES EXCHANGE ACT OF 1934 |
For the fiscal year ended December 31, 20112013
OR
| ¨ | TRANSITION REPORT PURSUANT TO SECTION 13 OR 15(d) OF THE SECURITIES EXCHANGE ACT OF 1934 |
for the transition period fromto
| ¨ | SHELL COMPANY REPORT PURSUANT TO SECTION 13 OR 15(d) OF THE SECURITIES EXCHANGE ACT OF 1934 |
Date of event requiring this shell company report
Commission file number 001-12518
BANCO SANTANDER, S.A.
(Exact name of Registrant as specified in its charter)
Kingdom of Spain
(Jurisdiction of incorporation)
Ciudad Grupo Santander
28660 Boadilla del Monte (Madrid), Spain
(address of principal executive offices)
José Antonio Álvarez
Banco Santander, S.A.
Ciudad Grupo Santander
28660 Boadilla del Monte
Madrid, Spain
Tel: +34 91 289 32 80
Fax: +34 91 257 12 82
(Name, Telephone, E-mail and/or Facsimile number and Address of Company Contact Person)
Securities registered or to be registered, pursuant to Section 12(b) of the Act
Title of each class | Name of each exchange on which registered | |
American Depositary Shares, each representing the right to receive one Share of Capital Stock of Banco Santander, S.A., par value | New York Stock Exchange | |
Shares of Capital Stock of Banco Santander, S.A., par value | New York Stock Exchange * | |
Guarantee of Non-cumulative Guaranteed Preferred Stock of Santander Finance Preferred, S.A. Unipersonal, Series | New York Stock Exchange ** |
| * | Banco Santander Shares are not listed for trading, but are only listed in connection with the registration of the American Depositary Shares, pursuant to requirements of the New York Stock Exchange. |
| ** | The guarantee is not listed for trading, but is listed only in connection with the registration of the corresponding Non-cumulative Guaranteed Preferred Stock of Santander Finance Preferred, S.A. Unipersonal (a wholly owned subsidiary of Banco Santander, S.A.) |
Securities registered or to be registered pursuant to Section 12(g) of the Act.
None.
(Title of Class)
Securities for which there is a reporting obligation pursuant to Section 15(d) of the Act
None.
(Title of Class)
Indicate by check mark if the registrant is a well-known seasoned issuer, as defined in Rule 405 of the Securities Act.
Yes x No ¨
If this report is an annual or transition report, indicate by check mark if the registrant is not required to file reports pursuant to Section 13 or 15(d) of the Securities Exchange Act of 1934.
Yes ¨ No x
Indicate by check mark whether the registrant (1) has filed all reports required to be filed by Section 13 or 15(d) of the Securities Exchange Act of 1934 during the preceding 12 months (or for such shorter period that the registrant was required to file such reports), and (2) has been subject to such filing requirements for the past 90 days.
Yes x No ¨
Indicate by check mark whether the registrant has submitted electronically and posted on its corporate Web site, if any, every Interactive Data File required to be submitted and posted pursuant to Rule 405 of Regulation S-T during the preceding 12 months (or for such shorter period that the registrant was required to submit and post such files).
Yes ¨ No ¨
Indicate by check mark whether the registrant is a large accelerated filer, an accelerated filer, or a non-accelerated filer. See definition of “accelerated filer and large accelerated filer” in Rule 12b-2 of the Exchange Act. (Check one):
Large accelerated filer x Accelerated filer ¨ Non-accelerated filer ¨
Indicate by check mark which basis of accounting the registrant has used to prepare the financial statements included in this filing:
US GAAP ¨International Financial Reporting Standards as issued by the International Accounting Standards Board xOther¨
US GAAP ¨ | International Financial Reporting Standards as issued by the International Accounting Standards Board x | Other¨ |
If “Other” has been checked in response to the previous question indicate by check mark which financial statement item the registrant has elected to follow.
Item 17 ¨ Item 18 ¨
If this is an annual report, indicate by check mark whether the registrant is a shell company (as defined in Rule 12b-2 of the Exchange Act).
Yes ¨ No x
Indicate the number of outstanding shares of each of the issuer’s classes of capital stock or common stock as of the close
of business covered by the annual report.
9,076,853,400 11,561,067,147 shares
BANCO SANTANDER, S.A.
| Page | ||||||
| 5 | ||||||
| 6 | ||||||
PRESENTATION OF FINANCIAL AND OTHER INFORMATION
Accounting Principles
Under Regulation (EC) No. 1606/2002 of the European Parliament and of the Council of July 19, 2002, all companies governed by the law of an EU Member State and whose securities are admitted to trading on a regulated market of any Member State must prepare their consolidated financial statements in conformity with the International Financial Reporting Standards previously adopted by the European Union (“EU-IFRS”). The Bank of Spain Circular 4/2004 of December 22, 2004 on Public and Confidential Financial Reporting Rules and Formats (“Circular 4/2004”) requires Spanish credit institutions to adapt their accounting systems to the principles derived from the adoption by the European Union of International Financial Reporting Standards. Therefore, Grupo Santander (“the Group” or “Santander”) is required to prepare its consolidated financial statements for the year ended December 31, 20112013 in conformity with the EU-IFRS and Bank of Spain’s Circular 4/2004. Differences between EU-IFRS, Bank of Spain’s Circular 4/2004 and International Financial Reporting Standards as issued by the International Accounting Standard Board (IFRS-IASB) are not material. Therefore, we assert that the financial information contained in this annual report on Form 20-F complies with IFRS-IASB.
We have formatted our financial information according to the classification format for banks used in Spain. We have not reclassified the line items to comply with Article 9 of Regulation S-X.S-X (see Note 55 of our consolidated financial statements). Article 9 is a regulation of the US Securities and Exchange Commission that contains formatting requirements for bank holding company financial statements.
Our auditors, Deloitte, S.L., an independent registered public accounting firm, have audited our consolidated financial statements in respect of the three years ended December 31, 2011, 20102013, 2012 and 20092011 in accordance with IFRS-IASB. See page F-1 to our consolidated financial statements for the 2011, 20102013, 2012 and 20092011 report prepared by Deloitte, S.L.
General Information
Our consolidated financial statements are in Euros, which are denoted “euro”, “euros”, “EUR” or “€” throughout this annual report. Also, throughout this annual report, when we refer to:
“dollars”, “US$” or “$”, we mean United States dollars;
“pounds” or “£”, we mean United Kingdom pounds; and
“one billion”, we mean 1,000 million.
When we refer to “average balances” for a particular period, we mean the average of the month-end balances for that period, unless otherwise noted. We do not believe that monthly averages present trends that are materially different from trends that daily averages would show. In calculating our interest income, we include any interest payments we received on non-accruing loans if they were received in the period when due. We have not reflected consolidation adjustments in any financial information about our subsidiaries or other business units.
When we refer to “loans”, we mean loans, leases, discounted bills and accounts receivable, unless otherwise noted. The loan to value “LTV” ratios disclosed in this report refer to LTV ratios upon origination unless otherwise noted. Additionally, if a debtloan is approaching a doubtful status, we update the appraisals which are then used to estimate allowances for loan losses.
When we refer to “impaired balances” or “non-performing balances”, we mean impaired or non-performing loans and contingent liabilities (“NPL”), securities and other assets to collect.
When we refer to “allowances for credit losses”, we mean the specific allowances for credit losses, and unless otherwise noted, the collectively assessed allowance for credit losses and any allowances for country-risk. See “Item 4. Information on the Company—B. Business Overview—Classified Assets—Allowances for Credit Losses and Country-Risk Requirements”.
Where a translation of foreign exchange is given for any financial data, we use the exchange rates of the relevant period (as of the end of such period for balance sheet data and the average exchange rate of such period for income statement data) as published by the European Central Bank, unless otherwise noted.
Management makes use of certain financial measures in local currency to help in the assessment of on-going operating performance. These non-GAAP financial measures include the results of operations of our subsidiary banks located outside the eurozone, excluding the impact of foreign exchange. We analyze these banks’ performance on a local currency basis to better measure the comparability of results between periods. Because changes in foreign currency exchange rates have a non-operating impact on the results of operations, we believe that evaluating their performance on a local currency basis provides an additional and meaningful assessment of performance to both management and the company’s investors. For a discussion of the accounting principles used in translation of foreign currency-denominated assets and liabilities to euros, see Note 2(a) of our consolidated financial statements.
4
CAUTIONARY STATEMENT REGARDING FORWARD-LOOKING STATEMENTS
This annual report contains statements that constitute “forward-looking statements” within the meaning of the US Private Securities Litigation Reform Act of 1995. Forward-looking statements include, but are not limited to, information regarding:
exposure to various types of market risks;
management strategy;
capital expenditures;
earnings and other targets; and
asset portfolios.
Forward-looking statements may be identified by words such as “expect,” “project,” “anticipate,” “should,” “intend,” “probability,” “risk,” “VaR,” “RORAC,” “target,” “goal,” “objective,” “estimate,” “future” and similar expressions. We include forward-looking statements in the “Operating and Financial Review and Prospects,” “Information on the Company,” and “Quantitative and Qualitative Disclosures About Market Risk”Risks” sections. Forward-looking statements are not guarantees of future performance and involve risks and uncertainties, and actual results may differ materially from those in the forward-looking statements.
You should understand that adverse changes in the following important factors, in addition to those discussed in “Key Information—Risk Factors”, “Operating and Financial Review and Prospects,” “Information on the Company” and elsewhere in this annual report, could affect our future results and could cause those results or other outcomes to differ materially from those anticipated in any forward-looking statement:
Economic and Industry Conditions
exposure to various types of market risks, principally including interest rate risk, foreign exchange rate risk and equity price risk;
general economic or industry conditions in Spain, the United Kingdom,U.K., the United States,U.S., other European countries, Brazil, other Latin American countries and the other areas in which we have significant business activities or investments;
a default on, or a ratings downgrade of, the sovereign debt of Spain, and the other countries where we operate;
a worsening of the economic environment in the United Kingdom,U.K., other European countries, Brazil, other Latin American countries, and the United States,U.S., and an increase of the volatility in the capital markets;
a further deterioration of the Spanish economy;
monetary and interest rate policies of the European Central Bank and various central banks;
inflation or deflation;
the effects of non-linear market behavior that cannot be captured by linear statistical models, such as the VaR model we use;
changes in competition and pricing environments;
the inability to hedge some risks economically;
the adequacy of loss reserves;
acquisitions or restructurings of businesses that may not perform in accordance with our expectations;
changes in demographics, consumer spending, investment or saving habits; and
changes in competition and pricing environments as a result of the progressive adoption of the internet for conducting financial services and/or other factors.
5
Political and Governmental Factors
political stability in Spain, the United Kingdom, other European countries, Latin America and the US;
changes in Spanish, UK, EU,U.K., E.U., Latin American, USU.S. or other jurisdictions’ laws, regulations or taxes;taxes, including changes in regulatory capital and
increased regulation in light of the global financial crisis.
Transaction and Commercial Factors
damage to our reputation;
our ability to integrate successfully our acquisitions and the challenges inherent in diverting management’s focus and resources from other strategic opportunities and from operational matters while we integrate these acquisitions; and
the outcome of our negotiations with business partners and governments.
Operating Factors
potential losses associated with an increase in the level of substandard loans ornon-performance by counterparties to other types of financial instruments.
technical difficulties and the development and use of new technologies by us and our competitors;
the impact of changes in the composition of our balance sheet on future net interest income.
The forward-looking statements contained in this annual report speak only as of the date of this annual report. We do not undertake to update any forward-looking statement to reflect events or circumstances after that date or to reflect the occurrence of unanticipated events.
6
Item 1. Identity of Directors, Senior Management and Advisers
A. Directors and Senior Management
Not applicable.
B. Advisers
Not applicable.
C. AuditorAuditors
Not applicable.
Item 2. Offer Statistics and Expected Timetable
A. Offer Statistics
Not applicable.
B. Method and Expected Timetable
Not applicable.
Selected Consolidated Financial Information
We have selected the following financial information from our consolidated financial statements. You should read this information in connection with, and it is qualified in its entirety by reference to, our consolidated financial statements.
In the F-pages of this annual report on Form 20-F, the audited financial statements for the years 2011, 20102013, 2012 and 20092011 are presented. The audited financial statements for 20082010 and 20072009 are not included in this document, but they can be found in our previous annual reports on Form 20-F.
In August 2013, we filed with the SEC a Form 6-K in which we recasted our audited financial statements included in our annual report on Form 20-F for the fiscal year ended December 31, 2012, as filed with the SEC on April 24, 2013 (the “2012 Form 20-F”) to reflect the change in International Accounting Standard 19 (“IAS 19”). IAS 19 requires that for periods beginning on or after January 1, 2013 actuarial gains and losses be immediately recognized against shareholders’ equity, without the possibility for deferred recognition through the income statement, as it was done in 2012 and prior periods. In addition, that 6-K recasted disclosures in the 2012 Form 20-F to give retroactive effect to the application of IAS 19 and to certain changes to our reporting methods in 2013, including the following:
The impact of the change in IAS 19 as of December 31, 2012, 2011 and 2010 is as follows:
| Millions of euros | ||||||||||||
| 2012 | 2011 | 2010 | ||||||||||
Deferred tax assets | 1,185 | 694 | 378 | |||||||||
Other assets | (1,213 | ) | (1,211 | ) | (922 | ) | ||||||
|
|
|
|
|
| |||||||
Assets | (28 | ) | (517 | ) | (544 | ) | ||||||
|
|
|
|
|
| |||||||
Deferred tax liabilities | 254 | 208 | 199 | |||||||||
Provisions for pensions and similar obligations | (3,276 | ) | (1,737 | ) | (1,072 | ) | ||||||
|
|
|
|
|
| |||||||
Liabilities | (3,022 | ) | (1,529 | ) | (873 | ) | ||||||
|
|
|
|
|
| |||||||
Valuation adjustment | 2,884 | 1,933 | 1,412 | |||||||||
Non-controlling interests | 262 | 91 | 39 | |||||||||
|
|
|
|
|
| |||||||
Equity | 3,146 | 2,024 | 1,451 | |||||||||
|
|
|
|
|
| |||||||
Provisions (net) | (138 | ) | 26 | (49 | ) | |||||||
Income tax | 43 | (5 | ) | 16 | ||||||||
|
|
|
|
|
| |||||||
Consolidated profit for the year | (95 | ) | 21 | (33 | ) | |||||||
|
|
|
|
|
| |||||||
Of which: | ||||||||||||
Profit attributable to the Parent | (90 | ) | 21 | (31 | ) | |||||||
|
|
|
|
|
| |||||||
Profit attributable to non-controlling interest | (5 | ) | — | (2 | ) | |||||||
|
|
|
|
|
| |||||||
The other adjustments described above did not have a material impact on our financial statements.
The following selected financial information includes the IAS 19 adjustments for 2012, 2011, 2010 and 2009 while the impacts of the envisaged disposal of the Santander UK card business is only included in the 2012, 2011 and 2010 data.
Under IFRS-IASB, revenues and expenses of discontinued businesses (mainly, Santander UK card business that was formerly owned by GE) must be reclassified from each income statement line item to “Profit from discontinued operations”. Revenues and expenses from prior years are also required to be reclassified for comparison purposes to present the same businesses as discontinued operations. This change in presentation does not affect “Consolidated profit for the year” (see Note 37 to our consolidated financial statements). The impact of Santander UK card business reclassification in the balance sheets as of December 31, 2012, 2011 and 2010 is as follows:
| Millions of euros | ||||||||||||
| 2012 | 2011 | 2010 | ||||||||||
Loans and receivables - Loans and advances to customers | (1,370 | ) | (1,559 | ) | (1,649 | ) | ||||||
Non-current assets held for sale | 1,370 | 1,559 | 1,649 | |||||||||
|
|
|
|
|
| |||||||
Assets | — | — | — | |||||||||
|
|
|
|
|
| |||||||
The income statement for the year ended December 31, 2013 includes the results from Kredyt Bank S.A. after the merger in early 2013 of the subsidiaries in Poland of Banco Santander, S.A. and KBC Bank NV (BZ WBK S.A. and Kredyt Bank S.A.). In addition, the income statement for the year ended December, 31, 2011 reflects the impact of the consolidation of Bank Zachodni WBK, S.A. and the income statement for the year ended December, 31, 2009 reflects the impact of the consolidation of Banco Real, Alliance & Leicester, Bradford & Bingley’s branch network and retail deposits, Sovereign (Santander Bank) and other consumer businesses.
Interest and similar income Interest expense and similar charges Interest income / (charges) Income from equity instruments Income from companies accounted for using the equity method Fee and commission income Fee and commission expense Gains/losses on financial assets and liabilities (net) Exchange differences (net) Other operating income Other operating expenses Total income Administrative expenses Personnel expenses Other general administrative expenses Depreciation and amortization Provisions (net) Impairment losses on financial assets (net) Impairment losses on other assets (net) Gains/(losses) on disposal of assets not classified as non-current assets held for sale Gains/(losses) on non-current assets held for sale not classified as discontinued operations Operating profit/(loss) before tax Income tax Profit from continuing operations Profit/(loss) from discontinued operations (net) Consolidated profit for the year Profit attributable to the Parent Profit attributable to non-controlling interest Per share information: Average number of shares (thousands) (1) Basic earnings per share (euros) Basic earnings per share continuing operation (euros) Diluted earnings per share (euros) Diluted earnings per share continuing operation (euros) Remuneration paid (euros) (2) Remuneration paid (US$) (2) Year ended December 31, 2013 2012 2011 2010 2009 (in millions of euros, except percentages and per share data) 51,447 58,791 60,618 52,637 53,173 (25,512 ) (28,868 ) (30,024 ) (23,672 ) (26,874 ) 25,935 29,923 30,594 28,965 26,299 378 423 394 362 436 500 427 57 17 (1 ) 12,473 12,732 12,640 11,559 10,726 (2,712 ) (2,471 ) (2,232 ) (1,899 ) (1,646 ) 3,234 3,329 2,838 2,166 3,802 160 (189 ) (522 ) 441 444 5,903 6,693 8,050 8,190 7,929 (6,194 ) (6,583 ) (8,029 ) (8,089 ) (7,785 ) 39,677 44,284 43,790 41,712 40,204 (17,452 ) (17,801 ) (17,644 ) (16,073 ) (14,825 ) (10,069 ) (10,306 ) (10,305 ) (9,296 ) (8,451 ) (7,383 ) (7,495 ) (7,339 ) (6,777 ) (6,374 ) (2,391 ) (2,183 ) (2,098 ) (1,937 ) (1,596 ) (2,182 ) (1,478 ) (2,616 ) (1,067 ) (1,747 ) (11,227 ) (18,880 ) (11,794 ) (10,400 ) (11,578 ) (503 ) (508 ) (1,517 ) (286 ) (165 ) 2,152 906 1,846 351 1,565 (422 ) (757 ) (2,109 ) (290 ) (1,225 ) 7,652 3,583 7,858 12,010 10,633 (2,113 ) (590 ) (1,755 ) (2,910 ) (1,222 ) 5,539 2,993 6,103 9,100 9,411 (15 ) 70 15 35 31 5,524 3,063 6,118 9,135 9,442 4,370 2,295 5,330 8,212 8,970 1,154 768 788 923 472 10,836,111 9,766,689 8,892,033 8,686,522 8,554,224 0.40 0.23 0.60 0.94 1.05 0.40 0.22 0.60 0.94 1.04 0.40 0.23 0.60 0.94 1.04 0.40 0.22 0.60 0.94 1.04 0.60 0.60 0.60 0.60 0.60 0.83 0.79 0.78 0.80 0.86
7
| Year ended December 31, | ||||||||||||||||||||
| 2011 | 2010 | 2009 | 2008 | 2007 | ||||||||||||||||
| (in millions of euros, except percentages and per share data) | ||||||||||||||||||||
Interest and similar income | 60,856 | 52,907 | 53,173 | 55,044 | 45,512 | |||||||||||||||
Interest expense and similar charges | (30,035 | ) | (23,683 | ) | (26,874 | ) | (37,506 | ) | (31,069 | ) | ||||||||||
Interest income / (charges) | 30,821 | 29,224 | 26,299 | 17,538 | 14,443 | |||||||||||||||
Income from equity instruments | 394 | 362 | 436 | 553 | 420 | |||||||||||||||
Income from companies accounted for using the equity method | 57 | 17 | (1 | ) | 792 | 438 | ||||||||||||||
Fee and commission income | 12,749 | 11,681 | 10,726 | 9,741 | 9,290 | |||||||||||||||
Fee and commission expense | (2,277 | ) | (1,946 | ) | (1,646 | ) | (1,475 | ) | (1,422 | ) | ||||||||||
Gains/losses on financial assets and liabilities (net) | 2,838 | 2,164 | 3,802 | 2,892 | 2,306 | |||||||||||||||
Exchange differences (net) | (522 | ) | 441 | 444 | 582 | 649 | ||||||||||||||
Other operating income | 8,050 | 8,195 | 7,929 | 9,436 | 6,740 | |||||||||||||||
Other operating expenses | (8,032 | ) | (8,089 | ) | (7,785 | ) | (9,163 | ) | (6,449 | ) | ||||||||||
Total income | 44,078 | 42,049 | 40,204 | 30,896 | 26,415 | |||||||||||||||
Administrative expenses | (17,781 | ) | (16,255 | ) | (14,825 | ) | (11,666 | ) | (10,777 | ) | ||||||||||
Personnel expenses | (10,326 | ) | (9,329 | ) | (8,451 | ) | (6,813 | ) | (6,435 | ) | ||||||||||
Other general administrative expenses | (7,455 | ) | (6,926 | ) | (6,374 | ) | (4,853 | ) | (4,342 | ) | ||||||||||
Depreciation and amortization | (2,109 | ) | (1,940 | ) | (1,596 | ) | (1,240 | ) | (1,247 | ) | ||||||||||
Provisions (net) | (2,601 | ) | (1,133 | ) | (1,792 | ) | (1,641 | ) | (896 | ) | ||||||||||
Impairment losses on financial assets (net) | (11,868 | ) | (10,443 | ) | (11,578 | ) | (6,283 | ) | (3,430 | ) | ||||||||||
Impairment losses on other assets (net) | (1,517 | ) | (286 | ) | (165 | ) | (1,049 | ) | (1,548 | ) | ||||||||||
Gains/(losses) on disposal of assets not classified as non-current assets held for sale | 1,846 | 350 | 1,565 | 101 | 1,810 | |||||||||||||||
Gains/(losses) on non-current assets held for sale not classified as discontinued operations | (2,109 | ) | (290 | ) | (1,225 | ) | 1,731 | 643 | ||||||||||||
Operating profit/(loss) before tax | 7,939 | 12,052 | 10,588 | 10,849 | 10,970 | |||||||||||||||
Income tax | (1,776 | ) | (2,923 | ) | (1,207 | ) | (1,836 | ) | (2,322 | ) | ||||||||||
Profit from continuing operations | 6,163 | 9,129 | 9,381 | 9,013 | 8,648 | |||||||||||||||
Profit/(loss) from discontinued operations (net) | (24 | ) | (27 | ) | 31 | 319 | 988 | |||||||||||||
Consolidated profit for the year | 6,139 | 9,102 | 9,412 | 9,332 | 9,636 | |||||||||||||||
Profit attributable to the Parent | 5,351 | 8,181 | 8,942 | 8,876 | 9,060 | |||||||||||||||
Profit attributable to non-controlling interest | 788 | 921 | 470 | 456 | 576 | |||||||||||||||
Per share information: | ||||||||||||||||||||
Average number of shares (thousands) (1) | 8,892,033 | 8,686,522 | 8,554,224 | 7,271,470 | 6,801,899 | |||||||||||||||
Basic earnings per share (euros) | 0.60 | 0.94 | 1.05 | 1.22 | 1.33 | |||||||||||||||
Basic earnings per share continuing operation (euros) | 0.60 | 0.94 | 1.04 | 1.18 | 1.20 | |||||||||||||||
Diluted earnings per share (euros) | 0.60 | 0.94 | 1.04 | 1.21 | 1.32 | |||||||||||||||
Diluted earnings per share continuing operation (euros) | 0.60 | 0.94 | 1.04 | 1.17 | 1.19 | |||||||||||||||
Remuneration paid (euros) (2) | 0.60 | 0.60 | 0.60 | 0.63 | 0.61 | |||||||||||||||
Remuneration paid (US$) (2) | 0.78 | 0.80 | 0.86 | 0.88 | 0.89 | |||||||||||||||
8
| Year ended December 31, | Year ended December 31, | |||||||||||||||||||||||||||||||||||||||
| 2011 | 2010 | 2009 | 2008 | 2007 | 2013 | 2012 | 2011 | 2010 | 2009 | |||||||||||||||||||||||||||||||
| (in millions of euros, except percentages and per share data) | (in millions of euros, except percentages and per share data) | |||||||||||||||||||||||||||||||||||||||
Total assets | 1,251,526 | 1,217,501 | 1,110,529 | 1,049,632 | 912,915 | 1,115,638 | 1,269,600 | 1,251,009 | 1,216,956 | 1,110,399 | ||||||||||||||||||||||||||||||
Loans and advances to credit institutions (net) (3) | 51,726 | 79,855 | 79,837 | 78,792 | 57,643 | 74,964 | 73,900 | 51,726 | 79,855 | 79,837 | ||||||||||||||||||||||||||||||
Loans and advances to customers (net) (3) | 750,100 | 724,153 | 682,551 | 626,888 | 571,099 | 668,856 | 719,112 | 748,541 | 722,504 | 682,551 | ||||||||||||||||||||||||||||||
Investment securities (net) (4) | 154,015 | 174,258 | 173,990 | 124,673 | 132,035 | 142,234 | 152,066 | 154,015 | 174,258 | 173,990 | ||||||||||||||||||||||||||||||
Investments: Associates and joint venture | 4,155 | 273 | 164 | 1,323 | 15,689 | 5,536 | 4,454 | 4,155 | 273 | 164 | ||||||||||||||||||||||||||||||
Contingent liabilities (net) | 48,042 | 59,795 | 59,256 | 65,323 | 76,217 | |||||||||||||||||||||||||||||||||||
Contingent liabilities | 41,049 | 45,033 | 48,042 | 59,795 | 59,256 | |||||||||||||||||||||||||||||||||||
Liabilities | ||||||||||||||||||||||||||||||||||||||||
Deposits from central banks and credit institutions (5) | 143,138 | 140,112 | 142,091 | 129,877 | 112,897 | 109,397 | 152,966 | 143,138 | 140,112 | 142,091 | ||||||||||||||||||||||||||||||
Customer deposits (5) | 632,533 | 616,376 | 506,975 | 420,229 | 355,407 | 607,837 | 626,639 | 632,533 | 616,376 | 506,975 | ||||||||||||||||||||||||||||||
Debt securities (5) | 197,372 | 192,873 | 211,963 | 236,403 | 233,287 | 175,477 | 205,969 | 197,372 | 192,873 | 211,963 | ||||||||||||||||||||||||||||||
Capitalization | ||||||||||||||||||||||||||||||||||||||||
Guaranteed subordinated debt excluding preferred securities and preferred shares (6) | 6,619 | 10,934 | 13,867 | 15,748 | 16,742 | 4,603 | 5,207 | 6,619 | 10,934 | 13,867 | ||||||||||||||||||||||||||||||
Other subordinated debt | 10,477 | 12,189 | 15,193 | 14,452 | 11,667 | 7,483 | 8,291 | 10,477 | 12,189 | 15,193 | ||||||||||||||||||||||||||||||
Preferred securities (6) | 5,447 | 6,917 | 7,315 | 7,622 | 7,261 | 3,652 | 4,319 | 5,447 | 6,917 | 7,315 | ||||||||||||||||||||||||||||||
Preferred shares (6) | 449 | 435 | 430 | 1,051 | 523 | 401 | 421 | 449 | 435 | 430 | ||||||||||||||||||||||||||||||
Non-controlling interest (including net income of the period) | 6,445 | 5,897 | 5,203 | 2,415 | 2,358 | 9,314 | 9,415 | 6,354 | 5,860 | 5,165 | ||||||||||||||||||||||||||||||
Stockholders’ equity (7) | 76,414 | 75,018 | 68,667 | 57,587 | 55,200 | 70,588 | 71,860 | 74,460 | 73,637 | 67,276 | ||||||||||||||||||||||||||||||
Total capitalization | 105,851 | 111,390 | 110,675 | 98,875 | 93,751 | 96,041 | 99,514 | 103,806 | 109,971 | 109,245 | ||||||||||||||||||||||||||||||
Stockholders’ equity per share (7) | 8.59 | 8.64 | 8.03 | 7.92 | 8.12 | |||||||||||||||||||||||||||||||||||
Stockholders’ equity per average share (7) | 6.51 | 7.36 | 8.37 | 8.48 | 7.86 | |||||||||||||||||||||||||||||||||||
Stockholders’ equity per share at the year-end (7) | 6.23 | 6.96 | 8.36 | 8.84 | 8.18 | |||||||||||||||||||||||||||||||||||
Other managed funds | ||||||||||||||||||||||||||||||||||||||||
Mutual funds | 102,611 | 113,510 | 105,216 | 90,306 | 119,211 | 93,304 | 89,176 | 102,611 | 113,510 | 105,216 | ||||||||||||||||||||||||||||||
Pension funds | 9,645 | 10,965 | 11,310 | 11,128 | 11,952 | 10,879 | 10,076 | 9,645 | 10,965 | 11,310 | ||||||||||||||||||||||||||||||
Managed portfolio | 19,200 | 20,314 | 18,364 | 17,289 | 19,814 | 20,987 | 18,889 | 19,200 | 20,314 | 18,364 | ||||||||||||||||||||||||||||||
Total other managed funds | 131,456 | 144,789 | 134,890 | 118,723 | 150,977 | |||||||||||||||||||||||||||||||||||
Total other managed funds (8) | 125,170 | 118,141 | 131,456 | 144,789 | 134,890 | |||||||||||||||||||||||||||||||||||
Consolidated ratios | ||||||||||||||||||||||||||||||||||||||||
Profitability ratios: | ||||||||||||||||||||||||||||||||||||||||
Net yield (8) | 2.74 | % | 2.68 | % | 2.62 | % | 2.05 | % | 1.80 | % | ||||||||||||||||||||||||||||||
Net yield (9) | 2.31 | % | 2.51 | % | 2.72 | % | 2.66 | % | 2.62 | % | ||||||||||||||||||||||||||||||
Return on average total assets (ROA) | 0.50 | % | 0.76 | % | 0.86 | % | 1.00 | % | 1.10 | % | 0.45 | % | 0.24 | % | 0.50 | % | 0.77 | % | 0.86 | % | ||||||||||||||||||||
Return on average stockholders’ equity (ROE) | 7.14 | % | 11.80 | % | 13.90 | % | 17.07 | % | 21.91 | % | 6.10 | % | 2.91 | % | 7.12 | % | 11.75 | % | 14.37 | % | ||||||||||||||||||||
Capital ratio: | ||||||||||||||||||||||||||||||||||||||||
Average stockholders’ equity to average total assets | 6.10 | % | 5.82 | % | 5.85 | % | 5.55 | % | 4.71 | % | 5.90 | % | 5.65 | % | 5.88 | % | 5.87 | % | 5.68 | % | ||||||||||||||||||||
Ratio of earnings to fixed charges (9) | ||||||||||||||||||||||||||||||||||||||||
Ratio of earnings to fixed charges (10) | ||||||||||||||||||||||||||||||||||||||||
Excluding interest on deposits | 1.63 | % | 2.28 | % | 2.01 | % | 1.57 | % | 1.67 | % | 1.72 | % | 1.27 | % | 1.62 | % | 2.27 | % | 2.02 | % | ||||||||||||||||||||
Including interest on deposits | 1.27 | % | 1.52 | % | 1.40 | % | 1.27 | % | 1.35 | % | 1.30 | % | 1.11 | % | 1.26 | % | 1.52 | % | 1.41 | % | ||||||||||||||||||||
Credit quality data | ||||||||||||||||||||||||||||||||||||||||
Loans and advances to customers | ||||||||||||||||||||||||||||||||||||||||
Allowances for impaired balances including country risk and excluding contingent liabilities as a percentage of total gross loans | 2.46 | % | 2.65 | % | 2.55 | % | 1.95 | % | 1.50 | % | 3.59 | % | 3.41 | % | 2.45 | % | 2.63 | % | 2.55 | % | ||||||||||||||||||||
Impaired balances as a percentage of total gross loans | 4.07 | % | 3.75 | % | 3.43 | % | 2.19 | % | 1.05 | % | ||||||||||||||||||||||||||||||
Allowances for impaired balances as a percentage of impaired balances | 60.52 | % | 70.58 | % | 74.32 | % | 89.08 | % | 143.24 | % | ||||||||||||||||||||||||||||||
Impaired balances as a percentage of total gross loans (11) | 5.81 | % | 4.74 | % | 4.07 | % | 3.76 | % | 3.43 | % | ||||||||||||||||||||||||||||||
Allowances for impaired balances as a percentage of impaired balances (11) | 61.76 | % | 72.01 | % | 60.17 | % | 69.99 | % | 74.32 | % | ||||||||||||||||||||||||||||||
Net loan charge-offs as a percentage of total gross loans | 1.38 | % | 1.31 | % | 1.27 | % | 0.60 | % | 0.46 | % | 1.38 | % | 1.36 | % | 1.39 | % | 1.31 | % | 1.27 | % | ||||||||||||||||||||
Ratios adding contingent liabilities to loans and advances to customers and excluding country risk (*) | ||||||||||||||||||||||||||||||||||||||||
Allowances for impaired balances (**) as a percentage of total loans and contingent liabilities | 2.39 | % | 2.58 | % | 2.44 | % | 1.83 | % | 1.42 | % | 3.48 | % | 3.29 | % | 2.38 | % | 2.56 | % | 2.44 | % | ||||||||||||||||||||
Impaired balances (**) (10) as a percentage of total loans and contingent liabilities | 3.89 | % | 3.55 | % | 3.24 | % | 2.02 | % | 0.94 | % | ||||||||||||||||||||||||||||||
Allowances for impaired balances (**) as a percentage of impaired balances (**) | 61.37 | % | 72.74 | % | 75.33 | % | 90.64 | % | 150.55 | % | ||||||||||||||||||||||||||||||
Impaired balances as a percentage of total loans and contingent liabilities (**) (11) | 5.64 | % | 4.54 | % | 3.90 | % | 3.54 | % | 3.24 | % | ||||||||||||||||||||||||||||||
Allowances for impaired balances as a percentage of impaired balances (**)(11) | 61.65 | % | 72.41 | % | 61.02 | % | 72.17 | % | 75.33 | % | ||||||||||||||||||||||||||||||
Net loan and contingent liabilities charge-offs as a percentage of total loans and contingent liabilities | 1.29 | % | 1.21 | % | 1.17 | % | 0.55 | % | 0.41 | % | 1.29 | % | 1.28 | % | 1.29 | % | 1.21 | % | 1.17 | % | ||||||||||||||||||||
| (*) | We disclose these ratios because our credit risk exposure comprises loans and advances to customers as well as contingent liabilities, all of which are subject to impairment and, therefore, allowances are taken in respect thereof. |
| (**) | Impaired or non-performing loans and contingent liabilities, securities and other assets to collect. |
9
| (1) | Average number of shares has been calculated on the basis of the weighted average number of shares outstanding in the relevant year, net of treasury stock. |
| (2) | The shareholders at the annual shareholders’ meeting held on June 19, 2009 approved a |
| (3) | Equals the sum of the amounts included under the headings “Financial assets held for trading”, “Other financial assets at fair value through profit or loss” and “Loans and receivables” as stated in our consolidated financial statements. |
| (4) | Equals the amounts included as “Debt instruments” and “Equity instruments” under the headings “Financial assets held for trading”, “Other financial assets at fair value through profit or loss”, “Available-for-sale financial assets” and “Loans and receivables” as stated in our consolidated financial statements. |
| (5) | Equals the sum of the amounts included under the headings “Financial liabilities held for trading”, “Other financial liabilities at fair value through profit or loss” and “Financial liabilities at amortized cost” included in Notes 20, 21 and 22 to our consolidated financial statements. |
| (6) | In our consolidated financial statements, preferred securities and preferred shares are included under “Subordinated liabilities”. |
| (7) | Equals the sum of the amounts included at the end of each year as “Own funds” and “Valuation adjustments” as stated in our consolidated financial statements. We have deducted the book value of treasury stock from stockholders’ equity. |
| (8) | At December 31, 2013 we held a 50% ownership interest in Santander Asset Management (SAM) and controlled this company jointly with Warburg Pincus and General Atlantic. Funds under “Other managed funds” are mostly managed by SAM. |
| (9) | Net yield is the total of net interest income (including dividends on equity securities) divided by average earning assets. See “Item 4. Information on the Company—B. Business Overview—Selected Statistical Information—Assets—Earning Assets—Yield Spread”. |
| For the purpose of calculating the ratio of earnings to fixed charges, earnings consist of pre-tax income from continuing operations before adjustment for income or loss from equity investees plus fixed charges. Fixed charges consist of total interest expense (including or excluding interest on deposits as appropriate) and the interest expense portion of rental expense. |
| Impaired loans reflect Bank of Spain classifications. These classifications differ from the classifications applied by U.S. banks in reporting loans as non-accrual, past due, restructured and potential problem loans. See “Item 4. Information on the Company—B. Business Overview—Classified Assets—Bank of |
10
Set forth below is a table showing our allowances for impaired balances broken down by various categories as disclosed and discussed throughout this annual report on Form 20-F:
| IFRS-IASB | ||||||||||||||||||||||||||||||||||||||||
| IFRS-IASB | Year Ended December 31, | |||||||||||||||||||||||||||||||||||||||
| Year Ended December 31, | 2013 | 2012 | 2011 | 2010 | 2009 | |||||||||||||||||||||||||||||||||||
| 2011 | 2010 | 2009 | 2008 | 2007 | (in millions of euros) | |||||||||||||||||||||||||||||||||||
Allowances refers to: | (in millions of euros) | |||||||||||||||||||||||||||||||||||||||
Allowances for impaired balances (*) (excluding country risk) | 19,661 | 20,748 | 18,497 | 12,863 | 9,302 | 25,681 | 26,112 | 19,531 | 20,553 | 18,497 | ||||||||||||||||||||||||||||||
Allowances for contingent liabilities and commitments (excluding country risk) | (648 | ) | (1,011 | ) | (623 | ) | (622 | ) | (587 | ) | ||||||||||||||||||||||||||||||
Less: Allowances for contingent liabilities and commitments (excluding country risk) | 688 | 614 | 648 | 1,011 | 623 | |||||||||||||||||||||||||||||||||||
|
|
|
|
|
|
|
|
|
| |||||||||||||||||||||||||||||||
Allowances for impaired balances of loans (excluding country risk): | 19,013 | 19,737 | 17,874 | 12,241 | 8,715 | |||||||||||||||||||||||||||||||||||
Allowances referred to country risk and other | 210 | 121 | 192 | 660 | 173 | |||||||||||||||||||||||||||||||||||
Allowances for Balances of Loans (excluding country risk): | 24,993 | 25,497 | 18,883 | 19,541 | 17,874 | |||||||||||||||||||||||||||||||||||
Allowances relating to country risk and other | 154 | 98 | 210 | 121 | 192 | |||||||||||||||||||||||||||||||||||
|
|
|
|
| ||||||||||||||||||||||||||||||||||||
|
|
|
|
| ||||||||||||||||||||||||||||||||||||
Allowances for impaired balances (excluding contingent liabilities) | 19,223 | 19,858 | 18,066 | 12,901 | 8,888 | 25,147 | 25,595 | 19,093 | 19,662 | 18,066 | ||||||||||||||||||||||||||||||
Of which: | ||||||||||||||||||||||||||||||||||||||||
Allowances for Loans and receivables: | 18,988 | 19,739 | 17,899 | 12,720 | 8,796 | 24,959 | 25,467 | 18,858 | 19,544 | 17,899 | ||||||||||||||||||||||||||||||
Allowances for Customers | 18,936 | 19,697 | 17,873 | 12,466 | 8,695 | 24,903 | 25,422 | 18,806 | 19,502 | 17,873 | ||||||||||||||||||||||||||||||
Allowances for Credit institutions and other financial assets | 36 | 17 | 26 | 254 | 101 | 37 | 30 | 36 | 17 | 26 | ||||||||||||||||||||||||||||||
Allowances for Debt Instruments | 16 | 25 | 0 | 0 | 0 | 19 | 15 | 16 | 25 | — | ||||||||||||||||||||||||||||||
Allowances for Debt Instruments available for sale | 235 | 119 | 167 | 181 | 92 | 188 | 129 | 235 | 119 | 167 | ||||||||||||||||||||||||||||||
| (*) | Impaired or non-performing loans and contingent liabilities, securities and other assets to collect. |
Exchange Rates
Fluctuations in the exchange rate between euros and dollars have affected the dollar equivalent of the share prices on Spanish stock exchanges and, as a result, are likely to affect the dollar market price of our American Depositary Shares, or ADSs, in the United States. In addition, dividends paid to the depositary of the ADSs are denominated in euros and fluctuations in the exchange rate affect the dollar conversion by the depositary of dividends paid on the shares to the holders of the ADSs. Fluctuations in the exchange rate of euros against other currencies may also affect the euro value of our non-euro denominated assets, liabilities, earnings and expenses.
The following tables set forth, for the periods and dates indicated, certain information concerning the exchange rate for euros and dollars (expressed in dollars per euro), based on the Noon Buying Rate as announced by the Federal Reserve Bank of New York for the dates and periods indicated.
The New York Federal Reserve Bank announced its decision to discontinue the publication of foreign exchange rates on December 31, 2008. From that date, the exchange rates shown below are those published by the European Central Bank (“ECB”), and are based on the daily consultation procedures between central banks within and outside the European System of Central Banks, which normally takes place at 14:15 p.m. ECBCET time.
| Rate During Period | Rate During Period | |||||||||||||||
| Calendar Period | Period End ($) | Average Rate ($) | Period End ($) | Average Rate ($) | ||||||||||||
2007 | 1.46 | 1.38 | ||||||||||||||
2008 | 1.39 | 1.47 | ||||||||||||||
2009 | 1.44 | 1.39 | 1.44 | 1.39 | ||||||||||||
2010 | 1.34 | 1.33 | 1.34 | 1.33 | ||||||||||||
2011 | 1.29 | 1.39 | 1.29 | 1.39 | ||||||||||||
2012 | 1.32 | 1.28 | ||||||||||||||
2013 | 1.38 | 1.33 | ||||||||||||||
11
| Rate During Period | Rate During Period | |||||||||||||||
| Last six months | High $ | Low $ | High $ | Low $ | ||||||||||||
2011 | ||||||||||||||||
2013 | ||||||||||||||||
October | 1.42 | 1.32 | 1.38 | 1.35 | ||||||||||||
November | 1.38 | 1.32 | 1.36 | 1.34 | ||||||||||||
December | 1.35 | 1.29 | 1.38 | 1.35 | ||||||||||||
2012 | ||||||||||||||||
2014 | ||||||||||||||||
January | 1.32 | 1.27 | 1.37 | 1.35 | ||||||||||||
February | 1.35 | 1.30 | 1.38 | 1.35 | ||||||||||||
March | 1.34 | 1.31 | 1.39 | 1.37 | ||||||||||||
April (through April 26) | 1.33 | 1.30 | ||||||||||||||
April (through April 28) | 1.39 | 1.37 | ||||||||||||||
On April 26, 2012,28, 2014, the exchange rate for euros and dollars (expressed in dollars per euro), as published by the ECB, was $1.32.$1.39.
For a discussion of the accounting principles used in translation of foreign currency-denominated assets and liabilities to euros, see Note 2 (a) ofto our consolidated financial statements.
B. Capitalization and indebtedness.
Not Applicable.
C. Reasons for the offer and use of proceeds.
Not Applicable.
Macro-Economic Risks
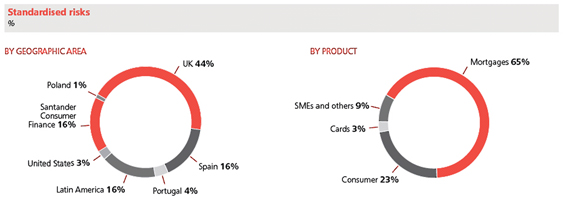
Because our loan portfolio is concentrated in Continental Europe, the United Kingdom and Latin America, adverse changes affecting the economies of Continental Europe, the United Kingdom or certain Latin American countries could adversely affect our financial condition.
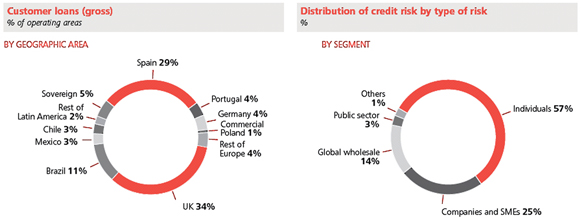
Our loan portfolio is concentrated in Continental Europe (in particular, Spain), the United Kingdom and Latin America. At December 31, 2011,2013, Continental Europe accounted for 42%40% of our total loan portfolio (Spain accounted for 29%24% of our total loan portfolio), while the United Kingdom (where the loan portfolio consists primarily of residential mortgages) and Latin America accounted for 34%35% and 19%20%, respectively. ContinuedAccordingly, the recoverability of these loan portfolios in particular, and our ability to increase the amount of loans outstanding and our results of operations and financial condition in general, are dependent to a significant extent on the level of economic activity in Continental Europe (in particular, Spain), the United Kingdom and Latin America. A return to recessionary economic conditions in the economies of Continental Europe (in particular, Spain), or a return to recessionary conditions in the United Kingdom or the Latin American countries in which we operate, would likely have a significant adverse impact on our loan portfolio and, as a result, on our financial condition, cash flows and results of operations. See “Item 4. Information on the Company—B. Business Overview.”Overview”.
SomeWe are vulnerable to disruptions and volatility in the global financial markets.
In the past six years, financial systems worldwide have experienced difficult credit and liquidity conditions and disruptions leading to less liquidity, greater volatility, general widening of spreads and, in some cases, lack of price transparency on interbank lending rates. Global economic conditions deteriorated significantly between 2007 and 2009, and many of the countries in which we operate fell into recession and some countries have only recently begun to recover and this recovery may not be sustainable. Many major financial institutions, including some of the world’s largest global commercial banks, investment banks, mortgage lenders, mortgage guarantors and insurance companies experienced, and some continue to experience, significant difficulties. Around the world, there have also been runs on deposits at several financial institutions, numerous institutions have sought additional capital or have been assisted by governments, and many lenders and institutional investors have reduced or ceased providing funding to borrowers (including to other financial institutions).
In particular, we face, among others, the following risks related to the economic downturn:
The level of income we derive from certain of our products and services dependsand limit our ability to pursue business opportunities.
Despite recent improvements in certain segments of the global economy, uncertainty remains concerning the future economic environment. There can be no assurance that economic conditions in these segments will continue to improve or that the global economic condition as a whole will improve significantly. Such economic uncertainty could have a negative impact on our business and results of operations. Investors remain cautious and the downgrade of the sovereign debt of France, for example, has induced greater volatility in the capital markets. A slowing or failing of the economic recovery would likely aggravate the adverse effects of these difficult economic and market conditions on us and on others in the financial services industry.
Increased disruption and volatility in the global financial markets could have a material adverse effect on us, including our ability to access capital and liquidity on financial terms acceptable to us, if at all. If capital markets financing ceases to become available, or becomes excessively expensive, we may be forced to raise the rates we pay on deposits to attract more customers and become unable to maintain certain liability maturities. Any such increase in capital markets funding availability or costs or in deposit rates could have a material adverse effect on our interest margins and liquidity.
If all or some of the foregoing risks were to materialize, this could have a material adverse effect on us.
We may suffer adverse effects as a result of the ongoing economic and sovereign debt tensions in the eurozone.
Our results of operations are materially affected by conditions in the capital markets and the economy generally in the eurozone, which, although improving recently, continue to show signs of fragility and volatility and in some cases only sporadic access to capital markets. Interest rate differentials among eurozone countries are affecting government finance and borrowing rates in those economies.
The European Central Bank (the “ECB”) and European Council took actions in 2012 and 2013 to aim to reduce the risk of contagion throughout and beyond the eurozone. These included the creation of the Open Market Transaction facility of the ECB and the decision by eurozone governments to create a banking union. A significant number of financial institutions throughout Europe have substantial exposures to sovereign debt issued by nations that are under financial pressure. Should any of those nations default on their debt, or experience a significant widening of credit spreads, major financial institutions and banking systems throughout Europe could be destabilized, resulting in the further spread of the ongoing economic crisis.
The continued high cost of capital for some European governments has impacted the wholesale markets and there has been a consequent increase in the cost of retail funding, with greater competition in a savings market that is growing slowly by historical standards. In the absence of a permanent resolution of the eurozone crisis, conditions could deteriorate.
We have direct and indirect exposure to financial and economic conditions throughout the eurozone economies. A deterioration of the economic and financial environment could have a material adverse impact on the whole financial sector, creating new challenges in sovereign and corporate lending and resulting in significant disruptions in financial activities at both the market and retail levels. This could materially and adversely affect our operating results, financial position and prospects.
Exposure to sovereign debt could have a material adverse effect on us.
Like many other banks, we invest in debt securities of governments in the geographies in which we operate, including debt securities of the countries that have been most affected by the deterioration in economic conditions, such as Spain, Portugal, Italy and Ireland. Although doubts remain about the solvency of certain countries, the implementation of new regulations by the European Banking Authority may have reduced the risk associated with the sovereign debt of such countries. A failure by any such government to make timely payments under the terms of these securities, or a significant decrease in their market value, could have a material adverse effect on us.
Our growth, asset quality and profitability in Latin America may be adversely affected by volatile macroeconomic and political conditions.
The economies of some of the Latin American countries where we operate experienced significant volatility in recent decades, characterized, in some cases, by slow or regressive growth, declining investment and hyperinflation. This volatility resulted in fluctuations in the levels of deposits and in the relative economic strength of various segments of the economies to which we lend.
Negative and fluctuating economic conditions, such as a changing interest rate environment, impact our profitability by causing lending margins to decrease and leading to decreased demand for higher margin products and services. Negative and fluctuating economic conditions in these Latin American regions could also result in government defaults on public debt. This could affect us in two ways: directly, through portfolio losses, and indirectly, through instabilities that a default in public debt could cause to the banking system as a whole, particularly since commercial banks’ exposure to government debt is high in these Latin American regions.
In addition, our revenues are subject to risk of loss from unfavorable political and diplomatic developments, social instability, and changes in governmental policies, including expropriation, nationalization, international ownership legislation, interest-rate caps and tax policies.
No assurance can be given that our growth, asset quality and profitability will not be affected by volatile macroeconomic and political conditions.
Risks Relating to Our Business
Legal, Regulatory and Compliance Risks
We are exposed to risk of loss from legal and regulatory proceedings.
We face risk of loss from legal and regulatory proceedings, including tax proceedings, that could subject us to monetary judgments, regulatory enforcement actions, fines and penalties. The current regulatory environment in the regions wherejurisdictions in which we operate reflects an increased supervisory focus on enforcement, combined with uncertainty about the evolution of the regulatory regime, and market trends prevailing in those regions. Customer loansmay lead to material operational and deposits, which collectively account for mostcompliance costs.
We are from time to time subject to certain claims and parties to certain legal proceedings incidental to the normal course of our earnings,business, including in connection with conflicts of interest, lending activities, relationships with our employees and other commercial or tax matters. In view of the inherent difficulty of predicting the outcome of legal matters, particularly where the claimants seek very large or indeterminate damages, or where the cases present novel legal theories, involve a large number of parties or are particularly sensitivein the early stages of discovery, we cannot state with confidence what the eventual outcome of these pending matters will be or what the eventual loss, fines or penalties related to economic conditions. In 2011, Continental Europe,each pending matter may be. We believe that we have made adequate reserves related to the costs anticipated to be incurred in connection with these various claims and legal proceedings. However, the amount of these provisions is substantially less than the total amount of the claims asserted against us and in light of the uncertainties involved in such claims and proceedings, there is no assurance that the ultimate resolution of these matters will not significantly exceed the reserves currently accrued by us. As a result, the outcome of a particular matter may be material to our operating results for a particular period, depending upon, among other factors, the size of the loss or liability imposed and our level of income for that period.
We are subject to substantial regulation which could adversely affect our business and operations.
As a financial institution, we are subject to extensive regulation, which materially affects our businesses. For example, we are subject to capital adequacy requirements which, among other things, require us to maintain minimum ratios of regulatory capital to risk-weighted assets. Any failure by us to comply with capital adequacy requirements may result in administrative actions or sanctions which may affect our ability to fulfill our obligations.
Statutes, regulations and policies to which we are subject, in particular those relating to the banking sector and financial institutions, may be changed at any time. For example, in response to the recent financial crisis, regulators world-wide have imposed, and may continue to impose, more stringent capital adequacy requirements, including increasing the minimum regulatory capital requirements imposed on us. Regulators world-wide have also produced a range of proposals for future legislative and regulatory changes which could force us to comply with certain operational restrictions or take steps to raise further capital, or could increase our expenses, or otherwise adversely affect our operating results, financial condition and prospects. The interpretation and the application by regulators of the laws and regulations to which we are subject may also change from time to time. Any legislative or regulatory actions and any required changes to our business operations resulting from such legislation and regulations could result in significant loss of revenue, limit our ability to pursue business opportunities in which we might otherwise consider engaging, affect the value of assets that we hold, require us to increase our prices and therefore reduce demand for our products, impose additional costs on us or otherwise adversely affect our businesses. Accordingly, there can be no assurance that future changes in regulations or in their interpretation or application will not adversely affect us.
Changes in regulations may also cause us to face increased compliance costs and limitations on our ability to pursue certain business opportunities and provide certain products and services. As some of the banking laws and regulations have been recently adopted, the manner in which those laws and related regulations are applied to the operations of financial institutions is still evolving. Moreover, to the extent these recently adopted regulations are implemented inconsistently in the various jurisdictions in which we operate, it may face higher compliance costs. No assurance can be given generally that laws or regulations will be adopted, enforced or interpreted in a manner that will not have a material adverse effect on our business and results of operations.
Extensive legislation affecting the financial services industry has recently been adopted in regions that directly or indirectly affect our business, including Spain, the United Kingdom,States, the European Union, Latin America and Sovereign (US) represented 31%, 12%, 51%other jurisdictions, and 6%, respectively,regulations are in the process of being implemented.
The European Union has created a European Systemic Risk Board to monitor financial stability and has implemented rules with the recommendations to increase capital requirements for certain trading instruments or exposures and to impose compensation limits on certain employees located in affected countries. In addition, the European Union Commission is considering a wide array of other initiatives, including new legislation that will affect derivatives trading, impose surcharges on “globally” systemically important firms and possibly impose new levies on bank balance sheets.
In December 2010, the Basel Committee on Banking Supervision (the “Basel Committee”) reached agreement on comprehensive changes to the capital adequacy framework, known as Basel III. A revised version of Basel III was published in June 2011. Basel III is intended to raise the resilience of the profit attributablebanking sector by increasing both the quality and quantity of the regulatory capital base and enhancing the risk coverage of the capital framework. Among other things, Basel III introduces new eligibility criteria for Common Equity Tier 1, Additional Tier 1 and Tier 2 capital instruments that are intended to raise the quality of regulatory capital, and increases the amount of regulatory capital that institutions are required to hold. Basel III also requires institutions to maintain a capital conservation buffer above the minimum capital ratios in order to avoid certain capital distribution constraints. The capital conservation buffer, to be comprised of Common Equity Tier 1 capital, would result in an effective Common Equity Tier 1 capital requirement of 7 percent of risk-weighted assets. In addition, Basel III directs national regulators to require certain institutions to maintain a counter-cyclical capital buffer during periods of excessive credit growth. Basel III introduces a leverage ratio for institutions as a backstop measure, to be applied from 2018 alongside current risk-based regulatory capital requirements. The changes in Basel III are intended to be phased in gradually between January 2013 and January 2022. The implementation of Basel III in the European Union is being performed through the Capital Requirements Directive IV (“CRD IV”) & Capital Requirements Regulation (“CRR”) legislative package. CRD IV was published in the Official Journal on June 27, 2013 entered into force in July 2013 (being CRR applicable from January 2014), with particular requirements being phased in over a period of time, to be effective by 2019, although requirements relating to certain deductions from Common Equity Tier 1 could be delayed until 2024. CRD IV substantially reflects the Basel III capital and liquidity standards and facilitates the applicable implementation timeframes. However, certain issues continue to remain under discussion and certain details remain to be clarified in further binding technical standards to be issued by the European Banking Authority.
In addition to the Group’s operating areaschanges to the capital adequacy framework published in December 2010 and June 2011 described above, the Basel Committee also published its global quantitative liquidity framework, comprising the Liquidity Coverage Ratio (“LCR”) and Net Stable Funding Ratio (“NSFR”) metrics, with objectives to (1) promote the short-term resilience of banks’ liquidity risk profiles by ensuring they have sufficient high-quality liquid assets to survive a significant stress scenario; and (2) promote resilience over a longer time horizon by creating incentives for banks to fund their activities with more stable sources of funding on an ongoing basis. The LCR has been subsequently revised by the Basel Committee in January 2013 which amended the definition of high-quality liquid assets and agreed a revised timetable for phase-in of the standard from 2015 to 2019, as well as making some technical changes to some of the stress scenario assumptions. As with the Basel Committee’s proposed changes to the capital adequacy framework, the Basel III liquidity standards are being implemented within the European Union through the CRD IV legislative package. In January 2014 the Basel Committee published amendments to the Leverage Ratio and technical revisions to the NSFR ratio, confirming that it remains the intention that the latter ratio, including any future revisions, will become a minimum standard by January 1, 2018. Also, in January 2014, the Basel Committee proposed uniform disclosure standards related to the LCR and issued a new modification to the ratio, which should be adopted by banks from January 1, 2015.
As a Spanish financial institution, the Bank is subject to CRD IV, through which the European Union has implemented the Basel III capital standards and which are in the process of being phased in until January 1, 2019. The CRR is applicable from January 1, 2014 and the CRD IV Directive has already been partially implemented in Spain as of January 1, 2014 by RD-L 14/2013. This Royal Decree-Law has repealed, with effect from January 1, 2014, any Spanish regulatory provisions that may be incompatible with CRR.
In addition to RD-L 14/2013, the Bank of Spain approved on January 31, 2014 its new Circular 2/2014, which derogates its previous Circular 7/2012, and makes certain regulatory determinations contained in CRR pursuant to the delegation contained in RD-L 14/2013, including, relevant rules concerning the applicable transitional regime on capital requirements and the treatment of deductions.
Despite the CRD IV/Basel III framework setting minimum transnational levels of regulatory capital and a measured phase-in, many national authorities have started a race to the top for capital by adopting requirements and interpretation calendars that are more stringent than Basel III’s.
For example, in the last three years the Bank of Spain and the European Banking Authority (the EBA) have imposed new capital requirements in advance of the entering into force of CRD IV. These measures have included Bank of Spain Circular 3/2008 (Circular 3/2008) of May 22, on the calculation and control of minimum capital requirements, which was amended by Bank of Spain Circular 4/2011 (Circular 4/2011) and implements Capital Requirements Directive III in Spain. In addition, some of the requirements of Basel III were already implemented by the Spanish Government in 2011 with Royal Decree-Law 2/2011 (RD-L 2/2011) of February 18 (as amended by Law 9/2012) which established a new minimum requirement in terms of capital on risk-weighted assets (Capital Principal) and required such capital to be greater than 9 per cent from January 1, 2013. RD-L 14/2013 specifically repealed, with effect from January 1, 2014, Title I of Royal Decree-Law 2/2011, which imposed the minimum Capital Principal requirement for credit institutions. Notwithstanding such repeal, as part of the assessment of additional capital requirements that could be required of credit institutions, the Bank of Spain has been given powers to stop or restrict, until December 31, 2014, any distributions of Tier 1 Capital which would have been caught by the minimum Capital Principal requirements stipulated in RD-L 2/2011, provided such distributions, accumulated over the year ended December 31, 2014, exceed in absolute terms the minimum Capital Principal legally required as at December 31, 2013 and further risk non-compliance with additional capital requirements that could be required by the Bank of Spain.
Furthermore, following an evaluation of the capital levels of 71 financial institutions throughout Europe (including the Bank) based on data available as of September 30, 2011, the EBA issued a recommendation on December 8, 2011 pursuant to which, on an exceptional and temporary basis, financial institutions based in the EU should reach a new minimum Core Tier 1 ratio (9 per cent.) by June 30, 2012. This recommendation has been replaced by the EBA recommendation of July 22, 2013 on the preservation of Core Tier 1 capital during the transition to CRD IV. This new recommendation provides for the year. However, manymaintenance of a nominal floor of capital denominated in the relevant reporting currency of Core Tier 1 capital corresponding to the amount of capital needed as at June 30, 2012 to meet the requirements of the economiesabove recommendation of Continental Europe, including SpainDecember 8, 2011. Competent authorities may waive this requirement for institutions which maintain a minimum of 7 per cent of common equity Tier 1 capital under CRD IV rules applied after the transitional period.
In addition, in order to complete the implementation of CRD IV initiated by RD-L 14/2013, the Spanish Ministry of Economy and Portugal, are forecastCompetitiveness has prepared and recently published a draft of a new comprehensive law on the supervision and solvency of financial institutions (the Supervision and Solvency Law), that has been already approved by the Spanish Council of Ministers and is being reviewed in order to have flatbe approved by the Spanish Parliament.
There can be no assurance that the implementation of these new standards will not adversely affect the Bank’s ability to pay dividends or weakening economies in 2012. If therequire it to issue additional securities that qualify as regulatory capital, to liquidate assets, to curtail business environment inor to take any other actions, any of our geographic segments does not improve or worsens, ourwhich may have adverse effects on the Bank’s business, financial condition and results of operations could be materially adversely affected.operations. Furthermore, increased capital requirements may negatively affect the Bank’s return on equity and other financial performance indicators.
Finally, in February 2014 the IMF recommended that the Bank of Spain limit the amount of dividends payable in cash in 2014 by Spanish banking institutions to Our business could be affected if our capital is not managed effectively or if changes limiting our abilitymanage our capital position are adopted.
Effective management of our capital position is important to our ability to operate our business, to continue to grow organically and to pursue our business strategy. However, in response to the recentglobal financial crisis, a number of changes to the regulatory capital framework have been adopted or are beingcontinue to be considered. For example, on December 16, 2010 and January 13, 2011, the Basel Committee on Banking Supervision issued its final guidance on a number of regulatory reforms to the regulatory capital framework in order to strengthen minimum capital requirements, including the phasing out of Innovative Tier 1 Capital instruments with incentives to redeem and implementing a leverage ratio on institutions in addition to current risk-based regulatory requirements. As these and other changes are implemented or future changes are considered or adopted that limit our ability to manage our balance sheet and capital resources effectively or to access funding on commercially acceptable terms, we may experience a material adverse effect on our financial condition and regulatory capital position.
In September 2011, the European Commission (the “Commission”) tabled a proposal for a common system of financial transactions taxes (“FTT”). Despite intense discussions on this proposal there was no unanimity amongst the 27 Member States. Eleven Member States (“participating Member States”) requested enhanced cooperation on a FTT based upon the Commission’s original proposal. The Commission presented a decision to this effect which was adopted by the EU’s Council of Finance Ministers at its committee meeting on January 22, 2013. The proposal of Directive was published on February 14, 2013, under which participating Member States may charge a FTT on all financial transactions where (i) at least one party to the transaction is established in the territory of a participating Member State and a financial institution established in the territory of a participating Member State is a party to the transaction acting either for its own account or for the account of another person, or is acting in the name of a party to the transaction or (ii) a financial institution is a party to a transaction with a financial instrument issued within the territory of a participating Member Estate. We are still assessing the proposals currently under discussion to determine the likely impact on Banco Santander and its affiliates.
The Spanish Government approved on February 3, 2012 the Royal Decree-Law 2/2012 and Law 8/2012, of October 20, 2012, on the clean-up of the financial sector (replacing Royal Decree-Law 18/2012, of May 11, 2012), through which the following actions were performed:
12
The Spanish Government also approved Law 9/2012, of November 14, 2012 which established a new regime on restructuring and resolution of credit institutions and a statutory loss absorbency regime applicable within the framework of restructuring and resolution processes, both based on the legislative proposal for a directive providing for the establishment of an European Union wide framework for the recovery and resolution of credit institutions and investment firms, the first draft of which (and the draft upon which Law 9/2012 was based) was published by the European Commission on June 6, 2012. In June 2012, a number of agreements were reached to reinforce the monetary union, including the definition of a broad roadmap towards a single banking and fiscal union. While support for a banking union in Europe is strong and significant advances have been made in terms of the development of a single-rule book through CRD IV, there is ongoing debate on the extent and pace of integration. On September 13, 2012, the European Parliament approved a proposal for the creation of the Single Supervisory Mechanism, so that 128 of the largest EU banks (including the Bank) will come under the ECB direct oversight from November 2014. The ECB comprehensive assessment includes a supervisory risk assessment, an asset quality review and a stress test to be conducted by national supervisors and the ECB in coordination with the EBA before the ECB becomes the single European bank supervisor in November 2014. The assessment is an important step in preparing the single supervisory mechanism and, more generally, towards bringing about greater transparency of the banks’ balance sheets and consistency of supervisory practices in Europe. The assessment started in November 2013 and will take 12 months to complete, ending in October 2014. The comprehensive assessment consists of three closely interlinked components:Reduced accessReview of the minimum provisioning percentages to be taken into consideration in the estimate of the impairment losses relating to financing granted to the property sector in Spain and to the foreclosed assets and assets received in payment of debt arising from financing granted to that sector, as a result of the impairment of these assets.Increase in the level of minimum capital requirements of Spanish credit institutions on the basis of the assets relating to the property sector in Spain presented on the balance sheet of each entity at December 31, 2012.a supervisory risk assessment – to review, quantitatively and qualitatively, key risks, including liquidity, leverage and funding;an asset quality review (AQR) – to enhance the transparency of bank exposures by reviewing the quality of banks’ assets, including the adequacy of asset and collateral valuation and related provisions;a stress test – to examine the resilience of banks’ balance sheets to stress scenarios.
The assessment will be based on a capital benchmark of 8% Common Equity Tier 1, drawing on the definition of the Capital Requirements Directive IV/Capital Requirements Regulation, including transitional arrangements, for both the AQR and the baseline stress test scenario.
Other open issues include the representation and voting power of non-eurozone countries, the accountability of the ECB to European institutions as part of the Single Supervision Mechanism, the final status of the EBA, the development of a new bank resolution regime and the creation of a common deposit-guarantee scheme. In particular, the Bank Recovery and Resolution Directive (BRRD) and the Deposit Guarantee Schemes Directive were submitted to the European Parliament in June 2013. They have been approved by the European Parliament on April 15, 2014 and approval by the European Council is expected in May 2014 for its official publication. The BRRD is expected to enter into force in 2015, but the bail-in tool will only be operational from 2016. The final regulation on direct recapitalization by the European Stability Mechanism is still pending. European leaders have also supported the reinforcement of the fiscal union but continue negotiating on how to achieve it.
Regulations adopted towards achieving a banking and/or increasesfiscal union in the EU and decisions adopted by the ECB in its future capacity as the Bank’s main supervisory authority may have a material impact on the Bank’s business, financial condition and results of operations.
On January 29, 2014, the European Commission, taking into account the October 2002 report by the High Level Expert Group chaired by Erkki Likannen on the reform of the structure of the EU Banking Sector, proposed new rules to prevent the largest and most complex EU banks with significant trading activities (including us) from engaging in the activity of proprietary trading in financial instruments and commodities. The new proposed regulation would also grant supervisors the power and, in certain instances, the obligation to require the transfer of other high-risk trading activities (such as market-making, complex derivatives and securitization operations) to separate legal trading entities within their group (“subsidiarisation”). Notwithstanding this, banks would have the possibility of not separating activities if they can show to the satisfaction of their supervisor that the risks generated are mitigated by other means. The proposal would also provide rules on the economic, legal, governance, and operational links between the separated trading entity and the rest of the banking group. Furthermore, the proposal is also aimed at increasing transparency of certain transactions in the shadow banking sector.
The European Parliament approved the following dossiers in April 2014 to develop a European Banking Union:
The Single Resolution Fund will be financed with contributions from all banks in the participating Member States. It will be administrated by the Board. The Fund has a target level, to be reached over eight years, of €55 billion and can borrow from the markets by order of the Board. During the transition, the Fund will be divided among national compartments whose resources will be progressively mutualized, starting with 40% of funds in the first year. The Fund and decision-making on its use is regulated by the SRM Regulation, while the transfer of contributions raised nationally towards the Single Fund and the mutualization of the national compartments is set out in an inter-governmental agreement established among the participating Member States.
Regulations adopted on structural measures to improve the resilience of EU credit institutions may have a material impact on the Bank’s business, financial condition and results of operations. These regulations, if adopted, may also cause the Group to invest significant management attention and resources to make any necessary changes.
In the United States, the Dodd-Frank Wall Street Reform and Consumer Protection Act (the “Dodd-Frank Act”) which was adopted in 2010 will continue to result in significant structural reforms affecting the financial services industry. This legislation provides for, among other things, the establishment of a Consumer Financial Protection Bureau with broad authority to regulate the credit, savings, payment and other consumer financial products and services that we offer, the creation of a structure to regulate systemically important financial companies, more comprehensive regulation of the over-the-counter derivatives market, prohibitions on engagement in certain proprietary trading activities and restrictions on ownership of, investment in or sponsorship of hedge funds and private equity funds, restrictions on the interchange fees earned through debit card transactions, and a requirement that bank regulators phase out the treatment of trust preferred capital instruments as Tier 1 capital for regulatory capital purposes.
With respect to OTC derivatives, the Dodd-Frank Act provides for an extensive framework for the regulation of OTC derivatives, including mandatory clearing, exchange trading and transaction reporting of certain OTC derivatives. Entities that are swap dealers, security-based swap dealers, major swap participants or major security-based swap participants are required to register with the CFTC or the SEC, or both, and are or will be subject to new capital, margin, business conduct, recordkeeping, clearing, execution, reporting and other requirements. Banco Santander, S.A. and Abbey National Treasury Services plc became provisionally registered as swap dealers with the CFTC on July 8, 2013 and November 4, 2013, respectively. In addition, we may register one more subsidiary as swap dealer with the CFTC.
In July 2013, the U.S. bank regulators issued the U.S. Basel III final rules implementing the Basel III capital framework for U.S. banks and bank holding companies and other U.S. capital reform. Certain aspects of the U.S. Basel III final rules, such as new minimum capital ratios and a revised methodology for calculating risk-weighted assets, will become effective on January 1, 2015. Other aspects of the U.S. Basel III final rules, such as the capital conservation buffer and the new regulatory deductions from and adjustments to capital, will be phased in over several years beginning on January 1, 2015.
In addition, the Board of Governors of the Federal Reserve System (the “Federal Reserve”) and other U.S. regulators issued for public comment in October 2013 a proposed rule that would introduce a quantitative liquidity coverage ratio requirement on certain large banks and bank holding companies. The proposed liquidity coverage ratio is broadly consistent with the Basel Committee’s revised Basel III liquidity rules, but is more stringent in several important respects. The Federal Reserve has also stated that it intends, through future rulemakings, to apply the Basel III liquidity coverage ratio and net stable funding ratio to the U.S. operations of some or all large foreign banking organizations (“FBOs”).
In February 2014, the Federal Reserve approved a final rule to enhance its supervision and regulation of the U.S. operations of FBOs such as us. Under the Federal Reserve’s rule, FBOs with $50 billion or more in U.S. assets held outside of their U.S. branches and agencies (“Large FBOs”), will be required to create a separately capitalized top-tier U.S. intermediate holding company (“IHC”) that will hold substantially all of the FBO’s U.S. bank and nonbank subsidiaries, such as Santander Bank, N.A. An IHC will be subject to U.S. risk-based and leverage capital, liquidity, risk management, stress testing and other enhanced prudential standards on a consolidated basis. Under the final rule, a Large FBO that is subject to the IHC requirement may request permission from the Federal Reserve to establish multiple IHCs or use an alternative organizational structure. The final rule also permits the Federal Reserve to apply the IHC requirement in a manner that takes into account the separate operations of multiple foreign banks that are owned by a single Large FBO. Although U.S. branches and agencies of a Large FBO will not be required to be held beneath an IHC, such branches and agencies will be subject to liquidity, and, in certain circumstances, asset maintenance requirements. Large FBOs generally will be required to establish IHCs and comply with the enhanced prudential standards beginning July 1, 2016. An IHC’s compliance with applicable U.S. leverage ratio requirements is generally delayed until January 1, 2018. FBOs that have $50 billion or more in non-branch/agency U.S. assets as of June 30, 2014 will be required to submit an implementation plan by January 1, 2015 on how the FBO will comply with the IHC requirement. Enhanced prudential standards will apply to our costtop-tier U.S.-based bank holding companies beginning on January 1, 2015 until we form or designate an IHC and the IHC becomes subject to corresponding enhanced prudential standards. The Federal Reserve has stated that it will issue, at a later date, final rules to implement certain other enhanced prudential standards under the Dodd-Frank Act for large bank holding companies and large FBOs, including single counterparty credit limits and an early remediation framework.
Within the Dodd-Frank Act, the Volcker Rule prohibits “banking entities” from engaging in certain forms of fundingproprietary trading or from sponsoring or investing in certain covered funds, in each case subject to certain limited exceptions. The Volcker Rule became effective on July 21, 2012 and on December 10, 2013, U.S. regulators issued final rules implementing the Volcker Rule. The final rules also limit the ability of banking entities and their affiliates to enter into certain transactions with such funds with which they or their affiliates have certain relationships. The final rules contain exclusions and certain exemptions for market-making, hedging, underwriting, trading in U.S. government and agency obligations as well as certain foreign government obligations, trading solely outside the United States, and also permits certain ownership interests in certain types of funds to be retained. The final rules implementing the Volcker Rule extended the period for all banking entities to conform to the Volcker Rule and implement a compliance program until July 21, 2015, and additional extensions are possible. Banking entities must bring their activities and investments into compliance with the requirements of the Volcker Rule by the end of the conformance period. We are assessing how the final rules implementing the Volcker Rule will affect our businesses and are developing and implementing plans to bring affected businesses into compliance.
Furthermore, Title I of the Dodd-Frank Act and the implementing regulations issued by the Federal Reserve and the Federal Deposit Insurance Corporation (“FDIC”) require each bank holding company with assets of $50 billion or more, including us, to prepare and submit annually a plan for the orderly resolution of our subsidiaries and operations that are domiciled in the United States in the event of future material financial distress or failure. The plan must include information on resolution strategy, major counterparties and interdependencies, among other things, and requires substantial effort, time and cost. We submitted our U.S. resolution plan in December 2013. The resolution plan is subject to review by the Federal Reserve Board and the FDIC.
Each of these aspects of the Dodd-Frank Act, as well as others, may directly and indirectly impact various aspects of our business. The full spectrum of risks that the Dodd-Frank Act, including the Volcker Rule, poses to us is not yet known, however, such risks could be material and we could be materially and adversely affected by them.
These and any additional legislative or regulatory actions in Spain, the European Union, the United States, the U.K., Latin America or other countries, and any required changes to our business operations resulting from such legislation and regulations, could result in reduced capital availability, significant loss of revenue, limit our ability to continue organic growth (including increased lending), pursue business opportunities in which we might otherwise consider engaging and provide certain products and services, affect the value of assets that we hold, require us to increase our prices and therefore reduce demand for our products, impose additional costs on us or otherwise adversely affect our businesses. Accordingly, we cannot provide assurance that any such new legislation or regulations would not have an adverse effect on our liquiditybusiness, results of operations or financial condition in the future.
We may also face increased compliance costs. As some of the banking laws and regulations have been recently adopted, the manner in which those laws and related regulations are applied to the operations of financial institutions is still evolving. Moreover, to the extent these recently adopted regulations are implemented inconsistently in the various jurisdictions in which we operate, we may face higher compliance costs. No assurance can be given generally that laws or regulations will be adopted, enforced or interpreted in a manner that will not have material adverse effect on our business and results of operations.
We may not be able to detect money laundering and other illegal or improper activities fully or on a timely basis, which could expose us to additional liability and could have a material adverse effect on us.
Historically,We are required to comply with applicable anti-money laundering, anti-terrorism and other laws and regulations in the jurisdictions in which we operate. These laws and regulations require us, among other things, to adopt and enforce “know-your-customer” policies and procedures and to report suspicious and large transactions to the applicable regulatory authorities. These laws and regulations have become increasingly complex and detailed, require improved systems and sophisticated monitoring and compliance personnel and have become the subject of enhanced government supervision.
While we have adopted policies and procedures aimed at detecting and preventing the use of our principalbanking network for money laundering and related activities, such policies and procedures may not completely eliminate instances where we may be used by other parties to engage in money laundering and other illegal or improper activities. To the extent we fail to fully comply with applicable laws and regulations, the relevant government agencies to which we report have the power and authority to impose fines and other penalties on us, including the revocation of licenses. In addition, our business and reputation could suffer if customers use our banking network for money laundering or illegal or improper purposes.
In addition, while we review our relevant counterparties’ internal policies and procedures with respect to such matters, we, to a large degree, rely upon our relevant counterparties to maintain and properly apply their own appropriate anti-money laundering procedures. Such measures, procedures and compliance may not be completely effective in preventing third parties from using our (and our relevant counterparties’) services as a conduit for money laundering (including illegal cash operations) without our (and our relevant counterparties’) knowledge. If we are associated with, or even accused of being associated with, or become a party to, money laundering, then our reputation could suffer and/or we could become subject to fines, sanctions and/or legal enforcement (including being added to any “black lists” that would prohibit certain parties from engaging in transactions with us), any one of which could have a material adverse effect on our operating results, financial condition and prospects.
Changes in taxes and other assessments may adversely affect us.
The legislatures and tax authorities in the tax jurisdictions in which we operate regularly enact reforms to the tax and other assessment regimes to which we and our customers are subject. Such reforms include changes in the rate of assessments and, occasionally, enactment of temporary taxes, the proceeds of which are earmarked for designated governmental purposes. The effects of these changes and any other changes that result from enactment of additional tax reforms cannot be quantified and there can be no assurance that any such reforms would not have an adverse effect upon our business.
Financial Reporting and Control Risks
Changes in accounting standards could impact reported earnings.
The accounting standard setters and other regulatory bodies periodically change the financial accounting and reporting standards that govern the preparation of our consolidated financial statements. These changes can materially impact how we record and report our financial condition and results of operations. In some cases, we could be required to apply a new or revised standard retroactively, resulting in the restatement of prior period financial statements.
Our financial statements are based in part on assumptions and estimates which, if inaccurate, could cause material misstatement of the results of our operations and financial position.
The preparation of financial statements requires management to make judgments, estimates and assumptions that affect the reported amounts of assets, liabilities, income and expenses. Due to the inherent uncertainty in making estimates, actual results reported in future periods may be based upon amounts which differ from those estimates. Estimates, judgments and assumptions are continually evaluated and are based on historical experience and other factors, including expectations of future events that are believed to be reasonable under the circumstances. Revisions to accounting estimates are recognized in the period in which the estimate is revised and in any future periods affected. The accounting policies deemed critical to our results and financial position, based upon materiality and significant judgments and estimates, include impairment of loans and advances, goodwill impairment, valuation of financial instruments, impairment of available-for-sale financial assets, deferred tax assets and provision for liabilities.
The valuation of financial instruments measured at fair value can be subjective, in particular where models are used which include unobservable inputs. Given the uncertainty and subjectivity associated with valuing such instruments it is possible that the results of our operations and financial position could be materially misstated if the estimates and assumptions used prove to be inaccurate.
If the judgment, estimates and assumptions we use in preparing our consolidated financial statements are subsequently found to be incorrect, there could be a material effect on our results of operations and a corresponding effect on our funding requirements and capital ratios.
The preparation of our tax returns requires the use of estimates and interpretations of complex tax laws and regulations and is subject to review by taxing authorities. We are subject to the income tax laws of Spain and certain foreign countries. These tax laws are complex and subject to different interpretations by the taxpayer and relevant governmental taxing authorities, which are sometimes subject to prolonged evaluation periods until a final resolution is reached. In establishing a provision for income tax expense and filing returns, we must make judgments and interpretations about the application of these inherently complex tax laws. If the judgment, estimates and assumptions we use in preparing our tax returns are subsequently found to be incorrect, there could be a material effect on our results of operations.
Disclosure controls and procedures over financial reporting may not prevent or detect all errors or acts of fraud.
Disclosure controls and procedures over financial reporting are designed to reasonably assure that information required to be disclosed by the company in reports filed or submitted under the Securities Exchange Act is accumulated and communicated to management, and recorded, processed, summarized and reported within the time periods specified in the SEC’s rules and forms.
These disclosure controls and procedures have inherent limitations which include the possibility that judgments in decision-making can be faulty and that breakdowns occur because of simple error or mistake. Additionally, controls can be circumvented by the individual acts of some persons, by collusion of two or more people or by any unauthorized override of the controls. Consequently, our businesses are exposed to risk from potential non-compliance with policies, employee misconduct or negligence and fraud, which could result in regulatory sanctions and serious reputational or financial harm. In recent years, a number of multinational financial institutions have suffered material losses due to the actions of ‘rogue traders’ or other employees. It is not always possible to deter employee misconduct and the precautions we take to prevent and detect this activity may not always be effective. Accordingly, because of the inherent limitations in the control system, misstatements due to error or fraud may occur and not be detected.
Liquidity and Financing Risks
Liquidity and funding risks are inherent in our business and could have a material adverse effect on us.
Liquidity risk is the risk that we either do not have available sufficient financial resources to meet our obligations as they fall due or can secure them only at excessive cost. This risk is inherent in any retail and commercial banking business and can be heightened by a number of enterprise-specific factors, including over-reliance on a particular source of fundsfunding, changes in credit ratings or market-wide phenomena such as market dislocation. While we implement liquidity management processes to seek to mitigate and control these risks, unforeseen systemic market factors in particular make it difficult to eliminate completely these risks. Adverse and continued constraints in the supply of liquidity, including inter-bank lending, has been customer deposits (demand, timeaffected and notice deposits). Total time deposits (including repurchase agreements) represented 52.5%, 53.0%may materially and 46.8%adversely affect the cost of total customer deposits atfunding our business, and extreme liquidity constraints may affect our current operations as well as limit growth possibilities.
Continued or worsening disruption and volatility in the endglobal financial markets could have a material adverse effect on our ability to access capital and liquidity on financial terms acceptable to us.
Our cost of 2011, 2010obtaining funding is directly related to prevailing market interest rates and 2009, respectively. Large-denomination time depositsto our credit spreads. Increases in interest rates and our credit spreads can significantly increase the cost of our funding. Changes in our credit spreads are market-driven, and may be influenced by market perceptions of our creditworthiness. Changes to interest rates and our credit spreads occur continuously and may be unpredictable and highly volatile.
If wholesale markets financing ceases to become available, or becomes excessively expensive, we may be forced to raise the rates we pay on deposits, with a less stable sourceview to attracting more customers, and/or to sell assets, potentially at depressed prices. The persistence or worsening of these adverse market conditions or an increase in base interest rates could have a material adverse effect on our ability to access liquidity and cost of funding (whether directly or indirectly).
We rely, and will continue to rely, primarily on commercial deposits than other type of deposits and, at December 31, 2011, 21.5% of total customer deposits were time deposits in amounts greater than $100,000.to fund lending activities. The ongoing availability of deposits as a sourcethis type of funding is sensitive to a variety of factors outside our control, such as general economic conditions and the confidence of retailcommercial depositors in the economy, in general, and the financial services industry in general, and in our creditworthiness, in particular, and the availability and extent of deposit guarantees, as well as competition between banks for deposits. InAny of these factors could significantly increase the eventamount of commercial deposit levels decrease,withdrawals in a short period of time, thereby reducing our ability to access commercial deposit funding on appropriate terms, or at all, in the future. If these circumstances were to arise, this could have a material adverse effect on our operating results, financial condition and prospects.
We anticipate that our customers will continue, in the near future, to make short-term deposits (particularly demand deposits and short-term time deposits), and we intend to maintain our emphasis on the use of banking deposits as a source of funds. The short-term nature of this funding source could cause liquidity problems for us in the future if deposits are not made in the volumes we expect or are not renewed. If a substantial number of our depositors withdraw their demand deposits or do not roll over their time deposits upon maturity, we may be forced to raise the rates we pay on deposits, with a view to attracting more customers, and/or to increase our reliance on capital markets financing, which may be more expensive or unavailable.materially and adversely affected.
We also fund our operations throughcannot assure you that in the capital markets by issuing long-term debt, by issuing promissory notes and commercial paperevent of a sudden or by obtaining bank loans or linesunexpected shortage of credit. The cost and availability of capital markets financing generally are dependent on our short-term and long-term credit ratings andfunds in the market’s perception of the risks inherent in European banks and Spain. Factors that are importantbanking system, we will be able to the determination of our credit ratings include the level and quality of our earnings, capital adequacy, liquidity, risk appetite and management, asset quality, business mix and actual and perceivedmaintain levels of government support. Banco Santander S.A.’s rating, together with thatfunding without incurring high funding costs, a reduction in the term of funding instruments or the other main Spanish banks, was downgraded by all three rating agencies in October 2011 and by Standard & Poor’s and Fitch in February 2012. Any further downgrade in our ratings would likely increase our borrowing costs andliquidation of certain assets. If this were to happen, we could limit our access to capital markets andbe materially adversely affect our commercial business. See “—affected.
Credit, market and liquidity risksrisk may have an adverse effect on our credit ratings and our cost of funds. Any reductiondowngrading in our credit rating would likely increase our cost of funding, require us to post additional collateral or take other actions under some of our derivative contracts and adversely affect our interest margins and results of operations.”
The effectsCredit ratings affect the cost and other terms upon which we are able to obtain funding. Rating agencies regularly evaluate us, and their ratings of our debt are based on a number of factors, including our financial strength and conditions affecting the financial services industry generally. In addition, due to the methodology of the widespread crisismain rating agencies, our credit rating is affected by the rating of Spanish sovereign debt. If Spain’s sovereign debt is downgraded, our credit rating would also likely be downgraded by an equivalent amount.
Any downgrade in investor confidenceour debt credit ratings would likely increase our borrowing costs and resulting liquidity crisis experienced in 2008 and early 2009, andrequire us to some extent in 2011, have resulted in increased costs of funding and limited access topost additional collateral or take other actions under some of our traditional sources of liquidity, such as domesticderivative contracts, and internationalcould limit our access to capital markets and adversely affect our commercial business. For example, a ratings downgrade could adversely affect our ability to sell or market certain of our products, engage in certain longer-term and derivatives transactions and retain our customers, particularly customers who need a minimum rating threshold in order to invest. In addition, under the interbank market, which has adversely affectedterms of certain of our derivative contracts, we may be required to maintain a minimum credit rating or terminate such contracts. Any of these results of operationsa ratings downgrade, in turn, could reduce our liquidity and financial condition. Further or continued reductions in our access to financing or increases in our cost of funding may make it harder and more expensive to obtain funding for our businesses. If our available funding is limited or we are forced to fund our operations at a higher cost, we may experience further adverse effects on our results of operations and financial condition.
The possibility of the moderate economic recovery returning to recessionary conditions or of turmoil or volatility in the financial markets would likely have an adverse effect on us, including our business,operating results and financial positioncondition.
Banco Santander, S.A.’s long-term debt is currently rated investment grade by the major rating agencies—Baa1 by Moody’s Investors Service España, S.A., BBB by Standard & Poor’s Ratings Services and resultsBBB+ by Fitch Ratings Ltd.— all of operations.
In 2011,which have stable outlook. During 2012, following downgrades of Spanish sovereign debt, all three agencies downgraded Banco Santander, S.A.’s rating together with that of the global economy beganother main Spanish banks, due to recover from the severe recessionary conditions of mid-2009,weaker-than-previously-anticipated macroeconomic and certain regions (such as Latin America, the US and the UK) experienced a moderate economic recovery. However, the sustainability of this partial recovery has been dependent on a number of factors that are not within our control, such as a return of jobfinancial environment in Spain with dimming growth and investmentprospects in the private sector, strengthening of housing salesnear term, depressed real estate market activity and construction and timing of the exit from government credit easing policies. In addition, the modest economic recovery that had been experienced in Continental Europe has been tempered by adverse financial conditions in Europe, triggered by high sovereign budget deficits, austerity measures and rising sovereign debt levels in Greece, Ireland, Italy and Portugal, and is projected to slow or, in some cases, reverse in 2012. We continue to face risks resulting from the aftermath of the severe recession and the uneven and fragile recovery. A slowing or failing of the economic recovery or a deterioration in the economy of Continental Europe, especially in Spain, could result in a return of some or all of the adverse effects of the earlier recessionary conditions.
Since the middle of 2007, there has been disruption and turmoil in financial markets around the world. Throughout many of our largest markets, including Spain, there have been dramatic declines in the housing market, with falling home prices and increasing foreclosures, high levels of unemployment and underemployment, and reduced earnings, or, in some cases, losses, for businesses across many industries, with reduced investments in growth.
13
This overall environment resulted in significant stress for the financial services industry, led to distress in credit markets, reduced liquidity for many types of financial assets, including loans and securities and caused concerns regarding the financial strength and adequacy of the capitalization of financial institutions. Some financial institutions around the world have failed, some have needed significant additional capital, and others have been forced to seek acquisition partners.
Concerned about the stability of the financial markets generally, the strength of counterparties and about their own capital and liquidity positions, many lenders and institutional investors reduced or ceased providing funding to borrowers. The resulting economic pressure on consumers and businesses and the lack of confidence in the financial markets exacerbated the state of economic distress and hampered, and to some extent continues to hamper, efforts to bring about sustained economic recovery. While certain segments of the global economy are currently experiencing a moderate recovery, we expect these conditions to continue to have an ongoing negative impact on our business and results of operations. A slowing or failing of the economic recovery would likely aggravate the adverse effects of these difficult economic and market conditions on us and on others in the financial services industry.
In an attempt to prevent the failure of the financial system, Spain, the United States and other European governments intervened on an unprecedented scale. In Spain, the government increased consumer deposit guarantees, made available a program to guarantee the debt of certain financial institutions, created a fund to purchase assets from financial institutions and the Spanish Ministry of Economy and Finance was authorized, on an exceptional basis and until December 31, 2009, to acquire, at the request of credit institutions resident in Spain, shares and other capital instruments (including preferred shares) issued by such institutions. Additionally, in 2009 the Spanish government created the Orderly Banking Restructuring Fund (FROB) to manage the restructuring processes of credit institutions and reinforce the equity of institutions undergoing integration. In the United States, the federal government took equity stakes in several financial institutions, implemented a program to guarantee the short-term and certain medium-term debt of financial institutions, increased consumer deposit guarantees, and brokered the acquisitions of certain struggling financial institutions, among other measures. In the United Kingdom, the government effectively nationalized some of the country’s largest banks, provided a preferred equity program open to all financial institutions and a program to guarantee short-term and certain medium-term debt of financial institutions, among other measures. For more information on recent regulatory changes, see “—Changes in the regulatory framework in the jurisdictions where we operate could adversely affect our business.”
Despite the extent of the aforementioned intervention, global investor confidence remains cautious. The economies of the United States, United Kingdom, Brazil and other Latin American countries grew during 2011, although, in most cases, still at a slow pace. Spain, however, continued to suffer from a recession. In addition, recent downgrades of the sovereign debt of Ireland, Greece, Portugal, Italy and Spain have caused volatilityheightened turbulence in the capital markets. Our exposureIn the fourth quarter of 2013 and first quarter of 2014 the three agencies revised our outlook from negative to stable reflecting the gradual improvement of the Spanish economy and the view that any further weakening of our credit profile was unlikely to be significant. In March 2014, Moody’s Investors Service upgraded our rating from Baa2 to Baa1 following the upgrade of Spain’s sovereign debt rating announced on February 21 along with the change of Greece, Portugal, Italythe outlook on Spain’s rating to positive from stable.
Santander UK’s long-term debt is currently rated investment grade by the major rating agencies: A2 with negative outlook by Moody’s Investors Service, A with negative outlook by Standard & Poor’s Ratings Services and SpainA with stable outlook by Fitch Ratings. All three agencies revised Santander UK’s ratings during 2012 following the downgrades of the Spanish sovereign debt and remained unchanged in 2013. Negative outlooks by Moody’s and Standard & Poor’s reflect the negative trend that they see for the U.K. banking industry.
We conduct substantially all of our material derivative activities through Banco Santander, S.A. and Santander UK. We estimate that as of December 31, 2011 was €0.1, €1.8, €0.72013, if all the rating agencies were to downgrade Banco Santander, S.A.’s long-term senior debt ratings by one notch we would be required to post up to €3 million in additional collateral pursuant to derivative and €39.3other financial contracts. A hypothetical two notch downgrade would result in a requirement to post up to €14 million in additional collateral. We estimate that as of December 31, 2013, if all the rating agencies were to downgrade Santander UK’s long-term credit ratings by one notch, and thereby trigger a short-term credit rating downgrade, this could result in contractual outflows from Santander UK’s total liquid assets of £7.6 billion respectively,of cash and we had no exposureadditional collateral that Santander UK would be required to post under the sovereign debtterms of Ireland.secured funding and derivatives contracts. A hypothetical two notch downgrade would result in an additional contractual outflow of £1.9 billion of cash and collateral under secured funding and derivatives contracts.
Risks
While certain potential impacts of these downgrades are contractual and ongoing concernsquantifiable, the full consequences of a credit rating downgrade are inherently uncertain, as they depend upon numerous dynamic, complex and inter-related factors and assumptions, including market conditions at the time of any downgrade, whether any downgrade of a firm’s long-term credit rating precipitates downgrades to its short-term credit rating, and assumptions about the debt crisis in Europepotential behaviors of various customers, investors and counterparties. Actual outflows could have a detrimental impact on the global economic recovery, sovereign and non-sovereign debt in these countriesbe higher or lower than this hypothetical example, depending upon certain factors including which credit rating agency downgrades our credit rating, any management or restructuring actions that could be taken to reduce cash outflows and the financial conditionpotential liquidity impact from loss of European financial institutions, including us,unsecured funding (such as from money market funds) or loss of secured funding capacity. Although, unsecured and international financial institutions with exposure tosecured funding stresses are included in our stress testing scenarios and a portion of our total liquid assets is held against these risks, it is still the region. Market and economic disruptions have affected, and may continue to affect, consumer confidence levels and spending, personal bankruptcy rates, levels of incurrence and default on consumer debt and residential mortgages, and housing prices, among other factors. There can be no assurancecase that the market disruptions in Europe, including the increased cost of funding for certain governments and financial institutions, will not continue, nor can there be any assurance that future assistance packages will be available or, even if provided, will be sufficient to stabilize the affected countries and markets in Europe or elsewhere. To the extent uncertainty regarding the European economic recovery continues to negatively impact consumer confidence and consumera credit factors, or should the EU enter a deep recession, our business and results of operations could be materially adversely affected.
Continued or worsening disruption and volatility in the global financial marketsrating downgrade could have a material adverse effect on Banco Santander, S.A., and/or its subsidiaries.
In addition, if we were required to cancel our abilityderivatives contracts with certain counterparties and were unable to access capital and liquidity on financial terms acceptable to us, if at all. If capital markets financing ceases to become available, or becomes excessively expensive, we mayreplace such contracts, our market risk profile could be forced to raisealtered.
In light of the rates we pay on deposits to attract more customers. Any such increase in capital markets funding costs or deposit rates would entail a repricing of loans, which would result in a reduction of volume, and may also have an adverse effect on our interest margins.
14
Risks concerning borrower credit quality and general economic conditions are inherent in our business.
Risks arising from changes in credit quality and the recoverability of loans and amounts due from counterparties are inherent in a wide range of our businesses. Adverse changes in the credit quality of our borrowers and counterparties or a general deterioration in Spanish, United Kingdom, Latin American, United States or global economic conditions, or arising from systemic risksdifficulties in the financial systems,services industry and the financial markets, there can be no assurance that the rating agencies will maintain the current ratings or outlooks. Failure to maintain favorable ratings and outlooks could reduce the recoverability and valueincrease our cost of our assets and require an increase in our level of allowances for credit losses. Deterioration in the economies in which we operate could reduce the profit margins for our banking and financial services businesses.
The financial problems faced by our customers could adversely affect us.
Market turmoil and economic recession, especially in Spain, the United Kingdom, the United States and certain Latin American countries, could materiallyfunding and adversely affect the liquidity, businesses and/or financial conditions of our borrowers,interest margins, which could in turn increase our non-performing loan (“NPL”) ratios, impair our loan and other financial assets and result in decreased demand for borrowings in general. The uneven global recovery from the recent market turmoil and economic recession and the possibility of renewed economic contraction in Continental Europe, combined with continued high unemployment and low consumer spending, could cause the value of assets collateralizing our secured loans, including homes and other real estate, to decline significantly, which could result in the impairment of the value of our loan assets. Accordingly, in 2011 we experienced an increase in our non-performing ratios and a deterioration in asset quality as compared to 2010. In addition, our customers may further significantly decrease their risk tolerance to non-deposit investments such as stocks, bonds and mutual funds, which would adversely affect our fee and commission income. Any of the conditions described above could have a material adverse effect on our business, financial conditionus.
Risk Management
Failure to successfully implement and results of operations.
We are exposed to risks faced by other financial institutions.
We routinely transact with counterparties in the financial services industry, including brokers and dealers, commercial banks, investment banks, mutual funds, hedge funds and other institutional clients. Defaults by, and even rumors or questions about the solvency of, certain financial institutions and the financial services industry generally have led to market-wide liquidity problems and could lead to losses or defaults by other institutions. Many of the routine transactions we enter into expose us to significant credit risk in the event of default by one of our significant counterparties. In 2011, the financial health of a number of European governments was shaken by the European sovereign debt crisis, contributing to volatility of the capital and credit markets, and the risk of contagion throughout and beyond the Eurozone remains, as a significant number of financial institutions throughout Europe have substantial exposures to sovereign debt issued by nations which are under considerable financial pressure. These liquidity concerns have had, and may continue to have, an adverse effect on interbank financial transactions in general. Should any of those nations default on their debt, or experience a significant widening of credit spreads, major financial institutions and banking systems throughout Europe could be destabilized. A default by a significant financial counterparty, or liquidity problems in the financial services industry generally, could have a material adverse effect on our business, financial condition and results of operations.
Our exposure to Spanish and UK real estate markets makes us more vulnerable to adverse developments in these markets.
Mortgage loans are one of our principal assets, comprising 52% of our loan portfolio as of December 31, 2011. As a result, we are highly exposed to developments in real estate markets, especially in Spain and the United Kingdom. In addition, we have exposure to a number of large real estate developers in Spain. From 2002 to 2007, demand for housing and mortgage financing in Spain increased significantly driven by, among other things, economic growth, declining unemployment rates, demographic and social trends, the desirability of Spain as a vacation destination and historically low interest rates in the Eurozone. The United Kingdom experienced an increase in housing and mortgage demand driven by, among other things, economic growth, declining unemployment rates, demographic trends and the increasing prominence of London as an international financial center. During late 2007, the housing market began to adjust in Spain and the United Kingdom as a result of excess supply (particularly in Spain) and higher interest rates. Since 2008, as economic growth stalled in Spain and the United Kingdom, persistent housing oversupply, decreased housing demand, rising unemployment, subdued earnings growth, greater pressure on disposable income, a decline in the availability of mortgage finance and the continued effect of global market volatility have caused home prices to decline, while mortgage delinquencies increased. As a result, our NPL ratio increased from 0.94% at December 31, 2007, to 2.02% at December 31, 2008, to 3.24% at December 31, 2009 and to 3.55% at December 31, 2010. At December 31, 2011, our NPL ratio was 3.89%. These trends, especially higher unemployment rates coupled with declining real estate prices, could have a material adverse impact on our mortgage payment delinquency rates, which in turn could have a material adverse effect on our business, financial condition and results of operations.
15
Portions of our loan portfolio are subject to risks relating to force majeure events and any such event could materially adversely affect our operating results.
Our financial and operating performance may be adversely affected by force majeure events, such as natural disasters, particularly in locations where a significant portion of our loan portfolio is composed of real estate loans. Natural disasters such as earthquakes and floods may cause widespread damage which could impair the asset quality of our loan portfolio and could have an adverse impact on the economy of the affected region.
We may generate lower revenues from brokerage and other commission—and fee—based businesses.
Market downturns have lead, and are likely to continue to lead, to a decline in the volume of transactions that we execute for our customers and, therefore, to a decline in our non-interest revenue. In addition, because the fees that we charge for managing our clients’ portfolios are in many cases based on the value or performance of those portfolios, a market downturn that reduces the value of our clients’ portfolios or increases the amount of withdrawals would reduce the revenues we receive from our asset management, private banking and custody businesses and adversely affect our results of operations.
Even in the absence of a market downturn, below-market performance by our mutual funds may result in increased withdrawals and reduced inflows, which would reduce the revenue we receive from our asset management business and adversely affect our results of operations.
Market risks associated with fluctuations in bond and equity prices and other market factors are inherent in our business. Protracted market declines can reduce liquidity in the markets, making it harder to sell assets and leading to material losses.
The performance of financial markets may cause changes in the value of our investment and trading portfolios. In some of our businesses, protracted adverse market movements, particularly asset price declines, can reduce the level of activity in the market, reducing market liquidity. These developments can lead to material losses if we cannot close out deteriorating positions in a timely way. This risk is especially great for assets with normally less liquid markets. Assets that are not traded on stock exchanges or other public trading markets, such as derivative contracts between banks, may have values that we calculate using models other than publicly quoted prices. Monitoring the deterioration of prices of assets like these is difficult and could lead to losses that we did not anticipate.
The volatility of world equity markets due to the continued economic uncertainty and sovereign debt crisis has had a particularly strong impact on the financial sector. Continued volatility may affect the value of our investments in entities in this sector and, depending on their fair value and future recovery expectations, could become a permanent impairment which would be subject to write-offs against our results.
Volatility in interest rates may negatively affect our net interest income and increase our non-performing loan portfolio.
Changes in market interest rates could affect the interest rates charged on our interest-earning assets differently than the interest rates paid on our interest-bearing liabilities. This difference could result in an increase in interest expense relative to interest income leading to a reduction in our net interest income. Income from treasury operations is particularly vulnerable to interest rate volatility. Because the majority of our loan portfolio reprices in less than one year, rising interest rates may also lead to an increasing non-performing loan portfolio. Interest rates are highly sensitive to many factors beyond our control, including deregulation of the financial sector, monetary policies, domestic and international economic and political conditions and other factors.
As of December 31, 2011, our interest rate risk measured in daily Value at Risk (“VaRD”) terms amounted to €328.5 million.
Foreign exchange rate fluctuations may negatively affect our earnings and the value of our assets and shares.
Fluctuations in the exchange rate between the euro and the US dollar will affect the US dollar equivalent of the price of our securities on the stock exchanges in which our shares and ADSs are traded. These fluctuations will also affect the conversion to US dollars of cash dividends paid in euros on our ADSs.
In the ordinary course of our business, we have a percentage of our assets and liabilities denominated in currencies other than the euro. Fluctuations in the value of the euro against other currencies may adversely affect our profitability. For example, the appreciation of the euro against some Latin American currencies and the US dollar will depress earnings from our Latin American and US operations, and the appreciation of the euro against the sterling will depress earnings from our UK operations. Additionally, while most of the governments of the countries in which we operate have not imposed material prohibitions on the repatriation of dividends, capital investment or other distributions, no assurance can be given that these governments will not institute restrictive exchange control policies in the future. Moreover, fluctuations among the currencies in which our shares and ADSs trade could reduce the value of your investment.
16
As of December 31, 2011, our largest exposures on temporary positions (with a potential impact on the income statement) were concentrated on, in descending order, the pound sterling, the Mexican peso, the Chilean peso the Polish zloty (PLN) and the US dollar. At December 31, 2011, our largest exposures on permanent positions (with a potential impact on equity) were concentrated on, in descending order, the Brazilian real, the pound sterling, the US dollar, the Mexican peso, and the Polish zloty.
Despiteimprove our risk management policies, procedures and methods, including our credit risk management system, could materially and adversely affect us, and we may nonetheless be exposed to unidentified or unanticipated risks.
OurThe management of risk managementis an integral part of our activities. We seek to monitor and manage our risk exposure through a variety of separate but complementary financial, credit, market, operational, compliance and legal reporting systems. While we employ a broad and diversified set of risk monitoring and risk mitigation techniques, such techniques and strategies may not be fully effective in mitigating our risk exposure in all economic market environments or against all types of risk, including risks that we fail to identify or anticipate.
Some of our qualitative tools and metrics for managing risk are based upon our use of observed historical market behavior. We apply statistical and other tools to these observations to arrive at quantifications of our risk exposures. These qualitative tools and metrics may fail to predict future risk exposures. These risk exposures could, for example, arise from factors we did not anticipate or correctly evaluate in our statistical models. This would limit our ability to manage our risks. Our losses thus could be significantly greater than the historical measures indicate. In addition, our quantified modeling does not take all risks into account. Our more qualitative approach to managing those risks could prove insufficient, exposing us to material unanticipated losses. If existing or potential customers believe our risk management is inadequate, they could take their business elsewhere. This could harmhave a material adverse effect on our reputation as well asoperating results, financial condition and prospects.
As a commercial bank, one of the main types of risks inherent in our revenuesbusiness is credit risk. For example, an important feature of our credit risk management system is to employ an internal credit rating system to assess the particular risk profile of a customer. As this process involves detailed analyses of the customer, taking into account both quantitative and profits.qualitative factors, it is subject to human error. In exercising their judgment, our employees may not always be able to assign an accurate credit rating to a customer or credit risk, which may result in our exposure to higher credit risks than indicated by our risk rating system.
Our recentIn addition, we have been trying to refine our credit policies and future acquisitionsguidelines to address potential risks associated with particular industries or types of customers. However, we may not be successfulable to timely detect these risks before they occur, or due to limited tools available to us, our employees may not be able to effectively implement them, which may increase our credit risk. Failure to effectively implement, consistently follow or continuously refine our credit risk management system may result in an increase in the level of non-performing loans and may be disruptive to our business.a higher risk exposure for us, which could have a material adverse effect on us.
Credit Risks
We have acquired controlling interests in various companies and have engaged in other strategic partnerships. See “Item 4. Information on the Company—A. History and development of the Company.” Additionally, we may consider other strategic acquisitions and partnerships from time to time. WhileIf we are optimistic aboutunable to effectively control the acquisitions welevel of non-performing or poor credit quality loans in the future, or if our loan loss reserves are insufficient to cover future loan losses, this could have made, therea material adverse effect on us.
Risks arising from changes in credit quality and the recoverability of loans and amounts due from counterparties are inherent in a wide range of our businesses. Non-performing or low credit quality loans have in the past and can be no assurancescontinue to negatively impact our results of operations. We cannot assure you that we will be successfulable to effectively control the level of the impaired loans in our plans regardingtotal loan portfolio. In particular, the operationamount of our reported non-performing loans may increase in the future as a result of growth in our total loan portfolio, including as a result of loan portfolios that we may acquire in the future, or factors beyond our control, such as adverse changes in the credit quality of our borrowers and counterparties or a general deterioration in economic conditions in Continental Europe, the United Kingdom, Latin America, the United States or global economic conditions, impact of political events, events affecting certain industries or events affecting financial markets and global economies.
Our current loan loss reserves may not be adequate to cover any increase in the amount of non-performing loans or any future deterioration in the overall credit quality of our total loan portfolio. Our loan loss reserves are based on our current assessment of and expectations concerning various factors affecting the quality of our loan portfolio. These factors include, among other things, our borrowers’ financial condition, repayment abilities and repayment intentions, the realizable value of any collateral, the prospects for support from any guarantor, government macroeconomic policies, interest rates and the legal and regulatory environment. As the recent global financial crisis has demonstrated, many of these or other acquisitionsfactors are beyond our control. As a result, there is no precise method for predicting loan and strategic partnerships.
We can give no assurancecredit losses, and we cannot assure you that our recent and any future acquisition and partnership activitiesloan loss reserves will perform in accordance with our expectations. We basebe sufficient to cover actual losses. If our assessment of potential acquisitions and partnershipsexpectations concerning the above mentioned factors differ from actual developments, if the quality of our total loan portfolio deteriorates, for any reason, including the increase in lending to individuals and small and medium enterprises, the volume increase in the credit card portfolio and the introduction of new products, or if the future actual losses exceed our estimates of incurred losses, we may be required to increase our loan loss reserves, which may adversely affect us. If we were unable to control or reduce the level of our non-performing or poor credit quality loans, this could have a material adverse effect on limitedus.
Mortgage loans are one of our principal assets, comprising 53% of our loan portfolio as of December 31, 2013. As a result, we are exposed to developments in housing markets, especially in Spain and the United Kingdom. In addition, we have exposure to a number of large real estate developers in Spain. From 2002 to 2007, demand for housing and mortgage financing in Spain increased significantly driven by, among other things, economic growth, declining unemployment rates, demographic and social trends, the desirability of Spain as a vacation destination and historically low interest rates in the eurozone. The United Kingdom also experienced an increase in housing and mortgage demand driven by, among other things, economic growth, declining unemployment rates, demographic trends and the increasing prominence of London as an international financial center. During late 2007, the housing market began to adjust in Spain and the United Kingdom as a result of excess supply (particularly in Spain) and higher interest rates. Since 2008, as economic growth stalled in Spain and the United Kingdom, persistent housing oversupply, decreased housing demand, rising unemployment, subdued earnings growth, greater pressure on disposable income, a decline in the availability of mortgage finance and the continued effect of global market volatility have caused home prices to decline, while mortgage delinquencies increased. As a result of these and other factors, our NPL ratio increased from 0.94% at December 31, 2007, to 2.02% at December 31, 2008, to 3.24% at December 31, 2009, to 3.55% at December 31, 2010, to 3.89% at December 31, 2011 and to 4.54% at December 31, 2012. At December 31, 2013, our NPL ratio was 5.64%. These trends, especially higher unemployment rates coupled with declining real estate prices, could have a material adverse impact on our mortgage payment delinquency rates, which in turn could have a material adverse effect on our business, financial condition and results of operations.
Our loan and investment portfolios are subject to risk of prepayment, which could have a material adverse effect on us.
Our fixed rate loan and investment portfolios are subject to prepayment risk, which results from the ability of a borrower or issuer to pay a debt obligation prior to maturity. Generally, in a declining interest rate environment, prepayment activity increases, which reduces the weighted average lives of our earning assets and could have a material adverse effect on us. We would also be required to amortize net premiums into income over a shorter period of time, thereby reducing the corresponding asset yield and net interest income. Prepayment risk also has a significant adverse impact on credit card and collateralized mortgage loans, since prepayments could shorten the weighted average life of these assets, which may result in a mismatch in our funding obligations and reinvestment at lower yields. Prepayment risk is inherent to our commercial activity and an increase in prepayments could have a material adverse effect on us.
The value of the collateral securing our loans may not be sufficient, and we may be unable to realize the full value of the collateral securing our loan portfolio.
The value of the collateral securing our loan portfolio may fluctuate or decline due to factors beyond our control, including macroeconomic factors affecting Europe, the United States and Latin American countries. The value of the collateral securing our loan portfolio may be adversely affected by force majeure events, such as natural disasters, particularly in locations where a significant portion of our loan portfolio is composed of real estate loans. Natural disasters such as earthquakes and floods may cause widespread damage which could impair the asset quality of our loan portfolio and could have an adverse impact on the economy of the affected region. We may also not have sufficiently recent information on the value of collateral, which may result in an inaccurate assessment for impairment losses of our loans secured by such collateral. If any of the above were to occur, we may need to make additional provisions to cover actual impairment losses of our loans, which may materially and adversely affect our results of operations and financial condition.
We are subject to counterparty risk in our banking business.
We are exposed to counterparty risk in addition to credit risks associated with lending activities. Counterparty risk may arise from, for example, investing in securities of third parties, entering into derivative contracts under which counterparties have obligations to make payments to us or executing securities, futures, currency or commodity trades from proprietary trading activities that fail to settle at the required time due to non-delivery by the counterparty or systems failure by clearing agents, clearing houses or other financial intermediaries.
We routinely transact with counterparties in the financial services industry, including brokers and dealers, commercial banks, investment banks, mutual funds, hedge funds and other institutional clients. Defaults by, and even rumors or questions about the solvency of, certain financial institutions and the financial services industry generally have led to market-wide liquidity problems and could lead to losses or defaults by other institutions. Many of the routine transactions we enter into expose us to significant credit risk in the event of default by one of our significant counterparties.
Market Risks
Our financial results are constantly exposed to market risk. We are subject to fluctuations in interest rates and other market risks, which may materially and adversely affect us.
Market risk refers to the probability of variations in our net interest income or in the market value of our assets and liabilities due to volatility of interest rate, exchange rate or equity price. Changes in interest rates affect the following areas, among others, of our business:
Variations in short-term interest rates could affect our net interest income, which comprises the majority of our revenue, reducing our growth rate and potentially inexact informationresulting in losses. When interest rates rise, we may be required to pay higher interest on our floating-rate borrowings while interest earned on our fixed-rate assets does not rise as quickly, which could cause profits to grow at a reduced rate or decline in some parts of our portfolio. Interest rates are highly sensitive to many factors beyond our control, including increased regulation of the financial sector, monetary policies, domestic and on assumptions with respect to operations, profitabilityinternational economic and political conditions and other mattersfactors.
Increases in interest rates may reduce the volume of loans we originate. Sustained high interest rates have historically discouraged customers from borrowing and have resulted in increased delinquencies in outstanding loans and deterioration in the quality of assets. Increases in interest rates may also reduce the propensity of our customers to prepay or refinance fixed-rate loans. Increases in interest rates may reduce the value of our financial assets and may reduce gains or require us to record losses on sales of our loans or securities.
If interest rates decrease, although this is likely to reduce our funding costs, it is likely to compress our net interest margins, as well as adversely impact our income from investments in securities and loans with similar maturities, which could have a negative effect on us. In addition, we may also experience increased delinquencies in a low interest rate environment when such an environment is accompanied by high unemployment and recessionary conditions.
The market value of a security with a fixed interest rate generally decreases when prevailing interest rates rise, which may have an adverse effect on our earnings and financial condition. In addition, we may incur costs (which, in turn, will impact our results) as we implement strategies to reduce future interest rate exposure. The market value of an obligation with a floating interest rate can be adversely affected when interest rates increase, due to a lag in the implementation of repricing terms or an inability to refinance at lower rates.
We are also exposed to foreign exchange rate risk as a result of mismatches between assets and liabilities denominated in different currencies. Fluctuations in the exchange rate between currencies may negatively affect our earnings and value of our assets and securities.
We are also exposed to equity price risk in connection with our trading investments in equity securities. The performance of financial markets may cause changes in the value of our investment and trading portfolios. The volatility of world equity markets due to the continued economic uncertainty and sovereign debt crisis has had a particularly strong impact on the financial sector. Continued volatility may affect the value of our investments in entities in this sector and, depending on their fair value and future recovery expectations, could become a permanent impairment which would be subject to write-offs against our results. To the extent any of these risks materialize, our net interest income or the market value of our assets and liabilities could be materially adversely affected.
Market conditions have resulted and could result in material changes to the estimated fair values of our financial assets. Negative fair value adjustments could have a material adverse effect on our operating results, financial condition and prospects.
In the past six years, financial markets have been subject to significant stress resulting in steep falls in perceived or actual financial asset values, particularly due to volatility in global financial markets and the resulting widening of credit spreads. We have material exposures to securities, loans and other investments that are recorded at fair value and are therefore exposed to potential negative fair value adjustments. Asset valuations in future periods, reflecting then-prevailing market conditions, may proveresult in negative changes in the fair values of our financial assets and these may also translate into increased impairments. In addition, the value ultimately realized by us on disposal may be lower than the current fair value. Any of these factors could require us to record negative fair value adjustments, which may have a material adverse effect on our operating results, financial condition or prospects.
In addition, to the extent that fair values are determined using financial valuation models, such values may be incorrect. inaccurate or subject to change, as the data used by such models may not be available or may become unavailable due to changes in market conditions, particularly for illiquid assets, and particularly in times of economic instability. In such circumstances, our valuation methodologies require us to make assumptions, judgments and estimates in order to establish fair value, and reliable assumptions are difficult to make and are inherently uncertain and valuation models are complex, making them inherently imperfect predictors of actual results. Any consequential impairments or write-downs could have a material adverse effect on our operating results, financial condition and prospects.
We can give no assurancesare subject to market, operational and other related risks associated with our derivative transactions that our expectationscould have a material adverse effect on us.
We enter into derivative transactions for trading purposes as well as for hedging purposes. We are subject to market, credit and operational risks associated with regardsthese transactions, including basis risk (the risk of loss associated with variations in the spread between the asset yield and the funding and/or hedge cost) and credit or default risk (the risk of insolvency or other inability of the counterparty to integrationa particular transaction to perform its obligations thereunder, including providing sufficient collateral).
Market practices and synergies will materialize.
Increased competitiondocumentation for derivative transactions in the countries where we operate differ from each other. In addition, the execution and performance of these transactions depends on our ability to maintain adequate control and administration systems and to hire and retain qualified personnel. Moreover, our ability to adequately monitor, analyze and report derivative transactions continues to depend, to a great extent, on our information technology systems. This factor further increases the risks associated with these transactions and could have a material adverse effect on us.
General Business and Industry Risks
The financial problems faced by our customers could adversely affect us.
Market turmoil and economic recession could materially and adversely affect the liquidity, businesses and/or financial conditions of our borrowers, which could in turn increase our non-performing loan ratios, impair our loan and other financial assets and result in decreased demand for borrowings in general. In addition, our customers may further significantly decrease their risk tolerance to non-deposit investments such as stocks, bonds and mutual funds, which would adversely affect our fee and commission income. Any of the conditions described above could have a material adverse effect on our business, financial condition and results of operations.
Changes in our pension liabilities and obligations could have a material adverse effect on us.
We provide retirement benefits for many of our former and current employees through a number of defined benefit pension plans. We calculate the amount of our defined benefit obligations using actuarial techniques and assumptions, including mortality rates, the rate of increase of salaries, discount rates, inflation, the expected rate of return on plan assets, or others. These calculations are based on IFRS and on those other requirements defined by the local supervisors. Given the nature of these obligations, changes in the assumptions that support valuations, including market conditions, can result in actuarial losses which would in turn impact the financial condition of our pension funds. Because pension obligations are generally long term obligations, fluctuations in interest rates have a material impact on the projected costs of our defined benefit obligations and therefore on the amount of pension expense that we accrue.
Any increase in the current size of the deficit in our defined benefit pension plans, due to reduction in the value of the pension fund assets (depending on the performance of financial markets) or an increase in the pension fund liabilities due to changes in mortality assumptions, the rate of increase of salaries, discount rate assumptions, inflation, the expected rate of return on plan assets, or other factors, could result in our having to make increased contributions to reduce or satisfy the deficits which would divert resources from use in other areas of our business and reduce our capital resources. While we can control a number of the above factors, there are some over which we have no or limited control. Increases in our pension liabilities and obligations could have a material adverse effect on our business, financial condition and results of operations.
We depend in part upon dividends and other funds from subsidiaries.
Some of our operations are conducted through our financial services subsidiaries. As a result, our ability to pay dividends, to the extent we decide to do so, depends in part on the ability of our subsidiaries to generate earnings and to pay dividends to us. Payment of dividends, distributions and advances by our subsidiaries will be contingent upon our subsidiaries’ earnings and business considerations and is or may be limited by legal, regulatory and contractual restrictions. Additionally, our right to receive any assets of any of our subsidiaries as an equity holder of such subsidiaries, upon their liquidation or reorganization, will be effectively subordinated to the claims of our subsidiaries’ creditors, including trade creditors.
Increased competition and industry consolidation may adversely affect our growth prospectsresults of operations.
We face substantial competition in all parts of our business, including in originating loans and operations.
Most of the financial systems in which we operate are highly competitive. Financial sector reformsattracting deposits. The competition in the markets in which we operate have increased competition among both localoriginating loans comes principally from other domestic and foreign financial institutions,banks, mortgage banking companies, consumer finance companies, insurance companies and we believe that this trend will continue. In particular, price competition in Europe, Latin Americaother lenders and the US has increased recently. Our success in the European, Latin American and US markets will depend on our ability to remain competitive with other financial institutions. purchasers of loans.
In addition, there has been a trend towards consolidation in the banking industry, which has created larger and stronger banks with which we must now compete. There can be no assurance that this increased competition will not adversely affect our growth prospects, and therefore our operations. We also face competition from non-bank competitors, such as brokerage companies, department stores (for some credit products), leasing and factoring companies, mutual fund and pension fund management companies and insurance companies.
Changes inIncreasing competition could require that we increase our rates offered on deposits or lower the regulatory framework in the jurisdictions whererates we operatecharge on loans, which could adverselyalso have a material adverse effect on us, including our profitability. It may also negatively affect our business.
Extensive legislation affecting the financial services industry has recently been adopted in Spain, the United States, the European Unionbusiness results and other jurisdictions, and regulations are in the process of being implemented. In Spain, the Bank of Spain issued Circular 9/2010 on December 22, 2010, which amends certain rules in order to establish more restrictive conditions regarding capital requirements for credit risk, credit risk mitigation techniques, securitization and treatment of counterparty and trading book risk. This Circular has not had and it is not expected that it will have a quantifiable material impact on our business. The Circular was issued following the passage of two EU Directives on risk management (Directive 2009/27/CE and Directive 2009/83/CE).
17
The European Union has created a European Systemic Risk Board to monitor financial stability and has implemented rules that will increase capital requirements for certain trading instruments or exposures and impose compensation limits on certain employees located in affected countries. In addition, the European Union Commission is considering a wide array of other initiatives, including new legislation that will affect derivatives trading, impose surcharges on “globally” systemically important firms and possibly impose new levies on bank balance sheets.
In the United States, the Dodd-Frank Wall Street Reform and Consumer Protection Act (the “Dodd-Frank Act”) that was adopted in 2010 will result in significant structural reforms affecting the financial services industry. This legislation provides for,prospects by, among other things: the establishment of a Consumer Financial Protection Bureau which will have broad authority to regulate the credit, savings, payment and other consumer financial products and services that we offer; the creation of a structure to regulate systemically important financial companies; more comprehensive regulation of the over-the-counter derivatives market; prohibitions on our engaging in certain proprietary trading activities and restricting our ownership of, investment in or sponsorship of, hedge funds and private equity funds; restrictions on the interchange fees that we earn on debit card transactions; and a requirement that bank regulators phase out the treatment of trust preferred capital debt securities as Tier 1 capital for regulatory capital purposes.
Regulators in the UK have produced a range of proposals for future legislative and regulatory changes, which could force us to comply with certain operational restrictions or take steps to raise further capital, or could increase our expenses or otherwise adversely affect our results of operations and financial condition. These proposals include: (i) the introduction of recovery and resolution planning requirements (popularly known as ‘living wills’) for banks and other financial institutions as contingency planning for the failure of a financial institution that may affect the stability of the financial system; (ii) the implementation of the Financial Services Act 2010, which enhances the FSA’s disciplinary and enforcement powers; (iii) the introduction of more regular and detailed reporting obligations; and (iv) a requirement for large UK retail banks to hold a minimum Core Tier 1 to risk-weighted assets ratio of at least 10%, which is approximately 3% higher than the minimum capital levels required under Basel III.
In December 2010, the Basel Committee on Banking Supervision announced revisions to its Capital Accord, which will require higher capital ratio requirements for banks, narrow the definition of capital, and introduce short term liquidity and term funding standards, among other things. The Basel Committee is also proposing to consider the imposition of a bank surcharge on institutions that are determined to be “globally significant financial institutions,” a liquidity coverage ratio and a net stable funding ratio. Compliance with these requirements could increase our funding and operational costs.
During the last few months of 2011 the European Banking Authority (EBA) established new requirements to strengthen capital ratios. These requirements are part of a series of measures adopted by the European Council in the second half of 2011, which aim to restore stability and confidence in the European markets. These capital requirements are expected to be exceptional and temporary.
The selected banks are required to have a core capital Tier 1 ratio of at least 9% by June 30, 2012, in accordance with the EBA’s rules. Each bank was required to present by January 20, 2012 their capitalization plan to reach the requirement by June 30, 2012. In the beginning of December 2011, the EBA disclosed its capital requirements for the main European banks. According to the EBA, our additional capital needs amounted to €15,302 million.
During the last few months of 2011 we have carried out a series of measures which allowed us, at the beginning of 2012, to achieve a core capital ratio of 9% ahead of the EBA deadline of June 30, 2012.
On February 3, 2012 the Ministry of Economy and Competitiveness approved the Royal Decree-Law 2/2012 on the clean-up of the financial sector (see Item 4. Information on the Company—A. History and Development of the Company – Recent Events)
These and any additional legislative or regulatory actions in Spain, the European Union, the United States, the UK or other countries, and any required changes to our business operations resulting from such legislation and regulations, could result in significant loss of revenue, limitthings, limiting our ability to pursue business opportunities in which we might otherwise consider engaging, affect the value of assets that we hold, require us to increase our pricescustomer base and therefore reduce demandexpand our operations and increasing competition for investment opportunities.
In addition, if our products, impose additional costs on us or otherwise adversely affectcustomer service levels were perceived by the market to be materially below those of our businesses. Accordingly, we cannot provide assurance that any such new legislation or regulations would not have an adverse effect on our business, results of operations or financial condition in the future.
18
We may also face increased compliance costs and limitations on our ability to pursue certain business opportunities and provide certain products and services. As some of the banking laws and regulations have been recently adopted, the manner in which those laws and related regulations are applied to the operations ofcompetitor financial institutions, is still evolving. Moreover, to the extent these recently adopted regulationswe could lose existing and potential business. If we are implemented inconsistentlynot successful in the various jurisdictions in which we operate,retaining and strengthening customer relationships, we may face higher compliance costs. No assurance can be given generally that lawslose market share, incur losses on some or regulations will be adopted, enforcedall of our activities or interpreted infail to attract new deposits or retain existing deposits, which could have a manner that will not have material adverse effect on our businessoperating results, financial condition and results of operations.prospects.
Operational risks are inherentOur ability to maintain our competitive position depends, in our business.
Our businesses dependpart, on the ability to process a large numbersuccess of transactions efficientlynew products and accurately,services we offer our clients and on our ability to rely on our digital technologies, computercontinue offering products and email services software and networks, as well as on the secure processing, storage and transmission of confidential and other information in our computer systems and networks. Losses can result from inadequate personnel, inadequate or failed internal control processes and systems or from external events that interrupt normal business operations. We also face the risk that the design of our controls and procedures prove to be inadequate or are circumvented. Although we work with our clients, vendors, service providers, counterparties and other third parties, to develop secure transmission capabilities and prevent against cyber attacks, we routinely exchange personal, confidential and proprietary information by electronic means, and we may not be the targetable to manage various risks we face as we expand our range of attempted cyber attacks. We take protective measuresproducts and continuously monitor and develop our systems to protect our technology infrastructure and data from misappropriation or corruption, but our systems, software and networks nevertheless may be vulnerable to unauthorized access, misuse, computer viruses or other malicious code and other eventsservices that could have a security impact. An interception, misusematerial adverse effect on us.
The success of our operations and our profitability depends, in part, on the success of new products and services we offer our clients and our ability to continue offering products and services from third parties. However, we cannot guarantee that our new products and services will be responsive to client demands or mishandlingsuccessful once they are offered to our clients, or that they will be successful in the future. In addition, our clients’ needs or desires may change over time, and such changes may render our products and services obsolete, outdated or unattractive and we may not be able to develop new products that meet our clients’ changing needs. If we cannot respond in a timely fashion to the changing needs of personal, confidentialour clients, we may lose clients, which could in turn materially and adversely affect us.
As we expand the range of our products and services, some of which may be at an early stage of development in the markets of certain regions where we operate, we will be exposed to new and potentially increasingly complex risks and development expenses. Our employees and risk management systems, as well as our experience and that of our partners may not be sufficient or proprietary information sentadequate to enable us to properly handle or received frommanage such risks. In addition, the cost of developing products that are not launched is likely to affect our results of operations. Any or all of these factors, individually or collectively, could have a client, vendor, service provider, counterparty or third party could result in legal liability, regulatory actionmaterial adverse effect on us.
Further, our customers may issue complaints and reputational harm. Although we have not experienced any material losses to date relating to cyber attacks or other such security breaches, weseek redress if they consider that they have suffered lossesloss from operational riskour products and services, for example, as a result of any alleged mis-selling or incorrect application of the terms and conditions of a particular product. This could in turn subject us to risks of potential legal action by our customers and intervention by our regulators. We have in the past experienced losses due to claims of mis-selling in the U.K., Spain and thereother jurisdictions and may do so in the future. For further detail on our legal and regulatory risk exposures, please see the Risk Factor entitled “We are exposed to risk of loss from legal and regulatory proceedings.”
If we are unable to manage the growth of our operations this could have an adverse impact on our profitability.
We allocate management and planning resources to develop strategic plans for organic growth, and to identify possible acquisitions and disposals and areas for restructuring our businesses. From time to time, we evaluate acquisition and partnership opportunities that we believe offer additional value to our shareholders and are consistent with our business strategy. However, we may not be able to identify suitable acquisition or partnership candidates, and our ability to benefit from any such acquisitions and partnerships will depend in part on our successful integration of those businesses. Any such integration entails significant risks such as unforeseen difficulties in integrating operations and systems and unexpected liabilities or contingencies relating to the acquired businesses, including legal claims. We can begive no assurances that our expectations with regards to integration and synergies will materialize. We also cannot provide assurance that we will, not suffer material lossesin all cases, be able to manage our growth effectively or deliver our strategic growth objectives. Challenges that may result from operationalour strategic growth decisions include our ability to:
In addition, there have been
Any failure to manage growth effectively, including relating to any or all of the world involving actual or alleged fraud or other misconduct by employees in theabove challenges associated with our growth plans, could have a material adverse effect on our operating results, financial services industry in recent yearscondition and we run the risk that employee misconduct could occur. This misconduct has included and may include in the future the theft of proprietary information, including proprietary software. It is not always possible to deter or prevent employee misconduct and the precautions we take to prevent and detect this activity have not been and may not be effective in all cases.prospects.
We rely on recruiting, retaining and developing appropriate senior management and skilled personnel.
Our continued success depends in part on the continued service of key members of our management team. The ability to continue to attract, train, motivate and retain highly qualified professionals is a key element of our strategy. The successful implementation of our growth strategy depends on the availability of skilled management, both at our head office and at each of our business units. If we or one of our business units or other functions fails to staff ourits operations appropriately or loses one or more of ourits key senior executives and fails to replace them in a satisfactory and timely manner, our business, financial condition and results of operations, and financial condition, including control and operational risks, may be adversely affected.
In addition, the financial industry has and may continue to experience more stringent regulation of employee compensation, which could have an adverse effect on our ability to hire or retain the most qualified employees. If we fail or are unable to attract and appropriately train, motivate and retain qualified professionals, our business may also be adversely affected.
We rely on third parties for important products and services.
Third party vendors provide key components of our business infrastructure such as loan and deposit servicing systems, internet connections and network access. Third parties can be sources of operational risk to us, including with respect to security breaches affecting such parties. We may be required to take steps to protect the integrity of our operational systems, thereby increasing our operational costs and potentially decreasing customer satisfaction. In addition, any problems caused by these third parties, including as a result of their not providing us their services for any reason, their performing their services poorly, or employee misconduct, could adversely affect our ability to deliver products and services to customers and otherwise to conduct business. Replacing these third party vendors could also entail significant delays and expense.
Damage to our reputation could cause harm to our business prospects.
Maintaining a positive reputation is critical to our attracting and maintaining customers, investors and employees. Damage to our reputation can therefore cause significant harm to ourits business and prospects. Harm to our reputation can arise from numerous sources, including, among others, employee misconduct, litigation or regulatory outcomes, failure to deliver minimum standards of service and quality, compliance failures, unethical behavior, and the activities of customers and counterparties. Further, negative publicity regarding us, whether or not true, may result in harm to our business prospects.
Actions by the financial services industry generally or by certain members of, or individuals in, the industry can also affect our reputation. For example, the role played by financial services firms in the financial crisis and the seeming shift toward increasing regulatory supervision and enforcement has caused public perception of us and others in the financial services industry to decline.
19
We could suffer significant reputational harm if we fail to properly identify and manage potential conflicts of interest. Management of potential conflicts of interest has become increasingly complex as we expand our business activities through more numerous transactions, obligations and interests with and among our clients. The failure to adequately address, or the perceived failure to adequately address, conflicts of interest could affect the willingness of clients to deal with us, or give rise to litigation or enforcement actions against us. Therefore, there can be no assurance that conflicts of interest will not arise in the future that could cause material harm to us.
Different disclosure and accounting principles between Spain and the US may provide you with different or less information about us than you expect.
There may be less publicly available information about us than is regularly published about companies in the United States. While we are subject to the periodic reporting requirements of the Securities Exchange Act of 1934 (the “Exchange Act”), the disclosure required from foreign private issuers under the Exchange Act is more limited than the disclosure required from US issuers. Additionally, we present our financial statements under IFRS-IASB which differs from U.S. GAAP.
The lack of PCAOB inspections of our auditor in Spain may reduce the confidence in our reported financial information.
Our auditor, Deloitte, S.L., as auditor of companies, including the Bank, that are traded publicly in the United States and a firm registered with the US Public Company Accounting Oversight Board (United States) (“the “PCAOB”), is required by the laws of the United States to undergo regular inspections by the PCAOB to assess its compliance with the laws of the United States and applicable United States professional standards.
Because our auditor is located in Spain, a jurisdiction where the PCAOB is currently unable to conduct inspections without the approval of the Spanish authorities, our auditor is not currently inspected by the PCAOB. Inspections of other firms that the PCAOB has conducted outside Spain have identified deficiencies in those firms’ audit procedures and quality control procedures. This lack of PCAOB inspections in Spain prevents the PCAOB from evaluating our auditor’s audit and quality control procedures and deprives investors in our securities and those of other Spanish companies of the potential benefits of such inspections.
We are exposedengage in transactions with our subsidiaries or affiliates that others may not consider to risk of loss from legal and regulatory proceedings.be on an arm’s-length basis.
We face various issues that may give rise to risk of loss from legal and regulatory proceedings. These issues, including appropriately dealing with potential conflicts of interest, legal and regulatory requirements, ethical issues and conduct by companies in which we hold strategic investments or joint venture partners, could increase the number of litigation claims and the amount of damages asserted against the Group or subject the Group to regulatory enforcement actions, fines and penalties. In addition, amidst the changing regulatory landscape described above, many of our consumers, customers and counterpartiesaffiliates have become more litigious. The current regulatory environment, which suggests a migration toward increasing supervisory focus on enforcement, including in connection with alleged violations of law and customer harm, combined with enhanced enforcement and uncertainty about the evolution of the regulatory regime, may lead to significant operational and compliance costs.
Currently, the Bank and its subsidiaries are the subject ofentered into a number of services agreements pursuant to which we render services, such as administrative, accounting, finance, treasury, legal proceedingsservices and regulatory actions. Forothers.
Spanish law provides for several procedures designed to ensure that the transactions entered into with or among our financial subsidiaries and/or affiliates do not deviate from prevailing market conditions for those types of transactions.
We are likely to continue to engage in transactions with our affiliates. Future conflicts of interests between us and any of affiliates, or among our affiliates, may arise, which conflicts are not required to be and may not be resolved in our favor.
Technology Risks
Any failure to effectively improve or upgrade our information relating to the legal proceedingstechnology infrastructure and regulatory actions involving our businesses, see “Item 8. Financial Information—A. Consolidated statements and other financial information—Legal proceedings.” Additionally, the Bank and its subsidiaries may be the subject of future legal proceedings and regulatory actions. An adverse resultmanagement information systems in one or more of the Bank’s current or future legal proceedings or regulatory actionsa timely manner could have a material adverse effect on our operating results for any particular period, could require changesus.
Our ability to our business practices and may even require that we exit certain businesses.
Credit, market and liquidity risks may have an adverse effectremain competitive depends in part on our credit ratings and our cost of funds. Any reduction in our credit rating would likely increase our cost of funding, require us to post additional collateral or take other actions under some of our derivative contracts and adversely affect our interest margins and results of operations.
Credit ratings affect the cost and other terms upon which we are able to obtain funding. Rating agencies regularly evaluate us and their ratings of our long-term debt are based on a number of factors, including our financial strength as well as conditions affecting the financial services industry generally.
Any downgrade in our ratings would likely increase our borrowing costs, and require us to post additional collateral or take other actions under some of our derivative contracts, and could limit our access to capital markets and adversely affect our commercial business. For example, a ratings downgrade could adversely affect our ability to sell or market certain ofupgrade our products, such as subordinated securities, engageinformation technology on a timely and cost-effective basis. We must continually make significant investments and improvements in certain longer-term and derivatives transactions and retain our customers, particularly customers who need a minimum rating thresholdinformation technology infrastructure in order to invest. This,remain competitive. We cannot assure you that in turn, could reduce our liquidity and have an adverse effect on our operating results and financial condition. Under the termsfuture we will be able to maintain the level of certaincapital expenditures necessary to support the improvement or upgrading of our derivative contracts, we may be requiredinformation technology infrastructure. Any failure to maintaineffectively improve or upgrade our information technology infrastructure and management information systems in a minimum credit rating or terminate such contracts.
20
Banco Santander, S.A.’s long-term debt is currently rated investment grade by the major rating agencies Aa3 by Moody’s Investors Service España, S.A., A+ by Standard & Poor’s Ratings Services and A by Fitch Ratings Ltd. all of which have a negative outlook due to the difficult economic environment in Spain. Banco Santander, S.A.’s rating together with that of the other main Spanish banks, was downgraded by all three rating agencies in October 2011 (and by Standard & Poor’s and Fitch additionally in February 2012), due to the tougher-than-previously-anticipated macroeconomic and financial environment in Spain with dimming growth prospects in the near term, depressed real estate market activity and heightened turbulence in the capital markets. Santander UK’s long-term debt is currently rated investment grade by the major rating agencies A1 with outlook under review by Moody’s Investors Service, A+ with negative outlook by Standard & Poor’s Ratings Services and A+ with stable outlook by Fitch Ratings. Standard & Poor’s Ratings Services downgraded Santander UK’s rating in February 2012 from AA- to A+ with negative outlook, following their downgrading of Banco Santander, S.A. because the rating for both entities is equalized under Standard & Poor’s rating criteria of ‘core subsidiaries’.
We conduct substantially all of our material derivative activities through Banco Santander, S.A. and Santander UK. Following the credit rating downgrades described above, Banco Santander, S.A. posted a total of approximately €250 million of additional collateral pursuant to derivative and other financial contracts while the impact on Santander UK was not significant. Under the terms of certain derivative and other financial contracts, in the event of a further downgrade of Banco Santander, S.A.’s or a downgrade of Santander UK’s long-term debt rating, counterparties to those agreements may require Banco Santander, S.A. or Santander UK, as appropriate, to provide additional collateral, terminate these contracts or provide other remedies.
If the rating agencies were to downgrade their long-term senior debt ratings for Banco Santander, S.A. by one or two incremental notches, we expect that the amount of additional collateral we would post would likely be in line with the collateral posted in response to Banco Santander, S.A.’s most recent downgrades. An additional downgrade of Santander UK’s long-term senior debt ratings would lower Santander UK’s credit ratings below the minimum allowed by certain of its derivative and other financial contracts andtimely manner could require that such counterparty contracts be renegotiated. The impact of any such downgrade cannot be accurately predicted as the impact would largely depend on the response of Santander UK, the Group and the respective counterparties. For example, as a result of the renegotiations, Santander UK could be required to cancel derivative contracts, post additional collateral, sell its position to another party that holds the required minimum credit ratings and/or provide a guarantee from an entity that holds the required minimum credit ratings, among others. It is not possible to know in advance what actions Santander UK, the Group and the respective counterparties would undertake in the event of a further downgrade of Santander UK’s credit ratings. We expect that any such downgrade would have a material adverse effect on us.
Risks relating to data collection, processing and storage systems are inherent in our business.
Our businesses depend on the Group’sability to process a large number of transactions efficiently and accurately, and on our ability to rely on our digital technologies, computer and email services, software and networks, as well as on the secure processing, storage and transmission of confidential and other information in our computer systems and networks. The proper functioning of financial conditioncontrol, accounting or other data collection and resultsprocessing systems is critical to our businesses and to our ability to compete effectively. Losses can result from inadequate personnel, inadequate or failed internal control processes and systems, or from external events that interrupt normal business operations. We also face the risk that the design of operations, significantly larger than the impact of the downgrades of Banco Santander, S.A.’s credit ratings in October 2011our controls and February 2012 and of Santander UK in February 2012. In addition, if dueprocedures prove to future downgrades, Banco Santander, S.A.be inadequate or Santander UK were required to cancel their derivative contractsare circumvented. Although we work with certainour clients, vendors, service providers, counterparties and were unableother third parties to replace such contracts,develop secure transmission capabilities and prevent against cyber-attacks, we routinely exchange personal, confidential and proprietary information by electronic means, and we may be the Group’s market risk profiletarget of attempted cyber-attacks. If we cannot maintain an effective data collection, management and processing system, we may be materially and adversely affected.
We take protective measures and continuously monitor and develop our systems to protect our technology infrastructure and data from misappropriation or corruption, but our systems, software and networks nevertheless may be vulnerable to unauthorized access, misuse, computer viruses or other malicious code and other events that could be altered.
The derivativehave a security impact. An interception, misuse or mishandling of personal, confidential or proprietary information sent to or received from a client, vendor, service provider, counterparty or third party could result in legal liability, regulatory action and financial contracts that would be at risk of renegotiation as a result of a one-notch downgrade of Santander UK’s long-term credit rating primarily are basis swaps with a consolidated special purpose entity used in Santander UK’s covered bond programme. The aggregate notional amount of these swaps as at December 31, 2011 was approximately £40 billion. The derivative and financial contracts that would be at risk of renegotiation as a result of a two -notch downgrade of Santander UK’s long-term credit rating primarily are basis swaps and currency swaps with consolidated special purposes entities used in Santander UK’s Residential Mortgage Backed Securities (RMBS) and covered bond programs. The aggregate notional amount of these swaps as at December 31, 2011 was approximately £83 billion (in addition to the £40 billion notional amount of swaps that would be at risk of renegotiation as a result of a one-notch downgrade). Santander UK would also be required to take action in relation to the bank account arrangements with the consolidated special purposes entities under these programs. Such accounts are currently held by Santander UK. The action required could involve obtaining guarantees, transferring the accounts to another bank or re-negotiating the account bank agreement.
While certain potential impacts are contractual and quantifiable, the full consequences of a credit ratings downgrade to a financial institution are inherently uncertain, as they depend upon numerous dynamic, complex and inter-related factors and assumptions, including market conditions at the time of any downgrade, whether any downgrade of a firm’s long-term credit ratings precipitates downgrades to its short-term credit ratings, and assumptions about the potential behaviors of various customers, investors and counterparties. For a further discussion of our liquidity matters, see “Item 5. Operating and Financial Review and Prospects — B. Liquidity and capital resources.”
21
In light of the difficulties in the financial services industry and the financial markets, therereputational harm. There can be no assurance that we will not suffer material losses from operational risk in the rating agencies will maintain their current ratingsfuture, including relating to cyber-attacks or outlooks,other such security breaches. Further, as cyber-attacks continue to evolve, we may incur significant costs in its attempt to modify or with regardenhance our protective measures or investigate or remediate any vulnerabilities.
Failure to those rating agenciesprotect personal information could adversely affect us.
We manage and hold confidential personal information of customers in the conduct of our banking operations. Although we have procedures and controls to safeguard personal information in our possession, unauthorized disclosures could subject us to legal actions and administrative sanctions as well as damages that have a negative outlook on the Group, there can be no assurances that such agencies will revise such outlooks upward. The Group’s failure to maintain favorable ratings and outlooks would likely increase our cost of fundingcould materially and adversely affect the Group’s interest marginsour operating results, financial condition and results of operations.prospects.
Foreign Private Issuer and Other Risks
Our Latin American subsidiaries’ growth, asset qualitycorporate disclosure may differ from disclosure regularly published by issuers of securities in other countries, including the United States.
Issuers of securities in Spain are required to make public disclosures that are different from, and profitabilitythat may be adversely affected by volatile macroeconomicreported under presentations that are not consistent with, disclosures required in other countries, including the United States. In particular, for regulatory purposes, we currently prepare and political conditions.
The economieswill continue to prepare and make available to our shareholders statutory financial statements in accordance with IFRS, which differs from US GAAP in a number of respects. In addition, as a foreign private issuer, we are not subject to the same disclosure requirements in the United States as a domestic U.S. registrant under the Exchange Act, including the requirements to prepare and issue quarterly reports, or the proxy rules applicable to domestic U.S. registrants under Section 14 of the eight Latin American countries whereExchange Act or the insider reporting and short-swing profit rules under Section 16 of the Exchange Act. Accordingly, the information about us available to you will not be the same as the information available to shareholders of a U.S. company and may be reported in a manner that you are not familiar with.
Investors may find it difficult to enforce civil liabilities against us or our directors and officers.
Our directors and officers reside outside of the United States. In addition, all or a substantial portion of our assets and their assets are located outside of the United States. Although we operate have experienced significant volatilityappointed an agent for service of process in recent decades, characterized, in some cases, by slow or regressive growth, declining investment and hyperinflation. This volatility has resulted in fluctuationsany action against us in the levelsUnited States with respect to our ADSs, none of deposits andour directors or officers has consented to service of process in the relative economic strengthUnited States or to the jurisdiction of various segmentsany United States court. As a result, it may be difficult for investors to effect service of process within the United States on such persons.
Additionally, investors may experience difficulty in Spain enforcing foreign judgments obtained against us and our executive officers and directors, including in any action based on civil liabilities under the U.S. federal securities laws. Based on the opinion of Spanish counsel, there is doubt as to the enforceability against such persons in Spain, whether in original actions or in actions to enforce judgments of U.S. courts, of liabilities based solely on the U.S. federal securities laws.
As a holder of ADSs you will have different shareholders’ rights than in the United States and certain other jurisdictions.
Our corporate affairs are governed by our Bylaws and Spanish corporate law, which may differ from the legal principles that would apply if we were incorporated in a jurisdiction in the United States or in certain other jurisdictions outside Spain. Under Spanish corporate law, you may have fewer and less well-defined rights to protect your interests than under the laws of other jurisdictions outside Spain.
Although Spanish corporate law imposes restrictions on insider trading and price manipulation, the form of these regulations and the manner of their enforcement may differ from that in the U.S. securities markets or markets in certain other jurisdictions. In addition, in Spain, self-dealing and the preservation of shareholder interests may be regulated differently, which could potentially disadvantage you as a holder of the economiesshares underlying ADSs.
ADS holders may be subject to which we lend. Latin American banking activities (including Retail Banking, Global Wholesale Banking, Asset Management and Private Banking) accounted for €4,664 million of our profit attributableadditional risks related to the Parent bank for the year ended December 31, 2011 (a decrease of 1% from €4,728 million for the year ended December 31, 2010). Negative and fluctuating economic conditions, such as a changing interest rate environment, impact our profitability by causing lending margins to decrease and leading to decreased demand for higher margin products and services. Negative and fluctuating economic conditions in some Latin American countries could also result in government defaults on public debt. This could affect us in two ways:holding ADSs rather than shares.
Because ADS holders do not hold their shares directly, through portfolio losses, and indirectly, through instabilities that a default in public debt could cause to the banking system as a whole, particularly since commercial banks’ exposure to government debt is high in several of the Latin American countries in which we operate.
In addition, revenues from our Latin American subsidiariesthey are subject to riskthe following additional risks, among others:
No assurance can be given that our growth, asset quality and profitability willyou may not be affected by volatile macroeconomicable to exercise shareholder rights;
Item 4. Information on the Company A. History and development of the company Introduction Banco Santander, S.A. (“Santander”, the “Bank”, the “Parent” or the “Parent bank”) is the Parent bank of Grupo Santander. It was established on March 21, 1857 and incorporated in its present form by a public deed executed in Santander, Spain, on January 14, 1875. On January 15, 1999, the boards of directors of Banco Santander, S.A. and Banco Central Hispanoamericano, S.A. agreed to merge Banco Central Hispanoamericano, S.A. into Banco Santander, S.A., and to change Banco Santander’s name to Banco Santander Central Hispano, S.A. The shareholders of Banco Santander, S.A. and Banco Central Hispanoamericano, S.A. approved the merger on March 6, 1999, at their respective general meetings. The merger and the name change were registered with the Mercantile Registry of Santander, Spain, by the filing of a merger deed. Effective April 17, 1999, Banco Central Hispanoamericano, S.A. shares were extinguished by operation of law and Banco Central Hispanoamericano, S.A. shareholders received new Banco Santander shares at a ratio of three shares of Banco Santander, S.A. for every five shares of Banco Central Hispanoamericano, S.A. formerly held. On the same day, Banco Santander, S.A. changed its legal name to Banco Santander Central Hispano, S.A.Latin American economies canthe depositary may take or be directly and negatively affected by adverse developments in other countries.Financial and securities markets inrequired to take actions under the Latin American countries where we operate are, to varying degrees, influenced by economic and market conditions in other countries in Latin America and beyond. Negative developments in the economy or securities markets in one country, particularly in an emerging market,Deposit Agreement that may have a negative impact on other emerging market economies. These developments may adversely affect the business, financial condition and operating results of our subsidiariesadverse consequences for some ADS holders in Latin America.
22
The general shareholders’ meeting held on June 23, 2007 approved the proposal to change the name of the Bank to Banco Santander, S.A.
The general shareholders’ meeting held on March 22, 2013 approved the merger by absorption of Banco Español de Crédito, S.A. (Banesto) and Banco Banif, S.A.
We are incorporated under, and governed by the laws of the Kingdom of Spain. We conduct business under the commercial name “Santander”. Our corporate offices are located in Ciudad Grupo Santander, Avda. de Cantabria s/n, 28660 Boadilla del Monte (Madrid), Spain. Telephone: (011) 34-91-259-6520.
Principal Capital Expenditures and Divestitures
Acquisitions, Dispositions, Reorganizations
Our principal acquisitions and dispositions in 2013, 2012 and 2011 were as follows:
Invitation to tender American Securities for purchase
On March 6, 2013, we announced an invitation to all holders of callable subordinated notes series 22 issued by Santander Issuances, S.A. Unipersonal (the American Securities) to tender such Securities for purchase (the American Invitation). The American Securities are listed in the London Stock Exchange. The total principal amount of the American Securities comprising the American Invitation amounts to approximately US$ 257.5 million.
Banco Santander announced on March 14, 2013 the final aggregate principal amount accepted for purchase (US$ 26.6 million) and the final purchase prices as a consequence of the tender offers.
The invitation was undertaken as a part of the Group’s active management of liabilities and capital, and focused on core capital generation as well as the optimization of the future interest expense.
Invitation to tender European Securities for purchase
On March 6, 2013, we announced an invitation to all holders of certain securities issued by Santander Issuances, S.A. Unipersonal and Santander Perpetual, S.A. Unipersonal (the European Securities) to tender such securities for purchase (the European Invitation). The European Securities are subordinated and perpetual bonds listed in the Luxembourg Stock Exchange, corresponding to 15 different series. The total principal amount of the series comprising the Invitation amounts to approximately €6,575 million and GBP 2,243 million.
Banco Santander announced on March 14, 2013 the final aggregate principal amount accepted for purchase (€140.2 million and GBP 178.9 million) and the final purchase prices as a consequence of the European Invitation.
The European Invitation was undertaken as a part of the Group’s active management of liabilities and capital, and focused on core capital generation as well as the optimization of the future interest expense. The invitation was also designed to provide liquidity in the market and to offer the holders of the European Securities the possibility to exit their investment in the European Securities.
Santander sells 5.2% of its Polish unit as KBC places its 16.2% in the market
On March 18, 2013, KBC Bank NV (“KBC”) and Banco Santander announced a secondary offering of up to 19,978,913 shares in Bank Zachodni WBK S.A. (“BZ WBK”) by way of a fully marketed follow-on offering (the “WBK Offering”). Through the WBK Offering, KBC would sell 15,125,964 shares (constituting 16.17% of BZ WBK shares outstanding at that date) and Santander was expected to sell not less than 195,216 but up to 4,852,949 shares (constituting between 0.21% and 5.19% of BZ WBK shares outstanding at that date).
KBC and Banco Santander, as selling shareholders, granted the underwriters a reverse greenshoe option in relation to up to 10% of the final Offering size which was not used. KBC and Santander each committed to be locked-up for a period of 90 days, and BZ WBK for a period of 180 days, following the closing of the WBK Offering.
The WBK Offering was made to eligible institutional investors and within an indicative price range of PLN240 to PLN270. The final sale price was determined through a bookbuilding process that began on March 18, 2013, and ended on March 21, 2013.
On March 22, 2013, Banco Santander, S.A. and KBC completed the placement of all the shares owned by KBC and 5.2% of the share capital of Bank Zachodni WBK S.A. held by the Group in the market for €285 million, which gave rise to an increase of €292 million in Non-controlling interests.
Following these transactions, we hold 70% of the share capital of Bank Zachodni WBK S.A. and the remaining 30% is held by non-controlling interests.
Agreement with Warburg Pincus and General Atlantic
On May 30, 2013, we announced that we had entered into an agreement with subsidiaries of Warburg Pincus and General Atlantic to foster the global development of our asset management unit, Santander Asset Management (SAM). Pursuant to the terms and conditions of the agreement, Warburg Pincus and General Atlantic together own 50% of the holding company which comprises the eleven management companies we have, mainly in Europe and Latin America, while the other 50% are held by us.
The purpose of the alliance is to enable SAM to improve its ability to compete with the large independent international asset management companies, since the businesses to be strengthened include asset management in the global institutional market, with the additional advantage of having knowledge and experience in those markets in which we are present. The agreement also envisages the distribution of products managed by SAM in the countries in which we have a commercial network for a period of ten years, renewable for five additional two-year periods, for which we will receive commissions at market rates, thus benefiting from broadening the range of products and services we offer our customers. SAM also distributes its products and services internationally, outside our commercial network.
Since the aforementioned asset management companies belonged to different Group companies, prior to the completion of the transaction a corporate restructuring took place whereby each of the asset management companies was sold, by its shareholders, for its fair value, to SAM Investment Holdings Limited (SAM), a holding company created by us. The aggregate value of the asset management companies was approximately €1.7 billion.
Subsequently, in December 2013, once the required authorizations had been obtained from the various regulators, the agreement was executed through the acquisition of a 50% ownership interest in SAM’s share capital by Sherbrooke Acquisition Corp SPC (an investee of Warburg Pincus and General Atlantic) for €449 million. At that date, SAM had financing from third parties for €845 million. The agreement includes deferred contingent amounts payable and receivable for the Group based on the achievement of the business plan targets over the coming five years.
Also, we entered into a shareholders’ agreement with these shareholders regulating, inter alia, the taking of strategic, financial, operational and other significant decisions regarding the ordinary management of SAM on a joint basis. Certain restrictions on the transferability of the shares were also agreed, and a commitment was made by the two parties to retain the restrictions for at least 18 months. Lastly, Sherbrooke Acquisition Corp SPC will be entitled to sell to the Group its ownership interest in the share capital of SAM at market value on the fifth and seventh anniversaries of the transaction, unless a public offering of SAM shares has taken place prior to those dates.
Following these transactions, at year-end we held a 50% ownership interest in SAM and controlled this company jointly with the aforementioned shareholders.
As a result of the aforementioned transaction, we recognized a gain of €1,372 million in the consolidated income statement for 2013, of which €671 million related to the fair value of the 50% ownership interest retained by us.
Banco Santander (Brasil) optimized its equity structure
On September 29, 2013, we announced that our subsidiary Banco Santander (Brasil) S.A. will optimize its equity structure by replacing common equity (Core Tier I) in an amount of Brazilian Reais 6 billion (amount which will be distributed pro rata among its shareholders) with newly-issued instruments of an equivalent amount qualifying as Additional Tier I and Tier II capital, and which will be offered to Banco Santander (Brasil) S.A.’s shareholders.
In January 2014 we subscribed a percentage of the newly issued instruments in proportion to our shareholding in Banco Santander (Brasil) S.A. (approximately 75%), as well as those not subscribed by the other shareholders of Banco Santander (Brasil) S.A.
The new structure improves Banco Santander (Brasil) S.A.’s regulatory capital composition, by increasing the return on equity (ROE) while maintaining the total amount of regulatory capital and capital ratios (BIS II ratio of approximately 21.5% and fully loaded BIS III ratio of approximately 18.9%) above the other retail banks in Brazil.
Acquisition of a 51% interest in Financiera El Corte Inglés, E.F.C., S.A.
On October 7, 2013, we announced that Santander Consumer Finance, S.A. (“Santander Consumer”) had reached a strategic agreement with El Corte Inglés, S.A. (“El Corte Inglés”) in consumer finance and client financing which includes the acquisition from El Corte Inglés of a 51% interest in Financiera El Corte Inglés, E.F.C., S.A. (“Financiera El Corte Inglés”). El Corte Inglés will retain the remaining 49%. The transaction was closed in the first quarter of 2014.
Financiera El Corte Inglés is a consumer finance business that provides financing for the acquisition of all sorts of goods and services of the entities of the El Corte Inglés group. The El Corte Inglés group is a leading retailer in Spain and the largest department store business in the country.
The transaction values Financiera El Corte Inglés at €415 million. Prior to closing El Corte Inglés received a special dividend of approximately €140 million. Thus, Santander Consumer paid a price of approximately €140 million for the 51% stake of Financiera El Corte Inglés.
Financiera El Corte Inglés has a seven member Board, of which Santander Consumer has appointed four members and El Corte Inglés the remaining three.
Agreement with Apollo
On November 21, 2013, we announced that we had reached a preliminary agreement with Apollo European Principal Finance Fund II, a fund managed by subsidiaries of Apollo Global Management, LLC (“Apollo”), for the sale of the platform for managing the loan recovery activities of Banco Santander, S.A. in Spain and for managing and marketing the properties relating to this activity.
Following this transaction, we will retain the property assets and credit portfolio on our balance sheet, while management of these assets will be carried out from the platform owned by Apollo.
On January 3, 2014, we announced that we had sold to Altamira Asset Management Holdings, S.L., an investee of Apollo European Principal Finance Fund II, 85% of the share capital of Altamira Asset Management, S.L., our company that manages debt recovery services before the initiation of court action in Spain and the sale or lease of foreclosed property assets relating to this business, for €664 million.
Cooperation agreement with Bank of Shanghai and purchase of an 8% stake
On December 10, 2013 we announced that we reached a cooperation agreement with Bank of Shanghai (“BoS”) to buy an 8% equity stake in BoS. The transaction, which is subject to approval from the China Banking Regulatory Commission, will make Santander the second-largest shareholder in BoS and its strategic international partner. The transaction is expected to be completed in the first half of 2014. The cost of the investment, including the purchase of HSBC Ltd.’s stake and the cooperation agreement with Bank of Shanghai, is estimated at approximately €470 million. The transaction will have an impact of approximately 1 basis point on the Santander Group’s capital.
Under the terms of the agreement, Santander will provide BoS with a permanent team of professionals, who will contribute Santander’s knowledge and experience in risk management and commercial and retail banking. The two will develop joint wholesale banking activities.
Transfer of interest in Banco Santander (Brasil), S.A.
In January and March 2012 the Group transferred shares representing 4.41% and 0.77%, respectively, of the capital stock of Banco Santander (Brasil), S.A. to two leading international financial institutions. These institutions undertook to deliver these shares to the holders of bonds issued by Banco Santander in October 2010 which were exchangeable for Banco Santander (Brasil), S.A. shares upon maturity, in accordance with their terms.
Santander and KBC agree to merge Bank Zachodni WBK and Kredyt Bank in Poland
On February 28, 2012, we announced that Banco Santander, S.A. and KBC had entered into an investment agreement to combine their Polish banking subsidiaries, BZ WBK and Kredyt Bank S.A. (‘Kredyt Bank’).
The transaction entailed a share capital increase in BZ WBK, where the newly issued shares in BZ WBK were offered and rendered to KBC and the other shareholders of Kredyt Bank in exchange for their shares in Kredyt Bank. Under the agreements BZ WBK would merge with Kredyt Bank at the ratio of 6.96 BZ WBK shares for every 100 Kredyt Bank shares. At market prices as of the date of the announcement, the transaction valued Kredyt Bank at PLN 15.75 a share and BZ WBK at PLN 226.4 a share. The combined bank’s total pro forma value would be PLN 20.8 billion (€5 billion). Both Bank Zachodni WBK and Kredyt Bank were listed on the Warsaw Stock Exchange. The merged bank would continue to be listed on the Warsaw Stock Exchange.
In 2013, following obtainment of the authorization from the Polish financial regulator (KNF), the aforementioned transaction was carried out. As a result, we controlled approximately 75.2% of the post-merger entity and KBC controlled approximately 16.2%, with the remaining 8.6% being owned by non-controlling interests.
Under the investment agreement, Santander also committed to acquire 100% of Zagiel, the consumer finance arm of KBC in Poland. In 2013 Zagiel was integrated into Santander Consumer Finance.
Valores Santander
On March 30, 2012, we informed that the Ordinary General Shareholders’ Meeting held that day had resolved to grant the holders ofValores Santander an option to convert their securities on four occasions before October 4, 2012, the mandatory conversion date for the outstandingValores Santander. As a result on June 7, 2012, July 5, 2012, August 7, 2012 and September 6, 2012 we issued 73,927,779, 193,095,393, 37,833,193 and 14,333,873 new shares related to the conversion requests of 195,923, 511,769, 98,092 and 37,160Valores Santander, respectively.
In October 2007, a total of 1,400,000Valores Santander were issued. On October 2008, 2009, 2010 and 20092011, and on June, July, August and September 2012 a total to 880,700Valores Santander were voluntarily converted. On October 4, 2012, the mandatory conversion of the remaining 519,300Valores Santander took place, representing 37.1% of the original issuance.
Invitation to tender certain securitization bonds for cash
On April 16, 2012, we announced an invitation to all holders of certain securities (the Securities) to tender such Securities for purchase by Banco Santander for cash (the Invitation). The Securities are fixed rate securities (securitization bonds) listed on the AIAF Fixed Rate Market which correspond to 33 different series issued by specific securitization funds managed by Santander de Titulización, S.G.F.T., S.A. series with an aggregate outstanding principal amount of €6 billion.
The rationale for the Invitation was to effectively manage the Group’s outstanding liabilities and to strengthen our balance sheet. The Invitation was also designed to provide liquidity to Security holders.
On April 25, 2012 we announced the aggregate outstanding principal amount of each of the Securities accepted for purchase, which for senior securities amounted to €388,537,762.18 and for mezzanine securities €61,703,163.58.
Sale of our Colombian unit to the Chilean group Corpbanca
In December 2011, we entered into an agreement with the Chilean group Corpbanca to sell our shareholding in Banco Santander Colombia S.A. and our other business subsidiaries in this country (Santander Investment Valores Colombia S.A., Comisionista de Bolsa Comercial, Santander Investment Colombia S.A., Santander Investment Trust Colombia S.A., Sociedad Fiduciaria y Agencia de Seguros Santander, Ltda.).
Following receipt of the regulatory authorizations from the competent authorities and the delisting of the shares of Banco Santander Colombia S.A., in the second quarter of 2012 we sold our shareholding in Banco Santander Colombia S.A. and our other business subsidiaries in Colombia to the Corpbanca Group for a total of $1,229 million (€983 million), giving rise to a gain of €619 million, which was recognized under Gains/(losses) on disposal of assets not classified as follows:non-current assets held for sale in our 2012 consolidated income statement.
Agreement with Abbey Life Assurance On July 19, 2012, we reached an agreement with Abbey Life Assurance Ltd, a subsidiary of Deutsche Bank AG, under which Abbey Life Assurance Ltd reinsured 100% of the individual life risk portfolio of the insurance companies of Banco Santander in Spain and Portugal. This reinsurance transaction enabled us to monetize our life risk insurance portfolio. This transaction gave rise to income of €435 million recognized under Other operating income - Income from insurance and reinsurance contracts issued in the consolidated income statement (€308 million net of tax). The policies ceded to Abbey Life Assurance Ltd consist of the portfolio as of June 30, 2012. This reinsurance agreement does not involve any changes for our customers as services will continue to be provided by Santander’s insurance companies. Our branches in Spain and Portugal will continue to offer products designed by our insurance companies as the agreement reached with Abbey Life Assurance Ltd does not involve any commitment on future distribution and is limited to the portfolio existing at June 30, 2012. Placement of shares of Grupo Financiero Santander, S.A.B. de C.V. on the secondary market On August 16, 2012, we announced our intention to register with both the Mexican Comisión Nacional de Banca y Valores (National Commission of Banking and Securities) and the U.S. Securities & Exchange Commission the registration statements for the placement of shares of Grupo Financiero Santander, S.A.B. de C.V. on the secondary market. The selling institutions would be Banco Santander, S.A. and its subsidiary Santusa Holding, S.L. On September 26, 2012, we announced that the price of the offering of shares of Grupo Financiero Santander Mexico was set at 31.25 Mexican pesos ($2.437) per share, valuing Santander Mexico at €12,730 million ($16,538 million), making it the 82nd largest bank in the world by market capitalization. The total volume of the offering represented 24.9% of the share capital of Santander Mexico after the exercise of the green shoe option. The value of the transaction was €3,178 million, making it the largest equity offering in Latin America in 2012 and one of the largest in the world. The gains obtained by Banco Santander in this transaction were fully allocated to reserves, in line with accounting requirements, as Banco Santander will continue to maintain control over its Mexican subsidiary. Of the total shares sold, 81% were placed in the United States and elsewhere outside Mexico and 19% in Mexico. The American Depositary Shares of Santander Mexico commenced trading on the New York Stock Exchange on September 26, 2012. The shares of Santander Mexico continue to trade on the Mexican Stock Exchange. The IPO of our unit in Mexico was an important step in our strategy of having market listings for all of our significant subsidiaries. Invitation to tender offer On August 22, 2012, the Bank and Santander Financial Exchanges Limited (each an Offeror and, jointly, the Offerors) invited holders of 21 specific series of subordinated debt and preferred securities to sell them to the Offerors. The aggregate principal amount of the securities traded in euros and sterling amounted to €7,201 million and £3,373 million, respectively. The rationale for the invitation was to effectively manage the Group’s outstanding liabilities and to strengthen our balance sheet. The invitation was also designed to provide liquidity to security holders. On August 31, 2012, the Offerors announced that the holders had accepted to sell an aggregate principal amount of €755 million for the securities traded in euros and £311 million for the securities traded in sterling. Termination of the agreement to purchase Royal Bank of Scotland branch offices On October 15, 2012, we announced that the agreement for the sale by The Royal Bank of Scotland (“RBS”) to Santander UK of approximately 300 branches of RBS in England and Wales and NatWest in Scotland (the “Business”) would not be completed in view of the foreseeable lack of satisfaction of the conditions precedent by the agreed final deadline of February 2013.
Santander and Elavon agreement
On October 19, 2012, we announced that we had reached an agreement with Elavon Financial Services Limited (“Elavon”) to jointly operate in Spain a payment services business for credit and debit cards through merchants’ point of sale terminals.
The transaction involves the incorporation of a joint venture company whose share capital will be held 51% by Elavon and 49% by the Bank, and to which Santander Group will transfer its aforementioned payment services business in Spain (excluding that of Banesto).
The agreement valued the transferred business at €165.8 million and generated a capital gain of approximately €87 million after tax.
As of March 31, 2013, all the necessary authorizations had been obtained. The transaction was closed in April 2013.
Mergers by absorption of Banesto and Banco Banif
On December 17, 2012, we announced that we had resolved to approve the plan for the merger by absorption of Banesto and Banco Banif, S.A. as part of the restructuring of the Spanish financial sector. These transactions are part of a commercial integration which brought Banesto and Banif under the Santander brand.
At their respective board of directors meetings held on January 9, 2013, the directors of the Bank and Banesto approved the common draft terms of the merger by absorption of Banesto into the Bank with the dissolution without liquidation of the former and the transferen bloc of all its assets and liabilities to the Bank, which were acquired, by universal succession, the rights and obligations of the absorbed entity. As a result of the merger, the shareholders of Banesto, other than the Bank, received in exchange shares of the Bank.
January 1, 2013 was established as the date from which the transactions of Banesto shall be considered to have been performed for accounting purposes for the account of the Bank.
On March 22, 2013 and March 21, 2013, the general shareholders meetings of the Bank and Banesto, respectively, approved the terms of the merger.
On April 29, 2013, pursuant to the provisions of the terms of the merger and to the resolutions of the general shareholders’ meetings of both companies, the regime and procedure for the exchange of Banesto shares for shares of Banco Santander was made public. Banco Santander covered the exchange of Banesto shares with shares held as treasury stock based on the exchange ratio of 0.633 shares of Banco Santander, each with a nominal value of €0.50, for each share of Banesto, each with a nominal value of €0.79, without provision for any supplemental cash remuneration.
On May 3, 2013, the merger was registered with the Commercial Registry of Cantabria and the dissolution of Banesto was completed.
The directors of Banco Banif, S.A., at its board of directors meeting held on January 28, 2013, and the directors of Banco Santander, S.A., at its board of directors meeting held on that same day, approved the common drafts terms of the merger by absorption of Banco Banif, S.A. into Banco Santander, S.A. with the dissolution without liquidation of the former and the transferen bloc of all its assets and liabilities to Banco Santander, S.A., which acquired, by universal succession, the rights and obligations of the absorbed entity.
January 1, 2013 was established as the date from which the transactions of Banif shall be considered to have been performed for accounting purposes for the account of the Bank.
On May 7, 2013, the merger was registered with the Commercial Registry of Cantabria and the dissolution of Banco Banif, S.A. was completed.
Insurance business in Spain
On December 20, 2012, we announced that we had reached an agreement with Aegon. In this regard, we created two insurance companies, one for life insurance and the other for general insurance, in which Aegon would acquire ownership interests of 51%, and management responsibility would be shared by Aegon and the Group. We would hold 49% of the share capital of the companies and we would enter into a distribution agreement for the sale of insurance products in Spain through the commercial networks for a period of 25 years. The agreement would not affect savings, health and vehicle insurance, which would continue to be owned and managed by Santander.
In June 2013, after obtaining the relevant authorizations from the Directorate-General of Insurance and Pension Funds and from the European competition authorities, Aegon acquired a 51% ownership interest in the two insurance companies created by the Group for these purposes, one for life insurance and the other for general insurance (currently Aegon Santander Vida Seguros y Reaseguros, S.A. and Aegon Santander Generales Seguros y Reaseguros, S.A.), for which it paid €220 million, thereby gaining joint control together with the Group over the aforementioned companies. The agreement also includes payments to Aegon that are deferred over two years and amounts receivable for the Group that are deferred over five years, depending on the business plan.
The aforementioned agreement includes the execution of a distribution agreement for the sale of insurance products in Spain for 25 years through commercial networks, for which the Group will receive commissions at market rates.
This transaction gave rise to a gain of €385 million recognized under Gains (losses) on disposal of assets not classified as non-current assets held for sale (€270 million net of tax), of which €186 million related to the fair value recognition of the 49% ownership interest retained by the Group.
Acquisition of the Polish institution Bank Zachodni WBK
On September 10, 2010, we announced that we had reached an agreement with Allied Irish Banks (“AIB”) to acquire 70.36% of the Polish institution Bank Zachodni WBK (“BZ WBK”) for an amount of approximately €2.938 billion in cash. On February 7, 2011, we announced that we had launched a tender offer in Poland (the “Tender Offer”) for 100% of the share capital of BZ WBK in accordance with applicable Polish law and regulation. The Tender Offer forms part of the agreement of Banco Santander with AIB for the acquisition of AIB’s stake in BZ WBK announced in September 10, 2010.
Under the Tender Offer, Banco Santander offered PLN 226.89 in cash per share (approximately €58.74) resulting in a total maximum consideration of PLN 16,580,216,589.57 (approximately €4,293.4 million) for the total share capital of BZ WBK.
The Tender Offer was made in Poland subject to Polish law and subject to the terms and conditions included in the Tender Offer document (dokument wezwania) submitted to the Polish securities regulator—regulator - Polish Financial Supervision Commission (Komisja Nadzoru Finansowego) and the Warsaw Stock Exchange (Giełda Papierów Wartościowych w Warszawie S.A.). The consummation of the Tender Offer was subject to the satisfaction of the conditions indicated in the Tender Offer document, including the acceptance of the tender offer by holders of more than 70% of the outstanding shares of BZ WBK and the approval by the Polish regulatory authorities of the acquisition by Grupo Santander of BZ WBK.
The acceptance period of the tender offer commenced on February 24, 2011 and ended on March 25, 2011.
69,912,653 BZ WBK shares were tendered, representing 95.67% of BZ WBK’s capital. Since the Tender Offer was made at a cash price of PLN 226.89 per share (approximately €57.05), the purchase of the shares tendered in the offer resulted in a payment of PLN 15,862.48 million (approximately €3,987 million).
Since the 70% acceptance threshold (which was a condition of the Tender Offer) was exceeded and all the remaining conditions, including the obtaining of the appropriate regulatory authorizations, were met, the tender offer was settled and the transfer of the shares was made on April 1, 2011.
Additionally, on April 1, 2011, we acquired AIB’s 50% stake in BZ WBK Asset Management for €174 million in cash. Subsequently, based on the terms and conditions of the takeover bid, certain non-controlling shareholders of BZ WBK opted to sell their shares. As a result, the Group acquired 421,859 additional shares for €24 million.
Finally, in May and June 2011, we acquired and aggregate of 113,336 additional BZ WBK shares. As of December 31, 2011, the Group held a total of 70,334,512 shares of Bank Zachodni WBK S.A. (96.25%).
Sales of 1.9% and 7.8% of Banco Santander Chile
On February 17, 2011, we announced that we had sold shares representing 1.9% of the share capital of Banco Santander Chile, for a total consideration of US$291 million. This transaction generated a capital gain for Banco Santander of approximately €110 million, entirely accounted for as reserves. Following the transaction, we holdheld a 75% stake in the share capital of Banco Santander Chile.
On November 22, 2011, we announced the launch of a public secondary offering of approximately 14,741.6 million shares of common stock of Banco Santander Chile, representing 7.8% of the company’s share capital.
23
On December 7, 2011, we announced that we had successfully completed the offering. As a result, 7.82% of the capital of such bank was sold at a price of 33 Chilean pesos per share and US$66.88 per ADR. The placement amounted to US$950 million, with a positive impact on the core capital of the Group of 11 basis points.
Following the transaction, we holdheld 67% of the share capital of Banco Santander Chile. We have agreed not to reduce our stake in Banco Santander Chile for one year.
Agreement with Zurich Financial Services Group
On February 22, 2011, the Groupwe signed a Memorandum of Understanding with insurer Zurich Financial Services Group (“Zurich”) to form a strategic alliance to strengthen insurance distribution in five key Latin American markets: Brazil, Chile, Mexico, Argentina and Uruguay.
Once the required authorizations from the various regulators were obtained, in the fourth quarter of 2011 Zurich acquired, for €1,044 million 51% of the share capital of ZS Insurance América, S.L. (holding company for the Group’s insurance businesses in Latin America), thereby gaining control over this company, and it has taken over management of the companies concerned. The agreement also provides for deferred payments based on the achievement of the business plan targets over the coming 25 years.
Following this transaction Santander retained 49% of the share capital of the holding company and entered into a distribution agreement for the sale of insurance products in each of the relevant countries for 25 years.
As a result of the aforementioned transaction, the Group recognized a gain of €641 million (net of the related tax effect) under Gains (losses) on disposal of assets not classified as non-current assets held for sale in the consolidated income statement for 2011, of which €233 million related to the measurement at fair value of the 49% ownership interest retained in this company.
Santander Banif Inmobiliario
On December 3, 2010, exclusively for commercial reasons, we decided to contribute resources to the Santander Banif Inmobiliario, FII property investment fund (the “Fund”) through the subscription of new units and the granting of a two-year liquidity guarantee in order to meet any outstanding redemption claims by the unit holders of the Fund and to avoid winding up the Fund. We offered the unit holders of the Fund the opportunity to submit new requests for the total or partial redemption of their units or for the total or partial revocation of any redemption requests that they had previously submitted. Any such requests were required to be submitted before February 16, 2011.
Redemptions from the Fund, managed by Santander Real Estate, S.G.I.I.C. S.A., had been suspended for a period of two years in February 2009, in accordance with the request filed with the Spanish National Securities Market Commission (CNMV), due to the lack of sufficient liquidity to meet the redemptions requested at that date.
On March 1, 2011, we paid the full amount of the redemptions requested by the Fund’s unit holders, which amounted to €2,326 million (93.01% of the Fund’s net assets), through the subscription of the related units by us at their redemption value at February 28, 2011.
Following the aforementioned acquisition, we ownowned 95.54% of the Fund. The suspension of redemptions was lifted from said date and the Fund is operating normally.
Metrovacesa, S.A. (“Metrovacesa”)
On February 20, 2009, certain credit institutions, includingMarch 17, 2011, Banco de Sabadell, S.A., Caja de Ahorros y Monte de Piedad de Madrid (now Bankia, S.A.), Banco Bilbao Vizcaya Argentaria, S.A., Banco Popular Español, S.A., Banco Santander, S.A. and Banco Español de Crédito, S.A., entered into an agreement for the restructuringholders in aggregate of the debt of the Sanahuja Group, whereby they received shares representing 54.75%65.52% of theMetrovacesa’s share capital of Metrovacesa in consideration for payment of the Sanahuja Group’s debt.
The agreement also included the acquisition(of which a 23.63% stake was held by the creditor entities of an additional 10.77% of the share capital of Metrovacesa (shares for which the Sanahuja family was granted a call option for four years), which gave rise to an additional disbursement of €214 million for the Group, and other conditions concerning the administration of this company.
24
Following the execution of the agreement, Grupo Santander had an ownership interest of 23.63% in Metrovacesa, S.A., and 5.38% of the share capital was subject to the call option described above.
At 2009 year-end, the Group measured this investment at €25 per share, which gave rise to additional write-downs and impairment losses of €269 million net of tax.
At December 31, 2010, the value of this holding amounted to €402 million, after deducting the write-downs, equivalent to €24.4 per share. Also, the Group has granted the company loans amounting to €109 million, which were fully provisioned.
On March 17, 2011, the creditor entities that had been party to the agreement for the restructuring of Metrovacesa’s debt in 2009, including Banco Santander, S.A. and Banco Español de Crédito, S.A.Group), entered into a capitalization and voting agreement relating to Metrovacesa (which iswas subject to certain conditions precedent, including the implementation by Metrovacesa of a capital increase through monetarycash contributions and the conversion of debt into equity)equity referred to below) whereby the creditorsaid credit entities taken as a whole, will convertcollectively undertook to capitalize approximately €1,360 million of Metrovacesa’s financial debt into equity,credits to Metrovacesa, the Group’s share of which would bewas €492 million.
On June 28, 2011, theMetrovacesa’s shareholders at the annual general meeting of Metrovacesa resolved to approveapproved the aforementioned capital increase for a par value of €1,949 million, subject to certain conditions precedent such asincluding the CNMV releasing the Group from the obligation to launch a mandatory takeover bid for allthe entire share capital of Metrovacesa as a result of the share capital, since the transaction might raiseincrease of the Group’s holding in the share capital of Metrovacesa above 30%. of the company’s voting rights. This release was granted by the CNMV on July 6, 2011.
On August 1, 2011, we announced that,and following the execution of the abovementioned capital increase of Metrovacesa, S.A. as approved by the shareholders at the annual general meeting held on June 28, 2011, Banco Santander, S.A. and the individuals and legal entities whose voting rights are attributed to the Bank pursuant to the assumptions provided in article 5 of Royal Decree 1066/2007, of July 27, governing the legal framework for public take-over bids of securities, have become the holders of a total ofheld 344,530,740 shares in Metrovacesa, S.A., representing 34.88% of the company’s voting rights.
On December 19, 2012, the creditor entities that took part in the aforementioned debt restructuring agreement announced that they had reached an agreement to promote the delisting of the shares of Metrovacesa, S.A. and they voted in favor of this at the general meeting held for this purpose on January 29, 2013. Following the approval of the delisting and the public takeover offer by the shareholders at the Metrovacesa, S.A. general meeting, the entities prepared a delisting public takeover offer aimed at the Metrovacesa, S.A. shareholders that did not enter into the agreement, at €2.28 per share. Our share of the delisting public takeover offer was 45.56% and, as a result, following 97.29% acceptance of the public takeover offer, we acquired an additional 1.953% of Metrovacesa, S.A. for which we paid €44 million. Following this transaction, at December 31, 2013, we held an ownership interest of 36.82% in the share capital (excluding the treasury shares held by it which, according to the information provided byof Metrovacesa, S.A., amounted to 401,769 as at July 29, 2011).
New partners for Santander Consumer USA
On October 21, 2011 we announced that Santander Holdings USA, Inc. (“SHUSA”) and Santander Consumer USA Inc. (“SCUSA”), a majority-owned subsidiary of SHUSA, entered into an investment agreement with Sponsor Auto Finance Holdings Series LP, a Delaware limited partnership (“Auto Finance Holdings”). Auto Finance Holdings is jointly owned by investment funds affiliated with each of Warburg Pincus LLC, Kohlberg Kravis Roberts & Co. L.P. and Centerbridge Partners L.P. (collectively, the “New Investors”), as well as DFS Sponsor Investments LLC, a Delaware limited liability company affiliated with Thomas G. Dundon, the Chief Executive Officer of SCUSA and a Director of SHUSA, and Jason Kulas, Chief Financial Officer of SCUSA. As previously reported on October 20, 2011, SCUSA also entered into an investment agreement with DDFS LLC (“DDFS”), a Delaware limited liability company affiliated with Thomas G. Dundon.
On December 31, 2011, Auto Finance Holdings Series and DDFS completed their investments in SCUSA. SCUSA increased its share capital on that date through the issuance of shares to Auto Finance Holdings for an aggregate consideration of $1.0 billion and to DDFS for an aggregate consideration of $158.2 million.
The transaction valued SCUSA at $4 billion. Upon its completion, Banco Santander, S.A. realized a capital gain of €872 million under Gains (losses) on disposal of assets not classified as non-current assets held for sale, of which €649 million related to the measurement at fair value of the 65% ownership interest retained in SCUSA. The fair value of SCUSA was determined using comparable market data, recent transactions and discounted cash flow analyses, taking into account contingent payments.
As a result of these transactions, SHUSA, the New Investors (indirectly through Auto Finance Holdings) and Mr. Dundon (indirectly through DDFS and DFS Sponsor Investments LLC) ownowned approximately 65%, 24% and 11% of the common stock of SCUSA, respectively.
Also on December 31, 2011, SHUSA, SCUSA, Auto FinancingFinance Holdings, DDFS, Thomas G. Dundon and Banco Santander, S.A. entered into a shareholdersshareholders’ agreement (the “Shareholders“Shareholders’ Agreement”). The ShareholdersShareholders’ Agreement provides each of SHUSA, DDFS and Auto Finance Holdings with certain board representation, governance, registration and other rights with respect to their ownership interests in SCUSA. Subject to the terms and conditions of the ShareholdersShareholders’ Agreement, SHUSA, Auto Finance Holdings and DDFS jointly manage SCUSA and share control over it.
25
Pursuant to the ShareholdersShareholders’ Agreement, depending on SCUSA’s performance during 2014 and 2015, if SCUSA exceeds certain performance targets, SCUSA may be required to pay up to $595.0 million in favor of SHUSA. If SCUSA does not meet such performance targets during 2014 and 2015, SCUSA may be required to make a payment to Auto Finance Holdings of up to the same amount.
The ShareholdersShareholders’ Agreement also provides that each of Auto Finance Holdings and DDFS will have the right to sell, and SHUSA will be required to purchase, their respective shares of SCUSA common stock, at its then fair market value, and Auto Finance Holdings and DDFS, if applicable, will receive the payment referred to above at that time (i) at the fourth, fifth and seventh anniversaries of the closing of the investments, unless an initial public offering of SCUSA common stock has been previously consummated or (ii) in the event there is a deadlock with respect to certain specified matters which require the approval of the board of directors or shareholders of SCUSA. See “Information on the Company—A. History and development of the company—Principal Capital Expenditures and Divestitures—Recent events — Santander Consumer USA successfully completed its initial public offering”
Offer to exchange subordinated debt instruments for non-subordinated debt instruments
On November 15, 2011, we announced an offer (“the Offer”) to holders of the existingcertain securities identified in the table below (“the Existing(the “Existing Securities”), to exchange Existing Securities for new securities to be issued (“the New(the “New Securities”).
The Existing Securities constituted eight series of subordinated debt instruments issued by Santander Issuances, S.A.U., which are listed on the Luxembourg Stock Exchange.
The New Securities are senior debt instruments denominated in pounds sterling and euros with a maturity date of December 1, 2015. The New Securities trade on the Luxembourg Stock Exchange.
We used funds pursuant to the Offer from our ordinary available liquidity to comply with our payment obligations pursuant to the Offer.
The Offer allows managing more effectively the Group’s outstanding liabilities, taking into consideration prevailing market conditions.
On November 24, 2011, we announced (i) the aggregate nominal amount of the Existing Securities accepted for the exchange; and (ii) the final nominal amount and interest rate of the New Securities. Such amounts as set forth in the table below.
Series No. | ISIN | Aggregate Amount of Existing Securities accepted for Exchange | Aggregate Nominal Amount of New Securities to be issued | Aggregate Outstanding Amount of Existing Securities after the exchange | ||||||||||||
1 | XS0291652203 | € | 274,000,000 | € | 243,300,000 | € | 1,226,000,000 | |||||||||
2 | XS0261717416 | € | 202,200,000 | € | 180,000,000 | € | 347,800,000 | |||||||||
3 | XS0327533617 | € | 394,250,000 | € | 347,500,000 | € | 1,105,750,000 | |||||||||
4 | XS0284633327 | £ | 146,053,000 | £ | 124,800,000 | £ | 153,947,000 | |||||||||
5 | XS0255291626 | € | 165,471,000 | € | 141,300,000 | € | 334,529,000 | |||||||||
6 | XS0301810262 | € | 85,150,000 | € | 72,600,000 | € | 414,850,000 | |||||||||
7 | XS0440402393 | € | 135,500,000 | € | 131,500,000 | € | 313,750,000 | |||||||||
8 | XS0440403797 | £ | 70,950,000 | £ | 65,000,000 | £ | 772,400,000 | |||||||||
26
The final nominal amount and interest rate of the New Securities are set forth below:
€1,116,200,000 3.381% senior notes due December 1, 2015.
GBP 189,800,000 3.160% senior notes due December 1, 2015.
The Offer generated gross capital gains of approximately €144 million, included in the 2011 accounts.
Offer to repurchase preferred securities and subscribe Banco Santander shares
On December 2, 2011, we announced an offer (the “Repurchase Offer”) to repurchase Series X Preferred Securities issued by Santander Finance Capital, S.A.U. in June 2009 and guaranteed by the Bank (the “Series X Preferred Securities”) and a simultaneous public offer to subscribe for newly-issued shares of Banco Santander (the “New Shares”), on the terms set out below. We refer to the Repurchase Offer and the issuance of New Shares as the “Capital Increase.”
In order to participate in the Repurchase Offer, holders of Series X Preferred Securities were required to irrevocably subscribe the number of New Shares which corresponded to the repurchase price of their Series X Preferred Securities. The New Shares were offered solely to the abovementioned holders of Series X Preferred Securities who accepted the Repurchase Offer.
The issue price of the New Shares (nominal plus premium) equaled the arithmetic mean of the average weighted prices of Banco Santander shares on the Spanish stock exchanges during the Acceptance Period. Consequently, the number of New Shares to be subscribed by each holder of Series X Preferred Securities who accepted the Repurchase Offer was the result of dividing the nominal value of the preferred securities (€25.00) by the issue price of the New Shares.
On December 28, 2011, we announced that during the acceptance period, the holders of 77,743,969 preferred securities, representing 98.88% of the preference shares outstanding, had accepted the repurchase offer.
The holders of these preferred securities subscribed 341,802,171 shares under the Capital Increase. Consequently, the total amount (nominal plus premium) subscribed was €1,943,599,225, and the nominal value of the Capital Increase was €170,901,085.50. The New Shares represented 3.84% of the share capital of Banco Santander following the Capital Increase.
On December 30, 2011, Banco Santander acquired the Series X Preferred Securities and the new shares subscribed by the holders of those preferred securities were paid up.
The new shareholders were, as of December 30, 2011, entitled to all of the rights pertaining to the shares of Banco Santander and, in particular, have the right to participate in theSantander Dividendo Elección program.
The Capital Increase resulted in a raise in core capital of 34 basis points.
Sale of the Colombian unit to the Chilean group Corpbanca
On December 6, 2011, we reported that we had reached an agreement with the Chilean group Corpbanca for the sale of Banco Santander Colombia and its other subsidiaries in that country.
The transaction values our Colombian operations (which in 2010 contributed US$54 million to the Group’s profits and is not a core market for the Group) at US$1,225 million and will generate for Santander a capital gain of approximately €615 million, which will be allocated to reinforce our balance sheet.
Banco Santander Colombia shares are listed on the Colombian Stock Exchange and has a free float of approximately 2.15% of its share capital.
The transaction is subject to obtaining the relevant regulatory approvals and is expected to be completed within the second quarter of 2012.
New capitalCapital requirements
On December 8, 2011, the European Banking Authority (“EBA”) published aggregate figures relating to capital requirements of a temporary and extraordinary nature applicable to financial institutions, calculated on the basis of data as of September 30, 2011.
27
According to the updated calculations, the additional capital required for Grupo Santander amountsamounted to €15,302 million versus the €14,971 million published by the EBA on October 26, 2011, which was based on estimated figures for September 30, 2011.
In accordance with This amount was reached as follows: (i) €6,829 million of Valores Santander, which have to be converted into shares before October 2012; (ii) €1,943 million through the exchange of preferred shares for ordinary new requirementsshares; (iii) €1,660 million through the application of the EBA, our objective is to attain a 10% core capital ratio, which we expect to achieve through the organic creation of capital, optimization of risk-weighted assets, expansion of the use of internal capital calculation models and other measures, including the possible sale of assets.
Tender offer for subordinated notes
On January 11, 2010, Banco Santander S.A. offered to purchase for cash 13 series of subordinated notes issued by several entities of Grupo Santander for an aggregate nominal amount of €3.3 billion.
The acceptance level of the exchange offers reached 60% and the nominal amount of the securities accepted for purchase was approximately €2 billion.
Also, on February 17, 2010, Banco Santander, S.A. offered to purchase for cash perpetual subordinated notes issued by Santander Perpetual, S.A.U. for a total nominal amount of US$1.5 billion (of which Santander held approximately US$350 million). The aggregate nominal amount of securities accepted for purchase was US$1.1 billion, representing 95% of the outstanding notes not held by Santander.
Bolsas y Mercados Españoles (“BME”)
On February 22, 2010, we sold to institutional investors 2,099,762 shares of BME representing approximately 2.5% of its share capital,Dividendo Elección program (scrip dividend) at a price of €20.0 per share, which amounts to a total of approximately €42 million. The capital gain for Grupo Santander was of €30.4 million. Grupo Santander maintains a stake of 2.5% in the capital of BME and will continue to be represented on its board of directors.
James Hay Holdings Limited
On March 10, 2010, Santander Private Banking UK Limited completed the sale of James Hay Holdings Limited (including its five subsidiaries) through the transfer of all the shares of James Hay Holdings Limited to IFG UK Holdings Limited, a subsidiary of the IFG Group, for a total of £39 million.
28
Companhia Brasileira de Soluções e Serviços (“CBSS”) and Cielo S.A.
On April 25, 2010, we announced that we had reached an agreement with Banco do Brasil S.A. and Banco Bradesco S.A. for the sale of the entire stake held by Grupo Santander in the companies Companhia Brasileira de Soluções e Serviços (15.32% of the capital), and Cielo S.A. – formerly Visanet – (7.20% of the capital).
The total agreed sale price was BRL200 million (approximately €89 million) for the 15.32% of CBSS and BRL1,487 million (approximately €650.7 million) for the 7.20% of Cielo.
The net capital gain generated for Grupo Santander was approximately €245 million.
The closing of the transactions took place in July 2010.
Acquisition of AIG Bank Polska Spolka Akcyina
On June 8, 2010, Santander Consumer Bank S.A. (Poland) increased capital through the issuance of 1,560,000 new shares, fully subscribed by AIG Consumer Finance Group Inc. who made a contribution of 11,177,088 shares of AIG Bank Polska S.A. representing a 99.92% of its share capital. The amount of the capital increase amounted to 452 million Polish zlotys (€109 million approximately as of the date of the transaction).
The capital increase has diluted the Group’s share capital of Santander Consumer Bank S.A. (Poland), which is now 70%.
Acquisition of 24.9% of Banco Santander Mexico
On June 9, 2010, we announced that Banco Santander had reached an agreement with Bank of America to acquire the 24.9% stake held by the latter in Grupo Financiero Santander (“Banco Santander Mexico”) for an amount of US$ 2.5 billion. Following this transaction, our holding in Banco Santander Mexico will amount to 99.9%.
In 2003, Bank of America acquired this 24.9% stake from Santander for an amount of US$1.6 billion.
The transaction was completed on September 23, 2010.
Agreement to purchase Royal Bank of Scotland branch offices
In August 2010 Santander UK plc announced that it had entered into an agreement to acquire the portion of the banking business carried on by Royal Bank of Scotland (RBS) through its branches in England and Wales and the NatWest network in Scotland, as well as certain SME and corporate banking centers. The acquisition is currently in progress and is expected to be completed in the fourth quarter of 2012, once the necessary approvals have been obtained and certain other conditions have been met.
Acquisition of CitiFinancial Auto’s auto loan portfolio
On June 24, 2010, we announced that we had reached an agreement with Citigroup Inc. (“Citi”) to purchase US$3.2 billion of CitiFinancial Auto’s auto loan portfolio. In addition, Santander and Citi entered into an agreement under which Santander will service a portfolio of US$7.2 billion of auto loans that will be retained by Citi.
Santander purchased the US$ 3.2 billion portion of the portfolio at a price equal to 99% of the value of the gross receivables.
The transaction closed on September 3, 2010.
Acquisition of the commercial banking business of Skandinaviska Enskilda Banken in Germany
On July 12, 2010, we announced that we had reached an agreement with Skandinaviska Enskilda Banken (SEB Group) for the acquisition by our affiliate Santander Consumer Bank AG of SEB’s commercial banking business in Germany for an amount of approximately €494 million (€555 million deducting certain amendments to the purchase price agreed between the parties).
Following the acquisition of SEB’s commercial banking business in Germany, which includes 173 branches and serves one million customers, the number of branches of Santander Consumer Bank’s network in Germany almost doubled.
29
The transaction closed on January 31, 2011, once the appropriate regulatory approvals were obtained.
Tender offer for Santander Bancorp shares
On July 23, 2010, we announced the completion of the tender offer by our wholly-owned subsidiary, Administración de Bancos Latinoamericanos Santander, S.L. (“ABLASA”), for all outstanding shares of common stock of Santander BanCorp not owned by ABLASA at US$12.69 per share.
The offer expired at 12:00 midnight, New York City time, on July 22, 2010. Based on information provided by BNY Mellon Shareowner Services, the depositary for the tender offer, 3,644,906 Santander BanCorp shares were validly tendered and not withdrawn. The tendered shares represented approximately 7.8% of Santander BanCorp’s outstanding shares of common stock. Together with the 90.6% of the outstanding shares already held by ABLASA, ABLASA held a total of approximately 45,886,244 shares or 98.4% of the 46,639,104 Santander BanCorp shares outstanding after the expiration of the tender offer. All Santander BanCorp shares that were validly tendered and not withdrawn immediately prior to the expiration of the tender offer were accepted and purchased by ABLASA.
ABLASA acquired the remaining publicly held shares of Santander BanCorp through a short-form merger under Puerto Rico law on July 29, 2010. As a result of the merger, any remaining shares of Santander BanCorp common stock were cancelled pursuant to the merger in consideration for the same offer price of US$12.69 cash paid in the tender offer, without interest and less any required withholding taxes (other than shares of Santander BanCorp common stock for which appraisal rights were validly exercised under Puerto Rico law). Upon completion of the merger, Santander BanCorp became a wholly owned subsidiary of Banco Santander, its shares ceased to be traded on the New York Stock Exchange, and Santander BanCorp was no longer required to file certain information and periodic reports with the U.S. Securities and Exchange Commission.
Acquisition of auto loan portfolio in the USA from HSBC
On August 27, 2010, we purchased a US$ 4.3 billion auto loan portfolio in the USA from HSBC, for a total consideration of approximately US$ 4 billion. The portfolio amount represents the carrying amount of the loans at June 30, 2010, and the purchase price is subject to final adjustments.
Santander Consumer USA is already servicing the auto loan portfolio that was acquired.
The transaction required only US$ 342 million financing from Grupo Santander, since it carries financing from a third party as well as assumptions of existing securitizations pertaining to part of the portfolio.
Agreement with Qatar Holding by which it will subscribe a bond issue
On October 18, 2010, Banco Santander announced that it had reached an agreement with Qatar Holding, by which the latter will subscribe bonds issued by Banco Santander amounting to US$ 2.719 billion, mandatorily exchangeable for existing or for new shares of Banco Santander Brasil, at the choice of Banco Santander.
This transaction represents 5% of the share capital of Banco Santander Brasil.
The bonds will mature on the third anniversary of the issuance date. The conversion or exchange price will be Brazilian reais 23.75 per share and the bonds will pay an annual coupon of 6.75% in U.S. dollars.
The transaction is part of Banco Santander’s commitment for its Brazilian affiliate to have a free float of 25% by the end of 2014.
Acquisition of Sovereign
On October 13, 2008, we announced that we would acquire Sovereign through a share exchange. At the date of the announcement, we held 24.35% of the outstanding ordinary shares of Sovereign. The capital and finance committee of Sovereign, composed of independent directors, requested that Santander consider acquiring the 75.65% of the company that it did not own. The committee assessed the transaction and recommended it to the company’s board of directors.
Under the terms of the definitive transaction agreement, which was unanimously approved by the non-Santander directors of Sovereign and by the executive committee of Santander, Sovereign shareholders received 0.2924 Banco Santander American Depository Shares (“ADSs”) for every 1 ordinary Sovereign share they owned (or 1 Banco Santander ADS for every 3.42 Sovereign shares).
30
On January 26, 2009, Banco Santander held an extraordinary general meeting at which its shareholders approved the capital increase for the acquisition of 75.65% of Sovereign Bancorp Inc.
On January 28, 2009, the shareholders at the general meeting of Sovereign approved the acquisition.
On January 30, 2009, the acquisition of Sovereign was completed and Sovereign became a wholly-owned subsidiary of Grupo Santander. The transaction involved the issuance of 0.3206 ordinary shares of Banco Santander for each ordinary share of Sovereign (equivalent to the approved exchange of 0.2924 ADSs adjusted for the dilution arising from the capital increase carried out in December 2008). To this end, 161,546,320 ordinary shares were issued by Banco Santander for a cash amount (par value plus share premium) of €1.3 billion.
At the time of the acquisition this transaction gave risefinal dividend corresponding to goodwill of US$2,053fiscal year 2011; and (iv) €4,890 million (€1,601 million at the exchange rate on the date of the acquisition, €1,425 million at the exchange rate on December 31, 2009).
Acquisition of Real Tokio Marine Vida e Previdencia
In March 2009, the Santander Brazil Group acquired the 50% of the insurance company Real Seguros Vida e Previdencia (formerly Real Tokio Marine Vida e Previdencia) that it did not already own from Tokio Marine for BRL 678 million (€225 million).
CEPSA
On March 31, 2009, we announced that we had reached an agreement with the International Petroleum Investment Company (“IPIC”) of the Emirate of Abu Dhabi for the sale of our 32.5% stake in CEPSA to IPIC, at a price of €33 per share, which would be reduced by the amount of any dividends paid, prior to the closing of the transaction, charged to the 2009 fiscal year. With this transaction, our historical annual return derived from our investment in CEPSA was of 13%. The sale had no impact on Grupo Santander’s earnings.
On July 30, 2009, we announced that we had transferred to IPIC our 32.5% stake in CEPSA at the agreed price of €33 per share. The acquirer applied to the CNMV for exemption from the obligation to launch a tender offer, in accordance with the provisions of article 4.2 of Royal Decree 1066/2007, owing to the existence of a shareholder with a higher stake in the sharethrough organic capital the denial of which would be cause for termination of the contract. On September 15, 2009, the CNMV granted this exemption.
France Telecom España, S.A.(“France Telecom”)
On April 29, 2009, we announced that we had reached an agreement with the company Atlas Services Nederland BV (a 100%-owned affiliate of France Telecom) on the sale of the 5.01% share package held by Grupo Santander in France Telecom España, S.A. for an amount of €378 million. The sale generated a loss for Grupo Santander of €14 million.
Triad Financial Corporation
In June 2008, Banco Santander’s executive committee authorized the acquisition by Santander Consumer USA Inc. of the vehicle purchase loan portfolio and an internet-based direct loan platform (www.roadloans.com) belonging to the US group Triad Financial Corporation. The acquisition price, US$615 million, was determined on the basis of an analysis of each individual loan. In July 2009, Banco Santander’s executive committee authorized Santander Consumer USA Inc. to acquire Triad Financial SM LLC with its remaining portfolio for US$260 million.
Banco de Venezuela
On July 6, 2009, we announced that we had closed the sale of our stake in Banco de Venezuela to Bank for Economic and Social Development of Venezuela (Banco de Desarrollo Económico y Social de Venezuela), a public institution of the Bolivarian Republic of Venezuela for US$1,050 million, of which US$630 million were paid on that date, US$210 million were paid in October 2009generation and the remainder was paid in December 2009. This sale did not have a material impact on the Group’s income statement.
31
Offers to exchange perpetual issues for other financial instruments
On July 9, 2009, Banco Santander, S.A. and its subsidiary Santander Financial Exchanges Limited launched various offers to exchange 30 issues of securities eligible to be included in capital for a total nominal amount of approximately €9.1 billion for securities to be issued by Santander and its subsidiaries. The exchange envisaged the delivery of new securities that meet the current market standards and regulatory requirements to be classified as equity at the consolidated Group level.
The purpose of these offers was to improve the efficiency of the Group’s capital structure and to strengthen Grupo Santander’s balance sheet. The Group’s annual borrowing costs were not increased as a result of exchange offers.
The acceptance level of the exchange offers reached 49.8% and the nominal amount of the new securities issued was €3,210 million.
The capital gains generated by this transaction amounted to €724 million which were used to strengthen the Group’s balance sheet.
Purchase of securitizations
On August 24, 2009, Banco Santander invited holderstransfer of certain securitization bonds for a total nominal amount of €25,273 million to tender any or all of the bonds for purchase by Banco Santander for cash.
The aggregate outstanding nominal amount of securities accepted for purchase was €609 million. The capital gains generated amounted to €97 million which were used to strengthen the Group’s balance sheet.
Initial Public Offering of Banco Santander (Brasil) S.A.
On October 13, 2009, our subsidiary Banco Santander (Brasil) S.A. (Santander Brasil) closed its initial public offering of 525,000,000 units, each unit representing 55 ordinary sharesstakes, mainly in Chile and 50 preference shares, without par value. The offered securities (units) are share deposit certificates. The units were offered in a global offering consisting of an international tranche in the United States and in other countries other than Brazil, in the form of American Depositary Shares (“ADSs”), in which each ADS represented a unit, and a domestic tranche of units in Brazil.
The initial public offering price was BRL 23.50 per unit and $13.4033 per ADS.
Additionally, Santander Brasil granted the international underwriters an option, exercisable before November 6, 2009, to purchase an additional 42,750,000 ADSs to cover any over-allotments in connection with the international tranche. Santander Brasil also granted the domestic underwriters an option, exercisable during the same period, to purchase an additional 32,250,000 units to cover any over-allotments in connection with the Brazilian tranche.
Once the global offering was completed and after the underwriters exercised their options, the capital increase amount was BRL 13,182 million (€5,092 million). The free float of Santander Brasil rose to approximately 16.45% of its share capital, from only 2.0% before the global offering. Santander Brasil undertook to raise the free float to at least 25% of its share capital within three years from the date of the initial public offering in order to maintain its listing on Level 2 of theBolsa de Valores, Mercadorias e Futuros (BM&FBOVESPA). The ADSs are listed on the New York Stock Exchange.
Santander Group’s net gains from the placement amounted to €1,499 million.
Prior to the public offering, on August 14, 2009, the Group transferred to Santander Brasil, through share exchange transactions, all the share capital of certain Brazilian asset management, insurance and banking companies (including Santander Seguros S.A. and Santander Brasil Asset Management Distribuidora de Títulos e Valores Mobiliários S.A.) which were owned by Santander Group and certain non-controlling shareholders. The total equity of the transferred businesses was valued at BRL 2.5 billion. The purpose of these transactions was to consolidate in a single entity Santander Group’s investments in Brazil, thus streamlining the current corporate structure and grouping the ownership interests held by Santander Group and by the non-controlling shareholders in those entities in the share capital of Santander Brasil. As a result of these transactions, the share capital of Santander Brasil was increased by approximately BRL 2.5 billion through the issuance of 14,410,886,181 shares, of which 7,710,342,899 were ordinary shares and 6,700,543,282 were preference shares. Additionally, on September 17, 2009, Banco Santander sold to Santander Brasil a loan portfolio consisting of loans to Brazilian companies and their affiliates abroad for US$ 806.3 million.
32
Santander Brasil is the third largest private-sector bank in Brazil, the largest bank controlled by an international financial group and the fourth largest bank overall in Brazil in absolute terms, with a market share of 10.5% in terms of loans. Santander Brasil carries on its business activity across the country, although its presence is concentrated in the Southern and South Eastern regions, where it has one of the largest branch networks, according to the Central Bank of Brazil.
In August 2008, Santander Brasil acquired Banco Real, which was then the fourth largest private-sector Brazilian bank in terms of volume of assets. At the time of the purchase, Santander Brasil was the fifth largest private-sector bank in Brazil in terms of volume of assets. The businesses of Banco Real and Santander Brasil were highly complementary before the acquisition. Santander Brasil considered that the acquisition provided considerable opportunities in terms of operational, commercial and technological synergies, building on the best practices of each bank. Banco Real’s strong representation in the states of Rio de Janeiro and Minas Gerais has further enhanced Santander Brasil’s position in the Southern and South Eastern regions of the country, adding to this entity’s already significant presence in those regions, particularly in the State of São Paulo. The acquisition of Banco Real consolidated Santander Brasil’s position as a full-service bank with nationwide coverage, whose size enables it to compete efficiently in its target markets.
In the third quarter of 2010, we sold 2.616% of the share capital of Santander Brasil. The sale price amounted to €867 million, which gave rise to increases of €162 million in Reserves and €790 million in Non-controlling interest, and a decrease of €85 million in Valuation adjustments—Exchange differences.
Sale of 10% of the share capital of Attijariwafa Bank
On December 28, 2009, we announced that we had sold to the Moroccan Société Nationale d’Investissement (SNI) 10% of the share capital of Attijariwafa Bank, at a price of Dirhams 4,149.4 million (approximately €367 million at the exchange rate on such date). The transaction generated for Grupo Santander a capital gain of approximately €218 million, which was recognized under Gains/(losses) on non-current assets held for sale in the consolidated income statement. Following the sale, Grupo Santander holds 4.55% of Attijariwafa Bank.
General Electric Money and Interbanca
The first quarter of 2009 saw the completion of the agreement reached by Banco Santander and General Electric (“GE”) in March 2008 whereby Banco Santander would acquire the units of GE Money in Germany (already acquired in the fourth quarter of 2008), Finland and Austria and its card (Santander Cards UK Limited) and vehicle financing units in the UK, and GE Commercial Finance would acquire Interbanca, an entity specializing in wholesale banking which was assigned to Banco Santander in the distribution of ABN AMRO’s assets. The initial goodwill arising from the acquisition of the GE business amounted to €558 million at December 2009.
Capital Increases
As of December 31, 2009, our capital consisted of 8,228,826,135 fully subscribed and paid shares of €0.50 par value each. In 2009, our capital increased by 234,766,732 shares, or 2.94% of our total capital as of December 31, 2008, as a result of the following transactions:
|
|
Scrip Dividend: On November 2, 2009 we issued 72,962,765 ordinary shares par value €0.5 in the free-of-charge capital increase, corresponding to 0.89% of our share capital. The amount of the capital increase was €36,481,382.50.
As of December 31, 2010, our capital had increased by 100,295,963 shares, or 1.22% of our total capital as of December 31, 2009, to 8,329,122,098 shares as a result of the following transactions:
|
33
|
As of December 31, 2011, our capital had increased by 579,921,105 shares, or 6.96% of our total capital as of December 31, 2010, to 8,909,043,203 shares as a result of the following transactions:
| • | Valores Santander: On October 6, 2011, 1,223,457 new shares were issued in exchange for 3,458Valores Santander. |
| • | Scrip Dividend:On February 1, 2011, we issued 111,152,906 ordinary shares par value €0.5 in the free-of-charge capital increase, corresponding to 1.33% of our share capital. The amount of the capital increase was €55,576,453. Additionally, on November 2, 2011, the Bank issued 125,742,571 ordinary shares par value €0.5 in the free-of-charge capital increase, corresponding to 1.49% of our share capital. The amount of the capital increase was €62,871,285.50. |
| • | Repurchase of Series X Preferred Securities and subscription of Banco Santander shares: On December 28, 2011, we announced that the holders of 77,743,969 preference shares had accepted the Repurchase Offer. On December 30, 2011, the holders of these preference shares subscribed 341,802,171 shares. Consequently, the total amount (nominal plus premium) subscribed was €1,944 million and the nominal value was €170.9 million. The New Shares represent 3.84% of our share capital after the Capital Increase. |
Recent Events
Scrip dividend
On JanuaryAs of December 31, 2012, furtherour capital had increased by 1,412,136,547 shares, or 15.85% of our total capital as of December 31, 2011, to the reports on Form 6-K dated December 12, 2011 and January 12, 2012, we announced that the trading period for the free allotment rights corresponding to the free-of-charge capital increase by means of which theSantander Dividendo Elección program was carried out ended on January 30, 2012.
During the period set for that purpose, the holders of 13.35%10,321,179,750 shares as a result of the free allotment rights accepted the irrevocable undertakingfollowing transactions:
| • | Valores Santander: On March 30, 2012, we informed that the Ordinary General Shareholders’ Meeting held that day had resolved to grant the holders ofValores Santander an option to convert their securities on four occasions before October 4, 2012, the mandatory conversion date for the outstandingValores Santander. As a result on June 7, 2012, July 5, 2012, August 7, 2012, September 6, 2012 and October 9, 2012 we issued 73,927,779, 193,095,393, 37,833,193, 14,333,873 and 200,311,513 new shares related to the conversion requests of 195,923, 511,769, 98,092, 37,160 and 519,300Valores Santander, respectively. |
| • | Scrip Dividend:On January 31, 2012, May 2, 2012, July 30, 2012 and November 2, 2012, we issued 167,810,197 shares, 284,326,000 shares, 218,391,102 shares and 222,107,497 shares (1.88%, 3.13%, 2.27%, and 2.20% of the share capital, respectively), giving rise to capital increases of €83,905,098.50, €142,163,000, €109,195,551 and €111,053,748.50, respectively. |
As of December 31, 2013, our capital had increased by 1,012,240,738 shares, or 9.81% of our total capital as of December 31, 2012, to waive their free allotment rights issued by Banco Santander. Consequently, Banco Santander has acquired 1,189,774,111 rights for11,333,420,488 shares as a total gross consideration of €141,583,119.21. Banco Santander has waived the free allotment rights so acquired.
The holdersresult of the remaining 86.65% of the free allotment rights have chosen to receive new shares. Thus, the definitive number of ordinary shares of €0.5 of face value issued in the free-of-charge capital increase is 167,810,197, corresponding to 1.88% of the share capital, and the amount of the capital increase is €83,905,098.50. The value of the remuneration corresponding to the shareholders who have requested new shares amounts to €918,593,018.38.following transactions:
The authorization for the admission to listing of the new shares in the Spanish Stock Exchanges and in the other stock exchanges where Banco Santander is listed was granted in February 2012.
| • | Scrip Dividend:On January 30, 2013, April 30, 2013, July 31, 2013 and October 31, 2013, we issued 217,503,395 shares, 270,917,436 shares, 282,509,392 shares and 241,310,515 shares (2.06%, 2.51%, 2.55%, and 2.13% of the share capital, respectively), giving rise to capital increases of €108,751,697.50, €135,458,718, €141,254,696 and €120,655,257.50, respectively. |
Other Material Events
Resignation of Francisco Luzón
On January 23, 2012, we announced that our board of directors resolved at the meeting held that day to leave record of the resignation presented by Francisco Luzón from his positions as director and member of the executive committee of the Bank, with effect from January 23, 2012. Francisco Luzón has taken voluntary pre-retirement, also ceasing to hold office as an executive vice president of the Bank and head of its America division.
Transfer of interest in Banco Santander (Brasil), S.A.
In January and March 2012 the Group transferred shares representing 4.41% and 0.77%, respectively, of the capital stock of Banco Santander (Brasil), S.A. to two leading international financial institutions. These institutions have undertaken to deliver these shares to the holders of bonds issued by Banco Santander in October 2010 which are exchangeable for Banco Santander (Brasil), S.A. shares upon maturity, in accordance with their terms.
Royal Decree-Law 2/2012 and Royal Decree-Law 18/2012
OnIn 2012, the Spanish Government implemented a series of structural reforms including measures aimed at cleaning up the balance sheets of Spanish credit institutions affected by the impairment of their assets relating to the real estate sector.
Among the main actions carried out were the approval on February 3, 2012 the Spanish Ministry of Economy and Competitiveness approved the Royal Decree-Law 2/2012 and on May 18, 2012 of Royal Decree-Law 18/2012 on the clean-up of the financial sector.
This Royal Decree-Law forms partsector, through which a review of the Government’s structural reforms and contains, among others, a seriesminimum provisioning percentages to be taken into consideration in the estimation of measures aimed at cleaning up Spanish credit institutions’ balance sheets, which were adversely affected by the impairment of their assets linkedlosses relating to financing granted to the real estate industry. With this legislation, the Government intends to design an integrated reform strategy that will impact the valuation of these assetssector in Spain and entail the clean-up of Spanish credit institutions’ balance sheets so that financial institutions can once again fulfill their essential function of channeling savings into efficient investment projects that encourage economic activity, growth and employment.
34
The balance sheet clean-up measures take the form of two main ideas:
i) A revision of the minimum percentages of the provisions that institutions must recognize in their balance sheets in relation to lending to the real estate industry and to foreclosed assets and assets received in payment of loansdebt arising from financing granted to the real estate industry; and
ii) An increase in the minimum capital required forthat sector was carried out. Spanish credit institutions calculated on the basis of real estate industry related assets recorded on their balance sheet.
The Royal Decree-Law stipulates that credit institutions mustwere required to comply with itsthe provisions of these regulations by December 31, 2012. The provision required is a one-off provision aimed at eliminating
These requirements gave rise to new provisions in addition to those arising from the uncertainty regardingapplication of the value of these assets –particularly land– on Spanish credit institutions’ balance sheets. It should be noted that these minimum percentages are established hitherto by the Bank of Spain amounting to approximately €6.8 billion, of which €1.8 billion were covered in 2011 as a result of the estimate of the impairment losses on a general basisthe aforementioned assets and the legislation does not include sufficient details for the specific featuresrecognition of the assets held by different institutions, orcorresponding provisions. At the end of those held by a single institution to be reflected.
Taking into account the above, and that at 2011 year-end2012, the Group had reviewedfully covered all the recoverable values of its real estate assets pursuant to IFRSs, we do not believe that this is an adjusting event as defined by IAS 10.required provisions.
With respect to the recognition of the impact of those Royal Decree-Law 2/2012Decree-Laws on the Group’sour IFRS-IASB consolidated financial statements for 2012, the Group will continuewe continued to apply its currentour procedure with regard to Spanish regulatory requirements related to the loan provision and to the valuation of foreclosed assets,, i.e. it will comparewe compared the amount of the provisions for loans and foreclosed assets to be recognized at each dateyear end calculated pursuant to IFRSs (obtained from internal models for credit loss provisions and from external valuations and other evidence for foreclosed assets and assets received in payment of loans) with the amount of the provisions required by the Spanish regulatory requirementrequirements including Royal Decree-Law 2/2012,Decree-Laws in order to ascertain whether the difference between the two amounts iswas not material in relation to the Group’sour consolidated financial statements as a whole and, accordingly, doesdid not require any adjustment to be made for the preparation of the consolidated financial statements under IFRS-IASB.
AsThe difference between loan loss provisions and provisions for foreclosed assets calculated using internal models and external valuations and those calculated under Spanish regulatory requirements was not material as of December 31, 2012.
Financial assistance to recapitalize the Spanish Banking Sector
1. Assessment of balance sheets
In 2012, in order to strengthen the credibility and confidence of the date hereof,banks, an expert and independent assessment was conducted on all loans granted to the private resident sector, both to households (including mortgages) as well as to SMEs and all other non-financial companies.
This exercise was carried out on the 14 largest banks (90% of assets), and in two phases.
The second phase was carried out by Oliver Wyman with the participation of the four main auditing firms in Spain (Deloitte, PwC, Ernst & Young and KPMG), six Spanish and international real estate assessment companies and a project manager, the Boston Consulting Group, which helped the Bank of Spain coordinate the exercise.
The adverse scenario (probability of less than 1%) was based on a 6.5% shrinkage in GDP between 2012 and 2014, a further rise in unemployment (to 27.2% in 2014) and a big fall in real estate prices.
The non-payment probability was multiplied by three in the case of the portfolios of companies and real estate developers (27% and 87%, respectively). In mortgages to individual borrowers, it was not possiblemultiplied by five, to estimate15%, and in foreclosures an expected loss of 64% was considered.
The results of the provisions that will have to be recognizedbottom-up analysis for the banking system, for a three year period (2012-2014) were total systemwide losses on the credit portfolio (operations in Spain) of €270 billion in the consolidated IFRS booksadverse scenario (€183.3 billion in the baseline).
In comparing these losses with the system’s absorption capacity (provisions already made, pre-provision profit, the impact of the protection frameworks, the excess of capital versus the capital required in the adverse scenario), the system’s additional capital needs were estimated to amount to €57.3 billion in the adverse scenario (€53.7 billion after the tax effect) and €24 billion in the baseline scenario (€25.9 billion after the tax effect).
The main results from the analysis were the following:
In the adverse scenario, it was estimated that Banco Santander would be able to raise its capital ratio (from 9.7% to 10.8%) and to have a significant capital surplus (€25.3 billion in 2014).
2. Loan request to European authorities.
On June 9, 2012, the Spanish Government announced that it intended to request a special loan from the European authorities that would be used exclusively to recapitalize the more vulnerable Spanish financial institutions, most of which were former savings banks.
The financial assistance was formally requested on June 25, 2012 and approved on July 20, 2012. The basic conditions are as follows:
3. Creation of the Spanish Bank Restructuring Asset Management Company (“Sareb”).
The creation of Sareb is intended to increase confidence in the Spanish banking system, which could lead to a lower cost of funding and better ratings.
Its objective is to manage and sell in an orderly way the loans and real estate assets placed in it from banks in Groups 1 and 2 over no more than 15 years.
In December 2012 we, together with other Spanish financial institutions, entered into an agreement to invest in Sareb whereby we undertook to invest of up to €840 million (25% in capital and 75% in subordinated debt), and at December 31, 2012, since the provisions will depend, among others,we had purchased €164 million of capital and €490 million of subordinated debt. Our equity stake is around 17% with two representatives on the rateboard of salesdirectors.
In February 2013, following the review of the real estate portfolio,own funds that Sareb required, the general performanceaforementioned undertaking was reduced to €806 million, and the Group disbursed the remaining €44 million of capital and €108 million of subordinated debt.
4. Recapitalization and restructuring of the economybanks that needed state aid.
Following the review and approval of the recapitalization and restructuring plans of banks in need of capital (according to the Oliver Wyman report) by the Spanish and European authorities, the state aid that would be provided to each bank was determined. No state aid was determined to be necessary for Grupo Santander.
The capital to be injected by FROB into Group 1 banks amounted to €36,968 million. In December 2012, this amount was transferred from the European Stability Mechanism to FROB, together with €2.5 billion for FROB’s contribution to Sareb, which recapitalized these banks before the end of the year.
In the case of the four banks that comprise Group 2, FROB injected €1,865 million of capital. Two banks (in Group 3) in need of capital but which showed a capacity to cover their needs themselves did not receive state aid.
The total state aid for banks in need was €38,833 million, significantly below the €54 billion identified by Oliver Wyman for these banks. This lower amount was due to the losses assumed by hybrid instruments, the transfer of assets to Sareb and capital gains realized by the relevant banks.
The recapitalization of the financial sector enabled banks in need of capital to meet their targeted capital ratios.
In addition, and according to the aforementioned Memorandum of Understanding, a profound restructuring was underway in the yeareight banks receiving state aid, which must reduce their balance sheets before 2017.
The European Commission believes that these business reduction plans, which involve closures of branches and in particular,shedding of employees, strengthen the long-term viability of all these banks.
Recent Events
Scrip dividends
At its meeting of January 13, 2014, the Bank’s executive committee resolved to apply theSantander Dividendo Elección scrip dividend scheme on the valuedates on which the third interim dividend is traditionally paid, whereby the shareholders were offered the option of real estate assets. However, ifreceiving an amount equivalent to said dividend, the Government’s negative forecasts are borne out, it is possible that the provision required under IFRSs will converge with the provision required for regulatory purposes calculated pursuant to Royal Decree-Law 2/2012.
Santander and KBC agree to merge Bank Zachodni WBK and Kredyt Bankgross amount of which was €0.152 per share, in Polandshares or cash.
On February 28, 2012,January 30, 2014 we announced that the holders of 86.37% of the free allotment rights chose to receive new shares. Thus, the definitive number of ordinary shares of €0.5 of face value issued in the free-of charge capital increase was 227,646,659, corresponding to 2.01% of the share capital, and the amount of the capital increase was €113,823,329.50. The value of the remuneration corresponding to the holders of free allotment rights who have requested new shares amounts to €1,487,898,563.22. The shareholders holding the remaining 13.63% of the free allotment rights accepted the irrevocable undertaking to acquire free allotment rights assumed by Banco Santander. Consequently, Banco Santander acquired 1,544,614,122 rights for a total gross consideration of €234,781,346.54. Banco Santander waived the free allotment rights so acquired.
On April 10, 2014 we announced the information in connection with the flexible remuneration program Santander Dividendo Elección (scrip dividend scheme) to be applied to the final 2013 dividend. The shareholders were offered the option of receiving an amount equivalent to said dividend, the gross amount of which was €0.149 per share, in shares or cash.
Santander Consumer USA successfully completed its initial public offering
On January 23, 2014, the public offering of shares of Santander Consumer USA Holdings Inc. (SCUSA) was completed and SCUSA’s shares were admitted to trading on the New York Stock Exchange. The placement represented 21.6% of SCUSA’s share capital, of which 4% related to the holding sold by the Group. Following this sale, we hold 60.7% of the share capital of SCUSA. Both Sponsor Auto Finance Holdings Series LP (Sponsor Holdings) -an investee of funds controlled by Warburg Pincus LLC, Kohlberg Kravis Roberts & Co. L.P. and Centerbridge Partners L.P.- and DDFS LLC (DDFS) - a company controlled by Thomas G. Dundon, the Chief Executive Officer of SCUSA- also reduced their holdings.
Since the ownership interests of the former shareholders were reduced to below certain percentages, the prevailing shareholder agreement was terminated, pursuant to the terms and conditions established in said agreement. This termination has included, inter alia, the cancellation of the contingent payment to be made by SCUSA on the basis of its results in 2014 and 2015. It has also entailed the termination of the agreements whereby, SCUSA was controlled jointly by all the above and, as a result, it has begun to be controlled by us on the basis of the percentage held in its share capital.
Issuance of contingent perpetual preferred convertible securities
On March 5, 2014, we announced that the Executive Committee had resolved to carry out an issue of contingent perpetual preferred securities convertible into newly issued ordinary shares of the Bank (“PCCS”), excluding pre-emptive subscription rights and for a nominal value of up to €1.5 billion (the “Issue”). The Issue was carried out through an accelerated bookbuilding process and was targeted only at qualified investors.
The PCCS were issued at par and the interest thereon, the payment of which is subject to certain conditions and is at the discretion of the Bank, was set at 6.25% per annum for the first five years. After that, it will be reviewed by applying a margin of 541 basis points on the five-year Mid-Swap Rate.
On March 25, 2014, Bank of Spain qualified the PCCS as additional tier 1 under the new European rules on capital requirements set by European Regulation 575/2013. The PCCS are perpetual although they may be called under certain circumstances and would be converted into newly issued ordinary shares of Banco Santander if the common equity Tier 1 ratio of the Bank or its consolidated group, calculated in accordance with European Regulation 575/2013, were to fall below 5.125%. At present, the PCCS are traded on the Global Exchange Market of the Irish Stock Exchange.
Agreement for the acquisition of Getnet
On April 7, 2014, we announced the agreement reached for the acquisition, through Banco Santander (Brasil) S.A.’s investee company Santander Getnet Serviços para Meios de Pagamento Socidade Anónima, of 100% of the company Getnet Tecnologia Em Captura e Processamento de Transações H.U.A.H. (“Getnet”) for an amount of 1,104 million reais (approximately €353 million). Following the acquisition, Banco Santander (Brasil) S.A. and KBC Bank NV had entered intowill hold indirectly an investment agreement to combine their Polish banking subsidiaries, Bank Zachodni WBK S.A. (‘Bank Zachodni WBK’) and Kredyt Bank S.A. (‘Kredyt Bank’).
88.5% stake in Getnet. The transaction will entailhave no significant impact on Grupo Santander’s shareholders’ equity.
Getnet specializes in the development and management of technological solutions and services for businesses with electronic transactions. The transaction gives continuity to the growth strategy in the acquiring business. Santander Getnet Serviços para Meios de Pagamento Socidade Anónima is a share capital increasepayment service provider company in Bank Zachodni WBK, wherewhich Santander Brasil and Getnet presently hold 50% each.
It is expected that the newly issued shares in Bank Zachodni WBKtransaction (which is subject to regulatory authorization) will be offered and rendered to KBC and the other shareholders of Kredyt Bank in exchange for their shares in Kredyt Bank. Under the agreements, and subject to independent evaluation and final agreement by Bank Zachodni WBK and Kredyt Bank, as well as to obtaining regulatory approval from the Polish Financial Supervision Authority (Komisja Nadzoru Finansowego) and relevant competition clearance, Bank Zachodni WBK will merge with Kredyt Bank at the ratio of 6.96 Bank Zachodni WBK shares for every 100 Kredyt Bank shares. At current market prices, the transaction values Kredyt Bank at PLN 15.75 a share and BZ WBK at PLN 226.4 a share. The combined bank’s total pro forma value will be PLN 20.8 billion (€5 billion). Both Bank Zachodni WBK and Kredyt Bank are listed on the Warsaw Stock Exchange. The merged bank will continue to be listed on the Warsaw Stock Exchange.
Following the proposed merger, we will hold approximately 76.5% of the merged bank and KBC around 16.4%. The rest will be held by other minority shareholders. We have committed ourselves to help KBC to lower its stake in the merged bank from 16.4% to below 10% immediately after the merger. For this purpose, we will seek to place a stake with investors. In this regard, we have also committed ourselves to acquire up to 5% of the merged bank to assist KBC. Furthermore, KBC intends to divest its remaining stake, with a view to maximizing its value.
35
With this transaction, we will increase our presence in Poland, one of our ten core markets, underlining our long-term commitment to Poland. The proposed merger will consolidate the merged bank’s position as Poland’s third largest bank by all measures, with a market share of 9.6% in deposits, 8.0% in loans and 12.9% in branches (899). With more than 3.5 million retail customers, the merged bank will also be Poland’s third in terms of revenues and profits, significantly closing the gap to the leaders. Including the Santander Consumer finance business, the Group’s total market share in terms of volume will amount to around 10% in Poland. The proposed merger will produce business synergies in addition to those announced following the acquisition of Bank Zachodni WBK by Banco Santander. Santander estimates the impact of this transaction on its Group core capital ratio under Basel II criteria will be around 5 basis points.
Under the investment agreement, Santander has also committed to acquire 100% of Zagiel, the consumer finance arm of KBC in Poland, at an adjusted net asset value, also subject to obtaining the relevant competition clearance. Additionally, the existing cooperation between Kredyt Bank and KBC TFI (KBC’s Polish asset management company) will remain in place for the foreseeable future. The merged bank will distribute KBC TFI’s funds under a non-exclusive distribution agreement for a minimum term of two years from the proposed merger transaction.
The transaction is expected to close inconcluded during the second half of 2012, subject2014.
Offer to the registrationacquire 25% of the merger between Bank Zachodni WBK and Kredyt Bank and to obtaining regulatory approval from Polish Financial Supervision Authority (Komisdja Nadzoru Finansowego)Santander’s Brazilian subsidiary and relevant competition clearance.
Valores Santander
On March 30, 2012,April 29, 2014 we informedhave announced that the Ordinary General Shareholders’ Meeting held that day hadBanco Santander’s board of directors has resolved to grant the holders ofValores Santandermake an optionoffer to convert their securities on four occasions before October 4, 2012, the mandatory conversion date for the outstanding Valores Santander. Specifically, the holders ofValores Santander may request their conversion within the fifteen calendar days prior to each of June 4, July 4, August 4 and September 4, 2012.
Those who opt for the voluntary conversion will receive the number of newacquire all shares of Banco Santander that results fromBrasil not already held by Grupo Santander, representing approximately 25% of Santander Brasil’s share capital. The transaction would be paid for with up to 665 million shares of Banco Santander (parent company), equivalent to The offer will be subject to customary conditions for this type of transaction, including the conversion ratio prevailing asgranting of the date of this report pursuant to the prospectus of the issuance (365.76 shares for eachValorrelevant regulatory authorizations and approval at Santander). In addition, they will receive, subject to the same cancellation events provided in the prospectus, the remuneration corresponding to theirValores Santander accrued until the applicable voluntary conversion date. Brasil €4,686 million.
Without prejudice to such voluntary conversion option, the terms and conditions of the issuanceSantander Brazil would remain unchanged. As a result, the holders ofValores Santander who do not opt for the voluntary conversion in any of the conversion windows will maintain the rights of their securities, which will mandatorily convert into new shares of Santander on October 4, 2012 pursuant to the terms of the prospectus.
Invitation to tender certain securitization bonds for cash
On April 16, 2012, we announced an invitation to all holders of certain securities (the Securities) to tender such Securities for purchase by Banco Santander for cash (the Invitation). The Securities are fixed rate securities (securitization bonds) listed on the AIAF Fixed Rate Market which correspondSao Paulo stock exchange and Banco Santander’s shares (parent company) would be listed on that market as well.
The offer will be subject to 33 different series issued by specific securitization funds managed by Santander de Titulización, S.G.F.T., S.A. series with an aggregate outstanding principal amountcustomary conditions for this type of €6 billion. We intend to accept offers for up to up to a maximum aggregate principal amount of €750 million. Such amount is indicative only and not binding on Banco Santander.
Such holders of Securities may remit, or request their corresponding mediators or participating entities (intransaction, including the case that said owners are not participating entities in Sociedad de Gestión de los Sistemas de Registro, Compensación y Liquidación de Valores, S.A. Unipersonal (Iberclear)) to remit, the corresponding instructions of the tender offers (the Tender Offers) to the tender and information agent, Lucid Issuer Services Limited, as from April 16, 2012.
Tender Offers must specify the number of Securities included in each offer, the outstanding principal amount of such Securities and the price at which such Securities are tendered in the relevant offer. The price shall be specified by each holder as a percentage of the outstanding principal amountgranting of the relevant Securities tendered for purchase. Regarding the senior Securities to which the Invitation is directed, an indicative minimum purchase price has been provided for information purposes onlyregulatory authorizations and is not binding onapproval at Santander Brasil’s and Banco Santander. Banco Santander may, but is not required to accept, Tender Offers made at or below this minimum price.
36
Tender Offers will be irrevocable unless Banco Santander modifies the terms of the Invitation in a manner that makes the Invitation less favorable to holders.
The amount in cash that must be paid for each Security is equal to the sum of (i) the purchase price multiplied by the principal amount of the Securities on the date of settlement which are accepted for purchase plus (ii) interest accrued but not paid since the immediately preceding interest payment date (inclusive) until the date of settlement of the Tender Offers (exclusive) in relation to such Securities.
The terms of the Tender Offers and the procedure to make the Tender Offers are set forth in the tender offer memorandum dated April 16, 2012 (the Tender Offer Memorandum).
We have absolute discretion whether to accept the Securities tendered for purchase, in accordance with the terms and conditions of the Tender Offer Memorandum.
We will satisfy the payment obligations derived from the Invitation, if any, with funds from our treasury.
We reserve the right to modify the terms and conditions of the Invitation as well as to extend, re-open or terminate the Invitation at any moment.
The rationale for the Invitation is to effectively manage the Group’s outstanding liabilities and to strengthen our balance sheet. The Offers are also designed to provide liquidity to Security holders.
On April 25, 2012 we announced the aggregate outstanding principal amount of each of the Securities accepted for purchase which for senior securities amounted to €388,537,762.18 and for mezzanine securities €61,703,163.58. The sale and purchase agreements of the relevant securities have been agreed.
In respect of each security, the aggregate outstanding principal amount means the outstanding principal amount of the relevant security as at the settlement date (i.e. following any reduction of its original principal amount by prepayments prior to such date in accordance, only, with the terms of such security). The settlement date was April 27, 2012.
At December 31, 2011,2013, we had a market capitalization of €50.3€73.7 billion, stockholders’ equity of €76.4€70.6 billion and total assets of €1,251.5€1,115.6 billion. We had an additional €131.5€125.2 billion in mutual funds, pension funds and other assets under management at that date. As of December 31, 2011,2013, we had 63,86658,383 employees and 6,6086,160 branch offices in Continental Europe, 26,29525,368 employees and 1,3791,157 branches in the United Kingdom, 91,88787,069 employees and 6,0465,904 branches in Latin America, 8,9689,741 employees and 723706 branches in the United States (Sovereign Bancorp) and 2,3332,397 employees in other geographic regionsCorporate Activities (for a full breakdown of employees by country, see Item 6 of Part I, “Directors, Senior Management and Employees—D. Employees” herein).
We are a financial group operating principally in Spain, the United Kingdom, other European countries, Brazil and other Latin American countries and the United States, offering a wide range of financial products.
In Latin America, we have majority shareholdings in banks in Argentina, Brazil, Chile, Colombia, Mexico, Peru, Puerto Rico and Uruguay.
Grupo Santander maintains the general criteria used in our 2012 Form 20-F, with the following exceptions:
1) In the Group’s financial statements
2) In businesses
3) Other adjustments
The financial statements of each business area have been drawn up by aggregating the Group’s basic operating units. The information relates to both the accounting data of the companies in each area as well as that provided by the management information systems. In all cases, the same general principles as those used in the Group are applied.
In accordance with the criteria established by the IFRS-IASB, the structure of our operating business areas has been segmented into two levels:
First (or geographic) level. The activity of our operating units is segmented by geographical areas. This coincides with our first level of management and reflects our positioning in the world’s main currency areas.
The reported segments are:
| • | Continental Europe. This covers all retail banking business, |
37
| • | United Kingdom. This includes retail and wholesale banking, asset management and insurance conducted by the various units and branches of the Group in the |
| • | Latin America. This embraces all the Group’s financial activities conducted via |
| • |
|
Second (or business) level. This segments the activity of our operating units by type of business. The reported segments are:
| • | Retail Banking. This area covers all customer banking businesses, including private banking (except those of Corporate Banking, |
| • | Global Wholesale Banking. This business reflects the |
| • | Asset Management and Insurance. This includes our units that design and manage mutual and pension funds and insurance. The Group uses and remunerates the distribution networks for marketing these products through cost- and profit-sharing arrangements. This means that the segment’s profit/loss on this business is the gross income net of the cost of distribution which is the remuneration paid to the network. |
| • | Spain’s run-off real estate. This unit includes loans to customers in Spain whose activity is mainly real estate development, equity stakes in real estate companies and foreclosed assets. |
In addition to these operating units, which cover everything by geographic area and business, we continue to maintain a separate Corporate Activities area. This area incorporates the centralized activities relating to equity stakes in financial companies, financial management of the structural exchange rate position and of the Parent bank’s structural interest rate risk, as well as management of liquidity and of stockholders’ equity through issues and securitizations. As the Group’s holding entity, it manages all capital and reserves and allocations of capital and liquidity. It also incorporates amortization of goodwillthe goodwill’s impairment but not the costs related to the Group’s central services except for corporate and institutional expenses related to the Group’s functioning.
In 2011, Grupo Santander maintains the same primary and secondary operating segments as it had in 2010.
In addition, and in line with the criteria established by IFRS-IASB, the results of businesses discontinued in 2009 (Banco de Venezuela) which were consolidated by global integration, were eliminated from various lines of the income statement and included in “net profit from discontinued operations.”
For purposes of our financial statements and this annual report on Form 20-F, we have calculated the results of operations of the various units of the Group listed below using these criteria. As a result, the data set forth herein may not coincide with the data published independently by each unit individually.
First level (or geographic):
Continental Europe
This area covers theContinental Europe includes all activities carried out in this region: retail banking, activities of the different networksglobal wholesale banking, asset management and specialized units in Europe, principally with individual clients and Small and Medium Enterprises (“SMES”),insurance, as well as private and public institutions.Spain’s run-off real estate. During 2011,2013, there were fivefour main units within this area: the Santander Branch Network, Banesto,Spain, Portugal, Poland and Santander Consumer Finance, Portugal and Bank Zachodni WBK which was incorporated in April 2011, including retail banking, global wholesale banking and asset management and insurance.Finance.
Continental Europe is the largest business area of Grupo Santander by assets. At the end of 2011,2013, it accounted for 37.2%38.0% of total customer funds under management, 42.2%39.9% of total loans to customers and credits and 31.0%18.0% of profit attributed to the Parent bank of the Group’s main businessbank’s total operating areas.
The area had 6,6086,160 branches and 63,86658,383 employees (direct and assigned) at the end of 2011.2013.
38
In 2011,2013, this segment obtained attributable profit of €1,127 million, an increase of €3,872 million after the Continental Europe segment’s profit attributable to the Parent bank decreased 15.1% to €2,849. Profits have been hard hit by deleveraging, the low growth environment and low interest rates, as well as the negative impactheavy impairment losses of gains on financial transactions and fee income.Spain’s real estate portfolio in run-off accounted for in 2012. Return on equity (“ROE”) in 2011 was 9.3%, a 311 basis point decrease from 2010.stood at 3.8%.
The Santander Branch NetworkSpain
Our retail banking activity in Spain iswas carried out mainly through the branch networknetworks of Santander, with support from an increasing number of automated cash dispensers, savings books updaters, telephone banking services, electronic and internet banking.
In order to consolidate the Group’s leadership in Spain and increase profitability and efficiency, Santander merged its two large retail networks (Santander and Banesto) and its private bank (Banif) in 2013. See “A. History and development of the company—Principal Capital Expenditures and Divestitures—Acquisitions, Dispositions, Reorganizations”.
The integration of these units is progressing on schedule, and is even ahead of the initial forecasts in some areas. The process of branch concentration and optimization began in July 2013, together with optimization of staff. This part of the integration is running ahead of schedule and has begun to realize some of the projected cost synergies.
At the end of 2011,2013, we had 2,9154,067 branches and a total of 18,70427,406 employees (direct and assigned), none of which was2 were hired on a temporary basis, dedicated to retail banking in Spain. Compared to 2010, there was a net decrease of 16 branches and 189 employees.basis.
In 2011,2013, profit attributable to the Parent bank from the Santander Branch Networkin Spain was €660€478 million, 22.1% lower44.6% less than 2010,in 2012, while the ROE reached 9.6%was 4.0% (as compared to 11.9%6.3% in 2010)2012). AlthoughThis decrease was mainly due to a 15.4% reduction in net interest income increased by 2.4%which reflects the decrease in volumes and administrative and depreciation and amortization expenses declined 1.2% theythe repricing of mortgages. The decrease in the cost of new deposits has not yet been passed on to all of the stock.
The units in Spain did not feed though profits because of greater provisions.
These results were obtainedbusiness in 2013 in a still difficultcomplicated environment, with insufficientalthough there were signs of an economic recovery, strong competition forimprovement in the second half of the year when GDP ended eight quarters of falls (+0.1% in the third quarter and +0.3% in the fourth quarter of 2013). There was a marked improvement in financial conditions with a sharp decrease in the sovereign debt risk premium and the banking system gained in soundness with stronger solvency and liquidity ratios.
Nevertheless, the banking system continued to be affected by the process of business and low demand for loans.household deleveraging, by interest rates at all-time lows (with the ECB main reference rate at 0.5%), and a non-performing ratio that was still rising.
In 2011, the Santander Branch Network2013, Spain’s lending decreased by approximately 7.8%10.5%, customer funds under management were reducedfell by 4.5%2.2% with deposits decreasing 3.3%, deposits decreased 7.9%marketable debt securities diminishing 65.7%, mutual funds fell 20.6%growing by 28.7% and pension funds declined 3.5%increasing by 8.0%. The activity reflected the scant demand for loanspriority in the last quarters of 2013 of reducing the cost of deposits and developing a strategy in funding which combines cost reductionpolicy to retain customers via mutual funds and volume retention. savings-insurance products.
The ratio of non-performing loans (“NPL”) for Santander Branch Networkratio was 7.49% compared to 3.84% at December 2012. This rise was due to several components: (i) the impact of deleveraging on the loan portfolio, including the cancellation of the public sector financing pursuant to a government program to pay suppliers’ pending invoices, and (ii) some deterioration in the loan portfolio, mainly in the companies segment and real estate mortgages to individuals. The coverage level decreased to 44.0% as compared to 50.0% at the end of 2012.
Portugal
Our main Portuguese retail and investment banking operations are conducted by Banco Santander Totta, S.A. grew to 8.5% and 6.0%, from 5.5% and 4.2% in 2010, respectively. The evolution of NPLs was worse than expected because the downturn in the economy was more severe than envisaged and the fall in lending meant the NPL ratio increased to a greater extent than the volume of NPLs. While the NPL ratio for residential mortgages remained stable, the rise in the NPLs ratio was related to loans with real estate purpose. This reflects a further deterioration in this segment and the Group’s policy to sharply reduce balances in this sector.
Banesto(“Santander Totta”).
At the end of 2011, Banesto2013, Portugal had 1,714640 branches and 9,5485,635 employees (direct and assigned), of which 1353 employees were temporary, a decrease of 48 branches and an increase of 194 employees as compared to the end of 2010.temporary.
In 2011,2013, profit attributable to the Parent bank from Banesto was €130€114 million, a 68.9%6.3% decrease from 2010, while2012, as a result of a higher tax charge. Nevertheless, pretax profits increased by 18.5% mainly due to a 51% drop in provisions after the ROE reached 2.8% as compared to 9.4%large amount provisioned in 2010. In the second halffirst quarter of 2011,2012.
Santander Totta’s strategy remained focused on increasing linkage and improving the Spanish market faced continued weak economic growth, strong tensionstransaction levels of customers and high volatility. The sector’s NPLsdefending spreads on deposits and loans. Management of bad loans also remained a strategic priority.
Lending continued to rise and interest rates were unstable. Liquidity tensionsdecline, although at a more moderate rate (-1% in the financial system triggered a rise in wholesale funding costs.
fourth quarter of 2013 and -5% for the whole year). At the end of 2011, the balance of loans was 9.0% lower2013, customer funds under management declined 4.4% with deposits at €24,191 million, 1% more than a year earlier (-4% excluding repos), marketable debt securities diminishing 33.3%, mutual funds decreasing 32.0% and pension funds increasing 7.8%.
Santander Totta’s NPL ratio was 8.12% at December 31, 2013, up from 6.56% at December 31, 2012 because of the difficult macroeconomic environment. The ROE was 4.5%, as compared to 4.8% in 2012.
Poland
On April 1, 2011, we completed the acquisition of 96% of BZ WBK along with the 50% of BZ WBK Asset Management. The BZ WBK Group is now integrated into Grupo Santander, consolidating its results and business as of the second quarter of 2011. In February 2012, Banco Santander, S.A. and KBC Bank NV (KBC) reached an investment agreement for the merger of their subsidiaries in Poland, BZ WBK S.A. and Kredyt Bank S.A., which was put into effect in early 2013, after the necessary approval was received from the Polish financial supervisor (KNF).
On 22 March 2013, Banco Santander, S.A. and KBC completed the placement of all the shares owned by KBC and 5.2% of the share capital of Bank Zachodni WBK S.A. held by the Group in the market for €285 million, which gave rise to an increase of €292 million in Non-controlling interests.
The merger of BZ WBK and Kredyt Bank is one of the main focuses of management. The process is proceeding faster than envisaged, with a very effective cost management made possible by the efficiency measures taken and the implementation of the integration plan. All branches already have the same IT systems and display the same brand. This rebranding was aided by a marketing campaign across the country.
In two years, Santander has become the third largest bank in Poland in terms of loans and deposits decreased 15.0%(market shares of 7.4% and 8.4%, respectively). At the end of 2013, this unit had 12,363 employees (direct and assigned), of which 1,104 employees were temporary, and 830 branches.
In 2013, attributable profit was €334 million, 1.5% higher than 2012 impacted by the integration of Kredyt Bank and higher minority interests. Profit before minority interests was €447 million (+31.3%), with growth of more than 30% throughout the income statement. On a like-for-like basis (eliminating the perimeter effect of the integration of Kredyt Bank) and in local criteria, net profit was 3.9% higher.
Due to the integration of Kredyt Bank, customer loans increased 66.6% and customer funds under management diminishedgrew by 16.2%, mutual funds fell 22.3% and pension funds declined 7.5%. NPL grew to 5.0%56.3% with a 65.0% increase in 2011, up 0.9 percentage points from 2010 as a result of the still difficult environment, in particular in the real estate segment, and a fall in lending which meant thedeposits. The NPL ratio increased 3.12 percentage points to 7.84% also due to the integration of Kredyt Bank which had higher levels of non-performing loans. The ROE stood at 17.7% a greater extent than the volume NPL.1.2 percentage points decrease from 18.9% in 2012.
Santander Consumer Finance
Our consumer financing activities are conducted through our subsidiary Santander Consumer Finance (SCF) and its group of companies. Most of the activity of Santander Consumer FinanceSCF relates to auto financing, personal loans, credit cards, insurance and customer deposits. These consumer financing activities are mainly focused on Germany, Spain, Italy, Norway, Poland, Finland Sweden, the US (SCUSA began accounted by the equity accounted method at the end of December 2011 without impact on profits) and the UK. WeSweden. SCF also conductconducts business in Portugal, Austria and the Netherlands, among others.
At the end of 2011,2013, this unit had 647613 branches (as compared to 519 at the end of 2010) and 15,61011,695 employees (direct and assigned) (as compared to 13,852 employees at the end of 2010), of which 1,1051,446 employees were temporary.
The SCF business model is based on portfolio diversification, leadership in core markets, efficiency, control of risks and recoveries and a single pan-European platform.
39
In Europe, the focus was on organic growth and cross-selling, backed by brand agreements (37 with 9 manufacturers), which increased the recurrence of profits and boosted new car business, particularly in Germany and the UK. In addition we increased our penetration in the second-hand car sector and in new car sales in central European and Nordic countries. The first steps were also taken in Germany by Santander Retail (former SEB), focusing on mortgages and on capturing customer funds.
In the US, high growth in new loans and the capacity to extract value from a greater presence in the market doubled profits. This attractive performance made it possible for new partners to invest in SCUSA in the fourth quarter which allowed a capital injection of $1,150 million. This operation strengthened the business and increased our future growth capacity.
In 2011,2013, this unit generated €1,228€794 million in profit attributable to the Parent bank, a 51.5%9.6% increase from 2010,2012, while the ROE reached 12.3%7.3% (as compared to 10.3%6.7% in 2010). This improvement was fuelled by an increase in total income, an improvement in efficiency and a drop in loan loss provisions.
Customer loans amounted to €60 billion, 5% less than in 2010 because of the consolidation of SCUSA by the equity accounted method at the end of December 2011. Excluding this impact, gross lending was 16% higher, due to organic growth and the integration of businesses in Germany. Additionally, this area has €39 billion in customer funds under management. NPL decreased to 3.8% in 2011 from 4.9% a year earlier supported by recoveries, which increased 38% in 2011.
Customer deposits increased 27.9% during 2011 fuelled by SC Germany and the entry of Santander Retail.
Portugal
Our main Portuguese retail and investment banking operations are conducted by Banco Santander Totta, S.A. (“Santander Totta”).
At the end of 2011, Portugal operated 716 branches (as compared to 759 branches at the end of 2010) and had 6,091 employees (direct and assigned) (as compared to 6,214 employees at the end of 2010), of which 83 employees were temporary.
In 2011, profit attributable to the Parent bank was €174 million, a 61.8% decrease from 2010, due to the 18.3% decrease in total income and the 87.7% rise in provisions. This rise in provisions reflects the difficult economic environment, which is also strongly increasing NPLs. The NPL ratio increased in 2011 to 4.1% from 2.9% a year earlier. The ROE was 7.0%, as compared to 20.3% in 2010.
In a very difficult economic and financial environment, which led to a slowdown in economic activity and a lack of liquidity in the markets, Santander Totta has focused on strengthening its balance sheet. Lending reflected the deterioration of economic conditions and dropped 5.6% to €28,403 million. Customer funds under management decreased 8.1% and mutual funds and pension funds decreased 41.8% and 42.2%, respectively.
Retail Poland (BZ WBK)
On April 1, 2011, we completed the acquisition of 96% of BZ WBK along with the 50% of BZ WBK Asset Management. The BZ WBK Group is now integrated into Grupo Santander, consolidating its results and business as of the second quarter of 2011.
BZ WBK has the third largest branch network in Poland (622 including 96 agencies), 9,383 employees, €2.4 million retail customers and close to €20 billion of loans and customer funds (mostly deposits).
In the nine months of its consolidation in 2011, BZ WBK posted a profit attributable to the Parent bank of €232 million. For comparison purposes, the profit for the whole year in local criteria was €288 million (which represents an increase of 21.6% since 2010)2012). The ROE stood at 17.9%.
Others
The rest of our businesses in the Continental Europe segment (Banif, Asset Management, Insurance and Global Wholesale Banking) generated profit attributable to the Parent bank of €424 million in 2011, 48.5% less than in 2010. Of these businesses Global Wholesale Banking, provided 69% of total income and 90% of profits. Global Wholesale Banking posted a 51.7% decreaseincrease in profit attributable to the Parent bank (€382 million), hitis mainly explained by market weaknessa 25% decrease in loan-loss provisions, which declined every quarter, bringing the cost of credit to the lowest level of the current economic cycle. This fall was mainly due to a decrease in NPL net entrees and tensionsa decline in the last few quarters,coverage ratio from 109.5% in 2012 to 105.3% in 2013.
Customer loans decreased by 1.2%, and customer funds under management increased by 8.8% mainly due to a 70.6% increase in marketable debt securities partially offset by a 3.2% decrease in customer deposits. The NPL ratio of 4.01% was in line with the figures in 2012 at 3.90% due to the previously mentioned decrease in customer loans and a 1.6% increase in NPL.
Spain real-estate run off
In order to enhance efficiency and specialization in the management of potentially problematic properties in Spain, we have reorganized the management of these assets under a unit that is separate from the units in which such assets were originated.
This unit focuses on: (i) managing real estate clients with whom the Groups holds potentially problematic exposures in order to reduce their exposure, and (ii) property and land management, which includes the sale of existing properties and, in certain cases, real estate development and subsequent marketing and sale.
At the end of 2013, this unit had 629 employees.
In 2013, this unit had €635 million of losses attributable to the Parent bank as well as bycompared to €4,768 million losses in 2012. The strong impairment losses accounted for during 2012, due to the Group’s strategy to give priority to reducing risk and releasing capital and liquidity.deterioration of the real estate portfolio, stabilized in 2013.
40
United Kingdom
As of December 31, 2011,2013, the United Kingdom accounted for 32.2% for31.3% of the total customer funds under management of the Group’s operationoperating areas. Furthermore it also accounted for 33.7%34.6% of total loans to customers and credits and 12.5%18.4% of profit attributed to the Parent bank of the Group’s main businessbank’s total operating areas.
Our UK businesses include Abbey (since 2004), the deposits and branches of Bradford & Bingley (acquired in September 2008) and Alliance & Leicester (acquired in October 2008). They are referred to as “Santander UK”.
Santander UK is focused on the United Kingdom (85% of its balance sheet). More than 80%Kingdom. Around 83% of customer loans are prime mortgages for homes in the UK.U.K. The portfolio of mortgages is of a high quality, with no exposure to self-certified or subprime mortgages and less thanwhile buy to let loans represent around 1% of buy-to-letcustomer loans. At December 31, 2013, the loan to deposit ratio was 123%, 5 percentage points lower than at December 31, 2012. This was a consequence of the reduction of loans exceeding the outflow of customer deposits due to the deleveraging of the loan portfolio consistent with the market.
At the end of 2011,2013, we had 1,3791,157 branches and a total of 26,29525,368 employees (direct and assigned) of which 556394 employees were temporary, in the United Kingdom. Compared to 2010, there was a net decrease of 37 branches and an increase of 2,646 employees.
In 2011,2013, Santander UK contributed €1,145€1,149 million profit attributable to the Parent bank (a 41.7% decrease3.1% increase from 2010)2012). LoansThe ROE was 8.8% (as compared to 7.8% in 2012). Net interest income rose 3.4% and costs increased 3.1%, absorbing the investments in businesses. Provisions fell 28.1%, due to the improved quality in retail and corporate businesses.
As of December 31, 2013, loans and advances to customers increaseddecreased by 7.8%7.3% and customer funds under management increased 6.4% during the same period. ROE was 9.2% (asdecreased 7.2%, with a 13.3% drop in marketable debt securities, a 3.6% decrease in customer deposits and a 30.7% decrease in mutual funds all as compared to 21.3% in 2010).December 31, 2012. The NPL ratio stood still at the end of 2011 increased to 1.9% from 1.8% at the end of 2010. The income statement was affected by the environment of low activity, low interest rates, regulatory changes, higher funding costs and the PPI provision. On the other hand, costs were almost flat and fewer provisions were made, reflecting the good evolution of non-performing loans.1.98%.
Latin America
At December 31, 2011,2013, we had 6,046 offices5,904 branches and 91,88787,069 employees (direct and assigned) in Latin America, (as compared to 5,882 offices and 89,526 employees, respectively, at December 31, 2010), of which 1,5501,683 were temporary employees. At that date, Latin America accounted for 26.0%26.3% of the total customer funds under management, 18.7%19.9% of total loans to customers and credits and 50.8%52.1% of profit attributed to the Parent bank of the Group’s main businessbank’s total operating areas.
Profit attributable to the Parent bank from Latin America was €4,664 million in 2011, a 1.4% decrease from 2010, while the ROE reached 21.8% (as compared to 22.3% in 2010).
Our Latin American banking business is principally conducted by the following banking subsidiaries:
| Percentage held at December 31, 2013 | Percentage held at December 31, 2013 | |||||||||||||||||||
| Percentage��held at December 31, 2011 | Percentage held at December 31, 2011 | |||||||||||||||||||
Banco Santander (Brasil), S.A. | 81.53 | Banco Santander, S.A. (Uruguay) | 100.00 | 75.25 | Banco Santander, S.A. (Uruguay) | 100.00 | ||||||||||||||
Banco Santander Chile | 67.01 | Banco Santander Colombia, S.A. | 97.85 | 67.01 | Banco Santander Puerto Rico | 100.00 | ||||||||||||||
Banco Santander (Mexico), S.A., Institución de Banca Múltiple, Grupo Financiero Santander | 99.86 | Banco Santander Puerto Rico | 100.00 | 75.08 | Banco Santander Perú, S.A. | 100.00 | ||||||||||||||
Banco Santander Río, S.A. (Argentina) | 99.30 | Banco Santander Perú, S.A. | 100.00 | 99.30 | ||||||||||||||||
We engage in a full range of retail banking activities in Latin America, although the range of our activities varies from country to country. We seek to take advantage of whatever particular business opportunities local conditions present.
Our significant position in Latin America is attributable to our financial strength, high degree of diversification (by countries, businesses, products, etc.), and the breadth and depth of our franchise.
The Group announced an agreement to sell its business units in ColombiaProfit attributable to the Chilean group CorpBanca for $1,225Parent bank from Latin America in 2013 was €3,257 million, (estimated capital gainsa decrease of €615 million)23.6% (-16.3% excluding the exchange rate impact), while the ROE reached 13.8% (as compared to 19.2% in 2012). This operation isNet interest income fell by €224 million or 15.1% (-5.5% in constant currency), affected by lower spreads (mainly in Brazil due to be completed during 2012the change of business mix). Operating expenses decreased by €419 million, however, excluding the exchange rate impact, expenses grew by 5.9% because of investments in business development, mainly in Mexico, and it is subjectinflationary pressures. Loan-loss provisions declined €897 million or 12.2% (-1.4% in constant currency) due to obtaining the authorizations from the regulatory bodies and a takeover bid delisting Banco Santander Colombia shares aimed to minority shareholders who have 2.15% of Santander Colombia. The 2011 results do not yet incorporate these capital gains.improvement in Brazil.
41
Detailed below are the performance highlights of the main Latin American countries in which we operate: 1
Brazil. Santander Brazil is the country’s third largest private sector bank in terms ofby assets and the leadinglargest foreign bank with a market share of 10.5% in loans.the country. At the end of 2011,2013, the institution had 3,7753,566 branches, 54,19749,459 employees and 25.329.5 million customers.
During 2011, lending increased 20% with significant2013, total loans declined 10.8%. Nevertheless, in local currency total loans rose 7.4%. During the year Santander Brazil’s strategy was to prioritize the growth across allof lower risk products, mainly of mortgage loans, where the major segments. Particularly noteworthy was lendingmarket is still incipient, and large companies, the segments registering the largest growth. We also launched projects to individualsincrease commercial productivity, based on best practices identified in other Group units and SMEs and companies, which grew by around 23% and 26%, respectively. Deposits excluding repos rose 6%, with a good performancewe implemented measures to increase efficiency in time deposits (+30%).order to keep cost increases below the expected inflation rate. On the other hand, consumer finance dropped in the last 12 months.
Profit attributable to the Parent bank from Brazil in 20112013 was €2,610€1,577 million, a 7.2%27.9% decrease whenas compared with 2010 (-7.3%to 2012 (-17.8% in local currency). TotalThis was mainly due to: (i) a decline in net interest income rose 11.2%of 21% (9.9% in local currency), due to the portfolio’s mix change and the narrowing of spreads on loans, particularly from the shift toward products with lower spreads and also a reduced cost of credit, and (ii) a fall of 20.1% (8.9% in local currency) in loan loss provisions, which were lower for the third straight quarter. The ROE was 11.9% (as compared to 17.7% in 2012).
Deposits fell 12.0% (+6.1% in local currency, spurred by net interest income and fee income, which coupled with a slight improvement inimproving the efficiency ratio, produced a 10.5% increase in net operating income. This increase enabledgrowth rate from the larger provisions to be absorbed, maintaining net operating income after provisions in positive growth rates (+2.9%)beginning of the year). This, however, did not feed through to profits mainly because of labor disputes, a higher tax rate and minority interests. For 2011, ROE was 23.3% and at the end of 2011,The NPL ratio was 5.4%, an increase of 47 percentage points as compared to 4.91% in 2010, mainly due to a moderate rise in NPLs of individual borrowers, principally in consumer credits and cards. The NPL coverage ratio was 95%5.64% at December 31, 2013 (6.86% at December 31, 2012).
Mexico.Mexico.Banco Santander (Mexico), S.A., Institución de Banca Múltiple, Grupo Financiero Santander, is one of the leading financial services companies in Mexico. It leadsIn the thirdfourth quarter of 2013, Mexico acquired ING Hipotecaria, which consolidated the Bank as the country’s second largest mortgage provider. Santander is the fourth largest banking group in Mexico by business volume, with a market share in termsloans of business volume.13.9% and 15.1% in deposits. As of December 31, 2011,2013, we had a network of 1,1251,258 branches, 13,16214,804 employees and 9.310.5 million customers in Mexico. Santander Mexico acquired a portfolio of mortgages from GE Capital Corporation for $1,870 million in the second quarter of 2011.
In 2011, lending rose 22%, with mortgage loans growing 30%, both on a like-for-like basis (excluding GE). In addition, bank savings increased 8%, with demand deposits up 14%, time deposits 6% and mutual funds 3%.
Profit attributable to the Parent bank from Mexico in 2011 increased 40.9%2013 declined 29.3% to €936 million (45.6%€713 million. Net interest income rose 5.7%, backed by dynamic business activity and spreads management and total income grew 8.0%. Operating expenses grew 9.6%, in local currency)line with the expansion plan (increase of 88 branches in 2013, +8%). Loan-loss provisions were 72.2% higher, mainly due to growth in net interest income and fee income, lower provisions and benefiting from lower minority interests. For 2011,homebuilders as result of the deterioration of this sector. The ROE was 21.2%18.6% (as compared to 24.9% in 2012).
Loans increased 9.3% and at the endcustomer funds under management up by 4.7% mainly due to an increase of 2011,43.3% in marketable debt securities.
At December 31, 2013, the NPL ratio remainedstood at 1.8% and3.66% as compared to 1.94% at December 31, 2012, mainly impacted by homebuilders, which accounted for 1.51 percentage points of the rise in the NPL coverage ratio, was 176%.and by the entry of the ING portfolio in the fourth quarter of 2013, which has a higher NPL ratio than the recurring business.
Chile.Chile. Banco Santander Chile is the principal component of the largest financial group in Chile in terms of assets and profits. Grupo Santander sold an aggregate of 9.7% of Banco Santander Chile in 2011 for $1,241 million, leaving it with 67%.assets. As of December 31, 2011,2013, we had 499493 branches, 12,20412,290 employees and more than 3.5 million customers and market shares of 19.7%19.1% in loans and 17.3%16.8% in savings.
In 2011, lending accelerated due to the higher economic growth and the positive impact of reconstruction following the 2010 earthquake. Loans rose 7%, with cards up 15%, mortgages 10% and consumer credit 8%. Commercial credit grew 4%.
Savings grew 11%. Time deposits increased 29% and mutual funds declined 10%.deposits.
Profit attributable to the Parent bank from Chile decreased 9.0%11.2% in 20112013 to €611€435 million (a 9.3%6.6% decrease as compared to 20102012 in local currency), mainly due to growth inhigher operating expenses (10.1%)relating to branches and in loan loss provisions (17.3%).IT investments, and impairment losses relating to specific companies. For 2011,2013, the ROE was 25.4% at the end of 2011,18.5%, the NPL ratio remained stable at 3.9% comparedincreased to 3.7%5.91%.
In 2013, customer loans decreased 3.0%, however in 2010 and the NPL coverage ratiolocal currency there was 73%an 11.2% increase. Customer deposits declined 6.3% (+7.4% in local currency).
Argentina. Santander Río is one of the country’s leading banks,private sector bank in terms of assets, customer funds and results, with market shares of 8.9%9.1% in lending and 10.1%9.6% in savings. It has 358savings at December 2013. At that date, it had 377 branches, 6,7736,874 employees and 2.5 million customers.
The Group focused its strategy in 2011 on maximizing the strengths of the franchise, sustained by a successful transactional banking model resting on low funding costs (demand deposits accounted for 68% of total deposits) and high levels of revenues from services (recurrence ratio of 88%).
During the year, lending (+28%) continued to grow strongly. Demandand deposits rose 20%decreased 2.0% and 6.1%, time deposit rose 42% and mutual fundsrespectively. Nevertheless, in local currency lending rose 35%, with notable growth in SMEs and companies, both above 50% and deposits grew 30% (+24% in demand and +42% in time).
Profit attributable to the Parent bank was €287€333 million, 2.7% lower (8.0%2.0% higher (26.3% in local currency). At the end of 2011,2013, the ROE was 39.4%, NPL ratio was 1.2% and the NPL coverage ratio was 207%1.42%.
|
42
Uruguay.Uruguay.Santander is the largest private sector bank in the country, in terms of the number of branches (78) and business (marketwith a market share of 18.6% in lending of 18.0% and 16.0%15.3% in deposits). As ofdeposits. Overall, the Group had 85 branches, 1,194 employees and 450,000 customers at December 31, 2011, we had 1,166 employees and 247,000 customers.2013.
Profit attributable to the Parent bank was €20€53 million in 2011, 70.3% lower2013, 14.3% higher than in 2010 (a 69.9% decrease2012 (an 18.8% increase in local currency) and the NPL ratio was 0.64% as of December 31, 2011.
Colombia. As of December 31, 2011, Banco Santander Colombia, S.A. had 80 branches, 1,458 employees and 0.3 million banking customers.
As previously mentioned, the Group announced an agreement to sell its business in Colombiadue to the Chilean group CorpBanca. The transaction is expected to be completedgrowth in the second quarternet interest income and fee income of 2012, once the regulatory authorizations have been obtained.8.4% and 14.8%, respectively.
Profit attributable to the Parent bank from Colombia was €58 million in 2011, 43.0% higher than in 2010 (a 46.5% increase in local currency). As of December 31, 2011, the NPL ratio was 1.0% and the NPL coverage ratio was 299%.
Puerto Rico. As of December 31, 2011, Banco2013 Santander Puerto Rico had 121115 branches, 1,7531,493 employees, 415,000 customers and 0.5 million customers.market shares of 11.1% in loans and 13.7% in deposits.
Profit attributable to the Parent bank from Puerto Rico in 20112013 was €34€77 million, a 10.1% decrease36.1% increase as compared to 20102012 (a 5.6% decrease40.7% increase in U.S. dollars). At the end of 2011, theThe NPL ratio stood at 8.6%was 6.29%, after improving 85 basis points due to the rebalancing of credit portfolios and the NPL coverage ratio was 51%.positive performance of the commercial portfolio.
Peru. As of December 31, 2011,2013, Banco Santander Perú, S.A. had 1 branch 60 employees and 100,000 banking customers.117 employees. The unit’s activity is focused on companies and on attending to the Group’s global customers. A new auto finance company began to operate in 2013, together with a well-known international partner with considerable experience in Latin America. The company has a specialized business model, focused on service and with products that enable customers to acquire any brand of new car from any dealer in Peru.
Profit attributable to the Parent bank from Peru was €11€19 million in 2011, 56.4%2013, 21.2% higher than in 2010,2012, (a 60.3%28.1% increase in local currency).
SovereignUnited States
The U.S. segment includes Santander Holdings USA (SHUSA), a bank holding company with two distinct lines of business: retail banking, via its subsidiary Santander Bank, and consumer finance business through its stake in Santander Consumer USA Inc. (SCUSA).
On October 17, 2013, Sovereign Bank changed its name to Santander Bank, successfully completing the rebranding. Santander Bank, with 723706 branches, 2,3032,074 ATMs, and more than 1.7 million customers,customer-households and 9,741 employees at December 31, 2013, is developing a business model focused on retail customers atand companies.
SCUSA specializes in consumer finance, mainly auto finance. At December 31, 20112013, our stake in the company was recorded by the equity method. In the first quarter 2014, SCUSA completed an initial public offering of shares at a price of $24 per share, and companies. At that date, Sovereign had 8,968 employees (directis now listed on the New York Stock Exchange. Demand was 10 times higher than the offering, valuing the company at $8.3 billion. After this transaction, we retain a 60.7% stake; as a result, since 2014 we are fully consolidating SCUSA’s financial statements.
In February 2013, SCUSA entered into a ten-year agreement with Chrysler Group LLC whereby we originate private-label loans and assigned), none of which were temporary. Sovereignleases under the Chrysler Capital brand (“Chrysler Capital”) to facilitate Chrysler vehicle retail sales.
The U.S. segment accounted for 4.6%4.4% of the total customer funds under management, 5.4%5.6% of total loans to customers and credits and 5.7%11.6% of profit attributed to the Parent bankbank’s total operating areas.
The U.S. segment obtained attributable profit of €725 million in 2013, which was 9.9% less than in 2012 (7.1% less in local currency). This reduction was due to: (i) lower net interest income (-16.9%) due to reduced volumes and the sale of part of the Group’s main business areas.
In 2011, Sovereign contributed €526 million profit attributableinvestment portfolio, (ii) higher costs (6.5%) related to the Parent bank as comparedrebranding and investments to improve the IT infrastructure and (iii) greater regulatory pressure that resulted in reduced fee income and higher compliance costs, which was only partially offset by a €424sharp reduction in impairment losses on financial assets, which had net release of €4 million, a year earlier. due to the high credit quality.
For 2011,2013, ROE was 13.0%. Loans12.4% and advances to customers at December 31, 2011 were €40,194 millionthe NPL ratio was 2.23%, which represents a 3.0 and customer funds under management €40,812 million. Rigorous admission and renewal of loans standards, together with their proactive management, were reflected in a continuous improvement in NPL which decreased 176 basis0.06 percentage points to 2.9% and NPL coverage which stood at 96% upreduction from 75% in 2010.2012, respectively.
The results show a solid income statement backed by the generation of recurring revenues, a reduction in the cost of deposits and an improvement in the levels of provisions. This was the result of the improvement in the balance sheet structure, which, together with the recovery in volumes of basic loans and control of spending, provides a solid base for 2012.
Second or business level:
Retail Banking
Profit attributable to the Parent bank of the retail banking sectorin 2013 was 5.7%€5,077 million, 13.8% lower than 2010 at €6,893 million. as compared to 2012. The results were due to: (i) lower interest income (-11.5%) in an environment of reduced business and low interest rates in mature markets and change of business mix in emerging markets, (ii) partly offset by lower impairment losses for financial assets (-22.0%) and costs (-1.6% or +4.4% deducting the exchange rate impact) growing below the inflation rate.
Retail Banking generated 87.4%in 2013 88% of the operating areas’ total income and 75.1%81.1% of profit attributable to the Parent bank. Total income increased 7.0% to €39,892 millionThis segment had 170,971 employees as of December 31, 2013, of which 4,682 were temporary.
By geographic area, the main features in 2013 were as follows:
The performance by geographic areas reflects the varying economic environments with lower growth in developed economies and a better macroeconomic environment in emerging countries.
43
• Retail banking in continental Europe, despite the recovery in revenues and the positive impact of incorporations to the Group, was conditioned by the higher amount assigned to provisions and writedowns. Profit attributable to the Parent bank declined 3.0%.
• Retail banking in the UK was 42.5% lower in sterling as it was hit by the PPI remediation. Excluding this impact, profit attributable to the Parent was almost the same as in 2010. Total income declined, affected by regulatory changes, but this was offset by flat costs and reduced needs for provisions.
• Retail banking revenues and costs in Latin America continued to grow, compatible with business development.
Global Private Banking includes institutions that specialize in financial advisory and asset management for high-income clients (mainly Banif in Spain and Santander Private Banking in the UK, Italy and Latin America), as well as the units of domestic private banking in Portugal and Latin America, jointly managed with local retail banks. Profit before tax was 2.0% higher (+4.7% excluding exchange rate impact) at €370 million, due to the rise in net interest income (+9.2%) and reduced needs for provisions and writedowns, whichcredit losses partially offset the lower gains on financial transactions and higher operating expenses (+9.1%). The higher tax charge absorbed almost four points of growth in profit attributable to the Parent which at €279 million was 1.5% lower than in 2010 (+1.4% excluding the exchange rate impact).
Global Wholesale Banking
This area covers our corporate banking, treasury and investment banking activities throughout the world.
This segment, managed by Santander Global Banking &and Markets conducted its business in an environment of markets that were more stable and with increased regulatory requirements. This segment contributed 10.2%12.6% of the operating areas’ total income and 20.4%24.0% of profit attributable to the Parent bank in 2011.2013. Profit attributable to the Parent bank in 20112013 by Global Wholesale Banking amounteddecreased by 21.3% to €1,872€1,504 million, a 30.6% decrease from 2010. This reductionprimarily due to higher minority interests in the Latin American units, the depreciation of their currencies and, above all, higher loan-loss provisions (+126.7%) mainly in Spain and Mexico. In Spain, the increase in loan loss provisions was related to specific companies, and in Mexico mainly to homebuilders due to the fall in total income fromdeterioration of this sector. Those increases were partially offset by the sharp reduction in gains on financial transactionssolid revenues and in fee income, coupled with higher costs and provisions.the management of costs. This segment had 2,7227,165 employees as of December 31, 2011,2013, of which 2 were temporary.
Beginning in the spring, markets were very unstable, and the instability intensifying in the second half of the year due to the Eurozone’s sovereign debt crisis. This environment had a significant impact on revenues, particularly those derived from equities and those not related to customers, whose decreases explain the larger reduction in profits.
At the strategic level, and in a very complex year, the division focused on maintaining the results of its franchise in a very complex year and on reducing exposure to risk (for example, cutting the risk of trading activity), which helped to improve the Group’s capital and liquidity positions, particularly in those countries with the greatest tensions.
The division also continued to invest in resources to strengthen its operational capacities and distribution of basic treasury products, with a special focus on foreign exchange and fixed-income businesses. The generation of recurring revenues and strict management of the cost base is enabling Santander Global Banking to absorb these investments and improve its efficiency ratio to 35.1%.
Santander is present in global transaction banking (which includes cash management, trade finance and basic financing)financing and custody), in corporate finance (comprising mergers and acquisitions, equity capital markets and asset and capital structuring)investment solutions for corporate clients via derivatives), in credit markets (which include origination activities, risk management,and distribution of corporate loans or structured productsfinance, bond origination and debt), in rates (comprised of structuringsecuritization teams and trading activities in financial markets of interest rateasset and exchange rate instruments)capital structuring) and in global markets (which include the sale and distribution of fixed income and equity derivatives, interest rates and inflation, the trading and hedging of exchange rates, short-term money markets for the Group’s wholesale and retail clients, management of books associated with distribution, brokerage of equities, (activities relating to the equity markets)and derivatives for investment and hedging solutions).
Asset Management and Insurance
This segment comprises all of our companies whose activity is the management of mutual and pension funds and insurance. At
In July 2012, we reached an agreement with Abbey Life Insurance ltd., a subsidiary of Deustche Bank AG, to reinsure the entire individual life risk portfolio of the insurance companies in Spain and Portugal. This transaction generated extraordinary gross results of €435 million accounted as other operating income under the Corporate Activities segment.
In December 31, 2011,2012, Santander agreed a strategic alliance with the insurer Aegon to boost its bancassurance business in Spain through commercial networks. The transaction closed in 2013 and resulted in a capital gain for the Group of €385 million. The agreement does not affect savings, auto and health insurance, which Santander continues to manage.
See “A. History and development of the company—Principal Capital Expenditures and Divestitures—Acquisitions, Dispositions, Reorganizations”.
In 2013, this segment accounted for 2.4%1.9% of total income and 4.6%5.0% of profit attributable to the Parent bank. Profit attributable to the Parent bank by Asset Management and Insurance was €419€312 million in 20112013 or 9.5%22.3% lower than in 2010.2012. Excluding the corporate insurance transactions recorded in 2012 (reinsurance of life-risk assurance operations in Spain and Portugal) and the strategic alliance in bancassurance in Spain, attributable profit would have been 7.1% lower in 2013 after eliminating the exchange rate impact. This segment had 1,2721,795 employees at the end of 2011,2013, of which 4213 were temporary.
Total income growth
Asset Management
Attributable profit in 20112013 was flat at 0.6%, while net operating income rose 2.2% largely due to the 2.8% fall in operating expenses. The other negative results and a higher tax charge caused profit attributable to the Parent bank to be 9.5%€80 million, 27.2% lower than in 2010. These results include2012, following a negative impactdecrease of €64 million4.6% in total income affected by exchange rates, higher costs. Excluding the exchange rate impact, gross income was virtually unchanged (-0.6%) and €53 million in net operating income from the globalattributable profit dropped 23.8%.
In December 2013, we closed a strategic agreement with ZurichWarburg Pincus and General Atlantic to drive our global business through improvements in the fourth quarter. Excluding this impact, total income increased in 2011 6.6% and net operating income increased 9.2%.
44
In 2011, we formed a strategic alliance with the insurer Zurich to strengthen our bancassurance business in five key markets in Latin America: Brazil, Mexico, Chile, Argentina and Uruguay. Santander created a holding company for its insurers in Latin America, which is 49% owned by it and 51% owned by Zurich. This agreement combines Banco Santander’s commercial and distribution capacity with the experience of Zurich in developing and managing products. In each of the five countries, Banco Santander will distribute the strategic alliance’s bancassurance products for 25 years.
Asset Management
Santander Asset Management obtained profit attributable to the Parent bank of €53 million, a 34.6% decrease as compared to 2010. The revenue reduction was the result of a fall in managed volumes, accelerated in the second half, which was partly offset by a better mixrange of products and in consequence, in average revenues.services and strengthen institutional business where there is a high growth potential. See “A. History and development of the company—Principal Capital Expenditures and Divestitures—Acquisitions, Dispositions, Reorganizations”.
TotalAt December 31, 2013, the total volume of managed funds was €156,400 million, (+2% year-on-year and +8% eliminating the exchange rate impact). Of this, €104,200 million were mutual and pension funds, under€9 billion were client portfolios other than funds, including institutional mandates. The rest was management amounted to €112 billion, 10%mandates on behalf of other Group units.
Insurance
Santander Insurance posted attributable profit in 2013 of €233 million, 20.5% less than in December 2010. The preference for liquidity2012, following the corporate transaction in Spain and on-balance sheet funds, together with more unstable markets in the second half of the yearPortugal. Eliminating this effect and the impact on prices, explainof exchange rates, attributable profit was almost the fall in volumes.same (-1.0%).
Insurance
The global area of Santander Insurance posted a profit attributableIncluding the fees paid to the Parent bank of €366 million, 3.8% more than in 2010. This result was affected bynetworks, the sale of 51% of the insurance companies in Latin America completed in the fourth quarter of 2011 as, without it, growth would have been 4.0%.
Insurance business generated total revenues (including fee income paid toof €2,641 million for the commercial networks) of €3,083 million (+14.7%)Group (3.7% less year-on-year; +4.2% at constant perimeter and exchange rates). The total contribution to profitsresult for the Group (income before taxes of insurers and brokers plus fee income received bypaid to the networks) increased 15.7%was €2,510 million (-3.8% year-on-year; +4.3% at constant perimeter and exchange rates).
Spain’s run-off real estate
This segment focuses on: (i) managing real estate clients with whom the Group holds potentially problematic exposures in order to €2,882 million, 17.9% higher excluding the impact ofreduce their exposure, and (ii) property and land management, which includes the sale of the insurance companies.
The total volume of premium income increased 9% due to the good evolution of protection insurance premiums (+13%) as well as the recoveryexisting properties and, in the distribution of savings insurance whose premium income rose 7% after falling in 2010.
Corporate Activitiescertain cases, real estate development and subsequent marketing and sale.
At the end of 2011,2013, this segment had 629 employees.
In 2013, this segment had €635 million of losses attributable to the Parent bank as compared to €4,768 million losses in 2012. The strong impairment losses accounted for during 2012, due to the deterioration of the real estate portfolio, stabilized in 2013.
Corporate Activities
At the end of 2013, this area had 2,3332,397 employees (direct and assigned) of which 901 were temporary. At year end of 2010, this area had 2,529 employees, of which 6231,577 were temporary.
This area is responsible for, on the one hand, a series of centralized activities to manage the structural risks of the Group and of the Parent bank. It executes the necessary activities for managing interest rates, exposure to exchange-rate movements and the required levels of liquidity in the Group. On the other hand, it acts as the Group’s holding entity, managing the Group’s global capital as well as that of each of the business units.
The Corporate Activities area had a loss of €3,833€1,888 million in 2011,2013, a 67.3%65.3% increase as compared to 2010.2012. This decrease was mainlyprimarily due to pre-taxgreater provisions against the fourth quarter earnings to cover real estate exposure in Spain of €1,812 million and €601 million in pre-tax provisions to amortize goodwill related to Santander Totta,impairment losses, and higher cost of funding. These impactsinterest, which were charges partially offset by greatertrading gains and gains on corporate transactions.
Within corporate activities, the financial transactions, mainly hedgingmanagement area conducts the global functions of exchange rates and net capital gains of €1,513 million generated in 2011 (€872 million arising from the entry of new partners in the capital of SCUSA and €641 million from the sale of the insurance holding in Latin America).
With respect to the area’s activities:
Interest rate management is conducted on a coordinated basis by all the units, but this business only registers the part relative to the balance sheet of the Parent bankmanagement, both structural interest rate and liquidity risk management (the latter via the ALCO portfolios (at the volume levelsissues and duration considered optimum at each moment).
Management of the exposure to exchange-rate movementssecuritizations), both from investments in the shareholders’ equity of units in currencies other than the euro as well as from the results generated forstructural position of exchange rates:
ManagementThe objective of structural liquidity aims management is to finance our recurrentthe Group’s recurring activity in optimum conditions of maturity and cost. The decisions whether to go tocost, maintaining an appropriate profile (in volumes and maturities) by diversifying the wholesale markets to capture funds and cover stable and permanent liquidity needs, the type of instrument used, the maturity date structure and managementfunding sources.Management of the associated risks of interest rates andexposure to exchange rates of the various financing sources, arerate movements is also conductedcarried out on a centralized basis. This management (which is dynamic) is conducted through exchange-rate derivatives, seeking to optimize at all times the financial cost of hedging.
45
Thefinancial management unit uses financial derivatives to cover the interest rateMeanwhile, and exchange rate risksseparately from new issuances. The net impact of this hedging is recorded in the gains/losses on financial transactions in corporate activities. The financial management area also analyzes the strategies for structural management of credit risk aiming to reduce concentrations by sectors, which naturally occur as a result of commercial activity. Derivative transactions achieve an effect similar to selling some assets and acquiring others enabling us to diversify the credit portfolio as a whole.
In addition, the area ofdescribed here, Corporate Activities acts as theGroup’s holding entity. It manages all capital and reserves and allocations of capital to each of the business units, as well as providesproviding any liquidity that some of the business units might need (mainly the Santander Branch Network and corporate in Spain).need. The price at which these operationstransactions are carried out is the market rate (Euribor(euribor or swap without liquidity premium for their duration) for eachswap) plus a risk premium.
Lastly, and more marginally, the equity stakes of the maturities of repricing operations.
Lastly, theequity stakesa financial nature that the Group takes within its policy of optimizing investments isare reflected in corporate activities.Corporate Activities.
Total Revenues by Activity and Geographic Location
For a breakdown of our total revenues by category of activity and geographic market, please see Note 52 to our consolidated financial statements.
Selected Statistical Information
The following tables show our selected statistical information.
Average Balance Sheets and Interest Rates
The following tables show, by domicile of customer, our average balances and interest rates for each of the past three years.
You should read the following tables and the tables included under “—Changes in Net Interest Income—Volume and Rate Analysis” and “—Assets—Earning Assets—Yield Spread” in conjunction with the following:
We have included interest received on non-accruing assets in interest income only if we received such interest during the period in which it was due;
We have included loan arrangement fees in interest income;
We have not recalculated tax-exempt income on a tax-equivalent basis because the effect of doing so would not be significant;
We have included income and expenses from interest-rate hedging transactions as a separate line item under interest income and expenses if these transactions qualify for hedge accounting under IFRS-IASB. If these transactions did not qualify for such treatment, we have included income and expenses on these transactions elsewhere in our income statement. See Note 2 to our consolidated financial statements for a discussion of our accounting policies for hedging activities;
We have stated average balances on a gross basis, before netting our allowances for credit losses, except for the total average asset figures, which includes such netting; and
All average data have been calculated using month-end balances, which is not significantly different from having used daily averages.
As stated above under “Presentation of Financial and Other Information”, we have prepared our financial statements for 2007, 2008, 2009,2013, 2012, 2011, 2010 and 20112009 under IFRS-IASB.
Average Balance Sheet - Assets and Interest Income Cash and due from central banks Domestic International Due from credit entities Domestic International Loans and credits Domestic International Debt securities Domestic International Income from hedging operations Domestic International Other interest-earning assets Domestic International Total interest-earning assets Domestic International Investments in affiliated companies Domestic International Total earning assets Domestic International Other assets Assets from discontinued operations Total average assets Year ended December, 31 ASSETS 2013 2012 2011 Average
Balance Interest Average
Rate Average
Balance Interest Average
Rate Average
Balance Interest Average
Rate (in millions of euros, except percentages) 6,590 54 0.82 % 21,172 91 0.44 % 8,436 187 2.22 % 77,467 2,647 3.42 % 75,572 2,602 3.44 % 73,259 3,005 4.10 % 84,057 2,701 3.21 % 96,744 2,693 2.78 % 81,695 3,192 3.91 % 28,206 152 0.54 % 25,257 136 0.54 % 22,140 190 0.86 % 56,983 614 1.08 % 45,600 898 1.97 % 53,123 871 1.64 % 85,189 766 0.90 % 70,857 1,034 1.46 % 75,263 1,061 1.41 % 178,227 5,755 3.23 % 198,643 7,332 3.69 % 217,235 7,581 3.49 % 519,037 34,450 6.64 % 550,730 38,795 7.04 % 511,964 39,089 7.64 % 697,264 40,205 5.77 % 749,373 46,127 6.16 % 729,199 46,670 6.40 % 55,497 2,113 3.81 % 52,382 1,946 3.72 % 42,293 1,458 3.45 % 94,144 4,322 4.59 % 96,910 5,147 5.31 % 106,408 5,948 5.59 % 149,641 6,435 4.30 % 149,292 7,093 4.75 % 148,701 7,406 4.98 % 85 211 378 125 472 (46 ) 210 683 332 60,673 677 1.12 % 75,008 803 1.07 % 48,716 779 1.60 % 41,333 453 1.10 % 47,902 357 0.75 % 40,029 1,176 2.94 % 102,006 1,130 1.11 % 122,910 1,160 0.94 % 88,745 1,955 2.20 % 329,193 8,836 2.68 % 372,462 10,520 2.82 % 338,820 10,573 3.12 % 788,964 42,611 5.40 % 816,714 48,271 5.91 % 784,783 50,044 6.38 % 1,118,157 51,447 4.60 % 1,189,176 58,791 4.94 % 1,123,603 60,617 5.39 % 1,223 — 0.00 % 1,147 — 0.00 % 443 — 0.00 % 3,632 — 0.00 % 3,459 — 0.00 % 546 — 0.00 % 4,855 — 0.00 % 4,606 — 0.00 % 989 — 0.00 % 330,416 8,836 2.67 % 373,609 10,520 2.82 % 339,263 10,573 3.12 % 792,596 42,611 5.38 % 820,173 48,271 5.89 % 785,329 50,044 6.37 % 1,123,012 51,447 4.58 % 1,193,782 58,791 4.92 % 1,124,592 60,617 5.39 % 91,187 92,815 103,259 — — — 1,214,199 51,447 1,286,597 58,791 1,227,851 60,617
Average Balance Sheet - Liabilities and Interest Expense Due to credit entities Domestic International Customers deposits Domestic International Marketable debt securities Domestic International Subordinated debt Domestic International Other interest-bearing liabilities Domestic International Expenses from hedging operations Domestic International Total interest-bearing liabilities Domestic International Other liabilities Non-controlling interest Stockholders’ Equity Liabilities from discontinued operations Total average Liabilities and Stockholders’Equity46 Year ended December, 31 2013 2012 2011 LIABILITIES AND STOCKHOLDERS
EQUITY Average
Balance Interest Average
Rate Average
Balance Interest Average
Rate Average
Balance Interest Average
Rate 21,654 335 1.55 % 55,339 761 1.38 % 33,456 756 2.26 % 107,956 1,635 1.51 % 99,347 1,720 1.73 % 113,182 2,107 1.86 % 129,610 1,970 1.52 % 154,686 2,481 1.60 % 146,638 2,863 1.95 % 173,833 3,053 1.76 % 153,399 2,850 1.86 % 164,980 2,895 1.75 % 458,506 11,752 2.56 % 482,952 13,554 2.81 % 451,710 13,924 3.08 % 632,339 14,805 2.34 % 636,351 16,404 2.58 % 616,690 16,819 2.73 % 83,445 2,993 3.59 % 95,054 3,175 3.34 % 91,358 3,142 3.44 % 105,509 3,886 3.68 % 109,647 4,102 3.74 % 104,749 3,288 3.14 % 188,954 6,879 3.64 % 204,701 7,277 3.55 % 196,107 6,430 3.28 % 8,547 496 5.80 % 10,409 637 6.12 % 15,321 752 4.91 % 8,098 764 9.43 % 10,830 1,013 9.35 % 11,352 1,188 10.47 % 16,645 1,260 7.57 % 21,239 1,650 7.77 % 26,673 1,940 7.27 % 75,386 962 1.28 % 91,492 1,113 1.22 % 68,103 1,242 1.82 % 57,778 1,064 1.84 % 63,062 684 1.08 % 53,353 1,166 2.19 % 133,164 2,026 1.52 % 154,554 1,797 1.16 % 121,456 2,408 1.98 % (1,138 ) (974 ) (805 ) (290 ) 234 368 (1,428 ) (740 ) (437 ) 362,865 6,701 1.85 % 405,693 7,561 1.86 % 373,218 7,983 2.14 % 737,847 18,811 2.55 % 765,838 21,307 2.78 % 734,346 22,042 3.00 % 1,100,712 25,512 2.32 % 1,171,531 28,868 2.46 % 1,107,564 30,025 2.71 % 31,830 33,954 42,200 10,066 8,424 5,934 71,591 72,688 72,153 — — — 1,214,199 25,512 1,286,597 28,868 1,227,851 30,025
Average Balance Sheet - Assets and Interest Income
| Year ended December, 31 | ||||||||||||||||||||||||||||||||||||
| ASSETS | 2011 | 2010 | 2009 | |||||||||||||||||||||||||||||||||
| Average | Average | Average | ||||||||||||||||||||||||||||||||||
| Balance | Interest | Average Rate | Balance | Interest | Average Rate | Balance | Interest | Average Rate | ||||||||||||||||||||||||||||
| (in millions of euros, except percentages) | ||||||||||||||||||||||||||||||||||||
Cash and due from centralbanks | ||||||||||||||||||||||||||||||||||||
Domestic | 8,436 | 187 | 2.22 | % | 8,441 | 87 | 1.03 | % | 7,916 | 87 | 1.10 | % | ||||||||||||||||||||||||
International | 73,259 | 3,005 | 4.10 | % | 52,936 | 1,846 | 3.49 | % | 25,933 | 269 | 1.04 | % | ||||||||||||||||||||||||
|
|
|
|
|
|
|
|
|
|
|
|
|
|
|
|
|
| |||||||||||||||||||
| 81,695 | 3,192 | 3.91 | % | 61,377 | 1,933 | 3.15 | % | 33,849 | 356 | 1.05 | % | |||||||||||||||||||||||||
Due from credit entities | ||||||||||||||||||||||||||||||||||||
Domestic | 22,140 | 190 | 0.86 | % | 29,392 | 206 | 0.70 | % | 20,935 | 366 | 1.75 | % | ||||||||||||||||||||||||
International | 53,123 | 871 | 1.64 | % | 51,382 | 839 | 1.63 | % | 58,290 | 2,156 | 3.70 | % | ||||||||||||||||||||||||
|
|
|
|
|
|
|
|
|
|
|
|
|
|
|
|
|
| |||||||||||||||||||
| 75,263 | 1,061 | 1.41 | % | 80,774 | 1,045 | 1.29 | % | 79,225 | 2,522 | 3.18 | % | |||||||||||||||||||||||||
Loans and credits | ||||||||||||||||||||||||||||||||||||
Domestic | 217,235 | 7,581 | 3.49 | % | 224,642 | 7,312 | 3.25 | % | 230,642 | 10,297 | 4.46 | % | ||||||||||||||||||||||||
International | 513,568 | 39,328 | 7.66 | % | 482,407 | 34,542 | 7.16 | % | 436,857 | 31,784 | 7.28 | % | ||||||||||||||||||||||||
|
|
|
|
|
|
|
|
|
|
|
|
|
|
|
|
|
| |||||||||||||||||||
| 730,803 | 46,909 | 6.42 | % | 707,049 | 41,854 | 5.92 | % | 667,499 | 42,081 | 6.30 | % | |||||||||||||||||||||||||
Debt securities | ||||||||||||||||||||||||||||||||||||
Domestic | 42,293 | 1,458 | 3.45 | % | 44,784 | 1,136 | 2.54 | % | 40,146 | 1,158 | 2.88 | % | ||||||||||||||||||||||||
International | 106,408 | 5,948 | 5.59 | % | 107,662 | 5,096 | 4.73 | % | 92,777 | 4,428 | 4.77 | % | ||||||||||||||||||||||||
|
|
|
|
|
|
|
|
|
|
|
|
|
|
|
|
|
| |||||||||||||||||||
| 148,701 | 7,406 | 4.98 | % | 152,446 | 6,232 | 4.09 | % | 132,923 | 5,586 | 4.20 | % | |||||||||||||||||||||||||
Income from hedging operations | ||||||||||||||||||||||||||||||||||||
Domestic | 378 | 169 | 305 | |||||||||||||||||||||||||||||||||
International | (46 | ) | (76 | ) | 587 | |||||||||||||||||||||||||||||||
|
|
|
|
|
| |||||||||||||||||||||||||||||||
| 332 | 93 | 892 | ||||||||||||||||||||||||||||||||||
Other interest-earning assets | ||||||||||||||||||||||||||||||||||||
Domestic | 24,840 | 779 | 3.14 | % | 27,769 | 698 | 2.51 | % | 29,389 | 610 | 2.08 | % | ||||||||||||||||||||||||
International | 63,905 | 1,176 | 1.84 | % | 62,757 | 1,052 | 1.68 | % | 60,209 | 1,126 | 1.87 | % | ||||||||||||||||||||||||
|
|
|
|
|
|
|
|
|
|
|
|
|
|
|
|
|
| |||||||||||||||||||
| 88,745 | 1,955 | 2.20 | % | 90,526 | 1,750 | 1.93 | % | 89,598 | 1,736 | 1.94 | % | |||||||||||||||||||||||||
Total interest-earning assets | ||||||||||||||||||||||||||||||||||||
Domestic | 314,944 | 10,573 | 3.36 | % | 335,028 | 9,608 | 2.87 | % | 329,028 | 12,823 | 3.90 | % | ||||||||||||||||||||||||
International | 810,263 | 50,283 | 6.21 | % | 757,144 | 43,299 | 5.72 | % | 674,066 | 40,350 | 5.99 | % | ||||||||||||||||||||||||
|
|
|
|
|
|
|
|
|
|
|
|
|
|
|
|
|
| |||||||||||||||||||
| 1,125,207 | 60,856 | 5.41 | % | 1,092,172 | 52,907 | 4.84 | % | 1,003,094 | 53,173 | 5.30 | % | |||||||||||||||||||||||||
Investments in affiliated companies | ||||||||||||||||||||||||||||||||||||
Domestic | 443 | — | 0.00 | % | 201 | — | 0.00 | % | 153 | — | 0.00 | % | ||||||||||||||||||||||||
International | 546 | — | 0.00 | % | 52 | — | 0.00 | % | 709 | — | 0.00 | % | ||||||||||||||||||||||||
|
|
|
|
|
|
|
|
|
|
|
|
|
|
|
|
|
| |||||||||||||||||||
| 989 | — | 0.00 | % | 253 | — | 0.00 | % | 862 | — | 0.00 | % | |||||||||||||||||||||||||
Total earning assets | ||||||||||||||||||||||||||||||||||||
Domestic | 315,387 | 10,573 | 3.35 | % | 335,229 | 9,608 | 2.87 | % | 329,181 | 12,823 | 3.90 | % | ||||||||||||||||||||||||
International | 810,809 | 50,283 | 6.20 | % | 757,196 | 43,299 | 5.72 | % | 674,775 | 40,350 | 5.98 | % | ||||||||||||||||||||||||
|
|
|
|
|
|
|
|
|
|
|
|
|
|
|
|
|
| |||||||||||||||||||
| 1,126,196 | 60,856 | 5.40 | % | 1,092,425 | 52,907 | 4.84 | % | 1,003,956 | 53,173 | 5.30 | % | |||||||||||||||||||||||||
Other assets | 102,186 | 97,936 | 90,198 | |||||||||||||||||||||||||||||||||
Assets from discontinued operations | — | — | 4,981 | |||||||||||||||||||||||||||||||||
|
|
|
|
|
|
|
|
|
|
|
| |||||||||||||||||||||||||
Total average assets | 1,228,382 | 60,856 | 1,190,361 | 52,907 | 1,099,135 | 53,173 | ||||||||||||||||||||||||||||||
47
Average Balance Sheet - Liabilities and Interest Expense
| Year ended December, 31 | ||||||||||||||||||||||||||||||||||||
| LIABILITIES AND STOCKHOLDERS EQUITY | 2011 | 2010 | 2009 | |||||||||||||||||||||||||||||||||
| Average | Average | Average | ||||||||||||||||||||||||||||||||||
| Balance | Interest | Average Rate | Balance | Interest | Average Rate | Balance | Interest | Average Rate | ||||||||||||||||||||||||||||
Due to credit entities | ||||||||||||||||||||||||||||||||||||
Domestic | 33,456 | 756 | 2.26 | % | 28,586 | 389 | 1.36 | % | 21,713 | 424 | 1.95 | % | ||||||||||||||||||||||||
International | 113,182 | 2,119 | 1.87 | % | 105,991 | 1,283 | 1.21 | % | 120,217 | 2,861 | 2.38 | % | ||||||||||||||||||||||||
|
|
|
|
|
|
|
|
|
|
|
|
|
|
|
|
|
| |||||||||||||||||||
| 146,638 | 2,875 | 1.96 | % | 134,577 | 1,672 | 1.24 | % | 141,930 | 3,285 | 2.31 | % | |||||||||||||||||||||||||
Customers deposits | ||||||||||||||||||||||||||||||||||||
Domestic | 164,980 | 2,895 | 1.75 | % | 155,244 | 2,839 | 1.83 | % | 130,581 | 2,695 | 2.06 | % | ||||||||||||||||||||||||
International | 451,710 | 13,924 | 3.08 | % | 413,670 | 10,607 | 2.56 | % | 333,021 | 9,116 | 2.74 | % | ||||||||||||||||||||||||
|
|
|
|
|
|
|
|
|
|
|
|
|
|
|
|
|
| |||||||||||||||||||
| 616,690 | 16,819 | 2.73 | % | 568,914 | 13,446 | 2.36 | % | 463,602 | 11,811 | 2.55 | % | |||||||||||||||||||||||||
Marketable debt securities | ||||||||||||||||||||||||||||||||||||
Domestic | 91,358 | 3,142 | 3.44 | % | 105,411 | 2,876 | 2.73 | % | 125,931 | 3,598 | 2.86 | % | ||||||||||||||||||||||||
International | 104,749 | 3,288 | 3.14 | % | 103,595 | 2,083 | 2.01 | % | 95,299 | 2,638 | 2.77 | % | ||||||||||||||||||||||||
|
|
|
|
|
|
|
|
|
|
|
|
|
|
|
|
|
| |||||||||||||||||||
| 196,107 | 6,430 | 3.28 | % | 209,006 | 4,959 | 2.37 | % | 221,230 | 6,236 | 2.82 | % | |||||||||||||||||||||||||
Subordinated debt | ||||||||||||||||||||||||||||||||||||
Domestic | 15,321 | 752 | 4.91 | % | 19,702 | 1,019 | 5.17 | % | 21,704 | 1,029 | 4.74 | % | ||||||||||||||||||||||||
International | 11,352 | 1,188 | 10.47 | % | 14,394 | 1,211 | 8.41 | % | 17,304 | 1,325 | 7.66 | % | ||||||||||||||||||||||||
|
|
|
|
|
|
|
|
|
|
|
|
|
|
|
|
|
| |||||||||||||||||||
| 26,673 | 1,940 | 7.27 | % | 34,096 | 2,230 | 6.54 | % | 39,008 | 2,354 | 6.03 | % | |||||||||||||||||||||||||
Other interest-bearing liabilities | ||||||||||||||||||||||||||||||||||||
Domestic | 37,580 | 1,242 | 3.30 | % | 39,729 | 1,031 | 2.60 | % | 37,348 | 1,129 | 3.02 | % | ||||||||||||||||||||||||
International | 83,876 | 1,166 | 1.39 | % | 81,999 | 1,184 | 1.44 | % | 70,462 | 1,242 | 1.76 | % | ||||||||||||||||||||||||
|
|
|
|
|
|
|
|
|
|
|
|
|
|
|
|
|
| |||||||||||||||||||
| 121,456 | 2,408 | 1.98 | % | 121,728 | 2,215 | 1.82 | % | 107,810 | 2,371 | 2.20 | % | |||||||||||||||||||||||||
Expenses from hedging operations | ||||||||||||||||||||||||||||||||||||
Domestic | (805 | ) | (1,362 | ) | (623 | ) | ||||||||||||||||||||||||||||||
International | 368 | 522 | 1,440 | |||||||||||||||||||||||||||||||||
|
|
|
|
|
| |||||||||||||||||||||||||||||||
| (437 | ) | (840 | ) | 817 | ||||||||||||||||||||||||||||||||
Total interest-bearing liabilities | ||||||||||||||||||||||||||||||||||||
Domestic | 342,695 | 7,982 | 2.33 | % | 348,672 | 6,792 | 1.95 | % | 337,277 | 8,252 | 2.45 | % | ||||||||||||||||||||||||
International | 764,869 | 22,053 | 2.88 | % | 719,649 | 16,891 | 2.35 | % | 636,303 | 18,622 | 2.93 | % | ||||||||||||||||||||||||
|
|
|
|
|
|
|
|
|
|
|
|
|
|
|
|
|
| |||||||||||||||||||
| 1,107,564 | 30,035 | 2.71 | % | 1,068,321 | 23,683 | 2.22 | % | 973,580 | 26,874 | 2.76 | % | |||||||||||||||||||||||||
Other liabilities | 40,999 | 45,192 | 54,383 | |||||||||||||||||||||||||||||||||
Non-controlling interest | 5,998 | 5,695 | 3,192 | |||||||||||||||||||||||||||||||||
Stockholders’ Equity | 73,821 | 71,153 | 63,393 | |||||||||||||||||||||||||||||||||
Liabilities from discontinued operations | — | — | 4,587 | |||||||||||||||||||||||||||||||||
|
|
|
|
|
|
|
|
|
|
|
| |||||||||||||||||||||||||
Total average Liabilities and Stockholders’Equity | 1,228,382 | 30,035 | 1,190,361 | 23,682 | 1,099,135 | 26,874 | ||||||||||||||||||||||||||||||
48
Changes in Net Interest Income—Volume and Rate Analysis
The following tables allocate, by domicile of customer, changes in our net interest income between changes in average volume and changes in average rate for 20112013 compared to 20102012 and 20102012 compared to 2009.2011. We have calculated volume variances based on movements in average balances over the period and rate variance based on changes in interest rates on average interest-earning assets and average interest-bearing liabilities. We have allocated variances caused by changes in both volume and rate to volume. You should read the following tables and the footnotes thereto in light of our observations noted in the preceding sub-section entitled “—Average Balance Sheets and Interest Rates”, and the footnotes thereto.
| Volume and rate analysis | IFRS-IASB 2011/2010 | IFRS-IASB 2013/2012 | ||||||||||||||||||||||
| Increase (Decrease) due to changes in | ||||||||||||||||||||||||
| Increase (Decrease) due to changes in | Volume | Rate | Net change | |||||||||||||||||||||
| Volume | Rate | Net change | (in millions of euros) | |||||||||||||||||||||
| (in millions of euros) | ||||||||||||||||||||||||
Interest income | ||||||||||||||||||||||||
Cash and due from central banks | ||||||||||||||||||||||||
Domestic | — | 100 | 100 | (87 | ) | 50 | (37 | ) | ||||||||||||||||
International | 794 | 364 | 1,158 | 65 | (20 | ) | 45 | |||||||||||||||||
|
|
|
|
|
| |||||||||||||||||||
| 794 | 464 | 1,258 | (22 | ) | 30 | 8 | ||||||||||||||||||
Due from credit entities | ||||||||||||||||||||||||
Domestic | (57 | ) | 41 | (16 | ) | 16 | — | 16 | ||||||||||||||||
International | 29 | 3 | 32 | 188 | (472 | ) | (284 | ) | ||||||||||||||||
|
|
|
|
|
| |||||||||||||||||||
| (28 | ) | 44 | 16 | 204 | (472 | ) | (268 | ) | ||||||||||||||||
Loans and credits | ||||||||||||||||||||||||
Domestic | (247 | ) | 516 | 269 | (711 | ) | (866 | ) | (1,577 | ) | ||||||||||||||
International | 2,306 | 2,480 | 4,786 | (2,168 | ) | (2,177 | ) | (4,345 | ) | |||||||||||||||
|
|
|
|
|
| |||||||||||||||||||
| 2,059 | 2,996 | 5,055 | (2,879 | ) | (3,043 | ) | (5,922 | ) | ||||||||||||||||
Debt securities | ||||||||||||||||||||||||
Domestic | (66 | ) | 388 | 322 | 118 | 49 | 167 | |||||||||||||||||
International | (60 | ) | 913 | 853 | (144 | ) | (681 | ) | (825 | ) | ||||||||||||||
|
|
|
|
|
| |||||||||||||||||||
| (126 | ) | 1,301 | 1,175 | (26 | ) | (632 | ) | (658 | ) | |||||||||||||||
Other interest-earning assets | ||||||||||||||||||||||||
Domestic | (79 | ) | 160 | 81 | (159 | ) | 33 | (126 | ) | |||||||||||||||
International | 20 | 104 | 124 | (54 | ) | 150 | 96 | |||||||||||||||||
|
|
|
|
|
| |||||||||||||||||||
| (59 | ) | 264 | 205 | (213 | ) | 183 | (30 | ) | ||||||||||||||||
Total interest-earning assets without hedging operations | ||||||||||||||||||||||||
Domestic | (449 | ) | 1,205 | 756 | (823 | ) | (734 | ) | (1,557 | ) | ||||||||||||||
International | 3,089 | 3,864 | 6,953 | (2,113 | ) | (3,200 | ) | (5,313 | ) | |||||||||||||||
|
|
|
|
|
| |||||||||||||||||||
| 2,640 | 5,069 | 7,709 | (2,936 | ) | (3,934 | ) | (6,870 | ) | ||||||||||||||||
Income from hedging operations | ||||||||||||||||||||||||
Domestic | 209 | — | 209 | (127 | ) | — | (127 | ) | ||||||||||||||||
International | 31 | — | 31 | (347 | ) | — | (347 | ) | ||||||||||||||||
|
|
|
|
|
| |||||||||||||||||||
| 240 | — | 240 | (474 | ) | — | (474 | ) | |||||||||||||||||
Total interest-earning assets | ||||||||||||||||||||||||
Domestic | (240 | ) | 1,205 | 965 | (950 | ) | (734 | ) | (1,684 | ) | ||||||||||||||
International | 3,120 | 3,864 | 6,984 | (2,460 | ) | (3,200 | ) | (5,660 | ) | |||||||||||||||
|
|
|
|
|
| |||||||||||||||||||
| 2,880 | 5,069 | 7,949 | (3,410 | ) | (3,934 | ) | (7,344 | ) | ||||||||||||||||
|
|
|
|
|
| |||||||||||||||||||
Cash and due from central banks Domestic International Due from credit entities Domestic International Loans and credits Domestic International Debt securities Domestic International Other interest-earning assets Domestic International Total interest-earning assets without hedging operations Domestic International Income from hedging operations Domestic International Total interest-earning assets Domestic International Volume and rate analysis IFRS-IASB
2012/2011 Increase (Decrease) due to changes in Volume Rate Net change (in millions of euros) Interest income 134 (230 ) (96 ) 92 (496 ) (404 ) 226 (726 ) (500 ) 24 (78 ) (54 ) (134 ) 160 26 (110 ) 82 (28 ) (670 ) 422 (248 ) 2,847 (3,141 ) (294 ) 2,177 (2,719 ) (542 ) 368 120 488 (515 ) (287 ) (802 ) (147 ) (167 ) (314 ) 334 (310 ) 24 195 (1,014 ) (819 ) 529 (1,324 ) (795 ) 190 (76 ) 114 2,485 (4,778 ) (2,293 ) 2,675 (4,854 ) (2,179 ) (167 ) — (167 ) 518 — 518 351 — 351 23 (76 ) (53 ) 3,003 (4,778 ) (1,775 ) 3,026 (4,854 ) (1,828 )
Due to credit entities Domestic International Customers’ deposits Domestic International Marketable debt securities Domestic International Subordinated debt Domestic International Other interest-bearing liabilities Domestic International Total interest-bearing liabilities without hedging operations Domestic International Expenses from hedging operations Domestic International Total interest-bearing liabilities Domestic International 49Volume and rate analysis IFRS-IASB
2013/2012 Increase (Decrease) due to changes in Volume Rate Net change (in millions of euros) Interest charges (511 ) 85 (426 ) 141 (226 ) (85 ) (370 ) (141 ) (511 ) 365 (162 ) 203 (664 ) (1,138 ) (1,802 ) (299 ) (1,300 ) (1,599 ) (406 ) 224 (182 ) (153 ) (63 ) (216 ) (559 ) 161 (398 ) (109 ) (32 ) (141 ) (258 ) 9 (249 ) (367 ) (23 ) (390 ) (204 ) 54 (150 ) (62 ) 442 380 (266 ) 496 230 (865 ) 169 (696 ) (996 ) (976 ) (1,972 ) (1,861 ) (807 ) (2,668 ) (164 ) — (164 ) (524 ) — (524 ) (688 ) — (688 ) (1,029 ) 169 (860 ) (1,520 ) (976 ) (2,496 ) (2,549 ) (807 ) (3,356 )
| Volume and rate analysis | IFRS-IASB 2010/2009 | |||||||||||||||||||||||
| Increase (Decrease) due to changes in | ||||||||||||||||||||||||
| Volume | Rate | Net change | IFRS-IASB 2012/2011 | |||||||||||||||||||||
| (in millions of euros) | Increase (Decrease) due to changes in | |||||||||||||||||||||||
Interest income | ||||||||||||||||||||||||
Cash and due from central banks | ||||||||||||||||||||||||
| Volume | Rate | Net change | ||||||||||||||||||||||
| (in millions of euros) | ||||||||||||||||||||||||
| Interest charges | ||||||||||||||||||||||||
Due to credit entities | ||||||||||||||||||||||||
Domestic | 6 | (6 | ) | — | 373 | (368 | ) | 5 | ||||||||||||||||
International | 482 | 1,095 | 1,577 | (246 | ) | (141 | ) | (387 | ) | |||||||||||||||
|
|
|
|
|
| |||||||||||||||||||
| 488 | 1,089 | 1,577 | 127 | (509 | ) | (382 | ) | |||||||||||||||||
Due from credit entities | ||||||||||||||||||||||||
Customers deposits | ||||||||||||||||||||||||
Domestic | 112 | (273 | ) | (161 | ) | (210 | ) | 165 | (45 | ) | ||||||||||||||
International | (230 | ) | (1,086 | ) | (1,316 | ) | 925 | (1,296 | ) | (371 | ) | |||||||||||||
|
|
|
|
|
| |||||||||||||||||||
| (118 | ) | (1,359 | ) | (1,477 | ) | 715 | (1,131 | ) | (416 | ) | ||||||||||||||
Loans and credits | ||||||||||||||||||||||||
Marketable debt securities | ||||||||||||||||||||||||
Domestic | (262 | ) | (2,724 | ) | (2,986 | ) | 125 | (92 | ) | 33 | ||||||||||||||
International | 3,268 | (511 | ) | 2,757 | 160 | 655 | 815 | |||||||||||||||||
|
|
|
|
|
| |||||||||||||||||||
| 3,006 | (3,235 | ) | (229 | ) | 285 | 563 | 848 | |||||||||||||||||
Debt securities | ||||||||||||||||||||||||
Subordinated debt | ||||||||||||||||||||||||
Domestic | 126 | (148 | ) | (22 | ) | (275 | ) | 159 | (116 | ) | ||||||||||||||
International | 705 | (38 | ) | 667 | (53 | ) | (122 | ) | (175 | ) | ||||||||||||||
|
|
|
|
|
| |||||||||||||||||||
| 831 | (186 | ) | 645 | (328 | ) | 37 | (291 | ) | ||||||||||||||||
Other interest-earning assets | ||||||||||||||||||||||||
Other interest-bearing liabilities | ||||||||||||||||||||||||
Domestic | (35 | ) | 123 | 88 | 353 | (482 | ) | (129 | ) | |||||||||||||||
International | 46 | (120 | ) | (74 | ) | 184 | (667 | ) | (483 | ) | ||||||||||||||
|
|
|
|
|
| |||||||||||||||||||
| 11 | 3 | 14 | 537 | (1,149 | ) | (612 | ) | |||||||||||||||||
Total interest-earning assets without hedging operations | ||||||||||||||||||||||||
Total interest-bearing liabilities without hedging operations | ||||||||||||||||||||||||
Domestic | (53 | ) | (3,028 | ) | (3,081 | ) | 366 | (618 | ) | (252 | ) | |||||||||||||
International | 4,271 | (660 | ) | 3,611 | 970 | (1,571 | ) | (601 | ) | |||||||||||||||
|
|
|
|
|
| |||||||||||||||||||
| 4,218 | (3,688 | ) | 530 | 1,336 | (2,189 | ) | (853 | ) | ||||||||||||||||
Income from hedging operations | ||||||||||||||||||||||||
Expenses from hedging operations | ||||||||||||||||||||||||
Domestic | (135 | ) | — | (135 | ) | (169 | ) | — | (169 | ) | ||||||||||||||
International | (663 | ) | — | (663 | ) | (134 | ) | — | (134 | ) | ||||||||||||||
|
|
|
|
|
| |||||||||||||||||||
| (798 | ) | — | (798 | ) | (303 | ) | — | (303 | ) | |||||||||||||||
Total interest-earning assets | ||||||||||||||||||||||||
Total interest-bearing liabilities | ||||||||||||||||||||||||
Domestic | (188 | ) | (3,028 | ) | (3,216 | ) | 197 | (618 | ) | (421 | ) | |||||||||||||
International | 3,608 | (660 | ) | 2,948 | 836 | (1,571 | ) | (735 | ) | |||||||||||||||
|
|
|
|
|
| |||||||||||||||||||
| 3,420 | (3,688 | ) | (268 | ) | 1,033 | (2,189 | ) | (1,156 | ) | |||||||||||||||
|
|
|
|
|
| |||||||||||||||||||
Assets
50
| IFRS-IASB 2011/2010 | ||||||||||||
| Increase (Decrease) due to changes in | ||||||||||||
| Volume | Rate | Net change | ||||||||||
| (in millions of euros) | ||||||||||||
Interest charges | ||||||||||||
Due to credit entities | ||||||||||||
Domestic | 75 | 292 | 367 | |||||||||
International | 93 | 743 | 836 | |||||||||
|
|
|
|
|
| |||||||
| 168 | 1,035 | 1,203 | ||||||||||
Customers deposits | ||||||||||||
Domestic | 174 | (118 | ) | 56 | ||||||||
International | 1,037 | 2,280 | 3,317 | |||||||||
|
|
|
|
|
| |||||||
| 1,211 | 2,162 | 3,373 | ||||||||||
Marketable debt securities | ||||||||||||
Domestic | (417 | ) | 683 | 266 | ||||||||
International | 23 | 1,181 | 1,204 | |||||||||
|
|
|
|
|
| |||||||
| (394 | ) | 1,864 | 1,470 | |||||||||
Subordinated debt | ||||||||||||
Domestic | (217 | ) | (50 | ) | (267 | ) | ||||||
International | (285 | ) | 262 | (23 | ) | |||||||
|
|
|
|
|
| |||||||
| (502 | ) | 212 | (290 | ) | ||||||||
Other interest-bearing liabilities | ||||||||||||
Domestic | (58 | ) | 269 | 211 | ||||||||
International | 27 | (44 | ) | (17 | ) | |||||||
|
|
|
|
|
| |||||||
| (31 | ) | 225 | 194 | |||||||||
Total interest-bearing liabilities without hedging operations | ||||||||||||
Domestic | (443 | ) | 1,076 | 633 | ||||||||
International | 895 | 4,422 | 5,317 | |||||||||
|
|
|
|
|
| |||||||
| 452 | 5,498 | 5,950 | ||||||||||
Expenses from hedging operations | ||||||||||||
Domestic | 558 | — | 558 | |||||||||
International | (154 | ) | — | (154 | ) | |||||||
|
|
|
|
|
| |||||||
| 404 | — | 404 | ||||||||||
Total interest-bearing liabilities | ||||||||||||
Domestic | 115 | 1,076 | 1,191 | |||||||||
International | 741 | 4,422 | 5,163 | |||||||||
|
|
|
|
|
| |||||||
| 856 | 5,498 | 6,354 | ||||||||||
51
| Volume and rate analysis | IFRS-IASB 2010/2009 | |||||||||||
| Increase (Decrease) due to changes in | ||||||||||||
| Volume | Rate | Net change | ||||||||||
| (in millions of euros) | ||||||||||||
Interest charges | ||||||||||||
Due to credit entities | ||||||||||||
Domestic | 113 | (148 | ) | (35 | ) | |||||||
International | (306 | ) | (1,272 | ) | (1,578 | ) | ||||||
|
|
|
|
|
| |||||||
| (193 | ) | (1,420 | ) | (1,613 | ) | |||||||
Customers deposits | ||||||||||||
Domestic | 473 | (329 | ) | 144 | ||||||||
International | 2,097 | (606 | ) | 1,491 | ||||||||
|
|
|
|
|
| |||||||
| 2,570 | (935 | ) | 1,635 | |||||||||
Marketable debt securities | ||||||||||||
Domestic | (566 | ) | (156 | ) | (722 | ) | ||||||
International | 215 | (770 | ) | (555 | ) | |||||||
|
|
|
|
|
| |||||||
| (351 | ) | (926 | ) | (1,277 | ) | |||||||
Subordinated debt | ||||||||||||
Domestic | (99 | ) | 90 | (9 | ) | |||||||
International | (237 | ) | 123 | (114 | ) | |||||||
|
|
|
|
|
| |||||||
| (336 | ) | 213 | (123 | ) | ||||||||
Other interest-bearing liabilities | ||||||||||||
Domestic | 69 | (167 | ) | (98 | ) | |||||||
International | 186 | (243 | ) | (57 | ) | |||||||
|
|
|
|
|
| |||||||
| 255 | (410 | ) | (155 | ) | ||||||||
Total interest-bearing liabilities without hedging operations | ||||||||||||
Domestic | (10 | ) | (710 | ) | (720 | ) | ||||||
International | 1,955 | (2,768 | ) | (813 | ) | |||||||
|
|
|
|
|
| |||||||
| 1,945 | (3,478 | ) | (1,533 | ) | ||||||||
Expenses from hedging operations | ||||||||||||
Domestic | (740 | ) | — | (740 | ) | |||||||
International | (918 | ) | — | (918 | ) | |||||||
|
|
|
|
|
| |||||||
| (1,658 | ) | — | (1,658 | ) | ||||||||
Total interest-bearing liabilities | ||||||||||||
Domestic | (750 | ) | (711 | ) | (1,461 | ) | ||||||
International | 1,037 | (2,768 | ) | (1,731 | ) | |||||||
|
|
|
|
|
| |||||||
| 287 | (3,479 | ) | (3,192 | ) | ||||||||
52
Assets
Earning Assets—Yield Spread
The following table analyzes, by domicile of customer, our average earning assets, interest income and dividends on equity securities and net interest income and shows gross yields, net yields and yield spread for each of the years indicated. You should read this table and the footnotes thereto in light of our observations noted in the preceding sub-section entitled “—Average Balance Sheets and Interest Rates”, and the footnotes thereto.
| Earning Assets - Yield Spread | IFRS-IASB | |||||||||||
| Year Ended December 31, | ||||||||||||
| 2011 | 2010 | 2009 | ||||||||||
| (in millions of euros, except percentages) | ||||||||||||
Average earning assets | ||||||||||||
Domestic | 315,387 | 335,229 | 329,181 | |||||||||
International | 810,809 | 757,196 | 674,775 | |||||||||
|
|
|
|
|
| |||||||
| 1,126,196 | 1,092,425 | 1,003,956 | ||||||||||
Interest | ||||||||||||
Domestic | 10,573 | 9,608 | 12,823 | |||||||||
International | 50,283 | 43,299 | 40,350 | |||||||||
|
|
|
|
|
| |||||||
| 60,856 | 52,907 | 53,173 | ||||||||||
Net interest income (1) | ||||||||||||
Domestic | 2,591 | 2,816 | 4,571 | |||||||||
International | 28,230 | 26,408 | 21,727 | |||||||||
|
|
|
|
|
| |||||||
| 30,821 | 29,224 | 26,298 | ||||||||||
Gross yield (2) | ||||||||||||
Domestic | 3.35 | % | 2.87 | % | 3.90 | % | ||||||
International | 6.20 | % | 5.72 | % | 5.98 | % | ||||||
|
|
|
|
|
| |||||||
| 5.40 | % | 4.84 | % | 5.30 | % | |||||||
Net yield (3) | ||||||||||||
Domestic | 0.82 | % | 0.84 | % | 1.39 | % | ||||||
International | 3.48 | % | 3.49 | % | 3.22 | % | ||||||
|
|
|
|
|
| |||||||
| 2.74 | % | 2.68 | % | 2.62 | % | |||||||
Yield spread (4) | ||||||||||||
Domestic | 1.02 | % | 0.92 | % | 1.45 | % | ||||||
International | 3.32 | % | 3.37 | % | 3.05 | % | ||||||
|
|
|
|
|
| |||||||
| 2.69 | % | 2.62 | % | 2.54 | % | |||||||
| IFRS-IASB | ||||||||||||
| Earning Assets - Yield Spread | Year Ended December 31, | |||||||||||
| 2013 | 2012 | 2011 | ||||||||||
| (in millions of euros, except percentages) | ||||||||||||
Average earning assets | ||||||||||||
Domestic | 330,416 | 373,609 | 339,264 | |||||||||
International | 792,596 | 820,173 | 785,329 | |||||||||
|
|
|
|
|
| |||||||
| 1,123,012 | 1,193,782 | 1,124,593 | ||||||||||
Interest | ||||||||||||
Domestic | 8,836 | 10,520 | 10,573 | |||||||||
International | 42,611 | 48,271 | 50,044 | |||||||||
|
|
|
|
|
| |||||||
| 51,447 | 58,791 | 60,617 | ||||||||||
Net interest income (1) | ||||||||||||
Domestic | 2,135 | 2,959 | 2,591 | |||||||||
International | 23,800 | 26,964 | 28,002 | |||||||||
|
|
|
|
|
| |||||||
| 25,935 | 29,923 | 30,594 | ||||||||||
Gross yield (2) | ||||||||||||
Domestic | 2.67 | % | 2.82 | % | 3.12 | % | ||||||
International | 5.38 | % | 5.89 | % | 6.37 | % | ||||||
|
|
|
|
|
| |||||||
| 4.58 | % | 4.92 | % | 5.39 | % | |||||||
Net yield (3) | ||||||||||||
Domestic | 0.65 | % | 0.79 | % | 0.76 | % | ||||||
International | 3.00 | % | 3.29 | % | 3.57 | % | ||||||
|
|
|
|
|
| |||||||
| 2.31 | % | 2.51 | % | 2.72 | % | |||||||
Yield spread (4) | ||||||||||||
Domestic | 0.83 | % | 0.95 | % | 0.98 | % | ||||||
International | 2.83 | % | 3.10 | % | 3.37 | % | ||||||
|
|
|
|
|
| |||||||
| 2.26 | % | 2.46 | % | 2.68 | % | |||||||
| (1) | Net interest income is the net amount of interest and similar income and interest expense and similar charges. See “Income Statement” on page |
| (2) | Gross yield is the quotient of interest income divided by average earning assets. |
| (3) | Net yield is the quotient of net interest income divided by average earning assets. |
| (4) | Yield spread is the difference between gross yield on earning assets and the average cost of interest-bearing liabilities. For a discussion of the changes in yield spread over the periods presented, see “Item 5. Operating and Financial Review and Prospects—A. Operating results—Results of Operations for Santander—Interest Income / (Charges)” herein. |
53
Return on Equity and Assets
The following table presents our selected financial ratios for the years indicated.
| Year Ended December 31, | Year Ended December 31, | |||||||||||||||||||||||
| 2011 | 2010 | 2009 | 2013 | 2012 | 2011 | |||||||||||||||||||
ROA: Return on average total assets | 0.50 | % | 0.76 | % | 0.86 | % | ||||||||||||||||||
ROA: Return on average total assets | 0.45 | % | 0.24 | % | 0.50 | % | ||||||||||||||||||
ROE: Return on average stockholders’ equity | 7.14 | % | 11.80 | % | 13.90 | % | 6.10 | % | 2.91 | % | 7.12 | % | ||||||||||||
PAY-OUT: Dividends per average share as a percentage of net attributable income per average share (*) | 34.33 | % | 40.70 | % | 46.09 | % | 20.07 | % | 46.30 | % | 38.72 | % | ||||||||||||
Average stockholders’ equity as a percentage of average total assets | 6.10 | % | 5.82 | % | 5.85 | % | 5.90 | % | 5.65 | % | 5.88 | % | ||||||||||||
| (*) | The pay-out ratio does not include in the numerator the amounts paid under theSantander Dividendo Elección program (scrip dividends) which are not dividends paid on account of the net attributable income of the period. Such amounts equivalent to dividends |
Interest-Earning Assets
The following table shows, by domicile of customer, the percentage mix of our average interest-earning assets for the years indicated. You should read this table in light of our observations noted in the preceding sub-section entitled “—Average Balance Sheets and Interest Rates”, and the footnotes thereto.
| Interest-earning assets | ||||||||||||
| IFRS-IASB | ||||||||||||
| Year Ended December 31, | ||||||||||||
| 2011 | 2010 | 2009 | ||||||||||
Cash and due from Central Banks | ||||||||||||
Domestic | 0.75 | % | 0.77 | % | 0.79 | % | ||||||
International | 6.51 | % | 4.85 | % | 2.59 | % | ||||||
|
|
|
|
|
| |||||||
| 7.26 | % | 5.62 | % | 3.38 | % | |||||||
Due from credit entities | ||||||||||||
Domestic | 1.97 | % | 2.69 | % | 2.09 | % | ||||||
International | 4.71 | % | 4.70 | % | 5.81 | % | ||||||
|
|
|
|
|
| |||||||
| 6.68 | % | 7.39 | % | 7.90 | % | |||||||
Loans and credits | ||||||||||||
Domestic | 19.31 | % | 20.56 | % | 22.99 | % | ||||||
International | 45.64 | % | 44.18 | % | 43.55 | % | ||||||
|
|
|
|
|
| |||||||
| 64.95 | % | 64.74 | % | 66.54 | % | |||||||
Debt securities | ||||||||||||
Domestic | 3.76 | % | 4.10 | % | 4.00 | % | ||||||
International | 9.46 | % | 9.86 | % | 9.25 | % | ||||||
|
|
|
|
|
| |||||||
| 13.22 | % | 13.96 | % | 13.25 | % | |||||||
Other interest-earning assets | ||||||||||||
Domestic | 2.21 | % | 2.53 | % | 2.93 | % | ||||||
International | 5.68 | % | 5.76 | % | 6.00 | % | ||||||
|
|
|
|
|
| |||||||
| 7.89 | % | 8.29 | % | 8.93 | % | |||||||
Total interest-earning assets | ||||||||||||
Domestic | 28.00 | % | 30.65 | % | 32.80 | % | ||||||
International | 72.00 | % | 69.35 | % | 67.20 | % | ||||||
|
|
|
|
|
| |||||||
| 100.00 | % | 100.00 | % | 100.00 | % | |||||||
Cash and due from Central Banks Domestic International Due from credit entities Domestic International Loans and credits Domestic International Debt securities Domestic International Other interest-earning assets Domestic International Total interest-earning assets Domestic International 54 IFRS-IASB
Year Ended December 31, 2013 2012 2011 0.58 % 1.78 % 0.75 % 6.93 % 6.35 % 6.52 % 7.51 % 8.13 % 7.27 % 2.52 % 2.12 % 1.97 % 5.10 % 3.83 % 4.73 % 7.62 % 5.95 % 6.70 % 15.94 % 16.70 % 19.33 % 46.42 % 46.32 % 45.56 % 62.36 % 63.02 % 64.89 % 4.96 % 4.40 % 3.76 % 8.42 % 8.15 % 9.47 % 13.38 % 12.55 % 13.23 % 5.43 % 6.31 % 4.34 % 3.70 % 4.04 % 3.57 % 9.13 % 10.35 % 7.91 % 29.43 % 31.31 % 30.15 % 70.57 % 68.69 % 69.85 % 100.00 % 100.00 % 100.00 %
Our financial information included in this annual report on Form 20-F has been prepared since 2008 under IFRS-IASB. There are no material differences between the financial information disclosed in this section of our annual report under IFRS-IASB and the periods prior to 2008 previously presented under EU-IFRS. See “Item 3. Key information – A. Selected Financial Data” in our 2008 Form 20-F for additional information.
The following tables show our short-term funds deposited with other banks at each of the dates indicated.
| IFRS-IASB At December 31, | IFRS-IASB Year Ended December 31, | |||||||||||||||||||||||||||||||||||||||
| 2011 | 2010 | 2009 | 2008 | 2007 | 2013 | 2012 | 2011 | 2010 | 2009 | |||||||||||||||||||||||||||||||
| (in millions of euros) | (in millions of euros) | |||||||||||||||||||||||||||||||||||||||
Reciprocal accounts | 2,658 | 1,264 | 713 | 663 | 418 | 1,858 | 1,863 | 2,658 | 1,264 | 713 | ||||||||||||||||||||||||||||||
Time deposits | 11,419 | 13,548 | 21,382 | 25,456 | 13,569 | 16,284 | 15,669 | 11,419 | 13,548 | 21,382 | ||||||||||||||||||||||||||||||
Reverse repurchase agreements | 10,647 | 36,721 | 29,490 | 18,569 | 30,276 | 29,702 | 25,486 | 10,647 | 36,721 | 29,490 | ||||||||||||||||||||||||||||||
Other accounts | 27,002 | 28,322 | 28,252 | 34,104 | 13,380 | 27,120 | 30,882 | 27,002 | 28,322 | 28,252 | ||||||||||||||||||||||||||||||
|
|
|
|
|
|
|
|
|
| |||||||||||||||||||||||||||||||
| 51,726 | 79,855 | 79,837 | 78,792 | 57,643 | 74,964 | 73,900 | 51,726 | 79,855 | 79,837 | |||||||||||||||||||||||||||||||
Of which impairment allowances | (37 | ) | (17 | ) | (26 | ) | (254 | ) | (18 | ) | (37 | ) | (30 | ) | (36 | ) | (17 | ) | (26 | ) | ||||||||||||||||||||
Investment Securities
At December 31, 2011,2013, the book value of our investment securities was €154.0€142.2 billion (representing 12.3%13% of our total assets). These investment securities had a yield of 4.61%4.23% in 20112013 compared with a yield of 3.76%4.69% in 2010,2012, and a yield of 3.94%4.61% in 2009.2011. Approximately €39.3€32.9 billion, or 27.3%23.1%, of our investment securities at December 31, 20112013 consisted of Spanish Government and government agency securities. For a discussion of how we value our investment securities, see Note 2 to our consolidated financial statements.
55
The following tables show the book values of our investment securities by type and domicile of counterparty at each of the dates indicated.
| IFRS-IASB Year Ended December 31, | ||||||||||||||||||||||||
| IFRS-IASB Year Ended December 31, | 2013 | 2012 | 2011 | |||||||||||||||||||||
| 2011 | 2010 | 2009 | (in millions of euros) | |||||||||||||||||||||
| Debt securities | (in millions of euros) | |||||||||||||||||||||||
Domestic- | ||||||||||||||||||||||||
Spanish Government | 37,698 | 35,110 | 37,770 | 31,160 | 35,380 | 37,698 | ||||||||||||||||||
Other domestic issuer: | ||||||||||||||||||||||||
Public authorities | 1,611 | 553 | 543 | 1,720 | 1,761 | 1,611 | ||||||||||||||||||
Other domestic issuer | 8,409 | 7,915 | 8,125 | 11,752 | 10,046 | 8,409 | ||||||||||||||||||
|
|
|
|
|
| |||||||||||||||||||
Total domestic | 47,718 | 43,578 | 46,438 | 44,632 | 47,187 | 47,718 | ||||||||||||||||||
International- | ||||||||||||||||||||||||
United States: | ||||||||||||||||||||||||
U.S. Treasury and other U.S. Government agencies | 514 | 1,122 | 1,184 | 2,620 | 132 | 514 | ||||||||||||||||||
States and political subdivisions | 1,420 | 1,743 | 1,715 | 1,653 | 6,941 | 1,420 | ||||||||||||||||||
Other securities | 11,115 | 11,598 | 12,965 | 5,945 | 7,648 | 11,115 | ||||||||||||||||||
|
|
|
|
|
| |||||||||||||||||||
Total United States | 13,049 | 14,463 | 15,864 | 10,218 | 14,721 | 13,049 | ||||||||||||||||||
Other: | ||||||||||||||||||||||||
Governments | 58,619 | 60,737 | 41,108 | 55,387 | 60,149 | 58,619 | ||||||||||||||||||
Other securities | 24,647 | 31,961 | 48,291 | 22,416 | 19,431 | 24,647 | ||||||||||||||||||
|
|
|
|
|
| |||||||||||||||||||
Total Other | 83,266 | 92,698 | 89,399 | 77,803 | 79,580 | 83,266 | ||||||||||||||||||
|
|
|
|
|
| |||||||||||||||||||
Total International | 96,315 | 107,161 | 105,263 | 88,021 | 94,301 | 96,315 | ||||||||||||||||||
Less- Allowance for credit losses | (251 | ) | (144 | ) | (167 | ) | (207 | ) | (144 | ) | (251 | ) | ||||||||||||
Less- Price fluctuation allowance | — | — | — | |||||||||||||||||||||
Total Debt Securities | 143,782 | 150,595 | 151,534 | 132,446 | 141,344 | 143,782 | ||||||||||||||||||
Equity securities | ||||||||||||||||||||||||
Domestic | 3,574 | 5,458 | 6,070 | 3,449 | 3,802 | 3,574 | ||||||||||||||||||
International- | ||||||||||||||||||||||||
United States | 1,283 | 1,931 | 1,490 | 951 | 1,417 | 1,283 | ||||||||||||||||||
Other | 5,376 | 16,274 | 14,896 | 5,388 | 5,503 | 5,376 | ||||||||||||||||||
|
|
|
|
|
| |||||||||||||||||||
Total international | 6,659 | 18,205 | 16,386 | 6,339 | 6,920 | 6,659 | ||||||||||||||||||
Less- Price fluctuation allowance | — | — | — | |||||||||||||||||||||
|
|
| ||||||||||||||||||||||
Total Equity Securities | 10,233 | 23,663 | 22,456 | 9,788 | 10,722 | 10,233 | ||||||||||||||||||
|
|
| ||||||||||||||||||||||
Total Investment Securities | 154,015 | 174,258 | 173,990 | 142,234 | 152,066 | 154,015 | ||||||||||||||||||
56
The following table sets out the aggregate book value and aggregate market value of the securities of single issuers, other than the Government of the United States, which exceeded 10% of our stockholders’ equity as of December 31, 20112013 (and other debt securities with aggregate values near to 10% of our stockholders’ equity).
| Aggregate as of December 31, 2011 | Aggregate as of December 31, 2013 | |||||||||||||||
| Book value | Market value | Book value | Market value | |||||||||||||
| (in millions of euros) | (in millions of euros) | |||||||||||||||
Debt securities: | ||||||||||||||||
Debt securities: | ||||||||||||||||
Exceed 10% of stockholders’ equity: | ||||||||||||||||
Spanish Government and public authorities | 39,309 | 39,309 | 32,880 | 32,880 | ||||||||||||
Near 10% of stockholders’ equity: | ||||||||||||||||
Federative Republic of Brazil: | 5,920 | 5,920 | ||||||||||||||
LCH Clearnet Group Limited | 6,374 | 6,374 | ||||||||||||||
The following table shows the maturities of our debt investment securities (before impairment allowances) atas of December 31, 2011.2013.
| Year Ended December 31, 2011 | Year Ended December 31, 2013 | |||||||||||||||||||||||||||||||||||||||
| Maturing | Maturing | Maturing Within 1 Year | Maturing Between 1 and 5 Years | Maturing Between 5 and 10 Years | Maturing After 10 Years | Total | ||||||||||||||||||||||||||||||||||
| Maturing | Between | Between | Maturing | |||||||||||||||||||||||||||||||||||||
| Within | 1 and | 5 and | After | |||||||||||||||||||||||||||||||||||||
| 1 Year | 5 Years | 10 Years | 10 Years | Total | ||||||||||||||||||||||||||||||||||||
| Debt Securities | (in millions of euros) | |||||||||||||||||||||||||||||||||||||||
| Debt securities | (in millions of euros) | |||||||||||||||||||||||||||||||||||||||
Domestic: | ||||||||||||||||||||||||||||||||||||||||
Spanish Government | 9,387 | 7,287 | 16,875 | 4,149 | 37,698 | 4,055 | 5,130 | 14,871 | 7,104 | 31,160 | ||||||||||||||||||||||||||||||
Other domestic issuer: | ||||||||||||||||||||||||||||||||||||||||
Public authorities | 142 | 1,225 | 243 | 1 | 1,611 | 323 | 1,328 | 63 | 6 | 1,720 | ||||||||||||||||||||||||||||||
Other domestic issuer | 3,350 | 3,090 | 666 | 1,303 | 8,409 | 771 | 6,999 | 1,432 | 2,550 | 11,752 | ||||||||||||||||||||||||||||||
|
|
|
|
| ||||||||||||||||||||||||||||||||||||
Total domestic | 12,879 | 11,602 | 17,784 | 5,453 | 47,718 | 5,149 | 13,457 | 16,366 | 9,660 | 44,632 | ||||||||||||||||||||||||||||||
International: | ||||||||||||||||||||||||||||||||||||||||
United States: | ||||||||||||||||||||||||||||||||||||||||
U.S. Treasury and other U.S. Government agencies | 500 | 8 | 2 | 4 | 514 | 777 | 511 | 69 | 1,263 | 2,620 | ||||||||||||||||||||||||||||||
States and political subdivisions | 23 | 53 | 17 | 1,327 | 1,420 | 181 | 83 | 84 | 1,305 | 1,653 | ||||||||||||||||||||||||||||||
Other securities | 371 | 2,310 | 722 | 7,712 | 11,115 | 312 | 2,038 | 934 | 2,661 | 5,945 | ||||||||||||||||||||||||||||||
|
|
|
|
| ||||||||||||||||||||||||||||||||||||
Total United States | 894 | 2,371 | 741 | 9,043 | 13,049 | 1,270 | 2,632 | 1,087 | 5,229 | 10,218 | ||||||||||||||||||||||||||||||
Other: | ||||||||||||||||||||||||||||||||||||||||
Governments | 20,842 | 26,777 | 8,946 | 2,054 | 58,619 | 19,202 | 25,934 | 6,489 | 3,762 | 55,387 | ||||||||||||||||||||||||||||||
Other securities | 10,787 | 6,422 | 5,106 | 2,332 | 24,647 | 5,901 | 9,887 | 4,604 | 2,024 | 22,416 | ||||||||||||||||||||||||||||||
|
|
|
|
| ||||||||||||||||||||||||||||||||||||
Total Other | 31,629 | 33,199 | 14,052 | 4,386 | 83,266 | 25,103 | 35,821 | 11,093 | 5,786 | 77,803 | ||||||||||||||||||||||||||||||
|
|
|
|
| ||||||||||||||||||||||||||||||||||||
Total International | 32,523 | 35,570 | 14,793 | 13,429 | 96,315 | 26,373 | 38,453 | 12,180 | 11,015 | 88,021 | ||||||||||||||||||||||||||||||
Total debt investment securities | 45,402 | 47,172 | 32,577 | 18,882 | 144,033 | 31,522 | 51,910 | 28,546 | 20,675 | 132,653 | ||||||||||||||||||||||||||||||
57
Loan Portfolio
At December 31, 2011,2013, our total loans and advances to customers equaled €769.0€693.8 billion (61.45%(62.2% of our total assets). Net of allowances for credit losses, loans and advances to customers equaled €750.1€668.9 billion at December 31, 2011 (59.9%2013 (60.0% of our total assets). In addition to loans, we had outstanding atas of December 31, 2007, 2008, 2009,2013, 2012, 2011, 2010 and 2011 €102.22009 €154.3 billion, €123.3€187.7 billion, €150.6€181.6 billion, €180.0 billion and €181.6€150.6 billion respectively, of undrawn balances available to third parties.
Loans by Geographic Area and Type of Customer
The following tables illustrate our loans and advances to customers (including securities purchased under agreement to resell), by domicile and type of customer, at each of the dates indicated.
| IFRS-IASB At December 31, | IFRS-IASB Year Ended December 31, | |||||||||||||||||||||||||||||||||||||||
| 2011 | 2010 | 2009 | 2008 | 2007 | 2013 | 2012 | 2011 | 2010 | 2009 | |||||||||||||||||||||||||||||||
| (in millions of euros) | (in millions of euros) | |||||||||||||||||||||||||||||||||||||||
Loans to borrowers in Spain (**): | ||||||||||||||||||||||||||||||||||||||||
Loans to borrowers in Spain: (**): | ||||||||||||||||||||||||||||||||||||||||
Spanish Government | 12,147 | 12,137 | 9,803 | 7,668 | 5,633 | 13,374 | 16,884 | 12,147 | 12,137 | 9,803 | ||||||||||||||||||||||||||||||
Commercial, financial, agricultural and industrial | 65,935 | 67,940 | 70,137 | 56,290 | 45,170 | 47,583 | 61,527 | 65,935 | 67,940 | 70,137 | ||||||||||||||||||||||||||||||
Real estate and construction (*) | 36,260 | 38,419 | 42,515 | 48,099 | 46,837 | 27,158 | 29,008 | 36,260 | 38,419 | 42,515 | ||||||||||||||||||||||||||||||
Other mortgages | 69,297 | 74,462 | 68,866 | 59,784 | 59,269 | 62,180 | 63,886 | 69,297 | 74,462 | 68,866 | ||||||||||||||||||||||||||||||
Installment loans to individuals | 12,964 | 15,985 | 20,070 | 21,506 | 21,533 | 8,668 | 12,775 | 12,964 | 15,985 | 20,070 | ||||||||||||||||||||||||||||||
Lease financing | 5,043 | 6,195 | 7,534 | 9,253 | 9,644 | 3,372 | 3,857 | 5,043 | 6,195 | 7,534 | ||||||||||||||||||||||||||||||
Other | 12,912 | 12,475 | 11,420 | 37,647 | 49,995 | 11,517 | 12,077 | 12,912 | 12,475 | 11,420 | ||||||||||||||||||||||||||||||
|
|
|
|
|
|
|
|
|
| |||||||||||||||||||||||||||||||
Total | 214,558 | 227,613 | 230,345 | 240,247 | 238,081 | 173,852 | 200,014 | 214,558 | 227,613 | 230,345 | ||||||||||||||||||||||||||||||
Loans to borrowers outside Spain (**): | ||||||||||||||||||||||||||||||||||||||||
Loans to borrowers outside Spain: (**): | ||||||||||||||||||||||||||||||||||||||||
Non-Spanish Governments | 4,394 | 3,527 | 2,861 | 3,029 | 2,296 | 4,402 | 4,983 | 4,394 | 3,527 | 2,861 | ||||||||||||||||||||||||||||||
Commercial and industrial | 225,961 | 217,747 | 174,763 | 127,839 | 143,046 | 209,820 | 217,358 | 225,961 | 217,747 | 174,763 | ||||||||||||||||||||||||||||||
Mortgage loans | 296,330 | 269,893 | 249,065 | 201,112 | 179,164 | 275,739 | 290,825 | 296,330 | 269,893 | 249,065 | ||||||||||||||||||||||||||||||
Other | 27,793 | 25,071 | 43,390 | 67,127 | 17,207 | 29,946 | 31,354 | 26,104 | 23,226 | 43,390 | ||||||||||||||||||||||||||||||
|
|
|
|
|
|
|
|
|
| |||||||||||||||||||||||||||||||
Total | 554,478 | 516,238 | 470,079 | 399,107 | 341,713 | 519,907 | 544,520 | 552,789 | 514,393 | 470,079 | ||||||||||||||||||||||||||||||
Total loans and leases, gross | 769,036 | 743,851 | 700,424 | 639,354 | 579,794 | 693,759 | 744,534 | 767,347 | 742,007 | 700,424 | ||||||||||||||||||||||||||||||
Allowance for possible loan losses (***) | (18,936 | ) | (19,697 | ) | (17,873 | ) | (12,466 | ) | (8,695 | ) | ||||||||||||||||||||||||||||||
|
|
|
|
| ||||||||||||||||||||||||||||||||||||
Allowance for loan losses (***) | (24,903 | ) | (25,422 | ) | (18,806 | ) | (19,502 | ) | (17,873 | ) | ||||||||||||||||||||||||||||||
Loans and leases, net of allowances | 750,100 | 724,154 | 682,551 | 626,888 | 571,099 | 668,856 | 719,112 | 748,541 | 722,504 | 682,551 | ||||||||||||||||||||||||||||||
| (*) | As of December 31, |
| (**) | Credit of any nature granted to credit institutions is included in the “Loans and advances to credit institutions” caption of our balance sheet. |
| (***) | Refers to loan losses of “Loans and Advances to customers”. See “Item 3. Key |
At December 31, 2011,2013, our loans and advances to associated companies and jointly controlled entities amounted to €146€1,331 million (see “Item 7. Major Shareholders and Related Party Transactions—B. Related party transactions”). Excluding government-related loans and advances, the largest outstanding exposure to a single counterparty at December 31, 20112013 was €4.6€3.2 billion (0.6%(0.5% of total loans and advances, including government-related loans), and the five next largest exposures totaled €7.0€7.2 billion (0.9%(1.1% of total loans, including government-related loans).
58
Maturity
The following table sets forth an analysis by maturity of our loans and advances to customers by domicile and type of customer atas of December 31, 2011.2013.
| Maturity | Maturity | |||||||||||||||||||||||||||||||||||||||||||||||||||||||||||||||
| Less than | One to five | Over five | Less than | One to five | Over five | |||||||||||||||||||||||||||||||||||||||||||||||||||||||||||
| one year | years | years | Total | one year | years | years | Total | |||||||||||||||||||||||||||||||||||||||||||||||||||||||||
| Balance | % of Total | Balance | % of Total | Balance | % of Total | Balance | % of Total | Balance | % of Total | Balance | % of Total | Balance | % of Total | Balance | % of Total | |||||||||||||||||||||||||||||||||||||||||||||||||
| (in millions of euros, except percentages) | (in millions of euros, except percentages) | |||||||||||||||||||||||||||||||||||||||||||||||||||||||||||||||
Loans to borrowers in Spain: (*) | ||||||||||||||||||||||||||||||||||||||||||||||||||||||||||||||||
Spanish Government | 4,271 | 2.12 | % | 3,630 | 2.03 | % | 4,246 | 1.09 | % | 12,147 | 1.58 | % | 3,169 | 1.67 | % | 5,446 | 3.34 | % | 4,759 | 1.40 | % | 13,374 | 1.93 | % | ||||||||||||||||||||||||||||||||||||||||
Commercial, financial, agriculture and industrial | 30,142 | 14.97 | % | 17,708 | 9.90 | % | 18,085 | 4.65 | % | 65,935 | 8.57 | % | 18,728 | 9.87 | % | 19,303 | 11.84 | % | 9,552 | 2.80 | % | 47,583 | 6.86 | % | ||||||||||||||||||||||||||||||||||||||||
Real estate and construction | 3,645 | 1.81 | % | 3,786 | 2.12 | % | 28,829 | 7.42 | % | 36,260 | 4.72 | % | 2,276 | 1.20 | % | 3,263 | 2.00 | % | 21,619 | 6.34 | % | 27,158 | 3.91 | % | ||||||||||||||||||||||||||||||||||||||||
Other mortgages | 6,582 | 3.27 | % | 5,079 | 2.84 | % | 57,635 | 14.83 | % | 69,296 | 9.01 | % | 5,618 | 2.96 | % | 4,806 | 2.95 | % | 51,756 | 15.18 | % | 62,180 | 8.96 | % | ||||||||||||||||||||||||||||||||||||||||
Installment loans to individuals | 5,537 | 2.75 | % | 4,935 | 2.76 | % | 2,492 | 0.64 | % | 12,964 | 1.69 | % | 2,916 | 1.54 | % | 3,747 | 2.30 | % | 2,005 | 0.59 | % | 8,668 | 1.25 | % | ||||||||||||||||||||||||||||||||||||||||
Lease financing | 881 | 0.44 | % | 2,522 | 1.41 | % | 1,640 | 0.42 | % | 5,043 | 0.66 | % | 386 | 0.20 | % | 2,013 | 1.23 | % | 973 | 0.29 | % | 3,372 | 0.49 | % | ||||||||||||||||||||||||||||||||||||||||
Other | 6,335 | 3.15 | % | 3,687 | 2.06 | % | 2,891 | 0.74 | % | 12,913 | 1.68 | % | 7,569 | 3.99 | % | 1,189 | 0.73 | % | 2,759 | 0.81 | % | 11,517 | 1.66 | % | ||||||||||||||||||||||||||||||||||||||||
|
|
|
|
|
|
|
|
|
|
|
|
|
|
|
| |||||||||||||||||||||||||||||||||||||||||||||||||
Total borrowers in Spain | 57,393 | 28.50 | % | 41,347 | 23.11 | % | 115,818 | 29.79 | % | 214,558 | 27.90 | % | 40,662 | 21.43 | % | 39,767 | 24.38 | % | 93,423 | 27.40 | % | 173,852 | 25.06 | % | ||||||||||||||||||||||||||||||||||||||||
Loans to borrowers outside Spain: (*) | ||||||||||||||||||||||||||||||||||||||||||||||||||||||||||||||||
Non-Spanish Governments | 1,678 | 0.83 | % | 1,253 | 0.70 | % | 1,463 | 0.38 | % | 4,394 | 0.57 | % | 1,651 | 0.87 | % | 1,250 | 0.77 | % | 1,501 | 0.44 | % | 4,402 | 0.63 | % | ||||||||||||||||||||||||||||||||||||||||
Commercial and Industrial | 109,338 | 54.30 | % | 91,725 | 51.28 | % | 24,898 | 6.40 | % | 225,961 | 29.38 | % | 103,361 | 54.47 | % | 81,955 | 50.25 | % | 24,504 | 7.19 | % | 209,820 | 30.24 | % | ||||||||||||||||||||||||||||||||||||||||
Mortgage loans | 15,483 | 7.69 | % | 38,318 | 21.42 | % | 242,529 | 62.38 | % | 296,330 | 38.53 | % | 22,397 | 11.80 | % | 34,287 | 21.02 | % | 219,055 | 64.25 | % | 275,739 | 39.75 | % | ||||||||||||||||||||||||||||||||||||||||
Other | 17,456 | 8.67 | % | 6,222 | 3.48 | % | 4,115 | 1.06 | % | 27,793 | 3.61 | % | 21,683 | 11.43 | % | 5,821 | 3.57 | % | 2,442 | 0.72 | % | 29,946 | 4.32 | % | ||||||||||||||||||||||||||||||||||||||||
|
|
|
|
|
|
|
|
|
|
|
|
|
|
|
| |||||||||||||||||||||||||||||||||||||||||||||||||
Total loans to borrowers outside Spain | 143,955 | 71.50 | % | 137,518 | 76.88 | % | 273,005 | 70.21 | % | 554,478 | 72.10 | % | 149,092 | 78.57 | % | 123,313 | 75.62 | % | 247,502 | 72.60 | % | 519,907 | 74.94 | % | ||||||||||||||||||||||||||||||||||||||||
Total loans and leases, gross | 201,348 | 100.00 | % | 178,865 | 100.00 | % | 388,823 | 100.00 | % | 769,036 | 100.00 | % | 189,754 | 100.00 | % | 163,080 | 100.00 | % | 340,925 | 100.00 | % | 693,759 | 100.00 | % | ||||||||||||||||||||||||||||||||||||||||
| (*) | Credit of any nature granted to credit institutions is included in the “Loans and advances to credit institutions” caption of our balance sheet. |
For roll-over not due to client´s financial difficulties, the analysis of the situation is performed under standard acceptance terms and a comprehensive review of the client.
Fixed and Variable Rate Loans
The following table sets forth a breakdown of our fixed and variable rate loans having a maturity of more than one year at December 31, 2011.2013.
| Fixed and variable rate loans | ||||||||||||||||||||||||
| having a maturity of more than one year | Fixed and variable rate loans having a maturity of more than one year | |||||||||||||||||||||||
| Domestic | International | Total | Domestic | International | Total | |||||||||||||||||||
| (in millions of euros) | (in millions of euros) | |||||||||||||||||||||||
Fixed rate | 27,749 | 141,669 | 169,418 | 21,904 | 145,514 | 167,419 | ||||||||||||||||||
Variable rate | 129,416 | 268,854 | 398,270 | 111,286 | 225,301 | 336,587 | ||||||||||||||||||
|
|
| ||||||||||||||||||||||
Total | 157,165 | 410,523 | 567,688 | 133,190 | 370,815 | 504,005 | ||||||||||||||||||
59
Cross-Border Outstandings
The following table sets forth, as of the end of the years indicated, the aggregate amount of our cross-border outstandings (which consist of loans, interest-bearing deposits with other banks, acceptances and other monetary assets denominated in a currency other than the home-country currency of the office where the item is booked) where outstandings in the borrower’s country exceeded 0.75% of our total assets. Cross-border outstandings do not include local currency loans made by subsidiary banks in other countries to the extent that such loans are funded in the local currency or hedged. As a result, they do not include the vast majority of the loans by Santander UK or our Latin American subsidiaries.
| IFRS-IASB | 2013 | IFRS-IASB 2012 | 2011 | |||||||||||||||||||||||||||||||||||||||||||||
| 2011 | 2010 | 2009 | % of | % of | % of | |||||||||||||||||||||||||||||||||||||||||||
| % of | % of | % of | total | total | total | |||||||||||||||||||||||||||||||||||||||||||
| total | total | total | assets | assets | assets | |||||||||||||||||||||||||||||||||||||||||||
| assets | assets | assets | (in millions of euros, except percentages) | |||||||||||||||||||||||||||||||||||||||||||||
| (in millions of euros, except percentages) | ||||||||||||||||||||||||||||||||||||||||||||||||
OECD (1) (2) Countries: | ||||||||||||||||||||||||||||||||||||||||||||||||
Total OECD Countries | 17,736 | 1.12 | % | 13,613 | 1.12 | % | 14,327 | 1.29 | % | 12,518 | 1.12 | % | 19,325 | 1.52 | % | 17,736 | 1.12 | % | ||||||||||||||||||||||||||||||
Non-OECD Countries: | ||||||||||||||||||||||||||||||||||||||||||||||||
Latin American Countries (2) (3) | 5,730 | 0.65 | % | 7,885 | 0.65 | % | 8,298 | 0.75 | % | |||||||||||||||||||||||||||||||||||||||
Non-OECD Countries: | ||||||||||||||||||||||||||||||||||||||||||||||||
Total Latin American Countries (2) (3) | 10,962 | 0.98 | % | 10,861 | 0.86 | % | 11,000 | 0.88 | % | |||||||||||||||||||||||||||||||||||||||
Other Non-OECD | 10,698 | 0.96 | % | 7,418 | 0.58 | % | 6,944 | 0.55 | % | |||||||||||||||||||||||||||||||||||||||
|
|
|
|
|
| |||||||||||||||||||||||||||||||||||||||||||
Total Non-OECD | 17,944 | 1.73 | % | 21,096 | 1.73 | % | 20,215 | 1.82 | % | 21,660 | 1.94 | % | 18,279 | 1.44 | % | 17,944 | 1.73 | % | ||||||||||||||||||||||||||||||
|
|
|
|
|
| |||||||||||||||||||||||||||||||||||||||||||
Total | 35,680 | 2.85 | % | 34,709 | 2.85 | % | 34,542 | 3.11 | % | 34,178 | 3.06 | % | 37,604 | 2.96 | % | 35,680 | 2.85 | % | ||||||||||||||||||||||||||||||
| (1) | The Organization for Economic Cooperation and Development. |
| (2) | Aggregate outstandings in any single country in this category do not exceed 0.75% of our total assets. |
| (3) | With regards to these cross-border outstandings, at December 31, |
As of December 31, 2011, 20102013, 2012 and 2009,2011, we did not have any cross-border outstanding to any single borrower that exceeded 0.75% of total assets.
Exposure to sovereign counterparties by credit rating
Our exposure to sovereign counterparties (the exposure is included in the financial statement line items “Financial assets held for trading – Debt instruments”, “Other financial assets at fair value through profit or loss – Debt instruments”, “Available for sale financial assets – Debt instruments” and “Loans and receivables-Debt instruments”) organized by credit rating and our exposure to private and sovereign debt organized by origin of the issuer is included in Note 7 to the Financial Statements.
Additionally, in Note 10 to our consolidated financial statements we present the disclosure by credit rating of our exposure to sovereign counterparties recorded under the caption “loans and advances to customers”.
60
The detail of Santander Group’s total risk exposure (excluding the value of any collateral associated with the corresponding balances) to the peripheral countries of the Eurozone at December 31, 2011, based on the country2013 and 2012, by type of financial instrument, of the issuer or borrower in terms ofGroup’s sovereign risk exposure to Europe’s peripheral countries and private sector exposure,of the short positions held with them, taking into consideration the criteria established by the European Banking Authority (EBA) –explained in Note 54– is as follows:
Sovereign risk by country of issuer/borrower (**)
Sovereign risk by country of issuer/borrower as of December 31, 2013 (*) | Sovereign risk by country of issuer/borrower as of December 31, 2013 (*) | |||||||||||||||||||||||||||||||||||||||||||||||||||||||||||||||||||||||
| Millions of euros | Millions of euros | |||||||||||||||||||||||||||||||||||||||||||||||||||||||||||||||||||||||
| Debt instruments | Derivatives | Debt instruments | Derivatives (***) | |||||||||||||||||||||||||||||||||||||||||||||||||||||||||||||||||||||
| Balances with central banks | Financial assets held for trading and Other financial assets at fair value through profit or loss | Available- for-sale financial assets | Loans and receivables | Loans and advances to customers (*) | Direct exposure | Indirect exposure (CDSs) | Total on- balance-sheet exposure | Contingent liabilities and commitments (off- balance exposure) | Total exposure | Financial assets held for trading and other financial assets at fair value through profit or loss | Short positions | Available- for-sale financial assets | Loans and receivables | Loans and advances to customers (**) | Total net direct exposure | Other than CDSs | CDSs | |||||||||||||||||||||||||||||||||||||||||||||||||||||||
Spain | 4,841 | 8,060 | 29,975 | 1,274 | 12,147 | 225 | — | 56,522 | 2,848 | 59,370 | 4,783 | (2,079 | ) | 21,144 | 1,145 | 13,374 | 38,367 | (153 | ) | — | ||||||||||||||||||||||||||||||||||||||||||||||||||||
Portugal | 1,359 | 83 | 1,741 | — | 847 | 846 | — | 4,876 | 272 | 5,148 | 148 | — | 2,076 | — | 583 | 2,807 | — | — | ||||||||||||||||||||||||||||||||||||||||||||||||||||||
Italy | 9 | 406 | 247 | — | — | 15 | (15 | ) | 662 | — | 662 | 2,571 | (1,262 | ) | 77 | — | — | 1,386 | — | 2 | ||||||||||||||||||||||||||||||||||||||||||||||||||||
Greece | — | — | 84 | — | — | — | — | �� | 84 | — | 84 | — | — | — | — | — | — | — | — | |||||||||||||||||||||||||||||||||||||||||||||||||||||
Ireland | — | — | — | — | — | 139 | — | 139 | — | 139 | — | — | — | — | — | — | 199 | — | ||||||||||||||||||||||||||||||||||||||||||||||||||||||
| (*) |
| (**) |
Private sector exposure by country of issuer/borrower (**)
| (***) | “Other than CDSs” refers to the exposure to derivatives based on the location of the counterparty, irrespective of the location of the underlying. “CDSs” refers to the exposure to CDSs based on the location of the underlying. |
Sovereign risk by country of issuer/borrower as of December 31, 2012 (*) | Sovereign risk by country of issuer/borrower as of December 31, 2012 (*) | |||||||||||||||||||||||||||||||||||||||||||||||||||||||||||||||||||||||
| Millions of euros | Millions of euros | |||||||||||||||||||||||||||||||||||||||||||||||||||||||||||||||||||||||
| Debt instruments | Derivatives | Debt instruments | Derivatives (***) | |||||||||||||||||||||||||||||||||||||||||||||||||||||||||||||||||||||
| Loans and advances to credit institutions | Financial assets held for trading and Other financial assets at fair value through profit or loss | Available- for-sale financial assets | Loans and receivables | Loans and advances to customers (*) | Direct exposure | Indirect exposure (CDSs) | Total on- balance-sheet exposure | Contingent liabilities and commitments (off- balance exposure) | Total exposure | Financial assets held for trading and other financial assets at fair value through profit or loss | Short positions | Available- for-sale financial assets | Loans and receivables | Loans and advances to customers (**) | Total net direct exposure | Other than CDSs | CDSs | |||||||||||||||||||||||||||||||||||||||||||||||||||||||
Spain | 5,547 | 2,069 | 5,385 | 955 | 202,411 | 3,226 | (46 | ) | 219,547 | 63,025 | 282,572 | 6,473 | (2,070 | ) | 24,654 | 1,173 | 15,356 | 45,586 | (234 | ) | — | |||||||||||||||||||||||||||||||||||||||||||||||||||
Portugal | — | 862 | 907 | 1,935 | 23,337 | 468 | (8 | ) | 27,501 | 7,706 | 35,207 | — | — | 1,684 | — | 616 | 2,300 | — | 1 | |||||||||||||||||||||||||||||||||||||||||||||||||||||
Italy | — | 359 | 88 | 98 | 11,705 | (308 | ) | (4 | ) | 11,938 | 3,402 | 15,340 | 353 | (425 | ) | 76 | — | — | 4 | — | — | |||||||||||||||||||||||||||||||||||||||||||||||||||
Greece | — | — | — | — | 170 | 64 | — | 234 | 138 | 372 | — | — | — | — | — | — | — | — | ||||||||||||||||||||||||||||||||||||||||||||||||||||||
Ireland | — | 211 | 281 | 150 | 491 | 286 | — | 1,419 | 110 | 1,529 | — | — | — | — | — | — | 284 | — | ||||||||||||||||||||||||||||||||||||||||||||||||||||||
| (*) |
| (**) |
| (***) | “Other than CDSs” refers to the exposure |
The detail of the Group’s other exposure to other counterparties (private sector, central banks and other public entities that are not considered to be sovereign risks) in the aforementioned countries as of December 31, 2013 and 2012 is as follows:
61
Exposure to other counterparties by country of issuer/borrower as of December 31, 2013 (*) | ||||||||||||||||||||||||||||||||||||
| Millions of euros | ||||||||||||||||||||||||||||||||||||
| Debt instruments | Loans and advances to customers (**) | Total net direct exposure | Derivatives (***) | |||||||||||||||||||||||||||||||||
| Balances with central banks | Reverse repurchase agreements | Financial assets held for trading and other financial assets at fair value through profit or loss | Available- for-sale financial assets | Loans and receivables | Other than CDSs | CDSs | ||||||||||||||||||||||||||||||
Spain | 816 | 7,451 | 3,148 | 7,826 | 1,804 | 160,478 | 181,523 | 1,981 | (44 | ) | ||||||||||||||||||||||||||
Portugal | 1,716 | — | 209 | 1,168 | 1,845 | 25,578 | 30,516 | 1,454 | (1 | ) | ||||||||||||||||||||||||||
Italy | 11 | — | 368 | 273 | 93 | 6,490 | 7,235 | (115 | ) | (2 | ) | |||||||||||||||||||||||||
Greece | — | — | — | — | — | 80 | 80 | — | — | |||||||||||||||||||||||||||
Ireland | — | — | 229 | 360 | 259 | 507 | 1,355 | 1,031 | — | |||||||||||||||||||||||||||
| (*) | Also, the Group has off-balance-sheet exposure other than derivatives –contingent liabilities and commitments– amounting to €48,659 million, €5,982 million, €2,717 million, €4 million and €93 million to counterparties in Spain, Portugal, Italy, Greece and Ireland, respectively. |
| (**) | Presented excluding valuation adjustments and impairment losses recognized (€13,209 million). |
| (***) | “Other than CDSs” refers to the exposure to derivatives based on the location of the counterparty, irrespective of the location of the underlying. “CDSs” refers to the exposure to CDSs based on the location of the underlying. |
Exposure to other counterparties by country of issuer/borrower as of December 31, 2012 (*) | ||||||||||||||||||||||||||||||||||||
| Millions of euros | ||||||||||||||||||||||||||||||||||||
| Debt instruments | Derivatives (***) | |||||||||||||||||||||||||||||||||||
| Balances with central banks | Reverse repurchase agreements | Financial assets held for trading and other financial assets at fair value through profit or loss | Available- for-sale financial assets | Loans and receivables | Loans and advances to customers (**) | Total net direct exposure | Other than CDSs | CDSs | ||||||||||||||||||||||||||||
Spain | 1,218 | 11,471 | 2,598 | 7,225 | 1,130 | 184,658 | 208,300 | 7,180 | (40 | ) | ||||||||||||||||||||||||||
Portugal | 1,156 | — | 997 | 676 | 1,547 | 25,243 | 29,619 | 1,809 | (4 | ) | ||||||||||||||||||||||||||
Italy | 3 | — | 176 | 122 | 83 | 7,513 | 7,897 | (2 | ) | 8 | ||||||||||||||||||||||||||
Greece | — | — | — | — | — | 96 | 96 | — | — | |||||||||||||||||||||||||||
Ireland | — | — | 146 | 414 | 179 | 481 | 1,220 | 344 | — | |||||||||||||||||||||||||||
| (*) | Also, the Group has off-balance-sheet exposure other than derivatives –contingent liabilities and commitments– amounting to €63,101 million, €7,397 million, €3,234 million, €135 million and €224 million to counterparties in Spain, Portugal, Italy, Greece and Ireland, respectively. |
| (**) | Presented excluding valuation adjustments and impairment losses recognized (€12,671 million). |
| (***) | “Other than CDSs” refers to the exposure to derivatives based on the location of the counterparty, irrespective of the location of the underlying. “CDSs” refers to the exposure to CDSs based on the location of the underlying. |
The following table presents certain information presentson the notional amount of the CDSs atas of December 31, 20112013 and 2012 detailed in the foregoing tables:
| Millions of euros | ||||||||||||||||||||||||||||||||||||||||||||||||||||
12/31/13 | 12/31/13 | |||||||||||||||||||||||||||||||||||||||||||||||||||
Millions of euros | Millions of euros | |||||||||||||||||||||||||||||||||||||||||||||||||||
| Notional amount | Fair value | Notional amount | Fair value | |||||||||||||||||||||||||||||||||||||||||||||||||
| Bought | Sold | Net | Bought | Sold | Net | Bought | Sold | Net | Bought | Sold | Net | |||||||||||||||||||||||||||||||||||||||||
Spain | Sovereign | — | — | — | — | — | — | Sovereign | — | — | — | — | — | — | ||||||||||||||||||||||||||||||||||||||
Private | 3,288 | 4,122 | (834 | ) | 96 | (142 | ) | (46 | ) | Other | 1,735 | 2,277 | (542 | ) | (18 | ) | (26 | ) | (44 | ) | ||||||||||||||||||||||||||||||||
Portugal | Sovereign | 211 | 211 | — | 60 | (60 | ) | — | Sovereign | 192 | 174 | 18 | 5 | (5 | ) | — | ||||||||||||||||||||||||||||||||||||
Private | 409 | 448 | (39 | ) | 93 | (101 | ) | (8 | ) | Other | 223 | 278 | (55 | ) | 1 | (2 | ) | (1 | ) | |||||||||||||||||||||||||||||||||
Italy | Sovereign | 429 | 614 | (185 | ) | 46 | (61 | ) | (15 | ) | Sovereign | 603 | 570 | 33 | (1 | ) | 3 | 2 | ||||||||||||||||||||||||||||||||||
Private | 1,106 | 1,129 | (23 | ) | 114 | (118 | ) | (4 | ) | Other | 834 | 913 | (79 | ) | (2 | ) | — | (2 | ) | |||||||||||||||||||||||||||||||||
Greece | Sovereign | 223 | 223 | — | 158 | (158 | ) | — | Sovereign | — | — | — | — | — | — | |||||||||||||||||||||||||||||||||||||
Private | 54 | 44 | 10 | 9 | (9 | ) | — | Other | 5 | 5 | — | — | — | — | ||||||||||||||||||||||||||||||||||||||
Ireland | Sovereign | 9 | 9 | — | 1 | (1 | ) | — | Sovereign | 4 | 4 | — | — | — | — | |||||||||||||||||||||||||||||||||||||
Private | 60 | 60 | — | 5 | (5 | ) | — | Other | 6 | 6 | — | — | — | — | ||||||||||||||||||||||||||||||||||||||
12/31/12 Millions of euros Spain Other Portugal Other Italy Other Greece Other Ireland Other Classified Assets Notional amount Fair value Bought Sold Net Bought Sold Net Sovereign — — — — — — 2,202 2,952 (750 ) 3 (43 ) (40 ) Sovereign 225 207 18 14 (13 ) 1 398 418 (20 ) 7 (11 ) (4 ) Sovereign 518 608 (90 ) 12 (12 ) — 1,077 1,025 52 40 (32 ) 8 Sovereign — — — — — — 20 20 — 1 (1 ) — Sovereign 9 9 — — — — 16 16 — — — —
In the following pages, we describe the Bank of Spain’s requirements for classification of non-performing assets. The Group has established a credit loss recognition process that is independent of the process for balance sheet classification and removal of impaired loans from the balance sheet.
The description below sets forth the minimum requirements that are followed and applied by all of our subsidiaries. Nevertheless, if the regulatory authority of the country where a particular subsidiary is located imposes stricter or more conservative requirements for classification of the non-performing balances, the more strict or conservative requirements are followed for classification purposes.
The classification described below applies to all debt instruments not measured at fair value through profit or loss, and to contingent liabilities.
Bank of Spain’s Classification Requirements
a) Standard Assets
Standard assets include loans, fixed-income securities, guarantees and certain other extensions of credit that are not classified in any other category. Under this category, assets that require special watch must be identified, including restructured loans and standard assets with clients that have other outstanding risks classified as Non-Performing Past Due. Standard assets are subdivided as follows:
62
|
| |
|
| |
|
| |
|
| |
63
|
| |
|
| |
b) Sub-standard Assets
This category includes all types of credits and off-balance sheet risks that cannot be classified as non performingnon-performing or charged-off assets but that have certain weaknesses that may result in losses for the bank higher than those described in the previous category. Credits and off-balance sheet risks with insufficient documentation must also be classified under this category.
c) Non-Performing Past-Due Assets classified as impaired due to counterparty arrears
The Bank of Spain requires Spanish banks to classify as non-performing the entire outstanding principal amount and accrued interest on any loan, fixed-income security, guarantee and certain other extensions of credit on which any payment of principal or interest or agreed cost is 90 days or more past due (“non-performing past-due assets”).
In relation to the aggregate risk exposure (including off-balance sheet risks) to a single obligor, if the amount of non-performing balances exceeds 25% of the total outstanding risks (excluding non-accrued interest on loans to such borrower), then banks must classify all outstanding risks to such borrower as non-performing.
Once any portion of a loan is classified as non-performing, the entire loan is placed on a non-accrual status. Accordingly, even the portion of any such a loan which may still be identified as performing will be recorded on non-accrual status.
d) Other Non-Performing Assets classified as impaired for reasons other than counterparty arrears
The Bank of Spain requires Spanish banks to classify any loan, fixed-income security, guarantee and certain other extensions of credit as non-performing if they have a reasonable doubt that these extensions of credit will be collected (“other non-performing assets”), even if any past due payments have been outstanding for less than 90 days or the asset is otherwise performing. When a bank classifies an asset as non-performing on this basis, it must classify the entire principal amount of the asset as non-performing.
Once any such asset is classified as non-performing, it is placed on a non-accrual status.
64
e) Charged-off Assets
Credit losses are generally recognized through provisions for allowances for credit losses, well before they are removed from the balance sheet. Under certain unusual circumstances (such as bankruptcy, insolvency, etc.), the loss is directly recognized through write-offs.
The Bank of Spain requires Spanish banks to charge-off immediately those non-performing assets that management believes will never be repaid. Otherwise, the Bank of Spain requires Spanish banks to charge-off non-performing assets four years after they were classified as non-performing. Accordingly, even if allowances have been established equal to 100% of a non-performing asset, Spanish banks may maintain that non-performing asset, fully provisioned, on their balance sheet for the full four-year period if management believes based on objective factors that there is some possibility of recoverability of that asset.
Because the Bank of Spain does not permit partial write-offs of impaired loans, when a loan is deemed partially uncollectible, the credit loss is charged against earnings through provisions to credit allowances instead of through partial write-offs of the loan. If a loan becomes entirely uncollectible, its allowance is increased until it reaches 100% of the loan balance. The credit loss recognition process is independent of the process for the removal of impaired loans from the balance sheet. The entire loan balance is kept on the balance sheet until any portion of it has been classified as non-performing for 4 years. Loans can be written-off earlier depending on our management’s view as to the recoverability of the loan. After that period, the loan balance and its 100% specific allowance are removed from the balance sheet and recorded in off-balance sheet accounts, with no resulting impact on net income at that time.
f) Country-Risk Outstandings
The Bank of Spain requires Spanish banks to classify as country-risk outstandings all loans, fixed-income securities and other outstandings to any countries, or residents of countries, that the Bank of Spain has identified as being subject to transfer risk or sovereign risk and the remaining risks derived from the international financial activity.
All outstandings must be assigned to the country of residence of the client except in the following cases:
The Bank of Spain has established six categories to classify such countries, as shown in the following table:
Country-Risk Categories | Description | |
| 1 | European Union, Norway, Switzerland, Iceland, USA, Canada, Japan, Australia and New Zealand | |
| 2 | Low risk countries not included in 1 | |
| 3 | Countries with transitory difficulties | |
| 4 | Countries with serious difficulties | |
| 5 | Doubtful countries | |
| 6 | Bankrupt countries | |
65
The Bank of Spain allows each bank to decide how to classify the listed countries within this classification scheme, subject to the Bank of Spain’s oversight. The classification is made based on criteria such as the payment record (in particular, compliance with renegotiation agreements), the level of the outstanding debt and of the charges for debt services, the debt quotations in the international secondary markets and other indicators and factors of each country as well as all the criteria indicated by the Bank of Spain. All credit extensions and off-balance sheet risks included in country-risk categories 3 to 6, except the excluded cases described below, will be classified as follows:
Among others, the Bank of Spain excludes from country-risk outstandings:
Non-Accrual of Interest Requirements
We stop accruing interest on the basis of contractual terms on the principal amount of any asset that is classified as an impaired asset and on category 5 (doubtful) and category 6 (bankrupt) country-risk outstandings. Thereafter, we recognize the passage of time (financial effect) releasing provisions for loan losses by calculating the present value of the estimated future cash flows using the rate of interest used to discount the future cash flows for the purpose of measuring the impairment loss. On the other hand, any collected interest for any assets classified as impaired are accounted for on a cash basis.
The following table shows the amount of non accrued interest owed on impaired assets and the amount of such interest that was received:
| IFRS-IASB At December 31, | ||||||||||||
| 2011 | 2010 | 2009 | ||||||||||
| (in millions of euros) | ||||||||||||
Non accrued interest on the basis of contractual terms owed on impaired assets | ||||||||||||
Domestic | 463 | 359 | 382 | |||||||||
International | 1,263 | 1,118 | 915 | |||||||||
|
|
|
|
|
| |||||||
Total | 1,726 | 1,477 | 1,297 | |||||||||
Non accrued interest on the basis of contractual terms received on impaired assets | ||||||||||||
Domestic | 215 | 165 | 151 | |||||||||
International | 199 | 180 | 158 | |||||||||
|
|
|
|
|
| |||||||
Total | 414 | 345 | 309 | |||||||||
66
| IFRS-IASB | ||||||||||||
| At December 31, | ||||||||||||
| 2013 | 2012 | 2011 | ||||||||||
| (in millions of euros) | ||||||||||||
Non accrued interest on the basis of contractual terms owed on impaired assets | ||||||||||||
Domestic | 606 | 566 | 463 | |||||||||
International | 1,294 | 1,313 | 1,261 | |||||||||
|
|
|
|
|
| |||||||
Total | 1,900 | 1,879 | 1,724 | |||||||||
Non accrued interest on the basis of contractual terms received on impaired assets | ||||||||||||
Domestic | 190 | 190 | 215 | |||||||||
International | 265 | 229 | 199 | |||||||||
|
|
|
|
|
| |||||||
Total | 455 | 419 | 414 | |||||||||
The balances of impaired loans as of December 31, 2011, 20102013, 2012 and 20092011 are as follows:
| Millions of Euros | ||||||||||||
| 2011 | 2010 | 2009 | ||||||||||
Other impaired loans (*) | 4,591 | 4,872 | 3,284 | |||||||||
Impaired loans more than ninety days past due | 27,445 | 23,650 | 21,270 | |||||||||
|
|
|
|
|
| |||||||
Total impaired loans | 32,036 | 28,522 | 24,554 | |||||||||
| Millions of Euros | ||||||||||||
| 2013 | 2012 | 2011 | ||||||||||
Impaired loans more than ninety days past due | 30,832 | 31,326 | 27,415 | |||||||||
Other impaired loans and contingent liabilities (*) | 10,820 | 4,735 | 4,591 | |||||||||
|
|
|
|
|
| |||||||
Total impaired loans and contingent liabilities | 41,652 | 36,061 | 32,006 | |||||||||
| (*) | See above “Bank of |
The roll-forward of allowances (under IFRS-IASB) is shown in Note 10 to our consolidated financial statements.
Guarantees
The Bank of Spain requires some guarantees to be classified as non-performing in the following amounts:situations:
•
•
Allowances for Credit Losses and Country-Risk Requirements
We calculate simultaneously the allowances required due to credit risk attributable to the client and to country-risk and apply the ones that are more demanding.
The Bank of Spain requires that we develop internal models to manage credit risk and to calculate the allowances for both credit risk and country-risk based on historical experience. As of July 2008,We detail below the Bank of Spain had approved for regulatory capital calculation purposes the Group’s internal models affecting the vast majority of the Group’s credit risk net exposure. The Bank of Spain will continue to review the models for the purpose of calculating allowances for loan losses. The calculation obtained based on the output parameters of internal models is consistent with the best estimate of the Group as to the probable losses using possible scenarios which rely on the approved internally developed models, and which constitute an appropriate basis for determining loan loss allowances. While these models are not yet approved by the Bank of Spain for loan loss allowance calculation, we are required to calculate the allowances according to the instructions described below. The difference between loan loss provisions calculated using internal models and those calculated under Bank of Spain Guidance, was not material for any of the three years ending December 31, 2011.
The global allowances will be the sum of those corresponding to losses in specific transactions (Specific Allowances) and those not specifically assigned (General Allowance for inherent losses) due to credit risk, plus theAllowances for Country-Risk.
Specific and Collectively Assessed Allowances for Credit Losses
Our methodology for calculation of loan loss allowances is summarized as follows:
Assets classified as doubtful due to counterparty arrears: debt instruments, whoever the obligor and whatever the guarantee or collateral, with amounts more than three months past due are assessed individually, taking into account the age of the past-due amounts, the guarantees or collateral provided and the financial situation of the counterparty and the guarantors.
Assets classified as doubtful for reasons other than counterparty arrears: Debt instruments which are not classifiable as doubtful due to arrears but for which there are reasonable doubts as to their repayment under the contractual terms are assessed individually, and their allowance is the difference between the amount recognized in assets and the present value of the cash flows expected to be received.
67
General allowance for inherent losses: We cover our losses inherent in debt instruments not measured at fair value through profit or loss and in contingent liabilities taking into account the historical experience of impairment and other circumstances known at the time of assessment. For these purposes, inherent losses are losses incurred at the reporting date, calculated using statistical methods that have not yet been allocated to specific transactions.
Our methodology for determining the general allowance for incurred loan losses, intends to identify the amount of incurred losses as of the balance sheet date of loans that have not yet been identified as impaired, but that we estimate based on our past history and specific facts that will manifest within a one year lead time period from the balance sheet date. The above demonstrates those loans were having problems as of the balance sheet date. That is what we call inherent losses in the contextmain characteristics of our internal models in which loan loss allowances are calculated.models.
Since 1993 we have used our internal models for assigning solvency and internal ratings, which measure the degree of risk of a client or transaction. Each rating corresponds to a certain probability of default or non-payment, the result of the Group’s past experience, except for some designated low default portfolios. We have approximately 300different internal rating models for risk admission and monitoring (models(differentiating between segments; models for corporate, sovereign, financial institutions; medium and small companies, retail, etc.).
The ratings accorded to customers are regularly reviewed, incorporating new financial information and the experience in the development of the banking relationship with the customer. The regularity of the reviews increases in the case of clients who reach certain levels in the automatic warning systems and for those classified as special watch. The rating tools are also reviewed so that Group’s accuracy can be fine-tuned.
In order to make the internal ratings of the various models comparable and to be able to make comparisons with the ratings of external rating agencies, the Group has a master ratings scale. The comparisons are established via the probability of default associated with each rating.
The process:process of credit rating and parameter estimation
The creditCredit risk associated to each transaction is quantified by means of its incurred loss. Risk measurement quantification requires following two steps; the first one is the estimation, and the second one is the assignment of the parameters that define the credit risk: Probability of Default, Loss Given Default and Exposure at Default.
We cover our losses inherent in debt instruments not measured at fair value through profit or loss and in contingent liabilities taking into account the historical experience of impairment and other circumstances known at the time of assessment. For these purposes, inherentimpairment losses are losses incurred at the reporting date, calculated using statistical methods that have not yet been allocated to specific transactions.methods.
We use the concept of incurred loss to quantify the cost of the credit risk and include it in the calculation of the risk-adjusted return of its transactions. The parameters necessary for its calculation, with the corresponding adjustment are also used to calculate economic capital and to calculate BIS II regulatory capital under internal models.
Incurred loss is the cost of the credit risk of a transaction that will manifest within a one year lead time from the balance sheet date due to an event that had already occurred at the assessment date and considering the characteristics of the counterparty and the guarantees and collateral associated with the transaction.
The incurred loss is calculated using statistical models that consider the following three factors: “exposure at default”, “probability of default” and “loss given default”.
68
PD is measured using a time horizon of one year; i.e. it quantifies the probability of the counterparty defaulting in the coming year.year due to an event that had already occurred at the assessment date. The definitioncalculation of default used includes past-duesPD considers both to loans that are past-due by 90 days or more and cases in which there is no default but there are doubts as to the solvency of the counterparty (subjective doubtfulimpaired assets).
Loss given default (“LGD”) is the loss arising in the event of default. It depends mainly |
Estimation is based on the Group’s own internal experience, i.e.present value of credit enhancements, such as collateral and guarantees associated with the historical records of default for each rating as well as the recoveries experience regarding non performing loans:
transaction and other future flow that are expected to be recovered. The LGD calculation is based on the analysis of recoveries of past due transactions, considering not only revenues and costsloans associated with the collection process, but also the moment when these revenues and costs take place and all indirectdirect costs linked to the collecting activity.
The estimation of the exposure at default (“EAD”) comes from comparing the use of the lines committed at the moment of default and a normal situation, in order to identify the real consumption of the lines at the time of default.
Once estimated, the credit risk parameters are assigned to assets that are not past due and play an essential role in the risk management and decision taking processes. These parameters, with the corresponding adjustments, are used by several management tools such as (1) pre-classifications, (2) economic capital, (3) return on risk adjusted capital (“RORAC”), or (4) stress scenarios.
Control of the process
Internal validation is a prerequisite for supervisory validation and consists of a specialized and sufficiently independent unit obtaining a technical opinion on whether the internal model is appropriate for the purposes used (internal and regulatory) and concluding on its usefulness and effectiveness. Moreover, it must evaluate whether the risk management and control procedures are appropriate for the entity’s strategy and risk profile.
Grupo Santander’s corporate framework of internal validation is fully aligned with the criteria for internal validation of advanced models issued by the Bank of Spain. The criterion of separation of functions is maintained between Internal Validation and Internal Auditing which, as the last element of control in the Group, is responsible for reviewing the methodology, tools and work done by Internal Validation and to give its opinion on its degree of effective independence.
Other Non-Performing Assets. If a non-performing asset isThe calculation obtained based on the output from the internal models described above reflects the best estimate of the Group as to probable credit losses and constitute an “other non-performing asset”, see “—appropriate basis for determining loan loss allowances.
As of July 2008, the Bank of Spain Classification Requirements—Other Non-Performing Assets”,approved the amountGroup’s internal models for regulatory capital calculation purposes with respect to the vast majority of the Group’s credit risk net exposure. The Bank of Spain continues to review the models for the purpose of calculating allowances for loan losses.
While these models are not yet approved by the Bank of Spain for loan loss allowance calculation, we are required to calculate the allowances according to the instructions described below:
a. Specific allowance will(individual):
The allowance for debt instruments not measured at fair value through profit or loss that are classified as impaired is generally recognized in accordance with the criteria set forth below:
i. Assets classified as impaired due to counterparty arrears:
Debt instruments, whoever the obligor and whatever the guarantee or collateral, with amounts more than three months past due are assessed individually. The allowances percentages are determined taking into account the age of the past-due amounts, the guarantees or collateral provided and the financial situation of the counterparty and the guarantors. Loans are identified as impaired and income no longer accrued when it is determined that collection of interest or principal is impaired or when the interest or principal has been past due for 90 days or more, unless the loan is well secured and in the process of collection. According to Bank of Spain’s requirements, all non-performing loans not guaranteed by effective collateral must be fully provisioned (hence all the credit loss recognized) when they are more than 12 months overdue.
ii. Assets classified as impaired for reasons other than counterparty arrears:
Debt instruments which are not classifiable as impaired due to arrears but for which there are reasonable doubts as to their repayment under the contractual terms are assessed individually, and their allowance is the difference between the amount outstandingrecognized in assets and the currentpresent value of the cash flows expected collectable cash flows. The minimum allowance willto be 25% and up to 100% of the amounts treated as non-performing, depending on management’s opinion of the loan recovery expectations. When the treatment of such asset as a non-performing asset is due to, in management’s opinion, an inadequate financial or economical condition of the borrower, and the amount estimated as non-collectible is less than 25% of the outstanding debt, the amount of the required allowance will be at least 10% of the outstanding debt.received.
Sub-standard Assets. The necessaryb. General allowance for assets classified in this category is determined asinherent losses (collective):
Based on its experience and on the difference between its outstanding balanceinformation available to it on the Spanish banking industry, the Bank of Spain has established various categories of debt instruments and the current value of the expected collectable cash flows. In every case, the amount of the required allowance must be higher than the collectively assessed allowance that would correspond in case of beingcontingent liabilities, classified as standard assetrisk, which are recognized at Spanish entities or relate to transactions performed on behalf of residents in Spain which are recognized in the accounting records of foreign subsidiaries, and lower than would correspond if classified as non-performing asset. When assets are classified as sub-standard duehas applied a range of required allowances to insufficient documentation and have an outstanding balance higher than €25,000, the applicable allowance is 10%.
69
Allowances forc. Country risk allowance:
Country risk is considered to be the risk associated with counterparties resident in a given country due to circumstances other than normal commercial risk (sovereign risk, transfer risk and risks arising from international financial activity). Based on the countries’ economic performance, political situation, regulatory and institutional framework, and payment capacity and record, we classifythe Group classifies all the transactions performed with third parties into six different groups, from group 1 (transactions with ultimate obligors resident in European Union countries, Norway, Switzerland, Iceland, the United States, Canada, Japan, Australia and New Zealand) to group 6 (transactions the recovery of which is considered remote due to circumstances attributable to the country), assigning to each group the credit loss allowance percentages.percentages resulting from the aforementioned analyses. However, due to the size of the Group and to the proactive management of its country risk exposure, the allowances recognized in respect of country risk are not material with respect to the credit loss allowances recognized.
The difference between loan loss provisions calculated using internal models and those calculated under Bank of Spain Guidance, was not material for any of the three years ending December 31, 2013. Guarantees
Allowances for non-performing guarantees will be equal to the amount that, using prudent criteria, is considered irrecoverable.
Bank of Spain’s Foreclosed Assets Requirements
If a Spanish bank eventually acquires the properties (residential or not) which secure loans or credits, the Bank of Spain requires that the value of the foreclosed assets should be the lesser of the amount of the debt (netnet of allowances)allowances (which shall be at least 10% of the value) and the fair value of the foreclosed assets less the estimated selling costs (which shall be at least 10% of such value).
After the initial registration of a foreclosed assets, the Bank of Spain requiresestablishes that if the valuation considerfair value of the foreclosed asset less the estimated selling cost is lower than the carrying amount, the entity should recognize the corresponding impairment.
The Bank of Spain considers the amount of time acquired assets have been held which is a clear indication of impairment. The entityAccordingly, it determines that Spanish entities will recognize impairment (unless the bids received indicate a higher amount) at least as large as the amount resulting from applying the following discounts to the initial valuation:
Terms from acquisition | % Coverage | |||
Over 12 months | 20 | |||
Over 24 month | 30 | |||
Over 36 month | 40 | |||
For the purpose of ensuring that the provisions determined in accordance with the abovementioned policy are reasonable under IFRS-IASB we develop an estimation of the fair value of our foreclosed assets using external valuations. The difference between both estimations was not material for any of the three years ending December 31, 2013.
Bank of Spain’s Charge-off Requirements
The Bank of Spain does not permit non-performing assets to be partially charged-off.
The Bank of Spain requires Spanish banks to charge-off immediately those non-performing assets that management believes will never be repaid or that were made to category 6 (“bankrupt”) countries or residents of such category 6 countries. See the above sub-section entitled “—Bank of SpainSpain’s Classification Requirements—Country-Risk Outstandings”. Otherwise, the Bank of Spain requires Spanish banks to charge-off non-performing assets four years after they were classified as non-performing. Accordingly, even if allowances have been established equal to 100% of a non-performing asset (in accordance with the Bank of Spain criteria discussed above), the Spanish bank may maintain that non-performing asset, fully provisioned, on its balance sheet for the full four year period if management believes based on objective factors that there is some possibility of recoverability of that asset.
70
Movements in Allowances for Credit Losses
The following table analyzes movements in our allowances for credit losses and movements, by domicile of customer, for the years indicated. See “Presentation of Financial and Other Information”. For further discussion of movements in the allowances for credit losses, see “Item 5. Operating and Financial Review and Prospects—A. Operating results—Results of Operations for Santander—Impairment Losses (net)”.
| IFRS-IASB | ||||||||||||||||||||||||||||||||||||||||
| Year Ended December 31, | IFRS-IASB Year Ended December 31, | |||||||||||||||||||||||||||||||||||||||
| 2011 | 2010 | 2009 | 2008 | 2007 | 2013 | 2012 | 2011 | 2010 | 2009 | |||||||||||||||||||||||||||||||
| (in millions of euros) | (in millions of euros) | |||||||||||||||||||||||||||||||||||||||
Allowance for credit losses at beginning of year | ||||||||||||||||||||||||||||||||||||||||
Borrowers in Spain | 6,810 | 6,993 | 5,949 | 4,512 | 4,318 | 11,711 | 6,907 | 6,810 | 6,993 | 5,949 | ||||||||||||||||||||||||||||||
Borrowers outside Spain | 12,929 | 10,906 | 6,771 | 4,284 | 3,970 | 13,756 | 11,951 | 12,734 | 10,906 | 6,771 | ||||||||||||||||||||||||||||||
|
|
|
|
|
|
|
|
|
| |||||||||||||||||||||||||||||||
Total | 19,739 | 17,899 | 12,720 | 8,796 | 8,288 | 25,467 | 18,858 | 19,544 | 17,899 | 12,720 | ||||||||||||||||||||||||||||||
Consolidation/deconsolidation of companies’ credit loss allowances (1) | ||||||||||||||||||||||||||||||||||||||||
Borrowers in Spain | — | — | — | — | — | — | — | — | — | — | ||||||||||||||||||||||||||||||
Borrowers outside Spain | (1,267 | ) | — | 1,426 | 2,310 | 7 | — | (266 | ) | (1,267 | ) | — | 1,426 | |||||||||||||||||||||||||||
|
|
|
|
|
|
|
|
|
| |||||||||||||||||||||||||||||||
Total | (1,267 | ) | — | 1,426 | 2,310 | 7 | — | (266 | ) | (1,267 | ) | — | 1,426 | |||||||||||||||||||||||||||
Recoveries of loans previously charged off (2) | ||||||||||||||||||||||||||||||||||||||||
Borrowers in Spain | 297 | 201 | 115 | 130 | 149 | |||||||||||||||||||||||||||||||||||
Borrowers outside Spain | 1,503 | 1,000 | 800 | 570 | 464 | |||||||||||||||||||||||||||||||||||
|
|
|
|
| ||||||||||||||||||||||||||||||||||||
Total | 1,800 | 1,201 | 915 | 700 | 613 | |||||||||||||||||||||||||||||||||||
Net provisions for credit losses (2) | ||||||||||||||||||||||||||||||||||||||||
Net provisions for credit losses charged to income statement (2) | ||||||||||||||||||||||||||||||||||||||||
Borrowers in Spain | 2,871 | 2,125 | 2,500 | 928 | 659 | 3,447 | 8,847 | 3,169 | 2,326 | 2,615 | ||||||||||||||||||||||||||||||
Borrowers outside Spain | 8,169 | 8,142 | 8,588 | 4,969 | 2,762 | 8,607 | 10,992 | 9,581 | 9,078 | 9,388 | ||||||||||||||||||||||||||||||
|
|
|
|
|
|
|
|
|
| |||||||||||||||||||||||||||||||
Total | 11,040 | 10,267 | 11,088 | 5,897 | 3,421 | 12,054 | 19,839 | 12,750 | 11,404 | 12,003 | ||||||||||||||||||||||||||||||
Charge offs against credit loss allowance | ||||||||||||||||||||||||||||||||||||||||
Borrowers in Spain | (2,798 | ) | (2,174 | ) | (1,237 | ) | (732 | ) | (574 | ) | (2,580 | ) | (2,747 | ) | (2,798 | ) | (2,174 | ) | (1,237 | ) | ||||||||||||||||||||
Borrowers outside Spain | (9,632 | ) | (8,739 | ) | (8,558 | ) | (3,821 | ) | (2,746 | ) | (8,046 | ) | (8,599 | ) | (9,495 | ) | (8,582 | ) | (8,558 | ) | ||||||||||||||||||||
|
|
|
|
|
|
|
|
|
| |||||||||||||||||||||||||||||||
Total | (12,430 | ) | (10,913 | ) | (9,795 | ) | (4,553 | ) | (3,320 | ) | (10,626 | ) | (11,346 | ) | (12,293 | ) | (10,756 | ) | (9,795 | ) | ||||||||||||||||||||
Other movements (3) | 106 | 1,285 | 1,545 | (430 | ) | (213 | ) | (1,936 | ) | (1,618 | ) | 124 | 997 | 1,545 | ||||||||||||||||||||||||||
Allowance for credit losses at end of year (4) (5) | ||||||||||||||||||||||||||||||||||||||||
Borrowers in Spain | 6,907 | 6,810 | 6,993 | 5,949 | 4,512 | 12,279 | 11,711 | 6,907 | 6,810 | 6,993 | ||||||||||||||||||||||||||||||
Borrowers outside Spain | 12,081 | 12,929 | 10,906 | 6,771 | 4,284 | 12,680 | 13,756 | 11,951 | 12,734 | 10,906 | ||||||||||||||||||||||||||||||
|
|
|
|
|
|
|
|
|
| |||||||||||||||||||||||||||||||
Total | 18,988 | 19,739 | 17,899 | 12,720 | 8,796 | 24,959 | 25,467 | 18,858 | 19,544 | 17,899 | ||||||||||||||||||||||||||||||
Recoveries of loans previously charged off against income statement | ||||||||||||||||||||||||||||||||||||||||
Borrowers in Spain | 395 | 272 | 297 | 201 | 115 | |||||||||||||||||||||||||||||||||||
Borrowers outside Spain | 673 | 1,044 | 1,487 | 979 | 800 | |||||||||||||||||||||||||||||||||||
|
|
|
|
| ||||||||||||||||||||||||||||||||||||
Total | 1,068 | 1,316 | 1,784 | 1,180 | 915 | |||||||||||||||||||||||||||||||||||
Average loans outstanding | ||||||||||||||||||||||||||||||||||||||||
Borrowers in Spain | 217,235 | 224,642 | 230,642 | 235,002 | 215,521 | 178,227 | 198,643 | 217,235 | 224,642 | 230,642 | ||||||||||||||||||||||||||||||
Borrowers outside Spain | 513,568 | 482,407 | 436,857 | 340,939 | 330,253 | 519,037 | 550,730 | 511,964 | 480,885 | 436,857 | ||||||||||||||||||||||||||||||
|
|
|
|
|
|
|
|
|
| |||||||||||||||||||||||||||||||
Total | 730,803 | 707,049 | 667,499 | 575,941 | 545,774 | 697,264 | 749,373 | 729,199 | 705,527 | 667,499 | ||||||||||||||||||||||||||||||
Net charge-offs against loan loss allowance to average loans ratio | ||||||||||||||||||||||||||||||||||||||||
Net charge-offs against loan loss allowance to average loans ratio (6) | ||||||||||||||||||||||||||||||||||||||||
Borrowers in Spain | 1.15 | % | 0.88 | % | 0.49 | % | 0.26 | % | 0.20 | % | 1.23 | % | 1.25 | % | 1.15 | % | 0.88 | % | 0.49 | % | ||||||||||||||||||||
Borrowers outside Spain | 1.58 | % | 1.60 | % | 1.78 | % | 0.95 | % | 0.69 | % | 1.42 | % | 1.37 | % | 1.56 | % | 1.58 | % | 1.78 | % | ||||||||||||||||||||
|
|
|
|
|
|
|
|
|
| |||||||||||||||||||||||||||||||
Total | 1.45 | % | 1.37 | % | 1.33 | % | 0.67 | % | 0.50 | % | 1.37 | % | 1.34 | % | 1.44 | % | 1.36 | % | 1.33 | % | ||||||||||||||||||||
71
| (1) | The |
| (2) | We have not included a separate line |
| (3) | The changes in “Other Movements” |
| (4) | Allowances for the impairment losses on the assets making up the balances of “Loans and |
| (5) | The segregation of the allowance for credit losses between Spain and outside Spain was made by geographical location of the Group’s company that accounts for the risk. |
| (6) | For the purpose of calculating the ratio, net charge-offs consist of Charge offs against credit loss allowance less Recoveries of loans previously charged off. |
The net charge-offs against loan loss allowance to average loans ratio was lower in Spain than in foreign jurisdictions as of December 31, 2013, 2012, 2011 and 2010 primarily due to the different mix of products of our credit portfolio in the various countries in which we operate (our mortgage portfolio is focused in Spain and United Kingdom while in Latin America (including Brazil) the main products are non-collateral loans (credit cards or consumer loans)). In Spain, the percentage of loans with collateral (secured by mortgages on finished homes, offices and multi-purpose premises and rural properties or by pledges on monetary deposits, listed equity instruments and debt securities of issuers with high credit ratings) as of December 31, 2013 was 63%. The figure outside Spain includes certain countries such as Brazil where mortgages (which are Brazil’s main type of collateral) represent approximately 12% of the total lending in that country as of December 31, 2013 (5% as of December 31, 2012). This means that the amount of loan write-offs contributed each year by these countries is far higher than in Spain, since these entities of the Group have fewer possibilities of recovering the loans once they have fallen into arrears.
72
The table below shows a breakdown of recoveries, net provisions and charge-offs against credit loss allowance by type and domicile of borrower for the years indicated.
| Year Ended December 31, | Year Ended December 31, | |||||||||||||||||||||||||||||||||||||||
| 2011 | 2010 | 2009 | 2008 | 2007 | 2013 | 2012 | 2011 | 2010 | 2009 | |||||||||||||||||||||||||||||||
| (in millions of euros) | (in millions of euros) | |||||||||||||||||||||||||||||||||||||||
Recoveries of loans previously charged off- | ||||||||||||||||||||||||||||||||||||||||
Recoveries of loans previously charged off against income statement | ||||||||||||||||||||||||||||||||||||||||
Domestic: | ||||||||||||||||||||||||||||||||||||||||
Commercial, financial, agricultural, industrial | 135 | 41 | 32 | 30 | 32 | 236 | 85 | 135 | 41 | 32 | ||||||||||||||||||||||||||||||
Real estate and construction | 31 | 32 | 15 | 5 | 11 | 80 | 38 | 31 | 32 | 15 | ||||||||||||||||||||||||||||||
Other mortgages | 37 | 32 | 24 | 11 | 18 | 7 | 10 | 37 | 32 | 24 | ||||||||||||||||||||||||||||||
Installment loans to individuals | 92 | 89 | 43 | 75 | 70 | 48 | 137 | 92 | 89 | 43 | ||||||||||||||||||||||||||||||
Lease finance | 1 | 1 | 1 | 6 | 5 | 19 | — | 1 | 1 | 1 | ||||||||||||||||||||||||||||||
Other | 1 | 6 | — | 3 | 13 | 5 | 2 | 1 | 6 | — | ||||||||||||||||||||||||||||||
|
|
|
|
|
|
|
|
|
| |||||||||||||||||||||||||||||||
Total Borrowers in Spain | 297 | 201 | 115 | 130 | 149 | 395 | 272 | 297 | 201 | 115 | ||||||||||||||||||||||||||||||
Borrowers outside Spain | ||||||||||||||||||||||||||||||||||||||||
Government and official institutions | — | 4 | — | — | — | — | — | — | 4 | — | ||||||||||||||||||||||||||||||
Commercial and industrial | 1,208 | 877 | 732 | 484 | 397 | 575 | 877 | 1,208 | 877 | 732 | ||||||||||||||||||||||||||||||
Mortgage loans | 197 | 72 | 35 | 28 | 30 | 78 | 79 | 197 | 72 | 35 | ||||||||||||||||||||||||||||||
Other | 98 | 47 | 33 | 58 | 37 | 20 | 88 | 82 | 26 | 33 | ||||||||||||||||||||||||||||||
|
|
|
|
|
|
|
|
|
| |||||||||||||||||||||||||||||||
Borrowers outside Spain | 1,503 | 1,000 | 800 | 570 | 464 | 673 | 1,044 | 1,487 | 979 | 800 | ||||||||||||||||||||||||||||||
|
|
|
|
|
|
|
|
|
| |||||||||||||||||||||||||||||||
Total | 1,800 | 1,201 | 915 | 700 | 613 | 1,068 | 1,316 | 1,784 | 1,180 | 915 | ||||||||||||||||||||||||||||||
Net provisions for credit losses- | ||||||||||||||||||||||||||||||||||||||||
Net provisions for credit losses charged to income statement | ||||||||||||||||||||||||||||||||||||||||
Domestic: | ||||||||||||||||||||||||||||||||||||||||
Commercial, financial, agricultural, industrial | 935 | 647 | 753 | 265 | (278 | ) | 1,842 | 1,290 | 1,070 | 688 | 785 | |||||||||||||||||||||||||||||
Real estate and construction | 641 | 674 | 528 | (77 | ) | 240 | 176 | 5,378 | 672 | 706 | 543 | |||||||||||||||||||||||||||||
Other mortgages | 781 | 131 | 264 | 277 | 299 | 587 | 1,291 | 818 | 164 | 288 | ||||||||||||||||||||||||||||||
Installment loans to individuals | 397 | 574 | 848 | 400 | 384 | 745 | 709 | 489 | 663 | 891 | ||||||||||||||||||||||||||||||
Lease finance | 121 | 82 | 73 | 27 | 16 | 52 | 57 | 122 | 83 | 74 | ||||||||||||||||||||||||||||||
Other | (4 | ) | 17 | 34 | 36 | (2 | ) | 45 | 122 | (2 | ) | 22 | 34 | |||||||||||||||||||||||||||
|
|
|
|
|
|
|
|
|
| |||||||||||||||||||||||||||||||
Total Borrowers in Spain | 2,871 | 2,125 | 2,500 | 928 | 659 | 3,447 | 8,847 | 3,169 | 2,326 | 2,615 | ||||||||||||||||||||||||||||||
Borrowers outside Spain | ||||||||||||||||||||||||||||||||||||||||
Government and official institutions | (4 | ) | 44 | 14 | (8 | ) | (2 | ) | 1 | — | (4 | ) | 48 | 14 | ||||||||||||||||||||||||||
Commercial and industrial | 6,754 | 7,257 | 7,668 | 2,710 | 2,016 | 7,772 | 9,673 | 7,962 | 8,134 | 8,400 | ||||||||||||||||||||||||||||||
Mortgage loans | 966 | 453 | 533 | 243 | 238 | 553 | 624 | 1,163 | 525 | 568 | ||||||||||||||||||||||||||||||
Other | 453 | 389 | 373 | 2,024 | 510 | 281 | 695 | 460 | 371 | 406 | ||||||||||||||||||||||||||||||
|
|
|
|
|
|
|
|
|
| |||||||||||||||||||||||||||||||
Borrowers outside Spain | 8,169 | 8,143 | 8,588 | 4,969 | 2,762 | 8,607 | 10,992 | 9,581 | 9,078 | 9,388 | ||||||||||||||||||||||||||||||
|
|
|
|
|
|
|
|
|
| |||||||||||||||||||||||||||||||
Total | 11,040 | 10,268 | 11,088 | 5,897 | 3,421 | 12,054 | 19,839 | 12,750 | 11,404 | 12,003 | ||||||||||||||||||||||||||||||
Charge offs against credit loss allowance | ||||||||||||||||||||||||||||||||||||||||
Domestic: | ||||||||||||||||||||||||||||||||||||||||
Commercial, financial, agricultural, industrial | (980 | ) | (704 | ) | (356 | ) | (122 | ) | (141 | ) | (893 | ) | (755 | ) | (980 | ) | (704 | ) | (356 | ) | ||||||||||||||||||||
Real estate and construction | (133 | ) | (191 | ) | (137 | ) | (34 | ) | (29 | ) | (717 | ) | (676 | ) | (133 | ) | (191 | ) | (137 | ) | ||||||||||||||||||||
Other mortgages | (592 | ) | (369 | ) | (236 | ) | (62 | ) | (12 | ) | (278 | ) | (400 | ) | (592 | ) | (369 | ) | (236 | ) | ||||||||||||||||||||
Installment loans to individuals | (870 | ) | (841 | ) | (481 | ) | (503 | ) | (357 | ) | (593 | ) | (839 | ) | (870 | ) | (841 | ) | (481 | ) | ||||||||||||||||||||
Lease finance | (220 | ) | (61 | ) | (26 | ) | (3 | ) | (1 | ) | (60 | ) | (27 | ) | (220 | ) | (61 | ) | (26 | ) | ||||||||||||||||||||
Other | (3 | ) | (8 | ) | (1 | ) | (8 | ) | (34 | ) | (39 | ) | (50 | ) | (3 | ) | (8 | ) | (1 | ) | ||||||||||||||||||||
|
|
|
|
|
|
|
|
|
| |||||||||||||||||||||||||||||||
Total Borrowers in Spain | (2,798 | ) | (2,174 | ) | (1,237 | ) | (732 | ) | (574 | ) | (2,580 | ) | (2,747 | ) | (2,798 | ) | (2,174 | ) | (1,237 | ) | ||||||||||||||||||||
Borrowers outside Spain | ||||||||||||||||||||||||||||||||||||||||
Government and official institutions | — | (43 | ) | — | — | — | — | — | — | (43 | ) | — | ||||||||||||||||||||||||||||
Commercial and industrial | (8,445 | ) | (7,994 | ) | (7,827 | ) | (2,807 | ) | (1,970 | ) | (7,130 | ) | (7,402 | ) | (8,445 | ) | (7,994 | ) | (7,827 | ) | ||||||||||||||||||||
Mortgage loans | (791 | ) | (445 | ) | (393 | ) | (2 | ) | (7 | ) | (459 | ) | (477 | ) | (791 | ) | (445 | ) | (393 | ) | ||||||||||||||||||||
Other | (396 | ) | (257 | ) | (338 | ) | (1,012 | ) | (769 | ) | (457 | ) | (720 | ) | (259 | ) | (100 | ) | (338 | ) | ||||||||||||||||||||
|
|
|
|
|
|
|
|
|
| |||||||||||||||||||||||||||||||
Borrowers outside Spain | (9,632 | ) | (8,739 | ) | (8,558 | ) | (3,821 | ) | (2,746 | ) | (8,046 | ) | (8,599 | ) | (9,495 | ) | (8,582 | ) | (8,558 | ) | ||||||||||||||||||||
|
|
|
|
|
|
|
|
|
| |||||||||||||||||||||||||||||||
Total | (12,430 | ) | (10,913 | ) | (9,795 | ) | (4,553 | ) | (3,320 | ) | (10,626 | ) | (11,346 | ) | (12,293 | ) | (10,756 | ) | (9,795 | ) | ||||||||||||||||||||
The table below shows a breakdown of allowances for credit losses by type and domicile of borrower for the years indicated.
73
Allowances for Credit Losses
| IFRS-IASB Year Ended December 31, | IFRS-IASB Year Ended December 31, | |||||||||||||||||||||||||||||||||||||||||||||||||||||||||||||||||||||||||||||||
| 2011 | % | 2010 | % | 2009 | % | 2008 | % | 2007 | % | 2013 | % | 2012 | % | 2011 | % | 2010 | % | 2009 | % | |||||||||||||||||||||||||||||||||||||||||||||||||||||||||||||
| (in millions of euros, except percentages) | (in millions of euros, except percentages) | |||||||||||||||||||||||||||||||||||||||||||||||||||||||||||||||||||||||||||||||
Borrowers in Spain: | ||||||||||||||||||||||||||||||||||||||||||||||||||||||||||||||||||||||||||||||||
Commercial, financial, agricultural, industrial | 1,579 | 8.32 | 1,499 | 7.59 | 1,743 | 9.74 | 1,690 | 13.29 | 1,121 | 12.75 | 2,681 | 10.74 | 1,775 | 6.97 | 1,579 | 8.37 | 1,499 | 7.67 | 1,743 | 9.74 | ||||||||||||||||||||||||||||||||||||||||||||||||||||||||||||
Real estate and construction (*) | 3,210 | 16.91 | 2,723 | 13.80 | 1,896 | 10.59 | 1,490 | 11.72 | 1,413 | 16.06 | 6,678 | 26.76 | 7,511 | 29.49 | 3,210 | 17.02 | 2,723 | 13.93 | 1,896 | 10.59 | ||||||||||||||||||||||||||||||||||||||||||||||||||||||||||||
Other mortgages | 1,325 | 6.98 | 1,329 | 6.73 | 1,375 | 7.68 | 1,272 | 10.00 | 805 | 9.16 | 1,810 | 7.25 | 1,420 | 5.58 | 1,325 | 7.03 | 1,329 | 6.80 | 1,375 | 7.68 | ||||||||||||||||||||||||||||||||||||||||||||||||||||||||||||
Installment loans to individuals | 690 | 3.63 | 1,065 | 5.40 | 1,674 | 9.35 | 1,182 | 9.29 | 927 | 10.53 | 967 | 3.87 | 823 | 3.23 | 690 | 3.66 | 1,065 | 5.45 | 1,674 | 9.35 | ||||||||||||||||||||||||||||||||||||||||||||||||||||||||||||
Lease finance | 101 | 0.53 | 169 | 0.85 | 216 | 1.21 | 113 | 0.89 | 162 | 1.85 | 113 | 0.46 | 103 | 0.40 | 101 | 0.54 | 169 | 0.87 | 216 | 1.21 | ||||||||||||||||||||||||||||||||||||||||||||||||||||||||||||
Other | 2 | 0.01 | 25 | 0.13 | 89 | 0.50 | 202 | 1.59 | 84 | 0.95 | 30 | 0.12 | 79 | 0.31 | 2 | 0.01 | 25 | 0.13 | 89 | 0.50 | ||||||||||||||||||||||||||||||||||||||||||||||||||||||||||||
|
|
|
|
|
|
|
|
|
|
|
|
|
|
|
|
|
|
|
| |||||||||||||||||||||||||||||||||||||||||||||||||||||||||||||
Total Borrowers in Spain | 6,907 | 36.37 | 6,810 | 34.50 | 6,993 | 39.07 | 5,949 | 46.77 | 4,512 | 51.30 | 12,279 | 49.20 | 11,711 | 45.98 | 6,907 | 36.62 | 6,810 | 34.85 | 6,993 | 39.07 | ||||||||||||||||||||||||||||||||||||||||||||||||||||||||||||
Borrowers outside Spain: | ||||||||||||||||||||||||||||||||||||||||||||||||||||||||||||||||||||||||||||||||
Government and official institutions | 31 | 0.17 | 31 | 0.16 | 19 | 0.11 | 14 | 0.11 | 26 | 0.29 | 21 | 0.08 | 30 | 0.12 | 31 | 0.17 | 31 | 0.16 | 19 | 0.11 | ||||||||||||||||||||||||||||||||||||||||||||||||||||||||||||
Commercial and industrial | 9,334 | 49.16 | 9,811 | 49.70 | 8,529 | 47.65 | 4,518 | 35.52 | 2,762 | 31.40 | 9,765 | 39.12 | 10,628 | 41.74 | 9,334 | 49.50 | 9,811 | 50.20 | 8,529 | 47.65 | ||||||||||||||||||||||||||||||||||||||||||||||||||||||||||||
Mortgage loans | 1,791 | 9.43 | 1,876 | 9.50 | 1,555 | 8.69 | 1,615 | 12.70 | 1,355 | 15.40 | 2,223 | 8.91 | 2,054 | 8.06 | 1,791 | 9.50 | 1,876 | 9.60 | 1,555 | 8.69 | ||||||||||||||||||||||||||||||||||||||||||||||||||||||||||||
Other | 925 | 4.87 | 1,211 | 6.14 | 803 | 4.48 | 624 | 4.91 | 141 | 1.61 | 671 | 2.69 | 1,043 | 4.10 | 795 | 4.21 | 1,016 | 5.20 | 803 | 4.48 | ||||||||||||||||||||||||||||||||||||||||||||||||||||||||||||
|
|
|
|
|
|
|
|
|
|
|
|
|
|
|
|
|
|
|
| |||||||||||||||||||||||||||||||||||||||||||||||||||||||||||||
Total Borrowers outside Spain | 12,081 | 63.63 | 12,929 | 65.50 | 10,906 | 60.93 | 6,771 | 53.23 | 4,284 | 48.70 | 12,680 | 50.80 | 13,756 | 54.02 | 11,951 | 63.38 | 12,734 | 65.15 | 10,906 | 60.93 | ||||||||||||||||||||||||||||||||||||||||||||||||||||||||||||
|
|
|
|
|
|
|
|
|
|
|
|
|
|
|
|
|
|
|
| |||||||||||||||||||||||||||||||||||||||||||||||||||||||||||||
Total | 18,988 | 100.00 | 19,739 | 100.00 | 17,899 | 100.00 | 12,720 | 100.00 | 8,796 | 100.00 | 24,959 | 100.00 | 25,467 | 100.00 | 18,858 | 100.00 | 19,544 | 100.00 | 17,899 | 100.00 | ||||||||||||||||||||||||||||||||||||||||||||||||||||||||||||
| (*) | As of December 31, |
Impaired Balances
The following tables show our impaired assets (loans, securities and other assets to collect) and contingent liabilities, excluding country-risk. We do not keep records classifying balances as non-accrual, past due, restructured or potential problem loans, as those terms are defined by the SEC. However, we have estimated the amount of our balances that would have been so classified, to the extent possible, below.
IFRS At December 31, | IFRS-IASB At December 31, | |||||||||||||||||||||||||||||||||||||||
| Non-performing balances | 2011 | 2010 | 2009 | 2008 | 2007 | 2013 | 2012 | 2011 | 2010 | 2009 | ||||||||||||||||||||||||||||||
| (in millions of euros) | (in millions of euros) | |||||||||||||||||||||||||||||||||||||||
Past-due and other non-performing balances (1) (2) (3): | ||||||||||||||||||||||||||||||||||||||||
Domestic | 15,340 | 12,474 | 10,406 | 6,406 | 1,887 | 22,658 | 16,623 | 15,340 | 12,474 | 10,406 | ||||||||||||||||||||||||||||||
International | 16,696 | 16,048 | 14,148 | 7,785 | 4,291 | 18,994 | 19,438 | 16,666 | 16,004 | 14,148 | ||||||||||||||||||||||||||||||
|
|
|
|
|
|
|
|
|
| |||||||||||||||||||||||||||||||
Total | 32,036 | 28,522 | 24,554 | 14,191 | 6,178 | 41,652 | 36,061 | 32,006 | 28,478 | 24,554 | ||||||||||||||||||||||||||||||
| (1) | We estimate that the total amount of our non-performing balances fully provisioned under IFRS and which under |
| (2) | Non-performing balances due to country risk were |
| (3) | We estimate that at December 31, 2013, 2012, 2011, 2010, |
74
We do not believe that there is a material amount of assets not included in the foregoing table where known information about credit risk at December 31, 20112013 (not related to transfer risk inherent in cross-border lending activities) gave rise to serious doubts as to the ability of the borrowers to comply with the loan repayment terms at such date.
The following table shows our financial assets classified as loans and receivables which are considered to be impaired due to credit risk at December 31, 2011,2013, classified by geographical location of risk and by age of the oldest past-due amount (see Note 10.d, to our consolidated financial statements):
| Millions of euros | ||||||||||||||||||||||||||||||||||||||||||||||||
| Millions of euros | With no | With balances past due by | ||||||||||||||||||||||||||||||||||||||||||||||
| With no past-due balances or less | With balances past due by | past-due balances or less than 3 months past due | 3 to 6 months | 6 to 9 months | 9 to 12 months | More than 12 months | Total | |||||||||||||||||||||||||||||||||||||||||
| than 3 months past due | 3 to 6 months | 6 to 9 months | 9 to 12 months | More than 12 months | Total | |||||||||||||||||||||||||||||||||||||||||||
Spain | 2,962 | 3,574 | 1,589 | 1,956 | 4,902 | 14,983 | 6,876 | 3,327 | 1,707 | 1,700 | 8,255 | 21,865 | ||||||||||||||||||||||||||||||||||||
European Union (excluding Spain) | 474 | 3,360 | 1,018 | 703 | 2,752 | 8,307 | 1,791 | 3,141 | 994 | 763 | 3,461 | 10,150 | ||||||||||||||||||||||||||||||||||||
United States and Puerto Rico | 406 | 282 | 137 | 118 | 533 | 1,476 | 322 | 178 | 78 | 43 | 417 | 1,038 | ||||||||||||||||||||||||||||||||||||
Other OECD countries | 9 | 34 | 37 | 43 | 1 | 124 | 12 | 38 | 29 | 10 | 49 | 138 | ||||||||||||||||||||||||||||||||||||
Latin America | 440 | 2,438 | 1,339 | 1,075 | 1,103 | 6,395 | 819 | 2,671 | 1,194 | 1,050 | 1,393 | 7,127 | ||||||||||||||||||||||||||||||||||||
Rest of the world | — | 2 | — | — | — | 2 | — | — | — | — | 2 | 2 | ||||||||||||||||||||||||||||||||||||
|
|
|
|
|
|
|
|
|
|
|
| |||||||||||||||||||||||||||||||||||||
| 4,291 | 9,690 | 4,120 | 3,895 | 9,291 | 31,287 | 9,820 | 9,355 | 4,002 | 3,566 | 13,577 | 40,320 | |||||||||||||||||||||||||||||||||||||
|
|
|
|
|
| |||||||||||||||||||||||||||||||||||||||||||
The financial assets classified under the caption “loans and receivables” of our balance sheet as of December 31, 2011 that are considered to be impaired due to credit risk and bear past-due amounts of more than 12 months amounted to €9,291 million (29.7% of total impaired loans).
Evolution of Impaired Balances
The following tables show the movement in our impaired assets and contingent liabilities (excluding country risk, see “—Country risk Outstandings” herein).
| IFRS | IFRS-IASB | |||||||||||||||||||||||||||||||||||||||||||||||||||||||||||||||||||||||
| (in millions of euros) | Quarter ended | Year ended Dec. 31, | Year ended Dec. 31, | Year ended Dec. 31, | Year ended Dec. 31, | Year ended Dec. 31, | Quarter ended | Year ended Dec. 31, | Year ended Dec. 31, | Year ended Dec. 31, | Year ended Dec. 31, | Year ended Dec. 31, | ||||||||||||||||||||||||||||||||||||||||||||||||||||||||||||
| Mar. 31, 2011 | Jun. 30, 2011 | Sep. 30, 2011 | Dec. 31, 2011 | 2011 | 2010 | 2009 | 2008 | 2007 | Mar. 31, 2013 | Jun. 30, 2013 | Sep. 30, 2013 | Dec. 31, 2013 | 2013 | 2012 | 2011 | 2010 | 2009 | |||||||||||||||||||||||||||||||||||||||||||||||||||||||
Opening balance | 28,522 | 28,494 | 30,186 | 30,910 | 28,522 | 24,554 | 14,191 | 6,179 | 4,608 | 36,061 | 38,051 | 40,055 | 41,173 | 36,061 | 32,006 | 28,478 | 24,554 | 14,191 | ||||||||||||||||||||||||||||||||||||||||||||||||||||||
Net additions | 3,112 | 4,015 | 4,206 | 4,048 | 15,381 | 13,478 | 18,234 | 11,346 | 5,014 | |||||||||||||||||||||||||||||||||||||||||||||||||||||||||||||||
Increase in scope of consolidation | 186 | 739 | — | — | 925 | 257 | 1,033 | 2,089 | 1 | |||||||||||||||||||||||||||||||||||||||||||||||||||||||||||||||
Increases | 7,775 | 10,124 | 9,136 | 10,280 | 37,316 | 34,983 | 34,379 | 31,764 | 36,067 | |||||||||||||||||||||||||||||||||||||||||||||||||||||||||||||||
Cash recoveries | (3,351 | ) | (3,739 | ) | (4,642 | ) | (6,130 | ) | (17,863 | ) | (16,298 | ) | (15,466 | ) | (15,802 | ) | (15,951 | ) | ||||||||||||||||||||||||||||||||||||||||||||||||||||||
Foreclosed assets | (626 | ) | (510 | ) | (372 | ) | (349 | ) | (1,857 | ) | (2,146 | ) | (2,791 | ) | (2,484 | ) | (1,882 | ) | ||||||||||||||||||||||||||||||||||||||||||||||||||||||
Changes in scope of consolidation | 743 | — | — | — | 743 | (628 | ) | 69 | 55 | 1,033 | ||||||||||||||||||||||||||||||||||||||||||||||||||||||||||||||
Exchange differences | (558 | ) | (31 | ) | (444 | ) | 672 | (362 | ) | 1,147 | 890 | (871 | ) | (124 | ) | 278 | (1,260 | ) | (401 | ) | (739 | ) | (2,122 | ) | (509 | ) | (370 | ) | 1,147 | 890 | ||||||||||||||||||||||||||||||||||||||||||
Writeoffs | (2,767 | ) | (3,031 | ) | (3,037 | ) | (3,594 | ) | (12,430 | ) | (10,914 | ) | (9,794 | ) | (4,552 | ) | (3,320 | ) | ||||||||||||||||||||||||||||||||||||||||||||||||||||||
Write-offs | (2,829 | ) | (2,611 | ) | (2,603 | ) | (2,583 | ) | (10,626 | ) | (11,347 | ) | (12,293 | ) | (10,756 | ) | (9,794 | ) | ||||||||||||||||||||||||||||||||||||||||||||||||||||||
|
|
|
|
|
|
|
|
| ||||||||||||||||||||||||||||||||||||||||||||||||||||||||||||||||
Closing balance | 28,495 | 30,186 | 30,911 | 32,036 | 32,036 | 28,522 | 24,554 | 14,191 | 6,179 | 38,051 | 40,055 | 41,173 | 41,652 | 41,652 | 36,061 | 32,006 | 28,478 | 24,554 | ||||||||||||||||||||||||||||||||||||||||||||||||||||||
75
NPL balances increased in 2011 by €3,514 million to €32,036 million (an increase of 12.3% as compared to 2010). NPL balances were €28,522 million in 2010, a 16% increase as compared to €24,554 million in 2009. These variations reflect the impact of continued weak economic environments in some markets, mitigated in part by risk management activities. In 2011, NPLs fell at Santander Consumer Finance and Sovereign, but rose in both of the economies most affected by the crisis, namely Spain and Portugal, and, to a lesser extent, in the countries better placed in the economic cycle, such as the UK. In Latin America as a whole, the increase in NPLs tracked lending growth.
In 2011, net additions to non-performing balances increased by a total amount of €1,903 million as compared to a decrease of €4,756 million in 2010, mainly due to the deterioration in the economy in Spain that was more severe than foreseen.
The €925 million increase in the scope of consolidation in 2011 mainly reflects the impact from the consolidation of Bank Zachodni WBK in Poland during the year.
Charge-offs increased from 2010 to 2011 by €1,517 million as compared to a €1,119 million increase from 2009 to 2010. The increase during 2011 was of €624 million in Spain (+€937 million in 2010) and of €893 million outside Spain (+€182 million in 2010). The chargeoffs in Spain reflect the still weak Spanish economy. Outside Spain charge-offs increased more than the previous year mainly due to the growth of the credit portfolio in Latin America.
Charge-offs increased from 2009 to 2010 by €1,119 million as compared to a €5,243 million increase from 2008 to 2009. The increase during 2010 was more significant in Spain (+€936.9 million) while charge-offs outside Spain increased to a significantly lesser degree (+€181.7 million). This was due to the still weak Spanish economy which ended 2010 with a negative growth of -0.1% while the main foreign economies either grew strongly or were showing signs of recovery.
76
Impaired Balances Ratios
The following table shows the total amount of our computable credit risk, our non-performing assets and contingent liabilities by category, our allowances for credit losses, the ratio of our impaired balances to total computable credit risk and our coverage ratio at the dates indicated.
| IFRS At December 31, | IFRS-IASB At December 31, | |||||||||||||||||||||||||||||||||||||||
| 2011 | 2010 | 2009 | 2008 | 2007 | 2013 | 2012 | 2011 | 2010 | 2009 | |||||||||||||||||||||||||||||||
| (in millions of euros, except percentages) | (in millions of euros, except percentages) | |||||||||||||||||||||||||||||||||||||||
Computable credit risk (1) | 822,657 | 804,036 | 758,347 | 697,200 | 649,342 | 738,558 | 793,449 | 820,968 | 802,192 | 758,347 | ||||||||||||||||||||||||||||||
Non-performing balances by segments: | ||||||||||||||||||||||||||||||||||||||||
Non-performing balances by category: | ||||||||||||||||||||||||||||||||||||||||
Individuals | 15,981 | 15,606 | 14,590 | 10,114 | 4,775 | 17,607 | 16,828 | 15,951 | 15,562 | 14,590 | ||||||||||||||||||||||||||||||
Mortgages | 6,872 | 6,304 | 6,111 | 3,239 | 1,585 | 9,609 | 7,281 | 6,872 | 6,304 | 6,111 | ||||||||||||||||||||||||||||||
Consumer loans | 6,254 | 6,487 | 6,164 | 5,711 | 2,696 | 5,129 | 5,961 | 6,254 | 6,487 | 6,164 | ||||||||||||||||||||||||||||||
Credit cards and others | 2,855 | 2,815 | 2,315 | 1,164 | 494 | 2,869 | 3,586 | 2,825 | 2,771 | 2,315 | ||||||||||||||||||||||||||||||
Enterprises | 14,995 | 11,321 | 7,812 | 2,860 | 1,310 | 21,538 | 18,155 | 14,995 | 11,321 | 7,812 | ||||||||||||||||||||||||||||||
Corporate Banking | 954 | 1,550 | 2,127 | 1,130 | 62 | 2,408 | 991 | 954 | 1,550 | 2,127 | ||||||||||||||||||||||||||||||
Public sector | 106 | 45 | 25 | 87 | 32 | 99 | 87 | 106 | 45 | 25 | ||||||||||||||||||||||||||||||
|
|
|
|
|
|
|
|
|
| |||||||||||||||||||||||||||||||
Total non performing balances | 32,036 | 28,522 | 24,554 | 14,191 | 6,179 | |||||||||||||||||||||||||||||||||||
Total non-performing balances | 41,652 | 36,061 | 32,006 | 28,478 | 24,554 | |||||||||||||||||||||||||||||||||||
Allowances for non-performing balances | 19,661 | 20,748 | 18,497 | 12,863 | 9,302 | 25,681 | 26,112 | 19,531 | 20,552 | 18,497 | ||||||||||||||||||||||||||||||
Ratios | ||||||||||||||||||||||||||||||||||||||||
Non-performing balances to computable credit risk | 3.89 | % | 3.55 | % | 3.24 | % | 2.04 | % | 0.95 | % | ||||||||||||||||||||||||||||||
Non-performing balances (2) to computable credit risk | 5.64 | % | 4.54 | % | 3.90 | % | 3.55 | % | 3.24 | % | ||||||||||||||||||||||||||||||
Coverage ratio | 61.37 | % | 72.74 | % | 75.33 | % | 90.64 | % | 150.55 | % | 61.65 | % | 72.41 | % | 61.02 | % | 72.17 | % | 75.33 | % | ||||||||||||||||||||
Balances charged-off to total loans and contingent liabilities | 1.29 | % | 1.21 | % | 1.17 | % | 0.55 | % | 0.41 | % | 1.29 | % | 1.27 | % | 1.29 | % | 1.21 | % | 1.17 | % | ||||||||||||||||||||
| (1) | Computable credit risk is the sum of the face amounts of loans and leases (including non-performing assets but excluding country risk loans), guarantees and documentary credits. |
| (2) | Impaired or non-performing loans and contingent liabilities, securities and other assets to collect. |
| (3) | Allowances for non-performing balances as a percentage of non-performing balances. |
Non-performing loan (NPL) balances were €41,652 million at December 31, 2013, a €5,591 million increase as compared to €36,061 million at December 31, 2012. The Group’s NPL ratio of non-performing balances to computable credit risk was 3.89%, 3.55%, 3.24%, 2.04%, and 0.95%, and for the Group as a whole as of December 31, 2011, 2010, 2009, 2008 and 2007, respectively. 2013 was 5.64%, as compared to 4.54% as of December 31, 2012.
The 34 basis point increaseNPL coverage ratio as of December 31, 2013 was 61.7%, as compared to a coverage ratio of 72.4% at the end of 2012. This ratio is calculated as allowances for non-performing balances as a percentage of non-performing balances.
The main reasons for the increases in 2011 reflects the impact ofNPL ratio are the deterioration of the economic environment. This continued weakness increased thefollowing:
The NPL ratios by country as of December 31, 2013 are set out below.
mortgages to individuals. The NPL coverage ratio was 61.4% in 2011,level decreased to 44.0% as compared to a coverage ratio of 72.7%50.0% at the end of 2010. This2012.
77
In 2009, the Group’s non-performing balances increased mainly duecompared to (1) the rapid deterioration of the global macroeconomic environment and (2) the increase in the Bank’s scope of consolidation (due to the acquisitions of Alliance & Leicester, Sovereign, Banco Real, GE Money and RBS Europe). Other factors leading to the increase in the Group’s non-performing balances were the higher volumes of lending in recent years and the change of mix (principally in Latin America) toward more profitable but higher risk products. The principal geographic drivers of the increase in non-performing balances, other than through acquisitions, were Spain, the United Kingdom and Brazil.
We establish our expectations of credit loss (and our corresponding allowances) for our entire loan portfolio, not just for our non-performing balances. Our expectations of credit loss for our entire portfolio typically increase at a slower rate than the rate at which our non-performing balances increase, particularly during an economic downturn, when non-performing loans grow quickly but the performing loan portfolio grows at a slower pace and with lower-risk loans, reflecting caution due to macroeconomic conditions. As a result, the ratio of our non-performing balances to computable credit risk typically increases since the numerator (non-performing balances) increases faster than the denominator (computable credit risk). Similarly, our coverage ratio typically decreases since, for the reasons discussed above, the numerator (allowances for credit losses) does not increase as quickly as the denominator (non-performing balances).
We are currently highly exposed to real estate markets, especially in Spain and the United Kingdom. The mortgage portfolio of the commercial network in Spain accounted for a 34% of the total loan portfolio of this segment and in the United Kingdom it comprised more than 80%. Mortgage loans are one of our principal assets, comprising 52% of our loan portfolio6.56% as of December 31, 2011,2012 due to the difficult economic environment and we are focused on first home mortgages. From 2002mainly concentrated in loans to 2007, demandenterprises. Coverage was 50% as compared to 53% as of December 31, 2012.
Allowances for non-performing balances,excluding country risk, were €25,681 million at December 31, 2013, a €431 million decrease as compared to €26,112 million at December 31, 2012. The main developments in 2013 were; (i) a €1,201 million decrease in Brazil, mainly due to exchange rate differences, (ii) a €537 million increase in Poland, mainly due to higher levels of non-performing loans of Kredyt Bank, and (iii) a €509 million increase in Spain due to increased significantly driven by, among other things, economic growth, declining unemployment rates, demographicnon-performing loans, as previously mentioned. For further details see Item 11 of Part I. “Quantitative and social trends, and historically low interest rates in the Eurozone. The United Kingdom experienced a similar increase in housing and mortgage demand, driven by, among other things, economic growth, declining unemployment rates, demographic trends and the increasing prominence of London as an international financial center. In this favorable environment, we maintained prudent risk management with a mortgage portfolio focused on first homes with low average loan to value. As a result of the general macroeconomic deterioration in the second half of 2008, a percentage of these assets became non-performing and, as a result of the quality of the collateral, the inexistence of both option adjustable rate mortgage (“ARM”) loans and of monthly payments below accrued interest, the requirements of allowances for these non-performing assets have remained low.Qualitative Disclosures About Risk—Part 5. Credit Risk”.
Other non-accruing balances
As described previously herein under “Bank of SpainSpain’s Classification Requirements”, we do not classify our loans and contingent liabilities to borrowers in countries with transitory difficulties (category 3) and countries in serious difficulties (category 4) as impaired balances. Loans and contingent liabilities in these categories do not stop accruing interest. However, we treat category 5 (doubtful countries) country-risk outstandings as both a non-accruing and impaired balance.
Summary of non-accrual balances | IFRS-IASB Year Ended December 31, | |||||||||||||||||||
| 2011 | 2010 | 2009 | 2008 | 2007 | ||||||||||||||||
| (in millions of euros) | ||||||||||||||||||||
Balances classified as non-performing balances | 32,036.0 | 28,522.4 | 24,553.6 | 14,190.8 | 6,178.7 | |||||||||||||||
Non-performing balances due to country risk | 7.0 | 7.9 | 7.8 | 2.6 | 6.7 | |||||||||||||||
|
|
|
|
|
|
|
|
|
| |||||||||||
Total non-accruing balances | 32,043.0 | 28,530.3 | 24,561.4 | 14,193.4 | 6,185.4 | |||||||||||||||
As of December 31, 2011, 2010, 2009, 2008 and 2007, the amounts of refinanced loans were €10,167 million, €5,956 million, €3,829 million, €648.7 million and €465.2 million, respectively. A definition of refinanced loans and a detailed explanation of the corporate policy of restructurings can be found under “Item 11. Quantitative and Qualitative Disclosures About Market Risk – Part 4. Credit risk – Credit exposure in Spain – Restructuring and Payment Agreements” herein. The strong increase in 2009 and 2010 was directly related to the increase in non-performing loans. In 2011, the main increases were in the commercial business and individual segments.
Summary of non-accrual balances | IFRS-IASB Year Ended December 31, | |||||||||||||||||||
| 2013 | 2012 | 2011 | 2010 | 2009 | ||||||||||||||||
| (in millions of euros) | ||||||||||||||||||||
Balances classified as non-performing balances | 41,652 | 36,061 | 32,006 | 28,478 | 24,554 | |||||||||||||||
Non-performing balances due to country risk | 3 | 6 | 7 | 8 | 7 | |||||||||||||||
|
|
|
|
|
|
|
|
|
| |||||||||||
Total non-accruing balances | 41,655 | 36,067 | 32,013 | 28,486 | 24,561 | |||||||||||||||
78
Foreclosed Assets
The tables below set forth the movements in our foreclosed assets for the periods shown.
| IFRS-IASB | IFRS-IASB | |||||||||||||||||||||||||||||||||||||||||||||||||||||||
| Quarterly movements | Year Ended December 31, | Quarterly movements | Year Ended December 31, | |||||||||||||||||||||||||||||||||||||||||||||||||||||
| Mar. 31, 2011 | Jun. 30, 2011 | Sep. 30, 2011 | Dec. 31, 2011 | 2011 | 2010 | 2009 | Mar. 31, 2013 | Jun. 30, 2013 | Sep. 30, 2013 | Dec. 31, 2013 | 2013 | 2012 | 2011 | |||||||||||||||||||||||||||||||||||||||||||
| (in millions of euros, except percentages) | (in millions of euros, except percentages) | |||||||||||||||||||||||||||||||||||||||||||||||||||||||
Opening balance | 4,046 | 4,469 | 5,051 | 5,325 | 4,046 | 2,716 | 1,310 | 8,611 | 8,866 | 9,102 | 9,393 | 8,611 | 9,624 | 8,376 | ||||||||||||||||||||||||||||||||||||||||||
Foreclosures | 878 | 1,078 | 613 | 806 | 3,375 | 3,164 | 3,384 | 582 | 575 | 535 | 616 | 2,308 | 2,603 | 2,699 | ||||||||||||||||||||||||||||||||||||||||||
Sales | (455 | ) | (496 | ) | (339 | ) | (678 | ) | (1,968 | ) | (1,834 | ) | (1,978 | ) | (330 | ) | (290 | ) | (211 | ) | (484 | ) | (1,315 | ) | (3,248 | ) | (1,591 | ) | ||||||||||||||||||||||||||||
Other movements | 3 | (49 | ) | (33 | ) | 173 | 94 | (368 | ) | 140 | ||||||||||||||||||||||||||||||||||||||||||||||
|
|
|
|
|
|
|
|
|
|
|
|
|
| |||||||||||||||||||||||||||||||||||||||||||
Gross foreclosed assets | 4,469 | 5,051 | 5,325 | 5,453 | 5,453 | 4,046 | 2,716 | 8,866 | 9,102 | 9,393 | 9,698 | 9,698 | 8,611 | 9,624 | ||||||||||||||||||||||||||||||||||||||||||
|
|
|
|
|
|
| ||||||||||||||||||||||||||||||||||||||||||||||||||
Of which: in Spain | 8,057 | 8,395 | 8,709 | 8,831 | 8,831 | 7,846 | 8,552 | |||||||||||||||||||||||||||||||||||||||||||||||||
Allowances established | 1,257 | 1,403 | 1,503 | 1,683 | 1,683 | 1,138 | 713 | 4,524 | 4,655 | 4,809 | 4,956 | 4,956 | 4,416 | 4,512 | ||||||||||||||||||||||||||||||||||||||||||
Of which: in Spain | 4,279 | 4,424 | 4,586 | 4,685 | 4,685 | 4,170 | 4,278 | |||||||||||||||||||||||||||||||||||||||||||||||||
|
|
|
|
|
|
|
|
|
|
|
|
|
| |||||||||||||||||||||||||||||||||||||||||||
Closing balance (net) | 3,212 | 3,648 | 3,822 | 3,770 | 3,770 | 2,908 | 2,003 | 4,342 | 4,447 | 4,584 | 4,742 | 4,742 | 4,195 | 5,112 | ||||||||||||||||||||||||||||||||||||||||||
|
|
|
|
|
|
| ||||||||||||||||||||||||||||||||||||||||||||||||||
Of which: in Spain | 3,778 | 3,971 | 4,123 | 4,146 | 4,146 | 3,676 | 4,274 | |||||||||||||||||||||||||||||||||||||||||||||||||
Allowance as a percentage of foreclosed assets | 28.13 | % | 27.78 | % | 28.22 | % | 30.86 | % | 30.86 | % | 28.14 | % | 26.27 | % | 51.0 | % | 51.1 | % | 51.1 | % | 51.1 | % | 51.1 | % | 51.3 | % | 46.9 | % | ||||||||||||||||||||||||||||
|
|
|
|
|
|
| ||||||||||||||||||||||||||||||||||||||||||||||||||
Of which: in Spain | 53.1 | % | 52.7 | % | 52.7 | % | 53.1 | % | 53.1 | % | 53.1 | % | 50.0 | % | ||||||||||||||||||||||||||||||||||||||||||
Additionally, the measures adopted in Spain to achieve more efficient risk management included the acquisition and foreclosure of real estate assets in payment of customer’s debts. At December 31, 2011 the net balance of these assets amounted to €4,274 million, as compared to €5,196 million in 2010. The allowances covering the value of these foreclosed and acquired assets were approximately €4,278 million in 2011 and €2,313 million in 2010 (coverage of 50% and 31%, respectively).Liabilities
Liabilities
Deposits
The principal components of our deposits are customer demand, time and notice deposits, and international and domestic interbank deposits. Our retail customers are the principal source of our demand, time and notice deposits. For an analysis, by domicile of customer, of average domestic and international deposits by type for 2009, 20102013, 2012 and 2011 see “—Average Balance Sheets and Interest Rates—Liabilities and Interest Expense”.
We compete actively with other commercial banks and with savings banks for domestic deposits. Our share of customer deposits in the Spanish banking system (includingCajas de Ahorros) was 18.0%18.9% at December 31, 2011,November 30, 2013 (most recent available data), according to figures published by the Spanish Banking Association (“AEB”) and the Confederación Española de Cajas de Ahorros (“CECA”). See “—Competition” herein.
The following tables analyze our year-end deposits.
Deposits (from central banks and credit institutions and customers) by type of deposit
| IFRS-IASB At December 31, | ||||||||||||
| Deposits from central banks and credit institutions- | 2011 | 2010 | 2009 | |||||||||
| (in millions of euros) | ||||||||||||
Reciprocal accounts | 604 | 423 | 948 | |||||||||
Time deposits | 82,817 | 57,233 | 78,325 | |||||||||
Other demand accounts | 3,396 | 2,678 | 3,341 | |||||||||
Repurchase agreements | 51,316 | 78,197 | 56,818 | |||||||||
Central bank credit account drawdowns | 5,005 | 1,580 | 2,659 | |||||||||
Other financial liabilities associated with transferred financial assets | — | — | — | |||||||||
Hybrid financial liabilities | — | 1 | — | |||||||||
|
|
|
|
|
| |||||||
Total | 143,138 | 140,112 | 142,091 | |||||||||
Customer deposits- | ||||||||||||
79
| IFRS-IASB At December 31, | ||||||||||||||||||||||||
| 2013 | 2012 | 2011 | ||||||||||||||||||||||
| (in millions of euros) | ||||||||||||||||||||||||
Deposits from central banks and credit institutions- | ||||||||||||||||||||||||
Reciprocal accounts | 755 | 508 | 604 | |||||||||||||||||||||
Time deposits | 55,839 | 92,491 | 82,817 | |||||||||||||||||||||
Other demand accounts | 3,425 | 3,225 | 3,396 | |||||||||||||||||||||
Repurchase agreements | 49,378 | 50,742 | 51,316 | |||||||||||||||||||||
Central bank credit account drawdowns | — | 6,000 | 5,005 | |||||||||||||||||||||
|
|
| ||||||||||||||||||||||
Total | 109,397 | 152,966 | 143,138 | |||||||||||||||||||||
Customer deposits- | ||||||||||||||||||||||||
Demand deposits- | ||||||||||||||||||||||||
Current accounts | 155,455 | 148,066 | 135,895 | 167,787 | 144,305 | 155,455 | ||||||||||||||||||
Savings accounts | 140,583 | 136,694 | 127,941 | 164,214 | 167,389 | 140,583 | ||||||||||||||||||
Other demand deposits | 3,179 | 3,431 | 3,570 | 3,512 | 3,443 | 3,179 | ||||||||||||||||||
Time deposits- | — | — | — | |||||||||||||||||||||
Fixed-term deposits | 257,498 | 275,629 | 192,245 | 225,471 | 257,583 | 257,498 | ||||||||||||||||||
Home-purchase savings accounts | 174 | 231 | 316 | 102 | 132 | 174 | ||||||||||||||||||
Discount deposits | 732 | 448 | 448 | 1,156 | 1,345 | 732 | ||||||||||||||||||
Funds received under financial asset transfers | — | — | — | |||||||||||||||||||||
Hybrid financial liabilities | 4,594 | 4,754 | 5,447 | 3,324 | 3,128 | 4,594 | ||||||||||||||||||
Other financial liabilities associated with transferred financial assets | — | — | — | |||||||||||||||||||||
Other time deposits | 139 | 154 | 212 | 463 | 590 | 139 | ||||||||||||||||||
Notice deposits | 1,338 | 1,316 | 2,208 | 21 | 969 | 1,338 | ||||||||||||||||||
Repurchase agreements | 68,841 | 45,653 | 38,693 | 41,787 | 47,755 | 68,841 | ||||||||||||||||||
|
|
|
|
|
| |||||||||||||||||||
Total | 632,533 | 616,376 | 506,975 | 607,837 | 626,639 | 632,533 | ||||||||||||||||||
Total deposits | 775,671 | 756,488 | 649,066 | 717,234 | 779,605 | 775,671 | ||||||||||||||||||
80
Deposits (from central banks and credit institutions and customers) by office location.geographic location of the Group’s companies that account the deposits.
| IFRS-IASB At December 31, | ||||||||||||||||||||||||
| 2013 | 2012 | 2011 | ||||||||||||||||||||||
| IFRS-IASB At December 31, | (in millions of euros) | |||||||||||||||||||||||
| Deposits from central banks and credit institutions- | 2011 | 2010 | 2009 | |||||||||||||||||||||
| (in millions of euros) | ||||||||||||||||||||||||
Due to credit institutions | ||||||||||||||||||||||||
Offices in Spain | 69,411 | 43,998 | 68,500 | 49,770 | 87,053 | 69,411 | ||||||||||||||||||
Offices outside Spain: | ||||||||||||||||||||||||
Other EU countries | 33,989 | 60,145 | 56,157 | 35,472 | 34,894 | 33,989 | ||||||||||||||||||
United States | 10,652 | 11,529 | 1,002 | 7,215 | 12,648 | 10,652 | ||||||||||||||||||
Other OECD countries (1) | 82 | 26 | 39 | 15 | 55 | 82 | ||||||||||||||||||
Central and South America (1) | 29,003 | 24,414 | 16,371 | 16,924 | 18,313 | 29,003 | ||||||||||||||||||
Other | 1 | — | 22 | 1 | 3 | 1 | ||||||||||||||||||
Total offices outside Spain | 73,727 | 96,114 | 73,591 | 59,627 | 65,913 | 73,727 | ||||||||||||||||||
|
|
|
|
|
| |||||||||||||||||||
Total | 143,138 | 140,112 | 142,091 | 109,397 | 152,966 | 143,138 | ||||||||||||||||||
Customer deposits | ||||||||||||||||||||||||
Offices in Spain | 202,022 | 218,788 | 170,760 | 185,460 | 192,588 | 202,022 | ||||||||||||||||||
Offices outside Spain: | ||||||||||||||||||||||||
Other EU countries | 260,529 | 230,929 | 199,169 | 259,903 | 261,135 | 260,529 | ||||||||||||||||||
United States and Puerto Rico | 43,437 | 40,855 | 37,851 | 43,773 | 45,129 | 43,437 | ||||||||||||||||||
Other OECD countries (1) | 939 | 998 | 1,101 | 1,879 | 788 | 939 | ||||||||||||||||||
Central and South America (1) | 125,343 | 124,334 | 96,805 | 116,666 | 126,842 | 125,343 | ||||||||||||||||||
Other | 263 | 472 | 1,289 | 156 | 157 | 263 | ||||||||||||||||||
Total offices outside Spain | 430,511 | 397,588 | 336,215 | 422,377 | 434,051 | 430,511 | ||||||||||||||||||
|
|
|
|
|
| |||||||||||||||||||
Total | 632,533 | 616,376 | 506,975 | 607,837 | 626,639 | 632,533 | ||||||||||||||||||
|
|
|
|
|
| |||||||||||||||||||
Total deposits | 775,671 | 756,488 | 649,066 | 717,234 | 779,605 | 775,671 | ||||||||||||||||||
| (1) | In this schedule Mexico is classified under “Central and South America”. |
The following table shows the maturity of time deposits (excluding inter-bank deposits) in denominations of $100,000 or more for the year ended December 31, 2011.2013. Large denomination customer deposits may be a less stable source of funds than demand and savings deposits.
| Year Ended December 31, 2013 | ||||||||||||||||||||||||
| Year Ended December 31, 2011 | Domestic | International | Total | |||||||||||||||||||||
| Domestic | International | Total | (in millions of euros) | |||||||||||||||||||||
| (in millions of euros) | ||||||||||||||||||||||||
Under 3 months | 16,019 | 36,276 | 52,295 | 10,615 | 33,191 | 43,806 | ||||||||||||||||||
3 to 6 months | 4,486 | 7,735 | 12,221 | 4,581 | 16,196 | 20,777 | ||||||||||||||||||
6 to 12 months | 8,149 | 16,917 | 25,066 | 16,406 | 13,578 | 29,984 | ||||||||||||||||||
Over 12 months | 9,726 | 36,610 | 46,336 | 11,814 | 13,828 | 25,642 | ||||||||||||||||||
|
|
|
|
|
| |||||||||||||||||||
Total | 38,380 | 97,538 | 135,918 | 43,416 | 76,793 | 120,209 | ||||||||||||||||||
81
The aggregate amount of deposits held by non-resident depositors (banks and customers) in our domestic branch network was €56.9 million, €64.0 million,€49 billion, €55 billion and €87.1 million,€57 billion, at December 31, 2011, 20102013, 2012 and 2009,2011, respectively.
| Short-Term Borrowings | IFRS-IASB At December 31, | IFRS-IASB At December 31, | ||||||||||||||||||||||||||||||||||||||||||||||
| 2011 | 2010 | 2009 | ||||||||||||||||||||||||||||||||||||||||||||||
| Average | Average | Average | 2013 | 2012 | 2011 | |||||||||||||||||||||||||||||||||||||||||||
| Amount | Rate | Amount | Rate | Amount | Rate | Amount | Average Rate | Amount | Average Rate | Amount | Average Rate | |||||||||||||||||||||||||||||||||||||
| (in millions of euros, except percentages) | (in millions of euros, except percentages) | |||||||||||||||||||||||||||||||||||||||||||||||
Securities sold under agreements to repurchase (principally Spanish Treasury notes and bills): | ||||||||||||||||||||||||||||||||||||||||||||||||
At December 31 | 120,156 | 3.60 | % | 123,859 | 2.38 | % | 95,512 | 1.85 | % | 91,166 | 3.69 | % | 98,497 | 3.27 | % | 120,156 | 3.60 | % | ||||||||||||||||||||||||||||||
Average during year | 124,788 | 3.46 | % | 98,171 | 3.01 | % | 90,542 | 2.24 | % | 109,191 | 3.08 | % | 115,755 | 3.34 | % | 124,788 | 3.46 | % | ||||||||||||||||||||||||||||||
Maximum month-end balance | 129,570 | 123,859 | 101,312 | 122,226 | 133,725 | 129,570 | ||||||||||||||||||||||||||||||||||||||||||
Other short-term borrowings: | ||||||||||||||||||||||||||||||||||||||||||||||||
At December 31 | 11,774 | 1.78 | % | 6,871 | 4.48 | % | 28,678 | 3.75 | % | 13,945 | 3.48 | % | 21,984 | 3.01 | % | 11,774 | 1.78 | % | ||||||||||||||||||||||||||||||
Average during year | 7,761 | 2.69 | % | 20,384 | 1.51 | % | 34,033 | 2.65 | % | 19,329 | 2.51 | % | 19,403 | 2.74 | % | 7,761 | 2.69 | % | ||||||||||||||||||||||||||||||
Maximum month-end balance | 11,774 | 29,273 | 41,760 | 23,049 | 22,304 | 11,774 | ||||||||||||||||||||||||||||||||||||||||||
|
|
|
|
|
| |||||||||||||||||||||||||||||||||||||||||||
Total short-term borrowings at year-end | 131,930 | 3.43 | % | 130,730 | 2.49 | % | 124,190 | 2.29 | % | 105,111 | 3.66 | % | 120,481 | 3.22 | % | 131,930 | 3.43 | % | ||||||||||||||||||||||||||||||
Competition
We face strong competition in all of our principal areas of operation from other banks, savings banks, credit co-operatives, brokerage services, on-line banks, insurance companies and other financial services firms.
Banks
At the end of December 2011,November 2013 (most recent available information), Banco Bilbao Vizcaya Argentaria, S.A. and Banco Santander, S.A. accounted for approximately 58.9%51.9% of loans and 64.6%56.0% of deposits of all Spanish banks, which in turn represented 30.1%35.7% of loans and 31.2%34.3% of deposits of the financial system, according to figures published by the AEB and the CECA.
Foreign banks also have a presence in the Spanish banking system as a result of liberalization measures adopted by the Bank of Spain in 1978. At December 31, 2011,2013, there were 8786 foreign banks (of which 7978 were from European Union countries) with branches in Spain. In addition, there were 2019 Spanish subsidiary banks of foreign banks (of which 1514 were from European Union countries).
Spanish law provides that any financial institution organized and licensed in another Member State of the European Union may conduct business in Spain from an office outside Spain. They do not need prior authorization from the Spanish authorities to do so. Once the Bank of Spain receives notice from the institution’s home country supervisory authority about the institution’s proposed activities in Spain, the institution is automatically registered and the proposed activities are automatically authorized.
The opening of a branch of any financial institution authorized in another Member State of the European Union does not need prior authorization or specific allocation of resources. The opening is subject to the reception by the Bank of Spain of a notice from the institution’s home country supervisory authority containing, at least, the following information:
Program of activities detailing the transactions to be made and the corporate structure of the branch;
Address in Spain of the branch;
Name and curriculum vitae of the branch’s managers;
Shareholders’ equity and solvency ratio of the financial institution and its consolidated group; and
Detailed information about any deposit guarantee scheme that assures the protection of the branch’s depositors.
82
Once the Bank of Spain receives the notice, it notifies the financial institution, thereby permitting the branch to be registered in the Mercantile Register and, then, in the Special Register of the Bank of Spain.
Spanish law requires prior approval by the Bank of Spain for a Spanish bank to acquire a significant interest in a bank organized outside the European Union, create a new bank outside the European Union or open a branch outside the European Union. Spanish banks must provide prior notice to the Bank of Spain to conduct any other business outside of Spain.
When a new bank is created by a Spanish bank outside of Spain, the following information has to be provided to the Bank of Spain:
amount of the investment;
percentage of the share capital and of the total voting rights;
name of the companies through which the investment will be made;
draft of the by-laws;
program of activities, setting out the types of business envisaged, the administrative and accounting organization and the internal control procedures, including those established to prevent money laundering transactions;
list of the persons who will be members of the first board of directors and of the senior management;
list of partners with significant holdings; and
detailed description of the banking, tax and anti-money laundering regulations of the country where it will be located.
The opening of branches outside Spain requires prior application to the Bank of Spain, including information about the country where the branch will be located, the address, program of activities and names and résumésresumes of the branch’s managers. The opening of representative offices requires prior notice to the Bank of Spain detailing the activities to be performed.
In addition, we face strong competition outside Spain, particularly in Argentina, Brazil, Chile, Mexico, Portugal, the United Kingdom, Germany, Poland, and the United States. In these corporate and institutional banking markets, we compete with the large domestic banks active in these markets and with the major international banks.
The global banking crisis has reduced the capacity of many institutions to lend and has resulted in the withdrawal or disappearance of a number of market participants and significant consolidation of competitors, particularly in the USU.S. and UK.U.K. Competition for retail deposits has intensified significantly reflecting the difficulties in the wholesale money markets.
In a number of these markets there are regulatory barriers to entry or expansion, and the state ownership of banks. Competition is generally intensifying as more players enter markets that are perceived to be de-regulating and offer significant growth potential.
Competition for corporate and institutional customers in the UKU.K. is from UKU.K. banks and from large foreign financial institutions that are also active and offer combined investment and commercial banking capabilities. Santander UK’sU.K.’s main competitors are established UKU.K. banks, building societies and insurance companies and other financial services providers (such as supermarket chains and large retailers).
In the UKU.K. credit card market large retailers and specialist card issuers, including major USU.S. operators, are active in addition to the UKU.K. banks. In addition to physical distribution channels, providers compete through direct marketing activity and the Internet.
83
In the United States, SovereignSantander Bank competes in the Northeastern, New England and New York retail and mid-corporate banking markets with local and regional banks and other financial institutions. SovereignSantander Bank also competes in the USU.S. in large corporate lending and specialized finance markets, and in fixed-income trading and sales. Competition is principally with the large USU.S. commercial and investment banks and international banks active in the US.U.S.
Savings Banks
Spanish savings banks (“Cajas de Ahorros”) are mutual organizations which engage in the same activities as banks, but primarily take deposits and make loans, principally to individual customers and small to medium-sized companies. The Spanish savings banks provided strong competition for the demand and savings deposits through a vast network of offices in Spain. Royal Decree-Law 2/2011, of February 18, was designed to reinforce the Spanish financial system and opened up a new stage in the process of restructuring and strengthening the Spanish savings banks. The focus was set on recapitalizing institutions that needed more capital and encouraging the savings banks to transfer their financial activity to a bank to ease their access to capital markets and wholesale funding. As of December 31, 2011,2012, the downsizing of the savings sector within this framework is nearlywas finalized and mostthe savings banks have completed their conversion into commercial banks. Notwithstanding this, to address concerns in connection with the persistence of savings banks as controllers or significant shareholders of commercial banks the Spanish parliament adopted in December 2013 a comprehensive reform of the savings bank system as part of the ESM-supported program. The Spanishreform entailed a two-fold approach: a) strengthening the regulatory regime for the two small savings banks’ sharebanks that still carry out banking activities directly; and b) providing that former savings banks that indirectly exercise banking activity (through ownership of domestic loans and deposits is no longer significant.a commercial bank) be transformed into “banking foundations”.
Credit Co-operatives
Credit co-operatives are active principally in rural areas. They provide savings and loan services including financing of agricultural machinery and supplies. They are also a source of competition.
Brokerage Services
We face competition in our brokerage activities in Spain from brokerage houses of other financial institutions.
Spanish law provides that any investment services company authorized to operate in another Member State of the European Union may conduct business in Spain from an office outside Spain, once the CNMV receives notice from the institution’s home country supervisory authority about the institution’s proposed activities in Spain.
Spanish law provides that credit entities have access, as members, to the Spanish stock exchanges, in accordance with the provisions established by the Investment Services Directive.
We also face strong competition in our mutual funds, pension funds and insurance activities from other banks, savings banks, insurance companies and other financial services firms.
On-line Banks and Insurance Companies
The entry of on-line banks into the Spanish banking system has increased competition, mainly in customer funds businesses such as deposits. Insurance companies and other financial service firms also compete for customer funds.
SUPERVISION AND REGULATION
Bank of Spain and the European Central Bank
The Bank of Spain, which operates as Spain’s autonomous central bank, supervises all Spanish financial institutions, including us. Until January 1, 1999, the Bank of Spain was also the entity responsible for implementing Spanish monetary policy. As of that date, the start of Stage III of the European Monetary Union, the European System of Central Banks and the European Central Bank became jointly responsible for Spain’s monetary policy. The European System of Central Banks consists of the national central banks of the twenty seven Member States belonging to the European Union, whether they have adopted the euro or not, and the European Central Bank. The “Eurosystem” is the term used to refer to the European Central Bank and the national central banks of the Member States which have adopted the euro. The European Central Bank is responsible for the monetary policy of the European Union. The Bank of Spain, as a member of the European System of Central Banks, takes part in the development of the European System of Central Banks’ powers including the design of the European Union’s monetary policy.
84
The European System of Central Banks is made up of three decision-making bodies:
the Governing Council, comprised of the 6 members of the Executive Board of the European Central Bank and the governors of the national central banks of the 1718 Member States which have adopted the euro;
the Executive Board, comprised of the president, vice-president and four other members; and
the General Council of the European Central Bank, comprised of the president and vice-president of the European Central Bank and the governors of the national central banks of the 2728 European Union Member States.
The Governing Council is the body in charge of formulating monetary policy for the euro area and adopting the guidelines and decisions necessary to performensure the Euro system’s tasks.performance of the tasks entrusted to the Eurosystem. The Executive Board is the body in charge of implementing the monetary policy for the euro area laid out by the Governing Council and providing the instructions necessary to carry out monetary policy to the euro area’s national central banks. The General Council is the transitional body which carries out the tasks taken over from the European Monetary Institute which the ECB is required to perform in Stage III of the European Monetary Union on account of the fact that not all EU Member States have adopted the euro yet.
The European Central Bank has delegated the authority to issue the euro to the central banks of each country participating in Stage III. These central banks are also in charge of executing the European Union’s monetary policy in their respective countries. The countries that have not adopted the euro will have a seat in the European System of Central Banks, but will not have a say in the monetary policy or instructions laid out by the governing council to the national central banks.
Since January 1, 1999, the Bank of Spain has performed the following basic functions attributed to the European System of Central Banks:
defining and executing the European Union monetary policy;
conducting currency exchange operations consistent with the provisions of Article 109 of the Treaty on European Union, and holding and managing the States’ official currency reserves;
promoting the sound working of payment systems in the euro area; and
issuing legal tender bank notes.
Notwithstanding the European Monetary Union, the Bank of Spain, as the Spanish national central bank, continues to be responsible for:
maintaining, administering and managing the foreign exchange and precious metal reserves;
promoting the sound working and stability of the financial system and, without prejudice to the functions of the European System of Central Banks, of national payment systems;
placing coins in circulation and the performance, on behalf of the State, of all such other functions entrusted to it in this connection;
preparing and publishing statistics relating to its functions, and assisting the European Central Bank in the compilation of the necessary statistical information;
rendering treasury services to the Spanish Treasury and to the regional governments, although the granting of loans or overdrafts in favor of the State, the regional governments or other bodies referred to in Article 104 of the European Union Treaty, is generally prohibited;
rendering services related to public debt to the State and regional governments; and
advising the Spanish Government and preparing the appropriate reports and studies.
85
The Bank of Spain has the following supervisory powers over Spanish banks, subject to applicable laws, rules and regulations issued by the Spanish Government and its Ministry of Economy and Competitiveness:
to conduct periodic inspections of Spanish banks to test compliance with current regulations concerning, among other matters, preparation of financial statements, account structure, credit policies and provisions and capital adequacy;
to advise a bank’s board of directors and management when its dividend policy is deemed inconsistent with the bank’s financial results;
to undertake extraordinary inspections of banks concerning any matters relating to their banking activities;
to participate with, as the case may be, other authorities in appropriate cases in the imposition of penalties to banks for infringement or violation of applicable regulations; and
to take control of credit entities and to replace directors of credit entities when a Spanish credit entity faces an exceptional situation that poses a risk to the financial status of the relevant entity.
LiquidityCouncil Regulation (EU) No 1024/2013 of October 15, 2013, which came into force November, 3, 2013, confers on the ECB specific functions relating to the prudential supervision of the participating Member States’ credit institutions, without prejudice to the related responsibilities and powers of the competent authorities of these States. The ECB shall have exclusive powers to exercise, for prudential supervisory purposes, inter alia, the following functions in relation to credit institutions established in participating Member States: 1) to authorize credit institutions and, where appropriate, withdraw such authorizations, and to assess notifications of the acquisition and disposal of qualifying holdings in credit institutions, except in the case of a bank resolution, which shall be discussed in detail below; 2) to carry out the tasks which the competent authority of the home Member State shall have under the relevant European Union law in relation to credit institutions established in a participating Member State which wish to establish a branch or provide cross-border services in a non-participating Member State; 3) to ensure compliance with EU legislation and, where appropriate, national legislation, which impose prudential requirements on credit institutions in the areas of own funds requirements, securitization, large exposure limits, liquidity, leverage, and reporting and public disclosure of information on those matters; 4) to carry out supervisory reviews, including where appropriate stress tests, in order to determine whether the arrangements, strategies, processes and mechanisms set in place by credit institutions ensure a sound management and coverage of their risks, and 5) to carry out supervisory tasks in relation to recovery plans, and early intervention where a credit institution or group does not meet or is likely to breach the applicable prudential requirements, or where it is determined that the arrangements, strategies, processes and mechanisms set in place by the credit institution, and the own funds and liquidity that the institution holds, do not ensure a sound management and coverage of their risks. Lastly, the ECB shall adopt guidelines and recommendations, and it shall in particular be subject to binding regulatory and implementing technical standards developed by the EBA and adopted by the Commission, and to the provisions laid down in the European supervisory handbook to be developed by the EBA in accordance with Regulation 1022/2013.
Cash Ratio
European Central Bank regulations require credit institutions in each Member State that participates in the European Monetary Union, including us, to place a specific percentage of their “Qualifying Liabilities” with their respective central banks in the form of interest bearing deposits as specified below (the “Liquidity“Cash Ratio”).
The European Central Bank requires the maintenance of a minimum liquiditycash ratio by all credit institutions established in the Member States of the European Monetary Union. Branches located in the Eurozoneeurozone of institutions not registered in this area are also subject to this ratio, while the branches located outside the Eurozoneeurozone of institutions registered in the Eurozoneeurozone are not subject to this ratio.
“Qualifying Liabilities” are broadly defined as deposits and debt securities issued. The LiquidityCash Ratio is 1% over Qualifying Liabilities except in relation to deposits with stated maturity greater than two years, deposits redeemable at notice after two years, repos and debt securities with a stated maturity greater than two years, for which the ratio is 0%.
Liabilities of institutions subject to the LiquidityCash Ratio and liabilities of the European Central Bank and national central banks of a participating Member State of the European Monetary Union are not included in the base of “Qualifying Liabilities”.
Investment Ratio
The Spanish Government has the power to require credit institutions to invest a portion of certain “Qualifying Liabilities” in certain kinds of public sector debt or public-interest financing (the “Investment Ratio”), and has exercised this power in the past. Although the Investment Ratio has been 0% since December 31, 1992, the law which authorizes it has not been abolished, and the Spanish Government could reimpose the Ratio, subject to EU requirements.
Capital Adequacy Requirements
Spain forms part ofThe regulations known as Basel III, which establish new global capital and liquidity standards for financial institutions, came into force in 2014.
From the capital standpoint, Basel Committee on Banking RegulationsIII redefines what is considered to be available capital at financial institutions (including new deductions and Supervisory Practices. We calculate ourraising the requirements for eligible equity instruments), increases the minimum capital requirements, under this Committee’s criteria. In June 2006 the European Union adopted arequires financial institutions to operate permanently with capital buffers, and adds new regulatory framework (recast of Directives 2006/48/EC and 2006/49/EC, amended by Directives 2009/111/EC and 2010/76/EU) that promotes more risk sensitive approachesrequirements in relation to the determination of minimum regulatory capital requirements in accordance withrisks considered.
The Group shares the New Basel Accord (“Basel II” or “BIS II”). The Law 36/2007 amending Law 13/1985, the Royal Decree 216/2008 published on February 16, 2008, and Bank of Spain’s Circular 3/2008 published on June 10, 2008, partially amended by Circular 9/2010 and Circular 4/2011, introduced these European Directives into the Spanish regulatory framework, and BIS II was incorporated into the Spanish regulations, following its adoptionultimate objective pursued by the European Union. This isregulator with this new framework, namely to endow the current capital regulation in effect. New capital regulation byinternational financial system with greater stability and resilience. In this regard, for many years the European Union (which will be in accordance with Basel III or “BIS III”) is pending implementation, and will be introducedGroup has collaborated on a gradual basis from 2013 to 2019, whenthe impact studies for calibrating the new European Capital Directive and Regulation are developed.
86
The Spanish capital adequacy requirements distinguish between “basic” and “complementary” capital and require certain ratios of basic and total capital to risk-weighted assets. Basic capital generally includes ordinary shares, non-cumulative preferred securities and most reserves, less interim dividends, goodwill and intangible assets, treasury stock and financing for the acquisition (by persons other than the issuer’s employees) of the issuer’s shares. Complementary capital generally includes cumulative preferred securities, revaluation and similar reserves, dated and perpetual subordinated debt, general credit allowances and capital gains. The Group’s total capital is reduced by certain deductions that need to be made with respect to its investments in other financial institutions, insurance and securitization companies.
The computation of both basic and complementary capital is subject to provisions limiting the type of stockholding and the level of control which these stockholdings grant to a banking group. The level of dated subordinated debt taken into account for the calculation of complementary capital may not exceed 50% of basic capital, the level of non-cumulative preferred securities may not exceed 30% of basic capital, the level of step-up preferred securities may not exceed 15% of basic capital and the total amount of complementary capital admissible for computing total capital may not exceed the total amount of basic capital.
The consolidated total capital of a banking group calculated in the manner described above may not be less than 8% of the group’s risk-weighted assets net of specified provisions and amortizations.
As a result of the Basel capital accord issuedrules conducted by the Basel Committee (Basel II)and the European Banking Authority (EBA) and coordinated at local level by the Bank of Spain.
In Europe, the new standards have been implemented through Directive 2013/36/EU, known as the Capital Requirements Directive (“CRD IV”), we calculate ourand the related Capital Requirements Regulation (“CRR”), which is directly applicable in all EU member states (as part of the Single Rulebook). In addition, the standards are subject to Implementing Technical Standards commissioned from the European Banking Authority (EBA), some of which will be issued in the coming months/years.
The Capital Requirements Regulation came into force on January 1, 2014, with many of its rules subject to various implementation timetables. This transitional implementation phase, which affects mainly the definition of eligible capital, concludes at the end of 2017, except with regard to the deduction for deferred tax assets, the transition period for which lasts until 2023.
Subsequent to the transposition of Basel III into European legislation, the Basel Committee has continued to issue additional standards, some in the form of public consultation processes, which will entail a future amendment of CRD IV and the CRR. The Group will continue to support the regulators by offering its opinions and participating in impact studies.
The Group currently has robust capital ratios, in keeping with its business model and risk profile, which, coupled with its substantial capacity to generate capital organically and the gradual implementation timetable envisaged for the new requirements based onin the exposurelegislation, place it in a position to comply with Basel III.
With regard to credit and counterparty risk, market risk and operational risk. Basel II allows two main methods to perform these calculations: standardized or advanced internal models.
The credit risk requirements calculated with standardized models are based on the risk weighted assets calculated on the basis of the quality of the Group’s assets, which mainly depend on their counterparties and guarantees, and the available external agency ratings for those counterparties. Moreover, we have been using, from the outset, advanced internal models to calculate the capital requirements for credit risk of the units with the largest credit risk exposure
The Group intendsis continuing to adopt overits plan to implement the next few years, the Basel II advanced internal ratings-based (“AIRB”)(AIRB) approach under Basel for substantially all its banks, and it intends to do so until the percentage of net exposure of the loan portfolio covered by this approach exceeds 90%. The attainment of this objective in the short term will also depend on the acquisitions of new entities and the need for the various supervisors to coordinate the validation processes for the internal approaches. The Group is present in geographical areas where there is a common legal framework among supervisors, as is the case in Europe through the Capital Requirements Directive. However, in other jurisdictions, the same process is subject to the framework of cooperation between the home and host country supervisors under different legislations, which in practice entails adapting to different criteria and timetables in order to obtain authorization to use the advanced approaches on a consolidated basis.
Accordingly, the Group continued in 20112013 with the project for the progressive implementation of the technology platforms and methodological improvements required for the roll-out of the AIRB approaches. During 2011, inapproaches for regulatory capital calculation purposes at the course of the yearremaining Group units. To date the Group obtained regulatory authorization for various units, most notably Santander Consumer España, Banco Santander (México), S.A., Institución de Banca Múltiple, Grupo Financiero Santander and the global corporate customer portfolios in Brazil and Chile. In addition, in 2008 the Grouphas obtained authorization from the supervisory authorities to use advanced approaches for the calculation of regulatory capital requirements for credit risk for the Parent, and the main subsidiaries in Spain, the United Kingdom and Portugal.Portugal, certain portfolios in Mexico, Brazil and Chile, as well as for Santander Consumer Finance in Spain and the United States. The Group’s Basel implementation strategy is focused on obtaining authorization for the use of AIRB approaches at the main entities in the Americas and at consumer banking entitiesEurope.
With regard to operational risk, the Group currently uses the standardized approach for regulatory capital calculation purposes and has embarked on a project to roll out AMA approaches once it has collated sufficient data using its own management model. The Group considers that the internal model should be developed primarily on the basis of the experience accumulated in Europe.managing an entity through the corporate guidelines and criteria established after assuming control, which are a distinctive feature.
As regards the other risks explicitly addressed in Pillar I of the Basel Capital Accord, the Grupo Santander wasGroup has been authorized to use its internal model for market risk with respect toon the treasury area’sareas’ trading activities in MadridSpain, Chile, Portugal and the Chile and Portugal units,Mexico, thus continuing implementation of the roll-out plan it submitted to the Bank of Spain for the other units.
With regardrespect to operational risk,Pillar II, the Group considersuses an economic capital approach to quantify its global risk profile and its capital adequacy position as part of the internal capital adequacy assessment process (ICAAP) at consolidated level. This process includes regulatory and economic capital planning under several alternative economic scenarios, in order to ensure that the internal model should be developed primarily on the basiscapital adequacy targets are met even in plausible but highly unlikely adverse scenarios. The ICAAP exercise is supplemented with a qualitative description of the experience accumulatedrisk management and internal control systems, is reviewed by internal audit and internal validation teams and is subject to a corporate governance structure that culminates in managingits approval by the entity throughGroup’s board of directors, which also establishes the corporate guidelinesstrategic factors relating to risk appetite and criteria established after assuming control, which are a distinctive featurecapital adequacy targets on an annual basis.
In accordance with the capital requirements set by the European Directive and Bank of Grupo Santander.Spain rules, the Group publishes its Pillar III disclosures report on an annual basis. This report comfortably meets the market transparency requirements in relation to Pillar III. The Group has made numerous acquisitions in recent years and, as a result, a longer maturity period willconsiders the market reporting requirements to be required to develop the internal model based on its own management experience of the various acquired entities. However, although the Group has decided to use the standardized approach for regulatory capital calculation purposes, it is considering the possibility of adopting Advance Measurement Approach (AMA) approaches once it has collected sufficient data using its own management modelfundamental in order to make full usecomplement the minimum capital requirements of Pillar I and the positive qualities that are characteristic ofsupervisory review process performed through Pillar II. In this respect, its Pillar III disclosures report incorporates the Group.
87
Also, Royal Decree-Law 2/2011, approved on February 18, 2011, established the implementing regulations of the plan to strengthen the financial sector published in January 2011recommendations made by the Spanish Ministry of Economy and Competiviveness, which aimed, among others, to establish certain minimum requirements for core capital, in advance of those established by Basel III, to be met before autumn 2011. At the reporting date, the Group had complied with these minimum core capital requirements.
Furthermore, in December 2011 the European Banking Authority (“EBA”) published(EBA), thus making Santander Group an international benchmark in terms of market transparency, as is already the case with its annual report.
Parallel to the roll-out of advanced approaches at the various Group units, Santander Group is carrying out an ongoing training process on Basel at all levels of the organization, covering a significant number of professionals from all areas and divisions, with a particular focus on those most affected by the changes arising from the adoption of the new international capital requirements for the main European credit institutions. These requirements are part of a package of measures adopted by the European Council in the second half of 2011 with the aim of restoring stability and confidence in the European markets.
At June 30, 2012, the institutions selected for the EBA sample must have a Tier 1 core capital ratio, determined on the basis of EBA rules of at least 9%. These capital requirements are expected to be of an exceptional and temporary nature.
The EBA published the capital requirements of each credit institution and required them to submit, on January 20, 2012, their capital plans to reach the required ratio by June 30, 2012.
The EBA estimated a €15,302 million capital shortfall for the Santander Group. In January 2012, the Group reported the measures it had taken -detailed in its capital plan submitted to the Bank of Spain- and which had enabled it to attain the required 9% ratio. These capital raising measures are summarized as follows: i) €6,829 million relating toValores Santander -securities that are mandatorily convertible before the end of October 2012; ii) the exchange of €1,943 million of preference shares for new shares in December 2011; iii) €1,660 million from application of theSantander Dividendo Elección program at the date of the final dividend for 2011; and iv) €4,890 million obtained through the organic generation of capital, write-downs and the transfer of various ownership interests, most notably those held in Chile and Brazil.standards
At December 31, 2011,2013, our eligible capital exceeded the minimum required by the Bank of Spain by over €22.8€23.3 billion. Our Spanish subsidiary banks were, at December 31, 2011,2013, each in compliance with these capital adequacy requirements, and all our foreign subsidiary banks were in compliance with their local regulations.
The calculation of the minimum capital requirements under the new regulations, referred to as Pillar I, is supplemented by an internal capital adequacy assessment process (“ICAAP”) and supervisory review, referred to as Pillar II. In the case of the Group, the ICAAP is based on an internal model which is used to quantify the economic capital required, given the Group’s global risk profile, to maintain a target AA rating. Lastly, Basel II regulations establish, through Pillar III, strict standards of transparency in the disclosure of risk information to the market.
Concentration of Risk
Spanish banks may not have exposure to a single person or group in excess of 25% of the bank’s own funds. Where that customer is a credit institution or investment firm, or where the economic group includes one or more credit institutions or investment firms, the value of all exposures may not exceed 25% of the bank’s own funds or €150 million, whichever the higher, provided that the sum of exposure values to all customers in the economic group that are not credit institutions or investment firms does not exceed 25% of the bank’s own funds. Any exposure to a person or group exceeding 10% of a bank’s own funds is deemed a concentration (excluding exposures to the Spanish government,Government, the Bank of Spain, the European Union and certain other exceptions).
Legal Reserve and Other Reserves
Spanish banks are subject to legal and other restricted reserves requirements. In addition, we must allocate profits to certain other reserves as described in Note 33 to our consolidated financial statements.
Allowances for Credit Losses and Country-Risk
For a discussion relating to allowances for credit losses and country-risk, see “—Classified Assets—Bank of SpainSpain’s Classification Requirements” herein.
Employee Pension Plans
At December 31, 2011,2013, our pension plans were all funded according to the criteria disclosed in Note 25 to our consolidated financial statements.
88
Restrictions on Dividends
We may only pay dividends (including interim dividends) if such payment is in compliance with the Bank of Spain’s minimum capital requirement (described under “—Capital Adequacy Requirements” herein) and other requirements or, as described below, under certain circumstances when we have capital that is 20% or less below the Bank of Spain’s minimum capital requirements.
If a banking group meets this capital requirement, it may dedicate all of its net profits to the payment of dividends, although in practice Spanish banks normally consult with the Bank of Spain before declaring a dividend. Even if a banking group meets the capital requirement as a group, any consolidated Spanish credit entity that is a subsidiary that does not meet the capital requirement on its own will be subject to the limitations on dividends described below. If a banking group or any Spanish credit entity subsidiary of the group has capital that is 20% or less below the Bank of Spain’s minimum capital requirement, it must devote an amount of net profits determined by the Bank of Spain to reserves, and dividends may be paid out of the remainder only with the prior approval of the Bank of Spain. If the capital is 20% or more, or its basic capital is 50% or more, below the minimum requirement, it may not pay any dividends and must allocate all profits to reserves unless otherwise authorized by the Bank of Spain. In the case of a banking group failing to meet the capital requirement, however, the Bank of Spain can authorize that the consolidated subsidiaries in the group pay dividends without restriction, so long as they are at least 50% owned by group companies and, if they are credit entities, independently comply with the capital requirement.
If a bank has no net profits, its board of directors may propose at the general meeting of shareholders that a dividend be declared out of retained earnings. However, once the board of directors has proposed the dividend to be paid, it must submit the proposal to the Minister of Economy and Competitiveness who, in consultation with the Bank of Spain, may in his discretion authorize or reject the proposal of the board.
Compliance with such requirements notwithstanding, the Bank of Spain is empowered to advise a bank against the payment of dividends on solvency and soundness grounds. If such advice is not followed, the Bank of Spain may require that notice of such advice be included in the bank’s annual report registered before the Mercantile Register. In no event may dividends be paid from certain legal reserves.
Interim dividends of any given year may not exceed the net profits for the period from the closing of the previous fiscal year to the date on which interim dividends are declared. In addition, the Bank of Spain recommends that interim dividends not exceed an amount equal to one-half of all net income from the beginning of the corresponding fiscal year. Although banks are not legally required to seek prior approval from the Bank of Spain before declaring interim dividends, the Bank of Spain has asked that banks consult with it on a voluntary basis before declaring interim dividends.
In February 2014 the IMF recommended that the Bank of Spain limit the amount of dividends payable in cash in 2014 by Spanish banking institutions to 25% of such bank’s attributable profits. The Bank of Spain has given this recommendation to the Spanish banking institutions. Limitations On Types Of Business
Spanish banks generally are not subject to any prohibitions on the types of businesses that they may conduct, although they are subject to certain limitations on the types of businesses they may conduct directly.
The activities that credit institutions authorized in another Member State of the European Union may conduct and which benefit from the mutual recognition within the European Union are detailed in article 52 of Law 26/1988 (July 29, 1988).
Deposit Guarantee Fund
The Deposit Guarantee Fund on Credit Institutions (“(Fondo de Garantía de Depósitos”, or the “FGD”), which operates under the guidance of the Bank of Spain, guarantees in the case of the Bank and our Spanish banking subsidiaries: (i) bank deposits up to €100,000 per depositor; and (ii) securities and financial instruments which have been assigned to a credit institution for its deposit, register or for other such services, up to €100,000 per investor. The FGD may also take actions aimed at strengthening the solvencyLaw 9/2012, of November 14, on restructuring and the functioningdissolution of credit institutions. Thus,entities (which enacts all the provisions of the Royal Decree-law 24/2012, of 31 August), which has strengthened the position of the Fund for the Orderly Restructuring of the Banking Sector(Fondo de Restructuración Ordenada Bancaria or “FROB”) giving it a prominent role within the restructuring and resolution processes of credit entities, clarified the role of the FGD, being now limited to guaranteeing deposits. However, taking into account the principle of minimal capital impact, the FGD may take preventive and consolidation measuresparticipate in the following cases: (i) when the situation of a credit institution is such that the FGD is expected to have to pay, (ii) in the case of the restructuring of a credit institution, or (iii) to fulfillresolution proceedings by granting financial support measures in order to strengthen own funds of the entity, all in accordance with the plan of action approved by the Bank of Spain, if any.
89
The actions contained in the corresponding plan of action can be: (1) financial support, which may include non-refundable funds, loans granted on favorable terms by the FGD for the acquisition of damaged assets, and any other financial support; (2) capital restructuring of the entity, which may involve, among others, facilitiating mergers with other entities of recognized solvency or transfer of its business to another credit institution and the subscription by the FGD of capital increases; and (3) management measures which may result in improving the organization and internal control systems of the entity.exceptional cases.
The FGD is funded by annual contributions from member banks. The amount of such bank’s contributions will not exceed 3 per thousand of the year-end amount of deposits to which the guarantee extends depending of the kind of credit institution. Nevertheless, further contributions will be suspended when the FGD’s funds exceed the requirement by 1% or more of the calculation basis.
As of December 31, 2011,2013, the Bank and its domestic bank subsidiaries were members of the FGD and thus were obligated to make annual contributions to it.
The Bank participates in the Deposit Guarantee Fund. The contributions made by the Bank to this Fund amounted to €260 million in 2013 (€156 million at the end of 2012). These contributions include the amounts incurred in 2013 in relation to the extraordinary contribution to be made based on the deposits as of December 31, 2012 established in Additional Provision Five of Royal Decree-Law 21/2012, of July 13, on liquidity measures of Public Authorities and in the financial sector, as determined by Article 2 of Royal Decree-Law 6/2013, on protection of holders of certain savings and investment products and other financial measures.
Data Protection
Law 15/1999, dated December 13, 1999, establishes the requirements relating to the treatment of customers’ personal data by credit entities. This law requires credit entities to notify the Spanish Data Protection Agency prior to creating files with a customer’s personal information. Furthermore, this law requires the credit entity to identify the persons who will be responsible for the files and the measures that will be taken to preserve the security of those files. The files must then be recorded in the Spanish Data Protection General Registry, once compliance with the relevant requirements has been confirmed. Credit entities that breach this law may be subject to claims by the interested parties before the Spanish Data Protection Agency. The Data Protection Agency, which has investigatory and sanctioning capabilities, is the Spanish Authority responsible for the control and supervision of the enforcement of this law.
Recent Legislation
Law 3/2009 of April 3 on structural modifications of commercial companies (Ley sobre modificaciones estructurales de las sociedades mercantiles), entails a profound reform of our legal system in various areas of Spanish corporate law:
(i) cross-border mergers and international transfers of a corporation’s registered office are regulated;
(ii) rules applicable to corporate restructuring transactions of the different types of commercial companies are unified;
(iii) the quantitative limitations for the acquisition of treasury stock by public limited companies are extended (10% for listed companies and 20% for unlisted companies); and
(iv) preemptive rights are abolished in the case of non-monetary contributions, preemptive rights of the holders of convertible debentures are eliminated, and the ability to exclude preemptive rights of the shareholders for the issuance of convertible debentures is expressly provided.
Law 2/2010 of March 1 transposes certain European Union Directives in the field of indirect taxation and amends the Non-residents Income Tax Law, mainly with respect to taxation of residents in the European Union.
Law 39/2010 of December 22 on the 2011 General State Budget has introduced some reforms in the tax system. The most significant changes are an increase in the maximum marginal rate from 43% to 45% in the Personal Income Tax and the establishment of additional limitations on the deduction for investment in housing, the elimination in the Corporate Income Tax of the deductibility of goodwill amortization in the acquisition of shares in companies resident in the European Union with effect from December 21, 2007, and the amendment of the applicable tax regime to capital reductions made by SICAVs.
90
Law 10/2010 of April 28 on prevention of money laundering and financing of terrorism, which transposes into Spanish Law Directive 2005/60/EC of the European Parliament and of the Council of October 26, 2005, repeals Law 19/1993 of December 28 on certain measures to prevent money laundering and amends Law 12/2003 of May 21 on prevention of financing of terrorism and Law 19/2003 of July 4 on the legal regime governing capital movements and cross-border transactions and on certain measures to prevent money laundering.
Royal Decree 712/2010 of May 28, 2010, on the legal regime governing payment services and payment institutions implements Law 16/2009 of November 13, 2009 on payment services and the general obligations in this area and Ministerial Order EHA/1608/2010 of June 14, 2010 on transparency in the terms of transactions and other information requirements applicable to payment services.
Royal Decree 749/2010 of June 7, which came into force on June 9, 2010, amended the implementation of Law 35/2003 of November 4, 2003, on Collective Investment Schemes approved by Royal Decree 1309/2005 of November 4, 2005, and other regulations in the tax field. The Royal Decree 749/2010 makes more flexible the legal regime governing exchange-traded funds and real estate collective investment schemes, introduces the concept of special-purpose collective investment schemes and implements amended regulations on non-resident income tax, corporate income tax and personal income tax, including an exemption from the obligation to made withholdings from or prepayments on account of income derived from the transfer or redemption of shares or equity holdings in exchange-traded funds or exchange-traded index open-end investment companies.
Law 12/2010 of June 30, amends Law 19/1988 of July 12 on auditing, Law 24/1988 of July 28 on the securities market and Royal Decree 1564/1989 of December 22 and revises the Corporations Act to adapt it to the European Directive 2006/43 EC. This law is aimed to modify certain aspects of previous regulations in order to adapt it to changes in business law and to include technical improvements recommended by the recent auditing experience and practice.
Legislative Royal Decree 1/2010 of July 2 enacted the consolidated text of the Spanish Corporate Enterprises Act and came into force on September 1, 2010. The Spanish Corporate Enterprises Act replaces Private Limited Companies Law 2/1995 of March 23, Legislative Royal Decree 1564/1989 of December 22 enacting the consolidated text of the Public Limited Companies Law, Title X of Securities Markets Law 24/1988 of July 28 on listed companies and Book II, Title I, Section 4 of the Commercial Code enacted by decree of August 22, 1985. This consolidated text contains the whole legislation which has been recast and came into force on September 1, 2010, except for its article 515 on clauses limiting voting rights which applies since July 1, 2011.
Law 15/2010 of July 5 amending Law 3/2004 of December 29 on measures to avoid late payment in commercial transactions and Law 30/2007 of October 30 on public sector contracts, aims to foster competitiveness and achieve balanced growth of the Spanish economy, in line with a strategic view of a sustainable economy.
Royal Decree 1282/2010 of October 15 on the regulation of official secondary markets in futures, options and other financial derivatives, aims to improve competitiveness, and to reduce the systemic risk associated with the settlement and clearance of financial derivative contracts, and repeals the prior regulation seeking an increase in the number of products that can be traded and registered on these markets. This new regime also allows the governing company of the respective market to offer central counterparty services and establishes a new system for the contribution of guarantees by market members.
Organic Act 5/2010 of June 22 on reform of the Penal Code entered into force on December 23, 2010. The main reform introduced is that a legal entity is criminally liable: i) for crimes committed in the name or on behalf of the legal entity, and for the benefit thereof, by its legal and administrative representatives in fact or under law; and ii) for crimes committed in the conduct of corporate activities and on behalf and for the benefit thereof by those who, while subject to the authority of the legal and administrative representatives in fact or under law, have been able to perform such acts due to a failure to exercise due control over them, taking into account the specific circumstances of the case.
Law 6/2011 of April 11, 2011 amended Law 13/1985 of May 25, 1985 on investment ratios, own funds and reporting requirements for financial intermediaries, Law 24/1988 of July 28, 1988 on the securities market and Legislative Royal Decree 1298/1986 of June 28, 1986 on the adaptation of current regulatory credit institutions law to EU legislation. The purpose of this Law is to commence transposition of Directive 2009/111/EC of the European Parliament and of the Council of September 16, 2009 amending Directives 2006/48/EC, 2006/49/EC and 2007/64/EC as regards banks affiliated to central institutions, certain own funds items, large exposures, supervisory arrangements and crisis management. In connection with this, Royal Decree 771/2011 of June 3, 2011 amended Royal Decree 216/2008 of February 15, 2008 on financial institutions’ own funds and Royal Decree 2606/1996 of December 20, 1996 on credit institutions deposit guarantee funds. The most noteworthy developments from this financial regulation are (i) that it makes it compulsory for credit institutions and investment firms to meet certain requirements to allow them to assume exposures to securitization positions and to initiate such securitization; (ii) adapts the legal regime governing credit institution preference shares to conform international requirements ensuring accordingly that they are an effective instrument for meeting solvency requirements; (iii) changes the limit on large exposures of credit institutions generally maintaining it such that the value of that exposures of a credit institution to a customer (entity or economic group) may not exceed 25% of its own funds; (iv) changes the risk management policy of credit institutions, especially that regarding liquidity risk, and sets up new credit institution remuneration policies; (v) strengths the competence and cooperation between supervisors; and (vi) amends the legislation on credit institution deposit guarantee funds, introducing a new regime for additional contributions to these funds based on the remuneration of the deposits in them. Circular 4/2011, of November 30, 2011, of the Bank of Spain, which amended Circular 3/2008, of May 22, 2008, on the determination and control of minimum own funds, completed the transposition of EU legislation on own funds in force at that time. This transposition was initiated with Sustainable Economy Law 2/2011 of March 4, 2011 and followed up by Law 6/2011 of April 11, 2011, which amended Law 13/1985 of May 25, 1985 on investment ratios, own funds and reporting requirements for financial intermediaries, Law 24/1988 of July 28, 1988 on the securities market and Legislative Royal Decree 1298/1986 of June 28, 1986 on the adaptation of current credit institution law to EU legislation, and, finally, by Royal Decree 771/2011 of June 3, 2011 amending Royal Decree 216/2008 of February 15, 2008 on the own funds of financial institutions.
91
Law 7/2011 of April 11, 2011 amended Law 41/2009 of November 12, 1999 on payment and securities settlement systems and Royal Decree-Law 5/2005 of March 11, 2005 on urgent reforms to boost productivity and improve public procurement. The purpose of this Law is to transpose Directive 2009/44/EC of the European Parliament and of the Council of May 6, 2009 amending Directive 98/26/EC on settlement finality in payment and securities settlement systems and Directive 2002/47/EC on financial collateral arrangements as regards linked systems and credit claims. More specifically, this Law is intended to recognize so-called interoperable systems and extend to them the legislation on settlement finality of credit transfer orders given through these systems. The main changes introduced by this law are (i) updates to the definition of “credit transfer order” and (ii) an extension to interoperable systems the rules on the irrevocability and finality of settlement of transfer orders given through such systems and to extend to these interoperable systems the legal regime under Law 41/2009 for insolvency of a system participant the procedures establishes and the effects on transfer orders and on collateral.
Law 15/2011 of June 16, 2011, which came into force last June 18, 2011, amended certain financial legislation applying to the Spanish legal system Regulation 1060/2009 of the European Parliament and of the Council of September 16, 2009 on credit rating agencies, and was aiming at establishing the obligation for certain financial institutions (specifically, credit institutions, investment firms, mortgage securitization special purposes entities and collective investment institution custodians) to use the ratings issued by credit ratings agencies, which, from the standpoint of solvency, shall require that these have been issued or endorsed by an ESMA established in the European Union and registered according to Regulation 1060/2009.
Law 16/2011 of June 24, 2011 on credit agreements for consumers, which transposed into Spanish Law Directive 2008/48/EC of the European Parliament and of the Council of April 23, 2008 on credit agreements for consumers and repealed Law 7/1995 of March 23, 1995 on consumer credit, and came into force on September 25, 2011, is basically intended to improve consumer information and applies to those contracts whereby a creditor grants to a consumer credit in the form of a deferred payment, loan, credit line or other similar financial accommodation.
Law 21/2011 of July 26, 2011 on electronic money establishes a new regulatory framework for electronic money institutions and for the issuance of electronic money, which partially transposed Directive 2009/110/EC of September 16, 2009 on the taking up, pursuit and prudential supervision of the business of electronic money institutions amending Directive 200/46/EC of September 18, 2000.
Law 25/2011 of August 1, 2011, which entered into force on October 2, 2011, partially amends the Spanish Corporate Enterprises Act and transposes Directive 2007/36/EC of the European Parliament and of the Council dated July 11, 2007. The most important novelties of the law areare: (i) the recognition of the company’s electronic corporate address or corporate website for legal corporate purposes; (ii) the introduction of appraisal rights for dissenting shareholders in the event a substantial amendment to the corporate purposes and in the event of non-listed companies not distributing a third of distributable profits “derived from activities within their core corporate purpose” from their fifth year of the existence; (iii) the possibility for companies to introduce additional circumstances in the articles of association which would grant the company the right to forcibly redeem the shares of such shareholders; and (iv) other amendments of the Spanish Corporate Enterprises Act in relation to the winding-up and liquidation of all form of companies and the general shareholders meeting.
92
Royal Decree Law 16/2011 of October 14, 2011, as amended by Royal Decree Law 19/2011 of December 2, 2011, which came into force on October 15, 2011, establishes the Deposit Guarantee Fund for Credit Institutions, which replaces the three existing funds up to then and consolidates the existing funds in into the Single Deposit Guarantee Fund for Credit Institutions; and (ii) increases the possibility of improving the solvency of the affected institutions, expanding the situations in which the Fund may act.
Royal Decree-Law 9/2011 of August 19, provides certain temporary measures which affect corporate income tax, increasing the rate applied to determine the interim payments to be filed by certain large companies from October 2011 to December 2013; limiting for tax years 2011 to 2013 the maximum amount of carried forward tax losses that can be offset to 75% of the taxable base for companies whose turnover within the 12 months preceding the beginning of the tax year is between 20 and 60 million euros, and to 50% if such turnover is over 60 million euros; and reducing in those years the deduction for financial goodwill to a maximum annual limit of 1%. In addition, effective for tax periods beginning as of January 1 2012, the maximum period for offsetting tax losses from previous years is extended from 15 to 18 years.
Royal Decree-Law 13/2011, of September 16, temporarily restores the wealth tax for 2011 and 2012, abolishing the existing 100% tax rebate, and increases the value of the exemption for dwelling houses to €300,000 and the general tax-free amount to €700,000, extending this general tax-free amount to non-residents in Spain.
Law 31/2011, of October 4, 2011, amended Collective Investment Institutions Law 35/2003 of November 4 in order to adapt it to recent EU legislation. It introduced certain technical improvements and various qualifications in respect of the requirements for taking up and pursuing the activity of Collective Investment Institutions and also the “Community passport” for the cross-border management of investment funds, as envisaged by Directive 2009/65/EC.
Law 32/2011, of October 4, 2011, which came into force on October 6, 2011, amended Law 24/1988, of July 28, on the Securities Market, and is intended, among other aspects, to reform securities clearing, settlement and registration arrangements. The Law 32/2011 imposed the obligation to carry out all equity transactions traded, in both, official secondary markets and multilateral trading systems through a central counterparty. Likewise, it removed the references to the mechanism for ensuring delivery allowing, ultimately, for cash settlement when securities cannot be obtained. In addition, Law 32/2011 sets up the basis of the regulatory regime of the central counterparty, establishing, among others: (i) the obligation to take the form of public limited company; (ii) the need to be authorized by the Ministry of Economy and Finance; (iii) that it will be subject to the supervisory regime of Spanish Securities Exchange Commission (CNMV) and Bank of Spain; (iv) that it will be subject to the significant shareholding regime of Law 24/1988, of July 28, on the Securities Market; (v) regulation of the committees that will form part of the central counterparty; and (vi) regulation of the insolvency of the central counterparty, any of its members or any client of a member. The Law 32/2011 also amended IBERCLEAR’s regulatory regime in connection with: (i) new corporate law rules that will facilitate the relationship between IBERCLEAR and the other agents of the trading and post-trading system and (ii) the regulation on the agreements that IBERCLEAR may carry out is completed to provide a better coverage to the TARGET2-Securities project.
Royal Decree 1360/2011 of October 7, 2011, amending Royal Decree 1816/1991 of 20 December 1991, on cross-border economic transactions, and Ministerial Order EHA 2670/2011 of 7 October 2011, amending the Order dated December 27, 1991, which implemented Royal Decree 1816/1991, was aimed at aligning Spanish regulations in this area to those in force in practically all the Member States, and at acting in anticipation of the forthcoming reform of Regulation 924/2009, of the European Parliament and of the Council of September 16, 2009 on cross-border payments in the Community. Apart from certain improvements in aspects relating to the accreditation of resident and non-resident status, the main content of the recent regulations amended the reporting system for statistical purposes of cross-border economic transactions. Under the previous system, entities had to identify transactions entailing a cross-border payment, demanding data of customers to complete the information on the transactions in which they were taking part, and to submit such information to the Bank of Spain. The new regulations eliminated the obligation to submit that information which is not immediately available to them and automatable. Furthermore, for those making cross-border transactions, the obligation is included to furnish the information that the Bank of Spain may require of them. The Royal Decree and the Order became effective on June 1, 2012.
Law 38/2011, of October 10, 2011, reforming Insolvency Law 22/2003 of July 9, which became effective on January 1, 2012, introduces a series of amendments in order to correct errors of approach detected in practice and to update the attendant regulations on the basis of the experience and the application thereof. It also affords insolvency proceedings greater legal certainty; the opening up of alternatives which seek to strike a balance between the firm’s viability and the necessary legal guarantees; the promotion of electronic media, and simplified and more flexible proceedings.
Royal Decree-Law 9/2012, of March 16, 2012, on simplification of reporting and documentation requirements in the case of mergers and divisions of share capital companies amended the consolidated text of the Share Capital Companies Law enacted by Legislative Royal Decree 1/2010 of July 2, 2010 and Law 3/2009 of April 3, 2009 on structural changes to companies, aiming at transposing into Spanish law Directive 2009/109/EC of the European Parliament and of the Council of September 16, 2009 amending Council Directives 77/91/EEC, 78/855/EEC and 82/891/EEC, and Directive 2005/56/EC regarding reporting and documentation requirements in the case of mergers and divisions. The Royal Decree-Law 9/2012 became effective on March 18, 2012. Law 1/2012, of June 22, 2012, on simplification of reporting and documentation requirements in the case of mergers and divisions of share capital companies, repealed Royal Decree-Law 9/2012 of March 16, 2012.
Royal Decree 778/2012 of May 4, 2012, on the legal regime for electronic money institutions (ELMIs), implementing Law 21/2011 of July 26, 2011 on electronic money, established a new regulatory framework for ELMIs and the issuance of electronic money. This Royal Decree completed the transposition of Directive 2009/110/EC of September 16, 2009 on the taking up, pursuit and prudential supervision of the business of ELMIs amending Directives 2005/60/EC of October 26, 2005 and 2006/48/EC of June 14, 2006 and repealing Directive 2000/46/EC of September 18, 2000. The Royal Decree became effective on May 6, 2012.
Royal Decree 1336/2012, of September 21, 2012 amended certain royal decrees relating to the powers of European Services Authorities (“ESAs”). This Royal Decree, which completes the transposition of Directive 2010/78/EU of the European Parliament and of the Council of November 24, 2010, incorporates into Spanish law the obligation of the competent authorities (Bank of Spain and CNMV) to cooperate with, inform and communicate with their European counterparts (the European Banking Authority (EBA) and the European Securities and Markets Authority (ESMA)) on certain matters, some of which were initially regulated in Royal Decree-Law 10/2012 of March 23, 2012 amending certain financial legal provisions relating to the powers of the ESAs, and which are now addressed in their respective implementing provisions.
Royal Decree 1082/2012 of July 13, 2012, approved the implementing Regulations of Collective Investment Institutions (CIIs) Law 35/2003 of November 4, 2012, ended by Law 31/2011 of October 4, 2012. It also repealed the previous regulations in Royal Decree 1309/2005 of November 4, 2005. Among other things, the Royal Decree includes the amendments recently made by Law 31/2011 to Law 35/2003 and advances the transposition of EU legislation. The Royal Decree became effective on July 21, 2012.
Royal Decree-Law 20/2012 of July 13, 2012 on measures to ensure budgetary stability and the promotion of competitiveness which, among other reforms, amended Law 24/1988 of July 28, 1988 on the Securities Market (and Law 44/2002 of November 22, 2002 on financial system reform measures) to include a new financial instrument in the Spanish legal system, the so-called “internationalization covered bonds” (cédulas de internacionalización). These bonds are similar to “territorial covered bonds” (cédulas territoriales), introduced by Law 44/2002 and are fixed-income securities that may be issued by credit institutions, whose capital and interest are especially secured by loans and credits granted for the internationalization of companies. The total amount of internationalization covered bonds issued by a credit institution may not exceed 70% of the amount of the unrepaid “eligible” loans and credits.
The Royal Decree-Law 20/2012 also introduces new tax measures on a range of taxes which, in some cases, amends or expands the reforms previously introduced by the Royal Decree-Law 9/2011, 20/2011 and 12/2012. The following are the most important tax measures in the Corporate Income Tax: (i) In 2012 and 2013 the offsetting of negative tax bases generated in previous years will be restricted to 50% for those entities whose turnover during the previous year was between €20 million and €60 million (the figure was previously 75%) and to 25% if the turnover exceeds €60 million (previously 50%). Over this same period, the deduction for goodwill arising from acquisitions of businesses will be subject to the maximum annual limit of 1% of the related amount (5% previously) (ii) Likewise, for fiscal years 2012 and 2013, the ceiling on the tax deduction for intangible fixed assets with an indefinite useful life is reduced from 10% to 2%. Regarding indirect taxation, as from September 1, 2012, the Royal Decree-Law also sets up that the standard rate of VAT increases from 18% to 21%, the reduced rate from 8% to 10%, and the super-reduced rate is held at 4%, which is applicable to staple goods and services. Certain goods and services hitherto taxed at the reduced rate (8%) will now be taxed at the standard rate (21%). Finally, the tax rate applicable to the delivery of housing units is maintained at 4% until December 31, 2012.
Law 16/2012, of December 27, by which different tax measures are adopted in the aim of consolidating public finances and the impulse of the economic activity (the Tax Measures Act). The following are the most significant measures in the Corporate Income Tax: the legal and tax regime of Real Estate Investment Trusts (SOCIMI) has been modified; the tax neutrality regime has been broadened to cover certain transactions of restructuring and winding-up of credit institutions; and, only with effect for fiscal years starting in 2013 and 2014, the tax depreciation of fixed tangible and intangible assets and real estate properties has been limited for large sized companies to 70% of the amount that would have been tax deductible before the limitation. The Law also creates the “tax on deposits at credit institutions”, aimed to tax deposits of all types placed at credit institutions throughout the country, though an initial tax rate of 0% has been established. Additionally, this Law has extended the enforcement of Wealth Tax for tax year 2013.
Law 7/2012, of October 29, which amends taxation and budgetary regulations and adapts financial regulation to permit increased action to prevent and combat fraud. Among other measures, it introduces the obligation for Spanish tax residents (whether they are private people or companies located in Spain) to make a tax declaration informing of all the assets they might have abroad, and limits to €2,500 the amount for cash transactions involving a professional or a business. In the VAT, new cases of reverse VAT charge are included in the supply of real estate where certain exemptions are waived, or the supply derives from the execution of a guarantee imposed on that property. In addition, article 108 of the Stock Exchange Law (Law 24/1988), regarding indirect taxation in the transfer of securities of companies that hold real estate assets, has been modified and simplified reducing its scope and being characterized as an anti-abuse provision.
Organic Law 7/2012, of December 27, on the amendment of the Criminal Code with respect to transparency and fighting tax and social security fraud. The reform includes an increase of the penalties and an extension to ten years in the statute of limitations for those who commit tax fraud when the quota exceeds €600,000 defrauded, fraud is done through a criminal group or organization, or the tax fraud is committed by the interposition of entities, business, tax havens or tax-free jurisdictions. The reform also contemplates the possibility of mitigating a penalty where the alleged tax offender admits the commission of the offence and pays the tax liability due.
On January 14, 2013 the U.S. and the Kingdom of Spain signed a protocol amending the Tax Treaty, which needs to be ratified by both countries and will enter into force three months following the later of the dates on which any of the countries give notice that their internal procedures for entry into force have been fulfilled. Among the most significant changes included in the Tax Treaty was the elimination of the taxation at source for interest, royalties and for dividends if the beneficial owner is a company that has owned shares in the last year representing 80% of the voting capital (withholding will be 5% if the recipient does not reach that percentage, but at least 10%). Capital gains will not be subject to taxation at source, unless they derive from the sale of real estate or companies whose assets consist mainly of real estate.
Law 17/2012 of December 27, 2012 on the State Budget for 2013 authorized the Minister for Economic Affairs and Competitiveness to increase State debt for year 2013 with the limitation that the outstanding balance at the end of the year may not exceed that on January 1, 2013 by more than €71 billion. The collective action clauses (CAC) that apply as of January 1, 2013 to all issues of public debt with a maturity of more than a year are a set of clauses aggregating representative majorities among bondholders. In the event of a proposed modification of debt instruments’ conditions, this avoids the need to obtain unanimity among all bondholders and thus makes it possible to adopt binding modifications, avoiding a minority’s being able to block solutions approved by the majority. This allows, for example, the bonds’ terms governing their issue or management to be modified with the prior consent of the issuer and a vote in favor by at least 75% of the total principal of the bonds in circulation represented by a duly called meeting of bondholders, or a written resolution signed by or on behalf of the holders of at least 66% of the total principal of the bonds in circulation. The instruments and issue mechanisms used for State debt have, however, been left broadly unchanged. Thus, ordinary and special auctions (competitive and non-competitive bids) and other procedures will continue to be used for issues. In particular, issues may be granted, in whole or in part, to one or more financial institutions to ensure their placement. Outright sales or the sale under repos of newly issued securities or expanded existing issues that the Treasury might have in its securities account may also be performed.
On February 23, 2013, came into force the Royal Decree-Law 4/2013 on measures to support entrepreneurs and stimulate growth and job creation. The main changes from the financial and fiscal standpoint are: a) The measures to promote business finance include an amendment to the Regulations on the organization and supervision of private insurance, enacted by Royal Decree 2486/1998 of November 20, 1998, to allow insurance undertakings to invest in shares admitted to trading on the alternative stock market (MAB) or any other multilateral trading facility, and in venture capital funds, and that these investments be eligible as part of their technical provisions. Similarly, the regulations on pension schemes and pension funds, enacted by Royal Decree 304/2004 of February 20, 2004, have been amended to allow pension funds to invest in these securities. In both cases, a specific maximum limit of 3% of insurance undertakings’ total technical provisions, or of the pension funds’ total assets, in the securities of a single entity is established. This ceiling rises to 6% when they are issued or backed by entities belonging to the same group; b) Another measure to encourage non-bank finance of share capital companies is the elimination of the limit set in the Law on Share Capital Companies. This relaxation of the rules will only be applicable in the case of issues aimed at institutional investors, to ensure adequate protection of retail investors. Specifically, it applies in the following cases: 1) when aimed solely at qualified investors; or 2) investors purchasing securities of a minimum value of €100,000 in each issue; or 3) when offering securities with a nominal unit value of at least €100,000; c) in order to stimulate business creation and reduce the tax burden on new firms in their first few years of operation, a more favorable tax framework has been created for self-employed persons starting a business. Thus, new businesses starting after January 1, 2013 will pay corporate income tax in the first tax year in which the company’s taxable earnings are positive and in the subsequent tax year at a rate of 15% on the first €300,000 of taxable income, and 20% on the remainder. In line with the above, a new reduction of 20% on net business and professional earnings has been established in personal income tax for persons starting a business or professional activity, applicable to the first tax year in which their earnings are positive and in the subsequent tax year. The current limit on the exemption for unemployment benefits received as a single payment has also been eliminated (this exemption was previously set at €15,500); d) The period in which debtors are to settle payment (unless stipulated otherwise in the contract) has been shortened from 60 to 30 calendar days after the receipt of the goods or provision of services, even if the invoice or demand for payment is received previously. This limit can be extended to 60 calendar days by agreement between the parties in exceptional cases. It is stipulated that, if the parties have agreed a deferred payment timetable, and either of them fails to meet payment on the agreed date, the interest on arrears will be calculated only on the overdue amounts. The legal interest rate the debtor is liable to pay in the event of late payment has been increased, such that it is now the interest rate applied by the ECB in its most recent main refinancing operation, plus eight percentage points. Late payment incurs a fixed charge of €40 that the creditor is entitled to collect from the debtor, which will be added to the principal without the need for an express demand. All duly substantiated costs of collection caused by the default will be added to this amount. As regards these costs, the legislation states that any agreement between the parties excluding compensation will be presumed to be an unfair contract term and thus null and void.
On July 28, 2013, Law 11/2013 of July 26 on business support measures and measures conducive to growth and job creation came into force. It revises the provisions in Royal Decree-Law 4/2013 of February 2013 on business support some of which affect the financial sector. More recently, Law 14/2013 of September 27, on support to and internationalization of business not only complements that mentioned above, but also introduces new fiscal and social security support for business and promotes channels of financing and growth in the international markets. The most notable changes introduced by Law 11/2013 and Law 14/2013 , particularly those of a financial and fiscal nature, are as follows: a) Own funds and core capital requirements of credit institutions in respect of risk-weighted exposure amounts for credit risk to SMEs have been reduced, since now the capital requirements for risks of this type will be multiplied by a supporting factor of 0.7619; b) The regulatory framework governing cédulas de internacionalización (internationalization covered bonds) was updated to address in greater detail the assets pledged as collateral for them, and a new instrument,bonos de internacionalización (internationalization bonds), was created to lend greater flexibility to the issuance of securities collateralized by loans linked to internationalization (without prejudice, in any case, to the unlimited liability of the issuer). Compared with the previous legislation, the list of eligible collateral is broadened and its scope is extended to include internationalization bonds. Thus the principal of and interest on covered bonds will be particularly collateralized by loans relating to the financing of goods and services export contracts or to the internationalization of firms meeting certain requirements. These requirements include, inter alia, that the firm has a high credit quality, and that the loan has been granted to general government or to EU or non-EU public sector entities or to multilateral development banks or international organizations or, regardless of the borrower, has been guaranteed by these bodies; c) Certain amendments were made to the regulations on the organization and supervision of private insurance enacted by Royal Decree 2486/1998 of November 20, 1998. In particular, it is provided that insurance companies may invest in securities admitted to trading on theMercado Alternativo Bursátil (alternative stock market) or on theMercado Alternativo de Renta Fija (alternative fixed-income market) and in venture-capital companies and that those investments qualify for the coverage of technical provisions under certain conditions, although they are not eligible for an amount above 10% of total technical provisions. In the same vein, amendments were made to the pension scheme and pension fund regulations enacted by Royal Decree 304/2004 of February 20, 2004 so as to allow pension funds to invest in these securities; d) The provisions of Royal Decree-Law 4/2013 regarding the removal, in certain cases, of the limit imposed on share capital companies are retained, and, accordingly, the total amount of debt securities issued may not exceed paid-in share capital plus reserves to ensure that retail investors are adequately protected, this flexibility will only apply in those cases in which the issues are targeted at institutional investors, specifically: 1) when they are targeted exclusively at qualified investors; 2) when the securities offering is directed at investors that purchase securities amounting to at least €100,000 per investor in each separate offering, or 3) when the offering is of securities with a unit nominal value of at least €100,000. Also, certain refinements are made in respect of the issuance by share capital companies of debt or other securities of which recognize or create debt and are to be admitted to trading in a multilateral trading system. Thus, it will not be required to execute a public deed, register the issue or perform other related acts in the Mercantile Register, including the Official Gazette of the Mercantile Register; and e) The tax framework of Royal Decree-Law 4/2013, which favors the self-employed who start up a business, with a view to encouraging the creation of businesses and to reducing the tax burden during the initial years of business activity, was retained.
On March 24, 2013, came into force Royal Decree-Law 6/2013 of March 22, 2013 on the protection of the holders of certain savings and investment products and other financial measures was published. This Royal Decree-Law introduces certain mechanisms to speed up the resolution of disputes between credit institutions and their customers, primarily through arbitration, in relation to the marketing of certain savings and investment products, particularly hybrid capital instruments (generally preference shares) and subordinated debt. It also aims to offer liquidity to holders of shares received in exchange for these instruments, granting the Credit Institution Deposit Guarantee Fund (FGD) sufficient legal powers to create market mechanisms allowing liquidity alternatives for these shares. A monitoring committee has been set up as a decision-making body under the Ministry of Economy and Competitiveness to oversee hybrid capital and subordinated debt instruments, with specific responsibility for: 1) analyzing the factors behind judicial and extrajudicial claims by holders of this type of financial product against credit institutions in which the Fund for the Orderly Restructuring of the Banking Sector (FROB) has a shareholding; 2) quarterly submission of a report to the Spanish Parliament on the elements underlying these claims, and, where applicable, 3) making proposals to the competent authorities to improve the protection of purchasers of these products. The committee will also determine the basic criteria to be applied by credit institutions in which the FROB has a shareholding in order to offer their customers the option of submitting disputes arising in relation to the instruments mentioned to arbitration, so that they are appropriately compensated for the economic loss incurred. It will also specify the criteria to designate the group of customers whose claims, in view of their personal or family circumstances, should receive priority treatment by credit institutions in which the FROB has a shareholding. The committee will agree these criteria at its inaugural meeting and may review them on a quarterly basis. The commission will be chaired by the President of the CNMV, with the Deputy Governor of the Banco de España as deputy chairman, with a secretary appointed by the CNMV. The remaining members are the General Secretary for Health and Consumer Affairs, at the Ministry of Health, Social Services and Equality; the General Secretary for the Treasury and Financial Policy, at the Ministry of Economy and Competitiveness; and the President of Consumers’ and Users’ Council. Representatives appointed by the consumer affairs authorities at the regional government and the National Consumer Affairs Institute who have taken part in the claim and resolution mechanisms mentioned will also be invited to attend in an advisory capacity. The Royal Decree-Law also sets out a mechanism for providing liquidity through the Deposit Guarantee Fund (FGD) for shares due to be received by holders of the aforementioned instruments as a result of their being exchanged. Thus, first of all, the functions of the FGD have been expanded to allow it to subscribe for shares or subordinated debt instruments issued by Sareb. Moreover, it is empowered to purchase ordinary shares not admitted to trading on a regulated market issued by credit institutions transferring their assets to Sareb and which are the product of the conversion of hybrid capital instruments and subordinated debt. The FGD will primarily acquire the shares of the institution’s customers who are in situations of particular hardship as a result of their personal and family circumstances, in accordance with the criteria laid down by the committee. The foregoing instruments will be acquired at a price that does not exceed their market value and is in accordance with European Union rules on State aid. For the purposes of determining the market value, the FGD will commission an independent expert report. In order to maintain the FGD’s asset position healthy to ensure it is able to perform its role in supporting the stability of the Spanish financial system properly, a special one-off contribution to it by member institutions has been established, of 3 per mille of deposits held on December 31, 2012. This contribution will be made in two phases. A first tranche equivalent to 40% is to be paid within 20 business days of December 31, 2013. The management committee of the FGD may establish certain exemptions in relation to this tranche, such as: 1) non-application of this tranche to institutions in which the FROB has a majority shareholding; 2) a deduction of up to a maximum of 50% of the contributions of FGD member institutions whose basis for the calculation does not exceed €5 billion; and 3) a deduction of up to a maximum of 30% of the amounts invested by institutions in the subscription or purchase, before December 31, 2013, of shares or subordinated debt instruments issued by Sareb. The second tranche, which will account for the remaining 60%, must be paid within 7 days of January 1, 2014, in accordance with the timetable of payments laid down by the management committee. Without prejudice to the payment timetable, the amount due for this second tranche will be recognized on the assets of the FGD on the date of settlement of the first tranche.
On May 15, 2013, Law 1/2013, on measures to strengthen the protection of mortgagors, debt restructuring, and rented social housing, came into force on May 15, 2013. The Law 1/2013 was partially amended by Law 8/2013, of June 26, on urban renewal, regeneration and rehabilitation. An immediate two-year moratorium on evictions of families considered to be especially vulnerable has been enacted. This exceptional temporary measure will affect any mortgage foreclosure proceedings or extrajudicial sale granting the property to the creditor affecting the principal residence of persons included in certain groups. Special vulnerability is defined here in similar terms as in Royal Decree-Law 27/2012 of November 15, 2012 (BOE of on urgent measures to strengthen the protection of mortgage debtors., namely applying to: 1) large families; 2) one-parent families with two dependent children; 3) families with a child aged under three years; 4) families with a member with a recognized level of disability of more than 33%, requiring long-term care, or suffering from illness accredited as permanently preventing them from working; 5) families in which the mortgagor is unemployed and has exhausted their unemployment benefits; 6) families living together in which one or more persons related to the mortgagor or their spouse by a family tie of up to the third degree of kinship is disabled, requires long term care, or suffers from a serious illness accredited as permanently preventing them from working; and 7) families in which there is a victim of domestic violence, provided the dwelling subject to repossession is their principal residence. Improvements have been made to the mortgage market with the amendment of the consolidated text of the Mortgage Law, promulgated by Decree on February 8, 1946; Law 2/1981 of March 25, 1981 on mortgage market regulation; and Law 41/2007 of December 7, 2007, amending Law 2/1981 of March 25, 1981 on mortgage market regulation and other rules of the mortgage and financial system, regulating reverse mortgages and long-term care insurance and establishing certain tax rules. The deed of mortgage on the property must state whether the mortgaged property is intended as the principal residence or not. Unless proven otherwise, at the time of foreclosure it will be deemed that the property is the principal residence if so stated in the deed. The deed will also be required to include, together with the customer’s signature, a handwritten statement, with the wording to be determined by the Bank of Spain, to the effect that the borrower has been adequately warned of the possible risks arising out of the contract. This will apply, in particular, in the following cases: 1) when limitations are placed on the variability of the interest rate, in the form of floor and ceiling clauses, in which the limit on downward variations is less than that on upward variations; 2) when the contract incorporates an interest rate hedging instrument, or 3) when the loan is in one or more foreign currencies. The Mortgage Law has also been strengthened as regards the arrangements for extrajudicial sales of mortgaged property, provided that this has been agreed in the mortgage deed in the event of a default on payment of principal or interest on the guaranteed amount. Various amendments have also been made to Law 1/2000 of January 7, 2000 on Civil procedure in order to ensure that mortgage foreclosure proceedings take place in a way that protects the rights and interests of mortgagors appropriately, and overall, to streamline foreclosure proceedings and make them more flexible. In particular, the legal costs that may be claimed from the foreclosed debtor may in no case exceed 5% of the amount demanded in the foreclosure order. The possibility of a reduction in the outstanding debt has been provided for, such that when part of the debt remains unpaid after mortgage foreclosure of the debtor’s principal residence, the debtor may be released from it if certain conditions are satisfied. These are, settlement of 65% of the remainder within five years, together with interest at the legal rate, or if that is not possible, 80% over a period of ten years. The debtor is also entitled to a share of any possible future revaluation of the foreclosed property. Specifically, if the foreclosed property is sold in the following ten years, the outstanding debt for which the debtor is liable will be reduced by 50% of the capital gain obtained from the sale. If, during the periods indicated above, the property is realized for a sum greater than that for which the debtor is liable, the latter will be released under the above rules and be entitled to the remainder of the proceeds. If these periods expire in 2013 they will be extended until January 1, 2014.
Royal Decree-Law 11/2013, of August 2, on the protection of part-time workers and other urgent economic and social measures. Among other measures, in order to comply with the decision adopted by the European Commission last July 17, 2013, which concluded that the Spanish tax lease arrangements for the acquisition of vessels as worded till December 31, 2012 was partially incompatible with EU rules on state aid, introduces the transitional regime to be applied to all existing administrative authorizations affected by the content of that Decision.
Law 14/2013, of September 27, on support to entrepreneurs and their internationalization. Among other measures, it modifies the VAT regulation, introducing with effect from January 1, 2014, an optional cash basis regime for VAT tax payers whose turnover during the previous calendar year was less than €2 million.
Law 16/2013, of October 29, establishing certain measures on environmental taxation and taking other tax and financial measures on. It includes different changes to corporate income tax; among the most significant ones:
| a) | For tax periods beginning on or after January 1, 2013: (i) it has eliminated the tax deductibility of impairment losses on holdings in the capital or equity of entities, whether or not resident in Spain, and the possibility of deducting losses incurred abroad by permanent establishments (“PEs”); (ii) it has introduced a deferral regime for tax losses incurred on intragroup transfers of securities representing a holding in the capital or equity of entities, or on intragroup transfers of the PE, until the securities are transferred to third parties outside the group or the transferor or transferee cease to form part of the group; and new restrictions for the calculation of tax losses on the transfer of holdings. |
| b) | It has renewed for tax periods beginning in 2014 and 2015, some temporary measures which were introduced exceptionally for years 2012 and 2013, among others: (i) the offsetting of tax losses carryforwards will be restricted to 50% of the tax base before such offset for those entities whose turnover during the previous year was between €20 million and €60 million, and to 25% if the turnover exceeds €60 million; though these limitations will not apply to income/gains subject to debt compositions as a result of an arrangement with creditors not related to the taxpayer that is approved in a tax period beginning on or after January 1, 2013 (ii) the limitations on the tax deductibility of goodwill to 1% per year, and of intangible assets with an indefinite useful life to 2% per year, (iii) the increase in the rates applicable for determining the amount of the tax prepayment for large companies |
Royal-Decree-law 14/2013, of November 29, on urgent measures to adapt Spanish Law to European Union legislation on the supervision and solvency of financial institutions. The new legislation approved introduces important tax measures aimed at allowing for certain deferred tax assets (“DTAs”) to continue to be classed as capital, in line with legislation in force in other European Union member states, in such a way that Spanish credit institutions may operate in a uniform competitive environment. It states that certain temporary differences deriving from bad debts and pensions will receive a special treatment as regards their inclusion in the tax base, with retroactive effects for tax periods commencing on or after January 1, 2011. Moreover, for tax periods commencing on or after January 1, 2014, the timing differences which, after taking into account the aforementioned rules, cannot be used in certain circumstances (either because the taxpayer incurs accounting losses or because it is liquidated or has an insolvency order against it) can be “converted” into current credits against the tax authorities (which can be cash-settled or offset against other current tax debts, at the taxpayer’s option). Lastly, the provision establishes that after certain periods have elapsed without being able to use those tax assets, they can be exchanged for public debt securities.
Law 22/2013, of December 23, on 2014 National General Budget, among other tax measures, includes the extension for the year 2014 of certain temporary measures that had been introduce for tax years 2012 and 2013, among the most significant ones: (i) the supplementary levy scale on Individual Income Tax, (ii) the increase of the withholding tax rates for nonresident income to 24.75% (standard rate) and 21% (applicable on dividends, interest and capital gains), instead of 24% and 19% rates respectively, (iii) the extension of the Wealth Tax enforcement. Royal Decree-Law 1/2014, of January 24, has also extended until 31 December 2014 the increase of the 19% withholding rate in the Corporate Income Tax to 21%.
Instrument of Ratification of the Convention between the Kingdom of Spain and Argentina for the avoidance of double taxation and prevention of fiscal evasion with respect to taxes on income and on capital, made in Buenos Aires on March 11, 2013, (published in BOE January 14, 2014). The new Convention entered into force on December 23, 2013, but new will apply retroactively to January 1, 2013, replacing the previous treaty that had been terminated unilaterally by Argentina with effects from the same date. In general the new treaty retains the terms of the previous treaty; however, it excludes relief from Argentina’s 0.5% wealth tax. The Argentine government terminated the previous treaty in 2012. Among the most significant changes included in the new Tax Treaty is the elimination of the exclusive taxation in the country of residence of assets consisting of shares in a company and the Most Favorable Nation clause (affecting interest, royalties and capital gains) of the previous protocol.
On March 14, 2013, a new Tax Treaty was signed between Spain and the United Kingdom. The ratification process was concluded in April 2014 and the new Treaty will apply in Spain from June 12, 2014 for withholding taxes and from January 1, 2015 for income taxes and other taxes, and in the U.K. from June 12, 2014 for withholding taxes, from April 6, 2015 for income and capital gains taxes, and from April 1, 2015 for corporation tax. Among the most relevant changes introduced by the new Treaty, the interests’ and royalties’ withholding tax rates have been reduced to 0%, and the dividend withholding tax rate has been reduced to 0% if the beneficial owner is a company that controls, directly or indirectly, at least 10% of the capital in the company paying the dividends or a pension scheme.
* * * * * *
In an attempt to deal with the international financial crisis, due to the exceptional circumstances notably beginning in the second half of 2008, the following laws were approved in Spain:
•
•
•
• Article 1 of RD 7/2008, authorizes the granting of state guarantees for certain new financing transactions carried out by credit entities resident in Spain up to a maximum amount of €100 billion. The purpose of Order EHA/3364/2008, as amended by Order EHA/3748/2008 is to implement the provisions of RD 7/2008 and to specify certain essential aspects of the system for granting guarantees to credit entities, such as: (i) the characteristics of the guarantees to be granted; (ii) the requirements that the beneficiary entities and the transactions must fulfill; and (iii) the process to be followed in order to grant the guarantees. Debt issued under this state guarantee must form part of individual operations or issuance programs; not be subordinated or secured by any other class of guarantee; be traded on official Spanish secondary markets; mature within three months and three years (although this maturity can be extended to five years subject to prior notification to the Bank of Spain); be fixed or floating rate (subject to special conditions for floating-rate debt); be repaid in a single installment at maturity; not have any options or other derivatives attached to it; and, not be less than €10 million per issue. The deadline for issuing debt eligible for state guarantees was December 31, 2009 and the total amount of guarantees is €100 billion.
• Authorization, on an exceptional basis, until December 31, 2009, for the Spanish Ministry of Economy and Competitiveness to acquire regulatory capital (including preferred securities and quotas) issued by credit entities resident in Spain that need to reinforce their capital and request such action. These acquisitions will require a report from the Bank of Spain.
• Royal Decree-Law 3/2009, of March 27 on urgent measures for tax, financial and insolvency matters, amends the Spanish Insolvency Law (in force since 2004), and aims: (i) to facilitate restructuring outside insolvency proceedings for companies undergoing financial difficulties; (ii) to expedite insolvency proceedings for companies which either decide or are bound to restructure in an insolvency situation; and (iii) to settle certain discrepancies concerning credit subordinations. Additionally, it authorizes theConsorcio de Compensación de Seguros to participate in the reassurance of credit insurance transactions.
| – | Article 1 of RD 7/2008, authorizes the granting of state guarantees for certain new financing transactions carried out by credit entities resident in Spain up to a maximum amount of €100 billion. The purpose of Order EHA/3364/2008, as amended by Order EHA/3748/2008 is to implement the provisions of RD 7/2008 and to specify certain essential aspects of the system for granting guarantees to credit entities, such as: (i) the characteristics of the guarantees to be granted; (ii) the requirements that the beneficiary entities and the transactions must fulfill; and (iii) the process to be followed in order to grant the guarantees. Debt issued under this state guarantee must form part of individual operations or issuance programs; not be subordinated or secured by any other class of guarantee; be traded on official Spanish secondary markets; mature within three months and three years (although this maturity can be extended to five years subject to prior notification to the Bank of Spain); be fixed or floating rate (subject to special conditions for floating-rate debt); be repaid in a single installment at maturity; not have any options or other derivatives attached to it; and, not be less than €10 million per issue. The deadline for issuing debt eligible for state guarantees was December 31, 2009 and the total amount of guarantees is €100 billion. |
93
| – | Authorization, on an exceptional basis, until December 31, 2009, for the Spanish Ministry of Economy and Finance to acquire regulatory capital (including preferred securities and quotas) issued by credit entities resident in Spain that need to reinforce their capital and request such action. These acquisitions will require a report from the Bank of Spain. |
| • | Royal Decree-Law 3/2009, of March 27 on urgent measures for tax, financial and insolvency matters, amends the Spanish Insolvency Law (in force since 2004), and aims: (i) to facilitate restructuring outside insolvency proceedings for companies undergoing financial difficulties; (ii) to expedite insolvency proceedings for companies which either decide or are bound to restructure in an insolvency situation; and (iii) to settle certain discrepancies concerning credit subordinations. Additionally, it authorizes theConsorcio de Compensación de Seguros to participate in the reassurance of credit insurance transactions. |
•
This recapitalization scheme for credit institutions was approved by the European Commission until December 31, 2010, concluding the scheme is compatible with article 107.3.b of the Treaty on the Functioning of the European Union (“TFEU”).
•
•
•
•
•
•
a) Individual Income Tax: effective for tax years 2012 and 2013, an additional tax (increase on the tax rate) ranging from 0.75% to 7% has been established on the general tax base, bringing the total tax rate to a range between 24.75% and 52%. Similarly, an additional tax ranging from 2% to 6% would be applicable on the “savings” tax base, bringing the total tax rate to a range between 21% and 27%. Withholdings rates have been modified accordingly.
94
b) Non-resident Income Tax: Effective on January 1, 2012 until December 31, 2013, the applicable tax rate to income obtained by non-resident taxpayers without a permanent establishment is increased from 24% to 24.75%. Over the same period, the tax rate applicable to dividends, branch profits distributions, interest payments and capital gains obtained from the transfer of assets is increased from 19% to 21%. These changes are mirrored in the withholding rates applicable.
c) VAT: the reduced 4% VAT rate for deliveries of buildings (or part of them) suitable to be used as dwellings introduced by Royal Decree-Law 9/2011 has been extended until December 31, 2012.
•
United Kingdom Regulation
FSA
Both Santander UK and our London branch are regulated by the Financial Services Authority (“FSA”). The FSA is the single statutory regulator responsible for regulating deposit taking, mortgages, insurance and investment business pursuant
The FSA has authorized Santander UK,new European Supervisory Authorities, as well as somewith other Member States. In general, this Royal Decree-Law introduces the obligation for the Spanish supervisory authorities of the different financial institutions (Bank of Spain, CNMV and Directorate General of Insurance and Pension Funds) to cooperate with their European counterparts (European Banking Authority, European Securities and Markets Authority, and European Insurance and Occupational Pensions Authority, respectively), as well as with the European Systemic Risk Board. Furthermore, they shall provide these authorities with all the information that they need in order to perform their functions as conferred under European regulations.
| • | Royal Decree-Law 4/2012, of February 24, set out information obligations and procedures necessary to establish a financing mechanism for payments to local government suppliers, and Royal Decree-Law 7/2012, both of March 9, amended by Royal Decree-Law 10/2012 of March 23, and set up the Fund for Financing Payments to Suppliers. Royal Decree-Law 4/2012 is aimed to provide the conditions necessary for local governments to meet their outstanding payment obligations to suppliers stemming from the tendering out of works, supplies or services. For this purpose it sets in place an extraordinary financing mechanism, of which regional governments can also avail themselves. Royal Decree-Law 7/2012 sets up theFondo para la Financiación de los Pagos a Proveedores (Fund for Financing Payments to Suppliers) and regulates the terms and conditions of transactions for paying the outstanding obligations of local governments and, where applicable, of the regional governments that have availed themselves of this financing mechanism. |
Mortgages
Lending secured on land, at least 40% of which is usedThose institutions that, as a dwelling by an individual borrowerconsequence of these write-downs, have a capital or relative, has been regulated bycore capital shortfall according to the FSA since October 31, 2004. Santander UK is authorized to enter into, advise and arrange regulated mortgage contracts.
Banking
Deposit taking is a regulated activity that requires a firm to be authorized and supervised by the FSA. Santander UK has permission to carry on deposit taking as do several of its subsidiaries, including Abbey National Treasury Services plc and Cater Allen Limited.
Insurance
United Kingdom banking groups may provide insurance services through other group companies. Insurance businessrules in the United Kingdom is divided between two main categories: Long-term Assurance (such as whole of life, endowments, life insurance investment bonds) and General Insurance (such as buildings and contents coverage, annually renewable life, health and travel protection coverage and motor insurance).
Under the FSMA, effecting or carrying out any contract of insurance, whether general or long-term, is a regulated activity requiring authorization. Life insurance mediation has been subject to regulation for many years. General insurance mediation has been subject to regulation by the FSA since January 14, 2005.
Santander UK is authorized by the FSA to sell both Long-term Assurance and General Insurance and receives commissions for the policies arranged.
95
Investment business
Investment business such as dealing in, arranging deals in, managing and giving investment advice in respect of most types of securities and other investments, including options, futures and contracts for differences (which would include interest rate and currency swaps) and long-term assurance contracts are all regulated activities under the FSMA and require authorization by the FSA.
Santander UK and some of its subsidiaries have permission to engage in a wide range of wholesale and retail investment businesses including selling investment-backed life assurance and pension products, unit trust products and individual savings accounts (tax exempt saving products) and providing certain retail equity products and services.
New regulatory structure
The UK Government has announced a new regulatory framework which is due to begin taking effect at the end of 2012. The UK Financial Services Authority will be replaced by two regulatory bodies: (i) the Prudential Regulatory Authority, regulation of financial institutions that manage significant risks on their balance sheets, such as banks and insurance companies, and (ii) the Financial Conduct Authority, which will supervise the conduct of business and maintain orderly financial markets. We expect that the regulatory approach under the new regime will be more intrusive than the existing regime and will challenge business models and governance culture in particular. In order to prepare for this change, the FSA is adopting a twin peaks model internally, and therefore will have two supervisors: one focusing on prudential matters and the other focusing on conduct.
Substantial reorganization of the regulatory framework has the potential to cause administrative and operational disruption for the regulatory authorities concerned. This disruption could impact on the resources which the FSA or the successor authorities are able to devote to the supervision of regulated financial services firms, the nature of their approach to supervision and accordingly, the ability of regulated financial sector firms (including members of the Group) to deal effectively with their supervisors and to anticipate and respond appropriately to developments in regulatory policy. No assurance can be given that further changes will not be made to the regulatory regime in the UK generally, the Group’s particular business sectorscapitalize themselves in the market or, specificallyfailing that, request financial support from the FROB. This might consist in relationsubscription for instruments convertible into shares (contingent convertible bonds, known as “CoCos”) or contributions to share capital, irrespective of whether they participate in integration processes. Institutions that seek this support must submit a restructuring plan which, inter alia, must set out the support measures that the envisaged FROB intervention would include.
In order for real estate assets to be identified and sold, the Royal Decree-Law 18/2012 envisages the creation of share capital companies to which credit institutions must transfer all the real estate assets foreclosed or received in payment of debts relating to land or real estate construction or development, and other real estate assets foreclosed or received in payment of debts since December 31, 2011.
The transfers must be made at fair value and by the end of the period for setting aside the new provisions established in Royal Decree-Laws 2/2012 and 18/2012 (i.e. before December 31, 2012, unless integration processes are carried out). In the event of absence of and difficulty estimating a fair value, the value in the accounts of the institution contributing the asset may be used instead, taking into account the provisions that must be created for the assets pursuant to Royal Decree-Laws 2/2012 and 18/2012.
Where credit institutions have received financial support from the FROB, the exclusive corporate objects of the companies to which they transfer their assets will be the management and disposal, directly or indirectly, of such assets. In addition, they will be obliged to dispose each year of at least 5% of their assets to a third party other than the transferor credit institution or any other company in the same group. The directors of such companies must have proven experience in the management of real estate assets.
Finally, these credit institutions will have a period of three years, from the effective date of this Royal Decree-Law, to adopt and implement the necessary measures to ensure that the link of the asset management company to the Group.institution is, at most, that of an associate.
The Law 8/2012 also introduced special treatment for preference shares under the terms of Royal Decree-Law 18/2012. Thus, credit institutions facing equity capital difficulties as a result of applying the new provisions may include in their consolidation plan an application to defer for up to 12 months the envisaged remuneration on preference shares or mandatory convertible debt instruments in circulation before May 12, 2012 (date of entry into force of Royal Decree-Law 18/2012) or on instruments exchanged for the foregoing. Once this period has expired, deferred remuneration may only be paid if sufficient distributable profits or reserves are available and there is no capital shortfall at the parent credit institution. The Law also empowers the Government to stipulate under what circumstances institutions issuing preferred shares or subordinate bonds are to offer to exchange them for shares or subordinate bonds in the issuing institution or a member of its group, and the criteria for determining the percentage of the nominal value of the instruments to be exchanged.
The Royal Decree-Law also envisaged the institution of a territorial financing mechanism which involves the creation of a Regional Government Liquidity Fund that will be funded with a charge to the State budget with an extraordinary budgetary appropriation for an amount of €18 billion. The Fund was assigned to the Ministry of Economy and Competitiveness and General Government through the Secretariat of State for General Government, and it will be managed by the Official Credit Institute (OCI). It will extend loans to the Regional Governments, in order to cover their financial liquidity needs.
The Royal Decree-Law also exempted the Bank of Spain from the duty of professional secrecy so it may provide the European Commission, the European Central Bank, the European Banking Authority, the IMF, the European Financial Stability Facility and, where appropriate, the European Stability Mechanism with the information needed for the proper performance of their functions in respect of financial assistance for the recapitalization of Spanish financial institutions.
The Royal Decree-Law, besides modifying the definition of “capital principal” (core capital) to adapt it to the one used by the European Banking Authority, also modified with effect from January 1, 2013, the “capital principal” (core capital) requirements established by Royal Decree-Law 2/2011 of February 18 on the strengthening of the financial system that institutions and consolidable groups must comply with. Specifically, the requirements of 8% (general) and 10% (for institutions that have not sold at least 20% of the securities representing their capital to third parties, and that have a wholesale funding ratio of more than 20%) were converted into a single 9% requirement. The Royal Decree-Law became effective on August 31, 2012. Law 9/2012, of November 14, on restructuring and resolution of credit institution was published on November 15, 2012, and raised the content of Royal Decree-Law 24/2012 of August 31, on restructuring and resolution of credit institutions (which it repeals) to the status of a Law, and introduces some significant new provisions on the regulation of asset management companies (AMCs), and the segregated assets of AMCs’, which the Law terms “bank asset funds” (FABs). The Law also makes a number of changes of relevance to the financial sphere.
| • | Law 9/2012 of November 14, sets out the general framework for asset management companies (AMCs) established in Royal Decree-Law 24/2012 of August 31, which are envisaged as tools for credit institution restructuring and resolution, and introduces some significant changes. The general legal framework applicable to AMCs, the regulations governing them, and other additional details were recently enacted in Royal Decree 1559/2012 of November 15. AMCs’ purpose is to concentrate those assets considered problematic or which might be detrimental to credit institutions’ balance sheets or jeopardize their viability, by removing them from the balance sheet and allowing them to be independently managed. The objectives AMCs are to pursue through their operations are: (i) to help consolidate the financial system by acquiring the relevant assets, such that simultaneous with their change of ownership there is an effective transfer of the risks associated with them; (ii) to minimize public financial support; (iii) to pay the debts and obligations incurred in the course of conducting their activities; (iv) to minimize possible market distortions resulting from their activities; and (v) to dispose of the assets acquired in a way that optimizes their value within the timescale for which they have been constituted. The FROB may oblige a credit institution to transfer certain classes of assets on its balance sheet to an AMC, including those on the balance sheet of any entity over which the credit institution exercises control. Asset management companies regulated under Royal Decree Law 18/2012 of May 11, on the writing down and sale of the real estate assets of the financial sector, the regulations for which were given the status of law by Law 8/2012 of October 30, are not considered AMCs. Further details have been added to Law 9/2012 of November 14, on restructuring and resolution of credit institutions by the Royal Decree-Law 6/2013 of March 22, on the protection of the holders of certain savings and investment products and other financial measures. Firstly, new conditions have been added in relation to the framework for the transfer of assets to Sareb, namely: 1) transferred loans may not be classed as subordinated in the context of the debtor’s possible bankruptcy proceedings, even if Sareb is a shareholder in the debtor company. However, if already classed as subordinated prior to the transfer, they shall remain classed as such; 2) Sareb will be entitled to adhere to proposed agreements presented by any legitimate party and the right to vote at the shareholders’ meeting, in relation to any loans acquired by it following the declaration of bankruptcy proceedings; 3) Sareb may be the beneficiary ofhipotecas de máximo (mortgages securing multiple debts or obligations up to a set maximum amount) encumbering assets it already holds or subsequently transferred to it; and 4) the contractual compensation and financial guarantee schemes regulated in Royal Decree-Law 5/2005 of March 11 on urgent reforms to promote productivity and improve public sector procurement shall be applicable to Sareb. |
On December 29, 2013, entered into force Law 26/2013 of December 27 on savings banks and bank foundations, which contains the new legal regime for savings banks, and the regulation of bank foundations for the first time in Spanish law. This law repeals Law 31/1985 of August 2, on the regulation of the basic rules relating to the governing bodies of savings banks; Royal Decree-Law 11/2010 of July 9, on governing bodies and other aspects of the legal regime for savings banks, except the paragraphs that refer to the tax regime for institutional protection schemes; and certain paragraphs of Article 7 of Law 13/1985 of May 25, on investment ratios, own funds and reporting obligations of financial intermediaries, insofar as they concern non-voting equity units. The main changes which has been introduced by Law 26/2013 are: A) It specifies and determines the object of their activity, which is the traditional object of savings banks, these being credit institutions with a charitable nature and social purpose, whose financial activity must be primarily oriented towards the acceptance of repayable funds and the provision of banking and investment services to retail customers and SMEs; B) It takes the important step of professionalizing the governing bodies of savings banks, basically by reducing the representation of government and public law entities and corporations, and by extending the requirements for integrity, experience and good governance to all the members of the board of directors (previously they only applied to the majority of directors), including general managers and similar officers, those responsible for the functions of internal control and those who perform other key duties for the daily activity of savings banks. In short, the legislation applicable to banks is extended to the members of the board of directors and equivalent officers; C) As envisaged by the previous legislation, it requires savings banks to publish a corporate governance report on an annual basis, which will be sent to the CNMV, to the Bank of Spain and to the competent regional government bodies; D) Mergers of savings banks will be subject to the authorization procedure provided for in the implementing regional legislation. The change in address of the registered office of a savings bank will be subject to the authorization procedure of the transfer project, in accordance with the provisions of the implementing regional legislation. The denial of authorization of the merger or of the transfer may only occur through a reasoned resolution when the resulting institution may not comply with any of the objective requirements laid down in the said legislation; and E) It introduces the regulation of bank foundations into the Spanish legal system. These entities have a direct or indirect holding of at least 10% of the capital or voting rights of a credit institution, or that enables them to appoint or replace one or more members of the board of directors of such institution.
United States Supervision and Regulation
Our operations are subject to extensive federal and state banking and securities regulation and supervision in the United States. We engage in U.S. banking activities directly through our New York branch and indirectly through Banesto’s branch in New York, Santander UK’s branch in Connecticut, our subsidiary Edge Act corporation, Banco Santander International, in Miami, Banco Santander Puerto Rico (“Santander Puerto Rico”) in Puerto Rico, SovereignSantander Bank, a national bank that has branches throughout the Northeast US,U.S., and Santander Consumer USA, an auto financing company. We also engage in securities activities in the United States directly through our broker-dealer subsidiaries, Santander Securities Corporation, Santander Investment Securities Inc., and BanestoSantander International Securities, Inc.
Disclosure pursuant to Section 219 of the Iran threat reduction and Syria human rights act Pursuant to Section 219 of the Iran Threat Reduction and Syria Human Rights Act of 2012, which added Section 13(r) to the Securities Exchange Act of 1934, as amended (the “Exchange Act”), an issuer is required to disclose in its annual or quarterly reports, as applicable, whether it or any of its affiliates knowingly engaged in certain activities, transactions or dealings relating to Iran or with individuals or entities designated pursuant to certain Executive Orders. Disclosure is generally required even where the activities, transactions or dealings were conducted in compliance with applicable law. The following activities are disclosed in response to Section 13(r) with respect to affiliates of Santander UK within the Group. During the period covered by this annual report: (a) A Santander UK customer, being an Iranian national resident in the U.K., was designated in September 2013 as acting for or on behalf of the Government of Iran. This accountholder’s current account and credit card with Santander UK were closed in December 2013. No revenue was generated by Santander UK on these products. (b) In early October 2013, Santander UK opened an account for a Tunisian national, resident in the U.K., who is currently designated by the U.S. for terrorism. After becoming aware of this customer’s designation, Santander UK exited the relationship later in October 2013. No revenue was generated by Santander UK on these accounts. (c) Santander UK holds frozen savings and current accounts for three customers resident in the U.K. who are currently designated by the U.S. for terrorism. The accounts held by each customer were blocked after the customer’s designation and have remained blocked and dormant throughout 2013. No revenue was generated by Santander UK on these accounts. (d) A U.K. company maintained two commercial accounts at Santander UK that were used to provide payroll processing services for a U.K. entity that is currently designated by the U.S. under the Iran sanctions regime. The accounts may have been used to provide payroll services to other Iranian clients. Santander UK became aware of this account activity in September 2013 and exited the relationship in January 2014. No revenue was generated by Santander UK on these accounts. (e) An Iranian national, resident in the U.K., who is currently designated by the U.S. and the U.K. under the Iran Sanctions regime held a mortgage with Santander UK that was issued prior to any such designation. No further drawdown has been made (or would be allowed) under this mortgage although we continue to receive repayment installments. In 2013, total revenue in connection with the mortgage was £10,421 whilst net profits were negligible relative to the overall profits of Santander UK. Santander UK does not intend to enter into any new relationships with this customer, and any disbursements will only be made in accordance with applicable sanctions. The same Iranian national also holds two investment accounts with Santander Asset Management UK Limited, part of the Group until December 2013 (see Item 4 of Part I, “Information on the Company—A. History and development of the company —Principal Capital Expenditures and Divestitures—Acquisitions, Dispositions, Reorganizations-Agreement with Warburg Pincus and General Atlantic”). The accounts have remained frozen throughout 2013. The investment returns are being automatically reinvested, and no disbursements have been made to the customer. Total revenue for the Group in connection with the investment accounts was £247 whilst net profits in 2013 were negligible relative to the overall profits of Banco Santander, S.A. In addition, the Group has certain legacy export credits and performance guarantees with Bank Mellat, which are included in the U.S. Department of the Treasury’s Office of Foreign Assets Control’s Specially Designated Nationals and Blocked Persons List. The Bank entered into two bilateral credit facilities in February 2000 in an aggregate principal amount of €25.9 million. Both credit facilities matured in 2012. In addition, in 2005 Banco Santander participated in a syndicated credit facility for Bank Mellat of €15.5 million, which matures on July 6, 2015. As of December 31, 2013, the Group was owed €4.3 million under this credit facility. Bank Mellat has been in default under all of these agreements in recent years and Banco Santander has been and expects to continue to be repaid any amounts due by official export credit agencies, which insure between 95% and 99% of the outstanding amounts under these credit facilities. No funds have been extended by Santander under these facilities since they were granted.
The Group also has certain legacy performance guarantees for the benefit of Bank Sepah and Bank Mellat (stand-by letters of credit to guarantee the obligations – either under tender documents or under contracting agreements – of contractors who participated in public bids in Iran) that were in place prior to April 27, 2007. However, should any of the contractors default in their obligations under the public bids, the Group would not be able to pay any amounts due to Bank Sepah or Bank Mellat because any such payments would be frozen pursuant to Council Regulation (EU) No. 961/2010.
In the aggregate, all of the transactions described above resulted in approximately €72,000 gross revenues and approximately €123,000 net loss to the Group in 2013, all of which resulted from the performance of export credit agencies rather than any Iranian entity. The Group has undertaken significant steps to withdraw from the Iranian market such as closing its representative office in Iran and ceasing all banking activities therein, including correspondent relationships, deposit taking from Iranian entities and issuing export letters of credit, except for the legacy transactions described above. The Group is not contractually permitted to cancel these arrangements without either (i) paying the guaranteed amount – which payment would be frozen as explained above (in the case of the performance guarantees), or (ii) forfeiting the outstanding amounts due to it (in the case of the export credits). As such, the Group intends to continue to provide the guarantees and hold these assets in accordance with company policy and applicable laws.
Dodd-Frank Act
On July 21, 2010, the United States enacted the Dodd-Frank Act, which provides a broad framework for significant regulatory changes that will extend to almost every area of U.S. financial regulation. Implementation of the Dodd-Frank Act requires further detailed rulemaking over several years by different U.S. regulators, including the Office of the Comptroller of the Currency (the “OCC”), the Board of Governors of the Federal Reserve System (the “Federal Reserve Board”), the Securities and Exchange Commission (the “SEC”), the Federal Deposit Insurance Corporation (the “FDIC”), the Commodity Futures Trading Commission (the “CFTC”) and the newly created Financial Stability Oversight Council (the “Council”) and Consumer Financial Protection Bureau (the “CFPB”), although uncertainty remains about the final details, timing and impact of the rules.
Among other things, the Dodd-Frank Act will, pursuant to itsAct’s so-called “Volcker Rule”, prohibits “banking entities” from engaging in certain forms of proprietary trading or from sponsoring or investing in certain covered funds, in each case subject to certain limited exceptions. The Volcker Rule became effective on July 21, 2012 and on December 10, 2013, U.S. regulators issued final rules implementing the Volcker Rule. The final rules also limit the ability of banking entities and their affiliates to sponsorenter into certain transactions with such funds with which they or investtheir affiliates have certain relationships. The final rules contain exclusions and certain exemptions for market-making, hedging, underwriting, trading in private equity or hedge funds or to engageU.S. government and agency obligations as well as certain foreign government obligations, trading solely outside the United States, and also permits certain ownership interests in certain types of proprietary trading infunds to be retained. The final rules implementing the United States unrelatedVolcker Rule extended the period for all banking entities to serving clients, although certainconform with the Volcker Rule and implement a compliance program until July 21, 2015, and additional extensions are possible. Banking entities must bring their activities and investments into compliance with the requirements of the Volcker Rule by the end of the conformance period. We are assessing how the final rules implementing the Volcker Rule will affect our businesses and are developing and implementing plans to bring affected businesses into compliance. It is expected that our non-U.S. banking organizations, such as the Bank, will notlargely be prohibited by the Dodd-Frank Act from engaging in suchable to continue its activities solely outside the United States. States in reliance on the “solely outside the U.S.” exemptions under the Volcker Rule and its implementing regulations.
The Dodd-Frank Act also provides regulators with tools to impose greater capital, leverage and liquidity requirements and other prudential standards, particularly for financial institutions that pose significant systemic risk. However, in imposing heightened capital, leverage, liquidity and other prudential standards on non-U.S. banks such as us, the Federal Reserve Board is directed to take into account the principle of national treatment and equality of competitive opportunity, and the extent to which the foreign bank is subject to comparable home country standards (although certain of our activities will be subject to the U.S. standards).
96
U.S. regulators will also be able to restrict the size and growth of systemically significant non-bank financial companies and large interconnected bank holding companies and will be required to impose bright-line debt-to-equity ratio limits on financial companies that the Council determines pose a grave threat to financial stability.
Furthermore, the Dodd-Frank Act provides for an extensive framework for the regulation of over-the-counter (OTC) derivatives, including mandatory clearing, exchange trading and transaction reporting of certain OTC derivatives. Entities that are swap dealers, security-based swap dealers, major swap participants or major security-based swap participants will beare required to register with the SECCFTC or the CFTC,SEC, or both, and are or will becomebe subject to new capital, margin, business conduct, recordkeeping, clearing, execution, reporting and other requirements. Banco Santander, S.A. and Abbey National Treasury Services plc became provisionally registered as swap dealers with the CFTC on July 8, 2013 and November 4, 2013, respectively. In addition, we may register one more subsidiary as swap dealer with the CFTC.
In addition, Title I of the Dodd-Frank Act and the implementing regulations issued by the Federal Reserve and the FDIC require each bank holding company with assets of $50 billion or more, including us, to prepare and submit annually a plan for the orderly resolution of our subsidiaries and operations that are domiciled in the United States in the event of future material financial distress or failure. The plan must include information on resolution strategy, major counterparties and interdependencies, among other things, and requires substantial effort, time and cost. We submitted our U.S. resolution plan in December 2013. The resolution plan is subject to review by the Federal Reserve Board and the FDIC.
Regulations that the FDIC or the Consumer Financial Protection BureauCFPB may adopt could affect the nature of the activities that a bank, such as SovereignSantander Bank and Santander Puerto Rico, may conduct, and may impose restrictions and limitations on the conduct of such activities.
The Dodd-Frank Act also grants the SEC discretionary rule-making authority to impose a new fiduciary standard on brokers, dealers and investment advisers, and expands the extraterritorial jurisdiction of U.S. courts over actions brought by the SEC or the United States with respect to violations of the antifraud provisions of the Securities Act of 1933, the Securities Exchange Act of 1934 and the Investment Advisers Act of 1940.
Regulatory Authorities
We are a financial holding company and a bank holding company under the U.S. Bank Holding Company Act of 1956, as amended (the “Bank Holding Company Act”), by virtue of our ownership of Santander Bank, Santander Holdings USA and Santander BanCorp. As a result, we and our U.S. operations are subject to regulation, supervision and examination by the Federal Reserve Board.
Banco Santander Puerto Rico is a Puerto Rico-chartered bank, and its deposits are insured by the FDIC. As such, Santander Puerto Rico is subject to regulation, supervision and examination by the Puerto Rico Office of Financial Institutions and the FDIC. SovereignSantander Bank is a federally-chartered national bank, the deposits of which are also insured by the FDIC. SovereignSantander Bank is subject to regulation, supervision and examination by the OCC and the FDIC. Our New York branch is supervised by the Federal Reserve Bank of New York and the New York State Department of Financial Services, but its deposits are not insured (or eligible to be insured) by the FDIC. Banesto’s branch in New York is supervised by the Federal Reserve Bank of New York and the New York State Department of Financial Services. Santander UK’s branch in Connecticut is supervised by the Federal Reserve Bank of New York and the Connecticut Department of Banking. Banco Santander International is supervised by the Federal Reserve Bank of Atlanta. Santander Consumer USA is regulated and supervised by the Federal Reserve Bank of New YorkBoston and various state regulators.
Restrictions on Activities
As described below, federal and state banking laws and regulations restrict our ability to engage, directly or indirectly through subsidiaries, in activities in the United States.
We are required to obtain the prior approval of the Federal Reserve Board before directly or indirectly acquiring the ownership or control of more than 5% of any class of voting shares of U.S. banks, certain other depository institutions, and bank or depository institution holding companies. Under the Bank Holding Company Act and Federal Reserve Board regulations, our U.S. banking operations (including our New York branch and Santander Puerto Rico) are also restricted from engaging in certain “tying” arrangements involving products and services.
97
Santander Puerto Rico and SovereignSantander Bank are subject to requirements and restrictions under federal and state law, including requirements to maintain reserves against deposits, restrictions on the types and amounts of loans that may be made and the interest that may be charged thereon, and limitations on the types of investments that may be made and the types of services that may be offered. Various consumer laws and regulations also affect the operations of these subsidiaries.
Under U.S. law, our activities and those of our subsidiaries in the United States are generally limited to the business of banking, and managing or controlling banks. So long as we are a financial holding company under U.S. law, we may also engage in nonbanking activities in the United States that are financial in nature, or incidental or complementary to such financial activity, including securities, merchant banking, insurance and other financial activities, subject to certain limitations on the conduct of such activities and to prior regulatory approval in some cases.
In addition, under U.S. federal banking laws, state-chartered banks (such as Santander Puerto Rico) and state-licensed branches and agencies of foreign banks (such as our New York branch) may not, as a general matter, engage as a principal in any type of activity not permissible for their federally chartered or licensed counterparts, unless (i) in the case of state-chartered banks (such as Santander Puerto Rico), the FDIC determines that the additional activity would pose no significant risk to the FDIC’s Deposit Insurance Fund and is consistent with sound banking practices, and (ii) in the case of state licensed branches and agencies (such as our New York branch), the Federal Reserve Board determines that the additional activity is consistent with sound banking practices. United States federal banking laws also subject state branches and agencies to the same single-borrower lending limits that apply to federal branches or agencies, which are substantially similar to the lending limits applicable to national banks. For our U.S. branches, these single-borrower lending limits are based on the worldwide capital of the entire foreign bank (e.g., Banco Santander, S.A. in the case of our New York branch).
Under the International Banking Act of 1978, as amended, the Federal Reserve Board may terminate the activities of any U.S. office of a foreign bank if it determines (i) that the foreign bank is not subject to comprehensive supervision on a consolidated basis in its home country (unless the home country is making demonstrable progress toward establishing such supervision), (ii) that there is reasonable cause to believe that such foreign bank or its affiliate has violated the law or engaged in an unsafe or unsound banking practice in the United States and, as a result of such violation or practice, the continued operation of the U.S. office would be inconsistent with the public interest or with the purposes of federal banking laws or, (iii) for a foreign bank that presents a risk to the stability of the United States financial system, the home country of the foreign bank has not adopted, or made demonstrable progress toward adopting, an appropriate system of financial regulation to mitigate such risk.
The Dodd-Frank Act removed, effective in July 2011, a longstanding prohibition on the payment of interest on demand deposits by our FDIC-insured bank subsidiaries and our New York branch. In addition, theThe Dodd-Frank Act will requirealso requires that the lending limits applicable to SovereignSantander Bank, Santander Puerto Rico, and our New York branch take into account (effective July 2012) credit exposure arising from derivative transactions, and that those applicable to SovereignSantander Bank and our New York branch also take into account securities borrowing and lending transactions and repurchase and reverse repurchase agreements with counterparties. The OCC has issued an interim final rule to implement the Dodd-Frank Act’s provisions relating to lending limits. Also, under the so-called swap “push-out” provisions of the Dodd-Frank Act, the derivatives activities of FDIC-insured banks and U.S. branch offices of foreign banks will be(including our New York branch) are restricted or prohibited, which may necessitate a restructuring of how we conduct our derivatives activities. We and other U.S. and foreign banking organizations must comply with the “push-out” provisions by July 2015.
There are various qualitative and quantitative restrictions on the extent to which we and our nonbank subsidiaries can borrow or otherwise obtain credit from our U.S. banking subsidiaries or engage in certain other transactions involving those subsidiaries. In general, these transactions must be on terms that would ordinarily be offered to unaffiliated entities must be secured by designated amounts of specified collateral and are subject to volume limitations. These restrictions also apply to certain transactions of our New York branch with certain of our U.S. affiliates. Effective in July 2012, the Dodd-Frank Act subjects credit exposure arising from derivative transactions, securities borrowing and lending transactions, and repurchase/reverse repurchase agreements to these collateral and volume limitations. The Federal Reserve Bank has not yet issued regulations to implement these changes made by the Dodd-Frank Act.
A major focus of U.S. governmental policy relating to financial institutions is aimed at preventing money laundering and terrorist financing and compliance with economic sanctions in respect of designated countries or activities. Failure of an institution to have policies and procedures and controls in place to prevent, detect and report money laundering and terrorist financing could in some cases have serious legal, financial and reputational consequences for the institution.
In February 2014, the Federal Reserve approved a final rule to enhance its supervision and regulation of the U.S. operations of foreign banking organizations (“FBOs”) such as us. Under the Federal Reserve’s rule, FBOs with $50 billion or more in U.S. assets held outside of their U.S. branches and agencies (“Large FBOs”), will be required to create a separately capitalized top-tier U.S. intermediate holding company (“IHC”) that will hold substantially all of the FBO’s U.S. bank and nonbank subsidiaries, such as Santander Bank. An IHC will be subject to U.S. risk-based and leverage capital, liquidity, risk management, stress testing and other enhanced prudential standards on a consolidated basis. Under the final rule, a Large FBO that is subject to the IHC requirement may request permission from the Federal Reserve to establish multiple IHCs or use an alternative organizational structure. The final rule also permits the Federal Reserve to apply the IHC requirement in a manner that takes into account the separate operations of multiple foreign banks that are owned by a single Large FBO. Although U.S. branches and agencies of a Large FBO will not be required to be held beneath an IHC, such branches and agencies will be subject to liquidity, and, in certain circumstances, asset maintenance requirements. Large FBOs generally will be required to establish IHCs and comply with the enhanced prudential standards beginning July 1, 2016. An IHC’s compliance with applicable U.S. leverage ratio requirements is generally delayed until January 1, 2018. FBOs that have $50 billion or more in non-branch/agency U.S. assets as of June 30, 2014 will be required to submit an implementation plan by January 1, 2015 on how the FBO will comply with the IHC requirement. Enhanced prudential standards will apply to our top-tier U.S.-based bank holding companies beginning on January 1, 2015 until we form or designate an IHC and the IHC becomes subject to corresponding enhanced prudential standards. The Federal Reserve has stated that it will issue, at a later date, final rules to implement certain other enhanced prudential standards under the Dodd-Frank Act for large bank holding companies and large FBOs, including single counterparty credit limits and an early remediation framework.
98
Our New York branch
Our New York branch is licensed by the New York Superintendent of Financial Services to conduct a commercial banking business. Its activity is mainly focused on wholesale and investment banking, providing a full range of lending, investment banking, transactional banking and brokerage services to corporate and institutional investors. Under the New York State Banking Law and regulations, our New York branch is required to maintain eligible high-quality assets with banks in the State of New York, as security for the protection of depositors and certain other creditors.
The New York State Banking Law also empowers the Superintendent of Banks to establish asset maintenance requirements for branches of foreign banks, expressed as a percentage of each branch’s liabilities. The presently designated percentage is 0%, although the Superintendent may impose additional asset maintenance requirements upon individual branches on a case-by-case basis. No such requirement has been imposed upon our New York branch.
The New York State Banking Law authorizes the Superintendent of Financial Services to take possession of the business and property of a New York branch of a foreign bank under certain circumstances, generally involving violation of law, conduct of business in an unsafe manner, impairment of capital, suspension of payment of obligations, or initiation of liquidation proceedings against the foreign bank at its domicile or elsewhere. In liquidating or dealing with a branch’s business after taking possession of a branch, only the claims of depositors and other creditors that arose out of transactions with a branch are to be accepted by the Superintendent of Financial Services for payment out of the business and property of the foreign bank in the State of New York, without prejudice to the rights of the holders of such claims to be satisfied out of other assets of the foreign bank. After such claims are paid, the Superintendent of Financial Services will turn over the remaining assets, if any, to the foreign bank or its duly appointed liquidator or receiver.
Our U.S. Depository Institution Subsidiaries
The Federal Deposit Insurance Corporation Improvement Act of 1991 (the “FDICIA”) provides for extensive regulation of depository institutions (such as Santander Puerto Rico and SovereignSantander Bank), including requiring federal banking regulators to take “prompt corrective action” with respect to FDIC-insured depository institutions that do not meet minimum capital requirements. For this purpose, FDICIA establishes five tiers of institutions: “well capitalized,” “adequately capitalized,” “undercapitalized,” “significantly undercapitalized” and “critically undercapitalized.” As an insured depository institution’s capital level declines and the depository institution falls into lower categories (or if it is placed in a lower category by the discretionary action of its supervisor), greater limits are placed on its activities and federal banking regulators are authorized (and, in many cases, required) to take increasingly more stringent supervisory actions, which could ultimately include the appointment of a conservator or receiver for the depository institution (even if it is solvent). In addition, FDICIA generally prohibits an FDIC-insured bank from making any capital distribution (including payment of a dividend) or payment of a management fee to its holding company if the bank would thereafter be undercapitalized. If an insured depository institution becomes “undercapitalized,” it is required to submit to federal regulators a capital restoration plan guaranteed by the depository institution’s holding company. If an undercapitalized depository institution fails to submit an acceptable plan, it is treated as if it were “significantly undercapitalized.” Significantly undercapitalized depository institutions may be subject to a number of restrictions, including requirements to sell sufficient voting stock to become adequately capitalized, requirements to reduce total assets and restrictions on accepting deposits from correspondent banks. “Critically undercapitalized” depository institutions are subject to appointment of a receiver or conservator.
In July 2013, the U.S. bank regulators issued the U.S. Basel III final rules implementing the Basel III capital framework for U.S. banks and bank holding companies and other U.S. capital reform. Certain aspects of the U.S. Basel III final rules, such as new minimum capital ratios and a revised methodology for calculating risk-weighted assets, will become effective on January 1, 2015. Other aspects of the U.S. Basel III final rules, such as the capital conservation buffer and the new regulatory deductions from and adjustments to capital, will be phased in over several years beginning on January 1, 2015. In addition, the Federal Reserve and other U.S. regulators issued for public comment in October 2013 a proposed rule that would introduce a quantitative liquidity coverage ratio requirement on certain large banks and bank holding companies. The proposed liquidity coverage ratio is broadly consistent with the Basel Committee’s revised Basel III liquidity rules, but is more stringent in several important respects. The Federal Reserve has also stated that it intends, through future rulemakings, to apply the Basel III liquidity coverage ratio and net stable funding ratio to the U.S. operations of some or all large FBOs. Monetary Policy and Exchange Controls
The decisions of the European System of Central Banks influence conditions in the money and credit markets, thereby affecting interest rates, the growth in lending, the distribution of lending among various industry sectors and the growth of deposits. Monetary policy has had a significant effect on the operations and profitability of Spanish banks in the past and this effect is expected to continue in the future. Similarly, the monetary policies of governments in other countries in which we have operations, particularly in Latin America, the United States and the United Kingdom, affect our operations and profitability in those countries. We cannot predict the effect which any changes in such policies may have upon our operations in the future, but we do not expect it to be material.
The European Monetary Union has had a significant effect upon foreign exchange and bond markets and has involved modification of the internal operations and systems of banks and of inter-bank payments systems. Since January 1, 1999, the start of Stage III, see “—Supervision and Regulation—Bank of Spain and the European Central Bank,” Spanish monetary policy has been affected in several ways. The euro has become the national currency of the fifteen participating countries and the exchange rates between the currencies of these countries were fixed to the euro. Additionally, the European System of Central Banks became the entity in charge of the European Union’s monetary policy.
99
C.OrganizationalC. Organizational structure.
Banco Santander, S.A. is the parent company of the Group which was comprised at December 31, 20112013 of 739712 companies that consolidate by the global integration method. In addition, there are 156191 companies that are accounted for by the equity method.
See Exhibits I, II and III to our consolidated financial statements included in this Form 20-F for details of our consolidated and non-consolidated companies.
D.Property,D. Property, plant and equipment.
During 2011,2013, the Bank and its banking subsidiaries either leased or owned premises in Spain and abroad, which at December 31, 20112013 included 4,7814,067 branch offices in Spain and 9,9759,860 abroad. These figures include traditional branches and banking services points but do not include electronic service points. See Item 4 of Part I, “Information on the Company—A. History and development of the company—Principal Capital Expenditures and Divestitures—Acquisitions, Dispositions, Reorganizations and Recent events” herein and Note 16 to our consolidated financial statements.
Item 4A. Unresolved Staff Comments
None.
Critical Accounting Policies
The preparation of the Group’s consolidated financial statements requires a significant amount of judgment involving estimates and assumptions which can be inherently uncertain at the time they are made (see Note 1-c1.c to our consolidated financial statements). Changes in assumptions may have a significant impact on the financial statements in the periods in which they are changed. Judgments or changes in assumptions are submitted to the audit and compliance committee of the board of directors and/or to our regulatory authorities and are disclosed in the notes to our consolidated financial statements.
Management bases its estimates and judgments on historical experience and on various other factors that are believed to be reasonable under current circumstances. Actual results may differ from these estimates if assumptions and conditions change.
We believe that of our significant accounting policies, the following may involve a high degree of judgment:
Fair value of financial instruments
Trading assets or liabilities, financial instruments that are classified at fair value through profit or loss, available for sale securities, and all derivatives are recorded at fair value on the balance sheet. The fair value of a financial instrument on a given date is taken to be the value at which it couldprice that would be bought or soldreceived in a currentsale of an asset or paid to transfer a liability in an orderly transaction between willing parties. If a quoted price in an active market is availableparticipants. The most objective and common reference for an instrument, the fair value of a financial instrument is calculated basedthe price that would be paid for it on that price.an active, transparent and deep market (quoted price or market price).
If there is no market price available for a given financial instrument, its fair value is estimated on the basis of the price established in recent transactions involving the same or similar instruments and, in the absence thereof, on the basis of valuation techniques commonly used by the international financial community, taking into account the specific features of the instrument to be measured and, particularly, the various types of risk associated with it.
100
We use derivative financial instruments for both trading and non-trading activities. The principal types of derivatives used are interest rate swaps, future rate agreements, interest rate options and futures, foreign exchange forwards, foreign exchange futures, foreign exchange options, foreign exchange swaps, cross currency swaps, equity index futures and equity options. The fair value of standard derivatives is calculated based on published price quotations. The fair value of over-the-counter (“OTC”) derivatives is taken to be the sum of the expected future cash flows arising from the instrument, discounted to present value at the date of measurement (“present value” or “theoretical close”) using valuation techniques commonly used by the financial markets as follows:markets: net present value (NPV), option pricing models and other methods.
The following subsections set forth the most important products and families of derivatives, and the related valuation techniques and inputs, by asset class.
| • | Fixed income and inflation |
The fixed income asset class includes basic instruments such as interest rate forwards, interest rate swaps and cross currency swaps, which are valued using the net present value of the discounted estimated future cash flows taking into account basis swap and cross currency spreads, depending on the payment frequency and currency of each leg of the derivative. Vanilla options, including caps, floors and swaptions, are priced using the Black-Scholes model, which is one of the benchmark industry models. More exotic derivatives are priced using more complex models which are generally accepted as standard across institutions.
These pricing models are fed with observable data such as deposit interest rates, futures rates, cross currency swap and constant maturity swap rates, and basis spreads, on the basis of which different yield curves are calculated, depending on the payment frequency and discounting curves for each currency. In the valuationcase of financial instruments permitting static hedging (principally forwards, swaps and cross-currency swaps) andoptions, implied volatilities are also used as model inputs. These volatilities are observable in the valuationmarket for cap and floor options and swaptions, and interpolation and extrapolation of loansvolatilities from the quoted ranges are carried out using generally accepted industry models. The pricing of more exotic derivatives may require the use of non-observable data or parameters, such as correlation (among interest rates and advances to customers classified as Other financialcross-asset), mean reversion rates and prepayment rates, which are usually defined from historical data or through calibration.
Inflation-related assets at fair value through profitinclude inflation-linked bonds and zero-coupon or loss,year-on-year inflation-linked swaps, valued with the present value method using forward estimation and discounting. Derivatives on inflation indices are priced using standard and more complex bespoke models, as appropriate. Valuation inputs of these models consider inflation-linked swap spreads observable in the market and estimations of inflation seasonality, on the basis of which a forward inflation curve is used. Estimated future cash flowscalculated. Also, implied volatilities taken from zero-coupon and year-on-year inflation options are discountedalso inputs for the pricing of more complex derivatives.
| • | Equity and foreign exchange |
The most important products in these asset classes are forward and futures contracts; they also include vanilla, listed and OTC (over-the-counter) derivatives on single underlying assets and baskets of assets. Vanilla options are priced using the yield curves of the related currencies. The yield curvesstandard Black-Scholes model and more exotic derivatives involving forward returns, average performance, or digital, barrier or callable features are priced using generally observable market dataaccepted industry models and are constructed takingbespoke models, as appropriate. For derivatives on illiquid stocks, hedging takes into account the so-called “basis risk” for various terms on the curve and for various currencies.liquidity constraints in models.
In the valuationThe inputs of certain financial instruments exposed to interest rate or inflation risk which require dynamic hedging, such as swaptions, caps and floors, the Black-76 model is used; in the case of more exotic interest rate derivatives, more complexequity models of the evolution of the yield curve are used, such as the Heath-Jarrow-Morton, Hull-White and Markov Functional models. The main inputs used in these models are observable market data, including the relatedconsider yield curves, spot prices, dividends, asset borrowing costs (repo margin spreads), implied volatilities, correlation among equity stocks and correlations. In certain very specific cases, unobservableindices, and cross-asset correlation. Implied volatilities are obtained from market inputs can be used, such as reversion to the mean or the prepayment rate.
In the valuationquotes of financial instruments exposed to equity or foreign currency risk which require dynamic hedging (basically structured optionsEuropean and other structured instruments), the Black-Scholes model is normally used; for more complex instruments, models that are a generalization of the Black-Scholes model are used, such as the Dupire (local volatility)American vanilla call and Heston (stochastic volatility) models or a combination of both (mixed volatility) are used. Where appropriate, observable market inputsput options. Various interpolation and extrapolation techniques are used to obtain factors such ascontinuous volatility surfaces for illiquid stocks. Dividends are usually estimated for the mid and long term. Correlations are implied, when possible, from market quotes of correlation-dependent products. In all other cases, proxies are used for correlations between benchmark underlyings or correlations are obtained from historical data.
The inputs of foreign exchange models include the interest rate curve for each currency, the spot levels, yield curves, dividends,foreign exchange price and the implied volatilities and correlation among assets of this type. Volatilities are obtained from European vanilla call and put options which are quoted in markets as at-the-money, risk reversal or butterfly options. Illiquid currency pairs are usually handled by using the correlation between indices and shares.data of the liquid pairs from which the illiquid currency can be derived. For more exotic products, unobservable model parameters may be estimated by fitting to reference prices provided by other non-quoted market sources.
| • | Credit |
InThe most common instrument in this asset class is the case of swaps designedcredit default swap (CDS), which is used to hedge againstcredit exposure to third parties. In addition, models for first-to-default (FTD), n-to-default (NTD) and single-tranche collateralized debt obligation (CDO) products are also available. These products are valued with standard industry models, which estimate probability of default of a credit event (Credit Default Swaps (CDS)) credit risk is measured using dynamic models similar to those used in the measurement of interest rate risk. In the case of non-linear instruments, if the portfolio is exposed to credit risk (e.g. credit derivatives),single issuer (for CDSs) or the joint probability of default of more than one issuer for FTDs and CDOs.
Valuation inputs are the interest rate curve, the CDS spread curve and the recovery rate. The CDS spread curve is determinedobtained in the market for indices and important individual issuers. For less liquid issuers, this spread curve is estimated using proxies or other credit-dependent instruments. Recovery rates are usually set to standard values. For listed single-tranche CDOs, the Standard Gaussian Copula model. correlation of joint default of several issuers is implied from the market. For FTDs, NTDs and bespoke CDOs, the correlation is estimated from proxies or historical data when no other option is available.
Valuation adjustment for counterparty risk or default risk
The maincredit valuation adjustment (CVA) is a valuation adjustment to OTC derivatives as a result of the risk associated with the credit exposure assumed to each counterparty.
The CVA is calculated taking into account potential exposure with each counterparty in each future period. The CVA for a specific counterparty is equal to the sum of the CVA for all the periods. The following inputs are used to determinecalculate the underlying costCVA:
The debt valuation adjustment (DVA) is a similar valuation adjustment to the CVA but, in this case, as a result of the own risk premiumsof the Group assumed by its counterparties in OTC derivatives.
The CVA and DVA recognized at December 31, 2013 amounted to €739 million and €234 million, respectively.
Valuation adjustments due to model risk
The valuation models described above are not significantly subjective, since they can be adjusted and recalibrated, where appropriate, through the internal calculation of the fair value and the correlation betweensubsequent comparison with the quoted credit derivatives of various issuers.
The determination ofrelated actively traded price. However, fair value requires the use of estimates and certain assumptions. Ifadjustments may be necessary when market quoted market prices are not available fair value is calculated using widely accepted pricing models that consider contractual pricesfor comparison purposes.
The sources of therisk are associated with uncertain model parameters, illiquid underlying financial instruments, yield curves, contract terms, observableissuers, low quality market data or missing risk factors (sometimes the best available option is to use limited models with controllable risk). In these situations, we calculate and apply valuation adjustments in accordance with general industry practice.
The measurements obtained using the internal models might have been different had other relevant factors. The use of different estimatesmethods or assumptions in these pricing models could leadbeen used with respect to a different valuation being recorded in our consolidated financial statements.interest rate risk, to credit risk, market risk and foreign currency risk spreads, or to their related correlations and volatilities.
In Note 2. d) iii. to our consolidated financial statements additional information can be found regarding valuation techniques used by the Group, along with details of the principal assumptions and estimates used in these models and the sensitivityeffect on the fair value of the valuation of financial instruments to changesa reasonable change in the principal assumptions used.used in the valuation.
Allowance for credit losses for financial instruments accounted for at amortized cost
Financial assets accounted for at amortized cost and contingent liabilities are assessed for objective evidence of impairment and any resulting allowances for credit losses are recognized and measured in accordance with IAS 39. Credit losses exist if the carrying amount of an asset or claim or a portfolio of assets or claims exceeds the present value of the estimated future cash flows.
When a loan is deemed partially uncollectible, a provision is recorded (charged against earnings) as opposed to a partial write-off (removal from the balance sheet), since a partial write-off of the loan is not permitted by the Bank of Spain. If a loan becomes entirely uncollectible, the provision is increased to 100% of the loan balance. Accordingly, we recognize a credit loss on any loan at the time it is deemed to be impaired.
The credit loss recognition process is independent of the process for the removal of impaired loans from the balance sheet. The balances relating to impaired transactions continue to be recognized on the balance sheet, for their full amounts, until we consider that the recovery of those amounts is remote.
101We consider recovery to be remote when there has been a substantial and irreversible deterioration of the borrower’s solvency, when commencement of the liquidation phase of insolvency proceedings has been ordered or when more than four years have elapsed since the borrower’s transaction was classified as impaired due to arrears (the maximum period established by the Bank of Spain).
When the recovery of a financial asset is considered remote, it is written-off, together with the related allowance, without prejudice to any actions that the consolidated entities may initiate to seek collection until their contractual rights are extinguished due to expiry of the statute-of-limitations period, forgiveness or any other cause.
For the purpose of determining impairment losses, we monitor our debtors as described below:
As regards impairment losses resulting from materialization of the insolvency risk of the obligors (credit risk), a debt instrument is impaired due to insolvency:
We have certain policies, methods and procedures for covering its credit risk arising both from insolvency allocable to counterparties and from country risk. These policies, methods and procedures are applied in the granting, examination and documentation of debt instruments and contingent liabilities and commitments, and in the identification of their impairment and the calculation of the amounts required to cover the related credit risk.
With respect to the coverage of loss arising from credit risk, we must meet the Bank of Spain requirements, which establish that, until the Spanish regulatory authority has verified and approved the internal models for the calculation of the allowance for losses arising from credit risk (to date it has only approved the internal models to be used to calculate regulatory capital), entities must calculate their credit risk coverage as set forth below:
a. Specific allowance (individuals):
The allowance for debt instruments not measured at fair value through profit or loss that are classified as impaired is generally recognized in accordance with the criteria set forth below:
i. Assets classified as impaired due to counterparty arrears:
Debt instruments, whoever the obligor and whatever the guarantee or collateral, with amounts more than three months past due are assessed individually, taking into account: (i)account the age of the past-due amounts, the guarantees or collateral provided and the financial situation of the counterparty and the guarantors.
ii.Assets classified as impaired for reasons other than counterparty arrears:
Debt instruments which are not classifiable as impaired due to arrears but for which there are reasonable doubts as to their repayment under the contractual terms are assessed individually, and their allowance is the difference between the amount recognized in assets and the present value of futurethe cash flows discounted at an appropriate discount rate; (ii) the debtor’s financial situation; and (iii) any guarantees in place. Clients individually assessedexpected to be received.
b. General allowance for inherent losses (collective):
Additionally, based on its experience and on the borrower’s overallinformation available to it on the Spanish banking industry, the Bank of Spain has established various categories of debt instruments and contingent liabilities, classified as standard risk, which are recognized at Spanish entities or relate to transactions performed on behalf of residents in Spain which are recognized in the accounting records of foreign subsidiaries, and has applied a range of required allowances to each category.
c. Country risk allowance:
Country risk is considered to be the risk associated with counterparties resident in a given country due to circumstances other than normal commercial risk (sovereign risk, transfer risk and risks arising from international financial condition, resources, guaranteesactivity). Based on the countries’ economic performance, political situation, regulatory and institutional framework, and payment capacity and record, we classify all the transactions performed with third parties into six different groups, from group 1 (transactions with ultimate obligors resident in European Union countries, Norway, Switzerland, Iceland, the United States, Canada, Japan, Australia and New Zealand) to group 6 (transactions the recovery of which is considered remote due to circumstances attributable to the country), assigning to each group the credit loss allowance percentages resulting from the aforementioned analyses. However, due to the size of the Group and to the proactive management of our country risk exposure, the allowances recognized in this connection are globally managed clients, corporate, sovereignnot material with respect to the credit loss allowances recognized.
The allowance for credit losses for financial instruments accounted for at amortized cost and contingent liabilities recorded by Grupo Santander as at December 31, 2013, using the methodology outlined above, was €25,652 million.
However, the coverage of the Group’s losses arising from credit risk must also meet the regulatory requirements of IFRS-IASB and, therefore, we check the allowances calculated as described above with those obtained from our own internal models for the calculation of the coverage of losses arising from credit risk in order to confirm that there are no material differences.
Our internal models (a full description of our credit risk management system is included in Item 3 Information on the Company. B Business Overview- Allowance for Credit Losses and Country Risk Requirements and in Item 11. Quantitative and Qualitative Disclosures about Market Risk Part 4. Credit Risk) determine the impairment losses on debt instruments not measured at fair value through profit or loss and on contingent liabilities taking into account the historical experience of impairment and other loans with significant balances.
The amount of an impairment loss incurred on a debt instrument carried at amortized cost is equal to the difference between its carrying amount and the present value of its estimated future cash flows, and is presented as a reduction of the balance of the asset adjusted.
In estimating the future cash flows of debt instruments the following factors are taken into account:
These cash flows are subsequently discounted using the instrument’s effective interest rate (if its contractual rate is fixed) or the effective contractual rate at the discount date (if it is variable).
Credit losses are generally recognized through allowances for credit losses. As a result
Incurred loss is the cost of certain unusual circumstances (for example, bankruptcy or insolvency), the loss can be directly recognized through write-offs. With respect to the coverage of loss arising from credit risk we makeof a transaction that will manifest within a one year lead time from the following distinction:
Country risk allowance:
Country risk is considered to be the risk associated with counterparties resident in a given countrybalance sheet date due to circumstances other than normal commercial risk (sovereign risk, transfer riskan event that had already occurred at the assessment date and risks arising from international financial activity). Based onconsidering the countries’ economic performance, political situation, regulatory and institutional framework, and payment capacity and record, we classify all the transactions performed with third parties into six different groups, from group 1 (transactions with ultimate obligors resident in European Union countries, Norway, Switzerland, Iceland, the United States, Canada, Japan, Australia and New Zealand) to group 6 (transactions the recovery of which is considered remote due to circumstances attributable to the country), assigning to each group the credit loss allowance percentages resulting from the aforementioned analyses.
However, due to the size of the Group and to the proactive management of our country risk exposure, the allowances recognized in this connection are not material with respect to the credit loss allowances recognized.
Specific credit risk coverage:
a. Specific allowance: The allowance for debt instruments not measured at fair value through profit or loss that are classified as doubtful is generally recognised in accordance with the criteria, established by Bank of Spain, set forth below:
i. Assets classified as doubtful due to counterparty arrears:
102
Debt instruments, whoever the obligor and whatever the guarantee or collateral, with amounts more than three months past due are assessed individually. The allowances percentages are determined taking into account the age of the past-due amounts, the guarantees or collateral provided and the financial situationcharacteristics of the counterparty and the guarantors. Loansguarantees and collateral associated with the transaction.
The loss incurred is calculated by multiplying three factors: exposure at default, probability of default and loss given default. These parameters are identified as impairedalso used to calculate economic capital and income no longer accrued whento calculate BIS II regulatory capital under internal models.
For the purposes of calculating the incurred losses PD is measured using a time horizon of one year; i.e. it is determinedquantifies the probability of the counterparty defaulting in the coming year due to an event that collectionhad already occurred at the assessment date. The definition of interest or principal is doubtful or when the interest or principal has beendefault used includes amounts past due forby 90 days or more unless the loan is well secured and cases in the process of collection. According to Bank of Spain’s requirements, non-performing loans must be fully provisioned (hence all the credit loss recognized) when they are more than 12 months overdue
ii. Assets classified as doubtful for reasons other than counterparty arrears:
Debt instruments which are not classifiable as doubtful due to arrears but for which there is no default but there are reasonable doubts as to their repayment under the contractual terms are assessed individually, and their allowancesolvency of the counterparty (subjective impaired assets).
When a loan is deemed partially uncollectible, a provision is recorded (charged against earnings) as opposedIn addition to a partial write-off (removal from the balance sheet), since a partial write-offall of the loan is not permitted by the Bank of Spain. If a loan becomes entirely uncollectible, the provision is increased to 100% of the loan balance. Accordingly, we recognize a credit loss on any loan at the time it is deemed to be impaired.
The credit loss recognition process is independent of the process for the removal of impaired loans from the balance sheet. The balances relating to impaired transactions continue to be recognized on the balance sheet, for their full amounts, until we consider that the recovery of those amounts is remote.
We consider recovery to be remote when there has been a substantial and irreversible deterioration of the borrower’s solvency, when commencement of the liquidation phase of insolvency proceedings has been ordered or when more than four years have elapsed since the borrower’s transaction was classified as doubtful due to arrears (the maximum period established by the Bank of Spain).
When the recovery of a financial asset is considered remote, it is written-off, together with the related allowance, without prejudice to any actions that the consolidated entities may initiate to seek collection until their contractual rights are extinguished due to expiry of the statute-of-limitations period, forgiveness or any other cause.
b. General allowance for inherent losses: Additionally, we recognize an impairment allowance for credit losses when it is probable that a loss has been incurred, taking into account the historical loss experience and other circumstances known at the time of assessment. For this type of allowance, credit losses are losses incurred at the reporting date, calculated using statistical methods that have not yet been allocated to specific transactions
We have implemented a methodology which complies with Bank of Spain requirements and, as is explained below, is consistent with IFRS-IASB for the determination of the level of provisions required to cover inherent losses. This methodology initially classifies portfolios considered normal risk (debt instruments not classified at fair value through profit or loss, contingent risks and contingent commitments) into the following groups, according to the associated level of risk: no appreciable risk, low risk, medium-low risk, medium risk, medium-high risk and high risk.
Once these portfolios have been classified, the Bank of Spain, based on experience and information available to it with respect to the Spanish banking sector, has determined the methodology and parameters that entities should apply inabove, the calculation of the provisions for inherent losses in debt instruments and contingent risks and commitments classified as normal risk.
The calculation establishes thatincurred loss takes into account the charge for inherent losses to be made in each period will be equal to: (i) the sum of multiplying the value, positive or negative,adjustment of the variation in the period of the balance of each class of risk by the constanta corresponding to that class, plus (ii) the sum of multiplying the total amount of the operations included in each class at the end of the period by the relevant ß, minus (iii) the amount of the net charge for theaforementioned factors (PD and LGD), historical experience and other specific allowance made in the period.
103
The parametersa and ß as determined by the Bank of Spain’s guidance take into account historic inherent losses and adjustmentsinformation to reflect the current economic circumstances.conditions.
The allowances for impaired balances recorded by Grupo Santander as atAt December 31, 2011, using the methodology outlined above, was €19,661 million.
Additionally, with the objective of ensuring that the provisions resulting from the application of the above explained criteria required by the Bank of Spain are reasonable, we estimate the allowances for credit losses using models based on our own credit loss experience and management’s estimate of future credit losses. We have developed internal risk models, based on historical information available for each country and type of risk (homogenous portfolios); a full description of our credit risk management system is included in Item 11. Quantitative and Qualitative Disclosures about Market Risk Part 4. Credit Risk. These internal models may be applied in future periods, and although approved for regulatory capital calculations, they are currently subject to local regulatory approval by the Bank of Spain for purposes of loan loss provisions. In order for each internal model to be considered valid by the local regulator for use, the calculation should be methodologically correct, and be supported by historical information which covers at least one complete economic cycle and is stored in databases which are consistent with information that has been audited by both the group internal auditing function and external auditors.
Since 1993, we have employed our own models for assigning solvency and internal ratings, which aim to measure the degree of risk associated with a client or transaction. Each rating corresponds to a certain probability of default or non-payment, based on the Group’s past experience. A more detail description is included in “Item 4. Information of the Company. B. Business Overview. The process: credit rating and parameter estimation”. The development of the internal models has led to the introduction of databases that can be used to estimate the risk parameters required in the calculation of capital and expected loss, following market best practices and the guidelines of the New Capital Accord (Basel II).
These internal models produce a result that is substantially the same as the level of provisions at which we arrive using the parameters established by the Bank of Spain. Therefore,2013 there is no substantialmaterial difference in the calculation of loan allowances between the EU-IFRS required to be applied under the Bank of Spain´sSpain’s Circular 4/2004 (as explained above) and IFRS-IASB.
Impairment
Certain assets, including goodwill, other intangible assets, non-current assets held for sale, equity method investments, financial assets not carried at fair value through profit or loss and other assets are subject to impairment review. We record impairment charges when we believe there is objective evidence of impairment, or that the cost of the assets may not be recoverable. Assessment of what constitutes impairment is a matter of significant judgment.
Goodwill and other intangible assets are tested for impairment on an annual basis, or more frequently if events or changes in circumstances, such as an adverse change in business climate or observable market data, indicate that these assets may be impaired. An impairment loss recognized for goodwill may not be reversed in a subsequent period. The fair value determination used in the impairment assessment requires estimates based on quoted market prices, prices of comparable businesses, present value or other valuation techniques, or a combination thereof, requiring management to make subjective judgments and assumptions. Events and factors that may significantly affect the estimates include, among others, competitive forces, customer behaviors and attrition, changes in revenue growth trends, cost structures and technology, and changes in discount rates and specific industry or market sector conditions.
In relation to goodwill, the first step of the impairment review process requires the identification of the cash-generating units (“CGU”). These are the smallest identifiable group of assets that, as a result of continuing operations, generate cash inflows that are largely independent of the cash inflows from other assets or groups of assets. Goodwill is then allocated to these CGUs; this allocation is reviewed following a business reorganization.
The amount to be recovered of each cash-generating unit is determined taking into consideration the carrying amount (including any fair value adjustments arising on the business combination) of all the assets and liabilities of all the independent legal entities comprising the cash-generating unit, together with the related goodwill.
The amount to be recovered of the CGU, including the allocated goodwill,cash-generating unit is compared towith its fair valuerecoverable amount in order to determine whether anthere is any impairment.
The Group assesses the existence of any indication that might be considered to be evidence of impairment exists. To calculate these fair values, management may use quoted prices, if available, appraisals madeof the cash-generating unit by independent external experts or internal estimations. Assumptions about expected future cash flows require management to make estimations and judgments. For this purpose, management analyzesreviewing information including the following: (i) certain macroeconomic variables that might affect its investments (including population(population data, the political andsituation, economic environment, as well as the banking system’s penetration level);situation -including bankarization-, among others) and (ii) various microeconomic variables comparing our investments with the financial services industry of the country in which we carrythe Group carries on most of ourits business activities (breakdown of the balance(balance sheet composition, total funds under management, results, efficiency ratio, capital adequacy ratio, and return on equity, among others);.
Regardless of whether there is any indication of impairment, every year the Group calculates the recoverable amount of each cash-generating unit to which goodwill has been allocated and, (iii)to this end, it uses price quotations, if available, market references (multiples), internal estimates and based in part on third-party appraisals.
Firstly, we determine the recoverable amount by calculating the fair value of each cash-generating unit on the basis of the quoted price of the cash-generating units, if available, and of the price earnings (“P/E”) ratio of the investments as compared with the P/E ratio of the stock market in the country in which the investments are located and thoseratios of comparable local financial institutions.
104
To supplement this,In addition, we perform estimates of the recoverable amounts of certain cash-generating units by calculating their value in use using discounted cash flow projections. In order to performThe main assumptions used in this calculation the most significant assumptions used are: (i) cash flowearnings projections which are based on the five-year financial budgets approved by the directors;directors which normally cover a five-year period (unless a longer time horizon can be justified), (ii) discount rates which are determined as the cost of capital consisting oftaking into account the risk-free rate of return plus a risk premium in line with the market and the business in which the units operate;operate and (iii) a constant growth raterates used in order to extrapolate the cash flows inearnings to perpetuity which is determined consideringdo not exceed the evolution of GDP oflong-term average growth rate for the market in which the cash-generating unit in question operates.
The cash flow projections used to obtain the values in use are based on the financial budgets approved by both local management of the related local units and the Group’s directors. Our budgetary estimation process is common for all the cash-generating units. The local management teams prepare their budgets using the following key assumptions:
| a) | Microeconomic variables of the cash-generating unit: management takes into consideration the current balance sheet structure, the product mix on offer and the business decisions taken by local management in this regard. |
| b) | Macroeconomic variables: growth is estimated on the basis of the changing environment; taking into consideration expected GDP growth in the unit’s geographical location and forecast trends in interest and exchange rates. These data, which are based on external information sources, are provided by the Group’s economic research service. |
| c) | Past performance variables: in addition, management takes into consideration in the projection the difference (both positive and negative) between the cash-generating unit’s past performance and that of the market. |
Given the degree of uncertainty related toof these assumptions, the directors carry outwe perform a sensitivity analysis thereof using reasonably possiblereasonable changes in the key assumptions on which the recoverable amountsamount of the cash-generating units areis based in order to confirm thatwhether their recoverable amount still exceeds their carrying amount. Following the sensitivity analysis performed, the value in use of all the cash-generating units still exceeds their recoverable amounts still exceedamount.
Based on the carrying amountsforegoing, and therefore noin accordance with the estimates, projections and sensitivity analyses available to the Bank’s directors, in 2013 we recognized impairment would be recorded throughlosses on goodwill totaling €40 million (2012: €156 million; 2011: €660 million) under Impairment losses on other assets (net) - Goodwill and other intangible assets. In 2011 all the income statement. Asimpairment losses recognized related to Group subsidiaries in Portugal. These losses were attributed to the macroeconomic deterioration in Portugal. In 2012 the impairment losses recognized, which were due mainly to the deterioration of business expectations, related mainly to Group subsidiaries in Italy.
At December 31, 2011, 2010 and 2009,2013, none of our otherthe cash-generating units with significant goodwill had a recoverable amount below or near itsapproximating their carrying amount. The recoverable amount is considered to be close to the carrying amount except as described below.
In 2011, our impairment reviews resultedwhen reasonable changes in impairment charges of €660 million relatedthe main assumptions used in the valuation cause the recoverable amount to goodwill of our subsidiaries in Portugal and €501 million duebe below the amount to the review of the useful lives of our intangible assets.be recovered.
Non-current assets held for sale are measured at the lower of fair value less costs to sell and the carrying amount. Therefore, we annually conduct a review of the recoverable values of these assets, taking into account the features of our assets and using specialist externalbased in part on third-party appraisals. After performing this assessmentthese assessments at December 31, 2011, 20102013, 2012 and 20092011 the allowance that covers the value of our non-current assets held for sale amounted to €4,955 million, €4,416 million and €4,512 million, €2,500 million, €2,081 million, respectively.
Equity method investments are evaluated for impairment on an annual basis or more frequently if events or changes in circumstances indicate that these assets are impaired. An equity method investment is impaired if its fair value is deemed to be less than its cost. Accordingly, we evaluate whether an event or change in circumstances has occurred that may have a significant adverse effect on the fair value of the investment. After performing this analysis, an impairment loss of €100 million on the investment in Metrovacesa was recorded in 2011. In 2013 and 2012 there was no evidence of material impairment on the Group’s equity method investments.
In relation to the available for sale securities (debt and equity instruments) at the end of each year, we make an assessment of whether there is any objective evidence that any our available for sale securities of is impaired. This assessment includes but is not limited to an analysis of the following information: (i) the issuer’s economic and financial position, the existence of default or late payment, analysis of the issuer’s solvency, the evolution of its business, short-term projections, trends observed with respect to its earnings and, if applicable, its dividend distribution policy; (ii) market-related information such as changes in the general economic situation, or changes in the issuer’s sector which might affect its ability to pay; (iii)iii) changes in the fair value of the security analyzed, andanalysis of the reason fororigins of such changes-whetherchanges - whether they are intrinsic or the result of the general uncertainty concerning the economy or the country-;country - and (iv)iv) independent analysts’ reports and forecasts and other independent market information.
In the case of equity instruments, when the changes in the fair value of the instrument under analysis are assessed, the duration and significance of the fall in its market price below cost for us is taken into account. As a general rule, for these purposes we consider a significant fall to be a 40% drop in the value of the asset and/or a continued fall over a period of 18 months. Nevertheless, it should be noted that we assess, on a case-by-case basis each of the securities that have suffered losses, and monitors the performance of their prices, recognizing an impairment loss as soon as it is considered that the recoverable amount could be affected, even though the price may not have fallen by the percentage or for the duration mentioned above.
105
If, after the above assessment has been carried out, we consider that the presence of one or more of these factors could affect recovery of the cost of the asset, an impairment loss is recognized in the income statement for the amount of the loss in equity under Valuationvaluation adjustments. Also, where we do not intend and/or are not able to hold the investment for a sufficient amount of time to recover the cost, the instrument is written down to its fair value.
Upon impairment, the full difference between amortized cost and fair value is removed from equity and recognized in net profit or loss. Impairments on debt securities may be reversed if there is a decrease in the amount of the impairment which can be objectively related to an observable event. Impairments on equity securities may not be reversed.
At the end of 20112013 we performed the assessment described above and recognized in the consolidated income statement impairment losses of €125€89 million in respect of debt instruments (€1418 million in 20102012 and €42€125 million in 2009),2011, of which included €106 million relatingrelated to Greek sovereign debt.debt). At 2011, 20102013, 2012 and 20092011 year-end, we analyzed the additional unrealized revaluation losses related to debt instruments and we concluded that they were temporary and, therefore, there was no evidence of impairment since the interest payment schedules for all the securities had been complied with and there was no evidence that the issuers would not continue to meet their payment obligations or that the future payments (both principal and interest) would not be sufficient to recover the cost.
At the end of 2011,2013, most of the losses on government debt securities recognized in the Group’s equity (approximately 96.9%68.71% of the total) related to the decline in value of the Spanish and Portuguese government debt securities. This decline in value was not prompted by interest rate changes but rather by an increase in the credit risk spreads due to eurozone debt market tensions exacerbated by the interventions in Ireland, Greece and Portugal. Thererecent years; there had not been any default on payments of interest nor was there any evidence that the issuers would fail to continue to meet their paymentspayment obligations in the future, with respect both to principal and interest, and thus prevent recovery of the carrying amount of such securities.
During 2011, 20102013, 2012 and 20092011 we completed the analysis described above for equity securities and we recognized impairments amounting to €69 million (€344 million in 2012 and €704 million (€319 million in 2010 and €494 million2011). The impairment losses recognized in 2009), which2011 included €592 million relating to the impairment of the ownership interests in Iberdrola, S.A. and Assicurazioni Generali SpA. These equity instruments had suffered a significant and prolonged fall in price as of December 31, 2011. No additional significant impairments were recorded in 20112013 for the remainder of the equity securities that showed unrealized losses as of December 31, 20112013 because, after carrying out the abovementioned analysis, we concluded that their carrying value was still recoverable.
Retirement Benefit Obligations
We provide pension plans in most parts of the world. For defined contribution plans, the pension cost recognized in the consolidated income statement represents the contribution payable to the scheme. For defined benefit plans, the pension cost is assessed in accordance with the advice of a qualified external actuary using the projected unit credit method. This cost is annually charged to the consolidated income statement.
The actuarial valuation is dependent upon a series of assumptions; the principal ones are set forth below:
assumed interest rates;
mortality tables;
annual social security pension revision rate;
price inflation;
annual salary growth rate; and
the method used to calculate vested commitments to current employees.
The difference between the fair value of the plan assets and the present value of the defined benefit obligation at the balance sheet date adjusted for any historic unrecognized actuarial gains or losses and past service cost, is recognized as a liability in the balance sheet.
106
Further information on retirement benefit obligations is set out in Notes 2 and 25 to our consolidated financial statements.
Business combinations and goodwill
Goodwill and intangible assets include the cost of acquired subsidiaries in excess of the fair value of the tangible net assets recorded in connection with acquisitions as well as acquired intangible assets which include core deposits, customer lists, brands and assets under management. Accounting for goodwill and acquired intangible assets requires management’s estimates regarding: (1) the fair value of the acquired intangible assets and the initial amount of goodwill to be recorded, (2) the amortization period (for identified intangible assets other than goodwill) and (3) the recoverability of the carrying value of acquired intangible assets.
To determine the initial amount of goodwill to be recognized on an acquisition, we have to determine the fair value of the consideration and the fair value of the net assets acquired. We use independent appraisers and our internal analysis, generally based on discounted cash flow techniques, to determine the fair value of the net assets acquired and non-cash components of the consideration paid. The actual fair value of net assets acquired could differ from the fair value determined, resulting in an under- or over-statement of goodwill.
We test goodwill for impairment at the reporting unit level. We identify our reporting units as one level below our business segments, based on our management structure. We keep those reporting units unchanged unless business segment reorganization occurs. We disclose our goodwill impairment assessment methodology in “Critical Accounting Policies – Impairment”.
The useful lives of acquired intangible assets are estimated based on the period over which the assets are expected to contribute directly or indirectly to the future cash flows of the acquired entity.
For acquired intangible assets, the amortization period is reviewed annually. In making these assumptions, we consider historical results, adjusted to reflect current and anticipated operating conditions. Because a change in these assumptions can result in a significant change in the recorded amount of acquired intangible assets, we believe the accounting for business combinations is one of our critical accounting estimates.
As a result of the first consolidation of the acquired subsidiaries, Banco Real (2008), Sovereign (2009), Santander Cards UK (2009)merger of Bank Zachodni WBK S.A. and Kredyt Bank S.A. (2013), Skandinaviska Enskilda Banken (SEB) Group’s commercial banking business in Germany (2011) and Bank Zachodni WBK, S.A. (2011), a significant amount of goodwill was recorded (see Note 3 and Note 17 to our consolidated financial statements). Management made this determination, based in part upon independent appraisals of intangible assets, which is initially estimated and subsequently revised within the one year time period allowed by IFRS-IASB.
Recent Accounting Pronouncements
See Note 1.b to our consolidated financial statements for the detail of standards and interpretations that came into force in 20112013 and those with effective dates subsequent to December 31, 2011.2013.
We have based the following discussion on our consolidated financial statements. You should read it along with these financial statements, and it is qualified in its entirety by reference to them.
In a number of places in this report, in order to analyze changes in our business from period to period, we have isolated the effects of foreign exchange rates on our results of operations and financial position. In particular, we have isolated the effects of depreciation/appreciation of local currencies against the euro because we believe that doing so is useful in understanding the development of our business. For these purposes, we calculate the effect of movements in the exchange rates by multiplying the previous period balances in local currencies by the difference between the exchange rate to the euro of the current and the previous period.
107
General
We are a financial group whose main business focus is retail banking, complemented by global wholesale banking, asset management and insurance businesses.
Our main source of income is the interest that we earn from our lending activities, by borrowing funds from customers and money markets at certain rates and lending them to other customers at different rates. We also derive income from the interest and dividends that we receive from our investments in fixed/variable income and equity securities and from our trading activities in such securities and derivatives, by buying and selling them to take advantage of current and/or expected differences between purchase and sale prices.
Another source of income are the commissions that we earn from the different banking and other financial services that we provide (credit and debit cards, insurance, account management, bill discounting, guarantees and other contingent liabilities, advisory and custody services, etc.) and from our mutual and pension funds management services.
In addition, from time to time, we derive income from the capital gains we make from the sale of our holdings in Group companies.
20112013 Overview
We conducted our business in an economic environment of slower growth than in 2012, with business activity decelerating in some countries for the whole year, but improving as the year progressed, backed by a cyclical improvement in developed economies. The year ended with the euro zone out of recession as of the second quarter and with the U.K. and the U.S. showing firm signs of recovery. Emerging countries, particularly China, maintained solid growth despite their slowdown. In this environment, the main central banks insisted on keeping interest rates low for a prolonged period of time, indicating that monetary stimulus would be maintained.
The euro zone took major steps towards establishing a banking union. Of note was the approval of the Single Supervisory Mechanism that will come into force in November 2014, and the first agreement on the Banking Recovery and Resolution Directive and the Single Resolution Mechanism, which is expected to be approved and operating in January 2015. All of this helped improve the conditions in the wholesale markets, particularly those related to sovereign debt, which led to sharp decreases in risk premiums.
In the U.S., the upswing in private domestic demand, well established in an expanding housing sector, lower unemployment and the banking sector’s financing capacity, was the main driver of growth (fourth quarter GDP: +0.6% quarter-on-quarter; +2.5% year-on-year) and the recovery in employment produced growth of 1.9% for the whole of 2013. In this scenario, and after Congress’s agreement to reduce fiscal uncertainties, the Federal Reserve confirmed its tapering plan as of the beginning of 2014, although it remained committed to keeping short-term interest rates at their current levels until 2015.
Latin American economies and financial markets reflected in their currencies and investment flows the change envisaged in the Fed’s liquidity injection policy, although the impact varied by country. Its impact was very limited on the region’s growth, which remained in line with that of 2012, although it contributed to a general depreciation of emerging countries’ currencies in January 2014.
In 2011,Brazil, fourth quarter GDP growth eased to 1.9% year-on-year, bringing the global economy experienced a slowdown in growth as a resultfor the whole year to 2.3%. This performance was driven by the strength of consumption and the labor market offsetting investor weakness. Inflation decreased from the beginning of the worseningyear, but remained high, which triggered several increases in the benchmark Selic rate to 10% at the end of 2013 (+275 basis points), and a further increase in January 2014 to 10.50%. These hikes did not stop the European sovereign debt crisisreal from depreciating after the Fed’s first announcements regarding its tapering plan in May.
Mexico lost momentum in the fourth quarter (+0.2% quarter-on-quarter and +0.7% year-on-year) due to the corresponding decrease in confidence, with various episodesreduced impulse from the public and industrial sectors, which brought growth to 1.1% for the whole of uncertainty2013. With inflation on target, the central bank focused on growth and reduced the benchmark rate in the second half of the year which gave riseto 3.50% (-50 basis points), while the peso remained relatively stable.
Chile’s growth eased in the fourth quarter (-0.1% quarter-on-quarter and +2.7% year-on-year) due to a tighteningdrop in equipment investments. The GDP growth for the whole year was 4.1%. With inflation under control, the central bank cut its benchmark rate by 50 basis points to 4.50%, the first reduction since January 2012, and the peso remained stable.
The euro zone, out of financing conditions. This scenariorecession since the second quarter, expanded at a higher rate in the fourth quarter (+0.3% quarter-on-quarter; +0.5% year-on-year), backed by less restrictive fiscal and monetary conditions and upturns in the peripheral countries (quarter-on-quarter Portugal: +0.5%; Spain: +0.2% and Italy: +0.1%). Of note was partially offset by a general easing of monetary policy: injections of liquidity bythe growth in Germany (+0.4%) and in France (+0.3%).
With inflation below 1%, the European Central Bank (ECB) cut its benchmark rate again to 0.25% (-50 basis points in 2013) and stated its intention to keep the continuedbenchmark rate low interest“for an extensive period of time” and continue to inject all the necessary liquidity into the financial system. Meanwhile, the early return by banks to the ECB of three-year borrowed funds reduced the surplus of liquidity, exerting pressure on short-term money market rates and contributing to the euro’s appreciation against the dollar.
In Spain, the economy registered in the USthird quarter positive growth over the second quarter (+0.1% quarter-on-quarter; -1.1% year-on-year), for the first time since the start of 2011. The recovery in private consumption and cutscapital goods, added to the strength of exports, explains this upward trend. The 0.2% growth in official ratesthe fourth quarter and the job creation figures on a seasonally adjusted basis confirmed the exit from recession. For the whole of 2013, GDP decreased 1.2%.
Throughout 2013, progress in Latin America.correcting imbalances, the strength of the external sector, further improvements in competitiveness from the decline in unit labor costs and the advances in structural reforms, both in Spain as well as European governance, enabled relaxation of the markets, and reduced the risk premium sharply. This trend continued in early 2014. At the end of 2013, the premium over the benchmark 10-year German bond was 220 basis points, down from 395 basis points at the end of 2012 and a high of 637 basis points in July 2012.
The United States looks set for year-on-year growthU.K. economy remained strong in GDP of 1.7% in 2011, after athe fourth quarter (+0.7% quarter-on-quarter and 2.7% year-on-year), thanks to private consumption, improvements in employment and lending, which annualized quarterlyjoined the impulse from the residential and external sectors. The growth forecast for the whole of 2013 was 3%1.8%.
With inflation close to target, the Bank of England held its base rate. However, in the face of the strong economic improvement, particularly consumption and housing, the Bank of England recommended ending the Funding for Lending Scheme for households, while keeping it for companies. This would represent the first reduction in monetary stimulus measures. All of these factors strengthened sterling’s appreciation against the dollar and partially corrected its depreciation against the euro.
The Polish economy continued to accelerate in the fourth quarter (+0.6% quarter-on-quarter and +2.7% year-on-year), which helpedwith more balanced growth, a greater weight of consumption and private investment, as well as an upturn in employment and continued strength in the economy to partly offsetexternal sector. An important factor was the slumplarge cut in growththe central bank’s benchmark rate in the first half of 2011. This growth, basically underpinned through the year by investment(to 2.50% in capital goods and foreign trade, is gradually giving way toJuly 2013 representing a 225 basis point reduction from September 2012) in an increase in both consumption and investment in non-residential construction, which is expected to continue in the coming quarters, taking growth close to its potential.
The impactenvironment of crude oil prices and greater use of the installed capacity took the generalcontained inflation, rate to an annual average of over 3%. However, underlying inflation was kept under control at around 1.5%, enabling the Fed to pursue a monetary policy in favor of growth and the re-establishment of the interbank market.
Latin America kept up a good pace of growth in its economies in the year overall, albeit slower than in 2010. The second half of 2011 reflected the effects of the slowdown in the global economy and the decrease in commodities prices. To counteract these negative effects on growth, some central banks embarked on a cycle of monetary easing which is not yet complete, applying a strategy that is likely to be replicated by others in the course of 2012.
Brazil’s GDP increased 3.0% in 2011, after a strong start (4.2% year-on-year in the first quarter) which then slowed, touching bottom in the third quarter. The decrease in growth led the Central Bank of Brazil to begin a gradual reduction of the official Selic rate from 12.50% in September 2011 to 10.50% in January 2012, a trend which is expected to continue in the coming months.
Monetary easing and robust domestic demand, underpinned by a sound labor market (unemployment at a record low rate: below 5%), will continue to drive growth. Also inflation remained high (6.5% in December) and occasionally topped the Central Bank target (4.5±2%). With regard to the Brazilian real, the variation in interest rates in the second half of the year and the government’s measures to control excess appreciation led to a depreciation of the currency over the year as a whole, ending 2011 at BRL 1.87 = USD 1 (compared to BRL 1.66 = USD 1 at the end of 2010).
Mexico displayed great resistance in 2011 to the international financial turmoil and the weakening of global activity. Its GDP growth for 2011 was 3.9%. Performance was supported by industrial output, investment and the recovery of bank lending to the private sector, particularly consumer lending, which is expected to remain strong over the coming quarters despite the external uncertainties.
The positive trend in activity, moderate inflation (an average rate of 3.4% in 2011) within the target bands of the Bank of Mexico (2%-4%), and a position in foreign trade favored bydepreciated zloty against the rise in oil prices, have enabled the central bank to keep the interest rate stable at 4.5% and preserve its room for manoeuvre. The Mexican peso fell during the year after closing at a high of MXN 13.9 = USD 1 (compared to MXN 12.4 = USD 1 at the end of 2010), as a result of the international financial tensions in the second half of the year.
108
Chile recorded growth of 5.9% in GDP for the year as a whole, assisted partly by the weak start to 2010 as a result of the earthquake. A trend of slowdown can be seen, however, accentuated in the second half by the international tensions, which is expected to continue over the coming quarters in response to a weaker external environment and less impetus from private spending.
Inflation remained under control throughout 2011 (at an average rate of 3.3%), which enabled the central bank to halt the upward trend in interest rates in the second half (after a rise of 200 basis points from the beginning of the year to 5.25% in June). The upturn in inflation towards the end of the year (4.4% in December) is expected to be temporary and therefore the central bank is expected to maintain current positions to ease monetary policy and boost growth, as reflected by the reduction in January of 25 basis points to 5%. Like the region’s other main currencies, the Chilean peso fell during the year, ending at CLP 519 = USD 1 (compared to CLP 468 = 1 USD at the end of 2010).
The Eurozone registered growth of 1.5% in 2011. In the second half of the year there was a marked slowdown in activity with the materialization of threats to recovery (the rise in commodities prices and the earthquake in Japan, which had a greater impact than expected), combined with the unconvincing handling of the sovereign debt crisis. GDP for the fourth quarter contracted by 0.3% (annualized quarterly rate) and this downward trend is expected to continue into the beginning of 2012.
Inflation, which remained higher than the ECB target throughout the year (an average rate of 2.7% compared to the target of 2%), began a downward trend in December when it fell from 3.0% to 2.8%, which is expected to continue, taking it back to the target level.
Against this background of sharp slowdown and uncertainty, in the fourth quarter the ECB reversed the two rate increases it had madeeuro in the first half of 2011 (from 1.0% to 1.5%) to end December with the official interest rate at 1%. It also re-established unconventional liquidity transactions and in December held another long-term auction (three-year financing with no limit on volume) whichyear. In the second half, part of this was repeated in February 2012. As for the exchange rate, the increasing tension in the Eurozone and the deterioration of activity led to a progressive depreciation of the euro against the dollar which ended December at €1 = USD 1.29 (compared to €1 = USD 1.34 at the end of 2010).
There continue to be differences between the countries in terms of economic situation and outlook. Most disadvantaged are the so-called peripheral economies that are facing a greater loss of confidence and higher financing costs, combined with the contractive effect of the fiscal adjustment policies. Conversely, Germany’s underlying situation is more favorable. Withcorrected. The GDP growth of 3.1% in 2011, the unemployment rate fell to 6.8%, the lowest since 1991. However, as in the Eurozone as a whole, activity in the fourth quarter shrank by 0.3% (annualized quarterly rate), bringing the Eurozone GDP growth to 1.5% for the whole of 2011.
Spain’s GDP growth of 0.7% for the year as a whole was based on a strong foreign sector that has made up for the weak domestic demand. However, the clear trend of slowdown experienced since the summer (0.0% in the third quarter), points to a fall of 0.3% in GDP in the fourth quarter due to the reduction in consumption. The continuation of these trends combined with the impact of the substantial effort for budgetary consolidation indicates a likely return to recession for the Spanish economy in 2012 according to all the forecasts. Against this background, inflation, which remained very high throughout the year (3.2% on average) mainly due to the increase in energy prices, fell significantly towards the end of the year (2.4% in December)1.6%.
The United Kingdom obtained similar levels and profiles of growth: +0.8% for the whole of 2011 as a result of a fall in the fourth quarter. The worsening of the international financial situation and trade and weak domestic demand explain the downturn in activity, which is expected to continue in the coming quarters, albeit partially offset by a more stable labor market. Inflation, which was very high throughout the year (4.5% average rate), is on a clearly downward path (4.2% in December compared with 5.2% in September) that is expected to continue in 2012. The Bank of England, which kept its official rate unchanged at 0.5%, increased the bond purchase program by GBP 75 billion in October to add to the GBP 200 billion acquired previously. All in all, the pound sterling rose during the year against the euro, affected by the sovereign debt crisis in Europe, to €1.20 = GBP 1 (€1.16 = GBP 1 at the end of 2010).
109
Results of Operations for Santander
Summary
Profit attributable to the Parent bank as reported in our consolidated financial statements for the year ended December 31, 20112013 was €5,351€4,370 million, a 34.6%90.4% or €2,830€2,075 million increase from €2,295 million in 2012, which represented a 56.9% or €3,035 million decrease from €8,181€5,330 million in 2010, which represented an 8.5% or €761 million decrease from €8,942 million in 2009. The 2011 decrease was mainly due to increases in impairment losses, losses on non-current assets held for sale and administrative expenses, which were partially offset by an increase in interest income/ (charges) and2011.
There are a decrease in the income taxes.
The following aspects hadnumber of factors that have an impact on the Group’s results:year-on-year comparison:
The climate of macroeconomic slowdown and record low interest rates after appreciable decreases in some countries in which the Group was operating. This is combined with the strategy followed by the Group of giving preference to capital and liquidity which increased our financing costs.
The impact of the exchange rates of the various currencies against the euro was not very significant at around one6 negative percentage point negativepoints for the Group as a whole in comparing revenuesthe comparison of income and costs with 2011. Inyear on year. By country, the UKmain negative impacts were in Brazil (-12 percentage points), the United Kingdom and Latin America, the impact was one percentage point negative and in Sovereign fiveChile (-5 percentage points negative.
There is a positive impact of approximately three or four percentage points in revenues and costs from the change in perimeter. This impact is the net effect of the entry into consolidation of Bank Zachodni WBK and AIG in Poland and SEB in Germany (Santander Retail) and lower revenues from insurance business, as the transaction with Zurich Financial Services closed in the fourth quarter.
The results are impacted by an €1,812 million provision to cover real estate exposure in Spain and by net capital gains of €1,513 million arising from the entry of new partners in the capital of Santander Consumer USA and from the sale of the insurance business in Latin America.
Lastly, we recognized impairment losses of €1,161 million in goodwill and other intangible assets relating to our subsidiaries in Portugal (€660 million) and other intangible assets (€501 million).
Interest Income / (Charges)
InterestNet interest income was €30,821€25,935, a 13.3% or €3,988 million decrease from €29,923 million in 2011,2012, which represented a 5.5%2.2% or €1,597€670 million increasedecrease from €29,224€30,594 million in 2010, which represented an 11.1% or €2,925 million increase from €26,299 million in 2009.2011.
20112013 compared to 20102012
The €1,597€3,988 million increasedecrease in net interest income was mainly due to:
The performance of net interest income by countries was the following:
Our overall net yield spread increased from 2.62% in 2010 to 2.69% in 2011. Domestic net yield spread increased from 0.92% in 2010 to 1.02% in 2011. International net yield spreads decreased from 3.37% in 2010 to 3.32% in 2011.
Average totalThe average balance of interest earning assets in 2013 was €1,118,157 million, which was 6.0% or €71,019 million less than in 2012. This decrease occurred mainly in Spain (-€43,269 million), despite its lower relative weight. Within this, the biggest drops were €1,126,196 million for 2011,in Loans and advances to customers (-€20,416 million), as a 3.1% or €33,771 million increase from €1,092,425 million in 2010. This was due to an increaseresult of €53,612 million in the average balances of our international total earning assets (mainly due to an increase of €31,161 million in the average balances of loansdeleveraging process, and creditsCash and an increase of €20,323 million in the average balances due from central banks)banks (-€14,582 million). This increase inThe balances of the international total earning assets was partially offset by a decrease of €19,841component declined €27,750 million in the domestic sector. This decrease was mainly due to a fall of €7,406 million in average loans and credits and €7,252 million in the average of due from credits entities. The Group’s customer loans amounted to €769,036 million, 3.4% higher than in 2010. In local currencies and excluding the perimeter effects, customer loans were 3.0% higher.
110
Spain and Portugal’s lending fell by 4.6% and 5.6%, respectively, due to deleveraging. Santander Consumer Finance’s lending dropped 4.8%, due to the impact of the consolidation by the equity accounted methodchanges in exchange rates.
The geographic distribution (principal segments) of Santander Consumer USA in December 2011 (+16.1% before this impact). The consolidation of Bank Zachodni WBK increased the Group’s net lending by €8,479 million.
Gross customer loans was very different by market.
In Portugal, the fall in lending (5.6%) came from all segments: -11.8% to SMEs, -13.9% to companies and -3.1% to individuals. In addition, balances in construction and real estate, which represent only 3.6% of lending in the country, declined 12.1% in 2011.
Portugal. Santander Consumer Finance’s total lending afterremained stable, while Poland registered positive growth both organically as well as from the deconsolidationincreased perimeter. The balance of Santander Consumer USA, dropped 4.8%. ExcludingSpain’s run-off real estate activity was much lower, as we maintained the strategy of reducing this impact, growth was 16.1% due to organic growth plus SEB’s integration in Germany. New lending rose 11.1%.type of risk.
At the end of 2013, Continental Europe accounted for 40% of the Group’s total net lending (24% Spain), the U.K. 36%, Latin America 20% (10% Brazil) and the U.S. 6%.
The average balance of interest-bearing liabilities in 2013 was €1,100,712 million, which was 6% or €70,819 million less than in 2012, with a 14 basis points improvement in their average cost, taking it to 2.32%. This improvement was primarily in the cost of customer deposits, which fell 24 basis points.
The main reason for the drop in average liabilities, as in the case of assets, was Spain (-€42,828 million), as a result of the decreases in transactions with credit institutions (-€33,685 million, mainly because of the repayment of the Long-term Refinancing Operation “LTRO” funds, obtained from the ECB at the end of 2011), marketable securities (-€11,609 million) and other interest-bearing liabilities (-€16,106 million). In contrast, domestic customer deposits increased by €20,434 million. Balances were also down in the international component (-€27,991 million), mainly due to organic growthlower customer deposits (-€24,446 million) affected by exchange rates.
The development by geographic distribution (principal segments) of customer deposits as of December 31, 2013 as compared to December 31, 2012 was the following:
Sovereign’s loans rose 6.0% in dollars,Poland due to the 4.5% increaseentry of Kredyt Bank.
Continental Europe accounted for 42% of the Group’s total lending (29%customer deposits (30% Spain), the UK 34%U.K. 31%, Latin America 19% (11% Brazil)21% (Brazil 10%) and Sovereign 5%. These percentages in 2010 were 45% for Continental Europe (32% Spain), 32% the UK, 18% Latin America (10% Brazil) and 5% Sovereign.U.S. 6%.
20102012 compared to 20092011
The €2,925€670 million increasedecrease in interest income in 2010compared to 2011 was mainly due to an increasethe change in consolidation method of €3,133 millionSCUSA, which was accounted for by the equity method in business volumes partially offset byDecember 2011. On a decreaselike for like basis (mainly deducting the change in consolidation method of customer rates by €208 million. InternationalSCUSA) net interest income grew by €4,681 million while domestic net interest income decreased by €1,755 million. increased 3.6%. This increase was mainly attributable to:
Our net interest income by geographic areas was as follows:
Our overall net yield spread increased from 2.54% in 2009 to 2.62% in 2010. Domestic net yield spread decreased from 1.45% in 2009 to 0.92% in 2010. International net yield spreads increased from 3.05% in 2009 to 3.37% in 2010.
Average total earning assets were €1,092,425€1,193,782 million for the year ended December 31, 2010, an 8.8%2012, a 6.2% or €88,469€69,190 million increase from €1,003,956€1,124,592 million forin 2011. This increase was divided among the same periodinternational and domestic sectors, which grew €31,931 million and €33,642 million, respectively. By line items the growth in 2009. Thisaverage total earning assets was due toto: (i) an increase of €6,047€34,165 million in the average balances of our domestic totalother interest earning assets (mainly due to an increasehedging derivatives), (ii) a rise of €4,637€20,174 million in the average balancesloans and credits, and (iii) a growth of debt securities and an increase of €8,458€15,049 million in the average balances due from credit entities partially offset by a decrease of €6 billion in the average balances of our domestic loan and credit portfolio) and an increase of €82,421 million in the average balance of our international total earning assets (mainly due to an increase of €45,550 million in the average balances of our international loan and credit portfolio, an increase of €27,003 million in the average balances of cash and due from central banks and an increasebanks. Although average loans increased during 2012, by year end gross loans declined 4% as compared to 2011. The geographic distribution (principal segments) of €14,886 million in the average balances of our debt securities portfolio partially offsetcustomer loans was very different by a decrease of €6,908 million in the average balances due from credit entities).
111
Our net
Spain and Portugal’s lending fell by 4% and 7%, respectively, due to deleveraging and the selective growth policy followed by the Group in these countries. Santander Consumer Finance’s lending increased 11%.Portugal.
Gross lending in Spain amounted to €236 billion, of which €61,387 million were household mortgages. Loans to SMEs and companies not related to the construction and real estate sectors amounted to €94,406 million, virtually the same as in 2009.
In Portugal, the fall in lending was mainly due to lower lending to large companies, where there was a shift from loans to capital markets. In addition, balances in construction and real estate, which represent only 3% of lending, declined 10% in 2010.
Santander Consumer Finance’s balance increased 11% due to organic growth and the integration of the portfolios acquired in the US and Poland. New loans increased 9%, a significant positive trend.
Lending in Latin America gradually accelerated through the year and ended 2010remained flat with growth of 15%, excluding the exchange rate effect. Specifically, growth rates in Brazil, Mexico and Chile were 16%, 15% and 14%, respectively (versus negative rates in 2009).
Sovereign’s loans declined 2% in dollars, affected by the reduction of the portfolio in run-off (-32% in 2010 and -62% since Sovereign joined the Group). This resulted in a reduction from $9.7 billion to $4 billion. In addition, the focus during 2010 was on new0.2% increase.
These changes are reflected in the lesser share of lending in Europe and the increase in Latin America. U.S. increased 2.8%.
At the end of 2010,2012, Continental Europe accounted for 45%40% of lending of the Group’s total lending (32% for Spain)operating areas (Spain 25%), the UK 32%U.K. 34%, Latin America 18% (10% for Brazil)20% (Brazil 11%) and Sovereign 5%the U.S. 6%. The respective figures a year earlier were 47% forThese shares in 2011 were: Continental Europe 33% for41% (Spain 25%), the UK, 15% forU.K. 34%, Latin America 19% (Brazil 11%) and 5% for Sovereign.the U.S. 6%.
Income from Equity Instruments
Income from equity instruments was €378 million in 2013, an 11% or €45 million decrease from €423 million in 2012, which was a 7% or €29 million increase from €394 million in 2011, an 8.8% or €32 million increase from €362 million in 2010, which was a 17.0% or €742011.
The €45 million decrease from €436 million in 2009.
The €322013 and the €29 million increase in 2011 was mainly explained by increased dividends from Telefónica and Repsol-YPF partially offset by a further reduction from Iberdrola.
The €74 million decrease in 20102012, was mainly explained by the reductionvariation in dividends from our share capital in Iberdrola and Repsol-YPF and the sale of Unicredit Capitalia SPA and Cielo, S.A.
112
Income from Companies Accounted for usingby the Equity Method
Income from companies accounted for by the equity method was €500 million in 2013, a €73 million increase from €427 million in 2012, which was a €370 million increase from €57 million in 2011, a €40 million increase from €17 million in 2010, which was a €18 million increase from €-1 million in 2009. This is mainly due2011. In this line item we record the contribution to the results obtained from ZS Insurance América, S.L. In December 2011,Group of Santander Consumer USA was consolidated byand the equity method. The impactcorporate insurance transactions in Europe and Latin America. Starting in 2014, we are fully consolidating Santander Consumer USA financial statements. See Item 4 of this change will be reflected in this line item in 2012.Part I, “Information on the Company—A. History and development of the company—Principal Capital Expenditures and Divestitures—Recent events”.
Fee and Commission Income (net)
Fee and commission income was €10,472€9,761 million in 2011,2013, a 7.6%5% or €737€499 million increasedecrease from €9,735€10,260 million in 2010.2012. Excluding the exchange rate impact, it increased 0.8%. During 2010,2012, fee and commission income increaseddecreased by 7.2%1% as compared to €9,080€10,409 million obtained in 2009.2011.
20112013 compared to 20102012
Fee and commission income for 20112013 and 20102012 was as follows:
| 2011 | 2010 | Amount Change | % Change | 2013 | 2012 | Amount Change | % Change | |||||||||||||||||||||||||
| (in millions of euros, except percentages) | (in millions of euros, except percentages) | |||||||||||||||||||||||||||||||
Mutual and pension funds | 1,236 | 1,267 | (31 | ) | (2.4 | %) | 1,121 | 1,178 | (57 | ) | (4.8 | %) | ||||||||||||||||||||
Insurance | 2,397 | 2,051 | 346 | 16.9 | % | 2,284 | 2,317 | (33 | ) | (1.4 | %) | |||||||||||||||||||||
Securities services | 668 | 784 | (116 | ) | (14.8 | %) | 678 | 702 | (24 | ) | (3.4 | %) | ||||||||||||||||||||
Commissions for services | 6,171 | 5,633 | 538 | 9.5 | % | 5,678 | 6,063 | (385 | ) | (6.3 | %) | |||||||||||||||||||||
Credit and debit cards | 1,313 | 1,138 | 175 | 15.4 | % | 1,611 | 1,543 | 68 | 4.4 | % | ||||||||||||||||||||||
Account management | 1,028 | 995 | 33 | 3.3 | % | 1,163 | 1,209 | (46 | ) | (3.8 | %) | |||||||||||||||||||||
Bill discounting | 309 | 301 | 8 | 2.7 | % | 325 | 327 | (2 | ) | (0.6 | %) | |||||||||||||||||||||
Contingent liabilities | 425 | 439 | (14 | ) | (3.2 | %) | 404 | 398 | 6 | 1.5 | % | |||||||||||||||||||||
Other operations | 3,096 | 2,760 | 336 | 12.2 | % | 2,175 | 2,586 | (411 | ) | (15.9 | %) | |||||||||||||||||||||
|
|
|
|
|
|
|
| |||||||||||||||||||||||||
Total fee and commission income (net) | 10,472 | 9,735 | 737 | 7.6 | % | 9,761 | 10,260 | (499 | ) | (4.9 | %) | |||||||||||||||||||||
FeeThe 5% decrease in fee and commission income rose 7.6% to €10,472 million in 2011 compared to 2010was mainly due to the performance of insurance and services. lesser commissions for services mainly due to overdrafts.
The latter showed rises in almost all lines. On the other hand, income from securities and custody was lower and income from mutual and pension funds was slightly lower.
Averageaverage balances of mutual funds under management in Spain decreased 16.6%7.5% from €32.7€99.3 billion in 20102012 to €27.3€91.8 billion in 2011. This decrease was due to the Bank’s strategy of emphasis on balance sheet funds to the detriment of mutual funds. However, average balances of mutual funds abroad increased by 6.0% from €77.9 billion2013, mainly concentrated in 2010 to €82.6 billion in 2011, mainly due to increased activity in Brazil, the United Kingdom and Mexico,Brazil. However, as of year-end 2013, mutual funds increased 4.6% mainly due to the increase in Spain +28.7%, as a result of greater marketing, partially offset by a 30.7% decrease in Chile and Portugal.the United Kingdom.
AverageThe average balances of pension funds increased 7.0% from €9.7 billion in 2012 to €10.4 billion in 2013. Spain decreased by 3.0%experienced a 7.4% increase from €8.9 billion in 2012 to €9.6 billion in 2010 to €9.3 billion in 2011. Since we sold our pension funds businesses in Latin America, our2013. Our only remaining pension business abroad is in Portugal. AverageThe average balances of pension funds in Portugal decreased 12.2%increased 2.9% from €1.3 billion€766 million in 20102012 to €1.2 billion€788 million in 2011.
113
20102012 compared to 20092011
Fee and commission income for 20102012 and 20092011 was as follows:
| 2010 | 2009 | Amount Change | % Change | 2012 | 2011 | Amount Change | % Change | |||||||||||||||||||||||||
| (in millions of euros, except percentages) | (in millions of euros, except percentages) | |||||||||||||||||||||||||||||||
Mutual and pension funds | 1,267 | 1,178 | 89 | 7.6 | % | 1,178 | 1,236 | (58 | ) | (4.7 | %) | |||||||||||||||||||||
Insurance | 2,051 | 1,861 | 190 | 10.2 | % | 2,317 | 2,366 | (49 | ) | (2.1 | %) | |||||||||||||||||||||
Securities services | 784 | 774 | 10 | 1.3 | % | 702 | 668 | 34 | 5.1 | % | ||||||||||||||||||||||
Commissions for services | 5,633 | 5,267 | 366 | 6.9 | % | 6,063 | 6,139 | (75 | ) | (1.2 | %) | |||||||||||||||||||||
Credit and debit cards | 1,138 | 1,033 | 105 | 10.2 | % | 1,543 | 1,302 | 241 | 18.5 | % | ||||||||||||||||||||||
Account management | 995 | 859 | 136 | 15.8 | % | 1,209 | 1,028 | 181 | 17.6 | % | ||||||||||||||||||||||
Bill discounting | 301 | 319 | (18 | ) | (5.6 | %) | 327 | 309 | 18 | 6.1 | % | |||||||||||||||||||||
Contingent liabilities | 439 | 422 | 17 | 4.0 | % | 398 | 425 | (27 | ) | (6.4 | %) | |||||||||||||||||||||
Other operations | 2,760 | 2,634 | 126 | 4.8 | % | 2,586 | 3,050 | (219 | ) | 7.1 | % | |||||||||||||||||||||
|
|
|
|
|
|
|
| |||||||||||||||||||||||||
Total fee and commission income (net) | 9,735 | 9,080 | 655 | 7.2 | % | 10,260 | 10,409 | (149 | ) | (1.4 | %) | |||||||||||||||||||||
Fee and commission income rose 7.2%decreased 1.4% to €9,735€10,260 million in 20102012 compared to 2009. The increase is2011 mainly due to higher revenues from fee income from insurance, credit cards, account managementlesser commissions for services, as well as mutual and pension funds.funds and insurance.
Average
The average balances of mutual funds under management in Spain decreased 10.3%9.6% from €36.5€109.9 billion in 20092011 to €32.7€99.3 billion in 2010. This decrease was due to the Bank’s strategy2012, mainly concentrated in Brazil and Spain. As of promoting growth in deposits and the customer preference for this type of product to the detriment of mutual funds. However, average balances ofyear-end 2012 mutual funds abroad increased by 29.8% from €60.0 billiondecreased 13% with falls in 2009 to €77.9 billionalmost all countries, except in 2010, mainly due to increased activity in Brazil, the United Kingdom,Poland, Mexico and Chile, which offsetArgentina, affected by the decrease in Spain.greater focus on capturing on-balance sheet funds.
AverageThe average balances of pension funds in Spain increased by 0.4%decreased 7.7% from €9.58€10.5 billion in 20092011 to €9.62€9.7 billion in 2010. Since we sold our pension funds businesses2012. Spain experienced a 4.3% decrease from €9.3 billion in Latin America, our2011 to €8.9 billion in 2012. Our only remaining pension business abroad is in Portugal. AverageThe average balances of pension funds in Portugal decreased 0.4%33.9% from €1.33€1.2 billion in 20092011 to €1.32€0.8 billion in 2010.2012.
Gains Gains/(Losses) on Financial Assets and Liabilities (net)
Net gains on financial assets and liabilities in 20112013 were €2,838€3,234 million, a 31.1%2.9% or €674€95 million increasedecrease as compared to €2,164€3,329 million in 2010,2012, which represented a 43.1% decrease17.3% increase from €3,802€2,838 million in 2009.2011. Gains (losses) on financial assets and liabilities include gains and losses arising from the following: marking to market our trading portfolio and derivative instruments, including spot market foreign exchange transactions, sales of investment securities and liquidation of our corresponding hedge or other derivative positions. For further details, see Note 44 to our consolidated financial statements.
20112013 compared to 20102012
NetThe €95 million decrease was mainly due the net effect of: (i) a €273 million increase in trading gains, on(ii) a €165 million decrease in other financial assetsinstruments at fair value through profit or loss relating to valuation fluctuations, and liabilities increased 31.1%(iii) a €167 million decrease in 2011. We registered profitsfinancial instruments not measured at fair value through profit or loss, after the gains accounted in Corporate Activities’ hedges of exchange rates in2012 relating to repurchase transactions.
2012 compared to 2011 as against losses in 2010 and in marking to market our trading portfolio of derivative instruments. These profits were partially offset by reduced revenues from the operating areas, mostly GBM (Global Banking and Markets), which were weak in the last three quarters of 2011
The 17.3% increase was due to several securities exchange and repurchase transactions for which the economic environment, comparedGroup credited €870 million to strong results in 2010, mainly in the first half of the year.income.
2010 compared to 2009
Net gains on financial assets and liabilities decreased 43.1% in 2010 mainly due to Corporate Activities, where the cost of hedging exchange rates is recorded, and to lower results in some Latin American countries (due to the sale of portfolios in 2009). These negative effects were partially offset by revenues from wholesale businesses in Europe derived mainly from customer operations.
Other operating income / expenses (net)
Net other operating income in 20112013 was €18a €291 million loss, a €88€401 million decrease from €106income of €110 million in 2010,2012, which was a €38€89 million decreaseincrease from €144income of €21 million in 2009.2011. Under this line item we include income and expenses from insurance activity, from non-financial services, other commissions and charges to theFondo de Garantía de Depósitos.
114
| 2011 | 2010 | 2009 | ||||||||||
| (in millions of euros) | ||||||||||||
Insurance activity income | 392 | 378 | 339 | |||||||||
Income from insurance and reinsurance contracts issued | 6,748 | 7,162 | 7,113 | |||||||||
Of which: | ||||||||||||
Insurance and reinsurance premium income | 6,547 | 6,845 | 6,950 | |||||||||
Reinsurance income | 201 | 317 | 163 | |||||||||
Expenses of insurance and reinsurance contracts | (6,356 | ) | (6,784 | ) | (6,774 | ) | ||||||
Of which: | ||||||||||||
Claims paid and other insurance-related expenses | (4,852 | ) | (5,816 | ) | (3,016 | ) | ||||||
Net provisions for insurance contract liabilities | (1,202 | ) | (689 | ) | (3,540 | ) | ||||||
Reinsurance premiums paid | (302 | ) | (279 | ) | (218 | ) | ||||||
Non-financial services | 151 | 135 | 140 | |||||||||
Sales and income from the provision of non-financial services | 400 | 340 | 378 | |||||||||
Cost of sales | (249 | ) | (205 | ) | (238 | ) | ||||||
Other operating income and expenses | (525 | ) | (407 | ) | (335 | ) | ||||||
Other operating income | 902 | 693 | 438 | |||||||||
Of which, fees and commissions offsetting direct costs | 119 | 70 | 117 | |||||||||
Other operating expenses | (1,427 | ) | (1,100 | ) | (773 | ) | ||||||
Of which, Deposit Guarantee Fund | (346 | ) | (307 | ) | (318 | ) | ||||||
Other operating income/expenses, net | 18 | 106 | 144 | |||||||||
In 2011, a 3.7% increaseThe main developments in insurance activity were:
Insurance activity Income from insurance and reinsurance contracts issued Of which: Insurance and reinsurance premium income Reinsurance income Expenses of insurance and reinsurance contracts Of which: Claims paid and other insurance-related expenses Net provisions for insurance contract liabilities Reinsurance premiums paid Non-financial services Sales and income from the provision of non-financial services Cost of sales Other operating income and expenses Other operating income Of which, fees and commissions offsetting direct costs Other operating expenses Of which, Deposit Guarantee Fund Other operating income / expenses, net 2013 2012 Amount
Change %
Change (in millions of euros, except percentages) 117 593 (476 ) (80.3 %) 4,724 5,541 (817 ) (14.7 %) 4,513 4,667 (154 ) (3.3 %) 211 874 (663 ) (75.9 %) (4,607 ) (4,948 ) 341 (6.9 %) (4,497 ) (4,440 ) (57 ) 1.3 % 382 (323 ) 705 n.a. (492 ) (185 ) (307 ) 165.9 % 93 137 (44 ) (32.1 %) 322 369 (47 ) (12.7 %) (229 ) (232 ) 3 (1.3 %) (501 ) (620 ) 119 (19.2 %) 857 783 74 9.5 % 115 130 (15 ) (11.5 %) (1,358 ) (1,403 ) 45 (3.2 %) (559 ) (530 ) (29 ) 5.5 % (291 ) 110 (401 ) n.a
The €401 million decrease in net other charges.
In 2010, an 11.5% increaseoperating income in 2013 was mainly due to a decrease in insurance activity wasof €476 million mainly due to the previously mentioned agreements, partially offset by an increase of €119 million in other charges. Income from non-financial services remained flat.operating income and expenses.
Insurance activity Income from insurance and reinsurance contracts issued Of which: Insurance and reinsurance premium income Reinsurance income Expenses of insurance and reinsurance contracts Of which: Claims paid and other insurance-related expenses Net provisions for insurance contract liabilities Reinsurance premiums paid Non-financial services Sales and income from the provision of non-financial services Cost of sales Other operating income and expenses Other operating income Of which, fees and commissions offsetting direct costs Other operating expenses Of which, Deposit Guarantee Fund Other operating income / expenses, net The €89 million increase in net other operating income in 2012 was mainly due to an increase in insurance activity of €201 million partially offset by an increase of €98 million in other operating income and expenses. Administrative Expenses 2012 2011 Amount
Change %
Change (in millions of euros, except percentages) 593 392 201 51.3 % 5,541 6,748 (1,207 ) (17.9 %) 4,667 6,547 (1,880 ) (28.7 %) 874 201 673 334.8 % (4,948 ) (6,356 ) 1,408 (22.2 %) (4,440 ) (4,852 ) 412 (8.5 %) (323 ) (1,202 ) 879 (73.1 %) (185 ) (302 ) 117 (38.7 %) 137 151 (14 ) (9.3 %) 369 400 (31 ) (7.8 %) (232 ) (249 ) 17 (6.8 %) (620 ) (522 ) (98 ) 18.8 % 783 902 (119 ) (13.2 %) 130 119 11 9.2 % (1,403 ) (1,424 ) 21 (1.5 %) (530 ) (346 ) (184 ) 53.2 % 110 21 89 423.8 %
Administrative expenses were €17,781declined 2.0% or €349 million to €17,452 million in 2011, a 9.4% or €1,526 million increase2013 from €16,255€17,801 million in 2010,2012, which was a 9.6% or €1,430 million increasewere flat from €14,825€17,644 million in 2009.2011.
20112013 compared to 20102012
Administrative expenses for 20112013 and 20102012 were as follows:
| 2011 | 2010 | Amount Change | % Change | 2013 | 2012 | Amount Change | % Change | |||||||||||||||||||||||||
| (in millions of euros, except percentages) | (in millions of euros, except percentages) | |||||||||||||||||||||||||||||||
Personnel expenses | 10,326 | 9,329 | 997 | 10.7 | % | 10,069 | 10,306 | (237 | ) | (2.3 | %) | |||||||||||||||||||||
Other general administrative expenses | 7,455 | 6,926 | 529 | 7.6 | % | 7,383 | 7,495 | (112 | ) | (1.5 | %) | |||||||||||||||||||||
Building and premises | 1,845 | 1,731 | 114 | 6.6 | % | |||||||||||||||||||||||||||
Building and premises and supplies | 1,980 | 1,916 | 64 | 3.3 | % | |||||||||||||||||||||||||||
Other expenses | 1,723 | 1,555 | 168 | 10.8 | % | 1,556 | 1,694 | (138 | ) | (8.1 | %) | |||||||||||||||||||||
Information technology | 875 | 798 | 77 | 9.6 | % | 992 | 889 | 103 | 11.6 | % | ||||||||||||||||||||||
Advertising | 695 | 634 | 61 | 9.6 | % | 630 | 662 | (32 | ) | (4.8 | %) | |||||||||||||||||||||
Communications | 659 | 670 | (11 | ) | (1.6 | %) | 519 | 638 | (119 | ) | (18.7 | %) | ||||||||||||||||||||
Technical reports | 467 | 428 | 39 | 9.1 | % | 493 | 491 | 2 | 0.4 | % | ||||||||||||||||||||||
Per diems and travel expenses | 313 | 276 | 37 | 13.4 | % | |||||||||||||||||||||||||||
Taxes (other than income tax) | 401 | 376 | 25 | 6.6 | % | 445 | 415 | 30 | 7.2 | % | ||||||||||||||||||||||
Guard and cash courier services | 412 | 401 | 11 | 2.7 | % | 425 | 432 | (7 | ) | (1.6 | %) | |||||||||||||||||||||
Per diems and travel expenses | 284 | 297 | (13 | ) | (4.4 | %) | ||||||||||||||||||||||||||
Insurance premiums | 65 | 57 | 8 | 14.0 | % | 59 | 61 | (2 | ) | (3.3 | %) | |||||||||||||||||||||
Total administrative expenses | 17,781 | 16,255 | 1,526 | 9.4 | % | 17,452 | 17,801 | (349 | ) | (2.0 | %) | |||||||||||||||||||||
In 2013, administrative expenses decreased 2.0% or €349 million, positively affected by exchange rates. Excluding the impact of exchange rate differences administrative expenses increased by 3.6%.
Expenses in Europe, in both the big commercial units as well as the United Kingdom, continued to fall or rose below the inflation rate. Latin America was up as a result of the commercial network expansion and upgrade and the review of pay agreements in an environment of higher inflation. In the United States, the year-on-year comparison reflects the investments in technology and commercial structure, as well as costs associated with the change in brand.
2012 compared to 2011
Administrative expenses for 2012 and 2011 were as follows:
Personnel expenses Other general administrative expenses Building and premises and supplies Other expenses Information technology Advertising Communications Technical reports Per diems and travel expenses Taxes (other than income tax) Guard and cash courier services Insurance premiums Total administrative expenses115 2012 2011 Amount
Change %
Change (in millions of euros, except percentages) 10,306 10,305 1 0.0 % 7,495 7,339 156 2.1 % 1,916 1,844 72 3.9 % 1,694 1,672 22 1.3 % 889 828 61 7.4 % 662 691 (29 ) (4.2 %) 638 649 (11 ) (1.7 %) 491 466 25 5.4 % 297 312 (15 ) 4.8 % 415 401 14 3.8 % 432 412 20 4.9 % 61 65 (4 ) (6.2 %) 17,801 17,644 157 0.9 %
The 9.4% increase inIn 2012, administrative expenses in 2011 reflectedexperienced a 10.7%slight increase inof 0.9%. This reflects a flat personnel expenses and a 7.6%2.1% increase in other general administrative expenses.
In Europe, both the large retail units (Santander Branch Network, Banesto(Spain and Portugal) and the UK recorded slight fallsregistered negative growth in expensescost in real terms, whilecontinuing the global units (GBM and Asset Management and Insurance) registered increasedtrend begun in 2011. United States also experienced a reduction in administrative expenses because of investments in equipment and technology with the double purpose of strengthening the positions attained in key markets and businesses in previous years and developing new initiatives. Moreover, there is also an increase in expenses resulting from the incorporation of new entities, mainly Bank Zachodni WBK in Poland and SEB in Germany.11.3%. In Latin America costs alsoexpenses rose due to the drive in new commercial projects, the increase in installedbusiness capacity the restructuring of points of attention, particularly in Brazil, and the revision of collective bargainingwage agreements in an environment of higher inflation. Sovereign also registered single digit growth in costs.
2010 compared to 2009
Administrative expenses for 2010 and 2009 were as follows:
| 2010 | 2009 | Amount Change | % Change | |||||||||||||
| (in millions of euros, except percentages) | ||||||||||||||||
Personnel expenses | 9,329 | 8,451 | 878 | 10.4 | % | |||||||||||
Other general administrative expenses | 6,926 | 6,374 | 552 | 8.7 | % | |||||||||||
Building and premises | 1,731 | 1,614 | 117 | 7.2 | % | |||||||||||
Other expenses | 1,555 | 1,436 | 119 | 8.3 | % | |||||||||||
Information technology | 798 | 785 | 13 | 1.7 | % | |||||||||||
Advertising | 634 | 594 | 40 | 6.7 | % | |||||||||||
Communications | 670 | 632 | 38 | 6.0 | % | |||||||||||
Technical reports | 428 | 360 | 68 | 18.9 | % | |||||||||||
Per diems and travel expenses | 276 | 262 | 14 | 5.3 | % | |||||||||||
Taxes (other than income tax) | 376 | 313 | 63 | 20.1 | % | |||||||||||
Guard and cash courier services | 401 | 331 | 70 | 21.1 | % | |||||||||||
Insurance premiums | 57 | 47 | 10 | 21.3 | % | |||||||||||
Total administrative expenses | 16,255 | 14,825 | 1,430 | 9.6 | % | |||||||||||
The 9.6% increase in administrative expenses in 2010 reflected a 10.4% increase in personnel expenses and an 8.7% increase in Other general administrative expenses.
All units in continental Europe and the UK slightly reduced their costs. Sovereign experienced a more significant reduction because of synergies, while Brazil’s and Mexico’s costs increased at a slower pace than the inflation rate. The only noteworthy rises were in Chile because of the impact of the earthquake, the signing of a collective bargaining agreement and business dynamics, Argentina with costs at 23% because of a collective bargaining agreement and Global Banking and Markets because of investments made in 2010 to consolidate positions reached in 2009 in its main markets.
116
Depreciation and Amortization
Depreciation and amortization was €2,109€2,391 million in 2011, an 8.7%2013, a 9.5% or €169€208 million increase from €1,940€2,183 million in 2010,2012, which was a 21.5%4.0% or €344€85 million increase from €1,596€2,098 million in 2009. Both2011. This increase was mainly focused in 2010 and 2011, the depreciation and amortization of intangible assets in Latin America, mainly Brazil, explain most of the increase.Continental Europe.
Provisions (net)
Net provisions were €2,601€2,182 million in 2011,2013, a 129.6%47.6% or €1,468€704 million increase from €1,133€1,478 million in 2010,2012, which was a 36.8%43.5% or €659€1,138 million decrease from €1,792€2,616 million in 2009.2011. This item includes additions charged to the income statement in relation to provisions for pensions and similar obligations, provisions for contingent liabilities and commitments and other provisions (mainly provisions for restructuring costs and tax and legal litigation). The variation in 20112013 is mainly due to a €581 million increase in provisions for pensions and similar obligations. In Spain we recognized provisions of €334 million in 2013 to cover obligations arising from employees’ acceptances of an early retirement and voluntary redundancy offer. In addition, there was a €65 million increase in other provisions and a €58 million increase in contingent liabilities and commitments provisions.
The variation in 2012 was due to: (i) a €1,680€951 million increasedecrease in other provisions, mainly due to the one-off charge in the second quarter of 2011 of €842 million from a provision made related to PPI remediation (see Item 8in Santander UK (€620 million net of Part I, “Financial information— Legal proceedings, ii. Non-tax-related proceedings)tax); (ii) a €10€408 million increasedecrease in provisions for pensions and; (iii) a €222 million decrease in contingent liabilities and commitments provisions.
The variation in 2010 is due to a €151 million decrease in provisions for pensions together with a €531 million decrease in other provisions partially offset by a €23€221 million increase in contingent liabilities and commitments provisions.
SeeFor further details, see Note 25 to our consolidated financial statements.
Impairment Losses (net)
Impairment losses (net) were €13,385€11,730 million in 2011,2013, a 24.8%39.5% or €2,656€7,658 million decrease from €19,388 million in 2012, which was a 45.7% or €6,077 million increase from €10,729€13,311 million in 2010, which was an 8.6% or €1,014 million decrease from €11,743 million in 2009.2011.
Impairment losses are divided in the income statement as follows:
| 2011 | 2010 | 2009 | 2013 | 2012 | 2011 | |||||||||||||||||||
| (in millions of euros) | ||||||||||||||||||||||||
Impairment losses on financial assets (net): | 11,868 | 10,443 | 11,578 | 11,227 | 18,880 | 11,794 | ||||||||||||||||||
Loans and receivables | 11,040 | 10,267 | 11,088 | 10,986 | 18,523 | 10,966 | ||||||||||||||||||
Other financial assets not measured at fair value through profit and loss | 828 | 176 | 490 | 241 | 357 | 828 | ||||||||||||||||||
Impairment losses on other assets (net): | 1,517 | 286 | 165 | 503 | 508 | 1,517 | ||||||||||||||||||
Goodwill and other intangible assets | 1,161 | 69 | 31 | 41 | 151 | 1,161 | ||||||||||||||||||
Other assets | 356 | 217 | 134 | 462 | 357 | 356 | ||||||||||||||||||
|
|
|
|
|
| |||||||||||||||||||
Total impairment losses (net) | 13,385 | 10,729 | 11,743 | 11,730 | 19,388 | 13,311 | ||||||||||||||||||
20112013 compared to 20102012
The €773€7,537 million or 7.5% increase40.7% decrease in net impairment losses for loans and receivables in 20112013 compared to 20102012 reflected a €821€7,788 million increasedecrease in allowances,provisions, a €598€248 million increasedecrease in recoveries of loans previously charged-off and an €11a €3 million decreaseincrease in impairment losses of other assets.
There was a strong increaseCredit loss provisions accounted in impairment losses2013 decreased after the recorded rise in Spain and Portugal due to the economic environment and significant reductionsnon-performing loans in the UK, Sovereign andSpain’s real estate run-off segment in 2012. In other units, provisions were down in Brazil, the United Kingdom, Portugal, Santander Consumer Finance, (eventhe United States and, to a lesser extent, Spain. In contrast, they were up in the other Latin American countries, particularly Mexico, with a big impact from the incorporation of new units). Provisions in Latin America excluding Brazil also dropped. However, they rose strongly in Brazil because of the growth in lending of around 20% and a moderate increase in NPLs of individual borrowers, principally in consumer credits and cards.one-off charge booked for housing developers.
Our total allowances for credit losses (excluding country-risk) decreased by €1,087€431 million to €19,661€25,681 million at December 31, 2011,2013, from €20,748€26,112 million at December 31, 2010.
Net impairment losses on other assets in 2013 remained at the prior year level with €503 million compared to €508 million in 2012.
117
The €1,231impairment losses of other financial assets not measured at fair value through profit and loss in 2013 of €241 million were mainly due to equity instruments that had suffered a significant and prolonged fall in price.
Non-performing balances (excluding country-risk) increased by €5,591 million to €41,652 million at December 31, 2013, compared to €36,061 million at December 31, 2012. Our Non-performing balance ratio was 5.64% at December 31, 2013 as compared to 4.54% at December 31, 2012. This increase was mainly due to the 2.84 percentage points increase in Continental Europe. See Item 5 of Part I, “Operating and Financial Review and Prospects—A. Operating results— Results of Operations for Santander—Continental Europe”. Our coverage ratio was 62% at December 31, 2013 and 72% at December 31, 2012. See Item 4 of Part I, “Information on the Company—B. Business Overview—Selected Statistical Information—Impaired Balances Ratios”.
2012 compared to 2011
The €7,557 million or 68.9% increase in net impairment losses for loans and receivables in 2012 compared to 2011 reflected a €7,081 million increase in 2011provisions, a €467 million decrease in recoveries of loans previously charged-off and a €9 million increase in impairment losses of other assets.
The increase in credit loss provisions recorded in 2012 was mainly due to two factors: (i) a rise in non-performing loans in the Spain’s real estate run-off segment which increased 206 basis points to 54.1%. This rise was caused by the worsening of Spain’s macroeconomic situation as a result of an economic slowdown, falling consumer spending and job market deterioration, and (ii) the upward shift in non-performing loan ratios in certain financial systems, including Brazil, Chile, and Portugal.
Our total allowances for credit losses (excluding country-risk) increased by €6,581 million to €26,112 million at December 31, 2012, from €19,531 million at December 31, 2011.
The €1,009 million decrease in 2012 in net impairment losses on other assets was mainly attributable to two impairments which occurred in 2011: (i) €601 million in pre-tax provisions to amortize goodwill related to Santander Totta and (ii) €491 million in amortization of other intangible assets.
The impairment losses of other financial assets not measured at fair value through profit and loss in 20112012 of €826€357 million were mainly due to: (i) €125 million in debt instruments of which €106 million related to the Greek sovereign debt; and (ii) €592 million in equity instruments relating to the impairment of the ownership interests in Iberdrola, S.A. and Assicurazioni Generali SpA. These equity instrumentsthat had suffered a significant and prolonged fall in price at December 31, 2011.price.
Non-performing balances (excluding country-risk) increased by €3,514€4,055 million to €32,036€36,061 million at December 31, 2011,2012, compared to €28,522€32,006 million at December 31, 2010.2011. Our coverage ratio was 72% at December 31, 2012 and 61% at December 31, 2011 and 73% at December 31, 2010.2011. See Item 4 of Part I, “Information on the Company—B. Business Overview—Selected Statistical Information—Impaired Balances Ratios”.
2010 compared to 2009
The €821 million or 7.4% decrease in net impairment losses for loans and receivables in 2010 compared to 2009 reflected a €460 million net decrease in allowances, a €287 million increase in recoveries of loans previously charged-off and a €74 million decrease in impairment losses of other assets.
This reduction was due to improved trends in the UK and for Sovereign, and lower provisions in Latin America, which is beginning to benefit from the improvement in the economic cycle and a change in the mix of products.
Spain and Portugal, on the other hand, required higher provisions in 2010 because of the increase in bad loans and the review carried out by the Bank of Spain of the references established in the Circular 4/2004 to determine the provisions for credit risk after taking into account the experience from recent years and the current economic situation.
Our total allowances for credit losses (excluding country-risk) increased by €2,251 million to €20,748 million at December 31, 2010, from €18,497 million at December 31, 2009.
Non-performing balances (excluding country-risk) increased by €3,969 million to €28,522 million at December 31, 2010, compared to €24,554 million at December 31, 2009. Our coverage ratio was 72.7% at December 31, 2010, and 75.3% at December 31, 2009. See Item 4 of Part I, “Information on the Company—B. Business Overview—Selected Statistical Information—Impaired Balances Ratios”.
Net gains / (losses) on other assets
Net lossesgains on other assets were €1,730 million in 2013, a €1,581��million increase from gains of €149 million in 2012, which was a €412 million increase from losses of €263 million in 2011, a €3232011.
The €2,152 million decrease from gains of €60 million in 2010, which was a €280 million decrease from gains of €340 million in 2009.
In 2011, Gains on disposal of assets not classified as non-current assets held for sale increased to €1,846 millionaccounted in 2013 were mainly due to the sale of a minority stakeour management companies (pursuant to the agreement with Warburg Pincus and General Atlantic), the insurance companies in Santander Consumer USASpain, and the sale of our Latin American insurance companies (€872 million and €908 million, respectively)payment services company (agreement with Elavon Financial Services Limited). See Item 4 of Part I, “Information on the Company—A. History and development of the company—Principal Capital Expenditures and Divestitures—Acquisitions, Dispositions, Reorganizations”.
Losses on non-current assets held for sale not classified as discontinued operations increased to €2,109 millionin 2013 totaled €422 million. This was mainly due to impairment of foreclosed and acquired assets recorded during the year. See Item 4year and the sale of Part I, “Information on the Company—B. Business Overview—Selected Statistical Information—Foreclosed assets”.properties.
2013 compared to 2012
| 2013 | 2012 | Amount Change | % Change | |||||||||||||
| (in millions of euros, except percentages) | ||||||||||||||||
Gains / (losses) on disposal of assets not classified as non-current assets held for sale | 2,152 | 906 | 1,246 | 137.5 | % | |||||||||||
Of which: | ||||||||||||||||
Disposal of investments | 2,167 | 775 | 1,392 | 179.6 | % | |||||||||||
Gains / (losses) on non-current assets held for sale not classified as discontinued operations | (422 | ) | (757 | ) | 335 | (44.3 | %) | |||||||||
Of which: | ||||||||||||||||
Impairment of non-current assets held for sale | (335 | ) | (449 | ) | 114 | (25.4 | %) | |||||||||
Losses on sale of non-current assets held for sale | (87 | ) | (308 | ) | 221 | (71.8 | %) | |||||||||
|
|
|
|
|
|
|
| |||||||||
Net gains / (losses) on other assets | 1,730 | 149 | 1,581 | n/a | ||||||||||||
118
20112012 compared to 20102011
| 2011 | 2010 | Amount Change | % Change | 2012 | 2011 | Amount Change | % Change | |||||||||||||||||||||||||
| (in millions of euros, except percentages) | (in millions of euros, except percentages) | |||||||||||||||||||||||||||||||
Gains / (losses) on disposal of assets not classified as non-current assets held for sale | 1,846 | 350 | 1,496 | 427.4 | 906 | 1,846 | (940 | ) | (50.9 | %) | ||||||||||||||||||||||
Of which: | ||||||||||||||||||||||||||||||||
Disposal of investments | 1,794 | 153 | 1,641 | 1,072.5 | 775 | 1,794 | (1,019 | ) | (56.8 | %) | ||||||||||||||||||||||
Gains / (losses) on non-current assets held for sale not classified as discontinued operations | (2,109 | ) | (290 | ) | (1,819 | ) | (627.2 | ) | (757 | ) | (2,109 | ) | 1,352 | (64.1 | %) | |||||||||||||||||
Of which: | ||||||||||||||||||||||||||||||||
Impairment of non-current assets held for sale | (2,037 | ) | (298 | ) | (1,739 | ) | (583.6 | ) | (449 | ) | (2,037 | ) | 1,588 | (78.0 | %) | |||||||||||||||||
Losses on sale of non-current assets held for sale | (308 | ) | (72 | ) | (236 | ) | 327.8 | % | ||||||||||||||||||||||||
|
|
|
| |||||||||||||||||||||||||||||
Net gains / (losses) on other assets | 149 | (263 | ) | 412 | n/a | |||||||||||||||||||||||||||
2010 compared to 2009
| 2010 | 2009 | Amount Change | % Change | |||||||||||||
| (in millions of euros, except percentages) | ||||||||||||||||
Gains / (losses) on disposal of assets not classified as non-current assets held for sale | 350 | 1,565 | (1,215 | ) | (77.6 | ) | ||||||||||
Of which: | ||||||||||||||||
Disposal of investments | 153 | 1,528 | (1,375 | ) | (90.0 | ) | ||||||||||
Gains / (losses) on non-current assets held for sale not classified as discontinued operations | (290 | ) | (1,225 | ) | 935 | (76.3 | ) | |||||||||
Of which: | ||||||||||||||||
Sale of Attijariwafa Bank | — | 218 | (218 | ) | — | |||||||||||
Impairment of non-current assets held for sale and other assets | (298 | ) | (1,350 | ) | 1,052 | (77.9 | ) | |||||||||
Income Tax
The provision for corporate income tax was €1,776€2,113 million in 2011,2013, a 39.2%258.1% or €1,147€1,523 million increase from €590 million in 2012, which represented a 66.4% or €1,165 million decrease from €2,923€1,755 million in 2010, which represented a 142.3% or €1,716 million increase from €1,207 million in 2009.2011. The effective tax rate was 22.5%27.6% in 2011, 24.3%2013, 16.5% in 20102012 and 11.5%22.3% in 2009.2011.
The reductionincrease in the effective tax rate in 20112013 compared to the prior year is primarily due to tax exempt transactions occurred during 2011 (described in note 27.c). Thethe €4,069 million increase in consolidated operating profit before tax together with a reduction in the effective incomenet adjustments to profit before tax ratethat applied in 20102013 as compared to 2009 is primarily due2012 (see the reconciliation in Note 27.c to various tax exempt transactions that took place during 2009. Had these transactions been taxable, the effective tax rate for the fiscal year 2009 would have been 19.9%. The increase between the mentioned 19.9% and the effective rate for the fiscal year 2010 (24.3%) is due to a higher proportion of our income being derived from our businesses in Latin America, and the USA, which have higher tax rates than other countries, principally Spain, in which the Group operates.consolidated financial statements).
For more information about factors affecting effective tax rates, see Note 27 to our consolidated financial statements.
Profit / (losses) from discontinued operations
Losses from discontinued operations were €24€15 million in 2011,2013, compared to a €3€70 million decrease from €27 millionprofit in 2010,2012, which represented a €57.8€55 million decreaseincrease from €31€15 million profitsprofit in 2009.2011. During 2011 and 2010,2013 we did not discontinue any significant operation.
119
Profit attributable to non-controlling interest
Profit attributable to non-controlling interest was €1,154 million in 2013, a 50.3% or €386 million increase from €768 million in 2012, which represented a 2.5% or €20 million decrease from €788 million in 2011, a 14.4% or €133 million decrease from €921 million in 2010, which represented a 96.0% or €451 million increase from €470 million in 2009.2011. For further details, see Note 28 to our consolidated financial statements.
20112013 compared to 20102012
The €133 million decreaseincrease in 2011 is2013, was mainly attributabledue to the purchase in September 2010a full year accounting of 25% of Santander Mexico. Non-controllingminority interest in BancoMexico as in the fourth quarter of 2012 Santander Mexico was €2México finalized its placement of shares in the secondary market. Moreover, in 2013 we reduced our ownership interest in Bank Zachodni WBK S.A. to 70%, thereby generating an increase in the balance of non-controlling interests of €1,329 million in 2011 as(see Note 3 to our consolidated financial statements).
2012 compared to €130 million in 2010.
2010 compared to 20092011
The €451 million increasemain developments in profit attributable to minority shareholders2012 regarding non-controlling interest were: (i) in 2010 was principally due to Grupo Santander Brazil. Non-controlling interest inJanuary and March 2012 the Group transferred shares accounting for 4.41% and 0.77% of Banco Santander (Brasil) S.A. wasto two leading international financial institutions, and (ii) in 2010 €539 million, a €425 million2012 the Group sold 24.9% of its ownership interest in Grupo Financiero Santander México, S.A.B. de C.V. The related increase from €114 million in 2009 dueprofits attributable to the global offering of Banco Santander (Brasil), which closednon-controlling interest in October 2009. This effectthese units was partially offset by the purchase of 25% of Santander Mexicolosses registered to non-controlling interest in 2010.Banesto.
Results of Operations by Business Areas
For internal information, Grupo Santander maintained in 2011 the general criteria used in 2010 for geographical and business segmentation, with the following exception:
The financial statementsa description of each operating segment are prepared by aggregating the figures for the Group’s various business units. The basic information used for segment reporting comprises the accounting dataour segments see Item 4 of the legal units composing each segment and the data available from the management information systems. All segment financial statements have been prepared on a basis consistent with the accounting policies used by the Group. When calculating the net interest income of each business, internal transfer prices are applied both to assets and liabilities. Having observed that the actual cost of liquidity during the ongoing financial and liquidity crisis the actual cost of liquidity deviated from the benchmark curve used for the units, in 2011 the Group decided to revise the system for measuring net interest income and modified the internal transfer price applied by the corporate centre to the units, adding to the base curve a liquidity spread basedPart I, “Information on the duration of each transaction. The figures for 2010 and 2009 relating to segment reporting presented below have been recalculated in order to facilitate their comparison with the figures for 2011.Company—B. Business Overview”.
Our results of operations by business areas can be summarized as follows (see Item 4follows.
First level (geographic):
Continental Europe
| Variations | ||||||||||||||||||||
| 2013 | 2012 | 2011 | 2013/2012 | 2012/2011 | ||||||||||||||||
| (in millions of euros, except percentages) | ||||||||||||||||||||
INTEREST INCOME / (CHARGES) | 8,123 | 8,854 | 7,976 | (8.3 | %) | 11.0 | % | |||||||||||||
Income from equity instruments | 265 | 289 | 264 | (8.3 | %) | 9.5 | % | |||||||||||||
Income from companies accounted for by the equity method | (19 | ) | (88 | ) | 17 | (78.4 | %) | (617.6 | %) | |||||||||||
Net fees and commissions | 3,552 | 3,625 | 3,767 | (2.0 | %) | (3.8 | %) | |||||||||||||
Gains/losses on financial assets and liabilities (net) * | 775 | 306 | 254 | 153.3 | % | 20.5 | % | |||||||||||||
Other operating income/(expenses) (net) | (111 | ) | (19 | ) | 131 | 484.2 | % | (114.5 | %) | |||||||||||
TOTAL INCOME | 12,585 | 12,967 | 12,409 | (2.9 | %) | 4.5 | % | |||||||||||||
Administrative expenses | (5,807 | ) | (5,790 | ) | (5,805 | ) | 0.3 | % | (0.3 | %) | ||||||||||
Personnel expenses | (3,527 | ) | (3,498 | ) | (3,535 | ) | 0.8 | % | (1.0 | %) | ||||||||||
Other general expenses | (2,280 | ) | (2,292 | ) | (2,270 | ) | (0.5 | %) | 1.0 | % | ||||||||||
Depreciation and amortization | (769 | ) | (667 | ) | (590 | ) | 15.3 | % | 13.1 | % | ||||||||||
Provisions (net) | (158 | ) | (130 | ) | (437 | ) | 21.5 | % | (70.3 | %) | ||||||||||
Impairment losses on financial assets (net) | (3,766 | ) | (9,903 | ) | (3,694 | ) | (62.0 | %) | 168.1 | % | ||||||||||
Impairment losses on other assets (net) | (65 | ) | (27 | ) | (75 | ) | 140.7 | % | (64.0 | %) | ||||||||||
Gains/(losses) on other assets (net) | (374 | ) | (757 | ) | (1,719 | ) | (50.6 | %) | (55.9 | %) | ||||||||||
OPERATING PROFIT/(LOSS) BEFORE TAX | 1,646 | (4,307 | ) | 89 | n/a | n/a | ||||||||||||||
Income tax | (376 | ) | 1,490 | 133 | n/a | 1,020.3 | % | |||||||||||||
PROFIT FROM CONTINUING OPERATIONS | 1,270 | (2,817 | ) | 222 | n/a | n/a | ||||||||||||||
Profit/(loss) from discontinued operations (net) | (6 | ) | (7 | ) | (24 | ) | (14.3 | %) | (70.8 | %) | ||||||||||
CONSOLIDATED PROFIT FOR THE YEAR | 1,264 | (2,824 | ) | 198 | n/a | n/a | ||||||||||||||
Profit attributable to non-controlling interest | 137 | (79 | ) | 28 | n/a | n/a | ||||||||||||||
Profit attributable to the Parent | 1,127 | (2,745 | ) | 170 | n/a | n/a | ||||||||||||||
| * | Includes exchange differences (net) |
2013 compared to 20121
In 2013, Continental Europe accounted for 18.0% of Part I, “Informationprofit attributed to the Parent bank’s total operating areas.
The main actions in 2013 focused on integrating the mergers of retail networks in Spain and the banks in Poland. In a still weak environment and with low interest rates, the Group’s strategy over the last three years was maintained. These strategies were: (i) defending spreads on loans and on deposits, (ii) greater focus on reducing the cost of funds, after reaching a comfortable liquidity position, (iii) control of costs and (iv) active risk management.
Total incomedecreased by €382 million mainly due to the €731 million decrease in net interest income partially offset by a €469 million increase in gains on financial assets and liabilities. The fall innet interest income reflects the economic weakness, low interest rates, a still high average cost of deposits and repricing of mortgages. The increase ingains/(losses) on financial assets and liabilities was due to trading gains (wholesale business).
Operating expenses,which includeadministrative expenses anddepreciation and amortization, rose by €119 million or 1.8%, primarily due to the perimeter in Poland, since on a like-for-like basis their performance was flat (-0.8%) with costs at all units either decreasing or stable.
| 1 | For a summary by countries see “Item 4. Information of the Company. B. Business Overview – Continental Europe”. |
Provisions and impairment losses, which includeprovisions (net),impairment losses on financial assets (net), andimpairment losses on other assets (net), decreased by €6,071 million or 60.3% after the strong increase in the deterioration of the real estate segment in Spain experienced in 2012 was not repeated in 2013.
The effort in provisions in the past years was combined with a strategy of reducing the real estate exposure in Spain. The balance sheet of Spain’s run-off real estate activity declined by €1,496 million (-12%). The reduction since December 2008 is approximately €30 billion (-73%). Of note was the sale of a stake in Altamira, which manages loan recoveries and properties in Spain and sells or rents foreclosed real estate assets. See “Item 4. Information on the Company—A. History and development of the company—company — Principal Capital Expenditures and Divestitures—Divestitures — Acquisitions, Dispositions, Reorganizations”):Reorganizations — Agreement with Apollo”.
First level (geographic):
Continental Europe
| Variations | ||||||||||||||||||||
| 2011 | 2010 | 2009 | 2011/2010 | 2010/2009 | ||||||||||||||||
| (in millions of euros, except percentages) | ||||||||||||||||||||
INTEREST INCOME / CHARGES | 10,666 | 9,872 | 10,966 | 8.0 | % | (10.0 | %) | |||||||||||||
Income from equity instruments | 264 | 217 | 218 | 21.7 | % | (0.5 | %) | |||||||||||||
Income from companies accounted for by the equity method | 14 | 9 | 7 | 55.6 | % | 28.6 | % | |||||||||||||
Net fees and commissions | 4,051 | 3,679 | 3,697 | 10.1 | % | (0.5 | %) | |||||||||||||
Gains/losses on financial assets and liabilities (net) | 233 | 846 | 687 | (72.5 | %) | 23.1 | % | |||||||||||||
Other operating income/(expenses) (net) | 119 | 170 | 138 | (30.0 | %) | 23.2 | % | |||||||||||||
TOTAL INCOME | 15,347 | 14,793 | 15,713 | 3.7 | % | (5.9 | %) | |||||||||||||
Administrative expenses | (5,998 | ) | (5,301 | ) | (5,116 | ) | 13.1 | % | 3.6 | % | ||||||||||
Personnel expenses | (3,725 | ) | (3,343 | ) | (3,220 | ) | 11.4 | % | 3.8 | % | ||||||||||
Other general expenses | (2,273 | ) | (1,958 | ) | (1,896 | ) | 16.1 | % | 3.3 | % | ||||||||||
Depreciation and amortization | (614 | ) | (616 | ) | (548 | ) | (0.3 | %) | 12.4 | % | ||||||||||
Impairment losses on financial assets (net) | (4,206 | ) | (4,048 | ) | (3,286 | ) | 3.9 | % | 23.2 | % | ||||||||||
Provisions (net) | (138 | ) | (40 | ) | (99 | ) | 245.0 | % | (59.6 | %) | ||||||||||
Impairment losses on other assets (net) | (48 | ) | (48 | ) | (42 | ) | 0.0 | % | 14.3 | % | ||||||||||
Gains/(losses) on other assets (net) | (304 | ) | (56 | ) | (73 | ) | 442.9 | % | (23.3 | %) | ||||||||||
OPERATING PROFIT/(LOSS) BEFORE TAX | 4,039 | 4,684 | 6,549 | (13.8 | %) | (28.5 | %) | |||||||||||||
Income tax | (1,049 | ) | (1,219 | ) | (1,770 | ) | (13.9 | %) | (31.1 | %) | ||||||||||
PROFIT FROM CONTINUING OPERATIONS | 2,990 | 3,465 | 4,779 | (13.7 | %) | (27.5 | %) | |||||||||||||
Profit/(loss) from discontinued operations (net) | (24 | ) | (14 | ) | (45 | ) | 71.4 | % | (68.9 | %,) | ||||||||||
CONSOLIDATED PROFIT FOR THE YEAR | 2,966 | 3,451 | 4,734 | (14.1 | %) | (27.1 | %) | |||||||||||||
Profit attributable to non-controlling interest | 117 | 96 | 66 | 21.9 | % | 45.5 | % | |||||||||||||
Profit attributable to the Parent | 2,849 | 3,355 | 4,668 | (15.1 | %) | (28.1 | %) | |||||||||||||
120
2011 compared to 2010
In 2011,The NPL ratio in Continental Europe contributed 31.0%increased from 6.29% in 2012 to 9.13% in 2013, while NPL coverage decreased from 73% in 2012 to 57% in 2013. The NPL ratio increase was mainly due to: (i) a rise in Spain’s non-performing loans, mainly related to specific clients and to real estate mortgages to individuals, (ii) a drop in Spain’s lending levels, partially due to the cancellation of the profitpublic sector financing pursuant to a government program to pay suppliers’ pending invoices, deleveraging in the real estate sector and the decrease in the demand for credit, and (iii) to the integration of Kredyt Bank S.A. in Poland, which has a higher NPL ratio than the rest of Continental Europe.
Profit attributable to the Group’s operating areas. The profit includesParent increased by €3,872 million after the effectheavy impairment losses accounted in 2012 in the Spain’s real estate portfolio in run-off. Furthermore, comparisons with 2012 are affected by: the positive impact of the consolidation of Kredyt Bank in Poland, which was partially offset by the reinsurance transaction in Spain and Portugal. The overall impact of the change in perimeter was 2 percentage points increase in revenues and 6 percentage points negative in ordinary attributable profit.
2012 compared to 2011
In general, businesses developed in a difficult environment, characterized by shrinking GDP, domestic demand and consumption, rising unemployment and declining interest rates, at historic lows, with their impact on spreads.
Total income increased by €558 million as compared to 2011 mainly due to an 11% increase in net interest income related to the inclusion of SEB in Germany and the entry of Bank Zachodni WBK in April and SEB’s branches in Germany in the first quarter. Overall, the positive impactWBK. A reduction of these acquisitions (perimeter effect) on the Group’s profits was around 6 percentage points.
Interest income was €10,666€143 million in 2011, which is an 8.0% or €794 million increase from the €9,872 million obtained in 2010.Netnet fees and commissions were €4,051 million in 2011, a 10.1% increase from €3,679 million in 2010. These increases were, due to lower activity, partially offset the improvements in commercial units and the consolidation of Bank Zachodni WBKpreviously mentioned change in the second quarter. Excluding the perimeter impact, net interest income and fee and commission income increased 1.1%.
scope of consolidation.Gains/(losses) on financial assets and liabilities were €233increased by €52 million in 2011, a 72.5% decrease from €846 million in 2010. The decrease was mainlyprimarily due to the tensionsresults generated in the marketsrepurchase of preferred shares in Banesto and the second halfrepurchase of debt in Portugal.
In a weak environment and with low interest rates, the year which impacted gainsGroup’s strategy over the last two years focused on financial transactions, due,defending spreads on the one hand, to lower asset valuationsassets side (those on new ones are improving) and on the other, to reduced customer activity.liabilities side.
Total incomeOperating expenses increased 3.7% to €15,347 million in 2011 from €14,793 million in 2010. This increase was mainly pushed by the performance of Santander Consumer Finance, which increased 14.0%, backed by the most basic revenues: (i) net interest income (+13.6%), due to the rise in the average portfolio and to better spreads and (ii) fee income (+18.0%), basically due to servicing in the US and greater presence in key European countries (Germany, Poland and Norway).
includeAdministrativeadministrative expenses were €5,998anddepreciation and amortization, rose by €62 million in 2011, a 13.1% increase from €5,301 million in 2010(1.0%) year on year due to the impact of the changes in the scope of consolidation. OnEliminating this effect, there was a like-for-like basis the increase was only 0.9%. The larger unitsslight reduction with all of the segment experienced,units flat or decreasing as the Group’s strategy focused on control of expenses. Noteworthy, however, was the 4.8% reduction in real terms, reductions of 2.5% at Banesto, 2.1% in Portugal,Portugal.
Provisions and 1.2% in the Santander Branch Network.
impairment losses, which includeImpairmentprovisions (net),impairment losses on financial assets (net) were €4,206, andimpairment losses on other assets (net), increased by €5,854 million (1,135%). The main reason for this strong increase is the deterioration of the real estate segment in 2011,Spain. The segment was heavily affected by the impairment losses of Spain’s real estate portfolio in run-off accounted for during the year. Portugal experienced a 3.9% increase from €4,048 millionrise in 2010, mainlycredit loss provisions also due to the perimeter effect. Additionally,increase in non-performing loans as a result of the evolutioneconomic cycle. A decrease of NPLs11.7% in credit loss provisions in Santander Consumer Finance partially mitigated the increases in Spain was worse than expected becauseand Portugal.
Exposure to the downturnreal estate industry has taken on particular importance for Spanish financial institutions since 2008 due to a slowdown in sales, an increase in defaults, the economy was more severe than envisageddifficulties experienced by companies related to the real estate industry in accessing credit and thea fall in lending meant the NPL ratio increased to a greater extent than the volume of non-performing. property prices.
The NPL ratio in Continental Europe increased from 4.3%5.24% in 20102011 to 5.2%6.29% in 2011,2012, while NPL coverage decreasedincreased from 71%59% in 20102011 to 56%73% in 2011. The decrease in total lending in Spain caused the NPL ratio to increase to a greater extent than the volume of NPLs.2012.
Profit attributable to the Parent United Kingdom INTEREST INCOME / (CHARGES) Income from equity instruments Income from companies accounted for by the equity method Net fees and commissions Gains/losses on financial assets and liabilities (net) * Other operating income/(expenses) (net) TOTAL INCOME Administrative expenses Personnel expenses Other general expenses Depreciation and amortization Provisions (net) Impairment losses on financial assets (net) Impairment losses on other assets (net) Gains/(losses) on other assets (net) OPERATING PROFIT/(LOSS) BEFORE TAX Income tax PROFIT FROM CONTINUING OPERATIONS Profit/(loss) from discontinued operations (net) CONSOLIDATED PROFIT FOR THE YEAR Profit attributable to non-controlling interest Profit attributable to the Parent 2013 compared to 2012 In 2013, the United Kingdom accounted for 18.4% of profit attributed to the Parent bank’s total operating areas. Total incomedecreased by €897 million in was 15.1% lower at €2,849decreased by €2,915 million heavily affected by the impairment losses of Spain’s real estate portfolio in run-off. Total income reflects the positive effect of the change in the scope of consolidation due to the inclusion in the Group of Bank Zachodni WBK and the SEB branches in Germany for the full year, and a slight negative effect from €3,355the agreement with Abbey Life Assurance for the reinsurance of the portfolio of individual life risk in Spain and Portugal. Variations 2013 2012 2011 2013/2012 2012/2011 (in millions of euros, except percentages) 3,451 3,336 4,128 3.4 % (19.2 %) 1 1 1 — — 4 (5 ) 1 n/a n/a 991 1,190 1,015 (16.7 %) 17.1 % 403 1,231 405 (67.3 %) 204.0 % 30 24 28 25.0 % (14.3 %) 4,880 5,777 5,578 (15.5 %) 3.6 % (2,181 ) (2,311 ) (2,131 ) (5.6 %) 8.4 % (1,401 ) (1,492 ) (1,407 ) (6.1 %) 6.0 % (780 ) (819 ) (724 ) (4.8 %) 13.1 % (424 ) (379 ) (343 ) 11.9 % 10.5 % (232 ) (522 ) (964 ) (55.6 %) (45.9 %) (580 ) (1,220 ) (559 ) (52.5 %) 118.2 % (4 ) — — n/a n/a — 5 9 (100.0 %) (44.4 %) 1,459 1,350 1,590 8.1 % (15.1 %) (301 ) (312 ) (424 ) (3.5 %) (26.4 %) 1,158 1,038 1,166 11.6 % (11.0 %) (9 ) 77 39 n/a 97.4 % 1,149 1,115 1,205 3.0 % (7.5 %) — — — n/a n/a 1,149 1,115 1,205 3.0 % (7.5 %) * Includes exchange differences (net) 2011. Profits have been hard hit by the low growth environment, deleveraging and low interest rates, as well as the negative impact of gains on financial transactions and the increase in impairment losses mentioned above. Profits fell at the three commercial networks (Santander, Banesto and Portugal) and at wholesale businesses, while Santander Consumer Finance performed well (+51.5% in profit attributable to the parent bank) and Poland’s BZ WBK was incorporated to the Group in April.
121
2010 compared to 2009
In 2010, Continental Europe contributed 32.0% of the profit attributable to the Group’s operating areas. The contribution decreased from 45.8% in 20092013 mainly due to both the reduction in profits in Continental Europe and the strong growth in emerging markets, primarily in Brazil and the rest of Latin America.
lesser gInterest income was €9,872 million in 2010, which is a 10.0% or €1,094 million decrease from the €10,966 million obtained in 2009. Effective management of spreads and of the balance sheet was largely offset by the impact of slower business growth due to lower demand for loans, the repricing of mortgages and the higher cost of funds resulting from the strong competition for deposits.
Net fees and commissions were €3,679 million in 2010, a 0.5% decrease from €3,697 million in 2009 because of lower activity and lower demand for some products, especially mutual funds.
Gains/ains / (losses) on financial assets and liabilities as in 2012 Santander UK accounted for the repurchase of debt capital instruments.Net interest income increased €115 million or 3.4% (+8.3% in pounds sterling), and rose in every quarter, thanks to the spread on the stock of mortgages and the maturity of costly deposits in the second half of the year. The ratio of net interest income to average customer assets improved to 1.71% in the last quarter of 2013 from 1.27% in the last quarter of 2012.Net fees and commissionswere €846€199 million in 2010, a 23.1% increase from €687 million in 2009. The impact of lower activity due to the weak economic environment was offset by the improvement in gains from the distribution of treasury products to customers, especially in Banesto.
Total income decreased 5.9% in 2010 due to the negative performance of most areas. Only Santander Consumer Finance experienced an increase backed by the most basic revenues: interest income due to a rise in the average portfolio and management of spreads and fee income due to greater activity and servicing in the US.
Administrative expenses were €5,301 million in 2010, a 3.6% increase from €5,116 million in 2009. This growth was mainly due to the increase in the scope of consolidation in Santander Consumer Finance and the increase in costs atreduced Global Banking & Markets activity.
Operating expenses decreased €85 million in 2013. In local currency, operating expenses increased £32 million or 1.5% (below inflation and revenues), despite investments in retail and corporate banking.
Santander UK continued to invest in the growth of the SME business and Large Corporates. Moreover, the segment further developed its capacity to support their SME customers, with more customer-facing staff in its growing regional Corporate Business Centre network, and expansion into new financial centers across the U.K.. Santander UK also completed the rollout of and customer migration to the new transactional platform in 2013.
The increase was also driven by ongoing investment in business growth in Retail Banking, as well as increased regulatory compliance and control costs. These increases were partly offset by tight cost control, the Santander Branch Network, Banestoconsolidation of multi-branch locations.
Provisions and Portugal reduced their costs.
impairment losses decreased €926 million. The €290 million decrease inprovisions was mainly due toa €264 million customer remediation provision charge principally relating to PPI remediation accounted in 2012 and not repeated in 2013.Impairment losses on financial assets were €4,048decreased by €640 million mainly due to the significant provisions accounted in 2010, a 23.2% increase from €3,286 million in 2009. This strong increase resulted mainly from2012 related to the review carried out by the Bank of Spainand full re-assessment of the parameters establishedassets held in the Circular 4/2004non-core corporate and legacy portfolios in run-off. The provisions related to determineassets acquired from Alliance & Leicester plc. (particularly the shipping portfolio) as well as certain assets within the old Abbey Commercial Mortgages book. The amount of the provision in 2012 reflected the increasing losses experienced in these portfolios. For further details see Item 11 of Part I. “Quantitative and Qualitative Disclosures About Risk—Part 4. Credit Risk”. No further significant provisions for credit risk. These parameters are based on its experience and information onwere required in 2013 as disposals of assets across the historical rates of impairment in the banking sector and are periodically updated. The review, carried out in 2010,portfolios were consistent with provisioned levels.
In 2013, Santander UK improved its credit quality across the results shown by our internal model, reflected the worseningproduct range in Spanish debtors’ conditions taking into account both records of defaultretail and experience of the recoveries of non performing loans.corporate banking. The NPL ratio increasedexperienced a small decrease of 7 basis points, from 3.6% in 20092.05% to 4.3% in 2010,1.98%, while NPLthe coverage decreased from 77%44% to 42%. The stock of residential properties in 2009possession remained very low at 0.05% of the total portfolio, unchanged from 2012 and below the industry average, according to 71% in 2010.the Council of Mortgage Lenders.
Profit attributable to the Parent was €3,335increased €34 million in 2010, a 28.1% or €1,313 million decrease from €4,668 million in 2009. The main reasons for this decrease were weak revenues affected by the economic environmentmainly due to lower provisions and the increase in impairment losses mentioned above.which were partially compensated by reduced gains on financial transactions. The results demonstrate a further improvement in performance and continued the progress evident through the year, particularly in net interest income.
United Kingdom
| Variations | ||||||||||||||||||||
| 2011 | 2010 | 2009 | 2011/2010 | 2010/2009 | ||||||||||||||||
| (in millions of euros, except percentages) | ||||||||||||||||||||
INTEREST INCOME / (CHARGES) | 4,176 | 4,766 | 4,298 | (12.4 | %) | 10.9 | % | |||||||||||||
Income from equity instruments | 1 | — | — | n/a | n/a | |||||||||||||||
Income from companies accounted for by the equity method | 1 | — | — | n/a | n/a | |||||||||||||||
Net fees and commissions | 1,070 | 1,027 | 1,083 | 4.2 | % | (5.2 | %) | |||||||||||||
Gains/losses on financial assets and liabilities (net) | 405 | 462 | 506 | (12.3 | %) | (8.7 | %) | |||||||||||||
Other operating income/(expenses) (net) | 25 | 29 | 28 | (13.8 | %) | 3.6 | % | |||||||||||||
TOTAL INCOME | 5,678 | 6,284 | 5,915 | (9.6 | %) | 6.2 | % | |||||||||||||
Administrative expenses | (2,203 | ) | (2,241 | ) | (2,216 | ) | (1.7 | %) | 1.1 | % | ||||||||||
Personnel expenses | (1,391 | ) | (1,295 | ) | (1,257 | ) | 7.4 | % | 3.0 | % | ||||||||||
Other general expenses | (812 | ) | (946 | ) | (959 | ) | (14.2 | %) | (1.4 | %) | ||||||||||
Depreciation and amortization | (351 | ) | (309 | ) | (253 | ) | 13.6 | % | 22.1 | % | ||||||||||
Impairment losses on financial assets (net) | (585 | ) | (930 | ) | (881 | ) | (37.1 | %) | 5.6 | % | ||||||||||
Provisions (net) | (969 | ) | (151 | ) | (195 | ) | 541.7 | % | (22.6 | %) | ||||||||||
Impairment losses on other assets (net) | — | — | — | n/a | n/a | |||||||||||||||
Gains/(losses) on other assets (net) | (3 | ) | 47 | (7 | ) | n/a | n/a | |||||||||||||
OPERATING PROFIT/(LOSS) BEFORE TAX | 1,567 | 2,700 | 2,363 | (42.0 | %) | 14.3 | % | |||||||||||||
Income tax | (422 | ) | (735 | ) | (639 | ) | (42.6 | %) | 15.0 | % | ||||||||||
PROFIT FROM CONTINUING OPERATIONS | 1,145 | 1,965 | 1,724 | (41.7 | %) | 14.0 | % | |||||||||||||
Profit/(loss) from discontinued operations (net) | — | — | — | n/a | n/a | |||||||||||||||
CONSOLIDATED PROFIT FOR THE YEAR | 1,145 | 1,965 | 1,724 | (41.7 | %) | 14.0 | % | |||||||||||||
Profit attributable to non-controlling interest | — | — | — | n/a | n/a | |||||||||||||||
Profit attributable to the Parent | 1,145 | 1,965 | 1,724 | (41.7 | %) | 14.0 | % | |||||||||||||
122
20112012 compared to 20102011
In 2011, the United Kingdom contributed 12.5% of the profit attributable to the Parent bank’s total operating areas. This included a net gain of £65 million (€80 million, approximately) resulting from the impact netrepurchase of tax of a provision of €620 milliondebt capital instruments made in the second quarter,third quarter. Most of this gain was offset by provisions related to the payment protection insurance (PPI) remediation, in line with what has been done by other British banks. In addition, there were higher costs derived from regulatory changes affecting increased liquidity requirementsnon-core corporate and potential conduct remediation. Santander UK faced an environment of weak economic growth, low interest rates and higher wholesale funding costs. All
Total incomeincreased by €199 million mainly due to: (i) an €826 million increase in gains / (losses) on financial assets and liabilities largely due to the repurchase of this wasdebt capital instruments; (ii) a fall of €792 million in the context of weak growth and low interest rates.
Interest income was €4,176 million in 2011, a 12.4% or €590 million decrease from €4,766 million in 2010 reflecting the impact of the higher cost of liquid assets. The total commercial spread was lower at 1.85% (in local currency), withfunding (of both deposits and wholesale financing) and low interest rates. These impacts in interest income were partially offset by improved volumes and higher spreads on loans more than offsetnew lending to SMEs and businesses; and (iii) a €175 million rise innet fees and commissions due to increased fees and ancillary income from SME and large corporates.
Operating expenses increased by the greater cost of liquidity and funding. Increases in the proportion of customers on standard variable rate mortgages helped€216 million due to partly mitigate the impact of low interest rates. Higher net interest incomeinflation and continued investment in SMEs business.
Provisionsand corporations reflected growthimpairment lossesincreased by €219 million. The €442 million decrease in deposits and loans, with spreads on new loans continuing to increase.
Net fees and commissionsprovisions were €1,070 million in 2011, a 4.2% or €43 million increase from €1,027 million in 2010. This increase was mainly due to a new pricing structure for current accounts where overdraft interest charges have been replaced with a flat fee.
Gains / losses on financial assets and liabilities were €405 millionfall in 2011, a 12.3% or €57 million decrease from €462 million in 2010customer remediation principally due to remediation charges as in 2012 we provisioned €264 million compared to the impact€842 million (€620 million net of lower market activity.
Administrative expenses were €2,203 milliontax) of PPI-related charges registered in 2011 a 1.7% or €38 million decrease from €2,241 million in 2010. This decrease was mainly achieved by continued operational and integration cost efficiencies in the back office functions, marketing and property costs. This was partially offset by the addition of 1,100 employees to improve customer service in the first half of 2011, which enabled Santander UK to repatriate the call centers that were abroad.
Impairment losses on financial assets were €585 million in 2011, a 37.1% or €345 million decrease from €930 million in 2010, due to the improved evolution of retail products and to a better than expected performance in the current environment.
The NPL ratio was 1.86%, 0.10 percentage points higher than that of 2010. There was a better performance in all retail products, particularly mortgages and unsecured personal loans, and a slight deterioration in the fourth quarter in corporate loans, including real estate. The stock of foreclosed properties remained very low (0.06% of the total portfolio compared to 0.05% at the end of 2010). In general, the trends were better than the sector’s, according to the data from the Council of Mortgage Lenders (CML). The NPL coverage ratio stood at 38% at the end of 2011, an 8.0 percentage point decrease compared to 46% at the end of 2010.
Provisions were €969 million in 2011, a 541.7% or €818 million increase from of €151 million in 2010, mainly due to the one-off charge in the second quarter of €842 million from a provision made related to PPI remediation (see Item 8 of Part I, “Financial information—Legal proceedings, ii. Non-tax-related proceedings)proceedings”).
The NPL ratio was 2.05%, 0.20 percentage points higher than that of 2011. Both the stock of residential properties in possession (0.06%) as well as the NPL ratio of residential mortgages (1.74%) remained low with underlying performance stable and both were better than the sector average, according to the Council of Mortgage Lenders.
123
Profit attributable to the Parent was €1,145decreased by €90 million in 2011, a 41.7% or €820 million decrease from €1,965 million in 2010. Theas the income statement was very affected by thean environment of low activity,weak economic growth, low interest rates regulatory changes,and higher funding costscosts. Gains on financial transactions were offset by heavy impairment losses and provisions related to the PPI provision.non-core corporate and potential conduct remediation. On the other hand, costs were almost flat and fewer provisions were made, reflecting the good evolution of non-performing loans.in local currency cost experienced a decline.
Latin America INTEREST INCOME / (CHARGES) Income from equity instruments Income from companies accounted for by the equity method Net fees and commissions Gains/losses on financial assets and liabilities (net) * Other operating income/(expenses) (net) TOTAL INCOME Administrative expenses Personnel expenses Other general expenses Depreciation and amortization Provisions (net) Impairment losses on financial assets (net) Impairment losses on other assets (net) Gains/(losses) on other assets (net) OPERATING PROFIT/(LOSS) BEFORE TAX Income tax PROFIT FROM CONTINUING OPERATIONS Profit/(loss) from discontinued operations (net) CONSOLIDATED PROFIT FOR THE YEAR Profit attributable to non-controlling interest Profit attributable to the Parent Variations 2013 2012 2011 2013/2012 2012/2011 (in millions of euros, except percentages) 15,186 17,881 16,473 (15.1 %) 8.5 % 54 60 72 (10.0 %) (16.7 %) 202 183 36 10.4 % 408.3 % 4,874 �� 5,097 4,992 (4.4 %) 2.1 % 1,038 1,071 1,067 (3.1 %) 0.4 % (271 ) (358 ) (198 ) (24.3 %) 80.3 % 21,083 23,934 22,442 (11.9 %) 6.6 % (7,801 ) (8,253 ) (8,037 ) (5.5 %) 2.7 % (4,319 ) (4,643 ) (4,480 ) (7.0 %) 3.6 % (3,482 ) (3,610 ) (3,557 ) (3.6 %) 1.5 % (904 ) (871 ) (932 ) 3.8 % (6.5 %) (783 ) (1,027 ) (1,052 ) (23.8 %) (2.4 %) (6,533 ) (7,380 ) (5,448 ) (11.5 %) 35.5 % (25 ) (17 ) (39 ) 47.1 % (56.4 %) 307 226 62 35.8 % 264.5 % 5,344 6,612 6,996 (19.2 %) (5.5 %) (1,208 ) (1,484 ) (1,636 ) (18.6 %) (9.3 %) 4,136 5,128 5,360 (19.3 %) (4.3 %) — — — n/a n/a 4,136 5,128 5,360 (19.3 %) (4.3 %) 879 866 738 1.5 % 17.3 % 3,257 4,262 4,622 (23.6 %) (7.8 %) * Includes exchange differences (net) 20102013 compared to 200920122
In 2010, the United Kingdom contributed 18.8%As of theDecember 31, 2013, Latin America accounted for 52.1% of profit attributable to the Parent bank’sParent’s total operating areas.
The 2010 results were drivenstrategy in 2013 was focused on the expansion and consolidation of the commercial franchise in the region. The specialized offering of products and services is being strengthened in line with customer requirements, with a view to enabling the Bank to boost long-term growth; all while maintaining constant vigilance of risk quality.
Total incomedecreased by strong income growth, strict control€2,851 million due to a fall of costs and lower provisions.
€2,695 million inInterestnet interest income was €4,766 millionmainly focused in 2010, a 10.9% or €468 million increase from €4,298 million in 2009. The increase in interest income reflectsBrazil affected by lower spreads and the balanced growthchange of loansmix towards products with lower cost and deposits. The higher spread on loans was partlymargins. These effects were partially offset by the higher cost of the deposit capturing campaign. Moreover, the increased cost of funds and liquid assets, mainly in the second half of 2010, partly offset the strength of the core activity adding pressure on net interest income. There was a positive impact from greater retention of mortgages and customers’ preference for variable rate mortgages in Retail Banking. In addition, growth in bank account liability balances and hedging strategies helped to reduce the impact of lower interest rates on deposits. Prudent management of spreads and growth in loans and deposits in SMEs and corporations also helped to increase interest income.
volumes (in local currency).Net fees and commissions were €1,027declined by €223 million or 4.4%. However, deducting the exchange rate impact, net fee and commission income increased 6.2%. Of note was the growth in 2010, a 5.2%local currency from cards (+17.9%) and foreign trade (+18.6%).
Operating expenses decreased by €419 million or €56 million decrease from €1,083 million4.6%. Nevertheless, deducting the exchange rate impact, operating expenses grew 5.9% due to investment in 2009.networks and commercial projects (some traditional and others focused on priority customer segments), inflationary pressures on salary agreements and contracted services, and higher amortizations for technology.
| 2 | For a summary by countries see “Item 4. Information of the Company. B. Business Overview—Latin America.” |
Provisions and impairment lossesdecreased by €1,084 million. This decreasefall was mainly concentrated in line withBrazil which, after the marketchange in trend inat the UK. In retail business, revenue wasbeginning of 2013, reduced by the lower cancellation of mortgagesits provisions between March and the policy of reducing uncollateralized loans. The change in the mix from structured products to managed customer funds also continued, reducing current revenues but we expect it will produce higher fees in the future.
Gains / losses on financial assets and liabilities were €462 million in 2010, an 8.7% or €44 million decrease from €506 million in 2009 as the favorable market situation in 2009 was not repeated in 2010 and there were losses in the saleend of the portfolio of Alliance & Leicester, which has been discontinued.
Administrative expenses were €2,241 millionyear. This was partially offset by rises in 2010, an 1.1% or €25 million increase from €2,216 million in 2009. The cost savings obtained from synergies from the acquisition of Alliance & Leicester were reinvested in growth in Corporate BankingMexico and Global Banking & Markets. We continued to eliminate overlapping functions in back office and support departments.
Impairment losses on financial assets were €930 million in 2010, a 5.6% or €49 million increase from €881 million in 2009, due to the better evolution of retail products, mainly mortgages, enabling us to maintain high coverage levels.
Chile. The NPL ratio was 1.8%5.03%, 39 basis points lower than at the end of 2010 (compared2012, positively impacted by Brazil, while the coverage decreased 3 percentage points to 1.7% at December 2009). The stock of foreclosed properties remained very low at 0.05% of the total portfolio. The evolution, in general, was better than the sector, according to the Council of Mortgage Lenders (the “CML”). NPL coverage was 46% (compared to 44% at December 2009)85%.
Provisions were €151 million in 2010, a €44 million decrease from €195 million in 2009.
Profit attributable to the Parent was €1,965decreased by €1,005 million mainly due to a fall in 2010, a 14.0% or €241 million increase from €1,724 millionnet interest income affected by lower spreads (primarily in 2009, as a resultBrazil due to the change of business mix) partially offset by lower provisions due to the improvement in Brazil.
2012 compared to 2011
Latin American financial systems displayed high levels of capital, liquidity and robust credit quality indicators. They also maintained double-digit rates of growth reflecting the dynamism of the combined effecteconomies. The scope of higher revenues, stable costs and lower provisions.
124
Latin America
| Variations | ||||||||||||||||||||
| 2011 | 2010 | 2009 | 2011/2010 | 2010/2009 | ||||||||||||||||
| (in millions of euros, except percentages) | ||||||||||||||||||||
INTEREST INCOME / (CHARGES) | 16,473 | 14,678 | 11,959 | 12.2 | % | 22.7 | % | |||||||||||||
Income from equity instruments | 72 | 80 | 96 | (10.0 | %) | (16.7 | %) | |||||||||||||
Income from companies accounted for by the equity method | 37 | 10 | 10 | n/a | 0.0 | % | ||||||||||||||
Net fees and commissions | 4,991 | 4,661 | 3,925 | 7.1 | % | 18.8 | % | |||||||||||||
Gains/losses on financial assets and liabilities (net) | 1,067 | 1,410 | 1,663 | (24.3 | %) | (15.2 | %) | |||||||||||||
Other operating income/(expenses) (net) | (198 | ) | (163 | ) | 15 | 21.5 | % | n/a | ||||||||||||
TOTAL INCOME | 22,442 | 20,676 | 17,668 | 8.5 | % | 17.0 | % | |||||||||||||
Administrative expenses | (7,984 | ) | (7,193 | ) | (6,032 | ) | 11.0 | % | 19.2 | % | ||||||||||
Personnel expenses | (4,456 | ) | (3,955 | ) | (3,210 | ) | 12.7 | % | 23.2 | % | ||||||||||
Other general expenses | (3,528 | ) | (3,238 | ) | (2,822 | ) | 9.0 | % | 14.7 | % | ||||||||||
Depreciation and amortization | (925 | ) | (778 | ) | (566 | ) | 18.9 | % | 37.5 | % | ||||||||||
Impairment losses on financial assets (net) | (5,447 | ) | (4,687 | ) | (4,979 | ) | 16.2 | % | (5.9 | %) | ||||||||||
Provisions (net) | (1,232 | ) | (990 | ) | (681 | ) | 24.4 | % | 45.4 | % | ||||||||||
Impairment losses on other assets (net) | (38 | ) | (12 | ) | (22 | ) | n/a | (45.5 | %) | |||||||||||
Gains/(losses) on other assets (net) | 241 | 255 | 40 | (5.5 | %) | n/a | ||||||||||||||
OPERATING PROFIT/(LOSS) BEFORE TAX | 7,057 | 7,271 | 5,428 | (2.9 | %) | 34.0 | % | |||||||||||||
Income tax | (1,655 | ) | (1,693 | ) | (1,257 | ) | (2.2 | %) | 34.7 | % | ||||||||||
PROFIT FROM CONTINUING OPERATIONS | 5,402 | 5,578 | 4,171 | (3.2 | %) | 33.7 | % | |||||||||||||
Profit/(loss) from discontinued operations (net) | — | — | 91 | n/a | (100.0 | %) | ||||||||||||||
CONSOLIDATED PROFIT FOR THE YEAR | 5,402 | 5,578 | 4,262 | (3.2 | %) | 30.9 | % | |||||||||||||
Profit attributable to non-controlling interest | 738 | 850 | 428 | (13.2 | %) | 98.6 | % | |||||||||||||
Profit attributable to the Parent | 4,664 | 4,728 | 3,834 | (1.4 | %) | 23.3 | % | |||||||||||||
2011 comparedconsolidation of this segment changed due to 2010
In 2011, Latin America contributed 50.8%the sale of the profit attributablesubsidiary in Colombia, the agreement with Zurich Financial Services Group to the Parent bank’s total operating areas with strong growthstrengthen insurance distribution and higher minority interests in all countries. The main developments were the notable rise in basic revenues,Brazil, Mexico and Chile.
Total incomeincreased by €1,492 million driven by greaternet interest income which did not feed through to profits as it was offset by the decrease in gains on financial transactions caused by the market situation, the increase in administrative expenses and the rise in loan-loss provisions.
Interest income was €16,473€1,408 million in 2011, a 12.2% or €1,795 million increase from €14,678 million in 2010,higher due to largerincreased volumes and improved management of spreads in a context of higherstable or declining interest rates, than in 2010. Interest income was the main driver of profit growth.varying by country.
Net fees and commissions were €4,991grew €105 million in 2011, a 7.1% or €330 million increase from €4,661 million in 2010.affected by regulatory pressures. Excluding the exchange rate impact, the main drivers of growth were insurancecards (+31.7%18.7%), transactional banking (+9.8%), administration of accounts (+6.8%) and credit cardsinsurance (+23.7%2.5%). Mutual funds dropped 15.4% because of the shift into deposits.
Operating expenses increased by €155 million was mainly due to the opening of branches (some traditional and others focused on priority customer segments), new business projects and inflationary pressures on wage agreements and outsourcing of services.
Provisions and impairment lossesincreased by €1,885 million largely influenced by increased lending and a worsening of nonperforming loans in some markets. The NPL ratio increased 110 basis points, from 4.32% to 5.42%, while thosecoverage decreased from managing accounts fell 16.6%97% to 88%.
Profit attributable to the Parentdecreased by €360 million mainly due to the sale of the subsidiary in Colombia, the sale of our insurance businesses with Zurich Financial Services Group to strengthen insurance distribution and the increase of non-controlling interests in Brazil, Mexico and Chile.
United States
| Variations | ||||||||||||||||||||
| 2013 | 2012 | 2011 | 2013/2012 | 2012/2011 | ||||||||||||||||
| (in millions of euros, except percentages) | ||||||||||||||||||||
INTEREST INCOME / (CHARGES) | 1,409 | 1,695 | 3,289 | (16.9 | %) | (48.5 | %) | |||||||||||||
Income from equity instruments | 23 | 20 | 1 | 15.0 | % | 1,900.0 | % | |||||||||||||
Income from companies accounted for by the equity method | 321 | 341 | — | (5.9 | %) | n/a | ||||||||||||||
Net fees and commissions | 394 | 378 | 643 | 4.2 | % | (41.2 | %) | |||||||||||||
Gains/losses on financial assets and liabilities (net) * | 69 | 244 | 192 | (71.7 | %) | 27.1 | % | |||||||||||||
Other operating income/(expenses) (net) | (58 | ) | (73 | ) | (57 | ) | (20.5 | %) | 28.1 | % | ||||||||||
TOTAL INCOME | 2,158 | 2,605 | 4,068 | (17.2 | %) | (36.0 | %) | |||||||||||||
Administrative expenses | (1,097 | ) | (1,037 | ) | (1,169 | ) | 5.8 | % | (11.3 | %) | ||||||||||
Personnel expenses | (606 | ) | (571 | ) | (645 | ) | 6.1 | % | (11.5 | %) | ||||||||||
Other general expenses | (491 | ) | (466 | ) | (524 | ) | 5.4 | % | (11.1 | %) | ||||||||||
Depreciation and amortization | (163 | ) | (146 | ) | (126 | ) | 11.6 | % | 15.9 | % | ||||||||||
Provisions (net) | (50 | ) | (170 | ) | (43 | ) | (70.6 | %) | 295.3 | % | ||||||||||
Impairment losses on financial assets (net) | 4 | (265 | ) | (1,006 | ) | n/a | (73.7 | %) | ||||||||||||
Impairment losses on other assets (net) | (16 | ) | (24 | ) | (118 | ) | (33.3 | %) | (79.7 | %) | ||||||||||
Gains/(losses) on other assets (net) | 2 | 7 | — | (71.4 | %) | n/a | ||||||||||||||
OPERATING PROFIT/(LOSS) BEFORE TAX | 838 | 970 | 1,606 | (13.6 | %) | (39.6 | %) | |||||||||||||
Income tax | (113 | ) | (165 | ) | (554 | ) | (31.5 | %) | (70.2 | %) | ||||||||||
PROFIT FROM CONTINUING OPERATIONS | 725 | 805 | 1,052 | (9.9 | %) | (23.5 | %) | |||||||||||||
Profit/(loss) from discontinued operations (net) | — | — | — | n/a | n/a | |||||||||||||||
CONSOLIDATED PROFIT FOR THE YEAR | 725 | 805 | 1,052 | (9.9 | %) | (23.5 | %) | |||||||||||||
Profit attributable to non-controlling interest | — | — | 48 | n/a | (100.0 | %) | ||||||||||||||
Profit attributable to the Parent | 725 | 805 | 1,004 | (9.9 | %) | (19.8 | %) | |||||||||||||
| * | Includes exchange differences (net). |
2013 compared to 20123
In 2013, United States contributed 11.6% of the profit attributable to the Parent’s bank total operating areas. Business was conducted in a setting of moderate growth in which the monetary authorities kept interest rates very low and implemented other unconventional stimulus measures such as quantitative easing.
During 2013, Sovereign Bank changed its name to Santander Bank and continued to capture new customers and expand its range of higher value-added products and services. The main strategy in the retail segment is to enhance customer attention via new ATMs, refurbish branches and give an impetus to alternative channels (mobile banking, etc.).
Santander Consumer USA’s strategy is to continue to strengthen its auto finance franchise. The growth drivers are organic growth supported by commercial agreements with brands and dealers, strategic alliances (such as the partnership with Chrysler), growth in the platform of direct credits to clients via Internet (Roadloans.com) and the opportunities of expansion offered by servicing.
Total incomedecreased by €447 million reflecting a €286 million reduction innet interest income and €175 million reduction ingains on financial assets and liabilities. IncomeThe decrease in net interest income reflected the low interest rate environment, the reduction in the non-strategic loan portfolio and the sharp fall in the investment portfolio. Gains on financial assets and liabilities decreased due to lower trading gains.
| 3 | For further information on the segment, see “Item 4. Information of the Company. B. Business Overview—United States”. |
SCUSA’s contribution, which is accounted for asincome from insurance business grew 16.9%, affectedcompanies accounted for by the impactequity method, was €321 million, 5.9% less than in 2012. Although SCUSA’s net interest income increased by 27% in U.S. dollars, partly due to the agreement with Chrysler, this growth has not yet fed through to profits because of the higher provisions required for the faster pace of lending, which increased 35% in U.S. dollars in 2013.
Operating expensesincreased by €78 million as a result of the investment in rebranding, technology (ATMs, mobile banking, cards) and higher spending on regulatory compliance.
Provisions and impairment lossesdecreased by €397 million due to the normalization of the cost of credit and the improvement in the economy. At December 31, 2013, the NPL ratio was 2.23%, a 6 basis point reduction as compared to 2012. Coverage stood at 94% at December 31, 2013, a 12 percentage points reduction as compared to 2012.
Profit attributable to the Parentdecreased €80 million. This fall was mainly driven by Santander Bank as the sharp reduction in provisions due to the high credit quality was offset by a fall in net interest income and gains on financial assets and liabilities and higher operating expenses.
2012 compared to 2011
On December 31, 2011, SCUSA increased its capital to allow for new shareholders. As a result, SCUSA is subject to the joint control of all shareholders, which led the Group to stop consolidating this company by the global integration method and to record its stake by the equity method.
Total incomedecreased by €1,463 with the negative development of net interest income (-€1,594 million) and net fees and commissions (-€265 million) which were partially offset by the contribution of SCUSA recorded as income from companies accounted for by the equity method (+€341 million) and, to a lesser extent, greater net gains on financial assets and liabilities (+€52 million).
The €1,594 million decrease innet interest income was mainly due to the change in consolidation method of SCUSA. Eliminating SCUSA’s results in 2011 and in local currency, net interest income was down by 6.7%, reflecting the fall in long-term interest rates and the reduction in the non-strategic portfolio.
The €265 million decrease in net fees and commissions was mainly due to the deconsolidation of SCUSA. Eliminating SCUSA’s results in 2011 and in local currency, there was a 6.8% drop. The increased regulatory pressure resulted in a significant reduction in revenues linked to commissions from credit card transactions and overdrafts. This was partly offset by the business effort, which raised the quality of revenues associated with current accounts.
Net gains on financial assets and liabilities increased €52 million due to the increase in originations and sale of mortgages and greater customer activity.
Operating expensesdecreased by €112 million due to the deconsolidation of SCUSA. Eliminating SCUSA’s results and in local currency, operating expenses grew almost 9% as compared to 2011. This increase reflects the investments in technology and in the sales and regulatory compliance teams needed to take advantage of the new status as a national bank.
Provisions and impairment lossesdecreased by €708 million in 2013 mainly due to lesserimpairment losses on financial assets with a €741 million decrease principally relating to the deconsolidation of SCUSA. Eliminating SCUSA’s results in 2011 and in local currency, loan-loss provisions dropped by 34.7%, further lowering the NPL ratio to 2.29% from 2.85% in 2011, and coverage rose to 106% from 96% in 2011. This was mainly due to the improved composition of the portfolio and strict management of risk. On the other handprovisions (net)increased €127 million mainly due to provisions booked in respect of certain Trust Piers securities due to the court settlement reached to remunerate an investment at a higher rate of interest than it was earning.
Profit attributable to the Parent decreased by €199 million. The main developments were: (i) the entry of new shareholders in SCUSA, with the result that our stake in the company went from 91.5% to approximately 65%, (ii) the provision booked for the Trust Piers settlement.
Corporate Activities
| Variations | ||||||||||||||||||||
| 2013 | 2012 | 2011 | 2013/2012 | 2012/2011 | ||||||||||||||||
| (in millions of euros, except percentages) | ||||||||||||||||||||
INTEREST INCOME / (CHARGES) | (2,234 | ) | (1,843 | ) | (1,272 | ) | 21.2 | % | 44.8 | % | ||||||||||
Income from equity instruments | 35 | 53 | 56 | (34.0 | %) | (5.4 | %) | |||||||||||||
Income from companies accounted for by the equity method | (8 | ) | (4 | ) | 3 | 100.0 | % | n/a | ||||||||||||
Net fees and commissions | (50 | ) | (29 | ) | (9 | ) | 72.4 | % | 222.2 | % | ||||||||||
Gains/losses on financial assets and liabilities (net) * | 1,109 | 288 | 398 | 285.1 | % | (27.6 | %) | |||||||||||||
Other operating income/(expenses) (net) | 119 | 536 | 117 | (77.8 | %) | 358.1 | % | |||||||||||||
TOTAL INCOME | (1,029 | ) | (999 | ) | (707 | ) | 3.0 | % | 41.3 | % | ||||||||||
Administrative expenses | (566 | ) | (410 | ) | (502 | ) | 37.7 | % | (18.1 | %) | ||||||||||
Personnel expenses | (216 | ) | (102 | ) | (238 | ) | 111.8 | % | (57.1 | %) | ||||||||||
Other general expenses | (350 | ) | (308 | ) | (264 | ) | 13.6 | % | 16.7 | % | ||||||||||
Depreciation and amortization | (131 | ) | (120 | ) | (107 | ) | 9.2 | % | 12.1 | % | ||||||||||
Provisions (net) | (959 | ) | 371 | (120 | ) | n/a | n/a | |||||||||||||
Impairment losses on financial assets (net) | (352 | ) | (112 | ) | (1,087 | ) | 214.3 | % | (89.7 | %) | ||||||||||
Impairment losses on other assets (net) | (393 | ) | (440 | ) | (1,285 | ) | (10.7 | %) | (65.8 | %) | ||||||||||
Gains/(losses) on other assets (net) | 1,795 | 668 | 1,385 | 168.7 | % | (51.8 | %) | |||||||||||||
OPERATING PROFIT/(LOSS) BEFORE TAX | (1,635 | ) | (1,042 | ) | (2,423 | ) | 56.9 | % | (57.0 | %) | ||||||||||
Income tax | (115 | ) | (119 | ) | 726 | (3.4 | %) | (116.4 | %) | |||||||||||
PROFIT FROM CONTINUING OPERATIONS | (1,750 | ) | (1,161 | ) | (1,697 | ) | (50.7 | %) | (31.6 | %) | ||||||||||
Profit/(loss) from discontinued operations (net) | — | — | — | n/a | n/a | |||||||||||||||
CONSOLIDATED PROFIT FOR THE YEAR | (1,750 | ) | (1,161 | ) | (1,697 | ) | (50.7 | %) | (31.5 | %) | ||||||||||
Profit attributable to non-controlling interest | 138 | (19 | ) | (26 | ) | n/a | (23.1 | %) | ||||||||||||
Profit attributable to the Parent | (1,888 | ) | (1,142 | ) | (1,671 | ) | 65.3 | % | (31.7 | %) | ||||||||||
| * | Includes exchange differences (net). |
2013 compared to 2012
Total incomedecreased €30 million or 3.0%.Net interest income / (charges) worsened by €391 million due to our policy of strengthening liquidity since the middle of 2012, and which, combined with the current low level of market interest rates, caused net interest income to deteriorate temporarily. It also includes the cost of credit of issues in wholesale markets, which was partly absorbed by lower recourse to these markets (directly related to the lower funding needs from the gap between lending and deposits).
Other operating income decreased by €417 million mainly due to the €435 million accounted in 2012 as a result of the agreement reached with Zurich (excluding this impact: +34.8%)Abbey Life Insurance Ltd., which acquired 51%a subsidiary of the share capital of ZS Insurance América, S.L. (the holding companyDeustche Bank AG. The agreement provided for the Group’sreinsurance of our entire individual life risk portfolio of our insurance businessescompanies in Latin America).Spain and Portugal.
Gains / Gains/losses on financial assets and liabilities were €1,067increased by €821 million in 2011, a 24.3% or €343due to gains derived from the ALCO portfolio. These gains reflect those derived from the centralized management of the interest rate and exchange rate risk of the parent bank as well as from equities.
Operating expensesincreased €166 million decrease from €1,410 million in 2010, largelymainly due to the volatilityexecution in 2013 of marketsprojects originally planned for 2012. Administrative expenses increased, partly linked to higher indirect taxes.
Provisions and impairment losses increased €1,523 million mainly due to provisions for pensions and similar obligations relating to the pre-retirement and voluntary redundancy offer accepted by employees in 2013, charges made in the thirdfourth quarter for goodwill in Italy, real estate provisions and fourth quarters.for the integration costs of SEB in Germany.
Administrative expensesGains/(losses) on other assets (net) were €7,984 million in 2011,registered an 11.0% or €791 million increase from €7,193 million in 2010. The increase wasof €1,127 million. Gains were mainly due to: (i)to the growthsale of our management companies (+€1,372 million) to Warburg Pincus and General Atlantic, the insurance companies in staff inSpain (+€385 million) to Aegon, and the branch networks, (ii) renegotiation of salaries and collective agreements; (iii) new business projects; (iv) increased installed capacity; and (v) redesigning points of attention.
Impairment losses on financial assets were €5,447 million in 2011, a 16.2% or €760 million increase from €4,687 million in 2010, which is below lending growth. The NPL ratio increased 21 basis points, from 4.11% to 4.32%, while coverage was decreased from 104% to 97%.
ProfitLoss attributable to the Parentwas €4,664 increased by €746 million in 2011, a 1.4% or €64 million decrease from €4,728 million in 2010. This decrease wasprimarily due to increasedgreater provisions and impairment loses, reducedlosses, higher interest charges partially offset by trading gains and gains on corporate transactions.
2012 compared to 2011
Total incomedecreased by €292 million greater interest charges, lesser gains on financial transactionsassets and liabilities partially offset by increased other operating income.Net Interest income/(charges) increased €571 million largely due to a liquidity buffer kept in the European Central Bank and the greater cost of wholesale funding, which was partly offset by reduced recourse to wholesale markets because the need to finance the commercial gaps was lower. This higher cost also impacted the financing of the Group’s goodwill, which by definition has a negative nature, and which increased its cost proportionately.
Other operating income increased by €419 million mainly due to the unfavorable market situation, and higher commercial investment. This was partially offset thanks to the dynamism of net interest income and fee income, which lifted total income by 8.5%. By segment, Retail Banking’s attributable profit rose 0.8%, while Global Wholesale Banking and Asset Management and Insurance’s decreased 1.5% and 1.4%, respectively.
125
2010 compared to 2009
In 2010, Latin America contributed 45.1%€435 million accounted as a result of the profit attributable to the Parent bank’s total operating areasagreement reached with strong growth in all countries.Abbey Life Insurance Ltd.
Interest income was €14,678 million in 2010, a 22.7% or €2,719 million increase from €11,959 million in 2009, due to greater volumes, the change of mix toward lower risk products and defending spreads in an environment of lower interest rates than in 2009.
Net fees and commissions were €4,661 million in 2010, an 18.8% or €736 million increase from €3,925 million in 2009. The main drivers of growth were, in local currency, insurance activity (+18%), mutual funds (+14%), credit cards (+10%), cash management (+8%) and foreign trade (+7%). Income from the administration of accounts, however, was 2% lower due to the negative impact from regulatory changes that eliminated certain commissions.
Gains / losses(losses) on financial assets and liabilities decreased by €110 million. Of note were €1,410 million in 2010, a 15.2% or €253 million decreasethe results from €1,663 million in 2009, largely due to large capital gains in securities portfolios in 2009 that were not repeated in 2010.
Administrative expenses were €7,193 million in 2010, a 19.2% or €1,161 million increase from €6,032 million in 2009. In Brazil, Mexico, Colombia, Uruguay and Puerto Rico, costs grew (in local currency) in line with or below their respective inflation rates. In Argentina, they increased 26.9% (in local currency) due to the renegotiation of the collective bargaining agreement (+23%) in a context of significant growth in inflation. In Chile, the impact of the earthquake and the signing of a collective bargaining agreement produced an increase of 7.8% (in local currency).
Impairment losses on financial assets were €4,687 million in 2010, a 5.9% or €292 million decrease from €4,979 million in 2009. The better macroeconomic environment and outlook, together with active riskliabilities management, and a notable improvement in risk premiums (from 4.8% in 2009 to 3.6% in 2010), is beginning to be reflected in provisions (-19.5%). The NPL ratio declined 14 basis points, from 4.25% to 4.11%, while coverage was stable at 104%.
Profit attributable to the non-controlling interest was €850 million in 2010, a 98.6% or €422 million increase from €428 million in 2009. This strong increase is the net result of the sale of Santander Brazil shares in 2009small financial stakes and 2010 and the acquisition of the non-controlling interest of Santander Mexico in September 2010.
Profit attributable to the Parent was €4,728 million in 2010, a 23.3% or €894 million increasethose arising from €3,834 million in 2009 reflecting the strong growth of the region, the strict control of expenses (with the increase being below that of inflation) and the intense management of recoveries of bad loans (resulting in a notable decline in loan-loss provisions). The increase in profit attributable to the Parent bank was positively affected by the exchange rate impact and negatively affected by the sale of Banco de Venezuela and by higher non-controlling interest. By segment and excluding these impacts, Retail Banking’s profit attributable to the parent bank was 32.8% higher, Wholesale Banking’s profit attributable to the parent bank declined 8.5% (notably influenced by very good results in 2009) and Asset Management and Insurance’s attributable profit rose 9.5%.
Sovereign
| Variations | ||||||||||||||||||||
| 2011 | 2010 | 2009 (¹) | 2011/2010 | 2010/2009 | ||||||||||||||||
| (in millions of euros, except percentages) | ||||||||||||||||||||
INTEREST INCOME / (CHARGES) | 1,678 | 1,736 | 1,160 | (3.3 | %) | 49.7 | % | |||||||||||||
Income from equity instruments | 1 | 1 | 1 | 0.0 | % | 0.0 | % | |||||||||||||
Income from companies accounted for by the equity method | — | — | (3 | ) | n/a | (100.0 | %) | |||||||||||||
Net fees and commissions | 375 | 408 | 380 | (8.1 | %) | 7.4 | % | |||||||||||||
Gains/losses on financial assets and liabilities (net) | 190 | 29 | 14 | 555.2 | % | 107.1 | % | |||||||||||||
Other operating income/(expenses) (net) | (56 | ) | (67 | ) | (89 | ) | (16.4 | %) | (24.7 | %) | ||||||||||
TOTAL INCOME | 2,188 | 2,107 | 1,463 | 3.8 | % | 44.0 | % | |||||||||||||
Administrative expenses | (863 | ) | (832 | ) | (766 | ) | 3.7 | % | 8.6 | % | ||||||||||
Personnel expenses | (469 | ) | (468 | ) | (457 | ) | 0.2 | % | 2.4 | % | ||||||||||
Other general expenses | (394 | ) | (364 | ) | (309 | ) | 8.2 | % | 17.8 | % | ||||||||||
Depreciation and amortization | (113 | ) | (105 | ) | (115 | ) | 7.6 | % | (8.7 | %) | ||||||||||
Impairment losses on financial assets (net) | (375 | ) | (510 | ) | (571 | ) | (26.5 | %) | (10.7 | %) | ||||||||||
Provisions (net) | (42 | ) | (66 | ) | (55 | ) | (36.4 | %) | 20.0 | % | ||||||||||
Impairment losses on other assets (net) | (18 | ) | (19 | ) | (1 | ) | (5.3 | %) | n/a | |||||||||||
Gains/(losses) on other assets (net) | (1 | ) | (8 | ) | (2 | ) | (87.5 | %) | 300.0 | % | ||||||||||
OPERATING PROFIT/(LOSS) BEFORE TAX | 776 | 567 | (47 | ) | 36.9 | % | n/a | |||||||||||||
Income tax | (250 | ) | (143 | ) | 22 | 74.8 | % | n/a | ||||||||||||
PROFIT FROM CONTINUING OPERATIONS | 526 | 424 | (25 | ) | 24.1 | % | n/a | |||||||||||||
Profit/(loss) from discontinued operations (net) | — | — | — | n/a | n/a | |||||||||||||||
CONSOLIDATED PROFIT FOR THE YEAR | 526 | 424 | (25 | ) | 24.1 | % | n/a | |||||||||||||
Profit attributable to non-controlling interest | — | — | — | n/a | n/a | |||||||||||||||
Profit attributable to the Parent | 526 | 424 | (25 | ) | 24.1 | % | n/a | |||||||||||||
126
2011 compared to 2010
In 2011, Sovereign contributed 5.7% of the profit attributable to the Parent bank’s total operating areas.
Interest incomefor 2011 was €1,678 million, a 3.3% or €58 million decrease as compared to €1,736 million for 2010. Net interest income was impacted by a sharp decline in interest rates, which was partially offset by the management of volumes and prices.
Net fees and commissionswere €375 million in 2011, an 8.1% or €33 million decrease from €408 million in 2010. This decrease was partially caused by the negative impact of the Durbin Amendment to the Dodd-Frank Act, which limits the commissions charged to clients for certain transactions. We partially offset this impact through increased commercial efforts.
Administrative expenses were €863 million in 2011, a 3.7% or €31 million increase as compared to €832 million in 2010.Depreciation and amortization was €113 million in 2011, a 7.6% or €8 million increase as compared to €105 million in 2010. The increase in operating expenses reflects the impact of investments in technology and the increase in commercial structures which begun in the second half of 2010.
Impairment losses on financial assets were €375 million in 2011, a 26.5% or €135 million decrease as compared to €510 million in 2010. This reduction was due to the control of NPLs and the recovery capacity throughout the credit cycle. This change caused a better than expected evolution in credit quality. Non-performing loans and coverage improved for the eighth quarter running. The NPL ratio stood at 2.9% down from 4.61% in December 2010. The NPL coverage was 96% as compared to 75% in December 2010.
Profit attributable to the Parent was €526 million in 2011, a €102 million increase as compared to €424 million in 2010. Revenues and provisions performed well and costs rose because of investments in technology and commercial structures.
2010 compared to 2009
In 2010, Sovereign contributed 4.0% of the profit attributable to the Parent bank’s total operating areas.
Interest incomefor 2010 was €1,736 million, a 49.7% or €576 million increase as compared to €1,160 million for 2009, mainly due to the management of prices in loans, the lower cost of deposits and ALCO management, which offset the lower volume of loans.
127
Administrative expenses were €832 million in 2010, an 8.6% or €66 million increase as compared to €766 million in 2009.Depreciation and amortization was €105 million in 2010, an 8.7% or €10 million decrease as compared to €115 million in 2009. Operating expenses reflect the efforts to reduce costs, the positive impact of synergies and the optimization of structures.
Impairment losses on financial assets were €510 million in 2010, a 10.7% or €61 million decrease as compared to €571 million in 2009, thanks to containment of NPLs and the recovery capacity throughout the credit cycle. This is reflected in a better than expected evolution in credit quality.
Profit attributable to the Parent was €424 million in 2010, a €449 million increase as compared to a loss of €25 million in 2009. Sovereign consolidated the profitability of its franchise in 2010 and secured the breakeven point reached in the fourth quarter of 2009 due to effective management of spreads, the better mix of loans and deposits, control of costs and enhanced credit quality.
Corporate Activities
| Variations | ||||||||||||||||||||
| 2011 | 2010 | 2009 | 2011/2010 | 2010/2009 | ||||||||||||||||
| (in millions of euros, except percentages) | ||||||||||||||||||||
INTEREST INCOME / (CHARGES) | (2,172 | ) | (1,828 | ) | (2,084 | ) | 18.8 | % | (12.3 | %) | ||||||||||
Income from equity instruments | 56 | 64 | 121 | (12.5 | %) | (47.1 | %) | |||||||||||||
Income from companies accounted for by the equity method | 5 | (2 | ) | (15 | ) | n/a | (86.7 | %) | ||||||||||||
Net fees and commissions | (15 | ) | (40 | ) | (5 | ) | (62.5 | %) | n/a | |||||||||||
Gains/losses on financial assets and liabilities (net) | 421 | (142 | ) | 1,376 | n/a | n/a | ||||||||||||||
Other operating income/(expenses) (net) | 128 | 137 | 52 | (6.6 | %) | 163.5 | % | |||||||||||||
TOTAL INCOME | (1,577 | ) | (1,811 | ) | (555 | ) | (12.9 | %) | 226.3 | % | ||||||||||
Administrative expenses | (733 | ) | (688 | ) | (695 | ) | 6.5 | % | (1.0 | %) | ||||||||||
Personnel expenses | (285 | ) | (268 | ) | (307 | ) | 6.3 | % | (12.7 | %) | ||||||||||
Other general expenses | (448 | ) | (420 | ) | (388 | ) | 6.7 | % | 8.2 | % | ||||||||||
Depreciation and amortization | (106 | ) | (132 | ) | (114 | ) | (19.7 | %) | 15.8 | % | ||||||||||
Impairment losses on financial assets (net) | (1,255 | ) | (268 | ) | (1,861 | ) | 368.3 | % | (85.6 | %) | ||||||||||
Provisions (net) | (220 | ) | 114 | (762 | ) | n/a | n/a | |||||||||||||
Impairment losses on other assets (net) | (1,413 | ) | (207 | ) | (100 | ) | 582.6 | % | 107.0 | % | ||||||||||
Gains/(losses) on other assets (net) | (196 | ) | (178 | ) | 382 | 10.1 | % | n/a | ||||||||||||
OPERATING PROFIT/(LOSS) BEFORE TAX | (5,500 | ) | (3,170 | ) | (3,705 | ) | 73.5 | % | (14.4 | %) | ||||||||||
Income tax | 1,600 | 867 | 2,437 | 84.5 | % | (64.4 | %) | |||||||||||||
PROFIT FROM CONTINUING OPERATIONS | (3,900 | ) | (2,303 | ) | (1,268 | ) | 69.3 | % | 81.6 | % | ||||||||||
Profit/(loss) from discontinued operations (net) | — | (13 | ) | (15 | ) | (100.0 | %) | (13.3 | %) | |||||||||||
CONSOLIDATED PROFIT FOR THE YEAR | (3,900 | ) | (2,316 | ) | (1,283 | ) | 68.4 | % | 80.5 | % | ||||||||||
Profit attributable to non-controlling interest | (67 | ) | (25 | ) | (24 | ) | 168.0 | % | 4.2 | % | ||||||||||
Profit attributable to the Parent | (3,833 | ) | (2,291 | ) | (1,259 | ) | 67.3 | % | 82.0 | % | ||||||||||
2011 compared to 2010
Interest income/(charges)for Corporate Activities was a loss of €2,172 million in 2011, an 18.8% increase as compared to 2010. The increase was largely due to the greater cost of wholesale funding. This was mainly due to the higher level of market reference interest rates and the rise in the credit spreads of issues, as well as the cost of maintaining a prudent liquidity position. This higher cost also had a negative impact on financing costs associated with of the Group’s investments and acquisitions, which costs are allocated to the Corporate Activities segment. The net interest income of the ALCO portfolios was higher in 2011 than 2010, while maintaining similar volumes, thanks to the greater return on the assets.
128
Gains / losses on financial assets and liabilitieswere a gain of €421 million in 2011 compared to losses of €142 million in 2010.available for sale. The difference was mainly due to hedging. In 2011, the impact of hedging the results of subsidiaries was negative (it was positive (offsettingin 2011) balancing the lowerhigher value in euros of the results of the business units) and more than €500units results.
Operating expensesdecreased by €78 million above 2010. In 2010, there were higher losses from the hedging of the results of subsidiaries and writedowns of financial investments in the portfolio of equity stakes, both of which were partly offset by positive returns from the hedging of interest rates.
Administrative expenses were €733 million in 2011 a 6.5% or €45 million increase from €688 million in 2010, mainly due to an increaselower personnel expenses.
Provisions and impairment losses decreased by €2,312 million as impairment stabilized after the portfolio’s significant deterioration in rents.Depreciation and amortization stood at €106 million, a 19.7% reduction from2011. Furthermore, the €132 million in 2010. The growth in general costs from the increase in rents was partially offset by lower amortizations.
In 2011, Corporate Activitiesfollowing impairment losses on financial assets were €1,255 million a 368.3% or €987 million increase from €268 million in 2010.Impairment losses on other assets were €1,413 million a 582.6% or €1,206 million increase from €207 million solely recorded in 2010. These variations were mainly due to €1,812 million in provisions to cover real estate exposure in Spain,2011: €601 million to amortize goodwill related to Santander Totta, and the amortization of other intangibles, pensions and contingencies.
Gains/(losses) on other assets (net)registered a decrease of €717 million. The gains accounted in 2012 were mainly due to the sale of the business in Colombia and the reinsurance operation of the insurance portfolios in Spain and Portugal.
Loss attributable to the Parentamounted to €3,833 decreased by €529 million in 2011, a €1,542 million increase as compared to a loss of €2,291 million in 2010. This variation was primarily due to thelower impairment losses previously mentioned.on financial assets and on other assets.
Retail Banking INTEREST INCOME / (CHARGES) Income from equity instruments Income from companies accounted for by the equity method Net fees and commissions Gains/losses on financial assets and liabilities (net) * Other operating income/(expenses) (net) TOTAL INCOME Administrative expenses Personnel expenses Other general expenses Depreciation and amortization Provisions (net) Impairment losses on financial assets (net) Impairment losses on other assets (net) Gains/(losses) on other assets (net) OPERATING PROFIT/(LOSS) BEFORE TAX Income tax PROFIT FROM CONTINUING OPERATIONS Profit/(loss) from discontinued operations (net) CONSOLIDATED PROFIT FOR THE YEAR Profit attributable to non-controlling interest Profit attributable to the Parent 2013 compared to 2010Second level (business): Variations 2013 2012 2011 2013/2012 2012/2011 (in millions of euros, except percentages) 25,552 28,865 28,882 (11.5 %) (0.1 %) 78 86 72 (9.3 %) 19.4 % 401 400 16 0.3 % 2,400.0 % 8,193 8,471 8,703 (3.3 %) (2.7 %) 1,119 2,004 1,067 (44.2 %) 87.8 % (553 ) (630 ) (541 ) (12.2 %) 16.5 % 34,790 39,196 38,199 (11.2 %) 2.6 % (14,890 ) (15,343 ) (15,100 ) (3.0 %) 1.6 % (8,669 ) (8,986 ) (8,827 ) (3.5 %) 1.8 % (6,221 ) (6,357 ) (6,273 ) (2.1 %) 1.3 % (2,027 ) (1,848 ) (1,803 ) 9.7 % 2.5 % (1,173 ) (1,815 ) (2,131 ) (35.4 %) (14.8 %) (9,506 ) (12,182 ) (9,712 ) (22.0 %) 25.4 % (73 ) (44 ) (150 ) 65.9 % 70.7 % 249 219 (40 ) 13.7 % n/a 7,370 8,183 9,263 (9.9 %) (11.7 %) (1,509 ) (1,675 ) (2,235 ) (9.9 %) (25.1 %) 5,861 6,508 7,028 (9.9 %) (7.4 %) (15 ) 70 15 (121.4 %) 400.0 % 5,846 6,578 7,043 (11.1 %) (6.6 %) 769 686 571 12.1 % 20.1 % 5,077 5,892 6,472 (13.8 %) (9.0 %) * Includes exchange differences (net). 20092012
Interest income / (charges)for Corporate Activities was a lossRetail Banking generated 81.0% of €1,828the operating areas’ profit attributable to the Parent bank in 2013.
The €4,406 million decrease in 2010. The improvement of 12.3% over 2009 (€2.084 million loss) total incomewas mainly due to a €3,313 million fall innet interest income (-5.3% excluding the prompt allocationexchange rate impact). This reflected the environment of low growth and interest rates, the increase in credit cost derived fromGroup’s strategy of giving priority to liquidity and balance sheet strength and the market conditionschange of business mix toward lower risk products. Further contributing to the business areas of the Parent Bankfall in Spain, which receive liquidity from the Corporate Center. Partially offsetting this, the cost of financing the goodwill of the Group’s investments rosetotal income was a €885 million reduction in the year. The net interest income of the ALCO portfolios showed no substantial changes.
gIncome from equity instruments was €64 million in 2010, a 47.1% decrease from 2009. This item has declined significantly in recent years as a result of the disposal of our equity stakes.
Gains / ains/losses on financial assets and liabilities were a lossas in 2012 Santander UK accounted for the repurchase of €142debt capital instruments.
Net fees and commissions decreased by €278 million. Excluding the exchange rate impact, they increased by 2.7% benefiting from the growth in commissions in cards in Latin America.
Operating expensesdecreased by €274 million. Excluding the exchange rate impact they increased 4.4% mainly due to the increasing costs in Latin America related to business development and inflationary pressures on wage agreements. Santander Bank’s operating expenses also increased due to the rebranding process and technology investment.
Provisions and impairment losses decreased by €3,289 million in 2010, a €1,518 million decrease as comparedmainly attributable to gains of €1,376 million in 2009. This item includes gains / losses from centralized management of interest rate and currency riskthe improvement of the Parent bank as well as from equities. The main reason for the variation in 2010 was due to hedging. In 2009, the impact from hedging the results of units was low,portfolio’s composition and there were positive returns on the ALCO portfolio of the Parent bankits credit quality, and on the business of equity stakes. In 2010, the situation reverted, with higher losses from the hedging of the results of subsidiaries (which were compensated with higher results in euros for the business units) and allowances for financial investmentsimprovement in the portfolio of equity stakes.economy.
Administrative expenses were €688 million in 2010, in line with €695 million in 2009. The growth in general expenses from rentals was offset by the reduction in personnel expenses from variable remuneration.
In 2010, Corporate Activities net provisions were releases of €114 million,impairment losses on financial assets were €268 million,impairment losses on other assets were €207 million andlosses on other assets were €178 million.
LossProfit attributable to the Parent amounteddecreased by €815 million or 13.8% (8.9% lower excluding exchange rates) due to €2,291 millionlower total income in 2010, a €1,032 million increase asan environment of reduced business and low interest rates in mature markets and change of business mix in emerging ones. Lower provisions partly offset the decrease in total income.
2012 compared to a loss of €1,259 million in 2009.2011
Second level (business):
Retail Banking
| Variations | ||||||||||||||||||||
| 2011 | 2010 | 2009 | 2011/2010 | 2010/2009 | ||||||||||||||||
| (in millions of euros, except percentages) | ||||||||||||||||||||
INTEREST INCOME / (CHARGES) | 30,273 | 28,144 | 25,674 | 7.6 | % | 9.6 | % | |||||||||||||
Income from equity instruments | 95 | 101 | 128 | (5.9 | %) | (21.1 | %) | |||||||||||||
Income from companies accounted for by the equity method | 22 | 19 | 14 | 15.8 | % | 35.7 | % | |||||||||||||
Net fees and commissions | 8,933 | 8,059 | 7,526 | 10.8 | % | 7.1 | % | |||||||||||||
Gains/losses on financial assets and liabilities (net) | 1,106 | 1,333 | 1,452 | (17.0 | %) | (8.2 | %) | |||||||||||||
Other operating income/(expenses) (net) | (537 | ) | (384 | ) | (224 | ) | 39.8 | % | 71.4 | % | ||||||||||
TOTAL INCOME | 39,892 | 37,272 | 34,570 | 7.0 | % | 7.8 | % | |||||||||||||
Administrative expenses | (15,243 | ) | (13,930 | ) | (12,682 | ) | 9.4 | % | 9.8 | % | ||||||||||
Personnel expenses | (8,874 | ) | (8,002 | ) | (7,237 | ) | 10.9 | % | 10.6 | % | ||||||||||
Other general expenses | (6,369 | ) | (5,928 | ) | (5,445 | ) | 7.4 | % | 8.9 | % | ||||||||||
Depreciation and amortization | (1,832 | ) | (1,623 | ) | (1,362 | ) | 12.9 | % | 19.2 | % | ||||||||||
Impairment losses on financial assets (net) | (10,471 | ) | (10,168 | ) | (9,741 | ) | 3.0 | % | 4.4 | % | ||||||||||
Provisions (net) | (2,325 | ) | (1,221 | ) | (999 | ) | 90.4 | % | 22.2 | % | ||||||||||
Impairment losses on other assets (net) | (82 | ) | (69 | ) | (61 | ) | 18.8 | % | 13.1 | % | ||||||||||
Gains/(losses) on other assets (net) | (57 | ) | 232 | (42 | ) | n/a | n/a | |||||||||||||
OPERATING PROFIT/(LOSS) BEFORE TAX | 9,882 | 10,493 | 9,683 | (5.8 | %) | 8.4 | % | |||||||||||||
Income tax | (2,383 | ) | (2,519 | ) | (2,341 | ) | (5.4 | %) | 7.6 | % | ||||||||||
PROFIT FROM CONTINUING OPERATIONS | 7,499 | 7,974 | 7,342 | (6.0 | %) | 8.6 | % | |||||||||||||
Profit/(loss) from discontinued operations (net) | (24 | ) | (14 | ) | 46 | 71.4 | % | n/a | ||||||||||||
CONSOLIDATED PROFIT FOR THE YEAR | 7,475 | 7,960 | 7,388 | (6.1 | %) | 7.7 | % | |||||||||||||
Profit attributable to non-controlling interest | 582 | 648 | 334 | (10.2 | %) | 94.0 | % | |||||||||||||
Profit attributable to the Parent | 6,893 | 7,312 | 7,054 | (5.7 | %) | 3.7 | % | |||||||||||||
129
Compared to 2011, compared to 2010
In 2011, the Group’s Retail Banking segment generated 75.1% of the profit attributedearnings were negatively affected due to the Group’s total operating areas. The profits were affected by the provision of €620 millionchange in the second quarter for PPI remediationscope of consolidation (equity-method accounting of SCUSA and insurance in the UK. Results were also slightly impacted by the perimeter effect (mainly the consolidation of Poland’s Bank Zachodni WBK)Latin America, and increased non-controlling interests). The impacteffect of interest rate variations was between three to four percentage points positive on revenues and costs. The evolution of exchange rates during the period had a negative impact of between one and two percentage points.nearly zero.
InterestTotal income / (charges)were €30,273increased by €997 million in 2011, a 7.6% or €2,129 million increase from €28,144 million in 2010.Net fees and commissionswere €8,933 million in 2011, a 10.8% or €874 million increase from €8,059 million in 2010. These results were mainly due to the continued growthgains from the repurchase of debt capital instruments in the U.K. registered asgains / (losses) on financial assets and liabilities.A €384 million increase inincome from companies accounted for by the equity method, relating to the previously mentioned change in the scope of consolidation, was partially offset by a €232 million decrease innet fees and commissions.
Operating expensesincreased by €288 million mainly due to the increasing costs in Latin America related to business development, inflationary pressures on wage agreements and outsourcing of services.
Provisions and impairment losses increased by €2,048 million mainly driven by (i) growth in loan loss provisions in Spain due to the worsening economic situation in 2012, including a contraction of the economy, which fell into recession; (ii) increased provisions in the rest of Europe mainly due to the rise in the NPL ratio in Portugal, the result of an economic cycle heading towards contraction, with falling domestic demand and private consumption, and to the increase in the United Kingdom; and (iii) growth in provisions in Brazil as a result of the increased volume of total lending and a slight rise in non-performing loans.
Profit attributable to the Parent decreased by €580 million because of higher loan-loss provisions and the negative impact of the change in the scope of consolidation which was partially offset by the effect(equity-method accounting of the changes in exchange rates.
Gains / (losses) on financial assetsSCUSA and liabilitieswere €1,106 million in 2011, a 17.0% or €227 million decrease from €1,333 million in 2010.
Administrative expenses were €15,243 million in 2011, a 9.4% or €1,313 million increase from €13,930 million in 2010. This is mainly due to the increase in costinsurance in Latin America, along relatedand increased non-controlling interests).
Global Wholesale Banking
| Variations | ||||||||||||||||||||
| 2013 | 2012 | 2011 | 2013/2012 | 2012/2011 | ||||||||||||||||
| (in millions of euros, except percentages) | ||||||||||||||||||||
INTEREST INCOME / (CHARGES) | 2,464 | 2,708 | 2,637 | (9.0 | %) | 2.7 | % | |||||||||||||
Income from equity instruments | 265 | 284 | 265 | (6.7 | %) | 7.2 | % | |||||||||||||
Income from companies accounted for by the equity method | (1 | ) | — | — | n/a | n/a | ||||||||||||||
Net fees and commissions | 1,254 | 1,360 | 1,248 | (7.8 | %) | 9.0 | % | |||||||||||||
Gains/losses on financial assets and liabilities (net) * | 1,159 | 840 | 847 | 38.0 | % | (0.8 | %) | |||||||||||||
Other operating income/(expenses) (net) | 7 | (16 | ) | 11 | n/a | n/a | ||||||||||||||
TOTAL INCOME | 5,148 | 5,176 | 5,008 | (0.5 | %) | 3.4 | % | |||||||||||||
Administrative expenses | (1,549 | ) | (1,592 | ) | (1,544 | ) | (2.7 | %) | 3.1 | % | ||||||||||
Personnel expenses | (988 | ) | (1,013 | ) | (1,017 | ) | (2.5 | %) | (0.4 | %) | ||||||||||
Other general expenses | (561 | ) | (579 | ) | (527 | ) | (3.1 | %) | 9.9 | % | ||||||||||
Depreciation and amortization | (186 | ) | (171 | ) | (137 | ) | 8.8 | % | 24.8 | % | ||||||||||
Provisions (net) | (47 | ) | (17 | ) | (4 | ) | 176.5 | % | 325.0 | % | ||||||||||
Impairment losses on financial assets (net) | (952 | ) | (420 | ) | (434 | ) | 126.7 | % | (3.2 | %) | ||||||||||
Impairment losses on other assets (net) | (37 | ) | (24 | ) | 118 | 54.2 | % | n/a | ||||||||||||
Gains/(losses) on other assets (net) | 12 | (5 | ) | — | n/a | n/a | ||||||||||||||
OPERATING PROFIT/(LOSS) BEFORE TAX | 2,389 | 2,947 | 3,007 | (18.9 | %) | (2.0 | %) | |||||||||||||
Income tax | (661 | ) | (827 | ) | (827 | ) | (20.1 | %) | 0.0 | % | ||||||||||
PROFIT FROM CONTINUING OPERATIONS | 1,728 | 2,120 | 2,180 | (18.5 | %) | (2.8 | %) | |||||||||||||
Profit/(loss) from discontinued operations (net) | — | — | — | n/a | n/a | |||||||||||||||
CONSOLIDATED PROFIT FOR THE YEAR | 1,728 | 2,120 | 2,180 | (18.5 | %) | (2.8 | %) | |||||||||||||
Profit attributable to non-controlling interest | 224 | 209 | 212 | 7.2 | % | (1.4 | %) | |||||||||||||
Profit attributable to the Parent | 1,504 | 1,911 | 1,968 | (21.3 | %) | (2.9 | %) | |||||||||||||
| * | Includes exchange differences (net). |
2013 compared to 2012
Santander Global Banking and Markets conducted its business development.Depreciationin markets that were more stable and amortization costs were €1,832 million in 2011, a 12.9% or €209 million increase from €1,623 million in 2010.
Impairment losses on financial assets were €10,471 million in 2011, a 3.0% or €303 million increase from €10,168 million in 2010.with increased regulatory requirements. This increase was less than the increase in 2010 and reflects the efforts made in previous years to improve risk management in the Group’s units.
Profit attributable to the Parentwas €6,893 million in 2011, a 5.7% or €419 million decrease from €7,312 million in 2010.
Retail banking in Continental Europe, despite the recovery in revenues and the positive impactsegment, contributed 24.0% of the change in the scope of consolidation, was impacted by the higher amount assigned to provisions and writedowns. Profit attributable to the Parent bank declined 3.0%.
Retail banking in the UK was 42.5% lower in sterling as it was hit by the PPI charge. Excluding this impact, profit attributable to the Parent bank was almost the same as in 2010. 2013.
Total income declined, affected by regulatory changes, but this was offset by flat costs and reduced provisions.
Retail banking revenues in Latin America continued to grow, as did costs, compatible with business development. Net operating income was 9.2% higher,decreased 0.5% or €28 million. However, it rose 4.9% year-on-year, excluding the exchange rate impact.
130
2010 compared to 2009
In 2010, the Group’s Retail Banking segment generated 69.8% of the profit attributed to the Group’s total operating areas.
Interest income / (charges)was €28,144 million in 2010, a 9.6% or €2,470 million increase from €25,674 million in 2009, driven by management of spreads against a background of weak business growth. This variation was positively impacted by the increase in scope of consolidation and exchange rates.
Net feesinterest income decreased €244 million mainly due to exchange rates and commissionswere €8,059 millionto a lesser extent a reduction in 2010, a 7.1% or €533 million increase from €7,526 million in 2009. This variation was also positively affected by the increase in scope of consolidation andSpain’s business volume.
Operating expensesdecreased 1.6% (+2.9% eliminating exchange rates.
Gains / (losses) on financial assets and liabilitieswere €1,333 million in 2010, an 8.2% or €119 million decrease from €1,452 million in 2009.
Administrative expenses were €13,930 million in 2010, a 9.8% or €1,248 million increase from €12,682 million in 2009 whiledepreciation and amortization costs were €1,623 million in 2010, a 19.2% or €261 million increase from €1,362 million in 2009. These operating costs remained flat, eliminating the effects of the increase in the scope of consolidation and of the exchange rates.
Impairment losses on financial assets were €10,168 million in 2010, a 4.4% or €427 million increase from €9,741 million in 2009. These figures reflect the impact of the review carried out by the Bank of Spain of the parameters established in circular 4/2004, taking into account the worsening in Spanish debtors’ conditions. Excluding this one-off impact and the scope of consolidation and foreign exchange effects, provisions were lowered by 10.1%rates), reflecting the quality of integral management of riskinvestments in all ofbuilding up franchises in key markets.
Provisions and impairment losses increased by €575 million due to higher loan-loss provisions, mainly in Spain and Mexico. In the Group’s units.first case, they were related to specific companies, and in the second mainly to homebuilders.
Profit attributable to non-controlling interest was €648 million in 2010, a €314 million increase as compared to €334 million in 2009. This increase is the net result of the placement of Santander Brazil shares in 2009 and 2010 and acquisition of the non-controlling interest of Santander Mexico in September 2010.
Profit attributable to the Parent was €7,312decreased by €407 million. The key drivers were higher minority interests in the Latin American units, the depreciation of their currencies and, above all, higher loan-loss provisions.
2012 compared to 2011
Total incomeincreased by €168 million in 2010,mainly due to a 3.7% or €258€71 million increase from €7,054innet interest income and a €112 million in 2009 reflecting an increase in interest income together with a rigorous control of expenses.
Retail Banking in Continental Europe was affected the most by the economic environment. Total income declined 3.0% while profit attributable to the Parent bank dropped 23.1% because of higher provisions. The main drivers were moderate business volumes net fees and falls in lending, good management of asset spreads incommissions. In an environment of strong pressurereduced activity, these results were supported by the strength and low interest rates, the impactdiversification of the Group’s policyclient revenues.
Operating expensesincreased by €82 million largely due higher amortizations for capturing deposits, control of costs and the effect of the extra provisions under the new regulations.projects.
The profit of Retail Banking in the United Kingdom was 16.0% higher than in 2009. Growth in total income was spurredProvisionsand impairment losses increased by net interest income and lower costs.
The results of Retail Banking in Latin America came from growth in basic revenues (net interest income and fee income), control of costs compatible with business development (benefiting from Brazil’s synergies) and lower loan-loss provisions. Total income and costs rose moderately. As€141 million as a result of a lower level ofincreased loan loss provisions profit attributable to the Parent bank rose 41.6% albeit with increased non-controlling interest.
131
Despite the negative impact of markets, Global Private Banking’s volume of managed assets was higher than in 2009 due to the capturing of new business and more customers. The volume stood at €97,888 million at the end of 2010, a 10.6% increase compared to 2009 with the effect of the variation in the scope of consolidation eliminated. Profit attributable to the Parent bank was €283 million (as compared to €330 million in 2009). Total income was hit by net interest income due to the evolution of interest rates, offset by higher fee income. Expenses, due to continued strict control, remained relatively stable and provisions continued to have a low share of costs.
132
Global Wholesale Banking
| Variations | ||||||||||||||||||||
| 2011 | 2010 | 2009 | 2011/2010 | 2010/2009 | ||||||||||||||||
| (in millions of euros, except percentages) | ||||||||||||||||||||
INTEREST INCOME / (CHARGES) | 2,457 | 2,676 | 2,508 | (8.2 | %) | 6.7 | % | |||||||||||||
Income from equity instruments | 242 | 197 | 187 | 22.8 | % | 5.3 | % | |||||||||||||
Income from companies accounted for by the equity method | — | — | — | n/a | n/a | |||||||||||||||
Net fees and commissions | 1,174 | 1,292 | 1,128 | (9.1 | %) | 14.5 | % | |||||||||||||
Gains/losses on financial assets and liabilities (net) | 785 | 1,364 | 1,384 | (42.4 | %) | (1.4 | %) | |||||||||||||
Other operating income/(expenses) (net) | 17 | (22 | ) | (22 | ) | n/a | 0.0 | % | ||||||||||||
TOTAL INCOME | 4,675 | 5,507 | 5,185 | (15.1 | %) | 6.2 | % | |||||||||||||
Administrative expenses | (1,507 | ) | (1,343 | ) | (1,169 | ) | 12.2 | % | 14.9 | % | ||||||||||
Personnel expenses | (998 | ) | (898 | ) | (758 | ) | 11.1 | % | 18.5 | % | ||||||||||
Other general expenses | (509 | ) | (445 | ) | (411 | ) | 14.4 | % | 8.3 | % | ||||||||||
Depreciation and amortization | (136 | ) | (137 | ) | (88 | ) | (0.7 | %) | 55.7 | % | ||||||||||
Impairment losses on financial assets (net) | (141 | ) | (5 | ) | 34 | n/a | n/a | |||||||||||||
Provisions (net) | (10 | ) | (11 | ) | 5 | (9.1 | %) | n/a | ||||||||||||
Impairment losses on other assets (net) | (22 | ) | (10 | ) | (3 | ) | 120.0 | % | 233.3 | % | ||||||||||
Gains/(losses) on other assets (net) | — | 5 | — | (100.0 | %) | n/a | ||||||||||||||
OPERATING PROFIT/(LOSS) BEFORE TAX | 2,859 | 4,006 | 3,964 | (28.6 | %) | 1.1 | % | |||||||||||||
Income tax | (766 | ) | (1,071 | ) | (1,084 | ) | (28.5 | %) | (1.2 | %) | ||||||||||
PROFIT FROM CONTINUING OPERATIONS | 2,093 | 2,935 | 2,880 | (28.7 | %) | 1.9 | % | |||||||||||||
Profit/(loss) from discontinued operations (net) | — | — | — | n/a | n/a | |||||||||||||||
CONSOLIDATED PROFIT FOR THE YEAR | 2,093 | 2,935 | 2,880 | (28.7 | %) | 1.9 | % | |||||||||||||
Profit attributable to non-controlling interest | 221 | 238 | 132 | (7.1 | %) | 80.3 | % | |||||||||||||
Profit attributable to the Parent | 1,872 | 2,697 | 2,748 | (30.6 | %) | (1.9 | %) | |||||||||||||
2011 compared to 2010
The Global Wholesale Banking segment generated 20.4% of the operating areas’ total profit attributable to the Group in 2011. Beginning in the spring, markets were very unstable and they continued to deteriorate in the second half of the year due to the Eurozone’s sovereign debt crisis. This environment had a significant impact on revenues, particularly those derived from equities and those not related to customers.
Interest income / (charges) were €2,457 million in 2011, an 8.2% or €219 million decrease from €2,676 million in 2010, due to adjustments to spreads and larger volumes.
Net fees and commissionswere €1,174 million in 2011, a 9.1% or €118 million decrease from €1,292 million in 2010 lower due to reduced activity in the markets.
Gains / (losses) on financial assets and liabilities were €785 million in 2011, a 42.4% or €579 million decrease from €1,364 million in 2010.
Administrative expenses were €1,507 million in 2011, a 12.2% or €164 million increase from €1,343 million in 2010, reflecting the investment in equipment and technology.
Depreciation and amortization costs remained stable at €136 million in 2011 which is a €1 million decrease from €137 million 2010.
Impairment losses on financial assets were €141 million in 2011, a €136 million increase as compared to provisions of €5 million in 2010 due to the further deterioration of the economic environment.
133
Profit attributable to the Parent was €1,872 million in 2011, a 30.6% or €825 million decrease from €2,697 million in 2010. Profits declined because of the falldecreased by €57 million. The increase in total income from the sharp reduction in gains on financial transactions and in fee income, coupled with higher costs and provisions.
The results were supported by strong and diversified client revenues, accounting for 87% of total income and showing greater stability, although they were impacted by the market stress in the second half of the year somewhat shaken in the last two quarters of very high stress.
Client revenues were 8.1% lower than in 2010, when they were particularly high because of certain operations and the positive impact of high volatility in some markets. All countries’ client revenues fell except Sovereign in the US, which almost doubled them, as part of a continuing trend to reach its natural share in corporate business. Among the big areas, Latin America only dropped 4%, affected by Mexico (-14%) as Brazil and Chile were more stable. Greater weakness in Europe, particularly Spain (-17%) and the UK (-18%), was caused by tensions and falls in markets in the last few months.
The revenues generated by clients in the Global Relation Model, which give the area great stability, were stronger. They were only 4% lower and already account for 70% of total client revenues.
The performance of the product areas was as follows:
Global Transaction Banking, which includes Cash Management, Trade Finance and Basic Financing, increased its client revenues by 4%. Cash Management revenues experienced the greatest growth with an 18% increase over 2010. Of note were the four large units in Spain, Brazil, Mexico and Chile, particularly the last two which grew higher than the overall average.
In 2011, Corporate Finance (including Mergers and Acquisitions and Asset & Capital Structuring) reduced its client revenues 29%, but this did not hinder notable participation in important transactions. Of note was the involvement in several of the most significant transactions in the Group’s markets, including the acquisition by a consortium led by Iberdrola of electricity and gas distributors in seven Latin American countries owned by AEI Energy (Ashmore Energy International); the integration of Vivo and Telesp in Brazil; the entry of Qatar Holding into Iberdrola and the purchase by the French company Schneider of Telvent, which was listed on Nasdaq.
Credit Markets, which include origination and distribution of corporate loans or structured finance, bond origination and securitization teams and asset and capital structuring, reduced client revenues by 3%. The growth in Latin America, strongly backed by Mexico, and in the US was offset by the sharp decline in Europe, particularly in the UK after the exceptional operations performance in 2010.
2010 compared to 2009
The Global Wholesale Banking segment generated 25.8% of the operating areas’ total profit attributable to the Group in 2010. The rise in revenues was offset by higher costsimpairment losses. After a good start, the year experienced significant levels of volatility and provisions and contributeduncertainty due to the worsening eurozone crisis. This conditioned business activity to a 1.9% fall in profit attributable to the Parent bank. Other reasons for this fall included higher non-controlling interest in Brazil because of the listing in October 2009 and the higher provisions. Nonetheless, the performance in 2010 was still notable and only slightly behind 2009, a record year in revenues and profits which were spurred by high spreads and volatility and reduced competition. The normalization of the environment in 2010 contributed to positive results, which continued to be backed by a business model focused on customers, the area’s global capacities and its connection with local units.
Interest income / (charges) were €2,676 million in 2010, a 6.7% or €168 million increase from €2,508 million in 2009, after absorbing deleveraging of mature markets, the higher cost of liquidity and normalization of spreads.
Net fees and commissionswere €1,292 million in 2010, a 14.5% or €164 million increase from €1,128 million in 2009, aided by the disintermediation trends in some Latin American countries. In these countries, more companies are obtaining liquidity through bond issuances made with the Bank instead of through loans. As a result, commissions have increased.large extent.
134
Gains / (losses) on financial assets and liabilities were €1,364 million in 2010, a 1.4% or €20 million decrease from €1,384 million in 2009.
Administrative expenses were €1,343 million in 2010, a 14.9% or €174 million increase from €1,169 million in 2009, reflecting the investments made and some exchange rate impact.
Depreciation and amortization costs were €137 million in 2010, a 55.7% or €49 million increase from €88 million in 2009.
Impairment losses on financial assets were €5 million in 2010 as compared to releases of €34 million in 2009.
Profit attributable to non-controlling interest was €238 million in 2010, a €106 million increase as compared to €132 million in 2009.
Profit attributable to the Parent was €2,697 million in 2010, a 1.9% or €51 million decrease from €2,748 million in 2009. The results were supported by strong and diversified client revenues (86% of the total). They were 3.4% higher than in 2009. The weak evolution in Spain was offset by a higher contribution in euros from other large areas.
The product areas also made progress in their increasingly global business vision, which is adapted to the changing needs of markets and clients. Their performance was as follows:
Global Transaction Banking increased its client revenues by 15%. Growth was solid but lower than in 2009 because of a smaller rise in volumes and lower spreads.
During 2010 Corporate Finance stepped up its efforts in origination and presentation of new ideas. This resulted in a larger and more solid pipeline of projects and allowed for maintaining operations in an unfavorable environment. Customer revenues rose 44% due to a very active fourth quarter in Brazil and the UK, which returned business to pre-crisis levels.
Credit Markets continued to generate solid client revenues (+14%) with a good performance by products and countries.
The client revenues of the rates area (including trading activities, structuring and distribution of foreign exchange and bonds and interest rate derivatives for the Group’s wholesale and retail clients) declined 10%. The larger volumes with institutional and mid-corp clients did not offset the impact on revenues of the normalization of spreads since the highs reached in 2009.
The revenues of the Global Equities area (activities related to the equity markets, settlement and custody) in 2010 were 10% lower than in 2009 (a record year). The factors behind the fall were the considerable degree of uncertainty in the markets, the significant fall in share prices, high volatility and sharp declines in trading volumes. Nonetheless, Santander managed to defend its position in key markets.
135
Asset Management and Insurance
| Variations | Variations | |||||||||||||||||||||||||||||||||||||||
| 2011 | 2010 | 2009 | 2011/2010 | 2010/2009 | 2013 | 2012 | 2011 | 2013/2012 | 2012/2011 | |||||||||||||||||||||||||||||||
| (in millions of euros, except percentages) | (in millions of euros, except percentages) | |||||||||||||||||||||||||||||||||||||||
INTEREST INCOME / (CHARGES) | 263 | 232 | 201 | 13.4 | % | 15.4 | % | 115 | 119 | 258 | (3.4 | %) | (53.9 | %) | ||||||||||||||||||||||||||
Income from equity instruments | 1 | — | — | n/a | n/a | — | — | 1 | n/a | (100.0 | %) | |||||||||||||||||||||||||||||
Income from companies accounted for by the equity method | 30 | — | — | n/a | n/a | |||||||||||||||||||||||||||||||||||
Income from companies accounted for by the equity method* | 148 | 131 | 38 | 13.0 | % | 244.7 | % | |||||||||||||||||||||||||||||||||
Net fees and commissions | 380 | 424 | 431 | (10.4 | %) | (1.6 | %) | 349 | 418 | 409 | (16.5 | %) | 2.0 | % | ||||||||||||||||||||||||||
Gains/losses on financial assets and liabilities (net) | 4 | 50 | 34 | (92.0 | %) | 47.1 | % | 6 | 3 | — | 100.0 | % | n/a | |||||||||||||||||||||||||||
Other operating income/(expenses) (net) | 410 | 375 | 338 | 9.3 | % | 10.9 | % | 145 | 223 | 433 | (35.0 | %) | (48.5 | %) | ||||||||||||||||||||||||||
TOTAL INCOME | 1,088 | 1,081 | 1,004 | 0.6 | % | 7.7 | % | 763 | 894 | 1,139 | (14.7 | %) | (21.5 | %) | ||||||||||||||||||||||||||
Administrative expenses | (298 | ) | (294 | ) | (279 | ) | 1.4 | % | 5.4 | % | (285 | ) | (272 | ) | (319 | ) | 4.8 | % | (14.7 | %) | ||||||||||||||||||||
Personnel expenses | (169 | ) | (161 | ) | (149 | ) | 5.0 | % | 8.1 | % | (149 | ) | (160 | ) | (178 | ) | (6.9 | %) | (10.1 | %) | ||||||||||||||||||||
Other general expenses | (129 | ) | (133 | ) | (130 | ) | (3.0 | %) | 2.3 | % | (136 | ) | (112 | ) | (141 | ) | 21.4 | % | (20.6 | %) | ||||||||||||||||||||
Depreciation and amortization | (35 | ) | (48 | ) | (32 | ) | (27.1 | %) | 50.0 | % | (33 | ) | (35 | ) | (43 | ) | (5.7 | %) | (18.6 | %) | ||||||||||||||||||||
Provisions (net) | (3 | ) | (17 | ) | (46 | ) | (82.4 | %) | (63.0 | %) | ||||||||||||||||||||||||||||||
Impairment losses on financial assets (net) | (1 | ) | (2 | ) | (10 | ) | (50.0 | %) | (80.0 | %) | (7 | ) | (2 | ) | (2 | ) | 250.0 | % | 0.0 | % | ||||||||||||||||||||
Provisions (net) | (46 | ) | (15 | ) | (36 | ) | 206.7 | % | (58.3 | %) | ||||||||||||||||||||||||||||||
Impairment losses on other assets (net) | — | — | (1 | ) | n/a | (100.0 | %) | — | — | — | n/a | n/a | ||||||||||||||||||||||||||||
Gains/(losses) on other assets (net) | (10 | ) | 1 | — | n/a | n/a | 2 | 8 | (9 | ) | (75.0 | %) | n/a | |||||||||||||||||||||||||||
OPERATING PROFIT/(LOSS) BEFORE TAX | 698 | 723 | 646 | (3.5 | %) | 11.9 | % | 437 | 576 | 720 | (24.1 | %) | (20.0 | %) | ||||||||||||||||||||||||||
Income tax | (227 | ) | (200 | ) | (219 | ) | 13.5 | % | (8.7 | %) | (101 | ) | (154 | ) | (232 | ) | (34.4 | %) | (33.6 | %) | ||||||||||||||||||||
PROFIT FROM CONTINUING OPERATIONS | 471 | 523 | 427 | (9.9 | %) | 22.5 | % | 336 | 422 | 488 | (20.4 | %) | (13.5 | %) | ||||||||||||||||||||||||||
Profit/(loss) from discontinued operations (net) | — | — | — | n/a | n/a | — | — | — | n/a | n/a | ||||||||||||||||||||||||||||||
CONSOLIDATED PROFIT FOR THE YEAR | 471 | 523 | 427 | (9.9 | %) | 22.5 | % | 336 | 422 | 488 | (20.4 | %) | (13.5 | %) | ||||||||||||||||||||||||||
Profit attributable to non-controlling interest | 52 | 60 | 28 | (13.3 | %) | 114.3 | % | 24 | 20 | 51 | 20.0 | % | (60.8 | %) | ||||||||||||||||||||||||||
Profit attributable to the Parent | 419 | 463 | 399 | (9.5 | %) | 16.0 | % | 312 | 402 | 437 | (22.4 | %) | (8.0 | %) | ||||||||||||||||||||||||||
| * | Includes exchange differences (net). |
20112013 compared to 20102012
In 20112013 this segment generated 4.6%5.0% of the operating areas’ total profit attributable to the Parent bank. In December 2012, Santander agreed to a strategic alliance with the insurer Aegon to boost its bancassurance business in Spain through commercial networks. This transaction closed in June 2013. The alliance does not affect savings, auto and health insurance, which Santander continues to manage.
Total incomedecreased by €131 million or 14.7% mainly due to a €69 million decrease innet fees and commission and a €78 million decrease inother operating income. These changes are mostly related to the agreement reached in 2011 was flat at €1,088 million, a 0.6% or €7 million increase from €1,081 million in 2010.July 2012, with Abbey Life Insurance Ltd. and the previously mentioned alliance with Aegon. Eliminating the perimeter and exchange rate effects, total income declined 3.6%.
AdministrativeOperating expenses were €298increased by €11 million in 2011, a 1.4% increase from €294 million in 2010.reflecting the costs of developing the franchise.
Depreciation and amortization decreased by €13 million in 2011 because of the one-off impact of the change in accounting criteria for amortization of intangible insurance assets in 2010.
Profit attributable to the Parent was €419decreased by €90 million in 2011, a decrease of 9.5% or €44 million from €463 million in 2010, largely affected by lower revenues from insurance in22.4%. Excluding the fourth quarter after the global agreement with Zurich.Abbey Life Insurance Ltd., the alliance with Aegon and exchange rate effects, attributable profit would have been 7.1% lower in 2013.
The revenue reduction was the result of
2012 compared to 2011
Total incomedecreased by €245 million mainly due to a fall€139 million decrease in managed volumes, acceleratednet interest income and a €210 million decrease in the second half, which was partlyother operating income, partially offset by a better mix of products and,€94 million increase in consequence, in average revenues.
The client revenues of the rates area (which restructured its businesses into three activities, Fixed Income Sales, Fixed Income Flow and FX) registered a 7% decrease. Improved sales were offsetincome from companies accounted for by the weakness of the sovereign debt markets and its impact on management of books.
The revenues from Global Equities (thoseequity method. These changes are mostly related to the equity markets) decreased a 44% in 2011. This was due tofollowing impacts: (i) the weak generation of revenues in the second half of the year as compared to the high revenues generated throughout 2010.
136
The global area of Santander Asset Management posted €53 million in profit attributable to the parent. The total contribution of profit before taxreinsurance agreement reached with Abbey Life Insurance Ltd., and fees paid to the networks was €1,062 million, 4.7% less than in 2010 due to reduction in total revenues (-2.1%). The revenue reduction was the result of a fall in managed volumes, accelerated in the second half, which was partly offset by a better mix of products and, in consequence, an increase in average revenues.
Total mutual and pension funds under management amounted to €112 billion, 10% less than at December 2010. The decrease in volume was due to the preference for liquidity and on-balance sheet funds, together with more unstable markets in the second half of the year and the resulting impact on prices.
The global area of Santander Insurance posted €366 million in profit attributable to the parent, 3.8% less than in 2010. This result was affected by(ii) the sale of 51% of the Latin American insurers to Zurich which meant recording the contribution of these companies by the equity method.
Operating expenses decreased by €55 million reflecting two main changes: (i) the reduction in the stake in the Latin American insurance companies and (ii) the reinsurance agreement with Abbey Life Insurance Ltd. in Latin America completed in the fourth quarter as, without it, growth would have been 4.0%.Spain and Portugal.
2010 compared to 2009
In 2010 this segment generated 4.4% of the operating areas’ total profit attributable to the Parent bank.
Total incomein 2010 was €1,081 million, a 7.7% or €77 million increase from €1,004 million in 2009, boosted by insurance income and stable revenue from mutual funds.
Administrative expenses were €294 million in 2010, a 5.4% increase from €279 million in 2009.
Depreciation and amortization increased by €16 million in 2010 because of the one-off impact of the change in accounting criteria for amortization of intangible insurance assets.
Profit attributable to the Parent was €463decreased by €35 million mainly due to the previously mentioned agreements.
Spain’s Run-Off Real Estate
| Variations | ||||||||||||||||||||
| 2013 | 2012 | 2011 | 2013/2012 | 2012/2011 | ||||||||||||||||
| (in millions of euros, except percentages) | ||||||||||||||||||||
INTEREST INCOME / (CHARGES) | 38 | 74 | 89 | (48.6 | %) | (16.9 | %) | |||||||||||||
Income from equity instruments | — | — | — | n/a | n/a | |||||||||||||||
Income from companies accounted for by the equity method | (40 | ) | (100 | ) | — | (60.0 | %) | n/a | ||||||||||||
Net fees and commissions | 15 | 41 | 57 | (63.4 | %) | (28.1 | %) | |||||||||||||
Gains/losses on financial assets and liabilities (net) * | 1 | 5 | 4 | (80.0 | %) | 25.0 | % | |||||||||||||
Other operating income/(expenses) (net) | (8 | ) | (3 | ) | 1 | 166.7 | % | n/a | ||||||||||||
TOTAL INCOME | 6 | 17 | 151 | (64.7 | %) | (88.7 | %) | |||||||||||||
Administrative expenses | (162 | ) | (184 | ) | (179 | ) | (12.0 | %) | 2.8 | % | ||||||||||
Personnel expenses | (47 | ) | (45 | ) | (45 | ) | 4.4 | % | 0.0 | % | ||||||||||
Other general expenses | (115 | ) | (139 | ) | (134 | ) | (17.3 | %) | 3.7 | % | ||||||||||
Depreciation and amortization | (13 | ) | (9 | ) | (8 | ) | 44.4 | % | 12.5 | % | ||||||||||
Provisions (net) | — | — | (315 | ) | n/a | (100.0 | %) | |||||||||||||
Impairment losses on financial assets (net) | (410 | ) | (6,164 | ) | (559 | ) | (93.3 | %) | 1002.7 | % | ||||||||||
Impairment losses on other assets (net) | — | — | (201 | ) | n/a | (100.0 | %) | |||||||||||||
Gains/(losses) on other assets (net) | (328 | ) | (741 | ) | (1,598 | ) | (55.7 | %) | (53.6 | %) | ||||||||||
OPERATING PROFIT/(LOSS) BEFORE TAX | (907 | ) | (7,080 | ) | (2,709 | ) | (87.2 | %) | 161.4 | % | ||||||||||
Income tax | 272 | 2,185 | 813 | (87.6 | %) | 168.8 | % | |||||||||||||
PROFIT FROM CONTINUING OPERATIONS | (635 | ) | (4,896 | ) | (1,896 | ) | (87.0 | %) | 158.2 | % | ||||||||||
Profit/(loss) from discontinued operations (net) | — | — | — | n/a | n/a | |||||||||||||||
CONSOLIDATED PROFIT FOR THE YEAR | (635 | ) | (4,896 | ) | (1,896 | ) | (87.0 | %) | 158.2 | % | ||||||||||
Profit attributable to non-controlling interest | — | (128 | ) | (20 | ) | n/a | 540.0 | % | ||||||||||||
Profit attributable to the Parent | (635 | ) | (4,768 | ) | (1,876 | ) | (86.7 | %) | 154.2 | % | ||||||||||
| * | Includes exchange differences (net). |
2013 compared to 2012
In 2013, we began to manage a separate unit for run-off real estate activity in 2010, an increaseSpain, which has a specialized management model and, which includes loans to clients mainly for real estate promotion, stakes in real estate companies (Metrovacesa and Sareb) and foreclosed assets.
Losses attributable to the Parent decreased by €4,133 million after the heavy impairment losses accounted for during 2012 due to the deterioration of 16.0% or €64the real estate portfolio.Provisions and impairment losses decreased €5,754.
Losses on other assetsdecreased by €413 million from €399mainly due to lesser provisions for foreclosed assets in 2013.
Income tax benefit decreased by €1,913 million as operating losses decreased by €6,173 million.
2012 compared to 2011
Losses attributable to the Parent increased by €2,893 million mainly due to impairment losses accounted for during the year due to the deterioration of the real estate portfolio.
Provisions and impairment losses increased by €5,089 million due to the strong rise in 2009,the deterioration of the real estate segment caused by the worsening of Spain’s macroeconomic situation as a result of an economic slowdown, falling consumer spending and job market deterioration. Particularly significant in this context was the increase in non-performing loan ratios of 206 basis points from 33.5% in 2011 to 54.1% at December 31, 2012, (for further details see Note 54 to our consolidated financial statements).
Losses on other assetsdecreased by €857 million mainly due to lower provisions and a more favorablefor foreclosed assets in 2012 after the increased impairments accounted for in 2011.
Income tax rate which offset the higher non-controlling interest in Brazil.
Santander Asset Management generated profit attributable to the Parent bank in 2010 of €81 benefit increased by €1,372 million higher than in 2009 and reflecting the recovery in volumes, the rise in average commissions in the main markets due to the better product mix and a reduction in loan loss provisions.
Total revenues from mutual and pension funds, before distribution to the distribution networks, amounted to €1,278 million (+8%), while the total contribution to profits rose 12.3% to €1,099as operating losses increased by €4,371 million.
Total mutual and pension funds managed assets amounted to more than €124 billion at the end of 2010 (+7% and benefiting from the appreciation of currencies against the euro).
The global area of Santander Insurance generated profit attributable to the Parent bank of €381 million, 9.0% more than in 2009. The main reason for this was greater activity, which absorbed the higher non-controlling interest in Brazil.
Total revenues (the area’s total income plus fee income paid to the networks) were €2,688 million, 11% more than in 2009 (+3.5% in local currency).
The total contribution to the Group’s results (profit before tax of the insurance companies and brokers and fees received by networks) increased 10.7% to €2,491 million (+3.3% in local currency).
137
Financial Condition
Assets and Liabilities
Our consolidated total assets were €1,251,526€1,115,638 million at December 31, 2011,2013, a 2.8% or €34,025€153,962 million increasedecrease from total assets of €1,217,501€1,269,600 million at December 31, 2010.2012. Our gross loans and advances to corporate clients, individual clients and government and public entities, including the trading portfolio, other financial assets at fair value and loans, increaseddecreased by 3.4%6.8% to €769,036€693,759 million at December 31, 20112013, from €743,851€744,534 million at December 31, 2010. Our total assets increased during 20112012.
The decrease in customer loans was mainly due to the slightlydomestic component as a result of the deleveraging process in Spain and the cancellation of the public sector financing pursuant to a government program to pay suppliers’ pending invoices. Furthermore, the performance of balances in comparison with December 2012 was significantly impacted by the changes in exchange rates as a result of the depreciation of the main currencies in which the Group operates. This led to a negative impact of 4 percentage points on the year-on-year variations in lending to customers and customer funds.
There was a positive perimeter impacteffect from the net effect of the following changeschange in the Group’s composition:
• Positive impact from thescope of consolidation of Bancoless than one percentage point due to the merger in early 2013 of Bank Zachodni WBK S.A. and Kredyt Bank S.A. in Poland, the incorporation into Santander Consumer Finance in 2011 of SEB’s retail banking business in Germany (Santander Retail) and the acquisition of GE Capital Corporation’s mortgage portfolio in Mexico.
• Negative impact from Santander Consumer USA, which in December stopped consolidating by global integration and moved to be accounted by the equity accounted method, and the sale of our Latin American bancassurance business.
Another factor was the appreciation/depreciation of various currencies against the euro (end of period rates). Both the dollar and sterling appreciated by 3%, while the main Latin American currencies depreciated: Brazilian real and Mexican peso (8%); Chilean peso (7%) and the Argentine peso (5%). The net impact of both is virtually zero.Poland.
Customer deposits, which comprise deposits from clients and securities sold to clients under agreements to repurchase, increaseddecreased by 2.6%3.0% from €616,376€626,639 million at December 31, 2010,2012, to €632,533€607,837 million at December 31, 2011 reflecting the efforts to open new current accounts mainly in Sovereign and Santander UK.2013, affected by exchange rates. Other managed funds, including mutual funds, pension funds, managed portfolios and savings-insurance policies, decreasedincreased by 9.7%5.9% from €145,547€118,141 million at December 31, 2010,2012, to €131,456€125,170 million at December 31, 2011.2013. This increase was mainly concentrated in Spain, due to the greater marketing of mutual funds.
In addition, and as part of the global financing strategy, during 2011During 2013, the Group issued €91,215€61,754 million of senior debt (including Santander UK’s medium term program and €3,513 million in covered bonds), and €1,027 million of subordinated debt. As regards securitization activities, in 2013 the Group’s subsidiaries placed several securitizations for a total amount of €6,273 million, mainly through Santander UK and the Santander Consumer Finance units.
During 2013, €73,619 million of senior debt (including Santander UK’s medium term program), including €13,664 million of covered and territorial bonds and €171 million of subordinated debt.
During 2011, €81,395 million of senior debt (including Santander UK’s medium term program), including €7,439€10,997 million of covered bonds and €8,616€1,915 million of subordinated debt, matured.
GoodwillRegarding other balance sheet items, goodwill totaled €23,281 million, which was €25,089€1,345 million less than in 2012 as a result of the variations in exchange rates, particularly those of sterling and the Brazilian real. In contrast, the inclusion of Kredyt Bank S.A. brought an increase in goodwill.
Financial assets available for sale at the end of 2011,December 31, 2013, totaled €83,799 million, which was €8,468 million (9%) less than a €467 million increase from €24,622 million at the end of 2010 mainlyyear earlier, due to the net impact betweendecrease in government bond positions, particularly in Spain, the increase from the incorporations of BZ WBK, Santander Retail in Germany, GE Capital Corporation’s mortgage portfolio in Mexico and Creditel in UruguayUnited Kingdom, Brazil and the reductions resulting from the amortization of €601 million of goodwill in Santander Totta, the Santander Consumer USA consolidation by the equity accounted method and exchange rates.United States.
Capital
Stockholders’ equity, net of treasury stock, at December 31, 2011,2013, was €76,414€70,588 million, an increasea decrease of €1,396€1,272 million or 1.9%1.8% from €75,018€71,860 million at December 31, 2010,2012, mainly due to the increase of reserves resulting fromin the issuance of 579,921,105 shares in 2011. That increaseconsolidated income for the year which was partially offset by the increase of negative valuation adjustments, and the decrease in the consolidated income.mainly due to exchange differences.
Our eligible stockholders’ equity under BIS II was €76,772€71,453 million at December 31, 2011.2013. The surplus over the minimum required by the Bank of Spain was €31,495€23,265 million. In accordance with the Basel II Accord criteria (which provide the framework under which Spanish entities must report capital ratios as of June 30, 2008), at December 31, 20112013 the BIS II ratio was 13.56% (13.11%14.59% (13.09% at December 31, 2010)2012), Tier I Capital was 11.01% (10.02%12.60% (11.17% at December 31, 2010)2012) and core capital was 10.02% (8.80%11.71% (10.33 at December 31, 2010)2012). See Item 4 of Part I, “Information on the Company—B. Business Overview—Supervision and Regulation—Capital Adequacy Requirements”.
138
B. Liquidity and capital resources
Management of liquidity
For information about our liquidity risk management process, see Item 11 of Part I, “Quantitative“Corporate principles of risk management, control and Qualitative Disclosures About Market Risk—Part. 10 Market Risk—Statistical Tools for Measuringrisk appetite” and Managing Market Risk—Non Trading activity—Liquidity Risk”Part 7 “Liquidity and “—Quantitative analysis—B. Non Trading Activity—Asset and liability management— Management of structural liquidity”funding risk”.
Sources of funding
As a financial group, a principal source of our liquidity is our customer deposits which consist primarily of demand, time and notice deposits. In addition, we complement the liquidity generated by our customer deposits through access to the domestic and international capital markets and to the interbank market (overnight and time deposits). For this purpose, we have in place a series of domestic and international programs for the issuance of commercial paper and medium- and long-term debt. We also maintain a diversified portfolio of liquid and securitized assets throughout the year. In addition, another source of liquidity is the generation of cash flow.
At December 31, 2011,2013, we had outstanding €197.4€175.5 billion of senior debt, of which €108.0€82.8 billion were mortgage bonds and €11.8€13.9 billion were promissory notes. Additionally, we had €23.0€16.1 billion in outstanding subordinated debt (which includes €5.4€3.7 billion preferred securities and €0.4 billion in preferred shares).
The following table shows the average balances during the years 2011, 20102013, 2012 and 20092011 of our principal sources of funds:
| 2011 | 2010 | 2009 | 2013 | 2012 | 2011 | |||||||||||||||||||
| (in millions of euros) | (in millions of euros) | |||||||||||||||||||||||
Due to credit entities | 146,638 | 134,577 | 141,930 | 129,610 | 154,686 | 146,638 | ||||||||||||||||||
Customer deposits | 616,690 | 568,915 | 463,602 | 632,339 | 636,351 | 616,690 | ||||||||||||||||||
Marketable debt securities | 196,107 | 209,006 | 221,230 | 188,954 | 204,701 | 196,107 | ||||||||||||||||||
Subordinated debt | 26,673 | 34,096 | 39,009 | 16,645 | 21,239 | 26,673 | ||||||||||||||||||
|
|
|
|
|
| |||||||||||||||||||
Total | 986,108 | 946,594 | 865,771 | 967,548 | 1,016,977 | 986,108 | ||||||||||||||||||
The average maturity of our outstanding debt as of December 31, 20112013 is as follows:
(1) Senior debt | ||||
(2) Mortgage debt | ||||
(3) Dated subordinated debt |
For more information see Notes 22.b, 23.a and 51.a to our consolidated financial statements.
The cost and availability of debt financing are influenced by our credit ratings. A reduction in these ratings could increase the cost of and reduce our market access to debt financing. Our credit ratings are as follows:
| Long-Term | Short-Term | |||||||
Moody’s | Baa1 | P-2 | Stable | |||||
Standard & Poor’s | ||||||||
Fitch | ||||||||
| ||||||||
DBRS | R-1 (low) | Negative | ||||||
Our total customer deposits, excluding assets sold under repurchase agreements, totaled €563.7€566.1 billion at December 31, 2011.2013. Loans and advances to customers (gross) totaled €769.0€693.8 billion at the same date.
We remain well placed to access various wholesale funding sources from a wide range of counterparties and markets, and the changing mix between customer deposits and repos, deposits by banks and debt securities in issue primarily reflects comparative pricing, maturity considerations and investor counterparty demand rather than any material perceived trend.
139
We use our liquidity to fund our lending and investment securities activities, for the payment of interest expense, for dividends paid to shareholders and the repayment of debt.
We, Grupo Santander, are a European, Latin American and North American financial group. Although at this moment we are not aware of any material legal or economic restrictions on the ability of our subsidiaries to transfer funds to the Bank (the Parent company) in the form of cash dividends, loans or advances, capital repatriation and other forms, or to have access to foreign currency at the official exchange rate, there is no assurance that in the future such restrictions will not be adopted or how they would affect our business. Nevertheless, the geographic diversification of our businesses limits the effect of any restrictions that could be adopted in any given country.
We believe that our working capital is sufficient for our present requirements and to pursue our planned business strategies.
As of December 31, 2011,2013, and to the present date, we did not, and presently do not, have any material commitments for capital expenditures.
C. Research and development, patents and licenses, etc.
We do not currently conduct any significantDuring 2013, 2012 and 2011, we spent €1,229 million, €1,098 million, and €1,420 million, respectively, in research and development activities.activities in connection with information technology projects.
Overview
During the international economic and financial crisis of recent years, we maintained a high degree of recurrence in revenues and did not suffer any quarterly loss between 2007 and 2013. The global financial services sector is likely to remain competitive with a large number of financial service providers and alternative distribution channels. Additionally, consolidation in the sector (through mergers, acquisitions or alliances) is likely to occur as other major banks look to increase their market share, combine complementary businesses or strengthen their balance sheets. In addition, regulatory changes will take place in the future that we expect will increase the overall level of regulation in the markets.
The following are the most important trends, uncertainties and events that are reasonably likely to have a material adverse effect on the Group or that would cause the disclosed financial information not to be indicativeelements of our future operating results orbusiness that explain our solid performance and enabled us to keep on growing in a stable and sustainable way are:
| • | Geographic diversification. We operate in 10 main countries, with a balance between mature and emerging markets (contributing 47% and 53%, respectively, of our profits in 2013). This geographic diversification has reduced the volatility of our earnings and enables us to capitalize on our experience and best practices on a global scale. |
| • | Focus on retail banking. Approximately 87% of our gross income in 2013 was derived from retail banking, which is a key factor for revenue stability. |
| • | Subsidiaries model. The Group is composed of subsidiaries that are autonomous in capital and liquidity. This has clear strategic and regulatory advantages, as it reduces the risk of contagion between our units, imposes a double layer of global and local supervision and facilitates crisis management and resolution. Our goal is to publicly list a minority portion of our main subsidiaries when market circumstances make it advisable. |
| • | Prudence in risks. The board gives particular importance to risk management and sets risk appetite at a medium-low level every year. We have a solid balance sheet, thanks to the retail nature of our business, and we maintain a limited exposure to sovereign risk, which is mainly used for interest rate hedging. |
| • | Comfortable liquidity position. The strength of our commercial franchise enables us to finance most of our lending with deposits, and we access wholesale funding via many markets and instruments as needed. |
| • | Solid solvency position. We generate capital organically and through active management of our business portfolio and core capital increased by 138 basis points in 2013. |
| • | Corporate governance. The board’s composition maintains balance between non-executive (69%) and executive directors (31%) and seeks to comply with the best international practices in this sphere. We have also implemented corporate policies across our banks and global units for the supervision and control of the whole Group in certain risk-critical areas. |
Our strategic position is better now than it was at the start of the international financial condition:crisis, both in terms of geographic diversification and balance sheet strength. During this period, we:
a continued downturnBoosted our presence in the SpanishU.K. and entered the retail banking business in Poland, Germany and the United Kingdom real estate markets, and a corresponding increase in mortgage defaults, which could impactU.S., enhancing our NPL and decrease consumer confidence and disposable income;
uncertainties relating to economic growth expectations
Banco Santander is the only bank in the United States, Spain,world whose debt is rated above that of its home country’s sovereign debt by the United Kingdom, other Europeanthree main agencies (S&P, Moody’s and Fitch) and we achieved all of the above without the need for state aid in any of the countries where the Group operates.
International Banking Environment and Latin America,Outlook
The forward-looking statements included below and in the following section are based on the current beliefs and expectations of our management and are subject to significant risks and uncertainties. These risks and uncertainties could cause the Group’s actual results to differ materially from those set forth in such forward-looking statements. See Forward-Looking Statements on page 7 of this Annual Report and the impact they may have overRisk Factors section on pages 15-34 of this Annual Report.
Independent economic forecasts for 2014 and 2015 point to an upswing in the yield curve and exchange rates;
international economic cycle, particularly in the continued effectmarkets that were hardest hit by the crisis.
However, the economic recovery is unlikely to be sufficient for the banking sector to return to pre-2008 levels of profitability. Many of the global economic slowdown on Europe and the US and fluctuations in local interest and exchange rates;
continued changes in the macroeconomic environment, such as sustained unemployment above historical levels, could further deteriorate the quality of our customers’ credit;
increases in our cost of funding, partiallyregulations introduced as a result of the fragilityinternational financial crisis are having and will continue to have a structural impact on banks’ profitability. This is particularly the case with the higher capital requirements, new short- and long-term liquidity and leverage ratios, higher cost of deposits as a result of the new bank resolution mechanisms and the cost of compliance with these and other new regulations. As of December 31, 2013, we were in compliance with all of the new regulatory requirements and we successfully passed the various stress tests conducted on European and Spanish Portuguese, Irishbanks and Greek economies, could adversely affectare prepared for the balance sheet analysis that the ECB will carry out prior to setting up the Single Supervisory Mechanism.
As of December 31, 2013:
After focusing on strengthening our balance sheet, liquidity and strategic positioning during the effectsperiod from 2007 to 2013, management is now concentrating on increasing profits, while bearing in mind trends that will define the sector’s future, such as:
continued instabilityThe recovery in companies’ productivity and volatilityprofitability in a context of globalization that offers growing investment opportunities; and
Future vision
We are closely involved in building a more stable, solid and efficient financial sector, focused on financing sustainable economic growth. Our business model, based on lasting and profitable relations with customers, increasing their linkage with the Bank and maintaining prudence in risks and discipline in the financial markets;and capital sphere, has been vindicated by the crisis and is well regarded by regulators and rating agencies.
We are in a dropunique position as we enter what we expect will be a new cycle of growth in the global economy. We have a potential market of 600 million people in our 10 core markets. Our challenge is to generate greater value ofby focusing on our customers and attracting those who are not yet clients. Meanwhile, we will continue to help social development in the euro relative to the US dollar, the sterling pound or Latin American currencies;
140
inflationary pressures, particularly in Latin America, because of the effect they may have in relation to increases of interest rates and decreases of growth;
increased consolidation of the global financial services sector, which could further reduce our spreads;
although it is foreseeablecountries where we do business via Santander Universities, a program that entry barriers to domestic markets in Europe will eventually be lowered, our possible plans of expansion into other markets could be affected by regulatory requirements of the national authorities of these countries;
acquisitions or restructurings of businesses that do not perform in accordance with our expectations or that subjecthas enabled us to previously unknown risks;create a unique alliance with more than 1,000 universities.
increased regulation, government intervention and new laws prompted byIn the financial crisisnext three years, we will seek to regain our pre-crisis profit levels, which could change our industry and requirewould enable us to modify our businesses or operations;maintain an adequate remuneration for shareholders, while at the same time comfortably meeting the new regulations for capital and liquidity.
the risk of further reductions in liquidity and increases of credit spreads as a consequence of the crisis in the financial markets, which could affect not only our cost of funding but also the value of our proprietary portfolios and our assets under management.
E. Off-balance sheet arrangements
As of December 31, 2011, 20102013, 2012 and 2009,2011, we had outstanding the following contingent liabilities and commitments:
| 2011 | 2010 | 2009 | 2013 | 2012 | 2011 | |||||||||||||||||||
| (in millions of euros) | (in millions of euros) | |||||||||||||||||||||||
Contingent liabilities: | ||||||||||||||||||||||||
Financial guarantees and other sureties | 15,417 | 18,395 | 20,974 | 13,479 | 14,437 | 15,417 | ||||||||||||||||||
Irrevocable documentary credits | 2,978 | 3,816 | 2,637 | 2,430 | 2,866 | 2,978 | ||||||||||||||||||
Other guarantees | 29,093 | 36,733 | 35,192 | 24,690 | 27,285 | 29,093 | ||||||||||||||||||
Other contingent liabilities | 554 | 851 | 453 | 450 | 445 | 554 | ||||||||||||||||||
|
|
|
|
|
| |||||||||||||||||||
| 48,042 | 59,795 | 59,256 | 41,049 | 45,033 | 48,042 | |||||||||||||||||||
|
|
|
|
|
| |||||||||||||||||||
Commitments: | ||||||||||||||||||||||||
Balances drawable by third parties | 181,559 | 179,964 | 150,563 | 154,314 | 187,664 | 181,559 | ||||||||||||||||||
Other commitments | 13,823 | 23,745 | 12,968 | 18,483 | 28,378 | 13,823 | ||||||||||||||||||
|
|
|
|
|
| |||||||||||||||||||
| 195,382 | 203,709 | 163,531 | 172,797 | 216,042 | 195,382 | |||||||||||||||||||
|
|
|
|
|
| |||||||||||||||||||
Total: | 243,424 | 263,504 | 222,787 | 213,846 | 261,075 | 243,424 | ||||||||||||||||||
|
|
|
|
|
| |||||||||||||||||||
For more information see Note 35 to our consolidated financial statements.
In addition to the contingent liabilities and commitments described above, the following table provides information regarding off-balance sheet funds managed by us and jointly controlled companies as of December 31, 2011, 20102013, 2012 and 2009:2011:
| 2011 | 2010 | 2009 | 2013 | 2012 | 2011 | |||||||||||||||||||
| (in millions of euros) | (in millions of euros) | |||||||||||||||||||||||
Off-balance sheet funds: | ||||||||||||||||||||||||
Mutual funds | 102,611 | 113,510 | 105,216 | 93,304 | 89,176 | 102,611 | ||||||||||||||||||
Pension funds | 9,645 | 10,965 | 11,310 | 10,879 | 10,076 | 9,645 | ||||||||||||||||||
Other managed funds | 19,200 | 20,314 | 18,364 | 20,987 | 18,889 | 19,200 | ||||||||||||||||||
|
|
|
|
|
| |||||||||||||||||||
| 131,456 | 144,789 | 134,890 | 125,170 | 118,141 | 131,456 | |||||||||||||||||||
Relationship with unconsolidated companies
We have holdings in companies over which we are in a position to exercise significant influence, but that we do not control or jointly control. According to IFRS-IASB, these investments in associated companies are accounted for using the equity method (see further details of these companies in Exhibit II to our consolidated financial statements).
141
Transactions with these companies are made under market conditions and are closely monitored by our regulatory authorities. See Note 53 to our consolidated financial statements for further information.
Also, in our securitization activity we use special purpose vehiclesstructured entities (fondos de titulización) that are consolidated in the Group’s financial statements. According to IFRS, only those vehiclesentities that meet certain requirements can be consolidated. We are not required to repurchase assets from or contribute additional assets to any of these special purpose vehicles.structured entities. We do, however, provide in the ordinary course of business certain loans (amounting to €238.1€235.3 million as of December 31, 2011)2013) to some of these special purpose vehicles,structured entities, which are provided for in accordance with the risks involved. In 2011,2013, the Group sold securitized bonds and structured medium and long-term operations with customers whose collateral is securitized bonds or mortgage bonds amounting to close to €25€6 billion.
In the ordinary course of business, Santander UK enters into securitization transactions using special purpose securitization companies which are consolidated and included in Santander UK’s financial statements. Santander UK is under no obligation to support any losses that may be incurred by the securitization companies or the holders of the securities and has no right or obligation to repurchase any securitized loan. Santander UK has made some interest-bearing subordinated loans to these securitization companies.
We do not have any further transactions with unconsolidated entities other than those mentioned above.
We have no other off-balance sheet arrangements that have, or are reasonably likely to have, a current or future material effect on our financial condition, revenues or expenses, results of operations, liquidity, capital expenditures or capital resources.
F. Tabular disclosure of contractual obligations
The following table summarizes our contractual obligations by remaining maturity at December 31, 2011:2013:
Contractual obligations
Contractual Obligations
(in millions of euros) | Less than 1 year | More than 1 year but less than 3 years | More than 3 years but less than 5 years | More than 5 years | Total | |||||||||||||||||||||||||||||||||||
Deposits from credit institutions and central banks | 65,619 | 10,983 | 39,607 | 160 | 116,369 | |||||||||||||||||||||||||||||||||||
| Less than 1 year | More than 1 year but less than 3 years | More than 3 years but less than 5 years | More than 5 years | Total | ||||||||||||||||||||||||||||||||||||
| (in millions of euros) | ||||||||||||||||||||||||||||||||||||||||
Deposits from credit institutions | 54,595 | 18,734 | 7,837 | 5,156 | 86,322 | |||||||||||||||||||||||||||||||||||
Customer deposits | 502,009 | 63,284 | 14,301 | 9,383 | 588,977 | 488,294 | 63,278 | 9,576 | 11,705 | 572,853 | ||||||||||||||||||||||||||||||
Marketable debt securities | 45,453 | 52,077 | 33,899 | 57,681 | 189,110 | 52,987 | 53,966 | 20,667 | 43,770 | 171,390 | ||||||||||||||||||||||||||||||
Subordinated debt | 317 | 2,846 | 3,402 | 16,427 | 22,992 | 1,006 | 2,468 | 2,723 | 9,942 | 16,139 | ||||||||||||||||||||||||||||||
Liabilities under insurance contracts (1) | — | — | — | 517 | 517 | — | — | — | 1,430 | 1,430 | ||||||||||||||||||||||||||||||
Operating lease obligations | 317 | 580 | 531 | 2,220 | 3,648 | 326 | 606 | 553 | 2,088 | 3,573 | ||||||||||||||||||||||||||||||
Capital lease obligations | 150 | 9 | 9 | 72 | 240 | 33 | 37 | 39 | 100 | 209 | ||||||||||||||||||||||||||||||
Purchase obligations | 5 | 8 | 4 | 4 | 21 | 2 | 6 | 2 | 3 | 13 | ||||||||||||||||||||||||||||||
Other long-term liabilities (2) | — | — | — | 9,045 | 9,045 | 661 | 1,395 | 1,503 | 5,567 | 9,126 | ||||||||||||||||||||||||||||||
Contractual interest payments (3) | 7,797 | 8,141 | 5,391 | 26,376 | 47,705 | |||||||||||||||||||||||||||||||||||
|
|
|
|
|
|
|
|
|
| |||||||||||||||||||||||||||||||
Total | 613,870 | 129,787 | 91,753 | 95,508 | 930,919 | 605,701 | 148,631 | 48,291 | 106,137 | 908,760 | ||||||||||||||||||||||||||||||
| (1) | Includes life insurance contracts in which the investment risk is borne by the policy holder and insurance savings contracts. |
| (2) | Other long-term liabilities relate to pensions and similar obligations. |
| (3) | Calculated for all Deposits from credit institutions, Customer deposits, Marketable debt securities and Subordinated debt assuming a constant interest rate based on data as of December 31, 2013 over time for all maturities, and those obligations with maturities of more than five years have an average life of ten years. |
The table above excludes the “fixed payments” of our derivatives since derivative contracts executed by the Group apply close-out netting across all outstanding transactions, that is, these agreements provide for settlements to be made on a maturity or settlement date for the differences that arise, and as such, the obligation to be settled in the future is not fixed at the present date and is not determined by the fixed payments.
For a description of our trading and hedging derivatives, which are not reflected in the above table, see Note 36 to our consolidated financial statements.
For more information on our marketable debt securities and subordinated debt, see Notes 22 and 23 to our consolidated financial statements.
142
Higher-Risk Loans
Grupo Santander does not have any significant exposure to higher-risk loans. Our credit profile is focused on retail banking with a medium-low risk profile and with broad diversification both by geography and segment, and nearly 60% of the Group’s total loan portfolio is secured (in most cases, by real estate).
Mortgages to individuals represent approximately 41% of the Group’s total lending. These mortgages are focused on our core markets, Spain and the UK,U.K., and are principal residencemainly residential mortgages with a low risk profile, low non-performing ratios (below the ratios of our peers) and an acceptableappropriate coverage ratio. This low risk profile allows us to envisage a relatively minor impact at Group level and a low final estimated loss.
In Spain, at December 31, 2011,2013, the loan portfolio and thus its risk profile mainly comprises primary residence loans, with an average loan to value ratio (LTV) of 51.6%54,8% and an affordability rate of 29% under management criteria.criteria described below. Residential mortgages account for 25%represent around 28% of the total credit risk portfolio in Spain, of which 88% has a LTV at inception a LTVof under 80%.
All customers applying for a prime residential mortgage are subject to a rigorous assessment of credit risk and affordability.
In evaluating the payment capacity (affordability) of a potential customer, the credit analyst must determine if the income of the customer is sufficient to meet the payment of the loan installments taking into consideration other income that the customer may receive. In addition, the analyst must decide if the customer’s income will be stable over the term of the loan.
We define the affordability rate as the index that measures the financial ability of the family unit calculated as follows: (Monthly payments corresponding to the requested transaction + monthly payments for other loans) /( Net monthly salary + other monthly justified income).
This ratio is considered predictive of the customer’s payment capacity. The ratio indicates the percentage of a customer’s income that is currently available to repay debt obligations. For this reason, it is included as part of our credit policy in the application process for the mortgage portfolio and is used either as a minimum acceptance criteria or in prescriptive analyses (decision trees/ rules/ decision models).
The UK’sU.K.’s mortgage portfolio is focused on primary residence mortgages with high risk quality risk in terms of LTV (53%(50.7% as of December 31, 2011)2013). Certain portfolios with high risk profiles (interest only and buy to let, among others) are subject to strict lending policies to mitigate risks and their performance is continuously monitored to ensure an adequate control.
The mortgages withGroup’s strategy in the highest risk profile (buy-to-let) account for a small percentagelast few years has been to reduce the volume of real estate exposure in Spain which at the total (less than 1%).
Due to the economic downturn, the portfolioend of 2013 stood at €10,821 million in net terms (around 3% of loans to real estate developers has been significantly reduced, especially in Spain. At December 31, 2011, it accounted forSpain and less than 1% of the Group’s total portfolio. The Group’s risk policies stipulate that these loans should be granted not just based on the quality of the projects but also on the credit quality of the clients.loans).
Changes in Practices
There have not been any significant changes in policies and practices in response to the effects of the current economic environment that might affect the quality of the credit information presented. This is due to the fact that the following policies and practices already formed part of our normal course of business:
a) Medium-low risk profile of the portfolio
Our risk profile is characterized by the prevalence of primary residence loans and a low effort rate of loan approval, which leads to a medium-low risk profile for the mortgage portfolio. This is due to the establishment of risk management frameworks and policies that reflect our risk management principles.
In addition to the tasks performed by the internal auditingaudit division, the risk unit has a specific risk monitoring function for adequate credit quality control with local and global teams.
b) Suspended accrual interest of non-performing past-due assets
143
Balances are deemed to be impaired, and the interest accrual suspended, when there are reasonable doubts as to their full recovery and/or the collection of the related interest for the amounts and on the dates initially agreed upon, after taking into account the guarantees received to secure (fully or partially) collection of the related balances. For all non-performing past due assets, any collections relating to impaired loans and advances are used to recognize the accrued interest and the remainder, if any, is applied to reduce the principal amount outstanding. The amount of the financial assets that would be deemed to be impaired had the conditions thereof not been renegotiated, is not material with respect to the Group’s financial statements taken as a whole.
When the recovery of any recognized amount is considered unlikely, the amount is written off, without prejudice to any actions that we may initiate to seek collection.
c) Allowances for credit losses and internal model
As of July 2008, the Bank of Spain had approved for regulatory capital calculation purposes the Group’s internal models affecting the vast majority of the Group’s credit risk net exposure. The Bank of Spain will continue to review the models for the purpose of calculating allowances for loan losses. The calculation obtained based on the output parameters of internal models is consistent with the best estimate of the Group as to the probable losses using possible scenarios which rely on the approved internally developed models, and which constitute an appropriate basis for determining loan loss allowances. While these models are not yet approved by the Bank of Spain for loan loss allowance calculation, we are required to calculate the allowances according to the instructions described in Item 4 in our annual report on Form 20-F for the year ended December 31, 2011,2013, and are subject to continuing review by Bank of Spain, and subsequent continuous improvement of the processes within our internal model. The difference between loan loss provisions calculated using internal models and those calculated under Bank of Spain guidance, was not material for each one of the three years ending December 31, 2011.2013.
Declines in Collateral Value
Declines in collateral value are not relevant in our portfolio given that Spanish residential mortgages with LTV up to 80% amount to only approximately 2% of the total Group’s lending as of December 31, 2011. When a mortgage with these characteristics is authorized, the Group’s polices establish that the client must provide additional guarantees such as more properties, insurance coverage or others.
Other
During 2011, the general deterioration of the economic environment had a negative effect on the evolution of non-performing loans and the cost of credit. This effect was softened by prudent risk management which kept non-performing loan and coverage ratios at reasonable levels. Both ratios compare well with those of our competitors.
We use credit derivatives to cover loans and trading transactions. The volume of this activity is small compared to that of our peers and is subject to strict internal controls that minimize operational risk. Risk in these activities is controlled via a series of limits such as VaR, nominal by rating, sensitivity to the spread by rating and name, and sensitivity to the rate of recovery and to correlation. Jump-to-default limits are also set by geographic area, sector and liquidity.
Exposures related to complex structured assets
We have a very limited exposure to complex structured assets. See “Item 11. Quantitative and Qualitative Analysis About Market Risk—Part 10.6. Market Risk—Quantitative analysis—D. Exposures related to complex structured assets”Risk”.
144
Item 6. Directors, senior management and employees
A. Directors and senior management
We are managed by our board of directors, which currently consists of 16 members. In accordance with our Bylaws (Estatutos), the board shall consist of at least 14 and not more than 22 members. Each member of the board is elected to a three-year term by our shareholders at a general meeting. One-third of the members are electedre-elected each year and members may be re-elected.year.
Our board of directors holds its meetings in accordance with an annual calendar. The Rules and Regulations of the Board24 provide that the board shall hold not less than nine annual ordinary meetings; in 2011,2013, it met 1415 times. Our board of directors elects our chairman, vice chairmen and chief executive officer from among its members. Between board meetings, lending and other board powers reside with the executive committee(comisión ejecutiva) and with the risk committee(comisión delegada de riesgos). of our board of directors.
The chairman of the board is the Bank’s most seniorhighest-ranking officer of the Bank (article 48.1 of the Bylaws and as a result,article 8.1 of the Rules and Regulations of the Board) and accordingly, all the powers asthat may be delegated under Spanish law,the Law, our Bylaws and the Rules and Regulations of the Board of Directors have been delegated to him. The chairman leads
However, it is the Bank’s management teamchief executive officer, in accordance with article 10.3 of the decisions madeRules and Regulations of the Board, in his capacity as such, who is entrusted with the day-to-day management of the different business areas and the criteria set by our shareholders athighest executive functions.
There is a clear separation of duties between the general shareholders’ meeting and by the board.
By delegation and under the direction of the board and of theexecutive chairman, the chief executive officer, leads the businessboard and assumes the Bank’s highest executive functions.committees thereof, as well as various checks and balances that assure proper equilibrium in the corporate governance structure of the Bank.
Our board has ultimate lending authority and it delegates such authority to the risk committee, which generally meets twice a week.
Members of our senior management are appointed and removed by the board.
The Rules and Regulations of the Board of Directors are available on the Group’s website, which does not form part of this annual report on Form 20-F, atwww.santander.comunder the heading “Information for shareholders and investors—Corporate governance—Rules and Regulations of the Board of Directors”. |
145
The current members of our board of directors are:
Name | Position with Banco Santander | Director since | ||||
Emilio Botín(1) | Chairman | 1960 | ||||
Javier Marín | Chief executive officer | 2013 | ||||
Fernando de Asúa | First vice chairman | 1999 | ||||
| Second vice chairman | |||||
| Third vice chairman | |||||
| ||||||
Ana P. Botín(1) | Director | 1989 | ||||
Javier Botín(1) | Director | 2004 | ||||
| ||||||
Vittorio Corbo | Director | 2011 | ||||
Rodrigo Echenique | Director | 1988 | ||||
Esther Giménez-Salinas | Director | 2012 | ||||
| ||||||
| ||||||
Ángel Jado | Director | 2010 | ||||
Abel Matutes | Director | 2002 | ||||
Juan R. Inciarte(2) | Director | 2008 | ||||
Isabel Tocino | Director | 2007 | ||||
Juan Miguel Villar Mir | Director | 2013 | ||||
| (1) | Ana P. Botín and Javier Botín are daughter and son, respectively, of Emilio Botín. |
| (2) | Matías R. Inciarte and Juan R. Inciarte are brothers. |
146
Our current executive officers are:
Name | Position with Banco Santander | ||
Emilio Botín | Chairman of the board of directors and of the executive committee | ||
| |||
Matías R. Inciarte | |||
Ana P. Botín | Director and chief executive officer, | ||
Juan R. Inciarte | Director and executive vice president, strategy and Asia | ||
José A. Alvarez | Executive vice president, financial management and investor relations | ||
Ignacio Benjumea | Executive vice president, general | ||
Juan Manuel Cendoya | Executive vice president, communications, corporate marketing and research | ||
Jesús Cepeda | Executive vice president, human resources, organization and costs | ||
José F. Doncel | Executive vice president, internal audit | ||
José María Espí | Executive vice president, risk | ||
José María Fuster | Executive vice president, technology and operations | ||
José Luis G. Alciturri | Executive vice president | ||
Enrique G. Candelas | Executive vice president, | ||
José G. Cantera | |||
Juan Guitard | Executive vice president, | ||
| |||
Jorge Maortua | Executive vice president, global wholesale banking | ||
| Executive vice president, | ||
Luis Moreno | Executive vice president, private banking, asset management and insurance | ||
| |||
José Mª Nus | Executive vice president, | ||
César Ortega | Executive vice president, general secretariat | ||
| Executive vice president, | ||
| |||
Magda Salarich | Executive vice president, consumer finance | ||
Javier San Félix | Executive vice president, commercial banking | ||
José Tejón | Executive vice president, financial accounting and control | ||
José Antonio | |||
Juan A. Yanes | Executive vice president, United States | ||
Jesús Mª Zabalza | Executive vice president, | ||
In addition, Román Blanco is the Group’s country head for Santander in the United States.
147
The following is a summary of the relevant business experience and principal business activities of our current directors and executive officers:
Emilio Botín (chairman of the board of directors and of the executive committee)
Born in 1934. He joined the board of directors of Banco Santander in 1960 and was appointed chairman of the board in 1986.
Javier Marín (chief executive officer)
Born in 1966. He was appointed director and chief executive officer at board meeting of April 29, 2013. The appointment of Javier Marín as a director was ratified by our shareholders at the general meeting of shareholders held on March 28, 2014. He joined the Bank in 1991. After performing various duties within the Group, he was appointed executive vice president of the global private banking division in 2007. He was appointed head of the global private banking and asset management division in 2009 and of the global private banking, asset management and insurance division in 2010.
Fernando de Asúa (first vice chairman of the board of directors, lead director and chairman of the appointments and remuneration committee)
Born in 1932. Former vice chairman of Banco Central Hispanoamericano from 1991 to 1999. He was appointed director in 1999 and first vice chairman in 2004. He is a former chairman of IBM España, S.A. and he is currently the honorary chairman. In addition, he is a non-executive vice chairman of Técnicas Reunidas, S.A.
Alfredo Sáenz (second vice chairman of the board of directors and chief executive officer)
Born in 1942. Former chief executive officer and vice chairman of Banco Bilbao Vizcaya, S.A. and chairman of Banca Catalana until 1993. In 1994, he was appointed chairman of Banesto and in 2002, second vice chairman and chief executive officer of Santander.
Matías R. Inciarte (third(second vice chairman of the board of directors and chairman of the risk committee)
Born in 1948. He joined Banco Santander in 1984 and was appointed executive vice president and chief financial officer in 1986. He was appointed director in 1988 and between 1999 and 2013 he was third vice chairman of the board. In 2013 he was appointed second vice chairman in 1994.of the board. He is non-executive chairman of Banco Santander Totta, S.A. and a non-executive director of Banesto, Sanitas, S.A. de Seguros and Financiera Ponferrada, S.A., SICAV and since 2008, president of the Fundación Príncipe de Asturias. Prior to joining Banco Santander, he was minister of the presidency of the Spanish Government from 1981 to 1982.
Manuel Soto (fourthGuillermo de la Dehesa (third vice chairman of the board of directors and chairman of the audit and compliance committee)
Born in 1940.1941. He was appointed director in 1999.2002. He is a state economist and Bank of Spain’s office manager (on leave). He is an international advisor to Goldman Sachs International, former state secretary of Economy, general secretary of Trade and chief executive officer of Banco Pastor, S.A. He is currently non-executive vice chairman of Amadeus IT Holding, S.A., a non-executive director of Cartera Industrial REA,Campofrío Food Group, S.A. In addition, he was formerlyand of Grupo Empresarial San José, S.A., chairman of Arthur Andersen’s Global Boardthe Centre for Economic Policy Research (CEPR) in London, a member of the Group of Thirty in Washington, chairman of the board of trustees of IE Business School and managernon-executive chairman of Aviva Grupo Corporativo, S.L. and of Aviva Vida y Pensiones, S.A. de Seguros y Reaseguros.
Sheila C. Bair
Born in 1954. She was appointed director at board meeting of January 27, 2014. The appointment of Sheila C. Bair as a director was ratified by our shareholders at the general meeting of shareholders held on March 28, 2014. She is senior advisor and chairman of the Systemic Risk Council at The Pew Charitable Trusts and columnist in Fortune Magazine. She is a former chairman of the Federal Deposit Insurance Corporation (2006-2011), Dean´s Professor of Financial Regulatory Policy for EMEIA (Europe Middle East, Indiathe Isenberg School of Management at the University of Massachusetts-Amherst (2002-2006) and Africa)Assistant Secretary for Financial Institutions at the U.S. Department of the Treasury (2001-2002).
Ana P. Botín
Born in 1960. FormerShe was appointed director in 1989. She is chief executive officer of Santander UK plc. She joined the Bank after a period at JP Morgan (1981-1988). She has been executive vice president of Banco Santander, S.A., former chief executive officer of Banco Santander de Negocios from 1994 to 1999 since 1992 and formerwas executive chairwoman of Banesto from 2002 to 2010. In November 2010, she was appointed chief executive officer of Santander UK. She is also a member of the International Advisory Board of the New York Stock Exchange and a non-executive director of the board of Georgetown University.The Coca-Cola Company.
Javier Botín
Born in 1973. He was appointed director in 2004. He is chairman and chief executive officer of JB Capital Markets, Sociedad de Valores, S.A.
Lord Burns
Born in 1944. He was appointed director in 2004. He is also a non-executive chairman of Santander UK plc and Alliance & Leicester plc. In addition, he is non-executive chairman of Channel Four Television Corporation and a non-executive member of the Office for Budget Responsibility. He was Permanent Secretary to the UK Treasury and chaired the UK Parliamentary Financial Services and Markets Bill Joint Committee and was a non-executive chairman of Marks & Spencer Group plc, Glas Cymru (Welsh Water) and a non-executive director of Pearson Group plc, British Land plc and Legal & General Group plc.
148
Vittorio Corbo
In July 2011, at the proposal of the appointments and remuneration committee, Vittorio CorboBorn in 1943. He was appointed director by co-option byin 2011. He is the board. At the annual general meeting held on March 30, 2012, our shareholders ratified such appointmentnon-executive chairman of Banco Santander Chile and re-elected him for of Compañía three year term. Born in 1943 in Iquique (Chile)de Seguros SURA Chile, non-executive director of Banco Santander (México), Vittorio Corbo served from 2003S.A., of CCU, S.A. and of Endesa Chile, and a financial advisor to 2007 asvarious international institutions and Chilean businesses. He was previously chairman of the Central Bank of Chile. He is currentlyChile (2003-2007), a senior associate researcherprofessor of Economics at the Centro de Estudios PúblicosPontificia Catholic University of Chile (1981-1984 and 1991-2003) and at Concordia University in Chile, full professorMontreal, Canada (1972-1981) and professorial lecturer at the Universidad Católica de Chile, professorGeorgetown University, Washington, DC (1985-1991), and held management positions at the Universidad de Chile, director of Banco Santander Chile, chairman of the board of directors of ING-Seguros de Vida Chile, director of ENDESA-Chile, a member of the advisory council for the World Bank Chief Economist, a member of the consulting group on monetary and exchange policy of the money and capital markets department of the International Monetary Fund, a member of the board for resolutions on parliamentary assignments of the Chilean Congress, and a member of the international advisory board of the Center for Social and Economic Research (CASE) in Warsaw, Poland.Washington, D.C. (1984-1991).
Esther Giménez-Salinas
Born in 1949. She joined the board in 2012 after her appointment as director by our shareholders acting at their annual general meeting held on March 30, 2012. She is Rector of the Ramon Llull University and Professor of Criminal Law for the ESADE-URL’s Law School. She has been a member of the Supreme Judicial Council, a member of the standing committee of the Conference of Rectors of Spanish Universities (CRUE) and an executive vice-president of the Center for Legal Studies of the Department of Justice of the Generalitat de Catalunya.
Guillermo de la Dehesa
Born in 1941. Former secretary of state of economy and secretary general of commerce of the Spanish Government and chief executive officer of Banco Pastor. He is a state economist and Bank of Spain’s office manager (on leave). He was appointed director in 2002. He is an international advisor of Goldman Sachs International, and a non-executive director of Campofrío Food Group, S.A. and Amadeus IT Holding, S.A. He is also chairman of the Centre for Economic Policy Research (CEPR) in London, member of the Group of Thirty of Washington, chairman of the board of trustees of the IE Business School and non-executive chairman of Aviva Grupo Corporativo, S.L. and of Aviva Vida y Pensiones, S.A. de Seguros y Reaseguros.
Rodrigo Echenique
Born in 1946. He was appointed director in 1988. Former chief executive officer of Banco Santander, S.A. from 1988 to 1994. He is currently also non-executive chairman of NH Hoteles, S.A. and non-executive chairman of Vocento, S.A.
Esther Giménez-Salinas
Born in 1949. She joined the board in 2012. She is a professor of Criminal Law for the ESADE-URL’s Law School. She has been rector of the Ramon Llull University, member of the Supreme Judicial Council, member of the standing committee of the Conference of Rectors of Spanish Universities (CRUE) and an executive vice president of the Center for Legal Studies of the Department of Justice of the Generalitat de Catalunya.
Ángel Jado
Born in 1945. He was appointed director in 2010. Former director of Banco Santander from 1972 to 1999 and former director of Banco Banif, S.A. from 2001.2001 to 2013.
Abel Matutes
Born in 1941. He was appointed director in 2010. Since 2001 he is director of Banco Banif, S.A.
Abel Matutes
Born in 1941. He joined Banco Santander in 2002 as member of the board.2002. Former foreign minister of the Spanish Government and EU commissioner for the portfolios of Loans and Investment, Financial Engineering and Policy for Small and Medium-sized Companies (1989); North-South Relations, Mediterranean Policy and Relations with Latin America and Asia (1989) and of the Transport and Energy and Supply Agency of Euroatom (1993). He is also a chairman of Grupo de Empresas Matutes and director of FCC Construcción, S.A.Matutes.
Juan R. Inciarte
Born in 1952. He joined Banco Santanderthe Group in 1985 as director and executive vice president of Banco Santander de Negocios. He was appointedis executive vice president insince 1989 and between 1991 and 1999 he was a director of Banco Santander from 1991 to 1999. HeSantander. In 2008, he was again appointed director in January 2008. Hedirector. In addition, he is also a non-executive vice chairman of Santander UK plc and a director of Santander Consumer Finance, S.A., Alliance & Leicester plc and Banco Banif, S.A.
149
Isabel Tocino
Born in 1949. She joined Banco Santanderwas appointed director in 2007 as a member of the board.2007. Former ministerMinister for environmentEnvironment of the Spanish Government, former chairwoman of the European Affairs and of the Foreign Affairs Committees of Spanish Congress. She is currently an elected member of the Spanish State Council, a professor of the Complutense University of Madrid, and a member of the Royal Academy of Doctors.Doctors and a non-executive director of ENCE Energía y Celulosa, S.A. and Enagás, S.A.
Juan Miguel Villar Mir Born in 1931. He was appointed director at board meeting of April 29, 2013. The appointment of Juan Miguel Villar Mir as a director was ratified by our shareholders at the general meeting of shareholders held on March 28, 2014. He is chairman of the OHL Group and representative of the latter as vice chairman of Abertis Infraestructuras, S.A., he was Minister for Finance and vice president of the Spanish Government for economic affairs (1975-1976). He has also served as chairman of Electra de Viesgo, Altos Hornos de Vizcaya, Hidro Nitro Española, Empresa Nacional de Celulosa, Empresa Nacional Carbonífera del Sur, Cementos del Cinca, Cementos Portland Aragón and Puerto Sotogrande. Furthermore, he is presently a member of the Royal Academy of Engineering. José A. AlvarezÁlvarez
Born in 1960. He joined the Bank in 2002. In 2004, he was appointed executive vice president, Financialfinancial management and Investor Relations.investor relations. José A. Alvarez is a director of Santander Consumer Finance, S.A., Santander Consumer Bank AG, Banco Santander (Brazil) SA and Santander Holdings USA. He is also a member of the supervisory board of Bank Zachodni WBK S.A.
Ignacio Benjumea
Born in 1952. He joined Banco Santander in 1987 as general secretary of Banco Santander de Negocios. In 1994 he was appointed executive vice president and general secretary and secretary of the board of Banco Santander. He is also a director of Bolsas y Mercados Españoles, Sociedad Holding de Mercados y Sistemas Financieros, S.A., Sociedad Rectora de la Bolsa de Madrid, S.A. and La Unión Resinera Española, S.A.
Juan Manuel Cendoya
Born in 1967. Former manager of the Legal and Tax Department of Bankinter, S.A. from 1999 to 2001. He joined the Bank in July 2001 as executive vice president, communications, corporate marketing and research.
Jesús Cepeda
Born in 1961. He joined the Bank in 1990, having held positions as head of the management control area and deputy head of the financial accounting and control division prior to being appointed executive vice president and head of the human resources, organization and costs division in 2013.
José Doncel
Born in 1961. He worked for Arthur Andersen and Banco Santander before joining Banesto in 1994, where he served as head of accounting and financial management. In 2013, he joined Banco Santander, where he was appointed executive vice president and head of the internal audit division.
José María Espí
Born in 1944. He joined the Bank in 1985 and, in 1988, was appointed executive vice president, human resources. In 1999 he was appointed executive vice president, risk. He is also chairman of Unión de Crédito Inmobiliario, S.A., E.F.C. and director of UCI, S.A.
José María Fuster
Born in 1958. He joined the Group in 1988. In 2004, he was appointed chief information officer of Grupo Santander. In the same year, he was also named member of the board of Abbey National plc (now, Santander UK plc) and the board of Advisors of IBM Corporation. In 2006,2007, he was appointed executive director of Banesto and, in 2007, executive vice president of technology and operations at Banco Santander. Presently, José María Fuster is also a director of Openbank, S.A. and of Ingeniería de Software Bancario, S.A. (ISBAN).
José Luis G. Alciturri
Born in 1949. He joined the Bank in 1996. Since 2003, he has been responsible for the Group’s human resources. In1966. Between 2007 and 2013 he was appointedhead of the human resources division. At present, he is executive vice president.president of the Bank.
Enrique G. Candelas
Born in 1953. He joined Banco Santander in 1975 and was appointed senior vice president in 1993. He was appointed executive vice president, Retail Banking Spain (Santander Branch Network) in 1999.1999 and head of Santander Spain in 2013.
José G. Cantera
Born in 1966. He joined Banestothe Group in 2003. In 2006, he was appointed Banesto’s chief executive officer. Formerly, he was member of the executive committee of Citigroup EMEA and member of the board of directors of Citigroup Capital Markets Int. Ltd. and Citigroup Capital Markets UK.
150
Juan Guitard
Born in 1960. Former general secretary of the board of Banco Santander de Negocios (from 1994 to 1999) and manager of the investment banking department of the Bank (from 1999 to 2000). He rejoined the Bank in 2002, being appointed executive vice president, vice-secretary general of the board. He was head of the internal audit division between 2009 and 2013. In 2009,2013, he was appointed head of internal auditing.responsible for the risk division.
Adolfo LagosRemigio Iglesias
Born in 1948. Former chief executive officer of Grupo Financiero Serfin since 1996.1954. He joined the Group in 1990, having held several positions in commercial banking. He was appointed executive vice president America,and head of the asset recoveries and restructuring division in 2002 and executive vice president, global wholesale banking in 2003.2013.
Jorge Maortua
Born in 1961. Former executive vice president of Banesto since 2001.between 2001 and 2003. He joined the Bank in 2003 as head of global treasury and was appointed executive vice president, global wholesale banking in 2004.
Javier MarínLuis Moreno
Born in 1966. He joined the Bank in 1991. After serving in various positions within the Group, he was appointed executive vice president of the global private banking division in 2007. In 2009, he was appointed head of the asset management and global private banking division. In 2010 he was appointed head of the global private banking, asset management and insurance division.
Jorge Morán
Born in 1964. He joined the Bank in 2002. He was1989, having held positions as head of products, marketing & electronic banking and head of the marketing & business development area of private banking, asset management and insurance division, prior to being appointed executive vice president asset management and insurance, in 2004. In 2005, he was appointed executive vice president and chief operating officer of Santander UK and, in 2006, executive vice president in charge of insurance and global direct banking. In 2010 he was appointed chief executive officer of Sovereign and country head of all our businesses in the United States.2013.
José Mª Nus
Born in 1950. He joined Santander UK in 2010 as executive director and chief risk officer. He is also an executive vice president of Santander. Formerly,In 2010, he was appointed executive director of Banco Santander and chiefin March 2014, head of strategic planning of the risk officer of Banesto.division. He has also been executive vice president, risk in Argentaria and Bankinter, and member of the board of directors in Banesto, Banco de Vitoria, Banco de Negocios Argentaria, Banco de Crédito Local and Banco de Alicante. He is currently a member of the board of Societat Catalana d’Economia.
César Ortega
Born in 1954. He joined the Bank in 2000 and was appointed executive vice president, general secretariat in 2006. He is also a non-executive director of Fomento de Construcciones y Contratas, S.A.
Javier PeraltaÁngel Rivera
Born in 1950.1966. He joined the Bank in 1989 and was appointed2013 as executive vice president in 1993. In 2002,responsible for companies and institutions, within the commercial banking division. Previously, he was appointed executive vice president, risk.
Marcial Portela
Born in 1945. He joineddeveloped his professional career over 23 years with the Bank in 1998 as executive vice president. In 1999, he was appointed executive vice president, America. In 2010 he was appointed chief executive officer of Santander Brasil. He is also a director of Best Global, S.A.Banco Popular Group.
151
Magda Salarich
Born in 1956. She joined the Bank in 2008 as executive vice president responsible for Santander’s Consumer Financeconsumer finance division. Previously, she had held several positions in the automobile industry, including the position of director and executive vice president of Citroën España and head of commerce and marketing for Europe of Citroën Automobiles.
Javier San Félix
Born in 1967. He joined the Group in 2004 as head of strategic planning in the consumer finance division. In 2005 he was appointed director and executive vice president of Santander Consumer Finance in Spain and in 2006 he was appointed chief operating officer of the consumer finance division. Former chief executive officer of Banesto, he was appointed executive vice president of Banco Santander and head of commercial banking division in 2013.
José Tejón
Born in 1951. He joined the Bank in 1989. In 2002, he was appointed executive vice president, financial accounting and control.
José Antonio Vieira MonteiroVillasante
Born in 1946. He joinedHis entire professional career has been with Banco Santander, Tottawhich he joined in 2004 as an executive director. Previously, he had held several positions in the Portuguese banking industry, including the directorship of Crédito Predial Português and chairmanship, on behalf of Banco Totta, of Banco Totta de Angola and Banco Standard Totta Moçambique. In 2012, he1964. He was appointed chairman of thesenior vice president in 1994 and deputy executive committee of Banco Santander Totta, S.A. and Santander Totta SGPS, S.A.vice president in 2006. He is currently also a non-executive directorexecutive vice president, head of Portal Universia, S.A.the universities division.
Juan A. Yanes
Born in 1962. He joined Grupo Santander in 1991 and was involvedworked in Investment Banking, Corporate Finance,investment banking, corporate finance, and Financial Marketsfinancial markets until 1999. FromIn 1999, until 2009, he was in the Risk Management Division. In 2009 he was appointed as global head of market risk in U.S. and in 2010 executive vice president of the Bank.
Since 2013 he is the chief risk officer in charge of all Santander operations in the U.S. From 2009 to 2013, Juan A. Yanes was the chief corporate officer responsible for the consolidated supervision of all Banco Santander, USA. In 2011, heS.A. activities in the U.S. and was named head ofalso responsible for compliance and internal controlcontrol.
Before joining the Group he worked for Citibank in the Group’s US operations. He serves as a board member of various US business units.capital markets area in Venezuela.
Jesús Mª Zabalza
Born in 1958. Former executive vice president of La Caixa (from 1996 to 2002). He joined the Bank in 2002, being appointed executive vice president, America. He is currently chief executive officer of Banco Santander Brazil.
* * * * * *
In addition, Ramón Tellaeche, an adjunct to executive vice presidentfollowing is a summary of the relevant business experience of Román Blanco (U.S., country head from 2013):
Román Blanco
Born in 1964. He joined the Bank isin 2004 as director of business development for the head of the payment meansAmerica division and José A. Villasante, an adjunct towas later appointed vice-president of Banco Santander Banespa in Brazil. He was also country head for Santander in Colombia (2007) and in Puerto Rico (2012-2013).
He is chairman and chief executive vice presidentofficer of Santander Bank and Santander Holdings USA. In this role, he manages all the Bank, isGroup’s units in the head of theUnited States. Before joining Santander, Universidades division.he worked for 13 years with McKinsey & Co., where he became senior partner.
* * * * * *
For a description of arrangements or understandings with major shareholders, customers, suppliers or others pursuant to which any person referred to above was appointed, see Item 7 of Part I, “Shareholders and Related Party Transactions – Transactions—A. Major Shareholders– Shareholders—Shareholders’ agreements” herein.
Directors’ compensation
Fees Stipulated in the Bylaws stipulated fees
Article 58 of the Bank’s current Bylaws approved by the shareholders at their annual general meeting held on June 21, 2008 providesprovided that the annual share in the Bank’s profit for that the directors will beare entitled to receive for discharging their duties as members of the board of directors -annual emolument(annual retainer and attendance fees-fees) will be equal to 1% of the Bank’s net profit for the year. However, the board of directors may resolve to reduce this percentage.
The amount set by the board of directors for 2011,2012, calculated pursuant to the aforementioned Article 58 of the Bylaws, was 0.275%0.321% of the Bank’s profit for 2011 (2010: 0.183% in like-for-like terms).
152
At the proposal of the appointments and remuneration committee, the directors at the boardThe annual general meeting held on December 19, 2011 resolvedMarch 22, 2013 approved an amendment to the Bylaws, whereby the remuneration of directors in their capacity as board members now consists of an annual fixed amount determined by the shareholders at the annual general meeting. This amount shall remain in effect unless the shareholders resolve to change it at a general meeting. However, the board of directors may elect to reduce the amount in any years in which it deems such action justified. The remuneration established for 2013 by the annual emolumentgeneral meeting was €6 million, with two components: (a) an annual retainer and (b) attendance fees.
The specific amount payable for 2011 by 6% with respectthe above-mentioned items to the amounts paid outeach of the profits for 2010.directors is determined by the board of directors, which takes into consideration the positions held by each director on the board, their attendance of board meetings, their membership on various committees and their attendance of committee meetings.
The total Bylaws-stipulated retainer earned by the directors in 2013 amounted to €4.3 million.
The amounts received individually by each board member in 20112013 and 2010 based2012 for each position held on their positions held in the board and for each position held on a board committees werecommittee are as follows:
| Euros | ||||||||
| 2011 | 2010 | |||||||
Members of the board of directors | 99,946 | 106,326 | ||||||
Members of the executive committee | 200,451 | 213,246 | ||||||
Members of the audit and compliance committee | 46,530 | 49,500 | ||||||
Members of the appointments and remuneration committee | 27,918 | 29,700 | ||||||
First and fourth deputy chairmen | 33,502 | 35,640 | ||||||
| Euros | ||||
| 2013-2012 | ||||
Members of the board of directors | 84,954 | |||
Members of the executive committee | 170,383 | |||
Members of the audit and compliance committee | 39,551 | |||
Members of the appointments and remuneration committee | 23,730 | |||
First and fourth deputy chairmen(1) | 28,477 | |||
| (1) | In 2013 the total amount of €28,477 was paid to the current third vice chairman and the former fourth vice chairman, in proportion to the time during which each held office in the year. |
Furthermore, the directors received fees for attending board and committee meetings excludingbut not attending executive committee meetings, sincebecause no attendance fees are received for this committee.
The amounts of the fees for attending the meetingsBy resolution of the board of directors, and of the board committees (excluding the executive committee) were the same in 2011 as in 2010, in accordance withat the proposal made byof the appointments and remuneration committee, at its meeting on December 14, 2010the fees for attending board and approved by the directorscommittee meetings (excluding executive committee meetings, for which no attendance fees have been established) have remained unchanged since 2008 and will be maintained at the board meeting on December 20, 2010. These attendance fees were approved by the directors at the board meeting held on December 17, 2007 in the following amounts:same level as of January 1, 2014.
Board of directors: €2,540 for resident directors residing in Spain and €2,057 for non-resident directors.
Risk committee and audit and compliance committee: €1,650 for resident directors residing in Spain and €1,335 for non-resident directors.
Other committees: €1,270 for resident directors residing in Spain and €1,028 for non-resident directors.
Salary compensationfor executive directors
Executive directors received the following salaries for 2013 and 2012, which were approved by the board at the proposal of the appointments and remuneration committee:
| Thousands of euros | ||||||||
| 2013 | 2012 | |||||||
Emilio Botín | 1,344 | 1,344 | ||||||
Javier Marín(1) | 2,000 | — | ||||||
Matías R. Inciarte | 1,710 | 1,710 | ||||||
Ana P. Botín(2) | 2,005 | 2,100 | ||||||
Juan R. Inciarte | 987 | 987 | ||||||
Alfredo Sáenz(3) | — | 3,703 | ||||||
|
|
|
| |||||
Total | 8,046 | 9,844 | ||||||
|
|
|
| |||||
| (1) | Annualized amount of the chief executive officer’s salary. However, the amount actually received in 2013 was €1,600,000, which is the sum of his remuneration as executive vice president of the Bank for the first four months of the year and his remuneration as chief executive officer for the remaining eight. |
| (2) | The gross annual salary for 2011 was revised in the case of Ana P. Botín to reflect the assumption of new responsibilities as chief executive officer of Santander UK and was established at €2 million which, at the exchange rate published by the Bank of Spain on the business day prior to December 20, 2010 (the date on which the current fixed salary remuneration of the aforementioned executive director was approved by the board of directors), amounted to £1,702 thousand. The euro amounts shown in the above table are the equivalent values calculated by applying the average exchange rates for those years to her remuneration in pounds sterling. |
| (3) | Retired from the board on April 29, 2013. The gross salary received until that date is shown, together with his other remuneration, on page number 182. |
The maximum variable remuneration for executive directors for 20112013 and 20102012 approved by the board at the proposal of the appointments and remuneration committee was as follows:
| Thousands of euros | Thousands of euros | |||||||||||||||
| 2011 | 2010 | 2013 | 2012 | |||||||||||||
Emilio Botín | 1,344 | 1,344 | 1,412 | 1,412 | ||||||||||||
Alfredo Sáenz | 3,703 | 3,703 | ||||||||||||||
Javier Marín(1) | 2,500 | — | ||||||||||||||
Matías R. Inciarte | 1,710 | 1,710 | 2,308 | 2,669 | ||||||||||||
Ana P. Botín | 1,962 | 1,353 | 2,212 | 2,247 | ||||||||||||
Francisco Luzón(*) | 1,656 | 1,656 | ||||||||||||||
Juan R. Inciarte | 987 | 987 | 1,480 | 1,557 | ||||||||||||
Alfredo Sáenz | — | 3,510 | ||||||||||||||
|
|
|
| |||||||||||||
Total | 11,362 | 10,753 | 9,912 | 11,395 | ||||||||||||
|
|
|
| |||||||||||||
153
The maximum variable remuneration of the executive directors for 2011 and 2010 approved by the board at the proposal of the appointments and remuneration committee was as follows:
| Thousands of euros | ||||||||
| 2011 | 2010 | |||||||
Emilio Botín | 2,825 | 3,263 | ||||||
Alfredo Sáenz | 7,019 | 8,107 | ||||||
Matías R. Inciarte | 3,568 | 4,122 | ||||||
Ana P. Botín(*) | 2,667 | 3,871 | ||||||
Francisco Luzón | 3,717 | 4,294 | ||||||
Juan R. Inciarte | 2,082 | 2,405 | ||||||
|
|
|
| |||||
Total | 21,878 | 26,062 | ||||||
|
|
|
| |||||
| (2) | Equivalent euro value of the |
The second and third cycles of the deferred conditional variable remuneration plan were approved in 2012 and 2013 under the same payment terms as the first cycle of the plan (see Note 5.e to our consolidated financial statements), whereby payment of a portion of the variable remuneration for these years is deferred over three years and paid, where appropriate, in three equal portions, 50% in cash and 50% in Santander shares, provided the conditions for entitlement to the remuneration are met. The portion of the variable remuneration that is not deferred (immediate payment) is also paid 50% in cash and 50% in shares.
The amounts shown in the foregoing table reflect the maximum total maximum variable remuneration allocated annually to the executive directors.directors for each year. These amounts include both the cash-based and share-based variable remuneration (according to the plans agreed in each year) and both the remuneration payable immediately and onthat which, as the case may be, is payable following a deferred basis payable.deferral period and deferred.
In recent years the Group has adapted its remuneration policy to the new requirements and best practices, increasing the variable remuneration to be deferred and paid in shares, rather than in cash.
The following table shows a breakdownthe form of payment of the variable remuneration:
154
| Thousands of euros | ||||||||||||||||||||||||||||||||||||||||||||||||
| Thousands of euros | 2013 | 2012 | ||||||||||||||||||||||||||||||||||||||||||||||
| 2011(1) | 2010(2) | Immediate payment in cash (20%) | Immediate payment in shares (20%) | Deferred payment in cash (30%) (1) | Deferred payment in shares (30%) (1) | Immediate payment in cash (20%) | Immediate payment in shares (20%) | Deferred payment in cash (30%) (2) | Deferred payment in shares (30%) (2) | |||||||||||||||||||||||||||||||||||||||
| Immediate payment | Deferred payment | Immediate payment | Deferred payment | |||||||||||||||||||||||||||||||||||||||||||||
Emilio Botín | 1,130 | 1,695 | 1,682 | 1,581 | 282 | 282 | 424 | 424 | 282 | 282 | 424 | 424 | ||||||||||||||||||||||||||||||||||||
Javier Marín | 500 | 500 | 750 | 750 | — | — | — | — | ||||||||||||||||||||||||||||||||||||||||
Matías R. Inciarte | 462 | 462 | 692 | 692 | 534 | 534 | 801 | 801 | ||||||||||||||||||||||||||||||||||||||||
Ana P. Botín(3) | 442 | 442 | 664 | 664 | 449 | 449 | 674 | 674 | ||||||||||||||||||||||||||||||||||||||||
Juan R. Inciarte | 296 | 296 | 444 | 444 | 311 | 311 | 467 | 467 | ||||||||||||||||||||||||||||||||||||||||
Alfredo Sáenz | 2,808 | 4,212 | 3,351 | 4,756 | — | — | — | — | 702 | 702 | 1,053 | 1,053 | ||||||||||||||||||||||||||||||||||||
Matías R. Inciarte | 1,427 | 2,141 | 1,994 | 2,128 | ||||||||||||||||||||||||||||||||||||||||||||
Ana P. Botín | 1,067 | 1,600 | 1,980 | (3) | 1,891 | (3) | ||||||||||||||||||||||||||||||||||||||||||
Francisco Luzón | 1,487 | 2,230 | 2,146 | 2,148 | ||||||||||||||||||||||||||||||||||||||||||||
Juan R. Inciarte | 833 | 1,249 | 1,304 | 1,101 | ||||||||||||||||||||||||||||||||||||||||||||
|
|
|
|
|
|
|
|
|
|
|
| |||||||||||||||||||||||||||||||||||||
Total | 8,752 | 13,127 | 12,457 | 13,605 | 1,982 | 1,982 | 2,974 | 2,974 | 2,278 | 2,278 | 3,419 | 3,419 | ||||||||||||||||||||||||||||||||||||
|
|
|
|
|
|
|
|
|
|
|
| |||||||||||||||||||||||||||||||||||||
| (1) |
| (2) |
| (3) |
The amounts relatingof immediate and deferred payments in shares shown in the table above correspond to the variable share-based remuneration reflect the equivalent value, at the agreement date,following numbers of shares:
| Number of shares | ||||||||||||||||||||||||
| 2013 | 2012 | |||||||||||||||||||||||
| Immediate payment | Deferred payment (1) | Total | Immediate payment | Deferred payment (2) | Total | |||||||||||||||||||
Emilio Botín | 42,287 | 63,431 | 105,718 | 43,952 | 65,927 | 109,879 | ||||||||||||||||||
Javier Marín | 74,850 | 112,275 | 187,125 | — | — | — | ||||||||||||||||||
Matías R. Inciarte | 69,092 | 103,639 | 172,731 | 83,059 | 124,589 | 207,648 | ||||||||||||||||||
Ana P. Botín | 66,241 | 99,362 | 165,603 | 69,916 | 104,874 | 174,790 | ||||||||||||||||||
Juan R. Inciarte | 44,299 | 66,448 | 110,747 | 48,466 | 72,699 | 121,165 | ||||||||||||||||||
Alfredo Sáenz | — | — | — | 109,211 | 163,817 | 273,028 | ||||||||||||||||||
|
|
|
|
|
|
|
|
|
|
|
| |||||||||||||
Total | 296,769 | 445,155 | 741,924 | 354,604 | 531,906 | 886,510 | ||||||||||||||||||
|
|
|
|
|
|
|
|
|
|
|
| |||||||||||||
| (1) | In 3 years: 2015, 2016 and 2017 subject to continued service, with the exceptions provided for, and the non-applicability of “malus” clauses. |
| (2) | In 3 years: 2014, 2015 and 2016 subject to continued service, with the exceptions provided for, and the non-applicability of “malus” clauses. |
A breakdown of the maximum number of shares that may be receivedremuneration for 2013 by the directors for their participation in the various plans. The number of shares that each director will actually receive on expiry of each plan will depend on the director’s compliance with the conditions for entitlement thereto (see Note 5.e) to our consolidated financial statements).
A detailed explanation for the 2011 renumeration for eachBank director is provided below. The salaries of the executive directors disclosed in the table below relatecorrespond to the maximum amounts for each item approved by the board of directors as period remuneration, regardlessirrespective of the actual year of payment and of any amounts paid to the directors under the agreed deferred remuneration scheme. Note 5.e)5.e to our consolidated financial statements includes disclosures on the shares delivered by virtueas part of the deferred remuneration schemes in place in previous years the conditions for delivery of which were met in the relatedcorresponding years.
155
Thousands of euros | ||||||||||||||||||||||||||||||||||||||||||||||||||||||||||||
| Directors | 2011 | 2010 | ||||||||||||||||||||||||||||||||||||||||||||||||||||||||||
| Bylaw-stipulated emoluments | Salaries of executive directors | |||||||||||||||||||||||||||||||||||||||||||||||||||||||||||
| Annual emolument | Attendance fees | |||||||||||||||||||||||||||||||||||||||||||||||||||||||||||
| Audit and | Appointments and | Variable -Immediate | Variable -Deferred | Other | ||||||||||||||||||||||||||||||||||||||||||||||||||||||||
| Board | Executive Committee | compliance committee | remuneration committee | Board | Other fees | Fixed remuneration | In cash | In shares | In cash | In shares | Total | remuneration (b) | Total | Total | ||||||||||||||||||||||||||||||||||||||||||||||
Emilio Botín | 100 | 200 | — | — | 30 | 4 | 1,344 | 565 | 565 | 847 | 847 | 4,168 | 1 | 4,505 | 4,959 | |||||||||||||||||||||||||||||||||||||||||||||
Fernando de Asúa | 133 | 200 | 47 | 28 | 30 | 186 | — | — | — | — | — | — | — | 625 | 654 | |||||||||||||||||||||||||||||||||||||||||||||
Alfredo Sáenz | 100 | 200 | — | — | 30 | 4 | 3,703 | 1,404 | 1,404 | 2,106 | 2,106 | 10,723 | 548 | 11,604 | 12,635 | |||||||||||||||||||||||||||||||||||||||||||||
Matías R. Inciarte | 100 | 200 | — | — | 33 | 163 | 1,710 | 714 | 714 | 1,071 | 1,071 | 5,280 | 239 | 6,015 | 6,569 | |||||||||||||||||||||||||||||||||||||||||||||
Manuel Soto | 133 | — | 47 | 28 | 30 | 36 | — | — | — | — | — | — | — | 274 | 279 | |||||||||||||||||||||||||||||||||||||||||||||
Assicurazioni Generali, SpA.(1) | 96 | — | — | — | 12 | — | — | — | — | — | — | — | — | 108 | 139 | |||||||||||||||||||||||||||||||||||||||||||||
Antonio Basagoiti | 100 | 200 | — | — | 33 | 158 | — | — | — | — | — | — | 7 | 498 | 510 | |||||||||||||||||||||||||||||||||||||||||||||
Ana P. Botín | 100 | 200 | — | — | 28 | 1 | 1,962 | 534 | 534 | 800 | 800 | 4,630 | 51 | 5,010 | 5,592 | (c) | ||||||||||||||||||||||||||||||||||||||||||||
Javier Botín (2) | 100 | — | — | — | 30 | — | — | — | — | — | — | — | — | 130 | 131 | |||||||||||||||||||||||||||||||||||||||||||||
Lord Terence Burns | 100 | — | — | — | 19 | — | — | — | — | — | — | — | — | 119 | 125 | |||||||||||||||||||||||||||||||||||||||||||||
Vittorio Corbo (3) | 45 | — | — | — | 8 | — | — | — | — | — | — | — | — | 53 | — | |||||||||||||||||||||||||||||||||||||||||||||
Guillermo de la Dehesa | 100 | 200 | — | 28 | 33 | 15 | — | — | — | — | — | — | — | 377 | 390 | |||||||||||||||||||||||||||||||||||||||||||||
Rodrigo Echenique (4) | 100 | 200 | 47 | 28 | 33 | 35 | — | — | — | — | — | — | 37 | 480 | 423 | |||||||||||||||||||||||||||||||||||||||||||||
Antonio Escámez | 100 | 200 | — | — | 33 | 154 | — | — | — | — | — | — | 41 | 528 | 530 | |||||||||||||||||||||||||||||||||||||||||||||
Ángel Jado (5) | 100 | — | — | — | 33 | — | — | — | — | — | — | — | — | 133 | 72 | |||||||||||||||||||||||||||||||||||||||||||||
Francisco Luzón (6) | 100 | 200 | — | — | 30 | 1 | 1,656 | 743 | 743 | 1,115 | 1,115 | 5,372 | 1,089 | 6,792 | 7,297 | |||||||||||||||||||||||||||||||||||||||||||||
Abel Matutes | 100 | — | 47 | — | 30 | 21 | — | — | — | — | — | — | — | 198 | 197 | |||||||||||||||||||||||||||||||||||||||||||||
Juan R. Inciarte | 100 | — | — | — | 28 | 96 | 987 | 416 | 416 | 625 | 625 | 3,069 | 120 | 3,413 | 3,759 | |||||||||||||||||||||||||||||||||||||||||||||
Luis Ángel Rojo (7) | 39 | — | 18 | 11 | 8 | 9 | — | — | — | — | — | — | — | 85 | 215 | |||||||||||||||||||||||||||||||||||||||||||||
Luis Alberto Salazar-Simpson | 100 | — | 47 | — | 30 | 21 | — | — | — | — | — | — | — | 198 | 200 | |||||||||||||||||||||||||||||||||||||||||||||
Isabel Tocino (8) | 100 | — | — | 13 | 30 | 5 | — | — | — | — | — | — | — | 148 | 134 | |||||||||||||||||||||||||||||||||||||||||||||
|
|
|
|
|
|
|
|
|
|
|
|
|
|
|
|
|
|
|
|
|
|
|
|
|
|
|
|
|
| |||||||||||||||||||||||||||||||
Total 2011 | 2,046 | 2,005 | 251 | 135 | 575 | 909 | 11,362 | 4,376 | 4,376 | 6,564 | 6,564 | 33,242 | 2,133 | 41,293 | — | |||||||||||||||||||||||||||||||||||||||||||||
|
|
|
|
|
|
|
|
|
|
|
|
|
|
|
|
|
|
|
|
|
|
|
|
|
|
|
|
|
| |||||||||||||||||||||||||||||||
Total 2010 | 2,168 | 2,132 | 248 | 149 | 482 | 904 | 10,753 | 12,457 | — | — | 13,605 | 36,815 | 1,912 | — | 44,810 | |||||||||||||||||||||||||||||||||||||||||||||
|
|
|
|
|
|
|
|
|
|
|
|
|
|
|
|
|
|
|
|
|
|
|
|
|
|
|
|
|
| |||||||||||||||||||||||||||||||
| Thousands of euros | Change (%) | |||||||||||||||||||||||||||||||||||||||||||||||||||||||||||||||
| 2013 | 2012 | |||||||||||||||||||||||||||||||||||||||||||||||||||||||||||||||
| Fees Stipulated in the Bylaws | Other remuneration (b) | Total | Total(c) | |||||||||||||||||||||||||||||||||||||||||||||||||||||||||||||
| Annual retainer | Attendance fees | Executive director salary remuneration | ||||||||||||||||||||||||||||||||||||||||||||||||||||||||||||||
| Board | Executive committee | Audit and compliance committee | Appointments and remuneration committee | Board | Other fees | Fixed | Variable - immediate payment | Variable - deferred payment(a) | ||||||||||||||||||||||||||||||||||||||||||||||||||||||||
Directors | In cash | In shares | In cash | In shares | Total | |||||||||||||||||||||||||||||||||||||||||||||||||||||||||||
Emilio Botín | 85 | 170 | — | — | 33 | 5 | 1,344 | 282 | 282 | 424 | 424 | 2,757 | 1 | 3,051 | 3,061 | (0.3 | %) | |||||||||||||||||||||||||||||||||||||||||||||||
Javier Marín (1) | 57 | 115 | — | — | 15 | 3 | 1,600 | 500 | 500 | 750 | 750 | 4,100 | 51 | 4,341 | — | — | ||||||||||||||||||||||||||||||||||||||||||||||||
Fernando de Asúa | 113 | 170 | 40 | 24 | 33 | 199 | — | — | — | — | — | — | — | 579 | 567 | 2.1 | % | |||||||||||||||||||||||||||||||||||||||||||||||
Matías R. Inciarte | 85 | 170 | — | — | 30 | 160 | 1,710 | 462 | 462 | 692 | 692 | 4,018 | 265 | 4,729 | 5,154 | (8.2 | %) | |||||||||||||||||||||||||||||||||||||||||||||||
Guillermo de la Dehesa (2) | 104 | 170 | 27 | 24 | 33 | 36 | — | — | — | — | — | — | — | 394 | 320 | 23.3 | % | |||||||||||||||||||||||||||||||||||||||||||||||
Ana P. Botín | 85 | 170 | — | — | 25 | 4 | 2,005 | 442 | 442 | 664 | 664 | 4,217 | 339 | 4,840 | 5,140 | (5.8 | %) | |||||||||||||||||||||||||||||||||||||||||||||||
Francisco Javier Botín (3) | 85 | — | — | — | 28 | — | — | — | — | — | — | — | — | 113 | 108 | 4.7 | % | |||||||||||||||||||||||||||||||||||||||||||||||
Lord Burns (Terence) (4) | 85 | — | — | — | 19 | — | — | — | — | — | — | — | — | 103 | 106 | (1.9 | %) | |||||||||||||||||||||||||||||||||||||||||||||||
Vittorio Corbo | 85 | — | — | — | 21 | — | — | — | — | — | — | — | — | 106 | 106 | 0 | % | |||||||||||||||||||||||||||||||||||||||||||||||
Rodrigo Echenique | 85 | 170 | 40 | 24 | 33 | 111 | — | — | — | — | — | — | 30 | 493 | 415 | 18.7 | % | |||||||||||||||||||||||||||||||||||||||||||||||
Esther Giménez-Salinas (5) | 85 | — | — | — | 28 | 1 | — | — | — | — | — | — | — | 114 | 82 | 39.1 | % | |||||||||||||||||||||||||||||||||||||||||||||||
Ángel Jado | 85 | — | — | — | 30 | — | — | — | — | — | — | — | — | 115 | 110 | 4.6 | % | |||||||||||||||||||||||||||||||||||||||||||||||
Abel Matutes | 85 | — | 40 | — | 25 | 19 | — | — | — | — | — | — | — | 169 | 169 | 0 | % | |||||||||||||||||||||||||||||||||||||||||||||||
Juan R. Inciarte | 85 | — | — | — | 33 | 94 | 987 | 296 | 296 | 444 | 444 | 2,467 | 151 | 2,830 | 2,937 | (3.7 | %) | |||||||||||||||||||||||||||||||||||||||||||||||
Isabel Tocino (6) | 85 | 115 | — | 24 | 33 | 175 | — | — | — | — | — | — | — | 432 | 257 | 68.1 | % | |||||||||||||||||||||||||||||||||||||||||||||||
Juan Miguel Villar Mir (7) | 56 | — | — | — | 15 | — | — | — | — | — | — | — | — | 71 | — | — | ||||||||||||||||||||||||||||||||||||||||||||||||
Alfredo Sáenz (8) | 28 | 56 | — | — | 18 | 3 | 1,234 | — | — | — | — | 1,234 | 561 | 1,899 | 8,237 | (76.9 | %) | |||||||||||||||||||||||||||||||||||||||||||||||
Manuel Soto (8) | 37 | — | 13 | 8 | 15 | 64 | — | — | — | — | — | — | — | 137 | 352 | (61.2 | %) | |||||||||||||||||||||||||||||||||||||||||||||||
Francisco Luzón (9) | — | — | — | — | — | — | — | — | — | — | — | — | — | — | 130 | — | ||||||||||||||||||||||||||||||||||||||||||||||||
Antonio Basagoiti (10) | — | — | — | — | — | — | — | — | — | — | — | — | — | — | 115 | — | ||||||||||||||||||||||||||||||||||||||||||||||||
Antonio Escámez (10) | — | — | — | — | — | — | — | — | — | — | — | — | — | — | 118 | — | ||||||||||||||||||||||||||||||||||||||||||||||||
Luis Alberto Salazar-Simpson (10) | — | — | — | — | — | — | — | — | — | — | — | — | — | — | 44 | — | ||||||||||||||||||||||||||||||||||||||||||||||||
|
|
|
|
|
|
|
|
|
|
|
|
|
|
|
|
|
|
|
|
|
|
|
|
|
|
|
|
|
|
|
| |||||||||||||||||||||||||||||||||
Total 2013 | 1,415 | 1,308 | 158 | 103 | 468 | 874 | 8,880 | 1,982 | 1,982 | 2,974 | 2,974 | 18,792 | 1,398 | 24,517 | — | (10.9 | %) | |||||||||||||||||||||||||||||||||||||||||||||||
|
|
|
|
|
|
|
|
|
|
|
|
|
|
|
|
|
|
|
|
|
|
|
|
|
|
|
|
|
|
|
| |||||||||||||||||||||||||||||||||
Total 2012 | 1,464 | 1,287 | 168 | 119 | 409 | 900 | 9,952 | 2,278 | 2,278 | 3,419 | 3,419 | 21,347 | 1,833 | — | 27,528 | |||||||||||||||||||||||||||||||||||||||||||||||||
|
|
|
|
|
|
|
|
|
|
|
|
|
|
|
|
|
|
|
|
|
|
|
|
|
|
|
|
|
| |||||||||||||||||||||||||||||||||||
| (1) |
| (2) |
| Member of the audit and compliance committee and third deputy chairman since April 29, 2013. |
| (3) | Amounts delivered to the Fundación Botin. |
| (4) | Retired from the board on December |
| (5) | Board member since |
| (6) | Member of the risk committee since March 30, 2012 and of the executive committee since April 29, 2013. |
| (7) | Board member since May 7, 2013. |
| (8) | Retired from the board on April 29, 2013. |
| (9) | Retired from the board on January 23, 2012. |
| (a) | Maximum deferred variable remuneration for the period approved by the board of directors, at the related meetings, for each of the directors. |
| (b) | Includes, inter alia, the life and medical insurance costs borne by the Group relating to Bank directors. |
| (c) |
Following the amendment made by the Group in 2011 to its remuneration policy in order to adapt to the new European standards and recommendations on remuneration, the foregoing table was prepared including the maximum variable remuneration agreed for that year, regardless of the deferral of a portion thereof over several years and of the amount that will ultimately be received, since collection of the deferred amounts is subject to certain conditions being met. For comparison purposes, the figures for 2010 were prepared using consistent criteria.
156
Compensation to the board membersfor service on other boards as representatives of the Bank and to senior management
Representation on other boards
By resolution of the executive committee, all the remuneration received by the Bank’s directors who represent the Bank on the boards of directors of listed companies in which the Bank has a stake (at the expense ofand are paid by those companies) and which relatescompanies as well as remuneration relating to appointments made after March 18, 2002, will accrueaccrues to the Group. TheIn 2013 and 2012 the Bank’s directors did not receive any remuneration received in respect of representation duties of this kind, relating to appointments agreed upon before March 18, 2002, was as follows:for such representative duties.
| Thousands of euros | ||||||||||
Company | 2011 | 2010 | ||||||||
Antonio Escámez | Attijariwafa Bank Société Anonyme | — | 10.0 | |||||||
Emilio Botín ceased to discharge his duties as director of Shinsei Bank, Ltd. on June 23, 2009 and received compensation of €73.1 thousand.
Also, in 2008, 2007, 2006 and 2005, Emilio Botín received options to acquire shares of Shinsei Bank, Ltd. (Shinsei), as follows: 10,000 shares at a price of JPY 416 per share in 2008; 10,000 shares at a price of JPY 555 per share in 2007; 25,000 shares at a price of JPY 825 per share in 2006; and 25,000 shares at a price of JPY 601 per share in 2005. At December 31, 2011, the market price of the Shinsei share was JPY 80 and, therefore, regardless of the stipulated exercise periods, the options granted in those years would not have given rise to any gains had they been exercised.
Furthermore, otherThree directors of the Bank received a total of €1,413€1,184 thousand in 20112013 as members of the boards of directors of Group companies (2010: €741(2012: €1,317 thousand), the detail being as follows: Lord Burns received €600€736 thousand as non-executive chairman of the board of directors of the Group companies Santander UK plc and Alliance & Leicester plc; Antonio Basagoiti received €375 thousand as non-executive chairman of the board of directors of Banesto and in bylaws stipulated directors’ fees;Plc.; Matías R. Inciarte received €42 thousand as a non-executive director of U.C.I., S.A., and Vittorio Corbo received €107€406 thousand, of which he received €104 thousand as a non-executive director of Banco Santander Chile, and €289€284 thousand for advisory services provided to that bank.
157
Senior management
Following is a detail of the maximum aggregate remuneration approved for the Bank’s executive vice presidents (*) for 2011 and 2010:
| Number of managers (1) | Thousands of euros | |||||||||||||||||||||||||||||||||||
| Salaries | Other remuneration (4) | Total | ||||||||||||||||||||||||||||||||||
| Variable - Immediate payment | Variable - Deferred payment | |||||||||||||||||||||||||||||||||||
| Fixed | In cash | In shares | In cash | In shares | Total | |||||||||||||||||||||||||||||||
2010 | 23 | 23,756 | 28,484 | — | — | 26,697 | (2) | 78,937 | 5,510 | 84,447 | ||||||||||||||||||||||||||
2011 | 22 | 23,095 | 12,584 | (3) | 12,584 | 12,584 | 12,584 | 73,431 | 7,887 | 81,318 | ||||||||||||||||||||||||||
|
|
|
|
Following is a detail of the maximum number of Santander shares that the Bank’s executive vice presidents (excluding executive directors) were entitled to receive at December 31, 2011 and 2010 under the various plans then in force (see Note 47 to our consolidated financial statements):
Maximum number of shares to be delivered | December 31, 2011 | December 31, 2010 | ||||||
Plan I11 | — | 1,226,754 | ||||||
Plan I12 | 1,468,762 | (1) | 1,468,762 | |||||
Plan I13 | 1,468,762 | (2) | 1,468,762 | |||||
First cycle of obligatory investment | — | 261,681 | ||||||
Second cycle of obligatory investment | 452,994 | 508,764 | ||||||
Third cycle of obligatory investment | 293,140 | 330,104 | ||||||
Deferred conditional delivery plan | 1,496,628 | (3) | 1,496,628 | |||||
Deferred variable remuneration plan | 2,119,944 | (4) | — | |||||
In 2011 and 2010, since the conditions established in the related deferred share-based remuneration schemes from prior years had been met, the following number of Santander shares were delivered to the executive vice presidents:
Number of shares delivered | 2011 | 2010 | ||||||
Plan I10 | — | 1,078,730 | ||||||
Plan I11 | 1,042,130 | (1) | — | |||||
First cycle of obligatory investment | 232,852 | — | ||||||
158
The actuarial liability recognized in respect of post-employment benefits earned by the Bank’s executive vice presidents totaled €267 million as of December 31, 2011 (December 31, 2010: €227 million). Settlements of €47 million took place in 2010. The net charge to the consolidated income statement amounted to €29 million in 2011 (2010: €31 million). Additionally, the total sum insured under life and accident insurance policies relating to this group amounted to €66 million at December 31, 2011 (December 31, 2010: €61 million).
Pension commitments, other insurance and other items of directors
In 2012, within the eventframework of pre-retirement or retirement, the executive directors have the right to receive supplementary pension benefits which may be externalizedmeasures implemented by the Bank.
In prior years,Group in order to mitigate the board of directors ofrisks arising from the Bank resolveddefined-benefit pension obligations payable to changecertain employees, which led to an agreement with the workers’ representatives to convert the defined-benefit obligations existing under the collective agreement into defined-contribution plans (see Note 25 to our consolidated financial statements), the contracts of the executive directors and the other members of the Bank’s senior management (the senior executives) granting themwhich provided for defined-benefit pension obligations were amended to convert these obligations into a defined-contribution employee welfare system, which was externalized to Santander Seguros y Reaseguros, Compañía Aseguradora, S.A. The new system grants the executive directors the right to receive a pension benefit upon retirement, regardless of whether or not they are in the Bank’s employ on that date, based on the date of retirement or pre-retirement, as appropriate,contributions made to optthe aforementioned system, and replaced the right to receive a pension supplement which had previously been payable to them upon retirement. The new system expressly excludes any obligation of the accrued pensions, or amounts similar thereto,Bank to the executive directors other than the conversion of the previous system into the new employee welfare system, which took place in 2012, and, as the formcase may be, the annual contributions to be made as described below5. In the event of an annuity or a lump sum, i.e. in one single payment. The board also resolved thatpre-retirement, the senior executivesexecutive directors who have not reachedexercised the retirement age may opt, after reaching the age of 60, and each year thereafter until the age of 64,option to receive their accrued pensions in the form of a lump sum which will be determined atare entitled to receive an annual retainer until the date of economic effect of exercising the option and which they (or their heirs,retirement.
The initial balance for each executive director in the event of death) will be entitlednew defined-contribution welfare system was that corresponding to receive when they retire or are declared disabled; any person who exercises this option must undertake not to take pre-retirement, retire early or retire, in all cases at his/her own request, within two years from the exercise date. In order to maintain the financial neutrality for the Group, the amount to be received in the form of a lump sum by the commitment beneficiary at the date of retirement must be the aliquot part of the market value of the assets assigned to coverin which the mathematical provisions offor the policy instrumenting these commitments to senior executivesrespective accrued obligations had been invested, at the date on which the former pension obligations were converted into the new welfare system6.
Following the aforementioned amendment, from 2013 onwards the Bank makes annual contributions to the employee welfare system for the benefit of economic effect of exercising the option. Theexecutive directors and senior executives, in proportion to their respective pensionable bases, until they leave the Group, or until their retirement from the Group, death or disability (including, as the case may be, during the pre-retirement period). No contributions are made for the executive directors and senior executives who, reach the age of 60 and, prior to the ageconversion of retirement, do not optthe defined-benefit pension obligations into the current defined-contribution employee welfare system, had exercised the option to receive their accrued pensions aspension rights in a lump sum, and who are still in service when reaching the age of retirement or who at the datesum.
The terms of the contract have passed the age of retirement must state whether they wish to opt for this form of benefit. The exercise of this option will mean, in all cases, that no further pension benefit will accrue and, from the date of economic effect of exercising the option, the lump sum to be received, which will be updated at the agreed-upon interest rate, will be fixed. Should the senior executive subsequently die whilst still in service and prior to retirement, the lump sum of the pension will correspond to his/her heirs. Lastly, the board of directors also regulatedemployee welfare system regulate the impact of the deferral of the computable variable remuneration on the determinationbenefit payments covered by the system upon retirement and, as the case may be, the withholding tax on shares arising from such remuneration.
In 2013, as a result of his appointment as chief executive officer, changes were introduced to the contract of Javier Marín with respect to the pension obligations (or similar amounts),stipulated in the form of an annuity or a lump sum, for pre-retirement, early retirement or normal retirement.
In 2009, Emilio Botín and Alfredo Sáenz, who had passed the age of retirement, exercised the option to receive their respective accrued pensions as a lump sum on the date of effective retirement.
In 2010, Matías R. Inciarte, who had reached the age of 60, exercised the option to receive his accrued pension as a lump sum on the date of effective retirement.
senior management contract. The total balance of supplementary pension obligations assumed by the Group over the years to its current and retired employees, which is covered mostly by in-house provisions amounted to €9,045 million as of December 31, 2011. This amount includes obligations to former directors of the Bank during the year who discharge (or have discharged) executive functions.
The following table provides information on the pension obligations assumed and covered by the Group in respect of the Bank’s executive directors:
| Thousands of euros | ||||||||
| 2011 | 2010 | |||||||
Emilio Botín | 25,400 | 25,029 | ||||||
Alfredo Sáenz | 87,758 | 86,620 | ||||||
Matías R. Inciarte | 45,224 | 44,560 | ||||||
Ana P. Botín | 31,856 | 31,329 | ||||||
Francisco Luzón | 63,608 | (*) | 55,950 | |||||
Juan R. Inciarte | 12,309 | 11,629 | ||||||
|
|
|
| |||||
| 266,155 | 255,117 | |||||||
|
|
|
| |||||
159
Since the aforementioned option has been exercised, the amounts included in the foregoing table in respect of the directors Emilio Botín, Alfredo Sáenz and Matías R. Inciarte are those relatingannual contribution to the aforementioned lump sums, and no further amounts will accrue to each of them in respect of pensions following the exercise of the aforementioned option. The lump sums are updated at the agreed-upon interest rate.
The other amounts in the foregoing table relate to the accrued present actuarial value of the future annual payments to be made by the Group. These amounts were obtained using actuarial calculations and cover the obligations to pay the respective pension supplements or lump sums. In the case of Ana P. Botín, these supplements or lump sums wereemployee welfare system is now calculated as 100%80% of the sum of theof: (i) fixed annual salary received at the date of effective retirement or, in her case, at the date of opting to receive the benefit in a lump sum plusremuneration; and (ii) 30% of the arithmeticalarithmetic mean of the last three gross amounts of variable salary payments received until that date. In addition,remuneration. Also, the pensionable base in relation to the death and permanent disability scheme provided for in his senior management contract is now 100% of fixed annual remuneration. Under his senior management contract, which is currently suspended, the annual contribution is 55% of his fixed remuneration, and the pensionable base in the caseevent of Francisco Luzón, to the amount thus calculated here will be added the amounts received by him in the year before retirementdeath or pre-retirement or, where appropriate, at the datedisability is 80% of opting to receive the benefithis fixed remuneration.
| 5 | As provided for in the contracts of the executive directors and members of senior management prior to their modification, Emilio Botín and Matías R. Inciarte had exercised the option to receive the accrued pensions -or amounts similar thereto- in the form of a lump sum (i.e. in a single payment), which meant that no further pension benefit would accrue to them from that time, and the lump sum to be received, which would be updated at the agreed-upon interest rate, was fixed. |
| 6 | In the case of Emilio Botín and Matías R. Inciarte, the initial balance corresponded to the amounts that were set when, as described above, they exercised the option to receive a lump sum, and includes the interest accrued on these amounts from that date. |
Following is a lump sum, in his capacity as a memberdetail of the board of directors or the committeesbalances relating to each of the Bank or of other consolidable Group companiescurrent executive directors under the new welfare system at December 31, 2013 and in the case of Juan R. Inciarte, 100% of the gross fixed annual salary received at the date of effective retirement or, where appropriate, at the date of optinginitial balances that corresponded to receive the benefit in a lump sum.
On January 23, 2012, Francisco Luzón took voluntary pre-retirement and resigned from his positions as director and executive vice president of the Bank and head of the America division, and opted to receive his accrued pre-retirement pension (€2.8 million) as a lump sum. This amount, which is included in the figure shown in the foregoing table, will be paid to him as follows: €2.5 millionthem in 2012 and €0.1 million each year in 2013, 2014 and 2015.on the conversion of their obligations:
Francisco Luzón retained his right to opt to receive his accrued retirement pension on reaching early retirement age as an annuity or a lump sum.
| Thousands of euros | ||||||||
| 2013 | 2012 | |||||||
Emilio Botín | 25,864 | 25,566 | ||||||
Javier Marín | 4,346 | (1) | — | |||||
Matías R. Inciarte | 46,058 | 45,524 | ||||||
Ana P. Botín | 37,202 | (2) | 34,941 | |||||
Juan R. Inciarte | 13,410 | 12,824 | ||||||
Alfredo Sáenz(3) | — | 88,174 | ||||||
|
|
|
| |||||
| 126,880 | 207,029 | |||||||
|
|
|
| |||||
| (1) | Includes both his rights under the welfare system described above and those to which he is entitled, for the period prior to his appointment as chief executive officer, under the executive pension scheme of which he became an inactive participant on his appointment. |
| (2) | Includes the amounts relating to the period of provision of services at Banesto, externalized with another insurance company. |
| (3) | In April 2013, upon his retirement, Alfredo Sáenz requested payment of the pensions to which he was entitled in a lump sum (€88.5 million gross). For such purpose, his pension rights were settled, in accordance with the applicable contractual and legal terms, through: i) the payment in cash of €38.2 million relating to the net amount of the pension calculated taking into account the fixed remuneration, and €12.2 million relating to the net amount of the pension calculated taking into account the accrued variable remuneration at the retirement date, and ii) the investment by Alfredo Sáenz of those €12.2 million in Santander shares (2,216,082 shares), which were deposited at the Bank on a restricted basis until April 29, 2018. |
The Group also continues to havehas pension obligations to other directors amounting to €39€18 million (December 31, 2010: €402012: €18 million). The payments made in 20112013 to the members of the board entitled to post-employment benefits amounted to €2.6€1.2 million (2010: €2.6(2012: €1.6 million).
PensionLastly, the contracts of the executive directors who had not exercised the option referred to above prior to the conversion of the defined-benefit pension obligations into the current welfare system include a supplementary welfare regime for the contingency of death (surviving spouse and child benefits) and permanent disability of serving directors.
The provisions recognized in 2013 and reversed in 2011 amounted to €7.8 million2012 for retirement pensions and €886 thousand, respectively (2010: €9.6 millionsupplementary benefits (surviving spouse and €7.4 million, respectively).child benefits, and permanent disability) were as follows:
| Thousands of euros | ||||||||
| 2013 | 2012 | |||||||
Emilio Botín | — | — | ||||||
Javier Marín | 2,006 | — | ||||||
Matías R. Inciarte | — | — | ||||||
Ana P. Botín | 1,443 | 2,078 | ||||||
Juan R. Inciarte | 609 | 78 | ||||||
Alfredo Sáenz | — | — | ||||||
|
|
|
| |||||
| 4,058 | 2,166 | |||||||
|
|
|
| |||||
The Group has taken out life insurance policies for the Bank’s directors, who will be entitled to receive benefits if they are declared disabled; in the event of death, the benefits will be payable to their heirs. The premiums paid by the Group are included in the ‘Other remuneration’Other remuneration column of the table shown in Note 5.a.iii to our consolidated financial statements. Also, the following table provides information on the sums insured for the Bank’s executive directors:
| Insured sum (Thousands of euros) | ||||||||||||||||
| Thousands of euros | 2013 | 2012 | ||||||||||||||
| 2011 | 2010 | |||||||||||||||
Emilio Botín | — | — | — | — | ||||||||||||
Alfredo Sáenz | 11,108 | 11,108 | ||||||||||||||
Javier Marín | 2,400 | — | ||||||||||||||
Matías R. Inciarte | 5,131 | 5,131 | 5,131 | 5,131 | ||||||||||||
Ana P. Botín | 988 | 1,403 | 6,000 | 6,000 | ||||||||||||
Francisco Luzón | 9,934 | 9,934 | ||||||||||||||
Juan R. Inciarte | 2,961 | 2,961 | 2,961 | 2,961 | ||||||||||||
Alfredo Sáenz | — | 11,108 | ||||||||||||||
|
|
|
| |||||||||||||
| 30,122 | 30,537 | 16,492 | 25,200 | |||||||||||||
|
|
|
| |||||||||||||
Additionally, the Group is responsible forother directors have life insurance policies for other executive directors,the cost of which is borne by the Group, the related insured sum being €3€1.4 million at December 31, 2011 (2010: €32013 (2012: €1.4 million).
160
Share-based payments to executive directors
The detailsFollowing is a description of the various share delivery plans instrumenting the directors’ share-based paymentdeferred variable remuneration. For more information on these plans granted to directors (seesee Note 47 to our consolidated financial statements) are as follows:statements:
i) Performance share plan
This plan involves successive three-year cycles of share deliveries to the beneficiaries, as part of their variable remuneration for the year in which each cycle begins, so that each year one cycle will begin and, from 2009 onwards, another cycle will also end. Following the changes implemented in 2011 to the remuneration policy for the executive directors, the latter ceaseceased to be beneficiaries of the cycle approved in 2011 and of any successive cycles approved.2011.
The table below shows the maximum number of optionsrights granted to each executive director in each cycle and the number of shares received in 20112012 and 20102013 under the I11I12 and I10I13 incentive plans (Plans I11I12 and I10)I13), respectively. As established in these plans, the number of shares received was determined by the degree of achievement of the targets to which each plan was tied to and all planstied. Plan I12 fell short of the maximum number and Plan I13 fell short of the minimum number.
161
| Options at January 1, 2010 | Options granted in 2010 (number) | Shares delivered in 2010 (number) | Options cancelled in 2010 (number) | Options at December 31, 2010 | Shares delivered in 2011 (number) | Options cancelled in 2011 (number) | Options at December 31, 2011 | Grant date | Share delivery deadline | |||||||||||||||||||||||||||||||||||||||||||||||||||||||||||||||||||
Plan I10: | ||||||||||||||||||||||||||||||||||||||||||||||||||||||||||||||||||||||||||||
Emilio Botín | 62,589 | — | (56,825 | ) | (5,764 | ) | — | — | — | — | 06/23/07 | 07/31/10 | ||||||||||||||||||||||||||||||||||||||||||||||||||||||||||||||||
Alfredo Sáenz | 164,894 | — | (149,707 | ) | (15,187 | ) | — | — | — | — | 06/23/07 | 07/31/10 | ||||||||||||||||||||||||||||||||||||||||||||||||||||||||||||||||
Matías R. Inciarte | 79,627 | — | (72,293 | ) | (7,334 | ) | — | — | — | — | 06/23/07 | 07/31/10 | ||||||||||||||||||||||||||||||||||||||||||||||||||||||||||||||||
Ana P. Botín (1) | 41,835 | — | (37,982 | ) | (3,853 | ) | — | — | — | — | 06/23/07 | 07/31/10 | ||||||||||||||||||||||||||||||||||||||||||||||||||||||||||||||||
Francisco Luzón | 67,029 | — | (60,856 | ) | (6,173 | ) | — | — | — | — | 06/23/07 | 07/31/10 | ||||||||||||||||||||||||||||||||||||||||||||||||||||||||||||||||
Juan R. Inciarte (2) | 64,983 | — | (58,998 | ) | (5,985 | ) | — | — | — | — | 06/23/07 | 07/31/10 | ||||||||||||||||||||||||||||||||||||||||||||||||||||||||||||||||
|
|
|
|
|
|
|
| |||||||||||||||||||||||||||||||||||||||||||||||||||||||||||||||||||||
| 480,957 | — | (436,661 | ) | (44,296 | ) | — | — | — | — | |||||||||||||||||||||||||||||||||||||||||||||||||||||||||||||||||||
|
|
|
|
|
|
|
| |||||||||||||||||||||||||||||||||||||||||||||||||||||||||||||||||||||
Plan I11: | ||||||||||||||||||||||||||||||||||||||||||||||||||||||||||||||||||||||||||||
Emilio Botín | 68,848 | — | — | — | 68,848 | 59,209 | (9,639 | ) | — | 06/21/08 | 07/31/11 | |||||||||||||||||||||||||||||||||||||||||||||||||||||||||||||||||
Alfredo Sáenz | 189,628 | — | — | — | 189,628 | 163,080 | (26,548 | ) | — | 06/21/08 | 07/31/11 | |||||||||||||||||||||||||||||||||||||||||||||||||||||||||||||||||
Matías R. Inciarte | 87,590 | — | — | — | 87,590 | 75,327 | (12,263 | ) | — | 06/21/08 | 07/31/11 | |||||||||||||||||||||||||||||||||||||||||||||||||||||||||||||||||
Ana P. Botín (1) | 46,855 | — | — | — | 46,855 | 40,295 | (3) | (6,560 | ) | — | 06/21/08 | 07/31/11 | ||||||||||||||||||||||||||||||||||||||||||||||||||||||||||||||||
Francisco Luzón | 77,083 | — | — | — | 77,083 | 66,291 | (10,792 | ) | — | 06/21/08 | 07/31/11 | |||||||||||||||||||||||||||||||||||||||||||||||||||||||||||||||||
Juan R. Inciarte | 50,555 | — | — | — | 50,555 | 43,477 | (7,078 | ) | — | 06/21/08 | 07/31/11 | |||||||||||||||||||||||||||||||||||||||||||||||||||||||||||||||||
|
|
|
|
|
|
|
| |||||||||||||||||||||||||||||||||||||||||||||||||||||||||||||||||||||
| 520,559 | — | — | — | 520,559 | 447,679 | (72,880 | ) | — | ||||||||||||||||||||||||||||||||||||||||||||||||||||||||||||||||||||
|
|
|
|
|
|
|
| Rights at January 1, 2012 | Shares delivered in 2012 (number) | Rights cancelled in 2012 (number) | Rights at December 31, 2012 | Shares delivered in 2013 (number) | Rights cancelled in 2013 (number) | Rights at December 31, 2013 | Grant date | Share delivery deadline | ||||||||||||||||||||||||||||||||||||||||||||||||||||||||||||
Plan I12: | ||||||||||||||||||||||||||||||||||||||||||||||||||||||||||||||||||||||||||||
Emilio Botín | 82,941 | — | — | — | 82,941 | — | — | 82,941 | 06/19/09 | 07/31/12 | 82,941 | 24,882 | (58,059 | ) | — | — | — | — | 06/19/09 | 07/31/12 | ||||||||||||||||||||||||||||||||||||||||||||||||||||||||
Alfredo Sáenz | 228,445 | — | — | — | 228,445 | — | — | 228,445 | 06/19/09 | 07/31/12 | 228,445 | 68,534 | (159,911 | ) | — | — | — | — | 06/19/09 | 07/31/12 | ||||||||||||||||||||||||||||||||||||||||||||||||||||||||
Matías R. Inciarte | 105,520 | — | — | — | 105,520 | — | — | 105,520 | 06/19/09 | 07/31/12 | 105,520 | 31,656 | (73,864 | ) | — | — | — | — | 06/19/09 | 07/31/12 | ||||||||||||||||||||||||||||||||||||||||||||||||||||||||
Ana P. Botín (1) | 56,447 | — | — | — | 56,447 | — | — | 56,447 | 06/19/09 | 07/31/12 | 56,447 | 16,934 | (2) | (39,513 | ) | — | — | — | — | 06/19/09 | 07/31/12 | |||||||||||||||||||||||||||||||||||||||||||||||||||||||
Francisco Luzón (4) | 92,862 | — | — | — | 92,862 | — | — | 92,862 | 06/19/09 | 07/31/12 | ||||||||||||||||||||||||||||||||||||||||||||||||||||||||||||||||||
Francisco Luzón(3) | 92,862 | — | (92,862 | ) | — | — | — | — | 06/19/09 | 07/31/12 | ||||||||||||||||||||||||||||||||||||||||||||||||||||||||||||||||||
Juan R. Inciarte | 60,904 | — | — | — | 60,904 | — | — | 60,904 | 06/19/09 | 07/31/12 | 60,904 | 18,271 | (42,633 | ) | — | — | — | — | 06/19/09 | 07/31/12 | ||||||||||||||||||||||||||||||||||||||||||||||||||||||||
|
|
|
|
|
|
|
|
|
|
|
|
|
|
| ||||||||||||||||||||||||||||||||||||||||||||||||||||||||||||||
| 627,119 | — | — | — | 627,119 | — | — | 627,119 | 627,119 | 160,277 | (466,842 | ) | — | — | — | — | |||||||||||||||||||||||||||||||||||||||||||||||||||||||||||||
|
|
|
|
|
|
|
|
|
|
|
|
|
|
| ||||||||||||||||||||||||||||||||||||||||||||||||||||||||||||||
Plan I13 | ||||||||||||||||||||||||||||||||||||||||||||||||||||||||||||||||||||||||||||
Emilio Botín | — | 82,941 | — | — | 82,941 | — | — | 82,941 | 06/11/10 | 07/31/13 | 82,941 | — | — | 82,941 | — | (82,941 | ) | — | 06/11/10 | 07/31/13 | ||||||||||||||||||||||||||||||||||||||||||||||||||||||||
Alfredo Sáenz | — | 228,445 | — | — | 228,445 | — | — | 228,445 | 06/11/10 | 07/31/13 | ||||||||||||||||||||||||||||||||||||||||||||||||||||||||||||||||||
Alfredo Sáenz(4) | 228,445 | — | — | 228,445 | — | (228,445 | ) | — | 06/11/10 | 07/31/13 | ||||||||||||||||||||||||||||||||||||||||||||||||||||||||||||||||||
Matías R. Inciarte | — | 105,520 | — | — | 105,520 | — | — | 105,520 | 06/11/10 | 07/31/13 | 105,520 | — | — | 105,520 | — | (105,520 | ) | — | 06/11/10 | 07/31/13 | ||||||||||||||||||||||||||||||||||||||||||||||||||||||||
Ana P. Botín (1) | — | 56,447 | — | — | 56,447 | — | — | 56,447 | 06/11/10 | 07/31/13 | 56,447 | — | — | 56,447 | — | (56,447 | ) | — | 06/11/10 | 07/31/13 | ||||||||||||||||||||||||||||||||||||||||||||||||||||||||
Francisco Luzón (4) | — | 92,862 | — | — | 92,862 | — | — | 92,862 | 06/11/10 | 07/31/13 | ||||||||||||||||||||||||||||||||||||||||||||||||||||||||||||||||||
Francisco Luzón(3) | 92,862 | — | (92,862 | ) | — | — | — | — | 06/11/10 | 07/31/13 | ||||||||||||||||||||||||||||||||||||||||||||||||||||||||||||||||||
Juan R. Inciarte | — | 60,904 | — | — | 60,904 | — | — | 60,904 | 06/11/10 | 07/31/13 | 60,904 | — | — | 60,904 | — | (60,904 | ) | — | 06/11/10 | 07/31/13 | ||||||||||||||||||||||||||||||||||||||||||||||||||||||||
|
|
|
|
|
|
|
|
|
|
|
|
|
|
| ||||||||||||||||||||||||||||||||||||||||||||||||||||||||||||||
| — | 627,119 | — | — | 627,119 | — | — | 627,119 | 627,119 | — | (92,862 | ) | 534,257 | — | (534,257 | ) | — | ||||||||||||||||||||||||||||||||||||||||||||||||||||||||||||
|
|
|
|
|
|
|
|
|
|
|
|
|
|
| ||||||||||||||||||||||||||||||||||||||||||||||||||||||||||||||
| (1) | Without prejudice to the Banesto shares corresponding to Ana P. Botín by virtue of the various Banesto Share-Based Incentive Plans approved by the shareholders at the general |
| (2) |
| In |
| Following his resignation on January 23, 2012, Francisco Luzón lost his entitlement arising from his participation in these plans since he did not meet all the conditions stipulated for the shares to be received. |
| (4) | Following his resignation on April 29, 2013, Alfredo Sáenz lost his entitlement arising from his participation in these plans since he did not meet all the conditions stipulated for the shares to be received. |
162
ii) Obligatory investment share plan
Pursuant to the Obligatoryobligatory investment share plan (see Note 47 to our consolidated financial statements), and also as part of the deferred share-based variable remuneration for each period, the current executive directors acquired, prior to February 29, 2008, February 28, 2009 and February 28, 2010, the current executive directors acquired as deferred share-based variable remuneration the number of Bank shares shown in the table below, which represented a costcorresponding to the second and third cycles of €1.5 million in 2008, €0.8 million in 2009 and €1.5 million in 2010.this plan. Executive directors who hold the shares acquired through the obligatory investment and remain in the Group’s employ for three years from the date on which the obligatory investment is made will beare entitled to receive the same number of Bank shares as that composing their initial obligatory investment.
The shareholders at the annual shareholders’general meeting of June 19, 2009 introduced, for the third cycle, ana requirement additional requirement to that of remaining in the Bank’sGroup’s employ, namely,which is that in the three-year period from the investment in the shares, none of the following circumstances may arise:should exist: (i) poor financial performance of the Group; (ii) breach by the beneficiary of the codes of conduct or other internal regulations, (including,including, in particular, risk regulations)those relating to risks, where applicable to the executive in question; or (iii) a material restatement of the Group’s financial statements, except ifwhen it is required pursuant to a change in accounting standards.
| Maximum number of shares to be delivered | ||||||||||||
Executive directors | 3rd Cycle 2010-2012 | 2nd Cycle 2009-2011 | 1st Cycle 2008-2010 | |||||||||
Emilio Botín | 20,515 | 19,968 | 16,306 | |||||||||
Alfredo Sáenz | 49,000 | 47,692 | 37,324 | |||||||||
Matías R. Inciarte | 25,849 | 25,159 | 20,195 | |||||||||
Ana P. Botín(1) | 18,446 | 16,956 | 13,610 | |||||||||
Francisco Luzón(2) | 28,434 | 27,675 | 22,214 | |||||||||
Juan R. Inciarte | 15,142 | 14,738 | 14,617 | |||||||||
|
|
|
|
|
| |||||||
| 157,386 | 152,188 | 124,266 | ||||||||||
|
|
|
|
|
| |||||||
| Maximum number of shares to be delivered (3) | ||||||||
| 3rd cycle 2010-2012 | 2nd cycle 2009-2011 | |||||||
Emilio Botín | 20,515 | 19,968 | ||||||
Javier Marín(1) | 11,092 | — | ||||||
Matías R. Inciarte | 25,849 | 25,159 | ||||||
Ana P. Botín(2) | 18,446 | 16,956 | ||||||
Juan R. Inciarte | 15,142 | 14,738 | ||||||
|
|
|
| |||||
| 91,044 | 76,821 | |||||||
|
|
|
| |||||
| (1) |
| (2) | The maximum number of shares |
Since the conditionconditions to retain the aforementioned shares acquired in the first cycle and the additional requirement to stay in the Group for three years had been complied with, in March 2011February 2012 and 2013, as approved by the board, at the proposal of the appointments and remuneration committee, the gross number of shares detailed inabove relating to the foregoing tablesecond and third cycles accrued to the executive directors, whichdirectors. This number is equivalentequal to the number of shares initially acquired by them. Also, the shares relating to the second cycle were delivered in February 2012, once compliance with the conditions for delivery thereof were satisfied -holding the shares acquired and remaining employed by the Group-.
The obligatory investment share plan ended in 2010.
iii) Deferred conditional delivery share plan
AtThe 2010 variable remuneration of the executive directors and Group executives or employees whose variable remuneration or annual bonus for 2010 exceeded, in general, meeting held on June 11, 2010,€300,000 (gross) was approved by the shareholders approvedboard of directors through the instrumentation of the first cycle of the deferred conditional delivery share plan, applicable to the variable remuneration for 2010 of the executive directors and executives and employees of Santander Group whose variable remuneration or annual bonus for 2010 generally exceeded €300,000 (gross), with a view to deferringwhereby a portion of the aforementioned variable remuneration or bonus is being deferred over a period of three years in whichfor it willto be paid, where appropriate, in Santander shares. Application of this cycle, insofar as it entails the delivery of shares to the plan beneficiaries, was authorized by the annual general meeting held on June 11, 2010.
In addition to the requirement that the beneficiary remains employed byremain in the Group,Group’s employ, with the exceptions included in the plan regulations, the accrual of the share-based deferred remuneration is conditional upon none of the following circumstances existing, in the opinion of the board of directors, during the period prior to each of the deliveries: (i) poor financial performance of the Group; (ii) breach by the beneficiary of internal regulations, including, in particular, those relating to risks; (iii) material restatement of the Group’s financial statements, except when it is required pursuant to a change in accounting standards; or (iv) significant changes in economic capital and the qualitative assessment of risk.
163
The share-based bonus will be deferred over three years and will be paid, where appropriate, in three instalments starting inafter the first year.
The number of shares allocated to eachthe executive directordirectors for deferral purposes, the shares delivered in 2012 (first third), in 2013 (second third) and the shares relating tothat were approved by the first ofboard for delivery in February 2014 (third third), once the three deliveries envisaged under this plan,conditions for receiving them have been met, are as follows:
| Number of shares deferred on bonus for 2010(2) | Number of shares delivered in 2012 (1st third) (2) | Number of shares delivered in 2013 (2nd third) (2) | Number of shares to be delivered in 2014 ( | ||||||||||||
Emilio Botín | 94,345 | 31,448 | 31,448 | 31,448 | ||||||||||||
| 12,583 | 12,583 | ||||||||||||||
Matías R. Inciarte | 135,188 | 45,063 | 45,063 | 45,063 | ||||||||||||
Ana P. Botín | 91,187 | 30,395 | ||||||||||||||
| ||||||||||||||||
Juan R. Inciarte | 61,386 | 20,462 | 20,462 | 20,462 | ||||||||||||
| Shares of Banesto, as authorized by the shareholders of that bank at the annual general meeting of February 23, 2011. On February 12, 2014, following the merger of Banesto with the Bank, Ana P. Botín received 19,240 shares of the Bank, equivalent to the 30,395 shares of Banesto authorized by the annual general meeting. |
| On January 23, 2012, Francisco Luzón took |
A detailed descriptionFurthermore, Alfredo Sáenz ceased to discharge his duties as director on April 29, 2013. In accordance with the plan regulations, Alfredo Sáenz received 104,150 shares in February 2014. Also, in both 2012 and 2013 he received 104,150 shares relating to the number of shares to which he was entitled as a result of the termsaccrual of the first cycleand second thirds of this plan is contained in our 2009 annual report on Form 20-F.the deferred portion of his 2010 bonus.
iv) Deferred conditional variable remuneration plan
The shareholders at the annual general meeting of June 17,bonuses for 2011, approved the first cycle of the deferred conditional variable remuneration plan in relation to the variable remuneration or bonus for 20112012 and 2013 of the executive directors and certain executives (including senior management) and employees who assume risks, perform control functions or receive an overall remuneration which putsplacing them on the same remuneration level as senior executives and employees who assume risks (all of themwhom are referred to as identified staff, in accordance with the Guidelines on Remuneration Policies and Practices approved by the Committee of European Banking Supervisors on December 10, 2010). were approved by the board of directors and instrumented, respectively, through the first, second and third cycles of the deferred conditional variable remuneration plan. Application of theses cycles, insofar as they entail the delivery of shares to the plan beneficiaries, was authorized, respectively, by the annual general meetings held on June 17, 2011, March 30, 2012 and March 22, 2013.
The purpose of this first cyclethese plans is to defer a portion of the variable remuneration or bonus of the beneficiaries thereof over a period of three years for it to be paid, where appropriate, in cash and in Santander shares; the other portion of the variable remuneration is also to be paid in cash and Santander shares, upon commencement of the cycle,cycles, in accordance with the rules set forth below.
The variable remuneration will be paid in accordance with the following percentages, based on the timing of the payment and the group to which the beneficiary belongs (the “immediate payment percentage” identifies the portion of the bonus for which payment is not deferred, and the “deferred percentage” identifies the portion of the bonus for which payment is deferred):
| Immediate payment percentage | Deferred percentage | Immediate payment percentage | Deferred percentage | |||||||||
Executive directors | 40% | 60% | 40 | % | 60 | % | ||||||
Division directors and other executives of the Group with a similar profile | 50% | 50% | 50 | % | 50 | % | ||||||
Other executives subject to supervision | 60% | 40% | 60 | % | 40 | % | ||||||
The payment of the deferred percentage of the bonus applicable in each case will be deferred over a period of three years and will be paid in thirds, within fifteen days following the anniversaries of the initial date (that on which the immediate payment percentage is paid) in 2013, 2014 and 2015 for the deferred remuneration of 2011; in 2014, 2015 and 2016 for the deferred remuneration of 2012; and in 2015, 2016 and 2017 for the deferred remuneration of 2013, 50% being paid in cash and 50% in shares, provided that the conditions listedindicated below are met.
164
In addition to the requirement that the beneficiary remains employed byremain in the Group,Group’s employ, with the exceptions included in the plan regulations, the accrual of the deferred remuneration is conditional upon none of the following circumstances existing in(in the opinion of the board of directors and following a proposal of the appointments and remuneration committeecommittee) during the period prior to each of the deliveries: (i) poor financial performance of the Group; (ii) breach by the beneficiary of internal regulations, including, in particular, those relating to risks; (iii) material restatement of the Group’s financial statements, except when it is required pursuant to a change in accounting standards; or (iv) significant changes in the Group’s economic capital or risk profile.
On eachUpon delivery, the beneficiaries will be paid an amount in cash equal to the dividends paid foron the amount deferred in shares plusand the interest on the amount deferred in cash. If theSantander Dividendo Elección scrip dividend scheme is applied, they will be paid the price offered by the Bank for the bonus share rights relating to those shares.
The maximum number of shares to be delivered is calculated taking into account the amount resulting from applying the applicable taxes and the volume-weighted average prices for the 15 trading sessions prior to the date on which the board of directors approves the bonus for the Bank’s executive directors for 2011.each year.
The table below shows the number of Santander shares allocatedassigned, as variable remuneration for 2011, 2012 and 2013, to each executive director, for 2011, distinguishing between those which have beenand the gross shares delivered to them in 2012 and those subject2013, by way of either immediate payment or deferred payment, in the latter case once the board had determined, at the proposal of the appointments and remuneration committee, that the third relating to a three-year deferral, is as follows:each plan had accrued:
Share-based variable | Maximum number of shares to be delivered at January 1, 2012 | Shares delivered in 2012 (immediate payment of 2011 variable remuneration) | 2012 variable remuneration (maximum number of shares to be delivered) | Maximum number of shares to be delivered at December 31, 2012 | Shares delivered in 2013 (immediate payment of 2012 variable remuneration) | Shares delivered in 2013 (deferred payment of 2011 variable remuneration) | 2013 variable remuneration (maximum number of shares to be delivered) | Maximum number of shares to be delivered at December 31, 2013 | ||||||||||||||||||||||||||||||||||||
Variable remuneration (2011) | ||||||||||||||||||||||||||||||||||||||||||||
Emilio Botín | 248,879 | (99,552 | ) | — | 149,327 | — | (49,776 | ) | — | 99,551 | ||||||||||||||||||||||||||||||||||
Javier Marín | 155,764 | (77,882 | ) | — | 77,882 | — | (25,961 | ) | — | 51,921 | ||||||||||||||||||||||||||||||||||
Matías R. Inciarte | 314,390 | (125,756 | ) | — | 188,634 | — | (62,878 | ) | — | 125,756 | ||||||||||||||||||||||||||||||||||
Ana P. Botín | 235,004 | (94,002 | ) | — | 141,002 | — | (47,001 | ) | — | 94,001 | ||||||||||||||||||||||||||||||||||
Juan R. Inciarte | 183,450 | (73,380 | ) | — | 110,070 | — | (36,690 | ) | — | 73,380 | ||||||||||||||||||||||||||||||||||
Francisco Luzón(1) | 327,490 | (130,996 | ) | — | 196,494 | — | (65,498 | ) | — | 130,996 | ||||||||||||||||||||||||||||||||||
Alfredo Sáenz(2) | 618,415 | (247,366 | ) | — | 371,049 | — | (123,683 | ) | — | 247,366 | ||||||||||||||||||||||||||||||||||
|
|
|
|
|
|
|
| |||||||||||||||||||||||||||||||||||||
| Maximum number of shares to be delivered | 2,083,392 | (848,934 | ) | — | 1,234,458 | — | (411,487 | ) | — | 822,971 | ||||||||||||||||||||||||||||||||||
| Immediate payment | Deferred payment |
|
|
|
|
|
|
|
| |||||||||||||||||||||||||||||||||||
| Total | ||||||||||||||||||||||||||||||||||||||||||||
Variable remuneration (2012) | ||||||||||||||||||||||||||||||||||||||||||||
Emilio Botín | 99,552 | 149,327 | 248,879 | — | — | 109,879 | 109,879 | (43,952 | ) | — | — | 65,927 | ||||||||||||||||||||||||||||||||
Alfredo Sáenz | 247,366 | 371,049 | 618,415 | |||||||||||||||||||||||||||||||||||||||||
Javier Marín | — | — | 116,908 | 116,908 | (58,454 | ) | — | — | 58,454 | |||||||||||||||||||||||||||||||||||
Matías R. Inciarte | 125,756 | 188,634 | 314,390 | — | — | 207,648 | 207,648 | (83,059 | ) | — | — | 124,589 | ||||||||||||||||||||||||||||||||
Ana P. Botín | 94,002 | 141,002 | 235,004 | — | — | 174,790 | 174,790 | (69,916 | ) | — | — | 104,874 | ||||||||||||||||||||||||||||||||
Francisco Luzón(1) | 130,996 | 196,494 | 327,490 | |||||||||||||||||||||||||||||||||||||||||
Juan R. Inciarte | — | — | 121,165 | 121,165 | (48,466 | ) | — | — | 72,699 | |||||||||||||||||||||||||||||||||||
Alfredo Sáenz(2) | — | — | 273,028 | 273,028 | (109,211 | ) | — | — | 163,817 | |||||||||||||||||||||||||||||||||||
|
|
|
|
|
|
|
| |||||||||||||||||||||||||||||||||||||
| — | — | 1,003,418 | 1,003,418 | (413,058 | ) | — | — | 590,360 | ||||||||||||||||||||||||||||||||||||
|
|
|
|
|
|
|
| |||||||||||||||||||||||||||||||||||||
Variable remuneration (2013) | ||||||||||||||||||||||||||||||||||||||||||||
Emilio Botín | — | — | — | — | — | — | 105,718 | 105,718 | ||||||||||||||||||||||||||||||||||||
Javier Marín | — | — | — | — | — | — | 187,125 | 187,125 | ||||||||||||||||||||||||||||||||||||
Matías R. Inciarte | — | — | — | — | — | — | 172,731 | 172,731 | ||||||||||||||||||||||||||||||||||||
Ana P. Botín | — | — | — | — | — | — | 165,603 | 165,603 | ||||||||||||||||||||||||||||||||||||
Juan R. Inciarte | 73,380 | 110,070 | 183,450 | — | — | — | — | — | — | 110,747 | 110,747 | |||||||||||||||||||||||||||||||||
|
|
|
|
|
|
|
|
|
|
| ||||||||||||||||||||||||||||||||||
| 771,052 | 1,156,576 | 1,927,628 | — | — | — | — | — | — | 741,924 | 741,924 | ||||||||||||||||||||||||||||||||||
|
|
|
|
|
|
|
|
|
|
| ||||||||||||||||||||||||||||||||||
| (1) | On January 23, 2012, Francisco Luzón took pre-retirement and resigned from his positions as director and head of the |
A detailed description of the terms of the first cycle of this plan is contained in our 2010 annual report on Form 20-F.
General description of long term incentive plan (or performance share plan), obligatory investment plan, deferred conditional delivery share plan and deferred conditional variable remuneration plan
Executive directors and the other members of the Bank’s senior management participate in the following plans:
1. Performance share plan;
2. Obligatory investment plan with matched deferred bonus in shares or matched deferred bonus plan;
3. Deferred conditional delivery share plan; and
4. Deferred conditional variable remuneration plan.
At the board meeting on March 26, 2007, following the report of the appointments and remuneration committee, the Bank’s directors approved a long-term incentive policy aimed at the Bank’s executive directors and certain executive personnel of the Bank and of other Santander Group companies. This policy, through which the deferred share-based variable remuneration is paid, includes Bank share-based payments, and its implementation requires, in conformity with the Spanish law and our Bylaws, specific resolutions to be adopted by the annual general shareholders meeting.
Were it necessary or advisable for legal, regulatory or other similar reasons, the delivery mechanisms described below may be adapted in specific cases without altering the maximum number of shares linked to the plan or the essential conditions to which the delivery thereof is subject. These adaptations may involve replacing the delivery of shares with the delivery of cash amounts of an equal value.
165
The plans shaping the aforementioned incentive policy are currently as follows: (i) performance share plan; (ii) obligatory investment share plan; (iii) deferred conditional delivery share plan and (iv) deferred conditional variable remuneration plan. The characteristics of the plans are set forth below:
In addition, the Bank had a long-term incentive plan (I-06 plan) which expired on January 15, 2009.
Under Spanish law and our Bylaws, the implementation of the share based plans requires specific resolutions of shareholders adopted at general shareholders’ meetings, which, to date, have been the following:
The shareholders acting at the general shareholders meeting of June 18, 2005, authorized a share option plan of the Bank (I-06 plan) tied to certain targets.
At the general shareholders’ meeting of June 23, 2007, the shareholders authorized the first two cycles of the performance shares plan (the I-09 and I-10 plans), the first cycle of the matched deferred bonus plan and the restricted shares plan, in the case of the latter for a 12-month period and up to a maximum of 2,189,004 shares. The maximum amount of all shares to be delivered by application of these programs was fixed at 28,144,334 shares (the 2007 Total Limit).
At the general shareholders’ meeting of June 21, 2008, the shareholders authorized the third cycle of the performance shares plan (the I-11 plan), the second cycle of the matched deferred bonus plan and the restricted shares plan, in the case of the latter for a 12-month period and up to a maximum of 1,900,000 shares. The maximum amount of all shares to be delivered by application of these programs was fixed at 19,960,000 shares (the 2008 Total Limit).
At the general shareholders’ meeting held on June 19, 2009, the shareholders authorized the fourth cycle of the performance shares plan (the I-12 plan), the third cycle of the matched deferred bonus plan and the restricted shares plan. In the case of the latter, the authorization was for a 12-month period and for up to a maximum of 2,478,000 shares. The aggregate maximum amount of shares to be delivered pursuant to these programs was fixed at 26,027,580 shares (the 2009 Total Limit).
At the general shareholders’ meeting held on June 11, 2010, the shareholders authorized the fifth cycle of the performance shares plan (the I-13 plan), the first cycle of deferred conditional delivery share plan and the restricted shares plan, in the case of the latter for a 12-month period and up to a maximum of 2,500,247 shares. The aggregate maximum amount of shares to be delivered pursuant to these programs was fixed at 25,028,650 shares (the 2010 Total Limit).
At the general shareholders’ meeting held on June 17, 2011, the shareholders authorized the sixth cycle of the performance shares plan (the I-14 plan), the second cycle of the deferred conditional delivery share plan and the first cycle of deferred conditional variable remuneration plan. The maximum amount of shares to be delivered pursuant to the sixth cycle of the performance shares plan (the I-14 plan) was fixed at 19,000,000 shares. The maximum amount of shares to be delivered pursuant to the second cycle of the deferred conditional delivery share plan has been determined by dividing the maximum amount estimated by the board of directors to defer in shares of the global bonus for financial year 2011 of the beneficiaries of this cycle (40 million euros) by the share price of Santander which will be calculated as the average weighted daily volume of the average weighted listing prices of the relevant Santander shares for the fifteen trading sessions prior to the date on which the board of directors approves the bonus for the executive directors of the Bank for financial year 2011 (5.675 euros per share). The maximum amount of shares to be delivered pursuant to the first cycle of deferred conditional variable remuneration plan has, after deducting applicable taxes (or withholding), been determined by dividing the maximum amount estimated by the board of directors to deliver in shares to the beneficiaries (165 million euros and out of which 17.5 million for executive directors) by the share price of Santander which will be calculated as the average weighted daily volume of the average weighted listing prices of the relevant Santander for the fifteen trading sessions prior to the date on which the board of directors approves the bonus for the executive directors of the Bank for financial year 2011 (5.675 euros per share).
166
At the general shareholders’ meeting held on March 30, 2012, the shareholders authorized the third cycle of the deferred conditional delivery share plan and the second cycle of deferred conditional variable remuneration plan. The maximum amount of shares to be delivered pursuant to the third cycle of the deferred conditional delivery share plan will be determined, after deducting applicable taxes (or withholdings), by dividing the maximum amount estimated by the board of directors to be deferred in shares of the global bonus for financial year 2012 of the beneficiaries (22 million euros) by the share price of Santander which will be calculated as the average weighted daily volume of the average weighted listing prices of Santander shares for the fifteen trading sessions prior to the date on which the board of directors approves the bonus for the executive directors of the Bank for financial year 2012. The maximum amount of shares to be delivered pursuant to the second cycle of deferred conditional variable remuneration plan will be determined by dividing, after deducting applicable taxes (or withholdings), the maximum amount estimated by the board of directors of the bonus for the financial year 2012 to be delivered in shares for the beneficiaries (140 million and out of which 12.1 million for executive directors) by the share price of Santander which will be calculated as the average weighted daily volume of the average weighted listing prices of Santander shares for the fifteen trading sessions prior to the date on which the board of directors approves the bonus for the executive directors of the Bank for financial year 2012.
I-06 plan
At the general shareholders’ meeting held on June 18, 2005, a long-term incentive plan (the I-06 plan) for executive directors, which consisted of options on shares of the Bank and was tied to two pre-determined targets (increase in the trading price of the Bank’s shares and growth in earnings per share – in both cases above a sampling of comparable banks), was approved. The appointments and remuneration committee and the board of directors at their meetings on March 26, 2007 each took note of compliance with the conditions to which the plan was subject giving participants the right to exercise options to purchase shares of the Bank during the period between January 15, 2008 and January 15, 2009.
Options not exercised as of January 15, 2009 expired without value and this plan was cancelled at December 31, 2009.
1. Performance shares plan
The performance shares plan is implemented with a multiannual incentive plan, which is payable in shares of the Bank. The beneficiaries of the plan are the executive directors and other members of senior management, together with any other Group executives determined by the board of directors or, when delegated by the board, the executive committee.
This plan involves successive three-year cycles of share deliveries to the beneficiaries, so that each year one cycle will begin and, from 2009 onwards, another cycle will also end. The aim is to establish an adequate sequence between the end of the incentive program linked to the previous I-06 plan and the successive cycles of this plan. Thus, the first two cycles commenced in July 2007, the first cycle having a duration of two years (PI09) and the second cycle having a standard three-year term (PI10). In June 2008, 2009, 2010 and 2011 the third, fourth, fifth and sixth cycles of the performance share plan (PI11, PI12, PI13 and Pl14, respectively) were approved. On July 31, 2009, 2010 and 2011 the first, second and third cycles (Pl09, Pl10 and Pl11) were cancelled.
For each cycle a maximum number of shares is established for each beneficiary who remains in the Group’s employ for the duration of the plan. The target, which, if met, will determine the number of shares to be delivered is defined by comparing the Group’s performance with that of a benchmark group of financial institutions and is linked to only one parameter, the Total Shareholder Return (TSR). With regard to the plans approved until June 2008, the targets, which, if met, determined the number of shares to be delivered, were defined by comparing the Group’s performance with that of a benchmark group of financial institutions and were linked to two parameters, namely Total Shareholder Return (TSR) and growth in Earnings per Share (EPS).
The ultimate number of shares to be delivered will be determined in each of the cycles by the degree of achievement of the targets on the third anniversary of commencement of each cycle (with the exception of the first cycle, for which the second anniversary was considered), and the shares will be delivered within a maximum period of seven months from the beginning of the year in which the cycle ends.
For more information, see Note 47 c) (i) to our consolidated financial statements.
At December 31, 2011, there were three cycles in effect: I-12, I-13 and I-14 plans. The table below describes the number of participants and the maximum number of shares to be distributed.
167
| Number of shares | Year granted | Number of persons | Date granted | Deadline for delivery of shares | ||||||||||||||||
Plans in effect at December 31, 2011 | 54,765,213 | |||||||||||||||||||
Of which: | ||||||||||||||||||||
I-12 plan | 18,866,927 | 2009 | 6,510 | June 19, 2009 | July 31, 2012 | |||||||||||||||
I-13 plan | 19,612,616 | 2010 | 6,782 | June 11, 2010 | July 31, 2013 | |||||||||||||||
I-14 plan | 16,285,670 | 2011 | 6,500 | June 17, 2011 | July 31, 2014 | |||||||||||||||
Previous cycles of the performance share plan
A detailed description of the terms of the third cycle (I-11 plan) is contained in our 2008 annual report on Form 20-F.
A detailed description of the terms of the fourth cycle (I-12 plan) is contained in our 2009 annual report on Form 20-F.
A detailed description of the terms of the fifth cycle (I-13 plan) is contained in our 2010 annual report on Form 20-F.
A detailed description of the terms of the sixth cycle (I-14 plan) is contained in our 2010 annual report on Form 20-F.
2. Obligatory investment plan with matched deferred bonus in shares or matched deferred bonus plan
The matched deferred bonus plan is implemented via the multiannual incentive plan, which is payable in shares of the Bank and is conditional upon compliance with certain investment and continued service requirements.
The current beneficiaries of the plan are the Group’s top executives, who include the executive directors, non-director members of senior management and other executives.
This plan, which was discontinued in 2010, is structured in three-year cycles which start each year. The beneficiaries of the plan must use 10% of their gross annual variable cash-based remuneration (or bonus) to acquire shares of the Bank in the market (the “Obligatory Investment”). As resolved by the shareholders at the relevant general shareholders’ meeting, the Obligatory Investments were made before February 29, 2008, February 28, 2009 and February 28, 2010, respectively.
Participants who hold the shares acquired through the obligatory investment and remain in the Group’s employ for three years from the date on which the obligatory investment is made will be entitled to receive the same number of Bank shares as that composing their initial obligatory investment.
The shares will be delivered within a period of one month from the third anniversary of the date on which the obligatory investment was made.
The shareholders at the annual general meeting of June 19, 2009 introduced, for the third cycle, a requirement additional to that of remaining in the Group’s employ, which is that in the three-year period from the investment in the shares, none of the following circumstances should concur: (i) poor financial performance of the Group; (ii) breach by the beneficiary of the codes of conduct or other internal regulations, including, in particular, those relating to risks that is applicable to the executive in question; or (iii) a material restatement of the Group’s financial statements, except when it is required pursuant to a change in accounting standards.
As of the date of this report, there is in effect one cycle of this plan (third cycle), whose main terms of which are described in our 2009 annual report on Form 20-F.
3. Deferred conditional delivery share plan
At the annual general meeting held on June 11, 2010, the shareholders approved the first cycle of the deferred conditional delivery share plan. This deferred share-based variable remuneration is instrumented through a multiannual incentive plan, which is payable in shares of the Bank. The beneficiaries of the plan are the executive directors and executives and employees of the Group whose variable remuneration or annual bonus for 2010 generally exceeded €0.3 million (gross), with a view to deferring a portion of the aforementioned variable remuneration or bonus over a period of three years in which it will be paid in Santander shares.
168
The share-based bonus is deferred over three years and will be paid, where appropriate, in three instalments starting in the first year. The amount in shares is calculated based on the tranches of the following scale established by the board of directors on the basis of the gross variable cash-based remuneration or annual bonus for 2010:
| (2) | ||||
| ||||
| ||||
| ||||
| ||||
| ||||
| ||||
The condition for accrual of the share-based deferred remuneration was, in addition to that of the beneficiary remaining employed by the Group, with the exceptions envisaged in the plan regulations, that none of the following circumstances should occur in the period prior to each of the deliveries: (i) poor financial performance of the Group; (ii) breach by the beneficiary of the codes of conduct or other internal regulations, including, in particular, those relating to risks, where applicable to the executive in question; (iii) material restatement of the Group’s financial statements, except when it is required pursuant to a change in accounting standards; or (iv) significant changes in economic capitalthe deferred variable remuneration for 2012) and the qualitative assessment of risk.
The shareholders at the annual general meeting on June 17, 2011 approved the second cycle of this plan. The beneficiaries are the executives or employees of the Group whose variable remuneration or annual bonus for 2011 generally exceeds €0.3 million (gross), with a view to deferring a portion of the aforementioned variable remuneration or bonus over a period of three years in which it will be paid in Santander shares. This second cycle is not applicable to executive directors or other senior executives and other executives who are beneficiaries of the deferred conditional variable remuneration plan described below.
The share-based bonus is deferred over three years and will be paid, where appropriate, in three instalments starting in the first year. The amount in shares (one delivery of 123,683 shares is calculated based on the tranches of the following scale established by the board of directors on the basis of the gross variable cash-based remuneration or annual bonus for 2011:
| ||||
| ||||
| ||||
| ||||
The condition for accrual of the share-based deferred remuneration was, in addition to that of the beneficiary remaining employed by the Group, with the exceptions envisaged in the plan regulations, that none of the following circumstances should occur in the period prior to each of the deliveries: (i) poor financial performance of the Group; (ii) breach by the beneficiary of internal regulations, including, in particular, those relating to risks; (iii) material restatement of the Group’s financial statements, except when it is required pursuant to a change in accounting standards; or (iv) significant changes in the Group’s economic capital or risk profile.
169
At the annual general meeting held on March 30, 2012, the shareholders approved the third cycle of the deferred conditional delivery share plan, which is subject to the following rules:
This Plan (also known as the 2012 Variable Remuneration Plan for Other Executives) applies in relation to the variable remuneration or bonus for financial year 2012 approved by the board of directors, or the appropriate body in each case, for the executives or employees of the Grupo Santander whose gross variable remuneration or annual bonus for 2012 is generally above 300,000 euros, in order to defer a portion of said variable remuneration or bonus for payment, if any, within a three-year period in Santander shares, in accordance with the rules set forth below. This Plan does not apply to the executive directors, other members of senior management or other executives who are beneficiaries of the second cycle of the Deferred and Conditional Variable Remuneration Plan (described below).
170
II.Operation
In addition to the beneficiary remaining with Grupo Santander3, the accrual of deferred remuneration in the form of shares is conditional upon none of the following circumstances existing during the period prior to each of the deliveries, in the opinion of the board of directors and following a proposal of the appointments and remuneration committee:
The deferral of the bonus in shares will last for a period of three years and will be paid, where applicable, in thirds from the first year on.
The amount to be deferred in shares shall generally be calculated in accordancecorresponding maturity dates, together with the tranches in the following scale set by the board of directors based on the gross amount of variable remuneration or annual bonus for financial year 2012:
| the | |||
| ||||
| ||||
| ||||
Upon each delivery of shares, and thusthe shares (dividends and amounts offered for the bonus share rights if theSantander Dividendo Elección scrip dividend scheme is applied) and the interest accrued on the cash amounts, subject to compliance with the same requirements the beneficiary will be paid an amount in cash equal to the dividends paid on such shares from the date of payment of the bonus and through the time of delivery, whether on the first, second or third anniversary. In cases of application of the Santander Scrip Dividend Program (Programa Santander Dividendo Elección), the price offered by the Bank for the free allotment rights corresponding to such shares will be paid.
The beneficiaries of this 2012 Variable Remuneration Plan for Other Executives may not directly or indirectly hedge the shares prior to the delivery thereof.
|
In
Furthermore, the eventtable below shows the cash delivered in 2012 and 2013, by way of death, the right shall pass to the successors of the beneficiary.
In cases of justified temporary leave due to temporary disability, suspension of the contract due to maternityeither immediate payment or paternity, or leave to care for children or a relative, there shall be no changedeferred payment, in the rights of the beneficiary.
If the beneficiary goes to another company of the Santander Group (including through international assignment and/or expatriation), there will be no change in the rights thereof.
If the employment relationship terminates by mutual agreement or because the beneficiary obtains a leave not referred to in any of the preceding paragraphs, the terms of the termination or temporary leave agreement shall apply.
None of the above circumstances shall give the right to receive the deferred amount in advance. If the beneficiary or the successors thereof maintain the right to receive deferred remuneration in shares (as well as the respective dividends), such remuneration shall be delivered within the periods and upon the terms set forth in the plan rules.
171
III.Maximum number of shares to be delivered
Taking into account that, in application of the scale above,latter case once the board of directors has estimated that the maximum amount to be deferred in shares of the global bonus for financial year 2012 of the beneficiaries of this 2012 Variable Remuneration Plan for Other Executives is 22 million euros (the “Maximum Amount Distributable in Shares”), the maximum number of Santander shares that may be delivered under this plan (the “Share Limit for the 2012 Variable Remuneration Plan of Other Executives”) will behad determined, by applying the following formula:
| ||
where “Santander Share Price” will be the average weighted daily volume of the average weighted listing prices of the relevant Santander shares for the fifteen trading sessions prior to the date on which the board of directors approves the bonus for the executive directors of the Bank for financial year 2012.
IV.Other rules
In the event of a change in the number of shares due to a decrease or increase in the par value of the shares or a transaction with an equivalent effect, the number of shares to be delivered will be modified so as to maintain the percentage of the total share capital represented by them.
Information from the stock exchange with the largest trading volume shall be used to determine the listing price of the share.
If necessary or appropriate for legal, regulatory or similar reasons, the delivery mechanisms provided for herein may be adapted in specific cases without altering the maximum number of shares linked to the plan or the basic conditions upon which the delivery thereof is made contingent. Such adaptations may include the substitution of the delivery of shares for the delivery of equivalent amounts in cash.
The shares to be delivered may be owned by the Bank or by any of its subsidiaries, be newly-issued shares, or be obtained from third parties that have signed agreements to ensure that the commitments made will be met.
4. Deferred conditional variable remuneration plan
The shareholders at the annual general meeting of June 17, 2011 approved the first cycle of the deferred conditional variable remuneration plan in relation to the variable remuneration or bonus for 2011 of the executive directors and certain executives (including senior management) and employees who assume risks, perform control functions or receive an overall remuneration which puts them on the same remuneration level as senior executives and employees who assume risks (all of them are referred to asidentified staff, in accordance with the Guidelines on Remuneration Policies and Practices approved by the Committee of European Banking Supervisors on December 10, 2010).
The purpose of this first cycle is to defer a portion of the variable remuneration or bonus of the beneficiaries thereof over a period of three years for it to be paid, where appropriate, in cash and in Santander shares; the other portion of the variable remuneration is also to be paid in cash and Santander shares, upon commencement of the cycle, in accordance with the rules set forth below:
The variable remuneration will be paid in accordance with the following percentages, based on the timing of the payment and the group to which the beneficiary belongs (the “immediate payment percentage” identifies the portion of the bonus for which payment is not deferred, and the “deferred percentage” identifies the portion of the bonus for which payment is deferred):
| Immediate payment percentage | Deferred percentage | |||||||
Executive directors | 40 | % | 60 | % | ||||
Division directors and other executives of the Group with a similar profile | 50 | % | 50 | % | ||||
Other executives subject to supervision | 60 | % | 40 | % | ||||
172
The payment of the deferred percentage of the bonus applicable in each case will be deferred over a period of 3 years and will be paid in thirds, within fifteen days following the anniversaries of the initial date in 2013, 2014 and 2015, 50% being paid in cash and 50% in shares, provided that the conditions described in the paragraph below are met.
In addition to the requirement that the beneficiary remains employed by the Group, with the exceptions included in the plan regulations, the accrual of the deferred remuneration is conditional upon none of the following circumstances existing in the opinion of the board of directors and following a proposal of the appointments and remuneration committee during the period prior to each of the deliveries: (i) poor financial performance of the Group; (ii) breach by the beneficiary of internal regulations, including, in particular, those relating to risks; (iii) material restatement of the Group’s financial statements, except when it is required pursuant to a change in accounting standards; or (iv) significant changes in the Group’s economic capital or risk profile.
On each delivery, the beneficiaries will be paid an amount in cash equal to the dividends paid for the deferred amount in shares and the interest on the amount accrued in cash.
The maximum number of shares to be delivered is calculated taking into account the amount resulting from applying the applicable taxes and the volume-weighted average prices for the 15 trading sessions prior to the date on which the board of directors approves the bonus for the Bank’s executive directors for 2011.
At the annual general meeting held on March 30, 2012, the shareholders approved the second cycle of the deferred conditional variable remuneration plan, which is subject to the following rules:
I.Purpose and Beneficiaries
This Plan (also known as the 2012 Variable Remuneration Plan of the Supervised Group) applies in relation to the variable remuneration or bonus for financial year 2012 approved by the board of directors, or the appropriate body in each case, for executive directors and certain executives (including senior management) and employees whose professional activities have a significant impact on the Bank’s risk profile, who perform control functions or receive overall remuneration which puts them at the same remuneration level as senior executives, and employees whose professional activities have a significant impact on the risk profile of the entity (all of whom are referred to asidentified staff in accordance with the aforementioned Guidelines on Remuneration Policies and Practices approved by the Committee of European Banking Supervisors on December 10, 2010).
The number of beneficiaries is approximately 270 persons, who are distributed into three groups for purposes of this second cycle: “Executive Directors,” which consists of directors of the Bank performing executive duties; “Division Directors,” consisting of division directors and other executives of the Group with a similar profile, and “Other Executives Subject to Supervision,” composed of other executives who are beneficiaries of this second cycle.
The purpose of this 2012 Variable Remuneration Plan of the Supervised Group is to defer a portion of the variable remuneration or bonus of the beneficiaries thereof for a period of three years, with any payment thereof being made in cash and in Santander shares, also paying the other portion of such variable remuneration in cash and Santander shares upon commencement, all in accordance with the rules set forth below.
II.Operation
The total variable remuneration (bonus) of the beneficiaries for financial year 2012 shall be paid according to the following percentages, depending on the time of payment and on the group to which the beneficiary belongs (the “Immediate Payment Percentage,” to identify the portion of the bonus payment of which is not deferred, and the “Deferred Percentage,” to identify the portion of the bonus payment of which is deferred):
| Immediate Payment Percentage | Deferred Percentage | |||||||
Executive directors | 40 | % | 60 | % | ||||
Division directors and other executives of the Group with a similar profile | 50 | % | 50 | % | ||||
Other executives subject to supervision | 60 | % | 40 | % | ||||
173
Taking into account the foregoing, the total variable remuneration (bonus) for financial year 2012 of the beneficiaries of this 2012 Variable Remuneration Plan of the Supervised Group shall be paid as follows:
In addition to the beneficiary remaining with the Grupo Santander4, the accrual of deferred remuneration is conditional upon none of the following circumstances existing during the period prior to each of the deliveries, in the opinion of the board of directors and following a proposal of the appointments and remuneration committee:
The board of directors, at the proposal of the appointments and remuneration committee, and depending onthat the degree of compliance with such conditions, shall determine the specific amount of the deferred remunerationthird relating to be paid on each occasion.plan had accrued:
If the foregoing requirements are met on each Anniversary, the beneficiaries shall receive the cash and the shares, in thirds, within 30 days of the first, second and third Anniversary.
On the occasion of each delivery of shares and cash and, therefore, subject to the same requirements, the beneficiary shall be paid an amount in cash equal to the dividends paid on the deferred amount in shares of the annual bonus and the interest accrued on the deferred cash amount of the annual bonus, in both cases from the Initial Date until the date of payment of the shares and cash in each applicable case. In cases of application of the Santander Scrip Dividend Program (Programa Santander Dividendo Elección), the price paid will be that offered by the Bank for the free allotment rights corresponding to such shares.
| Thousands of euros | ||||||||||||
| 2013 | 2012 | |||||||||||
| Cash paid (immediate payment of 2012 variable remuneration) | Cash paid (1st third deferred payment of 2011 variable remuneration) | Cash paid (immediate payment of 2011 variable remuneration) | ||||||||||
Emilio Botín | 282 | 282 | 565 | |||||||||
Javier Marín | 376 | 147 | 442 | |||||||||
Matías R. Inciarte | 534 | 357 | 714 | |||||||||
Ana P. Botín | 449 | (1) | 286 | (1) | 534 | (1) | ||||||
Juan R. Inciarte | 311 | 208 | 416 | |||||||||
Francisco Luzón | — | 371 | 743 | |||||||||
Alfredo Sáenz | 702 | 702 | 1,404 | |||||||||
|
|
|
|
|
| |||||||
| 2,654 | 2,353 | 4,818 | ||||||||||
|
|
|
|
|
| |||||||
|
Compensation for the senior management who are not also executive directors on our board
Following is a detail of the maximum remuneration approved for the Bank’s executive vice presidents (*) in 2013 and 2012:
| Number of managers (1) | Thousands of euros | |||||||||||||||||||||||||||||||||||
| Salaries | Other remuneration (3) | Total | ||||||||||||||||||||||||||||||||||
| Fixed | Variable - Immediate payment | Variable -Deferred payment(2) | Total | |||||||||||||||||||||||||||||||||
| In cash | In shares | In cash | In shares | |||||||||||||||||||||||||||||||||
2013 | 28 | 26,040 | 9,521 | 9,521 | 9,588 | 9,588 | 64,257 | 8,416 | 72,673 | |||||||||||||||||||||||||||
2012 | 24 | 24,580 | 10,689 | 10,689 | 10,769 | 10,769 | 67,495 | 6,615 | 74,111 | |||||||||||||||||||||||||||
| (*) | Excluding executive directors’ remuneration, which is detailed above. |
| (1) | At some point in the year they occupied the position of executive vice president. The amounts reflect the remuneration for the full year regardless of the number of months in which the position of executive vice president was occupied. |
| (2) | The shareholders at the annual general meetings of March 30, 2012 and March 22, 2013 approved the second and third cycles of the deferred conditional variable remuneration plan, whereby payment of a portion of the variable remuneration for 2012 and 2013 will be deferred over three years for it to be paid, where appropriate, in three equal portions, 50% in cash and 50% in Santander shares, provided that the conditions for entitlement to the remuneration are met. The amount of the immediate payment in shares for 2013 relates to 1,331,781 Santander shares and 165,100 Banco Santander |
| (3) | Includes other remuneration items, such as life insurance premiums amounting to |
In the eventFollowing is a detail of death, the right shall pass to the successors of the beneficiary.
In cases of justified temporary leave due to temporary disability, suspension of the contract due to maternity or paternity, or leave to care for children or a relative, there shall be no change in the rights of the beneficiary.
If the beneficiary goes to another company of the Santander Group (including through international assignment and/or expatriation), there will be no change in the rights thereof.
If the employment relationship terminates by mutual agreement or because the beneficiary obtains a leave not referred to in any of the preceding paragraphs, the terms of the termination or temporary leave agreement shall apply.
None of the above circumstances shall give the right to receive the deferred amount in advance. If the beneficiary or the successors thereof maintain the right to receive deferred remuneration in shares and in cash (as well as applicable dividends and interest), such remuneration shall be delivered within the periods and upon the terms set forth in the plan rules.
174
III.Maximum number of shares to be delivered
The final number of shares delivered to each beneficiary will be calculated taking into account: (i) the amount resulting from applying applicable taxes (or withholdings); and (ii) the average weighted daily volume of the average weighted listing prices for the fifteen trading sessions prior to the date on which the board of directors approves the bonus for the executive directors of the Bank for financial year 2012.
Taking into account that the maximum amount estimated by the board of directors of the bonus to be delivered in shares to the beneficiaries of the 2012 Variable Remuneration Plan of the Supervised Group is 140 million euros (the “Maximum Amount of Variable Remuneration Distributable in Shares” (Importe Máximo Distribuible en Acciones de Retribución Variable) or “IMDARV”), the maximum number of Santander shares that may be deliveredthe Bank’s executive vice presidents (excluding executive directors) were entitled to such beneficiariesreceive at December 31, 2013 and 2012 relating to the deferred portion under this plan (the “Limit of Variable Remunerationthe various plans then in Shares” (Límite de Acciones de Retribución Variable) or “LARV”) will be determined, after deducting applicable taxes (or withholdings), by applying the following formula:force (see Note 47 to our consolidated financial statements):
shares to be delivered | ||||||||
Plan I13 | — | 1,463,987 | (1) | |||||
Third cycle - obligatory investment plan | — | 286,317 | ||||||
Deferred conditional delivery plan (2010) | 482,495 | 980,780 | (2) | |||||
Deferred conditional variable remuneration plan (2011) | 1,480,251 | (5) | 2,076,477 | (3) | ||||
Deferred conditional variable remuneration plan (2012) | 1,660,832 | (5) | 1,622,485 | (4) | ||||
Deferred conditional variable remuneration plan (2013) | 1,341,718 | (6) | — | |||||
where “Santander Share Price” will be
| (1) | In addition, they were entitled to a maximum of 114,160 Banesto shares at December 31, 2012. |
| (2) | In addition, they were entitled to a maximum of 14,705 Banesto shares at December 31, 2012. |
| (3) | In addition, they were entitled to a maximum of 123,973 Banesto shares and 79,696 Santander Brasil shares at December 31, 2012. |
| (4) | In addition, they were entitled to a maximum of 61,328 Santander Brasil shares at 31 December 2012 and a maximum of 344,070 options on Santander Brasil shares at December 31, 2012 under the share option plan approved in 2011, the exercise of which, subject to the plan’s terms and conditions, may commence in July 2014. |
| (5) | For the executives who joined from Banesto, the Banesto shares were converted into Santander shares at €0.633 per share. |
| (6) | In addition, they were entitled to a maximum of 165,000 Santander Brasil shares at December 31, 2013 and to a maximum of 844,070 options on Santander Brasil shares (344,070 under the share option plan approved in 2011, the exercise of which, subject to the plan’s terms and conditions, may commence in July 2014, plus 500,000 under the share option plan approved in 2013, the exercise of which, subject to the plan’s terms and conditions, may commence in July 2016). |
In 2013 and 2012, since the average weighted daily volumeconditions established in the corresponding deferred share-based remuneration schemes for prior years had been met, in addition to the payment of the average weighted listing prices of Santander shares forrelated cash amounts, the fifteen trading sessions prior to the date on which the board of directors approves the bonus for the executive directors of the Bank for financial year 2012.
Included in the Maximum Amount of Variable Remuneration Distributable in Shares is the estimated maximum amount of the bonus to be delivered in shares for the executive directors of the Bank, which is €12.1 million (the “Maximum Amount Distributable in Shares for Executive Directors” (Importe Máximo Distribuible en Acciones para Consejeros Ejecutivos) or (“IMDACE”). The maximumfollowing number of Santander shares that may bewas delivered to the executive directors under this plan (the “Limit on Shares for Executive Directors” (Límite de Acciones para Consejeros Ejecutivos) or “LACE”) will be determined by applying the following formula, after deducting applicable taxes (or withholdings):vice presidents:
Number of shares delivered | 2013 | 2012 | ||||||
Plan I12 | — | 439,195 | (1) | |||||
Second cycle - obligatory investment plan | — | 442,319 | ||||||
Third cycle - obligatory investment plan | 275,325 | — | ||||||
Deferred conditional delivery plan (2010) | 482,494 | (3) | 490,388 | (2) | ||||
Deferred conditional variable remuneration plan (2011) | 708,375 | (4) | — | |||||
| — | ||||||||
| (1) | In addition, 49,469 Banesto shares were delivered. |
| (2) | In addition, 14,705 Banesto shares were delivered. |
| (3) | In addition, 14,705 Banesto shares were delivered. |
| (4) | ||||||
| ||||||
| In addition, 50,159 Banesto shares were delivered. |
where “Santander Share Price” will beAs indicated in Note 5.c to our consolidated financial statements, in 2012 the average weighted daily volumecontracts of the average weighted listing pricesmembers of the Bank’s senior management which provided for defined-benefit pension obligations were amended to convert these obligations into a defined-contribution employee welfare system, which was externalized to Santander shares forSeguros y Reaseguros Compañía Aseguradora, S.A. The new system grants the fifteen trading sessions priorsenior executives the right to receive a pension benefit upon retirement, regardless of whether or not they are in the Bank’s employ on that date, based on the contributions made to the date onaforementioned system, and replaces the right to receive a pension supplement which the board of directors approves the bonus for the executive directorshad previously been payable to them upon retirement. The new system expressly excludes any obligation of the Bank for financial year 2012.
IV.Other rules:
to the executives other than the conversion of the previous system into the new employee welfare system, which took place in 2012, and, as the case may be, the annual contributions to be made. In the event of a changepre-retirement, the senior executives who have not exercised the option described in Note 5.c to our consolidated financial statements are entitled to an annual retainer until the numberdate of shares dueretirement.
The senior executives’ beginning balance under the new employee welfare system amounted to a decrease or increase in€287 million. This balance reflects the parmarket value, at the date of conversion of the shares or a transaction with an equivalent effect,former pension obligations into the number of shares to be delivered will be modified so as to maintain the percentagenew employee welfare system, of the total share capital represented by them.assets in which the provisions for the respective accrued obligations had been invested. The balance at December 31, 2013 amounted to €312 million.
Information from the stock exchange with the largest trading volume shall be used to determine the listing priceThe contracts of the share.
If necessary or appropriate for legal, regulatory or similar reasons,senior executives who had not exercised the delivery mechanisms provided for herein may be adaptedoption referred to in specific cases without altering the maximum number of shares linkedNote 5.c to the plan or the basic conditions upon which the delivery thereof is made contingent. Such adaptations may include the substitution of the delivery of shares for the delivery of equivalent amounts in cash.
The shares to be delivered may be owned by the Bank or by any of its subsidiaries, be newly-issued shares, or be obtained from third parties that have signed agreements to ensure that the commitments made will be met.
175
Santander UK
The long-term incentive plans on shares of the Bank originally granted by management of Santander UK to its employees (consisting of Santander UK shares) are as follows:
| Number of shares | Exercise price in pounds sterling (*) | Year granted | Employee Group | Number of persons | Date of commencement of exercise period | Date of expiry of exercise period | ||||||||||||||||||||||
Plans outstanding at 01/01/09 | 6,153 | 7.00 | ||||||||||||||||||||||||||
|
|
|
| |||||||||||||||||||||||||
Options granted (Sharesave) | 4,528 | 7.26 | 2009 | Employees | 7,066 | (**) | 11/01/09 | 11/01/12 | ||||||||||||||||||||
| 11/01/09 | 11/01/14 | |||||||||||||||||||||||||||
Options exercised | (678 | ) | 3.85 | |||||||||||||||||||||||||
Options cancelled (net) or not exercised | (1,278 | ) | 7.48 | |||||||||||||||||||||||||
|
|
|
| |||||||||||||||||||||||||
Plans outstanding at 12/31/09 | 8,725 | 7.24 | ||||||||||||||||||||||||||
|
|
|
| |||||||||||||||||||||||||
Options granted (Sharesave) | 3,359 | 6.46 | 2010 | Employees | 4,752 | (**) | 11/01/10 | 11/01/13 | ||||||||||||||||||||
| 11/01/10 | 11/01/15 | |||||||||||||||||||||||||||
Options exercised | (72 | ) | 7.54 | |||||||||||||||||||||||||
Options cancelled (net) or not exercised | (3,073 | ) | 6.82 | |||||||||||||||||||||||||
|
|
|
| |||||||||||||||||||||||||
Plans outstanding at 12/31/10 | 8,939 | 7.09 | ||||||||||||||||||||||||||
|
|
|
| |||||||||||||||||||||||||
Options granted (Sharesave) | 7,725 | 4.46 | 2011 | Employees | 7,429 | (**) | 11/01/11 | 11/01/14 | ||||||||||||||||||||
| 11/01/11 | 11/01/16 | |||||||||||||||||||||||||||
Options exercised | (43 | ) | 4.09 | |||||||||||||||||||||||||
Options cancelled (net) or not exercised | (5,348 | ) | 6.92 | |||||||||||||||||||||||||
|
|
|
| |||||||||||||||||||||||||
Plans outstanding at 12/31/11 | 11,273 | |||||||||||||||||||||||||||
Of which: | ||||||||||||||||||||||||||||
Executive Options | 12 | 4.54 | 2003-2004 | Executives | 2 | 03/26/06 | 03/24/13 | |||||||||||||||||||||
Sharesave | 11,261 | 5.37 | 2008-2011 | Employees | 12,421 | (**) | 11/01/08 | 11/01/16 | ||||||||||||||||||||
In 2008 the Group launched a voluntary savings scheme for Santander UK employees (Sharesave Scheme) whereby employees who join the scheme will have between GBP 5 and GBP 250 deducted from their net monthly pay over a period of three or five years. When this period has ended, the employees may use the amount saved to exercise options on shares of the Bank at an exercise price calculated by reducing by up to 20% the average purchase and sale prices of the Bank shares in the three trading sessionsour consolidated financial statements prior to the approvalconversion of the plan bydefined-benefit pension obligations into the UK tax authorities (HMRC). This approval must be received within 21 to 41 days following the publication of the Group’s resultscurrent welfare system include a supplementary welfare regime for the first halfcontingencies of death (surviving spouse and child benefits) and permanent disability of serving executives.
Additionally, the year. This scheme, which commencedtotal sum insured under life and accident insurance policies relating to this group of employees amounted to €92 million at December 31, 2013 (December 31, 2012: €73 million).
Lastly, settlements of €10.7 million took place in September 2008, was approved by the shareholders at the annual general meeting held on June 21, 2008 and was authorized by the UK tax authorities (HMRC). At the annual general meetings held on June 19, 2009, June 11, 2010, June 17, 2011, and March 30, 2012, the shareholders approved a plan with similar features2012. The net charge to the plan approvedconsolidated income statement amounted to €19.7 million in 2008.
176
Date of expiration of the current term of office of the directors and the period during which the directors have served in that office:
The period during which the directors have served in their office is shown in the table under Section A of this Item 6.
The date of expiration of the current term of office is shown in the table below:
Name | Date of expiration(1) | |
Emilio Botín | 1st half 2015 | |
Javier Marín | 1st half 2016 | |
| Fernando de Asúa | 1st half | |
| ||
Matías R. Inciarte | 1st half 2015 | |
| ||
| ||
| ||
| ||
| ||
| ||
Guillermo de la Dehesa | 1st half | |
| 1st half | |
| 1st half | |
| 1st half | |
Vittorio Corbo | 1st half 2017 | |
| Rodrigo Echenique | 1st half 2017 | |
| Esther Giménez-Salinas | 1st half 2017 | |
| Ángel Jado | 1st half 2016 | |
| Abel Matutes | 1st half 2015 | |
| Juan R. Inciarte | 1st half 2015 | |
Isabel Tocino | 1st half | |
| Juan Miguel Villar Mir | 1st half 2015 |
| (1) | Pursuant to the provisions of our |
At the annual general meeting held on March 30, 2012, the28, 2014, our shareholders passed the following resolutions:
To appoint Esther Giménez-Salinas as director for the three-year term provided in our Bylaws.
To ratify the appointment of Vittorio CorboJavier Marín as a director, which appointment was approved by the board of directors at its meeting of July 21, 2011,April 29, 2013, and also to re-elect him for a three-year term.
As a consequence of the non-renewal of the appointments of Antonio Basagoiti, Antonio Escámez and Luis Alberto Salazar-Simpson, the number of directors of the Bank has been reduced to sixteen.
The principalbasic terms and conditions of the contracts entered into byof the Bank with its executive directors, besides those relating to the remuneration thereof, are as follows:the following:
(i)a) Exclusivity and non-competition
Executive directors may not enter into other service contracts for services with other companies or entities unless express prior authorization is obtained fromexcept where expressly authorized by the board of directors. In addition, executive director’s contracts contain non-compete provisions, which prohibit executive directors from providing servicesall cases, a duty of non-competition is established with respect to companies engagedand activities similar in activities of a nature similar to thatthose of the Bank or theand its consolidated Group.
To that end, during its meeting on January 24, 2011,Likewise, the board, without the participationcontracts of the executive directors unanimously voted, following the favorable report from the appointments and remuneration committee, to draft anaddendato the contracts of executive directors and members of senior management in order to includeprovide for certain amendments to the clauses applicable to the termination of services of such officers with respect to the prohibitionprohibitions against competition and solicitationthe taking of customers,clients, employees and providers.
177
(ii)b) Code of conduct
Executive directors are requiredThere is an obligation to strictly observe the provisions contained inof the Grupo Santander’sGroup’s General Code and of Conduct and the Code of Conduct in the Securities Market,Markets, specifically with respect to rules of confidentiality, professional ethics and conflicts of interest.
(iii) Remunerationc) Pre-retirement and retirement
Set forth below is the remuneration system resulting from the policies applied in 2011 to determine the remuneration of directors for the performance of duties of supervision and collective decision-making as well as for the performance by theThe following executive directors of other duties5.
a) Principles applied
The principles appliedshall have the right to the remuneration of directors, including executive directors, for exercising the duties of supervision and collective decision-making were the following:
• The directors sharepre-retirement in the profits from the financial year for the performanceevent of duties of supervision and collective decision-making through bylaw-mandated payments, which are made up of an annual allotment and attendance fees.
• The Bylaws set the above-described share as an amount equal to one per cent of the net profits obtained by the Bank for the financial year, although the board may resolve to reduce such percentage annually. Moreover, payment thereof requires that the priority payments established by applicable law (such as, for instance, allocations to reserves required under the equity rules for financial institutions) be paid first.
The specific amount payable to each of the directors for the aforementioned items is determined by the board of directors. To such end, all positions held by each director on the board itself as well as membership in and attendance at board meetings and meetings of the various committees are taken into account.
b) Annual emolument
In 2011, the board, at the proposal of the appointments and remuneration committee, resolved to reduce the annual allotment payable to its members for performing the duties of supervision and collective decision-making.
The amounts received individually by the directors for the most recent financial years based on the positions held on the board and for belonging to the various committees thereof were as follows:
| Amounts per director | ||||||||||||
| Amount in euros | ||||||||||||
| 2011 | Change (%) | 2010, 2009 and 2008 | ||||||||||
Members of the board of directors | 99,946 | -6.0 | 106,326 | |||||||||
Members of the executive committee | 200.451 | -6.0 | 213,246 | |||||||||
Members of the audit and compliance committee | 46,530 | -6.0 | 49,500 | |||||||||
Members of the appointments and remuneration committee | 27,918 | -6.0 | 29,700 | |||||||||
First and fourth vice-chairmen | 33,502 | -6.0 | 35.640 | |||||||||
|
178
The principles applied in 2011 to remuneration of the directors for the performance of executive duties were the following:
Fixed remuneration represented a significant proportion of total remuneration.
The variable remuneration of executive directors was established on the basis of the achievement of basic targets set in terms of budgeted net profits and additional qualitative factors.
a) Basic targets. For purposes of determining the variable component of remuneration, a distinction is made between executive directors with general Group management duties and those to whom the management of a specific business division has been entrusted. The paramount factor in the case of the former is the Group’s net profits and RORAC, and in the case of the latter, the net profits of the division managed by the director in question.
b) Additional qualitative factors. In order to determine the amount of the variable remuneration of each director, the quality of the net profits obtained, whether at the Group level or at the division level, is assessed in the light of the following factors:
Form of payment of the variable remuneration of executive directors:
- 40% of the variable remuneration has been paid, net of taxes (or withholdings), half in cash and half in shares, which shares must be held for one year.
- Deferral of 60% of variable remuneration for 3 years, payment of which is subject to the satisfaction of certain conditions (continuity within the Group and bad actor provisions).
After deduction of applicable taxes (or withholdings), the net amount of the deferred remuneration shall be paid, if appropriate, in thirds, on the first, second and third anniversary, 50% in cash and the other 50% in Santander shares, which shares may not be sold until the passage of one year in each case.
Hedging the value of the Santander shares received during the retention and deferral period is expressly forbidden.
For more information see “Item 6. Directors, senior management and employees—B. Compensation” herein.
(iv) Termination
The Bank has signed contracts with all its executive directors. The Bank’s executive directors have indefinite-term employment contracts. Executive directors whose contracts are terminated voluntarily or due to a breach of their duties, are not entitled to receive any economic compensation. Under current conditions, ifin which case they shall have the contracts are terminated for reasons attributable to the Bank or due to objective circumstances (such as those affecting the executive directors’ functional and organic statute), the directors are entitled, at the date of termination of their employment relationship with the Bank, to the following:rights described below:
Javier Marín will have the |
Had Alfredo Sáenz’s contract been terminated in 2009, he would have been able to choose between retiring or receiving severance pay equivalent to 40% of his fixed annual salary multiplied by the number of years’ service in banking, up to a maximum of ten times his fixed annual salary. However, Alfredo Sáenz waived his right to receive this severance pay.
179
At December 31, 2009, 2013 would be 800 thousand euros annually. Alternatively, he may choose to retake his position as executive vice president of the Bank.
If Javier Marín, Ana P. Botín or Juan R. Inciarte retire or takeenter into pre-retirement, they have the right to opt to receive the pensions accrued -or similar amounts-annual allotments in the form of an annuity or a lump sum, -i.e.i.e., in aone single payment-payment, in full but not in part.
For their part, the other executive directors may at any time enter into retirement and therefore claim the benefits corresponding thereto from the insurer with which the benefit system is outsourced as described in section —Pension commitments, other insurance and other items of directors— above, without prejudiceany obligation on the part of the Bank in such circumstances.
d) Termination
Contracts are for an indefinite term. Termination of the employment relationship due to breach of an executive director’s obligations or by decision of the director shall not entitle the director to any financial compensation. In case of termination of the contract by the Bank for any reason, the directors will only have the right to exercise their respective options, after reaching the age of 60 (see Note 5.c)legal severance to our consolidated financial statements).which they are legally entitled.
Francisco Luzón retired as a director and executive vice president on January 23, 2012 (see Note 5.c) to our consolidated financial statements).e) Insurance
Additionally, other non-director membersThe Group has obtained life insurance in favor of the Group’s senior managementBank’s directors, who shall have contracts which entitle themthe right to receive benefitsthe insurance in the event of termination for reasons other than voluntary redundancy, retirement,a declaration of disability, or serious breachwhose heirs shall have such right in case of duties. These benefitsdeath. The premiums paid by the Group are recognized as a provision for pensions and similar obligations and as a staff cost only when the employment relationship between the Bank and its managers is terminated before the normal retirement date.
(v) Insurance
The Group provides the Bank’s executive directors with life insurance (the premium for which is included in the ‘Other remuneration’ column in the tableof the table shown in Note 5.a.iii to our consolidated financial statements) and accident insurance,statements. The following table also provides information regarding insured lump sums for the coverage of which varies in each case according to the policy established by the Bank for its senior officers, as well as reimbursement-based medical insurance.Bank’s executive directors:
For more information see “Item 6. Directors, senior management and employees—A. Directors and senior management”.
| Insured sum (Thousands of euros) | ||||||||||||
2013 | 2012 | Var. (%) | ||||||||||
Emilio Botín | — | — | — | |||||||||
Javier Marín | 2,400 | — | — | |||||||||
Matías R. Inciarte | 5,131 | 5,131 | 0.00 | % | ||||||||
Ana P. Botín | 6,000 | 6,000 | 0.00 | % | ||||||||
Juan R. Inciarte | 2,961 | 2,961 | 0.00 | % | ||||||||
Alfredo Sáenz | — | 11,108 | — | |||||||||
|
|
|
|
|
| |||||||
| 16,492 | 25,200 | -35 | % | |||||||||
|
|
|
|
|
| |||||||
(vi)f) Confidentiality and return of documents
A strict duty of confidentiality is established during the relationship and following termination thereof, pursuant to which executive directors must return to the Bank the documents and items related to their activities that are in their possession.
180
(vii)g) Other terms and conditions
The contracts provide for the following advance notice periods for termination ofcontained in the contracts with the executive officers’ position by the Bank or resignation by the executive officer.directors are as follows:
| Advance notice period | Date of current contract (month/day/year) | By decision of the Bank (months) | By decision of the director (months) | Date of current contract (month/day/year) | By decision of the Bank (months) | By decision of the director (months) | ||||||||||
Emilio Botín | 04/29/2009 | (*) | (*) | 12/26/2012 | (* | ) | (* | ) | ||||||||
Alfredo Sáenz | 04/29/2009 | 4 | 4 | |||||||||||||
Javier Marín | 10/22/2013 | (* | ) | (* | ) | |||||||||||
Matías R. Inciarte | 04/29/2009 | 4 | 4 | 12/26/2012 | 4 | 4 | ||||||||||
Ana P. Botín | 04/29/2009 | 4 | 4 | 12/26/2012 | 4 | 4 | ||||||||||
Juan R. Inciarte | 04/29/2009 | 4 | 4 | 12/26/2012 | 4 | 4 | ||||||||||
| (*) |
Audit and compliance committee and appointments and remuneration committee
An audit and compliance committee as well as an appointments and remuneration committee operate as part of the board of directors. The audit and compliance committee consists exclusively of 43 external directors (all of whom are independent in accordance with the principles set forth in Article 6.2(c) of the Rules and Regulations of the Board). and in Rule 10A-3 under the Exchange Act. The appointments and remuneration committee consists exclusively of five4 external directors (all of whom(3 are independent in accordance with the principlesRules and Regulations of the Board and one, in the opinion of the board, is neither proprietary nor independent). The independence standards set forth in Article 6.2(c) of the Rules and Regulations of the Board). These independence standardsBoard may not necessarily be consistent with, or as stringent as, the director independence standards established by the NYSE.
The audit and compliance committee
The audit and compliance committee was created to provide support and specialization for the tasks of controlling and reviewing the Bank’s accounts and compliance function. Its mission, which has been defined and approved by the Board, is established in our Bylaws and in the Rules and Regulations of the Board.
OnlyThe Rules and Regulations of the Board provide that only non-executive directors can be members of this committee with independent directors (as defined in the Rules and Regulations of the Board) having a majority representation. ItsNevertheless, we have determined that all of the members of our audit and compliance committee meet the independence criteria for foreign private issuers set forth in Rule 10A-3 under the Exchange Act. The committee’s chairman must always be an independent director (as defined in the Rules and Regulations of the Board) and someone who has the necessary knowledge and experience in matters of accounting, auditing or risk management. Currently, the chairman of the audit and compliance committee is Manuel Soto,Guillermo de la Dehesa, the fourththird vice chairman of the board of directors.directors, who our board of directors has determined is an “Audit Committee Financial Expert” in accordance with SEC rules and regulations.
The members of the audit and compliance committee are appointed by the board of directors, taking into account the directors’ knowledge, aptitude and experience in the areas of accounting, auditing or risk management.
Functions of the audit and compliance committee:committee:
a) Have its chairman and/or secretary report to the shareholders at the general shareholders’ meeting with respect to matters raised therein by shareholders regarding its powers.
b) Propose the appointment of the auditor, as well as the conditions inunder which such auditor will be hired, the scope of its professional duties and, if applicable, the revocation or non-renewal of its appointment. The committee shall favor the Group’s auditor also assuming responsibility for auditing the companies which comprisemaking up the Group.
c) Review the accounts of the Company and the Group, monitor compliance with legal requirements and the proper application of generally accepted accounting principles, and report on the proposals for alterations to the accounting principles and standards suggested by management.
d) Supervise the Bank’s internal audit services, and particularly:
(ii) Reviewing the annual working plan for internal audit and the annual activities report;
181(iii) Ensuring the independence and effectiveness of the internal audit function;
(v) Receiving periodic information regarding the activities thereof; and
(vi) Verifying that senior management takes into account the conclusions and recommendations of its reports.
e) Supervise the process for gathering financial information and for the internal control systems. In particular, the audit and compliance committee shall:
(i) Supervise the process of preparing and presenting the regulated financial information relating to the Company and the Group, as well as its integrity, reviewing compliance with regulatory requirements, the proper demarcation of group consolidation and the correct application of accounting standards; and
(ii) Supervise the effectiveness of the systems for the internal monitoring and management of risks, reviewing them periodically, so that the principal risks are identified, managed and properly disclosed.
(iii) Discuss with the external auditor any significant weaknesses detected in the internal control system during the course of the audit.
f) Report on, review and supervise the risk control policy established in accordance with the provisions of the Rulesthese rules and Regulations of the Board.regulations.
g) Serve as a channel of communication between the board and the auditor, assess the results of each audit and the response of the management team to its recommendations, and act as a mediator in the event of disagreement between the board and the auditor regarding the principles and standards to be applied in the preparation of the financial statements. Specifically, it shall endeavor to ensure that the statements ultimately drawn up by the board are submitted to the shareholders at the general shareholders’ meeting without any qualifications or reservations in the auditor’s report.
h) Supervise the fulfillmentfulfilment of the audit contract, endeavoring to ensure that the opinion on the annual financial statements and the main contents of the auditor’s report are set forth in a clear and accurate fashion.
i) Ensure the independence of the auditor, by taking notice of those circumstances or issues that might risk such independence and any others related to the development of the auditing procedure, as well as receive information and maintain such communication with the auditor as is provided for in legislation regarding the auditing of financial statements and in technical auditing regulations. And, specifically, verify the percentage represented by the fees paid for any and all reasons of the total income of the audit firm, and the length of service of the partner who leads the audit team in the provision of such services to the Company. The annual report shall set forth the fees paid to the audit firm, including information relating to fees paid for professional services other than audit work.
In any event, the audit and compliance committee should receive annually from the external auditor written confirmation of the latter’s independence versus the Company or institutions directly or indirectly linked to the Company, as well as information on any type of additional services provided to such institutions by the aforementioned auditor or by persons or institutions related to the latter, as stipulated in External Auditing LawAct 19/1988, of July 1267.
Likewise, prior to the issuing of the external auditor’s report, the committee shall issue annually a report expressing an opinion on the independence of the external auditor. In any event, such report should make a statement as to the providing of the additional services referred to in the preceding paragraph.
j) The committee shall ensure that the Company publicly communicates a change of auditor and accompanies such communication with a declaration regarding the possible existence of disagreements with the outgoing auditor and, if any, regarding the content thereof and, in the event of the resignation of the auditor, the committee shall examine the circumstances causing it.
|
182
k) Report to the board, in advance of itsthe adoption by it of the corresponding decisions, regarding:
(i) The financial information that the Company must periodically make public, ensuring that such information is prepared in accordance with the same principles and practices applicable to the annual financial statements.
(ii) The creation or acquisition of equity interests in special purpose entities or entities domiciled in countries or territories that are considered to be tax havens.
l) Supervise the observance of the Group’s Codecode of Conductconduct of the Group in the Securities Markets,securities markets, the Manualsmanuals and Proceduresprocedures for the Preventionprevention of Money Launderingmoney laundering and, in general, the rules of governance and compliance in effect in the Company, and make such proposals as are deemed necessary for the improvement thereof. In particular, the committee shall have the duty to receive information and, if applicable, issue a report on disciplinary penalties to be imposed upon members of the senior management.
m) Review compliance with such courses of action and measures as result from the reports issued or the inspection proceedings carried out by the administrative authorities having functions of supervision and control.
n) Know and, if applicable, respond to the initiatives, suggestions or complaints put forward or raised by the shareholders regarding the area of authority of this committee and which are submitted to it by the office of the general secretary of the Company. The committee shall also:
(i) Receive, deal with and keep a record of the complaintsclaims received by the Bank on matters related to the process offor gathering financial information, auditing and internal controls.
(ii) Receive on a confidential and anonymous basis possible communications from Group employees who express their concern on possible questionable practices in the areas of accounting or auditing.
o) Receive information from the person responsible for the Company’s taxation matters on the tax policies applied, at least prior to the drawing-up of the annual accounts and the filing of the Corporate Tax return, and where relevant, on the tax consequences of transactions or matters submitted to the board of directors or the executive committee for approval, unless such bodies have been informed directly, in which case this will be reported to the committee at the first subsequent meeting held by it. The audit and compliance committee shall transfer the information received to the board of directors.
p) Report on any proposed amendments to the Rulesthese rules and Regulations of the Boardregulations prior to the approval thereof by the board of directors.
q) Evaluate, at least onceone a year, the committee’sits operation and the quality of its work.
r) And the others specifically provided for in the Rules and Regulations of the Board.
| 7 | Currently Legislative Royal Decree 1/2011, of 1 July, Spain’s Consolidated Audit Act. |
The Group’s 20112013 audit and compliance committee report is available on the Group’s website, which does not form part of this annual report on Form 20-F, atwww.santander.com under the heading “Information for shareholders and investors—corporate governance—committees’ report”.
The following are the current members of the audit and compliance committee:
Name | Position | |||||
| Chairman | |||||
Fernando de Asúa | Member | |||||
| Member | |||||
| ||||||
Ignacio Benjumea acts as secretary to the audit and compliance committee, but is classified as a non-member.
At the 2014 annual general meeting, held on March 28, 2014, our shareholders passed a resolution proposed by the board of directors to amend our Bylaws in compliance with the CRD IV to establish a new committee of the board to assist the latter on matters of risk, regulation and compliance.
Our amended Bylaws have not yet been filed with the Mercantile Register, which is required prior to their effectiveness. We expect that the amendments will become effective within the first semester of 2014.
183Once such committee is set up, the risk committee will retain its powers with respect to risk management and the new committee will assume advisory and support functions on issues of supervision and risk control, the definition of Group’s risk policies, relations with supervisors and compliance issues, the latter being handed over from the current audit and compliance committee, which will henceforth be known as the audit committee.
The appointments and remuneration committee:
The Rules and Regulations of the Board state that the members of this committee must all be non-executive directors with independent directors (as defined in the Rules and Regulations of the Board) having a majority representation including an independent director as chairman (as defined in the Rules and Regulations of the Board).
Currently, the chairman of the appointments and remuneration committee is Fernando de Asúa, the first vice chairman of the board of directors.
The members of the appointments and remuneration committee are appointed by the board of directors, taking into account the directors’ knowledge, aptitudes and experience and the goals of the committee.
Functions of the appointments and remuneration committee:
a) EstablishPropose and review the standardsinternal criteria and procedures to be followed in order to determine the composition of the board and select those persons who will be proposed for election to serve as directors.directors, as well as for the continuous evaluation of directors, reporting on such continuous evaluation. In particular, the appointments and remuneration committee:
(i) Shall evaluateestablish the competencies, knowledge and experience required of the director;
(ii) Shall specify the duties and the aptitudes needed of the candidates to fill each vacancy, evaluatingnecessary for directors, likewise assessing the time and dedication neededrequired for them to properly carryappropriately carrying out their commitments; andthe position.
(iii)(ii) Shall receive for taking into consideration, the proposals of potential candidates to fillfor the covering of vacancies that might be made by the directors.directors, where applicable, may propose.
b) Prepare, by following standards of objectiveness and conformance to the corporate interests, the proposals for appointment, re-election and ratification of directors provided for in section 2 of article 21 of the Rules and Regulations of the Board, as well as the proposals for appointment of the members of each of the committees of the board of directors. Likewise, it shall prepare, by following the same aforementioned standards, the proposals for the appointment of positions on the board of directors and its committees.
c) Annually verify the classification of each director (as executive, proprietary, independent or other) for the purpose of their confirmation or review at the ordinary general shareholders’ meeting and in the annual corporate governance report.
d) Report on proposals for appointment or withdrawal of the secretary of the board, prior to submission thereof to the board.
e) ReportPropose and review the internal criteria and procedures for the selection and continuous evaluation of executive vice presidents or similar officers and other employees responsible for internal control functions or who hold key positions for the daily carrying-out of banking activity, and to report on appointmentstheir appointment and withdrawals of the members of senior management.removal from office and their continuous evaluation.
f) Propose to the board:
(i) The policy for compensation of directors and the corresponding report.report, upon the terms of article 29 of the Rules and Regulations of the Board.
(ii) The policy for compensation of the members of senior management.
(iii) The individual compensation of the directors.
(iv) The individual compensation of the executive directors and, if applicable, external directors, for the performance of duties other than those of a mere director, and other terms of their contracts.
(v) The basic terms of the contracts and compensation of the members of senior management.
(vi) The remuneration of those other officers who, thoughwhilst not members of senior management, receive significant compensation, particularly variable compensation, and whose activities may have a significant impact on the assumption of risk by the Group.
184
g) Ensure compliance with the policy established by the Company for compensation of the directors and the members of senior management.
h) Periodically review the compensation programs, assessing the appropriateness and yield thereof and endeavoring to ensure that the compensation of directors shall conform to standards of moderation and correspondcorrespondence to the earnings of the Company.
i) Ensure the transparency of such compensation and the inclusion in the annual report and in the annual corporate governance report of information regarding the compensation of directors and, for such purposes, submit to the board any and all information that may be appropriate.
j) Ensure compliance by the directors with the duties prescribed in article 30 of the Rules and Regulations of the Board, prepare the reports provided for thereinherein and receive information, and, if applicable, prepare a report on the measures to be adopted with respect to the directors in the event of non-compliance with the above mentionedabovementioned duties or with the Group’s Code of Conduct of the Group in the Securities Markets.securities markets.
k) Examine the information sent by the directors regarding their other professional obligations and assess whether such obligations might interfere with the dedication required of directors for the effective performance of their work.
l) Evaluate, at least once a year, its operation and the quality of its work.
m) Report on the process of evaluation of the committeeboard and of the members thereof.
n) And others specifically provided for in the Rules and Regulations of the Board.
The Group’s 20112013 appointments and remuneration committee report is available on the Group’s website, which does not form part of this annual report on Form 20-F, atwww.santander.com under the heading “Information for shareholders and investors—Corporate governance—Committees report”.
The following are the members of the appointments and remuneration committee:
Name | Position | |||||
| Fernando de Asúa | Chairman | |||||
Guillermo de la Dehesa | Member | |||||
| Rodrigo Echenique | Member | |||||
| Member | ||||||
| ||||||
Ignacio Benjumea acts as secretary to the appointments and remuneration committee but is classified as a non-member.
As of December 31, 2011,2013, we had 193,349182,958 employees (as compared to 178,869186,763 in 20102012 and 169,460193,349 in 2009)2011) of which 35,73732,208 were employed in Spain (as compared to 36,42934,862 in 20102012 and 35,07635,737 in 2009)2011) and 157,612150,750 were employed outside Spain (as compared to 142,440151,901 in 20102012 and 134,384157,612 in 2009)2011). The terms and conditions of employment in the non-government-owned banks in Spain are negotiated on an industry-wide basis with the trade unions. This process has historically produced collective agreements binding on all the privatenon-government-owned banks and their employees. The 2011-2014 agreement was signed on March 14, 2012. The terms and conditions of employment in many of our subsidiaries outside Spain (including in Argentina, Portugal, Italy, Uruguay, Puerto Rico, Colombia, Chile, Mexico, Germany, the UK,U.K., Brazil and Poland) are negotiated either directly or indirectly (on an industry-wide basis) with the trade unions.
185
The table below shows our employees by geographic area:
| Number of employees | Number of employees | |||||||||||||||||||||||
| 2011 | 2010 | 2009 | 2013 | 2012 | 2011 | |||||||||||||||||||
SPAIN | 35,737 | 36,429 | 35,076 | 32,208 | 34,862 | 35,737 | ||||||||||||||||||
LATIN AMERICA | 90,821 | 88,490 | 84,976 | 86,017 | 89,622 | 90,821 | ||||||||||||||||||
Argentina | 6,773 | 6,453 | 5,753 | 6,945 | 6,818 | 6,773 | ||||||||||||||||||
Brazil | 54,197 | 53,829 | 50,904 | 49,187 | 53,543 | 54,197 | ||||||||||||||||||
Chile | 12,204 | 11,702 | 11,850 | 12,217 | 12,336 | 12,204 | ||||||||||||||||||
Colombia | 1,458 | 1,321 | 1,304 | 40 | — | 1,458 | ||||||||||||||||||
Mexico | 13,168 | 12,531 | 12,509 | 14,819 | 14,068 | 13,168 | ||||||||||||||||||
Peru | 60 | 56 | 47 | 127 | 66 | 60 | ||||||||||||||||||
Puerto Rico | 1,753 | 1,807 | 1,796 | 1,462 | 1,578 | 1,753 | ||||||||||||||||||
Uruguay | 1,166 | 735 | 757 | 1,220 | 1,209 | 1,166 | ||||||||||||||||||
Venezuela | 42 | 56 | 56 | — | 4 | 42 | ||||||||||||||||||
EUROPE | 53,859 | 41,116 | 37,871 | 54,456 | 52,209 | 53,859 | ||||||||||||||||||
Austria | 399 | 389 | 467 | 423 | 360 | 399 | ||||||||||||||||||
Czech Republic | 90 | 116 | 166 | — | — | 90 | ||||||||||||||||||
Germany | 5,406 | 3,020 | 2,852 | 5,491 | 5,628 | 5,406 | ||||||||||||||||||
Belgium | 23 | 23 | 13 | 22 | 22 | 23 | ||||||||||||||||||
Finland | 151 | 143 | 89 | 140 | 146 | 151 | ||||||||||||||||||
France | 52 | 41 | 32 | 52 | 48 | 52 | ||||||||||||||||||
Greece | 24 | 26 | 19 | — | — | 24 | ||||||||||||||||||
Hungary | 38 | 42 | 47 | 48 | 37 | 38 | ||||||||||||||||||
Ireland | 16 | 8 | 7 | 34 | 21 | 16 | ||||||||||||||||||
Italy | 894 | 922 | 931 | 737 | 840 | 894 | ||||||||||||||||||
Luxembourg | 3 | 3 | 3 | — | — | 3 | ||||||||||||||||||
Norway | 454 | 421 | 385 | 557 | 493 | 454 | ||||||||||||||||||
Poland | 12,754 | 3,622 | 867 | 15,689 | 12,625 | 12,754 | ||||||||||||||||||
Portugal | 6,300 | 6,522 | 6,522 | 6,029 | 6,105 | 6,300 | ||||||||||||||||||
Russia | — | — | 85 | |||||||||||||||||||||
Switzerland | 170 | 175 | 178 | 148 | 159 | 170 | ||||||||||||||||||
The Netherlands | 365 | 423 | 423 | 363 | 360 | 365 | ||||||||||||||||||
United Kingdom | 26,720 | 25,220 | 24,785 | 24,723 | 25,365 | 26,720 | ||||||||||||||||||
USA | 12,722 | 12,644 | 11,355 | 10,080 | 9,882 | 12,722 | ||||||||||||||||||
ASIA | 141 | 114 | 103 | 154 | 144 | 141 | ||||||||||||||||||
Hong Kong | 91 | 78 | 72 | 93 | 89 | 91 | ||||||||||||||||||
China | 33 | 23 | 23 | 45 | 38 | 33 | ||||||||||||||||||
Japan | 7 | 6 | 5 | 5 | 6 | 7 | ||||||||||||||||||
Others | 10 | 7 | 3 | 11 | 11 | 10 | ||||||||||||||||||
OTHERS | 69 | 76 | 79 | 43 | 44 | 69 | ||||||||||||||||||
Bahamas | 46 | 55 | 56 | 24 | 24 | 46 | ||||||||||||||||||
Others | 23 | 21 | 23 | 19 | 20 | 23 | ||||||||||||||||||
|
|
|
|
|
| |||||||||||||||||||
Total | 193,349 | 178,869 | 169,460 | 182,958 | 186,763 | 193,349 | ||||||||||||||||||
In those cases where an employee is working from one country but is technically employed by a Group company located in a different country, we designate that employee as working from his/her country of residence.
186
The table below shows our employees by type of business:
| Number of employees | Number of employees | |||||||||||||||||||||||
| 2010 | 2010 | 2009 | 2013 | 2012 | 2011 | |||||||||||||||||||
Retail Banking | 187,022 | 171,964 | 163,184 | 170,971 | 174,764 | 182,986 | ||||||||||||||||||
Asset Management and Insurance | 1,272 | 1,338 | 1,558 | 1,795 | 1,881 | 1,560 | ||||||||||||||||||
Global Wholesale Banking | 2,722 | 3,037 | 2,898 | 7,165 | 7,027 | 6,212 | ||||||||||||||||||
Corporate Activities | 2,333 | 2,530 | 1,820 | 2,398 | 2,374 | 2,591 | ||||||||||||||||||
Spain’s Real Estate Run-Off | 629 | 717 | — | |||||||||||||||||||||
|
|
|
|
|
| |||||||||||||||||||
Total | 193,349 | 178,869 | 169,460 | 182,958 | 186,763 | 193,349 | ||||||||||||||||||
|
|
|
|
|
| |||||||||||||||||||
As of December 31, 2011,2013, we had 5,1096,274 temporary employees (as compared to 2,2166,875 as of December 31, 20102012 and 1,5775,109 as of December 31, 2009)2011). In 2011,2013, the average number of temporary employees working for the Group was 3,6646,575 employees.
As of April 12, 2012,15, 2014, the direct, indirect and represented holdings of our current directors were as follows:
Directors | Direct Stake | Indirect stake and represented | Total shares | % of Capital stock | Direct Stake | Indirect stake | Represented stake | Total shares | % of Capital stock | |||||||||||||||||||||||||||
Emilio Botín (1) | 8,367,504 | 151,922,027 | 160,289,531 | 1.972 | % | 6,552,426 | — | 132,967,130 | 139,519,556 | 1.496 | % | |||||||||||||||||||||||||
Javier Marín | 362,719 | 3,030 | — | 365,749 | 0.003 | % | ||||||||||||||||||||||||||||||
Fernando de Asúa | 67,684 | 53,609 | 121,293 | 0.001 | % | 85,772 | 67,306 | — | 153,078 | 0.001 | % | |||||||||||||||||||||||||
Alfredo Sáenz | 1,310,180 | 1,304,950 | 2,615,130 | 0.029 | % | |||||||||||||||||||||||||||||||
Matías R. Inciarte(2) | 1,385,728 | 111,084 | 83,452 | 1,580,264 | 0.014 | % | ||||||||||||||||||||||||||||||
Guillermo de la Dehesa | 130 | — | — | 130 | 0.000 | % | ||||||||||||||||||||||||||||||
Sheila C. Bair | 1 | — | — | 1 | 0.000 | % | ||||||||||||||||||||||||||||||
Ana P. Botín(1) (3) | 5,183,057 | 11,995,761 | — | 17,178,818 | 0.000 | % | ||||||||||||||||||||||||||||||
Javier Botín(1) (3) | 4,793,481 | 11,490,941 | — | 16,284,422 | 0.000 | % | ||||||||||||||||||||||||||||||
Vittorio Corbo | 1 | 33,011 | — | 33,012 | 0.000 | % | ||||||||||||||||||||||||||||||
Rodrigo Echenique | 658,758 | 12,485 | — | 671,243 | 0.006 | % | ||||||||||||||||||||||||||||||
Esther Giménez-Salinas | — | — | — | 0.000 | % | 4,759 | — | — | 4,759 | 0.000 | % | |||||||||||||||||||||||||
Matías R. Inciarte (3) | 1,139,525 | 168,591 | 1,308,116 | 0.014 | % | |||||||||||||||||||||||||||||||
Manuel Soto | 65,107 | 464,346 | 529,453 | 0.006 | % | |||||||||||||||||||||||||||||||
Ana P. Botín (1) | 5,207,841 | 4,024,136 | 9,231,977 | 0.000 | % | |||||||||||||||||||||||||||||||
Javier Botín (1)(2) | 4,793,481 | 4,678,044 | 9,471,525 | 0.000 | % | |||||||||||||||||||||||||||||||
Lord Burns (Terence) | 30,107 | 27,001 | 57,108 | 0.001 | % | |||||||||||||||||||||||||||||||
Vittorio Corbo | 1 | — | 1 | 0.000 | % | |||||||||||||||||||||||||||||||
Guillermo de la Dehesa | 107 | — | 107 | 0.000 | % | |||||||||||||||||||||||||||||||
Rodrigo Echenique | 658,758 | 9,947 | 668,705 | 0.007 | % | |||||||||||||||||||||||||||||||
Ángel Jado | 2,000,000 | 4,950,000 | 6,950,000 | 0.077 | % | 2,000,000 | 4,950,000 | — | 6,950,000 | 0.060 | % | |||||||||||||||||||||||||
Abel Matutes Juan | 132,293 | 2,357,399 | 2,489,692 | 0.027 | % | |||||||||||||||||||||||||||||||
Abel Matutes | 202,483 | 2,705,131 | — | 2,907,614 | 0.025 | % | ||||||||||||||||||||||||||||||
Juan R. Inciarte | 1,459,177 | — | 1,459,177 | 0.016 | % | 1,590,616 | — | — | 1,590,616 | 0.014 | % | |||||||||||||||||||||||||
Isabel Tocino | 41,557 | — | 41,557 | 0.000 | % | 125,084 | — | — | 125,084 | 0.001 | % | |||||||||||||||||||||||||
Juan Miguel Villar Mir | 1,081 | — | — | 1,081 | 0.000 | % | ||||||||||||||||||||||||||||||
|
|
|
|
| ||||||||||||||||||||||||||||||||
Total | 25,273,322 | 169,960,050 | 195,233,372 | 2.151 | % | 22,946,096 | 31,368,749 | 133,050,582 | 187,365,427 | 1.621 | % | |||||||||||||||||||||||||
|
|
|
|
| ||||||||||||||||||||||||||||||||
| (1) | Emilio Botín has |
| (2) | Matías R. Inciarte has the right to vote 83,452 shares owned by two of his children. |
| (3) | Javier Botín is a proprietary non-executive director |
Santander’s capital is comprised of only one class of shares, all of which are ordinary and have the same rights.
As of April 12, 201215, 2014, our current executive officers (not directors) referred to above under Section A of this Item 6 as a group beneficially owned, directly or indirectly, 6,575,5916,570,101 ordinary shares, or 0.07%0.057% of our issued and outstanding share capital as of that date. No individual executive officer beneficially owns, directly or indirectly, one percent or more of the outstanding share capital as of that date.
187
Item 7. Major Shareholders and Related Party Transactions
As of December 31, 2011,2013, to our knowledge no person beneficially owned, directly or indirectly, 5% or more of our shares.
AtAs of December 31, 20112013 a total of 1,035,247,9281,374,949,687 shares, or 11.62%12.13% of our share capital, were held by 1,1521,287 registered holders with registered addresses in the United States and Puerto Rico, including JP MorganJPMorgan Chase, as depositary of our American Depositary Share Program. These ADSs were held by 20,65319,039 record holders. Since certain of such shares and ADSs are held by nominees, the foregoing figures are not representative of the number of beneficial holders. Our directors and executive officers did not own any ADSs as of December 31, 2011.2013.
To our knowledge, we are not controlled directly or indirectly, by any other corporation, government or any other natural or legal person. We do not know of any arrangements which would result in a change in our control. The Bylaws of Banco Santander provide for only one class of shares (ordinary shares), granting all holders thereof the same rights.
Shareholders’ agreements
The Bank was informed inIn February 2006, three directors, together with other shareholders of anthe Bank, entered into a shareholder agreement among certain shareholders.that was notified to the Bank and to the Spanish Securities Markets Commission (“CNMV”). The document witnessing the aforementioned agreement was also communicated tofiled at both the CNMV followingRegistry and the filing of the agreement both with the CNMV and in theCantabria Mercantile Registry of Cantabria.Registry.
The agreement, which was entered intosigned by Emilio Botín, Ana P. Botín, Emilio Botín O., Javier Botín, Simancas, S.A., Puente San Miguel, S.A., Puentepumar, S.L., Latimer Inversiones, S.L. and Cronje, S.L. Unipersonal, and relates toprovides for the sharessyndication of the Bank shares held by themthe signatories to the agreement or those over which theywhose voting rights have voting rights.been granted to them.
Under thisThe aim of the syndication agreement and through the establishment of restrictions established on the free transferability of theirthe shares and the regulation of theregulated exercise of the voting rights inherent in them, thesethereto is to ensure, at all times, the concerted representation and actions of the syndicate members as shareholders have agreed to act inof the Bank, for the purpose of developing a coordinated manner in order to develop alasting, stable common lasting and stable policy and an effective, and unifiedunitary presence and representation in the Bank’s governingcorporate bodies.
The agreement comprises a total of 44,396,513 shares ofAt any given time, the Bank (0.498% of its share capital at the end of the year 2011). In addition and in accordance with the first clause of the shareholders’ agreement, the agreement will be extended only in terms of the exercising of voting rights to other shares of the Bank that are subsequently held, directly or indirectly, by the signatories or those over which they have voting rights. As a result, as of December 31, 2011, another 34,460,055 shares (0.387% of the Bank’s share capital at the end of the year 2011) are also included in the syndicate of shareholders.
The chairman of the syndicate of shareholders is the person who ofthen presiding over the same time holds the position of chairman of the MarcelinoFundación Botín, Foundation, which is currently Emilio Botín.
MembersThe members of the syndicate are obligedundertake to group togethersyndicate and pool the voting rights and other political rights inherent inattaching to the syndicated shares, so that the exercising of suchthese rights may be exercised and, in general, the conduct ofsyndicate members heading the members ofBank may act in a concerted manner, in accordance with the instructions and indications and with the voting criteria and orientation, necessarily unitary, issued by the syndicate, before the Bank, is done in a coordinated and, unified fashion. For suchfor this purpose, the representation of suchthese shares is attributed to the chairman of the syndicate as the common representative of the members of the syndicate.its members.
Except for the transfers made totransactions carried out in favor of other members of the syndicate or in favor of the MarcelinoFundación Botín, Foundation, the prior authorization must be granted from the syndicate assembly, which may freely approve or refuse permission for the planned transfer.
Banco Santander informed the CNMV on August 3, and November 19, 2012, by means of the pertinent material fact filings, that it had been officially notified of amendments to this shareholder agreement in respect of the persons subscribing to it.
On October 17, 2013, the Bank filed a material fact with the CNMV updating the holders and distribution of the shares in the syndication to reflect the business reorganization of one of the pact members.
At the date of execution of the agreement, the syndicate is required before any transfercomprised a total of 44,396,513 shares is proposed and it can freely authorizeof the Bank (0.392% of its share capital at year-end 2013). In addition, as established in clause one of the shareholders’ agreement, the syndication extends, solely with respect to the exercise of the voting rights, to other Bank shares held either directly or deny anyindirectly by the signatories, or whose voting rights are assigned to them, in the future. Accordingly, at December 31, 2013, a further 34,900,836 shares (0,308% of share capital at the time) were also included in the syndicate.
At year-end 2013, the agreement encompassed a total of 79,297,349 Bank shares (0.7% of its share capital at such transfer proposal.
| Parties to the shareholders’ agreement | No of shares syndicated | % of total share capital | ||||||
Emilio Botín | 6,464,149 | 0.057 | % | |||||
Ana P. Botín(1) | 17,082,380 | 0.151 | % | |||||
Emilio Botín O.(2) | 16,873,709 | 0.149 | % | |||||
Javier Botín (3) | 16,283,429 | 0.144 | % | |||||
Paloma Botín(4) | 7,830,897 | 0.069 | % | |||||
Carmen Botín | 8,633,998 | 0.076 | % | |||||
Puente San Miguel, S.A. | — | 0.000 | % | |||||
Latimer Inversiones, S.L. (5) | 553,508 | 0.005 | % | |||||
Cronje, S.L., Unipersonal | 4,024,136 | 0.036 | % | |||||
Nueva Azil, S.L. | 5,575,279 | 0.049 | % | |||||
Total | 79,297,349 | 0.700 | % | |||||
188
| 1. | Indirectly, 7,971,625 shares through Bafimar, S.L. and 4,024,136 shares corresponding to the Cronje holding detailed in the table. |
| 2. | 7,800,332 shares held indirectly through Puente San Miguel, S.L.U. |
| 3. | 4,652,747 shares held indirectly through Inversiones Zulú, S.L. and 6,794,391 through Apecaño, S.L. |
| 4. | 6,628,291 shares held indirectly through Bright Sky 2012, S.L. |
| 5. | Bare ownership (ownership without usufruct) of 553,508 shares corresponds to Fundación Botín, but the voting rights are assigned to Latimer Inversiones, S.L. as their beneficial owner. |
In all other respects, the agreement remains unchanged. The aforementioned significant filings can be found on the Group’s website (www.santander.com).
Loans made to members of our board of directors and to our executive officers
The Group’s direct risk exposure to the Bank’s directors and the guarantees provided for them are detailed below.
| Thousands of euros | Thousands of euros | |||||||||||||||||||||||||||||||||||||||||||||||
| 2011 | 2010 | 2013 | 2012 | |||||||||||||||||||||||||||||||||||||||||||||
| Loans and credits | Guarantees | Total | Loans and credits | Guarantees | Total | Loans and credits | Guarantees | Total | Loans and credits | Guarantees | Total | |||||||||||||||||||||||||||||||||||||
Alfredo Sáenz | 8 | — | 8 | 31 | — | 31 | ||||||||||||||||||||||||||||||||||||||||||
Javier Marín (1) | 707 | — | 707 | — | — | — | ||||||||||||||||||||||||||||||||||||||||||
Matías R. Inciarte | 1 | — | 1 | 14 | — | 14 | 17 | — | 17 | 13 | — | 13 | ||||||||||||||||||||||||||||||||||||
Manuel Soto | 1 | — | 1 | 2 | — | 2 | ||||||||||||||||||||||||||||||||||||||||||
Antonio Basagoiti | 12 | 1 | 13 | 36 | 1 | 37 | ||||||||||||||||||||||||||||||||||||||||||
Ana P. Botín | 6 | — | 6 | 2 | — | 2 | — | — | — | 7 | — | 7 | ||||||||||||||||||||||||||||||||||||
Javier Botín | 3 | — | 3 | 5 | — | 5 | 22 | — | 22 | 13 | — | 13 | ||||||||||||||||||||||||||||||||||||
Vittorio Corbo | 4 | — | 4 | — | — | — | ||||||||||||||||||||||||||||||||||||||||||
Rodrigo Echenique | 1,500 | — | 1,500 | 16 | — | 16 | 650 | — | 650 | 1,178 | — | 1,178 | ||||||||||||||||||||||||||||||||||||
Antonio Escámez | 1,851 | — | 1,851 | 1,500 | — | 1,500 | ||||||||||||||||||||||||||||||||||||||||||
Ángel Jado | 3,004 | — | 3,004 | 3,002 | — | 3,002 | 7 | — | 7 | 7 | — | 7 | ||||||||||||||||||||||||||||||||||||
Francisco Luzón (*) | 11,670 | — | 11,670 | 9,230 | — | 9,230 | ||||||||||||||||||||||||||||||||||||||||||
Juan R. Inciarte | 321 | — | 321 | 370 | — | 370 | 4,734 | — | 4,734 | 5,313 | — | 5,313 | ||||||||||||||||||||||||||||||||||||
Luis Alberto Salazar-Simpson | 3 | — | 3 | 401 | — | 401 | ||||||||||||||||||||||||||||||||||||||||||
Isabel Tocino | 322 | — | 322 | 30 | — | 30 | 20 | — | 20 | 42 | — | 42 | ||||||||||||||||||||||||||||||||||||
Alfredo Sáenz (2) | — | — | — | 17 | — | 17 | ||||||||||||||||||||||||||||||||||||||||||
|
|
|
|
|
|
|
|
|
|
|
| |||||||||||||||||||||||||||||||||||||
| 18,702 | 1 | 18,703 | 14,639 | 1 | 14,640 | 6,161 | — | 6,161 | 6,591 | — | 6,591 | |||||||||||||||||||||||||||||||||||||
|
|
|
|
|
|
|
|
|
|
|
| |||||||||||||||||||||||||||||||||||||
| Appointed chief executive officer on April 29, 2013. |
| (2) | Retired from the board on |
Additionally, the total amount of loans and credits made by us to our executive officers who are not directors, as of December 31, 20112013 amounted to €31million€36 million (see Note 53 to our consolidated financial statements).
Loans extended to related parties were made in the ordinary course of business, on substantially the same terms, including interest rates and collateral, as those prevailing at the time for comparable transactions with other persons, and did not involve more than normal risk of collectibilitycollectability or present other unfavorable features.
Loans made to other Related Parties
The companies of the Group engage, on a regular and routine basis, in a number of customary transactions among Group members, including:
overnight call deposits;
foreign exchange purchases and sales;
derivative transactions, such as forward purchases and sales;
money market fund transfers; and
letters of credit for imports and exports
and others within the scope of the ordinary course of the banking business, such as loans and other banking services to our shareholders, to employees of all levels, and the associates and the members of the families of all these persons, as well as those other businesses conducted by the companies of the Group. All these transactions are made:
in the ordinary course of business;
on substantially the same terms, including interest rates and collateral, as those prevailing for comparable transactions with other persons; and
did not involve more than the normal risk of collectibilitycollectability or other unfavorable features.
As of December 31, 20112013 our loans and credits to associated and jointly controlled entities, amounted to €146€1,331 million. Those loans and credits represented 0.02%0.20% of our total net loans and credits and 0.19%1.89% of our total stockholders’ equity as of December 31, 2011.2013.
For more information, see Notes 35 and 53 to our consolidated financial statements.
C. Interests of experts and counsel
Not Applicable.
189
A.ConsolidatedA. Consolidated statements and other financial information
Financial Statements
See Item 18 for our consolidated financial statements.
| (a) | Index to consolidated financial statements of Santander |
Legal Proceedings
Our general policy is to record provisions for tax and legal proceedings in which we assess the chances of loss to be probable and we do not record provisions when the chances of loss are possible or remote. We determine amounts to be provided as our best estimate of the expenditure required to settle the corresponding claim based, among others, on a case-by-case basis based on the analysis and legal opinion of internal and external counsel or by considering the historical average amount of loss of such category of lawsuits.
i. Tax-related proceedings
At December 31, 2011,As of the date of this report, the main tax-related proceedings concerning the Group were as follows:
190
| In December 2008 the Brazilian tax authorities issued an infringement notice against Banco Santander (Brasil), S.A. in relation to income tax (IRPJ and |
| In |
At the date of approval of this annual report on Form 20-F certain other less significant tax-related proceedings were also in progress.
ii. Non-tax-related proceedings
At December 31, 2011,As of the date of this report, the main non-tax-related proceedings concerning the Group were as follows:
Customer remediation: claims associated with the sale |
The provisions recorded by Santander UK in respect of customer remediation comprise the estimated cost of making redress payments with respectcertain financial products (principally payment protection insurance or PPI) to the past sales of products. In calculating the customer remediation provision, management’s best estimate of the provision was calculated based on assumptions regarding the number of claims that will be received, of those, the number that will be upheld, and the estimated average settlement per case.
191
Payment protection insurance is a UK insurance product offering payment protection on unsecured personal loans (and credit cards). The product was sold by all UK banks. The mis-selling issues are predominantly related to business written before 2009. The nature and profitability of the product has changed materially since 2008, in part due to customer and regulatory pressure. The product was sold by all UK banks – the mis-selling issues are predominantly related to business written before 2009.2008.
On July 1, 2008, the UK Financial Ombudsman Service (“FOS”(‘FOS’) referred concerns regarding the handling of PPI complaints to the UK FSA as an issue of wider implication.Financial Services Authority (‘FSA’). On September 29, 2009 and March 9, 2010, the FSA issued consultation papers on PPI complaints handling.handling as an issue of wider implication. The FSA published its Policy Statement on August 10, 2010, setting out evidential provisionsthe evidence and guidance on the fair assessment of a complaint and the calculation of redress, as well as a requirement for firms to reassess historically rejected complaints which had to be implemented by December 1, 2010.
On October 8, 2010, the British Bankers’ Association (“BBA”(‘BBA’), the principal trade association for the UK banking and financial services sector, filed on behalf of certain financial institutions (which did not include Santander UK)UK plc) an application for permission to seek judicial review against the FSA and the FOS. The BBA sought an order quashing the FSA Policy Statement and an order quashing the decision of the FOS to determine PPI sales in accordance with the guidance published on its website in November 2008. The Judicial Reviewjudicial review was heard in the courts in January 2011 and on April 20, 2011 judgment was handed down by the High Court dismissing the BBA’s application.proceeding brought by the BBA.
Santander UK did not participate in the legal action undertaken by other UK banks and hashad been consistently making provisions and settling claims with regards to PPI complaints liabilities since they began to increase in recent years. However, aliabilities.
A detailed review of the provision was performed by Santander UK in the first half of the year2011 which was necessary in light of current conditions,the new situation, including the High Court ruling injudgment of April 2011, the BBA’s subsequent decision not to appeal it and the consequent increase in actual claims levels. As a result, the provision has been revised to reflect the new information.
There are still a number of uncertainties as to the eventual costs from any such contact and/or redress given the inherent difficulties of assessing the impact of detailed implementation of the Policy Statement for all PPI complaints, uncertainties around the ultimate emergence period for complaints, the availability of supporting evidence and the activities of claims management companies, all of which will significantly affect complaints volumes, uphold rates and redress costs.revised.
In this context, in the first half of 2011 the Group recognized a provision, with a post-taxnet effect on results of €620 million (GBP 538 million), which was calculated on the basis of anthe estimate of the number of claims that willwould be received, of the number of claims that willwould be upheld and of the estimated average amount of compensation in each case,case.
Following the payments made until December 31, 2013, the remaining provision recognized in line with what other UK banks had done.relation to PPI sales totaled GBP 165 million.
The following table shows information on the total claims received up to December 31, 2013 and the resolution thereof:
(number of claims, in thousands) | ||||||||||||
| 2013 | 2012 | 2011 | ||||||||||
Claims outstanding at the beginning of the period | 31 | 1 | — | |||||||||
Claims received | 363 | 437 | 111 | |||||||||
Claims rejected as being invalid(1) | (298 | ) | (258 | ) | (90 | ) | ||||||
Resolved claims(2) | (82 | ) | (149 | ) | (20 | ) | ||||||
|
|
|
|
|
| |||||||
Claims outstanding at the end of the period | 14 | 31 | 1 | |||||||||
|
|
|
|
|
| |||||||
| (1) |
| (2) |
On December 16, 2003,The amount settled in relation to paid claims in 2013 totaled GBP 217 million.
The main cause of the increase in claims in 2011 was the media coverage of this issue following the dismissal by the High Court of the appeal for judicial review filed by the British Bankers’ Association and the launch of campaigns by claim management companies in relation to these products.
There was also an increase in claims in 2012 due to greater media coverage of the issue, a rise in the activity of claims management companies and the proactive policy followed by Santander UK, which contacted over 300,000 customers directly.
Lastly, the number of claims received fell by 17% in 2013 compared to 2012 and the associated costs also fell significantly, particularly in the last quarter of 2013.
The provision recognized at the end of 2013 represents the best estimate by Group management, taking into account the opinion of its advisers and of the costs to be incurred in relation to any compensation that may result from the redress measures associated with the sales of payment protection insurance (PPI) in the UK. The provision was calculated on the basis of the following key assumptions resulting from judgments made by management:
These assumptions were based on the following information:
These assumptions are reviewed, updated and validated on a regular basis using the latest available information, such as, the number of claims received, the percentage of claims lost, the potential impact of any change in that percentage, etc. and any new evaluation of the estimated population.
Group management reviews the provision required at each relevant date, taking into account the latest available information on the aforementioned assumptions as well as past experience.
The most relevant factor for calculating the balance of the provision is the number of claims received as well as the expected level of future claims. The percentage of claims lost is calculated on the basis of the analysis of the sale process. The average cost of compensation is calculated in a reasonable manner as the Group manages a high volume of claims and the related population is homogenous.
In a decision handed down on March 30, 2010, the Supreme Court dismissed an extraordinary appeal against procedural infringements and partly upheldon November 24, 2004 setting aside a cassation appealsummary mortgage proceeding filed in both cases by the Bank against the decision of the Madrid Provincial Appellate Court.
Zed Worldwide, S.A. requested the court-ordered enforcement of the decision. On January 25, 2011, the court issued an order to enforce the decision handed down by the Madrid Provincial Appellate Court, whereby the Bank has to subscribe to 75.1 million shares at their par value of €0.4 per share, totaling €30.05 million. Zed Worldwide, S.A. filed an appeal for reconsideration of the order enforcing the decision, which the Bank opposed. On May 23, 2011, the Bank was served notice of the decision of May 6, 2011, dismissing the appeal for reconsideration and upholding the order of January 25, 2011. On July 14, 2011, Zed Worldwide, S.A. filed an appeal against the decision dismissing the previous appeal for reconsideration; in this regard, the Bank has duly appeared and filed a notice of opposition.
192
The damages claimed are broken down as follows: (i) €18,428,076.43 relating to the value of the property auctioned; (ii) €32,608,895 relating to the loss of profit on the properties lost by the plaintiff which was prevented from continuing its business activity as a property developer; and (iii) €360,000 relating to loss of rental income.
On March 2, 2010, the court of first instance handed down a decision partly upholding both the claim filed against the Bank and the counterclaim, ordering the Bank to pay the plaintiff €4,458,960.61, and Galesa to pay the Bank €1,428,075.70, which resulted in a net loss of €3,030,874.91 for the Bank. Two appeals against this decision were filed on May 31, 2010, one by Galesa and the other by the Bank.counterclaim. On November 11, 2010, the Alicante Provincial Appellate Court handed down a decision upholding the appeal filed by the Bank and dismissing the appeal brought by Galesa de Promociones, S.A., as a result of which and by way of offsetting the indemnity obligations payable by each party, the Bank became a creditor of Galesa in the amount €400,000.€0.4 million.
Galesa filed a cassation appeal with the Supreme Court against this decision, which was given leave to proceed in an order dated October 11, 2011, and the Bank submitted a notice of opposition.
On May 19, 2006, a judgment was handed down at first instance, whereby the agreement was declared to be terminated and the Bank was ordered to pay €1.8 million, plus the related legal interest since February 1997, to return a property that was given in payment under the aforementioned agreement, to pay an additional €72.9 million relating to the replacement value of the assets foreclosed and subsequently sold by the Bank, and to pay all the related court costs. The Bank and Inversión Hogar, S.A. filed appeals against the judgment.
On July 30, 2007, the Madrid Provincial Appellate Court handed down a decision upholding in full the appeal filed by the Bank, reversing the judgment issued at first instance and dismissing the appeal filed by Inversión Hogar, S.A. On completion of the clarification procedure, Inversión Hogar, S.A. and its subsidiaries filed a cassation appeal against the aforementionedabove decision and an extraordinary appeal for procedural infringements at the Civil Division of theSupreme Court. The appeal was dismissed in a Supreme Court judgment dated July 17, 2013, against which issued an order on December 1, 2009, admitting for consideration the appealsappellant filed by Inversión Hogar S.A. and subsidiaries. On October 18, 2011, a judgment was handed down declaring that the appeals filed were not admissible. The appellants filed various applications for clarification of the judgment, challenges and a motion for annulment, which were dismissed.was rejected. The appellants have subsequently filed new requests and reconsideration appeals.Bank has not recognized a provision in this connection.
On August 3, 2012, Delforca 2008, S.A. was declared to be in a position of voluntary insolvency by Barcelona Commercial Court no. 10, which had agreed as part of the insolvency proceeding to stay the arbitration proceeding and the effects of the arbitration agreement entered into by Banco Santander, S.A. and Delforca 2008, S.A. The Bank filed an appeal against this decision, which was confirmeddismissed and it then proceeded to prepare a challenge with a view to filing a future appeal. The Arbitration Court, in compliance with the decision of the Commercial Court, agreed on January 20, 2013 to stay the arbitration proceedings at the stage reached at that date until a decision could be reached in this respect in the insolvency proceeding.
In addition, as part of the insolvency proceeding of Delforca 2008, S.A., Banco Santander, S.A. notified its claim against the insolvent party with a view to having the claim recognized as a contingent ordinary claim without specified amount. However, the insolvency manager opted to exclude Banco Santander, S.A.’s claim from the provisional list of creditors and, accordingly, Banco Santander, S.A. filed an ancillary claim on which a decision has not yet been handed down. In this ancillary claim (still in progress), Delforca 2008, S.A. and the insolvency manager are seeking to obtain a decision from the Court on the merits of the dispute between Banco Santander, S.A. and Delforca 2008, S.A. and, accordingly, Banco Santander, S.A. has appealed against the interlocutory order that admitted for consideration the evidence proposed by them. The appeal was not given leave to proceed and Banco Santander has prepared the corresponding protest.
As part of the same insolvency proceeding, Delforca 2008, S.A. has filed another ancillary claim requesting the termination of the arbitration agreement included in the framework financial transactions agreement entered into by that party and Banco Santander, S.A. in 1998, as well as the termination of the obligation that allegedly binds the insolvent party to the High Council of Chambers of Commerce (Spanish Arbitration Court). Banco Santander, S.A. filed its reply to the complaint on June 21, 2013, although it has repeatedly questioned the court’s objective jurisdiction to hear the complaint, as has the High Council of Chambers of Commerce, Industry and Shipping. The Commercial Court dismissed the motions for declinatory exception filed by Banco Santander and also dismissed the motion for declinatory exception filed by the County CourtHigh Council. These decisions have been appealed.
On December 30, 2013, Banco Santander filed a complaint requesting the termination of Madrid resolution dated May 24, 2010, pre-trial hearing has taken place on the April 16, 2012.insolvency proceeding of Delforca 2008, S.A. due to supervening disappearance of the alleged insolvency of the company.
193
Additionally,In addition, in April 2009 Mobilaria Monesa, S.L.S.A. (parent of the former Gaesco)Delforca 2008, S.A.) filed a claim against Banco Santander, S.A. at Santander Court of First Instance no. 5, reproducingclaiming damages which it says it incurred as a result of the claims discussed and resolved in the aforementioned arbitration proceeding, a circumstance which was brought to the Court’s attention in the notice of opposition thereto(in its opinion) unwarranted claim filed by the Bank.
Bank against its subsidiary, reproducing the same objections as Delforca 2008, S.A. This proceeding has currently been stayed on preliminary civil ruling grounds, against which Mobilaria Monesa, S.A. filed an appeal which was stayeddismissed by the SantanderCantabria Provincial Appellate Court in an ordera judgment dated December 20, 2010 due toJanuary 16, 2014.
Lastly, on April 11, 2012, Banco Santander, S.A. was notified of the Court admitting the preliminary civil ruling grounds claimedclaim filed by the Bank.
The above stay continues to be in effect due to an order dated October 11, 2011Delforca 2008, S.A., heard by SantanderMadrid Court of First Instance no. 5, based on21, in which it sought indemnification for the newdamage and losses it alleges it incurred due to the (in its opinion) unwarranted claim by the Bank. Delforca 2008, S.A. made the request in a counterclaim filed in the arbitration proceeding broughtthat concluded with the annulled award, putting the figure at up to €218 million, although in its present claim it invokes Article 219.3 of the Civil Procedure Law in order to leave for a subsequent proceeding the amount to be settled (as the case may be) by the Bank. The aforementioned Court has dismissed the motion for declinatory exception proposed by Banco Santander, S.A. An appeal was filed against this order by DELFORCA 2008, Sociedad de Valores S.A. atas the Santander Provincial Appellate Court.
Finally, by resolution stated by court order of first instance number 1 of Madrid, an applicationmatter has been admitted –legal proceeding 398/2012, action-a-law suit DELFORCA 2008 against Banco Santander S.A.- in claim of an indeterminate sum,referred for the purpose of compensation of damages, derived from the performance of Banco Santander with regards to the declaration of the early termination of the Financial Transaction Framework Agreement (CMOF) entered into between the above mentioned company and the Bank, as well as the financial transactions covered by the agreement. The Bankarbitration. This decision is in the process of pleading against said lawsuit.
pending appeal. The Group considers that the risk of loss arising as a result of these matters is remote and, accordingly, it has not recognized any provisions in connection with these proceedings.
Former employees of Banco do Estado de São Paulo S.A., Santander Banespa, Cia. de Arrendamiento Mercantil: a claim was filed in 1998 by the association of retired Banespa employees (AFABESP) on behalf of its members, requesting the payment |
194
On November 12, 2008, the Group announced the implementation of a solution (whichhalf-yearly bonus initially envisaged in the entity’s Bylaws in the event that the entity obtained a profit and that the distribution of this profit were approved by the board of directors. The bonus was of a strictly commercial, exceptional naturenot paid in 1994 and 1995 since the bank did not imply any admissionmake a profit and partial payments were made from 1996 to 2000, as agreed by the board of mis-selling) for holders ofdirectors, and the relevant clause was eliminated in 2001. The Regional Employment Court ordered the bank to pay this half-yearly bonus in September 2005 and the bank filed an appeal against the decision at the High Employment Court (“TST”) and, subsequently, at the Federal Supreme Court (“STF”). The TST confirmed the judgment against the bank, whereas the STF rejected the extraordinary appeal filed by the bank in a decision adopted by only one of the products sold -Seguro Banif Estructurado-Court members, thereby also upholding the order issued to the bank. This decision was appealed by the insurance company Axa Aurora Vida,bank and the association. Only the appeal lodged by the bank has been given leave to proceed and will be decided upon by the STF in plenary session.
The solution involved replacingcourt upheld the Lehman issuer riskclaim but did not make a specific pronouncement on costs. A judgment handed down by the Madrid Provincial Appellate Court on October 9, 2012 upheld the appeal lodged by the Bank and dismissed the appeal lodged by Banco Occidental de Descuento, Banco Universal, C.A., dismissing the claim. The dismissal of the claim was confirmed in an ancillary order to the judgment dated December 28, 2012. An appeal was filed at the Supreme Court by Banco Occidental de Descuento against the Madrid Provincial Appellate Court decision. The Bank has challenged the appeal. The Bank has not recognized any provisions in this connection.
As a result of the exchange, at 2008 year-end a loss of €46 million was recognized in the consolidated income statement (€33 million after tax).
In February 2009 the Group offered a similar solution to other customers affected by the Lehman bankruptcy. The costdate of this transaction, before tax, was €143 million (€100 million after tax), which were recognized in the consolidated income statement for 2008.
Certainreport, certain claims havehad been filed in relation to this matter. The Bank’s directors and its legal advisers consider that the various Lehman products were sold in accordance with the applicable legal regulations in force at the time of each sale or subscription and that the fact that the Group acted as intermediary didwould not give rise to any liability for it in relation to the insolvency of Lehman. Accordingly, the risk of loss is considered to be remote.
195
The intervention, on the grounds of alleged fraud, of Bernard L. Madoff Investment Securities LLC (“Madoff Securities”) by the US Securities and Exchange Commission (“SEC”) |
On January 27, 2009, the Group announced its decision to offer a solution to those of its private banking customers who had invested in Optimal Strategic and had been affected by the alleged fraud. This solution, which was applied to the principal amount invested, net of redemptions, totaled €1,380 million. It consisted of a replacement of assets whereby the private banking customers could exchange their investments in Optimal Strategic US for preference shares to be issued by the Group for the aforementioned amount, with an annual coupon of 2% and a call option that could be exercised by the issuer in year ten. At December 31, 2008, the Group determined that these events had to be considered to be adjusting events after the reporting period, as defined in IAS 10.3, because they provided evidence of conditions that existed at the end of the reporting period and, therefore, taking into account IAS 37.14, it recognized the pre-tax cost of this transaction for the Group (€500 million -€350 million after tax-) under Gains/Losses on financial assets and liabilities in the consolidated income statement for 2008.
The Group has at all times exercised due diligence in the management of its customers’ investments in the Optimal Strategic fund. These products have always been sold in a transparent way pursuant to applicable legislation and established procedures and, accordingly, the decision to offer a solution was taken in view of the exceptional circumstances attaching to this case and based on solely commercial reasons, due to the interest the Group has in maintaining its business relationship with these customers.
At the time of the intervention, Madoff Securities was a broker-dealer authorized, registered and supervised by the SEC and was also authorized as an investment advisor by the US Financial Industry Regulatory Authority. As the SEC itself has stated, Madoff Securities had been regularly inspected by the aforementioned supervisory body in recent years, and at no time was its reputation and solvency questioned by the market or by the US supervisory authorities.
On March 18, 2009, the Group issued the preference shares earmarked for the replacement of assets offered to the private banking customers affected by the intervention of Madoff Securities and those affected by the Lehman bankruptcy who were not able to participate in the exchange made on December 23, 2008 (referred to above). The preference shares have been listed on the London Stock Exchange since March 23, 2009. The level of acceptance of the exchange proposal was close to 97%.
On May 26, 2009, two funds managed by Optimal Investment Services, S.A. (“OIS”), an indirect subsidiary of Banco Santander, S.A., announced that they had entered into an agreement with Irving H. Picard, the court-appointed trustee for the liquidation of Madoff Securities. Under the agreement, the trustee allowed the funds’ claims in the liquidation proceeding and reduced his clawback demands on the funds by the amounts withdrawn by the latter from Madoff Securities, in the 90 days prior to bankruptcy, which US legislation allows him to claim, in exchange for the partial payment of those demands by the funds. The funds are Optimal Strategic U.S. Equity Limited and Optimal Arbitrage Limited. These are the only Optimal funds that had accounts at Madoff Securities.
Pursuant to the agreement, the funds’ claims against Madoff Securities’ estate were allowed in their full amounts, calculated on a cash-in, cash-out basis, of USD 1,540,141,277.60 and USD 9,807,768.40, respectively, and the funds were entitled to Securities Investor Protection Corporation advances of USD 500,000 each. The funds paid 85% of the clawback claims asserted by the trustee. The payments totaled USD 129,057,094.60 for Strategic U.S. Equity and USD 106,323,953.40 for Arbitrage.
The funds agreed not to file any other claims against Madoff Securities’ estate (in liquidation). The agreement also contains an “equal treatment” provision, so that if the trustee settled similar clawback claims for less than 85%, the funds would receive a rebate of a portion of their payments to make the percentages applied to the funds equal to those applied to other investors in comparable situations.
196
The agreement followed the trustee’s investigation of Optimal’s conduct in dealing with Madoff Securities, including a review of Optimal’s documents relating to its due diligence, in which the trustee concluded that its conduct did not provide grounds to assert any claim against the Optimal companies or any other entity of Santander Group (other than the clawback claims described above, which did not arise from any inappropriate conduct by the funds).
The agreement contains releases of all clawback and other claims the trustee may have against the funds for any matters arising out of the funds’ investments with Madoff Securities. The trustee’s release applies to all potential claims against other Optimal companies, Santander Group companies and their investors, directors, agents and employees who agree to release the trustee and the Madoff Securities estate (in liquidation), to the extent the claims arise out of the funds’ dealings with Madoff Securities. It also releases the funds from potential clawback liability for any other withdrawals made by them from Madoff Securities.
The agreement between the trustee and the aforementioned Optimal funds was approved by the United States Bankruptcy Court in New York on June 16, 2009.
Madoff Securities is currently in liquidation in accordance with the Securities Investor Protection Act of 1970 at the United States Bankruptcy Court in New York. Bernard L. Madoff, the chief executive of Madoff Securities, pleaded guilty to perpetrating what was probably the largest pyramid fraud in history and was sentenced to 150 years’ imprisonment.
In April 2011, by means of a corporate operation, the funds Optimal Multiadvisors Ltd / Optimal Strategic US Equity Series, Optimal Multiadvisors Ireland plc / Optimal Strategic US Equity Ireland Euro Fund and Optimal Multiadvisors Ireland plc / Optimal Strategic US Equity Ireland US Dollar Fund offered unitholders the possibility of voluntarily liquidating their units and shares in these funds in exchange for shares in a special purpose vehicle in the Bahamas (SPV Optimal SUS Ltd., the “SPV”) to which Optimal Strategic US Equity Ltd., the company through which the aforementioned funds held their assets, assigned in full the claim recognized by the trustee of the Madoff Securities liquidation, mentioned previously, the nominal amount of which totaled USD 1,540,141,277.60 and became part of the assets of the SPV.
This arrangement enabled the investors to take direct control of their proportional part of the claim against the insolvency estate of Madoff Securities and also enabled them to sell their claim directly or by means of a sales procedure through a private auction organized by OIS.
As a result of this transaction, 1,021 million shares of the 1,539 million issued by the SPV are now directly owned by the unitholders of the three aforementioned Optimal Strategic US Equity funds that accepted the exchange of their units in the fund for shares of the SPV. Furthermore, 991 million of those 1,021 million shares were sold in the subsequent private auction organized by OIS, while 30 million opted not to participate in the auction. The remaining fund unitholders decided to maintain their units in the funds and not participate in the transaction.
The price reached in the auction of the SPV shares was equal to 72.14% of the amount of the claim against Madoff Securities, which meant that those unitholders were able to recover approximately 35% of the value of their investment in the Optimal Strategic US Equity funds at October 30, 2008.
The Santander Group, as a unitholder of the Optimal Strategic US Equity funds, opted to accept the exchange and subsequent partial sale of a portion of its units in the funds, and it recognized in the 2011 income statement, as a result of the cash proceeds from that sale, a recovery of approximately €249 million of the initial loss.
At December 31, 2011, the Santander Group held an interest of approximately 20% in the SPV through the Optimal Strategic US Equity fund.
AtAs of the date hereof,of this report, certain claims havehad been filed in relation to this matter. The Group is currently assessing the appropriate legal action to be taken. As indicated above, the Group considers that it has at all times exercised due diligence and that these products have always been sold in a transparent way pursuant to applicable legislation and established procedures. Therefore, except for the three casesa specific case in which the decisions handed down partially upheld the claim based on the particular circumstances of these casesthat case (which havehas been appealed against by the Bank), no provisions were recognized for the other claims since the risk of loss is considered to be remote.
197
If
The swaps under debate included swaps arranged by Banco Santander Totta with the definitions applicablepublic companies Metropolitano de Lisboa, E.P.E. (MdL), Metro de Porto, S.A. (MdP), Sociedade de Transportes Colectivos do Porto, S.A. (STCP) and Companhia Carris de Ferro de Lisboa, S.A. (Carris). These swaps were arranged prior to 2008, i.e. before the Trust PIERS, Sovereign would be obligedstart of the financial crisis, and had been executed without incident.
In view of this situation Banco Santander Totta took the initiative to payrequest a considerably higher interest ratecourt judgment on the Sovereign subordinated debentures held in trust for the holdervalidity of the Trust PIERS andswaps in the principal amountjurisdiction of the debentures would accreteUnited Kingdom to USD 50 per debenture aswhich the swaps are subject. The corresponding claims were filed in May 2013.
After the Bank had filed the claims, the four companies (MdL, MdP, STCP and Carris) notified Banco Santander Totta that they were suspending payment of the effective dateamounts owed under the swaps until a final decision had been handed down in the UK jurisdiction in the proceedings. MdL, MdP and Carris suspended payment in September 2013 and STCP did the same in December 2013.
Consequently, Banco Santander Totta extended each of the “change of control”. Underclaims to include the Trust PIERS, no “change of control” occurs if, among other reasons,unpaid amounts.
On November 29, 2013, the considerationcompanies presented their defences in which they claimed, namely, that the acquisition consisted of shares of common stock traded on a national securities exchange.swaps were null and void under Portuguese law and, accordingly, that they should be refunded the amounts paid.
On February 14, 2014, Banco Santander S.A. issued American Depositary Shares (ADSs) in relationTotta presented its replies and defences to the acquisition that were traded on the New York Stock Exchange.
The increased rate in the event of a “change of control” is defined in the indenture as the greater of (i) 7.41% per annum; and (ii) the rate determined by a reference agent in accordance with a process established in the indenture.
There is no “change of control” under the Trust PIERS indenture, among other reasons, if the consideration for the acquisition consisted of shares of common stock listed on a national securities market. Banco Santander issued American Depositary Shares (ADSs) in relation to the acquisition that were traded and continue to be traded on the New York Stock Exchange.
The NY Court was asked to declare that the acquisition of Sovereign was a “change of control” under the Indenture and the Trustee requested damages equal to the interest that the complaint alleges should have been paid by Sovereign to the Trust PIERS holders. On December 13, 2011, the NY Court issuedcounterclaims, restating its decision granting the Trustee’s motion for summary judgmentcase and denying the cross-motion filed by Sovereign. The NY Court ruled that the term “common stock” usedcompanies’ arguments, as set out in the “change of control” provision of the Indenture did not include ADSs and, therefore, a “change of control” had occurred. The NY Court referred the matter of the calculation of damages to a magistrate judge. This inquest on damages is unlikely to be concluded before June 2012. A final judgment that may be appealed will not enter until damages are determined.
At December 31, 2011, the Group had recognized provisions for the estimated amount of the contingency with third parties (USD 139 million), which includes the accrued interest at 7.410% from January 31, 2009 to December 31, 2011 and the value of accreting the debentures to par (USD 50). In its Application for Damages submitted on March 16, 2012, the Trustee claimed that the reset rate under the Indenture should be 13.61%, which if accepted by the NY Court would increase the impact of the unfavorable outcome described above. The Trustee requests damages in excess of USD 277,707,040 for unpaid back interest through March 12, 2012 plus approximately USD 2,000,000 in legal fees. The Group’s liability would be 40.53% of the total claim, percentage which represents the contingency with third parties.their November 29 defences.
On April 16, Sovereign4, 2014, the companies submitted a responsetheir replies to the Trustee’s Damages Application, arguing that the reset rate should bedefences to counterclaims. These proceedings are still in no event higher than 8.31%. The magistrate has yet to schedule a hearing as to damages. The Group continues to assert that the acquisition of Sovereign by Banco Santander did not constitute a “change of control” under the Trust PIERS Indenture and that the Trustee’s damages are exaggerated. Accordingly, Sovereign intends to appeal the NY Court’s finding that the acquisition was a “change of control” and the damages assessed, upon completion of the inquest and entry of a final judgment against Sovereign.
* * * * *progress.
The Bank and its subsidiarieslegal advisers consider that the Bank acted at all times in accordance with applicable legislation and under the terms of the swaps, and take the view that the UK courts will confirm the full validity and effectiveness of the swaps. As a result, the Bank has not recognized any provisions in connection with this matter.
The Bank and the other Group companies are from time to time subject to certain claims and, partiestherefore, are party to certain legal proceedings incidental to the normal course of itstheir business including(including those in connection with the Group’s lending activities, relationships with the Group’s employees and other commercial or tax matters.matters).
Uncertainties exist about whatIn this context, it must be considered that the eventual outcome of these pending matters will be, whatcourt proceedings is uncertain, particularly in the timingcase of the ultimate resolution of these matters will be or what the eventual loss, fines or penalties related to each pending matter may be particularly where the claimants seek veryclaims for large or indeterminate damages, or where the cases present novelamounts, those based on legal theories, involveissues for which there are no precedents, those that affect a large number of parties or are in early stages of discovery.those at a very preliminary stage.
Considering allWith the information available information,to it, the Bank believesGroup considers that at December 31, 2013, 2012 and 2011, 2010 and 2009 year-end the Groupit had reliably estimated the obligation related toobligations associated with each proceeding and had recognized, adequatewhere necessary, sufficient provisions when required, thatto cover reasonably cover theany liabilities that mightmay arise fromas a result of these tax-relatedtax and non-tax-related proceedings andlegal situations. It also believes that liabilities related toany liability arising from such claims and proceedings shouldwill not have, in the aggregate,overall, a material adverse effect on the Group’s business, financial condition,position or results of operations.
198
The total amount of payments made by the Group arising from litigation in 2011, 2010 and 2009 is not material with respect to these consolidated financial statements.
In view of the inherent difficulty of predicting the outcome of legal matters, particularly where the claimants seek very large or indeterminate damages, or where the cases present novel legal theories, involve a large number of parties or are in early stages of discovery, the BankGroup cannot state with confidence what the eventual outcome of any of these pending matters will be, what the timing of the ultimate resolution of such matters will be or what the eventual loss, fines or penalties related to each such pending matter may be. Consequently, there is no assurance that the ultimate resolution of these matters will not significantly exceed the reserves currently accrued by the Bank;Group; and the outcome of a particular matter may be material to the Bank’sGroup’s operating results for a particular period, depending upon, among other factors, the size of the loss or liability imposed and the level of the Bank’sGroup’s income for that period.
Dividend PolicyShareholders remuneration
We have normally paid an annual dividend in quarterly installments. The table below sets forth the historical per share and per ADS (each of which represents the right to receive one of our shares) amounts of interim and total dividendsremuneration in respect of each fiscal year indicated.indicated, distributed quarterly.
| Euro per Share Interim | Dollars per ADS Interim | Euro per Share | Dollars per ADS | |||||||||||||||||||||||||||||||||||||||||||||||||||||||||||||||||||||||||||||
| First | Second | Third | Fourth | Total | First | Second | Third | Fourth | Total | First | Second | Third | Fourth | Total | First | Second | Third | Fourth | Total | |||||||||||||||||||||||||||||||||||||||||||||||||||||||||||||
2006 | 0.11 | 0.11 | 0.11 | 0.20 | 0.52 | 0.12 | 0.12 | 0.11 | 0.22 | 0.57 | ||||||||||||||||||||||||||||||||||||||||||||||||||||||||||||||||||||||
2007 | 0.12 | 0.12 | 0.12 | 0.28 | 0.65 | 0.14 | 0.15 | 0.15 | 0.36 | 0.79 | 0.12 | 0.12 | 0.12 | 0.28 | 0.65 | 0.14 | 0.15 | 0.15 | 0.36 | 0.79 | ||||||||||||||||||||||||||||||||||||||||||||||||||||||||||||
2008 | 0.14 | 0.14 | 0.12 | 0.26 | 0.65 | 0.17 | 0.14 | 0.13 | 0.27 | 0.70 | 0.14 | 0.14 | 0.12 | 0.26 | 0.65 | 0.17 | 0.14 | 0.13 | 0.27 | 0.70 | ||||||||||||||||||||||||||||||||||||||||||||||||||||||||||||
2009 | 0.14 | 0.12 | 0.12 | 0.22 | 0.60 | 0.16 | 0.14 | 0.14 | 0.24 | 0.67 | 0.14 | 0.12 | 0.12 | 0.22 | 0.60 | 0.16 | 0.14 | 0.14 | 0.24 | 0.67 | ||||||||||||||||||||||||||||||||||||||||||||||||||||||||||||
2010 | 0.14 | 0.12 | 0.12 | 0.23 | 0.60 | 0.14 | 0.13 | 0.13 | 0.25 | 0.65 | 0.14 | 0.12 | 0.12 | 0.23 | 0.60 | 0.14 | 0.13 | 0.13 | 0.25 | 0.65 | ||||||||||||||||||||||||||||||||||||||||||||||||||||||||||||
2011(*) | 0.14 | 0.13 | 0.12 | 0.22 | 0.60 | 0.15 | 0.14 | 0.12 | n.a. | n.a. | ||||||||||||||||||||||||||||||||||||||||||||||||||||||||||||||||||||||
2011 | 0.14 | 0.13 | 0.12 | 0.22 | 0.60 | 0.15 | 0.14 | 0.12 | 0.23 | 0.64 | ||||||||||||||||||||||||||||||||||||||||||||||||||||||||||||||||||||||
2012 | 0.15 | 0.15 | 0.15 | 0.15 | 0.60 | 0.14 | 0.19 | 0.21 | 0.21 | 0.75 | ||||||||||||||||||||||||||||||||||||||||||||||||||||||||||||||||||||||
2013(*) | 0.15 | 0.15 | 0.15 | 0.15 | 0.60 | 0.15 | 0.15 | 0.16 | 0.21 | 0.67 | ||||||||||||||||||||||||||||||||||||||||||||||||||||||||||||||||||||||
| (*) | As of the date of this annual report on Form 20-F, the fourth dividend has not yet been |
The shareholders at the annual shareholders’ meeting held on June 19, 2009 approved a dividend of €0.6508 per share to be paid out of our profits for 2008. In accordance with IAS 33, for comparative purposes, dividends per share paid, as disclosed in the table above, take into account the adjustment arising from the capital increase with pre-emptive subscription rights carried out in December 2008. As a result of this adjustment, the dividend per share for 2008 amounts to €0.6325. The shareholders also approved a new remuneration scheme (scrip dividend), whereby the Bank offered the shareholders the possibility to opt to receive an amount equivalent to the second interim dividend on account of the 2009 financial yeardividends in cash or new shares. In light of the acceptance of this remuneration program (81% of the capital opted to receive shares instead of cash), at the general shareholders’ meetings held in June 2010 and 2011, the shareholders approved to offer again this option to the shareholders as payment for the second and third interim dividends on account of 2010 and 2011. The remuneration per share approved in subsequent annual shareholders’ meetings for 2009, 2010, 2011, 2012 and 20112013 disclosed above, €0.60, is calculated assuming that the four dividendspayments for these years (either cash dividends or scrip dividends) were paidmade in cash. In 2010 and 2011, 85% and 80% of the capital, respectively, opted to receive the second and third interim dividends in the form of shares instead of cash. Additionally, at its meeting on December 19, 2011, the board of directors resolved to apply the scrip dividend program on the dates on which the fourth interim dividend is traditionally paid, and offered shareholders the option of receiving an amount equal to this dividend of €0.220 per share, to be paid in shares or cash. This resolution was approved by the annual general shareholders’ meeting held on March 30, 2012.
Banco Santander paid on account of 2011:2013:
A first interim dividend of €0.135 per share (August 2011).
A scrip dividend of €0.126€0.15 per share equivalent to the first interim dividend (August 2013);
A scrip dividend of €0.119€0.15 per share equivalent to the third interim dividend (February 2012)2014); and
199
•
Following the increase of capital of the third interim dividend, the Bank’s share capital at the date of this annual report on Form 20-F was €4,538,426,700€5,780,533,573.50 represented by 9,076,853,40011,561,067,147 shares, par value €0.50 each.
Banco Santander assigned EUR 5,260€6,775 million to shareholder remuneration in 2011, 5.2%2013, 11.3% more than in 2010. The high degree of recurrence of profits and the soundness of Santander’s capital has enabled the Bank to pay out more than €24 billion in the last five years.2012.
For a discussion of regulatory and legal restrictions on our payments of dividends, see “Item 4. Information on the Company—B. Business Overview—Supervision and Regulation—Restrictions on Dividends” herein.
For a discussion of Spanish taxation of dividends, see “Item 10. Additional Information—E. Taxation—Spanish tax considerations—Taxation of dividends” herein.
The dividends paid on the guaranteed non-cumulative preference stock of certain of our subsidiaries are limited by our Distributable Profits in the fiscal year preceding a dividend payment. “Distributable Profits” with respect to any year means our reported net profits after tax and extraordinary items for such year as derived from the Parent bank’s non-consolidated audited profit and loss account prepared in accordance with Bank of Spain requirements and guidelines in effect at the time of such preparation. Such requirements and guidelines may be expected to reflect the Bank of Spain regulatory policies applicable to us, including without limitation those relating to the maintenance of minimum levels of capital. See “Item 4. Information on the Company—B. Business Overview—Supervision and Regulation—Capital Adequacy Requirements” and “—Restrictions on Dividends” herein. According to our interpretation of the relevant Bank of Spain requirements and guidelines, Distributable Profits during the preceding five years were:
Year Ended December 31, | Year Ended December 31, | Year Ended December 31, | ||||||||||||||||||||||||||||||||
IFRS-IASB | IFRS-IASB | IFRS-IASB | ||||||||||||||||||||||||||||||||
2007 | 2008 | 2009 | 2010 | 2011 | ||||||||||||||||||||||||||||||
| 2009 | 2009 | 2010 | 2011 | 2012 | 2013 | |||||||||||||||||||||||||||||
| (in millions of euros) | (in millions of euros) | (in millions of euros) | ||||||||||||||||||||||||||||||||
4,070 | 4,826 | 4,151 | 3,332 | 2,151 | ||||||||||||||||||||||||||||||
| 4,151 | 3,332 | 2,151 | 1,355 | 1,030 | ||||||||||||||||||||||||||||||
The portion of our net income attributable to our subsidiaries has increased steadily in recent years as our subsidiaries have grown and we have acquired new subsidiaries. Such profits are available to us only in the form of dividends from our subsidiaries and we are dependent to a certain extent upon such dividends in order to have Distributable Profits sufficient to allow payment of dividends on our guaranteed preferred stock of our subsidiaries as well as dividends on our shares (although the payment of dividends on the shares is limited in the event of the non-payment of preference share dividends). We generally control a sufficient proportion of our consolidated subsidiaries’ voting capital to enable us to require such subsidiaries to pay dividends to the extent permitted under the applicable law. As a result of our growth, the Bank, as the holding entity of the shares of our various companies, has added investments in our subsidiaries, the financial costs of which are borne by us.
For significant changes that have occurred since December 31, 2011, seeOn April 29, 2014 we published our filingsfirst quarter 2014 results, which are available on our website at www.santander.com under the heading “Investor Relations“, and will be furnished promptly to the SEC on Form 6-K with the Securities and Exchange Commission.
200
Market Price and Volume Information
Santander’s Shares
In 2011,2013, Santander was the second most actively traded stock on the Spanish stock exchange. As at December 31, 2011,2013, the stock had a 15.68%an 17.11% weighting in the IBEX 35 Index and was ranked secondfirst among all Spanish issuers represented in this index. Santander’s stock weighting in the Euro Stoxx 50 was, at year end, 3.76%3.84%, placing it in fifth position. Our market capitalization of €50,290€73,735 million at 20112013 year-end was the second largest of any Spanish company.bank in the euro zone by market capitalization and the 11th in the world in 2013.
At December 31, 2011, we had 3,293,537 registered holders of our shares and, as of such date,2013 a total of 1,035,247,9281,374,949,687 shares, or 11.62%12.13% of our share capital, were held by 1,1521,287 registered holders with registered addresses in the United States and Puerto Rico, including JP MorganJPMorgan Chase, as depositary of our American Depositary Share Program.
Our shares are traded on Spain’s automated “continuous market”, the national, centralized market which integrates by computer quotations originating in the four Spanish stock exchanges (Madrid, Barcelona, Valencia and Bilbao) (the “Automated Quotation Systems”). Our shares are also listed on the New York (in the form of American Depositary Shares), London, Milan, Lisbon, Buenos Aires and Mexico Stock Exchanges. At December 31, 2011, 56.01%2013, 53.82% of our shares were held of record by non-residents of Spain.
The table below sets forth the high and low of the daily closing prices and last daily sales prices in euros for our shares on the Spanish continuous market for the periods indicated.
201
| Euros per Share | Euros per Share | |||||||||||||||||||||||
| High | Low | Last | High | Low | Last | |||||||||||||||||||
2007 Annual | 15.00 | 12.56 | 14.79 | |||||||||||||||||||||
2008 Annual | 14.59 | 5.11 | 6.75 | |||||||||||||||||||||
2009 Annual | 11.96 | 4.00 | 11.55 | 11.96 | 4.00 | 11.55 | ||||||||||||||||||
2010 Annual | 11.98 | 7.30 | 7.93 | |||||||||||||||||||||
2011 Annual | 9.32 | 5.13 | 5.87 | |||||||||||||||||||||
2010 Annual | 11.98 | 7.30 | 7.93 | |||||||||||||||||||||
2012 Annual | 6.68 | 4.17 | 6.10 | |||||||||||||||||||||
First Quarter | 11.98 | 9.24 | 9.84 | 6.59 | 5.45 | 5.77 | ||||||||||||||||||
Second Quarter | 10.79 | 7.36 | 8.74 | 5.78 | 4.25 | 5.22 | ||||||||||||||||||
Third Quarter | 10.43 | 8.68 | 9.32 | 6.29 | 4.04 | 5.80 | ||||||||||||||||||
Fourth Quarter | 9.63 | 7.30 | 7.93 | 6.13 | 5.43 | 5.88 | ||||||||||||||||||
2011 Annual | 9.32 | 5.13 | 5.87 | |||||||||||||||||||||
2013 Annual | 6.77 | 4.84 | 6.51 | |||||||||||||||||||||
First Quarter | 9.32 | 7.40 | 8.19 | 6.62 | 5.23 | 5.24 | ||||||||||||||||||
Second Quarter | 8.66 | 7.51 | 7.96 | 5.63 | 4.84 | 4.90 | ||||||||||||||||||
Third Quarter | 8.17 | 5.26 | 6.22 | 6.08 | 4.87 | 6.03 | ||||||||||||||||||
Fourth Quarter | 6.44 | 5.13 | 5.87 | 6.77 | 6.04 | 6.51 | ||||||||||||||||||
2012 First Quarter | 6.59 | 5.45 | 5.77 | |||||||||||||||||||||
2014 First Quarter | 6.92 | 6.22 | 6.92 | |||||||||||||||||||||
Last six months | ||||||||||||||||||||||||
2011 | ||||||||||||||||||||||||
2013 | ||||||||||||||||||||||||
October | 6.44 | 5.86 | 6.18 | 6.77 | 6.14 | 6.54 | ||||||||||||||||||
November | 5.88 | 5.13 | 5.60 | 6.58 | 6.34 | 6.54 | ||||||||||||||||||
December | 5.97 | 5.50 | 5.87 | 6.51 | 6.04 | 6.51 | ||||||||||||||||||
2012 | ||||||||||||||||||||||||
2014 | ||||||||||||||||||||||||
January | 6.16 | 5.45 | 5.95 | 6.83 | 6.26 | 6.41 | ||||||||||||||||||
February | 6.60 | 6.16 | 6.23 | 6.62 | 6.22 | 6.57 | ||||||||||||||||||
March | 6.47 | 5.68 | 5.77 | 6.92 | 6.36 | 6.92 | ||||||||||||||||||
April (through April 26, 2012) | 5.78 | 4.64 | 4.75 | |||||||||||||||||||||
April (through April 28, 2014) | 7.23 | 6.93 | 7.05 | |||||||||||||||||||||
On April 26, 2012,28, 2014, the reported last sale price of our shares on the continuous Spanish market was €4.75.€7.05.
American Depositary Shares
Our ADSs have been listed and traded on the New York Stock Exchange since July 30, 1987. Each ADS represents one of our shares and is evidenced by an American Depositary Receipt or “ADR.” The deposit agreement, pursuant to which ADRs have been issued, is among us, JP Morgan Chase, as depositary, and the holders from time to time of ADRs. At December 31, 2011,2013, a total of 260,769,574373,784,479 of our ADSs were held by 20,65319,039 registered holders. Since certain of such of our shares and our ADSs are held by nominees, the number of record holders may not be representative of the number of beneficial owners.
202
The table below sets forth the reported high and low of the daily closing prices and last saledaily sales prices for our ADSs on the New York Stock Exchange for the periods indicated.
| Dollars Per ADS | Dollars Per ADS | |||||||||||||||||||||||
| High | Low | Last | High | Low | Last | |||||||||||||||||||
2007 Annual | 22.14 | 17.29 | 21.54 | |||||||||||||||||||||
2008 Annual | 22.24 | 6.06 | 9.49 | |||||||||||||||||||||
2009 Annual | 17.83 | 4.90 | 16.44 | 17.83 | 4.90 | 16.44 | ||||||||||||||||||
2010 Annual | 17.50 | 8.77 | 10.65 | |||||||||||||||||||||
2011 Annual | 12.69 | 6.80 | 7.52 | |||||||||||||||||||||
2010 | ||||||||||||||||||||||||
Annual | 17.50 | 8.77 | 10.65 | |||||||||||||||||||||
2012 Annual | 8.76 | 4.89 | 8.17 | |||||||||||||||||||||
First Quarter | 17.50 | 12.65 | 13.27 | 8.76 | 6.91 | 7.67 | ||||||||||||||||||
Second Quarter | 14.77 | 8.77 | 10.50 | 7.74 | 5.25 | 6.56 | ||||||||||||||||||
Third Quarter | 13.73 | 10.92 | 12.66 | 8.29 | 4.89 | 7.04 | ||||||||||||||||||
Fourth Quarter | 13.46 | 9.62 | 10.65 | 8.17 | 6.92 | 8.17 | ||||||||||||||||||
2011 | ||||||||||||||||||||||||
Annual | 12.69 | 6.80 | 7.52 | |||||||||||||||||||||
2013 Annual | 9.29 | 6.43 | 9.07 | |||||||||||||||||||||
First Quarter | 12.69 | 9.74 | 11.71 | 8.81 | 6.77 | 6.81 | ||||||||||||||||||
Second Quarter | 12.48 | 10.66 | 11.51 | 7.47 | 6.46 | 6.47 | ||||||||||||||||||
Third Quarter | 11.87 | 7.38 | 8.04 | 8.21 | 6.43 | 8.17 | ||||||||||||||||||
Fourth Quarter | 9.20 | 6.80 | 7.52 | 9.29 | 8.31 | 9.07 | ||||||||||||||||||
2012 First Quarter | 8.76 | 6.91 | 7.67 | |||||||||||||||||||||
2014 First Quarter | 9.58 | 8.36 | 9.58 | |||||||||||||||||||||
Last six months | ||||||||||||||||||||||||
2011 | ||||||||||||||||||||||||
2013 | ||||||||||||||||||||||||
October | 9.20 | 7.68 | 8.56 | 9.29 | 8.31 | 8.91 | ||||||||||||||||||
November | 8.16 | 6.80 | 7.48 | 8.94 | 8.49 | 8.94 | ||||||||||||||||||
December | 7.96 | 7.11 | 7.52 | 9.07 | 8.38 | 9.07 | ||||||||||||||||||
2012 | ||||||||||||||||||||||||
2014 | ||||||||||||||||||||||||
January | 8.15 | 6.91 | 7.88 | 9.40 | 8.60 | 8.64 | ||||||||||||||||||
February | 8.76 | 8.08 | 8.30 | 9.11 | 8.36 | 9.05 | ||||||||||||||||||
March | 8.52 | 7.59 | 7.67 | 9.58 | 8.80 | 9.58 | ||||||||||||||||||
April (through April 26, 2012) | 7.74 | 6.10 | 6.35 | |||||||||||||||||||||
April (through April 28, 2014) | 9.93 | 9.58 | 9.78 | |||||||||||||||||||||
On April 26, 2012,28, 2014, the reported last sale price of our ADSs on the New York Stock Exchange was $6.35.$9.78.
Not Applicable
General
Spanish Securities Market
The Spanish securities market for equity securities (the “Spanish Stock Exchanges”) consists of four stock exchanges located in Madrid, Barcelona, Bilbao and Valencia (the “local exchanges”). The majority of the transactions conducted on them are done through the Automated Quotation System ((Sistema Interbancario Bursátil Español or “S.I.B.E.“S.I.B.E.”). During the year ended December 31, 2011,2013, the Automated Quotation System accounted for the majority of the total trading volume of equity securities on the Spanish Stock Exchanges.
203
Automated Quotation System
The Automated Quotation System was introduced in 1989 and links the four local exchanges, providing those securities listed on it with a uniform continuous market that eliminates most of the differences among the local exchanges. The principal feature of the system is the computerized matching of buy and sell orders at the time of entry of the order. Each order is executed as soon as a matching order is entered, but can be modified or canceled until executed. The activity of the market can be continuously monitored by investors and brokers. The Automated Quotation System is operated and regulated by the Sociedad de Bolsas, a corporation owned by the companies that manage the local exchanges. All trades on the Automated Quotation System must be placed through a bank, brokerage firm, an official stock broker or a dealer firm member of a Spanish stock exchange directly.
There is a pre-opening session held from 8:30 a.m. to 9:00 a.m. each trading day on which orders are placed at that time. The computerized trading hours are from 9:00 a.m. to 5:30 p.m. Each session will end with a 5 minute auction, between 5:30 and 5:35 p.m., with a random closedown of 30 seconds. The price resulting from each auction will be the closing price of the session.
From May 14, 2001, new rules came into effect regarding the maximum price fluctuations in the price of stocks. Under the new rules, each stock in the continuous market is assigned a static and a dynamic range within which the price of stocks can fluctuate. The price of a stock may rise or fall by its static range (which is published once a month and is calculated according to the stock’s average historic price volatility) above or below its opening price (which shall be the closing price of the previous session). When the stock trades outside of this range, the trading of the stock is suspended for 5 minutes, during which an auction takes place. After this auction, the price of the stock can once again rise or fall by its static range above or below its last auction price (which will be considered as the new static price before triggering another auction). Furthermore, the price of a stock cannot rise or fall by more than its dynamic price range (which is fixed and published once a month and is calculated according to the stock’s average intra-day volatility), from the last price at which it has traded. If the price variation exceeds the stock’s dynamic range a five minute auction is triggered.
Moreover, there is a block market ((el mercado de bloques)bloques) allowing for block trades between buyers and sellers from 9:00 a.m. to 5:30 p.m. during the trading session. Under certain conditions, this market allows cross-transactions of trades at prices different from prevailing market prices. Trading in the block market is subject to certain limits with regard to price deviations and volumes.
Between 5:30 p.m. and 8:00 p.m., trades may occur outside the computerized matching system without prior authorization of the Sociedad de Bolsas, at a price within the range of 5% above the higher of the average price and closing price for the day and 5% below the lower of the average price and closing price for the day, if there are no outstanding bids or offers, as the case may be, on the system matching or bettering the terms of the proposed off-system transaction, and if the trade involves more than EUR 300,000€300,000 and more than 20% of the average daily trading volume of the stock during the preceding quarter. At any time before 8:00 p.m., trades may take place (with the prior authorization of the Sociedad de Bolsas) at any price if:
•
relates to a merger or spin-off of a listed company;
relates to the reorganization of a business group;
the transaction is executed for the purposes of settling litigation;
involves certain types of contracts or complex transactions; or
the Sociedad de Bolsas finds other justifiable cause.
Information with respect to computerized trades between 9:00 a.m. and 5:30 p.m. is made public immediately, and information with respect to trades outside the computerized matching system is reported to the Sociedad de Bolsas and published in theBoletín de Cotización and in the computer system by the next trading day.
204
Clearance and Settlement System
Until April 1, 2003, transactions carried out on the regional Spanish stock exchanges and the continuous market were cleared and settled through the Servicio de Compensación y Liquidación de Valores, S.A. (the “SCL”). Since April 1, 2003, the settlement and clearance of all trades on the Spanish stock exchanges, the Public Debt Market (Mercado(Mercado de Deuda Pública)blica), the AIAF Fixed Income Market ((Mercado AIAF de Renta Fija)Fija) and Latibex —the- the Latin American stock exchange- denominated in euros, are made through the Sociedad de Gestión de los Sistemas de Registro, Compensación y Liquidación de Valores, S.A. (“Iberclear”), which was formed as a result of a merger between SCL and Central de Anotaciones del Mercado de Deuda Pública (the latter of which was managed by the Bank of Spain).
Book-Entry System
Ownership of shares listed on any Spanish stock exchange is required to be represented by entries in a register maintained by Iberclear, which is the Spanish Central Securities Depositary, and transfers or changes in ownership are effected by entries in such register. The securities register system is structured in two levels: the central registry managed by Iberclear which keeps the securities balances of the participants, and a detailed registry managed by the participants where securities are listed by holder’s name.
Securities Market Legislation
The Spanish Securities Markets Act, which came into effect in 1989, among other things:
established an independent regulatory authority, the CNMV, to supervise the securities markets;
established a framework for the regulation of trading practices, tender offers and insider trading;
required stock exchange members to be corporate entities;
required companies listed on a Spanish stock exchange to file annual audited financial statements and to make public quarterly financial information;
established a framework for integrating quotations on the four Spanish stock exchanges by computer;
exempted the sale of securities from transfer and value added taxes;
deregulated brokerage commissions as of 1992; and
provided for transfer of shares by book-entry or by delivery of evidence of title.
The Securities Markets Act was amended by Law 37/1998, which implemented two European Union directives into Spanish law. The first is Directive 93/22/CE, relating to investment services within securities, later amended by Directive 95/26/CE of the European Parliament and Council. The second is Directive 97/9/CE of the European Parliament and Council, relating to indemnity systems.
Law 37/1998 introduced some innovations to the Securities Markets Act. The first was the recognition that both Spanish and other European Union Member State companies authorized to provide investment services have full access to the official secondary markets, with full capacity to operate, thereby enabling the direct admission of banking entities into the stock exchange area. The second innovation was that the scope of the Securities Markets Act was enlarged to include a list of financial instruments, such as financial exchange contracts, or installment financial contracts, which expanded the categories of securities included.
The Securities Markets Act has been further amended by Law 44/2002 (November 22, 2002) on reform measures of the financial system, which introduced certain modifications to the laws governing financial markets and corporations, generally, including:
provisions regarding market transparency such as: requiring listed companies to establish an audit committee, redefining the reporting requirements for material facts, rules relating to the treatment of confidential and insider information and related party transactions, and prevention of manipulative and fraudulent practices with respect to market prices;
205
the establishment of Iberclear; and
the authorization of the Minister of Economy and Competitiveness to regulate financial services electronic contracts.
On July 17, 2003, the Securities Market law was amended by Law 26/2003 in order to reinforce the transparency of listed companies. It introduced:
information and transparency obligations including detailed requirements of the contents of the corporate website of listed companies and the obligation to file with the CNMV an annual corporate governance report; and
the obligation to implement a series of corporate governance rules including, among others, regulations regarding the boards of directors and the general shareholders’ meetings.
On March 11, 2005, Royal Decree Law 5/2005 was approved, modifying the Securities Market Law in order to implement the Directive 2003/71/EC of the European Parliament and of the Council on the prospectus to be published when securities are offered to the public or admitted to trading. The Directive: (i) harmonizes the requirements for the process of approval of prospectuses, which enables a prospectus to be valid throughout the European Union; and (ii) incorporates the application of the country of origin principle.
On April 22, 2005, the Securities Market Law was amended by Law 5/2005 on supervision of financial conglomerates in order to make the sectoralsectorial rules applicable to investment firms more consistent with other sectoralsectorial rules applicable to other groups with similar financial activities, such as credit institutions and insurance undertakings.
On November 14, 2005, the Securities Market Law was further amended by Law 19/2005, which refers to the European public limited-liability companies with registered offices in Spain and, on November 24, 2005, by Law 25/2005, of November 24, 2005, which regulates the capital risk entities.
Royal Decree 1310/2005 (November 4) partially developed the Securities Market Law 24/1988, in relation to the admission to trading of securities in the official secondary markets, the sale or subscription public offers and the prospectus required to those effects.
Royal Decree 1333/2005 (November 11), which developed the Securities Market Law 24/1988, in relation to market abuse.
Law 12/2006 (May 16) amended the Securities Market Law byby: (i) introducing a new article relating to notifications to the CNMV of transactions that might constitute insider dealing or market manipulation, (ii) completing the regulation of Bolsas y Mercados Españoles, and (iii) clarifying the regulation of significant participations on the entities which manage the clearing and settlement of securities and the Spanish secondary markets.
Law 36/2006 (November 30), relating to measures to prevent the tax fraud, among others, amends article 108 of the Securities Market Law.
Law 6/2007 (April 12) amends the Securities Market Law, in order to modify the rules for takeover bids and for issuers transparency. This Law came into effect on August 13, 2007, and partially integrates into the Spanish legal system Directive 2004/25/EC of the European Parliament and of the Council of April 21, 2004 on takeover bids and Directive 2004/109/EC of the European Parliament and of the Council of December 15, 2004 on the harmonization of transparency requirements in relation to information about issuers whose securities are admitted to trading on a regulated market and amending Directive 2001/34/EC. This Law has been further developed by Royal Decree 1066/2007 (July 27) on rules applicable to takeover bids for securities and by Royal Decree 1362/2007 (October 19) on transparency requirements for issuers of listed securities. For a brief description of the provisions of Law 6/2007 as regards the rules applicable to takeover bids see “Item 10. Additional Information—B. Memorandum and Articles of Association—Tender Offers”.
206
Law 6/2007 (i) introduces several changes to the periodical financial information, annual, biannual and quarterly, to be published by issuers of listed securities; and (ii) introduces new developments to the system which establishes the duty to notify significant stakes in an enterprise, such as:
Anyone with a right to acquire, transfer or exercise voting rights granted by the shares, regardless of the actual ownership of the shares; and anyone owing,owning, acquiring or transferring other securities or financial instruments which grant a right to acquire shares with voting rights, will also have to notify the holding of a significant stake in accordance with the developing regulations;
Directors of listed companies, in addition to notifying any transaction concerning the shares or other securities or financial instruments of the issuer which are linked to these shares, will have to inform the CNMV of their stake upon appointment or resignation; and
Listed companies will be required to notify transactions concerning their treasury shares in certain cases, which will be established in the developing regulations.
Law 47/2007 (December 19) amends the Securities Market Law in order to adapt it to Directive 2004/39/EC on markets in financial instruments (MiFID), Directive 2006/73/EC implementing Directive 2004/39/EC with respect to the organizational requirements and operating conditions for investment firms and defining terms for the purpose of that Directive, and Directive 2006/49/EC on the capital adequacy of investment firms and credit institutions. The amendments introduced by Law 47/2007 represent important reforms of the Securities Market Law and serve to (i) increase the number of investment services that can be performed by the entities; (ii) reinforce the measures for the protection of investors; (iii) establish new organizational procedures for investment firms; and (iv) reinforce the supervisory powers of the CNMV, establishing cooperation mechanisms among supervisory authorities. Directive 2006/49/EC and MiFID implementation have been introduced by Royal Decrees 216/2008 and 217/2008 (both of February 15), respectively.
Law 32/2011 of October 4, 2011, amending Law 24/1988 of July 28, 1988, on the securities market, introduced a central counterparty for equity transactions imposing the obligation to carry out all equity transactions traded through a central counterparty. Other relevant amendments of Law 32/2011 of October 4, 2011, include the introduction of a right of withdrawal in the event of insolvency of the entities in charge of keeping the registry and of participating entities and the pro rata rule. Modifications were also made to the regulatory regime of Iberclear, which is in charge of both the register of securities held in book-entry form and their clearing and settlement. Specifically, the new rules facilitate the relationship between Iberclear and the other agents of the trading and post-trading system and regulate the agreements that Iberclear may carry out to provide a better integration with to the TARGET2-Securities project, which aims to establish a Eurozone-wideeurozone-wide settlement system.
Royal Decree-Law 20/2012 of July 13, 2012 on measures to ensure budgetary stability and the promotion of competitiveness which, among other reforms, amended Law 24/1988 of July 28, 1988 on the Securities Market (and Law 44/2002 of November 22, 2002 on financial system reform measures) to include a new financial instrument in the Spanish legal system, the so-called “internationalization covered bonds” (cédulas de internacionalización). These bonds are similar to “territorial covered bonds” (cédulas territoriales), introduced by Law 44/2002 and are fixed-income securities that may be issued by credit institutions, whose capital and interest are especially secured by loans and credits granted for the internationalization of companies. The total amount of internationalization covered bonds issued by a credit institution may not exceed 70% of the amount of the unrepaid “eligible” loans and credits.
The Law 11/2012 of December 19, 2012 on urgent measures relating to the environment, which included transposition into Spanish legislation of the provisions of the Commission Regulation 1031/2010 of November 12, 2010 on the timing, administration and other aspects of auctioning of greenhouse gas emission allowances, amended by the Commission Regulation 1210/2011 of November 23, 2011, also amended Law 24/1988 of July 28, 1988 on the Securities Market to define the financial institutions that can participate in these auctions and grant the CNMV supervisory, inspection and sanctioning powers in relation to the aforementioned misconduct. It established that investment firms and credit institutions authorized to provide investment services may submit bids to greenhouse gas emission allowance auctions on their customers’ behalf, as well as conduct the activities envisaged in Law 24/1988.
Trading by Santander’s Subsidiaries in the Shares
Some of our subsidiaries, in accordance with customary practice in Spain, and as permitted under Spanish law, have regularly purchased and sold our shares both for their own account and for the accounts of customers. Our subsidiaries have intervened in the market for our shares primarily in connection with customer transactions and, occasionally, in connection with transactions by non-customers that are undertaken for commercial purposes or to supply liquidity to the market when it is reasonable to do so. Such trading activity also has provided a mechanism for accumulating shares that were used to meet conversions into our shares, of bonds issued by us and other affiliated companies and to make offerings of shares. We expect that our subsidiaries may continue to purchase and sell our shares from time to time.
Our trading activities in our shares are limited to those set forth above. The continuous market is driven by orders, which are matched by the market’s computer system according to price and time entered. Santander and Banesto’s broker subsidiaries, Santander Investment Bolsa, S.V., S.A., and Banesto Bolsa, S.A., S.V.B.8, and the other brokers authorized to trade on the continuous market (“Member Firms”) are not required to and do not serve as market makers maintaining independently established bid and ask prices. Rather, Member Firms place orders for their customers, or for their own account, into the market’s computer system. If an adequate counterparty order is not available on the continuous market at that time, the Member Firm may solicit counterparty orders from among its own clients and/or may accommodate the client by filling the client’s order as principal.
Under the Spanish Corporate Enterprises Act, a company and its subsidiaries are prohibited from purchasing shares of the company in the primary market. However, purchase of the shares is permitted in the secondary market provided that: (1) the aggregate nominal value of such purchases (referred to as “treasury stock” or “autocartera”) and of the shares previously held by the company and its subsidiaries does not exceed 10% of the total outstanding capital stock of the company, (2) the purchases are authorized at a meeting of the shareholders of the acquiring company and, if the acquisition relates to shares in the parent company, the acquiring company’s parent, and (3) such purchases, together with the shares previously held by the company and its subsidiaries, do not result in a net equity less than the company’s stock and its legal or by-lawsBylaws undisposable reserves.
207
The law requires that the CNMV be notified each time the acquisition of treasury stock made since the last notification reaches 1% of the voting rights of the company, regardless of any other preceding sales. The Spanish Corporate Enterprises Act establishes, in relation to the treasury stock shares (held by us and our affiliates), that the exercise of the right to vote and other non-financial rights attached to them shall be suspended. Financial rights arising from treasury stock held directly by us, with the exception of the right to allotment of new bonus shares, shall be attributed proportionately to the rest of the shares.
| 8 | Santander Investment Bolsa, S.V., S.A., and Banesto Bolsa, S.A., S.V.B. merged in December 2013 in Santander Investment Bolsa S.V., S.A.U. |
The portion of overall trading volume in Santander ordinary shares transacted by Group subsidiaries continues to vary from day to day and from month to month, and is expected to continue to do so in the future. In 2011, 9.27%2013, 7.59% of the total volume traded in Santander ordinary shares executed on the Primary Spanish Stock Exchange ((Bolsas y Mercados Españoles)oles) was transacted by Santander Investment Bolsa S.V.,S.A. and 3.65%0.94% by Banesto Bolsa S.A., S.V.B. The portion of trading volume in shares allocable to purchases and sales as principal by our companies (treasury shares) was approximately 3.8%4.6% in the same period. The monthly average percentage of outstanding shares held by our subsidiaries ranged from 0.126%0.171% to 0.701%1.264% in 2011.2013. At December 31, 2011,2013, the Parent bank and our subsidiaries held 42,192,0661,425,239 of our shares (0.474%(0.013% of our total capital stock as of that date).
Not Applicable.
Not Applicable.
Not Applicable.
Item 10. Additional Information
Not Applicable.
B. Memorandum and articles of association
The following summary of the material terms of our Bylaws is not meant to be complete and is qualified in its entirety by reference to our Bylaws. Because this is a summary, it does not contain all the information that may be important to you. You should read our Bylaws carefully before you decide to invest. Copies of our Bylaws are incorporated by reference.
The Bylaws of Banco Santander, S.A. were approved by our shareholders acting at the annual general shareholders’ meeting held on June 21, 2008 and incorporated with the office of the Mercantile Registry on August 11, 2008.
Subsequently, sub-sectionssub-subsections 1 and 2 of Article 5 of the Bank’s Bylaws have been updated several times to show the current share capital and the number of shares outstanding. The most recent of such amendments corresponds to the one required by the share capital increase carried out on February 1, 2012January 31, 2014 and filed with the office of the Mercantile Registry on the samefollowing day.
At the 2011 annual general meeting, our shareholders resolved to amend our Bylaws primarily to bring them into line with legislative amendments affecting capital corporations in Spain, including, specifically, those arising from the following sets of legal provisions:
208
In addition, some other provisions aimed at improving or refining the Bank’s rules on corporate governance (in particular, the reduction of the directors’ term of office from five to three years) and at making other technical improvements were passed by our shareholders at the 2011 annual general meeting to amend our Bylaws.
At the 2012 annual general meeting, held on March 30, 2012, our shareholders resolved to amend our Bylaws primarily to bring them into line with recent statutory amendments affecting Spanish Corporate Enterprises Act, including, specifically, those arising from Act 25/2011, of August 1, partially amending the Spanish Corporate Enterprises Act, and from the adoption of Directive 2007/36/EC, of the European Parliament and of the Council, of July 11 2007, on the exercise of certain rights of shareholders in listed companies.
At the 2013 annual general meeting, held on March 22, 2013, our shareholders resolved to amend our Bylaws to achieve two separate goals: (i) to modify the rules on directors’ remuneration to conform them to the Bank’s practices; and (ii) to adjust the Bylaws to recent statutory amendments regarding capital companies (Ley de Sociedades de Capital) by Law 1/2012, of 22 June, on the simplification of the obligations to provide information and documentation regarding mergers and split-offs of capital companies (“Law 1/2012”).
The first goal was achieved by amending section 2 of article 58 of our Bylaws regarding the rules for the remuneration of directors for their duties of supervision and collective decision-making, which has changed from a system of profits participation to one of fixed amount remuneration. For more information on the amendment of section 2 of article 58 of our Bylaws, see below, “Certain Powers of the Board of Directors”.
The second goal was achieved by amending the title and sections 1 and 2 in article 61 of our Bylaws to conform the provision to the latest amendment of article 11 bis of the Spanish Corporate Enterprises Act pursuant to Law 1/2012. First, the amendment of the title of the article was intended to specify the corporate nature of the website, in line with the nomenclature used by the law. Second, section 1 includes now a new rule that gives the shareholders at the General Shareholders’ Meeting the power to create the corporate website, for which purpose the corresponding item should expressly appear in the agenda of the meeting. Legal provisions have also been included regarding the manner in which such resolution will be announced. The power to amend, relocate or remove the website still belongs to the board of directors, in line with the legal rule applicable by default. Third, in section 2, apart from including certain improvements to the text, the reference to “registration with the Commercial Registry” of the approval of the amendment, removal or relocation of the website is replaced with a reference to its “record on the Bank’s page maintained with the Commercial Registry”, thus conforming the text of the Bylaws to the tenor of the new text of article 11 bis of the Spanish Corporate Enterprises Act.
At the 2014 annual general meeting, held on March 28, 2014, our shareholders resolved to amend our Bylaws to achieve two separate goals:
| i) | to adjust the Bylaws to statutory amendments regarding corporate governance introduced by: (a) Order EEC/461/2013 of March 20, which determines the content and structure of the annual corporate governance report, of the annual remuneration report and of other reporting instruments of listed corporations (sociedades anónimas), of savings associations and of other entities that issue securities admitted to trading on official securities markets, and (b) Royal Decree-law 14/2013 of November 29, on urgent measures to adjust Spanish Law to European Union regulations governing supervision and solvency of financial institutions; and |
| ii) | to make certain changes in the Bylaws regarding the organization of the Bank, relating primarily to the provisions of Directive 2013/36/UE of the European Parliament and of the Council, of June 26, 2013, on access to the activity of credit institutions and the prudential supervision of credit institutions and investment firms (“Directive CRD IV”). Such Directive, together with (UE) Regulation No. 575/2013 of the European Parliament and of the Council of June 26, 2013 on prudential requirements for credit institutions and investment firms, constitute the new supervision and solvency regulations for credit institutions applicable in the European Union since January 1, 2014. |
Our amended Bylaws have not yet been filed with the Mercantile Register, which is required prior to their effectiveness. We expect that the amendments will become effective within the first semester of 2012.2014.
Our current Bylaws are included as Exhibit 1.1. The Bylaws are also available on the Group’s website, which does not form part of this annual report on Form 20-F, atwww.santander.com,, under the heading “Information for shareholders and investors — General information — Bylaws”.
The board of directors, at its meeting held on April 25, 2011, agreedIn 2013, several amendments to amend the Rules and Regulations of the Board of Directors were recorded with the Companies Register of Cantabria. The purpose of such modifications was to adapt the Rules and Regulations to new legislative developments on corporate governance, specifically including those arising from Royal Decree 256/2013 of April 12, on the assessment of the suitability of members of the board of directors and key function holders, which incorporates into Spanish law the criteria contained in: i) the EBA Guidelines of December 27, 2011 on Corporate Governance, and ii) the EBA Guidelines of November 22, 2012 on the assessment of suitability of the members of the board, executive directors and key function holders at credit institutions. In addition, section 2 of article 28 of the Rules and Regulations were amended regarding the directors’ compensation system for their supervisory and collective decision-making duties, in order to conform it to the wording of article 58.2 of the Bylaws approved at the annual general shareholders’ meeting of March 22, 2013, whereby the profit sharing system was replaced by a system of fixed remuneration.
It is envisaged that the board of directors will modify the Rules and Regulations of the Board to conform them to the new wording of the Bylaws once the proposals to modify them have become effective. Such amendments consist of adapting to Order ECC/461/2013, Royal Decree-Law 14/2013 and the CRD IV Directive (Directive 2013/36/ EU) for the following purposes, among others,others: (i) to bring some aspectsadjust director typology definitions; (ii) to regulate the sphere of its internal regulations into linecompetence of a new committee in charge of assisting the board with regards risk, regulation and compliance, adjusting where applicable recent legislative amendments affecting capital corporations in Spain.the other responsibilities of the board committees; and (iii) to specify the requirement that the chairman may not simultaneously serve as chief executive officer.
All references to the Rules and Regulations of the Board in this annual report on Form 20-F are references to the current text.
The Rules and Regulations of the Board are available on the Group’s website, which does not form part of this annual report on Form 20-F, atwww.santander.com,, under the heading “Information for shareholders and investors—Corporate governance—Board of directors—Rules and Regulations of the Board of Directors”.
General
As of December 31, 2011,2013, the Bank’s share capital was €4,454,521,601.50,€5,666,710,244, represented by a single class of 8,909,043,20311,333,420,488 book-entry Santander shares with a nominal value of €0.50 each.
All of our shares are fully paid and non-assessable. Spanish law requires that bank-listed equity securities be issued in book-entry form only.
Register
Santander is registered with the Commercial Registry of Santander (Finance Section). The Bank is also recorded in the Special Registry of Banks and Bankers with registration number 0049, and its fiscal identification number isA-39000013.
209
Corporate Object and Purpose
Article 2 of our Bylaws states that the corporate objective and purpose of Santander consists of carrying-out all types of activities, operations and services specific to the banking business in general and which are permitted under current legislation and the acquisition, holding and disposal of all types of securities.
Certain Provisions Regarding Shareholder Rights
As of the date of the filing of this report, Santander’s capital is comprised of only one class of shares, all of which are ordinary shares and have the same rights. Santander may issue non-voting shares for a nominal amount of not more than one-half of the paid-up share capital, and redeemable shares for a nominal amount of not more than one-fourth of its share capital.
Our Bylaws do not contain any provisions relating to sinking funds.
Our Bylaws do not specify what actions or quorums are required to change the rights of holders of our stock. Under Spanish law, the rights of holders of stock may only be changed by an amendment to the Bylaws of the company that complies with the requirements explained below under “—Meetings“Meetings and Voting Rights.”Rights”.
Meetings and Voting Rights
We hold our annual general shareholders’ meeting during the first six months of each fiscal year on a date fixed by the board of directors. Extraordinary meetings may be called from time to time by the board of directors whenever the board considers it advisable for corporate interests, and whenever so requested by shareholders representing at least 5% of the outstanding share capital of Santander. Currently, notices of all meetings are published, at least one month prior to the date set for the meeting, in the Official Gazette of the Mercantile Register and in one of the local newspapers having the largest circulation in the province where the registered office of Santander is located. At our annual general shareholders’ meeting held on March 30, 2012, our shareholders approved an amendment to our Bylaws to require that notices of all meetings be published at least one month prior to the date set for the meeting, except in those instances in which a different period is established by law, in the Official Gazette of the Mercantile Register or in one of the local newspapers having the largest circulation in the province where the registered office of Santander is located, on the website of the National Securities Market Commission (CNMV) and on the Company’sBank’s website (www.santander.com). Our amended Bylaws have not yet been filed with the Mercantile Register, which is required prior to their effectiveness. We expect that the amendments will become effective within the first semester of 2012. In addition, under Spanish law, the agenda of the meeting must be sent to the CNMV and the Spanish Stock Exchanges and published on the company’s website. Our last ordinary general meeting of shareholders was held on March 30, 201228, 2014 and our last extraordinary general meeting of shareholders was held on January 26, 2009.
Each Santander share entitles the holder to one vote. Registered holders of any number of shares who are current in the payment of capital calls will be entitled to attend shareholders’ meetings. Our Bylaws do not contain provisions regarding cumulative voting.
Any Santander share may be voted by proxy. Subject to the limitations imposed by Spanish law, proxies may be given to any individual or legal person, must be in writing or by remote means of communication and are valid only for a single meeting. According to Spanish law, if a director or another person solicits a proxy for a director thus obtaining more than three proxies and the director is subject to a conflict of interest, the director holding the proxies may not exercise the voting rights attaching to the represented shares in connection with decisions relating to:
his appointment or ratification, removal, dismissal or withdrawal as director;
the institution of a derivative action against him; or
the approval or ratification of transactions between Santander and the director in question, companies controlled or represented by him, or persons acting for his account.
In accordance with the Rules and Regulations for the General Shareholders’ Meeting and in the manner established by such Rules and Regulations, the Group’s website includes from the date when the call of the general shareholders’ meeting is published, the text of all resolutions proposed by the board of directors with respect to the agenda items and the details regarding the manner and procedures for shareholders to follow to confer representation on any individual or legal entity. The manner and procedures for electronic delegation and voting via the Internet are also indicated.
210
At both general shareholders’ meetings held in 2004 (the annual shareholders’ meeting of June 19, 2004 and the extraordinary general meeting of October 21, 2004) our shareholders could exercise their voting and representation rights prior to the meetings by electronic means (via the Internet). In addition, at the extraordinary general shareholders’ meeting of October 21, 2004, our shareholders could vote by mail and in the annual general shareholders’ meetings held on June 18, 2005, June 17, 2006, June 23, 2007, June 21, 2008, June 19, 2009, June 11, 2010, June 17, 2011, and March 30, 2012, March 22, 2013 and March 28, 2014, and in the extraordinary general shareholders’ meeting of October 23, 2006, July 27, 2007, September 22, 2008 and January 26, 2009 our shareholders, besides exercising their voting and representation rights prior to the meeting by mail or via the Internet, were able to attend (besides attending and voting in person) via the Internet and were also able to vote in real time on the Internet on the resolutions considered at the meeting.
Only registered holders of Santander shares of record at least five days prior to the day on which a meeting is scheduled to be held may attend and vote at shareholders’ meetings. As a registered shareholder, the depositary will be entitled to vote the Santander shares underlying the Santander ADSs. The deposit agreement requires the depositary to accept voting instructions from holders of Santander ADSs and to execute such instructions to the extent permitted by law.
In general, resolutions passed by a general meeting are binding upon all shareholders. In certain circumstances, Spanish law gives dissenting or absent shareholders the right to have their Santander shares redeemed by us at prices determined in accordance with established formulaeformula or criteria. Santander shares held by the Bank or its affiliates are counted for purposes of determining quorums but may not be voted by the Bank or by its affiliates.
Resolutions at general meetings are passed provided that, regarding the voting capital present or represented at the meeting, the number of votes in favor is higher than the number of votes against or blank and abstentions.
In accordance with Spanish law, a quorum on first call for a duly constituted ordinary or extraordinary general meeting of shareholders requires the presence in person or by proxy of shareholders representing at least 25% of the subscribed voting capital. On the second call there is no quorum requirement. Notwithstanding the above, a quorum of at least 50% of the subscribed voting capital is required on the first call of the ordinary or extraordinary general meeting of shareholders to validly approve any of the following actions:
issuance of bonds;
increase or reduction of share capital;
rescission or limitation of the preferential right to subscribe new issuance of shares;
change of the registered address of Santander to a foreign country;
transformation of Santander, or merger, or spin-off, or global assignment of assets and liabilities; and
any other amendment of our Bylaws.
A quorum of 25% of the subscribed voting capital is required to vote on such actions on the second call. A two-third majority of the present or represented voting capital is required to approve all of the above listed actions when the shareholders’ meeting is held on second call and less than 50% of the subscribed voting capital is present or represented.
For purposes of determining the quorum, those shareholders who vote by mail or through the Internet are counted as being present at the meeting, as provided by the Rules and Regulations of the Bank’s general shareholders’ meetings. The quorum at the 2014 annual general meeting was 58.820% of the Bank’s share capital.
Changes in Capital
Any increase or reduction in share capital must be approved at the general meeting in accordance with the procedures explained above in the section entitled “Meetings and Voting Rights”. However, the shareholders acting at the general shareholders’ meeting may delegate to the board of directors the power to increase share capital.
211
The capital increase may be effected by issuing new shares or by increasing the par value of existing shares. Capital reduction may be effected by reducing the par value of existing shares, by repurchasing them, or dividing them into groups for exchange.
Unpaid subscription amounts on partially paid-up shares must be paid by the shareholders at the time determined by the board of directors, within five years of the date of the resolution providing for the capital increase.
At the Bank’s annual general shareholders’ meeting held on March 30, 2012, the28, 2014, our shareholders passed resolutionsa resolution which, among other things, withdrew, to the extent of the unused amount, the authorization granted by theour shareholders at the annual meeting held on June 19, 2009,March 22, 2013, and gave the board the authority to increase, within a period of three years from the date of the meeting, the Bank’s capital by up to 2,269,213,350 euros.€2,890,266,786.50. Under these resolutions,this resolution, the board is authorized to totally or partially exclude pre-emptive rights, upon the terms of the Spanish law, provided, however, that this power is limited to capital increases carried out under this resolution up to the amount of 907,685,340 euros.€1,156,106,714.50.
At the Bank’s annual general shareholders’ meeting held on March 30, 2012, the28, 2014, our shareholders passed resolutionsa resolution which, among other things, withdrew, to the extent of the unused part, the authorization granted by theour shareholders at the annual general shareholders meeting held on June 17, 2011,March 22, 2013, and permitted the Bank to issue, within five years from the date of the meeting, on one or more occasions, debentures, bonds, participating preference shares and other fixed-income securities or debt instruments of a similar nature (including warrants) that are convertible into and/or exchangeable for shares of the Bank in an amount up to €8€10 billion aggregate principal amount or the equivalent thereof in another currency.
At the Bank’s annual general shareholders’ meeting held on March 28, 2014, our shareholders also passed a resolution by which they authorized the board of directors to issue, on one or more occasions, up to €50 billion euros, or the equivalent thereof in another currency, in fixed-income securities in any of the forms admitted by Law, including bonds, certificates, promissory notes, debentures and preferred interests or debt instruments of a similar nature (including warrants payable by physical delivery or set-off). This power may be exercised by the board of directors within a maximum period of five years from the date of adoption of this resolution by our shareholders, at the end of which period it shall be cancelled to the extent of the unused amount.
Dividends
We normally pay an annual dividend in advancedividends in quarterly installments in August and November of the currentrelevant year and February and generally in May of the following year. Such dividends may be substituted byeither cash dividends or scrip dividends according to theSantander Dividendo Elección program, pursuant to which each shareholder receives a free allotment right for every Santander share held. These rights are listed on and may be traded on the Spanish Stock Exchanges during a 15 calendar day period. Following the end of this period, the rights will be automatically converted into new Santander shares. Each shareholder may opt for one of the following alternatives: (i) receive new Santander shares; (ii) receive a cash payment equivalent to the dividend. To this end, Banco Santander assumes an irrevocable undertaking to acquire the free allotment rights for a fixed price; or (iii) receive a cash payment through selling rights on market. We and our domestic banking subsidiaries are subject to certain restrictions on dividend payments, as prescribed by the Ministry of Economy and Competitiveness and the Bank of Spain. See “Item 4. Information on the Company—B. Business Overview—Supervision and Regulation—Restrictions on Dividends” herein.
Once the annual accounts have beenare approved, theour shareholders at the general shareholders’ meeting will resolve on the allocation of the results for the fiscal year. Dividends may only be distributed out of the earnings for the fiscal year or with a charge to unappropriated reserves, after the payments required by the law and the Bylaws have been made, provided that the stockholders’ equity disclosed in the accounts is not reduced to less than the share capital as a result of the distribution. If there are any losses from prior fiscal years that reduce the Bank’s stockholders’ equity below the amount of the share capital, the earnings must be used to offset such losses.
The amount, time and form of payment of the dividends, to be distributed among theour shareholders in proportion to their paid-in capital will be established by resolutions adopted at the general meeting. TheOur shareholders at the general shareholders’ meeting and the board of directors may make resolutions as to the distribution of interim dividends, subject to limitations and in compliance with the requirements established by the law.
A shareholder’s dividend entitlement lapses five years after the dividend payment date.
TheOur shareholders at the annual general shareholders’ meeting may resolve that dividends in kind can be paid, provided that:
the property or securities to be distributed are of the same nature;
212
the property or securities have been admitted to listing on an official market as of the effective date of the resolution, or liquidity is guaranteed by Santander within a maximum period of one year; and
the property or securities are not distributed for a value that is lower than the value at which they are recorded on Santander’s balance sheet.
Preemptive Rights
In the event of a capital increase each shareholder has a preferential right by operation of law to subscribe for shares in proportion to its shareholding in each new issue of Santander shares. The same right is vested on shareholders upon the issuance of convertible debt. Holders of convertible debt also have preemptive rights. However, preemptive rights of shareholders and holders of convertible debt may be excluded under certain circumstances by specific approval at the shareholders’ meeting (or upon its delegation by the board of directors) and preemptive rights are deemed excluded by operation of law in the relevant capital increase when theour shareholders approve:
capital increases following conversion of convertible bonds into Santander shares;
capital increases due to the absorption of another company or of part of the spun-off assets of another company, when the new shares are issued in exchange for the new assets received; or
capital increases due to Santander’s tender offer for securities using Santander’s shares as all or part of the consideration.
If capital is increased by the issuance of new shares in return for capital from certain reserves, the resulting new Santander shares will be distributed pro rata to existing shareholders.
Redemption
Our Bylaws do not contain any provisions relating to redemption of shares except as set forth in connection with capital reductions. Nevertheless, pursuant to Spanish law, redemption rights may be created at a duly held general shareholders’ meeting. Such meeting will establish the specific terms of any redemption rights created.
Registration and Transfers
The Santander shares are in book-entry form in the Iberclear system. We maintain a registry of shareholders. We do not recognize, at any given time, more than one person as the person entitled to vote each share in the shareholders meeting.
Under Spanish law and regulations, transfers of shares quoted on a stock exchange are normally made through aSociedad o Agencia de Valores, credit entities and investment services companies, that are members of the Spanish stock exchange.
Transfers executed through stock exchange systems are implemented pursuant to the stock exchange clearing and settlement procedures of Iberclear. Transfers executed “over the counter” are implemented pursuant to the general legal regime for book entrybook-entry transfer, including registration by Iberclear.
New shares may not be transferred until the capital increase is registered with the Commercial Registry.
Liquidation Rights
Upon a liquidation of Santander, our shareholders would be entitled to receive pro-rata any assets remaining after the payment of our debts, taxes and expenses of the liquidation. Holders of non-voting shares, if any, are entitled to receive reimbursement of the amount paid before any amount is distributed to the holders of voting shares.
213
Change of Control
Our Bylaws do not contain any provisions that would have an effect of delaying, deferring or preventing a change in control of the company and that would operate only with respect to a merger, acquisition or corporate restructuring involving Santander or any of our subsidiaries. Nonetheless, certain aspects of Spanish law described in the following section may delay, defer or prevent a change of control of the Bank or any of our subsidiaries in the event of a merger, acquisition or corporate restructuring.
Legal Restrictions on Acquisitions of Shares in Spanish Banks
Certain provisions of Spanish law require notice to the Bank of Spain prior to the acquisition by any individual or corporation of a substantial number of shares of a Spanish bank.financial institution.
Any individual or corporation that wishes to acquire, directly or indirectly, a significant holding ((participación significativa)significativa) in a Spanish bankfinancial institution must give advance notice to the Bank of Spain describing the size of such participation, its terms and conditions, and the anticipated closing date of the acquisition. “Significant participation”holding” is defined as 5%10% of the outstanding share capital or voting rights of the bank or any lesser participation that gives the acquirer effective influence or control over the target bank.
In addition, prior notice must be given to the Bank of Spain of any increase, direct or indirect, in any significant holding resulting in percentage equity interest or voting rights reaching or surpassing one of the following percentages: 20%, 30% or 50%. Notice to the Bank of Spain is also required from anyone who, as a result of the contemplated acquisition, may attain sufficient power to control the credit entity.
Any acquisition mentioned in the preceding sentence to which the required notice was not given or even if given, a three month period after receipt of notice has not yet elapsed, or that is opposed by the Bank of Spain will have the following effects: (1) the acquired shares will have no voting rights, (2) the Bank of Spain may seize control of the bank or replace its board of directors, and (3) a fine may be levied on the acquirer.
The Bank of Spain has sixty business days after the receipt of notice to object to a proposed transaction. Such objection may be based on finding the acquirer unsuitable on the basis, among others, of its commercial or professional reputation, its solvency or the transparency of its corporate structure. If sixty business days elapse without any word from the Bank of Spain, its authorization is deemed granted. However, absent objection by the Bank of Spain, it may set forth a different maximum period for closing the proposed transaction.
Any individual or institution that plans to sell its significant holding, or reduce it to one of the above-mentioned levels of ownership, or because of any sale will lose control of the entity, must provide advance notice to the Bank of Spain indicating the amount of the transaction and its anticipated closing date. Failure to comply with these requirements may subject the offending party to penalties.
Any individual or corporation which acquires, directly or indirectly, a participation in a Spanish financial institution and as a consequence the percentage of its share capital or voting rights reaches or exceeds 5%, must notify the Bank of Spain and the relevant financial institution, indicating the amount of the participation reached.
Credit entities must notify the Bank of Spain as soon as they become aware of any acquisition or transfer of significant shares of its capital stock that exceeds the above-mentioned percentages. Furthermore, banks are required to inform the Bank of Spain as soon as they become aware, and in any case not later than 15 days after, any acquisition by a person or a group of at least 1% of such a bank’s total equity. The Bank of Spain also requires each bank to notify the Bank of Spain of a list, dated on the last day of each quarter and during April, July, October and January of all its shareholders that are financial institutions and all other shareholders that own at least 0.25% of the bank’s total equity.
If the Bank of Spain determines at any time that the influence of a person who owns a significant participation of a bank may adversely affect that bank’s financial situation, it may request that the Ministry of Economy and Competitiveness: (1) suspend the voting rights of such person’s shares for a period not exceeding 3 years; (2) seize control of the bank or replace its board of directors; or (3) revoke the bank’s license in exceptional circumstances. A fine may also be levied on the relevant person.
Tender Offers
Law 6/2007, of April 12, which amends the Securities Market Law, has modified the rules for takeover bids. This Law, which came into effect on August 13, 2007, partially transposes into the Spanish legal system Directive 2004/25/EC of the European Parliament and of the Council of April 21, 2004 on takeover bids.
214
The rules replaced the traditional system where launching a takeover bid was compulsory prior to acquiring a significant shareholding in the target company and partial bids were permitted for a regime where takeover bids must be made for all the share capital after obtaining the control of a listed company (i.e. 30% of the voting rights or appointment of more than one-half of the members of the company’s board of directors) whether such control is obtained by means of an acquisition of securities or an agreement with other holders of securities.
The above does not prevent parties from making voluntary bids for a number that is less than the totality of securities in a listed company.
Law 6/2007 also regulates, among other things: (i) new obligations for the board of directors of the offeree company in terms of preventing the takeover bid (passivity rule); and (ii) the squeeze-out and sell-out rights when the offeror is a holder of securities representing at least 90% of the voting capital of the offeree company and the prior takeover bid has been accepted by holders of securities representing at least 90% of the voting rights covered by the bid.
Royal Decree 1066/2007 on rules applicable to takeover bids for securities further developed the regulations on takeover bids established by Law 6/2007, completing the amendments introduced by Law 6/2007, in order to ensure that takeover bids are carried out within a comprehensive legal framework and with absolute legal certainty. The Royal Decree contains provisions regarding: (i) the scope and application to all takeover bids, whether voluntary or mandatory, for a listed company; (ii) the rules applicable to mandatory takeover bids when control of a company is obtained; (iii) other cases of takeover bids, such as bids for de-listing of securities and bids that must be made when a company wishes to reduce capital through the acquisition of its own shares for subsequent redemption thereof; (iv) the consideration and guarantees offered in a bid; (v) stages of the procedure that must be followed in a takeover bid; (vi) the mandatory duty of passivity of the offeree company’s board of directors and the optional regime of neutralization of other preventive measures against bids; (vii) changes to, withdrawal of, and cessation of effects of the bid; (viii) the acceptance period, the calculation of the acceptances received and the settlement of the bid; (ix) the procedures applicable to competing offers; (x) the rules for squeeze-outs and sell-outs; and (xi) certain rules on supervision, inspection and sanctions applicable with respect to the regulations on takeover bids.
Reporting Requirements
Royal Decree 1362/2007 requires that any entity which acquires or transfers shares and as a consequence the number of voting rights held exceeds, reaches or is below the threshold of 3%, 5%, 10%, 15%, 20%, 25%, 30%, 35%, 40%, 45%, 50%, 60%, 70%, 75%, 80% or 90%, of the voting rights of a company, for which Spain is the member state of origin, listed on a Spanish stock exchange or on any other regulated market in the European Union, must, within 4 days after that acquisition or transfer, report it to such company, and to the CNMV. This duty to report the holding of a significant stake is applicable not only to the acquisitions and transfers in the terms described above, but also to those cases in which in the absence of an acquisition or transfer of shares, the percentage of an individual’s voting rights exceeds, reaches or is below the thresholds that trigger the duty to report, as a consequence of an alteration in the total number of voting rights of an issuer. Similar disclosure obligations apply, among others, in the event of: (i) the acquisition or disposal of any financial instruments entitling the holder to acquire the company’s shares (such as options, futures, swaps, etc.); (ii) certain voting, deposit, temporary transfer or other agreements regarding the relevant shares; or (iii) custodians or proxy-holders who can exercise with discretion the voting rights attached to the relevant shares. The above mentioned threshold percentage will be 1% or any multiple of 1% whenever the person who has the duty to notify is a resident of a tax haven or of a country or territory where there is no taxation or where there is no obligation to exchange tax information (in accordance with Spanish law).
In addition, any Spanish company listed on the Spanish stock exchanges must report any acquisition by such company (or a subsidiary) of the company’s own shares if the acquisition, together with any acquisitions since the date of the last report and without deducting sales of its own shares by the company or by its subsidiaries, causes the company’s ownership of its own shares to exceed 1% of its voting rights. See “Item 9. The Offer and Listing—C. Markets—Trading by Santander’s Subsidiaries in the Shares” herein.
Members of the board of directors of listed companies, in addition to notifying the CNMV of any transaction concerning the shares or other securities or financial instruments of the issuer which are linked to these shares, are required to inform the CNMV of their ratio of voting rights upon appointment or resignation.
In addition, top managers of any listed company must report to the CNMV the acquisition or disposal of shares or other securities or financial instruments of the issuer which are linked to these shares.
215
Board of Directors
Our board of directors may be made up of a minimum of 14 and a maximum of 22 members, appointed by our shareholders acting at the general meeting of shareholders.
Members of the board of directors are elected for an initial term of three years but can be re-elected. One third of the members of the board are electedre-elected each year.
A director could serve for a term shorter than the one for which he or she has been initially elected if the shareholders acting at a duly called general meeting decide that that director be replaced before completing his or her term.
Although there is no provision in Spanish law regarding the composition of a board of directors, the Rules and Regulations of the Board provide that in exercising its powers to make proposals at the general shareholders’ meeting and to designate directors by interim appointment to fill vacancies (co-option), the board shall endeavor to ensure that the external or non-executive directors represent a wide majority over the executive directors and that the former include a reasonable number of independent directors. In addition, in all events, the board of directors shall endeavor such that the number of independent directors represent at least one-third of all directors.
Article 42.1 of our Bylaws also provides that the shareholders at the general shareholders’ meeting shall endeavor to ensure that external or non-executive directors represent a large majority of the board of directors, and that a reasonable number of the board of directors are independent directors. In addition, the shareholders at the general shareholders’ meeting shall likewise endeavor to ensure that independent directors represent at least one-third of the total number of directors.
TheseArticle 6.2. c) of the Rules and Regulations of the Board incorporates the definition of independent director established in the Unified Code.
This definition should be understood in conjunction with the provisions of article 8.4 of Order ECC/461/2013, introducing a legal definition of independent directors, and also considering the second transitional provision of the Order.
According to the above criteria, eight out of our 16 board members are external independent directors.
The independence standards set forth in the Rules and Regulations of the Board may not necessarily be consistent with, or as stringent as, the director independence standards established by the NYSE. See Item 16G of Part II, “Corporate Governance—Independence of the directors on the board of directors” herein.
Certain Powers of the Board of Directors
The actions of the members of the board are limited by Spanish law and certain general provisions contained in our Bylaws. For instance, Article 57 of our Bylaws states that the directors will be liable to Santander, to our shareholders and to our corporate creditors for any damages that they may cause by acts or omissions which are contrary to law or to the Bylaws or by acts or omissions contrary to the duties inherent in the exercise of their office.
A director’s power to vote on a proposal, arrangement or contract in which such director is materially interested is not regulated by our Bylaws. Conflicts of interest are regulated by Article 30 of the Rules and Regulations of the Board. Under Article 30, a director is obliged to inform the board of any direct or indirect conflict of interest which may exist with the Bank. If such a conflict relates to a particular transaction with the Bank, then the director (i) may not undertake the transaction without the board’s authorization (such authorization can only be granted following a report of the appointments and remuneration committee); and (ii) the director may not take part in the discussion or voting regarding the transaction to which the conflict relates.
According to our Bylaws, unpaid subscription amounts on partially paid-up shares shall be paid up by the shareholders at the time determined by the board of directors, within five years of the date of the resolution providing for the capital increase. The manner and other details of such payment shall be determined by the resolution providing for the capital increase. Without prejudice to the effects of default as set forth by law, any late payment of unpaid subscription amounts shall bear, for the benefit of the Bank, such interest as is provided by law in respect of late payments, starting from the day when payment is due and without any judicial or extra-judicial demand being required. In addition, the Bank shall be entitled to bring such legal actions as may be permitted by law in these cases.
Our current Bylaws provide that the members of the board of directors are entitled to receive compensation for performing the duties entrusted to them by reason of their appointment, to be paid as a share in profits and by-law mandated compensation. Thisappointment. The compensation has two components: an annual emolumentretainer and attendance fees.
At the Bank’s annual general shareholders’ meeting held on March 22, 2013, our shareholders passed a resolution to amend section 2 of article 58 of our Bylaws regarding the rules for the remuneration of directors for their duties of supervision and collective-decision making, which changed from the system of profits participation to one of fixed annual remuneration determined by the shareholders at the general shareholders’ meeting. Such amount shall remain in effect to the extent that the shareholders at the general shareholders’ meeting do not resolve to change it, although the board may reduce the amount thereof in those years in which it so believes justified. Such compensation shall have two components: (i) an annual amount, and (ii) attendance fees.
The specific amount payable to each of the directors willand the form of payment shall be determined by the board of directors, takingdirectors. For such purpose, it shall take into consideration the positions held by each director on the board and their membership in and attendance at the meetings of the various committees. The aggregate amount
At the Bank’s annual general shareholders’ meeting held on March 28, 2014, our shareholders resolved to amend section 6 of article 58 of our Bylaws in order to adjust the director remuneration system to the provisions of Royal Decree-law 14/2013 of November 29, on urgent measures to adjust Spanish Law to European Union regulations governing supervision and solvency of financial institutions and of Directive 2013/36/UE of the compensation for performingEuropean Parliament and of the duties entrustedCouncil, of June 26, 2013, on access to the directors by reasonactivity of their appointment is equalcredit institutions and the prudential supervision of credit institutions and investment firms (“Directive CRD IV”) in connection with the limits for variable remuneration, which will affect executive directors. Pursuant to one percent of Santander’s profit forsuch provisions, the fiscal year, provided, however,Bylaws have included the rule that the boardvariable components of remuneration be set such that there is an appropriate ratio between the fixed and variable components of total remuneration, and the variable components may resolvenot exceed 100% of the fixed components, unless the shareholders at a general shareholders’ meeting approve a higher ratio, which shall under no circumstances exceed 200%.
In connection with the foregoing, our shareholders approved at the 2014 annual general meeting a maximum ratio between the fixed and variable components of remuneration for financial year 2014 of up to 200% for an identified staff consisting of a maximum of 785 members.
Our amended Bylaws have not yet been filed with the Mercantile Register, which is required prior to their effectiveness. We expect that such percentage be reduced in those years in which the board deems it justified.amendments will become effective within the first semester of 2014.
216
Regardless of the limit set above, the directors are entitled to receive compensation that the board of directors consider appropriate, for the performance of duties in Santander other than the duties of supervision and collective decision-making that the directors perform as members of the board.
Directors may also receive compensation in the form of shares of the Bank or options over the shares, or other remuneration linked to share value following a resolution adopted by the shareholders at the general shareholders’ meeting (conducted in accordance with our Bylaws and applicable Spanish legislation).
According to our Bylaws, the board of directors must, on an annual basis, approve athe annual report on directorsdirectors’ remuneration, policy, which shall include complete, clear and understandable information regarding: (i) the overall summary of the application of such policy during the last fiscal year, including a breakdown of the individual compensation accrued by each director during such fiscal year, (ii) the policy approved by the board for the current year and (iii) the policy, if any, planned for future years. This report must be made available to the shareholders when the annual general shareholders’ meeting is called and must be submitted to a non-binding vote thereof as a separate item on the agenda.
Board of Directors Qualification
There are no mandatory retirement provisions due to age for board members in our Bylaws or in the regulations of our board of directors. These regulations contain provisions relating to the cessation of directorship for other reasons.
In addition, there are no share ownership requirements in our Bylaws or in the Rules and Regulations of the Board of Directors.
Pursuant to Spanish law, directors appointed by the board but whose appointment remains subject to ratification by the shareholders must be a shareholder of the Bank and, pursuant to the Rules and Regulations of the Board, proprietary directors must submit their resignation proportionately when the shareholder that they represent parts with its shareholdings or reduces them in a significant manner. Our Bylaws and Rules and Regulations of the Board do not otherwise require ownership of Santander shares for a director’s qualification.
During the past two years, the Bank was not a party to any contract outside its ordinary course of business that was material to the Group as a whole.
Restrictions on Foreign Investments
Under present regulations, foreign investors may transfer invested capital, capital gains and dividends out of Spain without limitation on the amount other than applicable taxes. See “—Taxation”. On July 4, 2003, Law 19/2003 was approved which updates Spanish exchange control and money laundering prevention provisions, by recognizing the principle of freedom of the movement of capital between Spanish residents and non-residents. The law establishes procedures for the declaration of capital movements for purposes of administrative or statistical information and authorizes the Spanish Government to take measures which are justified on grounds of public policy or public security. It also provides the mechanism to take exceptional measures with regard to third countries if such measures have been approved by the European Union or by an international organization to which Spain is a party. The Spanish stock exchanges and securities markets are open to foreign investors. Royal Decree 664/1999, on Foreign Investments (April 23, 1999), established a new framework for the regulation of foreign investments in Spain which, on a general basis, will no longer require any prior consents or authorizations from authorities in Spain (without prejudice to specific regulations for several specific sectors, such as television, radio, mining, telecommunications, etc.). Royal Decree 664/1999 requires notification of all foreign investments in Spain and liquidations of such investments upon completion of such investments to the Investments Registry of the Ministry of Economy and Finance, strictly for administrative statistical and economical purposes. Only investments from “tax haven” countries (as they are defined in Royal Decree 1080/1991), shall require notice before and after performance of the investment, except that no prior notice shall be required for: (1) investments in securities or participations in collective investment schemes that are registered with the CNMV, and (2) investments that do not increase the foreign ownership of the capital stock of a Spanish company to over 50%. In specific instances, the CounselCouncil of Ministers may agree to suspend, all or part of, Royal Decree 664/1999 following a proposal of the Minister of Economy and Competitiveness, or, in some cases, a proposal by the head of the government department with authority for such matters and a report of the Foreign Investment Body. These specific instances include a determination that the investments, due to their nature, form or condition, affect activities, or may potentially affect activities relating to the exercise of public powers, national security or public health. Royal Decree 664/1999 is currently suspended for investments relating to national defense. Whenever Royal Decree 664/1999 is suspended, the affected investor must obtainprior administrative authorization in order to carry out the investment.
217
The following is a discussion of the material Spanish and USU.S. federal income tax consequences to you of the ownership and disposition of ADSs or shares.
The discussion of Spanish tax consequences below applies to you only if you are a non-resident of Spain and your ownership of ADSs or shares is not effectively connected with a permanent establishment or fiscal base in Spain and you are a USU.S. resident entitled to the benefits of the Convention Between the United States of America and the Kingdom of Spain for the Avoidance of Double Taxation and the Prevention of Fiscal Evasion with Respect to Taxes on Income (the “Treaty”).
On January 14, 2013, the United States of America and the Kingdom of Spain signed a protocol amending the Treaty, which needs to be ratified by both countries, and will become effective three months following the date on which notice is provided by the later of the countries to provide notice that its internal procedures for effectiveness have been fulfilled. When this protocol becomes effective, taxation described under the Treaty in this section may be altered.
You should consult your own tax adviser as to the particular tax consequences to you of owning the shares or ADSs including your eligibility for the benefits of any treaty between Spain and the country of your residence for the avoidance of double taxation, the applicability or effect of any special rules to which you may be subject, and the applicability and effect of state, local, foreign and other tax laws and possible changes in tax law.
Spanish tax considerations
The following is a summary of material Spanish tax matters and is not exhaustive of all the possible tax consequences to you of the acquisition, ownership and disposition of ADSs or shares. This discussion is based upon the tax laws of Spain and regulations thereunder, which are subject to change, possibly with retroactive effect.
Taxation of dividends
Under Spanish law, dividends paid by a Spanish resident company to a holder of ordinary shares or ADSs not residing in Spain for tax purposes and not operating through a permanent establishment in Spain are subject to Spanish Non-Resident Income Tax at a 21% rate. Royal Decree-Law 20/2011of December 31 has2011 had temporarily increased from 19% to 21% the rate applicable from January 1, 2012 until December 31, 2013.2013, but Law 22/2013 has extended the increased rate until December 31, 2014.
In addition, according to the Spanish Non-Resident Income Tax Law, if you are resident in the European Union or in a country, such as the United States, with which there is an effective exchange of information for tax purposes as defined in Spanish Law 36/2006 and you do not operate in Spain through a permanent establishment, dividends up to 1,500 euros, considering all Spanish-source dividends you may obtain in the calendar year, are exempt from Spanish taxation. However, Spanish withholding tax will nevertheless be required to be deducted from the gross amount of the dividends, and you will have to seek a refund of such withholding taxes from the Spanish tax authorities, following the standard refund procedure described below.
We will levy an initial withholdingwithhold tax on the gross amount of dividends at a 21% tax rate, following the procedures set forth by the Order of April 13, 2000. However, under the Treaty and subject to the fulfillment of certain requirements, you may be entitled to a reduced rate of 15%.
To benefit from the Treaty’s reduced rate of 15%, you must provide our depositary, JPMorgan Chase Bank, N.A., with a certificate from the U.S. Internal Revenue Service (the “IRS”) stating that to the knowledge of the IRS, you are a resident of the United States within the meaning of the Treaty. The IRS certificate is valid for a period of one year.
According to the Order of April 13, 2000, to get a direct application of the Treaty-reduced rate of 15%, the certificate referred to above must be provided to our depositary before the tenth day following the end of the month in which the dividends were distributable by us. If you fail timely to timely provide our depositary with the required documentation, you may obtain a refund of the 6% in excess withholding that would result from the Spanish tax authorities in accordance with the procedures below.
A scrip dividend (such as a dividend described in(see Item 4 of Part I, “Information on the Company—A. History and development of the company—Principal Capital Expenditures and Divestitures—Recent events”) will be treated as follows:
If the holder of ordinary shares or ADSs elects to receive newly issued ordinary shares or ADSs it will be considered a delivery of fully paid-up shares free of charge and, hence, will not be considered income for purposes of the Spanish Non-Resident Income Tax. The acquisition value, both of the new ordinary shares or ADSs received in the scrip dividend and of the ordinary shares or ADSs from which they arise, will be the result of dividing the total original cost of the shareholder’s portfolio by the number of shares, both old and new. The acquisition date of the new shares will be that of the shares from which they arise.
If the holder of ordinary shares or ADSs elects to sell the rights on the market, the amount obtained from the sale of rights will be deducted from the acquisition value of the shares from which the rights arose. If the amount obtained from such sale is higher than the acquisition value of the shares from which the rights arose, the excess amount will be treated as a capital gain for the holder onin the fiscal year in which the transfer takes place (please refer to Taxation“Taxation of Capital Gainscapital gains” below).
If the holder of ordinary shares or ADSs elects to receive the proceeds from the sale of rights back to us at a fixed price, the tax regime applicable to the amounts received will be that applicable to cash dividends described above.
218
Spanish refund procedure
According to Spanish Regulations on Non-Resident Income Tax, approved by Royal Decree 1776/2004, dated July 30, 2004, as amended, a refund of the amount withheld in excess of the rate provided by the Treaty can be obtained from the relevant Spanish tax authorities. To pursue the refund claim, if you are a USU.S. resident entitled to the benefits of the Treaty, you are required to file all of the following:
a Spanish 210 Form,
the certificate referred to in the preceding section, and
evidence that Spanish Non-Resident Income Tax was withheld with respect to you.
The refund claim must be filed within four years of the date on which the withheld tax was collected by the Spanish tax authorities. According to Order EHA/3316 of December 17, 2010, the 210 Form may be filed on or after the first of February 1st of the calendar year following the year in which the dividend was paid.
You are urged to consult your own tax adviser regarding refund procedures and any USU.S. tax implications of receipt of a refund.
Taxation of capital gains
Under Spanish law, any capital gains derived from securities issued by persons residing in Spain for tax purposes are considered to be Spanish sourceSpanish-source income and, therefore, are taxable in Spain. If you are a USU.S. resident, income from the sale of ADSs or shares will be treated as capital gains for Spanish tax purposes. Since January 1, 2012, Spanish Non-Resident Income Tax is levied at a 21% rate on capital gains realized by persons not residing in Spain for tax purposes who are not entitled to the benefit of any applicable treaty for the avoidance of double taxation. Royal Decree-Law 20/2011 of December 31 hashad temporarily increased the applicable rate from 19% to 21% from January 1, 2012 until December 31, 2013.2013, but Law 22/2013 has extended the increased rate until December 31, 2014.
Notwithstanding the above, capital gains derived from the transfer of shares on an official Spanish secondary stock market by any holder who is a resident of a country that has entered into a treaty for the avoidance of double taxation with Spain containing an “exchange of information” clause will be exempt from taxation in Spain. In addition, under the Treaty, if you are a U.S. resident, capital gains realized by you upon the disposition of ADSs or shares will not be taxed in Spain provided you have not held, directly or indirectly, 25% or more of our stock during the twelve months preceding the disposition of the stock. You are required to establish that you are entitled to this exemption by providing to the relevant Spanish tax authorities an IRS certificate of residence in the United States, together with the appropriate Spanish 210 Form, between January 1st and January 20th20th of the calendar year following the year in which the transfer of shares took place.
Spanish wealth tax
Individuals not residing in Spain who hold shares or ADSs located in Spain are subject to the Spanish wealth tax (Spanish Law 19/1991), which imposes a tax on property located in Spain on the last day of any year. The Spanish tax authorities maymight take the view that all shares of Spanish corporations and all ADSs representing such shares are located in Spain for Spanish tax purposes. If such a view were to prevail, non-residents of Spain who held shares or ADSs on the last day of any year would be subject to the Spanish wealth tax for such year on the average market value of such shares or ADSs during the last quarter of such year.
Law 4/2008 dated December 23, 2008, amended the Spanish wealth tax law, introducing a 100% tax rebate and eliminating the obligation to file any form for tax periods starting as of January 1, 2008. However, Royal Decree-Law 13/2011, of September 16extended by Law 16/2012 and Law 22/2013, has temporarily restored the wealth tax abolishing the 100% tax rebate until January 1, 20132015 and has introduced among other things, a general€700,000 tax free amount of €700,000.amount.
As a result of Royal Decree-Law 13/2011,the above legislation, non-residents of Spain who held shares, ADSs, or other assets or rights located in Spain according to Spanish wealth tax Law,law, on the last day of 2011or 2012, 2013 or 2014, whose combined value exceeds EUR 700,000 would€700,000 might be subject to the Spanish wealth tax on that excess amount at marginal rates varying between 0.2% and 2.5%, and would be obliged to file the corresponding wealth tax return.
219
Spanish inheritance and gift taxes
Transfers of shares or ADSs upon death or by gift are subject to Spanish inheritance and gift taxes (Spanish Law 29/1987) if the transferee is a resident of Spain for tax purposes, or if the shares or ADSs are located in Spain at the time of gift or death, or the rights attached thereto could be exercised or have to be fulfilled in the Spanish territory, regardless of the residence of the beneficiary. In this regard, the Spanish tax authorities maymight determine that all shares of Spanish corporations and all ADSs representing such shares are located in Spain for Spanish tax purposes. The applicable tax rate, after applying all relevant factors, ranges between 0% and 81.6% for individuals.
Gifts granted to corporations non-resident in Spain are subject to Spanish Non-Resident Income Tax at a 21% tax rate on the fair market value of the shares as a capital gain. Royal Decree-Law 20/2011 of December 31 has temporarily increased from 19% to 21% the rate applicable from January 1, 2012 until December 31, 2013.2013 but Law 22/2013 has extended the increased rate until December 31, 2014. If the donee is a United States corporation, the exclusions available under the Treaty described in the section “—Taxation“Taxation of capital gains” above will be applicable.
Expenses of transfer
Transfers of ADSs or shares will be exempt from any Spanish transfer tax or value-added tax. Additionally, no Spanish stamp tax will be levied on such transfers.
U.S. Federal Income Tax ConsiderationsUS
The following summary describes the material USU.S. federal income tax consequences of the ownership and disposition of ADSs or shares, but it does not purport to be a comprehensive description of all of the tax considerations that may be relevant to a particular person’s decision to acquire such securities. The summary applies only to USU.S. Holders (as defined below) that hold ADSs or shares as capital assets for U.S. federal income tax purposes andpurposes. In addition, it does not addressdescribe all of the tax consequences that may be relevant in light of the U.S. Holder’s particular circumstances, including the potential application of the provisions of the Internal Revenue Code of 1986, as amended (the “Code”) known as the Medicare contribution tax, state, local or non-United States tax laws, and tax consequences applicable to U.S. Holders subject to special classes of US holders,rules, such as:
financial institutions;
insurance companies;
dealers and traders in securities that use a mark-to-market method of tax accounting;
holderspersons holding ADSs or shares as part of a “straddle”, conversion transaction or integrated transaction;
holderspersons whose “functional currency” is not the USU.S. dollar;
holderspersons liable for the alternative minimum tax;
tax exempt entities, including “individual retirement accounts” and “Roth IRAs”;
partnerships or other entities classified as partnerships for USU.S. federal income tax purposes;
holderspersons that own or are deemed to own 10% or more of our voting shares;
holderspersons that acquired our ADSs or shares pursuant to the exercise of an employee stock option or otherwise as compensation; or
holderspersons holding ADSs or shares in connection with a trade or business outside the United States.
If an entity that is classified as a partnership for USU.S. federal income tax purposes holds shares or ADSs, the USU.S. federal income tax treatment of a partner will generally depend on the status of the partner and the activities of the partnership. Partnerships holding shares or ADSs and partners in such partnerships should consult their tax advisers as to the particular USU.S. federal income tax consequences of owning and disposing of the shares or ADSs.
220
This summary is based upon tax laws ofon the United States, including the Internal Revenue Code, of 1986, as amended (the “Code”), administrative pronouncements, judicial decisions, and final, temporary and proposed Treasury Regulations, and the Treaty, all as of the date hereof, changes to any of which may affect the tax consequences described herein, possibly with retroactive effect. In addition, this summary is based on the Treaty and assumes that each obligation provided for in or otherwise contemplated by the deposit agreement or any other related document will be performed in accordance with its terms. USU.S. Holders are urged to consult their own tax advisers as to the US,U.S., Spanish and other tax consequences of the ownership and disposition of ADSs or shares in their particular circumstances.
As used herein, a “US“U.S. Holder” is, for USU.S. federal income tax purposes, a beneficial owner of ADSs or shares thatwho is eligible for the benefits of the Treaty and is:
In general, for USU.S. federal income tax purposes, USU.S. Holders of ADSs will be treated as the owners of the underlying shares represented by those ADSs. Accordingly, no gain or loss will be recognized if a USU.S. Holder exchanges ADSs for the underlying shares represented by those ADSs.
The USU.S. Treasury has expressed concerns that parties to whom American depositary shares are released before delivery of shares to the depositary, (“pre-release”), or intermediaries in the chain of ownership between USU.S. holders and the issuer of the security underlying the American depositary shares, may be taking actions that are inconsistent with the claiming of foreign tax credits by USU.S. holders of American depositary shares. These actions would also be inconsistent with the claiming of the reduced rate of tax, described below, applicable to dividends received by certain non-corporate holders. Accordingly, the creditability of Spanish taxes and the availability of the reduced tax rate for dividends received by certain non-corporate USU.S. Holders, each described below, could be affected by actions taken by these parties or intermediaries.
Taxation of Distributions
Subject to the discussion of the passive foreign investment company rules below, toTo the extent paid out of our current or accumulated earnings and profits (as determined in accordance with USU.S. federal income tax principles), distributions, including the amount of any Spanish withholding tax, made with respect to ADSs or shares (other than certain pro rata distributions of our capital stock or rights to subscribe for shares of our capital stock) will be includible in the income of a USU.S. Holder as foreign-source ordinary dividend income. Because we do not maintain calculations of our earnings and profits under USU.S. federal income tax principles, it is expected that distributions generally will be reported to USU.S. Holders as dividends. These dividends will be included in a USU.S. Holder’s income on the date of the USU.S. Holder’s (or in the case of ADSs, the depositary’s) receipt of the dividends, and will not be eligible for the “dividends-received deduction” generally allowed to corporations receiving dividends from domestic corporations under the Code. The amount of the distribution will equal the USU.S. dollar value of the euros received, calculated by reference to the exchange rate in effect on the date that distribution is received (which, for USU.S. Holders of ADSs, will be the date that distribution is received by the depositary), whether or not the depositary or USU.S. Holder in fact converts any euros received into USU.S. dollars at that time. If the dividend is converted into USU.S. dollars on the date of receipt, a USU.S. Holder generally will not be required to recognize foreign currency gain or loss in respect thereof. An USA U.S. Holder may have foreign currency gain or loss if the euros are converted into USU.S. dollars after the date of receipt. Any gainsgain or lossesloss resulting from the conversion of euros into USU.S. dollars will be treated as ordinary income or loss, as the case may be, and will be US-source.U.S.-source.
A scrip dividend (such as a dividend described in(see Item 4 of Part I, “Information on the Company—Company – A. History and development of the company—company – Principal Capital Expenditures and Divestitures—Divestures – Recent events”Events”) will be treated as a distribution of cash, even if a U.S. Holder elects to receive the dividendequivalent amount in shares. In that event, the U.S. Holder will be treated as having received the U.S. dollar fair market value of the shares on the date of receipt, and that amount will be the U.S. Holder’s tax basis in those shares. The holding period for the shares will begin on the following day.
Subject to generally applicable limitations that may vary depending upon a holder’sU.S. Holder’s individual circumstances, and the discussion above regarding concerns expressed by the USU.S. Treasury, and the discussion of the passive foreign investment company rules below, under current law, dividends paid to certain non-corporate USU.S. holders inmay be taxable years beginning before January 1, 2013 will be taxed at favorable rates upapplicable to a maximum rate of 15%.long-term capital gains. A USU.S. Holder must satisfy minimum holding period requirements in order to be eligible to be taxed at these favorable rates. Non-corporate holders are urged to consult their own tax advisers to determineregarding the applicationavailability of the rule regarding this favorablereduced rate on dividends in their particular circumstances.
221
Subject to certain generally applicable limitations that may vary depending upon youra U.S. Holder’s circumstances and subject to the discussion above regarding concerns expressed by the USU.S. Treasury, a USU.S. Holder will be entitled to a credit against its USU.S. federal income tax liability for Spanish income taxes withheld at a rate not exceeding the rate provided by the Treaty. Spanish income taxes withheld in excess of the rate applicable under the Treaty will not be eligible for credit against a U.SU.S. Holder’s federal income tax liability. See “Spanish tax considerations – Spanish refund procedure –”procedure” for a discussion of how to obtain amounts withheld in excess of the applicable Treaty rate. The limitation on foreign taxes eligible for credit is calculated separately with regard to specific classes of income. Instead of claiming a credit, a USU.S. Holder may, at its election, deduct such otherwise creditable Spanish taxes in computing taxable income, subject to generally applicable limitations. An election to deduct foreign taxes instead of claiming foreign tax credits applies to all taxes paid or accrued in the taxable year to foreign countries and possessions of the United States.
A USU.S. Holder must satisfy minimum holding period requirements in order to be eligible to claim a foreign tax credit for foreign taxes withheld on dividends. The rules governing foreign tax credits are complex, and USU.S. Holders are urged to consult their own tax advisers to determine whether they are subject to any special rules that limit their ability to make effective use of foreign tax credits.
Sale or Exchange of ADSs or Shares
Subject to the discussion of the passive foreign investment company rules below, a USA U.S. Holder will realize gain or loss on the sale or exchange of ADSs or shares in an amount equal to the difference between the USU.S. Holder’s tax basis in the ADSs or shares and the amount realized on the sale or exchange, in each case as determined in USU.S. dollars. TheSubject to the discussion of the passive foreign investment company rules below, the gain or loss will be capital gain or loss and will be long-term capital gain or loss if the USU.S. Holder held the ADSs or shares for more than one year. This gain or loss will generally be U.S.-source gain or loss for foreign tax credit purposes.
Passive Foreign Investment Company Rules
We believe that we were not a “passive foreign investment company” (“PFIC”) for USU.S. federal income tax purposes for the 20112013 taxable year. However, because our PFIC status depends upon the composition of our income and assets and the fair market value of our assets (including, among others, less than 25% owned equity investments) from time to time, and upon certain proposed Treasury Regulations that are not yet in effect but are proposed to become effective for taxable years after December 31, 1994, there can be no assurance that we were not or will not be a PFIC for any taxable year.
If we were a PFIC for any taxable year, any gain recognized by a USU.S. Holder on a sale or other disposition of ADSs or shares would be allocated ratably over the USU.S. Holder’s holding period for the ADSs or shares. The amounts allocated to the taxable year of the sale or other exchange and to any year before we became a PFIC would be taxed as ordinary income. The amounts allocated to each other taxable year would be subject to tax at the highest rate in effect for individuals or corporations, as appropriate, for that taxable year, and an interest charge would be imposed on the amount allocated to each of those taxable years. Further, any distribution in respect of ADSs or shares in excess of 125% of the average of the annual distributions on ADSs or shares received by the USU.S. Holder during the preceding three years or the USU.S. Holder’s holding period, whichever is shorter, would be subject to taxation as described above. Certain elections may be available that would result in alternative treatments (such as mark-to-market treatment) of the ADSs or shares.
In addition, if we were a PFIC in a taxable year in which we paid a dividend or the prior taxable year, the 15% dividendreduced rate on dividends discussed above with respect to dividends paid to non-corporate holdersU.S. Holders would not apply.
If we were a PFIC for any taxable year during which a U.S. Holder owned the ADSs or shares, the U.S. holder would generally be required to file IRS Form 8621 with their annual U.S. federal income tax returns, subject to certain exceptions.
Information Reporting and Backup Withholding
Payment of dividends and sales proceeds that are made within the United States or through certain US-relatedU.S.-related financial intermediaries generally are subject to information reporting, and may be subject to backup withholding, unless (i) the USU.S. Holder is an exempt recipient or (ii) in the case of backup withholding, the USU.S. Holder provides a correct taxpayer identification number and certifies that it is not subject to backup withholding. The amount of any backup withholding from a payment to a USU.S. Holder will be allowed as a credit against the USU.S. Holder’s USU.S. federal income tax liability and may entitle the USU.S. Holder to a refund, provided that the required information is timely furnished to the IRS.
Certain USU.S. Holders who are individuals may be required to report information relating to their ownership of an interest in certain foreign financial assets, including stock of a non-USnon-U.S. entity, subject to certain exceptions (including an exception for publicly traded stock and interests held in custodial accounts maintained by a USU.S. financial institution). Certain USU.S. Holders that are entities may be subject to similar rules in the future. USU.S. Holders are urged to consult their tax advisers regarding the effect, if any, of this requirement on the ownership and disposition of ADSs or shares.
F. Dividends and paying agents
Not Applicable.
222
Not Applicable.
We are subject to the information requirements of the Exchange Act, except that as a foreign issuer, we are not subject to the proxy rules or the short-swing profit disclosure rules of the Exchange Act. In accordance with these statutory requirements, we file or furnish reports and other information with the SEC. Reports and other information filed or furnished by us with the SEC may be inspected and copied at the public reference facilities maintained by the SEC at Room 1024, 100 F Street, N.E., Washington, D.C. 20549, and at the SEC’s regional offices at 233 Broadway, New York, New York 10279 and Northwestern Atrium Center, 500 West Madison Street, Suite 1400, Chicago, Illinois 60661-2511. Copies of such material may also be inspected at the offices of the New York Stock Exchange, 11 Wall Street, New York, New York 10005, on which our ADSs are listed. In addition, the SEC maintains a website that contains information filed electronically with the SEC, which can be accessed on the internet athttp://www.sec.gov. The information contained on this website does not form part of this annual report on Form 20-F.
Not Applicable.
223
Item 11. Quantitative and Qualitative Disclosures About Market Risk
Our risk management activities involve the integrated qualification and quantification of the different types of risk (credit risk, operational risk, reputational risk and market risk) which are assumed by our business units in their activities.
We have divided this section into the following ten parts:
Corporate principles of risk management, control and risk appetite;
Corporate governance of the risk function;
IntegralIntegrated risk control of risk;
CreditClusters of risk;
OperationalCredit risk;
Reputational risk;
Adjustment to the new regulatory framework;
Economic capital;
Risk training activities;Compliance and
Market risk.
Part 1. Corporate principles of risk management, control and risk appetite
1.1 Corporate principles
The importance of Grupo Santander’s risk policy was underscored again in 2011. The policy is focused on maintaining a medium-low and predictive profile in all risks, which, together with the Group’s high degree of diversification, was again the differential element that enabled Santander to maintain a leading position in the market.
For Grupo Santander, quality management of risk is one of our hallmarks and thus a priority in our activity. Throughout our 150 years, Santander has combined prudence in risk management with use of advanced risk management techniques, which have proven to be decisive in generating recurrent and balanced earnings and creating shareholder value.
The risksmodel underlying the business model is based on the following principles:
• Independent working from
• Involvement
• Collegiatethe decision-making (includingprocess.
• Defining functions. Each
224
• Centralized
ManagementAt the Group, the risk management and control process is conducted as follows:
• Formulate the risk appetite. The purpose of which is to delimit, synthetically and explicitly, the levels and types of risk that the BankGroup is readywilling to assume in the developmentperformance of its business.
• Establish
• Building,
• Execute
1.2 Risk culture
Santander’sThe risk culture is based on the principles of the Group’s risk management model detailed above and is transmitted to all of the organization’s business and management units, supported, inter alia, by the following levers:
• Internal rating and scoring models which, by assessing
• Economic capital, as the homogeneous metrictransmission of the risk assumedculture are the training activities performed at the corporate risk school, the remuneration and incentives policy -which always includes performance-based variables that take into account risk quality and the basis for measuring management, using RORAC, for pricing transactions (bottom up)Group’s long-term results-, employees’ adherence to the general codes of conduct and for analysis of portfolios and units (top down), and VaR, assystematic, independent action taken by the element of control and settinginternal audit services.
1.3 Risk appetite at the market risk limits of the various trading portfolios.Group
• Analysis of scenarios and stress tests to complement the analysis of market and credit risk, in order to assess the impact of alternative scenarios, including on provisions and on the capital.
We calculate the minimum regulatory capital in accordance with Bank of Spain circular 3/2008, as amended, on determining and controlling the minimum equity of credit institutions. This regulation completed the transfer to Spanish banking legislation of various EU directives.
As a result of the new elements introduced into the regulatory framework, commonly known as BIS III, we have taken steps to apply with sufficient prevision the future requirements indicated in BIS III. This entails a greater requirement for high quality capital, sufficiency of capital conservation and counter cyclical measures.
Grupo Santander’s risk appetite
The riskRisk appetite is defined in Santanderat the Group as the amount and type of risks consideredrisk that it considers reasonable to assume forin implementing its business strategy, soin order to ensure that the Groupit can maintain its ordinary activity in the event ofcontinue to operate normally if unexpected events that couldoccur. To this end, severe scenarios are taken into account, which might have a negativean adverse impact on its levellevels of capital levels of profitabilityor liquidity, its profits and/or its share price.
The board of directors is the body responsible for establishing and annually updating the Group’s risk appetite, andfor monitoring theits actual risk profile and for ensuring the consistency between them. the two. The risk appetite is determined both for the Group as a whole and for each of the main business units using a corporate methodology adapted to the circumstances of each unit/market. At local level, the boards of directors of the related subsidiaries are responsible for approving the respective risk appetite proposals once they have been validated by the Group’s executive committee.
Senior management is responsible for achieving the desired risk profile as well as managing risks-which is reflected in the approved annual budget and in the medium-term strategic plan-, and for the day-to-day management of risk. Thus, it ensures that the usual limit structures formalized for each risk are properly connected to the established risk appetite metrics.
These limit structures for each risk are complementary to the risk appetite and fundamental to the articulation of an effective management thereof on a dailyday-to-day basis. The establishmentIf the established risk appetite levels are reached, the required management measures must be adopted so that the desired risk profile can be restored.
Every quarter, the risk committee and the executive committee of the Group check compliance with the risk appetite at both Group and business unit level.
In 2013 further progress was made in the effective application of the risk appetite coversframework at the Group through both the risks whose assumption constitutesrelated quarterly reviews referred to above and its implementation in certain of the strategic objectiveGroup’s main units.
Risk appetite framework
The Group’s risk appetite framework contains both quantitative and qualitative elements making up a group of primary metrics and a separate series of supplementary indicators.
Quantitative elements of the risk appetite
The primary quantitative metrics of the risk appetite are as follows:
These metrics are calculated for which maximum exposure criteriasevere stress scenarios that are set —minimum objectivesplausible but unlikely to occur.
Also, the Group has a series of return/risk— as well as those whose assumption is not desired but which cannot be avoidedtransversal metrics aimed at limiting excessive concentration of the risk profile, both in an integral way. The board will ensure that the amountterms of risk factors and type of risks relevant for the Bank have been taken into account. These derive from the annual budget approved as well asperspective of customers, businesses, geographical areas and products.
Losses
One of the medium-term strategic plan which is approved by the board. It also ensures that sufficient resources have been assignedthree primary metrics used to manage and control these risks, at both the global and local levels.
225
The board regularly revises, at least once a year,formulate the Group’s risk appetite is expressed in terms of the maximum unexpected effect on results that the Group is willing to accept in the event of adverse scenarios that are plausible but unlikely to occur.
These scenarios affect mainly both the losses arising from credit risk exposure of retail and itswholesale portfolios (considering both the direct credit loss and the reduction in margin) and the potential adverse effect of the exposure to market risk. After applying these credit and market impacts to the budgeted results, in the context of the monitoring of the risk appetite, senior management framework, analyzingassesses whether the impact of unlikely but plausible tension scenariosresulting margin is sufficient to absorb any unexpected effects arising from technology and adopting the pertinent measures to ensure the policies are met.operational risk and compliance and reputational risk.
The time horizon for the materialization of the adverse effects for all the risks considered is generally three years, or one year for market risk. Accordingly, the risk appetite is formulated for the whole Group as well asframework should be complied with for each of the following three years.
With regard to this loss metric, the Group’s risk appetite establishes that the combined effect on all risks arising from these scenarios must be lower than the net margin after ordinary provisions, i.e. ordinary operating profit/(loss) before tax.
Capital position
The Group has decided to operate with an ample capital base that enables it not only to meet regulatory requirements but also to have a reasonable capital buffer.
Also, in view of the related stress scenarios referred to in the preceding section, the Group’s risk appetite establishes that its main business units. risk profile must be such that the unexpected effect of these stress scenarios does not impair the core capital ratio by more than 100 basis points.
This capital approach included in the risk appetite framework is complementary to and consistent with the capital target for the Group that was approved as part of the capital planning process (Pillar II) implemented at the Group for a period of three years.
Liquidity position
The boardsGroup has implemented a funding model based on autonomous subsidiaries that are responsible for covering their respective liquidity requirements. Based on this premise, liquidity management is performed at the level of each of the subsidiaries must approvewithin the respectivecorporate management framework which implements its basic principles (decentralization, medium- and long-term balance between the source and the use of funds, high weighting of customer deposits, diversification of wholesale sources, low recourse to short-term funding, sufficient liquidity reserve) and it is based on three fundamental pillars (governance model, balance sheet analysis and liquidity risk appetite proposalsmeasurement, and management adapted to the corporate framework.needs of the business).
Risk appetite framework
Santander’sThe Group’s liquidity risk appetite framework hasestablishes a structural funding ratio of over 100%, i.e. the medium- and long-term customer deposits, capital and issues must exceed the structural funding needs defined basically as loans and credits and investments in Group companies. In addition, liquidity position and horizon targets are set for local and global systemic stress scenarios and idiosyncratic stress scenarios.
Supplementary quantitative metrics of concentration risk appetite
The Group wishes to maintain a widely diversified risk portfolio from the perspective of its exposure to large risks, to certain markets and to specific products. This is obtained firstly by virtue of the Group’s focus on the retail banking business with a high level of international diversification.
Concentration risk is measured using the following metrics for which risk appetite thresholds are established as wella proportion of capital or loans and credits (generally):
Non-financial risks
Qualitative elements of the risk appetite:
The qualitative elements ofIn general, the risk appetite framework define, both generally and for the main risk factors, the positioning that Santander’s senior management wishes to adopt or maintain in the development of its business model. Generally, ourGroup’s risk appetite framework is based on maintaining the following qualitative objectives:
•
• Maintain a
• Maintain a
• Maintain an organizational
• Maintain an
• Maintain
• Focus the
•
• Maintain adequate and sufficient
• Implement
Quantitative elements of risk appetite
The quantitative elements that comprise the risk appetite framework are specified in the following basic metrics:
• The maximum lossesand that the Bank has to assume;
226
• The minimum capital position that the Bank wants to maintain; and
• The minimum liquidity position that the Bank wishes to have in the event of unlikely but plausible tension scenarios.
We also have a series of transversal metrics to limit the excessive concentration ofincentives are consistent with the Group’s risk profile, both by risk factors as well as from the standpoint of customers, businesses, countries and products.
The Group’s risk appetite framework distinguishes between:
a)Risk capacity: the maximum level of risk that the Group can technically assume in the development of its business plans without compromising its commercial viability;
b)Risk appetite: the level, type of risk and geographic distribution that the Group is ready to accept in order to attain the strategic objectives in its business plan; and
c)Objective risk: the level and type of risk the Group incorporates into its budgets.
Risk tolerance is defined as the difference between risk appetite and objective risk. The risk appetite framework includes setting a series of triggers as the risk tolerance is consumed. Once these levels are reached and the board is informed the necessary management measures are adopted so that the risk profile can be adjusted as needed.
Losses
One of the three basic metrics used to formulate Santander’s risk appetite is expressed in terms of the maximum losses it is prepared to assume in the event of unfavorable scenarios —internal and external— whose probability of occurrence is considered low but plausible.
We regularly conduct analysis of the impact, in terms of losses, of submitting the portfolios and other elements that make up the Bank’s risk profile to stress scenarios that take into account various degrees of the probability of occurring.
The time frame for materialization of the negative impact for all risks considered will normally be 12 months, except for credit risk where an additional impact analysis is conducted with a three year time frame.
Capital position
Santander wants to operate with a large capital base that enables it not only to comply with the regulatory requirements but also have a reasonable surplus of capital. Its core capital target is 10%, which is one percentage point above the 9% required by the European Banking Authority (EBA).
The capital target extends to a period of three years, within the capital planning process implemented in the Group.
Liquidity position
The Group’s liquidity management model is based on the following principles:
• Decentralized liquidity model: autonomy of the subsidiaries within liquidity levels coordinated at the Group level.
• Comfortable structural liquidity position supported by stable funding: mainly customer deposits (principally in the retail segment) and medium- and long-term wholesale funding (with an objective of an average maturity of more than three years).
• Ample access to wholesale markets and diversification by markets, instruments and maturities.
227
• High discounting capacity with central banks.
Bearing in mind the Group’s wish to be structured on the basis of autonomous subsidiaries, liquidity management is executed by each of our subsidiaries. All of them, thus, must be self-sufficient as regards the availability of liquidity.
Transversal metrics of risk appetite: concentration
Santander wants to maintain a well-diversified risk portfolio from the standpoint of its exposure to large risks, certain markets andcontains specific products. In the first instance, this is achieved by virtue of Santander’s focus on retail banking business with a high degree of international diversification.
Concentration risk: this is measured via three focuses, which include limits set as signs of alert or control:
• Customer: individual and aggregate exposure to the 20 largest clients as a proportion of shareholders’ funds.
• Product: maximum exposure of clients to derivatives.
• Sector: maximum percentage of exposure of the portfolio of companies to an economic sector.
Specific objectives by type of risk
In addition, Grupo Santander’s risk appetite framework includes specificqualitative objectives for the followingvarious types of risk:risk considered:
Credit riskLiving wills (recovery and resolution plans)
• Complete management of the credit risk cycle withThe Group has a corporate model based on establishing budgets, their structural limits and management plans and on monitoring and control integrated with global reach responsibilities.
• Global and inter-related vision of the credit exposure, with portfolio vision, including, for example, lines committed, guarantees, off-balance sheet, etc.
• Involvement of the risk function in all credit risk admissions, avoiding the taking of discretionary decisions at the personal level, combined with a strict structure of delegation of powers.
• Systematic use of scoring and rating models.
• Centralized, real-time control of counterparty risk.
Market risk
• Moderate market risk appetite.
• Business model focused on the customer with scant exposure to own account business activities.
• Independent calculation of the results of market activities by the risk function.
• Daily centralized control of the market risk of trading activity (VaR).
• Strict control ex ante of products, underlying assets, currencies, etc., for which transactions are authorized as well as of the corresponding valuation models.
Structural risks
• Conservative management of balance sheet and of liquidity risk on the basis of what is stated in the previous sections.
• Active management of exchange rates in relation to the hedging of capital and the results in subsidiaries.
228
• Reduced sensitivity of margins and capital to changes in interest rates in stress situations.
• Limited assumption of credit risk in managing the Group’s balance sheet.
• Limited assumption of cross-border risk.
Technology and operational risk
• Supervision of technology and operational risk management through approval of the management framework and of the structure of the corresponding limits.
• Management focus centered on risk mitigation, based on monitoring and controlling gross losses/gross income, self- assessment questionnaires/risk maps and management indicators.
• Operational and technology integration model via corporate platforms and tools.
• Systems’ architecture with adequate redundancies and controls in order to guarantee a minimum probability of occurrence of high impact events and which, in their case, limit their severity.
• Business Continuity Master Plan with local developments; local plans of contingency coordinated with the corporate area of technology and operational risk.
Compliance and reputational risk
• Comply with all the regulatory requirements, ensuring qualifications and substantial recommendations are avoided in audits and supervisors’ reviews.
• Maintain the confidence of customers, shareholders and employees, as well as society in general, regarding solvency and reputation.
• Maintain a zero appetite in compliance and reputational risk through corporate policies, with local implementation, backed by risk indicators and the functioning of corporate and local committees that enable risk to be identified, monitored and mitigated in matters of:
– Prevention of money laundering: (analysis and resolution committee);
– Compliance (committee of compliance with regulations): Code of Conduct in the Securities Markets, transactions suspicious of market abuse, institutional relations, Markets in Financial Instruments Directive (MiFID); customers’ complaints to supervisors; data protection regulations and code of conduct of employees;
– Commercialization of products: reputational risk management office and committees of approval, marketing and monitoring of products, observing operational, conduct and reputational risk criteria.
• Registry and monitoring of disciplinary procedures, total cost by losses including fines and sanctions.
• Continuous monitoring of audits and revisions of the supervisors and of their corresponding recommendations in the sphere of compliance and reputational risk.
Risk appetite and living wills
We have an organizational structure based on autonomous andsubsidiaries that are self-sufficient subsidiaries in terms of capital and liquidity minimizing the useterms and it ensures that none of non-operating or investment companies, and ensuring that no subsidiarythese subsidiaries has a risk profile that couldmight jeopardize the Group’s solvency.
229
Grupo Santander wasIn 2010 the first international financial institutions considered globally systemic by the Financial Stability Board to present (in 2010) to its consolidated supervisor (the Bank of Spain)Group filed its corporate living wills including, as required, a viability plan and allwith the information needed to plan a possible liquidation (resolution plan). Furthermore, and even thoughsupervisor of the consolidated Group, the Bank of Spain. Moreover, although it was not required, in 2010 morefurther summarized individual plansliving wills were drawn upprepared for the main geographicimportant geographical units, including Brazil, Mexico, Chile, Portugal and the UK. The secondU.K..
In 2013 the fourth version of the corporate living wills was presentedprepared. As with the first three versions in 2010, 2011 and also2012, the secondGroup submitted the fourth version of the main summarized localliving wills to its CMG (Crisis Management Group) in September 2013. The 2013 living wills comprises the corporate plan (corresponding to Banco Santander, S.A.) and voluntary plans, and progress was made in preparing the local obligatoryindividual plans for most of its most important local units (the U.K., Brazil, Mexico, the Group’s entities which mustU.S. – Santander USA, Germany and Portugal). Particularly noteworthy are the cases of the U.K., Germany and Portugal, where, irrespective of the obligation to be eventually presented.
Also noteworthy waspart of the significant contribution that thecorporate living wills, exercise madea complete version was prepared in compliance with local regulatory initiatives.
We also submitted our U.S. resolution plan in December 2013. The resolution plan is subject to review by the conceptual delimitation ofFederal Reserve Board and the Group’s risk appetite and risk profile.FDIC.
The risk committee is responsible for proposing to the board the Group’s risk policy thefor approval of which corresponds toby the board underwithin its powers of administrationgoverning and supervision. Thesupervisory powers. Furthermore, the committee also ensures that the Group’s activities are consistent with its risk toleranceappetite level and, establishes thein this regard, it sets global limits for the main risk exposures, reviewing themwhich it reviews systematically, and resolving thosedecides upon any transactions that exceed the powers delegated in bodies lower down the hierarchy.to lower-ranking bodies.
The risk committee, is of an executive nature and takesbody that adopts decisions inwithin the spherescope of the powers delegated in it by the board. Itboard, is chairedpresided over by the thirdsecond vice-chairman of Grupo Santanderthe Group and also comprises a further four other board members are also membersdirectors of the committee.Bank.
The committee met 99 times during 2011, underscoringresponsibilities assigned to the importance that Grupo Santander attaches to appropriate management of its risks.
The main responsibilities of the board’s risk committee are:are essentially as follows:
• Propose
–
–
– Set the
–
• Systematically review exposures with
• Authorize
• Ensure
• Know,
• Resolve operations beyond
The board’s risk committee delegates somehas delegated certain of its powers to risk committeessubcommittees which are structured by geographicgeographical area, business line and typestype of risk, all of themwhich are defined in the corporate risk governance risk model.
In addition, both the executive committee and the Bank’s board of directors of the Bank pay particular attention to the management of the Group’s risks.
At the 2014 annual general meeting, held on March 28, 2014, our shareholders passed a resolution proposed by the board of directors to amend our Bylaws in compliance with the CRD IV to establish a new committee of the board to assist the latter on matters of risk, regulation and compliance.
Our amended Bylaws have not yet been filed with the Mercantile Register, which is required prior to their effectiveness. We expect that the amendments will become effective within the first semester of 2014.
Once such committee is set up, the risk committee will retain its powers with respect to risk management and the new committee will assume advisory and support functions on issues of supervision and risk control, the definition of Group’s risk policies, relations with supervisors and compliance issues, the latter being handed over from the current audit and compliance committee, which will henceforth be known as the audit committee.
The Group’s thirdsecond vice-chairman of the Group is the maximum executive inperson ultimately responsible for risk management. He is also a member of the board of directors and chairman of the risk committee. Two executive vice-presidents of risks, whichcommittee, and two general risk units report to him. These units are independent of the business areas from both from thea hierarchical and functional standpoint, report to the third vice-chairman.
230
•
The GDR is structured around two fundamental functions, which are replicated locally and globally:
– A corporate structure, with global scope responsibilities (“all risk, all countries”), entrusted with establishing the policies, methodologies and control. In this block, also called Intelligence and Global Control, are the areas/functions of solvency risks, market risk and methodology.
– A structure of businesses, focused on executing and integrating managementareas of the risk functionsunit are divided into three blocks:
In compliance with the aforementioned structure, the Group has defined a planning and governance area responsible for the coordination of new projects and the internal management of global business risks.
Complementingall the three corporate structure areasunits, and the six business areas is thea risk monitoring and consolidation area of global and systemic governance, which supports and advises the GDR, and is responsible for implementing the organizational model, overseeing effective executionall risks on an overall basis.
The scope of internal control and the systems model.
Theseaction of these functions have ais global, action sphere, i.e. they intervenefeature in all the units wherein which the risk division acts and therethis structure is a reflection of the same structuremirrored in the local units. The mainfundamental elements through which the global functions are replicated in each ofunit are the units are corporate frameworks. These are the central elements to communicatefor disseminating and transfertransferring global practices, reflectreflecting the criteriaaction policies and policiescriteria for each of the areasarea and setestablishing the Group’s compliance standards to be applied inat all local units.
Generally speakingIn general, it is possible to distinguish the main functions developed respectivelyperformed by the GDR’s global areas of the DGR and by the units:
–
–
• General directorate of integral
–
– Integral control of risks, including supervisingwhich is to supervise the quality of the Group’s risk management, guaranteeingseeking to ensure that the systems for the management and control of the risks inherent to its activity comply with the strictest criteria and the best practices observed in the industry and/or required by the regulators, and verifying that the risk profile actually assumed is within the guidelines laid down by senior management.
Part 3. Integrated risk control and internal risk validation
The integrated risk control and internal risk validation functions are located, at corporate level, within the integrated risk control and internal risk validation unit, reporting directly to the second vice-chairman of the Group and chairman of the risk committee, and provide support for the Group’s governing bodies in risk control and management matters.
3.1 Integrated risk control function
In 2008 the Group launched the integrated risk control function in order to ensure an integrated view of the management of all the risks affecting the performance of the Group’s ordinary activities. The risks taken into consideration are: credit risk (including concentration and counterparty risks); market risk (including liquidity risk and structural interest rate and foreign currency risks); operational and technology risk; and compliance and reputational risk.
The integrated risk control function is articulated in three complementary activities:
1) To guarantee that the management and control systems offor the various risks inherent in its activitythe Group’s activities comply with the most demanding criteria and best practices observed in the banking industry and/or are required by regulators, and verifying that the profile of effective risk assumed is adjusted to what senior management has established.
231
Part 3. Integral control of risk
Grupo Santander launched in 2008 the function of integral control of risks, anticipating the new regulatory requirements, then being discussed in the main organizations and forums — Basel Committee, CEBS, FSF, etc.,— as well as the recommendations on best risk management practices formulated by various public and private bodies.
Organization, mission and features of the function
The organization of this function is part of the directorate general of integral control and internal validation of risk. This function supports the Group’s governance bodies in risk management and control.
Particular attention is paid to credit risk (including the risks of concentration and counterparty); market risk (including liquidity risk as well as structural risks of interest rates and exchange rates); operational and technology risks and compliance and reputational risk.
Integral control of risks is based on three complementary activities:
1) Ensure that the management and control systems of the various risks inherent in Grupo Santander’s activity meet the most demandingstringent criteria and the best practices observed in the industry and/or required by regulators;
2) EnsureTo ensure that senior management has at its disposal an integral visionall-embracing view of the profileprofiles of the various risks assumed at any time and that these risksprofiles are in lineconsistent with the previously agreed appetite for risks;pre-determined risk appetite; and
3) Supervise appropriateTo supervise adequate compliance, in due time and form, with theany recommendations drawn up foron risk management matters followingand control made as a result of inspections conducted by internal auditingaudit and by the supervisors to whom Santanderwhich the Group is subject.
Internal control of risk supports the work of the risk committee, providing it with the best practices in risk management.
The main features of this function are:
• Globalis characterized by having global and corporate scope:scope and encompasses all risks, all businesses and all countries;
•geographical areas. It is configured as a third layer of control followingwhich follows the onecontrol performed in the first instance by the personofficer responsible for managing and controlling each risk in the sphere ofat each business or functional unit (first layer of control) and by each officer responsible for the corporate control of each risk at corporate level (second layer)layer of control). This system ensures thea vision and, thus integral controltherefore, the integrated monitoring of all the risks incurred duringby the yearGroup in Santander’s activity.the performance of its business activities.
• Special attention is paid3.2 Independent internal validation of risk models
In addition to constituting a regulatory requirement, the internal validation of risk models function provides essential support to the development of best practicesboard’s risk committee and the local and corporate risk committees in the sphereperformance of their duties to authorize the use of the financial industry,models (for management and regulatory purposes) and to review them regularly.
To this end, a sufficiently independent specialized unit of the Group issues an expert opinion on the adequacy of the internal models for the intended internal management and/or regulatory purposes (calculation of regulatory capital, level of provisions, etc.), expressing a conclusion on their robustness, usefulness and effectiveness.
At the Group, internal validation covers all models used in order to be able to incorporate within Santanderthe risk function, i.e. credit, market, structural and at once any advances deemed opportune.
• Bothoperational risk models and economic and regulatory capital models. The scope of the information available as well asvalidation includes not only the resourcesmore theoretical or methodological aspects, but also the technology systems and the data quality that Grupo Santander assigns to controllingfacilitate and underpin the various risks are optimized, avoiding overlapping.
Methodologyeffective operation of the models and, toolsin general, all the relevant aspects of risk management (controls, reporting, uses, involvement of senior management, etc.).
This function is backedperformed at a global and corporate level in order to ensure uniformity of application, and is implemented through five regional centers located in Madrid, London, São Paulo, New York and Wroclaw (Poland). From a functional standpoint, these centers are fully accountable to the corporate center, which makes it possible to ensure consistency in the performance of their activities. This system facilitates the application of a corporate methodology that is supported by ana set of tools developed internally developedby the Group that provide a robust corporate framework to be used at all the Group’s units and which automate certain verifications to ensure efficient reviews.
It should be noted that the Group’s corporate internal validation framework is fully consistent with the internal validation standards for advanced approaches issued by the Bank of Spain and by the other supervisors to which the Group is subject. Accordingly, the Group maintains the segregation of functions between internal validation and internal audit, which, in its role as the last layer of control at the Group, is responsible for reviewing the methodology, tools and work performed by internal validation and for giving its opinion on the degree of effective independence.
The Group’s senior management considers that there are clusters of risk that affect its business and, therefore, the risks arising from it. These clusters and the actions adopted to mitigate them are as follows:
Module 1
A guide of tests or reviews exists for each risk, divided in spheres of control (for example, corporate governance, organizational structure, management systems, integration in management, technology environment, contingency plans and business continuity,mitigate their impact, if any. Compliance with these measures by financial institutions, especially those designated as systemic, is having an impact on various areas: capital requirements, liquidity, transparency, etc.).
Applying the tests and obtaining the relevant evidence, which is assessed and enables the parameters of control of the various risks to be homogenized, is done every 12 months. New tests are incorporated where needed. The tests were fully reviewed during 2011, using as a reference the best practices most recently observed in the banking industry and/or required by the regulators, and also taking into account the experience garnered in previous years in this sphere.
232
The support tool is the risk control monitor (RCM), which is a repository of the results of each test and its work papers. A review of the situation of each risk is also conducted every six months, withconstant monitoring of the recommendations that emanate fromchanges in the annual reportregulatory framework and the anticipation of integral control.
Module 2
Senior management is ablethese changes to monitorenable Santander to adapt swiftly to the integral visionnew requirements constitute the basic pillars of the various risks assumed and their adjustmentBank’s approach to the previously formulated risk appetites.
Module 3
In order to monitor proactively the recommendations made by internal auditing and by the supervisors regarding risk control and management. We have a tool called SEGRE, which enables us to register the recommendations arising from integral control.these matters.
The Bank of Spain can access these tools if it so wishes and thus also the work papers used to develop the function of integral control of risks.
The following relevant issues took place during 2011:
(a) The third cycle of reviewing the various risks was completed in close contact with the corporate areas of control, contrasting and assessing the control and management systems of these risks. Improvements were identified and made into recommendations —with their corresponding schedule for implementation agreed with the risk areas— along with half yearly monitoringpublic policy department, which forms part of the progress achieved oncommunications, corporate marketing and research division, assumes the recommendations made in 2010.
(b) The boardtask of monitoring and the executive committee were regularly informed and given an integral vision of all risks, and the risk committee and the audit and compliance committee were also informed of the function’s performance.
(c) Work continued on extending the integral control of risks model to the Group’s main units, also coordinating the initiatives in this sphere in the various countries; and
(d) There was also participation,managing regulatory alerts, in coordination with the general secretariat division, the controller’s unit, the finance and risk divisions and the support and business areas affected by these alerts. The persons responsible for public policy at division level hold meetings on a monthly basis and other areas,those responsible for public policy at country level hold a teleconference every month in representingorder to ensure coordination at Group level.
This approach is encouraged and supported from the highest echelons of the Bank’s senior management. The public policy committee, which is chaired by the CEO, is the forum where the main regulatory changes are reported, the impact thereof is analyzed and the strategy to be adopted regarding these matters is designed.
233
4.15.1 Introduction to the treatment of credit risk
Credit risk is the possibility of lossesloss stemming from the total or partial failure of clientsour customers or counterparties to meet their financial obligations withto the Group.
Our risks functionIn credit risk management terms, segmentation is organizedbased on the basisdistinction between two types of the type of customer in ordercustomers:
• Those under individualized management are assigned, mainly because of the risk assumed,which a risk analyst.analyst has been assigned. This category includes the companies ofglobal wholesale banking customers (corporates, financial institutions and some ofsovereigns) and the retail banking companies of retail banking.whose risk level is above a set exposure threshold for each unit. Risk management is conductedperformed through expert analysis backed upsupplemented by tools todecision-making support decision-making based on internal models of risk assessment.tools.
• Standardized: a customer who has
The Group has a mainly retail profile, with more than 80% of its total risk exposure being generated by its commercial banking business.
5.2 Main aggregates and variations
5.2.1 Global credit risk map - 2013
Following are the main aggregates relating to credit risk arising on customer business:
| Credit risk exposure to customers(1) (millions of euros) | Non-performing loans ratio (%) | Coverage ratio (%) | ||||||||||||||||||||||||||||||||||
| 2013 | 2012 | 2011 | 2013 | 2012 | 2011 | 2013 | 2012 | 2011 | ||||||||||||||||||||||||||||
Continental Europe | 312,167 | 332,261 | 353,506 | 9.13 | 6.29 | 5.24 | 57.3 | 77.0 | 55.2 | |||||||||||||||||||||||||||
Spain | 189,783 | 210,536 | 223,456 | 7.49 | 3.84 | 3.30 | 44.0 | 50.0 | 50.9 | |||||||||||||||||||||||||||
Santander Consumer Finance | 58,628 | 59,387 | 59,442 | 4.01 | 3.90 | 3.97 | 105.3 | 109.5 | 109.3 | |||||||||||||||||||||||||||
Portugal | 26,810 | 28,188 | 30,607 | 8.12 | 6.56 | 4.06 | 50.0 | 53.1 | 54.9 | |||||||||||||||||||||||||||
Poland | 18,101 | 10,601 | 9,120 | 7.84 | 4.72 | 4.89 | 61.8 | 68.3 | 65 | |||||||||||||||||||||||||||
United Kingdom | 235,627 | 254,066 | 257,698 | 1.98 | 2.05 | 1.85 | 41.6 | 44.1 | 37.5 | |||||||||||||||||||||||||||
Latin America | 150,979 | 160,413 | 159,445 | 5.03 | 5.42 | 4.32 | 84.6 | 87.5 | 97.0 | |||||||||||||||||||||||||||
Brazil | 79,216 | 89,142 | 91,035 | 5.64 | 6.86 | 5.38 | 95.1 | 90.2 | 95.2 | |||||||||||||||||||||||||||
Mexico | 24,024 | 22,038 | 19,446 | 3.66 | 1.94 | 1.82 | 97.5 | 157.3 | 175.7 | |||||||||||||||||||||||||||
Chile | 31,645 | 32,697 | 28,462 | 5.91 | 5.17 | 3.85 | 51.1 | 57.7 | 73.4 | |||||||||||||||||||||||||||
Puerto Rico | 4,023 | 4,567 | 4,559 | 6.29 | 7.14 | 8.64 | 61.6 | 62.0 | 51.4 | |||||||||||||||||||||||||||
Argentina | 5,283 | 5,378 | 4,957 | 1.42 | 1.71 | 1.15 | 140.4 | 143.3 | 206.9 | |||||||||||||||||||||||||||
United States | 40,349 | 44,678 | 43,052 | 2.23 | 2.29 | 2.85 | 93.6 | 105.9 | 96.2 | |||||||||||||||||||||||||||
|
|
|
|
|
|
|
|
|
|
|
|
|
|
|
|
|
| |||||||||||||||||||
Total Group | 738,558 | 793,448 | 820,968 | 5.64 | 4.54 | 3.90 | 61.7 | 72.4 | 61.0 | |||||||||||||||||||||||||||
|
|
|
|
|
|
|
|
|
|
|
|
|
|
|
|
|
| |||||||||||||||||||
| (1) | Including gross loans and advances to customers, guarantees, documentary credits and the mark-to-market of customer derivatives (€5,505 million). |
At 2013 year-end credit risk exposure had fallen by 7%. This fall was experienced across the board, except for Brazil, Mexico, Chile and Poland, where growth was observed in this type2013 in local currency terms. These lending levels, together with non-performing loans of risk.
4.2 Main volume and performance€41,652 million, placed the Group’s non-performing loans ratio at 5.64% (up 110 basis points. from 2012).
The Group’s creditcoverage ratio stood at 62%. It is important to take into account that the ratio benefits from the relative proportion of the mortgage portfolios (especially in the U.K. and Spain), which require lower on-balance-sheet provisions since they are secured by collateral.
5.3 Detail of geographical areas with the highest concentrations
Following is a description of the portfolios in the geographical areas where the Group’s risk profileconcentration is characterized by diversified geographic distributionhighest:
5.3.1 U.K.
Credit risk exposure to U.K. customers amounted to €235,627 million at the end of December 2013, and predominantly retail banking activity.represented 31.9% of the Group total.
A. Global mapDue to its importance, not only to Santander UK, but also to Santander Group’s lending activity as a whole, the mortgage loan portfolio (which totaled €177,617 million at the end of credit risk, 2011December 2013) must be highlighted.
This portfolio is composed entirely of first-mortgage home purchase or refurbishment loans to new and existing customers, since transactions involving second or successive liens on mortgaged properties are no longer originated.
The table below sets outproperty on which the global credit risk exposuremortgage guarantee is constituted must be located in nominal amounts (exceptthe U.K., irrespective of where the funding is to be employed, except for derivatives and repos exposure which is expressedcertain one-off transactions. Loans may be granted for the purchase of residences abroad, but the mortgage guarantee must in equivalent credit) at December 31, 2011.all cases be constituted on a property located in the U.K..
The year 2011 was characterized by small growth of 0.8% inGeographically speaking, the credit risk exposure due, onis concentrated mainly in the one hand,South East of England, where house price indices reflect a more stable behavior, even in times of economic slowdown.
Properties are appraised independently prior to the deconsolidationapproval of Santander Consumer USA, which mainly reflects a dropeach new transaction, in accordance with the Group’s risk management principles.
For mortgage loans that have already been granted, the appraised value of the mortgaged property is updated quarterly by an independent agency using an automatic appraisal system in accordance with standard procedure in the effective credit amountmarket and in compliance with current legislation.
The non-performing loans ratio rose from 1.74% in 2012 to 1.88% at 2013 year-end.
This rise can be explained mainly by customerthe fall in loans and oncredits due to the other,application of the combinationstrict lending and pricing policies implemented in recent years. The effect of two factors:these measures has been to reduce exposure to certain of the worst performing subsegments, such as interest-only mortgages, to a greater extent than the new lending generated, resulting in a corresponding reduction in disbursements by customer (-0.2%),total stock.
There was a significant improvement in the performance of non-performing loans as a result of the lower volume of committed lines in an economicmore favorable macroeconomic environment of weaker demand for loans in the main units; and growth in the effective amount with credit institutions (13.6%).
Excluding the exchange rate impact during 2011 of the main currencies against the euro, and the change in the aforementioned consolidation method, the increase in re-performing loans due to the exposure would have been 2.8%.improved efficiency of the recovery teams. Thus, the amount of non-performing loans increased by 1.1% to €3,453 million, including foreclosed homes, compared with the 8.5% rise in 2012.
Spain was stillThe credit policies limit the main unit as regards exposuremaximum loan-to-value criteria to 90% for loans on which principal and interest are repaid and to 50% for loans on which interest is paid periodically and the principal is repaid on maturity.
Current credit risk althoughpolicies expressly prohibit loans considered to be high risk (subprime mortgages), and establish demanding requirements regarding the credit quality of both loans and customers. For example, the granting of mortgage loans with LTVs exceeding 100% has been forbidden since 2009. Between 2009 and 2012 less than 0.1% of new production had an LTV higher than 90%.
5.3.2 Spain
5.3.2.1 Portfolio overview
Total credit risk in Spain was 1.4% less than at the end of 2010. Of note in the rest of Europe, which accounts for more than one-third(including guarantees and documentary credits but excluding Spain’s run-off real estate unit) amounted to €189,783 million (26% of the credit exposure, is the presenceGroup total), with an adequate degree of diversification in the UK. Overall, Europe, including Spain, accounted for 71%terms of the total exposure.
In Latin America, which accounted for 22% of the exposure, 97% of the exposure to credit risk is classified as investment-grade.
The US accounted for 6.1% of the Group’s total credit exposure at the end of 2011.
234
Grupo Santander—Gross exposure to credit risk classified in accordance with legal company criteria
Million euros. Data at December 31, 2011.
| Outstanding to customers | Commitments to customers | Sovereign fixed income (excluding trading) | Private fixed income (excluding trading) | Outstanding to credit entitles | Commitments to credit entitles | Derivatives and Repos (REC) | Total | |||||||||||||||||||||||||
Spain | 252,165 | 55,526 | 32,318 | 8,040 | 33,092 | 3,465 | 36,535 | 421,142 | ||||||||||||||||||||||||
Parent bank | 151,644 | 42,075 | 21,025 | 5,356 | 25,094 | 3,236 | 30,232 | 278,663 | ||||||||||||||||||||||||
Banesto | 73,184 | 7,674 | 7,223 | 1,129 | 6,178 | 218 | 5,658 | 101,264 | ||||||||||||||||||||||||
Others | 27,337 | 5,777 | 4,070 | 1,555 | 1,820 | 10 | 646 | 41,215 | ||||||||||||||||||||||||
Rest of Europe | 341,350 | 50,232 | 6,292 | 4,664 | 33,374 | 0 | 11,840 | 447,754 | ||||||||||||||||||||||||
Germany | 30,413 | 536 | 0 | 93 | 2,492 | 0 | 8 | 33,541 | ||||||||||||||||||||||||
Portugal | 25,858 | 6,036 | 3,734 | 1,744 | 1,698 | 0 | 2,171 | 41,241 | ||||||||||||||||||||||||
UK | 248,425 | 39,500 | 0 | 2,679 | 27,757 | 0 | 8,961 | 327,321 | ||||||||||||||||||||||||
Others | 36,655 | 4,161 | 2,558 | 148 | 1,428 | 0 | 700 | 45,651 | ||||||||||||||||||||||||
Latin America | 148,579 | 56,992 | 20,079 | 5,879 | 30,849 | 0 | 9,919 | 272,297 | ||||||||||||||||||||||||
Brazil | 88,398 | 40,804 | 13,194 | 4,857 | 23,760 | 0 | 5,305 | 176,317 | ||||||||||||||||||||||||
Chile | 27,888 | 7,103 | 1,948 | 527 | 3,527 | 0 | 2,414 | 43,406 | ||||||||||||||||||||||||
Mexico | 18,101 | 7,501 | 3,376 | 324 | 1,600 | 0 | 1,874 | 32,777 | ||||||||||||||||||||||||
Others | 14,192 | 1,584 | 1,562 | 171 | 1,961 | 0 | 327 | 19,797 | ||||||||||||||||||||||||
United States | 43,107 | 15,271 | 1,437 | 10,577 | 2,766 | 0 | 559 | 73,717 | ||||||||||||||||||||||||
Rest of world | 774 | 72 | 2 | 1 | 115 | 0 | 0 | 964 | ||||||||||||||||||||||||
Total group | 785,975 | 178,094 | 60,129 | 29,160 | 100,196 | 3,465 | 58,854 | 1,215,874 | ||||||||||||||||||||||||
% of total | 64.6 | % | 14.6 | % | 4.9 | % | 2.4 | % | 8.2 | % | 0.3 | % | 4.8 | % | 100.0 | % | ||||||||||||||||
% change. s/Dec. 10 | -0.2 | % | -0.2 | % | -0.2 | % | -1.3 | % | 13.6 | % | 132.4 | % | -2.8 | % | 0.8 | % | ||||||||||||||||
ECR (equivalent credit risk: net value of replacement plus the maximum potential value. Includes mitigants)
Balances with customers include contingent risks and exclude repos (EUR 8,467 million) and other customer financial assets (EUR 20,137 million)
The total fixed income excludes the portfolio of trading and investments of third party takers of insurance.
Sovereign fixed income refers to securities issued by public administrations in general, including the state, regional and local administrations and institutions that operate with the guarantee of the state.
Balances with credit entities and central banks include contingent risks and exclude repos, the trading portfolio and other financial assets. Of the total, EUR 81,611 million are deposits in central banks.
B. Evolution of the magnitudes in 2011
The evolution of non-performing loans reflect the impact of the deterioration of the economic environment, while the reduction in the cost of credit during 2011 underscores the prudent and anticipative management of risk, enabling Santander, in general, to maintain both figures lower than those of its competitors. As a result, we maintain a significant level of coverage.
The NPL ratio was 3.89% at the end of 2011 (+34 basis points). Growth in this ratio slowed down in the last few quarters of 2011. NPLs declined in Santander Consumer Finance and Sovereign and rose in the countries most affected by the crisis (Spain and Portugal) and, to a lesser extent, in those with a better situation in the economic cycle, such as the UK. In the whole of Latin America, the rise in the NPL ratio went hand in hand with the growth in lending, with increases in Brazil mainly relating to loans to individuals (consumer loans and credit cards), and the incorporation in the second quarter of GE Capital Corporation’s mortgage portfolio in Mexico. NPL coverage was 61.4% compared to 72.7% at the end of 2010.
Specific provisions for loan losses, net of bad debt recoveries, amounted to €11,137 million, 1.41% of the average credit exposure with customers (the year’s average lending plus financial guarantees), down from 1.56% in 2010.
235
Grupo Santander—Risk, NPLs, coverage, provisions and cost of credit
Million euros
| Credit risk with customers(*) (million euros) | NPL ratio % | Coverage % | Spec, prov net of recovered write-offs(**) (million euros) | Credit cost of risk(3) % | ||||||||||||||||||||||||||||||||||||
| 2011 | 2010 | 2011 | 2010 | 2011 | 2010 | 2011 | 2010 | 2011(2) | 2010(1) | |||||||||||||||||||||||||||||||
Continental Europe | 364,622 | 370,673 | 5.20 | 4.34 | 55.5 | 71.4 | 4,569 | 6,190 | 1.10 | 1.62 | ||||||||||||||||||||||||||||||
Santander Branch Network | 118,060 | 126,705 | 8.47 | 5.52 | 39.9 | 51.8 | 1,735 | 2,454 | 1.42 | 1.89 | ||||||||||||||||||||||||||||||
Banesto | 78,860 | 86,213 | 5.01 | 4.11 | 53.1 | 54.4 | 778 | 1,272 | 0.96 | 1.52 | ||||||||||||||||||||||||||||||
Santander Consumer Finance | 63,093 | 67,820 | 3.77 | 4.95 | 113.0 | 128.4 | 1,503 | 1,884 | 1.43 | 2.85 | ||||||||||||||||||||||||||||||
Portugal | 30,607 | 32,265 | 4.06 | 2.90 | 54.9 | 60.0 | 283 | 105 | 0.90 | 0.30 | ||||||||||||||||||||||||||||||
United Kingdom | 255,735 | 244,707 | 1.86 | 1.76 | 38.1 | 45.8 | 779 | 826 | 0.32 | 0.34 | ||||||||||||||||||||||||||||||
Latin America | 159,445 | 149,333 | 4.32 | 4.11 | 97.0 | 103.6 | 5,379 | 4,758 | 3.57 | 3.53 | ||||||||||||||||||||||||||||||
Brazil | 91,035 | 84,440 | 5.38 | 4.91 | 95.2 | 100.5 | 4,554 | 3,703 | 5.28 | 4.93 | ||||||||||||||||||||||||||||||
Mexico | 19,446 | 16,432 | 1.82 | 1.84 | 175.7 | 214.9 | 293 | 469 | 1.63 | 3.12 | ||||||||||||||||||||||||||||||
Chile | 28,462 | 28,858 | 3.85 | 3.74 | 73.4 | 88.7 | 395 | 390 | 1.40 | 1.57 | ||||||||||||||||||||||||||||||
Puerto Rico | 4,559 | 4,360 | 8.64 | 10.59 | 51.4 | 57.5 | 95 | 143 | 2.25 | 3.22 | ||||||||||||||||||||||||||||||
Colombia | 2,568 | 2,275 | 1.01 | 1.56 | 299.1 | 199.6 | 14 | 15 | 0.59 | 0.68 | ||||||||||||||||||||||||||||||
Argentina | 4,957 | 4,097 | 1.15 | 1.69 | 206.9 | 149.1 | 29 | 26 | 0.67 | 0.72 | ||||||||||||||||||||||||||||||
Sovereign | 43,052 | 40,604 | 2.85 | 4.61 | 96.2 | 75.4 | 416 | 479 | 1.04 | 1.16 | ||||||||||||||||||||||||||||||
Total Group | 822,657 | 804,036 | 3.89 | 3.55 | 61.4 | 72.7 | 11,137 | 12,342 | 1.41 | 1.56 | ||||||||||||||||||||||||||||||
Memo item | ||||||||||||||||||||||||||||||||||||||||
Spain | 271,180 | 283,424 | 5.49 | 4.24 | 45.5 | 57.9 | 2,821 | 4,352 | 1.04 | 1.53 | ||||||||||||||||||||||||||||||
C. Distribution of credit risk
The charts below show the diversification of Santander’s loans by countriesproducts and customer segments. The Group is geographically diversified and focused on its main markets.
Grupo Santander’s profile is essentially retail (85.6% retail banking), and most portfolios are comprised by products with a real guarantee (e.g. mortgages).
236
| ||
The distribution by geographic area and product ofIn 2013 lending in the segment of standardized risks is set out below.
| ||
4.3 Metrics and measurement tools
A. Rating tools
We have been using since 1993 our own models for assigning solvency and internal ratings (known as internal ratings or scoring), which measure the degree of risk of a client or transaction. Each rating or scoring correspondslevels continued to a certain probability of default or non-payment, determined on the basis of the Bank’s past experience, except for some termed low default portfolios, where the probability is assigned using external sources. The Group has more than 200 internal rating models in the admission process and risk monitoring.
Global rating tools are used for the segments of sovereign risk, financial institutions and global wholesale banking. Their management is centralized in the Group, both to determine their rating and to monitor the risk. These tools assign a rating for each customer resulting from a quantitative or automatic module, based on balance sheet ratios or macroeconomic variables, and supplemented by the expert view of an analyst.
In the case of companies and institutions under individualized management, the parent company of Grupo Santander has defined a single methodology for formulating a rating in each country. The rating is determined by an automatic model which reflects a first intervention by the analyst and which can or not be later complemented. The automatic model determines the rating in two phases, one quantitative and the other qualitative based on a corrective questionnaire which enables the analyst to modify the automatic scoring by a maximum of ±2 points of rating. The quantitative rating is determined by analyzing the credit performance of a sample of customers and the correlation with their financial statements. The corrective questionnaire has 24 questions divided into six areas of assessment. The automatic rating (quantitative + corrective questionnaire) can be changed by an analyst by writing over it or by using a manual assessment model.
237
The ratings accorded to customers are regularly reviewed, incorporating new financial information available and the experience in the development of the banking relation. The regularity of the reviews increases in the case of clients who reach certain levels in the automatic warning systems and in those classified as special watch. The rating tools are also reviewed so that their accuracy can be fine-tuned.
In the case of standardized risks, both for companies as well as individuals, there are scoring tools which automatically assess the operations.
These admission systems are complemented by performance assessment models which enable the risk assumed to be better predicted. They are used for both preventative activities as well as sales and assigning limits
B. Parameters of credit risk
The assessment of a customer or operation, through ratings or scorings, constitutes a judgment of the credit quality, which is quantified via probability of default (PD in the terminology of Basel).
As well as the probability of default, quantifying credit risk requires other parameters to be estimated such as exposure at default (EaD) and the percentage of EaD that might not be recovered (loss given default or LGD). Other aspects are also included such as quantifying off-balance sheet exposures, which depend on the type of product, or analysis of expected recoveries, related to the guarantees existing and other features of the operation: type of product, maturity, etc.
These factors comprise the main credit risk parameters. Their combination enables the probable or expected loss (EL) to be calculated. This loss is considered as one more cost of the activity as it reflects the risk premium and should be incorporated into the price of transactions.
The following charts show the distribution of failed consumer loans and mortgages since 2001 for the Parent bank on the basis of the percentage recovered after discounting all the costs —including the financial —of the recovery process.
238
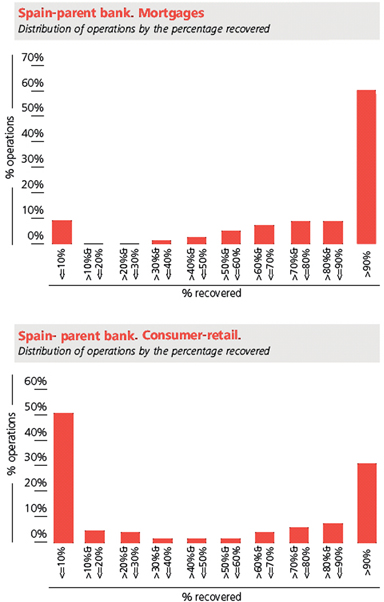
The risk parameters also calculate the regulatory capital in accordance with the rules derived from Circular 3/2008 of the Bank of Spain, as amended. The regulatory capital is the difference between the unexpected and the expected loss.
The unexpected loss is the basis for calculating the capital and makes reference to a very high level of loss, but not very probable, not considered recurrent and which must be met with equity.
In portfolios where the internal experience of defaults is scant, such as banks, sovereigns or global wholesale banking, estimates of the parameters come from alternative sources: market prices or studies by external agencies which draw on the shared experience of a sufficient number of institutions. These portfolios are called low default portfolios.
For the rest of portfolios, estimates are based on the institution’s internal experience. The PD is calculated by observing NPL entries and putting them in relation to the final rating assigned to the customer or with the scoring assigned to the operations.
239
The LGD calculation is based on observing the recovery process of transactions not fulfilled, taking into account not only the revenues and costs associated with this process, but also the moment when they are produced and the indirect costs incurred in recovery activity.
The estimation of the EaD comes from comparing the use of the lines committed at the moment of default and a normal situation.
The parameters estimated for global portfolios are the same for all the Group’s units. A financial institution with a rating of 8.5 will have the same PD regardless of the unit in which its exposure is recorded. On the other hand, retail portfolios have specific scoring systems in each unit of the Group. This requires separate estimates and specific assignment in each case.
The parameters are then assigned to the transactions present in the balance sheet of units in order to calculate the expected losses and the capital requirements associated with their exposure.
240
C. Master scale of global ratings
The following tables are used to calculate regulatory capital. They assign a PD on the basis of the internal rating, with a minimum value of 0.03%.
Probability of default
Wholesale Banking | Banks | |||||
Internal rating | PD | Internal rating | PD | |||
8.5 to 9.3 | 0.030% | 8.5 to 9.3 | 0.030% | |||
8.0 to 8.5 | 0.033% | 8.0 to 8.5 | 0.039% | |||
7.5 to 8.0 | 0.056% | 7.5 to 8.0 | 0.066% | |||
7.0 to 7.5 | 0.095% | 7.0 to 7.5 | 0.111% | |||
6.5 to 7.0 | 0.161% | 6.5 to 7.0 | 0.186% | |||
6.0 to 6.5 | 0.271% | 6.0 to 6.5 | 0.311% | |||
5.5 to 6.0 | 0.458% | 5.5 to 6.0 | 0.521% | |||
5.0 to 5.5 | 1.104% | 5.0 to 5.5 | 0.874% | |||
4.5 to 5.0 | 2.126% | 4.5 to 5.0 | 1.465% | |||
4.0 to 4.5 | 3.407% | 4.0 to 4.5 | 2.456% | |||
3.5 to 4.0 | 5.462% | 3.5 to 4.0 | 4.117% | |||
3.0 to 3.5 | 8.757% | 3.0 to 3.5 | 6.901% | |||
2.5 to 3.0 | 14.038% | 2.5 to 3.0 | 11.569% | |||
2.0 to 2.5 | 22.504% | 2.0 to 2.5 | 19.393% | |||
1.5 to 2.0 | 36.077% | 1.5 to 2.0 | 32.509% | |||
< 1.5 | 57.834% | < 1.5 | 54.496% | |||
These PDs are applied uniformly throughout the Group in accordance with the global management of these portfolios. As can be seen, the PD assigned to the internal rating is not exactly equal for a same rating in both portfolios, although it is very similar in the tranches where most of the exposure is concentrated (i.e. in tranches of rating of more than six).
D. Distribution of EaD and expected loss (EL) associated
The table below sets out the distribution by segments of the outstanding credit exposure to customers in terms of EaD, PD, LGD and EL. Approximately 78% of total risk with clients (excluding sovereign, counterparty risks and other assets) corresponds to companies, SMEs and loans to individuals, underlining the retail focus of business and of Santander’s risks. The expected loss from customer exposure is 1.30% (1.05% for the Group’s total credit exposure), which can be considered as a medium-to-low risk profile.
241
Segmentation of credit risk exposure
Million euros %
| EaD(1) | % | PD. Average | LGD Average | EL | ||||||||||||||||
Sovereign debt | 159,775 | 15.2 | % | 0.14 | % | 13.9 | % | 0.02 | % | |||||||||||
Counterparty | 51,574 | 4.9 | % | 0.27 | % | 59.6 | % | 0.16 | % | |||||||||||
Public sector | 14,654 | 1.4 | % | 1.44 | % | 14.8 | % | 0.21 | % | |||||||||||
Corporate | 155,702 | 14.8 | % | 0.94 | % | 39.9 | % | 0.37 | % | |||||||||||
SMEs | 163,005 | 15.5 | % | 5.44 | % | 30.5 | % | 1.66 | % | |||||||||||
Mortgages (individuals) | 330,435 | 31.5 | % | 3.10 | % | 8.9 | % | 0.28 | % | |||||||||||
Consumer loans | 124,913 | 11.9 | % | 7.94 | % | 55.1 | % | 4.38 | % | |||||||||||
Credit cards of individuals | 32,374 | 3.1 | % | 4.74 | % | 64.8 | % | 3.07 | % | |||||||||||
Other assets | 17,465 | 1.7 | % | 3.73 | % | 27.5 | % | 1.02 | % | |||||||||||
Memorandom item customers(2) | 821,083 | 78.2 | % | 3.93 | % | 33.1 | % | 1.30 | % | |||||||||||
|
|
|
|
|
|
|
|
|
| |||||||||||
Total | 1,049,897 | 100 | % | 3.17 | % | 33.0 | % | 1.05 | % | |||||||||||
|
|
|
|
|
|
|
|
|
| |||||||||||
Data at December 2011.
4.4. Loss observed: measurements of credit cost
As well as using these advanced models, other usual measures are employed which provide prudent and effective management of credit risk on the basis of the loss observed.
Our cost of credit is measured by various means: change in net entries (final doubtful loans –initial doubtful loans + write offs –recovered write offs), net loan-loss provisions (net specific provisions – recovered write-offs) and net write-offs (write offs – recovered write-offs).
The three approaches measure the same reality and, consequently, converge in the long term although they represent successive moments in credit cost measurement: flows of non-performing loans (non-performing loans management variation, NPLMV), coverage of doubtful loans (net loan-loss provisions, NLLPs) and becoming write offs (net write-offs), respectively. This without detriment, that in the long term and within the same economic cycle, the three approaches may show differences at certain times, particularly significant at the start of a change of cycle. These differences are due to the various moments at which the losses are calculated, which are basically determined by accounting rules. In addition, the analysis can be complicated by changes in the policy of coverage and entry into write offs, composition of the portfolio, doubtful loans of entities acquired, changes in accounting rules, sale of portfolios, etc.
242
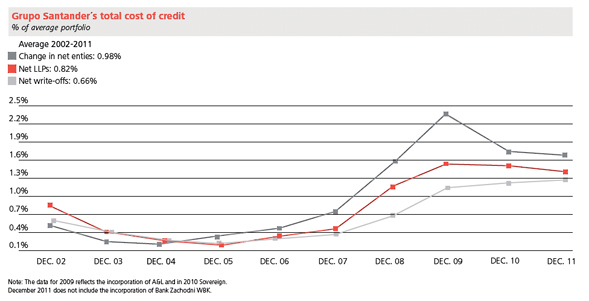
243
The following charts reflect the cost of Grupo Santander’s credit risk in its main areas of activity in 2011 and the comparison with prior years, measured in various ways:
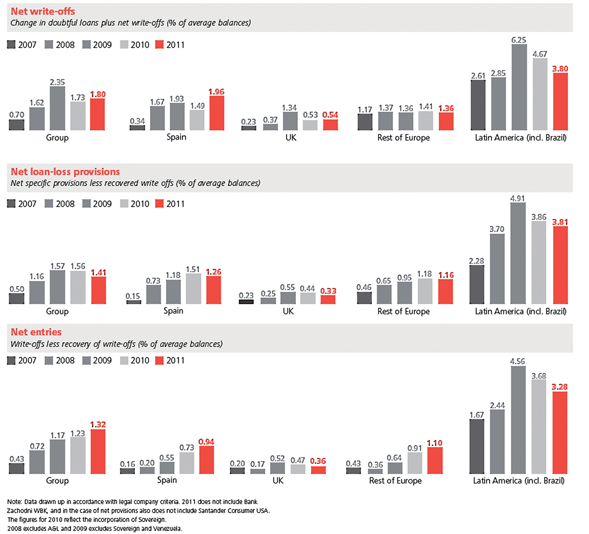
The general trend over the past few years has been to maintain the cost of Santander’s credit at low levels. In 2011, the decline of 15 basis points in the cost of credit (measured by net-loan loss provision) was due to the still significant deterioration of the economic environment and of the mix of retail portfolios which, although with a higher expected loss, have higher levels of direct and indirect profitability and a more predictable nature of risk.
4.5 Credit risk cycle
Risk management consists of identifying, measuring, analyzing, controlling, negotiating and deciding the risks incurred by the Group’s transactions. The process involves risk takers and senior management, as well as the risk areas.
The process emanates from senior management, via the board of directors and the risk committee; they set the risk policies and procedures, the limits and delegating of powers, and approve and supervise the framework of the risks function.
244
The risk cycle has three phases: pre-sale, sale and after sale:
• Pre-sale: this includes the planning and setting of objectives, determining the appetite for risk, approving new products, studying the risk and rating loans, and establishing limits.
• Sale: this covers the phase of decision-making both for transactions under pre-classification as well as one-off transactions.
• After sale: monitoring, measurement, control and recovery management.
A. Planning and setting limits
Setting limits is a dynamic process which identifies the Group’s risk appetite by discussing business proposals and the opinion of the risk division.
The global plan of limits, the document drawn up on the basis of consensus which provides complete management of the balance sheet and of the inherent risks, establishes the risk appetite in the various factors.
The limits are based on two structures: customers/segments and products.
The most basic level in individualized management is the customer and when certain features are present —generally of relative importance— an individual limit (pre-classification) is set.
A pre-classification model based on a system for measuring and monitoring economic capital is used for large corporate groups. A more simplified version is used for those companies who meet certain requirements (high knowledge, rating, etc.).
In the sphere of standardized risk, the planning and setting of limits is done through credit management programs (CMPs), a document prepared by consensus between the business and risk areas and approved by the risk committee or committees delegated by it. The CMPs set out the expected results of business in terms of risk and return, as well as the limits to which activity is subject and management of the associated risks.
B. Risk study and process of credit rating
The study of risk is obviously a prior requirement for authorizing customer transactions by the Group.
This study consists of analyzing the capacity of the customer to meet their contractual obligations with the Bank. This entails analyzing the customer’s credit quality, risk transactions, solvency and return in accordance with the risk assumed.
The risk study is carried out every time there is a new customer or transaction or with a pre-established regularity, depending on the segment. In addition, the rating is studied and reviewed every time there is an alert or something that affects the customer/operation.
C. Decisions on transactions
The purpose of the decision-making process is to analyze and resolve transactions, taking into consideration both the risk appetite as well as those elements of the transaction that are relevant in the search for the balance between risk and return.
The Group has been using RORAC methodology (return on risk adjusted capital) since 1993 to analyze and set prices for transactions and businesses.
D. Monitoring
As well as the tasks carried out by the internal auditing division, the directorate general of risks, through local and global teams, controls credit quality by monitoring the risks and has the resources and specific staff to do it.
245
The monitoring is based on a continuous process of permanent observation, which enables incidents to be detected in advance in the evolution of risk, transactions, customers, and their environment in order to take steps to mitigate them. The monitoring is conducted on the basis of customer segmentation.
The Group has a system called companies in special watch (FEVE) which identifies four levels on the basis of the degree of concern arising from the circumstances observed (extinguish, secure, reduce, monitor). The inclusion of a company in FEVE does not mean there have been defaults, but rather the advisability of adopting a specific policy toward that company and establishing the person and time frame for it. Clients in FEVE are reviewed at least every six months, and every quarter for the most serious cases. A company can end up in special watchfall as a result of monitoring, a review conducted by internal auditing, a decision of the person responsible for the company or the entry into functioning of the system established for automatic warnings.
Ratings of risk balances according to the FEVE monitoring system
Million euros at December 2011
| Extinguish | Secure | Reduce | Monitor | Total | ||||||||||||||||
Retail banking Spain | 4,760 | 485 | 11,250 | 12,649 | 29,143 | |||||||||||||||
Banesto | 7,467 | 151 | 2,018 | 11,154 | 20,790 | |||||||||||||||
Portugal | 394 | 247 | 987 | 2,221 | 3,848 | |||||||||||||||
Poland | 1,112 | N.A. | (*) | N.A. | (*) | 417 | 1,529 | |||||||||||||
United Kingdom | 235 | 60 | 844 | 1,923 | 3,062 | |||||||||||||||
Sovereign | 1,678 | 46 | 1,167 | 2,002 | 4,894 | |||||||||||||||
Latin America | 1,339 | 437 | 1,876 | 7,248 | 10,901 | |||||||||||||||
|
|
|
|
|
|
|
|
|
| |||||||||||
Total | 16,984 | 1,426 | 18,142 | 37,614 | 74,166 | |||||||||||||||
|
|
|
|
|
|
|
|
|
| |||||||||||
Note: 2011 shows the application of the FEVE tool in Poland. The classification of risk in FEVE is
independent in each institution and responds to the various criteria for classification of these risks and
management of them on the basis of the category in which they are classified.
Ratings are reviewed at least every year, but if weaknesses are detected, or on the basis of the rating, it is done more regularly.
As regards the risks of standardized clients, the main indicators are monitored in order to detect shiftsdecrease in the performance of the loan portfolio with respect to the forecasts made in thedemand for credit management programs.
Payment restructurings and agreements
Restructuring
The restructuring of debts is part of the continuous management of risks with customers although it is during periods of economic downturn when this practice assumes greatest importance. It arises when the customer is not in a condition to comply with the payment obligations contracted with the Bank and so the possibility of adjusting the debt to the customer’s new payment capacity and/or improve the guarantees is contemplated.
The use of debt restructuring by Grupo Santander’s banks makes it necessary to establish common practices, which enable these risks to be overseen. With this in mind, the corporate policy for restructuring the debts of customers was created, approved by the risk committee, which incorporates a series of definitions, general principles and policies that must be applied throughout the Group.
Within the activity of continuous monitoring, the risk departments and the business areaeconomic situation. The non-performing loans ratio stood at 7.49%. The coverage ratio stood at 44%.
5.3.2.2 Portfolio of recoveries, in coordination with the business areas, carry out centralized actionshome purchase loans to identify those customers who might need to restructure their debts. The payment capacity is the central factor of analysis, given that the purpose of restructuring is that the customer continues to pay back their loans. The factors taken into consideration are indicative of the changes in the economic situation and, thus, signify deterioration in the customer’s payment capacity.
246
The risk departments, in coordination with the business area of recoveries, are entrusted with approving the restructuring operation, modifying the terms of the loan and improving guarantees, if possible, as well as analyzing the risks assumed.
Grupo Santander restricts restructuring, with rigorous and selective criteria, to transactions:
• in which the original credit had not suffered a very severe deterioration;
• where the customer wishes to pay;
• that improve the Bank’s position in terms of expected loss; and
• where restructuring does not discourage additional efforts by the customer.
In standardized customers, the general principles stated below are applied rigorously, tending to exceptional circumstances when necessary. In the case of segmented customers, these principles can be used as an element of reference, but particularly important is individualized analysis of each case.
• The customer’s overall risk is assessed.
• The risk with the customer does not increase.
• All the refinancing alternatives are assessed and their impact, ensuring that their results would be better than those likely to be obtained if this process was not carried out.
• Particular attention is paid to guarantees and the possible future evolution of their value.
• Their use is restricted, rewarding the restructuring of risks with additional efforts by customers and avoiding actions that only postpone the problem.
• Monitoring of these operations is carried out in a special way, and maintained until the total extinction of the debt.
• For segmented customers, a very detailed analysis is carried out, case by case, where the expert opinion enables adjustment of the most appropriate conditions.
As well as close monitoring of these portfolios by the Group’s risk management teams, both the various supervisory authorities to which Grupo Santander is subject and the internal audit of the Group pay particular attention to control and appropriate assessment of the restructured portfolios.
Depending on the management situation in which transactions under restructuring are, we distinguish two types of transactions:
• Those for customers under normal classification (without non-performing loans) who, due to a change in their economic situation, could suffer an eventual deterioration in their payment capacity. This contingency can be resolved by adapting the debt conditions to the customer’s new capacity, thereby facilitating compliance with the payment obligation. These operations are not the subject of concern, but a one-off circumstance to tackle within the normal customer relationship. Moreover, as there was no need to anticipate possible losses, it is not necessary to make loan-loss provisions to cover these transactions. Once the conditions have changed, there is an increased probability that the customer will comply with the payment obligations.
• Loans classified as non-performing, due to delays in payment or other situations, are known as refinancing.
Refinancing does not signify release of provisions. The classification of the risk as non-performing is maintained unless:
• the criteria envisaged in the regulations based on Bank of Spain circulars (payment of ordinary interest pending and, in any case, contribution of new effective guarantees or a reasonable certainty of payment capacity) are met; and
247
• the conditions under the criteria of prudence in the Group’s corporate policy (sustained payment during a period of between 3 and 12 months, on the basis of the features of the operation and the type of guarantees existing) are met.
As for loan-loss provisions, the restructuring must not carry weight in assigning provisions for a particular transaction. Any irregular situation in the restructured transaction implies its classification as substandard and consequently entails an increase in provisions for the Group. In restructured transactions that return to a non-performing status, the applicable coverage percentage will be calculated on the basis of the date when the transaction first became non-performing.
The amount of the portfolio refinanced at the end of 2011 was barely 1% of the Group’s total lending and its structure was as follows:
Amount of the refinanced portfolio. Main countries
Million euros
| ||||
| ||||
| ||||
| ||||
| ||||
|
The structure by segments of the total refinanced portfolio at the end of 2011 was as follows:
Structure by segment of the total refinanced portfolio
Million euros
| ||||
| ||||
| ||||
|
Payment agreements
These criteria are mainly aimed at situations of low impact on the customer’s payment capacity. For situations of serious deterioration, restructuring the loan is not considered an option and agreements are sought with the customer to recover all or part of the loan, thereby minimizing losses. In these circumstances, one or several of the following conditions are present:
• There is not a reasonable certainty of payment; delays of 180 days or debts classified as bad.
• Contractual conditions were agreed that do not meet the general principles set out in the corporate policy of restructuring mentioned in the previous section: condonation of the principle and/of interest payments, a quota that does not cover the ordinary interest or there is an increase in the risk.
The logic of normalization of these transactions is based on using as a rule the experience with the customer, setting a graduation in the level of requirement of the observation periods considering both the customer’s initial situation before renegotiation, as well as the concessions made by the bank to reach the agreement. The greater the deterioration, the greater the degree of prudence, establishing a longer observation period. When estimating the length of a possible real recovery of the payment capacity a period of between 18 and 24 months is considered for an agreement without a haircut, and between 24 and 36 months for an agreement with a haircut.
248
Credit exposure in Spain
a. General view of the portfolio
At the end of 2011, Santander’s total credit exposure (including guarantees and documentary credits) in Spain amounted to €271,180 million, with an appropriate level of diversification, both by product as well as customer segment.
The credit risk of commercial networks of the main businesses in Spain (Santander Branch Network, Banesto, Banif and Santander Consumer) accounted for 23% of the Group’s total, distributed as follows:
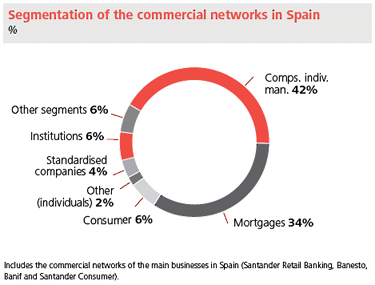
In accordance with Bank of Spain rules, we regard as doubtful loans those which have not been serviced for more than 90 days and include the total debt of the customer when the unpaid part represents more than 25% of the total or when pre-judicial actions are taken. Also considered as doubtful loans are those which, without entering into non-compliance, have reasonable doubts of being fully repaid. These criteria are not limited to just credit risk in Spain, but also to all units, where these are combined with the regulations that each local regulator has established.
The NPL ratio in Spain in 2011 was 5.49%, concentrated in those sectors which were most affected by the economic downturn. Although this figure is higher than in 2010 (4.24%), its increase was below the aggregate rise of banks in Spain (according to the regular information published by the Bank of Spain). This underscored the Group’s traditionally prudent risk management criteria as well as the fact that the NPL ratios of a large percentage of the credit portfolios in Spain registered lower growth during the year. Santander’s positive differential with the Spanish banking system widened in 2011 by 67 basis points
At December 31, 2011, total provisions for covering the possible loss of these risks represent coverage of 45.5%.
In line with the Bank of Spain’s rules and indications, loans classified as substandard are those which, while being up to date on payments and with no reason to be classified as doubtful, show some weakness which could lead to non- payments and losses, as they involve the weakest customers from certain collectives or sectors affected by extraordinary circumstances of greater risk.
249
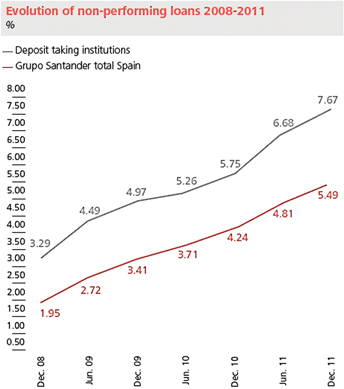
b. Analysis of the mortgage portfolio of individual customers
In line with the Bank of Spain’s guidelines for greater transparency in information for the market regarding property, the table below sets out theHome purchase loans granted to households to buy homes by the main businesses in Spain. This portfolio, one of the main onesfamilies in Spain stood at €59,453€55,158 million at the end of 2011 (22% of total credit risk in Spain).2013 year-end. Of this amount, 98% of the loans have mortgage guarantees.
Lending to households to acquire homes
Million euros
| Gross amount | Of which: doubtful | |||||||
Loans to acquire property | 59,453 | 1,607 | ||||||
Without mortgage guarantee | 918 | 28 | ||||||
With mortgage guarantee | 58,535 | 1,579 | ||||||
The mortgage guarantees of loans to households for the acquisition of property disclosed in the table above consist of the acquired property, to which the Group always has a first priority claim in the event of default. As of December 31, 2011, 97% of these mortgage loans financed the purchase of a primary residence.
The NPL ratio of the portfolio with mortgage guarantee, which reflects the evolution of the economic environment during 2011, was 2.7% at the end of the year, 50 basis points more than in 2010 and well below that of other businesses in Spain.
The portfolio of mortgages for property in Spain has features that maintained its medium-low risk profile and had limited expectations of further deterioration:
• All mortgages pay principal from the very first day of the transaction.
250
• The usual practice is to repay it ahead of time and so the average life of the transaction is well below that of the contract.
• The Bank has recourse to all of the borrower’s assets, not just the property.
• Most mortgages have variable interest rates with spreads over Euribor.
• High quality of collateral, almost entirely in mortgages for the first residence.
• 88% of the portfolio has a LTV of less than 80%, calculated as the total risk against the amount of the latest available valuation.
• The average affordability rate remained at close to 29%.
LTV ranges. Total
Million euros
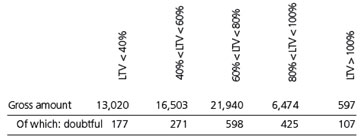
251
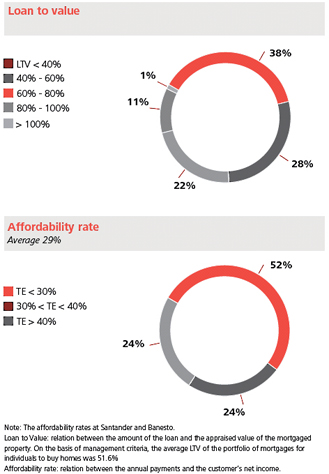
Unless otherwise stated, all LTV ratios disclosed in this report refer to LTV ratios upon origination. Nevertheless, for internal management purposes, we update LTV ratios for the Spanish portfolio at least once a year taking into consideration the housing price index publishedsecured by the corresponding government institution.
Additionally, if a debt is approaching a doubtful status, we update the appraisals which are then used to estimate allowances for loan losses.
The following table shows a detail of the loans granted to households for the acquisition of homes by the main businesses in Spain with the updated LTVs calculated for internal management purposes, taking into consideration published housing price indices.mortgages.
In millions of euros | 31-12-13 | |||||||
| Gross amount | Of which: Impaired | |||||||
Home purchase loans | 55,158 | 4,041 | ||||||
Without mortgage guarantee | 863 | 461 | ||||||
With mortgage guarantee | 54,295 | 3,580 | ||||||
The risk profile of the home purchase mortgage loan portfolio in Spain remained at a medium-low level, with limited prospects of additional impairment:
The following table sets forth the loan to value ratio of our home purchase loan portfolio with mortgage guarantee in Spain as of December 31, 2013, taking into account guarantee values at the time of origination:
| 12/31/13 | ||||||||||||||||||||||||
| Loan-to-value ratio | ||||||||||||||||||||||||
In millions of euros | Less than or equal to 40% | More than 40% and less than 60% | More than 60% and less than 80% | More than 80% and less than or equal to 100% | More than 100% | Total | ||||||||||||||||||
Initial gross amount | 12,703 | 16,642 | 18,185 | 5,683 | 1,083 | 54,295 | ||||||||||||||||||
Of which: Impaired | 277 | 641 | 1,353 | 951 | 358 | 3,580 | ||||||||||||||||||
For internal management purposes, the Group updates the LTV ratios at least once a year, taking into consideration published house price indices. Also, if a debtor becomes impaired the Group updates the appraisals undertaken by valuers, which are taken into account in the estimate of impairment losses.
5.3.2.3 Portfolio of loans to non-real estate companies
The €106,042 million of loans granted directly to SMEs and companies constitute the most important lending segment in Spain, representing 56% of the total.
Most of the portfolio relates to individualized customers to which a risk analyst has been assigned because of the risk assumed. The risk analyst monitors the customer on an ongoing basis in all the phases of the risk cycle.
The non-performing loans ratio of this portfolio was 8.72% in 2013, impacted by the continuity of the complicated economic environment and by the drop in lending.
5.3.2.4 Real estate loan portfolio
Gross real estate exposure in Spain amounted to €20,936 million at 2013 year-end, of which €12,105 million related to loans and €8,831 million to foreclosed properties. Of these amounts, €11,355 million of loans and €7,990 million of foreclosed properties are managed using a specialized management model in a separate unit called “Real estate operations discontinued in Spain” (Spain’s run-off real estate), which also manages investments in the real estate industry (Metrovacesa, S.A. and the Spanish Bank Restructuring Asset Management Company).
The policy of severely reducing the balances in this segment continued in 2013.
| Millions of euros | ||||||||||||
| 31-12-13 | 31-12-12 | 31-12-11 | ||||||||||
Balance at beginning of year | 15,867 | 23,442 | 27,334 | |||||||||
Foreclosed assets | (848 | ) | (930 | ) | (914 | ) | ||||||
Reductions(*) | (2,114 | ) | (5,670 | ) | (2,742 | ) | ||||||
Written-off assets | (800 | ) | (975 | ) | (236 | ) | ||||||
|
|
|
|
|
| |||||||
Balance at end of year (net) | 12,105 | 15,867 | 23,442 | |||||||||
|
|
|
|
|
| |||||||
| (*) | Includes sales of portfolios, cash recoveries and third-party subrogations |
Third party subrogation correspond to the replacement of the original borrower (real estate developer) with a private individual who acquires a share to the loan equivalent to the house acquired from the developer by such individual. These loans are included in the “House purchase loan portfolio”.
The NPL ratio of this portfolio ended the year at 61.7% (compared with 47.7% at December 2012) due to the increase in the proportion of impaired assets in the problem loan portfolio and, in particular, to the sharp reduction in lending in this segment. The table below shows the distribution of the portfolio. The coverage ratio of the real estate exposure in Spain stands at 41.1%.
Millions of euros | 12/31/13 | |||||||||||
| Gross amount | Excess over collateral value | Specific allowance | ||||||||||
Financing for construction and property development recorded by the Group’s credit institutions (business in Spain) | 12,105 | 5,173 | 4,981 | |||||||||
Of which: Impaired | 7,473 | 3,869 | 3,960 | |||||||||
Of which: Substandard | 2,972 | 1,011 | 1,021 | |||||||||
Memorandum item: Written-off assets | 1,642 | |||||||||||
| 12/31/ | |||||||||
| ||||||||||
Millions of euros | Carrying amount | |||||||||
Total loans and advances to customers excluding the public sector (businesses in Spain) | 160,478 | |||||||||
Total consolidated assets | 1,115,638 | |||||||||
Impairment losses and credit risk allowances. Collective coverage (business in Spain) | ||||||||||
| ||||||||||
At year-end,The Group calculates the recalibration of our internal models consideredloan loss allowance individually as the recent occurrence of significant valuation declines. Since this type of portfolio (home purchase loans to individuals) has a very low NPL ratio (2.7%) that is stable over time, anddifference between the average LTV ratios (51.6%) are low as a percentagecarrying amount of the debt and the recent decreases inpresent value of its estimated cash flows over the properties pledged as collateral for these transactions did not have an effect on the credit loss provisions recognized for these transactions.
252
Despite the economy’s situation and its gradual deterioration during the last three years, the measures taken in admission produced a good evolution of vintages. For new loans between 2008 and 2011 in the Santander network in Spain, the maturity of vintages is shown below.
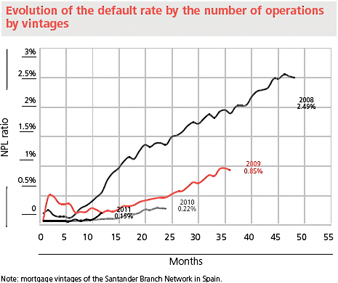
c. Financing provided for construction and real estate promotion with real estate purpose
Lending to these sectors, in line with the Bank of Spain’s guidelines regarding classification by purpose, amounted in Spain to €23,442 million, 25% lower than in 2009 and 14% below 2010 using like-for-like criteria. This represents a market share of around 10% on the basislife of the latest information published for June 2011, substantially lower than that ofagreement, including those from the Group’s total businesses in Spain. Including €8,552 million of foreclosed properties, the total amount is €31,994 million (4% of the Group’s total lending).guarantees, less costs to sell.
The reduction in risk was largely due to a strict policy in admitting new loans with the consequent amortization of the credit transactions of the portfolio outstanding and proactive management of existing risks.
The non-performing loan ratio ofAt year-end, this portfolio at the end of 2011 was 28.6%, underscoring the deterioration in this sector. Of the €10,638 million classified as doubtful and sub-standard 58% were up-to-date with payments. The coverage amounted to €3,151 million which represents a coverage ratio of 30%.
Financing for construction and real estate development:
doubtful and substandard loans
Million euros
| Risk | Coverage | |||||||||||
| Amount | Amount | % | ||||||||||
Doubtful loans | 6,722 | 2,211 | 33 | |||||||||
Substandard | 3,916 | 613 | 16 | |||||||||
Coverage with generic provisions | 327 | |||||||||||
|
|
|
|
|
| |||||||
Total | 10,638 | 3,151 | 30 | |||||||||
|
|
|
|
|
| |||||||
253
A large part of the exposure to the construction and real estate activity sectors are loans with mortgage guarantee (€18,705 million, 80% of the portfolio compared to 78% in 2010). Their distribution is shown below:
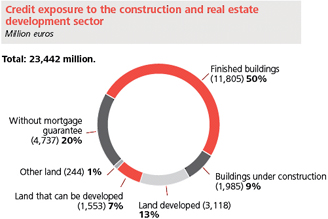
A particularly important product in the real estate promotion portfolio is mortgage loans to real estate developers. At the end of 2011, this amounted to €7,467 million and represented around 0.9% of Grupo Santander’s total credit portfolio. The reduction in the exposure to this product accelerated during 2011 (24% compared to 20% in 2010 and 9.3% in 2009).
At the end of 2011, this portfolio of loans had a low degree of concentration and an appropriateadequate level of guaranteescollateral and coverage.
The situation was as follows:allowances.
| Loans: Gross amount | Loans: Gross amount | |||||||
| 12/31/13 | 12/31/12 | |||||||
1. Without mortgage guarantee | 1,562 | 2,225 | ||||||
2. With mortgage guarantee | 10,543 | 13,642 | ||||||
2.1 Completed buildings | 5,600 | 7,025 | ||||||
2.1.1 Residential | 3,192 | 3,491 | ||||||
2.1.2 Other | 2,408 | 3,534 | ||||||
2.2 Buildings under construction | 685 | 1,493 | ||||||
2.2.1 Residential | 573 | 1,080 | ||||||
2.2.2 Other | 112 | 413 | ||||||
2.3 Land | 4,258 | 5,124 | ||||||
2.3.1 Developed land | 3,751 | 4,705 | ||||||
2.3.2 Other land | 507 | 419 | ||||||
|
|
|
| |||||
Total | 12,105 | 15,867 | ||||||
|
|
|
| |||||
Developments completed and with the final certificate of work: 79.2% of outstanding risk.
Developments more than 80% completed: 6.4% of outstanding risk.
Developments between 50% and 80% completed: 5.2% of outstanding risk.
Developments less than 50% completed: 9.2%.
Furthermore, close to 86% of this financing of real estate developments relates to assets that are totally completed or close to it, having overcome the risk of construction.
Policies and strategies establishedin place for the management of these risks
The policies in force for managingthe management of this portfolio, which are regularly reviewed and approved on a regular basis by the Group’s senior management, are currently focused ongeared towards reducing and securing the outstanding exposure, albeit without overlookingneglecting any viable new business identified as viable.that may be identified.
In order to manage this credit exposure, Grupo Santanderthe Group has specialized teams that not only fits withinform part of the risk areas but also complements itssupplement the management of this exposure and coverscover the wholeentire life cycle of these operations: theirtransactions: commercial management, juridical treatment, eventuality oflegal processes, court procedures and potential recovery management, etc.management.
As has already been discussed above, anticipativein this section, the Group’s anticipatory management of these risks enabled the Groupit to significantly reduce its exposure, significantly (45% in mortgage loans for promoters between 2008 and 2011) and attainit has a granular, geographically diversified portfolio and diversified by territories wherein which the volumefinancing of loanssecond residences accounts for second homes isa very low.
Mortgages for land not developed account for only 6%small proportion of the total.
Mortgage lending on non-urban land represents a low percentage of mortgage exposure withto land, while the restremainder relates to land already classified as developed landurban or land thatdevelopable, which can therefore be developed.
In the case of loans for homes not yethome financing projects in which the construction work has already been completed, the significant reduction in the exposure of 24% in 2011 was due tois supported by various actions. As well as the specialized marketing channels already existing specialized channels,in existence, campaigns were conducted supported bycarried out with the support of specific teams of specific managers for this function which,who, in the case of the Santander Branch Network, were directly supervised by the recoveries business area of recoveries. Directarea. These campaigns, which involved the direct management of themthe projects with property developers and buyers applying criteria ofpurchasers, reducing sale price reductionsprices and adapting to the financinglending conditions to the buyers’ needs, of buyers, enabled subrogations ofloans already existing loans.in force to be subrogated. These subrogations enable the Group to diversify its risk in a business segment that hasdisplays a clearly lower NPLnon-performing loans ratio.
254
The admissionloan approval processes are managed by specializedspecialist teams who coordinate directlywhich, working in direct coordination with commercialthe sales teams, and have wella set of clearly defined policies and criteria:
DevelopersProperty developers with an amplea strong solvency profile and witha proven experiencetrack record in the market.
Strict criteria regarding the specific parameters of parameters inherent in transactions. Exclusivethe transactions: exclusive financing for the construction cost, of building, high percentages of accredited sales, accredited,principal residence financing, etc.
Support for the financing of socialgovernment-subsidized housing, with accredited percentages of sale.
Restricted financing of land reducedpurchases, subject to the re-establishmentrestoration of the appropriatea sufficient level of coverage in already existing financingsfinancing arrangements or an increase into the guarantees.
As well asIn addition to the permanent control performed by its risk monitoring teams, of monitoring the Group’s risks, there isGroup has a specialist technical team specialized in monitoringunit that monitors and controllingcontrols this portfolio in relationwith regard to the stage of completion of construction work, planning compliance and sales control, and validates and controls progress in building, compliance with plans and controlbilling payments. The Group has created a set of sales, as well as with the validation and control of disbursements through certifications. Santander has specific tools created for this purpose.function. All the mortgage distributions, disbursements foramounts drawn down of any type of concept,kind, changes made to the grace periods, etc., are authorized on a centralized basis.
In the case of construction-phase projects under construction with somethat are experiencing difficulties of any kind, of problem, the criterion to be followedpolicy adopted is to guaranteeensure completion in orderof the construction work so as to haveobtain completed buildings that can be sold. Insold in the market. To achieve this aim, the projects are analyzed on a case-by-case basis in order to achieve this, each project is analyzed individually so thatadopt the most effective series of measures can be adopted for each case (payment structures(structured payments to suppliers that guaranteeto ensure completion of the work, settingspecific schedules of specific disbursements,for drawing down amounts, etc.).
In those casesThe management of on-balance-sheet property assets is performed by companies that require as a resultspecialize in the sale of the analysis some kind of restructuring of the exposure, the restructuring is carried out jointly between risks and the business area of recoveries, anticipating non-payment situations, with criteria centered on providing the projects with a payments structure that produces a good result. These authorizations are conducted on a centralized basis and by expert teams ensuring strict criteria are applied in line with the Group’s principles of prudential risk management. Recognition of the possible losses materializes when they are identified, classifying the positions without waiting for non-payment in accordance with the rules set by the Bank of Spain, with the corresponding provision giving coverage to the expected loss in these positions.
Companies specialized in selling propertiesproperty (Altamira Santander Real Estate, S.A.) and Promodomus) manage real estate assets, backed upis supplemented by the commercial network structure. SalesThe sale prices are madereduced in line with price reduction levels reflectingmarket conditions.
Foreclosed properties
As a last resort, the market’s situationacquisition and with the levelsforeclosure of provisions of this portfolio.
d. Real estate foreclosed
In the last instance,property assets is one of the mechanisms usedadopted in Spain in order to manage risk efficiently is the purchase and foreclosure of real estate assets. Theportfolio efficiently. At December 31, 2013, the net balance of these assets at the end of 2011 was €4,274amounted to €4,146 million the result of a gross amount of €8,552 million and provisions of €4,278 million.
In the last few years, the Group regarded acquisition/foreclosure as an efficient tool for resolving unpaid loans as against going through systems of legal processes. The faster pace of sales (+12%) than entries (+8%) in 2011 as compared to 2010 has led to negative net entries in the fourth quarter of 2011. This trend is expected to continue in the coming years.
As of December 31, 2011, the average length of time that our foreclosed properties remain in inventory prior to sale is approximately 27 months.
Analysis of the mortgage portfolio in the UK
The UK mortgage portfolio, the same as the risk portfolio in Spain, is of great importance in Grupo Santander’s total lending. This portfolio is also subject to standardized risk analysis.(gross amount: €8,831 million; recognized allowance: €4,685 million).
255
This portfolio consists of first home mortgages distributed in the UK territory, as there are no transactions that entail second or successive charges on mortgaged properties.
Most of the mortgages are in Greater London, where housing prices are more stable including during the recent economic slowdown.
All the properties are assessed by authorized surveyors before each transaction is approved, in accordance with the principles established by the Group for risk management and in line with the methodology defined by the Royal Institution of Chartered Surveyors.
The portfolio performed favorably during 2011. Its NPL ratio was 1.46% (1.41% in 2010), the result of both the constant monitoring and control as well as the strict credit policies which include, among other measures, maximum loan-to-value criteria in relation to properties in guarantee. On the basis of these policies, since 2009 no mortgages have been granted with LTVs of more than 100%. The average LTV was 53% at December 31, 2011.
There is no risk appetite for loans considered as high risk (subprime mortgages). The credit risk policies explicitly forbid this type of loan, establishing tough requirements for credit quality regarding, both the transactions as well as customers. Buy-to-let mortgages with a higher risk profile account for a small percentage of the total volume of the portfolio (barely 1%).
The following charts give the structure in LTV terms and the distribution in terms of the affordability rate at December 31, 2011:
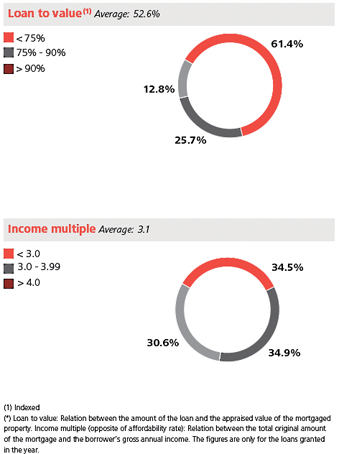
256
The following table shows the distributiondetail of the assets acquired and foreclosed by type of loan:
Portfolio of residential mortgages
Million eurosthe businesses in Spain at 2013 and 2012 year-end:
| December 2011 | ||||||||
| Portfolio | % of total UK portfolio | |||||||
Residential mortgages | 198,789 | 82.1 | ||||||
First Time Buyer | 33,010 | 13.6 | ||||||
Mover | 71,295 | 29.4 | ||||||
Remortgage | 94,484 | 39.0 | ||||||
Millions of euros | 12/31/13 | 12/31/12 | ||||||||||||||
| Carrying amount | Of which: Allowance | Carrying amount | Of which: Allowance | |||||||||||||
Property assets arising from financing provided to construction and property development companies | 3,397 | 4,151 | 2,906 | 3,650 | ||||||||||||
Of which: | ||||||||||||||||
Completed buildings | 1,059 | 727 | 793 | 498 | ||||||||||||
Residential | 492 | 338 | 393 | 236 | ||||||||||||
Other | 567 | 389 | 400 | 262 | ||||||||||||
Buildings under construction | 366 | 369 | 283 | 281 | ||||||||||||
Residential | 366 | 368 | 274 | 273 | ||||||||||||
Other | — | 1 | 9 | 8 | ||||||||||||
Land | 1,972 | 3,055 | 1,830 | 2,871 | ||||||||||||
Developed land | 926 | 1,390 | 1,302 | 2,024 | ||||||||||||
Other land | 1,046 | 1,665 | 528 | 847 | ||||||||||||
Property assets from home purchase mortgage loans to households | 747 | 530 | 707 | 454 | ||||||||||||
Other foreclosed property assets | 2 | 4 | 61 | 60 | ||||||||||||
|
|
|
|
|
|
|
| |||||||||
Total property assets | 4,146 | 4,685 | 3,674 | 4,164 | ||||||||||||
|
|
|
|
|
|
|
| |||||||||
Equity instruments, ownership interests and financing provided to non-consolidated companies holding these assets | 647 | 751 | 649 | 749 | ||||||||||||
|
|
|
|
|
|
|
| |||||||||
Total | 4,793 | 5,436 | 4,323 | 4,913 | ||||||||||||
|
|
|
|
|
|
|
| |||||||||
First time buyer, customers who buyIn recent years, the Group has considered asset acquisition/foreclosure to be a homemore efficient method for resolving cases of default than legal proceedings. The Group initially recognizes foreclosed assets at the lower of the carrying amount of the debt (net of provisions) and the fair value of the acquired/foreclosed asset (less estimated costs to sell). If fair value (less costs to sell) is lower than the net value of the debt, the difference is recognized under Impairment losses on financial assets (net) - Loans and receivables in the consolidated income statement for the first time.
Mover: customers who change home with or without changingyear. Subsequent to initial recognition, the bank that granted the mortgage.
Remortgage: customers who transfer their mortgage from another bank.
An additional indicator of the portfolio’s good performance is the small volume of foreclosed homes (€160 millionassets are measured at the endlower of 2011, only 0.07% of the total mortgage exposure). Efficient management of these casesfair value (less costs to sell) and the existenceamount initially recognized. The fair value of a dynamic market for this type of property which enables sales to take place in a short period contributed toassets is determined by the good results.
E. Control functionGroup’s directors based on evidence obtained from qualified valuers or evidence of recent transactions.
The management process is also aided during the various phaseschanges in foreclosed assets were as follows:
| Thousands of millions of euros | ||||||||
| 2013 | 2012 | |||||||
Gross additions | 1.9 | 2.1 | ||||||
Disposals | 0.9 | 2.8 | ||||||
Difference | 1.0 | (0.7 | ) | |||||
5.3.3 Brazil
The loan portfolio in Brazil amounted to €79,216 million (11% of the risk cycleGroup total), and had an adequate degree of diversification and a predominantly retail profile. 55% of loans are loans to individuals, consumer loans and loans to SMEs.
In 2013 the portfolio grew by 7.1% (excluding changes in exchange rates) as compared with 11% in 2012. This growth is in line with the function of control. This provides a global visionnominal growth of the Group’s portfolioBrazilian economy and the average performance of loans with the sufficient level of detail, enabling the current risk position and its evolution to be assessed.private banks in Brazil.
The objective ofNPL ratio was 5.64% at 2013 year-end, compared with 6.86% in 2012, reflecting the control model is to assessimprovement in the risk of solvency assumed in order to detect focuses of attention and propose measures that tend to correct eventual deterioration. It is therefore vital that the control activity includes an analysis component that facilitates early detection of problems and the subsequent recommendation of action plans.
The evolution of risk with regard to budgets, limits and standards of reference is constantly and systematically controlled and the impact in future situations evaluated, both exogenous as well as those arising from strategic decisions, in order to establish measures that put the profile and volumecredit quality of the portfolio, of risks within the parameters set by the Group.especially loans to individuals.
The control function is conducted by assessing risksnon-performing loans coverage ratio stands at 95% (2012 year-end: 90%).
5.4. Credit risk from various perspectives and establishing asother standpoints
5.4.1 Credit risk from financial market operations
This concept includes the main elements control by countries, business areas, management models, products and processes. This facilitates the detection of focuses of specific attention for decision-making.
The control processes, which ensure compliance with the Group’s corporate criteria in credit risk management, were strengthenedarising in 2011. Meanwhile, the homogeneous nature of the control model enabled standards in the flow of information to be established, their analysis by portfolios and monitoring of the main management metrics, in an exercise of coordination between the global area and thetreasury operations with customers, mainly credit institutions. These operations are performed using both money market financing products arranged with various units in which programs were created with specific targets that enable the situation of each of the units to converge with the global model.
In 2006, under the corporate framework established in the Group for complying with the Sarbanes-Oxley Act, a tool was created in the Group’s intranet to document and certify all sub processes, operational risks and controls that mitigate them. The risk division, as part of the Group, evaluates every year the efficiency of internal control of its activities.
Analysis of scenarios
As part of its management of monitoring and continuous control, the Group conducts simulations of its portfolio using adverse scenarios and stress tests in order to assess the Group’s solvency in the face of certain situations in the future. These simulations cover all the Group’s most relevant portfolios and are done systematically using a corporate methodology which:
257
Determines the sensitivity of risk factors (PD, LGD) to certain macroeconomic variables.
Defines reference scenarios (at the global level as well as for each of the Group’s units).
Identifies rupture scenarios (levels as of which the sensitivity of risk factors to macroeconomic variables is more accentuated) and the distance of these scenarios from the current situation and the reference scenarios.
Estimates the expected loss of each scenario and the evolution of the risk profile of each portfolio in the face of movements in certain macroeconomic variables.
The simulation models use the data of a complete economic cycle to measure the performance of risk factors in the face of changes in macroeconomic variables.
The scenarios take into account the vision of each unit as well as the global vision. The macroeconomic variables include:
The unemployment rate
Property prices
GDP
Interest rates
Inflation
The analysis of scenarios enables senior management to better understand the foreseeable evolution of the portfolio in the face of market conditions and changing situations, and it is a key tool for assessing the sufficiency of the provisions established for stress scenarios.
The analysis of the baseline and acid scenarios for the whole Group and for each unit, with a time frame of three years, shows the strength of the balance sheet to different market and macroeconomic situations.
EU Stress test exercises
In order to assess the solvency and resistance of banks to an adverse scenario, the European Banking Authority (EBA), in cooperation with the Bank of Spain, the European Central Bank, the European Commission and the European Systemic Risk Board, conducted in 2011 a stress test on 91 banks representing 65% of the total assets of the European banking system.
Stress test results. Grupo Santander
| Baseline scenario | Adverse scenario | |||||||||||||||
| Sufficiency of capital (million euros) | 2011 | 2012 | 2011 | 2012 | ||||||||||||
Risk weighted asset (constant balance sheet assumption) | 613,279 | 622,571 | 626,921 | 650,979 | ||||||||||||
Common equity according to EBA definition Of which ordinary shares subscribed by the government |
| 47,002 0 |
| | 59,374 0 | | | 45,053 0 | |
| 54,364 0 |
| ||||
Other existing subscribed government capital (before December 31, 2010) | 0 | 0 | 0 | 0 | ||||||||||||
Core Tier 1 capital (constant balance sheet assumption) | 47,002 | 59,374 | 45,053 | 54,364 | ||||||||||||
Tier 1 ratio (%) | 7.7 | % | 9.5 | % | 7.2 | % | 8.4 | % | ||||||||
Results (million euros) | ||||||||||||||||
Net interest income | 27,918 | 29,005 | 27,919 | 27,168 | ||||||||||||
Trading income | 895 | 895 | 352 | 352 | ||||||||||||
Other operating income | 1,530 | 1,128 | 2,323 | 2,355 | ||||||||||||
Operating profit before impairments | 21,954 | 22,639 | 22,207 | 21,487 | ||||||||||||
Operating profit after impairments and other losses from the stress test | 11,1 92 | 14,2 80 | 7,205 | 6,716 | ||||||||||||
Other income | -1,838 | -1,797 | -2,114 | -1,708 | ||||||||||||
Net profit after tax | 7,246 | 9,545 | 4,088 | 4,004 | ||||||||||||
Source: European Banking Autority (EBA)
The EBA’s stress test analyzed the level of capital that banks would reach in 2012 and their evolution since the end of 2010 (the starting point) in two scenarios: a benchmark scenario and an adverse one. The exercise assumed that the balance sheet remained unchanged from its starting position, the business model remained constant by countries and product strategies, and there are no acquisitions or disposals. It therefore does not reflect the estimate that the Bank’s management could have of the development of the Group’s results over the next two years. The banks submitted to the test had to have, initially, a Tier 1 core ratio of at least 5% in the most adverse scenario.
258
In the case of Santander, the stress tests showed the strength and validity of its business model. The results published on July 15, 2011 showed that even in the most adverse scenario, the Group is able to generate profits, distribute dividends and continue to generate capital. Santander would end 2012 with a Tier 1 capital of 8.4% in the most adverse scenario and 8.9% including generic provisions.
These results compared well with those of our competitors. Santander would be the bank that would post the most profits in the most adverse scenario (€8,092 million in 2011 and 2012).
F. Recovery activity
Recovery management is a strategic element in the Bank’s risk management.
In order to carry out this function, which is essentially a business activity, the Bank has a corporate model of management which sets the guidelines and general rules to be applied in the countries where it operates, with the necessary adjustments on the basis of local business models and the economic situation of the respective environments.
This corporate model basically establishes procedures and management circuits on the basis of customers’ features, making a distinction between massive level management with the use of multiple channels and a more personalized or segmented management with specific managers assigned.
As a result, with this segmentation in management, various mechanisms were established to ensure recovery management of customers in non-payment situations from the earliest phases to the writing off of the debt. The sphere of action of the recovery function begins the very first day of non-payment of the loan and ends when it has been paid or reclassified. Preventative management is conducted in some segments before a non-payment situation arises.
Recovery activity, understood as an integral business, is supported by constant reviewing of the management processes and methodology. It is backed by the Group’s capacity and with the participation and cooperation of other areas (commercial, resources, technology and human resources) as well as the development of technology solutions to improve effectiveness and efficiency.
In recoveries we have a practical and hands on training plan which deepens knowledge, facilitates the exchange of ideas and best practices and professionally develops teams, while always striving to integrate recovery activity into the Group’s ordinary and commercial activity.
During 2011, the indicators for management of loan recoveries underscored the difficult economic situation of some countries where the Group operates, with a change in net entries that was higher than in 2010, mainly due to the local economic conditions and, consequently, greater difficulty in obtaining recovery results in these units. The management capacity has been strenghtened and new strategies implemented to increase the recovery of non-performing loans.
Nevertheless, the results for the recovery of written-off assets were good. Action plans were put in place designed to improve this line of activity, with proactive strategies defined at the level of each customer and type of portfolio. This made possible a greater degree of recovery in this line of activity than in previous years, and in relation to the evolution in the declaration of write offs.
As a way of early recognition and rigorous management of troubled loans in the portfolio, we take into consideration portfolio sales as a possible alternative solution to be assessed. This activity, via a process of evaluation and commercialization, enables the recovery results to be accelerated.
In addition, portfolio sales provide the following advantages:
Avoid possible future deteriorations from changes in the macroeconomic environment.
Avoid costs with low return.
259
Reduce or adjust structures.
Improve liquidity for other businesses.
Ensure revenue recurrence in case of sales flows.
The Bank has specialized teams in this activity. They are responsible for relations with investors, identification of the portfolio, valuation (and subsequent back testing), management of the back office, as well as evaluating the legal and fiscal contingencies. In 2011, the creation of units specialized in this management was strengthened in the Group, particularly in Spain.
4.6 Other standpoints of credit risk
There are spheres and/or specific points in credit risk that deserve specialized attention and which complement global management.
A. Risk of concentration
Control of risk concentration is a vital part of management. The Group continuously tracks the degree of concentration of its credit risk portfolios using various criteria: geographic areas and countries, economic sectors, products and groups of clients.
The board’s risk committee establishes the policies and reviews the appropriate exposure limits for appropriate management of the degree of concentration of credit risk portfolios.
The Group is subject to the Bank of Spain regulation on large risks. In accordance with Circular 3/2008 (on determining and control of minimum equity), as amended, and subsequent amendments, the value of all the risks that a credit institution contracts with the same person, entity or economic group, including that portion which is non-consolidatable, cannot exceed 25% of its equity. The risks maintained with the same person, whether an individual or a company or an economic group, are considered large risks when their values exceeds 10% of the equity of the credit institution. The exceptions from this treatment are exposures to OECD governments and central banks.
At December 31, 2011, there were several financial groups that exceeded 10% of shareholders’ funds: three EU financial institutions two US financial entities and an EU central counterparty entity. After applying risk mitigation techniques and the rules for large risks, all of them were below 3.5% of eligible equity.
At December 31, 2011, the 20 largest economic and financial groups, excluding AAA governments and sovereign securities denominated in local currency, represented 5.0% of the outstanding credit risk of the Group’s clients (lending plus guarantees), which compares favorably with the 6% in 2010.
The distribution of the portfolio of companies by sectors is adequately diversified. The chart below shows the distribution of the credit exposure in the Group’s main units.
260
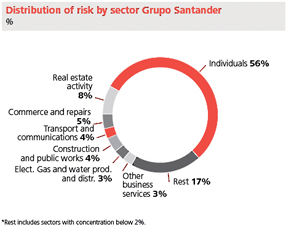
The Group’s risk division works closely with the financial division to actively manage credit portfolios. Its activities include reducing the concentration of exposures through various techniques such as using credit derivatives and securitization to optimize the risk-return relation of the whole portfolio.
B. Credit risk by activities in financial markets
This section covers credit risk generated in treasury activities with clients, mainly with credit institutions. This is developed through financingderivative products in the money market with different financial institutions, as well as derivativesintended to provide service to the Group’s clients.customers.
Risk is controlled through an integrated system and in real time which enables us to know at any moment theThe exposure limit available with any counterparty, in any product and maturity and in all of the Group’s units.
Risk is measured by its prevailing market as well as potential value (value of risk positions taking into account the future variation of underlying market factors in contracts). The equivalent credit risk (ECR) is the net replacement value plus the maximum potentialusing an MtM methodology (replacement value of these contracts in the future. Thederivatives or amount drawn down of committed facilities) plus potential future exposure (add-on). Calculations are also performed of capital at risk or unexpected loss is also calculated (i.e. the loss which, once the expected loss is subtracted, constitutes the economic capital, net of guarantees and recovery)recoveries).
When the markets close, the exposures are recalculated by adjusting all the transactions to their new time horizon, the potential future exposure is adjusted and mitigation measures are applied (netting arrangements, collateral arrangements, etc.) so that the exposures can be controlled daily against the limits approved by senior management. Risk control is performed using an integrated, real-time system that enables the Group to know at any time the unused exposure limit with respect to any counterparty, any product and maturity and at any Group unit.
5.4.2 Concentration risk
Concentration risk control is key to the risk management process. The Group continuously monitors the degree of credit risk concentration, by country, sector and customer group.
The risk committee establishes the risk policies and reviews the exposure limits required to ensure adequate management of credit risk concentration.
The Group is subject to Bank of Spain regulations on large exposures. Pursuant to the rules contained in Bank of Spain Circular 3/2008 (on the calculation and control of minimum capital requirements) and subsequent amendments thereto, the value of a credit institution’s total exposure to a single individual, entity or economic group, including the non-consolidated portion of its own economic group, may not exceed 25% of its capital. Exposures to a single individual, legal entity or economic group are deemed to be large exposures when their value exceeds 10% of the credit institution’s capital. Exposures to governments and central banks belonging to the OECD are excluded from this treatment.
At December 31, 2013, there were certain economic groups with respect to which the Group’s exposure initially exceeded 10% of capital: seven financial institutions, one central government and one central counterparty in the EU. After applying risk mitigation techniques and the regulations applicable to large exposures, all of these exposures fell below 4% of eligible capital.
At December 31, 2013, the Group’s credit exposure to the top 20 borrower economic and financial groups, excluding AAA-rated governments and sovereign bonds denominated in local currency, accounted for 4.7% of the credit risk from activitiesexposure to customers (lending plus off-balance-sheet exposures), slightly less than in 2012.
The Group does not have any exposures to central counterparties that exceed 5% of capital. The top 10 International Financial Institutions account for €14,769 million.
Santander Group’s risk division works closely with the financial accounting and control division in the financial markets was 59.6% withactive management of credit institutions. By product type,portfolios, which includes reducing the exposureconcentration of exposures through several techniques, such as the arrangement of credit derivatives for hedging purposes or the performance of securitization transactions, in order to derivatives was 59.4%, mainly products without options,optimize the risk/return ratio of the total portfolio.
The detail, by activity and 40.6% to liquidity products and traditional financing.
Derivative transactions are concentrated in high credit quality counterparties; 56.6%geographical area of risk with counterparties has a rating equal to or more than A. The total exposure in 2011 in termsthe counterparty, of equivalent creditthe concentration of the Group’s risk amounted to €53,358 million.
261
OTC derivatives: distribution by equivalent credit risk and market value including mitigation impact
Million euros at December 31, 20112013 is as follows:
| Total ECR | Total market value including mitigation impact(*) | |||||||||||||||||||||||
| Trading | Hedging | Total | Trading | Hedging | Total | |||||||||||||||||||
CDS Protection Acquired | 397 | 117 | 515 | 1,627 | 79 | 1,706 | ||||||||||||||||||
CDS Protection Sold | 34 | 0 | 34 | -1,735 | -68 | -1,803 | ||||||||||||||||||
TRS Total Return Swap | 0 | 0 | 0 | 0 | 0 | 0 | ||||||||||||||||||
CDS Options | 0 | 0 | 0 | 0 | 0 | 0 | ||||||||||||||||||
Total credit derivatives | 431 | 118 | 549 | -107 | 10 | -97 | ||||||||||||||||||
|
|
|
|
|
|
|
|
|
|
|
| |||||||||||||
Equity Forwards | 1 | 118 | 119 | 0 | -8 | -8 | ||||||||||||||||||
Equity Options | 512 | 778 | 1,290 | -107 | -245 | -352 | ||||||||||||||||||
Equity Swaps | 0 | 643 | 643 | 0 | 340 | 340 | ||||||||||||||||||
Equity Spot | 0 | 0 | 0 | 0 | 0 | 0 | ||||||||||||||||||
Total equity derivatives | 513 | 1,539 | 2,052 | -107 | 88 | -19 | ||||||||||||||||||
|
|
|
|
|
|
|
|
|
|
|
| |||||||||||||
Fixed-income Forwards | 30 | 99 | 130 | 0 | 75 | 75 | ||||||||||||||||||
Fixed-income Options | 0 | 0 | 0 | 0 | 0 | 0 | ||||||||||||||||||
Fixed-income Spot | 0 | 0 | 0 | 0 | 0 | 0 | ||||||||||||||||||
Total fixed income derivatives | 30 | 99 | 130 | 0 | 75 | 75 | ||||||||||||||||||
|
|
|
|
|
|
|
|
|
|
|
| |||||||||||||
Asset Swaps | 1,312 | 2,360 | 3,672 | -22 | 311 | 289 | ||||||||||||||||||
Exchange-rate Options | 302 | 264 | 566 | -168 | -24 | -192 | ||||||||||||||||||
Exchange-rate Swaps | 4,346 | 11,655 | 16,001 | 437 | 1,256 | 1,693 | ||||||||||||||||||
Other Exchange-rate Derivatives | 2 | 2 | 4 | -1 | 0 | -1 | ||||||||||||||||||
Total exchange rates | 5,962 | 14,281 | 20,243 | 246 | 1,543 | 1,789 | ||||||||||||||||||
|
|
|
|
|
|
|
|
|
|
|
| |||||||||||||
Asset Swaps | 0 | 412 | 412 | 0 | 134 | 134 | ||||||||||||||||||
Call Money Swaps | 349 | 52 | 401 | -187 | 14 | -173 | ||||||||||||||||||
IRS | 20,432 | 16,596 | 37,028 | 562 | 5,186 | 5,748 | ||||||||||||||||||
Forward Interest Rates | 16 | 21 | 37 | -25 | -19 | -43 | ||||||||||||||||||
Other Interest-rate Derivatives | 1,215 | 1,574 | 2,789 | 871 | -848 | 23 | ||||||||||||||||||
Interest Rate Structures | 229 | 599 | 828 | 135 | -434 | -298 | ||||||||||||||||||
|
|
|
|
|
|
|
|
|
|
|
| |||||||||||||
Total interest-rate derivatives | 22,240 | 19,254 | 41,494 | 1,357 | 4,034 | 5,391 | ||||||||||||||||||
|
|
|
|
|
|
|
|
|
|
|
| |||||||||||||
Commodities | 287 | 111 | 398 | 235 | 8 | 243 | ||||||||||||||||||
Total commodity derivatives | 287 | 111 | 398 | 235 | 8 | 243 | ||||||||||||||||||
|
|
|
|
|
|
|
|
|
|
|
| |||||||||||||
Total otc derivatives | 29,464 | 35,402 | 64,866 | 1,623 | 5,759 | 7,381 | ||||||||||||||||||
|
|
|
|
|
|
|
|
|
|
|
| |||||||||||||
Collateral | 0 | -11,508 | -11,508 | |||||||||||||||||||||
Total | 29,464 | 23,894 | 53,358 | |||||||||||||||||||||
|
|
|
|
|
| |||||||||||||||||||
Millions of euros | 12/31/13 | |||||||||||||||||||
| Total | Spain | Other EU countries | Americas | Rest of the world | ||||||||||||||||
Credit institutions | 147,993 | 26,142 | 69,665 | 48,481 | 3,705 | |||||||||||||||
Public sector | 113,441 | 46,880 | 22,358 | 38,931 | 5,272 | |||||||||||||||
Of which: | ||||||||||||||||||||
Central government | 92,780 | 32,216 | 21,646 | 33,649 | 5,269 | |||||||||||||||
Other | 20,661 | 14,664 | 712 | 5,282 | 3 | |||||||||||||||
Other financial institutions | 52,393 | 11,833 | 24,031 | 14,036 | 2,493 | |||||||||||||||
Non-financial companies and individual entrepreneurs | 293,297 | 98,642 | 65,783 | 115,972 | 12,900 | |||||||||||||||
Of which: | ||||||||||||||||||||
Property construction and development | 21,477 | 7,159 | 4,542 | 9,623 | 153 | |||||||||||||||
Civil engineering construction | 6,849 | 4,611 | 2,030 | 139 | 69 | |||||||||||||||
Large companies | 170,377 | 51,036 | 37,535 | 74,777 | 7,029 | |||||||||||||||
SMEs and individual entrepreneurs | 94,594 | 35,836 | 21,676 | 31,433 | 5,649 | |||||||||||||||
Other households and non-profit institutions serving households | 396,157 | 66,876 | 254,679 | 73,068 | 1,534 | |||||||||||||||
Of which: | ||||||||||||||||||||
Residential | 291,267 | 54,441 | 205,536 | 30,349 | 941 | |||||||||||||||
Consumer loans | 92,036 | 7,823 | 46,712 | 36,931 | 570 | |||||||||||||||
Other purposes | 12,854 | 4,612 | 2,431 | 5,788 | 23 | |||||||||||||||
|
|
|
|
|
|
|
|
|
| |||||||||||
Subtotal | 1,003,281 | 250,373 | 436,516 | 290,488 | 25,904 | |||||||||||||||
|
|
|
|
|
|
|
|
|
| |||||||||||
Less: collectively assessed impairment losses | 3,439 | |||||||||||||||||||
|
| |||||||||||||||||||
Total (*) | 999,842 | |||||||||||||||||||
|
| |||||||||||||||||||
| (*) |
262
Notional OTC derivative products by maturity
Million euros at December 31, 2011
| 1 year | 1-5 years | 5-10 years | Over 10 years | Total REC | ||||||||||||||||||||||||||||||||||||||||||||||||||||||||
| T | H | Total | T | H | Total | T | H | Total | T | H | Total | T | H | Total | ||||||||||||||||||||||||||||||||||||||||||||||
CDS Protection Acquired | 19 | 9 | 28 | 226 | 11 | 237 | 27 | 58 | 85 | 126 | 39 | 166 | 397 | 117 | 515 | |||||||||||||||||||||||||||||||||||||||||||||
CDS Protection Sold | 8 | 0 | 8 | 17 | 0 | 17 | 9 | 0 | 9 | 0 | 0 | 0 | 34 | 0 | 34 | |||||||||||||||||||||||||||||||||||||||||||||
TRS Total Return Swap | 0 | 0 | 0 | 0 | 0 | 0 | 0 | 0 | 0 | 0 | 0 | 0 | 0 | 0 | 0 | |||||||||||||||||||||||||||||||||||||||||||||
CDS Options | 0 | 0 | 0 | 0 | 0 | 0 | 0 | 0 | 0 | 0 | 0 | 0 | 0 | 0 | 0 | |||||||||||||||||||||||||||||||||||||||||||||
Total credit derivatives | 26 | 9 | 35 | 243 | 11 | 254 | 36 | 58 | 94 | 126 | 40 | 166 | 431 | 118 | 549 | |||||||||||||||||||||||||||||||||||||||||||||
|
|
|
|
|
|
|
|
|
|
|
|
|
|
|
|
|
|
|
|
|
|
|
|
|
|
|
|
|
| |||||||||||||||||||||||||||||||
Equity Forwards | 1 | 118 | 119 | 0 | 0 | 0 | 0 | 0 | 0 | 0 | 0 | 0 | 1 | 118 | 119 | |||||||||||||||||||||||||||||||||||||||||||||
Equity Options | 314 | 319 | 633 | 196 | 392 | 588 | 3 | 58 | 61 | 0 | 9 | 9 | 512 | 778 | 1,290 | |||||||||||||||||||||||||||||||||||||||||||||
Equity Swaps | 0 | 296 | 296 | 0 | 344 | 344 | 0 | 3 | 3 | 0 | 0 | 0 | 0 | 643 | 643 | |||||||||||||||||||||||||||||||||||||||||||||
Equity Spot | 0 | 0 | 0 | 0 | 0 | 0 | 0 | 0 | 0 | 0 | 0 | 0 | 0 | 0 | 0 | |||||||||||||||||||||||||||||||||||||||||||||
Total equity derivatives | 315 | 733 | 1,048 | 196 | 736 | 931 | 3 | 61 | 64 | 0 | 9 | 9 | 513 | 1,539 | 2,052 | |||||||||||||||||||||||||||||||||||||||||||||
|
|
|
|
|
|
|
|
|
|
|
|
|
|
|
|
|
|
|
|
|
|
|
|
|
|
|
|
|
| |||||||||||||||||||||||||||||||
Fixed-income Forwards | 30 | 99 | 129 | 0 | 0 | 0 | 0 | 0 | 0 | 0 | 0 | 0 | 30 | 99 | 130 | |||||||||||||||||||||||||||||||||||||||||||||
Fixed-income Options | 0 | 0 | 0 | 0 | 0 | 0 | 0 | 0 | 0 | 0 | 0 | 0 | 0 | 0 | 0 | |||||||||||||||||||||||||||||||||||||||||||||
Fixed-income Spot | 0 | 0 | 0 | 0 | 0 | 0 | 0 | 0 | 0 | 0 | 0 | 0 | 0 | 0 | 0 | |||||||||||||||||||||||||||||||||||||||||||||
Total fixed income derivatives | 30 | 99 | 129 | 0 | 0 | 0 | 0 | 0 | 0 | 0 | 0 | 0 | 30 | 99 | 130 | |||||||||||||||||||||||||||||||||||||||||||||
Asset Swaps | 985 | 1,902 | 2,887 | 323 | 442 | 765 | 4 | 16 | 20 | 0 | 0 | 0 | 1,312 | 2,360 | 3,672 | |||||||||||||||||||||||||||||||||||||||||||||
Exchange-rate Options | 211 | 254 | 465 | 90 | 11 | 101 | 0 | 0 | 0 | 0 | 0 | 0 | 302 | 264 | 566 | |||||||||||||||||||||||||||||||||||||||||||||
Exchange-rate Swaps | 1,549 | 1,782 | 3,331 | 1,666 | 5,821 | 7,487 | 1,132 | 2,045 | 3,536 | 0 | 1,647 | 1,647 | 4,345 | 11,655 | 16,001 | |||||||||||||||||||||||||||||||||||||||||||||
Other exchange-rate Derivatives | 2 | 2 | 4 | 0 | 0 | 0 | 0 | 0 | 0 | 0 | 0 | 0 | 2 | 2 | 4 | |||||||||||||||||||||||||||||||||||||||||||||
Total exchange rates | 2,747 | 3,941 | 6,688 | 2,079 | 6,274 | 8,353 | 1,136 | 2,421 | 3,556 | 0 | 1,647 | 1,647 | 5,962 | 14,281 | 20,243 | |||||||||||||||||||||||||||||||||||||||||||||
|
|
|
|
|
|
|
|
|
|
|
|
|
|
|
|
|
|
|
|
|
|
|
|
|
|
|
|
|
| |||||||||||||||||||||||||||||||
Asset Swaps | 0 | 2 | 2 | 0 | 36 | 36 | 0 | 77 | 77 | 0 | 297 | 297 | 0 | 412 | 412 | |||||||||||||||||||||||||||||||||||||||||||||
Call Money Swaps | 167 | 27 | 195 | 156 | 12 | 168 | 12 | 12 | 24 | 14 | 0 | 14 | 349 | 52 | 401 | |||||||||||||||||||||||||||||||||||||||||||||
IRS | 353 | 636 | 989 | 4,169 | 5,120 | 9,289 | 5,201 | 3,871 | 9,072 | 10,079 | 6,970 | 17,678 | 20,432 | 16,596 | 37,028 | |||||||||||||||||||||||||||||||||||||||||||||
Forward Interest Rates | 16 | 21 | 37 | 0 | 0 | 0 | 0 | 0 | 0 | 0 | 0 | 0 | 16 | 21 | 37 | |||||||||||||||||||||||||||||||||||||||||||||
Other Interest-rate Derivatives | 1 | 107 | 108 | 21 | 468 | 488 | 117 | 468 | 584 | 1,076 | 531 | 1,608 | 1,215 | 1,574 | 2.789 | |||||||||||||||||||||||||||||||||||||||||||||
Interest Rate Structures | 35 | 57 | 92 | 83 | 106 | 189 | 25 | 31 | 56 | 85 | 405 | 490 | 229 | 599 | 828 | |||||||||||||||||||||||||||||||||||||||||||||
Total interest-rate derivatives | 573 | 850 | 1,422 | 4,429 | 5,742 | 10,171 | 5,354 | 4,460 | 9,814 | 11,884 | 8,202 | 20,087 | 22,240 | 19,254 | 41,494 | |||||||||||||||||||||||||||||||||||||||||||||
|
|
|
|
|
|
|
|
|
|
|
|
|
|
|
|
|
|
|
|
|
|
|
|
|
|
|
|
|
| |||||||||||||||||||||||||||||||
Commodities | 122 | 45 | 166 | 146 | 66 | 212 | 20 | 0 | 20 | 0 | 0 | 0 | 287 | 111 | 398 | |||||||||||||||||||||||||||||||||||||||||||||
Total Commodity derivatives | 122 | 45 | 166 | 146 | 66 | 212 | 20 | 0 | 20 | 0 | 0 | 0 | 287 | 111 | 398 | |||||||||||||||||||||||||||||||||||||||||||||
|
|
|
|
|
|
|
|
|
|
|
|
|
|
|
|
|
|
|
|
|
|
|
|
|
|
|
|
|
| |||||||||||||||||||||||||||||||
Total OTC derivatives | 3,813 | 5,676 | 9,489 | 7,092 | 12,829 | 19,921 | 6,548 | 7,000 | 13,549 | 12,011 | 9,897 | 21,908 | 29,464 | 35,402 | 64,866 | |||||||||||||||||||||||||||||||||||||||||||||
|
|
|
|
|
|
|
|
|
|
|
|
|
|
|
|
|
|
|
|
|
|
|
|
|
|
|
|
|
| |||||||||||||||||||||||||||||||
Collateral | 0 | -11,508 | -11,508 | |||||||||||||||||||||||||||||||||||||||||||||||||||||||||
Total | 29,464 | 23,894 | 53,358 | |||||||||||||||||||||||||||||||||||||||||||||||||||||||||
|
|
|
|
|
| |||||||||||||||||||||||||||||||||||||||||||||||||||||||
H= Hedging
T= Trading
Distribution of risk in OTC derivatives
by rating of counterparty
| ||||
| ||||
| ||||
| ||||
| ||||
| ||||
| ||||
| ||||
263
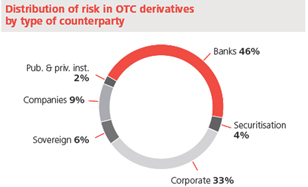 |
|
The distribution of risk in derivatives by type of counterparty was 46% with banks, 33% with large companies and 9% with SMEs.
As regards the geographic distribution of risk, 13% is with Spanish counterparties, 18% with the UK counterparties (mainly Santander UK’s operations), 30% the rest of Europe, 10% the US and 14% Latin America.
Activity in credit derivatives
Grupo Santander uses credit derivatives to cover loans, customer business in financial markets and, to a lesser extent, within trading operations. The volume of this activity is small compared to that of our peers and, moreover, is subject to a solid environment of internal controls and minimizing operational risk.
The risk of these activities is controlled via a broad series of limits such as VaR, nominal by rating, sensitivity to the spread by rating and name, sensitivity to the rate of recovery and to correlation. Jump-to-default limits are also set by individual name, geographic area, sector and liquidity.
In notional terms, the CDS position incorporates €57,220 million of acquired protection and €51,212 million of sold protection.
At December 31, 2011, for the Group’s trading activity, the sensitivity of lending to increases in spreads of one basic point was minus €0.3 million, and the average VaR during the year was €10.6 million. Both were significantly lower than in 2010 (sensitivity of –€1.5 million and average VaR of €17.2 million).
C.5.4.3 Country risk
Country risk is a credit risk component inherent in all cross-border credit transactions fordue to circumstances different to the usualother than ordinary commercial risk. Its main elements are sovereign risk, thetransfer risk of transfer and other risks which couldthat can affect international financial activity (wars,operations (war, natural disasters, balance of payments crisis,crises, etc.).
The exposure susceptible to country-risk provisions atAt December 31, 2013, the end of 2011 was €380 million, of which €19 million corresponded to intragroup transactions. At the end of 2010, the total country risk exposure for which allowances must be recorded amounted to €382 million (December 31, 2012: €342 million). The allowance recognized in need of provisions was €435 million. Total allowances in 2011 stoodthis connection at €552013 year-end amounted to €47 million, as compared with €69€45 million in 2010.at 2012 year-end.
The country risk exposure for which allowances must be recorded is moderate. Total country risk exposure, irrespective of whether or not allowances must be recorded, is also moderate. Except for the group 1 countries (considered by the Bank of Spain to have the lowest level of risk(9)), exposure to an individual country in no case exceeds 1% of the Group’s total assets.
The Group’s country risk management principlespolicies continued to followadhere to a principle of maximum prudence, criteria, assumingand country risk is assumed, applying highly selective criteria, in a very selective way in operationstransactions that are clearly profitable for the Group and which strengthen the globalbolster its overall relationship with its customers.
264
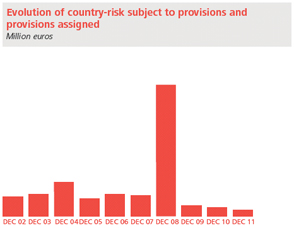
D.5.4.4 Sovereign risk
As a general criterion,rule, the Group considers sovereign risk is that contractedto be the risk assumed in transactions with athe central bank (including the regulatory cash reserve requirement), the issuer risk of the Treasury or similar body (government debt securities) and the Republic (portfolio of state debt) and thatrisk arising from transactions with public institutions withentities that have the following features: their funds are obtained only come from institutionsfiscal income; they are legally recognized as entities directly integrated intoincluded in the stategovernment sector; and their activities are of a non-commercial nature.
At December 31, 2011, according to Santander’s criteria, Europe accounted for 56.3% of total risk, Latin America 35.4%,
This criterion, which has been employed historically by the US 7.3% and others 1.0%. Of noteGroup, differs in Europe were Spain (29.8%) and the UK (16.1%) and, in Latin America, Brazil (24.3%) and Mexico (6.6%). Total risk was higher than in 2010 largely because of the increase in sovereign risk positions with Spain, Germany, the US and Mexico, and the incorporation of the positions of Bank Zachodni WBK (concentrated in Poland) to the perimeter of consolidation, which were partly offsetcertain respects from that requested by a reduction of positions with the UK and Switzerland.
As regards the European peripheral countries, their share ofBanking Authority (EBA) for its periodic stress tests. The most significant differences are that the total portfolio is low: Portugal (2.0%), Italy (0.4%), Ireland (0.02%) and Greece (0.04%).
Latin America’sEBA’s criteria do not include risk exposure to sovereigncentral banks, the Group insurance companies’ exposures, exposure to public-sector companies or indirect exposure by means of guarantees or other instruments. However, they do include exposure to public authorities in general (including regional and local authorities), not only the central government sector.
| 9 | This group includes transactions with ultimate obligors resident in European Union countries, Norway, Switzerland, Iceland, the U.S., Canada, Japan, Australia and New Zealand. |
Sovereign risk exposure (per the criteria applied at the Group) arises mainly comes from the subsidiary banks’ obligations to which our subsidiary banks are subject for constitutingmake certain deposits inat the corresponding central banks as well asand from the fixed-income portfolios maintainedheld as part of the on-balance-sheet structural interest rate risk management strategy. TheseThe vast majority of these exposures are taken in local currency and are financed by locally capturedout of local customer deposits, also denominated in local currency. The exposures
In general, total exposure to sovereign risk has remained relatively stable in recent years, which seems reasonable if the strategic reasons for it, discussed above, are taken into account.
The detail at December 31, 2013 and 2012, based on the Group’s management of Latin American issuers denominated in currencies other than the official oneeach portfolio, of the countryGroup’s sovereign risk exposure, net of issuethe short positions held with the respective countries, taking into consideration the aforementioned criterion established by the European Banking Authority (EBA), is as follows:
Country | 12/31/13 | |||||||||||||||
| Millions of euros | ||||||||||||||||
| Portfolio | ||||||||||||||||
| Financial assets held for trading and Other financial assets at fair value through profit or loss (*) | Available-for-sale financial assets | Loans and receivables | Total net direct exposure | |||||||||||||
Spain | 4,359 | 21,144 | 12,864 | 38,367 | ||||||||||||
Portugal | 148 | 2,076 | 583 | 2,807 | ||||||||||||
Italy | 1,309 | 77 | — | 1,386 | ||||||||||||
Greece | — | — | — | — | ||||||||||||
Ireland | — | — | — | — | ||||||||||||
Rest of eurozone | (1,229 | ) | 67 | — | (1,161 | ) | ||||||||||
U.K. | (1,375 | ) | 3,777 | — | 2,402 | |||||||||||
Poland | 216 | 4,770 | 43 | 5,030 | ||||||||||||
Rest of Europe | 5 | 117 | — | 122 | ||||||||||||
U.S. | 519 | 2,089 | 63 | 2,671 | ||||||||||||
Brazil | 8,618 | 8,901 | 223 | 17,743 | ||||||||||||
Mexico | 3,188 | 2,362 | 2,145 | 7,695 | ||||||||||||
Chile | (485 | ) | 1,037 | 534 | 1,086 | |||||||||||
Rest of Americas | 268 | 619 | 663 | 1,550 | ||||||||||||
Rest of world | 5,219 | 596 | 146 | 5,964 | ||||||||||||
|
|
|
|
|
|
|
| |||||||||
Total | 20,762 | 47,632 | 17,268 | 85,661 | ||||||||||||
|
|
|
|
|
|
|
| |||||||||
| (*) | Net of short positions amounting to €17,658 million. |
In addition, at December 31, 2013, the Group had net direct derivatives exposures the fair value of which amounted to €2,462€(206) million (3.5%and net indirect derivatives exposures the fair value of total sovereign risk with Latin American issuers).which amounted to €6 million. Also, the Group did not have any exposure to held-to-maturity investments.
E.
| 12/31/12 | ||||||||||||||||
| Millions of euros | ||||||||||||||||
| Portfolio | ||||||||||||||||
Country | Financial assets held for trading and Other financial assets at fair value through profit or loss (*) | Available-for-sale financial assets | Loans and receivables | Total net direct exposure | ||||||||||||
Spain | 4,403 | 24,654 | 16,528 | 45,586 | ||||||||||||
Portugal | — | 1,684 | 616 | 2,300 | ||||||||||||
Italy | (71 | ) | 76 | — | 4 | |||||||||||
Greece | — | — | — | — | ||||||||||||
Ireland | — | — | — | — | ||||||||||||
Rest of eurozone | 943 | 789 | — | 1,731 | ||||||||||||
U.K. | (2,628 | ) | 4,419 | — | 1,792 | |||||||||||
Poland | 669 | 2,898 | 26 | 3,592 | ||||||||||||
Rest of Europe | 10 | — | — | 10 | ||||||||||||
U.S. | (101 | ) | 1,783 | 30 | 1,712 | |||||||||||
Brazil | 14,067 | 11,745 | 351 | 26,163 | ||||||||||||
Mexico | 4,510 | 2,444 | 2,381 | 9,335 | ||||||||||||
Chile | (293 | ) | 1,667 | 521 | 1,895 | |||||||||||
Rest of Americas | 214 | 916 | 771 | 1,900 | ||||||||||||
Rest of world | 1,757 | 645 | 234 | 2,636 | ||||||||||||
|
|
|
|
|
|
|
| |||||||||
Total | 23,480 | 53,718 | 21,457 | 98,655 | ||||||||||||
|
|
|
|
|
|
|
| |||||||||
| (*) | Net of short positions amounting to €15,282 million. |
In addition, at December 31, 2012, the Group had net direct derivatives exposures the fair value of which amounted to €-330 million and net indirect derivatives exposures the fair value of which amounted to €-33 million. Also, the Group did not have any exposure to held-to-maturity investments.
5.4.5 Environmental risk
Analysis ofIn line with the Group’s commitment to sustainability, the environmental risk analysis of credit operationstransactions is one of the main aspectsfeatures of the strategic plan of corporate social responsibility. It revolves around the followingresponsibility plan. The analysis is founded on two large points:major cornerstones:
•
– For operations with an amount equalrisk and, accordingly, to or more than $10 million, an initial questionnaire is filled out, of a generic nature, designedgrant loans only to establish the project’s risk in the socio environmental sphere (according to categories A, B and C or greater to lower risk, respectively) and the operation’s degree of compliance with the Equator Principles.
– For those projects classified within the categories of greater risk (categories A and B), a more detailed questionnaire has to be filled out, adapted according to the sector of activity.
265
– According to the category and location of the projects athat can evidence that their social and environmental audit is carried out (by independent external auditors). Specific questionnaires have been developed for those sectors where the Bank is most active. impacts are properly managed.
• VIDA tool: usedimplemented since 2004, itsthe main purposeaim of this tool is to assess the environmental risk of corporate clients, both current and potential throughindividualized companies in commercial banking (Spain), using a system that classifies in seven categories each of the companies into one of seven categories, depending on the basisdegree of the environmental risk contracted. In 2011, 39,575 companies were assessed by this tool in Spain (totalincurred.
5.5. Credit risk of €59,770 million).
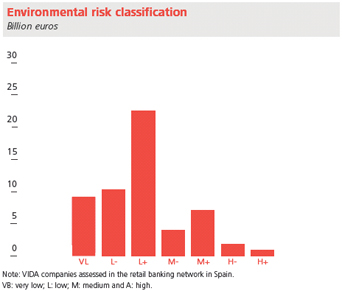
Low or very low environmental risk accounts for 78.3% of total risk. In 2011, there was a sharp fall in medium environmental risk (54.4% less than in 2010).
266
Definition and objectives
Grupo Santander defines operational risk (OR) as the risk of losses from defects or failures in its internal processes, employees or systems, or those arising from unforeseen circumstances. They are, in general, purely operational events, which makes them different from market or credit risks, although they also include external risks, such as natural disasters.cycle
The objective in controlcredit risk management process consists of identifying, analyzing, controlling and management of operational risk is to identify measure/valuate, control/mitigate and monitor this risk.
The Group’s priority, is to identify and eliminate risk focuses, regardless of whether they produce losses or not. Measurement also helps to establish priorities in management of operational risk.
Grupo Santander opted, fromdeciding on, as appropriate, the beginning, to use the standard method for calculating regulatory capital by operational risk, envisagedrisks incurred in the BIS- II rules.Group’s operations. The Group is weighing upparties involved in this process are the best moment to adopt the focus of advanced models (AMs), bearing in mind that a) the short-term priority in management of operational risk centers on its mitigation; and b) most of the regulatory requirements established for being able to adopt the AMs must be incorporated into the standard model (already achieved in the case of Grupo Santander’s operational risk management model).
Management model
The organizational model for controlling and managing risks is the result of adapting to the new BIS II environment, which establishes three levels of control:
First level: control and management functions conducted by the Group’s units.
Second level: supervision functions carried out by the corporate areas.
Third level: integral control functions by the risk division-integral control area and internal validation of risk.
This model is constantly reviewed by the internal auditing division.
Control of operational risk in the first and second levels is carried out by the technology and operations division, and is part of the Group’s strong risk management culture. Within this division, the corporate area of technological and operational risk, established in 2008, defines policies as well as managing and controlling these risks. The implementation, integration and local adjustment of the policies and guidelines established by this area is the responsibility of local executives in each unit.
This structure for operational risk management is based on the knowledge and experience of executives and professionals of the Group’s various units. Particular importance is attached to the role of local executives responsible for operational risk.
267
Management is based on the following elements:
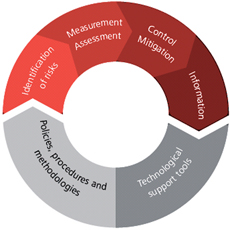
The different phases of the technological and operational risk management model entail:
Ÿ Identify the operational risk inherent in all activities, products, processes and banking systems.
Ÿ Measure and assess the operational risk objectively, continuously and in line with the regulatory standards (Basel II, Bank of Spain) and the banking industry, establishing risk tolerance levels.
Ÿ Continuously monitor the exposure of operational risk in order to detect the levels of unassumed risk, implement control procedures, improve internal knowledge and mitigate losses.
Ÿ Establish mitigation measures that eliminate or minimize operational risk.
Ÿ Produce regular reports on the exposure to operational risk and the level of control forbusiness areas, senior management and the Group’s areas/units, as well as inform the market and regulatory bodies.
Ÿ Define and implement systems that enable operational risk exposures to be watched over and controlled and integrated into the Group’s daily management, taking advantage of existing technology and seeking the maximum computerization of applications.
Ÿ Define and document operational risk management policies, and introduce methodologies for managing this risk in accordance with regulations and best practices.
Ÿ Grupo Santander’s operational risk management model contributes the following advantages:
Ÿ Integral and effective management of operational risk (identification, measurement/assessment, control/mitigation and information).
Ÿ Better knowledge of existing and potential operational risks and assigning responsibility for them to the business and support lines.
Ÿ Operational risk information helps to improve the processes and controls, reduce losses and the volatility of revenues.
Ÿ Facilitates the establishment of operational risk appetite limits.
Implementing the model: global initiatives and resultsunits.
The main functions, activities and global initiatives adopted to assist inprocess involves the effective managementboard of operational and technological risk are:
Ÿ Define and implement the framework for corporate management of technological and operational risk management.
268
Designate coordinators and create operational risk departments.
Training and interchange of experiences: continuation of best practices within the Group.
Foster mitigation plans: ensure control of implementation of corrective measures as well as ongoing projects.
Define policies and structures to minimize the impact on the Group of big disasters.
Maintain adequate control on activities carried out by third parties in order to meet potential critical situations.
Supply adequate information on this type of risk.
The corporate function enhances management of technological risk, strengthening the following aspects among others:
The security of the information systems.
The contingency and business continuity plans.
Management of risk associated with the use of technologies (development and maintenance of applications, design, implementation and maintenance of technology platforms, output of computer processes, etc.).
Almost all of our units have been incorporated to the model with a high degree of uniformity. However, due to the different pace of implementation, phases, schedules and the historical depth of the respective data bases, the degree of progress varies from country to country.
On a general basis, all of our units continue to improve all aspects related to operational risk management as can be seen in the annual review by the internal auditing unit.
Ÿ Data bases of operational incidents that are classified are received every month. The capturing of events related to operational risk are not truncated (i.e. without exclusions for reasons of amount and with both the accounting impact including positive effects as well as the non-accounting impact).
Ÿ Self-assessment questionnaires filled in by almost all the Group’s units are received and analyzed.
Ÿ A corporate system of operational risk indicators is in place. It is in continuous evolution and coordination with the internal control area.
Ÿ The main and most frequent events are identified and analyzed, and mitigation measures taken which, in significant cases, are disseminated to the Group’s other units as a best practices guide.
Ÿ Processes are conducted to reconcile data bases with accounting data.
269
By consolidating the total information received, the Group’s operational risk profile is reflected in the following chart:
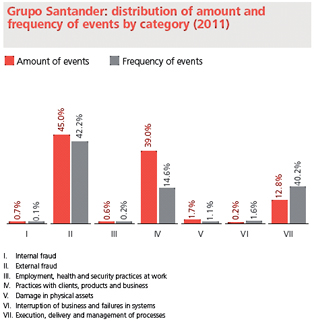
In addition, our units in 2011 continued to advance in conducting self-assessment risk exercises regarding the introduction of estimates of frequency and loss given default and worst case scenarios. Specifically, experts from the various business and support areas assessed the risk associated with processes and activities and estimated the average frequency of occurrence in the materialization of risks as well as the average loss given default. The exercise also incorporated evaluation of the largest loss in addition to the average loss, as well as assessment of the environment of control.
All of this will enable limits to be established on the basis of the distribution and modeling of expected/unexpected loss.
We completed in 2011 the establishment of a new corporate system which supports almost all the operational risk management tools and facilitates the functions and information and reporting needs, both at the local and corporate level. The most noteworthy features are:
Ÿ The following modules are available: registry of events, risk map and assessment, indicators and reporting systems.
Ÿ Application tool for all the Group’s entities.
Ÿ All operational risk management processes are automated.
Ÿ The following improvements are expected to be incorporated to the platform during 2012:
– Methodology for analyzing scenarios that supplements the current methodologies in the Group and enables potential risks of greater loss to be assessed.
– Strengthen the procedures for active management of operational risk via implementation and follow up of mitigation measures.
We have been exercising supervision and control of technological and operational risk via our governance bodies, the board,directors, the executive committee and the Group’s managementrisk committee, have been regularly including treatmentwhich establishes the risk policies and procedures, and the limits and delegations of relevant aspectspowers, and approves and supervises the scope of action of the risk function.
The risk cycle comprises three different phases: pre-sale, sale and post-sale. The process is being permanently updated, with the findings and conclusions of the post-sale phase being fed back into the risk analysis and planning of the pre-sale phase.
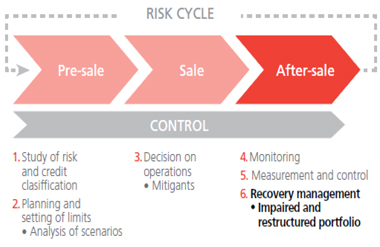
5.5.1. Risk analysis and credit rating process
In general, the risk analysis consists of examining the customer’s ability to meet its contractual obligations to the Bank. This involves analyzing the customer’s credit quality, its risk transactions, its solvency and the return to be obtained in view of the risk assumed.
Since 1993 the Group has used internal rating models for this purpose. These mechanisms are used in all the individualized segments, both the wholesale segments (sovereigns, financial institutions and corporate banking) and the other individualized companies and institutions.
The rating is obtained from a quantitative module based on balance sheet ratios or macroeconomic variables and supplemented by the analyst’s expert judgment.
Ratings assigned to customers are reviewed periodically to include any new financial information available and the experience in the managementbanking relationship. The frequency of the reviews is increased in the case of customers that reach certain levels in the automatic warning systems and mitigation of operational risk.customers classified as requiring special monitoring. The rating tools themselves are also reviewed in order to progressively fine-tune the ratings they provide.
Meanwhile,In contrast to the use of ratings in the individualized segments, in the standardized segment scoring techniques predominate; in general, these tools automatically assign a score to proposed transactions.
5.5.2 Risk limit planning and setting
The purpose of this phase is to efficiently and comprehensively limit the risk levels the Group through itsassumes.
The credit risk planning process is used to establish the budgets and limits at portfolio or customer level depending on the segment in question.
Thus, in the case of standardized risks, the risk limits are planned and set using documents agreed upon by the business areas and the risk units and approved by the risk committee formalizes every yearor its delegated committees, which contain the operationalexpected results of transactions in terms of risk profiles and limits. It establishesreturn, as well as the limits applicable to the activity and the related risk management.
For individualized risks, the analysis is conducted at customer level. When certain features concur for a given customer, an individual limit is established (pre-classification).
Thus, for large corporate groups a pre-classification model, based on an economic capital measurement and monitoring system, is used. The result of the pre-classification is the maximum level of risk that can be assumed vis-à-vis a customer or group in terms of amount or maturity. In the corporate segment, a simplified pre-classification model is applied for customers meeting certain requirements (thorough knowledge, rating, etc.).
Scenario analysis
An important aspect of the planning phase is the consideration of the volatility of the macroeconomic variables that affect the performance of the portfolios.
The Group simulates their performance in various adverse and stress scenarios (stress testing), which enables it to assess the Group’s capital adequacy in the event of certain future circumstantial situations.
These simulations are performed systematically on the Group’s most important portfolios in accordance with a corporate methodology which:
The simulation models used by the Group rely on data from a complete economic cycle to calibrate the behavior of the credit risk parameters in response to changes in the macroeconomic variables. These models undergo regular backtesting and recalibration processes in order to ensure that they provide a correct reflection of the relationship between the macroeconomic variables and the risk parameters.
The scenario analysis enables senior management to gain a clearer understanding of the performance of the portfolio in response to changing market and circumstantial conditions and it is a basic tool for assessing the sufficiency of the provisions recognized to cater for stress scenarios.
Definition of assumptions and (base/stress) scenarios
The risk and loss parameters are projected, usually with a three-year time horizon, using various economic scenarios that include the main macroeconomic variables (GDP, unemployment rate, housing prices, inflation, etc.).
The economic scenarios defined are based on different stress levels, ranging from the base or most probable scenario to more stressed economic scenarios which, although less probable, could possibly arise.
These scenarios are generally defined by the Group’s economic research service, in coordination with the research services of each unit, using as a reference the data published by the main international organizations.
A global stress scenario is defined that describes a situation of worldwide crisis and the manner in which it affects each of the main geographical regions in which the Group is present. In addition, a local stress scenario is defined which, affecting certain of the Group’s main units in an isolated fashion, includes a higher level of stress than the global stress scenario.
At the meetings of the capital coordination committee, senior management of the Group is apprised of, proposes any changes it deems appropriate and ultimately approves the definitive set of scenarios to be used in conducting the Group’s stress test.
Uses of the scenario analysis
The scenario analysis techniques are useful throughout the credit risk cycle. The various uses can be classified as follows:
The planning and management applications of the tests include most notably their use in the preparation of the annual budget and the ongoing monitoring thereof. The use of the tests in establishing and monitoring the Group’s risk appetite is also of particular significance.
Results obtained
The various stress tests performed, for both regulatory and management purposes, have evidenced the strength and validity of the Group’s business model, as a result of its resilience to stress scenarios for both the Group as a whole and each of its main units.
In this regard, in each risk appetite update submitted to the board of directors, it has been confirmed that, even in the most adverse stress scenarios, the Group continues to report profits and maintain adequate capital levels.
One of the most important conclusions to be drawn from the scenario analysis is the benefit contributed by the Group’s diversification in terms of geographical regions, industries and its low level customers concentration, which enables it to comfortably withstand adverse macroeconomic scenarios.
5.5.3 Transaction decision-making
The sale phase comprises the decision-making process, the aim of which is to analyze and resolve upon transactions, since approval by the risk unit is a pre-requisite for the arrangement of any risk transaction. This process must be situatedconsider the transaction approval policies defined and take into account both the risk appetite and any transaction elements that are important in lowachieving a balance between risk and medium-low profiles, whichreturn.
In the standardized customer sphere, the management of large volumes of loan transactions is facilitated by the use of automatic decision-making models that rate the customer/loan relationship. Thus, loans are definedclassified in homogeneous risk groups using the rating assigned to the transaction by the model on the basis of information on the levelfeatures of each transaction and the borrower. These models are used in individual banking and business banking and for standardized SMEs.
As stated above, the previous limit-setting stage can follow two different paths, giving rise to different types of decisions in the individualized customer sphere:
Credit risk mitigation techniques
The Group applies various ratios. Limitsmethods of reducing credit risk, depending, inter alia, on the type of customer and product. As we shall see, some of these methods are specific to a particular type of transaction (e.g. real estate guarantees) while others apply to groups of transactions (e.g. netting and collateral arrangements).
The various mitigation techniques can be grouped into the following categories:
Determination of a net balance by counterparty.
Netting refers to the possibility of determining a net balance of transactions of the same type, under the umbrella of a framework agreement such as ISDA or similar agreements.
It consists of aggregating the positive and negative market values of the derivatives transactions entered into by us with a particular counterparty, so that, in the event of default, the counterparty owes the Group (or the Group owes the counterparty, if the net figure is negative) a single net figure and not a series of positive or negative amounts relating to each of the transactions entered into with the counterparty.
An important aspect of framework agreements is that they represent a single legal obligation encompassing all the transactions they cover. This is the key to being able to set off the risks of all the transactions covered by the contract with the same counterparty.
Collateral
Collateral refers to the assets pledged by the customer or a third party to secure the performance of an obligation. Collateral may be:
From the risk acceptance standpoint, collateral of the highest possible quality is required. For regulatory capital calculation purposes, only collateral that meets the minimum quality requirements described in the Basel capital accords can be taken into consideration.
One very important example of financial collateral is the collateral agreement. Collateral agreements are a set of instruments with a determined economic value and high liquidity that are deposited or transferred by a counterparty in favor of another party in order to guarantee or reduce such counterparty credit risk as might arise from the portfolios of derivative transactions between the parties in which there is exposure to risk.
Collateral agreements vary in nature but, whichever the specific form of collateralization may be, the ultimate aim, as in the netting technique, is to reduce counterparty risk.
Transactions subject to collateral agreements are assessed periodically (normally on a daily basis). The agreed-upon parameters defined in the agreement are applied to the net balance arising from these assessments, from which the collateral amount (normally cash or securities) payable to or receivable from the counterparty is obtained.
With regard to real estate collateral, periodic re-appraisal processes are in place, based on the actual market values for the different types of real estate, which meet all the requirements established by the regulator.
When mitigation techniques are used, the minimum requirements established in the credit risk management policy manual are adhered to. In short, these consist of monitoring the following:
Personal guarantees and credit derivatives
Personal guarantees are guarantees that make a third party liable for another party’s obligations to the Group. They include, for example, security deposits, suretyships and standby letters of credit. Only guarantees provided by third parties that meet the minimum requirements established by the supervisor can be recognized for capital calculation purposes.
Credit derivatives are financial instruments whose main purpose is to hedge credit risk by buying protection from a third party, whereby the Bank transfers the risk of the issuer of the underlying instrument. Credit derivatives are OTC instruments, i.e. they are not traded in organized markets. Credit derivative hedges, mainly credit default swaps, are entered into with leading financial institutions.
5.5.4 Monitoring
The monitoring function is founded on a process of ongoing observation, which makes it possible to detect early any changes that might arise in customers’ credit quality, so that action can be taken to correct any deviations with an adverse impact.
Monitoring is based on the segmentation of customers, is performed by dedicated local and global risk teams and is complemented by the work performed by internal audit.
The function involves, inter alia, identifying and monitoring companies under special surveillance, reviewing ratings and the ongoing monitoring of standardized customers’ indicators.
The system called “companies under special surveillance” (FEVE, using the Spanish acronym) distinguishes four categories based on the degree of concern raised by the circumstances observed (extinguish, secure, reduce and monitor). The inclusion of a position in the FEVE system does not mean that there has been a default, but rather that it is deemed advisable to adopt a specific policy for the position in question, to place a person in charge and to set the policy implementation period. Customers classified as FEVE are reviewed at least every six months, or every three months for those classified in the most severe categories. A company can be classified as FEVE as a result of the monitoring process itself, a review performed by internal audit, a decision made by the sales manager responsible for that company or the triggering of the automatic warning system.
Assigned ratings are reviewed at least annually, but should any weakness be detected, or depending on the rating itself, more frequent reviews are performed.
For exposures to standardized customers, the key indicators are monitored in order to detect any variance in the performance of the loan portfolio with respect to the forecasts contained in the credit management programs.
5.5.5 Measurement and control
In addition to monitoring customers’ credit quality, the Group establishes the control procedures required to analyze the current credit risk portfolio and the changes therein over the various credit risk phases.
The risk control function is performed by assessing risks from various complementary perspectives, the main pillars being control by geographical location, business area, management model, product, etc., thus facilitating the early detection of specific areas of attention and the preparation of action plans to correct possible impairment.
Each control pillar can be analyzed in two ways:
1.- Quantitative and qualitative analysis of the portfolio
In the analysis of the portfolio, any variances in the Group’s risk exposure with respect to budgets, limits and benchmarks are controlled on an ongoing and systematic basis, and the impacts of these variances in certain future situations, both of an exogenous nature and those arising from strategic decisions, are assessed in order to establish measures that place the profile and amount of the loan portfolio within the parameters set by countrythe Group.
In addition to the traditional metrics, the following, inter alia, are used in the credit risk control phase:
It is an aggregate measure at portfolio level that enables action to be taken in the event of deteriorations in the trend of non-performing loans.
VMG is calculated as the difference between the ending balance and the beginning balance of non-performing loans for the period in question, plus the loans written off in the period, less any previously written-off loans recovered in that same period.
VMG and its component parts play a decisive role as monitoring variables.
Expected loss is the estimated financial loss that will occur over the next twelve months on the portfolio existing at any given time.
It is an additional cost of the activity and must be charged in the transaction price. It is calculated using three basic parameters:
Thus, other relevant factors are taken into account in estimating the risk involved in transactions, such as the quantification of off-balance-sheet exposures, or the expected percentage of recoveries, which is related to the guarantees associated with the transaction and other characteristics of the transaction: type of product, term, etc.
The risk parameters are also involved in the calculation of both economic and regulatory capital. The inclusion of capital metrics in management is fundamental to the rationalization of the use of capital.
2.- Assessment of the control processes
This includes a systematic periodic review of the procedures and methodology, and is performed over the entire credit risk cycle to ensure that they are in force and effective.
In 2006, within the corporate framework established in the Group for compliance with the Sarbanes-Oxley Act, a corporate tool was made available on the Group’s intranet for the documentation and certification of all the subprocesses, operational risks and related mitigating controls. In this connection, the risk division assesses the efficiency of the internal control of its activities on an annual basis.
Furthermore, the integrated risk control and internal risk validation unit, as part of its mission to supervise the quality of the Group’s risk management, guarantees that the systems for the management and control of the risks inherent to its activity comply with the strictest criteria and the best practices observed in the industry and/or required by the regulators. Also, internal audit is responsible for ensuring that the policies, methods and procedures are appropriate, effectively implemented and regularly reviewed.
5.5.6 Recovery management
The recovery activity is a significant function in the Group’s risk management area.
In order to manage recovery properly, action is taken in four main phases: arrears management, recovery of non-performing loans, recovery of written-off loans and management of foreclosed assets. In fact, the actions taken by the recovery function commence even before the first missed payment, i.e. when there are signs of a deterioration of the customer’s ability to pay, and they end when the customer’s debt has been paid or has returned to performing status. The recovery function aims to anticipate default events and focuses on preventive management.
The current macroeconomic environment has a direct effect on customer default and non-performing loans ratios. Therefore, the quality of the portfolios is fundamental to the development and growth of our businesses in the various countries, and particular attention is paid, on an permanent basis, to the debt collection and recovery functions in order to guarantee that this quality reaches the expected levels at all times.
The Group has in place a corporate management model that defines the general recovery action guidelines. These guidelines are applied in the various countries, always taking into account the local peculiarities required for the recovery activity, due either to the local economic environment, to the business model or to a combination of both. This corporate model is subject to the permanent review and enhancement of the management processes and methodology that underpin it. For the Group, recovery management entails the direct involvement of all areas of management (sales, technology and operations, human resources and risk), which has contributed to the incorporation of solutions improving the effectiveness and efficiency of the aforementioned model.
The differing characteristics of customers make segmentation necessary in order to ensure proper recovery management. The mass management of large groups of customers with similar profiles and products is performed using highly technological processes, while personalized and individualized management is reserved for customers who, due to their profile, require the assignment of a specific manager and a more tailored analysis.
The recovery activity has been aligned with the social and economic reality of the different countries, and various management mechanisms have been used, all involving appropriate prudential criteria, based on the age, collateral and conditions of the transaction, while always ensuring that at least the required ratings and provisions are maintained.
Within the recovery function particular emphasis has been placed on using the mechanisms referred to above for early arrears management, in accordance with corporate policies, considering the various local realities and closely monitoring the production, inventory and performance of those local areas. The aforementioned policies are reviewed and adapted periodically in order to reflect both best management practices and any applicable regulatory amendments.
In addition to the measures aimed at adapting transactions to the customer’s ability to pay, special mention should be made of recovery management, in which alternative solutions to legal action are sought to ensure the early collection of debts.
One of the channels for the recovery of debts of customers whose ability to pay has deteriorated severely is foreclosure (either court-ordered or through dation in payment) of the property assets securing the transactions. In geographical regions that are highly exposed to real estate risk, such as Spain, the Group has very efficient instruments in place to manage the sale of such assets, thus making it possible for the Bank to recuperate its capital and reduce its on-balance-sheet stock of property assets at a much faster pace than other financial institutions.
Forborne loan portfolio
The term “forborne loan portfolio” refers, for the purposes of the Group’s risk management, to the concepts of “restructurings” and “refinancings” as defined in Bank of Spain Circular 6/2012, which relate to transactions in which the customer has, or might foreseeably have, financial difficulty in meeting its payment obligations under the terms and conditions of the current agreement and, accordingly, the agreement has been modified or cancelled or even a new transaction has been entered into.
The Group has a detailed corporate policy for debt forbearance that is applicable to all countries, complies with the aforementioned Bank of Spain Circular 6/2012 and follows the general principles recently published by the European Banking Authority for transactions of this kind.
This corporate policy establishes strict prudential criteria for the assessment of these loans:
Also, the corporate policy sets out various criteria for determining the scope of transactions qualifying as forborne exposures by defining a detailed series of objective indicators that are indicative of situations of financial difficulty.
Accordingly, transactions not classified as impaired at the date of forbearance are generally considered to be experiencing financial difficulty if at that date they were more than one month past due. Where no payments have been missed or there are no payments more than one month past due, other indicators of financial difficulty are taken into account, including most notably the following:
Once it has been determined that the reasons for the modification are effectively due to financial difficulties, a more precise classification is performed based on the degree of impairment and management status of the original transactions, distinguishing between the following types of forbearance:
| • | Ex-ante forbearance: where the original transaction has not been classified as impaired and has an amount more than one month (but not more than three months) past due at the time the modification is arranged. If the transaction has an amount past due by one month or less, or even if the transaction is current in its payment, it will also be considered as a case of ex-ante forbearance if, based on the aforementioned indicators, there is any sign evidencing the existence of financial difficulties. |
| • | Ex-post forbearance: the ex-post concept refers to forbearance transactions in which, at the date of forbearance, the exposures have already been classified as impaired, either due to arrears or for other reasons (i.e. for subjective reasons or reasons other than arrears). |
The corporate policy also establishes different treatments that are applicable to forbearance transactions in cases of advanced impairment. The classification requirements and criteria are more stringent for transactions of this kind than for other forbearance transactions.
As regards the strategies to be applied, corporate policy requires the customer’s ability and willingness to pay to be analyzed and a distinction to be drawn between the severity and the estimated duration of the impairment. The results of this analysis will be used as a basis for deciding whether the debt should be forborne and the most appropriate way of doing so for each case:
| 1. | When borrowers display a severe but transitory deterioration in their ability to pay (which is expected to be recovered in a short space of time), short-term adjustment strategies are applied, such as a payment moratorium on the principal or the reduction of instalments for a short, limited period until the ability to pay is recovered. |
| 2. | When borrowers display a slight deterioration in their ability to pay (an early recovery of which is not expected), more long-term strategies are applied, such as reducing instalments by deferring either the maturity date or a portion of the principal, which would be paid at the same time as the last instalment, at all times securing its payment through the provision of effective guarantees. |
In any case, through a case-by-case analysis, priority is given to modifications for customers displaying a slight but prolonged deterioration, since those experiencing severe but transitory deterioration carry a higher risk, as they depend on the accuracy of the estimated time of their future recovery. Cases of severe deterioration deemed to be prolonged over time are not considered for forbearance.
Corporate policy also establishes mechanisms for the management and control of loan forbearance, which allow it to handle forborne transactions in a differentiated way, paying particular attention to the processes of:
270
Moreover, the areas of local resources hold monitoring committeescompliance with the corporate area every month and by country. In February 2011, the anti-fraud corporate committee was created which analyses the situationprojections prepared in the Group and implementsplanning phase.
Once forbearance measures have been adopted, transactions that have to remain classified as impaired because at the corrective measures for its reduction.
Lastly, ACRTO-CIVIR (corporate areadate of technological and operational risk-integral control and internal validation of risk) committees were held every three months. They examined relevant issues of operational risk management and control fromforbearance they do not meet the standpoint of integral control of risk.
Analysis and monitoring of controlsrequirements to be classified in market operations
Due to the specific nature and complexity of financial markets, we consider it necessary to strengthen continuously operational control of this activity, thereby enhancing the very demanding and conservative risk and operating principles that Grupo Santander already regularly applied.
Over and above monitoring all aspects related to operational control, in all the Group’s units the attention paid to the following aspects is reinforced:
Ÿ Review of the valuation models and in general the valuations of portfolios.
Ÿ Processes to capture and independent validation of prices.
Ÿ Adequate confirmation of the transactionsa different category(10) must comply with counterparties.
Ÿ Review of cancellations/modifications of transactions.
Ÿ Review and monitoring of the effectiveness of guarantees, collateral and risk mitigants.
Corporate information
The corporate area of technology and operational risk control has an integral management information system for operational risk, which consolidates every quarter the information available in each country/unit in the sphere of operational risk, so that it has a global view with the following features:
Ÿ Two levels of information: corporate with consolidated information and the other individualized for each country/unit.
Ÿ Dissemination of the best practices between Grupo Santander’s countries/units, obtained through a combined study of the results of qualitative and quantitative analysis of operational risk.
Information on the following points is also prepared:
Ÿ Operational risk management model in Grupo Santander.
Ÿ Perimeter of activity.
Ÿ Analysis of the database of operational losses.
Ÿ Accounting reconciliation.
Ÿ Self-assessment questionnaires.
Ÿ Key indicators.
Ÿ Mitigating/active management measures.
271
Ÿ Business continuity and contingency plans.
Ÿ Regulatory framework: BIS II.
Ÿ Insurance.
This information is the basis for complying with the reporting needs to the risk committee, senior management, regulators, rating agencies, etc.
Insurance in the management of operational risk
We regard insurance as a key element in management of operational risk. The area responsible for operational risk has been closely cooperating with the Group’s insurance area since 2004 in all those activities that entail improvements in both areas. For example:
Ÿ Cooperation in the exposure of the Group’s operational risk control and management model to insurance and reinsurance companies.
Ÿ Analysis and monitoring of recommendations and suggestions to improve operational risks made by insurance companies, via prior audits conducted by specialized companies, as well as their subsequent implementation.
Ÿ Exchange of information generated in both areasprudential payment schedule in order to strengthenassure reasonable certainty as to the qualityrecovery of the data basescustomer’s ability to pay.
If there is any (non-technical) irregularity in payments during that period, the probation period starts again.
On successful completion of errorsthe probation period, the duration of which depends on the customer’s situation and the perimeter of coverage oftransaction features (term and guarantees provided), the insurance policies fortransaction is no longer classified as impaired, but is temporarily classified as substandard until the various operational risks.
Ÿ Close cooperation between local operational risk executives and local coordinators of insurancetransaction becomes fully performing again. Once the transaction has returned to strengthen mitigation of operational risk.
Ÿ Regular meetings on specific activities, states of situation and projects in both areas.
Ÿ Active participation of both areas in global sourcing of insurance, the Group’s maximum technical body for defining coverage strategies and contracting insurance.
Grupo Santander defines reputational risk as that linked to the perception of the bank by its various stakeholders, both internal and external, of its activity, and which could have an adverse impact on results or business development expectations. This risk relates to juridical, economic-financial, ethical, social and environmental aspects, among others.
Various of the Group’s governance structures are involved in reputational risk management, depending on where the risk comes from. The audit and compliance committee helps the board to supervise compliance with the Group’s Code of Conduct in the Securities Markets, the manuals and the procedures to prevent money-laundering and, in general, the Bank’s rules of governance and compliance. It formulates the proposals needed for their improvement.
Management of reputational risk which might arise from an inadequate sale of products or an incorrect provision of services by the Group is conducted in accordance with the corporate policies for reputational risk management derived from the commercialization of products and services.
These policies aim to set a single corporate framework for all countries, all businesses and all entities: (i) strengthening the organizational structures; (ii) ensuring the decision-making committees vouch not only for approval of products and services, but also for monitoring throughout their life; and (iii) establish the guidelines for defining homogeneous criteria and procedures for all the Group for the commercialization of products and services, covering all the phases (admission, pre-sale, sale and post-sale).
The specific developments and adaptations of these policies to local reality and to local regulatory requirements are handled via local internal rules in the Group’s various units, following authorization from the corporate area of compliance and reputational risk.
272
The new version of the Procedures Manual for the Commercialization of Financial Products (the “Manual”) is a specific adaptation of the corporate policies of selling in the Spanish market and to the requirements of local rules (for example, the Markets in Financial Instruments Directive) and, thus, applicable to the parent Bank and to our subsidiaries in Spain as they do not have their own manual.
The Manual covers financial products, ranging from securities and other fixed income and variable financial instruments to money market instruments, participations in collective investment institutions, traded derivatives and OTC and untypical financial contracts. The corporate committee of commercialization can include other products in the Manual’s sphere of procedures.
The reputational risk management that can arise from the inadequate sale of products or an incorrect provision of services by the Group is carried out by the following bodies:
The risk committee (RC)
The board has the responsibility, as part of its supervisory function, to define the Group’s risk policy.
As the maximum body responsible for global management of risk and of all types of banking operations, the committee assesses, with the support of the division of the secretary general, reputational risk in its sphere of activity and decisions.
Corporate committee of commercialization (CCC)
This committee, which is the maximum decision-making body for approving and monitoring products and services, is chaired by the Group’s secretary general and composed of representatives of the divisions of risks, financial management, technology and operations, general secretariat, general intervention and control, internal auditing, Retail Banking, Santander Global Banking & Markets, private banking, asset management and insurance.
The committee pays particular attention to adjusting the product or service to the framework where it is going to be sold and especially to ensuring that:
Each product or service is sold by someone who knows how to sell it.
The customer is given the necessary and adequate information.
The product or service fits the customer’s risk profile.
Each product or service is assigned to the appropriate market, not only for legal or fiscal reasons, but also to meet the market’s financial culture.
When a product or service is approved the maximum limits for placement are set. They meet the requirements of the corporate policies of commercialization and, in general, the applicable internal or external rules.
Local commercialization committees (LCC), in turn, are created, which channel to the CCC new product approval proposals, after issuing a favorable opinion, and approve products that are not new and marketing campaigns.
In the respective approval processes, the marketing committees operate with a risk focus and from the double perspective of bank/customer.
The corporate commercialization committee held 19 meetings in 2011 and analyzed 203 new products/services.
Global consultative committee (GCC)
The global consultative committee (GCC) is the advisory body for the CCC and is composed of representatives of areas that contribute vision of regulatory and market risks. This committee meets every quarter and can recommend the review of products affected by changes, in markets, deterioration of solvency (country, sectors and companies) or by changes in the Group’s vision of markets in the medium and long term.
273
Corporate committee of monitoring (CCM)
A weekly meeting takes place since 2009 to monitor products presided by the secretary general in which internal auditing, legal advice, compliance, customer attention and the affected business areas (with permanent representation of the commercial network) participate. Specific questions related to the commercialization of products and services are raised and resolved.
The CCM held 42 meetings in 2011 where it resolved incidents and analyzed information on the monitoring of products and services, at both the local level of retail banking in Spain as well as at the consolidated Group level.
Corporate office of reputational risk management
Integrated in the corporate area of compliance and reputational risk, this office provides the corresponding bodies of governance with the necessary information to: (i) adequately analyze the risk to be approved, with a two-pronged purpose: impact on the Bank and on the customer; and (ii) monitoring of products throughout their life cycle.
During 2011 the office approved 68 products/services considered as not new and resolved 108 consultations from various areas and countries. The products approved by the office are successive issues of products previously approved by the CCC or the LCC, after having delegated this faculty in this office.
At the local level, reputational risk management offices are created, which are responsible for fostering the culture and ensuring that the functions of approval and monitoring of products are developed in their respective local sphere, in line with the corporate guidelines.
In 2011, the various reputational risk management offices monitored the approved products. The information is coordinated by the corporate office, which reports to the CCM.
274
Part 7. Adjustment to the new regulatory framework
Grupo Santander participated during 2011 in impact studies promoted by the Basel Committee and the European Banking Authority (EBA), and coordinated at the local level by the Bank of Spain to calibrate the new regulations denominated Basel III and whose implementation involves establishing new standards for capital and liquidity, with stricter criteria and standardized at the international level.
Santander has very solid capital ratios, adjusted to the business model and to its risk profile, putting it in a position to comfortably meet Basel III. The impact analysis shows no significant effects on the Group’s high solvency ratios, which benefit from a considerable organic capital generation capacity. The part of the new regulations known as Basel 2.5 referring to the additional requirements for securitizations and market risk, which came into force on December 31, 2011, did not have any significant impact on the Group’s solvency. The new regulations on capital will be gradually implemented between 2013 and 2019.
Grupo Santander has proposed adopting, during the next few years, the advanced internal ratings based (AIRB) models of Basel II for almost all its banks (up to covering more than 90% of net exposure of the credit portfolio under these models). Meeting this objective in the short term will also be conditioned by the acquisition of new entities as well as by the need of coordination between supervisors of the validation processes of internal models. We operate in countries where the legal framework among supervisors is the same as in Europe via the capital directive. However, in other jurisdictions, the same process is subject to the collaboration framework between the supervisor in the home country and that in the host country with different legislations. This means, in practice, adapting to different criteria and calendars in order to attain authorization for the use of advanced models on a consolidated basis.
With this objective, Santander continued during 2011 to gradually install the necessary technology platforms and methodological developments which will make it possible to progressively apply advanced internal models for calculating regulatory capital in the rest of the Group’s units. At the moment, Grupo Santander has the supervisory authorization to use advanced focuses for calculating the regulatory capital requirements by credit risk for the parent Bank and the main subsidiaries in Spain, the UK and Portugal, and certain portfolios in Mexico, Brazil, Chile and Santander Consumer Finance Spain (close to two-thirds of its total exposure at the end of 2011). The strategy of implementing Basel in the Group is focused on achieving the use of advanced models in the main institutions in America and consumer banking in Europe.
As regards the rest of risks explicitly envisaged in Pillar 1 of Basel, in market risk we have authorization to use our internal model for the trading activity of Madrid treasury and during 2010 we obtained authorization for the units in Chile and Portugal, thus continuing the gradual establishment for the rest of the units presented to the Bank of Spain.
In operational risk, we believe that development of the internal model should be largely based on the accumulated experience of the entity via the corporate guidelines and criteria established after assuming their control and which are very much hallmarks of Santander. The Group has made many acquisitions in the last few years that make necessary a longer period of maturity to develop the internal model based on the management experience of the various entities. However, although for the time being Grupo Santander has decided to adhere to the standard approach for calculating regulatory capital, it envisages the possibility of adopting the advanced management approach (AMA) once it has gathered sufficient information on the basis of its own management model in order to strengthen the virtues that characterize the Group.
As regards Pillar II, Grupo Santander uses an economic capital approach to quantify its global risk profile and its solvency position within the process of self-evaluation conducted at the consolidated level (PAC or ICAAP in English). This process, which is supplemented by the qualitative description of the risk management and internal control systems, is revised by the internal audit and internal validation teams, and is subject to a corporate governance framework that concludes with its approval by the board. Furthermore, the board establishes every year the strategic elements regarding risk appetite and solvency objectives. The economic capital model considers features not included in Pillar 1 (concentration, interest rate and business risks). The Group’s diversification compensates the additional capital required for these risks.
275
Grupo Santander, in accordance with the capital requirements set out in the European Directive and the regulations of the Bank of Spain, publishes every year the Report with Prudential Relevance. This report, published for the first time with data at December 31, 2008, clearly shows the transparency requirements requested by the Bank of Spain regarding Pillar III. Grupo Santander regards the requirements of providing the market with information as vital for complementing the minimum capital requirements demanded by Pillar 1, and the supervisory exam process conducted via Pillar II. It is incorporating to its Pillar III report the recommendations of the Committee of European Banking Supervisors (CEBS) in order to become an international benchmark in matters of transparency to the market as already happens in its Annual Report.
As well as the process of implementing the advanced models in various of the Group’s units, Santander is carrying out an ambitious training process on Basel at all levels which is reaching a large number of employees in all areas and divisions, with a particular impact on those most affected by the changes resulting from adopting the new international standards in matters of capital.
Internal validation of internal risk models
As well as a regulatory requirement, internal validation acts as a fundamental support for the risk committee and for the local and corporate risk committees in their responsibilities of authorizing the use (management and regulatory) of models and regular revision.
Internal validation of the models involves a specialized unit of the Bank, with sufficient independence, obtaining a technical opinion on the adequacy of the internal models for the purposes used, whether internal management and/or of a regulatory nature (calculation of regulatory capital, levels of provisions, etc), concluding whether they are robust, useful and effective.
Santander’s internal validation covers both credit risk and market risk models and those that set the prices of financial assets as well as the economic capital model. The scope of validation includes not only the most theoretical or methodological aspects but also the technology systems and the quality of data that make implementation effective and, in general, all relevant aspects for management of risk (controls, reporting, uses, involvement of senior management, etc.).
The function of internal validation is located, at the corporate level, within the area of integral control and internal validation of risk (CIVIR) which reports directly to the Group’s third vice-chairman and chairman of the board’s risk committee. The function is global and corporate in order to ensure homogeneous application. This is done via four regional centers in Madrid, London, Sao Paulo and New York. These centers report to the corporate centre, which ensures uniformity in the development of their activities. This facilitates application of a common methodology supported by a series of tools developed internally in Santander. These provide a robust corporate framework for use in all the Group’s units and which automate certain verifications in order to ensure the reviews are conducted efficiently.
Moreover, Grupo Santander’s corporate framework of internal validation is fully aligned with the criteria for internal validation of advanced models issued by the Bank of Spain. The criterion of separation of functions is maintained between the units of internal validation and internal auditing which, as the last element of control in the Group, is responsible for reviewing the methodology, tools and work done by internal validation and to give its opinion on its degree of effective independence.
276
The concept of economic capital has traditionally been contrasted with that of regulatory capital, as this is the one required for the regulation of solvency. The Basel capital framework clearly brings both concepts together. While Pillar 1 determines the minimum regulatory capital requirements, Pillar II quantifies, via economic capital, the Group’s global solvency position.
The Group’s model of economic capital quantifies the consolidated risk profile taking into account all the significant risks of activity, as well as the diversification effect inherent on a multinational and multi-business group like Santander. This economic capital model serves as the Group’s base for preparing its self-assessment of capital reportperforming, in accordance with Bank of Spain regulations underCircular 6/2012, the Basel II Pillar 2 framework.
The concept of diversification is fundamental for appropriately measuring the risk profile of a global activity group. Although it is an intuitive conceptmonitoring and one present in risk management since banking began, we can also explain diversification as the fact that the correlation between various risks is imperfect and so the largest events of losses do not happen simultaneously in all portfolios or by types of risk. The sum of the economic capital of the different portfolios and types of risk, considered in isolation, is more than the Group’s total economic capital. In other words, the Group’s overall risk is less than the sum of its parts considered separately.
In addition, within the framework of the model for measurement and aggregation of economic capital, the risk of concentration for wholesale portfolios (large companies, banks and sovereigns) is also considered both in its dimension of exposure as well as concentration by sectors and countries. The existence of concentration in a country or a product in retail portfolios is captured by applying an appropriate model of correlations.
The economic capital is also particularly adapted to internal management of the Group, allowing objectives, prices, business viabilities, etc., toforborne transaction continues until a series of requirements have been met, including most notably: a minimum period of two years must have elapsed since commencement of the forbearance; repayment of 20% of the principal and settlement of the amounts that were past due at the time of forbearance.
By contrast, if following arrangement of forbearance there is no improvement in the customer’s payment performance, the possibility of extending new forbearance measures will be assessed and helping to maximizeconsidered, with the Group’s profitability.
Global risk analysis profileapplication of more stringent classification/return-to-performing criteria.
The Group’s risk profileforbearance of a transaction classified as impaired, irrespective of whether, as a result of the forbearance, the transaction becomes current in its payments, does not change the default date considered when the provision was determined. Also, the forbearance of a transaction classified as impaired does not give rise to any release of the related provisions.
Quantitative information required by Bank of Spain Circular 6/2012
Set forth below is the quantitative information required by Bank of Spain Circular 6/2012 on the restructured/refinanced transactions in force at December 31, 2011, measured2013. The following terms are used in Bank of Spain Circular 6/2012 with the meanings specified:
| 10 | Bank of Spain Circular 6/2012: the refinancing or restructuring of transactions that are not current in their payments does not interrupt their arrears, nor does it give rise to their reclassification to one of the previous categories, unless there is reasonable certainty that the customer will be able to meet its payment obligations within the established time frame or new effective collateral is provided, and, in both cases, unless at least the ordinary outstanding interest is received, late-payment interest is not taken into account. |
CURRENT REFINANCING AND RESTRUCTURING BALANCES (a)
| Millions of euros | ||||||||||||||||||||||||||||||||||||||||||||||||||||||||||||||||||||||||||||||||||||||||||||
| Standard (b) | Substandard | Impaired | ||||||||||||||||||||||||||||||||||||||||||||||||||||||||||||||||||||||||||||||||||||||||||
| Full property mortgage guarantee | Other collateral (c) | Without collateral | Full property mortgage guarantee | Other collateral (c) | Without collateral | Full property mortgage guarantee | Other collateral (c) | Without collateral | Total | |||||||||||||||||||||||||||||||||||||||||||||||||||||||||||||||||||||||||||||||||||
| Number of trans- actions | Gross amount | Number of trans- actions | Gross amount | Number of trans- actions | Gross amount | Number of trans- actions | Gross amount | Number of trans- actions | Gross amount | Number of trans- actions | Gross amount | Specific allowance | Number of trans- actions | Gross amount | Number of trans- actions | Gross amount | Number of trans- actions | Gross amount | Specific allowance | Number of trans- actions | Gross amount | Specific allowance | ||||||||||||||||||||||||||||||||||||||||||||||||||||||||||||||||||||||
Public sector | — | — | 7 | 203 | 140 | 391 | — | — | — | — | 5 | 1 | — | 1 | 1 | — | — | 20 | 30 | 7 | 173 | 626 | 7 | |||||||||||||||||||||||||||||||||||||||||||||||||||||||||||||||||||||
Other legal entities and individual entrepreneurs | 7,568 | 3,602 | 3,370 | 1,134 | 61,874 | 3,866 | 8,624 | 4,157 | 827 | 775 | 35,955 | 1,803 | 1,213 | 11,231 | 8,690 | 3,040 | 2,085 | 88,486 | 5,316 | 7,731 | 220,975 | 31,430 | 8,944 | |||||||||||||||||||||||||||||||||||||||||||||||||||||||||||||||||||||
Of which: Financing for construction and property development | 247 | 638 | 41 | 20 | 176 | 19 | 1,674 | 1,327 | 105 | 241 | 816 | 158 | 638 | 3,786 | 4,891 | 103 | 792 | 961 | 1,072 | 3,466 | 7,909 | 9,158 | 4,104 | |||||||||||||||||||||||||||||||||||||||||||||||||||||||||||||||||||||
Other individuals | 66,480 | 5,592 | 11,784 | 513 | 472,908 | 1,389 | 51,344 | 5,139 | 7,207 | 350 | 302,697 | 1,045 | 562 | 46,539 | 4,607 | 23,056 | 742 | 985,793 | 2,170 | 2,334 | 1,967,808 | 21,546 | 2,896 | |||||||||||||||||||||||||||||||||||||||||||||||||||||||||||||||||||||
|
|
|
|
|
|
|
|
|
|
|
|
|
|
|
|
|
|
|
|
|
|
|
|
|
|
|
|
|
|
|
|
|
|
|
|
|
|
|
|
|
|
|
|
|
| |||||||||||||||||||||||||||||||||||||||||||||||
Total | 74,048 | 9,194 | 15,161 | 1,850 | 534,922 | 5,646 | 59,968 | 9,296 | 8,034 | 1,125 | 338,657 | 2,849 | 1,775 | 57,771 | 13,298 | 26,096 | 2,827 | 1,074,299 | 7,516 | 10,072 | 2,188,956 | 53,602 | 11,847 | |||||||||||||||||||||||||||||||||||||||||||||||||||||||||||||||||||||
|
|
|
|
|
|
|
|
|
|
|
|
|
|
|
|
|
|
|
|
|
|
|
|
|
|
|
|
|
|
|
|
|
|
|
|
|
|
|
|
|
|
|
|
|
| |||||||||||||||||||||||||||||||||||||||||||||||
| (a) | Including all refinanced or restructured transactions as defined in section 1.g) of Annex IX of Bank of Spain Circular 4/2004 |
| (b) | Standard risks classified as under special monitoring pursuant to section 7.a) of Annex IX of Bank of Spain Circular 4/2004 |
| (c) | Including transactions without a full property mortgage guarantee, i.e. with a loan-to-value ratio of more than 1, and transactions with collateral other than a real estate mortgage, irrespective of their loan-to-value ratio |
The transactions presented in the foregoing tables were classified at December 31, 2013, by typesnature, as follows:
The table below shows the changes in 2013 in the forborne loan portfolio:
| Millions of euros | 2013 | |||
|
| 55,714 | ||
| 37,497 | |||
| 18,217 | |||
Additions | 17,241 | |||
Reductions (*) | (19,353 | ) | ||
Balance at end of year | 53,602 | |||
Of which: Other than impaired | 29,961 | |||
Impaired assets | 23,641 | |||
| (*) | Including, mainly, debt repayments, foreclosures and write-offs and transactions that have ceased to be subject to special monitoring because the aforementioned requirements have been met. |
The distributionlevel of economic capital amongforbearance at the main business units reflectsGroup fell by 3.8% year-on-year as a result of the diversificationrecovery effort, the exchange rate effect and the deleveraging of the real estate industry in Spain. The specific allowance of the total forborne loan portfolio increased by 5 percentage points to 22%.
56% of the forborne loan transactions are classified as other than impaired. Particularly noteworthy is the high level of existing guarantees (70% of transactions are secured by collateral) and the adequate coverage provided by specific allowances (43% specific coverage ratio for the impaired portfolio).
Spain accounts for 60% (€32,271 million) of the Group’s activityforborne loan portfolio, down €596 million year-on-year. The detail of the forborne loan portfolio in Spain by purpose is as follows:
In none of the acquisition of SEB’s businessother geographical regions in Germany,which the acquisition of Bank Zachodni WBK in Poland and, to a lesser extent,Group is present does the partial sale of insurance businesses in Latin America.
Continental Europe accounts for almost 40%forborne loan portfolio represent more than 1% of the Group’s capital, Latin America including Brazil (21%) more than one-third, the UK 10%, and Sovereign 6%, while the corporate area of financial management and equity stakes, which assumes the risk from the structural exchange-rate position (derived from stakes in subsidiaries abroad denominated in non-euro currencies) and most of the equity stakes, accounts for 11%.
277
The economic capital at December 31, 2011 was €45,838 million, including non-controlling interests.
The benefit of diversification envisaged in the economic capital model, including both the intra-risks (assimilated to geographic) as well as inter-risks, amounted to around 22% at the end of 2011.
The Group also conducts capital planning with the main objective of obtaining future projections of economic and regulatory capital and so be able to assess situations of capital sufficiency in various scenarios. Each scenario incorporates the forecasts of results in a consistent way, both with their strategic objectives (organic growth, M&A, pay-out ratio, etc) as well as with the evolution of the economic situation and in the face of stress situations. Possible capital management strategies are identified that enable the Bank’s solvency situation to be optimized as well as the return on capital.
Return on risk adjusted capital (RORAC) and creation of value
Grupo Santander has been using RORAC methodology in its credit risk management since 1993 in order to:
• Calculate the consumption of economic capital and the return on it of the Group’s business units, as well as segments, portfolios and customers, in order to facilitate optimum assigning of economic capital.
• Budget the capital consumption and RORAC of the Group’s business units, including them in the compensation plans for their personnel.
• Analyze and set prices during the decision-taking process for operations (admission) and clients (monitoring).
RORAC methodology enables one to compare, on a like-for-like basis, the return on operations, customers, portfolios and businesses, identifying those that obtain a risk adjusted return higher than the cost of the Group’s capital, aligning risk and business management with the intention of maximizing the creation of value, the ultimate aim of the Group’s senior management.
The Group regularly assesses the level and evolution of value creation (VC) and the risk adjusted return (RORAC) of its main business units. The VC is the profit generated above the cost of the economic capital (EC) employed, and is calculated as follows:
Value creation = Profit – (average EC x cost of capital)
The economic profit is obtained by making the necessary adjustments to attributable profit so as to extract just the recurrent profit that each unit generates in the year of its activity.
The minimum return on capital that an transaction must attain is determined by the cost of capital, which is the minimum required by shareholders. It is calculated objectively by adding to the free return of risk the premium that shareholders demand to invest in our Group. This premium depends essentially on the degree of volatility in the price of the Banco Santander share in relation to the market’s performance. The cost of capital in 2011 applied to the Group’s various units was 13.86%.
A positive return from an transaction or portfolio means it is contributing to the Group’s profits, but it is not really creating shareholder value unless that return exceeds the cost of capital.
278
The performance of the business units in 2011 in value creation varied, declining in Europe while remaining at a similar level in America. The creation of value and the RORAC for the Group’s main business areas are shown below:
| Main segments | ||||||||
| Million euros | ||||||||
| RORAC (%) | Creation of value | |||||||
Continental Europe | 16.2 | 437 | ||||||
UK | 23.0 | 456 | ||||||
Brazil | 31.1 | 1,751 | ||||||
Rest of Latin America | 37.2 | 1,410 | ||||||
Sovereign | 18.3 | 128 | ||||||
Subtotal of operating areas | 23.7 | 4,181 | ||||||
Financial management and equity stakes | -37.9 | -3,001 | ||||||
Group total | 16.3 | 1,181 | ||||||
The Group’s RORAC exceeded the cost of capital estimated for 2011 and stood at 16.3%. The creation of value (i.e. the economic profit less the average cost of capital used to achieve it) amounted to €1,181 million.
279
Part 9.6. Market Risk training activities
Santander
| A. | Activities subject to market risk and types of market risk |
The market risk area has a corporate school of risks. Its purpose is to help to consolidate the risk management culture in Santander and ensure that all employees in the risk division are trained and developed with the same criteria.
The school, which gave a total of 31,028 hours of training to 6,195 employees in 2011 in 125 activities, is the base for strengthening Santander’s leadership in this sphere and continuously enhancing the skills of its staff.
It also trains staff from other business segments, particularly in the retail banking area, and aligns the requirements of risk management with business goals.
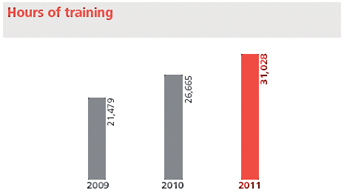
Generally
The perimeter for measuring, controlling and monitoring the area of Market Risksthat covers those transactions where equity risk is assumed.assumed as a result of changes in market factors. This risk comes from the change in risk factors –- interest rates, inflation rates, exchange rates, securities,share prices, the credit spread raw materialon loans, commodities prices and the volatility of each of these elements –- as well as the liquidity risk of the various products and markets in which the Group operates.
We
All these market risks can be partly or fully mitigated by using options, futures, forwards and swaps.
There are other types of market risk, whose coverage is more complex. They are the following:
On the basis of the origin of the risk, activities are segmented in the following activities:way:
| (a) | Trading. This includes financial services to customers and purchase-sale and positioning mainly in fixed income, equity and currency products. |
| (b) | Structural risks. Market risks inherent in the balance sheet excluding the trading portfolio. They are: |
Trading with financial instruments, which involveStructural interest rate foreign exchange rate, equity price, commodity pricerisk. This arises from mismatches in the maturities and volatility risks.
Engaging in retail banking activities, which involve interestStructural exchange rate risk/hedging of results. Exchange rate risk since a changeoccurs when the currency in interest rates affects interest income, interest expense and customer behavior. This interest rate risk ariseswhich the investment is made is different from the gap (maturityeuro in companies that consolidate and reprising) between assets and liabilities.
Investing in assets (including subsidiaries) whose returns or accounts are denominatedthose that do not (structural exchange rate). In addition, exchange rate hedging of future results generated in currencies other than the euro which involves foreign exchange rate risk between the Euro and such other currencies.
InvestingStructural equity risk. This involves investments via stakes in subsidiaries and otherfinancial or non-financial companies which subject us tothat are not consolidated, as well as portfolios available for sale formed by equity price risk; andpositions.
Trading and non-trading activities which entail liquidity risk.
Primary Market Risks and How They Arise
The primary market risks to which we are exposed are interest rate risk, foreign exchange rate risk, equity price risk, volatility risk and liquidity risk. We are exposed to interest rate risk whenever thereglobal wholesale banking division is a mismatch between interest rate sensitive assets and liabilities, subject to any hedging with interest rate swaps or other off-balance sheet derivative instruments. Interest rate risk arises in connection with both our trading and non-trading activities.
280
We are exposed to foreign exchange rate risk as a result of mismatches between assets and liabilities, and off-balance sheet items denominated in different currencies, either as a resultmainly responsible for managing the taking of trading or in the normal course of business. We maintain non-trading open currencyactivity positions, arising from our investments in overseas subsidiaries, affiliates and their currency funding. The principal non-trading currency exposures are the euro to the US dollar and the British pound and the euro to the main Latin American currencies. Trading foreign exchange rate open risk is not material compared to non-trading foreign exchange risk.
We are exposed to equity price risk in connection with both our trading and non-trading investments in equity securities.
We are also exposed to liquidity risk. Market depth is the main liquidity driver in our trading portfolio, even though our policy is to trade the most liquid assets. Our liquidity risk also arises in non-trading activity due to the maturity gap between assets and liabilities in the retail banking business.
We use derivatives for both trading and non-trading activities. Trading derivatives are used to eliminate, to reduce or to modify risk in trading portfolios (interest rate, foreign exchange and equity), and to provide financial services to clients. Our principal counterparties for this activity are financial institutions. The principal types of derivatives used are: interest rate swaps, future rate agreements, interest rate options and futures, foreign exchange forwards, foreign exchange futures, foreign exchange options, foreign exchange swaps, cross currency swaps, equity index futures and equity options.
Derivatives are also used in non-trading activity in order to develop the activity of clients in financial markets and to a much lesser extent take its own positions.
The financial management area is responsible for implementing the management strategy for structural risks, applying standardized methodologies adapted to each market where the Group operates, either directly in the case of the parent Bank or in coordination with the rest of units. The management decisions for these risks are taken by each country’s ALCO (ALM) committee in coordination with the Group’s markets committee. The aim is to inject stability and recurrence into the net interest margin of commercial activity and the Group’s economic value, while maintaining adequate levels of liquidity and solvency.
Each of these activities is measured and analyzed with different metrics in order to show their risk profile in the most precise way.
| B. | Management framework |
| 1. | Organizational and governance structure |
The market and structural risks area is integrated into one of the Group’s two general risk directorates. The missions of the market risk function are:
These missions rest on five basic pillars, vital for correct management of market risks:
In turn, market risks management is guided by the following basic principles:
In the same way that the market risks function is structured at the corporate or global level, each local market risk unit has and foreign exchange non-optional derivatives are usedarranges its functions, with the adjustments that arise in non-trading activity.accordance with its specific business, operational and legal requirement features, etc.
We also use credit derivatives both to hedge credit risk in fixed income portfolios
For the correct functioning of global policies and to provide financial services to clients. To a lesser extent, they are used in proprietary trading and to diversifylocal execution, the global credit portfolio. Mostarea of market risks and local units carry out different functions:
Global market risk:
Local market risk units:
The committees, by hierarchical order, which have powers in decision-making, control and monitoring of market risks are set out above below.
COMMITTEES WITH RESPONSIBILITIES IN MARKET RISK:
Sphere | Hierarchical level | Name | ||
| CENTRALISED SPHERE | Executive | Executive Committee | ||
- Markets Committee | ||||
| Risks Committee | ||||
| Risks division | Risks Management Committee | |||
| Global Committee of the Directorate General of Risks | ||||
| Permanent Committee of Risks | ||||
| Corporate Committee of Risks Brazil | ||||
| Areas and departments dependent on the Risk Division | Global Market Risks Committee | |||
| Underwriting and Structured Products Committee | ||||
| Models Committee | ||||
| DECENTRALISED SPHERE | Units | Risks Committee in the Banks of the Group/Countries | ||
| Risks Committee of Branches Abroad | ||||
| Risks Committee in Business Units | ||||
| Local ALCOs | ||||
| Other committees |
The collegiate body of the market risks area is made in credit default swaps on individual names or indices.
Procedures for Measuring and Managing Market Risk
Our board, through itsthe global market risk committee (GMRC). This committee is responsible for establishing our policies, proceduresthe functioning of market risk in Grupo Santander, both at the centralized level (global areas) and local level (local units). It gets its powers directly from the risk committee, the maximum body responsible for the risks function in Grupo Santander.
| 2. | System for controlling limits |
Setting market risk and liquidity limits with respectis designed as a dynamic process which responds to the Group’s risk appetite level. This process is part of the annual limits plan, which is drawn up by the Group’s senior management and administered by the general directorate of risks in a way that involves all the Group’s institutions.
Definition of limits
The market risk limits used in Grupo Santander are established on different metrics and try to cover all activity subject to market risks, including which businessesrisk from many perspectives, applying a conservative criterion. The main ones are:
Trading limits:
Structural interest rate risk of the balance sheet:
Structural exchange rate risk:
These general limits are complemented by sub-limits. In this way, the market risk area has a structure of limits sufficiently granular to conduct an effective control of the various types of market risk factors on which an exposure is maintained. Positions are tracked daily, both of each unit as well as globally. An exhaustive control is made of the changes in the portfolios, in order to detect possible incidents for their immediate correction. Meanwhile, the daily drawing up of the income statement by the market risks assumed. Togetherarea is an excellent indicator of risks, as it allows the impact that changes in financial variables have had on portfolios to be identified.
Structure of limits
The table below shows the levels of applying limits, the categories and the sphere of control in which they are classified and their levels of approval.
STRUCTURE OF LIMITS:
STRUCTURE OF LIMITS | ||||
Levels | Category/Control | Approval | ||
| Global/Global control | Risk Committee | |||
| Activity / Unity | Global/Local control | Global Market Risk Committee | ||
| Local/Local control | Local market risks | |||
These limits are requested by the relevant business executive in each country/entity on the basis of the nature of the business and the budget established, seeking consistency between limits and the return/risk ratio.
Compliance and control of limits
Business units must comply with the approved limits. The possible excesses trigger a series of actions by the local and global assets and liabilities committees (“ALCO”), each Market Risk Unit measures and monitors our market risks, and provides figures to ALCO to use in managing such risks, as well as liquidity risk.
Our market risk policy is to maintain a medium to low risk profile in business units. The risk activity is regulated and controlled through certain policies, documented in the Corporate Framework on Market Risk Management7 (and through a limit structure on our exposure to these market and liquidity risks which includes global limits for the entire Group (total risk limit unit) to specific portfolio limits; in addition, authorized products are listed and reviewed periodically.
These policies, procedures and limits on market risk are applicable to all units, businesses or portfolios susceptible to market risk.
1. Market and Liquidity Risk Management Policies
In the Corporate Framework on Market Risk, there is a compilation of policies that describe the control framework used by our Group to identify, measure and manage market risk exposures inherent to our activities in the financial markets. The handbook is employed for marketareas, risk management purposes at all involved levels incommittees or the Parent bank and subsidiaries, providing a general and global action framework and establishing risk rules for all levels.
The handbook’s main objective is to describe and report all risk policies and controls that our board of directors has established as well as its risk appetite.
|
281
All Group managers must ensure that each business activity is performed in accordance with the policies established in the Corporate Framework. The handbook is applied to all business units and activities, directly or indirectly, related to market risk decision-making.
2. Market Risk Management Procedures
All the functions developed by a risk manager are documented and regulated by different procedures, including measurement, control and reporting responsibilities. Internal and external auditors audit the compliance with this internal regulation controlrisks committee in order to ensure that our market risk policies are being followed.
3. Market Risk Limit Structure
The market risk limit structure can be defined as the board of director’s risk “appetite” and is managed by the Global Market Risk Function that accounts for all Group business units.
Its main functions are to:
Identify and define the main types of risk incurred efficiently and comprehensively to be consistent with the management and strategy of the business.
Quantify and inform the business areas ofreduce the risk levels and profile that senior management believescontrol them more strictly or executive actions, which can be assumed, in order to avoid undesired risks.make the risk takers reduce the risks levels assumed.
Give flexibilityThe local executives for market risk notify the excesses to the business areasexecutives. These have to build risk positions efficientlyexplain the reasons for the excess and, where appropriate, provide the plan of action to correct the situation. The business executive must respond, in writing and on a timely basis accordingthe day, to changesthe requirement made. The alternatives are to reduce the position to the prevailing limits or set out the strategy that justifies an increase in the market and inlimits.
If the business strategies, and always within the risk levels regarded as acceptableexcess situation continues without a response by the Group.
Allow the generators of business to take prudent risks which are sufficient to attain budgeted results.
Establish investment alternatives by limiting equity consumption.
Define the range of products and underlying assets with which each unit of treasury can operate, taking into consideration features such as the model and valuation systems, the liquidity of the tools used, etc. This will help to constrain all market risk within the business management and defined risk strategy.
The Global Market Risk Function defines the limit structure while the risk committee reviews and approves it. Business managers then administer their activities within these limits. The limit structure covers both our trading and non-trading portfolios and it includes limits on fixed income instruments, equity securities, foreign exchange and other derivative instruments.
Limits considered to be global limits refer to the business unit level. Localfor three days, the market risks area contacts the relevant global business managers set lower level limits, such as portfolio or trader limits. To date, system restrictions prevent intra-day limits.
Business units must always comply with approved limits. Potential excessesexecutives and informs them of this, and requests adjustment measures be taken. If this situation persists 10 days after the first excess, the market risks area will requirecontact senior risk management so that a range of actions carried out by the Global Market Risk Function unit including:decision can be taken.
| C. | Statistical Tools for Measuring and Managing Market Risk |
Providing risk reducing levels suggestions and controls. These actions are the result of breaking “alarm” limits.
Taking executive actions that require risk takers to close out positions to reduce risk levels.
Statistical Tools for Measuring and Managing Market Risk
1. Trading activity
The trading portfolio is defined as proprietary positions in financial instruments held for resale and/or bought to take advantage of current and/or expected differences between purchase and sale prices. These portfolios also include positions in financial instruments deriving from market-making, sale and brokering activity.
| 1.1. | Value At Risk (VaR) |
282
As a result ofThe standard methodology that Grupo Santander applied to trading fixed income securities, equity securities and foreign exchange, we are exposed to interest rate, equity price and foreign exchange rate risks. We are also exposed to volatility when derivatives (options) are used.
Market risk arising from proprietary trading and market-making activities is actively managed through the use of cash and derivative financial instruments traded in OTC and organized markets.
Interest rate risk derived from market-making is typically hedged by buying or selling very liquid cash securities such as government bonds, or futures contracts listed in organized markets like Liffe, Eurex, Meff and CBOT.
Foreign exchange rate risk is managed through spot transactions executed in the global foreign exchange inter-bank market, as well as through forward foreign exchange, cross currency swaps and foreign exchange options.
Equity price risk is hedged by buying or selling the underlying individual stocks in the organized equity markets in which they are traded or futures contracts on individual stocks listed in organized markets like Meff and Liffe.
In the case of equity indexes such as S&P 500, Euro STOXX 50, or IBEX 35, the hedging is done through futures contracts listed in the aforementioned organized markets.
Volatility risk arising from market-making in options and option-related products is hedged by, either buying and selling option contracts listed in organized markets like Eurex, Meff, and CBOT, or entering risk reversal transactions in the inter-bank OTC market.
Credit risk is managed through the use of credit derivatives.
We useduring 2013 was Value at Risk (“VaR”) to measure our market risk associated with all our trading activity.
1.1 VaR Model
We use a variety of mathematical and statistical models, including VaR models, historical simulations, stress testing and evaluations of Return on Risk Adjusted Capital (“RORAC”) to measure, monitor, report and manage market risk. We call our VaR figures daily or annual “capital at risk” figures, depending on their time horizon, since we use them to allocate economic capital to various activities in order to evaluate the RORAC of such activities.
(VaR). As calculated by us, VaR is an estimate of the expected maximum loss in the market value of a given portfolio over a one-day time horizon at a 99% confidence interval. It is the maximum one-day loss that we estimate we would suffer on a given portfolio 99% of the time, subject to certain assumptions and limitations discussed below. Conversely, it is the figure that we would expect to exceed only 1% of the time, or approximately two or three days per year. VaR provides a single estimate of market risk that is comparable among different portfolios or instruments.
The number of expected “exceptions” is an average number. Over a long period of time we would expect an average of two or three exceptions per year; however, there may be some years or periods where there are fewer exceptions than expected, as was the case in 2009 and 2010 when there were no exceptions, and other periods where there are more exceptions than expected. In 2011,For example in 2012 there were three exceptions to VaR at 99% (i.e. days when the daily loss was higher than VaR): August 4 and August 8, which can be explained mainly by the sharp increase in credit spreads, the sudden fall of the stock markets2013 there were two exceptions (see more details in section Quantitative analysis: 1.5. Gauging and the depreciation of most currencies against the dollar due to the worsening of the sovereign debt crisis in the Eurozone and to increased fears of a major slowdown in the global economy; and September 12, due to the significant increase in credit spreads, mainly spreads relating to financial sector entities and to Greece.contrasting measures).
The standard methodology used is based on historical simulation (520 days). In order to capture recent market volatility in the model, the reported VaR is the maximum between two different VaR figures, both of which use a historical window of two years (one applies an exponential decline factor which gives a higher weight to the observations closer in time and another gives the same weight to all the observations). This methodology makes our VaR numbers react very quickly to changes in current volatility, significantly reducing the likelihood of backtesting exceptions. In addition, backtesting exceptions in 2010 were further reduced as a consequence of inclusion of the 2008 financial crisis in the historical series used for calculating the VaR.
We use VaR estimates to alert senior management whenever the statistically estimated losses in our portfolios exceed prudent levels. Limits on VaR are used to control exposure on a portfolio-by-portfolio basis. VaR is also used to calculate the RORAC for a particular activity in order to make risk-adjusted performance evaluations.
283
Finally, in order to control derivative activities and credit management, because of their atypical nature, specific measures are evaluated daily. First, we look at the sensitivity to price movements of the underlying asset (delta and gamma), volatility (vega) and time (theta) and then measures are enacted such as the spread sensitivity, jump-to-default, and concentration of positions by rating levels.
To address the credit risk inherent in trading portfolios in accord with the recommendations of the Basel Committee on Banking Supervision and prevailing regulations, an additional measurement began to be calculated (incremental risk charge, IRC), in order to cover the risk of default that is not adequately captured in the VaR, via changes in lending spreads. The instruments affected are basically fixed-rate bonds, both public and private sector, derivatives on bonds (forwards, options, etc) and credit derivatives (credit default swaps, asset backed securities, etc.). The method for calculating the IRC, in essence similar to that of the credit risk of positions outside trading, is based on direct measurements of the tails of the distribution of losses to the appropriate percentile (99.9%) and uses Monte Carlo methodology (applying a million simulations).
1.2 Assumptions and Limitations
Our VaR methodology should be interpreted in light of the limitations of our model, which include:
A one-day time horizon may not fully capture the market risk of positions that cannot be liquidated or hedged within one day.
At present, we compute VaR at the close of business and trading positions may change substantially during the course of the trading day.
1.3
| 1.2. | Scenario Analysis and Calibration Measures |
The VaR is not the only measurement. It is used because of its calculation simplicity and Calibration Measuresfor being a good benchmark of the Group’s risk level, but other measures are also employed which allow for greater control of risks in all the markets where the Group operates.
BecauseAmong these measures is analysis of scenarios, which consists of defining alternatives for the performance of different financial variables and obtain the impact on results by applying them to activities. These scenarios can replicate events that happened in the past (crisis) or determine possible alternatives that do not correspond to past events.
The potential impact on results of applying different stress scenarios to all the trading portfolios and considering the same suppositions by risk factor is calculated and analyzed at least monthly. Three types of scenario are defined: possible, severe and extreme, obtaining along with the VaR a fuller spectrum of the risk profile.
In addition, levels of warning (triggers) are set for global scenarios, on the basis of the historic results of these limitationsscenarios and of the capital associated with the portfolio in VaR methodology, in addition to historical simulation, we use stress testing to analyzequestion. In the impactevent of extreme market movements and to adopt policies and procedures in an effort to protect our capital andsurpassing these levels, those responsible for management of the portfolio are informed so they can take the necessary measures. At the same time, the results of operation against such contingencies.the stress exercises at the global level, as well as the possible breaching of the levels set, are regularly reviewed by the global committee of market risks so that, if required, senior management is informed.
In order to calibrate our VaR model, we use back testing processes. Back testing (BT) is a comparative analysis between VaR estimates and the daily clean P&L (i.e. real profit or loss obtained at the end of the day on the portfolio analyzed at the end of the preceding day valued at the following day prices). The purpose of these tests is to verify and measure the precision of the models used to calculate VaR.
Santander performs regular back-testing (BT)BT processes to calibrate and improve its VaR model. Back-testing is conducted based on several approaches: by unit (Madrid, Brazil, Mexico, etc.), by main portfolio/strategy (proprietary trading, market making rates, market making equity, etc.), and by type of profit & loss source. Three kinds of back-testing are conducted: “clean P&L” (which allows us to monitor market risk), “clean P&L” calculated with front platforms such as Murex (which allows us to monitor risks associated with our treasury positions) and “dirty P&L” (which includes commissions, mark ups and intraday trading results). The aim of the latter is to capture indirectly the importance of intra-day activity.
Whenever an anomaly is detected, we undertake a detailed examination of elements (such as “pricers”, inputs and configuration, among others, in order to correct such anomaly. Detailed results of our BT are regularly reported to Bank of Spain.
The analyses of our back testingBT comply, at a minimum, with the BIS recommendations regarding the verification of the internal systems used to measure and manage market risks.
Besides the ongoing and regular calibration of our VaR methodology, there were no significant changes during the periods presented nor are any such changes contemplated at this time.
The market risk area, in line with the principle of independence of the business units, monitors the positions daily, both those of each unit as well as globally, and conducts an exhaustive control of the changes in the portfolios in order to detect possible incidents so that they can be corrected immediately. The positions are traditionally used to quantify the net volume of the market values of the transactions in portfolio, grouped by main risk factor, and considering the delta value of the futures and options that could exist. All the risk positions can be expressed in the base currency of the unit and in the currency of homogenizing information. The market risk sensitivity measures are those that gauge the change (sensitivity) of the market value of an instrument or portfolio to changes in each of the risk factors. The sensitivity of the value of an instrument to changes in market factors can be obtained through analytical approximations by partial derivatives or through a full revaluation of the portfolio. The daily drawing up of the income statement is also an excellent indicator of risks, as it enables the impact that changes in financial variables have on portfolios to be identified. Control of derivative activities and credit management should also be mentioned. This control, because of its atypical nature, is conducted daily according to specific measures. In the case of derivative activities, sensitivity to the price movements of the underlying asset (delta and gamma), volatility (vega) and time (theta) is controlled. In the case of credit management, measures such as the spread sensitivity, jump-to-default, and concentration of positions by rating levels, etc., are systematically reviewed. Regarding the credit risk inherent in trading portfolios and in line with the recommendations of the Basel Committee on Banking Supervision and prevailing regulations, an additional measurement began to be calculated (incremental risk charge, IRC), in order to cover the risk of default and rating migration that is not adequately captured in the VaR, via changes in credit spreads. The controlled products are basically fixed-rate bonds, both public and private sector, derivatives on bonds (forwards, options, etc.) and credit derivatives (credit default swaps, asset-backed securities, etc.). The method for calculating the IRC is based on direct measurements of the tails of the distribution of losses to the appropriate percentile (99.9%). The Monte Carlo methodology is used, applying one million simulations. As well as the usual VaR, Santander began to calculate stressed VaR every day, as of October 2011, for the main portfolios. The methodology for calculation is the same as that used for the VaR, with the following two exceptions: All the other aspects regarding the methodology and the inputs for calculating the stressed VaR are the same as those for the VaR. As regards determining the period of observation, for each relevant portfolio, the methodology area has analyzed the history of a subseries of market risk factors that were chosen on the basis of expert criteria taking into account the most relevant positions of the books.1.3. Analysis of positions, sensitivities and results 1.4. Credit management activity 1.5. Other measures: stressed VaR (sVaR) and expected shortfall Historic period of observation of factors: the stressed VaR uses a window of 250 figures, instead of one of 520 for the VaR.The maximum between the percentile uniformly weighted and the one exponentially weighted applied when calculating the VaR is not applied to obtain the stressed VaR. Instead, the percentile uniformly weighted is used directly.
Moreover, the expected shortfall (ES) has begun to be calculated in order to estimate the expected value of the potential loss when this is higher than the level set by the VaR. The ES, unlike the VaR, has the advantage of capturing better the tail risk and of being a subadditive metric13. With regard to the near future, the Basel Committee recommends replacing VaR with the expected shortfall as the reference metric for calculating the regulatory capital of the trading portfolios14.The committee believes that the confidence level of 97.5% is a risk level similar to that which VaR captures with a confidence level of 99%.
| 1.6. | CVA and DVA |
Grupo Santander incorporates credit valuation adjustment (CVA) and debt valuation adjustment (DVA) in the calculation of the results of trading portfolios. The credit valuation adjustment (CVA) is a valuation adjustment of over-the-counter (OTC) derivatives, as a result of the risk associated with the credit exposure assumed by each counterparty.
The CVA is calculated taking into account the potential exposure with each counterparty in each future maturity. The CVA for a certain counterparty would be equal to the sum of the CVA for all maturities. It is calculated on the basis of the following inputs:
The debt valuation adjustment (DVA) is a valuation adjustment similar to the CVA, but in this case as a result of Grupo Santander’s risk that counterparties assume in the OTC derivatives
2. Non Trading activityStructural market risks
2.1 Foreign Exchange Risk and Equity Price Risk
Due to its nature, changes in strategic positions have to be approved by local/global functions in ALCO committee. Position limits with respect to these investments are established, although they will be measured under VaR and other methods that attempt to implement immediate action plans if a particular loss level is reached.
284
The Group’s foreign exchange rate risk with respect to our non-trading activity can be either permanent or temporary. The permanent risk reflects the book value of investments net of the initial goodwill, while the temporary risk basically stems from purchase/sale transactions made to hedge the exchange rate risk derived from dividend flows and expected results. The exchange rate differences generated for each position are recorded in reserves and in profit and loss account, respectively.
In order to manage the exchange rate risk of the book value of permanent investments, our general policy is to finance the investment in local currency, provided there is a deep market which allows it and that the cost of doing so is justified by the expected depreciation. If local markets were not deep enough, our investments in foreign currency would be financed in euros and so would generate an exchange-rate risk. Certain one-time hedges of permanent investments are made when it is believed that a local currency could weaken against the euro more quickly than the market is discounting. In addition, transactions are carried out to hedge the currency risk of the Group’s results and dividends in Latin America.
2.2 Interest Rate Risk
| 2.1 | Structural interest rate risk |
The Group analyzesanalyses the sensitivity of net interest margin and market value of equity value to changes in interest rates. This sensitivity arises from gaps in maturity dates and the review of interest rates in the different asset and liability items.
On the basis of the positioning of balance sheet interest rates, as well as the situation and outlook for the market, the financial measures are agreed to adjust the positioning to that desired by the Group.Bank. These measures range from taking positions in markets to defining the interest rate features of commercial products. The Group manages total risk by determining a target range for each sensitivity and providing the appropriate hedge (mainly with government debt, interest rate swaps and interest rate options) in order to maintain these sensitivities within that range.
The metrics used by the Group to control structural interest rate risk arein these activities are: the interest rate gap, the sensitivitiessensitivity of net interest margin and marketof equity value to changes in interest rates, VaR and analysisrate levels, Value at Risk (VaR), for the purposes of scenarios.calculating economic capital.
a) Interest rate gap of assets and liabilities
Interest rate gap analysis focuses on lags or mismatches between changes in the value of asset, liability and off-balance sheet items. Gap analysisIt provides a basic representation of the balance sheet structure and allows for the detection of interest rate risk by concentration of maturities. It is also a useful tool for estimating the impact of eventual interest rate movements on net interest margin or equity.equity value.
| 13 | The sub-additive metric is one of the desirable properties which, according to French literature, should present a coherent risk metric. This property establishes that f (a+b) be lower or equal to f(a)+f(b). Intuitively, it supposes that the more instruments or risk factors there are, the less risky a portfolio due to the benefits of diversification. VaR does not meet this property for certain distributions, while the ES always does. |
| 14 | Fundamental review of the trading book: a revised market risk framework (consultative documents of the Basel Committee on banking supervision, October 2013) |
All on- and off-balance sheet items must be broken downdisaggregated by their flows and analyzedlooked at in terms of reprising and repricing/maturity. In the case of those items that do not have a contractual maturity, an internal model of analysis is used and estimates are made of theirthe duration and sensitivity.sensitivity of them.
b) Net interest margin sensitivity (NIM)
The sensitivity of net interest margin measures the change in the short/medium term in the accruals expected over a particular period (12 months), in response to a shift in the yield curve.
It is calculated by simulating the net interest margin, both for a scenario of a shift in the yield curve as well as for the current scenario.situation. The sensitivity is the difference between the two margins calculated.
c) Market value of equity sensitivity (MVE)
Net worthThe sensitivity measures in the long term (the whole life of the operation) the interest risk implicit in net worth (equity) on the basis of the effect that a change in interest rates has on the current values of financial assets and liabilities. Thisequity value is an additional measure to the sensitivity of the net interest margin.
d) It measures the interest risk implicit in the equity value on the basis of the impact of a change in interest rates on the current values of financial assets and liabilities.
Treatment of liabilities without defined maturity
In the corporate model, the total volume of the balances of accounts without maturity is divided between stable and unstable balances.
The separation between the stable and unstable balances is obtained from a model that is based on the relation between balances and their own moving averages.
From this simplified model the monthly cash flows are obtained and used to calculate the NIM and MVE sensitivities.
The model requires a variety of inputs:
Pre-payment treatment for certain assets
The pre-payment issue mainly affects fixed-rate mortgages in units where the relevant interest rate curves for the balance sheet (specifically for the portfolio of investment in fixed rate mortgages) are at low levels. In these units the risk is modelized and some changes can also be made to assets without defined maturity (credit card businesses and similar).
The usual techniques used to value options cannot be applied directly because of the complexity of the factors that determine the pre-payment of borrowers. As a result, the models for assessing options must be combined with empirical statistical models which seek to capture the prepayment performance. Some of the factors are:
a) Age: defines low rates of pre-payment.
b) Cash pooling: defines as more stable those loans that have already overcome various waves of interest rate falls. In other words, when a portfolio of loans has passed one or more cycles of downward rates and thus high levels of pre-payment, the “surviving” loans have a significantly lower pre-payment probability.
c) Others: geographic mobility, demographic, social, available income factors, etc.
The series of econometric relations that seek to capture the impact of all these factors is the probability of pre-payment of a loan or pool of loans and is denominated the pre-payment model.
Value at Risk (VaR)
The Value at Risk for balance sheet activity and investment portfolios is calculated with the same standard as for trading, historicaltrading: maximum expected loss under historic simulation with a confidence level of 99% and a time frame of one day. As for the trading portfolios, a time frame of two years, or 520 daily figures, is used, obtained from the reference date of the VaR calculation back in time.
| 2.2 | Structural exchange rate risk/hedging of results |
285
e) Analysis of scenarios
Two scenarios for the performance of interest ratesThese activities are established: maximum volatilitymonitored via position measurements, VaR and sudden crisis. These scenarios are applied to the balance sheet, obtaining the impactresults, on net worth as well as the projections of net interest revenue for the year.
2.3 Liquidity risk
Liquidity risk is associated with our capacity to finance our commitments, at reasonable market prices, as well as to carry out our business plans with stable sources of funding. The Group permanently monitors maximum gap profiles.
The Group has a diversified portfolio of assets that are liquid or can be made so in the short term. It also has an active presence in a wide and diversified series of financing and securitization markets, limiting its dependence on specific markets and keeping open the capacity of recourse to alternative markets.
The measures used for liquidity risk control in balance sheet management are the liquidity gap, liquidity ratios, stress scenarios and contingency plans.
a) Liquidity gap
The liquidity gap provides information on contractual and expected cash inflows and outflows for a certain period of time, for each of the currencies in which we operate. The gap measures the net need or net excess of funds at a particular date, and reflects the level of liquidity maintained under normal market conditions.
b) Liquidity ratios
The liquidity coefficient compares liquid assets available for sale (after applying the relevant discounts and adjustments) with total liabilities to be settled, including contingencies. This coefficient shows, for currencies that cannot be consolidated, the level of immediate response to firm commitments.
Net accumulated illiquidity is defined as the 30-day accumulated gap obtained from the modified liquidity gap. The modified contractual liquidity gap is drawn up on the basis of the contractual liquidity gap and placing liquid assets or repos at the point of settlement and not at their point of maturity. This indicator is calculated for each of the main currencies.
In addition, we use the following other ratios or metrics to monitor the structural liquidity position:
Loans / net assets
Customer deposits, insurance and medium and long-term financing / lending
Customer deposits, insurance and medium and long-term financing, shareholders’ funds and other liabilities / sum of credits and fixed assets
Short-term financing / net liabilities
Survival horizon
c) Analysis of scenarios/Contingency Plan
Our liquidity management focuses on preventing a crisis. Liquidity crises, and their immediate causes, cannot always be predicted. Consequently, the Group’s contingency plans concentrate on creating models of potential crises by analyzing different scenarios, identifying crisis types, internal and external communications and individual responsibilities.
The contingency plan covers the sphere of activity of a local unit and of central headquarters. It specifies clear lines of communication at the first sign of crisis and suggests a wide range of responses to different levels of crisis.
286
As a crisis can occur locally or globally, each local unit must prepare a contingency financing plan and must inform the headquarters in Madrid of its plan at least every six months so that it can be reviewed and updated. These plans, however, must be updated more frequently if market circumstances make it advisable.
Lastly, Grupo Santander is actively participating in the process opened by the Basel Committee to strengthen bank liquidity8, with a two-pronged approach: participating in the analysis of the impact of the regulatory changes raised —including, the introduction of two new ratios: Liquidity Coverage Ratio (LCR) and Net Stable Funding Ratio (NSFR) – and, participating in various forums (European Banking Federation, etc.), to discuss and comment on the issue, maintaining in both cases close co-operation with the Bank of Spain.
Quantitative analysis
A. Trading activity
Quantitative analysis of daily VaR in 2011
The Group’s risk performance with regard to trading activity in financial markets during 2011, as measured by daily Value at Risk “VaR”, is shown in the following graph.
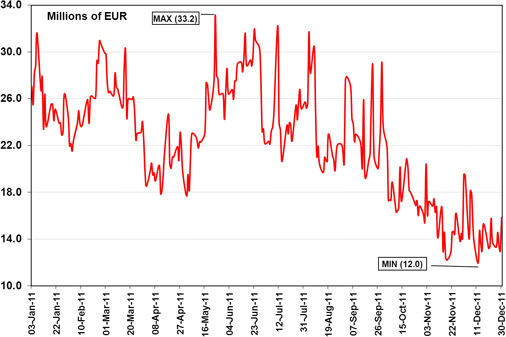
VaR during 2011 fluctuated between €12.0 million and €33.2 million. It rose as of the end of April to a maximum for the year of €33.2 million on May 24, due to an increase in interest rate and exchange rate risk in Spain and Brazil. The increase in VaR during the first half of July was due to the rise in exchange rate risk and volatility in Brazil. As of then, dynamic management of portfolios, together with a reduction in exchange rate and interest rate risk in the treasuries of Madrid and Brazil, produced a downward path until the end of the year.basis.
2.3 | Structural equity risk |
These activities are monitored via position measurements, VaR and results, on a monthly basis.
| D. | Quantitative analysis |
1. Trading activity15
| 1.1. | Value at Risk (VaR) analysis |
Grupo Santander maintained its strategy of concentrating its trading activity in customer business, minimizing where possible exposures of directional risk opened in net terms.
This was reflected in the VaR16 evolution, which was around the average of the last three years.
| 15 | Trading activity in financial markets |
| 16 | The definition and methodology for |
EVOLUTION OF VaR 2011-2013
287Millions of euros. VaR at 99%, with a time frame of one day
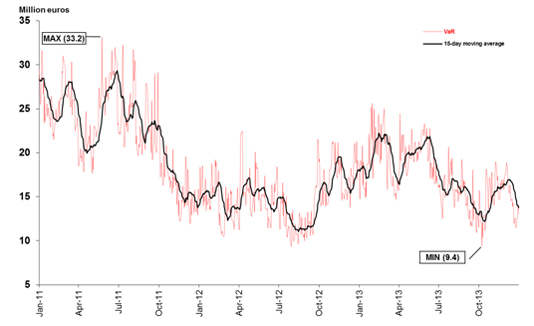
VaR during 2013 fluctuated between €9.4 million and €25.6 million. The VaR reported as of November 15, 2011 excludes the risk frommain increases were linked to changes in exposure to exchange rates in the Brazilian Treasury and to interest rates and credit spreads of securitizations and portfolios affected by credit correlation. For regulatory reasons (BIS 2.5), these exposures are considered as banking book for capital purposes. This change caused a decline in risk in VaR terms, both at the total level as well as by credit spread.Spain’s Treasury.
The average VaR of the Group’s trading portfolio in 20112013 was €17.4 million, similar to the two previous years (€22.4 million) was lower thanmillion in 2010 (€28.7 million), even though volatility remained high2011 and €14.9million in markets because2012) for the reason already mentioned of Europe’s sovereign debt crisis. Meanwhile,the concentration of activity in customers. In relation to other comparable financial groups, the Group has a low risk trading risk profile. Dynamic management of risk enables the Group to adopt changes of strategy in order to exploit opportunities in an environment of uncertainty.
The histogram below shows the distribution of average risk in terms of VaR during 2011. It was between €16.52011 and 2013 where the accumulation of days with levels between €10.5 million and €30.5€26.5 million on 81.9% of days.can be seen (91.5%). The values greater than €30.5above €26.5 million (3.5%(6.9%) were concentrated in the central monthsperiods mainly caused by one-off rises of the year, mainly due to the increased volatility in the Brazilian realcurrency and by the Eurozone’seuro zone’s sovereign debt crisis.
VaR RISK HISTOGRAM
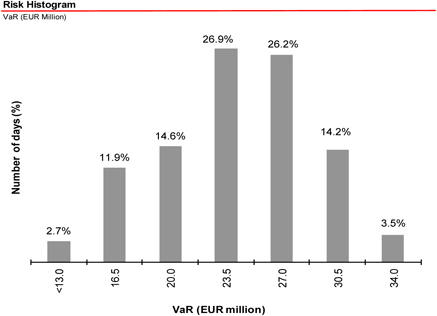
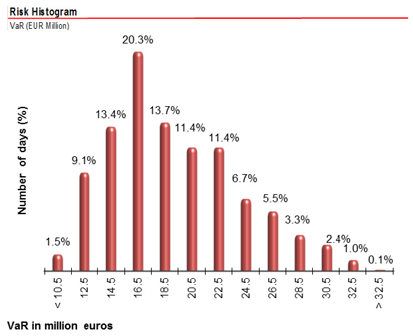
The average and year-end values in VaR statisticsterms at 99% for the last three years as well as their minimum and maximum values and the expected shortfall (ES) at 97.5%17 in 2013 were as follows:
VaR STATISTICS BY RISK FACTOR18,19
Millions of euros. VaR at 99%, with a time frame of one day
| 2013 | 2012 | 2011 | ||||||||||||||||||||||||||||||||||||
| VaR (99%) | ES (97.5%) | VaR | VaR | |||||||||||||||||||||||||||||||||||
| Min | Average | Max | Year-End | Year-End | Average | Year-End | Average | Year-End | ||||||||||||||||||||||||||||||
Total Trading | Total VaR | 9.4 | 17.4 | 25.6 | 13.1 | 13.4 | 14.9 | 18.5 | 22.4 | 15.9 | ||||||||||||||||||||||||||||
Diversification effect | (9.6 | ) | (16.2 | ) | (34.7 | ) | (12.3 | ) | (12.3 | ) | (15.2 | ) | (13.5 | ) | (21.8 | ) | (16.7 | ) | ||||||||||||||||||||
Interest Rate VaR | 8.1 | 12.7 | 21.3 | 8.5 | 8.4 | 11.8 | 12.0 | 14.8 | 14.6 | |||||||||||||||||||||||||||||
Equity VaR | 2.1 | 5.6 | 11.7 | 4.7 | 4.5 | 7.0 | 7.1 | 4.8 | 3.7 | |||||||||||||||||||||||||||||
FX VaR | 1.6 | 5.4 | 14.5 | 4.7 | 4.8 | 5.0 | 3.5 | 9.0 | 4.2 | |||||||||||||||||||||||||||||
Credit Spread VaR | 6.1 | 9.6 | 16.4 | 7.2 | 7.5 | 6.1 | 9.1 | 15.0 | 9.6 | |||||||||||||||||||||||||||||
Commodities VaR | 0.1 | 0.3 | 0.7 | 0.3 | 0.4 | 0.4 | 0.3 | 0.6 | 0.4 | |||||||||||||||||||||||||||||
EUROPE | Total VaR | 8.2 | 13.9 | 21.6 | 9.9 | 9.7 | 11.0 | 16.4 | 15.5 | 10.1 | ||||||||||||||||||||||||||||
Diversification effect | (7.6 | ) | (14.1 | ) | (26.8 | ) | (9.0 | ) | (9.6 | ) | (12.9 | ) | (9.9 | ) | (15.1 | ) | (13.0 | ) | ||||||||||||||||||||
Interest Rate VaR | 6.1 | 9.3 | 18.5 | 6.6 | 6.4 | 7.9 | 6.8 | 11.5 | 11.9 | |||||||||||||||||||||||||||||
Equity VaR | 1.6 | 4.3 | 9.2 | 2.6 | 2.5 | 6.2 | 6.3 | 3.9 | 3.6 | |||||||||||||||||||||||||||||
FX VaR | 1.4 | 5.2 | 14.2 | 3.7 | 4.0 | 4.1 | 4.0 | 8.5 | 3.9 | |||||||||||||||||||||||||||||
Credit Spread VaR | 4.2 | 9.0 | 15.1 | 5.8 | 6.0 | 5.4 | 8.9 | 6.0 | 3.3 | |||||||||||||||||||||||||||||
Commodities VaR | 0.1 | 0.3 | 0.7 | 0.3 | 0.4 | 0.4 | 0.3 | 0.6 | 0.4 | |||||||||||||||||||||||||||||
LATIN AMERICA | Total VaR | 3.9 | 11.1 | 24.1 | 6.9 | 7.4 | 10.1 | 8.9 | 11.7 | 10.7 | ||||||||||||||||||||||||||||
Diversification effect | (1.2 | ) | (5.3 | ) | (16.1 | ) | (6.7 | ) | (7.4 | ) | (6.4 | ) | (3.8 | ) | (6.4 | ) | (8.7 | ) | ||||||||||||||||||||
Interest Rate VaR | 3.6 | 9.6 | 22.1 | 5.9 | 7.4 | 8.8 | 8.8 | 11.2 | 10.5 | |||||||||||||||||||||||||||||
Equity VaR | 0.8 | 3.2 | 8.1 | 2.9 | 2.8 | 3.1 | 1.6 | 3.5 | 2.2 | |||||||||||||||||||||||||||||
FX VaR | 0.7 | 3.5 | 11.7 | 4.7 | 4.6 | 3.1 | 1.3 | 3.7 | 1.2 | |||||||||||||||||||||||||||||
USA & ASIA | Total VaR | 0.4 | 0.8 | 1.7 | 0.5 | 0.5 | 0.9 | 0.8 | 1.2 | 0.9 | ||||||||||||||||||||||||||||
Diversification effect | 0.0 | (0.4 | ) | (1.1 | ) | (0.2 | ) | (0.2 | ) | (0.5 | ) | (0.3 | ) | (0.5 | ) | (0.4 | ) | |||||||||||||||||||||
Interest Rate VaR | 0.3 | 0.7 | 1.5 | 0.5 | 0.5 | 0.7 | 0.6 | 0.9 | 0.9 | |||||||||||||||||||||||||||||
Equity VaR | 0.0 | 0.1 | 1.8 | 0.0 | 0.0 | 0.2 | 0.1 | 0.1 | 0.1 | |||||||||||||||||||||||||||||
FX VaR | 0.1 | 0.4 | 1.2 | 0.2 | 0.2 | 0.6 | 0.4 | 0.6 | 0.4 | |||||||||||||||||||||||||||||
| GLOBAL ACTIVITIES | Total VaR | 0.9 | 1.5 | 2.3 | 2.0 | 2.0 | 2.7 | 1.2 | 10.5 | 9.7 | ||||||||||||||||||||||||||||
Diversification effect | (0.1 | ) | (0.3 | ) | (0.8 | ) | (0.5 | ) | (0.4 | ) | (0.6 | ) | (0.3 | ) | (1.1 | ) | (0.9 | ) | ||||||||||||||||||||
Interest Rate VaR | 0.2 | 0.3 | 0.6 | 0.4 | 0.4 | 0.3 | 0.2 | 0.4 | 0.5 | |||||||||||||||||||||||||||||
Credit Spread VaR | 0.9 | 1.5 | 2.3 | 2.1 | 2.0 | 2.6 | 1.3 | 10.3 | 8.4 | |||||||||||||||||||||||||||||
FX VaR | 0.0 | 0.1 | 0.1 | 0.0 | 0.0 | 0.4 | 0.1 | 0.9 | 1.8 | |||||||||||||||||||||||||||||
For the first time another risk metric is shown, the expected shortfall. Its proximity to VaR shows that the probability of high losses due to tail risk is not high, at least bearing in mind the historic window of the last two years.
The average VaR increased a little in 2013 by €2.5 million, although if compared with the year-end figures VaR declined by €5.4 million. By risk factor,9 the average VaR increased in interest rates, credit spreads and exchange rates, and declined in equities and commodities. By geographic zone, it rose in Europe and Latin America and dropped in the United States and Asia and global activities.
Item Other measures: Stressed VaR (SVaR) and expected shortfall (ES) sets out the definition of this metric. Following the recommendation of the Basel Committee in its Fundamental review of the trading book: A revised market risk framework (October 2013), the confidence level of 97.5% means approximately a risk level similar to that which the VaR captures with a 99% confidence level |
| 18 | The VaR of global activities includes operations that are not assigned to any particular |
| 19 | In Latin America, the U.S. and |
VaR BY RISK FACTOR.
288
The minimum, maximum, average and year-end risk values inMillions of euros, VaR terms during 2011 were as follows:
| Minimum | Average | Maximum | Year-end | |||||||||||||||
TOTAL TRADING | Total VaR | 12.0 | 22.4 | 33.2 | 15.9 | |||||||||||||
|
|
|
|
|
|
|
| |||||||||||
Diversification effect | (12.2 | ) | (21.8 | ) | (34.7 | ) | (16.7 | ) | ||||||||||
|
|
|
|
|
|
|
| |||||||||||
Interest Rate VaR | 8.6 | 14.8 | 21.8 | 14.6 | ||||||||||||||
Equity VaR | 2.2 | 4.8 | 22.7 | 3.7 | ||||||||||||||
FX VaR | 1.3 | 9.0 | 24.1 | 4.2 | ||||||||||||||
Credit Spread VaR | 6.7 | 15.0 | 23.0 | 9.6 | ||||||||||||||
Commodities VaR | 0.2 | 0.6 | 3.9 | 0.4 | ||||||||||||||
LATIN AMERICA | Total VaR | 4.9 | 11.7 | 23.7 | 10.7 | |||||||||||||
|
|
|
|
|
|
|
| |||||||||||
Diversification effect | (2.4 | ) | (6.4 | ) | (12.5 | ) | (8.7 | ) | ||||||||||
|
|
|
|
|
|
|
| |||||||||||
Interest Rate VaR | 5.3 | 11.2 | 18.5 | 10.5 | ||||||||||||||
Equity VaR | 1.3 | 3.5 | 9.6 | 2.2 | ||||||||||||||
FX VaR | 0.6 | 3.7 | 19.2 | 1.2 | ||||||||||||||
USA & ASIA | Total VaR | 0.6 | 1.2 | 3.0 | 0.9 | |||||||||||||
|
|
|
|
|
|
|
| |||||||||||
Diversification effect | (0.1 | ) | (0.5 | ) | (2.4 | ) | (0.4 | ) | ||||||||||
|
|
|
|
|
|
|
| |||||||||||
Interest Rate VaR | 0.5 | 0.9 | 2.2 | 0.9 | ||||||||||||||
Equity VaR | 0.0 | 0.1 | 2.9 | 0.1 | ||||||||||||||
FX VaR | 0.2 | 0.6 | 1.7 | 0.4 | ||||||||||||||
EUROPE | Total VaR | 8.3 | 15.5 | 24.7 | 10.1 | |||||||||||||
|
|
|
|
|
|
|
| |||||||||||
Diversification effect | (8.2 | ) | (15.1 | ) | (25.0 | ) | (13.0 | ) | ||||||||||
|
|
|
|
|
|
|
| |||||||||||
Interest Rate VaR | 5.9 | 11.5 | 18.9 | 11.9 | ||||||||||||||
Equity VaR | 1.5 | 3.9 | 17.4 | 3.6 | ||||||||||||||
FX VaR | 0.9 | 8.5 | 15.2 | 3.9 | ||||||||||||||
Credit Spread VaR | 2.7 | 6.0 | 11.4 | 3.3 | ||||||||||||||
Commodities VaR | 0.2 | 0.6 | 3.9 | 0.4 | ||||||||||||||
GLOBAL ACTIVITIES | Total VaR | 6.5 | 10.5 | 15.9 | 9.7 | |||||||||||||
|
|
|
|
|
|
|
| |||||||||||
Diversification effect | 0.5 | (1.1 | ) | (4.1 | ) | (0.9 | ) | |||||||||||
|
|
|
|
|
|
|
| |||||||||||
Interest Rate VaR | 0.3 | 0.4 | 0.7 | 0.5 | ||||||||||||||
Credit Spread VaR | 6.0 | 10.3 | 17.0 | 8.4 | ||||||||||||||
FX VaR | 0.0 | 0.9 | 2.3 | 1.8 | ||||||||||||||
EUR million | ||||||||||||||||||
In Latin America, the US and Asia, the credit spread VaR and the commodities VaR are not shown separately becauseat 99% with a time frame of their scant or zero materiality.
The average VaR was €6.3 million lower than in 2010. The reduction was in all risk factors, particularly in the credit spread and equities, whose VaR dropped from €20.9 million and €8.0 million to €15 million and €4.8 million, respectively.
The evolution of VaR during 2011 highlighted the Group’s flexibility and agility in adapting its risk profile on the basis of changes in strategy caused by a perception different to that of expectations in the markets.
289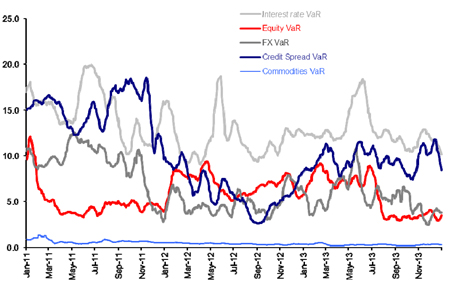
Daily VaR: PerformanceThe VaR evolution by Risk Factor
(€ million)
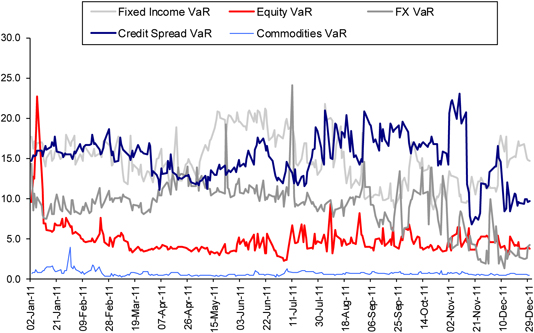
Of note were the transitory balancesrisk factor in VaR by exchange rate, caused by the significant changesgeneral also declined, with peaks and troughs sharper in the positions opened in foreign currencies. The drop incase of the VaR by credit spread, aspartly due to the exclusion of November 15 is explained by the aforementioned exclusion from the risk spread of securitizations and thecredit correlation of credit which underby BIS 2.5 areis considered as banking book for the purposes of regulatory capital.capital as of November 15, 2011. The temporary changes in the VaR of various factors was due more to the temporary rises in the volatility of market prices than to significant changes in positions.
Lastly, the table below compares the VaR figures20 with stressed VaR figures for trading activity in Spain and Brazil, whose treasuries were those that experienced the Group’s largest average VaR in 2013. In Spain, unlike Brazil, the fact that the stressed VaR (with window of historic crisis) does not significantly exceed the VaR (with window of the two last years) indicates that the portfolio has not been significantly exposed to events not covered in the most recent past.
STRESSED VAR STATISTICS VERSUS VAR IN 2013: TREASURIES IN SPAIN AND BRAZIL Million of euros. Stressed VaR and VaR at 99% with time frame of one day
| 2013 | ||||||||||||||||||
| Min | Average | Max | Year-End | |||||||||||||||
Spain | VaR (99%) | 5.4 | 10.7 | 19.3 | 6.0 | |||||||||||||
Stressed VaR (99%) | 7.4 | 12.2 | 22.2 | 14.8 | ||||||||||||||
Brazil | VaR (99%) | 5.0 | 9.1 | 22.6 | 5.3 | |||||||||||||
Stressed VaR (99%) | 5.1 | 17.2 | 48.3 | 12.1 | ||||||||||||||
| 20 | Description in Other measures: Stressed VaR (SVaR) and expected shortfall (ES) |
1.2.Distribution of risks and management results21
Geographic distribution
In trading activity, the average contribution of Latin America contributed on average 28.3% ofto the Group’s total VaR in trading activity and 34.5%2013 was 38.5% compared with a contribution of 35.6% in economic results. Europe, with 49.2%60.7% of global risk, contributed 70.8%58.1% of results, as mostresults. In relation to prior years, there was a gradual homogenization in the profile of its treasury activity in the Group’s different units, focused generally on providing service to professional and institutional clients. Global activities,
Below is the geographic contribution (by percentage), both in risks, measured in VaR terms, as well as in results (economic terms).
VaR BINOMIAL-MANAGEMENT RESULTS: GEOGRAPHIC DISTRIBUTION
Average VaR (at 99%, with 22.2%a time frame of the Group’s total VaR, contributed a negative 6.3% in economic results, hit by the Eurozone’s sovereign debt crisisone day) and the general rise in financial credit and corporate spreads.
290
Geographic distribution of risks and economic results (% )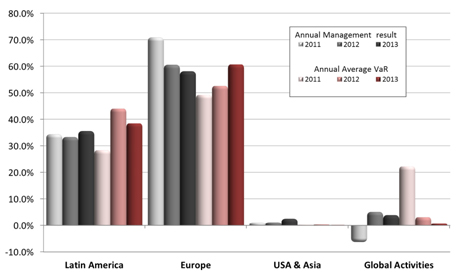
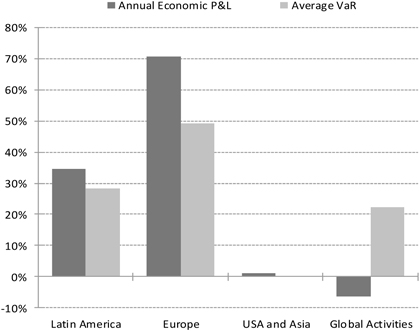
The next chart shows the risk assumption profile, in terms of VaR, Monthly distribution of risks and resultsas opposedcompared to results.results in 2013. The average VaR remained relatively stable, until September and then declined,although on a downward path to some extent, while results evolved in a more irregular way during the year. The first monthsJanuary and July were positive until Marchmonths and thenNovember negative, until November when they were wellwith results below the annual average due to the worseningaverage.21 Results in terms that can be assimilated to the gross margin (excluding operating costs, financial ones are the only cost).
DISTRIBUTION OF RISK BY TIME AND RESULTS IN 2013: PERCENTAGES OF ANNUAL TOTALS
Average VaR (at 99%, with a time frame of the Eurozone’s sovereign debt crisis.one day) and annual accumulated management result (millions of euros)
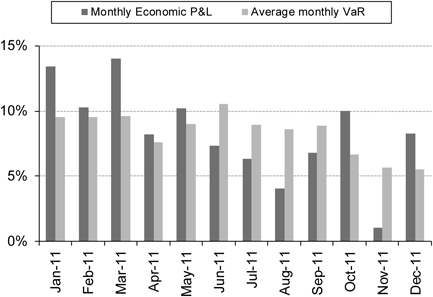
291
Histogram of daily Marked-to-Market (“MtM”) results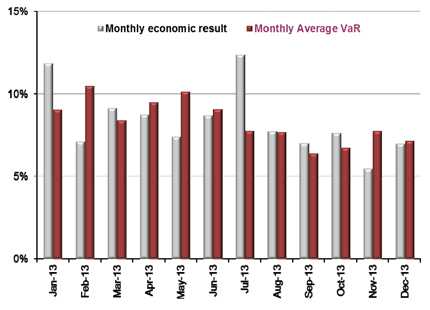
The following histogram of frequencies shows the distribution of daily economic results on the basis of their size.size between 2011 and 2013. The daily yield22 was between -€515 and +€15 million on 70%more than 95% of days when the market was open.
HISTOGRAM OF THE FREQUENCY OF DAILY RESULTS (MTM)
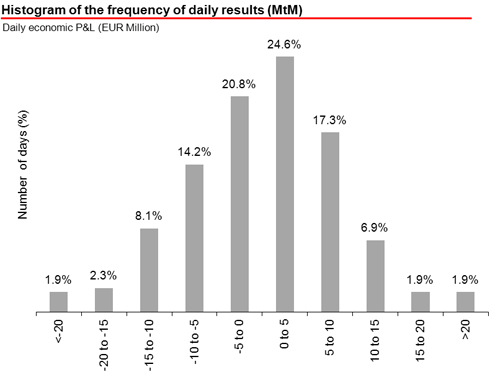
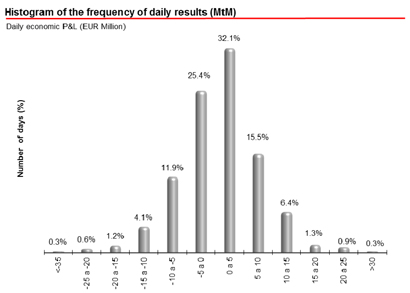
| 22 | Yields “clean” of commissions and results of intraday derivative operations |
1.3.Risk management of structuredfinancial derivatives market
The Group’s structuredFinancial derivatives activity is mainly focused on designing investment products and hedging riskrisks for clients. Management is focused on ensuring that the net risk opened is the lowest possible. These transactions include options on equities, currenciesfixed-income and interestexchange rates.
The units where this activity mainly takes place are: Madrid, Banesto,Spain, Santander U.K., and, to a lesser extent, Brazil and Mexico.
The chart below shows the VaR Vega23 performance of structured derivatives business over the last three years. It fluctuated at around an average of €6.5 million. The periods with higher VaR levels related to events of significant rises in volatility in the markets. The evolution of VaR Vega in the second quarter of 2013 is the result of the increased volatility of euro and U.S. dollar interest rate curves, coinciding with a strategy of hedging client operations of significant amounts.
EVOLUTION OF RISK (VaR) OF THE BUSINESS OF FINANCIAL DERIVATIVES
Million euros. VaR Vega at 99%, with a time frame of one day.
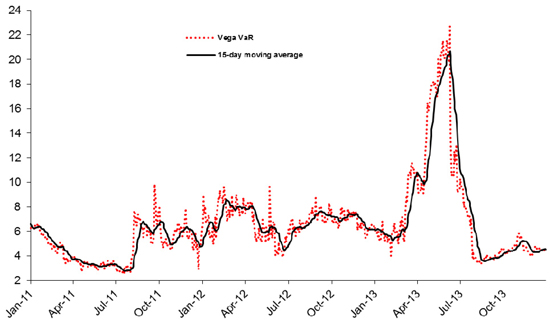
As regards the VaR by risk factor, on average, the exposure was concentrated, in this order: interest rates, equities, exchange rates and commodities. This is shown in the table below:
STRUCTURED DERIVATIVES. RISK (VaR) BY RISK FACTOR
Millions of euros. VaR at 99%, with a time frame of one day
| 2013 | 2012 | 2011 | ||||||||||||||||||||||||||||||
| Minimum | Average | Maximum | Year-end | Average | Year-end | Average | Year-end | |||||||||||||||||||||||||
Total VaR Vega | 3.4 | 8.0 | 22.7 | 4.5 | 6.8 | 6.5 | 4.7 | 4.9 | ||||||||||||||||||||||||
Diversification impact | 2.8 | (3.8 | ) | (7.0 | ) | (2.7 | ) | (3.0 | ) | (3.4 | ) | (2.9 | ) | (3.7 | ) | |||||||||||||||||
Interest rate VaR | 1.4 | 6.6 | 22.7 | 4.1 | 2.3 | 2.8 | 2.0 | 2.0 | ||||||||||||||||||||||||
Equity VaR | 1.5 | 3.4 | 7.2 | 1.8 | 6.5 | 5.5 | 4.1 | 5.2 | ||||||||||||||||||||||||
FX VaR | 0.2 | 1.7 | 5.0 | 1.3 | 0.7 | 1.3 | 1.2 | 1.0 | ||||||||||||||||||||||||
Commodities VaR | 0.0 | 0.1 | 0.2 | 0.1 | 0.3 | 0.2 | 0.3 | 0.4 | ||||||||||||||||||||||||
| 23 | Vega, a Greek term, means here the sensitivity of the value of a portfolio to changes in the price of market volatility. |
As regards the distribution by business unit, the exposure is concentrated, in this order: Spain, Santander UK, Brazil and Mexico.
STRUCTURED DERIVATIVES. RISK (VaR) BY UNIT
Millions of euros. VaR at 99%, with a time frame of one day
| 2013 | 2012 | 2011 | ||||||||||||||||||||||||||||||
| Minimum | Average | Maximum | Year-end | Average | Year-end | Average | Year-end | |||||||||||||||||||||||||
Total VaR Vega | 3.4 | 8.0 | 22.7 | 4.5 | 6.8 | 6.5 | 4.7 | 4.9 | ||||||||||||||||||||||||
Spain | 2.0 | 7.0 | 22.3 | 3.8 | 5.9 | 5.4 | 4.0 | 3.7 | ||||||||||||||||||||||||
Santander U.K. | 1.5 | 2.2 | 3.6 | 1.6 | 2.8 | 2.0 | 1.4 | 2.7 | ||||||||||||||||||||||||
Brazil | 0.8 | 1.2 | 2.8 | 0.9 | 1.0 | 2.8 | 0.8 | 0.3 | ||||||||||||||||||||||||
Mexico | 0.8 | 1.2 | 1.5 | 1.2 | 0.7 | 0.6 | 1.2 | 1.1 | ||||||||||||||||||||||||
The average risk in 20112013 (€4.78 million) was lowermore than in 2010 (€7.9 million),the combined average of the last three years, due to the declineincrease in the second quarter of 2013.
Grupo Santander continues to have a very limited exposure openedto instruments or complex structured vehicles, reflecting a management culture of prudence in risk management. At the end of 2013, the Group had:
| • | Monolines: Santander’s exposure to bond insurance companies (monolines) was €141 million24 at the end of 2013, mainly indirect exposure (€138 million) by virtue of the guarantee provided by this type of entity to various financing or traditional securitization operations. The exposure in this case is double default, as the primary underlying assets are of high credit quality. The small remaining amount is direct exposure (for example, via purchase of protection from the risk of non-payment by any of these insurance companies through a credit default swap). The exposure was 7% lower than in 2012. In short, the exposure to this type of instrument, which is a result of the Group’s usual operations, continued to decline in 2013. This was mainly due to the integration of positions of institutions acquired by the Group, such as Alliance & Leicester and Santander Bank (in 2008 and 2009, respectively). All these positions were known at the time of purchase, having been duly provisioned. These positions, since their integration in the Group, have been notably reduced, with the ultimate goal of eliminating them from the balance sheet. |
Santander’s policy for approving new transactions related to these products remains very prudent and conservative. It is subject to strict supervision by the Group’s senior management. Before approving a new transaction, product or underlying asset, the risks division verifies:
And provided these two points are always met:
| 24 | Guarantees provided by monolines for bonds issued by U.S. states (municipal bonds) are not considered as exposure. They amounted to €566 million at the end of 2013. |
1.4.Issuer risk in trading portfolios
Trading activity in credit risk is mainly conducted in Treasury in Spain. It is done by taking positions in bonds and credit default swaps (CDS) at different maturities on corporate and financial instruments linked to volatility.references, as well as indexes (Itraxx, CDX).
Regarding VaR by risk factor,The table below shows the exposure, on average, was concentratedlargest positions at the end of the year, distinguishing between long positions (bond purchase or protection sale via CDS and short positions (bond sale or purchase protection via CDS):
Largest “long” positions (protection sale) | Largest “short” positions (purchase protection) | |||||||||||||||||
| Exposure at default (EaD) | % of total EaD | Exposure at default (EaD) | % of total EaD | |||||||||||||||
1st reference | 118 | 3.8 | % | 1st reference | -65 | 6.7 | % | |||||||||||
2nd reference | 112 | 3.6 | % | 2nd reference | -45 | 4.7 | % | |||||||||||
3rd reference | 94 | 3.0 | % | 3rd reference | -44 | 4.6 | % | |||||||||||
4TH reference | 92 | 3.0 | % | 4TH reference | -29 | 3.0 | % | |||||||||||
5th reference | 84 | 2.7 | % | 5th reference | -29 | 3.0 | % | |||||||||||
|
|
|
|
|
|
|
| |||||||||||
Sub-total top 5 | 500 | 16.1 | % | Sub-total top 5 | -212 | 22.0 | % | |||||||||||
|
|
|
|
|
|
|
| |||||||||||
Top 5 subtotal | 3,103 | 100.0 | % | Total | -965 | 100.0 | % | |||||||||||
|
|
|
|
|
|
|
| |||||||||||
Million euros. Note: zero recoveries are supposed (LCR=0) in equities, followed by interest rates, exchange ratesthe EaD calculation
1.5.Gauging and commodities.
Test and calibrationcontrasting measures
In accordance with2013, the BIS recommendations for gaugingGroup continued to regularly conduct analysis and monitoringcontrasting tests on the effectiveness of internalthe Value at Risk (VaR) calculation model, obtaining the same conclusions that enable us to verify the model’s reliability. The objective of these tests is to determine whether it is possible to accept or reject the model used to estimate the maximum loss of a portfolio for a certain level of confidence and a specific time frame.
The most important test is backtesting, analyzed at the local and global levels by the market risk measurementcontrol units. The methodology of backtesting is implemented in the same way for all the Group’s portfolios and management systems,sub-portfolios.
Backtesting consists of comparing the forecast VaR measurements, with a certain level of confidence and time frame, with the real results of losses obtained in 2011 we carried out regular analysesa same time frame.
Santander calculates and contrasting measures which confirmedevaluates three types of backtesting:
In 2011
For the first case and the total portfolio, there were threetwo exceptions toin 2013 of VaR at 99% (i.e. days(days when the daily loss was higher than the VaR): August 4May 31 - concentrated in Brazil due to a more than usually high rise in the Brazilian currency curves, both nominal as well as inflation-indexed (IPCA) - and August 8, which can be explained mainly by the sharp increaseJuly 11 - concentrated in credit spreads, the sudden fallSpain due movements in curves and their greater than usual volatility, and Brazil, because of the stock markets and the depreciation of most currenciescurrency’s significant appreciation against the dollar duedollar.
The number of exceptions responded to the worseningexpected performance of the sovereign debt crisisVaR calculation model, which works with a confidence level of 99% and an analysis period of one year (over a longer period of time, an average of two or three exceptions a year is expected).
The backtesting exercises are regularly conducted for each relevant portfolio or strategy of the Group, and its main objective (as in the Eurozone andrest of contrasting tests) is to increased fears of a major slowdowndetect anomalies in the global economy; and September 12, due to the significant increase in credit spreads, mainly spreads relating to financial sector entities and to Greece,. The aforementhioned exceptions are shownVaR model of each portfolio (for example, shortcomings in the following graph:parameterization of the valuation models of certain instruments, inappropriate proxies, etc.). This is a dynamic process contextualized in the framework of the procedure for reviewing and validating the model.
BACKTESTING OF BUSINESS PORTFOLIOS: DAILY RESULTS VERSUS PREVIOUS DAY’S VALUE AT RISK
(Millions of euros)
292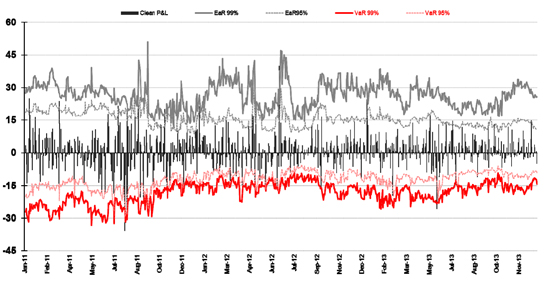
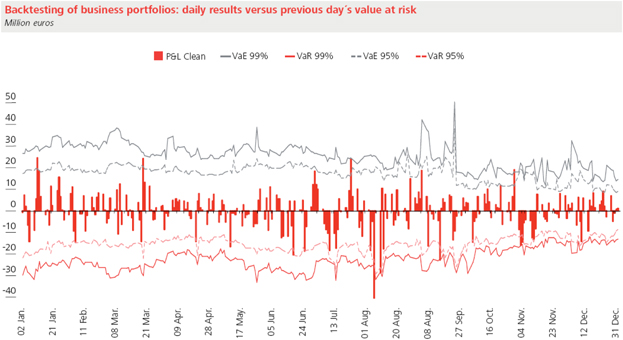
Scenario analysis1.6.Analysis of scenarios
Various stress scenarios including stress tests, were analyzedcalculated and calculatedanalyzed regularly in 20112013 (at least monthly),every month) at the local and global and local levels particularlyfor all the trading portfolios and using the same assumptionssuppositions by risk factor.
Maximum volatility scenario (Worst Case)
The table below shows, at December 31, 2011,This scenario is given particular attention as it combines historic movements of risk factors with an ad hoc analysis in order to reject very unlikely combinations of variations (for example, sharp falls in stock markets together with a decline in volatility).
This scenario is given particular attention as it combines historic movements of risk factors with an ad-hoc analysis in order to reject very unlikely combinations of variations (for example, sharp falls in stock markets together with a decline in volatility). As regards the results by risk factor (interest rates, equities, exchange rates, spreads on loans, commodities and the volatility of each one of them), in a scenario in whichvariations, an historic volatility equivalent to six standardtypical deviations in a normal distribution is applied. ThisThe scenario is based ondefined by taking for each risk factor the movement thatwhich represents a greaterthe greatest potential loss in the portfolio, rejecting the most unlikely combinations in economic financial terms. For year-end, that scenario implied, for the global portfolio. For the year-end, this scenario involved rises inportfolio, interest rate in Latin American markets andrises, falls in core markets (“flight into quality”), declines in stock markets, the depreciation of all currencies against the euro, greaterrise in credit spreads and mixed volatility and spreads on loans.movements. The following table shows the results of this scenario at the end of 2013.
Maximum volatility stress test
| € million | Interest Rate | Equity | Exchange Rate | Credit Spread | Commodity | Total | ||||||||||||||||||
Total Trading | -51.4 | -35.2 | -19.9 | -23.4 | -1.0 | -130.8 | ||||||||||||||||||
Europe | -5.5 | -26.4 | -16.7 | -5.6 | -1.0 | -55.2 | ||||||||||||||||||
Latin America | -44.7 | -8.7 | -2.4 | 0.0 | 0.0 | -55.7 | ||||||||||||||||||
United States | -1.4 | -0.1 | -0.8 | 0.0 | 0.0 | -2.2 | ||||||||||||||||||
Global Activities | 0.2 | 0.0 | 0.0 | -17.8 | 0.0 | -17.7 | ||||||||||||||||||
The stress test shows that the economic loss suffered by the Group in its trading portfolios, in terms of the Mark to Market (MtM) result would be, if the stress movements defined in the scenario materialized, €131€130.6 million, a loss that would be distributed betweenconcentrated in Europe (equities, exchange(in this order, credit spreads, interest rates and credit spreads),exchange rates) and Latin America (interest rate)rates, equities and global activities (credit spreads)exchange rates).
MAXIMUM VOLATILITY STRESS SCENARIO (WORST CASE)
293
| € million | Interest Rate | Equity | Exchange Rate | Credit Spread | Commodity | Total | ||||||||||||||||||
Total Trading | -51.3 | -21.5 | -27.3 | -30.3 | -0.2 | -130.6 | ||||||||||||||||||
Europe | -17.2 | -7.7 | -14.5 | -24.5 | -0.2 | -64.1 | ||||||||||||||||||
Latin America | -30.4 | -13.8 | -12.7 | 0.0 | 0.0 | -56.9 | ||||||||||||||||||
United States | -2.5 | 0.0 | -0.1 | 0.0 | 0.0 | -2.6 | ||||||||||||||||||
Global Activities | -1.2 | 0.0 | 0.0 | -5.8 | 0.0 | -7.0 | ||||||||||||||||||
Various global scenarios (similar for all the Group’s units) are established:
B. Non-Trading Activity
B.1. Asset and liability management
We actively manage the market risks inherent
The purpose of financial management is to make net interest revenue from our commercial activities more stable and recurrent, maintaining adequate levels of liquidity and solvency.
The Financial Management Area analyzes structuralmarkets. Rise in interest rate risk derived from mismatchescurves, sharp falls in maturity and revision dates for assets and liabilities in eachstock markets, large appreciation of the currencies in which we operate. For each currency, the risk measured is the interest gap, the sensitivity of net interest revenue, the economic value and the duration of equity.
The Financial Management Area manages structural risk on a centralized basis. This allows the use of homogenous methodologies, adapted to each local market where we operate.
In the euro-dollar area, the Financial Management Area directly manages the risks of the parent Bank and coordinates management ofdollar against the rest of currencies, rise in volatility and in credit spreads.
Every month a consolidated stress test report is drawn up with explanations of the main changes in coordination withresults for the various scenarios and units supervised by the global Financial Management Area.committee of market risks. An early warning mechanism has also been established so than when the loss of a scenario is high in historic terms and/or the capital consumed by the portfolio in question, the business executive is informed.
The Asset and Liability Committees (ALCO’s) of each country and, where necessary,Here we show the Markets Committeeresults of the parent Bank are responsibleglobal scenarios for the risk management decisions.last three years.
STRESS TEST RESULTS : COMPARISON OF 2011, 2012 AND 2013 (ANNUAL AVERAGES) (Millions of euros) 2.1.Structural interest rate risk Europe and the United States Generally, in 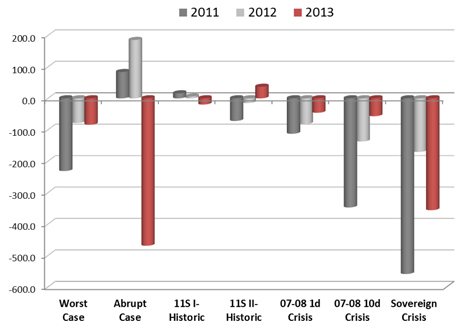
B.1.1. Quantitative analysis of2.Non-Trading Activity252011
a) Convertible currenciesIn any case, the exposure level in all countries is very low in relation to the annual budget and the amount of equity. Moreover, in 2013 the most general trend was to maintain or reduce the exposure.
At the end of 2011,2013, the sensitivity of net interest marginthe NIM at one year to parallel rises of 100 basis points was concentrated in the sterling interest rate curve, with Santander UK contributing the most (£191 million). In the euro interest rate curve, the risk was substantially reduced compared toU.S. dollar and sterling, with the end of 2010 to €96parent bank, the U.S. subsidiary and Santander UK the units that contributed the most (€111 million, stemming primarily from the sensitivity of the consumer unit in Germany (€66$54 million excluding our subsidiaries in Austria and Belgium). As regards the US dollar curve, the greatest concentration comes from Sovereign ($76 million)£39 million, respectively). The sensitivity of the margin to the rest of convertible currencies wasis not very significant.
| 25 | Includes the entire balance sheet except for the trading portfolios. |
NIM SENSITIVITY TO 100 BASIS POINTS
% of the total
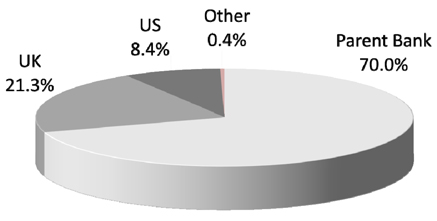
Other: Portugal, SCF, SC USA, Poland and Santander Private Banking
At the same date, the main sensitivity of equityeconomic value to parallel rises in the yield curve of 100 basis points was in the euro interest rate curve was €723 million, most of it in the parent Bank, which is lower thanbank (€1,478 million). As regards the dollar and sterling curves, the amounts were $285 million and £16 million, respectively).
MVE SENSITIVITY TO 100 BASIS POINTS
% of the total
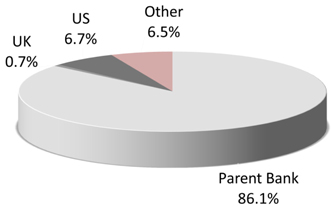
The tables below give the structure by maturity of interest rates at the parent bank and Santander UK at the end of 2010. As regards2013.
PARENT BANK: INTEREST RATES REPRICING GAP26 (DECEMBER 31, 2013)
Millions of euros
| Total | 3 months | 1 year | 3 years | 5 years | > 5 years | Non sensitive | ||||||||||||||||||||||
Assets | 408,298 | 163,941 | 78,854 | 23,913 | 12,690 | 21,056 | 107,844 | |||||||||||||||||||||
Liabilities | 408,298 | 139,231 | 73,936 | 72,089 | 24,836 | 33,441 | 64,766 | |||||||||||||||||||||
Off-balance sheet | 0 | -15,974 | -2,378 | 13,411 | 3,509 | 1,433 | 0 | |||||||||||||||||||||
Net Gap | 0 | 8,736 | 2,540 | -34,766 | -8,637 | -10,952 | 43,078 | |||||||||||||||||||||
SANTANDER UK: INTEREST RATES REPRICING GAP27 (DECEMBER 31, 2013)
Millions of euros
| Total | 3 months | 1 year | 3 years | 5 years | > 5 years | Non sensitive | ||||||||||||||||||||||
Assets | 287,814 | 190,079 | 21,650 | 48,057 | 12,761 | 301 | 14,966 | |||||||||||||||||||||
Liabilities | 287,814 | 182,894 | 38,628 | 23,061 | 14,815 | 638 | 27,778 | |||||||||||||||||||||
Off-balance sheet | 0 | 407 | 8,555 | -4,970 | -3,790 | -187 | -15 | |||||||||||||||||||||
Net Gap | 0 | 7,591 | -8,423 | 20,026 | -5,843 | -524 | -12,828 | |||||||||||||||||||||
In general, the curvegaps by maturities remained at very low levels in sterling itrelation to the size of the balance sheet, in order to minimize interest rate risk.
Latin America
Due to differences in the macroeconomic context and the degree of maturity of these markets, the positioning with regard to the NIM was £376 million.
In accordancenot homogeneous. There are countries with the current environment of low interest rates, the Bank maintains a positive sensitivity, both in net interest margin (NIM) andbalance sheets positioned to interest rate rises.rises and others to interest rate falls. With regard to MVE, the general positioning of the balance sheets was such that the average duration of the asset was higher than that of the liability (negative sensitivity to interest rate rises).
Structural Gap. Santander Parent Company (December 31, 2011) (*)The risk in the main countries was reduced or maintained in 2013. In any case, the exposure level in all countries is very low in relation to the annual budget and the amount of equity.
€ million | Not sensitive | Up to 1 year | 1-3 years | 3-5 years | More than 5 years | TOTAL | ||||||||||||||||||
Money and securities market | 81.408 | 6.471 | 2.679 | 16.287 | 106.845 | |||||||||||||||||||
Loans | 112 | 106.135 | 8.896 | 1.352 | 1.050 | 117.546 | ||||||||||||||||||
Equity Investments | 86.049 | 86.049 | ||||||||||||||||||||||
Other assets | 19.688 | 73.954 | 52 | 54 | 63 | 93.811 | ||||||||||||||||||
Total assets | 105.849 | 261.497 | 15.420 | 4.085 | 17.400 | 404.250 | ||||||||||||||||||
Money market | — | 64.325 | 2.585 | 300 | 56 | 67.265 | ||||||||||||||||||
Customer deposits | — | 39.455 | 17.773 | 10.004 | 14.247 | 81.478 | ||||||||||||||||||
Debt Issues and securitizations | — | 78.021 | 21.781 | 13.666 | 9.872 | 123.340 | ||||||||||||||||||
Shareholders’ equity and other liabilities | 87.606 | 60.906 | 920 | 595 | 935 | 150.962 | ||||||||||||||||||
Total liabilities | 87.606 | 242.708 | 43.059 | 24.564 | 25.109 | 423.045 | ||||||||||||||||||
Balance sheet Gap | 18.243 | 18.789 | (27.639 | ) | (20.479 | ) | (7.709 | ) | (18.795 | ) | ||||||||||||||
Off-balance sheet structural Gap | — | (11.451 | ) | 17.952 | 10.663 | 5.416 | 22.579 | |||||||||||||||||
Total structural Gap | 18.243 | 7.337 | (9.687 | ) | (9.816 | ) | (2.293 | ) | 3.785 | |||||||||||||||
Accumulated Gap | — | 7.337 | (2.350 | ) | (12.165 | ) | (14.459 | ) | — | |||||||||||||||
| 27 | Aggregate gap of all currencies in the balance sheet of Santander UK, expressed in euros. |
294
b) Latin America
The interest rate risk of Latin America’s balance sheet management portfolios, measured by the sensitivity of net interest margin (NIM) to a parallel movement of 100 basis points, in the yield curve remained during 2011 at low levels.
In terms of equity sensitivity, interest risk fluctuated in a range of between €753 million and €1,036 million. The sensitivity increased as of April mainly because of growth in lending and the ALCO portfolio in Brazil and the rise in fixed-rate loans in Mexico, after incorporating the portfolio of loans acquired from General Electric.
At the end of 2011, the region’s risk consumption, measured by equity sensitivity to shifts of 100 basis points, was €957 million (€763 million in 2010), while that of the net interest margin at one year, measured by its sensitivity to shifts of 100 basis points, was €79 million (€45 million in 2010).
Latin America: Structural Interest Risk Profile EvolutionEVOLUTION OF THE LATIN AMERICA STRUCTURAL INTEREST RISK PROFILE
Sensitivity of NIM and MVE to shifts of 100 basis points Millionsmillions of euros
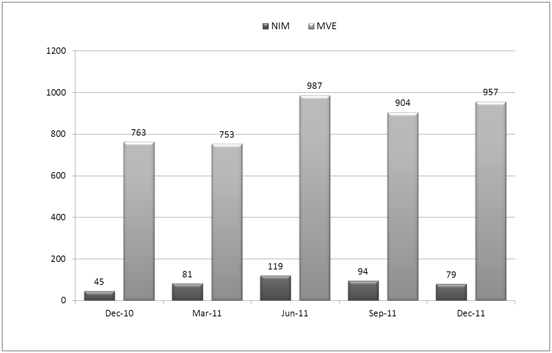
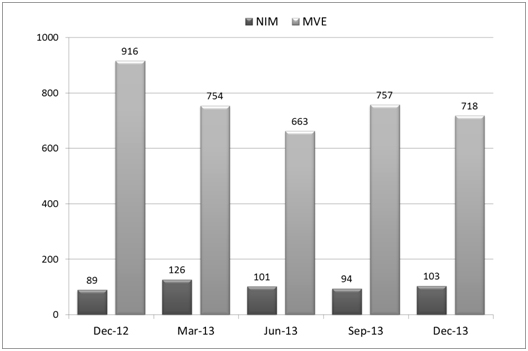
Interest rate risk profile at December 31, 2011
The gap tables below show the distribution of risk by maturity inFor Latin America as of December 31, 2011 (figures in millions of euros).
295
| Gaps in Local Currency | Not sensitive | 0-6 months | 6-12 months | 1-3 years | > 3 years | TOTAL | ||||||||||||||||||
Assets | 59,192 | 98,801 | 16,141 | 35,702 | 29,106 | 239,073 | ||||||||||||||||||
Liabilities | 71,196 | 115,340 | 24,017 | 13,731 | 10,833 | 235,117 | ||||||||||||||||||
Off-balance Sheet | -2,956 | 115,017 | 253 | 2,406 | -1,622 | 113,099 | ||||||||||||||||||
|
|
|
|
|
|
|
|
|
|
|
| |||||||||||||
Gap | -23,083 | 102,782 | -2,541 | 22,485 | 15,674 | 115,317 | ||||||||||||||||||
| Gaps in Foreign Currency | Not sensitive | 0-6 months | 6-12 months | 1-3 years | > 3 years | TOTAL | ||||||||||||||||||
Assets | 5,295 | 32,182 | 3,887 | 3,695 | 8,397 | 53,455 | ||||||||||||||||||
Liabilities | 5,658 | 30,718 | 4,247 | 5,009 | 10,043 | 55,675 | ||||||||||||||||||
Off-balance Sheet | -3,890 | -108,056 | -617 | -847 | 313 | -113,097 | ||||||||||||||||||
|
|
|
|
|
|
|
|
|
|
|
| |||||||||||||
Gap | -4,253 | -106,593 | -976 | -2,162 | -1,333 | -115,317 | ||||||||||||||||||
Net Interest Margin (NIM) sensitivity
For thea whole, of Latin America, the consumption of risk at the end of 2011 was €79 million (sensitivityDecember 2013, measured to 100 basis points of the financial margin28, stood at one year to rises of 100 basis points)€103 million (€89 million at December 2012). The geographic distribution is shown below.
More than 90%It can be seen from the chart below that over 95% of the risk was concentrated in three countries: Brazil, Chile and Mexico.
NIM SENSITIVITY TO 100 BASIS POINTS
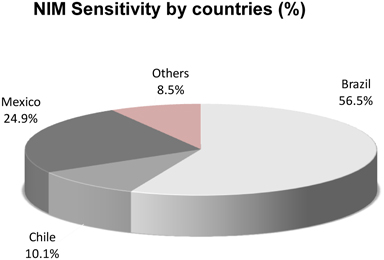
Others: Argentina, Colombia, Panama, Peru, Puerto Rico, Santander Overseas and Uruguay
Market Value of Equity (MVE) sensitivity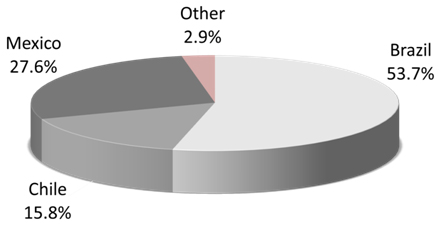
For the whole of Latin America, the consumption at the end of 2011 was €957 million (sensitivity of MVE to a parallel movement of rises of 100 basis points in interest rates).
The geographic distribution is shown below. About 90% of risk is concentrated in three countries: Brazil, Chile and Mexico Others:Other: Argentina, Colombia, Panama, Peru, Puerto Rico, Santander Overseas and Uruguay
| 28 | Betas are used to aggregate the sensitivities of different curves. |
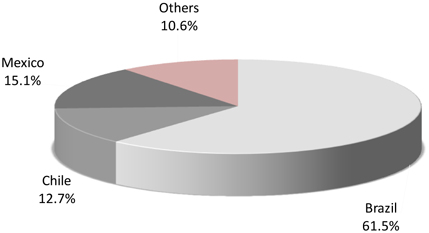
At the end of 2013, the risk consumption for the region, measured to 100 basis points of asset value29, was €718 million (€916 million in 2012). That over 90% of the asset value risk was concentrated in three countries: Brazil, Chile and Mexico.
MVE SENSITIVITY TO 100 BASIS POINTS
% of the total
296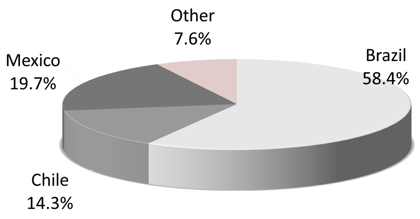
B.1.2. Structural management of credit riskOther countries: Argentina, Colombia, Panama, Peru, Puerto Rico, Santander Overseas and Uruguay.
The purpose of structural management of creditgap tables show the interest-rate risk is to reduce the concentrations that can naturally occur as a result of business activity through the sale of assets. These operations are offset by acquiring other assets that diversify the credit portfolio. The Financial Management Area analyzes these strategies and makes proposals to the ALCOmaturity structure in order to optimize the exposure to credit risk and help create value.
In 2011 and as part of the Group’s liquidity management:
• €73 billion of assets were securitized, of which around one-third were placed in the market and the rest retained by the Group’s various units. These retained securitizations increased the Group’s liquidity position through their discounting capacity in central banks.
• Repurchases were made in the secondary market of securitization bonds of the higher tranches of Group issuers (around €100 million).
B.1.3. Management of structural liquidity
Banco Santander’s business model has enabled it to have a comfortable liquidity position during the financial crisis. In this environment, the framework of managing financing and liquidity risk continued to function correctly, which gave the Bank a considerable competitive edge.
The great capacity to attract customer deposits, combined with strong issuance activity in institutional markets via subsidiaries with the responsibility and capacity to cover their own needs, has given the Group the necessary liquidity to finance the acquisition of new units in the last few years. It has also helped to bolster the Bank’s capacity to create value, while at the same time continue to improve the diversification of financing sources.
The Group’s liquidity management framework and its situationBrazil at the end of 2011 is set out below.2013
1. Management frameworkBRAZIL: INTEREST RATES REPRICING GAP30 (DECEMBER 31, 2013)
Liquidity management is based on three fundamental pillars:
A) Organizational model: governance and the board. A solid modelMillions of governance that ensures the involvement of senior management and the board in taking decisions and facilitating their integration with the Group’s global strategy.
B) Management. Adapted to each business’s liquidity needs, in accordance with the decentralized organizational model.
C) Balance sheet analysis and liquidity risk management. Profound analysis of the balance sheet and its evolution in order to support decision-taking.
A. Organizational and governance model
Decision-taking regarding structural risks is done by local ALCO committees in coordination with the markets committee. The latter is the highest decision-taking body and coordinates all global decisions that influence measurement, management and control of liquidity risk.
The markets committee is headed by the chairman of the Bank and comprises the second vice-chairman of the board and CEO, the third vice-chairman of the board and chairman of the risk committee, the chief financial officer and the executive vice-president of risks and those responsible for the business and analysis units.
There are also ALCO committees for convertible currencies (basically, euros the US dollar and sterling) as well as for the currencies of emerging countries.
| Total | 3 months | 1 year | 3 years | 5 years | > 5 years | Non sensitive | ||||||||||||||||||||||
Assets | 158,399 | 71,197 | 22,683 | 19,896 | 9,169 | 7,428 | 28,027 | |||||||||||||||||||||
Liabilities | 158,399 | 88,456 | 17,659 | 10,495 | 3,473 | 3,371 | 34,945 | |||||||||||||||||||||
Off-balance sheet | 0 | 5,293 | 1,101 | -6,854 | 302 | 159 | 0 | |||||||||||||||||||||
Net Gap | 0 | -11,967 | 6,126 | 2,547 | 5,997 | 4,216 | -6,918 | |||||||||||||||||||||
297
The Financial Management Area is responsible for managing structural risks, including liquidity, while control is the responsibilityD.2.Structural exchange-rate risk/hedging of the global market risk areas. Both areas support the ALCO committees, providing analysis and management proposals and controlling compliance with the limits set.
In line with the best practices of governance, the Group establishes a clear division between executing the financial management strategy (the responsibility of the financial management area) and monitoring and control (the responsibility of market risks).
298
B. Managementresults
Structural liquidity management aims to finance the Group’s recurring activity in optimum conditions of maturity and cost and avoid assuming undesired liquidity risks.
Liquidity and financing management is based on the following principles:
• Wide and very stable base of customer deposits and funds on the balance sheet (including retail commercial paper): more than 85% of the deposits are retail and are captured in the Group’s core markets by various units.
• Financing via medium and long-term issues of the balance sheet’s stable liquidity needs (the gap between loans and deposits), establishing a surplus of structural financing in order to be able to meet possible adverse situations.
• Diversification of financing sources to reduce the risk in relation to:
– instruments/investors
– markets/currencies
– maturities
• Strict control of short-term financing needs, within the Group’s policy of minimizing the degree of recourse to short term funds.
• Autonomy and responsibility of subsidiaries in managing the financing of liquidity, with no structural support from the parent Bank.
In practice, and applying these principles, the Group’s liquidity management consists of:
• Preparing a yearly liquidity plan based on the financing needs derived from the budgets of each business. On the basis of these needs and bearing in mind prudent limits on recourse to short-term markets, the year’s issuance and securitization plan is established by financial management.
• During the year the evolution of the balance sheet and financing needs is regularly monitored, giving rise to changes to the plan.
• Maintain an active presence in a wide and diversified series of financing markets. The Group has more than 10 significant and independent issuance units, which avoid dependence on a specific market and maintain available a wide capacity of issuance in various markets.
• And backed by all this, the Group has an adequate structure of medium and long-term issues, well diversified by products (senior debt, subordinated, preferred shares, bonds) with an average conservative, to which are added the securitized bonds placed in the market.
• All of these results in moderate needs of recourse to short-term wholesale financing at the Group level, which, as reflected in the accompanying balance of liquidity, represented less than 2% of net funds in 2011, down from 3% in 2010, and 5% in 2009. This percentage would be below 2% if the retail commercial paper placed by the commercial networks in Spain as products to replace customer deposits is excluded.
The subsidiaries have a large degree of autonomy to manage their liquidity within Grupo Santander’s decentralized and coordinated financing model. Each one must budget their liquidity needs and assess their own capacity of recourse to the wholesale markets in order to establish, always in coordination with the parent Bank, the issuance and securitization plan.
299
Only in the case of Santander Consumer Finance does the parent Bank supplement the necessary liquidity and always at the market price taking into account the maturity of the finance and the internal rating of the relevant unit. The Group, within the strategy of optimizing the use of liquidity in all units, has managed to reduce to one-third (to €5 billion from €15 billion in 2009) the recourse of Santander Consumer Finance to the parent Bank in the last two years.
C. Analysis of the balance sheet and measurement of liquidity risk
Taking decisions on financing and liquidity is based on a deep understanding of the Group’s current situation (environment, strategy, balance sheet and state of liquidity), the future liquidity needs of businesses (projection of liquidity), as well as access to and the situation of financing sources in the wholesale markets.
The goal is to ensure the Group maintains optimum levels of liquidity to cover its short and long-term needs, optimizing the impact of its cost on the income statement.
This requires monitoring of the structure of balance sheets, forecasting short and medium-term liquidity and establishing the basic metrics, in line with those reported in “Current state of liquidity” below.
Various stress tests are also conducted taking into account the additional needs that could arise from various extreme, although possible, events. These could affect the various items of the balance sheet and/or sources of financing differently (degree of renewal of wholesale financing, deposit outflows, deterioration in the value of liquid assets, etc), whether for global market reasons or specific ones of the Group.
All of this enables the Group to respond to a spectrum of potential, adverse circumstances, anticipating the corresponding contingency plans.
These actions are in line with the practices being recommended by the Basel Committee in order to strengthen the liquidity of banks, whose objective is to define a framework of principles and metrics that is still being analyzed and discussed.
2. Current state of liquidity
The Group has an excellent structural position, with the capacity to meet the new conditions of stress in the markets. This is underscored by:
A) The robust balance sheet.
B) The dynamics of financing.
A. Robust balance sheet
The balance sheet at the end of 2011 was solid, as befits the Group’s retail nature. Lending, which accounted for 77% of the net assets of the balance of liquidity, was entirely financed by customer deposits and medium and long-term financing, including securitized bonds placed in the market. Equally, the structural needs of liquidity, represented by loans and fixed assets, were also totally financed by structural funds (deposits, medium and long-term financing and capital).
As regards financing in wholesale markets, the Group’s structure is largely based on medium and long-term instruments (90% of the total).
Together with special financing from the Federal Home Loan Banks in the US and securitized bonds in the market, the bulk of medium- and long-term financing are issues of debt whose outstanding balance at the end of 2011 was around €162 billion, with an average maturity of more than four years and an adequate distributed profile (no year concentrates more than 20% of the outstanding balance).
Short-term financing is a marginal part of the structure (less than 2% of total funds) and it amply covered by liquid assets. At the end of 2011, the surplus structural liquidity (equivalent to the surplus of structural funds over loans and fixed assets) was €119 billion. In addition, if the retail commercial paper placed by the commercial networks in Spain in 2011 to replace deposits is excluded, the structural surplus of liquidity would amount to €125 billion.
300
This solid structural position is complemented by the Group’s ability to obtain immediate liquidity through recourse to the central banks of the countries where the Group has operating subsidiaries. Of note among these central banks are the three institutions that control the three main currencies in which the Group operates: the euro, sterling and the US dollar.
At the end of 2011, total eligible assets which could be discounted in the various central banks to which the Group has access via its subsidiaries amounted to around €100 billion. This amount, similar to that at the end of 2010, is the result of an active strategy of generating assets that can be discounted, backed by development of customer businesses, which enable both the maturities of the existing assets as well as the increasing cuts in the value of guarantees by central banks when supplying liquidity to be compensated.
The tables below set out the framework of the balance of liquidity of the consolidated group as well as the main metrics for monitoring the structural position of liquidity:
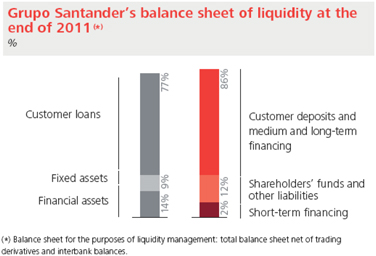
Monitoring metrics
%
| Metrics | 2011 | 2010 | 2009 | |||||||||
Loans/net assets | 77% | 75% | 79% | |||||||||
Customer deposits, insurance and medium and long-term financing/loans | 113% | 115% | 106% | |||||||||
Customer deposits, insurance and medium and long-term financing, shareholders’ funds and other liabilities / total loans and fixed assets | 114% | 117% | 110% | |||||||||
Liabilities/total loans and fixed assets | 2% | 3% | 5% | |||||||||
Short-term financing/net liabilities | 117% | 117% | 135% | |||||||||
As in the Group, the balance sheets of the units of convertible currencies and of Latin America have the same principles, within the philosophy of independence and responsibility in their financing.
301
A good example is that in the Group’s main units, apart from Santander Consumer Finance, all customer lending is financed by customer deposits plus medium- and long-term wholesale funding.
B. Dynamics of financing
In 2011, Santander maintained the solid structural liquidity position reached in 2010 in an environment of maximum pressure in both the retail and wholesale spheres.
As well as the aggressive competition for retail deposits in the main European markets already begun in 2010, Eurozone wholesale markets were closed in the second half of the year due to the crisis of confidence in the solvency of sovereign debt and in the growth capacity of countries on the periphery of Europe. This difficulty in wholesale issuance raised the appetite for retail deposits while complicating access to short-term dollar markets.
In this context of high stress, the Group maintained its liquidity ratios, after absorbing the financing needs derived from the new units incorporated. The Group’s loan-to-deposit ratio remained at around 117% at December 31, 2011 (including the retail commercial paper), after the sharp reduction from 150% in 2008. The ratio of deposits plus medium- and long-term financing to loans was 113% (115% in 2010), well above the 104% in 2008.
This evolution is the result of managing the two basic drivers of the Santander model: the high capacity to capture customer funds and the wide and diversified access to wholesale finance markets.
As regards deposits, in 2011 the Group’s main units continued to increase their customer deposits as the basis for financing growth in lending. Growth rates in the Latin American units were higher, although without offsetting the strong rise in lending in the region, especially in Brazil and Mexico, which led to the elimination of the traditional surplus of deposits. On the other hand, developed countries undergoing deleveraging generally registered lower growth in deposits although higher than that of lending, which enabled them to keep on reducing their commercial gap.
As an exception, the commercial units in Spain which, after the big effort made in 2010 to capture deposits, reduced the volume of deposits in 2011 after giving priority to recovering spreads by not renewing the most expensive deposits and issuing commercial paper to attract new funds from retail customers. The fall in the volume of deposits and on-balance sheet funds, however, was less than the reduction in loans, which continued to improve the commercial gap in Spain.
As regards the second driver, the Group maintained a high volume of issuance throughout the year, more continuously in the countries and businesses least affected by the Eurozone’s issuance difficulties after the summer. The diversity of issuers by markets and currencies, and exploiting the windows offered by the euro markets, particularly in the first half of the year, enabled Santander to capture €40 billion in medium- and long-term issues in the market (more than in 2010), which covered 124% of the maturities and amortizations envisaged for the year.
Medium and long term issues, basically senior debt and mortgage bonds, were concentrated in Spain and the UK (72% of the total between the two), followed by Latin America, led by Brazil, which increased its participation to 24% of the year’s total issues.
As regards securitization, in 2011 the Group’s subsidiaries made sales in the market of securitized bonds and structured medium and long-term operations with customers whose collateral is securitized bonds or mortgage bonds amounting to close to €25 billion. Of note along with the strong activity in the UK market, which concentrates more than half of the placements, was the growing issuance of Santander Consumer Finance, strongly backed by investor appetite for these securities. This demand increased the number of Santander Consumer Finance units which accessed the wholesale markets and contributed to the opening of new markets. A good example of this was Norway, where the Group made the first securitization of auto loans in the country.
This high issuance capacity shown by the parent Bank and its subsidiaries in various types of debt was backed by the Group’s notable credit quality. In February 2012, after the successive downgrading of Spanish sovereign debt by rating agencies, Grupo Santander had the following credit ratings: A from Fitch, A+ from Standard & Poor’s and Aa3 from Moody’s.
302
Also noteworthy was that, in all cases, the Group’s issuance capacity was adjusted to investors’ appetite for securities at placement prices that recognized the higher credit quality of the Group and its subsidiaries. A good example of this was the Parent bank’s €2 billion issue of 3 year mortgage bonds in February 2012, which reopened the Spanish market after almost six months of no activity for these volumes. Its placement, with a high demand (four times oversubscribed) was done at a spread of 210 basis points over mid swap, below that of the Bank’s CDS in the days before and which was close to the levels before the tightening of markets in August 2011.
In short, sustained growth in deposits except in some markets because of the greater focus on spreads, wide access to medium and long-term wholesale markets and generation of liquidity by businesses in economies undergoing deleveraging explain the Group’s continued solid structural liquidity position during 2011.
Santander thus begins 2012 with a comfortable liquidity situation and with fewer issuance needs in the medium- and long-term. There are no concentrations of maturities in the coming years, when annual maturities are less than the issues made in 2011 and furthermore the different business dynamics by areas and markets do not make it necessary to cover all issues. This will make the Group develop differentiated strategies in each one of them.
In any case, and while the current environment of uncertainty persists, Santander will continue to pursue a conservative policy in issues, as it did in 2011, in order to bolster its already solid position.
B.2. Exchange rate risk; Portfolio of industrial and strategic shareholdings
B.2.1. Exchange rate risk
Structural exchange rate risk arises from Group operations in currencies, mainly related to permanent financial investments, and the results and the dividendshedging of these investments.
This exchange rate risk management is dynamic and seeks to limit the impact on equity of currency depreciations and to optimize the financial cost of hedging.
With respect
| 29 | Betas are used to aggregate the sensitivities of different curves. |
| 30 | Aggregate gap of all currencies in the balance sheet of Brazil, expressed in euros. |
As regards the exchange-rateexchange rate risk of permanent investments, the general policy is to finance them in the currency of the investment provided the depth of the market allows it and the cost is justified by the expected depreciation. One-timeOne-off hedging is also done when a local currency could weaken against the euro significantly more quickly thanbeyond what the market is discounting.estimates.
At the end of 2011,2013, the largest exposures of a permanent nature (with potential impact on net worth)equity value) were concentrated, in this order, in sterling, Brazilian reais, followed by sterling, USU.S. dollars, Mexican pesos, Chilean pesos and Polish zloties.zlotys. The Group hedgescovers part of these positions of a permanent positionsnature with exchange-rate derivatives.
In addition, Corporate Activitiesfinancial management at the consolidated level is responsible for exchange-rateexchange rate management of the Group’s expected results and dividends in those units whose currency is not the euro.
B.2.2. PortfolioD.3.Structural equity risk
Santander maintains equity positions in its banking book in addition to those of industrial and strategic shareholdings
The non-tradingthe trading portfolio. These positions are maintained as portfolios available for sale (capital instruments) or as equity portfolio increased 21% in 2011, after the significant reductionsstakes, depending on their envisaged time in the two previous years. The increaseportfolio.
These positions are exposed to market risk. VaR calculations are made for these positions, using market price series for listed shares and proxies for those that do not. At the end of 2013, the VaR at 99% with a one day time frame was concentrated on equity investments, which rose from €201€253.3 million to €2,473(€281.4 million because of the reclassification of Metrovacesa (previously categorized as Available for Sale) and the incorporation as equity investments of the Group’s stakes in insurance companies and in Santander Consumer USA (previously their balance sheets were consolidated in the Group’s one). The Available for Sale equity portfolio decreased 15% to €6,135 million.
C. Structured financing transactions
Despite the complicated economic environment, Santander achieved growth of 13.2% in this activity in 2011 to a committed exposure of €22,017€305.7 million at the end of 2012 and 2011, respectively).
D.4.Balance sheet market risk
With a homogeneous metric such as the year, corresponding to 727 transactions, and increased bothVaR, the diversification by sectors and the internationalization of business. Leadership in project finance was strengthened with an exposure of €13,528 million among 514 transactions, (risk reduced to €12,198 million if we discount the exposure ceded to two CLOs signed in 2008 and 2009), followed by €4,434 million in acquisition finance (50 transactions), of which €1,746 million related to 12 margin calls and, lastly, leveraged buy-outs (LBOs) and other structured financings amounted to €4,055 million (154 transactions).
303
As a result of integrating Alliance & Leicester into the Group in 2008, a portfolio of structured operations is maintained. It is a diversified portfolio of specialized finance operations. The exposure at the end of 2011 was €4,167 million (€4,989 million) corresponding to 214 transactions. This exposure was 15.5% less than at the end of 2010.
D. Exposures related to complex structured assets
Grupo Santander continued to have a very limited exposure to complex structured instruments or vehicles, reflecting a management culture in which prudenttotal market risk management is one of the main identifying features. At the end of 2011, the Group had:
CDOs/CLOs: the position is still very insignificant at €301 million, 38% less than at the end of 2010. A significant part of it is the result of the integration of the Alliance & Leicester portfolio in 2008.
Non-Agency CMOs and pass-throughs with underlying mortgage alt-A: no exposure. The €818 million of positions at the end of 2010, mainly from the integration of Sovereign Bank in January 2009, were sold in the fourth quarter of 2011.
Hedge funds:banking book can be monitored, distinguishing between fixed income (both interest rate as well the total exposure is not significant (€469 million at the end of 2011) and most of it is through financing these funds (€233 million), as the rest is direct participation in portfolio. This exposure has low levels of loan-to-value of around 30% (€1,552 million of collateral at the end of 2011). The risk with this type of counterparty is analyzed case by case, establishing the percentages of collateral on the basis of the features and assets of each fund.
Conduits: No exposure.
Monolines: Santander’s exposure to bond insurance companies was €196 million at the end of 2011, mainly indirect exposure, and €173 million by virtue of the guarantee provided by this type of entity to various financing or traditional securitization operations. The exposure in this case is double default, as the primary underlying assets are of high credit quality (mainly AA). The small remaining amount is direct exposure (for example, via purchase of protection from the risk of non-payment by any of these insurance companies through a credit default swap). The exposure was 29% lower than in 2010.
In short, the exposure to this type of instrument, the result of the Group’s usual operations, continued to decline in 2011 and this was mainly due to the integration of positions of institutions acquired in 2011, such as Alliance & Leicester and Sovereign (in 2008 and 2009, respectively). All these positions were known at the time of purchase, having been duly provisioned. These positions, since their integration in the Group, have been notably reduced, with the ultimate goal of eliminating them from the balance sheet.
Santander’s policyspread for the approval of new transactions in these products continues to be very prudent and conservative, and is subject to strict supervision by the Group’s senior management. Before approval is given for a new transaction, product or underlying asset, the risk division verifies:
the existence of an appropriate valuation model to monitor the value of each exposure: Mark-to-Market, Mark-to-Model or Mark-to-Liquidity.
whether the inputs enabling application of this valuation model are observable in the market.
Provided the two aforementioned conditions are met, the risk division ascertains:
the availability of adequate systems duly adapted for the calculation and daily monitoring of the results, positions and risks of the new transactions and
the degree of liquidity of the product or underlying asset, with a view to arranging the related hedge on a timely basis.
304
E. Internal model
Grupo Santander had, at the end of 2011, approval from the Bank of Spain for its internal market risk model for calculating regulatory capital in the trading portfolios of units in Spain, Chile and Portugal. The Group’s goal is to gradually increase approval to the rest of the units.
As a result of this approval, the regulatory capital of trading activity is now calculated via advanced methods, using VaR as the fundamental metric and incorporating new metrics of stressed VaR and incremental risk capital charge, which replaces incremental default risk, in line with the new capital requirements demanded by Basel 2.5.
We closely co-operate with the Bank of Spain in order to advance in the perimeter susceptible of entering into the internal model (at the geographic and operational levels)ALCO portfolios), as well as in analysis of the impact of new requirements, in line with the documents published by the Basel Committee to strengthen the capital of banks.
F. Capital Management
Capital management’s objective is to optimize its structure and its cost, from the regulatory and economic perspectives. Therefore, different tools and policies are utilized, such as capital increases and computable issuances (preferred and subordinated), results, dividend policy and securitizations.
With respect to capital ratios, Grupo Santander’s eligible stockholders’ equity was €67,763 million at December 31, 2011, representing a €22,893 million surplus over the minimum required by the Bank of Spain. In accordance with the criteria of the Bank for International Settlements (BIS II), at December 31, 2011 the BIS II ratio was 13.6%, Tier I 11.0% and core capital 10.0% (as compared to 13.1%, 10.0% and 8.8%, respectively, at December 31, 2010).
G. Market Risk: VaR Consolidated Analysis
Our total daily VaR (considering all factors: interest rate risk, foreign exchange rate risk and equity price risk) as of December 31, 2010, and December 31, 2011, broken down by trading and structural (non-trading) portfolios, were as set forth below.equities.
Figures in millions of EUR
| December 31, 2013 | ||||||||||||||||||||||||||||||||||||||||
| December 31, 2011 | December 31, 2012 | Low | Average | High | Period End | |||||||||||||||||||||||||||||||||||
| December 31, 2010 | Low | Average | High | Year End | ||||||||||||||||||||||||||||||||||||
TOTAL | 580.4 | 389.4 | 469.3 | 563.0 | 542.8 | 666.5 | 683.5 | 862.5 | 1,054.5 | 736.6 | ||||||||||||||||||||||||||||||
|
|
|
|
| ||||||||||||||||||||||||||||||||||||
Trading | 29.6 | 12.0 | 22.4 | 33.2 | 15.9 | 18.5 | 9.4 | 17.4 | 25.6 | 13.1 | ||||||||||||||||||||||||||||||
Non-Trading | 582.1 | 387.6 | 460.4 | 564.4 | 534.4 | 659.0 | 387.6 | 857.6 | 1,051.3 | 733.9 | ||||||||||||||||||||||||||||||
Diversification Effect | -31.3 | -10.2 | -13.5 | -34.5 | -7.5 | |||||||||||||||||||||||||||||||||||
Diversification Impact | -11.0 | 286.4 | -12.4 | -22.4 | -10.3 | |||||||||||||||||||||||||||||||||||
The diversification effect is calculated as the sum of the individual or “stand alone” VaR of each portfolio minus the total VaR of the consolidated portfolio.
We calculate the VaR for full revaluation (individual pricers for each position) or second-order Taylor approximation for the most complex portfolios. We include several individual factors such as each interest rate curve involved, individual share prices, currencies and volatility matrices. For reporting purposes, we group them based on the primary factor (interest rate, equity, foreign exchange, credit spread and commodities).
Our daily VaR (considering each factor of interest rate risk, foreign exchange rate risk and equity price risk individually) were as set forth below.
305
Interest Rate Risk
Figures in millions of EUReuros
Interest Rate Risk
| December 31, 2013 | ||||||||||||||||||||||||||||||||||||||||
| December 31, 2011 | December 31, 2012 | Low | Average | High | Period End | |||||||||||||||||||||||||||||||||||
| December 31, 2010 | Low | Average | High | Year End | ||||||||||||||||||||||||||||||||||||
Interest Rate Risk | ||||||||||||||||||||||||||||||||||||||||
Trading | 19.0 | 8.6 | 14.8 | 21.8 | 14.6 | 12.0 | 8.1 | 12.7 | 21.3 | 8.5 | ||||||||||||||||||||||||||||||
Non-Trading | 309.2 | 256.0 | 273.1 | 328.1 | 328.1 | 517.5 | 580.6 | 782.4 | 931.0 | 681.0 | ||||||||||||||||||||||||||||||
Diversification Effect | -18.4 | -8.4 | -14.4 | -21.1 | -14.3 | |||||||||||||||||||||||||||||||||||
Diversification Impact | -11.8 | -8.0 | -12.6 | -21.1 | -8.5 | |||||||||||||||||||||||||||||||||||
|
|
|
|
|
|
|
|
|
| |||||||||||||||||||||||||||||||
TOTAL | 309.8 | 256.1 | 273.5 | 328.9 | 328.5 | 517.6 | 580.6 | 782.6 | 931.2 | 681.0 | ||||||||||||||||||||||||||||||
Foreign Exchange Rate Risk
Figures in millions of EUR
| December 31, 2013 | ||||||||||||||||||||||||||||||||||||||||
| December 31, 2011 | December 31, 2012 | Low | Average | High | Period End | |||||||||||||||||||||||||||||||||||
| December 31, 2010 | Low | Average | High | Year End | ||||||||||||||||||||||||||||||||||||
Exchange Rate Risk | ||||||||||||||||||||||||||||||||||||||||
Trading | 13.9 | 1.3 | 9.0 | 24.1 | 4.2 | 3.5 | 1.6 | 5.4 | 14.5 | 4.7 | ||||||||||||||||||||||||||||||
Non-Trading | 391.3 | 319.1 | 372.7 | 430.7 | 346.8 | 207.3 | 197.8 | 254.5 | 320.5 | 197.8 | ||||||||||||||||||||||||||||||
Diversification Effect | -13.6 | -1.3 | -8.9 | -23.4 | -4.2 | |||||||||||||||||||||||||||||||||||
Diversification Impact | -3.5 | -1.6 | -5.4 | -14.2 | -4.6 | |||||||||||||||||||||||||||||||||||
|
|
|
|
|
|
|
|
|
| |||||||||||||||||||||||||||||||
TOTAL | 391.6 | 319.1 | 372.8 | 431.4 | 346.8 | 207.3 | 197.8 | 254.5 | 320.8 | 197.9 | ||||||||||||||||||||||||||||||
Equity Price Risk
Figures in millions of EUR
| December 31, 2013 | ||||||||||||||||||||||||||||||||||||||||
| December 31, 2011 | December 31, 2012 | Low | Average | High | Period End | |||||||||||||||||||||||||||||||||||
| December 31, 2010 | Low | Average | High | Year End | ||||||||||||||||||||||||||||||||||||
Equity Price Risk | ||||||||||||||||||||||||||||||||||||||||
Trading | 8.8 | 2.2 | 4.8 | 22.7 | 3.7 | 7.1 | 2.1 | 5.6 | 11.7 | 4.7 | ||||||||||||||||||||||||||||||
Non-Trading | 218.5 | 182.0 | 234.0 | 305.7 | 305.7 | 281.4 | 225.8 | 269.0 | 299.6 | 235.3 | ||||||||||||||||||||||||||||||
Diversification Effect | -8.6 | -2.2 | -4.7 | -21.9 | -3.7 | |||||||||||||||||||||||||||||||||||
Diversification Impact | -7.0 | -2.1 | -5.5 | -11.5 | -4.6 | |||||||||||||||||||||||||||||||||||
|
|
|
|
|
|
|
|
|
| |||||||||||||||||||||||||||||||
TOTAL | 218.7 | 182.0 | 234.1 | 306.5 | 305.7 | 281.5 | 225.8 | 269.1 | 299.8 | 235.3 | ||||||||||||||||||||||||||||||
306
The Group’s daily VaR estimates by activity were as set forth below.
Figures in millions of EUR
| December 31, 2011 | December 31, 2013 | |||||||||||||||||||||||||||||||||||||||
| December 31, 2010 | Low | Average | High | Year End | December 31, 2012 | Low | Average | High | Period End | |||||||||||||||||||||||||||||||
Trading | ||||||||||||||||||||||||||||||||||||||||
Interest Rate | 19.0 | 8.6 | 14.8 | 21.8 | 14.6 | 12.0 | 8.1 | 12.7 | 21.3 | 8.5 | ||||||||||||||||||||||||||||||
Exchange Rate | 13.9 | 1.3 | 9.0 | 24.1 | 4.2 | 3.5 | 1.6 | 5.4 | 14.5 | 4.7 | ||||||||||||||||||||||||||||||
Equity | 8.8 | 2.2 | 4.8 | 22.7 | 3.7 | 7.1 | 2.1 | 5.6 | 11.7 | 4.7 | ||||||||||||||||||||||||||||||
Credit Spread | 14.7 | 6.7 | 15.0 | 23.0 | 9.6 | 9.1 | 6.1 | 9.6 | 16.4 | 7.2 | ||||||||||||||||||||||||||||||
Commodities | 1.0 | 0.2 | 0.6 | 3.9 | 0.4 | 0.3 | 0.1 | 0.3 | 0.7 | 0.3 | ||||||||||||||||||||||||||||||
|
|
|
|
|
|
|
|
|
| |||||||||||||||||||||||||||||||
TOTAL | 29.6 | 12.0 | 22.4 | 33.2 | 15.9 | 18.5 | 9.4 | 17.4 | 25.6 | 13.1 | ||||||||||||||||||||||||||||||
Non-Trading Interest Rate | ||||||||||||||||||||||||||||||||||||||||
Interest Rate | 309.2 | 256.0 | 273.1 | 328.1 | 328.1 | 517.5 | 580.6 | 782.4 | 931.0 | 681.0 | ||||||||||||||||||||||||||||||
|
|
|
|
|
|
|
|
|
| |||||||||||||||||||||||||||||||
Exchange Rate | ||||||||||||||||||||||||||||||||||||||||
Non-Trading Foreign Exchange | ||||||||||||||||||||||||||||||||||||||||
Exchange Rate | 391.3 | 319.1 | 372.7 | 430.7 | 346.8 | 207.3 | 197.8 | 254.5 | 320.5 | 197.8 | ||||||||||||||||||||||||||||||
|
|
|
|
|
|
|
|
|
| |||||||||||||||||||||||||||||||
Non-Trading Equity | ||||||||||||||||||||||||||||||||||||||||
Equity | 218.5 | 182.0 | 234.0 | 305.7 | 305.7 | 281.4 | 225.8 | 269.0 | 299.6 | 235.3 | ||||||||||||||||||||||||||||||
|
|
|
|
| ||||||||||||||||||||||||||||||||||||
|
|
|
|
| ||||||||||||||||||||||||||||||||||||
TOTAL | 580.4 | 389.4 | 469.3 | 563.0 | 542.8 | 666.5 | 683.5 | 862.5 | 1,054.5 | 736.6 | ||||||||||||||||||||||||||||||
|
|
|
|
|
|
|
|
|
| |||||||||||||||||||||||||||||||
Interest Rate | 309.8 | 256.1 | 273.5 | 328.9 | 328.5 | 517.6 | 580.6 | 782.6 | 931.2 | 681.0 | ||||||||||||||||||||||||||||||
Exchange Rate | 391.6 | 319.1 | 372.8 | 431.4 | 346.8 | 207.3 | 197.8 | 254.5 | 320.8 | 197.9 | ||||||||||||||||||||||||||||||
Equity | 218.7 | 182.0 | 234.1 | 306.5 | 305.7 | 281.5 | 225.8 | 269.1 | 299.8 | 235.3 | ||||||||||||||||||||||||||||||
E. Internal model
Grupo Santander had, at the end of 2013, approval from the Bank of Spain for its internal market risk model for calculating regulatory capital in the trading portfolios of units in Spain, Chile, Mexico and Portugal. The Group’s objective is to gradually increase approval to the rest of units.
The regulatory capital consolidated by the internal model of market risks for Grupo Santander is obtained by adding the regulatory capital of each of the units for which there is the corresponding Bank of Spain approval. A conservative criterion is used for consolidating the Group’s capital, as it does not take into account the savings in capital derived from the diversification impact among various countries.
As a result of this approval, the regulatory capital of trading activity for the commented perimeter is calculated via advanced methods, using as main metric the VaR , the stressed VaR and the incremental risk charge (IRC), in line with the new capital requirements demanded by the Basel agreements and, specifically in the European directive CRD-IV (transposition of the Basel III agreements).
We closely cooperate with the Bank of Spain in order to increase the entities that can enter into the internal model (at the geographic and operational levels), as well as in analysis of the impact of new requirements, in line with the documents published by the Basel Committee to strengthen the capital of banks.
Part 7. Liquidity and funding risk
7.1 Introduction to the treatment of liquidity and funding risk
Liquidity and funding risk management has always been a basic element of the Group’s business strategy and a fundamental cornerstone, together with capital, on which the strength of its balance sheet rests.
Liquidity has become increasingly important in recent years due to the growing stresses in the financial markets in the framework of a global economic crisis. This scenario has emphasized the importance of banks having appropriate funding structures and strategies to ensure their intermediation activity.
During this period of stress, the Group has enjoyed an adequate liquidity position, which has represented a competitive advantage in terms of carrying on and expanding its activity in a demanding environment.
This improved position held by the Group as a whole has been based on a decentralized funding model composed by subsidiaries that are autonomous and self-sufficient in terms of liquidity. Each subsidiary is responsible for covering the liquidity needs arising from its current and future activity, by means of either deposits taken from its customers in its area of influence, or through recourse to the wholesale markets where it operates, under management and supervision procedures coordinated at Group level.
This is a funding structure that is most effective in situations of high market stress as it prevents difficulties in one area from affecting funding capacity in other areas and, therefore, the Group as a whole, which could occur if a centralized funding model were used.
In addition, at the Group this funding structure also benefits from the advantages of having a commercial banking model with a significant presence (business shares of around 10% or more) in ten markets with great potential, with the focus on retail customers and a high level of efficiency. As a result, the subsidiaries have a considerable capacity to attract stable deposits, as well as a significant issue capacity in the wholesale markets of those countries, generally in their own currencies, which is bolstered by the strength afforded by their franchise and membership of a leading group.
7.2 Liquidity management framework - Monitoring and control of liquidity risk
Structural liquidity management seeks to finance the Group’s recurring business with optimal maturity and cost conditions, avoiding the need to assume undesired liquidity risks.
Liquidity management at the Group is based on the followingprinciples:
In order to ensure the effective application of these principles by all the Group entities, it was necessary to develop a single management framework resting on the following three cornerstones:
7.2.1 Organizational and governance model
Decisions relating to all structural risks, including liquidity risk, are made though local asset-liability committees (ALCOs) in coordination with the markets committee.
The markets committee is the highest-ranking body at Group level responsible for coordinating and supervising all global decisions affecting liquidity risk measurement, management and control. It is chaired by the Bank’s chairman and its members are the second vice-chairman (who, in turn, is the chairman of the risk committee), the CEO, finance and risk executive vice presidents, and certain heads of business and analysis units.
Following the aforementioned principles, the local ALCO committees establish strategies to guarantee and/or anticipate the funding requirements of their business. They are assisted in the performance of their duties by the financial management area and the market risk area, which submit analyses and management proposals and monitor compliance with the respective limits set.
In line with governance best practice, the Group has traditionally maintained a clear division between the implementation of the financial management strategy (for which the financial management area is responsible) and its monitoring and control (which is the responsibility of the market risk area).
This governance model has been reinforced by being integrated into a more global vision of the Group’s risks, namely the Group risk appetite framework, which responds to the demands from market regulators and participants, as a result of the financial crisis, for banks to strengthen their risk management and control systems.
With respect to the liquidity risk profile and appetite, the Group’s strategy when conducting its businesses aims to structure the balance sheet to make it as resilient as possible to potential liquidity stress scenarios. The liquidity appetite metrics are therefore structured by applying, on an individual basis, the principles of the Group’s liquidity management model, with specific levels for the structural funding ratio and minimum liquidity horizons under various stress scenarios, as detailed in the following sections.
7.2.2 Balance sheet analysis and liquidity risk measurement
Funding and liquidity decision-making is based on a thorough understanding of the Group’s current situation (environment, strategy, balance sheet and liquidity position), of the future liquidity needs of the businesses (liquidity projection) and of the accessibility and situation of the funding sources in wholesale markets.
Its aim is to ensure that the Group maintains optimum liquidity levels to cover its short- and long-term liquidity requirements with stable funding sources, optimizing the impact of funding costs on the income statement.
This requires the monitoring of the balance sheet structure, the preparation of short- and medium-term liquidity projections and the establishment of basic metrics.
Simultaneously, various scenario analyses are conducted considering the additional liquidity needs that could arise if certain very severe but very unlikely events occur. These events might have a varying effect on the various balance sheet items and/or funding sources (extent of roll-over of wholesale financing, run-off of deposits, impairment of liquid assets, etc.), due either to the global market conditions or to the Group’s specific situation.
The results of these balance-sheet, projection and scenario analyses provide the inputs required to prepare the Group’s various contingency plans, which, if necessary, would enable it to anticipate a broad spectrum of potential adverse situations.
All these measures are in line with the practices being promoted by the Basel Committee to strengthen the liquidity of financial institutions, the objective of which is to define a framework of principles and metrics that, in some cases, is currently in the observation phase and, in others, at the development stage.
The measurements, metrics and analyses used by the Group and subsidiaries in liquidity risk management and control are shown in greater detail below:
Methodology for liquidity risk monitoring and control
The liquidity risk measures adopted by the Group pursue the following goals:
Two kinds of basic metrics are used to control liquidity risk: short term and structural. Dynamic metrics include basically the liquidity gap, while static metrics feature the net structural balance-sheet position. The Group supplements these metrics by developing various stress scenarios. Following is a detailed description of these three metrics:
| a) | Liquidity gap |
The liquidity gap provides information on potential cash inflows and outflows -both contractual and those estimated using assumptions- for a given period. Liquidity gap analyses are prepared for each of the main currencies in which the Group operates.
The gap supplies data on the projected sources and applications of funds of all on- and off-balance sheet items in specific time periods. This analysis tool is obtained by considering the net result of the maturity and cash flow structure for each of the time buckets established. The tool is constructed by including the available liquidity and contrasting it with the liquidity requirements resulting from maturities.
In practice, since the same item will behave differently at the various Group subsidiaries, a set of common standards and methodologies are in place to make it possible to construct the liquidity risk profiles of each unit in a uniform manner and to submit these profiles in a comparable form to the Bank’s senior management.
Consequently, as this analysis has to be performed on an individual basis for each subsidiary in view of their autonomous management, a consolidated view of the Group’s liquidity gaps is of very limited use for the management and understanding of liquidity risk.
The various analyses conducted using the liquidity gap as a basis include most notably the wholesale funding analysis. Based on this analysis, a metric has been defined the aim of which is to ensure that the Group has sufficient liquid assets to attain a minimum liquidity horizon in a scenario in which wholesale financing is not renewed on maturity; this minimum horizon is set at 90 days at the Group.
The minimum liquidity horizons are established at corporate level and on a uniform basis for all units/countries, which must calculate their wholesale liquidity metric for the main currencies in which they operate.
Bearing in mind the pressures experienced by the markets in recent years, the wholesale liquidity gap has been monitored particularly closely at the Parent and at the units in the euro zone.
At the end of 2013, all units were comfortably positioned with respect to the horizons set at corporate level for the aforementioned scenario.
| b) | Net structural position |
The purpose of this metric is to determine the reasonableness of the balance-sheet funding structure. The Group’s aim is to ensure that its structural needs (lending, non-current assets, etc.) are satisfied by means of an appropriate combination of wholesale funding sources and a stable retail customer base.
Each unit prepares its liquidity balance sheet based on the nature of its business and compares its liquidity needs with the various funding sources available to it. The essential factors taken into account in determining this metric are the degree of recurrence of the business to be financed, the stability of the funding sources and the readiness with which assets can be converted into cash.
In practice, each subsidiary prepares its own liquidity balance sheet (different from the balance sheet for accounting purposes) by classifying the various asset, liability and off-balance-sheet items on the basis of their nature in terms of liquidity. Thus, the funding structure of each subsidiary is determined, which must at all times conform to a fundamental premise: namely that the basic businesses must be financed with stable funds and medium and long-term financing. The combination of these measures guarantees the robustness of the Bank’s financial structure and the sustainability of its business plans.
As of December 31, 2013, the Group’s structural liquidity surplus stood at €150 billion on a consolidated basis. This surplus is based mainly on fixed income securities (€108 billion), equities (€6 billion) and net deposits at central banks (€48 billion).
| c) | Scenario analysis |
In order to supplement the aforementioned metrics, the Group develops a series of stress scenarios. Its main objective is to identify the critical factors in each potential crisis and, at the same time, to define the most appropriate management measures to address each of the situations assessed.
In their liquidity analyses the units generally consider three different scenarios: systemic, idiosyncratic and hybrid which, given the Group’s characteristics, have been adapted to also take into account a local and a global systemic crisis. These scenarios constitute the minimum standard analysis established for all Group units to be reported to senior management. Also, each unit develops ad-hoc scenarios which replicate major historical crises or the liquidity risks specific to its particular environment.
The fundamental characteristics of the three base scenarios are as follows:
Within this category, a crisis at the Parent Bank, Banco Santander, S.A., which affect a local unit, is considered to be a specific scenario. This scenario was particularly relevant in 2012 in view of the tensions experienced in the peripheral eurozone countries.
These metrics and scenario definitions are directly related to the definition and execution of the liquidity contingency plan that is the responsibility of financial management.
At the end of 2013, in the event of a potential systemic crisis affecting the wholesale funding of the units located in Spain, Santander Group would have an adequate liquidity position. In particular, the wholesale liquidity horizon metric in Spain (included within the liquidity gap measures) would show levels exceeding 90 days in which the liquidity reserve would cover all wholesale financing maturities if they were not renewed.
In addition to these three metrics, the Group has defined a series of internal and market variables to act as early warning signals for potential crises; these signals are also capable of indicating the nature and severity of such crises. The incorporation of these variables in day-to-day liquidity management enables the Group to anticipate any situations that might have an adverse effect on its liquidity risk. Although these alerts vary from country to country and from entity to entity, based on the specific conditioning factors in each case, certain parameters are used across the Group, such as the price of Banco Santander CDSs, the changes in deposits and the trend in central bank official interest rates.
7.2.3 Management tailored to business needs
Santander Group performs its liquidity management at subsidiary and/or business unit level in order to finance its recurring activities with the appropriate terms and prices. In practice, in keeping with the funding principles mentioned above, the liquidity management at these units consists of the following:
The effectiveness of this management effort is based on the fact that it is implemented at all subsidiaries. Specifically, each subsidiary budgets the liquidity requirements resulting from its intermediation activity and assesses its own ability to raise funds in the wholesale markets so that, in ongoing coordination with the Group, it can establish an issue and securitization plan.
Traditionally, the Group’s main subsidiaries have been self-sufficient in terms of their structural funding. The exception has been Santander Consumer Finance (SCF) which, because it specializes in consumer financing mainly through dealer/retailer recommendations, has required the financial support of other Group units, especially the Parent.
7.3 Funding strategy and evolution of liquidity in 2013
7.3.1 Funding strategy
In the last few years the Group’s funding activity has achieved its goal of obtaining sufficient funds for the Group’s recurring business, in a highly demanding environment marked by a heightened perception of risk, scant liquidity at certain time horizons and the increased cost of funding.
This sound performance was underpinned by the extension of the management model to all Group subsidiaries, including recent acquisitions, and, above all, by the adaptation of subsidiaries’ strategies to the growing market demands. These demands were not uniform across the markets and reached far higher levels of difficulty and pressure in certain areas, such as the peripheral regions of Europe.
In any case, it is possible to identify a series of general trends in the policies implemented by Group’s subsidiaries in their funding and liquidity management strategies over the last five years, namely:
Following the tightening of conditions on the wholesale markets, the Group’s decentralized subsidiaries model, with proprietary issues and ratings programs, contributed to maintaining the Group’s high-level participation in the developed wholesale markets, even in the most demanding periods, such as the two-year period encompassing 2011 and 2012.
In particular, the Group has raised its total discount capacity in recent years to around €145 billion.
In 2012, in view of the stresses on the euro markets, the Group pursued a prudent strategy of depositing most of the funds raised by it in the three-year auctions as an immediate liquidity reserve at the European System of central banks, while maintaining a very limited net global position. The reduction of the stresses enabled the Group in 2013 to repay the ECB all of the funds received by Spain in the three-year auctions, thereby reducing its net recourse to funding at the end of 2013 to the lowest levels in five years. Such funding was basically concentrated in Portugal. As of December 31, 2013, the liquidity reserve was located as follows: €103 billion in the U.K., €71 billion in the rest of the units in the convertible currencies area, and the remaining €26 billion mainly in Latin America and Poland.
Thanks to all these developments, based on a sound liquidity management model, the Group currently enjoys a very robust funding structure. The basic features of this distinguishing structure are as follows:
Customer deposits are the Group’s major source of funding. If retail promissory notes are included (given that in Spain they are a substitute for term deposits), these deposits represent around two thirds of the Group’s net liabilities (i.e. of the liquidity balance sheet) and at the end of 2013 they accounted for 91% of net loans.
Medium and long-term wholesale funding represents 20% of the Group’s funding and enables it to comfortably cater for the net loans not financed with customer deposits (commercial gap).
7.3.2 Evolution of liquidity in 2013
At the end of 2013, in comparison with 2012, the Group reported:
The Group maintains its capacity to access the various markets on which it operates, strengthened by the incorporation of new issuer units. In 2013 it launched issues and securitizations in 11 currencies, in which 17 significant issuers in 14 countries participated, with an average maturity of approximately 3.7 years. In 2012 the Group’s issues were made in 10 currencies, involving 13 issuers in 10 countries, with an average maturity of approximately 4.3 years.
8.1 Definition and objectives
The Group defines operational risk as “the risk of loss resulting from inadequate or failed internal processes, human resources or systems or from external events”. Unlike other risks, this is generally a risk that is not associated with products or businesses, but is found in processes and/or assets and is generated internally (people, systems, processes) or as a result of external risks, such as natural disasters.
The aim pursued by the Group in operational risk control and management is primarily to identify, measure/assess, control/mitigate and report on this risk.
The Group’s priority, therefore, is to identify and eliminate any clusters of operational risk, irrespective of whether losses have been incurred. Measurement of this risk also contributes to the establishment of priorities in operational risk management.
For the purpose of calculating regulatory capital for operational risk, the Group decided to opt for the standardized approach provided for under Basel II standards. In this regard, the Group embarked on a project for 2014 to shift to Advanced Measurement Approaches (AMA), for which it has already satisfied the majority of the regulatory requirements. In any event, it should be noted that the short-term priority in operational risk management continues to be focused on mitigation.
8.2 Corporate governance and organizational model
The organizational model for risk management and control follows the Basel guidelines and establishes three lines of defense:
It should be noted that in 2013 the Group bolstered the operational risk control function by creating, as part of the risk unit, the non-financial risk control area to complement the control function performed by the integrated risk control and internal risk validation area (CIVIR).
The implementation, integration and local adaptation of the policies and guidelines established by the corporate area are the responsibility of the local areas, through the operational risk officers identified in each unit.
This operational risk management structure is based on the knowledge and experience of the executives and professionals of the various Group units, with particular importance being attached to the role of the local operational risk officers.
The Group has the following committees for operational risk management and control:
The Group oversees and controls technology and operational risk through its governing bodies. The Group’s board of directors, executive committee and management committee periodically address significant aspects concerning the management and mitigation of operational risk.
In addition, further to approval by the risk committee, the Group formally establishes the operational risk limits on an annual basis. A risk appetite is established which must fall within the low and medium-low risk profiles, which are defined in accordance with various ratio levels. Limits by country and for the Group are established based on the net loss to total income ratio. An assessment is also performed of the operational risk management status of the countries in accordance with certain internal indicators.
8.3 Risk management model
The technology and operational risk management model includes the following phases:
The operational risk control model implemented by the Group provides the following benefits:
Model implementation: global initiatives and results
Substantially all the Group units are currently included in the model, with a high degree of uniformity. However, the different pace of the implementation, phases, timetables and historic depth of the respective databases gives rise to differences in the level of progress between one country and another.
In general, all the Group’s units continue to improve all matters relating to operational risk management, as disclosed in the annual review performed by internal audit.
The main functions, activities and global initiatives which have been adopted and seek to ensure the effective management of operational and technology risk, can be summarized as follows:
With regard to technology risk management, the corporate function continues to strengthen significant aspects, such as the following:
In 2013 the corporate framework for agreements with third parties and control of suppliers was approved, and is applicable for all the entities over which the Group exercises effective control. The framework develops and defines the principle of operational responsibility, and establishes the benchmarks to be taken into consideration in agreements with suppliers, with the primary objective being to establish the principles governing the relationships between Group entities and suppliers, from start to finish, paying particular attention to the following:
This framework also establishes the necessary responsibility, while respecting an appropriate segregation of functions, in order to ensure that risks may be properly identified, the service controlled and supervision maintained within the Group.
8.4 Risk measurement and assessment model
In order to measure and assess technology and operational risk, the Group defined a set of quantitative and qualitative corporate techniques/tools that are combined to perform a diagnosis, based on the identified risks, and obtain a valuation, through the measurement/assessment, of the area/unit.
8.5 Business continuity plan
The Group has a business continuity management system (BCMS) to ensure the continuity of the business processes of its entities in the event of a disaster or serious incident.
This basic objective consists of the following:
8.6 Other matters relating to operational risk control and monitoring
Analysis and monitoring of controls in market operations
In view of the specific features and complexity of financial markets, the Group considers it necessary to continuously strengthen the operational control of its financial market activities. Therefore, in 2013, the control model for this business continued to be improved, with particular emphasis on the following points:
The business is also undergoing a global transformation, combined with the modernization of the technology platforms and operating processes involving a robust control model that enables the operational risk associated with this activity to be reduced.
Operational risk information system
The Group has a corporate information system that supports the operational risk management tools and facilitates the information and reporting functions and needs at local and corporate level.
The system offers event recording modules, risk mapping and assessment, indicators, mitigation and reporting systems, and is applicable to all the Group entities.
Corporate information
The corporate technology and operational risk control area has a system for management of operational risk information that provides data on the Group’s main risk elements. The information available from each country/unit in the operational risk sphere is consolidated to provide a global view with the following features:
Information is specifically prepared on the following aspects:
This information acts as the basis for meeting reporting requirements to the risk committee, senior management, regulators, rating agencies, etc.
The role of insurance in operational risk management
The Group considers insurance as a key factor in operational risk management. Since 2004 the operational risk area has worked closely with the Group’s insurance management area in all activities leading to improvements in the two areas. Some notable examples are as follows:
Part 9. Compliance and reputational risk
9.1 Definitions and objective
Compliance risk is the risk of receiving penalties (financial or otherwise) or being subject to other types of disciplinary measures by the supervisors as a result of failing to comply with laws, regulations, standards, the organization’s self-regulatory standards or codes of conduct applicable to the activity carried on.
Reputational risk is the risk associated with the perception of the Group held by the various internal and external stakeholders with which it is related as part of its business activities, which may have an adverse impact on results or business expectations. This risk includes legal, economic, financial, ethical, social and environmental aspects.
The Group’s objective regarding compliance risk is: (i) to minimize the probability of irregularities arising; and (ii) to identify, report and swiftly resolve any irregularities that might possibly arise. As for reputational risk, bearing in mind the diversity of sources from which it can arise, management of this risk aims to identify such sources and ensure that they are duly attended to so that the probability of their occurring is reduced and the possible impact thereof is mitigated.
9.2 Corporate governance and organizational model
It is the responsibility of the Bank’s board of directors, as part of its supervisory function, to approve the Group’s general risk policy. In the corporate compliance and reputational risk area, the board is in charge of the Group’s general Code of Conduct, the global policy on the prevention of money laundering and terrorist financing and the product and service marketing policy.
The risk committee proposes the Group’s risk policy to the board. Also, as the body responsible for global risk management, it measures reputational risk in its area of activity and decision-making.
The audit and compliance committee is entrusted, inter alia, with the functions of supervising compliance with legal requirements, watching over the effectiveness of internal control and risk management systems, supervising compliance with the Group’s Code of Conduct in the securities markets, with the manuals and procedures for the prevention of money-laundering and, in general, with the bank’s rules of governance and compliance, and making any necessary proposals for improvement, as well as reviewing compliance of the actions and measures resulting from reports or actions of the administrative supervisory and control authorities.
The compliance function reports to the board on an ongoing basis, mainly through the audit and compliance committee, to which the Group’s head of compliance reported at the twelve meetings held by this committee in 2013. The Group’s head of compliance also reported to one meeting of the risk committee in 2013, without prejudice to attending other sessions of this committee when transactions with a possible impact from the reputational risk standpoint were submitted to it.
Lastly, the corporate committees for regulatory compliance, analysis and resolution and marketing (the last two specialize in their respective subjects: the prevention of money laundering and the marketing of products and services) are collective bodies with basic competencies which have a global scope (all geographical areas, all businesses) and are replicated at local level.
The risk unit monitors the compliance risk control framework both from the integrated risk control and internal risk validation area (CIVIR), in the exercise of its functions to support the risk committee, and from the non-financial risk control area created in 2013.
The organizational model revolves around the corporate compliance and reputational risk area, forming part of the general secretariat division, which is entrusted with managing the Group’s compliance and reputational risks. Within this area, which is led by the Group’s head of compliance, are the corporate regulatory compliance risk management office, the corporate reputational risk management office and the corporate financial intelligence unit (UCIF), which is responsible for the prevention of money laundering and terrorist financing. This structure is replicated at local level and also in the global businesses, the appropriate functional reporting channels to the corporate area having been established.
9.3 Risk appetite model
The risk committee was informed at its meeting held on October 2013 of the Group’s risk appetite model applicable to compliance and reputational risk. The model is characterized by the following three elements:
Data of the communications received from the various supervisors each month is fed into the assessment matrix. Each of these communications is allocated a score depending on the risk they represent in terms of: (i) costs due to fines; (ii) process reorganization costs; and (iii) the impact on the brand and reputational risk. These assessments are compared with ratings assigned by internal audit with respect to compliance.
Each local unit is allocated a weighting based on its attributable profit and volume of assets, which can be used to obtain an overall score for the Group.
9.4 Risk management model
The main responsibility for compliance and reputational risk management is shared by the compliance department and the various business and support units that conduct the activities giving rise to risk. The responsibility for developing policies and implementing the corresponding controls lies with the compliance department, which is also responsible for advising senior management on these matters and fostering a culture of compliance, all as part of an annual program whose effectiveness is periodically evaluated.
The compliance department directly manages the basic components of these risks (money laundering, codes of conduct, product marketing, etc.) and ensures that the other components are duly addressed by the corresponding Group unit (responsible financing, data protection, customer claims, etc.), for which purpose it has established the appropriate control and verification systems.
The integrated risk control and internal risk validation area ensures that the risk management model is properly executed. Also, as part of its functions, internal audit performs the tests and reviews required to check that the standards and procedures established at the Group are being complied with.
The central plank of the Group’s compliance program is the general Code of Conduct. This code contains the ethical principles and standards of conduct that must guide the actions of all the Group employees and is complemented in certain matters by the standards contained in the industry-specific codes and manuals(31).
Also, the code establishes: i) the functions and responsibilities regarding compliance by the Group’s relevant governing bodies and divisions; ii) the standards regulating the consequences of the failure to comply; and iii) a channel for reporting and processing notifications of allegedly unlawful actions.
It is the role of the corporate compliance office, under the supervision of the audit and compliance committee and the regulatory compliance committee, to ensure the effective implementation and monitoring of the general Code of Conduct.
The regulatory compliance committee, which is chaired by the Group’s general secretary, has authority on all matters relating to the compliance function, without prejudice to the matters assigned to the two specialist bodies in this area (the corporate marketing committee with regard to the marketing of products and services, and the analysis and resolution committee with regard to the prevention of money laundering and terrorist financing). The regulatory compliance committee is composed of representatives from internal audit, the general secretariat division, financial management, human resources, organization and costs, organization and costs and the most directly affected business units.
The Group’s compliance department has been entrusted with the following compliance and reputational risk management functions:
| 1. | Implementing the Group’s general Code of Conduct and other codes and industry-specific manuals. |
| 2. | Supervising the training activities on the compliance program conducted by the human resources area. |
| 31 | The industry-specific codes and manuals include the prevention of money laundering and terrorist financing manual, the code of conduct in securities markets, the procedures manual for the sale of financial products, the analysis code of conduct, the research policy manual, the use of information and communications technology conduct manual, the property management conduct manual, the purchasing management conduct manual, etc., in addition to the notes and circulars implementing specific points of these codes and manuals. |
| 3. | Directing investigations into any possible breaches, with help from internal audit, and proposing the appropriate penalties to the related committee. |
| 4. | Cooperating with internal audit in the periodic reviews carried out by internal audit on compliance with the general code and with the industry-specific codes and manuals, without prejudice to the periodic reviews of matters of regulatory compliance which are conducted by the compliance department directly. |
| 5. | Receiving and handling the complaints made by employees or third parties through the whistleblowing facility. |
| 6. | Advising on the resolution of doubts arising from the application of the codes and manuals. |
| 7. | Preparing an annual report on the application of the compliance program for submission to the audit and compliance committee. |
| 8. | Regularly reporting to the general secretary, the audit and compliance committee and the board of directors on the implementation of the compliance policy and the compliance program. |
| 9. | Assessing, every year, the changes that it might be appropriate to make to the compliance program, particularly in the event of detecting unregulated risk areas and improvable procedures, and proposing such changes to the audit and compliance committee. |
As regards the industry-specific codes and manuals, the focus of the compliance program is on the following operational spheres, inter alia:
Prevention of money laundering and the financing of terrorism
Policies
As a socially responsible organization, it is a strategic objective for the Group to have an advanced effective system for the prevention of money laundering and the financing of terrorism that is constantly adapted to the latest international regulations and has the capacity to respond to the appearance of new techniques employed by criminal organizations.
The prevention of money laundering and terrorist financing function is articulated in certain policies that establish minimum standards that the Group’s units must observe, and which are prepared in conformity with the principles contained in the 40 recommendations of the Financial Action Task Force (FATF) and the obligations and stipulations of Directive 2005/60/EC of the European Parliament and of the Council of October 26, 2005 on the prevention of the use of the financial system for the purpose of money laundering and terrorist financing.
The corporate policy and the standards implementing it must obligatorily be complied with at all Group units worldwide. In this regard, units should be taken to be all the Group’s banks, subsidiaries, departments or branches, both in Spain and abroad, which, in accordance with their legal status, must be subject to the regulations on the prevention of money laundering and terrorist financing.
Governance and organization
The organization of the prevention of money laundering and terrorist financing function is divided into three parts: the analysis and resolution committee (CAR), the corporate financial intelligence unit (UCIF) and the persons in charge of prevention at various levels.
The CAR is a collective body with a corporate scope which is chaired by the Group’s general secretary and is composed of representatives of internal audit, the general secretary division, human resources, organization and costs and the most directly affected business units. The CAR held four meetings in 2013.
The UCIF’s function is to establish, coordinate and supervise the systems and procedures for the prevention of money laundering and terrorist financing at all Group units.
Also, there are persons responsible for the prevention of money laundering and terrorist financing at four different levels: area, unit, branch and account. Their mission in each case is to support the UCIF from the position of proximity to customers and operations.
At consolidated level, a total of 781 professionals perform the prevention of money laundering and terrorist financing function at the Group (three-quarters of that number on a full-time basis) at 173 units established in 36 countries.
The Group has established corporate systems at all its units and business areas based on decentralized computer software which makes it possible to present directly to the account branches or the relationship managers the transactions and customers which need to be analyzed because of their risk. The aforementioned tools are supplemented by other tools used centrally by the teams of analysts in the prevention units and, based on certain risk profiles and changes in certain customer operational behavior patterns, they enable transactions that might be linked to money laundering or terrorist financing to be analyzed, identified on a preventative basis and monitored.
The Group is a founder member, along with ten other large international banks, of the Wolfsberg Group. The Wolfsberg Group’s objective is to establish international standards to increase the effectiveness of programs to combat money laundering and terrorist financing in the financial community. Various initiatives have been developed which have addressed, inter alia, issues such as the prevention of money laundering in private banking and correspondent banking, and the financing of terrorism. The regulatory authorities and experts in this area consider that the Wolfsberg Group and the principles and guidelines set by it represent an important step in the fight against money laundering, corruption, terrorism and other serious crimes.
Marketing of products and services
Policies
The Group manages the risk that may arise from an inadequate sale of products or an improper provision of services by the Group in accordance with the corporate policies regarding the marketing of products and services.
These corporate policies aim to establish a single corporate framework for all regions, businesses and entities that: (i) reinforces the organizational structures; (ii) ensures that decision-making committees oversee not only the approval of products and services, but also the monitoring thereof over their whole lives; and (iii) establishes the guidelines for defining uniform Group-wide criteria and procedures for the marketing of products and services, which encompass all its phases (approval, pre-sale, sale and follow-up orpost-sale).
These policies are developed and specifically adapted to the actual local situation and to local regulatory requirements through the local internal rules of the various Group units, once authorization has been obtained from the corporate compliance and reputational risk area.
Governance and organization
The management of the risk that might arise from the incorrect selling of products or services is organized by corporate and local marketing committees, the global consultative committee, the corporate monitoring committee, and corporate and local reputational risk management offices.
The corporate marketing committee (CCC) is the Group’s highest decision-making body regarding the approval of products and services. Chaired by the Group’s general secretary, it is composed of representatives of the following divisions: risk, financial accounting and control, technology and operations, general secretariat division, internal audit, commercial banking, global wholesale banking, private banking, asset management and insurance.
The CCC pays particular attention to the suitability of the product or service for the environment in which it is to be marketed, placing particular emphasis on ensuring that:
Also, local marketing committees are created at local level to channel proposals for the approval of new products to theCCC -after issuing a favorable opinion, since initially they do not have any delegated powers- and to approve products that are not new and the related marketing campaigns.
In their respective approval processes the marketing committees’ actions are guided by a risk-based approach, from the view point of both the Bank and the customer.
The global consultative committee is the advisory body of the corporate marketing committee and consists of area representatives who provide an insight into risks, regulations and markets. The global consultative committee, which meets roughly on a quarterly basis, may recommend the review of products affected by market changes, impaired solvency (country, sectors or companies) or changes in the Group’s market perception at medium and long term.
The corporate monitoring committee is the Group’s decision-making body regarding the monitoring of products and services. This committee is chaired by the general secretary and is attended by internal audit, legal advisory, compliance, customer care and the business areas concerned (with the ongoing representation of the commercial network). It meets weekly, and considers and resolves specific issues relating to the selling of products and services at a local level as well as at the level of the Group units outside Spain.
The purpose of the corporate reputational risk management office is to provide the relevant governing bodies with the information required to enable them: (i) to conduct an appropriate analysis of risk in the approval phase, with a twofold focus: impact on the Bank and impact on customers; and (ii) to monitor products over their life cycle.
At local level reputational risk management offices have been established, which are responsible for promoting corporate culture and for ensuring that products are approved and monitored in the respective local spheres in keeping with corporate guidelines.
Conduct in securities markets
Policy
This is set by the Code of Conduct in the securities markets, complemented, inter alia, by the Code of Conduct for analysis activities, the research policy manual and the procedure for detecting, analyzing and communicating transactions suspected of market abuse.
Governance and organization
The organization is centered on the corporate compliance office and local and subsidiaries’ compliance divisions.
The Group’s compliance department performs the following main functions in relation to the rules of conduct in securities markets:
| 1. | Registering and controlling sensitive information that is known by and/or generated at the Group; |
| 2. | Keeping lists of the securities affected and the initiated persons, and monitoring transactions with these securities; |
| 3. | Monitoring transactions with restricted securities depending on the type of activity, portfolios or groups to which the restriction applies; |
| 4. | Receiving and attending to notifications of, and requests for, authorization of transactions for own account; |
| 5. | Controlling transactions for own account of the persons subject to compliance with the Code of Conduct; |
| 6. | Managing breaches; |
| 7. | Resolving any issues raised concerning the Code of Conduct in Securities Markets (CCMV); |
| 8. | Recording and resolving conflicts of interest and the situations that might give rise to them; |
| 9. | Assessing and managing any conflicts that might arise in the analysis activity. |
| 10. | Maintain the files required to control compliance with the obligations established in the CCMV; |
| 11. | Develop ordinary contact with the regulators; |
| 12. | Organizing training and, in general, performing the actions required to apply the CCMV; and |
| 13. | Analyzing actions that might be suspected of constituting market abuse and, where appropriate, reporting them to the supervisors. |
Criminal risk prevention
The Group’s compliance department has also been entrusted with the management of the criminal risk prevention model, which resulted from the entry into force of Organic Law 5/2010, which made legal entities criminally responsible for crimes committed on their account or for their benefit by directors or representatives or employees as a result of a lack of control.
Towards the end of 2013 a review certification process of the Group’s criminal risk prevention model was performed based in part on third-party appraisal, which verified the following: i) the effective implementation of the Group’s internal rules: ii) the existence of general control measures and; iii) the existence of specific control measures. Also, the criminal code reform project currently under way was monitored, with a view to anticipating as far as possible the adaptation tasks.
Relationships with supervisors and dissemination of information to the markets
The compliance department is responsible for responding to the information requirements of the regulatory and supervisory bodies, both in Spain and in other countries where the Group operates, monitoring implementation of the measures arising from the reports or inspections conducted by these bodies and supervising the way in which the Group disseminates institutional information in the markets, transparently and in accordance with the regulators’ requirements. The audit and compliance committee is informed of the main issues at each of its meetings.
10.1 Compliance with the new regulatory framework
The regulations known as Basel III, which establish new global capital and liquidity standards for financial institutions, came into force in 2014.
From the capital standpoint, Basel III redefines what is considered to be available capital at financial institutions (including new deductions and raising the requirements for eligible equity instruments), increases the minimum capital requirements, requires financial institutions to operate permanently with capital buffers, and adds new requirements in relation to the risks considered.
The Group shares the ultimate objective pursued by the regulator with this new framework, namely to endow the international financial system with greater stability and resilience. In this regard, for many years the Group has collaborated on the impact studies for calibrating the new rules conducted by the Basel Committee and the European Banking Authority (EBA) and coordinated at local level by the Bank of Spain.
In Europe, the new standards have been implemented through Directive 2013/36/EU, known as the Capital Requirements Directive (“CRD IV”), and the related Capital Requirements Regulation (“CRR”), which is directly applicable in all EU member states (as part of the Single Rulebook). In addition, the standards are subject to Implementing Technical Standards commissioned from the European Banking Authority (EBA), some of which will be issued in the coming months/years.
The Capital Requirements Regulation came into force on January 1, 2014, with many of its rules subject to various implementation timetables. This transitional implementation phase, which affects mainly the definition of eligible capital, concludes at the end of 2017, except with regard to the deduction for deferred tax assets, the transition period for which lasts until 2023.
Subsequent to the transposition of Basel III into European legislation, the Basel Committee has continued to issue additional standards, some in the form of public consultation processes, which will entail a future amendment of CRD IV and the CRR. The Group will continue to support the regulators by offering its opinions and participating in impact studies.
The Group currently has robust capital ratios, in keeping with its business model and risk profile, which, coupled with its substantial capacity to generate capital organically and the gradual implementation timetable envisaged for the new requirements in the legislation, place it in a position to comply with Basel III.
With regard to credit risk, the Group is continuing to adopt its plan to implement the advanced internal ratings-based (AIRB) approach under Basel for substantially all its banks, and it intends to do so until the percentage of net exposure of the loan portfolio covered by this approach exceeds 90%. The attainment of this objective in the short term will also depend on the acquisitions of new entities and the need for the various supervisors to coordinate the validation processes for the internal approaches. The Group is present in geographical areas where there is a common legal framework among supervisors, as is the case in Europe through the Capital Requirements Directive. However, in other jurisdictions, the same process is subject to the framework of cooperation between the home and host country supervisors under different legislations, which in practice entails adapting to different criteria and timetables in order to obtain authorization to use the advanced approaches on a consolidated basis.
Accordingly, the Group continued in 2013 with the project for the progressive implementation of the technology platforms and methodological improvements required for the roll-out of the AIRB approaches for regulatory capital calculation purposes at the remaining Group units. To date the Group has obtained authorization from the supervisory authorities to use advanced approaches for the calculation of regulatory capital requirements for credit risk for the Parent, the main subsidiaries in Spain, the United Kingdom and Portugal, certain portfolios in Mexico, Brazil and Chile, as well as for Santander Consumer Finance in Spain and the United States. The Group’s Basel implementation strategy is focused on obtaining authorization for the use of AIRB approaches at the main entities in the Americas and Europe.
With regard to operational risk, the Group currently uses the standardized approach for regulatory capital calculation purposes and has embarked on a project to roll out AMA approaches once it has collated sufficient data using its own management model. The Group considers that the internal model should be developed primarily on the basis of the experience accumulated in managing an entity through the corporate guidelines and criteria established after assuming control, which are a distinctive feature.
As regards the other risks explicitly addressed in Pillar I of the Basel Capital Accord, Santander Group has been authorized to use its internal model for market risk on the treasury areas’ trading activities in Spain, Chile, Portugal and Mexico, thus continuing implementation of the roll-out plan it submitted to the Bank of Spain for the other units.
With respect to Pillar II, the Group uses an economic capital approach to quantify its global risk profile and its capital adequacy position as part of the internal capital adequacy assessment process (ICAAP) at consolidated level. This process includes regulatory and economic capital planning under several alternative economic scenarios, in order to ensure that the internal capital adequacy targets are met even in plausible but highly unlikely adverse scenarios. The ICAAP exercise is supplemented with a qualitative description of the risk management and internal control systems, is reviewed by internal audit and internal validation teams and is subject to a corporate governance structure that culminates in its approval by the Group’s board of directors, which also establishes the strategic factors relating to risk appetite and capital adequacy targets on an annual basis.
In accordance with the capital requirements set by the European Directive and Bank of Spain rules, the Group publishes its Pillar III disclosures report on an annual basis. This report comfortably meets the market transparency requirements in relation to Pillar III. The Group considers the market reporting requirements to be fundamental in order to complement the minimum capital requirements of Pillar I and the supervisory review process performed through Pillar II. In this respect, its Pillar III disclosures report incorporates the recommendations made by the European Banking Authority (EBA), thus making Santander Group an international benchmark in terms of market transparency, as is already the case with its annual report.
Parallel to the roll-out of advanced approaches at the various Group units, Santander Group is carrying out an ongoing training process on Basel at all levels of the organization, covering a significant number of professionals from all areas and divisions, with a particular focus on those most affected by the changes arising from the adoption of the new international capital standards.
10.2 Economic capital
Economic capital is the capital required, based on an internally-developed model, to support all the risks of the business activity with a given solvency level. In the case of Santander, the solvency level is determined by the AA-/A+ long-term target rating, which results in the application of a 99.95% confidence level (higher than the regulatory 99.90%) for the purpose of calculating the required capital.
The Group’s economic capital model complements the regulatory approach by including in its measurement all the significant risks incurred in the Group’s operations. Accordingly, it considers risks such as concentration risk, structural interest rate risk, business risk, pension risk and other risks outside the scope of regulatory Pillar I capital requirements. Economic capital also includes the diversification effect, which in the case of Santander Group, owing to the multinational, multibusiness nature of its operations, is of key importance in determining its overall risk and solvency profile.
Comparison of regulatory and economic capital requirements is distorted because there are certain risks, such as goodwill, which for regulatory purposes are presented as deductions from the eligible capital base instead of being included as capital requirements. Similarly, the economic capital required for these risks can be presented as deductions from the internal capital base (following the regulatory method) or as part of the economic capital requirements, which is the preferred option within the Group. Furthermore, as we have mentioned above, measurement of economic capital includes certain risks that are not present in the regulatory approach (the so-called Pillar II risks).
The concept of diversification is fundamental for the proper measurement and understanding of the risk profile of a group with global operations such as Santander. The fact that the Group conducts its business activities in various countries through a structure of differentiated legal entities, across a broad spectrum of customer and product segments, thereby also incurring various types of risks, means that the Group’s earnings are less vulnerable to any adverse situation that might arise with respect to a particular market, portfolio, customer or risk. Despite the current high level of globalization of the world’s economies, the economic cycles are not the same and do not have the same intensity in the various geographical regions. As a result, groups with global presence display more stable results and have a greater capacity to withstand possible crises affecting specific markets or portfolios, which is synonymous with a lower level of risk. In other words, the risk and the associated economic capital borne by the Group as a whole is less than the risk and the capital arising from the sum of its various components considered separately.
Lastly, the economic capital measurement and aggregation model also considers the concentration risk for wholesale portfolios (large corporations, banks and sovereigns), in terms of both the size of their exposure and their industry-based or geographical concentration. Any geographical or product concentration in retail portfolios is captured through the application of an appropriate correlation model.
Economic capital is a fundamental tool for the internal management and implementation of the Group’s strategy, from the viewpoint of both the assessment of capital adequacy and the management of portfolio and business risk.
With regard to capital adequacy, in the context of Pillar II of the Basel Capital Accord, the Group conducts the internal capital adequacy assessment process using its economic capital model. To this end, the Group plans the business performance and the capital requirements under a central scenario and under alternative stress scenarios. With this planning the Group ensures that it will continue to meet its capital adequacy targets, even in adverse economic scenarios.
Also, the economic capital metrics make it possible to assess risk-return targets, price transactions on a risk basis and gauge the economic viability of projects, units or lines of business, with the ultimate objective of maximizing the generation of shareholder value.
Capital planning and stress tests
Capital stress tests have gained particular significance as a tool for the dynamic evaluation of banks’ risk exposure and capital adequacy. A new forward-looking assessment model is becoming a key component of capital adequacy analysis.
This forward-looking assessment is based on both macroeconomic and idiosyncratic scenarios that are highly improbable but nevertheless plausible. To conduct the assessment, it is necessary to have robust planning models capable of transferring the effects defined in the projected scenarios to the various elements that have a bearing on the adequacy of a bank’s capital.
The ultimate goal of capital stress tests is to perform a complete evaluation of banks’ risk exposure and capital adequacy in order to determine any possible capital requirements that would arise if banks failed to meet the regulatory or internal capital targets set.
In particular, the European Central Bank (ECB) has announced that the current comprehensive assessment that it will carry out in the course of 2014 ahead of taking up its role as the single supervisor (as part of the Single Supervisory Mechanism (SSM)) will culminate in a stress test to be conducted by the European Banking Authority (EBA) in collaboration with the ECB itself, which is scheduled to be completed in October 2014. The objective of this entire process is to eradicate any possible uncertainty as to the solvency of the European banking system, to provide transparency on the resilience and solvency of banks and, where required in light of the test results, to adopt any necessary measures (including possible additional capital requirements).
More specifically, the forthcoming stress test will be conducted on a total sample of 124 banks covering at least 50% of the banking sector in each EU Member State (as expressed in terms of assets). The stress test will be carried out over a three-year time horizon and will assess the impact of risk drivers on the solvency of banks, including credit risk, market risk, sovereign risk, securitization and cost of funding.
The capital hurdle rates, measured in terms of Common Equity Tier 1 (CET1), are expected to be 8% CET1 for the baseline scenario and 5.5% CET1 for the adverse scenario. Publication of the results of the stress test is scheduled for the end of October 2014.
As a starting point for the stress test and within the scope of the comprehensive assessment, throughout 2014 the ECB will conduct an asset quality review (AQR), an in-depth analysis of banks’ balance sheets and the quality of their assets.
The Group has defined a capital planning and stress testing process not only to enable it to respond to the various regulatory exercises, but also to serve as a key tool forming an integral part of the Bank’s management and strategy.
The purpose of the internal capital planning and stress testing process is to ensure the current and future sufficiency of the Group’s capital, even in adverse but plausible economic scenarios. To this end, taking as a basis the Group’s initial position (as defined by its financial statements, its capital base, its risk parameters and its regulatory ratios), estimates are made of the expected outcomes for the Group in various business environments (including severe recessions as well as “normal” macroeconomic scenarios), and the Group’s capital adequacy ratios, projected generally over a three-year period, are obtained.
The process implemented provides a comprehensive view of the Group’s capital for the time horizon analyzed and in each of the scenarios defined. The analysis incorporates regulatory capital, economic capital and available capital metrics.
This process facilitates achievement of the ultimate goal pursued by capital planning, since it has become a strategically important element for the Group that:
In addition, the entire process is carried out with the maximum involvement and under the close supervision of senior management, and within a framework that guarantees suitable governance and the application of adequate levels of challenge, review and analysis to all components of the process.
One of the key elements in the capital planning and stress testing exercises, since it plays a particularly important role in income statement projections for the adverse scenarios defined, is the calculation of the provisions that would be required in those scenarios, primarily the provisions recognized to cover losses on the loan portfolios. Specifically, in order to calculate the credit loss provisions for its loan portfolio, Santander Group uses a methodology which ensures that, at all times, it has a level of provisions sufficient to cover all the credit losses projected by its internal expected loss models.
This methodology is widely accepted and is similar to that used in previous stress-testing exercises (e.g. the 2011 EBA stress test or the 2012 stress test on the Spanish banking sector).
Lastly, the capital planning and stress testing process culminates in an analysis of capital adequacy in the various scenarios designed and over the established time horizon. The aim is to assess the Group’s capital adequacy and to ensure that it meets both its internal capital targets and all regulatory requirements.
In the course of the recent economic crisis, the Group underwent four stress tests in which it proved its strength and solvency in the most extreme and severe macroeconomic scenarios. All the stress tests evidenced that, thanks mainly to the Group’s business model and geographical diversification, Banco Santander will continue to generate profit for its shareholders and to comply with the most stringent regulatory requirements.
RORAC and value creation
The Group has used RORAC methodology in its risk management since 1993, with the following objectives:
The RORAC methodology facilitates the comparison, on a like-for-like basis, of the performance of transactions, customers, portfolios and businesses, and identifies those which achieve a risk-adjusted return higher than the Group’s cost of capital, thus aligning risk management and business management with the aim of maximizing value creation, which is the ultimate objective of Group senior management.
The Group periodically assesses the level of and the changes in the value creation (VC) and return on risk-adjusted capital (RORAC) of the Group and of its main business units. The VC is the profit generated over and above the cost of the economic capital (EC) used, and is calculated using the following formula:
VC = Profit - (average EC x cost of capital)
The profit used is obtained by making the required adjustments to accounting profit in order to reflect only the recurring profit obtained by each unit from its business activity.
If a transaction or portfolio yields a positive return, it will be contributing to the Group’s profit, although it will only create shareholder value when this return exceeds the cost of capital.
2013 witnessed an uneven performance of the business units in terms of value creation, although the instances of decreasing value creation predominated. The Group’s results and, therefore, the RORAC and value creation figures were shaped by the weakness of the economic cycle of various Group units in Europe and, in particular, in Spain.
Item 12. Description of Securities Other than Equity Securities.
Not Applicable
Not Applicable
Not Applicable
Our Depositary is J.P. Morgan Chase & Co., with its principal executive office located at 270 Park Avenue, New York, NY 10017-2070.
Each ADS represents the right to receive one share of Capital Stock of Santander, par value €0.50 each.
307
Fees charged to investors as outlined in the deposit agreement are the following:
Category of Service | Depositary Actions | Associated Fee | ||
| (a) Deposit or substituting the underlying shares | Each person to whom ADSs are issued against deposits of shares, including deposits in respect of share distributions, rights and other distributions.
Each person surrendering ADRs for the withdrawal of deposited securities. | $5.00 for each 100 ADSs (or portion thereof) delivered or surrendered. | ||
| (b) Receiving or distributing dividends | Distribution of dividends. | $0.01 per ADS. | ||
| (c) Selling or Exercising Rights | Distribution or sale of securities, the fee being in an amount equal to the fee for the execution and delivery of ADSs which would have been charged as a result of the deposit of such securities. | $5.00 for each 100 ADSs (or portion thereof). | ||
| (d) Withdrawing an underlying security | Acceptance of ADRs surrendered for withdrawal of deposited securities. | $5.00 for each 100 ADSs (or portion thereof) evidenced by the ADRs surrendered. | ||
| (d) Expenses of the Depositary | Expenses incurred on behalf of Holders in connection with:
i) Stock transfer or other taxes and other governmental charges. ii) Cable, telex and facsimile transmission and delivery. iii) Expenses of the Depositary in connection with the conversion of foreign currency into iv) Such fees and expenses as are incurred by the Depositary (including without limitation expenses incurred on behalf of Holders in connection with compliance with foreign exchange control regulations or any law or regulation relating to foreign investment) in delivery of deposited securities or otherwise in connection with the Depositary’s or its Custodian’s compliance with applicable law, rule or regulation. | Expenses payable at the sole discretion of the depositary. | ||
| 32 | The Depositary may sell (by public or private sale) sufficient securities and property received in respect of such share distributions, rights and other distributions prior to such deposit to cover such charge. |
Fees received from our depositary in connection with the ADR program are the following:
Contract amount:
Fixed: $3,868,240.62$3,521,398.94
Variable: $2,146,053.09$414,151.13
Total: $6,014,293.71$3,935,550.07
Actually paid:
Fixed: $3,868,240.62$3,521,398.94
Variable: $2,075,119.29$0
Total: $5,943,359.91$3,521,398.94
Waived fees:
Ongoing program maintenance per contract year: $150,000
Annual meeting services: $15,000
Investor Relations advisory services: $185,000
Total: $350,000
308
Item 13. Defaults, Dividend Arrearages and Delinquencies
AA.. Not Applicable
BB.. Not Applicable
Item 14. Material Modifications to the Rights of Security Holders and Use of Proceeds
AA.. Not Applicable
BB.. Not Applicable
CC.. Not Applicable
DD.. Not Applicable
EE.. Not Applicable
Item 15. Controls and Procedures
(a)(a) Evaluation of Disclosure Controls and Procedures
As of December 31, 2011,2013, Banco Santander, S.A., under the supervision and with the participation of its management, including its disclosure committee, its chief executive officer, chief financial officer, and chief accounting officer, performed an evaluation of the effectiveness of the design and operation of its disclosure controls and procedures (as defined in Rule 13a-15 (e) under the Exchange Act). There are, as described below, inherent limitations to the effectiveness of any control system, including disclosure controls and procedures. Accordingly, even effective disclosure controls and procedures can provide only reasonable assurance of achieving their control objectives.
Based on such evaluation, Banco Santander, S.A.’s chief executive officer, chief financial officer and chief accounting officer concluded that Banco Santander, S.A.’s disclosure controls and procedures are effective in ensuring that information Banco Santander, S.A. is required to disclose in the reports it files or submits under the Exchange Act is (1) recorded, processed, summarized and reported within the time periods specified in the SEC’s rules and forms, and (2) accumulated and communicated to Banco Santander, S.A.’s management, including its disclosure committee, chief executive officer, chief financial officer and the chief accounting officer, as appropriate to allow timely decisions regarding required disclosures.
(b)Management’s Report on Internal Control over Financial Reporting
The management of Banco Santander, S.A. is responsible for establishing and maintaining an adequate internal control over financial reporting as defined in Rule 13a-15 (f) under the Exchange Act.
Our internal control over financial reporting is a process designed by, or under the supervision of, the Bank’s principal executive and principal financial officers and effected by the Bank’s board of directors, management and other personnel, to provide reasonable assurance regarding the reliability of financial reporting and the preparation of consolidated financial statements for external purposes, in accordance with generally accepted accounting principles. For Banco Santander, S.A., generally accepted accounting principles refer to the International Financial Reporting Standards as issued by the International Accounting Standards Board (“IFRS-IASB”).
Our internal control over financial reporting includes those policies and procedures that:
Pertain to the maintenance of records that in reasonable detail accurately and fairly reflect the transactions and dispositions of our assets;
Provide reasonable assurance that transactions are recorded as necessary to permit preparation of financial statements in accordance with generally accepted accounting principles, and that our receipts and expenditures are being made only in accordance with authorizations of our management and directors; and
309
Provide reasonable assurance regarding prevention or timely detection of unauthorized acquisition, use or disposition of our assets that could have a material effect on the financial statements.
Because of its inherent limitations, internal control over financial reporting may not prevent or detect misstatements. Also, projections of any evaluation of effectiveness to future periods are subject to the risk that controls may become inadequate because of changes in conditions, or that the degree of compliance with the policies or procedures may deteriorate.
We have adapted our internal control over financial reporting to the most rigorous international standards and comply with the guidelines set by the Committee of Sponsoring Organizations of the Treadway Commission in its Enterprise Risk Management Integrated Framework. These guidelines have been extended and installed in our Group companies, applying a common methodology and standardizing the procedures for identifying processes, risks and controls, based on the Enterprise Risk Management Integrated Framework.
The documentation, update and maintenance processes in the Group’s companies have been constantly directed and monitored by a global coordination team, which set the guidelines for its development and supervised its execution at the unit level.
The general framework is consistent, as it assigns to management specific responsibilities regarding the structure and effectiveness of the processes related directly and indirectly with the production of consolidated financial statements, as well as the controls needed to mitigate the risks inherent in these processes.
Under the supervision and with the participation of the management of the Group, including our chief executive officer, our chief financial officer and our chief accounting officer, we conducted an evaluation of the effectiveness of our internal control over financial reporting as of December 31, 2011,2013, based on the framework set forth by the Committee of Sponsoring Organizations of the Treadway Commission (“COSO”) inEnterprise Risk Management —Internal Control – Integrated Framework (1992). Based on this assessment, management believes that, as of December 31, 2011,2013, its internal control over financial reporting was effective based on those criteria.
Our independent registered public accounting firm has issued an audit report on the effectiveness of our internal control over financial reporting as of December 31, 2011.2013. This report follows below.
(c)(c) Attestation report of the registered public accounting firm
310
REPORT OF INDEPENDENT REGISTERED PUBLIC ACCOUNTING FIRM
To the Board of Directors and Shareholders of Banco Santander, S.A.:
We have audited the internal control over financial reporting of Banco Santander, S.A. (the “Bank”) and Companies composing, together with the Bank, the Santander Group (the “Group”) as of December 31, 2011,2013, based on criteria established inInternal Control — Integrated Framework (1992) issued by the Committee of Sponsoring Organizations of the Treadway Commission. The Group’s management is responsible for maintaining effective internal control over financial reporting and for its assessment of the effectiveness of internal control over financial reporting, included in the accompanying Management’s Report on Internal Control Over Financial Reporting. Our responsibility is to express an opinion on the Group’s internal control over financial reporting based on our audit.
We conducted our audit in accordance with the standards of the Public Company Accounting Oversight Board (United States of America). Those standards require that we plan and perform the audit to obtain reasonable assurance about whether effective internal control over financial reporting was maintained in all material respects. Our audit included obtaining an understanding of internal control over financial reporting, assessing the risk that a material weakness exists, testing and evaluating the design and operating effectiveness of internal control based on the assessed risk, and performing such other procedures as we considered necessary in the circumstances. We believe that our audit provides a reasonable basis for our opinion.
A company’s internal control over financial reporting is a process designed by, or under the supervision of, the company’s principal executive and principal financial officers, or persons performing similar functions, and effected by the company’s board of directors, management, and other personnel to provide reasonable assurance regarding the reliability of financial reporting and the preparation of financial statements for external purposes in accordance with generally accepted accounting principles. A company’s internal control over financial reporting includes those policies and procedures that (1) pertain to the maintenance of records that, in reasonable detail, accurately and fairly reflect the transactions and dispositions of the assets of the company; (2) provide reasonable assurance that transactions are recorded as necessary to permit preparation of financial statements in accordance with generally accepted accounting principles, and that receipts and expenditures of the company are being made only in accordance with authorizations of management and directors of the company and (3) provide reasonable assurance regarding prevention or timely detection of unauthorized acquisition, use, or disposition of the company’s assets that could have a material effect on the financial statements.
Because of the inherent limitations of internal control over financial reporting, including the possibility of collusion or improper management override of controls, material misstatements due to error or fraud may not be prevented or detected on a timely basis.
Also, projections of any evaluation of the effectiveness of the internal control over financial reporting to future periods are subject to the risk that the controls may become inadequate because of changes in conditions, or that the degree of compliance with the policies or procedures may deteriorate.
In our opinion, the Group maintained, in all material respects, effective internal control over financial reporting as of December 31, 2011,2013, based on the criteria established inInternal Control — Integrated Framework (1992) issued by the Committee of Sponsoring Organizations of the Treadway Commission.
We have also audited, in accordance with the standards of the Public Company Accounting Oversight Board (United States of America), the consolidated financial statements as of and for the year ended December 31, 20112013 of the Group and our report dated April 27, 201229, 2014 expressed an unqualified opinion on those financial statements.
/s/ Deloitte, S.L.
DELOITTE, S.L.
Madrid, Spain
April 27, 201229, 2014
311
(d)(d) Changes in internal controls over financial reporting.reporting. There was no change in our internal control over financial reporting that occurred during the period covered by this annual report that has materially affected, or is reasonably likely to materially affect, our internal control over financial reporting.
Item 16A. Audit committee financial expert
The audit and compliance committee has fourthree members, all of whom are non-executive independent directors (as defined by Article 6.2 c) of the Rules and Regulations of the Board). All members of the audit and compliance committee also meet the independence criteria set by the NYSE for foreign private issuers. Our Rules and Regulations of the Board provide that all members of the audit and compliance committee must have knowledge, aptitude and experience in the areas of accounting, auditing or risk management. Currently, the chairman of the audit and compliance committee is Manuel Soto.Guillermo de la Dehesa, the third vice chairman of the board of directors. Our standards for director independence may not necessarily be consistent with, or as stringent as, the standards for director independence established by the NYSE.NYSE for U.S. issuers.
Our board of directors has determined that Manuel SotoGuillermo de la Dehesa is an “Audit Committee Financial Expert” in accordance with SEC rules and regulations.
We have adopted a code of ethics (the “General Code of Conduct”) that applies to members of the board and to all employees of Banco Santander, S.A. and of the Grupo Santander companies, notwithstanding the fact that certain persons are also subject to the Code of Conduct in Securities Markets or to other Codes of Conduct related specifically to the activity or lines of business in which they undertake their responsibilities. This Code establishes the principles that guide these officers’ and directors’ respective actions: ethical conduct, professional standards and confidentiality. It also establishes the limitations and defines the conflicts of interest arising from their status as senior executives or directors.
In 2012, a new General Code of Conduct has beenwas published. The current Code has primarily broadened the scope of the previous one by: (i) including guidelines for certain specific situations not included in the previous version and (ii) listing additional responsibilities in relation to the Code for compliance management and for other bodies and divisions of the Group.
The current General Code of Conduct set an open door policy by which any Grupo Santander employee who becomes aware of an allegedly unlawful act or an act in breach of the General Code of Conduct or of our business specific codes and manuals may report such act directly to compliance management.
This Code is available on our website, which does not form part of this annual report on Form 20-F, atwww.santander.comunder the heading “Information for shareholders and investors—corporate governance—codes of conduct”.
312
Item 16C. Principal Accountant Fees and Services
Amounts paid to the firms belonging to the Deloitte worldwide organization, the Group’s principal auditor, for statutory audit and other services were as follows
| 2011 | 2010 | 2009 | ||||||||||
| (in millions of euros) | ||||||||||||
Audit Fees | 20.4 | 21.6 | 19.6 | |||||||||
Audit Related Fees (1) | 10.8 | 10.7 | 11.0 | |||||||||
Non-Audit Related Fees (excluding tax services) | 2.6 | 1.7 | 1.5 | |||||||||
Tax Fees | 3.8 | 3.9 | 3.2 | |||||||||
Other Fees Paid (2) | 16.2 | 8.9 | 3.7 | |||||||||
| 53.8 | 46.8 | 39.0 | ||||||||||
| 2013 | 2012 | 2011 | ||||||||||
| (in millions of euros) | ||||||||||||
Audit Fees(1) | 35.9 | 38.1 | 36.2 | |||||||||
Audit Related Fees(1) | 20.8 | 20.6 | 13.6 | |||||||||
Tax Fees | 4.6 | 4.3 | 3.8 | |||||||||
All Other Fees(2) | 6.5 | 8.1 | 5.7 | |||||||||
| 67.8 | 71.1 | 59.3 | ||||||||||
| (1) |
| See detail of most significant concepts included in Note 48 to the Consolidated Financial Statements. |
| (2) | It includes €2.7 million in 2012, €1.5 million in 2011 for services related to adaptation of the Group to new regulations. |
The services commissioned fromprovided by the Group’s auditors meet the independence requirements stipulated by the Legislative Royal Decree 1/2011, of 1 July, 1, approving the Consolidated Audit Act, as well as those included in the Sarbanes-Oxley Act of 2002, assumed byin the SEC and in the Rules and Regulations of the Board.
The audit and compliance committee is required to pre-approve the audit and non-audit services performed by the Group’s auditors in order to assure that the provision of such services doesdo not impair the audit firm’s independence.
In the first months of each year the auditAudit and compliance committeeCompliance Committee proposes to the board the appointment of the independent auditor. At that moment,time, the auditAudit and compliance committeeCompliance Committee pre-approves the audit and audit related services that the appointed auditors will be required to carry out during the year to comply with the applicable regulation. These services will be included in the correspondentcorresponding audit contracts of the Bank and of any other company of the Group with its principal auditing firm.
In addition, non-recurring audit or audit-related services and all non-audit services provided by the Group’s principal auditing firm or other auditing firms are subject to case-by-case pre-approval by the auditAudit and compliance committee.Compliance Committee.
During 2013 the Audit and Compliance Committee reviewed the policies and procedures to manage the approval of services to be rendered by the auditor. A list of pre-approved services, including the most common non-prohibited services that may be required from the auditor, was adopted. Specific approval is required for other services not included in the list. The Chief Accounting Officer is in charge of managing the process and must report monthly to the Audit Committee detailing all services to be provided by auditors, including those pre-approved and others requiring individual approval.
All services provided by the Group’s principal auditing firm in 20112013 detailed in the table above were approved by the auditAudit and compliance committee.
313
Item 16D. Exemption from the Listing Standards for Audit Committees
Not applicable.
Item 16E. Purchases of Equity Securities by the Issuer and Affiliated Purchasers
The following table shows the repurchases of shares made by the Bank or any of its Affiliated Purchasers during 2011:2013:
| 2011 | (a) Total number of shares (or units) purchased | (b) Average price paid per share (or unit) | (c) Total number of shares (or units) purchased as part of publicly announced plans or programs | (d) Maximum number (or approximate dollar value) of shares (or units) that may yet be purchased under the plans or programs | ||||||||||||||||||||||||||||
2013 | (a) Total number of shares (or units) purchased* | (b) Average price paid per share (or unit) | (c) Total number of shares (or units) purchased as part of publicly announced plans or programs | (d) Maximum number (or approximate dollar value) of shares (or units) that may yet be purchased under the plans or programs | ||||||||||||||||||||||||||||
January | 79,225,239 | 7.36 | — | — | 90,075,748 | 6.09 | — | — | ||||||||||||||||||||||||
February | 32,148,252 | 8.76 | — | — | 112,269,278 | 5.74 | — | — | ||||||||||||||||||||||||
March | 66,854,716 | 8.15 | — | — | 97,141,521 | 5.85 | — | — | ||||||||||||||||||||||||
April | 163,846,496 | 8.02 | — | — | 207,763,046 | 5.25 | — | — | ||||||||||||||||||||||||
May | 84,014,688 | 8.29 | — | — | 65,672,628 | 4.45 | — | — | ||||||||||||||||||||||||
June | 69,115,654 | 7.67 | — | — | 58,291,496 | 4.63 | — | — | ||||||||||||||||||||||||
July | 102,420,178 | 6.78 | — | — | 102,784,763 | 4.43 | — | — | ||||||||||||||||||||||||
August | 96,509,870 | 6.14 | — | — | 97,496,672 | 5.37 | — | — | ||||||||||||||||||||||||
September | 59, 314,197 | 5.65 | — | — | 28,807,173 | 4.27 | — | — | ||||||||||||||||||||||||
October | 86,783,486 | 6.04 | — | — | 94,064,958 | 5.33 | — | — | ||||||||||||||||||||||||
November | 99,870,397 | 5.61 | — | — | 43,576,649 | 5.31 | — | — | ||||||||||||||||||||||||
December | 53,909,271 | 5.18 | — | — | 68,990,959 | 4.97 | — | — | ||||||||||||||||||||||||
Total | 994,012,444 | 1,066,934,891 | ||||||||||||||||||||||||||||||
| * | The number of shares purchased included securities lending and short positions. |
During 2011,2013, all purchases and sales of equity securities were made in open-market transactions.
Item 16F. Changes in Registrant’s Certifying Accountant
Not applicable
Item 16G. Corporate Governance
The following is a summary of the significant differences between our corporate governance practices and those applicable to domestic issuers under the NYSE listing standards.
Independence of the directors on the board of directors
Under the NYSE corporate governance rules, a majority of the board of directors of any U.S. company listed on the NYSE must be composed of independent directors, thewhose independence of whom is determined in accordance with highly detailed rules promulgated by the NYSE. Spanish law does not contain any such requirements although there is a non-binding recommendation for listed companies in Spain that the number of independent directors be at least one third of the total size of the Board. Article 42.1 of our Bylaws establishes that the shareholders at the general shareholders’ meeting shall endeavor to ensure that independent directors represent at least one-third of the total number of directors. Article 6.1 of the Rules and Regulations of the Board of Directors establishes likewise that the board shall endeavor that the number of independent directors represent at least one-third of all directors. The board of directors of Santander has eight independent directors (out of sixteen directors total), as defined in Article 6.2.c) of the Rules and Regulations of the Board. We have not determined whether or not the directors on the Santander board would be considered independent under the NYSE rules except in the case of the members of our audit and compliance committee where we have determined that all of them meet the NYSE independence criteria for foreign private issuers.issuers set forth in Rule 10A-3 under the Exchange Act. Article 6.2.c) of the Rules and Regulations of the Board defines the concept of an independent director as follows:
“External or non-executive Directors who have been appointed based on their personal or professional status and who perform duties not conditioned by relationships with the Company, or with the significant shareholders or management thereof shall be considered independent directors.
314
In no event may there be a classification as independent directors of those who:
a) Have been employees or executive directors of the Group’s companies, except after the passage of 3 or 5 years, respectively, since the cessation of such relationship.
b) Receive from the Company, or from another Group company, any amount or benefit for something other than director compensation, unless it is immaterial.
For purposes of the provisions of this sub-section, neither dividends nor pension supplements that a director receives by reason of the director’s prior professional or employment relationship shall be taken into account, provided that such supplements are unconditional and therefore, the Company paying them may not suspend, modify or revoke the accrual thereof without breaching its obligations.
c) Are, or have been during the preceding 3 years, a partner of the external auditor or the party responsible for auditing the Company or any other Group company during such period.
d) Are executive directors or senior managers of another company in which an executive director or senior manager of the Company is an external director.
e) Maintain, or have maintained during the last year, a significant business relationship with the Company or with any Group company, whether in their own name or as a significant shareholder, director or senior manager of an entity that maintains or has maintained such relationship.
Business relationships shall be considered the relationships of a provider of goods or services, including financial, advisory or consulting services.
f) Are significant shareholders, executive directors or senior managers of an entity that receives, or has received during the preceding 3 years, significant donations from the Company or the Group.
Those who are merely members of the board of a foundation that receives donations shall not be considered included in this letter.
g) Are spouses, persons connected by a similar relationship of affection, or relatives to the second degree of an executive director or senior manager of the Company.
h) Have not been proposed, whether for appointment or for renewal, by the appointments and remuneration committee.
i) Are, as regards a significant shareholder or shareholder represented on the board, in one of the circumstances set forth in letters (i), (v), (vi) or (vii) of this sub-section 2(c). In the event of a kinship relationship set forth in item (vii), the limitation shall apply not only with respect to the shareholder, but also with respect to the related proprietary directors thereof in the affiliate company”.
The above independence criteria are the same as those set forth by the Unified Code of Good Governance, which is a non-binding code approved by the Spanish CNMV in 2006.
Independence of the directors on the audit and compliance committee
Under the NYSE corporate governance rules, all members of the audit committee must be independent. Independence is determined in accordance with highly detailed rules promulgated by the NYSE. Such independence criteria are met by all members of our audit and compliance committee. The audit and compliance committee of the board of directors of Santander is composed of four directors. All members are non-executive independent directors and its chairman is independent in accordance with the standards set forth in the previously mentioned Article 6.2. c) of the Rules and Regulations of the Board. These independence standardsBoard may not necessarily be consistent with, or as stringent as, the director independence standards established by the NYSE. Under Spanish law, a majority of the members and the chairman of the audit committee must be non-executive. The composition of the audit and compliance committee is described under “—Audit and compliance committee and appointments and remuneration committee”.
315
Independence of the directors on the appointments and remuneration committee
In accordance with the NYSE corporate governance rules, all USU.S. companies listed on the NYSE must have a compensation committee and a nominating and corporate governance committee and all members of such committees must be independent in accordance with highly detailed rules promulgated by the NYSE. Under Spanish law, these committees are not required, though there is a non-binding recommendation for listed companies in Spain to have these committees and for them to be composed of non-executive directors and chaired by a non-executive independent director. Santander satisfies this non-binding recommendation. The appointments and remuneration committee of the board of directors of Santander is composed of five directors. All membersfour external directors (3 are non-executive independent directorsand one, in the opinion of the board, is neither proprietary nor independent) and its chairman is independent in accordance with the standards set forth in the previously mentioned Article 6.2. c) of the Rules and Regulations of the Board. These independence standards may not necessarily be consistent with, or as stringent as, the director independence standards established by the NYSE. The composition of the appointments and remuneration committee is described under “—Audit and compliance committee and appointments and remuneration committee”.
During the fiscal year 2011,2013, none of the members of the appointments and remuneration committee was an executive director, member of senior management or a Bank employee, and no executive director or member of senior management has held a position on the board (or its remuneration committee) of companies that employ members of the appointments and remuneration committee.
Separate meetings for non-management directors
In accordance with the NYSE corporate governance rules, non-management directors must meet periodically outside of the presence of management. Under Spanish law, this practice is not required and as such, the non-management directors on the board of directors of Santander do not meet outside of the presence of the directors who also serve in a management capacity.
The audit and compliance committee and the appointments and remuneration committee of the Bank’s board of directors consist entirely of non-management independent directors.
The audit and compliance committee and the appointments and remuneration committee met 12 and 1117 times, respectively, during 2011.2013.
Code of ethics
Under the NYSE corporate governance rules, all USU.S. companies listed on the NYSE must adopt a Code of Business Conduct and Ethics which contains certain required topics. In March 2000, Santander adopted aGeneral Code of Conduct that applies to members of the board and to all employees of Banco Santander, S.A. and of the Grupo Santander companies, notwithstanding the fact that certain persons are also subject to the Code of Conduct in Securities Markets or to other Codes of Conduct related specifically to the activity or lines of business in which they undertake their responsibilities. On July 28, 2003, the board approved amendments to the General Code of Conduct to conform it to the requirements of Law 44/2002 (November 2, 2002) on reform measures of the financial system. The code came into force on August 1, 2003 and replaced the previous one. The General Code of Conduct establishes the principles that guide the actions of officers and directors including ethical conduct, professional standards and confidentiality.
In 2012, a new General Code of Conduct has beenwas published. The current Code has primarily broadened the scope of the previous one by: (i) including guidelines for certain specific situations not included in the previous version and (ii) listing additional responsibilities in relation to the Code for compliance management and for other bodies and divisions of the Group.
The current General Code of Conduct set an open door policy by which any Grupo Santander employee who becomes aware of an allegedly unlawful act or an act in breach of the General Code of Conduct or of our business specific codes and manuals may report such act directly to compliance management.
As of December 31, 2011,2013, no waivers with respect to the General Code of Conduct had been applied for or granted.
In addition, the Group abides by a Code of Conduct in the Securities Markets, which was updated on July 28, 2003. This code establishes standards and obligations in relation to securities trading, conflicts of interest and the treatment of price sensitive information.
Both codes are available to the public on our website, which does not form part of this annual report on Form 20-F, atwww.santander.com under the heading “Information for shareholders and investors—corporate governance—codes of conduct”.
316
Item 16H. Mine Safety Disclosure
Not applicable.
317
We have responded to Item 18 in lieu of this item.
Reference is made to Item 19 for a list of all financial statements filed as part of this Form 20-F.
(a) Index to Financial Statements | Page | |||
| F-1 | ||||
Consolidated Balance Sheets at December 31, | F-2 | |||
Consolidated Income Statements for the Years Ended December 31, | F-3 | |||
| F-4 | ||||
| F-5 | ||||
Consolidated Cash Flow Statement for the Years Ended December 31, | F-8 | |||
| F-9 | ||||
(b) List of Exhibits.
Exhibit | Description | |
| 1.1 | Bylaws (Estatutos) of Banco Santander, S.A. | |
| 1.2 | Bylaws ( | |
| 8.1 | List of Subsidiaries (incorporated by reference as Exhibits I, II and III of our Financial Statements filed with this Form 20-F). | |
| 12.1 | Section 302 Certification by the chief executive officer. | |
| 12.2 | Section 302 Certification by the chief financial officer. | |
| 12.3 | Section 302 Certification by the chief accounting officer. | |
| 13.1 | Section 906 Certification by the chief executive officer, the chief financial officer and the chief accounting officer. | |
| 15.1 | Consent of Deloitte, S.L. | |
We will furnish to the SEC, upon request, copies of any unfiled instruments that define the rights of holders of long-term debt of Santander.
318
SIGNATURES
The registrant hereby certifies that it meets all of the requirements for filing on Form 20-F and that it has duly caused and authorized the undersigned to sign this annual report on its behalf.
| BANCO SANTANDER, S.A. | ||||
By: | /s/ José Antonio Álvarez | |||
| Name: | José Antonio Álvarez | |||
| Title: |
| |||
Date: April 27, 201229, 2014
319
(a) Index to Financial Statements
REPORT OF INDEPENDENT REGISTERED PUBLIC ACCOUNTING FIRM
To the Board of Directors and Shareholders of
Banco Santander, S.A.:
We have audited the accompanying consolidated balance sheets of Banco Santander, S.A. (the “Bank”) and Companies composing, together with the Bank, the Santander Group (the “Group”), as of December 31, 2011, 20102013, 2012 and 2009,2011, and the related consolidated income statements, statements of recognized income and expense, changes in total equity, and cash flows for the years then ended. These consolidated financial statements are the responsibility of the Bank’s directors. Our responsibility is to express an opinion on these consolidated financial statements based on our audits.
We conducted our audits in accordance with the standards of the Public Company Accounting Oversight Board (United States of America). Those standards require that we plan and perform the audit to obtain reasonable assurance about whether the consolidated financial statements are free of material misstatement. An audit includes examining, on a test basis, evidence supporting the amounts and disclosures in the consolidated financial statements. An audit also includes assessing the accounting principles used and significant estimates made by management, as well as evaluating the overall financial statement presentation. We believe that our audits provide a reasonable basis for our opinion.
In our opinion, the consolidated financial statements referred to above present fairly, in all material respects, the financial position of the Group as of December 31, 2011, 2010,2013, 2012, and 2009,2011, and the results of its operations, its changes in equity, and its cash flows for each of the three years in the period ended December 31, 2011,2013, in conformity with International Financial Reporting Standards, as issued by the International Accounting Standards Board (“IFRS-IASB”).
We have also audited, in accordance with the standards of the Public Company Accounting Oversight Board (United States of America), the Group’s internal control over financial reporting as of December 31, 2011,2013, based on the criteria established in Internal Control—Integrated Framework (1992) issued by the Committee of Sponsoring Organizations of the Treadway Commission and our report dated April 27, 201229, 2014 expressed an unqualified opinion on the Group’s internal control over financial reporting.
/s/ Deloitte, S.L.
DELOITTE, S.L.
Madrid, Spain
April 27, 201229, 2014
F-1
CONSOLIDATED BALANCE SHEETS AT DECEMBER 31, 2011, 20102013, 2012 AND 20092011
(Millions of Euros)
ASSETS | Note | 2011 | 2010 | 2009 | Note | 2013 | 2012 | 2011 | ||||||||||||||||||||
CASH AND BALANCES WITH CENTRAL BANKS | 96,524 | 77,786 | 34,889 | 77,103 | 118,488 | 96,524 | ||||||||||||||||||||||
FINANCIAL ASSETS HELD FOR TRADING: | 172,638 | 156,762 | 135,054 | 115,289 | 177,917 | 172,638 | ||||||||||||||||||||||
Loans and advances to credit institutions | 6 | 4,636 | 16,216 | 5,953 | 6 | 5,503 | 9,843 | 4,636 | ||||||||||||||||||||
Loans and advances to customers | 10 | 8,056 | 755 | 10,076 | 10 | 5,079 | 9,162 | 8,056 | ||||||||||||||||||||
Debt instruments | 7 | 52,704 | 57,872 | 49,921 | 7 | 40,841 | 43,101 | 52,704 | ||||||||||||||||||||
Equity instruments | 8 | 4,744 | 8,850 | 9,248 | 8 | 4,967 | 5,492 | 4,744 | ||||||||||||||||||||
Trading derivatives | 9 | 102,498 | 73,069 | 59,856 | 9 | 58,899 | 110,319 | 102,498 | ||||||||||||||||||||
OTHER FINANCIAL ASSETS AT FAIR VALUE THROUGH PROFIT OR LOSS: | 19,563 | 39,480 | 37,814 | 31,381 | 28,356 | 19,563 | ||||||||||||||||||||||
Loans and advances to credit institutions | 6 | 4,701 | 18,831 | 16,243 | 6 | 13,444 | 10,272 | 4,701 | ||||||||||||||||||||
Loans and advances to customers | 10 | 11,748 | 7,777 | 8,329 | 10 | 13,196 | 13,936 | 11,748 | ||||||||||||||||||||
Debt instruments | 7 | 2,649 | 4,605 | 7,365 | 7 | 3,875 | 3,460 | 2,649 | ||||||||||||||||||||
Equity instruments | 8 | 465 | 8,267 | 5,877 | 8 | 866 | 688 | 465 | ||||||||||||||||||||
AVAILABLE-FOR-SALE FINANCIAL ASSETS: | 86,613 | 86,235 | 86,620 | 83,799 | 92,266 | 86,613 | ||||||||||||||||||||||
Debt instruments | 7 | 81,589 | 79,689 | 79,289 | 7 | 79,844 | 87,724 | 81,589 | ||||||||||||||||||||
Equity instruments | 8 | 5,024 | 6,546 | 7,331 | 8 | 3,955 | 4,542 | 5,024 | ||||||||||||||||||||
LOANS AND RECEIVABLES: | 779,525 | 768,858 | 736,746 | 714,484 | 756,858 | 777,966 | ||||||||||||||||||||||
Loans and advances to credit institutions | 6 | 42,389 | 44,808 | 57,641 | 6 | 56,017 | 53,785 | 42,389 | ||||||||||||||||||||
Loans and advances to customers | 10 | 730,296 | 715,621 | 664,146 | 10 | 650,581 | 696,014 | 728,737 | ||||||||||||||||||||
Debt instruments | 7 | 6,840 | 8,429 | 14,959 | 7 | 7,886 | 7,059 | 6,840 | ||||||||||||||||||||
HELD-TO-MATURITY INVESTMENTS | — | — | — | — | — | — | ||||||||||||||||||||||
CHANGES IN THE FAIR VALUE OF HEDGED ITEMS IN PORTFOLIO HEDGES OF INTEREST RATE RISK | 36 | 2,024 | 1,464 | 1,420 | 36 | 1,627 | 2,274 | 2,024 | ||||||||||||||||||||
HEDGING DERIVATIVES | 11 | 9,898 | 8,227 | 7,834 | 11 | 8,301 | 7,936 | 9,898 | ||||||||||||||||||||
NON-CURRENT ASSETS HELD FOR SALE | 12 | 5,338 | 6,285 | 5,789 | 12 | 4,892 | 5,700 | 6,897 | ||||||||||||||||||||
INVESTMENTS: | 13 | 4,155 | 273 | 164 | 13 | 5,536 | 4,454 | 4,155 | ||||||||||||||||||||
Associates | 2,082 | 273 | 164 | 13 | 1,829 | 1,957 | 2,082 | |||||||||||||||||||||
Jointly controlled entities | 2,073 | — | — | 13 | 3,707 | 2,497 | 2,073 | |||||||||||||||||||||
INSURANCE CONTRACTS LINKED TO PENSIONS | 14 | 2,146 | 2,220 | 2,356 | 14 | 342 | 405 | 2,146 | ||||||||||||||||||||
REINSURANCE ASSETS | 15 | 254 | 546 | 417 | 15 | 356 | 424 | 254 | ||||||||||||||||||||
TANGIBLE ASSETS: | 13,846 | 11,142 | 8,996 | 13,654 | 13,860 | 13,846 | ||||||||||||||||||||||
Property, plant and equipment- | 9,995 | 9,832 | 7,905 | 9,974 | 10,315 | 9,995 | ||||||||||||||||||||||
For own use | 16 | 7,797 | 7,508 | 6,202 | 16 | 7,787 | 8,136 | 7,797 | ||||||||||||||||||||
Leased out under an operating lease | 16 | 2,198 | 2,324 | 1,703 | 16 | 2,187 | 2,179 | 2,198 | ||||||||||||||||||||
Investment property | 16 | 3,851 | 1,310 | 1,091 | 16 | 3,680 | 3,545 | 3,851 | ||||||||||||||||||||
INTANGIBLE ASSETS: | 28,083 | 28,064 | 25,643 | 26,241 | 28,062 | 28,083 | ||||||||||||||||||||||
Goodwill | 17 | 25,089 | 24,622 | 22,865 | 17 | 23,281 | 24,626 | 25,089 | ||||||||||||||||||||
Other intangible assets | 18 | 2,994 | 3,442 | 2,778 | 18 | 2,960 | 3,436 | 2,994 | ||||||||||||||||||||
TAX ASSETS: | 22,901 | 22,572 | 20,655 | 26,819 | 27,053 | 23,595 | ||||||||||||||||||||||
Current | 5,140 | 5,483 | 4,828 | 5,751 | 6,111 | 5,140 | ||||||||||||||||||||||
Deferred | 27 | 17,761 | 17,089 | 15,827 | 27 | 21,068 | 20,942 | 18,455 | ||||||||||||||||||||
OTHER ASSETS | 19 | 8,018 | 7,587 | 6,132 | 19 | 5,814 | 5,547 | 6,807 | ||||||||||||||||||||
Inventories | 319 | 455 | 519 | 80 | 173 | 319 | ||||||||||||||||||||||
Other | 7,699 | 7,132 | 5,613 | 5,734 | 5,374 | 6,488 | ||||||||||||||||||||||
|
|
|
|
|
| |||||||||||||||||||||||
TOTAL ASSETS | 1,251,526 | 1,217,501 | 1,110,529 | 1,115,638 | 1,269,600 | 1,251,009 | ||||||||||||||||||||||
|
|
|
|
|
| |||||||||||||||||||||||
LIABILITIES AND EQUITY | Note | 2011 | 2010 | 2009 | ||||||||||
FINANCIAL LIABILITIES HELD FOR TRADING: | 146,948 | 136,772 | 115,516 | |||||||||||
Deposits from central banks | 20 | 7,740 | 12,605 | 2,985 | ||||||||||
Deposits from credit institutions | 20 | 9,287 | 28,371 | 43,131 | ||||||||||
Customer deposits | 21 | 16,574 | 7,849 | 4,658 | ||||||||||
Marketable debt securities | 22 | 77 | 366 | 586 | ||||||||||
Trading derivatives | 9 | 103,083 | 75,279 | 58,713 | ||||||||||
Short positions | 9 | 10,187 | 12,302 | 5,140 | ||||||||||
Other financial liabilities | 24 | — | — | 303 | ||||||||||
OTHER FINANCIAL LIABILITIES AT FAIR VALUE THROUGH PROFIT OR LOSS: | 44,909 | 51,020 | 42,371 | |||||||||||
Deposits from central banks | 20 | 1,510 | 337 | 10,103 | ||||||||||
Deposits from credit institutions | 20 | 8,232 | 19,263 | 12,745 | ||||||||||
Customer deposits | 21 | 26,982 | 27,142 | 14,636 | ||||||||||
Marketable debt securities | 22 | 8,185 | 4,278 | 4,887 | ||||||||||
Subordinated liabilities | — | — | — | |||||||||||
Other financial liabilities | — | — | — | |||||||||||
FINANCIAL LIABILITIES AT AMORTISED COST: | 935,669 | 898,969 | 823,403 | |||||||||||
Deposits from central banks | 20 | 34,996 | 8,644 | 22,345 | ||||||||||
Deposits from credit institutions | 20 | 81,373 | 70,892 | 50,782 | ||||||||||
Customer deposits | 21 | 588,977 | 581,385 | 487,681 | ||||||||||
Marketable debt securities | 22 | 189,110 | 188,229 | 206,490 | ||||||||||
Subordinated liabilities | 23 | 22,992 | 30,475 | 36,805 | ||||||||||
Other financial liabilities | 24 | 18,221 | 19,344 | 19,300 | ||||||||||
CHANGES IN THE FAIR VALUE OF HEDGED ITEMS IN PORTFOLIO HEDGES OF INTEREST RATE RISK | 36 | 876 | 810 | 806 | ||||||||||
HEDGING DERIVATIVES | 11 | 6,444 | 6,634 | 5,191 | ||||||||||
LIABILITIES ASSOCIATED WITH NON-CURRENT ASSETS HELD FOR SALE | 42 | 54 | 293 | |||||||||||
LIABILITIES UNDER INSURANCE CONTRACTS | 15 | 517 | 10,449 | 16,916 | ||||||||||
PROVISIONS: | 15,572 | 15,660 | 17,533 | |||||||||||
Provision for pensions and similar obligations | 25 | 9,045 | 9,519 | 10,629 | ||||||||||
Provisions for taxes and other legal contingencies | 25 | 3,663 | 3,670 | 3,283 | ||||||||||
Provisions for contingent liabilities and commitments | 25 | 659 | 1,030 | 642 | ||||||||||
Other provisions | 25 | 2,205 | 1,441 | 2,979 | ||||||||||
TAX LIABILITIES: | 8,174 | 8,618 | 7,005 | |||||||||||
Current | 5,101 | 4,306 | 3,338 | |||||||||||
Deferred | 27 | 3,073 | 4,312 | 3,667 | ||||||||||
OTHER LIABILITIES | 26 | 9,516 | 7,600 | 7,625 | ||||||||||
|
|
|
|
|
| |||||||||
TOTAL LIABILITIES | 1,168,667 | 1,136,586 | 1,036,659 | |||||||||||
|
|
|
|
|
| |||||||||
EQUITY | ||||||||||||||
SHAREHOLDERS’ EQUITY: | 30 | 80,896 | 77,333 | 71,832 | ||||||||||
Share capital | 31 | 4,455 | 4,164 | 4,114 | ||||||||||
Registered | 4,455 | 4,164 | 4,114 | |||||||||||
Less: Uncalled capital | — | — | — | |||||||||||
Share premium | 32 | 31,223 | 29,457 | 29,305 | ||||||||||
Reserves | 33 | 32,980 | 28,307 | 24,608 | ||||||||||
Accumulated reserves (losses) | 33 | 32,921 | 28,255 | 24,540 | ||||||||||
Reserves (losses) of entities accounted for using the equity method | 33 | 59 | 52 | 68 | ||||||||||
Other equity instruments | 34 | 8,708 | 8,686 | 7,189 | ||||||||||
Equity component of compound financial instruments | 34 | 1,668 | 1,668 | — | ||||||||||
Other | 34 | 7,040 | 7,018 | 7,189 | ||||||||||
Less: Treasury shares | 34 | (251 | ) | (192 | ) | (30 | ) | |||||||
Profit for the year attributable to the Parent | 5,351 | 8,181 | 8,942 | |||||||||||
Less: Dividends and remuneration | 4 | (1,570 | ) | (1,270 | ) | (2,296 | ) | |||||||
VALUATION ADJUSTMENTS | (4,482 | ) | (2,315 | ) | (3,165 | ) | ||||||||
Available-for-sale financial assets | 29 | (977 | ) | (1,249 | ) | 645 | ||||||||
Cash flow hedges | 11 | (202 | ) | (172 | ) | (255 | ) | |||||||
Hedges of net investments in foreign operations | 29 | (1,850 | ) | (1,955 | ) | 297 | ||||||||
Exchange differences | 29 | (1,358 | ) | 1,061 | (3,852 | ) | ||||||||
Non-current assets held for sale | — | — | — | |||||||||||
Entities accounted for using the equity method | 29 | (95 | ) | — | — | |||||||||
Other valuation adjustments | — | — | — | |||||||||||
NON-CONTROLLING INTERESTS | 28 | 6,445 | 5,897 | 5,203 | ||||||||||
Valuation adjustments | 435 | 838 | 45 | |||||||||||
Other | 6,010 | 5,059 | 5,158 | |||||||||||
|
|
|
|
|
| |||||||||
TOTAL EQUITY | 82,859 | 80,915 | 73,870 | |||||||||||
|
|
|
|
|
| |||||||||
TOTAL LIABILITIES AND EQUITY | 1,251,526 | 1,217,501 | 1,110,529 | |||||||||||
|
|
|
|
|
| |||||||||
MEMORANDUM ITEMS: | ||||||||||||||
CONTINGENT LIABILITIES | 35 | 48,042 | 59,795 | 59,256 | ||||||||||
CONTINGENT COMMITMENTS | 35 | 195,382 | 203,709 | 163,531 | ||||||||||
The accompanying Notes 1 to 55 and Appendices are an integral part of the consolidated balance sheet at December 31, 2011.
LIABILITIES AND EQUITY | Note | 2013 | 2012 | 2011 | ||||||||||
FINANCIAL LIABILITIES HELD FOR TRADING: | 94,673 | 143,242 | 146,948 | |||||||||||
Deposits from central banks | 20 | 3,866 | 1,128 | 7,740 | ||||||||||
Deposits from credit institutions | 20 | 7,468 | 8,292 | 9,287 | ||||||||||
Customer deposits | 21 | 8,500 | 8,897 | 16,574 | ||||||||||
Marketable debt securities | 22 | 1 | 1 | 77 | ||||||||||
Trading derivatives | 9 | 58,887 | 109,743 | 103,083 | ||||||||||
Short positions | 9 | 15,951 | 15,181 | 10,187 | ||||||||||
Other financial liabilities | — | — | — | |||||||||||
OTHER FINANCIAL LIABILITIES AT FAIR VALUE THROUGH PROFIT OR LOSS: | 42,311 | 45,418 | 44,909 | |||||||||||
Deposits from central banks | 20 | 2,097 | 1,014 | 1,510 | ||||||||||
Deposits from credit institutions | 20 | 9,644 | 10,862 | 8,232 | ||||||||||
Customer deposits | 21 | 26,484 | 28,638 | 26,982 | ||||||||||
Marketable debt securities | 22 | 4,086 | 4,904 | 8,185 | ||||||||||
Subordinated liabilities | — | — | — | |||||||||||
Other financial liabilities | — | — | — | |||||||||||
FINANCIAL LIABILITIES AT AMORTISED COST: | 863,114 | 959,321 | 935,669 | |||||||||||
Deposits from central banks | 20 | 9,788 | 50,938 | 34,996 | ||||||||||
Deposits from credit institutions | 20 | 76,534 | 80,732 | 81,373 | ||||||||||
Customer deposits | 21 | 572,853 | 589,104 | 588,977 | ||||||||||
Marketable debt securities | 22 | 171,390 | 201,064 | 189,110 | ||||||||||
Subordinated liabilities | 23 | 16,139 | 18,238 | 22,992 | ||||||||||
Other financial liabilities | 24 | 16,410 | 19,245 | 18,221 | ||||||||||
CHANGES IN THE FAIR VALUE OF HEDGED ITEMS IN PORTFOLIO HEDGES OF INTEREST RATE RISK | 36 | 87 | 598 | 876 | ||||||||||
HEDGING DERIVATIVES | 11 | 5,283 | 6,444 | 6,444 | ||||||||||
LIABILITIES ASSOCIATED WITH NON-CURRENT ASSETS HELD FOR SALE | 1 | 2 | 41 | |||||||||||
LIABILITIES UNDER INSURANCE CONTRACTS | 15 | 1,430 | 1,425 | 517 | ||||||||||
PROVISIONS: | 14,475 | 16,148 | 17,309 | |||||||||||
Provision for pensions and similar obligations | 25 | 9,126 | 10,353 | 10,782 | ||||||||||
Provisions for taxes and other legal contingencies | 25 | 2,727 | 3,100 | 3,663 | ||||||||||
Provisions for contingent liabilities and commitments | 25 | 693 | 617 | 659 | ||||||||||
Other provisions | 25 | 1,929 | 2,078 | 2,205 | ||||||||||
TAX LIABILITIES: | 6,079 | 7,765 | 7,966 | |||||||||||
Current | 4,254 | 5,162 | 5,101 | |||||||||||
Deferred | 27 | 1,825 | 2,603 | 2,865 | ||||||||||
OTHER LIABILITIES | 26 | 8,283 | 7,962 | 9,516 | ||||||||||
|
|
|
|
|
| |||||||||
TOTAL LIABILITIES | 1,035,736 | 1,188,325 | 1,170,195 | |||||||||||
|
|
|
|
|
| |||||||||
EQUITY | ||||||||||||||
SHAREHOLDERS’ EQUITY: | 30 | 84,740 | 81,334 | 80,875 | ||||||||||
Share capital | 31 | 5,667 | 5,161 | 4,455 | ||||||||||
Registered | 5,667 | 5,161 | 4,455 | |||||||||||
Less: Uncalled capital | — | — | — | |||||||||||
Share premium | 32 | 36,804 | 37,412 | 31,223 | ||||||||||
Reserves | 33 | 38,121 | 37,153 | 32,980 | ||||||||||
Accumulated reserves (losses) | 33 | 37,858 | 36,898 | 32,921 | ||||||||||
Reserves (losses) of entities accounted for using the equity method | 33 | 263 | 255 | 59 | ||||||||||
Other equity instruments | 34 | 193 | 250 | 8,708 | ||||||||||
Equity component of compound financial instruments | 34 | — | — | 1,668 | ||||||||||
Other | 34 | 193 | 250 | 7,040 | ||||||||||
Less: Treasury shares | 34 | (9 | ) | (287 | ) | (251 | ) | |||||||
Profit for the year attributable to the Parent | 4,370 | 2,295 | 5,330 | |||||||||||
Less: Dividends and remuneration | 4 | (406 | ) | (650 | ) | (1,570 | ) | |||||||
VALUATION ADJUSTMENTS | (14,152 | ) | (9,474 | ) | (6,415 | ) | ||||||||
Available-for-sale financial assets | 29 | 35 | (249 | ) | (977 | ) | ||||||||
Cash flow hedges | 36 | (233 | ) | (219 | ) | (202 | ) | |||||||
Hedges of net investments in foreign operations | 29 | (1,874 | ) | (2,957 | ) | (1,850 | ) | |||||||
Exchange differences | 29 | (8,768 | ) | (3,013 | ) | (1,358 | ) | |||||||
Non-current assets held for sale | — | — | — | |||||||||||
Entities accounted for using the equity method | 29 | (446 | ) | (152 | ) | (95 | ) | |||||||
Other valuation adjustments | 29 | (2,866 | ) | (2,884 | ) | (1,933 | ) | |||||||
NON-CONTROLLING INTERESTS | 28 | 9,314 | 9,415 | 6,354 | ||||||||||
Valuation adjustments | (1,541 | ) | (308 | ) | 344 | |||||||||
Other | 10,855 | 9,723 | 6,010 | |||||||||||
|
|
|
|
|
| |||||||||
TOTAL EQUITY | 79,902 | 81,275 | 80,814 | |||||||||||
|
|
|
|
|
| |||||||||
TOTAL LIABILITIES AND EQUITY | 1,115,638 | 1,269,600 | 1,251,009 | |||||||||||
|
|
|
|
|
| |||||||||
MEMORANDUM ITEMS: | ||||||||||||||
CONTINGENT LIABILITIES | 35 | 41,049 | 45,033 | 48,042 | ||||||||||
CONTINGENT COMMITMENTS | 35 | 172,797 | 216,042 | 195,382 | ||||||||||
F-2
| The accompanying Notes 1 to 55 and Appendices are an integral part of the consolidated balance sheet at December 31, 2013. |
CONSOLIDATED INCOME STATEMENTS
FOR THE YEARS ENDED
DECEMBER 31, 2011, 20102013, 2012 AND 20092011
(Millions of Euros)
| (Debit) Credit | ||||||||||||||||||||||||||||||
| (Debit) Credit | Notes | 2013 | 2012 | 2011 | ||||||||||||||||||||||||||
| Notes | 2011 | 2010 | 2009 | |||||||||||||||||||||||||||
Interest and similar income | 38 | 60,856 | 52,907 | 53,173 | 38 | 51,447 | 58,791 | 60,618 | ||||||||||||||||||||||
Interest expense and similar charges | 39 | (30,035 | ) | (23,683 | ) | (26,874 | ) | 39 | (25,512 | ) | (28,868 | ) | (30,024 | ) | ||||||||||||||||
INTEREST INCOME/(CHARGES) | 30,821 | 29,224 | 26,299 | 25,935 | 29,923 | 30,594 | ||||||||||||||||||||||||
Income from equity instruments | 40 | 394 | 362 | 436 | 40 | 378 | 423 | 394 | ||||||||||||||||||||||
Income for companies accounted for using the equity method | 41 | 57 | 17 | (1 | ) | |||||||||||||||||||||||||
Income from companies accounted for using the equity method | 13 & 41 | 500 | 427 | 57 | ||||||||||||||||||||||||||
Fee and commission income | 42 | 12,749 | 11,681 | 10,726 | 42 | 12,473 | 12,732 | 12,640 | ||||||||||||||||||||||
Fee and commission expense | 43 | (2,277 | ) | (1,946 | ) | (1,646 | ) | 43 | (2,712 | ) | (2,471 | ) | (2,232 | ) | ||||||||||||||||
Gains/losses on financial assets and liabilities (net) | 44 | 2,838 | 2,164 | 3,802 | 44 | 3,234 | 3,329 | 2,838 | ||||||||||||||||||||||
Held for trading | 2,113 | 1,312 | 2,098 | 1,733 | 1,460 | 2,113 | ||||||||||||||||||||||||
Other financial instruments at fair value through profit or loss | 21 | 70 | 198 | (6 | ) | 159 | 21 | |||||||||||||||||||||||
Financial instruments not measured at fair value through profit or loss | 803 | 791 | 1,631 | 1,622 | 1,789 | 803 | ||||||||||||||||||||||||
Other | (99 | ) | (9 | ) | (125 | ) | (115 | ) | (79 | ) | (99 | ) | ||||||||||||||||||
Exchange differences (net) | 45 | (522 | ) | 441 | 444 | 45 | 160 | (189 | ) | (522 | ) | |||||||||||||||||||
Other operating income | 8,050 | 8,195 | 7,929 | 5,903 | 6,693 | 8,050 | ||||||||||||||||||||||||
Income from insurance and reinsurance contracts issued | 46 | 6,748 | 7,162 | 7,113 | 46 | 4,724 | 5,541 | 6,748 | ||||||||||||||||||||||
Sales and income from the provision of non-financial services | 46 | 400 | 340 | 378 | 46 | 322 | 369 | 400 | ||||||||||||||||||||||
Other operating income | 46 | 902 | 693 | 438 | ||||||||||||||||||||||||||
Other | 46 | 857 | 783 | 902 | ||||||||||||||||||||||||||
Other operating expenses | (8,032 | ) | (8,089 | ) | (7,785 | ) | (6,194 | ) | (6,583 | ) | (8,029 | ) | ||||||||||||||||||
Expenses of insurance and reinsurance contracts | 46 | (6,356 | ) | (6,784 | ) | (6,774 | ) | 46 | (4,607 | ) | (4,948 | ) | (6,356 | ) | ||||||||||||||||
Changes in inventories | 46 | (249 | ) | (205 | ) | (238 | ) | 46 | (229 | ) | (232 | ) | (249 | ) | ||||||||||||||||
Other operating expenses | 46 | (1,427 | ) | (1,100 | ) | (773 | ) | |||||||||||||||||||||||
Other | 46 | (1,358 | ) | (1,403 | ) | (1,424 | ) | |||||||||||||||||||||||
TOTAL INCOME | 44,078 | 42,049 | 40,204 | 39,677 | 44,284 | 43,790 | ||||||||||||||||||||||||
Administrative expenses | (17,781 | ) | (16,255 | ) | (14,825 | ) | (17,452 | ) | (17,801 | ) | (17,644 | ) | ||||||||||||||||||
Personnel expenses | 47 | (10,326 | ) | (9,329 | ) | (8,451 | ) | 47 | (10,069 | ) | (10,306 | ) | (10,305 | ) | ||||||||||||||||
Other general administrative expenses | 48 | (7,455 | ) | (6,926 | ) | (6,374 | ) | 48 | (7,383 | ) | (7,495 | ) | (7,339 | ) | ||||||||||||||||
Depreciation and amortization | 16 & 18 | (2,109 | ) | (1,940 | ) | (1,596 | ) | 16 & 18 | (2,391 | ) | (2,183 | ) | (2,098 | ) | ||||||||||||||||
Provisions (net) | 25 | (2,601 | ) | (1,133 | ) | (1,792 | ) | 25 | (2,182 | ) | (1,478 | ) | (2,616 | ) | ||||||||||||||||
Impairment losses on financial assets (net) | (11,868 | ) | (10,443 | ) | (11,578 | ) | (11,227 | ) | (18,880 | ) | (11,794 | ) | ||||||||||||||||||
Loans and receivables | 10 | (11,040 | ) | (10,267 | ) | (11,088 | ) | 10 | (10,986 | ) | (18,523 | ) | (10,966 | ) | ||||||||||||||||
Other financial instruments not measured at fair value through profit or loss | 7 & 29 | (828 | ) | (176 | ) | (490 | ) | 7 & 29 | (241 | ) | (357 | ) | (828 | ) | ||||||||||||||||
Impairment losses on other assets (net) | (1,517 | ) | (286 | ) | (165 | ) | (503 | ) | (508 | ) | (1,517 | ) | ||||||||||||||||||
Goodwill and other intangible assets | 17 & 18 | (1,161 | ) | (69 | ) | (31 | ) | 17 & 18 | (41 | ) | (151 | ) | (1,161 | ) | ||||||||||||||||
Other assets | (356 | ) | (217 | ) | (134 | ) | (462 | ) | (357 | ) | (356 | ) | ||||||||||||||||||
Gains/(losses) on disposal of assets not classified as non-current assets held for sale | 49 | 1,846 | 350 | 1,565 | 49 | 2,152 | 906 | 1,846 | ||||||||||||||||||||||
Gains on bargain purchases arising on business combinations | — | — | — | |||||||||||||||||||||||||||
Gains/(losses) on non-current assets held for sale not classified as discontinued operations | 50 | (2,109 | ) | (290 | ) | (1,225 | ) | |||||||||||||||||||||||
Gains from bargain purchases arising in business combinations | — | — | — | |||||||||||||||||||||||||||
Gains/(losses) of non-current assets held for sale not classified as discontinued operations | 50 | (422 | ) | (757 | ) | (2,109 | ) | |||||||||||||||||||||||
OPERATING PROFIT/(LOSS) BEFORE TAX | 7,939 | 12,052 | 10,588 | 7,652 | 3,583 | 7,858 | ||||||||||||||||||||||||
Income tax | 27 | (1,776 | ) | (2,923 | ) | (1,207 | ) | 27 | (2,113 | ) | (590 | ) | (1,755 | ) | ||||||||||||||||
PROFIT FROM CONTINUING OPERATIONS | 6,163 | 9,129 | 9,381 | 5,539 | 2,993 | 6,103 | ||||||||||||||||||||||||
PROFIT (LOSS) FROM DISCONTINUED OPERATIONS (Net) | 37 | (24 | ) | (27 | ) | 31 | ||||||||||||||||||||||||
PROFIT (LOSS) FROM DISCONTINUED OPERATIONS (net) | 37 | (15 | ) | 70 | 15 | |||||||||||||||||||||||||
CONSOLIDATED PROFIT FOR THE YEAR | 6,139 | 9,102 | 9,412 | 5,524 | 3,063 | 6,118 | ||||||||||||||||||||||||
Profit attributable to the Parent | 5,351 | 8,181 | 8,942 | 4,370 | 2,295 | 5,330 | ||||||||||||||||||||||||
Profit attributable to non-controlling interests | 28 | 788 | 921 | 470 | 28 | 1,154 | 768 | 788 | ||||||||||||||||||||||
EARNINGS PER SHARE | ||||||||||||||||||||||||||||||
From continuing and discontinued operations | ||||||||||||||||||||||||||||||
Basic earnings per share (euros) | 4 | 0.60 | 0.94 | 1.04 | 4 | 0.40 | 0.23 | 0.60 | ||||||||||||||||||||||
Diluted earnings per share (euros) | 4 | 0.60 | 0.94 | 1.04 | 4 | 0.40 | 0.23 | 0.60 | ||||||||||||||||||||||
From continuing operations | ||||||||||||||||||||||||||||||
Basic earnings per share (euros) | 4 | 0.60 | 0.94 | 1.04 | 4 | 0.40 | 0.22 | 0.60 | ||||||||||||||||||||||
Diluted earnings per share (euros) | 4 | 0.60 | 0.94 | 1.04 | 4 | 0.40 | 0.22 | 0.60 | ||||||||||||||||||||||
The accompanying Notes 1 to 55 and Appendices are an integral part of the consolidated income statement for the year ended December 31, 2011.2013.
F-3
CONSOLIDATED STATEMENTS OF RECOGNIZED INCOME AND EXPENSE
FOR THE YEARS ENDED DECEMBER 31, 2011, 20102013, 2012 AND 20092011
(Millions of Euros)
| 2013 | 2012 | 2011 | ||||||||||||||||||||||
| 2011 | 2010 | 2009 | ||||||||||||||||||||||
CONSOLIDATED PROFIT FOR THE YEAR | 6,139 | 9,102 | 9,412 | 5,524 | 3,063 | 6,118 | ||||||||||||||||||
OTHER RECOGNIZED INCOME AND EXPENSE | (2,570 | ) | 1,643 | 5,551 | (5,912 | ) | (3,711 | ) | (3,145 | ) | ||||||||||||||
Items that will not be reclassified to profit or loss | 188 | (1,123 | ) | (575 | ) | |||||||||||||||||||
Actuarial gains/(losses) on defined benefit pension plans | 502 | (1,708 | ) | (880 | ) | |||||||||||||||||||
Non-current assets held for sale | — | — | — | |||||||||||||||||||||
Income tax relating to items that will not be reclassified to profit or loss | (314 | ) | 585 | 305 | ||||||||||||||||||||
Items that may be reclassified to profit or loss | (6,100 | ) | (2,588 | ) | (2,570 | ) | ||||||||||||||||||
Available-for-sale financial assets: | 344 | (2,719 | ) | 1,254 | (99 | ) | 1,171 | 344 | ||||||||||||||||
Revaluation gains/(losses) | 231 | (1,863 | ) | 2,133 | 1,150 | 1,729 | 231 | |||||||||||||||||
Amounts transferred to income statement | 156 | (856 | ) | (777 | ) | (1,250 | ) | (558 | ) | 156 | ||||||||||||||
Other reclassifications | (43 | ) | — | (102 | ) | 1 | — | (43 | ) | |||||||||||||||
Cash flow hedges: | (17 | ) | 117 | 73 | 47 | (84 | ) | (17 | ) | |||||||||||||||
Revaluation gains/(losses) | (109 | ) | (89 | ) | 160 | 463 | 129 | (109 | ) | |||||||||||||||
Amounts transferred to income statement | 92 | 206 | (41 | ) | (416 | ) | (249 | ) | 92 | |||||||||||||||
Amounts transferred to initial carrying amount of hedged items | — | — | — | — | — | — | ||||||||||||||||||
Other reclassifications | — | — | (46 | ) | — | 36 | — | |||||||||||||||||
Hedges of net investments in foreign operations: | 106 | (2,253 | ) | (1,171 | ) | 1,117 | (1,107 | ) | 106 | |||||||||||||||
Revaluation gains/(losses) | 13 | (2,444 | ) | (1,222 | ) | 1,074 | (1,336 | ) | 13 | |||||||||||||||
Amounts transferred to income statement | 9 | 191 | 51 | 38 | 229 | 9 | ||||||||||||||||||
Other reclassifications | 84 | — | — | 5 | — | 84 | ||||||||||||||||||
Exchange differences: | (2,824 | ) | 5,704 | 5,915 | (7,027 | ) | (2,170 | ) | (2,824 | ) | ||||||||||||||
Revaluation gains/(losses) | (2,906 | ) | 5,986 | 5,944 | (7,019 | ) | (1,833 | ) | (2,906 | ) | ||||||||||||||
Amounts transferred to income statement | 85 | (282 | ) | (29 | ) | (37 | ) | (330 | ) | 85 | ||||||||||||||
Other reclassifications | (3 | ) | — | — | 29 | (7 | ) | (3 | ) | |||||||||||||||
Non-current assets held for sale: | — | — | (37 | ) | — | — | — | |||||||||||||||||
Revaluation gains/(losses) | — | — | (37 | ) | — | — | — | |||||||||||||||||
Amounts transferred to income statement | — | — | — | — | — | — | ||||||||||||||||||
Other reclassifications | — | — | — | — | — | — | ||||||||||||||||||
Actuarial gains/(losses) on pension plans | — | — | — | |||||||||||||||||||||
Entities accounted for using the equity method: | (95 | ) | — | 148 | (294 | ) | (57 | ) | (95 | ) | ||||||||||||||
Revaluation gains/(losses) | (37 | ) | — | — | (283 | ) | (61 | ) | (37 | ) | ||||||||||||||
Amounts transferred to income statement | — | — | — | 23 | 21 | — | ||||||||||||||||||
Other reclassifications | (58 | ) | — | 148 | (34 | ) | (17 | ) | (58 | ) | ||||||||||||||
Other recognized income and expense | — | — | — | — | — | — | ||||||||||||||||||
Income tax | (84 | ) | 794 | (631 | ) | |||||||||||||||||||
Income tax relating to items that may be reclassified to profit or loss | 156 | (341 | ) | (84 | ) | |||||||||||||||||||
TOTAL RECOGNIZED INCOME AND EXPENSE | 3,569 | 10,745 | 14,963 | (388 | ) | (648 | ) | 2,973 | ||||||||||||||||
Attributable to the Parent | 3,184 | 9,031 | 14,077 | (308 | ) | (764 | ) | 2,642 | ||||||||||||||||
Attributable to non-controlling interests | 385 | 1,714 | 886 | (80 | ) | 116 | 331 | |||||||||||||||||
The accompanying Notes 1 to 55 and Appendices are an integral part of the consolidated statement of recognized income and expense for the year ended December 31, 2011.2013.
F-4
CONSOLIDATED STATEMENTS OF CHANGES IN TOTAL EQUITY
FOR THE YEARS ENDED
DECEMBER 31, 2011, 20102013, 2012 AND 20092011
(Millions of Euros)
| Equity Attributable to the Parent | Equity attributable to the Parent | |||||||||||||||||||||||||||||||||||||||||||||||||||||||||||||||||||||||||||||||||||||||||||||||||||||||
| Shareholders’ Equity | Shareholders’ equity | |||||||||||||||||||||||||||||||||||||||||||||||||||||||||||||||||||||||||||||||||||||||||||||||||||||||
| Reserves | Share capital | Share premium | Reserves | Other equity instruments | Less: Treasury shares | Profit for the year attributable to the Parent | Less: Dividends and remuneration | Total shareholders’ equity | ||||||||||||||||||||||||||||||||||||||||||||||||||||||||||||||||||||||||||||||||||||||||||||||||
| Share capital | Share premium | Accumulated reserves (losses) | Reserves (losses) of entities accounted for using the equity method | Other equity instruments | Less: Treasury shares | Profit for the year attributable to the Parent | Less: Dividends and remuneration | Total shareholders’ equity | Valuation adjustments | Total | Non- controlling interests | Total equity | Accumulated reserves (losses) | Reserves (losses) of entities accounted for using the equity method | Valuation adjustments | Total | Non- controlling interests | Total equity | ||||||||||||||||||||||||||||||||||||||||||||||||||||||||||||||||||||||||||||||||||||||
Ending balance at 12/31/10 | 4,164 | 29,457 | 28,255 | 52 | 8,686 | (192 | ) | 8,181 | (1,270 | ) | 77,333 | (2,315 | ) | 75,018 | 5,897 | 80,915 | ||||||||||||||||||||||||||||||||||||||||||||||||||||||||||||||||||||||||||||||||||||||||
Ending balance at 12/31/12 | 5,161 | 37,412 | 36,898 | 255 | 250 | (287 | ) | 2,205 | (650 | ) | 81,244 | (6,590 | ) | 74,654 | 9,672 | 84,326 | ||||||||||||||||||||||||||||||||||||||||||||||||||||||||||||||||||||||||||||||||||||||||
Adjustments due to changes in accounting policies | — | — | — | — | — | — | — | — | — | — | — | — | — | — | — | — | — | — | — | 90 | — | 90 | (2,884 | ) | (2,794 | ) | (257 | ) | (3,051 | ) | ||||||||||||||||||||||||||||||||||||||||||||||||||||||||||||||||||||||||||
Adjustments due to errors | — | — | — | — | — | — | — | — | — | — | — | — | — | — | — | — | — | — | — | — | — | — | — | — | — | — | ||||||||||||||||||||||||||||||||||||||||||||||||||||||||||||||||||||||||||||||
Adjusted beginning balance | 4,164 | 29,457 | 28,255 | 52 | 8,686 | (192 | ) | 8,181 | (1,270 | ) | 77,333 | (2,315 | ) | 75,018 | 5,897 | 80,915 | 5,161 | 37,412 | 36,898 | 255 | 250 | (287 | ) | 2,295 | (650 | ) | 81,334 | (9,474 | ) | 71,860 | 9,415 | 81,275 | ||||||||||||||||||||||||||||||||||||||||||||||||||||||||||||||||||||||||
|
|
|
|
|
|
|
|
|
|
|
|
| ||||||||||||||||||||||||||||||||||||||||||||||||||||||||||||||||||||||||||||||||||||||||||||
Total recognized income and expense | — | — | — | — | — | — | 5,351 | — | 5,351 | (2,167 | ) | 3,184 | 385 | 3,569 | — | — | — | — | — | — | 4,370 |
| — |
| 4,370 | (4,678 | ) | (308 | ) | (80 | ) | (388 | ) | |||||||||||||||||||||||||||||||||||||||||||||||||||||||||||||||||||||||
|
|
|
|
|
|
|
|
|
|
|
|
| ||||||||||||||||||||||||||||||||||||||||||||||||||||||||||||||||||||||||||||||||||||||||||||
Other changes in equity | 291 | 1,766 | 4,666 | 7 | 22 | (59 | ) | (8,181 | ) | (300 | ) | (1,789 | ) | — | (1,789 | ) | 164 | (1,625 | ) | 506 | (608 | ) | 960 | 8 | (57 | ) | 278 | (2,295 | ) | 244 | (964 | ) | — | (964 | ) | (21 | ) | (985 | ) | |||||||||||||||||||||||||||||||||||||||||||||||||||||||||||||||||
Capital increases | 120 | 17 | (123 | ) | — | (17 | ) | — | — | — | (3 | ) | — | (3 | ) | — | (3 | ) | 506 | (506 | ) | (7 | ) | — | — | — | — | — | (7 | ) | — | (7 | ) | (2 | ) | (9 | ) | |||||||||||||||||||||||||||||||||||||||||||||||||||||||||||||||||||
Capital reductions | — | — | — | — | — | — | — | — | — | — | — | (51 | ) | (51 | ) | — | — | — | — | — | — | — | — | — | — | — | — | — | ||||||||||||||||||||||||||||||||||||||||||||||||||||||||||||||||||||||||||||
Conversion of financial liabilities into equity | 171 | 1,773 | — | — | — | — | — | — | 1,944 | — | 1,944 | — | 1,944 | — | — | — | — | — | — | — | — | — | — | — | — | — | ||||||||||||||||||||||||||||||||||||||||||||||||||||||||||||||||||||||||||||||
Increases in other equity instruments | — | — | — | — | 185 | — | — | — | 185 | — | 185 | — | 185 | — | — | — | — | 103 | — | — | — | 103 | — | 103 | — | 103 | ||||||||||||||||||||||||||||||||||||||||||||||||||||||||||||||||||||||||||||||
Reclassification of financial liabilities to other equity instruments | — | — | — | — | — | — | — | — | — | — | — | — | — | — | — | — | — | — | — | — | — | — | — | — | — | — | ||||||||||||||||||||||||||||||||||||||||||||||||||||||||||||||||||||||||||||||
Reclassification of other equity instruments to financial liabilities | — | — | — | — | — | — | — | — | — | — | — | — | — | — | — | — | — | — | — | — | — | — | — | — | — | — | ||||||||||||||||||||||||||||||||||||||||||||||||||||||||||||||||||||||||||||||
Distribution of dividends | — | — | (2,060 | ) | — | — | — | — | (1,570 | ) | (3,630 | ) | — | (3,630 | ) | (431 | ) | (4,061 | ) | — | — | (412 | ) | — | — | — | — | (406 | ) | (818 | ) | — | (818 | ) | (747 | ) | (1,565 | ) | ||||||||||||||||||||||||||||||||||||||||||||||||||||||||||||||||||
Transactions involving own equity instruments (net) | — | — | (31 | ) | — | — | (59 | ) | — | — | (90 | ) | — | (90 | ) | — | (90 | ) | — | — | (28 | ) | — | — | 278 | — | — | 250 | — | 250 | — | 250 | ||||||||||||||||||||||||||||||||||||||||||||||||||||||||||||||||||||||||
Transfers between equity items | — | (24 | ) | 6,970 | 7 | (41 | ) | — | (8,181 | ) | 1,270 | — | — | — | — | — | — | (102 | ) | 1,848 | 8 | (109 | ) | — | (2,295 | ) | 650 | — | — | — | — | — | ||||||||||||||||||||||||||||||||||||||||||||||||||||||||||||||||||||||||
Increases (decreases) due to business combinations | — | — | — | — | — | — | — | — | — | — | — | 162 | 162 | — | — | — | — | — | — | — | — | — | — | — | 169 | 169 | ||||||||||||||||||||||||||||||||||||||||||||||||||||||||||||||||||||||||||||||
Equity-instrument-based payments | — | — | — | — | (105 | ) | — | — | — | (105 | ) | — | (105 | ) | — | (105 | ) | — | — | — | — | (41 | ) | — | — | — | (41 | ) | — | (41 | ) | — | (41 | ) | ||||||||||||||||||||||||||||||||||||||||||||||||||||||||||||||||||||||
Other increases/(decreases) in equity | — | — | (90 | ) | — | — | — | — | — | (90 | ) | — | (90 | ) | 484 | 394 | — | — | (441 | ) | — | (10 | ) | — | — | — | (451 | ) | — | (451 | ) | 559 | 108 | |||||||||||||||||||||||||||||||||||||||||||||||||||||||||||||||||||||||
Ending balance at 12/31/11 | 4,455 | 31,223 | 32,921 | 59 | 8,708 | (251 | ) | 5,351 | (1,570 | ) | 80,896 | (4,482 | ) | 76,414 | 6,445 | 82,859 | ||||||||||||||||||||||||||||||||||||||||||||||||||||||||||||||||||||||||||||||||||||||||
Ending balance at 12/31/13 | 5,667 | 36,804 | 37,858 | 263 | 193 | (9 | ) | 4,370 | (406 | ) | 84,740 | (14,152 | ) | 70,588 | 9,314 | 79,902 | ||||||||||||||||||||||||||||||||||||||||||||||||||||||||||||||||||||||||||||||||||||||||
The accompanying Notes 1 to 55 and Appendices are an integral part of the consolidated statement of changes in total equity for the year ended December 31, 2011.2013.
F-5
SANTANDER GROUP
CONSOLIDATED STATEMENTS OF CHANGES IN TOTAL EQUITY
FOR THE YEARS ENDED DECEMBER 31, 2011, 20102013, 2012 AND 20092011
(Millions of Euros)
| Equity Attributable to the Parent | Equity attributable to the Parent | |||||||||||||||||||||||||||||||||||||||||||||||||||||||||||||||||||||||||||||||||||||||||||||||||||||||
| Shareholders’ Equity | Shareholders’ equity | |||||||||||||||||||||||||||||||||||||||||||||||||||||||||||||||||||||||||||||||||||||||||||||||||||||||
| Reserves | Reserves | |||||||||||||||||||||||||||||||||||||||||||||||||||||||||||||||||||||||||||||||||||||||||||||||||||||||
| Share capital | Share premium | Accumulated reserves (losses) | Reserves (losses) of entities accounted for using the equity method | Other equity instruments | Less: Treasury shares | Profit for the year attributable to the Parent | Less: Dividends and remuneration | Total shareholders’ equity | Valuation adjustments | Total | Non- controlling interests | Total equity | Share capital | Share premium | Accumulated reserves (losses) | Reserves (losses) of entities accounted for using the equity method | Other equity instruments | Less: Treasury shares | Profit for the year attributable to the Parent | Less: Dividends and remuneration | Total shareholders’ equity | Valuation adjustments | Total | Non- controlling interests | Total equity | |||||||||||||||||||||||||||||||||||||||||||||||||||||||||||||||||||||||||||||||
Ending balance at 12/31/09 | 4,114 | 29,305 | 24,540 | 68 | 7,189 | (30 | ) | 8,942 | (2,296 | ) | 71,832 | (3,165 | ) | 68,667 | 5,203 | 73,870 | ||||||||||||||||||||||||||||||||||||||||||||||||||||||||||||||||||||||||||||||||||||||||
Ending balance at 12/31/11 | 4,455 | 31,223 | 32,921 | 59 | 8,708 | (251 | ) | 5,351 | (1,570 | ) | 80,896 | (4,482 | ) | 76,414 | 6,445 | 82,859 | ||||||||||||||||||||||||||||||||||||||||||||||||||||||||||||||||||||||||||||||||||||||||
Adjustments due to changes in accounting policies | — | — | — | — | — | — | — | — | — | — | — | — | — | — | — | — | — | — | — | (21 | ) | — | (21 | ) | (1,933 | ) | (1,954 | ) | (91 | ) | (2,045 | ) | ||||||||||||||||||||||||||||||||||||||||||||||||||||||||||||||||||||||||
Adjustments due to errors | — | — | — | — | — | — | — | — | — | — | — | — | — | — | — | — | — | — | — | — | — | — | — | — | — | — | ||||||||||||||||||||||||||||||||||||||||||||||||||||||||||||||||||||||||||||||
Adjusted beginning balance | 4,114 | 29,305 | 24,540 | 68 | 7,189 | (30 | ) | 8,942 | (2,296 | ) | 71,832 | (3,165 | ) | 68,667 | 5,203 | 73,870 | 4,455 | 31,223 | 32,921 | 59 | 8,708 | (251 | ) | 5,330 | (1,570 | ) | 80,875 | (6,415 | ) | 74,460 | 6,354 | 80,814 | ||||||||||||||||||||||||||||||||||||||||||||||||||||||||||||||||||||||||
|
|
|
|
|
|
|
|
|
|
|
|
| ||||||||||||||||||||||||||||||||||||||||||||||||||||||||||||||||||||||||||||||||||||||||||||
Total recognized income and expense | — | — | — | — | — | — | 8,181 | — | 8,181 | 850 | 9,031 | 1,714 | 10,745 | — | — | — | — | — | — | 2,295 | — | 2,295 | (3,059 | ) | (764 | ) | 116 | (648 | ) | |||||||||||||||||||||||||||||||||||||||||||||||||||||||||||||||||||||||||||
|
|
|
|
|
|
|
|
|
|
|
|
| ||||||||||||||||||||||||||||||||||||||||||||||||||||||||||||||||||||||||||||||||||||||||||||
Other changes in equity | 50 | 152 | 3,715 | (16 | ) | 1,497 | (162 | ) | (8,942 | ) | 1,026 | (2,680 | ) | — | (2,680 | ) | (1,020 | ) | (3,700 | ) | 706 | 6,189 | 3,977 | 196 | (8,458 | ) | (36 | ) | (5,330 | ) | 920 | (1,836 | ) | — | (1,836 | ) | 2,945 | 1,109 | ||||||||||||||||||||||||||||||||||||||||||||||||||||||||||||||||||
Capital increases | 50 | 162 | (44 | ) | — | (168 | ) | — | — | — | — | — | — | — | — | 706 | 6,330 | (235 | ) | — | (6,811 | ) | — | — | — | (10 | ) | — | (10 | ) | 22 | 12 | ||||||||||||||||||||||||||||||||||||||||||||||||||||||||||||||||||||||||
Capital reductions | — | — | — | — | — | — | — | — | — | — | — | — | — | — | — | — | — | — | — | — | — | — | — | — | (112 | ) | (112 | ) | ||||||||||||||||||||||||||||||||||||||||||||||||||||||||||||||||||||||||||||
Conversion of financial liabilities into equity | — | — | — | — | — | — | — | — | — | — | — | — | — | — | — | — | — | — | — | — | — | — | — | — | — | — | ||||||||||||||||||||||||||||||||||||||||||||||||||||||||||||||||||||||||||||||
Increases in other equity instruments | — | — | — | — | 1,821 | — | — | — | 1,821 | — | 1,821 | — | 1,821 | — | — | — | — | 133 | — | — | — | 133 | — | 133 | — | 133 | ||||||||||||||||||||||||||||||||||||||||||||||||||||||||||||||||||||||||||||||
Reclassification of financial liabilities to other equity instruments | — | — | — | — | — | — | — | — | — | — | — | — | — | — | — | — | — | — | — | — | — | — | — | — | — | — | ||||||||||||||||||||||||||||||||||||||||||||||||||||||||||||||||||||||||||||||
Reclassification of other equity instruments to financial liabilities | — | — | — | — | — | — | — | — | — | — | — | — | — | — | — | — | — | — | — | — | — | — | — | — | — | — | ||||||||||||||||||||||||||||||||||||||||||||||||||||||||||||||||||||||||||||||
Distribution of dividends | — | — | (1,825 | ) | — | — | — | — | (1,270 | ) | (3,095 | ) | — | (3,095 | ) | (400 | ) | (3,495 | ) | — | — | (496 | ) | — | — | — | — | (650 | ) | (1,146 | ) | — | (1,146 | ) | (409 | ) | (1,555 | ) | ||||||||||||||||||||||||||||||||||||||||||||||||||||||||||||||||||
Transactions involving own equity instruments (net) | — | — | (18 | ) | — | — | (162 | ) | — | — | (180 | ) | — | (180 | ) | — | (180 | ) | — | — | 85 | — | — | (36 | ) | — | — | 49 | — | 49 | — | 49 | ||||||||||||||||||||||||||||||||||||||||||||||||||||||||||||||||||||||||
Transfers between equity items | — | (10 | ) | 6,712 | (16 | ) | (40 | ) | — | (8,942 | ) | 2,296 | — | — | — | — | — | — | (141 | ) | 3,768 | 196 | (63 | ) | — | (5,330 | ) | 1,570 | — | — | — | — | — | |||||||||||||||||||||||||||||||||||||||||||||||||||||||||||||||||||||||
Increases (decreases) due to business combinations | — | — | — | — | — | — | — | — | — | — | — | 101 | 101 | — | — | — | — | — | — | — | — | — | — | — | 5 | 5 | ||||||||||||||||||||||||||||||||||||||||||||||||||||||||||||||||||||||||||||||
Equity-instrument-based payments | — | — | — | — | (116 | ) | — | — | — | (116 | ) | — | (116 | ) | — | (116 | ) | — | — | (2 | ) | — | (40 | ) | — | — | — | (42 | ) | — | (42 | ) | — | (42 | ) | |||||||||||||||||||||||||||||||||||||||||||||||||||||||||||||||||||||
Other increases/(decreases) in equity | — | — | (1,110 | ) | — | — | — | — | — | (1,110 | ) | — | (1,110 | ) | (721 | ) | (1,831 | ) | — | — | 857 | — | (1,677 | ) | — | — | — | (820 | ) | — | (820 | ) | 3,439 | 2,619 | ||||||||||||||||||||||||||||||||||||||||||||||||||||||||||||||||||||||
Ending balance at 12/31/10 | 4,164 | 29,457 | 28,255 | 52 | 8,686 | (192 | ) | 8,181 | (1,270 | ) | 77,333 | (2,315 | ) | 75,018 | 5,897 | 80,915 | ||||||||||||||||||||||||||||||||||||||||||||||||||||||||||||||||||||||||||||||||||||||||
Ending balance at 12/31/12 | 5,161 | 37,412 | 36,898 | 255 | 250 | (287 | ) | 2,295 | (650 | ) | 81,334 | (9,474 | ) | 71,860 | 9,415 | 81,275 | ||||||||||||||||||||||||||||||||||||||||||||||||||||||||||||||||||||||||||||||||||||||||
The accompanying Notes 1 to 55 and Appendices are an integral part of the consolidated statement of changes in total equity for the year ended December 31, 2011.2013.
F-6
SANTANDER GROUP
CONSOLIDATED STATEMENTS OF CHANGES IN TOTAL EQUITY
FOR THE YEARS ENDED DECEMBER 31, 2011, 20102013, 2012 AND 20092011
(Millions of Euros)
| Equity Attributable to the Parent | Equity attributable to the Parent | |||||||||||||||||||||||||||||||||||||||||||||||||||||||||||||||||||||||||||||||||||||||||||||||||||||||
| Shareholders’ Equity | Shareholders’ equity | |||||||||||||||||||||||||||||||||||||||||||||||||||||||||||||||||||||||||||||||||||||||||||||||||||||||
| Reserves | Share capital | Share premium | Reserves | Other equity instruments | Less: Treasury shares | Profit for the year attributable to the Parent | Less: Dividends and remuneration | Total shareholders’ equity | ||||||||||||||||||||||||||||||||||||||||||||||||||||||||||||||||||||||||||||||||||||||||||||||||
| Share capital | Share premium | Accumulated reserves (losses) | Reserves (losses) of entities accounted for using the equity method | Other equity instruments | Less: Treasury shares | Profit for the year attributable to the Parent | Less: Dividends and remuneration | Total shareholders’ equity | Valuation adjustments | Total | Non- controlling interests | Total equity | Accumulated reserves (losses) | Reserves (losses) of entities accounted for using the equity method | Valuation adjustments | Total | Non-controlling interests | Total equity | ||||||||||||||||||||||||||||||||||||||||||||||||||||||||||||||||||||||||||||||||||||||
Ending balance at 12/31/08 | 3,997 | 28,104 | 21,158 | (290 | ) | 7,155 | (421 | ) | 8,876 | (2,693 | ) | 65,886 | (8,300 | ) | 57,586 | 2,415 | 60,001 | |||||||||||||||||||||||||||||||||||||||||||||||||||||||||||||||||||||||||||||||||||||||
Ending balance at 12/31/10 | 4,164 | 29,457 | 28,255 | 52 | 8,686 | (192 | ) | 8,181 | (1,270 | ) | 77,333 | (2,315 | ) | 75,018 | 5,897 | 80,915 | ||||||||||||||||||||||||||||||||||||||||||||||||||||||||||||||||||||||||||||||||||||||||
Adjustments due to changes in accounting policies | — | — | — | — | — | — | — | — | — | — | — | — | — | — | — | — | — | — | — | 31 | — | 31 | (1,412 | ) | (1,381 | ) | (37 | ) | (1,418 | ) | ||||||||||||||||||||||||||||||||||||||||||||||||||||||||||||||||||||||||||
Adjustments due to errors | — | — | — | — | — | — | — | — | — | — | — | — | — | — | — | — | — | — | — | — | — | — | — | — | — | — | ||||||||||||||||||||||||||||||||||||||||||||||||||||||||||||||||||||||||||||||
Adjusted beginning balance | 3,997 | 28,104 | 21,158 | (290 | ) | 7,155 | (421 | ) | 8,876 | (2,693 | ) | 65,886 | (8,300 | ) | 57,586 | 2,415 | 60,001 | 4,164 | 29,457 | 28,255 | 52 | 8,686 | (192 | ) | 8,212 | (1,270 | ) | 77,364 | (3,727 | ) | 73,637 | 5,860 | 79,497 | |||||||||||||||||||||||||||||||||||||||||||||||||||||||||||||||||||||||
|
|
|
|
|
|
|
|
|
|
|
|
| ||||||||||||||||||||||||||||||||||||||||||||||||||||||||||||||||||||||||||||||||||||||||||||
Total recognized income and expense | — | — | — | — | — | — | 8,942 | — | 8,942 | 5,135 | 14,077 | 886 | 14,963 | — | — | — | — | — | — | 5,330 | — | 5,330 | (2,688 | ) | 2,642 | 331 | 2,973 | |||||||||||||||||||||||||||||||||||||||||||||||||||||||||||||||||||||||||||||
|
|
|
|
|
|
|
|
|
|
|
|
| ||||||||||||||||||||||||||||||||||||||||||||||||||||||||||||||||||||||||||||||||||||||||||||
Other changes in equity | 117 | 1,201 | 3,382 | 358 | 34 | 391 | (8,876 | ) | 397 | (2,996 | ) | — | (2,996 | ) | 1,902 | (1,094 | ) | 291 | 1,766 | 4,666 | 7 | 22 | (59 | ) | (8,212 | ) | (300 | ) | (1,819 | ) | — | (1,819 | ) | 163 | (1,656 | ) | ||||||||||||||||||||||||||||||||||||||||||||||||||||||||||||||||||||
Capital increases | 117 | 1,224 | (88 | ) | — | (2 | ) | — | — | — | 1,251 | — | 1,251 | 2,187 | 3,438 | 120 | 17 | (123 | ) | — | (17 | ) | — | — | — | (3 | ) | — | (3 | ) | — | (3 | ) | |||||||||||||||||||||||||||||||||||||||||||||||||||||||||||||||||||||||
Capital reductions | — | — | — | — | — | — | — | — | — | — | — | — | — | — | — | — | — | — | — | — | — | — | — | — | (51 | ) | (51 | ) | ||||||||||||||||||||||||||||||||||||||||||||||||||||||||||||||||||||||||||||
Conversion of financial liabilities into equity | — | — | — | — | — | — | — | — | — | — | — | — | — | 171 | 1,773 | — | — | — | — | — | — | 1,944 | — | 1,944 | — | 1,944 | ||||||||||||||||||||||||||||||||||||||||||||||||||||||||||||||||||||||||||||||
Increases in other equity instruments | — | — | — | — | 148 | — | — | — | 148 | — | 148 | — | 148 | — | — | — | — | 185 | — | — | — | 185 | — | 185 | — | 185 | ||||||||||||||||||||||||||||||||||||||||||||||||||||||||||||||||||||||||||||||
Reclassification of financial liabilities to other equity instruments | — | — | — | — | — | — | — | — | — | — | — | — | — | — | — | — | — | — | — | — | — | — | — | — | — | — | ||||||||||||||||||||||||||||||||||||||||||||||||||||||||||||||||||||||||||||||
Reclassification of other equity instruments to financial liabilities | — | — | — | — | — | — | — | — | — | — | — | — | — | — | — | — | — | — | — | — | — | — | — | — | — | — | ||||||||||||||||||||||||||||||||||||||||||||||||||||||||||||||||||||||||||||||
Distribution of dividends | — | — | (2,119 | ) | — | — | — | — | (2,296 | ) | (4,415 | ) | — | (4,415 | ) | (233 | ) | (4,648 | ) | — | — | (2,060 | ) | — | — | — | — | (1,570 | ) | (3,630 | ) | — | (3,630 | ) | (431 | ) | (4,061 | ) | ||||||||||||||||||||||||||||||||||||||||||||||||||||||||||||||||||
Transactions involving own equity instruments (net) | — | — | 321 | — | — | 391 | — | — | 712 | — | 712 | — | 712 | — | — | (31 | ) | — | — | (59 | ) | — | — | (90 | ) | — | (90 | ) | — | (90 | ) | |||||||||||||||||||||||||||||||||||||||||||||||||||||||||||||||||||||||||
Transfers between equity items | — | (23 | ) | 5,891 | 358 | (43 | ) | — | (8,876 | ) | 2,693 | — | — | — | — | — | — | (24 | ) | 7,000 | 7 | (41 | ) | — | (8,212 | ) | 1,270 | — | — | — | — | — | ||||||||||||||||||||||||||||||||||||||||||||||||||||||||||||||||||||||||
Increases (decreases) due to business combinations | — | — | — | — | — | — | — | — | — | — | — | (10 | ) | (10 | ) | — | — | — | — | — | — | — | — | — | — | — | 162 | 162 | ||||||||||||||||||||||||||||||||||||||||||||||||||||||||||||||||||||||||||||
Equity-instrument-based payments | — | — | — | — | (76 | ) | — | — | — | (76 | ) | — | (76 | ) | — | (76 | ) | — | — | — | — | (105 | ) | — | — | — | (105 | ) | — | (105 | ) | — | (105 | ) | ||||||||||||||||||||||||||||||||||||||||||||||||||||||||||||||||||||||
Other increases/(decreases) in equity | — | — | (623 | ) | — | 7 | — | — | — | (616 | ) | — | (616 | ) | (42 | ) | (658 | ) | — | — | (120 | ) | — | — | — | — | — | (120 | ) | — | (120 | ) | 483 | 363 | ||||||||||||||||||||||||||||||||||||||||||||||||||||||||||||||||||||||
Ending balance at 12/31/09 | 4,114 | 29,305 | 24,540 | 68 | 7,189 | (30 | ) | 8,942 | (2,296 | ) | 71,832 | (3,165 | ) | 68,667 | 5,203 | 73,870 | ||||||||||||||||||||||||||||||||||||||||||||||||||||||||||||||||||||||||||||||||||||||||
Ending balance at 12/31/11 | 4,455 | 31,223 | 32,921 | 59 | 8,708 | (251 | ) | 5,330 | (1,570 | ) | 80,875 | (6,415 | ) | 74,460 | 6,354 | 80,814 | ||||||||||||||||||||||||||||||||||||||||||||||||||||||||||||||||||||||||||||||||||||||||
The accompanying Notes 1 to 55 and Appendices are an integral part of the consolidated statement of changes in total equity for the year ended December 31, 2011.2013.
F-7
CONSOLIDATED STATEMENTS OF CASH FLOWS
FOR THE YEARS ENDED DECEMBER 31, 2011, 20102013, 2012 AND 20092011
(Millions of Euros)
| 2013 | 2012 | 2011 | ||||||||||||||||||||||
| 2011 | 2010 | 2009 | ||||||||||||||||||||||
A. CASH FLOWS FROM OPERATING ACTIVITIES: | 35,995 | 51,874 | (18,036 | ) | (34,852 | ) | 24,133 | 35,904 | ||||||||||||||||
|
|
|
|
|
| |||||||||||||||||||
Consolidated profit for the year | 6,139 | 9,102 | 9,412 | 5,524 | 3,063 | 6,118 | ||||||||||||||||||
Adjustments made to obtain the cash flows from operating activities- | 21,877 | 17,849 | 15,558 | 17,699 | 24,373 | 21,898 | ||||||||||||||||||
Depreciation and amortization | 2,109 | 1,940 | 1,596 | 2,391 | 2,183 | 2,098 | ||||||||||||||||||
Other adjustments | 19,768 | 15,909 | 13,962 | 15,308 | 22,190 | 19,800 | ||||||||||||||||||
Net increase/decrease in operating assets- | (337 | ) | 28,487 | 23,749 | (13,533 | ) | 27,343 | (246 | ) | |||||||||||||||
Financial assets held for trading | (7,561 | ) | 6,310 | (10,146 | ) | (8,440 | ) | 381 | (7,561 | ) | ||||||||||||||
Other financial assets at fair value through profit or loss | (12,221 | ) | 413 | 11,553 | 3,426 | 5,207 | (12,221 | ) | ||||||||||||||||
Available-for-sale financial assets | 383 | (3,145 | ) | 30,417 | (4,149 | ) | 7,334 | 383 | ||||||||||||||||
Loans and receivables | 20,569 | 18,481 | (11,196 | ) | (2,767 | ) | 11,854 | 20,660 | ||||||||||||||||
Other operating assets | (1,507 | ) | 6,428 | 3,121 | (1,603 | ) | 2,567 | (1,507 | ) | |||||||||||||||
Net increase/decrease in operating liabilities- | 9,566 | 55,488 | (17,730 | ) | (68,031 | ) | 27,202 | 9,566 | ||||||||||||||||
Financial liabilities held for trading | (15,348 | ) | 7,583 | (14,437 | ) | 4,320 | (9,970 | ) | (15,348 | ) | ||||||||||||||
Other financial liabilities at fair value through profit or loss | (6,351 | ) | 285 | 6,730 | (2,781 | ) | (3,010 | ) | (6,351 | ) | ||||||||||||||
Financial liabilities at amortised cost | 32,901 | 47,274 | (10,206 | ) | ||||||||||||||||||||
Financial liabilities at amortized cost | (63,939 | ) | 39,216 | 32,901 | ||||||||||||||||||||
Other operating liabilities | (1,636 | ) | 346 | 183 | (5,631 | ) | 966 | (1,636 | ) | |||||||||||||||
Income tax recovered/paid | (1,924 | ) | (2,078 | ) | (1,527 | ) | (3,577 | ) | (3,162 | ) | (1,924 | ) | ||||||||||||
|
|
|
|
|
| |||||||||||||||||||
B. CASH FLOWS FROM INVESTING ACTIVITIES: | (7,099 | ) | (2,635 | ) | 2,884 | 677 | 126 | (7,008 | ) | |||||||||||||||
|
|
|
|
|
| |||||||||||||||||||
Payments- | 10,575 | 5,310 | 5,341 | 3,322 | 3,920 | 10,575 | ||||||||||||||||||
Tangible assets | 1,858 | 3,635 | 1,880 | 1,877 | 2,161 | 1,858 | ||||||||||||||||||
Intangible assets | 1,540 | 1,505 | 3,223 | 1,264 | 1,726 | 1,540 | ||||||||||||||||||
Investments | 1 | 10 | 13 | 181 | 33 | 1 | ||||||||||||||||||
Subsidiaries and other business units | 7,176 | 160 | 225 | — | — | 7,176 | ||||||||||||||||||
Non-current assets held for sale and associated liabilities | — | — | — | — | — | — | ||||||||||||||||||
Held-to-maturity investments | — | — | — | — | — | — | ||||||||||||||||||
Other payments related to investing activities | — | — | — | — | — | — | ||||||||||||||||||
Proceeds- | 3,476 | 2,675 | 8,225 | 3,999 | 4,046 | 3,567 | ||||||||||||||||||
Tangible assets | 520 | 696 | 1,176 | 500 | 815 | 520 | ||||||||||||||||||
Intangible assets | — | 9 | 1,321 | 39 | 6 | — | ||||||||||||||||||
Investments | 10 | 104 | 14 | 295 | 2 | 10 | ||||||||||||||||||
Subsidiaries and other business units | 1,044 | 33 | 756 | 1,578 | 991 | 1,044 | ||||||||||||||||||
Non-current assets held for sale and associated liabilities | 1,902 | 1,833 | 4,958 | 1,587 | 2,232 | 1,993 | ||||||||||||||||||
Held-to-maturity investments | — | — | — | — | — | — | ||||||||||||||||||
Other proceeds related to investing activities | — | — | — | — | — | — | ||||||||||||||||||
|
|
|
|
|
| |||||||||||||||||||
C. CASH FLOWS FROM FINANCING ACTIVITIES: | (8,111 | ) | (11,301 | ) | 433 | (1,676 | ) | (703 | ) | (8,111 | ) | |||||||||||||
|
|
|
|
|
| |||||||||||||||||||
Payments- | 16,259 | 21,470 | 18,281 | 8,528 | 12,549 | 16,259 | ||||||||||||||||||
Dividends | 3,489 | 4,107 | 4,387 | 818 | 1,287 | 3,489 | ||||||||||||||||||
Subordinated liabilities | 5,329 | 7,727 | 4,245 | 1,915 | 4,080 | 5,329 | ||||||||||||||||||
Redemption of own equity instruments | — | — | — | — | — | — | ||||||||||||||||||
Acquisition of own equity instruments | 6,937 | 7,372 | 9,263 | 5,592 | 6,957 | 6,937 | ||||||||||||||||||
Other payments related to financing activities | 504 | 2,264 | 386 | 203 | 225 | 504 | ||||||||||||||||||
Proceeds- | 8,148 | 10,169 | 18,714 | 6,852 | 11,846 | 8,148 | ||||||||||||||||||
Subordinated liabilities | 171 | 287 | 3,654 | 1,027 | 2 | 171 | ||||||||||||||||||
Issuance of own equity instruments | — | — | — | — | — | — | ||||||||||||||||||
Disposal of own equity instruments | 6,848 | 7,191 | 9,975 | 5,560 | 7,005 | 6,848 | ||||||||||||||||||
Other proceeds related to financing activities | 1,129 | 2,691 | 5,085 | 265 | 4,839 | 1,129 | ||||||||||||||||||
D. EFFECT OF FOREIGN EXCHANGE RATE CHANGES | (2,046 | ) | 4,957 | 3,826 | (5,534 | ) | (1,592 | ) | (2,046 | ) | ||||||||||||||
E. NET INCREASE/(DECREASE) IN CASH AND CASH EQUIVALENTS | 18,738 | 42,897 | (10,892 | ) | (41,385 | ) | 21,964 | 18,738 | ||||||||||||||||
F. CASH AND CASH EQUIVALENTS AT BEGINNING OF YEAR | 77,786 | 34,889 | 45,781 | 118,488 | 96,524 | 77,786 | ||||||||||||||||||
G. CASH AND CASH EQUIVALENTS AT END OF YEAR | 96,524 | 77,786 | 34,889 | 77,103 | 118,488 | 96,524 | ||||||||||||||||||
COMPONENTS OF CASH AND CASH EQUIVALENTS AT END OF YEAR: | ||||||||||||||||||||||||
Cash | 5,483 | 5,515 | 5,172 | 6,697 | 7,214 | 5,483 | ||||||||||||||||||
Cash equivalents at central banks | 91,041 | 72,271 | 29,717 | 70,406 | 111,274 | 91,041 | ||||||||||||||||||
Other financial assets | — | — | — | — | — | — | ||||||||||||||||||
Less: Bank overdrafts refundable on demand | — | — | — | — | — | — | ||||||||||||||||||
|
|
|
|
|
| |||||||||||||||||||
TOTAL CASH AND CASH EQUIVALENTS AT END OF YEAR | 96,524 | 77,786 | 34,889 | 77,103 | 118,488 | 96,524 | ||||||||||||||||||
|
|
|
|
|
| |||||||||||||||||||
The accompanying Notes 1 to 55 and Appendices are an integral part of the consolidated statement of cash flows for the year ended December 31, 2011.2013.
F-8
Banco Santander, S.A. and Companies composing the Santander Group
Notes to the consolidated financial statements
Consolidated Financial Statements for the year ended December 31, 20112013
| 1. | Introduction, basis of presentation of the consolidated financial statements and other information |
| a) | Introduction |
Banco Santander, S.A. (“the Bank” or Banco Santander) is a private-law entity subject to the rules and regulations applicable to banks operating in Spain. The Bylaws and other public information on the Bank can be consulted on the website of the Bank (www.santander.com) and at its registered office at Paseo de Pereda 9-12, Santander.
In addition to the operations carried on directly by it, the Bank is the head of a group of subsidiaries that engage in various business activities and which compose, together with it, the Santander Group (“the Group” or Santander Group). Therefore, the Bank is obliged to prepare, in addition to its own separate financial statements, the Group’s consolidated financial statements, which also include the interests in joint ventures and investments in associates.
| b) | Basis of presentation of the consolidated financial statements |
Under Regulation (EC) no. 1606/2002 of the European Parliament and of the Council of July 19, 2002, all companies governed by the Law of an EU Member State and whose securities are admitted to trading on a regulated market of any Member State must prepare their consolidated financial statements for the years beginning on or after January 1, 2005 in conformity with the International Financial Reporting Standards (IFRSs)(“IFRSs”) previously adopted by the European Union (“EU-IFRSs”).
In order to adapt the accounting system of Spanish credit institutions to the new standards, the Bank of Spain issued Circular 4/2004, of December 22, on Public and Confidential Financial Reporting Rules and Formats.
The Group’s consolidated financial statements for 2011, 2010 and 20092013 were formally prepared by the Bank’s directors (at the board meeting on January 27, 2014) in accordance with International Financial Reporting Standards as adopted by the European Union and with Bank of Spain Circular 4/2004 and Spanish corporate and commercial law applicable to the Group and in compliance with IFRS as issued by the International Accounting Standards Board (“IFRS – IASB” and together with IFRS adopted by the European Union, “IFRS”), using the basis of consolidation, accounting policies and measurement bases set forth in Note 2 to these consolidated financial statements and, accordingly, they present fairly the Group’s equity and financial position at December 31, 2013, 2012 and 2011 and the consolidated results of its operations, the changes in the consolidated equity and the consolidated cash flows in 2013, 2012 and 2011. These consolidated financial statements were prepared from the separate accounting records of the Bank and of each of the companies composing the Group, and include the adjustments and reclassifications required to unify the accounting policies and measurement bases applied by the Group.
The notes to the consolidated financial statements contain supplementary information to that presented in the consolidated balance sheet, consolidated income statement, consolidated statement of recognized income and expense, consolidated statement of changes in total equity and consolidated statement of cash flows. The notes provide, in a clear, relevant, reliable and comparable manner, narrative descriptions and breakdowns of these financial statements.
F-9
Adoption of new standards and interpretations issued
The following standards and interpretations came into force and were adopted by the European Union in 2011:2013:
AmendmentAmendments to IAS 32, Classification1, Presentation of Rights Issues—this amendment relatesItems of Other Comprehensive Income - the amendments require items to be classified into items that will be reclassified (recycled) to profit or loss in subsequent periods and items that will not be reclassified.
Revision of IAS 24, Related Party Disclosures—the revised IAS 24 addresses related party disclosures in financial statements. There are two new basic features. Firstly, it provides a partial exemption from certain disclosure requirements when the transactions are between state-controlled entities or government-related entities (or equivalent government institution) and, secondly, it simplifies the definition of a related party, clarifying its intended meaning and eliminating inconsistencies from the definition.
Amendments to IFRIC 14, Prepayments of a Minimum Funding Requirement—When these amendments remedycome into effect, all actuarial gains and losses are recognized immediately. The amendments also include significant changes in the fact that in some circumstances entities could not recognise certain voluntary prepaymentspresentation of cost components, as assets.
IFRIC 19, Extinguishing Financial Liabilities with Equity Instruments—this interpretation addressesa result of which the accounting by a debtor when all or part of a financial liability is extinguished through the issue of equity instruments. The interpretation does not applyservice cost relating to transactions in situations where the counterparties in question are shareholders or related parties, acting in their capacity as such, or where extinguishing the financial liability by issuing equity instruments is in accordance with the original terms of the financial liability. In this case, the equity instruments issued are measured at fair value at the date the liability is extinguishedpost-employment benefit obligations (past service cost and any difference between this valueplan curtailments and the carrying amount of the liability issettlements) and net interest cost will be recognized in profit or loss and the measurement component (comprising basically actuarial gains and losses) will be recognized in Equity - Valuation adjustments and may not be reclassified to profit or loss.
The application
At the date of preparation of these consolidated financial statements, the European Union had approvednon-financial items and adopted the amendmentsit introduces new disclosure requirements.
Additionally, the assets qualify for derecognition but the entity has a continuing involvement in them.
Lastly, at the date of preparation of these consolidated financial statements,Group opted to apply the following Standards and Interpretations which effectively come into force after December 31, 2011 had not yet beenstandards early under IFRS adopted by the European Union:Union, as permitted by said standards, that came into force under IFRS-IASB:
IFRS 9, Financial Instruments: Classification and Measurement (obligatory as from January, 1 2015), which will in the future replace the part of the current IAS 39 relating to the classification and measurement of financial assets. IFRS 9 presents significant differences regarding financial assets with respect to the current standard, including the approval of a new classification model based on only two categories, namely instruments measured at amortised cost and those measured at fair value, the disappearance of the current Held-to-maturity investments and Available-for-sale financial assets categories, impairment analyses only for assets measured at amortised cost and the non-separation of embedded derivatives in financial contracts. The main change introduced with regard to financial liabilities applies only to liabilities that an entity elects to measure at fair value. The portion of the change in the fair value of these liabilities attributable to changes in the entity’s own credit risk must be presented in Valuation adjustments instead of in profit or loss.
F-10
Amendments to IAS 12, Income Taxes (obligatory for annual reporting periods beginning on or after January, 1 2012)—these amendments incorporate the requirement to measure deferred tax assets and liabilities relating to investment property depending on whether the entity expects to recover the carrying amount of the asset through use or sale.
IFRS 10, Consolidated Financial Statements (obligatory for reporting periods beginning on or after January 1, 2013)—- this standard will replacesupersedes the currentprevious IAS 27 and SIC 12, introducingand introduces a single basis forcontrol-based consolidation (control),model, irrespective of the nature of the investee. IFRS 10 modifies the currentprevious definition of control. The new definition of control sets out the following three elements of control: power over the investee; exposure, or rights, to variable returns from involvement with the investee; and the ability to use power over the investee to affect the amount of the investor’s returns.
IFRS 11, Joint Arrangements (obligatory for reporting periods beginning on or after January, 1 2013)—- this standard will replacesupersedes the previous IAS 31 currently in force.31. The fundamental change introduced by IFRS 11 with respect to the current standard is the elimination of the option of proportionate consolidation for jointly controlled entities, which will begin to be accounted for using the equity method.
IFRS 12, Disclosure of Interests in Other Entities (obligatory for reporting periods beginning on or after January 1, 2013)—- this standard represents a single standard presenting the disclosure requirements for interests in other entities (whether thesethey be subsidiaries, associates, joint arrangements or other interests) and includes new disclosure requirements. The objective of this standard is to require an entity to disclose information that enables users of its financial statements to evaluate the nature of its interests in other entities (control), the possible restrictions on its ability to access or use assets and settle liabilities, the risks associated with its interests in unconsolidated structured entities, etc.
IFRS 13, Fair Value Measurement (obligatory for reporting periods beginning on or after January, 1 2013)—this standard replaces the current rules concerning fair value contained in various standards and sets out in a single IFRS a framework for measuring fair value. It does not modify the criteria set out in other standards for measuring assets and liabilities at fair value. IFRS 13 is applicable to the measurement of both financial and non-financial items and it introduces new disclosure requirements.
Amendments to IAS 27 and IAS 28 (revised) (obligatory for reporting periods beginning on or after January 1, 2013)—- these amendments reflect the changes arising from the new IFRS 10 and IFRS 11 described above.
Amendments to IAS 1, Presentation of Items of Other Comprehensive Income (obligatory for reporting periods beginning on or after July 1, 2012)—these amendments consist basicallyThe application of the requirement to present items that will be reclassified (recycled) to profit or loss in subsequent periods separately from those that willaforementioned accounting standards and interpretations did not be reclassified.
Amendmentshave any material effects on the Group’s financial statements, except for the application of the amendments to IAS 19, Employee Benefits (obligatory for reporting periods beginning on or after January 1, 2013)—these amendments eliminate the “corridor” under which entities are currently able to opt for deferred recognition of a given portion of actuarial gains and losses, establishing that when the amendments come into effect, all actuarial gains and losses must be recognized immediately (see Note 25). The amendments include significant changes in the presentation of cost components, as a resultimpact of which service cost (past service cost and plan curtailments and settlements) and net interest will be recognizedis detailed in profit or loss andNote 1.e.
Also, the remeasurement component (comprising basically gains and losses) will be recognizedfollowing standards whose effective dates are after December 31, 2013 were in Equity—Valuation adjustments and may not be reclassified to profit or loss.force at the date of preparation of these consolidated financial statements:
Amendments to IAS 32, Financial Instruments: Presentation—Presentation - Offsetting Financial Assets and Financial Liabilities (obligatory for reporting periods beginning on or after January 1, 2014)—2014, early application permitted) - these amendments introduce a series of additional clarifications on the requirements established by the standard for an entity to be able to offset a financial asset and a financial liability, indicating that they can only be offset when an entity currently has a legally enforceable right to set off the recognized amounts and this does not depend on the occurrence of future events.
F-11
Amendments to IFRS 7, Offsetting FinancialIAS 36, Impairment of Assets and Financial Liabilities- Recoverable Amount Disclosures for Non-Financial Assets (obligatory for reporting periods beginning on or after January 1, 2013)—2014, early application permitted) - these amendments eliminate the requirement to present certain disclosures on the recoverable amount of each cash-generating unit and introduce the obligation to disclose information on the recoverable amount of assets in relation to which an impairment loss was recognized or reversed in the year.
Lastly, at the date of preparation of these consolidated financial statements, the following standards and interpretations which effectively come into force after December 31, 2013 had not yet been adopted by the European Union:
IFRIC 20, Stripping Costs21, Levies (obligatory for reporting periods beginning on or after January 1, 2014, early application permitted) - provides clarifying guidance on when to recognize a liability to pay a fee, levy or tax that is accounted for in accordance with IAS 37 and whose timing and amount is certain. In these cases, the Production Phase of a Surface Mine—in view oflevy is recognized when the activity that triggers its nature, this interpretation does not affect the Group’s operations.payment occurs.
The Group is currently analysinganalyzing the possible effects of these new standards and interpretations.
All accounting policies and measurement bases with a material effect on the 2013, 2012 and 2011 consolidated financial statements were applied in their preparation.
| c) | Use of estimates |
The consolidated results and the determination of consolidated equity are sensitive to the accounting policies, measurement bases and estimates used by the directors of the Bank in preparing the consolidated financial statements. The main accounting policies and measurement bases are set forth in Note 2.
In the consolidated financial statements estimates were occasionally made by the senior management of the Bank and of the consolidated entities in order to quantify certain of the assets, liabilities, income, expenses and commitmentsobligations reported herein. These estimates, which were made on the basis of the best information available, relate basically to the following:
The impairment losses on certain assets (see Notes 6, 7, 8, 10, 12, 13, 16, 17 and 18);
The assumptions used in the actuarial calculation of the post-employment benefit liabilities and commitments and other obligations (see Note 25);
The useful life of the tangible and intangible assets (see Notes 16 and 18);
The measurement of goodwill arising on consolidation (see Note 17); and
The fair value of certain unquoted assets and liabilities (see Notes 6, 7, 8, 9, 10, 11, 20, 21 and 22); and
Although these estimates were made on the basis of the best information available at 2013, 2012 and 2011 year-end, future events might make it necessary to change these estimates (upwards or downwards) in coming years. Changes in accounting estimates would be applied prospectively, recognizing the effects of the change in estimates in the related consolidated income statement.
| d) | Other matters |
i. Disputed corporate resolutions
The directors of the Bank and its legal advisers consider that the objection to certain resolutions adopted by the Bank’s shareholders at the general meetings held on January 18, 2000, March 4, 2000, March 10, 2001, February 9, 2002, June 24, 2002, June 21, 2003, June 19, 2004, June 18, 2005 and June 11, 2010 will have no effect on the financial statements of the Bank and the Group.
The status of these matters at the date of preparation of the consolidated financial statements is detailed below:
On April 25, 2002, the Santander Court of First Instance number 1 dismissed in full the claim contesting the resolutions adopted by the shareholders at the general meeting on January 18, 2000. The plaintiff filed an appeal against the judgment. On December 2, 2002, the Cantabria Provincial Appellate Court dismissed the appeal. The Bank appeared as a party to the cassation appeal and filed pleadings with respect to the inadmissibility of the appeal. In the Order dated November 4, 2008 the Supreme Court considered the appeal to have been withdrawn in view of the decease of the appellant and the failure to appear of his heirs.
F-12
On November 29, 2002, the Santander Court of First Instance number 2 dismissed in full the claims contesting the resolutions adopted by the shareholders at the general meeting on March 4, 2000. The plaintiffs filed an appeal against the judgment. On July 5, 2004, the Cantabria Provincial Appellate Court dismissed the appeal. One of the appellants prepared and filed an extraordinary appeal on grounds of procedural infringements and a cassation appeal against the judgment, which were not given leave to proceed by order of the Supreme Court of July 31, 2007.
On March 12, 2002, the Santander Court of First Instance number 4 dismissed in full the claims contesting the resolutions adopted by the shareholders at the general meeting on March 10, 2001. The plaintiffs filed an appeal against the judgment. On April 13, 2004, the Cantabria Provincial Appellate Court dismissed the appeals. One of the appellants prepared and filed an extraordinary appeal on grounds of procedural infringements and a cassation appeal against the judgment, which were not given leave to proceed by order of the Supreme Court of November 6, 2007.
On September 9, 2002, the Santander Court of First Instance number 5 dismissed in full the claim contesting the resolutions adopted by the shareholders at the general meeting on February 9, 2002. The plaintiff filed an appeal against the judgment. On January 14, 2004, the Cantabria Provincial Appellate Court dismissed the appeal. The appellant prepared and filed an extraordinary appeal on grounds of procedural infringements and a cassation appeal against the judgment, which were not given leave to proceed by order of the Supreme Court of May 8, 2007.
On May 29, 2003, the Santander Court of First Instance number 6 dismissed in full the claim contesting the resolutions adopted by the shareholders at the general meeting on June 24, 2002. The plaintiffs filed an appeal against the judgment. On November 15, 2005, the Cantabria Provincial Appellate Court dismissed the appeal in full. The appellants filed an extraordinary appeal on grounds of procedural infringements and a cassation appeal against the judgment. The Bank appeared as a party to the two appeals and filed pleadings with respect to the inadmissibility thereof. In the order dated September 23, 2008 the Supreme Court refused leave to proceed with the aforementioned appeals.
On November 23, 2007, the Santander Court of First Instance number 7 dismissed in full the claims contesting the resolutions adopted by the shareholders at the annual general meeting on June 21, 2003. The plaintiffs filed an appeal against the judgment. The court was notified of the decease of one of the appellants and the court considered his appeal to have been withdrawn on the grounds of his decease and the failure to appear of his heirs. The other three appeals filed were dismissed in full by the Cantabria Provincial Appellate Court on June 30, 2009. The appellants filed an extraordinary appeal on grounds of procedural infringements and a cassation appeal against this judgment, and the appeal filed by one of the three appellants was refused leave to proceed by the Provincial Appellate Court. The cassation appeals filed against the judgments that dismissed the claims contesting the resolutions adopted at the annual general meeting on June 21, 2003 were not given leave to proceed by order of the Supreme Court of January 25, 2011.
On October 28, 2005, the Santander Court of First Instance number 8 dismissed in full the claims contesting the resolutions adopted by the shareholders at the general meeting on June 19, 2004. The plaintiffs filed an appeal against the judgment. In a Judgment dated June 28, 2007 the Cantabria Provincial Appellate Court dismissed the appeals in full. Against this judgment the plaintiffs prepared and filed cassation appeals and extraordinary appeals on the grounds of procedural infringements. The cassation appeal and extraordinary appeal for procedural infringement filed by one of the appellants were refused leave to proceed due to the decease of the appellant and the failure to appear of his heirs. The other two appeals were refused leave to proceed by order of the Supreme Court of October 27, 2009.
On July 13, 2007, the Santander Court of First Instance number 10 dismissed in full the claims contesting the resolutions adopted by the shareholders at the general meeting on June 18, 2005. The plaintiffs filed an appeal against the judgment. In a judgment dated May 14, 2009 the Cantabria Provincial Appellate Court dismissed the appeals in full. Against this judgment the plaintiffs prepared and filed a cassation appeal and an extraordinary appeal on the grounds of procedural infringements, and these appeals are still being processed at the Supreme Court.
On February 24, 2012, the Commercial Court no. 1 of Santander declared that the proceedings against the resolutions adopted by the shareholders at the general meeting held on June 11, 2010 were terminated as the claim had been withdrawn by the plaintiff”.
F-13
ii. Credit assignment transactions
Following the prolonged investigations carried out since 1992 by the Madrid Central Examining Court number 3, and the repeated applications by the Public Prosecutor’s Office and the Government Lawyer, as the representative of the Public Treasury, to have the case against the Bank and its executives dismissed and struck off, the trial commenced at Panel One of the Criminal Chamber of the National Appellate Court and after the debate on preliminary issues was held at the end of November 2006, without the appearance of the Government Lawyer, in which the Public Prosecutor’s Office reiterated its appeal to set aside the trial and interrupt the proceedings, on December 20, 2006, the Criminal Chamber of the National Appellate Court ordered the dismissal of the proceedings, as requested by the Public Prosecutor’s Office and the private prosecution.
A cassation appeal was filed against the aforementioned order by the Association for the Defence of Investors and Customers and Iniciativa per Catalunya Verds and, following the opposition by the Public Prosecutor’s Office, the Government Lawyer and the remaining appearing parties, it was dismissed by a Supreme Court decision handed down on December 17, 2007.
In an interlocutory order of April 15, 2008, the Supreme Court dismissed the request filed by the Association for the Defence of Investors and Customers for the decision handed down in the judgment of December 17, 2007 to be set aside.
The appeal filed by the Association for the Defence of Investors and Customers against the aforementioned Supreme Court decision was given leave to proceed by the Spanish Constitutional Court, and the appearing parties have submitted their pleadings. Subsequently, the appellant filed a document seeking dismissal of the appeal. By order of February 25, 2013, the Spanish Constitutional Court resolved to close the case.
| e) | Information relating to 2012 and 2011 |
In August 2013, we filed with the SEC a Form 6-K in which we recasted our audited financial statements included in our annual report on Form 20-F for the fiscal year ended December 31, 2012, as filed with the SEC on April 24, 2013 (the “2012 Form 20-F”) to reflect the following changes:
| a) | Amendments to IAS 19, Employee Benefits (see Note 1.b): set forth below are the effects arising from the retrospective application of the aforementioned standard (the positive or negative sign shows whether the figures are increases or decreases with respect to the figures shown in the consolidated financial statements for said years): |
| Millions of euros | ||||||||
| 2012 | 2011 | |||||||
| CONSOLIDATED BALANCE SHEET | ||||||||
Deferred tax assets | 1,185 | 694 | ||||||
Other assets | (1,213 | ) | (1,211 | ) | ||||
|
|
|
| |||||
Total assets | (28 | ) | (517 | ) | ||||
|
|
|
| |||||
Deferred tax liabilities | (254 | ) | (208 | ) | ||||
Provisions for pensions and similar obligations | 3,276 | 1,737 | ||||||
|
|
|
| |||||
Total liabilities | 3,022 | 1,529 | ||||||
|
|
|
| |||||
Consolidated profit (loss) for the year | 95 | (21 | ) | |||||
Valuation adjustments | (2,884 | ) | (1,933 | ) | ||||
Non-controlling interests | (262 | ) | (91 | ) | ||||
|
|
|
| |||||
Total equity | (3,051 | ) | (2,045 | ) | ||||
|
|
|
| |||||
|
|
|
| |||||
| CONSOLIDATED INCOME STATEMENT | ||||||||
Provisions (net) | 138 | (26 | ) | |||||
Income tax | (43 | ) | 5 | |||||
|
|
|
| |||||
Consolidated profit (loss) for the year | 95 | (21 | ) | |||||
|
|
|
| |||||
Of which: | ||||||||
|
|
|
| |||||
Profit (loss) attributable to the Parent | 90 | (21 | ) | |||||
|
|
|
| |||||
Profit attributable to non-controlling interests | 5 | — | ||||||
|
|
|
| |||||
| b) | Presentation of the Santander UK card business, which was acquired from the GE (General Electric) Group in prior years, as discontinued operations since the sale was completed in 2013: the balances contributed by this unit (EUR 1,370 million and EUR 1,559 million at December 31, 2012 and 2011, respectively) were eliminated from Loans and receivables and were presented under Non-current assets held for sale (see Note 12); also, the profit contributed by this unit was eliminated from the relevant line items in the income statement, and it was presented in aggregate under Profit (loss) from discontinued operations (net) (see Note 37). |
| c) | Note 52 includes a description of certain changes made in the business segment reporting. |
| Capital management |
i. Regulatory and economic capital
The Group’s capital management is performed at regulatory and economic levels.
Regulatory capital management is based on the analysis of the capital base, and the capital ratios using various regulatory criteria and the criteria of the related Bank of Spain Circular.scenarios used for capital planning. The aim is to achieve a capital structure that is as efficient as possible in terms of both cost and compliance with the requirements of regulators, ratings agencies and investors. Active
The regulations on the calculation and control of minimum capital requirements in Spain have been implemented, since June 2008, by Bank of Spain Circular 3/2008, which adapts Spanish legislation to European Directives 2006/48 and 2006/49 (known as Capital Requirements Directives, or CRD I), which include, inter alia, provisions equivalent to those defined in the Basel II framework agreement. The Basel regulatory framework is based on three pillars. Pillar I sets out the minimum capital requirements to be met, and provides for the possibility of using internal ratings and models (AIRB approach) in the calculation of risk-weighted exposures and including operational risk therein. The aim is to render regulatory requirements more sensitive to the risks actually borne by entities in carrying on their business activities. Pillar II establishes a supervisory review system to improve internal risk management includes securitizations, salesand internal capital adequacy assessment based on the risk profile. Lastly, Pillar III defines the elements relating to disclosures and market discipline.
In July 2009, the Basel Committee on Banking Supervision published a reform of the Basel II framework which raised the regulatory capital requirements for the trading book and complex securitization exposures, known as Basel 2.5. At European level, these greater requirements were reflected in Directive 2009/111 (CRD II) and 2010/76 (CRD III), which were in turn included in Bank of Spain Circular 3/2008 through Circular 4/2011.
In December 2010, the Committee on Banking Supervision published a new global regulatory framework in order to strengthen international capital standards (Basel III), by enhancing the quality, consistency and transparency of the capital base and improving risk coverage. On June 26, 2013, the Basel III legal framework was included in European law through Directive 2013/36 (CRD IV), which repeals Directives 2006/48 and 2006/49; and Regulation 575/2013 on prudential requirements for credit institutions and investment firms (CRR) directly applicable in every Member State as from January 1, 2014.
In December 2011, the European Banking Authority (EBA) published a Recommendation with additional capital requirements for the main European credit institutions. These requirements are part of a package of measures adopted by the European Council in the second half of 2011 with the aim of restoring stability and confidence in the European markets. At June 30, 2012, the institutions selected for the EBA sample were required to have a Tier 1 core capital ratio, determined on the basis of EBA rules, of at least 9%. On July 22, 2013, following publication of the CRD IV and CRR, the EBA issued a new Recommendation, replacing the previous requirement, that was in percentage terms, by a fixed equivalent capital floor, in terms of nominal amount.
In Spain, Royal Decree-Law 2/2011 was approved on February 18, 2011, establishing the implementing regulations of the “Plan for Strengthening the Financial Sector”, which aimed, inter alia, to establish in advance certain capital requirements, established by Basel III, by setting a principal capital requirement of 8% or 10%, depending on the characteristics of each entity. Also, Royal Decree-Law 2/2012, on the clean-up of the financial sector, was published on February 3, 2012, setting forth additional principal capital requirements to be met by entities based on certain levels of assets issuesrelating to the property industry.
Lastly, Law 9/2012, on restructuring and resolution of equitycredit institutions, was published on November 14, 2012, which established, effective from January 1, 2013, a single principal capital requirement of 9%, phasing in both the eligible instruments (preference shares and subordinated debt)deductions with those used by the European Banking Authority. Law 9/2012 was partially implemented by Bank of Spain Circular 7/2012, on minimum principal capital requirements.
The application as from January 1, 2014 of the capital requirements established by the CRR will lead to the repeal of lower-ranking rules providing for additional capital requirements, in particular, the principal capital requirements established in Circular 7/2012.
At December 31, 2013, the Group met all the minimum capital requirements established by current legislation and hybrid instruments.those set forth in the EBA’s recommendation.
From an economic standpoint, capital management seeks to optimiseoptimize value creation at the Group and at its constituent business units. To this end, the economic capital, RORAC and value creation data for each business unit are generated, analyzed and reported to the management committee on a quarterly basis. Within the framework of the internal capital adequacy assessment process (Pillar II of the Basel Capital Accord), the Group uses an economic capital measurement model with the objective of ensuring that there is sufficient capital available to support all the risks of its activity in various economic scenarios, with the solvency levels agreed upon by the Group.
In order to adequately manage the Group’s capital, it is essential to estimate and analyseanalyses future needs, in anticipation of the various phases of the business cycle. Projections of regulatory and economic capital are made based on the budgetary information (balance sheet, income statement, etc.) and on, macroeconomic scenarios defined by the Group’s economic research service.service, and the impact, if any, of foreseeable regulatory changes. These estimates are used by the Group as a reference to plan the management actions (issues, securitizations, etc.) required to achieve its capital targets.
In addition, certain stress scenarios are simulated in order to assess the availability of capital in adverse situations. These scenarios are based on sharp fluctuations in macroeconomic variables, GDP, interest rates, values of equity instruments, etc. that mirror historical crises that could happen again.again or plausible but unlikely stress situations.
Bankii. Plan for the roll-out of Spain Circular 3/2008 onadvanced approaches and authorization from the calculation and control of minimum capital requirements, which has been in force since June 2008, was partially amended in certain aspects by Circular 9/2010 and Circular 4/2011. Pending implementation of the new capital regulations known as Basel III, which will be carried out progressively from 2013 to 2019 through the corresponding European Capital Requirements Directive (CRD IV), the current Bank of Spain Circular addresses new developments relating to capital requirements (Pillar I) and to the possibility of using internal ratings-based (IRB) classifications and methods for calculating risk-weighted exposures, and the inclusion therein of operational risk. The aim is to render regulatory requirements more sensitive to the risks actually borne by entities in carrying on their business activities. It also establishes a supervisory review system to improve internal risk management and internal capital adequacy assessment based on the risk profile (Pillar II), and incorporates elements relating to disclosures and market discipline (Pillar III).authorities
F-14
The Group intends to adopt, over the next few years, the Basel II advanced internal ratings-based (AIRB) approach under Basel II for substantially all its banks, until the percentage of net exposure of the loan portfolio covered by this approach exceeds 90%.
Accordingly, the Group continued in 20112013 with the project for the progressive implementation of the technology platforms and methodological improvements required for the roll-out of the AIRB approaches. In this connection, inapproaches for regulatory capital calculation purposes at the course of the year thevarious Group units.
The Group has obtained regulatory authorisation for various units, including most notably Santander Consumer España, Banco Santander (México), S.A., Institución de Banca Múltiple, Grupo Financiero Santander and the global corporate customer portfolios in Brazil and Chile. In addition, in 2008 the Group obtained authorisationauthorization from the supervisory authorities to use advanced approaches for the calculation of regulatory capital requirements for credit risk for the Parent and the main subsidiaries in Spain, the United KingdomUK, Portugal, non-retail portfolios in Mexico and Portugal. The Group’s Basel implementation strategy is focused on obtaining authorisationlarge corporate portfolios in Brazil, Chile and the US. In 2013 the Group obtained approval for the use of AIRB approaches at the main entitieslarge corporate portfolio in the AmericasUS and at consumer banking entitiesauthorization to use an internal model for the authorized overdraft portfolio in Europe.the UK.
As regards the other risks explicitly addressed inunder Pillar I of Basel II, the Basel Capital Accord, Santander Group wasis authorized to use its internal model for market risk with respect to the treasury area’s trading activities in Madrid, Chile, Portugal and the Chile and Portugal units, thus continuing implementationMexico.
Lastly, as part of the roll-out plan it submitted to the Bank of SpainBasel 2.5 requirements, regulatory approval was obtained for the other units.Group’s corporate methodology, enabling the Group to calculate, for the market risk of the trading book, the incremental default and migration risk charge (IRC) and stressed value at risk (Stressed VaR).
With regard toAs far as operational risk is concerned, the Group considers thatuses the internal model should be developed primarily on the basis of the experience accumulated in managing the entity through the corporate guidelines and criteria established after assuming control, which are a distinctive feature of Santander Group. The Group has performed numerous acquisitions in recent years and, as a result, a longer maturity period will be required in order to develop the internal model based on its own management experience of the various acquired entities. However, although the Group has decided to use the standardisedstandardized approach for regulatory capital calculation purposes itbut is consideringworking towards requesting authorization for the possibilityuse of adopting AMA approaches, once it has collated sufficient data using its own management model in order to make full usewith the objective of the positive qualities that are characteristic of the Group.
Also, Royal Decree-Law 2/2011, approved on February 18, 2011, established the implementing regulations of the “Plan for Strengthening the Financial Sector” published in January 2011 by the Spanish Ministry of Economy and Finance, which aimed, inter alia, to establish certain minimum requirements for core capital, in advance of those established by Basel III, to be met before autumn 2011. At the reporting date, the Group had complied with these minimum core capital requirements.
Furthermore, in December 2011 the European Banking Authority (EBA) published the new capital requirements for the main European credit institutions. These requirements are part of a package of measures adopted by the European Councilgaining regulatory approval in the second half of 2011 with the aim of restoring stability and confidence in the European markets.
At June 30, 2012, the institutions selected for the EBA sample must have a Tier 1 core capital ratio, determined on the basis of EBA rules of at least 9%. These capital requirements are expected to be of an exceptional and temporary nature.
The EBA published the capital requirements of each credit institution and required them to submit, on January 20, 2012, their capital plans to reach the required ratio by June 30, 2012.
The EBA estimated a EUR 15,302 million capital shortfall for Santander Group. In January 2012 the Group reported the measures it had taken -detailed in its capital plan submitted to the Bank of Spain- and which had enabled it to attain the required 9% ratio. These measures are summarised as follows: i) EUR 6,829 million relating to “Valores Santander” -securities that are mandatorily convertible before the end of October 2012; ii) the exchange of EUR 1,943 million of preference shares for new shares in December 2011; iii) EUR 1,660 million resulting from application of the “Santander Dividendo Elección” programme at the date of the final dividend for 2011; and iv) EUR 4,890 million obtained through the organic generation of capital, write-downs and the transfer of various ownership interests, most notably those held in Chile and Brazil (see Note 1.g).
F-15
| Environmental impact |
In view of the business activities carried on by the Group entities, the Group does not have any environmental liability, expenses, assets, provisions or contingencies that might be material with respect to its consolidated equity, financial position or results. Therefore, no specific disclosures relating to environmental issues are included in these notes to the consolidated financial statements.
| Events after the reporting period |
It should be noted that from January 1, 20122014 to April 27, 201229, 2014 on which these consolidated financial statements were authorized for issue, the following significant events occurred:
On January 3, 2014, the Group announced that it had sold to Altamira Asset Management Holdings, S.L., an investee of Apollo European Principal Finance Fund II, an entity affiliated to Apollo Global Management, LLC (Apollo), 85% of the share capital of Altamira Asset Management, S.L., the Group company that manages debt recovery services before the initiation of court action in Spain and the sale or lease of foreclosed property assets relating to this business, for EUR 664 million (see Note 3.b.xviii). At its meeting of January 13, 2014, the Bank’s executive committee resolved to apply the Santander Dividendo Elección scrip dividend scheme on the dates on which the third interim dividend is traditionally paid, whereby the shareholders were offered the option of receiving an amount equivalent to said dividend, the gross amount of which was EUR 0.152 per share, in shares or cash. On April 10, 2014 the Group announced the information in connection with the flexible remuneration program “Santander Dividendo Elección” (scrip dividend scheme) to be applied to the final 2013 dividend. The shareholders were offered the option of receiving an amount equivalent to said dividend, the gross amount of which was EUR 0.149 per share, in shares or cash. On January 23, 2014, the public offering of shares of Santander Consumer USA Holdings Inc. (SCUSA) was completed and SCUSA’s share was admitted to trading on the New York Stock Exchange. The placement represented 21.6% of SCUSA’s share capital, of which 4% related to the holding sold by the Group. Following this sale, the Group held 60.7% of the share capital of SCUSA. Both Sponsor Auto Finance Holdings Series LP (Sponsor Holdings) -an investee of funds controlled by Warburg Pincus LLC, Kohlberg Kravis Roberts & Co. L.P. and Centerbridge Partners L.P.- and DDFS LLC (DDFS) - a company controlled by Thomas G. Dundon, the Chief Executive Officer of SCUSA- also reduced their holdings. Since the ownership interests of the former shareholders were reduced to below certain percentages, the prevailing shareholder agreement was terminated, pursuant to the terms and conditions established in said agreement. This termination has included, inter alia, the cancellation of the contingent payment to be made by SCUSA on the basis of its results in 2014 and 2015 (see Note 3.b.v). It has also entailed the termination of the agreements whereby, inter alia, Sponsor Holdings and DDFS LLC were granted representation on the board of directors of SCUSA and a voting system was established whereby the strategic, financial and operating decisions, and other significant decisions associated with the ordinary management of SCUSA, were subject to joint approval by the Group and the aforementioned shareholders and, therefore, SCUSA ceased to be controlled jointly by all the above and, as a result, it has begun to be controlled by the Group |
This Royal Decree-Law forms part of the Government’s structural reforms and contains, inter alia, a series of measures aimed at cleaning up Spanish credit institutions’ balance sheets, which were adversely affected by the impairment of their assets linked to the real estate industry. With this legislation, the Government intends to design an integrated reform strategy that will impact the valuation of these assets and entail the clean-up of Spanish credit institutions’ balance sheets so that financial institutions can once again fulfil their essential function of channelling savings into efficient investment projects that encourage economic activity, growth and employment.
The balance sheet clean-up measures take the form of two main ideas:
i) A revision of the minimum percentages of the provisions that institutions must recognise in their balance sheets in relation to lending to the real estate industry and to foreclosed assets and assets received in payment of loans to the real estate industry; and
ii) An increase in the minimum capital required of Spanish credit institutions, calculated on the basis of the assets relatedpercentage held in its share capital.
The Royal Decree-Law stipulates that credit institutions must comply with its provisions by December 31, 2012,PCCS were issued at par and the provision requiredinterest thereon, the payment of which is a one-off provision aimedsubject to certain conditions and is at eliminating the uncertainty regardingdiscretion of the value of these assets –particularly land– on Spanish credit institutions’ balance sheets. It should be noted that these minimum percentages are established on a general basis and the legislation does not include sufficient detailsBank, was set at 6.25% per annum for the specific featuresfirst five years. After that, it will be reviewed by applying a margin of 541 basis points on the five-year Mid-Swap Rate.
On March 25, 2014, Bank of Spain qualified the PCCS as additional tier 1 under the new European rules on capital requirements set by European Regulation 575/2013. The PCCS are perpetual although they may be called under certain circumstances and would be converted into newly issued ordinary shares of Banco Santander if the common equity Tier 1 ratio of the assets held by different institutions,Bank or its consolidated group, calculated in accordance with European Regulation 575/2013, were to fall below 5.125%. At present, the PCCS are traded on the Global Exchange Market of those held by a single institution to be reflected.the Irish Stock Exchange.
Taking into account the above, and that at 2011 year-end
With respect to the recognition100% of the impact of Royal Decree-Law 2/2012 on the Group’s IFRS-IASB consolidated financial statementscompany Getnet Tecnologia Em Captura e Processamento de Transações H.U.A.H. (“Getnet”) for 2012, the Group will continue to apply its current procedure with regard to Spanish regulatory requirements related to the loan provision and to the valuation of foreclosed assets, i.e. it will compare thean amount of 1,104 million reais (approximately EUR 353 million). Following the provisions for loans and foreclosed assets to be recognised at each date calculated pursuant to IFRSs (obtained from internal models for credit loss provisions and from external valuations and other evidence for foreclosed assets and assets receivedacquisition, Banco Santander (Brasil) S.A. will hold indirectly an 88.5% stake in payment of loans) with the amount of the provisions required by the Spanish regulatory requirement including Royal Decree-Law 2/2012 in order to ascertain whether the difference between the two amounts is not material in relation to the Group’s consolidated financial statements as a whole and, accordingly, does not require any adjustment to be made for the preparation of the consolidated financial statements under IFRS-IASB.
F-16
As of the date hereof, it was not possible to estimate the provisions that will have to be recognised in the consolidated IFRS books at December 31, 2012, since the provisions will depend, inter alia, on the rate of sales of the real estate portfolio, the general performance of the economy in the year and, in particular, on the value of real estate assets. However, if the Government’s negative forecasts are borne out, it is possible that the provision required under IFRSs will converge with the provision required for regulatory purposes calculated pursuant to Royal Decree-Law 2/2012.
Getnet. The transaction will entailhave no significant impact on Grupo Santander’s shareholders’ equity.
Getnet specializes in the development and management of technological solutions and services for businesses with electronic transactions. The transaction gives continuity to the growth strategy in the acquiring business. Santander Getnet Serviços para Meios de Pagamento Socidade Anónima is a share capital increasepayment service provider company in Bank Zachodni WBK, wherewhich Santander Brasil and Getnet presently hold 50% each.
It is expected that the newly issued shares in Bank Zachodni WBKtransaction (which is subject to regulatory authorization) will be offered and rendered to KBC and the other shareholders of Kredyt Bank in exchange for their shares in Kredyt Bank. Under the agreements, and subject to independent evaluation and final agreement by Bank Zachodni WBK and Kredyt Bank, as well as to obtaining regulatory approval from the Polish Financial Supervision Authority (Komisja Nadzoru Finansowego) and relevant competition clearance, Bank Zachodni WBK will merge with Kredyt Bank at the ratio of 6.96 Bank Zachodni WBK shares for every 100 Kredyt Bank shares. At current market prices, the transaction values Kredyt Bank at PLN 15.75 a share and BZ WBK at PLN 226.4 a share. The combined bank’s total pro forma value will be PLN 20.8 billion (€5 billion). Both Bank Zachodni WBK and Kredyt Bank are listed on the Warsaw Stock Exchange. The merged bank will continue to be listed on the Warsaw Stock Exchange.
Following the proposed merger, the Group will hold approximately 76.5% of the merged bank and KBC around 16.4%. The rest will be held by other minority shareholders. The Group has committed ourselves to help KBC to lower its stake in the merged bank from 16.4% to below 10% immediately after the merger. For this purpose, the Group will seek to place a stake with investors. In this regard, the Group has also committed ourselves to acquire up to 5% of the merged bank to assist KBC. Furthermore, KBC intends to divest its remaining stake, with a view to maximizing its value.
With this transaction, the Group will increase our presence in Poland, one of its ten core markets, underlining its long-term commitment to Poland. The proposed merger will consolidate the merged bank’s position as Poland’s third largest bank by all measures, with a market share of 9.6% in deposits, 8.0% in loans and 12.9% in branches (899). With more than 3.5 million retail customers, the merged bank will also be Poland’s third in terms of revenues and profits, significantly closing the gap to the leaders. Including the Santander Consumer finance business, the Group’s total market share in terms of volume will amount to around 10% in Poland. The proposed merger will produce business synergies in addition to those announced following the acquisition of Bank Zachodni WBK by Banco Santander. Santander estimates the impact of this transaction on its Group core capital ratio under Basel II criteria will be around 5 basis points.
Under the investment agreement, Santander has also committed to acquire 100% of Zagiel, the consumer finance arm of KBC in Poland, at an adjusted net asset value, also subject to obtaining the relevant competition clearance. Additionally, the existing cooperation between Kredyt Bank and KBC TFI (KBC’s Polish asset management company) will remain in place for the foreseeable future. The merged bank will distribute KBC TFI’s funds under a non-exclusive distribution agreement for a minimum term of two years from the proposed merger transaction.
The transaction is expected to close inconcluded during the second half of 2012, subject to the registration of the merger between Bank Zachodni WBK and Kredyt Bank and to obtaining regulatory approval from Polish Financial Supervision Authority (Komisdja Nadzoru Finansowego) and relevant competition clearance.2014.
Santander Brazil would remain listed on the Sao Paulo stock exchange and Banco Santander’s shares (parent company) would be listed on that The offer will Those who opt for the voluntary conversion will receive the numberOn April 29, 2014 we have announced that Banco Santander’s board of newdirectors has resolved to make an offer to acquire all shares of Banco Santander Brasil not already held by Grupo Santander, representing approximately 25% of Santander Brasil’s share capital. The transaction would be paid for with up to 665 million shares of Banco Santander (parent company), equivalent to €4,686 million.results from the conversion ratio prevailingmarket as of the date of this report pursuant to the prospectus of the issuance (365.76 shares for eachValor Santander). In addition, theywell.receive,be subject to customary conditions for this type of transaction, including the same cancellation events provided in the prospectus, the remuneration corresponding to theirValores Santander accrued until the applicable voluntary conversion date.
Without prejudice to such voluntary conversion option, the terms and conditions of the issuance remain unchanged. As a result, the holders ofValores Santander who do not opt for the voluntary conversion in any of the conversion windows will maintain the rights of their securities, which will mandatorily convert into new shares of Santander on October 4, 2012 pursuant to the terms of the prospectus.
Such holders of Securities may remit, or request their corresponding mediators or participating entities (in the case that said owners are not participating entities in Sociedad de Gestión de los Sistemas de Registro, Compensación y Liquidación de Valores, S.A. Unipersonal (Iberclear)) to remit, the corresponding instructions of the tender offers (the Tender Offers) to the tender and information agent, Lucid Issuer Services Limited, as from April 16, 2012.
F-17
Tender Offers must specify the number of Securities included in each offer, the outstanding principal amount of such Securities and the price at which such Securities are tendered in the relevant offer. The price shall be specified by each holder as a percentage of the outstanding principal amountgranting of the relevant Securities tendered for purchase. Regarding the senior Securities to which the Invitation is directed, an indicative minimum purchase price has been provided for information purposes onlyregulatory authorizations and is not binding onapproval at Santander Brasil’s and Banco Santander. Banco Santander may, but is not required to accept, Tender Offers made at or below this minimum price.Santander’s general shareholders’ meeting.
Tender Offers will be irrevocable unless Banco Santander modifies the terms of the Invitation in a manner that makes the Invitation less favorable to holders.
The amount in cash that must be paid for each Security is equal to the sum of (i) the purchase price multiplied by the principal amount of the Securities on the date of settlement which are accepted for purchase plus (ii) interest accrued but not paid since the immediately preceding interest payment date (inclusive) until the date of settlement of the Tender Offers (exclusive) in relation to such Securities.
The terms of the Tender Offers and the procedure to make the Tender Offers are set forth in the tender offer memorandum dated April 16, 2012 (the Tender Offer Memorandum).
The Group has absolute discretion whether to accept the Securities tendered for purchase, in accordance with the terms and conditions of the Tender Offer Memorandum.
The Group will satisfy the payment obligations derived from the Invitation, if any, with funds from our treasury.
The Group reserves the right to modify the terms and conditions of the Invitation as well as to extend, re-open or terminate the Invitation at any moment.
The rationale for the Invitation is to effectively manage the Group’s outstanding liabilities and to strengthen our balance sheet. The Offers are also designed to provide liquidity to Security holders.
On April 25, 2012 the Group announced the aggregate outstanding principal amount of each of the Securities accepted for purchase which for senior securities amounted to €388,537,762.18 and for mezzanine securities €61,703,163.58. The sale and purchase agreements of the relevant securities have been agreed.
In respect of each security, the aggregate outstanding principal amount means the outstanding principal amount of the relevant security as at the settlement date (i.e. following any reduction of its original principal amount by prepayments prior to such date in accordance, only, with the terms of such security). The settlement date was April 27, 2012.
| 2. | Accounting policies |
The accounting policies and measurement bases applied in preparing the consolidated financial statements were as follows:
| a) | Foreign currency transactions |
i. Functional currency
| i. | Functional currency |
The Group’s functional currency is the euro. Therefore, all balances and transactions denominated in currencies other than the euro are deemed to be denominated in foreign currency.
ii. Translation of foreign currency balances
| ii. | Translation of foreign currency balances |
Foreign currency balances are translated to euros in two consecutive stages:
Translation of foreign currency to the functional currency (currency of the main economic environment in which the entity operates), and
Translation to euros of the balances held in the functional currencies of entities whose functional currency is not the euro.
F-18
Translation of foreign currency to the functional currency
Foreign currency transactions performed by consolidated entities (or entities accounted for using the equity method) not located in EMU countries are initially recognized in their respective currencies. Monetary items in foreign currency are subsequently translated to their functional currencies using the closing rate.
Furthermore:
Non-monetary items measured at historical cost are translated to the functional currency at the exchange rate at the date of acquisition.
Non-monetary items measured at fair value are translated at the exchange rate at the date when the fair value was determined.
Income and expenses are translated at the average exchange rates for the year for all the transactions performed during the year. When applying this criterion, the Group considers whether there have been significant changes in the exchange rates in the year which, in view of their materiality with respect to the consolidated financial statements taken as a whole, would make it necessary to use the exchange rates at the transaction date rather than the aforementioned average exchange rates.
The balances arising from non-hedging forward foreign currency/foreign currency and foreign currency/euro purchase and sale transactions are translated at the closing rates prevailing in the forward foreign currency market for the related maturity.
Translation of functional currencies to euros
If the functional currency is not the euro, the balances in the financial statements of the consolidated entities (or entities accounted for using the equity method) are translated to euros as follows:
Assets and liabilities, at the closing rates.
Income and expenses, at the average exchange rates for the year.
Equity items, at the historical exchange rates.
iii. Recognition of exchange differences
| iii. | Recognition of exchange differences |
The exchange differences arising on the translation of foreign currency balances to the functional currency are generally recognized at their net amount under Exchange differences in the consolidated income statement, except for exchange differences arising on financial instruments at fair value through profit or loss, which are recognized in the consolidated income statement without distinguishing them from other changes in fair value, and for exchange differences arising on non-monetary items measured at fair value through equity, which are recognized under Valuation adjustments—adjustments - Exchange differences.
The exchange differences arising on the translation to euros of the financial statements denominated in functional currencies other than the euro are recognized under Valuation adjustments—adjustments - Exchange differences in the consolidated balance sheet, whereas those arising on the translation to euros of the financial statements of entities accounted for using the equity method are recognized under Valuation adjustments—adjustments - Entities accounted for using the equity method, until the related item is derecognized, at which time they are recognized in the consolidated income statement.
iv. Entities located in hyperinflationary economies
| iv. | Entities located in hyperinflationary economies |
As indicated in Note 3, inIn 2009 the Group sold substantially all its businesses in Venezuela and at December 31, 20112013 its net assets in that country amounted to only EUR 101 million (December 31, 2010:2012: EUR 183 million; December 31, 2011: EUR 10 million).
F-19
In view of the foregoing, at December 31, 2011, 20102013, 2012 and 20092011 none of the functional currencies of the consolidated entities and associates located abroad related to hyperinflationary economies as defined by International Financial Reporting Standards as adopted by the European Union. Accordingly, at 2011, 20102013, 2012 and 20092011 year-end it was not necessary to adjust the financial statements of any of the consolidated entities or associates to correct for the effect of inflation.
v. Exposure to foreign currency risk
At December 31, 2011, the Group’s largest exposures on temporary positions (with a potential impact on the income statement) were concentrated, in descending order, on the pound sterling, the Mexican peso, the Chilean peso, the Polish zloty and the US dollar. At that date, its largest exposure on permanent positions (with a potential impact on equity) were concentrated, in descending order, on the Brazilian real, the pound sterling, the US dollar, the Mexican peso and the Polish zloty.
At December 31, 2010, the Group’s largest exposures on temporary positions (with a potential impact on the income statement) were concentrated, in descending order, on the pound sterling, the Mexican peso and the Chilean peso. At that date, its largest exposures on permanent positions (with a potential impact on equity) were concentrated, in descending order, on the Brazilian real, the pound sterling, the Mexican peso, the US dollar and the Chilean peso.
At December 31, 2009, the Group’s largest exposures on temporary positions (with a potential impact on the income statement) were concentrated, in descending order, on the pound sterling and the Chilean peso. At that date, its largest exposures on permanent positions (with a potential impact on equity) were concentrated, in descending order, on the Brazilian real, the pound sterling, the Mexican peso and the Chilean peso.
| v. | Exposure to foreign currency risk |
The Group hedges a portion of these permanent positions using foreign exchange derivative financial instruments (see Note 36). Also, the Group manages foreign currency risk by dynamically hedging its position over time (with a potential impact on profit or loss) and attempting to limit the impact of currency depreciations and, in turn, optimizing the finance cost of the hedges.
The following tables show the sensitivity of consolidated profit and consolidated equity to changes in the Group’s foreign currency positions arising from all the Group’s items denominated in foreign currencies due to 1% variations in the various foreign currencies in which the Group has material balances.
The estimated effect on the Group’s consolidated equity and consolidated profit of a 1% appreciation of the euro against the related currency is as follows:
| Millions of euros | ||||||||||||||||||||||||
| Effect on consolidated equity | Effect on consolidated profit | |||||||||||||||||||||||
Currency | 2011 | 2010 | 2009 | 2011 | 2010 | 2009 | ||||||||||||||||||
US dollar | (41.7 | ) | (39.1 | ) | — | 2.8 | — | 2.8 | ||||||||||||||||
Chilean peso | (7.3 | ) | (11.7 | ) | (12.7 | ) | 6.1 | 7.6 | 7.0 | |||||||||||||||
Pound sterling | (72.8 | ) | (62.0 | ) | (21.5 | ) | 10.5 | 20.3 | 16.2 | |||||||||||||||
Mexican peso | (22.2 | ) | (42.9 | ) | (20.5 | ) | 9.5 | 9.1 | 4.7 | |||||||||||||||
Brazilian real | (151.7 | ) | (89.2 | ) | (111.4 | ) | — | — | — | |||||||||||||||
Polish zloty | (19.4 | ) | (2.6 | ) | (2.3 | ) | 3.7 | — | — | |||||||||||||||
F-20
| Millions of euros | ||||||||||||||||||||||||
| Effect on consolidated equity | Effect on consolidated profit | |||||||||||||||||||||||
Currency | 2013 | 2012 | 2011 | 2013 | 2012 | 2011 | ||||||||||||||||||
US dollar | (74.2 | ) | (71.6 | ) | (43.6 | ) | (9.0 | ) | (8.3 | ) | (19.4 | ) | ||||||||||||
Chilean peso | (16.2 | ) | (19.3 | ) | (8.6 | ) | (6.7 | ) | (4.8 | ) | (1.4 | ) | ||||||||||||
Pounds sterling | (173.1 | ) | (165.4 | ) | (150.1 | ) | (7.9 | ) | (11.0 | ) | (0.6 | ) | ||||||||||||
Mexican peso | (9.7 | ) | (11.6 | ) | (17.5 | ) | (7.8 | ) | (9.8 | ) | (1.3 | ) | ||||||||||||
Brazilian real | (73.8 | ) | (149.6 | ) | (208.3 | ) | (3.9 | ) | (20.0 | ) | (23.0 | ) | ||||||||||||
Polish zloty | (32.5 | ) | (44.3 | ) | (37.9 | ) | (3.8 | ) | (3.3 | ) | (1.0 | ) | ||||||||||||
Similarly, the estimated effect on the Group’s consolidated equity and consolidated profit of a 1% depreciation of the euro against the related currency is as follows:
| Millions of euros | Millions of euros | |||||||||||||||||||||||||||||||||||||||||||||||
| Effect on consolidated equity | Effect on consolidated profit | Effect on consolidated equity | Effect on consolidated profit | |||||||||||||||||||||||||||||||||||||||||||||
Currency | 2011 | 2010 | 2009 | 2011 | 2010 | 2009 | 2013 | 2012 | 2011 | 2013 | 2012 | 2011 | ||||||||||||||||||||||||||||||||||||
US dollar | 42.5 | 39.9 | — | (2.9 | ) | — | (2.8 | ) | 75.7 | 73.1 | 44.5 | 9.2 | 8.5 | 19.8 | ||||||||||||||||||||||||||||||||||
Chilean peso | 7.5 | 11.9 | 12.9 | (6.2 | ) | (7.8 | ) | (7.2 | ) | 16.5 | 19.6 | 8.8 | 6.9 | 4.9 | 1.1 | |||||||||||||||||||||||||||||||||
Pound sterling | 74.2 | 63.2 | 21.9 | (10.7 | ) | (20.7 | ) | (16.5 | ) | |||||||||||||||||||||||||||||||||||||||
Pounds sterling | 176.6 | 168.8 | 153.2 | 8.0 | 11.2 | 0.6 | ||||||||||||||||||||||||||||||||||||||||||
Mexican peso | 22.6 | 42.0 | 16.5 | (9.7 | ) | (9.3 | ) | (4.8 | ) | 9.9 | 11.8 | 17.8 | 8.0 | 10.0 | 1.4 | |||||||||||||||||||||||||||||||||
Brazilian real | 60.1 | 81.0 | 81.9 | — | — | — | 75.4 | 147.8 | 117.9 | 4.0 | 20.5 | 23.5 | ||||||||||||||||||||||||||||||||||||
Polish zloty | 19.8 | 2.7 | 2.4 | (3.8 | ) | — | — | 33.1 | 40.5 | 38.6 | 3.8 | 3.4 | 1.0 | |||||||||||||||||||||||||||||||||||
The foregoing data were obtained by calculating the possible effect of a variation in exchange rates on the various asset and liability items, excluding the foreign exchange positions arising from goodwill, and on other foreign currency-denominated items, such as the Group’s derivative instruments, considering the offsetting effect of the various hedging transactions on these items. This effect was estimated using the exchange difference recognition methods set forth in Note 2.a) iii above.follows:
Also, the estimated effect on the Group’s consolidated equity of a 1% appreciation or depreciation of the euro against the foreign currencies in which goodwill is denominated at December 31, 2011 would be a decrease or increase, respectively, in equity due to valuation adjustments of EUR 88.1 million and EUR 89.9 million in the case of the pound sterling (2010: EUR 85.5 million and EUR 87.2 million; 2009: EUR 82.8 million and EUR 84.5 million), EUR 80.5 million and EUR 82.1 million in the case of the Brazilian real (2010: EUR 86.7 million and EUR 88.4 million; 2009: EUR 76.3 million and EUR 77.8 million), EUR 22.5 million and EUR 23 million in the case of the US dollar (2010: EUR 21.8 million and EUR 22.3 million; 2009: EUR 20.3 million and EUR 20.7 million), and EUR 39.2 million and EUR 40 million for the other currencies (2010: EUR 15.1 million and EUR 15.4 million; 2009: EUR 11.0 million and EUR 11.3 million). These changes are offset by a decrease or increase, respectively, in the balance of goodwill at that date and, therefore, they have no impact on the calculation of the Group’s equity.
| a. | Effect on consolidated equity: in accordance with the accounting policy detailed in Note 2.a.iii, the exchange differences arising on the translation to euros of the financial statements in the functional currencies of the Group entities whose functional currency is not the euro are recognized in consolidated equity. The possible effect that a change in the exchange rates of the related currency would have on the Group’s consolidated equity was therefore determined by applying the aforementioned change to the net value of each unit’s assets and liabilities -including, where appropriate, the related goodwill- and by taking into consideration the offsetting effect of the hedges of net investments in foreign operations. |
| b. | Effect on consolidated profit: the effect was determined by applying the fluctuations in the average exchange rates used for the year, as indicated in Note 2.a.ii, to translate to euros the income and expenses of the consolidated entities whose functional currency is not the euro, taking into consideration, where appropriate, the offsetting effect of the various hedging transactions in place. |
The estimates used to obtain the foregoing data were performed considering the effects of the exchange rate fluctuations in isolation from the effect of the performance of other variables, the changes in which would affect equity and profit, such as variations in the interest rates of the reference currencies or other market factors. Accordingly, all variables other than the exchange rate fluctuations were kept constant with respect to their positions at December 31, 2011, 20102013, 2012 and 2009.2011.
| b) | Basis of consolidation |
i. Subsidiaries
Subsidiaries are defined as entities over which the Bank has the capacity to exercise control; controlthe Bank controls an entity when it is in general but not exclusively, presumedexposed, or has rights, to exist when the Parent owns directly or indirectly half or more of the voting power ofvariable returns from its involvement with the investee or, even if this percentage is lower or zero, when, as inand has the case of agreements with shareholders ofability to affect those returns through its power over the investee, the Bank is granted control. Control is the power to govern the financial and operating policies of an entity, as stipulated by the law, the Bylaws or agreement, so as to obtain benefits from its activities.investee.
The financial statements of the subsidiaries are fully consolidated with those of the Bank. Accordingly, all balances and effects of the transactions betweenamong the consolidated entities are eliminated on consolidation.
On acquisition of control of a subsidiary, its assets, liabilities and contingent liabilities are recognized at their acquisition-date fair value at the date of acquisition.values. Any positive differences between the acquisition cost and the fair values of the identifiable net assets acquired are recognized as goodwill (see Note 17). Negative differences are recognized in profit or loss on the date of acquisition.
Additionally, the share of third parties of the Group’s equity is presented under Non-controlling interests in the consolidated balance sheet (see Note 28). Their share of the profit for the year is presented under Profit attributable to non-controlling interests in the consolidated income statement.
F-21
The results of subsidiaries acquired during the year are included in the consolidated income statement from the date of acquisition to year-end. Similarly, the results of subsidiaries disposed of during the year are included in the consolidated income statement from the beginning of the year to the date of disposal.
At December 31, 2013, the Group controlled the following companies in which it held an ownership interest of less than 50% of the share capital: (i) Luri 1, S.A., (ii) Luri 2, S.A. and (iii) Luri Land, S.A. The percentage ownership interest in the aforementioned companies was 5.8%, 5% and 5.36%, respectively (see Appendix I). Although the Group holds less than half the voting power, it manages and, as a result, exercises control over these entities. The company object of these entities is the acquisition of real estate and other general operations relating thereto, including the rental, purchase and sale of properties.
The impact of the consolidation of these companies on the Group’s consolidated financial statements is immaterial.
The Appendices contain significant information on these entities.the subsidiaries.
ii. Interests in joint ventures (jointly controlled entities)
| ii. | Interests in joint ventures (jointly controlled entities) |
Joint ventures are deemed to be ventures that are not subsidiaries but which are jointly controlled by two or more unrelated entities. This is evidenced by contractual arrangements whereby two or more entities (venturers) acquire interestshave interest in entities (jointly controlled entities) or undertake operations or hold assets so that strategic financial and operating decisions affecting the joint ventureon significant activities require the unanimous consent of all the venturers.parties sharing control.
In the consolidated financial statements, investments in jointly controlled entities are accounted for using the equity method, i.e. at the Group’s share of net assets of the investee, after taking into account the dividends received therefrom and other equity eliminations. The profits and losses resulting from transactions with a jointly controlled entity are eliminated to the extent of the Group’s ownership interest therein.
At December 31, 2013, 2012 and 2011, the Group exercised joint control of Santander Consumer USA Holdings Inc. (SCUSA), despite holding 65% of its share capital. As detailed in Note 3.b.v, this decision was based on the entity.existence of a shareholders’ agreement that requires joint approval of certain strategic, financial and operating decisions, as well as other significant decisions associated with the ordinary management of SCUSA.
Also, at December 31, 2013, 2012, and 2011, the Group exercised joint control of Luri 3, S.A., despite holding 10% of its share capital. This decision is based on the Group’s presence on the company’s board of directors, in which the agreement of all members is required for decision-making.
The Appendices contain significant information on thesethe jointly controlled entities.
iii.
| iii. | Associates |
Associates
“Associates” are entities over which the Bank is in a position to exercise significant influence, but not control or joint control. SignificantIt is presumed that the Bank exercises significant influence generally exists when the Bankif it holds 20% or more of the voting power of the investee.
In the consolidated financial statements, investments in associates are accounted for using the equity method, i.e. at the Group’s share of net assets of the investee, after taking into account the dividends received therefrom and other equity eliminations. The profits and losses resulting from transactions with an associate are eliminated to the extent of the Group’s interest in the associate.
There are certain investments in entities (in which the Group owns 20% or more of the voting power) that are not considered to be associates, since the Group is not in a position to exercise significant influence over them. These investments are not significant for the Group and are recognized under Available-for-sale financial assets.
The Appendices contain significant information on these entities.the associates.
iv. Special purpose entities
| iv. | Structured entities |
When the Group incorporates special purpose entities, or holds ownership interests therein, to enable its customers to access certain investments, or for the transfer of risks or other purposes, italso called structured entities since the voting or similar power is not a key factor in deciding who controls the entity, the Group determines, using internal criteria and procedures and taking into consideration the applicable legislation, whether control (as defined above) exists and, therefore, whether these entities should be consolidated. These criteria and procedures take into account, inter alia, the risks and rewards retained by the Group and, accordingly, all relevant matters are taken into consideration, including any guarantees granted or any losses associated with the collection of the related assets retained by the Group. These entities include the securitization special purpose vehicles, which are fully consolidated in the case of the SPVs over which, based on the aforementioned analysis, it is considered that the Group continues to exercise control.
v. Other matters
At December 31, 2011, the Group controlled the following companies in which it held an ownership interest of less than 50% of the share capital: (i) Luri 1, S.A., (ii) Luri 2, S.A. and (iii) Luri Land, S.A. The percentage ownership interest in the aforementioned companies was 5.59%, 4.82% and 5.16%, respectively (see Appendix I). Although the Group holds less than half the voting power, it manages and, as a result, exercises control over these entities.
In addition, at December 31, 2011 the Group exercised joint control of Luri 3, S.A., despite holding 9.63% of its share capital (see Appendix II). This decision is based on the Group’s presence on the company’s board of directors, in which the agreement of all members is required for decision-making.
The impact of the consolidation of these companies onbalances associated with unconsolidated structured entities are not material with respect to the Group’s consolidated financial statements is immaterial.
F-22
The company object of these entities is the acquisition of real estate and other general operations relating thereto, including the rental, purchase and sale of properties (see Appendices I and II). 31% of their assets are located in Spain.
vi. Business combinations
| v. | Business combinations |
A business combination is the bringing together of two or more separate entities or economic units into one single entity or group of entities.
Business combinations whereby the Group obtains control over an entity are recognized for accounting purposes as follows:
The Group measures the cost of the business combination, which is normally the consideration transferred, defined as the acquisition-date fair values of the assets transferred, the liabilities incurred to the former owners of the acquireeacquire and the equity instruments issued, if any, by the acquirer. Since January 1, 2010, inIn cases where the amount of the consideration to be transferred has not been definitively established at the acquisition date, but rather depends on future events, any contingent consideration must beis recognized as part of the consideration transferred and measured at its acquisition-date fair value; also, since that date, acquisition-related costs such as fees paid to auditors, legal advisers, investment banks and other consultants, maydo not for these purposes form part of the cost of the business combination.
The fair values of the assets, liabilities and contingent liabilities of the acquired entity or business, including any intangible assets which might not have been recognized by the acquiree,acquire, are estimated and recognized in the consolidated balance sheet; the Group also estimates the amount of any non-controlling interests and the fair value of the previously held equity interest in the acquiree.
Any positive difference between the aforementioned items is recognized as discussed in Note 2.m. Any negative difference is recognized under Gains onfrom bargain purchases arising onin business combinations in the consolidated income statement.
Since January 1, 2010, goodwillGoodwill is only measured and recognized once, when control is obtained of a business.
vii. Changes in the levels of ownership interests in subsidiaries
| vi. | Changes in the levels of ownership interests in subsidiaries |
As required under IFRSs, since January 1, 2010, acquisitionsAcquisitions and disposals not giving rise to a change in control are recognized as equity transactions, and no gain or loss is recognized in the income statement and the initially recognized goodwill is not remeasured. The difference between the consideration transferred or received and the decrease or increase in non-controlling interests, respectively, is recognized in reserves.
Similarly, since that date, IAS 27 has established that when control over a subsidiary is lost, the assets, liabilities and non-controlling interests and any other items recognized in valuation adjustments of that company are derecognized from the consolidated balance sheet, and the fair value of the consideration received and of any remaining equity interest is recognized. The difference between these amounts is recognized in profit or loss.
With respect to non-monetary contributions of businesses to jointly controlled entities, the IASB has acknowledged the existence of a conflict between IAS 27,IFRS 10.25, which establishes that if control is lost the remaining equity interest is measured at fair value, recognisingrecognizing the full amount of the gain or loss in profit or loss, and IAS 31.48, together with SIC 13,28.28, which –for-for transactions underwithin its scope- would only permit recognition of the portion of the gain or loss attributable to the capital owned by the other venturers in the jointly controlled entity. The IASB is expected to issue a definitive positioning in this regard in the second quarter of 2014. Until that date, the Group has opted to apply, in a consistent manner, the provisions of IFRS 10 (previously IAS 27 consistently27), a treatment that coincides with that proposed by the IASB in the latest drafts, to all transactions falling under the scope of the aforementioned standards.
viii. Acquisitions and disposals
| vii. | Acquisitions and disposals |
Note 3 provides information on the most significant acquisitions and disposals in 2011, 20102013, 2012 and 2009.2011.
F-23
| c) | Definitions and classification of financial instruments |
i. Definitions
| i. | Definitions |
A financial instrument is any contract that gives rise to a financial asset of one entity and simultaneously, to a financial liability or equity instrument of another entity.
An equity instrument is any agreement that evidences a residual interest in the assets of the issuing entity after deducting all of its liabilities.
A financial derivative is a financial instrument whose value changes in response to the change in an observable market variable (such as an interest rate, foreign exchange rate, financial instrument price, market index or credit rating), whose initial investment is very small compared with other financial instruments with a similar response to changes in market factors, and which is generally settled at a future date.
Hybrid financial instruments are contracts that simultaneously include a non-derivative host contract together with a derivative, known as an embedded derivative, that is not separately transferable and has the effect that some of the cash flows of the hybrid contract vary in a way similar to a stand-alone derivative.
Compound financial instruments are contracts that simultaneously create for their issuer a financial liability and an own equity instrument (such as convertible bonds, which entitle their holders to convert them into equity instruments of the issuer).
The following transactions are not treated for accounting purposes as financial instruments:
Investments in associates and jointly controlled entities (see Note 13).
Rights and obligations under employee benefit plans (see Note 25).
Rights and obligations under insurance contracts (see Note 15).
Contracts and obligations relating to employee remuneration based on own equity instruments (see Note 34).
ii. Classification of financial assets for measurement purposes
| ii. | Classification of financial assets for measurement purposes |
Financial assets are initially classified into the various categories used for management and measurement purposes, unless they have to be presented as Non-current assets held for sale or they relate to Cash and balances with central banks, Changes in the fair value of hedged items in portfolio hedges of interest rate risk (asset side), Hedging derivatives and Investments, which are reported separately.
Financial assets are included for measurement purposes in one of the following categories:
Financial assets held for trading (at fair value through profit or loss): this category includes the financial assets acquired for the purpose of generating a profit in the near term from fluctuations in their prices and financial derivatives that are not designated as hedging instruments.
Other financial assets at fair value through profit or loss: this category includes hybrid financial assets not held for trading that are measured entirely at fair value and financial assets not held for trading that are included in this category in order to obtain more relevant information, either because this eliminates or significantly reduces recognition or measurement inconsistencies (accounting mismatches) that would otherwise arise from measuring assets or liabilities or recognisingrecognizing the gains or losses on them on different bases, or because a group of financial assets or financial assets and liabilities is managed and its performance is evaluated on a fair value basis, in accordance with a documented risk management or investment strategy, and information about the group is provided on that basis to the Group’s key management personnel. Financial assets may only be included in this category on the date they are acquired or originated.
F-24
Available-for-sale financial assets: this category includes debt instruments not classified as Held-to-maturity investments, Loans and receivables or Financial assets at fair value through profit or loss, and equity instruments issued by entities other than subsidiaries, associates and jointly controlled entities, provided that such instruments have not been classified as Financial assets held for trading or as Other financial assets at fair value through profit or loss.
Loans and receivables: this category includes the investment arising from ordinary lending activities, such as the cash amounts of loans drawn down and not yet repaid by customers or the deposits placed with other institutions, whatever the legal instrument, unquoted debt securities and receivables from the purchasers of goods, or the users of services, constituting part of the Group’s business.
The consolidated entities generally intend to hold the loans and credits granted by them until their final maturity and, therefore, they are presented in the consolidated balance sheet at their amortisedamortized cost (which includes any reductions required to reflect the estimated losses on their recovery).
Held-to-maturity investments: this category includes debt instruments traded in an active market, with fixed maturity and with fixed or determinable payments, for which the Group has both the intention and proven ability to hold to maturity.
iii. Classification of financial assets for presentation purposes
| iii. | Classification of financial assets for presentation purposes |
Financial assets are classified by nature into the following items in the consolidated balance sheet:
Cash and balances with central banks: cash balances and balances receivable on demand relating to deposits with the Bank of Spain and other central banks.
Loans and advances: includes the debit balances of all credit and loans granted by the Group, other than those represented by securities, as well as finance lease receivables and other debit balances of a financial nature in favourfavor of the Group, such as cheques drawn on credit institutions, balances receivable from clearing houses and settlement agencies for transactions on the stock exchange and organisedorganized markets, bonds given in cash, capital calls, fees and commissions receivable for financial guarantees and debit balances arising from transactions not originating in banking transactions and services, such as the collection of rentals and similar items. They are classified, depending on the institutional sector to which the debtor belongs, under:
Loans and advances to credit institutions: credit of any nature, including deposits and money market operations, in the name of credit institutions.
Loans and advances to customers: includes the remaining credit, including money market operations through central counterparties.
Debt instruments: bonds and other securities that represent a debt for their issuer, that generate an interest return, and that are in the form of certificates or book entries.
Equity instruments: financial instruments issued by other entities, such as shares, which have the nature of equity instruments for the issuer, unless they are investments in subsidiaries, jointly controlled entities or associates. Investment fund units are included in this item.
Trading derivatives: includes the fair value in favourfavor of the Group of derivatives which do not form part of hedge accounting, including embedded derivatives separated from hybrid financial instruments.
Changes in the fair value of hedged items in portfolio hedges of interest rate risk: this item is the balancing entry for the amounts credited to the consolidated income statement in respect of the measurement of the portfolios of financial instruments which are effectively hedged against interest rate risk through fair value hedging derivatives.
Hedging derivatives: includes the fair value in favourfavor of the Group of derivatives, including embedded derivatives separated from hybrid financial instruments, designated as hedging instruments in hedge accounting.
F-25
iv. Classification of financial liabilities for measurement purposes
| iv. | Classification of financial liabilities for measurement purposes |
Financial liabilities are initially classified into the various categories used for management and measurement purposes, unless they have to be presented as Liabilities associated with non-current assets held for sale or they relate to Hedging derivatives or Changes in the fair value of hedged items in portfolio hedges of interest rate risk (liability side), which are reported separately.
Financial liabilities are classified for measurement purposes into one of the following categories:
Financial liabilities held for trading (at fair value through profit or loss): this category includes the financial liabilities issued for the purpose of generating a profit in the near term from fluctuations in their prices, financial derivatives not considered to qualify for hedge accounting and financial liabilities arising from the outright sale of financial assets acquired under reverse repurchase agreements (“reverse repos”) or borrowed (short positions).
Other financial liabilities at fair value through profit or loss: financial liabilities are included in this category when more relevant information is obtained, either because this eliminates or significantly reduces recognition or measurement inconsistencies (accounting mismatches) that would otherwise arise from measuring assets or liabilities or recognisingrecognizing the gains or losses on them on different bases, or because a group of financial liabilities or financial assets and liabilities is managed and its performance is evaluated on a fair value basis, in accordance with a documented risk management or investment strategy, and information about the group is provided on that basis to the Group’s key management personnel. Liabilities may only be included in this category on the date when they are issued or originated.
Financial liabilities at amortisedamortized cost: financial liabilities, irrespective of their instrumentation and maturity, not included in any of the above-mentioned categories which arise from the ordinary borrowing activities carried on by financial institutions.
v. Classification of financial liabilities for presentation purposes
| v. | Classification of financial liabilities for presentation purposes |
Financial liabilities are classified by nature into the following items in the consolidated balance sheet:
Deposits: includes all repayable balances received in cash by the Group, other than those instrumented as marketable securities and those having the substance of subordinated liabilities. This item also includes cash bonds and cash consignments received the amount of which may be invested without restriction. Deposits are classified on the basis of the creditor’s institutional sector into:
Deposits from central banks: deposits of any nature, including credit received and money market operations received from the Bank of Spain or other central banks.
Deposits from credit institutions: deposits of any nature, including credit received and money market operations in the name of credit institutions.
Customer deposits: includes the remaining deposits, including money market operations through central counterparties.
Marketable debt securities: includes the amount of bonds and other debt represented by marketable securities, other than those having the substance of subordinated liabilities. This item includes the component considered to be a financial liability of issued securities that are compound financial instruments.
Trading derivatives: includes the fair value, with a negative balance for the Group, of derivatives, including embedded derivatives separated from the host contract, which do not form part of hedge accounting.
Short positions: includes the amount of financial liabilities arising from the outright sale of financial assets acquired under reverse repurchase agreements or borrowed.
F-26
Subordinated liabilities: amount of financing received which, for the purposes of payment priority, ranks behind ordinary debt. This category also includes the financial instruments issued by the Group which, although capital for legal purposes, do not meet the requirements for classification as equity, such as certain preference shares issued.
Other financial liabilities: includes the amount of payment obligations having the nature of financial liabilities not included in other items, and liabilities under financial guarantee contracts, unless they have been classified as doubtful.
Changes in the fair value of hedged items in portfolio hedges of interest rate risk: this item is the balancing entry for the amounts charged to the consolidated income statement in respect of the measurement of the portfolios of financial instruments which are effectively hedged against interest rate risk through fair value hedging derivatives.
Hedging derivatives: includes the fair value of the Group’s liability in respect of derivatives, including embedded derivatives separated from hybrid financial instruments, designated as hedging instruments in hedge accounting.
| d) | Measurement of financial assets and liabilities and recognition of fair value changes |
In general, financial assets and liabilities are initially recognized at fair value which, in the absence of evidence to the contrary, is deemed to be the transaction price. Financial instruments not measured at fair value through profit or loss are adjusted by the transaction costs. Financial assets and liabilities are subsequently measured at each period-endyear-end as follows:
i. Measurement of financial assets
| i. | Measurement of financial assets |
Financial assets are measured at fair value, without deducting any transaction costs that may be incurred on their disposal, except for loans and receivables, held-to-maturity investments, equity instruments whose fair value cannot be determined in a sufficiently objective manner and financial derivatives that have those equity instruments as their underlying and are settled by delivery of those instruments.
The fair value of a financial instrumentasset on a given date is taken to be the amount for which it couldprice that would be boughtreceived to sell an asset or sold on that date by two knowledgeable, willing partiespaid to transfer a liability in an arm’s lengthorderly transaction acting prudently.between market participants. The most objective and common reference for the fair value of a financial instrument is the price that would be paid for it on an active, transparent and deep market (quoted price or market price). At December 31, 2011,2013, there were no significant investments in quoted financial instruments which have ceased to be recognized at their quoted price because their market cannot be deemed to be active.
If there is no market price for a given financial instrument, its fair value is estimated on the basis of the price established in recent transactions involving similar instruments and, in the absence thereof, of valuation techniques commonly used by the international financial community, taking into account the specific features of the instrument to be measured and, particularly, the various types of risk associated with it.
All derivatives are recognized in the balance sheet at fair value from the trade date. If the fair value is positive, they are recognized as an asset and if the fair value is negative, they are recognized as a liability. The fair value on the trade date is deemed, in the absence of evidence to the contrary, to be the transaction price. The changes in the fair value of derivatives from the trade date are recognized in Gains/losses on financial assets and liabilities (net) in the consolidated income statement. Specifically, the fair value of financial derivatives traded in organisedorganized markets included in the portfolios of financial assets or liabilities held for trading is deemed to be their daily quoted price and if, for exceptional reasons, the quoted price cannot be determined on a given date, these financial derivatives are measured using methods similar to those used to measure OTC derivatives.
The fair value of OTC derivatives is taken to be the sum of the future cash flows arising from the instrument, discounted to present value at the date of measurement (present value or theoretical close) using valuation techniques commonly used by the financial markets: net present value (NPV), option pricing models and other methods.
F-27
Loans and receivables and Held-to-maturity investments are measured at amortisedamortized cost using the effective interest method. AmortisedAmortized cost is understood to be the acquisition cost of a financial asset or liability plus or minus, as appropriate, the principal repayments and the cumulative amortization (taken to the income statement) of the difference between the initial cost and the maturity amount. In the case of financial assets, amortisedamortized cost furthermore includes any reductions for impairment or uncollectibility. In the case of loans and receivables hedged in fair value hedges, the changes in the fair value of these assets related to the risk or risks being hedged are recognized.
The effective interest rate is the discount rate that exactly matches the carrying amount of a financial instrument to all its estimated cash flows of all kinds over its remaining life. For fixed rate financial instruments, the effective interest rate coincides with the contractual interest rate established on the acquisition date plus, where applicable, the fees and transaction costs that, because of their nature, form part of their financial return. In the case of floating rate financial instruments, the effective interest rate coincides with the rate of return prevailing in all connections until the next benchmark interest reset date.
Equity instruments whose fair value cannot be determined in a sufficiently objective manner and financial derivatives that have those instruments as their underlying and are settled by delivery of those instruments are measured at acquisition cost adjusted, where appropriate, by any related impairment loss.
The amounts at which the financial assets are recognized represent, in all material respects, the Group’s maximum exposure to credit risk at each reporting date. Also, the Group has received collateral and other credit enhancements to mitigate its exposure to credit risk, which consist mainly of mortgage guarantees, cash collateral, equity instruments and personal security, assets leased out under finance lease and full-service lease agreements, assets acquired under repurchase agreements, securities loans and credit derivatives.
ii. Measurement of financial liabilities
| ii. | Measurement of financial liabilities |
In general, financial liabilities are measured at amortisedamortized cost, as defined above, except for those included under Financial liabilities held for trading and Other financial liabilities at fair value through profit or loss and financial liabilities designated as hedged items (or hedging instruments) in fair value hedges, which are measured at fair value.
F-28
iii. Valuation techniques
| iii. | Valuation techniques |
The following table shows a summary of the fair values, at 2011, 20102013, 2012 and 20092011 year-end, of the financial assets and liabilities indicated below, classified on the basis of the various measurement methods used by the Group to determine their fair value:
| Millions of euros | ||||||||||||||||||||||||||||||||||||||||||||||||||||||||||||||||||||||||
| Millions of euros | 2013 | 2012 | 2011 | |||||||||||||||||||||||||||||||||||||||||||||||||||||||||||||||||||||
| 2011 | 2010 | 2009 | Published price quotations in active markets | Internal models | Total | Published price quotations in active markets | Internal models | Total | Published price quotations in active markets | Internal models | Total | |||||||||||||||||||||||||||||||||||||||||||||||||||||||||||||
| Published price quotations in active markets | Internal models | Total | Published price quotations in active markets | Internal models | Total | Published price quotations in active markets | Internal models | Total | ||||||||||||||||||||||||||||||||||||||||||||||||||||||||||||||||
Financial assets held for trading | 45,528 | 127,110 | 172,638 | 65,009 | 91,753 | 156,762 | 61,056 | 73,998 | 135,054 | 46,472 | 68,817 | 115,289 | 48,014 | 129,903 | 177,917 | 45,528 | 127,110 | 172,638 | ||||||||||||||||||||||||||||||||||||||||||||||||||||||
Other financial assets at fair value through profit or loss | 2,324 | 17,239 | 19,563 | 9,446 | 30,034 | 39,480 | 8,938 | 28,876 | 37,814 | 3,687 | 27,694 | 31,381 | 3,387 | 24,969 | 28,356 | 2,324 | 17,239 | 19,563 | ||||||||||||||||||||||||||||||||||||||||||||||||||||||
Available-for-sale financial assets | 68,325 | 18,288 | 86,613 | 69,337 | 16,898 | 86,235 | 75,468 | 11,152 | 86,620 | |||||||||||||||||||||||||||||||||||||||||||||||||||||||||||||||
Available-for-sale financial assets (1) | 62,343 | 20,995 | 83,338 | 65,720 | 26,039 | 91,759 | 68,325 | 17,830 | 86,155 | |||||||||||||||||||||||||||||||||||||||||||||||||||||||||||||||
Hedging derivatives (assets) | 1,497 | 8,401 | 9,898 | 1,226 | 7,001 | 8,227 | 1,226 | 6,608 | 7,834 | 221 | 8,080 | 8,301 | 128 | 7,808 | 7,936 | 1,497 | 8,401 | 9,898 | ||||||||||||||||||||||||||||||||||||||||||||||||||||||
Financial liabilities held for trading | 16,084 | 130,864 | 146,948 | 18,027 | 118,745 | 136,772 | 12,013 | 103,503 | 115,516 | 14,643 | 80,030 | 94,673 | 15,985 | 127,257 | 143,242 | 16,084 | 130,864 | 146,948 | ||||||||||||||||||||||||||||||||||||||||||||||||||||||
Other financial liabilities at fair value through profit or loss | — | 44,909 | 44,909 | — | 51,020 | 51,020 | — | 42,371 | 42,371 | — | 42,311 | 42,311 | — | 45,418 | 45,418 | — | 44,909 | 44,909 | ||||||||||||||||||||||||||||||||||||||||||||||||||||||
Hedging derivatives (liabilities) | 592 | 5,852 | 6,444 | 509 | 6,125 | 6,634 | 318 | 4,873 | 5,191 | 187 | 5,096 | 5,283 | 96 | 6,348 | 6,444 | 592 | 5,852 | 6,444 | ||||||||||||||||||||||||||||||||||||||||||||||||||||||
Liabilities under insurance contracts | — | 517 | 517 | 4,163 | 6,286 | 10,449 | 5,006 | 11,910 | 16,916 | — | 1,430 | 1,430 | — | 1,425 | 1,425 | — | 517 | 517 | ||||||||||||||||||||||||||||||||||||||||||||||||||||||
| (1) | In addition to the financial instruments measured at fair value shown in the foregoing table, at December 31, 2013, 2012 and 2011, the Group held equity instruments classified as available-for-sale financial assets and carried at cost amounting to EUR 461 million, EUR 507 million and EUR 458 million, respectively (see Note 51.c). |
Financial instruments at fair value, determined on the basis of published price quotations in active markets (Level 1), include government debt securities, private-sector debt securities, derivatives traded in organisedorganized markets, securitisedsecuritized assets, shares, short positions and fixed-income securities issued.
In cases where price quotations cannot be observed, management makes its best estimate of the price that the market would set, using its own internal models. In most cases, these internal models use data based on observable market parameters as significant inputs (Level 2) and, in very specific cases, they use significant inputs not observable in market data (Level 3). In order to make these estimates, various techniques are employed, including the extrapolation of observable market data. The best evidence of the fair value of a financial instrument on initial recognition is the transaction price, unless the fair value of the instrument can be obtained from other market transactions performed with the same or similar instruments or can be measured by using a valuation technique in which the variables used include only observable market data, mainly interest rates. In accordance with the standards in force (IFRSs), any difference between the transaction price and the fair value based on valuation techniques is not initially recognized in the income statement.
The Group did not make any material transfers of financial instruments between onethe measurement methodlevels described above in 2013.
General measurement bases
The Group has developed a formal process for the systematic valuation and another in 2011.
F-29
The main techniques used at December 31, 2011 bymanagement of financial instruments, which has been implemented worldwide across all the Group’s internalunits. The governance scheme for this process distributes responsibilities between two independent divisions: Treasury (development, marketing and daily management of financial products and market data) and Risk (on a periodic basis, validation of pricing models to determineand market data, computation of risk metrics, new transaction approval policies, management of market risk and implementation of fair value adjustment policies).
The approval of new products follows a sequence of steps (request, development, validation, integration in corporate systems and quality assurance) before the fairproduct is brought into production. This process ensures that pricing systems have been properly reviewed and are stable before they are used.
The following subsections set forth the most important products and families of derivatives, and the related valuation techniques and inputs, by asset class:
Fixed income and inflation
The fixed income asset class includes basic instruments such as interest rate forwards, interest rate swaps and cross currency swaps, which are valued using the net present value of the financial instruments detaileddiscounted estimated future cash flows taking into account basis swap and cross currency spreads, depending on the payment frequency and currency of each leg of the derivative. Vanilla options, including caps, floors and swaptions, are priced using the Black-Scholes model, which is one of the benchmark industry models. More exotic derivatives are priced using more complex models which are generally accepted as standard across institutions.
These pricing models are fed with observable data such as deposit interest rates, futures rates, cross currency swap and constant maturity swap rates, and basis spreads, on the basis of which different yield curves are calculated, depending on the payment frequency and discounting curves for each currency. In the case of options, implied volatilities are also used as model inputs. These volatilities are observable in the table belowmarket for cap and floor options and swaptions, and interpolation and extrapolation of volatilities from the quoted ranges are carried out using generally accepted industry models. The pricing of more exotic derivatives may require the use of non-observable data or parameters, such as follows:correlation (among interest rates and cross-asset), mean reversion rates and prepayment rates, which are usually defined from historical data or through calibration.
Equity and foreign exchange
The most important products in these asset classes are forward and futures contracts; they also include vanilla, listed and OTC (over-the-counter) derivatives on single underlying assets and baskets of assets. Vanilla options are priced using the yield curves of the related currencies. The yield curvesstandard Black-Scholes model and more exotic derivatives involving forward returns, average performance, or digital, barrier or callable features are priced using generally observable market dataaccepted industry models and are constructed takingbespoke models, as appropriate. For derivatives on illiquid stocks, hedging takes into account the so-called “basis risk” for various terms on the curve and for various currencies.
The inputs of foreign exchange models include the interest rate curve for each currency, the spot levels, yield curves, dividends,foreign exchange price and the implied volatilities and correlation among assets of this type. Volatilities are obtained from European vanilla call and put options which are quoted in markets as at-the-money, risk reversal or butterfly options. Illiquid currency pairs are usually handled by using the correlation between indices and shares.
Credit
The most common instrument in this asset class is the credit default swap (CDS), which is used to hedge againstcredit exposure to third parties. In addition, valuation models for first-to-default (FTD), n-to-default (NTD) and single-tranche collateralized debt obligation (CDO) products are also available. These products are valued with standard industry models, which estimate probability of default of a credit event (Credit Default Swaps (CDS)) credit risk is measured using dynamic models similar to those used in the measurement of interest rate risk. In the case of non-linear instruments, if the portfolio is exposed to credit risk (e.g. credit derivatives),single issuer (for CDSs) or the joint probability of default of more than one issuer for FTDs and CDOs.
Valuation inputs are the interest rate curve, the CDS spread curve and the recovery rate. The CDS spread curve is determinedobtained in the market for indices and important individual issuers. For less liquid issuers, this spread curve is estimated using proxies or other credit-dependent instruments. Recovery rates are usually set to standard values. For listed single-tranche CDOs, the Standard Gaussian Copula model. correlation of joint default of several issuers is implied from the market. For FTDs, NTDs and bespoke CDOs, the correlation is estimated from proxies or historical data when no other option is available.
Valuation adjustment for counterparty risk or default risk
The maincredit valuation adjustment (CVA) is a valuation adjustment to OTC derivatives as a result of the risk associated with the credit exposure assumed to each counterparty.
The CVA is calculated taking into account potential exposure with each counterparty in each future period. The CVA for a specific counterparty is equal to the sum of the CVA for all the periods. The following inputs are used to determinecalculate the underlying costCVA:
The fair valuedebt valuation adjustment (DVA) is a similar valuation adjustment to the CVA but, in this case, as a result of financial instruments obtained from the aforementioned internal models takes into account, inter alia,own risk of the contract termsGroup assumed by its counterparties in OTC derivatives.
The CVA and observable market data, which include interest rates, creditDVA recognized at December 31, 2013 amounted to EUR 739 million and EUR 234 million, respectively.
Valuation adjustments due to model risk exchange rates, the quoted market price of commodities and shares, volatility and prepayments.
The valuation models described above are not significantly subjective, since they can be adjusted and recalibrated, where appropriate, through the internal calculation of the fair value and the subsequent comparison with the related actively traded price. However, fair value adjustments may be necessary when market quoted prices are not available for comparison purposes.
The sources of risk are associated with uncertain model parameters, illiquid underlying issuers, low quality market data or missing risk factors (sometimes the best available option is to use limited models with controllable risk). In these situations, the Group calculates and applies valuation adjustments in accordance with general industry practice. The main sources of model risk are described below:
In fixed income markets, model risks include the correlation among fixed income indices, basis spread modelling, calibration risk of model parameters and the treatment of near-zero or negative interest rates. Other sources of risk arise from the estimation of market data, such as volatilities or interest rate curves, whether used for estimation or cash flow discounting purposes.
In equity markets, model risks include forward skew modelling, the impact of stochastic interest rates, correlation and multi-curve modelling. Also, other sources of risk arise from the hedging management of digital, callable and barrier option payments. In addition, sources of risk arising from the estimation of market data such as dividends, and correlation for quanto and composite options must also be considered.
For specific financial instruments relating to home mortgage loans secured by financial institutions in the UK (which are regulated and partially financed by the Government) and property asset derivatives, the main input is the Halifax House Price Index (HPI). In these cases, risk assumptions include estimates of the future growth and the volatility of the HPI, mortality and the implied credit spreads.
Inflation markets are exposed to model risk resulting from the uncertainty of modelling the correlation structure among various CPI (Consumer Price Index) rates. Another source of risk may arise from the bid-offer spread of inflation-linked swaps.
Foreign exchange markets are exposed to model risk resulting from forward skew modelling, the impact of stochastic interest rates and correlation modelling for multi-asset instruments. Risk may also arise from market data, due to the existence of specific illiquid foreign exchange pairs.
The most important source of model risk for credit derivatives relates to the estimation of the correlation between the probabilities of default of different underlying issuers. For illiquid underlying issuers, the CDS spread may not be well defined.
Set forth below are the financial instruments at fair value whose measurement was based on internal models (Levels 2 and 3) at December 31, 2011, 20102013, 2012 and 2009 and the potential effect on their measurement at December 31, 2011 of a shift towards other reasonably probable scenarios in the main assumptions that are not based on observable market data:
Valuation techniques Main assumptions ASSETS: Financial assets held for trading Loans and advances to credit institutions Present Value Method Observable market data Loans and advances to customers (a) Present Value Method Observable market data Debt and equity instruments Present Value Method Observable market data, HPI Trading derivatives Swaps Present Value Method, Gaussian Copula (b) Observable market data, basis, liquidity Exchange rate options Black-Scholes Model Observable market data, liquidity Interest rate options Black’s Model, Heath-Jarrow-Morton Model Observable market data, liquidity, correlation Interest rate futures Present Value Method Observable market data Index and securities options Black-Scholes Model Observable market data, dividends, correlation, liquidity, HPI Other Present Value Method, Monte Carlo simulation and other Observable market data and other Hedging derivatives Swaps Present Value Method Observable market data, basis Exchange rate options Black-Scholes Model Observable market data Interest rate options Black’s Model Observable market data Other N/A N/A Other financial assets at fair value through profit or loss Loans and advances to credit institutions Present Value Method Observable market data Loans and advances to customers (c) Present Value Method Observable market data, HPI Debt and equity instruments Present Value Method Observable market data Available-for-sale financial assets Debt and equity instruments Present Value Method Observable market data LIABILITIES: Financial liabilities held for trading Deposits from central banks Present Value Method Observable market data Deposits from credit institutions Present Value Method Observable market data Customer deposits Present Value Method Observable market data Debt and equity instruments Present Value Method Observable market data, liquidity Trading derivatives Swaps Present Value Method, Gaussian Copula (b) Observable market data, basis, liquidity, HPI Exchange rate options Black-Scholes Model Observable market data, liquidity Interest rate options Black’s Model, Heath-Jarrow-Morton Model Observable market data, liquidity, correlation Index and securities options Black-Scholes Model Observable market data, dividends, correlation, liquidity, HPI Interest rate and equity futures Present Value Method Observable market data Other Present Value Method, Monte Carlo simulation and other Observable market data and other Short positions Hedging derivatives Swaps Present Value Method Observable market data, basis Exchange rate options Black-Scholes Model Observable market data Interest rate options Black’s Model Observable market data Other N/A N/A Other financial liabilities at fair value through profit or loss Present Value Method Observable market data Liabilities under insurance contracts See Note 15F-30 Millions of euros Fair values calculated using
internal models at 12/31/13 Level 2 Level 3 124,079 1,507 68,535 282 5,502 — 5,079 — 1,585 50 56,369 232 40,380 56 849 16 7,375 — 16 — 2,953 56 4,796 104 8,080 — 6,920 — 400 — 24 — 736 — 27,184 510 13,444 — 13,135 61 605 449 20,280 715 20,280 715 128,762 105 79,970 60 3,866 — 7,468 — 8,500 — 1 — 57,260 60 41,156 2 660 — 8,457 — 4,252 — 88 — 2,647 58 2,875 — 5,096 — 4,961 — 1 — 13 — 121 — 42,266 45 1,430 —
| Millions of euros | Millions of euros | Valuation techniques | ||||||||||||||||||||||||||||||||||||||||
| Fair values calculated | Effect of reasonable assumptions on fair values at 12/31/11 | Fair values calculated using internal models | ||||||||||||||||||||||||||||||||||||||||
| using internal models at | More | Less | 12/31/12 | 12/31/11 | ||||||||||||||||||||||||||||||||||||||
| 12/31/11 | 12/31/10 | 12/31/09 | Valuation techniques | Main assumptions | favorable | favorable | Level 2 | Level 3 | Level 2 | Level 3 | ||||||||||||||||||||||||||||||||
ASSETS: | 187,431 | 1,288 | 169,542 | 1,037 | ||||||||||||||||||||||||||||||||||||||
Financial assets held for trading | 127,110 | 91,753 | 73,998 | 364 | (350 | ) | 129,508 | 395 | 126,663 | 447 | ||||||||||||||||||||||||||||||||
Loans and advances to credit institutions | 4,636 | 16,216 | 5,953 | Present Value Method | Observable market data | — | — | 9,843 | — | 4,636 | — | Present Value Method | ||||||||||||||||||||||||||||||
Loans and advances to customers | 8,056 | 755 | 10,076 | Present Value Method | Observable market data | — | — | 9,162 | — | 8,056 | — | Present Value Method | ||||||||||||||||||||||||||||||
Debt and equity instruments | 19,674 | 10,983 | 4,898 | Present Value Method | Observable market data, HPI | — | — | 1,320 | — | 19,674 | — | Present Value Method | ||||||||||||||||||||||||||||||
Trading derivatives | 94,744 | 63,799 | 53,070 | 364 | (309 | ) | 109,183 | 395 | 94,298 | 447 | ||||||||||||||||||||||||||||||||
Swaps | 74,665 | 46,562 | 26,390 | Present Value Method, Gaussian Copula (c) | Observable market data, basis, liquidity | 19 | (e) | (19 | )(e) | 90,759 | 109 | 74,520 | 145 | Present Value Method, Gaussian Copula (b) | ||||||||||||||||||||||||||||
Exchange rate options | 1,059 | 727 | 818 | Black-Scholes Model | Observable market data, liquidity | — | (e) | — | (e) | 708 | 46 | 964 | 95 | Black-Scholes Model | ||||||||||||||||||||||||||||
Interest rate options | 7,936 | 6,632 | 17,185 | Black-Scholes Model Heath-Jarrow-Morton Model | Observable market data, liquidity, correlation | 140 | (e) | (140 | )(e) | 9,141 | — | 7,936 | — | Black’s Model,Heath-Jarrow-Morton Model | ||||||||||||||||||||||||||||
Interest rate futures | 91 | 53 | 2,109 | Present Value Method | Observable market data | — | — | 78 | — | 91 | — | Present Value Method | ||||||||||||||||||||||||||||||
Index and securities options | 3,728 | 5,248 | 3,849 | Black-Scholes Model | Observable market data, dividends, correlation, liquidity, HPI | 55 | (e) | (64 | ) (e) | 3,188 | — | 3,728 | — | Black-Scholes Model | ||||||||||||||||||||||||||||
Other | 7,265 | 4,577 | 2,720 | Present Value Method, Monte Carlo simulation and other | Observable market data and other | 150 | (e) | (128 | ) (e) | 5,309 | 240 | 7,059 | 207 | Present Value Method, Monte Carlo simulation and other | ||||||||||||||||||||||||||||
Hedging derivatives | 8,401 | 7,001 | 6,608 | — | — | 7,808 | — | 8,400 | 1 | |||||||||||||||||||||||||||||||||
Swaps | 8,173 | 6,886 | 6,465 | Present Value Method | Observable market data, basis | — | — | 7,609 | — | 8,172 | 1 | Present Value Method | ||||||||||||||||||||||||||||||
Exchange rate options | 161 | 67 | 47 | Black-Scholes Model | Observable market data | — | — | 43 | — | 161 | — | Black-Scholes Model | ||||||||||||||||||||||||||||||
Interest rate options | 45 | 31 | 56 | Black-Scholes Model | Observable market data | — | — | 36 | — | 45 | — | Black’s Model | ||||||||||||||||||||||||||||||
Other | 22 | 17 | 40 | N/A | N/A | — | — | 120 | — | 22 | — | N/A | ||||||||||||||||||||||||||||||
Other financial assets at fair value through profit or loss | 17,239 | 30,034 | 28,876 | 61 | (61 | ) | 24,500 | 469 | 16,882 | 357 | ||||||||||||||||||||||||||||||||
Loans and advances to credit institutions | 4,701 | 18,831 | 16,243 | Present Value Method | Observable market data | — | — | 10,272 | — | 4,701 | — | Present Value Method | ||||||||||||||||||||||||||||||
Loans and advances to customers | 11,748 | 7,777 | 8,329 | Present Value Method | Observable market data, HPI | 2 | (2 | ) | 13,863 | 74 | 11,694 | 54 | Present Value Method | |||||||||||||||||||||||||||||
Debt and equity instruments | 790 | 3,426 | 4,304 | Present Value Method | Observable market data | 59 | (59 | ) | 365 | 395 | 487 | 303 | Present Value Method | |||||||||||||||||||||||||||||
Available-for-sale financial assets | 18,288 | 16,898 | 11,152 | 7 | (7 | ) | 25,615 | 424 | 17,597 | 233 | ||||||||||||||||||||||||||||||||
Debt and equity instruments | 18,288 | 16,898 | 11,152 | Present Value Method | Observable market data | 7 | (7 | ) | 25,615 | 424 | 17,597 | 233 | Present Value Method | |||||||||||||||||||||||||||||
LIABILITIES: | 180,243 | 205 | 181,864 | 279 | ||||||||||||||||||||||||||||||||||||||
Financial liabilities held for trading | 130,864 | 118,745 | 103,503 | — | — | 127,158 | 99 | 130,755 | 110 | |||||||||||||||||||||||||||||||||
Deposits from central banks | 7,740 | 12,605 | 2,985 | Present Value Method | Observable market data | — | — | 1,128 | — | 7,740 | — | Present Value Method | ||||||||||||||||||||||||||||||
Deposits from credit institutions | 9,287 | 28,370 | 43,132 | Present Value Method | Observable market data | — | — | 8,292 | — | 9,287 | — | Present Value Method | ||||||||||||||||||||||||||||||
Customer deposits | 16,574 | 7,849 | 4,658 | Present Value Method | Observable market data | — | — | 8,890 | 7 | 16,574 | — | Present Value Method | ||||||||||||||||||||||||||||||
Debt and equity instruments | 2 | 365 | 586 | Present Value Method | Observable market data, liquidity | (a) | (a) | 1 | — | 2 | — | Present Value Method | ||||||||||||||||||||||||||||||
Trading derivatives | 97,261 | 69,556 | 52,141 | — | — | 108,847 | 92 | 97,152 | 110 | |||||||||||||||||||||||||||||||||
Swaps | 73,616 | 48,533 | 35,916 | Present Value Method, Gaussian Copula (c) | Observable market data, basis, liquidity, HPI | (e) | (e) | 88,450 | 8 | 73,614 | 2 | Present Value Method, Gaussian Copula (b) | ||||||||||||||||||||||||||||||
Exchange rate options | 957 | 915 | 898 | Black-Scholes Model | Observable market data, liquidity | (e) | (e) | 766 | 6 | 946 | 11 | Black-Scholes Model | ||||||||||||||||||||||||||||||
Interest rate options | 9,722 | 7,356 | 3,974 | Black-Scholes Model Heath-Jarrow-Morton Model | Observable market data, liquidity, correlation | (e) | (e) | 10,772 | — | 9,722 | — | Black’s Model, Heath-Jarrow-Morton Model | ||||||||||||||||||||||||||||||
Index and securities options | 7,036 | 6,189 | 4,518 | Black-Scholes Model | Observable market data, dividends, correlation, liquidity, HPI | (e) | (e) | 121 | — | 7,036 | — | Black-Scholes Model | ||||||||||||||||||||||||||||||
Interest rate and equity futures | 273 | 181 | 2,596 | Present Value Method | Observable market data | — | — | 4,816 | — | 273 | — | Present Value Method | ||||||||||||||||||||||||||||||
Other | 5,657 | 6,382 | 4,239 | Present Value Method, Monte Carlo simulation and other | Observable market data and other | (e) | (e) | 3,922 | 78 | 5,560 | 97 | Present Value Method, Monte Carlo simulation and other | ||||||||||||||||||||||||||||||
Hedging derivatives | 5,852 | 6,125 | 4,873 | — | — | 6,348 | — | 5,852 | — | |||||||||||||||||||||||||||||||||
Swaps | 5,639 | 5,723 | 4,558 | Present Value Method | Observable market data, basis | — | — | 5,860 | — | 5,639 | — | Present Value Method | ||||||||||||||||||||||||||||||
Exchange rate options | 169 | 363 | 175 | Black-Scholes Model | Observable market data | — | — | 76 | — | 169 | — | Black-Scholes Model | ||||||||||||||||||||||||||||||
Interest rate options | 21 | 16 | 67 | Black-Scholes Model | Observable market data | — | — | 17 | — | 21 | — | Black’s Model | ||||||||||||||||||||||||||||||
Other | 23 | 23 | 72 | N/A | N/A | — | — | 395 | — | 23 | — | N/A | ||||||||||||||||||||||||||||||
Other financial liabilities at fair value through profit or loss | 44,909 | 51,020 | 42,371 | Present Value Method | Observable market data | — | — | 45,312 | 106 | 44,740 | 169 | Present Value Method | ||||||||||||||||||||||||||||||
Liabilities under insurance contracts | 517 | 6,286 | 11,910 | See Note 15 | — | — | 1,425 | — | 517 | — | See Note 15 | |||||||||||||||||||||||||||||||
|
|
|
|
| ||||||||||||||||||||||||||||||||||||||
| 353,180 | 327,862 | 283,290 | 432 | (418 | ) | |||||||||||||||||||||||||||||||||||||
|
|
|
|
| ||||||||||||||||||||||||||||||||||||||
| (a) |
| Includes mainly short-term loans and reverse repurchase agreements with corporate customers (mainly brokerage and investment companies). |
| Includes credit risk derivatives with a positive net fair value of EUR 56 million at December 31, 2013 (December 31, 2012: a positive net fair value of EUR 18 million; December 31, 2011: a negative net fair value of EUR 60 |
| Includes home mortgage loans to financial institutions in the UK (which are regulated and partly financed by the Government). The fair value of these loans was obtained using observable market variables, including current market transactions with similar amounts and collateral facilitated by the UK Housing Association. Since the Government is involved in these financial institutions, the credit risk spreads have remained stable and are |
F-31
The use of observable market data assumes that the markets in which the Group operates are functioning efficiently and, therefore, that these data are representative. The main assumptions used in the measurement of the financial instruments included in the foregoing table that were valued by means of internal models employing unobservable market data are as follows:
The main transactions measured using unobservable market data that constitute significant inputs of the internal models (Level 3) are:
The non-agency mortgage-backed securities (MBSs) of Sovereign were also included until the third quarter of 2011. These securities were sold in the fourth quarter of 2011.
F-32
The detail of the financial assets and liabilities measured using these models, included in the foregoing table, is as follows:
| Fair values calculated using internal models | ||||||||||||
| Millions of euros | ||||||||||||
| 2011 | 2010 | 2009 | ||||||||||
ASSETS: | ||||||||||||
Level 2 | 170,001 | 143,494 | 118,002 | |||||||||
Level 3 | 1,037 | 2,192 | 2,632 | |||||||||
|
|
|
|
|
| |||||||
| 171,038 | 145,686 | 120,634 | ||||||||||
|
|
|
|
|
| |||||||
LIABILITIES: | ||||||||||||
Level 2 | 181,863 | 181,879 | 162,179 | |||||||||
Level 3 | 279 | 297 | 477 | |||||||||
|
|
|
|
|
| |||||||
| 182,142 | 182,176 | 162,656 | ||||||||||
|
|
|
|
|
| |||||||
| 353,180 | 327,862 | 283,290 | ||||||||||
|
|
|
|
|
| |||||||
The measurements obtained using the internal models might have been different had other methods or assumptions been used with respect to interest rate risk, to credit risk, market risk and foreign currency risk spreads, or to their related correlations and volatilities. Nevertheless, the Group’sBank’s directors consider that the fair value of the financial assets and liabilities recognized in the consolidated balance sheet and the gains and losses arising from these financial instruments are reasonable.
As detailed in the foregoing tables, at December 31, 2011 the potential effect on the measurement of the financial instruments of a change in the main assumptions (liquidity, correlations, dividends and HPI) to less favorable reasonably probable assumptions, taking the lowest value within the range that is considered probable, would be to reduce gains or increase losses by EUR 418 million (December 31, 2010: EUR 476 million; December 31, 2009: EUR 449 million). The effect of using other more favorable reasonably probable assumptions, taking the highest value within the range that is considered probable, would be to increase gains or reduce losses by EUR 432 million (December 31, 2010: EUR 498 million; December 31, 2009: EUR 574 million).
The net gainloss recognized in the consolidated income statement for 20112013 arising from the aforementioned valuation models amounted to EUR 298 million (2012: net loss of EUR 229 million; 2011: net gain of EUR 1,006 million,million), of which a gainloss of EUR 592 million related to models whose significant inputs are unobservable market data.data (2012: a gain of EUR 20 million; 2011: a gain of EUR 59 million).
iv. RecognitionLevel 3 financial instruments
Set forth below are the Group’s main financial instruments measured using unobservable market data that constitute significant inputs of the internal models (Level 3):
The table below shows the effect, at December 31, 2013, on the fair value of the main financial instruments classified as Level 3 of a reasonable change in the assumptions used in the valuation. This effect was determined by applying the probable valuation ranges of the main unobservable inputs detailed in the following table:
Portfolio/Instrument (Level 3) | Valuation technique | Main unobservable inputs | Range | Weighted average | Impacts (in millions of euros) | |||||||||||||
| Unfavorable scenario | Favorable scenario | |||||||||||||||||
Financial assets held for trading | ||||||||||||||||||
Debt and equity instruments | Partial differential equations | Long-term volatility | 33.7% - 42.9% | 38.30 | % | (14 | ) | 14 | ||||||||||
Trading derivatives | Present Value Method | Curves on ABR indices (*) | (a) | (a | ) | (7 | ) | 7 | ||||||||||
Present Value Method, Modified Black-Scholes Model | HPI forward growth rate | 0%-5% | 2.3 | % | (19 | ) | 19 | |||||||||||
Present Value Method, Modified Black-Scholes Model | HPI spot rate | n/a | 572 | (**) | (22 | ) | 23 | |||||||||||
Standard Gaussian Copula Model | Probability of default | 0.1%-1.2% | 0.70 | % | (4 | ) | 4 | |||||||||||
Other financial assets at fair value through profit or loss | ||||||||||||||||||
Loans and advances to customers | Weighted average by probability (according to forecast mortality rates) of European HPI options, using the Black-Scholes model | HPI forward growth rate | 0%-5% | 3 | % | (1 | ) | 1 | ||||||||||
Debt and equity instruments | Weighted average by probability (according to forecast mortality rates) of HPI forwards, using the present value model | HPI forward growth rate | 0%-5% | 2.7 | % | (19 | ) | 17 | ||||||||||
Weighted average by probability (according to forecast mortality rates) of HPI forwards, using the present value model | HPI spot | n/a | 578 | (**) | (24 | ) | 24 | |||||||||||
Adjusted average of quoted prices from independent sources | Credit spread | 5%-15% | 7.5 | % | (7 | ) | 7 | |||||||||||
Available-for-sale financial assets | ||||||||||||||||||
Debt and equity instruments | Present Value Method, others | Non-performing loans and prepayment ratios, cost of capital, long-term earnings growth rate | (a) | (a | ) | (3 | ) | 3 | ||||||||||
Financial liabilities held for trading | ||||||||||||||||||
Trading derivatives | Present Value Method, Modified Black-Scholes Model | HPI forward growth rate | 0%-5% | 1.6 | % | (2 | ) | 2 | ||||||||||
Present Value Method, Modified Black-Scholes Model | HPI spot rate | n/a | 565 | (**) | (12 | ) | 12 | |||||||||||
Present Value Method, Modified Black-Scholes Model | Curves on ABR indices (*) | (a) | (a | ) | — | — | ||||||||||||
Other liabilities at fair value through profit or loss | — | — | — | — | (b | ) | (b | ) | ||||||||||
| (*) | ABR: Active Bank Rate. Average deposit interest rates (over 30, 90, 180 and 360 days) published by the Chilean Association of Banks and Financial Institutions (ABIF) in nominal currency (Chilean peso) and in real terms, adjusted for inflation (Unidad de Fomento - UF). |
| (**) | There is a national HPI index in the UK and regional indices. The HPI spot value is the weighted average of the indices that correspond to the positions of each portfolio. |
| (a) | The exercise was conducted for the unobservable inputs described in the Main unobservable inputs column under probable scenarios. The range and weighted average value used are not shown because the aforementioned exercise was conducted jointly for various inputs or variants thereof, and it was not possible to break down the results separately by type of input. |
| (b) | The Group calculates the potential effect on the valuation of each of these instruments on a joint basis, irrespective of whether their individual valuation is positive (asset) or negative (liability), and the global effect associated with these financial instruments is broken down in the Other financial assets at fair value through profit or loss line included. |
Lastly, the changes in the financial instruments classified as Level 3 in 2013 and 2012 were as follows:
| 2012 | Changes | 2013 | ||||||||||||||||||||||||||||||||||||||
Millions of euros | Fair value calculated using internal models (Level 3) | Purchases | Sales | Issues | Settlements | Changes in fair value recognized in profit or loss (unrealized) | Changes in fair value recognized in profit or loss (realized) | Changes in fair value recognized in equity | Other | Fair value calculated using internal models (Level 3) | ||||||||||||||||||||||||||||||
Financial assets held for trading | 395 | 131 | (164 | ) | — | (44 | ) | (4 | ) | 2 | — | (34 | ) | 282 | ||||||||||||||||||||||||||
Debt and equity instruments | — | 46 | — | — | 8 | — | (4 | ) | 50 | |||||||||||||||||||||||||||||||
Trading derivatives | 395 | 85 | (164 | ) | — | (44 | ) | (12 | ) | 2 | — | (30 | ) | 232 | ||||||||||||||||||||||||||
Swaps | 109 | — | (62 | ) | — | — | 19 | — | — | (10 | ) | 56 | ||||||||||||||||||||||||||||
Exchange rate options | 46 | — | (1 | ) | — | — | (8 | ) | (3 | ) | — | (18 | ) | 16 | ||||||||||||||||||||||||||
Index and securities options | — | 85 | — | (39 | ) | — | — | 10 | 56 | |||||||||||||||||||||||||||||||
Other | 240 | — | (101 | ) | — | 5 | (23 | ) | 5 | — | (12 | ) | 104 | |||||||||||||||||||||||||||
Hedging derivatives | — | — | — | — | — | — | — | — | — | — | ||||||||||||||||||||||||||||||
Swaps | — | — | — | — | — | — | — | — | — | — | ||||||||||||||||||||||||||||||
Other financial assets at fair value through profit or loss | 469 | 111 | (32 | ) | — | (17 | ) | 18 | 9 | — | (48 | ) | 510 | |||||||||||||||||||||||||||
Loans and advances to customers | 74 | — | — | — | (11 | ) | (8 | ) | 6 | — | — | 61 | ||||||||||||||||||||||||||||
Debt and equity instruments | 395 | 111 | (32 | ) | — | (6 | ) | 26 | 3 | — | (48 | ) | 449 | |||||||||||||||||||||||||||
Available-for-sale financial assets | 424 | 277 | (48 | ) | — | — | (1 | ) | (2 | ) | 73 | (8 | ) | 715 | ||||||||||||||||||||||||||
TOTAL ASSETS | 1,288 | 519 | (244 | ) | — | (61 | ) | 13 | 9 | 73 | (89 | ) | 1,507 | |||||||||||||||||||||||||||
Financial liabilities held for trading | 99 | — | (18 | ) | — | (14 | ) | (11 | ) | 13 | — | (9 | ) | 60 | ||||||||||||||||||||||||||
Customer deposits | 7 | — | — | — | — | — | — | — | (7 | ) | — | |||||||||||||||||||||||||||||
Trading derivatives | 92 | — | (18 | ) | — | (14 | ) | (11 | ) | 13 | — | (2 | ) | 60 | ||||||||||||||||||||||||||
Swaps | 8 | — | (6 | ) | — | — | (1 | ) | — | — | 1 | 2 | ||||||||||||||||||||||||||||
Exchange rate options | 6 | — | (6 | ) | — | — | — | — | — | — | — | |||||||||||||||||||||||||||||
Other | 78 | — | (6 | ) | — | (14 | ) | (10 | ) | 13 | — | (3 | ) | 58 | ||||||||||||||||||||||||||
Other liabilities at fair value through profit or loss | 106 | — | (42 | ) | — | — | (14 | ) | (12 | ) | — | 7 | 45 | |||||||||||||||||||||||||||
TOTAL LIABILITIES | 205 | — | (60 | ) | — | (14 | ) | (25 | ) | 1 | — | (2 | ) | 105 | ||||||||||||||||||||||||||
Millions of euros Financial assets held for trading Trading derivatives Swaps Exchange rate options Other Hedging derivatives Swaps Other financial assets at fair value through profit or loss Loans and advances to customers Debt and equity instruments Available-for-sale financial assets TOTAL ASSETS Financial liabilities held for trading Customer deposits Trading derivatives Swaps Exchange rate options Other Other liabilities at fair value through profit or loss TOTAL LIABILITIES 2011 Changes 2012 Fair value
calculated using
internal models
(Level 3) Purchases Sales Issues Settlements Changes in fair
value
recognized in
profit or loss
(unrealized) Changes in fair
value recognized
in profit or loss
(realized) Changes in
fair value
recognized in
equity Other Fair value
calculated using
internal models
(Level 3) 447 13 (23 ) — (2 ) (12 ) (12 ) — (16 ) 395 447 13 (23 ) — (2 ) (12 ) (12 ) — (16 ) 395 145 — (20 ) — (2 ) (15 ) 1 — — 109 95 — (3 ) — — (3 ) (22 ) — (21 ) 46 207 13 — — — 6 9 — 5 240 1 — — — — — — — (1 ) — 1 — — — — — — — (1 ) — 357 104 (28 ) — — 21 (1 ) — 16 469 54 — — — — 4 — — 16 74 303 104 (28 ) — — 17 (1 ) — — 395 233 300 (131 ) — — 2 (5 ) (16 ) 41 424 1,038 417 (182 ) — (2 ) 11 (18 ) (16 ) 40 1,288 110 11 — — (5 ) — (4 ) — (13 ) 99 — — — — — — — — 7 7 110 11 — — (5 ) — (4 ) — (20 ) 92 2 4 — — (1 ) — 1 — 2 8 11 — — — — — (2 ) — (3 ) 6 97 7 — — (4 ) — (3 ) — (19 ) 78 169 — — — — 9 (35 ) — (37 ) 106 279 11 — — (5 ) 9 (39 ) — (50 ) 205
| iv. | Recognition of fair value changes |
As a general rule, changes in the carrying amount of financial assets and liabilities are recognized in the consolidated income statement. A distinction is made between the changes resulting from the accrual of interest and similar items, which are recognized under Interest and similar income or Interest expense and similar charges, as appropriate, and those arising for other reasons, which are recognized at their net amount under Gains/losses on financial assets and liabilities.liabilities (net).
Adjustments due to changes in fair value arising from:
F-33
v. Hedging transactions
| v. | Hedging transactions |
The consolidated entities use financial derivatives for the following purposes: i) to facilitate these instruments to customers who request them in the management of their market and credit risks; ii) to use these derivatives in the management of the risks of the Group entities’ own positions and assets and liabilities (hedging derivatives); and iii) to obtain gains from changes in the prices of these derivatives (trading derivatives).
Financial derivatives that do not qualify for hedge accounting are treated for accounting purposes as trading derivatives.
A derivative qualifies for hedge accounting if all the following conditions are met:
| 1. | The derivative hedges one of the following three types of exposure: |
| a. | Changes in the fair value of assets and liabilities due to fluctuations, among others, in the interest rate and/or exchange rate to which the position or balance to be hedged is subject (fair value hedge); |
| b. | Changes in the estimated cash flows arising from financial assets and liabilities, commitments and highly probable forecast transactions (cash flow hedge); |
| c. | The net investment in a foreign operation (hedge of a net investment in a foreign operation). |
| 2. | It is effective in offsetting exposure inherent in the hedged item or position throughout the expected term of the hedge, which means that: |
| a. | At the date of arrangement the hedge is expected, under normal conditions, to be highly effective (prospective effectiveness). |
| b. | There is sufficient evidence that the hedge was actually effective during the whole life of the hedged item or position (retrospective effectiveness). To this end, the Group checks that the results of the hedge were within a range of 80% to 125% of the results of the hedged item. |
| 3. | There must be adequate documentation evidencing the specific designation of the financial derivative to hedge certain balances or transactions and how this hedge was expected to be achieved and measured, provided that this is consistent with the Group’s management of own risks. |
The changes in value of financial instruments qualifying for hedge accounting are recognized as follows:
| a. | In fair value hedges, the gains or losses arising on both the hedging instruments and the hedged items attributable to the type of risk being hedged are recognized directly in the consolidated income statement. |
In fair value hedges of interest rate risk on a portfolio of financial instruments, the gains or losses that arise on measuring the hedging instruments are recognized directly in the consolidated income statement, whereas the gains or losses due to changes in the fair value of the hedged amount (attributable to the hedged risk) are recognized in the consolidated income statement with a balancing entry under Changes in the fair value of hedged items in portfolio hedges of interest rate risk on the asset or liability side of the balance sheet, as appropriate.
| b. | In cash flow hedges, the effective portion of the change in value of the hedging instrument is recognized temporarily in equity under Valuation |
F-34
| c. | In hedges of a net investment in a foreign operation, the gains and losses attributable to the portion of the hedging instruments qualifying as an effective hedge are recognized temporarily in equity under Valuation |
| d. | The ineffective portion of the gains and losses on the hedging instruments of cash flow hedges and hedges of a net investment in a foreign operation are recognized directly under Gains/losses on financial assets and liabilities (net) in the consolidated income statement. |
If a derivative designated as a hedge no longer meets the requirements described above due to expiration, ineffectiveness or for any other reason, the derivative is classified for accounting purposes as a trading derivative.
When fair value hedge accounting is discontinued, the adjustments previously recognized on the hedged item are transferred to profit or loss at the effective interest rate re-calculated at the date of hedge discontinuation. The adjustments must be fully amortisedamortized at maturity.
When cash flow hedges are discontinued, any cumulative gain or loss on the hedging instrument recognized in equity under Valuation adjustments (from the period when the hedge was effective) remains in this equity item until the forecast transaction occurs, at which time it is recognized in profit or loss, unless the transaction is no longer expected to occur, in which case the cumulative gain or loss is recognized immediately in profit or loss.
vi. Derivatives embedded in hybrid financial instruments
Derivatives embedded in other financial instruments or in other host contracts are accounted for separately as derivatives if their risks and characteristics are not closely related to those of the host contracts, provided that the host contracts are not classified as Other financial assets/liabilities at fair value through profit or loss or as Financial assets/liabilities held for trading.
| e) | Derecognition of financial assets and liabilities |
The accounting treatment of transfers of financial assets depends on the extent to which the risks and rewards associated with the transferred assets are transferred to third parties:
| 1. | If the Group transfers substantially all the risks and rewards to third parties -unconditional sale of financial assets, sale of financial assets under an agreement to repurchase them at their fair value at the date of repurchase, sale of financial assets with a purchased call option or written put option that is deeply out of the money, securitization of assets in which the transferor does not retain a subordinated debt or grant any credit enhancement to the new holders, and other similar cases-, the transferred financial asset is derecognized and any rights or obligations retained or created in the transfer are recognized simultaneously. |
| 2. | If the Group retains substantially all the risks and rewards associated with the transferred financial asset -sale of financial assets under an agreement to repurchase them at a fixed price or at the sale price plus interest, a securities lending agreement in which the borrower undertakes to return the same or similar assets, and other similar cases-, the transferred financial asset is not derecognized and continues to be measured by the same criteria as those used before the transfer. However, the following items are recognized: |
| a. | An associated financial liability, which is recognized for an amount equal to the consideration received and is subsequently measured at |
| b. | The income from the transferred financial asset not derecognized and any expense incurred on the new financial liability, without offsetting. |
F-35
| 3. | If the Group neither transfers nor retains substantially all the risks and rewards associated with the transferred financial asset -sale of financial assets with a purchased call option or written put option that is not deeply in or out of the money, securitization of assets in which the transferor retains a subordinated debt or other type of credit enhancement for a portion of the transferred asset, and other similar cases- the following distinction is made: |
| a. | If the transferor does not retain control of the transferred financial asset, the asset is derecognized and any rights or obligations retained or created in the transfer are recognized. |
| b. | If the transferor retains control of the transferred financial asset, it continues to |
Accordingly, financial assets are only derecognized when the rights on the cash flows they generate have been extinguished or when substantially all the inherent risks and rewards have been transferred to third parties. Similarly, financial liabilities are only derecognized when the obligations they generate have been extinguished or when they are acquired, with the intention either to cancel them or to resell them.
| f) | Offsetting of financial instruments |
Financial asset and liability balances are offset, i.e. reported in the consolidated balance sheet at their net amount, only if the subsidiariesGroup entities currently have a legally enforceable right to set off the recognized amounts and intend either to settle on a net basis, or to realiserealize the asset and settle the liability simultaneously.
Following is the detail of financial assets and liabilities offset that were in the balance sheet at December 31, 2013:
| Millions of euros | ||||||||||||
Assets | Gross amount of financial assets | Gross amount of financial liabilities offset in the balance sheet | Net amount of financial assets presented in the balance sheet | |||||||||
Derivatives | 86,813 | (19,613 | ) | 67,200 | ||||||||
Reverse repurchase agreements | 59,990 | (12,463 | ) | 47,527 | ||||||||
|
|
|
|
|
| |||||||
Total | 146,803 | (32,076 | ) | 114,727 | ||||||||
|
|
|
|
|
| |||||||
| Millions of euros | ||||||||||||
Liabilities | Gross amount of financial liabilities | Gross amount of financial assets offset in the balance sheet | Net amount of financial liabilities presented in the balance sheet | |||||||||
Derivatives | 83,783 | (19,613 | ) | 64,170 | ||||||||
Reverse repurchase agreements | 103,621 | (12,463 | ) | 91,158 | ||||||||
|
|
|
|
|
| |||||||
Total | 187,404 | (32,076 | ) | 155,328 | ||||||||
|
|
|
|
|
| |||||||
Also, the Group has offset other items for EUR 2,267 million.
Most of the derivatives and repos not offset in the balance sheet are subject to netting and collateral arrangements.
| g) | Impairment of financial assets |
i. Definition
| i. | Definition |
A financial asset is considered to be impaired -and therefore its carrying amount is adjusted to reflect the effect of impairment- when there is objective evidence that events have occurred which:
As a general rule, the carrying amount of impaired financial instruments is adjusted with a charge to the consolidated income statement for the period in which the impairment becomes evident, and the reversal, if any, of previously recognized impairment losses is recognized in the consolidated income statement for the period in which the impairment is reversed or reduced.
Balances are deemed to be impaired, and the interest accrual is suspended, when there are reasonable doubts as to their full recovery and/or the collection of the related interest for the amounts and on the dates initially agreed upon, after taking into account the guarantees received by the consolidated entities to secure (fully or partially) collection of the related balances. Collections relating to impaired loans and advances are used to recogniserecognize the accrued interest and the remainder, if any, to reduce the principal amount outstanding.
Transactions classified as impaired due to arrears are reclassified as performing if, as a result of the collection of a portion or the sum of the unpaid instalments, the reasons for classifying such transactions as impaired cease to exist, unless other subjective reasons remain for classifying them as impaired, i.e. no longer have any amount more than three months past due. The entire loan balancerefinancing of impaired loans does not result in their reclassification to performing unless: there is keptcertainty that the customer can make payment in accordance with the new schedule; the customer provides effective guarantees or collateral; the customer pays the current interest receivable; and the customer complies with the established cure period (see Note 54).
The following constitute effective guarantees or collateral: collateral in the form of cash deposits; quoted equity instruments and debt securities issued by creditworthy issuers; mortgages on completed housing, offices and multi-purpose premises and on rural property, net of any prior charges; and personal guarantees (bank guarantees, inclusion of new obligors, etc.) which entail the direct and joint liability of the new guarantors to the customer, these being persons or entities whose solvency is sufficiently demonstrated so as to ensure the full repayment of the transaction on the agreed terms.
The balances relating to impaired transactions continue to be recognized on the balance sheet, for their full amounts, until the Group considers that the recovery of any recognized amountthose amounts is consideredremote.
The Group considers recovery to be unlikely,remote when there has been a substantial and irreversible deterioration of the borrower’s solvency, when commencement of the liquidation phase of insolvency proceedings has been ordered or when any portion of it has beenmore than four years have elapsed since the borrower’s transaction was classified as non-performing for four yearsimpaired due to arrears (the maximum period established inby the Bank of Spain regulations)Spain).
When the loanrecovery of a financial asset is considered unlikely, it is written off, together with the loan balance and its specificrelated allowance, without prejudice to any actions that the consolidated entities may initiate to seek collection until their contractual rights are removed fromextinguished due to expiry of the balance sheet and then recorded in off-balance sheet accounts, with no resulting impact on net income attributable to the Group. The recovery of a loan is considered to be unlikely (remote) when there is an unsecured loan in which there is a significant deterioration in the borrower´s overall financial condition, resources, value ofstatute-of-limitations period, forgiveness or any guarantees and payment record which would lead a borrower to bankruptcy.
| ii. | Debt instruments carried at amortized cost |
F-36
ii. Debt instruments carried at amortised cost
CreditFor the purpose of determining impairment losses, on impaired assets and contingent liabilities are assessed,the Group monitors its debtors as follows:described below:
As regards impairment losses resulting from materialization of the insolvency risk of the obligors (credit risk), a debt instrument is impaired due to insolvency:
The Group has certain policies, methods and procedures for covering its credit risk arising both from insolvency allocable to counterparties and from country risk. These policies, methods and procedures are applied in the granting, examination and documentation of debt instruments and contingent liabilities and commitments, and in the identification of their impairment and the calculation of the amounts required to cover the related credit risk.
With respect to the coverage of loss arising from credit risk, the Group must meet the Bank of Spain requirements, which establish that, until the Spanish regulatory authority has verified and approved the internal models for the calculation of the allowance for losses arising from credit risk (to date it has only approved the internal models to be used to calculate regulatory capital), entities must calculate their credit risk coverage as set forth below:
| a. | Specific allowance (individuals): |
The allowance for debt instruments not measured at fair value through profit or loss that are classified as impaired is generally recognized in accordance with the criteria set forth below:
| i. | Assets classified as impaired due to counterparty arrears: |
Debt instruments, whoever the obligor and whatever the guarantee or collateral, with amounts more than three months past due are assessed individually, taking into account: (i)account the age of the past-due amounts, the guarantees or collateral provided and the financial situation of the counterparty and the guarantors.
| ii. | Assets classified as impaired for reasons other than counterparty arrears: |
Debt instruments which are not classifiable as impaired due to arrears but for which there are reasonable doubts as to their repayment under the contractual terms are assessed individually, and their allowance is the difference between the amount recognized in assets and the present value of futurethe cash flows discounted at an appropriate discount rate; (ii) the debtor’s financial situation;expected to be received.
| b. | General allowance for inherent losses (collective): |
Based on its experience and (iii) any guarantees in place. Clients individually assessed based on the borrower’s overallinformation available to it on the Spanish banking industry, the Bank of Spain has established various categories of debt instruments and contingent liabilities, classified as standard risk, which are recognized at Spanish entities or relate to transactions performed on behalf of residents in Spain which are recognized in the accounting records of foreign subsidiaries, and has applied a range of required allowances to each category.
| c. | Country risk allowance: |
Country risk is considered to be the risk associated with counterparties resident in a given country due to circumstances other than normal commercial risk (sovereign risk, transfer risk and risks arising from international financial condition, resources, guaranteesactivity). Based on the countries’ economic performance, political situation, regulatory and institutional framework, and payment capacity and record, the Group classifies all the transactions performed with third parties into six different groups, from group 1 (transactions with ultimate obligors resident in European Union countries, Norway, Switzerland, Iceland, the United States, Canada, Japan, Australia and New Zealand) to group 6 (transactions the recovery of which is considered remote due to circumstances attributable to the country), assigning to each group the credit loss allowance percentages resulting from the aforementioned analyses. However, due to the size of the Group and to the proactive management of its country risk exposure, the allowances recognized in this connection are globally managed clients, corporate, sovereignnot material with respect to the credit loss allowances recognized.
However, the coverage of the Group’s losses arising from credit risk must also meet the requirements of IFRSs and, therefore, the Group checks the allowances calculated as described above with those obtained from internal models for the calculation of the coverage of losses arising from credit risk in order to confirm that there are no material differences.
The Group’s internal models determine the impairment losses on debt instruments not measured at fair value through profit or loss and on contingent liabilities taking into account the historical experience of impairment and other loans with significant balances.
The amount of an impairment loss incurred on a debt instrument carried at amortisedamortized cost is equal to the difference between its carrying amount and the present value of its estimated future cash flows, and is presented as a reduction of the balance of the asset adjusted.
In estimating the future cash flows of debt instruments the following factors are taken into account:
These cash flows are subsequently discounted using the instrument’s effective interest rate (if its contractual rate is fixed) or the effective contractual rate at the discount date (if it is variable).
Specifically as regards impairment losses resulting from materialisation of the insolvency risk of the obligors (credit risk), a debt instrumentIncurred loss is impaired due to insolvency:
* * * * *
The Group has certain policies, methods and procedures for covering its credit risk arising both from insolvency allocable to counterparties and from country risk.
These policies, methods and procedures are applied in the granting, examination and documentation of debt instruments, and contingent liabilities and commitments, the identification of their impairment and the calculation of the amounts required to cover the related credit risk.
F-37
With respect to the coverage of loss arising from credit risk, the Group makes the following distinction:
The allowance for debt instruments not measured at fair value through profit or loss that are classified as doubtful is generally recognized in accordance with the criteria set forth below:
Debt instruments, whoever the obligor and whatever the guarantee or collateral, with amounts more than three months past due are assessed individually, taking into account the age of the past-due amounts, the guarantees or collateral provided and the financial situation of the counterparty and the guarantors.
Debt instruments which are not classifiable as doubtful due to arrears but for which there are reasonable doubts as to their repayment under the contractual terms are assessed individually, and their allowance is the difference between the amount recognized in assets and the present value of the cash flows expected to be received.
The Group covers its losses inherent in debt instruments not measured at fair value through profit or loss and in contingent liabilities taking into account the historical experience of impairment and other circumstances known at the time of assessment. For these purposes, inherent losses are losses incurred at the reporting date, calculated using statistical methods, that have not yet been allocated to specific transactions.
The Group uses the concept of incurred loss to quantify the cost of the credit risk of a transaction that will manifest within a one year lead time from the balance sheet date due to an event that had already occurred at the assessment date and include it inconsidering the calculationcharacteristics of the risk-adjusted returncounterparty and the guarantees and collateral associated with the transaction.
The loss incurred is calculated by multiplying three factors: exposure at default, probability of its transactions. Thedefault and loss given default. These parameters necessary for its calculation are also used to calculate economic capital and to calculate BIS II regulatory capital under internal models (see Note 1.f).
The incurred loss is the expected cost, which will be disclosed in the one-year period after the reporting date, of the credit risk of a transaction, considering the characteristics of the counterparty and the guarantees and collateral associated with the transaction.
The loss is calculated by multiplying three factors: exposure at default, probability of default and loss given default.
For the purposes of calculating the incurred losses, PD is measured using a time horizon of one year; i.e. it quantifies the probability of the counterparty defaulting in the coming year.year due to an event that had already occurred at the assessment date. The definition of default used includes amounts past due by 90 days or more and cases in which there is no default but there are doubts as to the solvency of the counterparty (subjective doubtfulimpaired assets).
F-38
TheIn addition to all of the above, the calculation of the expectedincurred loss also takes into account the adjustment to the cycle of the aforementioned factors especially PD(PD and LGD.
The methodology for determining the general allowance for inherent losses seeks to identify the amounts of losses which, although incurred at the reporting date, have not yet been disclosed and which the Group knows, on the basis ofLGD), historical experience and other specific information will arise into reflect the one-year period followingcurrent conditions.
At December 31, 2013, the reporting date.estimated losses arising from credit risk calculated by the Group’s internal models did not differ materially from the allowances calculated on the basis of the Bank of Spain’s requirements.
In certain portfolios (sovereign risk, credit institutions or large corporations) the number of defaults observed is very small or zero. In these cases, the Group opted to use the data contained in the credit derivative spreads to estimate the expected loss discounted by the market and break it down into PD and LGD.
In the exceptional cases in which the Group does not have sufficient data to construct a sufficiently robust credit risk measurement model, the expected loss on the loan portfolios is estimated based on a top-down approximation in which the historically observed average cost of the loan portfolios is used as the best estimate of the expected loss. As the credit models are developed and bottom-up measurements are obtained, the top-down measurements used for these portfolios are gradually replaced.
* * * * *
However, as required by the Bank of Spain, until the Spanish regulatory authority has verified and approved these internal models for the calculation of the general allowance for inherent losses (to date it has only approved the internal models to be used to calculate regulatory capital), the inherent losses must be calculated as set forth below.
Based on its experience and on the information available to it on the Spanish banking industry, the Bank of Spain has established various categories of debt instruments and contingent liabilities, classified as standard risk, which are recognized at Spanish entities or relate to transactions performed on behalf of residents in Spain which are recognized in the accounting records of foreign subsidiaries, and has applied a range of required allowances to each category.
Country risk is considered to be the risk associated with counterparties resident in a given country due to circumstances other than normal commercial risk (sovereign risk, transfer risk and risks arising from international financial activity). Based on the countries’ economic performance, political situation, regulatory and institutional framework, and payment capacity and record, the Group classifies all the transactions performed with third parties into six different groups, from group 1 (transactions with ultimate obligors resident in European Union countries, Norway, Switzerland, Iceland, the United States, Canada, Japan, Australia and New Zealand) to group 6 (transactions the recovery of which is considered remote due to circumstances attributable to the country), assigning to each group the credit loss allowance percentages resulting from the aforementioned analyses.
However, due to the size of the Group and to the proactive management of its country risk exposure, the allowances recognized in this connection are not material with respect to the credit loss allowances recognized.
As at December 31, 2011, 2010 and 2009 there is no substantial difference in the calculation of allowances for loan losses between the provision calculated by the Group according to Bank of Spain regulation and in accordance with the internal models that comply with IFRS-IASB.
iii. Debt or equity instruments classified as available for sale
The amount of the impairment losses on these instruments is the positive difference between their acquisition cost (net of any principal repayment or amortization in the case of debt instruments) and their fair value, less any impairment loss previously recognized in the consolidated income statement.
F-39
When there is objective evidence at the date of measurement of these instruments that the aforementioned differences are due to permanent impairment, they are no longer recognized in equity under Valuation adjustments—adjustments - Available-for-sale financial assets and are reclassified, for the cumulative amount at that date, to the consolidated income statement.
If all or part of the impairment losses are subsequently reversed, the reversed amount is recognized, in the case of debt instruments, in the consolidated income statement for the year in which the reversal occurs (or in equity under Valuation adjustments—adjustments - Available-for-sale financial assets in the case of equity instruments).
iv. Equity instruments carried at cost
| iv. | Equity instruments carried at cost |
The amount of the impairment losses on equity instruments carried at cost is the difference between theirthe carrying amount and the present value of the expected future cash flows discounted at the market rate of return for similar securities.
Impairment losses are recognized in the consolidated income statement for the period in which they arise as a direct reduction of the cost of the instrument. These losses can only be reversed subsequently if the related assets are sold.
| h) | Repurchase agreements and reverse repurchase agreements |
Purchases (sales) of financial instruments under a non-optional resale (repurchase) agreement at a fixed price (repos) are recognized in the consolidated balance sheet as financing granted (received), based on the nature of the debtor (creditor), under Balances with central banks, Loans and advances to credit institutions or Loans and advances to customers (Deposits from central banks, Deposits from credit institutions or Customer deposits).
Differences between the purchase and sale prices are recognized as interest over the contract term.
| i) | Non-current assets held for sale and Liabilities associated with non-current assets held for sale |
Non-current assets held for sale includes the carrying amount of individual items, disposal groups or items forming part of a business unit earmarked for disposal (discontinued operations), whose sale in their present condition is highly likely to be completed within one year from the reporting date. Therefore, the carrying amount of these items -which can be of a financial nature or otherwise- will foreseeably be recovered through the proceeds from their disposal.
Specifically, property or other non-current assets received by the consolidated entities as total or partial settlement of their debtors’ payment obligations to them are deemed to be non-current assets held for sale, unless the consolidated entities have decided to make continuing use of these assets. In this connection, for the purpose of its consideration in the initial recognition of these assets, the Group obtains, at the foreclosure date, the fair value of the related asset through a request for appraisal by external appraisal agencies.
The Group has in place a corporate policy that ensures the professional competence and the independence and objectivity of the external appraisal agencies, in accordance with the regulations, which require appraisal agencies to meet neutrality and credibility requirements, so that the use of their estimates does not reduce the reliability of its valuations. This policy establishes that all the appraisal companies and agencies with which the Group works in Spain should be registered in the Official Register of the Bank of Spain.
Liabilities associated with non-current assets held for sale includes the balances payable arising from the assets held for sale or disposal groups and from discontinued operations.
Non-current assets held for sale are generally measured at the lower of fair value less costs to sell and their carrying amount at the date of classification in this category. Non-current assets held for sale are not depreciated as long as they remain in this category.
Subsequent to initial recognition, the Group measures its non-current assets at the lower of their fair value less costs to sell and their carrying amount. The Group measures foreclosed property assets located in Spain by taking into consideration the appraisal value on the date of foreclosure and the length of time each asset has been recognized in the balance sheet. In addition, in order to check at the end of each reporting period that the measurement made using the aforementioned criteria does not differ from fair value, based in part on third party appraisals.
Impairment losses on an asset or disposal group arising from a reduction in its carrying amount to its fair value (less costs to sell) are recognized under Gains/(losses) onof non-current assets held for sale not classified as discontinued operations in the consolidated income statement. The gains on a non-current asset held for sale resulting from subsequent increases in fair value (less costs to sell) increase its carrying amount and are recognized in the consolidated income statement up to an amount equal to the impairment losses previously recognized.
| j) | Reinsurance assets and Liabilities under insurance contracts |
Insurance contracts involve the transfer of a certain quantifiable risk in exchange for a periodic or one-off premium. The effects on the Group’s cash flows will arise from a deviation in the payments forecast and/or an insufficiency in the premium set.
F-40
The Group controls its insurance risk as follows:
Reinsurance assets includes the amounts that the consolidated entities are entitled to receive for reinsurance contracts with third parties and, specifically, the reinsurer’s share of the technical provisions recorded by the consolidated insurance entities.
At least once a year these assets are reviewed to ascertain whether they are impaired (i.e. there is objective evidence, as a result of an event that occurred after initial recognition of the reinsurance asset, that the Group may not receive all amounts due to it under the terms of the contract and the amount that will not be received can be reliably measured), and any impairment loss is recognized in the consolidated income statement and the assets are written down.
Liabilities under insurance contracts includes the technical provisions recorded by the consolidated entities to cover claims arising from insurance contracts in force at year-end.
Insurers’ results relating to their insurance business are recognized, according to their nature, under the related consolidated income statement items.
In accordance with standard accounting practice in the insurance industry, the consolidated insurance entities credit to the income statement the amounts of the premiums written and charge to income the cost of the claims incurred on final settlement thereof. Insurance entities are therefore required to accrue at period-end the unearned revenues credited to their income statements and the accrued costs not charged to income.
At least at each reporting date the Group assesses whether the insurance contract liabilities recognized in the consolidated balance sheet are adequate. For this purpose, it calculates the difference between the following amounts:
If the calculation results in a positive amount, this deficiency is charged to the consolidated income statement. When unrealisedunrealized gains or losses on assets of the Group’s insurance companies affect the measurement of liabilities under insurance contracts and/or the related deferred acquisition costs and/or the related intangible assets, these gains or losses are recognized directly in equity. The corresponding adjustment in the liabilities under insurance contracts (or in the deferred acquisition costs or in intangible assets) is also recognized in equity.
F-41
The most significant items that formforming part of ourthe technical provisions (see Note 15) are summarizeddetailed below:
| i) |
| ii) |
| i) | Provision for unearned premiums and unexpired risks: this relates to the portion of the premiums received at year-end that is allocable to the period from the reporting date to the end of the policy cover period. |
| ii) | Mathematical provisions: these relate to the value of the insurance companies’ obligations, net of the policyholders’ obligations. These provisions are calculated on a policy-by-policy basis using an individual capitalization system, taking as a basis for the calculation the premium accrued in the year, and in accordance with the technical bases of each type of insurance updated, where appropriate, by the local mortality tables. |
| k) | Tangible assets |
Tangible assets includes the amount of buildings, land, furniture, vehicles, computer hardware and other fixtures owned by the consolidated entities or acquired under finance leases. Tangible assets are classified by use as follows:
i. Property, plant and equipment for own use
| i. | Property, plant and equipment for own use |
Property, plant and equipment for own use -including–including tangible assets received by the consolidated entities in full or partial satisfaction of financial assets representing receivables from third parties which are intended to be held for continuing use and tangible assets acquired under finance leases-leases– are presented at acquisition cost, less the related accumulated depreciation and any estimated impairment losses (carrying amount higher than recoverable amount).
Depreciation is calculated, using the straight-line method, on the basis of the acquisition cost of the assets less their residual value. The land on which the buildings and other structures stand has an indefinite life and, therefore, is not depreciated.
The period tangible asset depreciation charge is recognized in the consolidated income statement and is calculated using the following depreciation rates (based on the average years of estimated useful life of the various assets):
F-42
| Average annual rate | ||||
Buildings for own use | 2.0 | % | ||
Furniture | 7.7 | % | ||
Fixtures | 7.0 | % | ||
Office and IT equipment | 25.0 | % | ||
Leasehold improvements | 7.0 | % | ||
The consolidated entities assess at the reporting date whether there is any indication that an asset may be impaired (i.e. its carrying amount exceeds its recoverable amount). If this is the case, the carrying amount of the asset is reduced to its recoverable amount and future depreciation charges are adjusted in proportion to the revised carrying amount and to the new remaining useful life (if the useful life has to be re-estimated).
Similarly, if there is an indication of a recovery in the value of a tangible asset, the consolidated entities recogniserecognize the reversal of the impairment loss recognized in prior periods and adjust the future depreciation charges accordingly. In no circumstances may the reversal of an impairment loss on an asset raise its carrying amount above that which it would have if no impairment losses had been recognized in prior years.
The estimated useful lives of the items of property, plant and equipment for own use are reviewed at least at the end of the reporting period with a view to detecting significant changes therein. If changes are detected, the useful lives of the assets are adjusted by correcting the depreciation charge to be recognized in the consolidated income statement in future years on the basis of the new useful lives.
Upkeep and maintenance expenses relating to property, plant and equipment for own use are recognized as an expense in the period in which they are incurred, since they do not increase the useful lives of the assets.
ii. Investment property
| ii. | Investment property |
Investment property reflects the net values of the land, buildings and other structures held either to earn rentals or for capital appreciation.
The criteria used to recogniserecognize the acquisition cost of investment property, to calculate its depreciation and its estimated useful life and to recogniserecognize any impairment losses thereon are consistent with those described in relation to property, plant and equipment for own use.
iii. Assets leased out under an operating lease
| iii. | Assets leased out under an operating lease |
Property, plant and equipment—equipment - Leased out under an operating lease reflects the amount of the tangible assets, other than land and buildings, leased out by the Group under an operating lease.
The criteria used to recogniserecognize the acquisition cost of assets leased out under operating leases, to calculate their depreciation and their respective estimated useful lives and to recogniserecognize the impairment losses thereon are consistent with those described in relation to property, plant and equipment for own use.
| l) | Accounting for leases |
i. Finance leases
| i. | Finance leases |
Finance leases are leases that transfer substantially all the risks and rewards incidental to ownership of the leased asset to the lessee.
F-43
When the consolidated entities act as the lessors of an asset, the sum of the present value of the lease payments receivable from the lessee, plus the guaranteed residual value -which is generallyincluding the exercise price of the lessee’s purchase option at the end of the lease term-term when such exercise price is sufficiently below fair value at the option date such that it is reasonably certain that the option will be exercised, is recognized as lending to third parties and is therefore included under Loans and receivables in the consolidated balance sheet.
When the consolidated entities act as the lessees, they present the cost of the leased assets in the consolidated balance sheet, based on the nature of the leased asset, and, simultaneously, recogniserecognize a liability for the same amount (which is the lower of the fair value of the leased asset and the sum of the present value of the lease payments payable to the lessor plus, if appropriate, the exercise price of the purchase option). The depreciation policy for these assets is consistent with that for property, plant and equipment for own use.
In both cases, the finance income and finance charges arising under finance lease agreements are credited and debited, respectively, to Interest and similar income and Interest expense and similar charges in the consolidated income statement so as to produce a constant rate of return over the lease term.
ii. Operating leases
| ii. | Operating leases |
In operating leases, ownership of the leased asset and substantially all the risks and rewards incidental thereto remain with the lessor.
When the consolidated entities act as the lessors, they present the acquisition cost of the leased assets under Tangible assets (see Note 16). The depreciation policy for these assets is consistent with that for similar items of property, plant and equipment for own use, and income from operating leases is recognized on a straight-line basis under Other operating income in the consolidated income statement.
When the consolidated entities act as the lessees, the lease expenses, including any incentives granted by the lessor, are charged on a straight-line basis to Other general administrative expenses in their consolidated income statements.
iii. Sale and leaseback transactions
| iii. | Sale and leaseback transactions |
In sale and leaseback transactions where the sale is at fair value and the leaseback is an operating lease, any profit or loss is recognized at the time of sale. In the case of finance leasebacks, any profit or loss is amortisedamortized over the lease term.
In accordance with IAS 17, in determining whether a sale and leaseback transaction results in an operating lease, the Group should analyse,analyses, inter alia, whether at the inception of the lease there are purchase options whose terms and conditions make it reasonably certain that they will be exercised, and to whom the gains or losses from the fluctuations in the fair value of the residual value of the related asset will accrue. In this connection, when the Group performed the transactions described in Note 16, it carried out the aforementioned analysis and concluded that there was no reasonable certainty that the related options would be exercised, since their exercise price was linked to fair value and there were no other indicators that could force the Group to exercise these options; therefore, under IAS 17, it was required to recognise the gain or loss on the sale.
| m) | Intangible assets |
Intangible assets are identifiable non-monetary assets (separable from other assets) without physical substance which arise as a result of a legal transaction or which are developed internally by the consolidated entities. Only assets whose cost can be estimated reliably and from which the consolidated entities consider it probable that future economic benefits will be generated are recognized.
Intangible assets are recognized initially at acquisition or production cost and are subsequently measured at cost less any accumulated amortization and any accumulated impairment losses.
F-44
i. Goodwill
| i. | Goodwill |
Any excess of the cost of the investments in the consolidated entities and entities accounted for using the equity method over the corresponding underlying carrying amounts acquired, adjusted at the date of first-time consolidation, is allocated as follows:
Goodwill is only recognized when it has been acquired for consideration and represents, therefore, a payment made by the acquirer in anticipation of future economic benefits from assets of the acquired entity that are not capable of being individually identified and separately recognized.
At the end of each reporting period or whenever there is any indication of impairment goodwill is reviewed for impairment (i.e. a reduction in its recoverable amount to below its carrying amount) and, if there is any impairment, the goodwill is written down with a charge to Impairment losses on other assets (net)— - Goodwill and other intangible assets in the consolidated income statement.
An impairment loss recognized for goodwill is not reversed in a subsequent period.
ii. Other intangible assets
| ii. | Other intangible assets |
Other intangible assets includesinclude the amount of identifiable intangible assets (such as purchased customer lists and computer software).
Other intangible assets can have an indefinite useful life -when, based on an analysis of all the relevant factors, it is concluded that there is no foreseeable limit to the period over which the asset is expected to generate net cash inflows for the consolidated entities- or a finite useful life, in all other cases.
Intangible assets with indefinite useful lives are not amortised,amortized, but rather at the end of each reporting period or whenever there is any indication of impairment the consolidated entities review the remaining useful lives of the assets in order to determine whether they continue to be indefinite and, if this is not the case, to take the appropriate steps.
Intangible assets with finite useful lives are amortisedamortized over those useful lives using methods similar to those used to depreciate tangible assets.
The intangible asset amortization charge is recognized under Depreciation and amortization in the consolidated income statement.
In both cases the consolidated entities recogniserecognize any impairment loss on the carrying amount of these assets with a charge to Impairment losses on other assets (net) in the consolidated income statement. The criteria used to recogniserecognize the impairment losses on these assets and, where applicable, the reversal of impairment losses recognized in prior years are similar to those used for tangible assets (see Note 2.k).
F-45
Internally developed computer software
Internally developed computer software is recognized as an intangible asset if, among other requisites (basically the Group’s ability to use or sell it), it can be identified and its ability to generate future economic benefits can be demonstrated.
Expenditure on research activities is recognized as an expense in the year in which it is incurred and cannot be subsequently capitalised.capitalized.
| n) | Other assets |
Other assets in the consolidated balance sheet includes the amount of assets not recorded in other items, the breakdown being as follows:
Inventories are measured at the lower of cost and net realisablerealizable value, which is the estimated selling price of the inventories in the ordinary course of business, less the estimated costs of completion and the estimated costs required to make the sale.
Any write-downs of inventories -such as those due to damage, obsolescence or reduction of selling price- to net realisablerealizable value and other impairment losses are recognized as expenses for the year in which the impairment or loss occurs. Subsequent reversals are recognized in the consolidated income statement for the year in which they occur.
The carrying amount of inventories is derecognized and recognized as an expense in the period in which the revenue from their sale is recognized.
| ñ) | Other liabilities |
Other liabilities includes the balance of all accrued expenses and deferred income, excluding accrued interest, and the amount of any other liabilities not included in other categories.
| o) | Provisions and contingent assets and liabilities |
When preparing the financial statements of the consolidated entities, their respectivethe Bank’s directors made a distinction between:
F-46
The Group’s consolidated financial statements include all the material provisions with respect to which it is considered that it is more likely than not that the obligation will have to be settled. In accordance with accounting standards, contingent liabilities must not be recognized in the consolidated financial statements, but must rather be disclosed in the notes.
Provisions, which are quantified on the basis of the best information available on the consequences of the event giving rise to them and are reviewed and adjusted at the end of each year, are used to cater for the specific obligations for which they were originally recognized. Provisions are fully or partially reversed when such obligations cease to exist or are reduced.
Provisions are classified according to the obligations covered as follows:follows (see Note 25):
| p) |
In addition to the disclosures made in Note 1, at the end of 20112013 certain litigationcourt proceedings and claims were in process against the consolidated entities arising from the ordinary course of their operations (see Note 25).
| q) | Own equity instruments |
Own equity instruments are those meeting both of the following conditions:
Transactions involving own equity instruments, including their issuance and cancellation, are deducted directly from equity.
Changes in the value of instruments classified as own equity instruments are not recognized in the consolidated financial statements. Consideration received or paid in exchange for such instruments is directly added to or deducted from equity.
F-47
| r) | Equity-instrument-based employee remuneration |
Own equity instruments delivered to employees in consideration for their services, if the instruments are delivered once the specific period of service has ended, are recognized as an expense for services (with the corresponding increase in equity) as the services are rendered by employees during the service period. At the grant date the services received (and the related increase in equity) are measured at the fair value of the equity instruments granted. If the equity instruments granted are vestedvest immediately, the Group recognisesrecognizes in full, at the grant date, the expense for the services received.
When the requirements stipulated in the remuneration agreement include external market conditions (such as equity instruments reaching a certain quoted price), the amount ultimately to be recognized in equity will depend on the other conditions being met by the employees (normally length of service requirements), irrespective of whether the market conditions are satisfied. If the conditions of the agreement are met but the external market conditions are not satisfied, the amounts previously recognized in equity are not reversed, even if the employees do not exercise their right to receive the equity instruments.
| s) | Recognition of income and expenses |
The most significant criteria used by the Group to recogniserecognize its income and expenses are summarisedsummarized as follows:
i. Interest income, interest expenses and similar items
| i. | Interest income, interest expenses and similar items |
Interest income, interest expenses and similar items are generally recognized on an accrual basis using the effective interest method. Dividends received from other companies are recognized as income when the consolidated entities’ right to receive them arises.
However, the recognition of accrued interest in the consolidated income statement is suspended for debt instruments individually classified as impaired and for the instruments for which impairment losses have been assessed collectively because they have payments more than three months past due. ThisAny interest that may have been recognized in the consolidated income statement before the corresponding debt instruments were classified as impaired, and that had not been collected at the date of that classification, is considered when determining the allowance for loan losses; accordingly, if subsequently collected, this interest is recognized as income, when collected, as a reversal of the related impairment losses. Interest whose recognition in the consolidated income statement has been suspended is accounted for as interest income, when collected, on a cash basis.
ii. Commissions, fees and similar items
| ii. | Commissions, fees and similar items |
Fee and commission income and expenses are recognized in the consolidated income statement using criteria that vary according to their nature. The main criteria are as follows:
iii. Non-finance income and expenses
| iii. | Non-finance income and expenses |
These are recognized for accounting purposes on an accrual basis.
iv. Deferred collections and payments
| iv. | Deferred collections and payments |
These are recognized for accounting purposes at the amount resulting from discounting the expected cash flows at market rates.
F-48
v. Loan arrangement fees
| v. | Loan arrangement fees |
Loan arrangement fees, mainly loan origination, application and information fees, are accrued and recognized in income over the term of the loan. In the case of loan origination fees, the portion relating to the associated direct costs incurred in the loan arrangement is recognized immediately in the consolidated income statement.
| t) | Financial guarantees |
Financial guarantees are defined as contracts whereby an entity undertakes to make specific payments on behalf of a third party if the latter fails to do so, irrespective of the various legal forms they may have, such as guarantees, insurance policies or credit derivatives.
The Group initially recognisesrecognizes the financial guarantees provided on the liability side of the consolidated balance sheet at fair value, which is generally the present value of the fees, commissions and interest receivable from these contracts over the term thereof, and simultaneously the Group recognisesrecognizes a credit on the asset side of the consolidated balance sheet for the amount of the fees, commissions and similar interest received at the inception of the transactions and the amounts receivable at the present value of the fees, commissions and interest outstanding.
Financial guarantees, regardless of the guarantor, instrumentation or other circumstances, are reviewed periodically so as to determine the credit risk to which they are exposed and, if appropriate, to consider whether a provision is required. The credit risk is determined by application of criteria similar to those established for quantifying impairment losses on debt instruments carried at amortisedamortized cost (described in Note 2.g above).
The provisions made for these transactions are recognized under Provisions—Provisions - Provisions for contingent liabilities and commitments in the consolidated balance sheet (see Note 25). These provisions are recognized and reversed with a charge or credit, respectively, to Provisions (net) in the consolidated income statement.
If a specific provision is required for financial guarantees, the related unearned commissions recognized under Financial liabilities at amortised cost—amortized cost - Other financial liabilities in the consolidated balance sheet are reclassified to the appropriate provision.
| u) | Assets under management and investment and pension funds managed by the Group |
Assets owned by third parties and managed by the consolidated entities are not presented on the face of the consolidated balance sheet. Management fees are included in Fee and commission income in the consolidated income statement. Note 35.c contains information on the third-party assets managed by the Group.
The investment funds and pension funds managed by the consolidated entities are not presented on the face of the Group’s consolidated balance sheet since the related assets are owned by third parties. The fees and commissions earned in the year for the services rendered by the Group entities to these funds (asset management and custody services) are recognized under Fee and commission income in the consolidated income statement.
Note 2.b.iv describes the internal criteria and procedures used to determine whether control exists over the structured entities, which include, inter alia, investment funds and pension funds.
| v) | Post-employment benefits |
Under the collective agreements currently in force and other arrangements, the Spanish banks included in the Group and certain other Spanish and foreign consolidated entities have undertaken to supplement the public social security system benefits accruing to certain employees, and to their beneficiary right holders, for retirement, permanent disability or death, the benefits and indemnity payments payable, the contributions to employee welfare systems for pre-retirees and the post-employment welfare benefits.
F-49
The Group’s post-employment obligations to its employees are deemed to be defined contribution plans when the Group makes pre-determined contributions (recognized inunder Personnel expenses in the consolidated income statement) to a separate entity and will have no legal or effective obligation to make further contributions if the separate entity cannot pay the employee benefits relating to the service rendered in the current and prior periods. Post-employment obligations that do not meet the aforementioned conditions are classified as defined benefit plans (see Note 25).
Defined contribution plans
The contributions made in this connection in each year are recognized under Personnel expenses in the consolidated income statement. The amounts not yet contributed at each year-end are recognized, at their present value, under Provisions—Provisions - Provision for pensions and similar obligations on the liability side of the consolidated balance sheet.
Defined benefit plans
The Group recognisesrecognizes under Provisions—Provisions - Provision for pensions and similar obligations on the liability side of the consolidated balance sheet (or under Other assets on the asset side, as appropriate) the present value of its defined benefit post-employment obligations, net of the fair value of the plan assets, of the net unrecognized cumulative actuarial gains and/or losses disclosed on measurement of these obligations, which are deferred using a corridor approach, and of the past service cost, which is deferred over time, as explained below.assets.
Plan assets are defined as those that will be directly used to settle obligations and that meet the following conditions:
If the Group can look to an insurer to pay part or all of the expenditure required to settle a defined benefit obligation, and it is practically certain that said insurer will reimburse some or all of the expenditure required to settle that obligation, but the insurance policy does not qualify as a plan asset, the Group recognisesrecognizes its right to reimbursement -which, in all other respects, is treated as a plan asset- under Insurance contracts linked to pensions on the asset side of the consolidated balance sheet.
Actuarial gains and losses are defined as those arising from differences between the previous actuarial assumptions and what has actually occurred and from the effects of changes in actuarial assumptions. The Group uses, on a plan-by-plan basis, the corridor approach and recognises in the consolidated income statement the amount resulting from dividing by five the net amount of the cumulative actuarial gains and/or losses not recognized at the beginning of each year which exceeds 10% of the present value of the obligations or 10% of the fair value of the plan assets at the beginning of the year, whichever amount is higher. The maximum five-year allocation period, which is required by the Bank of Spain for all Spanish financial institutions, is shorter than the average number of remaining years of active service relating to the employees participating in the plans, and is applied systematically.
The past service cost -which arises from changes to existing post-employment benefits or from the introduction of new benefits- is recognized on a straight-line basis in the consolidated income statement over the period from the time the new obligations arise to the date on which the employee has an irrevocable right to receive the new benefits.
F-50
Post-employment benefits are recognized as follows:
| w) | Other long-term employee benefits |
Other long-term employee benefits, defined as obligations to pre-retirees -taken to be those who have ceased to render services at the entity but who, without being legally retired, continue to have economic rights vis-à-vis the entity until they acquire the legal status of retiree-, long-service bonuses, obligations for death of spouse or disability before retirement that depend on the employee’s length of service at the entity and other similar items, are treated for accounting purposes, where applicable, as established above for defined benefit post-employment plans, except that all past service costs and actuarial gains and losses are recognized immediatelyunder Provisions (net) in the consolidated income statement (see Note 25).
| x) | Termination benefits |
Termination benefits are recognized when there is a detailed formal plan identifying the basic changes to be made, provided that implementation of the plan has begun, its main features have been publicly announced or objective facts concerning its implementation have been disclosed.
| y) | Income tax |
The expense for Spanish corporation tax and other similar taxes applicable to the foreign consolidated entities is recognized in the consolidated income statement, except when it results from a transaction recognized directly in equity, in which case the tax effect is also recognized in equity.
The current income tax expense is calculated as the sum of the current tax resulting from application of the appropriate tax rate to the taxable profit for the year (net of any deductions allowable for tax purposes), and of the changes in deferred tax assets and liabilities recognized in the consolidated income statement.
Deferred tax assets and liabilities include temporary differences, which are identified as the amounts expected to be payable or recoverable on differences between the carrying amounts of assets and liabilities and their related tax bases, and tax loss and tax credit carryforwards. These amounts are measured at the tax rates that are expected to apply in the period when the asset is realisedrealized or the liability is settled.
Tax assets includes the amount of all tax assets, which are broken down into current -amounts of tax to be recovered within the next twelve months- and deferred -amounts of tax to be recovered in future years, including those arising from tax loss or tax credit carryforwards.
Tax liabilities includes the amount of all tax liabilities (except provisions for taxes), which are broken down into current -the amount payable in respect of the income tax on the taxable profit for the year and other taxes in the next twelve months- and deferred -the amount of income tax payable in future years.
F-51
Deferred tax liabilities are recognized in respect of taxable temporary differences associated with investments in subsidiaries, associates or joint ventures, except when the Group is able to control the timing of the reversal of the temporary difference and, in addition, it is probable that the temporary difference will not reverse in the foreseeable future.
Deferred tax assets are only recognized for temporary differences to the extent that it is considered probable that the consolidated entities will have sufficient future taxable profits against which the deferred tax assets can be utilised,utilized, and the deferred tax assets do not arise from the initial recognition (except in a business combination) of other assets and liabilities in a transaction that affects neither taxable profit nor accounting profit. Other deferred tax assets (tax loss and tax credit carryforwards) are only recognized if it is considered probable that the consolidated entities will have sufficient future taxable profits against which they can be utilised.utilized.
Income and expenses recognized directly in equity are accounted for as temporary differences.
The deferred tax assets and liabilities recognized are reassessed at each reporting date in order to ascertain whether they still exist, and the appropriate adjustments are made on the basis of the findings of the analyses performed.
| z) | Residual maturity periods and average interest rates |
The analysis of the maturities of the balances of certain items in the consolidated balance sheet and the average interest rates at 2011, 20102013, 2012 and 20092011 year-end is provided in Note 51.
aa) Consolidated statements of cash flows
The following terms are used in the consolidated statements of cash flows with the meanings specified:
The Group classifies as cash and cash equivalents the balances recognized under Cash and balances with central banks in the consolidated balance sheet.
ab) Consolidated statements of recognized income and expense
This statement presents the income and expenses generated by the Group as a result of its business activity in the year, and a distinction is made between the income and expenses recognized in the consolidated income statement for the year and the other income and expenses recognized directly in consolidated equity.
Accordingly, this statement presents:
| a. | Consolidated profit for the year. |
| b. | The net amount of the income and expenses recognized temporarily in consolidated equity under |
| c. | The net amount of the income and expenses recognized definitively in consolidated equity. |
F-52
| d. | The income tax incurred in respect of the items indicated in b) and c) above, except for the valuation adjustments arising from investments in associates or jointly controlled entities accounted for using the equity method, which are presented net. |
| e. | Total consolidated recognized income and expense, calculated as the sum of a) to d) above, presenting separately the amount attributable to the Parent and the amount relating to non-controlling interests. |
The amount of the income and expenses relating to entities accounted for using the equity method recognized directly in equity is presented in this statement, irrespective of the nature of the related items, under Entities accounted for using the equity method.
The statement presents the items separately by nature, grouping together items that, in accordance with the applicable accounting standards, will not be reclassified subsequently to profit and loss since the requirements established by the corresponding accounting standards are met.
ac) Statements of changes in total equity
This statement presents all the changes in equity, including those arising from changes in accounting policies and from the correction of errors. Accordingly, this statement presents a reconciliation of the carrying amount at the beginning and end of the year of all the consolidated equity items, and the changes are grouped together on the basis of their nature into the following items:
| a. | Adjustments due to changes in accounting policies and to errors: include the changes in consolidated equity arising as a result of the retrospective restatement of the balances in the consolidated financial statements, distinguishing between those resulting from changes in accounting policies and those relating to the correction of errors. |
| b. | Income and expense recognized in the year: includes, in aggregate form, the total of the aforementioned items recognized in the consolidated statement of recognized income and expense. |
| c. | Other changes in equity: includes the remaining items recognized in equity, including, inter alia, increases and decreases in capital, distribution of profit, transactions involving own equity instruments, equity-instrument-based payments, transfers between equity items and any other increases or decreases in consolidated equity. |
| 3. | Santander Group |
| a) | Banco Santander, S.A. and international Group structure |
The growth of the Group in the last decade has led the Bank to also act, in practice, as a holding entity of the shares of the various companies in its Group, and its results are becoming progressively less representative of the performance and earnings of the Group. Therefore, each year the Bank determines the amount of the dividends to be distributed to its shareholders on the basis of the consolidated net profit, while maintaining the Group’s traditionally high level of capitalisationcapitalization and taking into account that the transactions of the Bank and of the rest of the Group are managed on a consolidated basis (notwithstanding the allocation to each company of the related net worth effect).
At international level, the various banks and other subsidiaries, jointly controlled entities and associates of the Group are integrated in a corporate structure comprising various holding companies which are the ultimate shareholders of the banks and subsidiaries abroad.
The purpose of this structure, all of which is controlled by the Bank, is to optimiseoptimize the international organisationorganization from the strategic, economic, financial and tax standpoints, since it makes it possible to define the most appropriate units to be entrusted with acquiring, selling or holding stakes in other international entities, the most appropriate financing method for these transactions and the most appropriate means of remitting the profits obtained by the Group’s various operating units to Spain.
The Appendices provide relevant data on the consolidated Group companies and on the companies accounted for using the equity method.
F-53
| b) | Acquisitions and disposals |
Following is a summary of the main acquisitions and disposals of ownership interests in the share capital of other entities and other significant corporate transactions performed by the Group in the last three years:
i. Sovereign Bancorp, Inc. (Sovereign)
On October 13, 2008, the Bank and Sovereign Bancorp Inc., the parent of Sovereign Bank, announced that Santander would acquire Sovereign through a share exchange. At the date of the announcement Santander held 24.35% of the outstanding ordinary shares of Sovereign.
On January 30, 2009, the acquisition of the 75.65% of the company not held by Santander was completed and Sovereign became a wholly-owned subsidiary of Santander Group. The transaction involved the issue of 0.3206 ordinary shares of Banco Santander for each ordinary share of Sovereign (equivalent to the approved exchange of 0.2924 ADSs adjusted for the dilution arising from the capital increase carried out in December 2008). To this end, 161,546,320 ordinary shares were issued for a cash amount (par value plus share premium) of EUR 1,302 million.
The volume of assets contributed by the Sovereign business unit to the Group amounted to approximately EUR 48,791 million at the 2009 closing exchange rate, of which approximately EUR 9,568 million related to Available-for-sale financial assets and EUR 34,605 million to Loans and receivables. Also, at December 31, 2009 Sovereign contributed to the Group financial liabilities amounting to approximately EUR 45,364 million and provisions amounting to EUR 401 million. In the process of allocation of the purchase price, the Group recognized initial goodwill of USD 2,053 million (EUR 1,601 million at the exchange rate at the date of acquisition- EUR 1,425 million at the 2009 closing exchange rate-). Additionally, various notes to these consolidated financial statements disclose the amounts of the main assets, liabilities and contingent liabilities contributed to the Group by this entity.
Since the Group obtained control over Sovereign at the end of January 2009, the Group’s consolidated income statement for 2009 included substantially all the losses generated by Sovereign in the year (EUR 25 million).
ii. Acquisition of Real Tokio Marine Vida e Previdência
In March 2009 the Group in Brazil acquired the 50% of the insurance company Real Seguros Vida e Previdência (formerly Real Tokio Marine Vida e Previdência) that it did not already own from Tokio Marine for BRL 678 million (EUR 225 million).
iii. General Electric Money and Interbanca
The first quarter of 2009 saw the completion of the agreement reached by Banco Santander and GE in March 2008 whereby Banco Santander would acquire the units of GE Money in Germany (already acquired in the fourth quarter of 2008), Finland and Austria and its card (Santander Cards UK Limited) and vehicle financing units in the UK, and GE Commercial Finance would acquire Interbanca, an entity specialising in wholesale banking which was assigned to Banco Santander in the distribution of ABN AMRO’s assets. The initial goodwill arising from the acquisition of the GE business amounted to EUR 558 million at December 2009. The assets contributed by these units consisted mainly of loans and advances to customers and represent approximately 1% of the Group’s lending.
iv. Banco de Venezuela, S.A., Banco Universal
On May 22, 2009, Banco Santander announced that it had reached an agreement in principle for the sale of its stake in Banco de Venezuela, S.A., Banco Universal to the Bolivarian Republic of Venezuela. On July 6, 2009 Banco Santander announced that it had closed the sale of the stake in Banco de Venezuela, S.A., Banco Universal to Banco de Desarrollo Económico y Social de Venezuela, a public institution of the Bolivarian Republic of Venezuela, for USD 1,050 million, of which USD 630 million were received in cash on that date and the remainder was received before the end of 2009. This sale did not have a material impact on the Group’s consolidated income statement for 2009.
F-54
v. Triad Financial Corporation
In June 2008 Banco Santander’s executive committee authorized the acquisition by Santander Consumer USA Inc. (formerly Drive Consumer USA Inc.) of the vehicle purchase loan portfolio and an Internet-based direct loan platform (roadloans.com) belonging to the US group Triad Financial Corporation. The acquisition price, USD 615 million, was determined on the basis of an analysis of each individual loan. In July 2009 the aforementioned executive committee authorized Santander Consumer USA Inc. to acquire Triad Financial SM Inc, with its remaining portfolio for USD 260 million.
vi. Banco Santander (Brasil) S.A.
On October 13, 2009, the Group subsidiary Banco Santander (Brasil) S.A. (Santander Brasil) closed its initial public offering of 525,000,000 units, each unit representing 55 ordinary shares and 50 preference shares, without par value. The offered securities (units) are share deposit certificates. The units were offered in a global offering consisting of an international tranche in the United States and in other countries other than Brazil, in the form of American depositary shares (ADSs), in which each ADS represented a unit, and a domestic tranche of units in Brazil.
The initial public offering price was BRL 23.50 per unit and USD 13.4033 per ADS.
Additionally, Santander Brasil granted the international underwriters an option, exercisable before November 6, 2009, to purchase an additional 42,750,000 ADSs to cover any over-allotments in connection with the international tranche. Santander Brasil also granted the domestic underwriters an option, exercisable during the same period, to purchase an additional 32,250,000 units to cover any over-allotments in connection with the Brazilian tranche.
Once the global offering was completed and after the underwriters exercised their options, the capital increase amount was BRL 13,182 million (EUR 5,092 million). The free float of Santander Brasil rose to approximately 16.45% of its share capital, from only 2.0% before the IPO. Santander Brasil undertook to raise the free float to at least 25% of its share capital within three years from the date of the initial public offering in order to maintain its listing on Level 2 of the Bolsa de Valores, Mercadorias e Futuros (BM&FBOVESPA). The ADSs are listed on the New York Stock Exchange.
In 2009 Santander Group’s net gains from the placement amounted to EUR 1,499 million.
In the third quarter of 2010 the Group sold 2.616% of Santander Brasil’s share capital. The sale price amounted to EUR 867 million, which gave rise to increases of EUR 162 million in Reserves and EUR 790 million in Non-controlling interests, and a decrease of EUR 85 million in Valuation adjustments—Exchange differences.
vii. Acquisition of 75% of AIG Bank Polska Spólka Akcyina
On June 8, 2010, Santander Consumer Bank S.A. (Poland) carried out a capital increase through the issue of 1,560,000 new shares, fully subscribed by AIG Consumer Finance Group Inc., through a non-monetary contribution of 11,177,088 shares of AIG Bank Polska Spólka Akcyina, representing 99.92% of its share capital. The capital increase amounted to PLN 452 million (approximately EUR 109 million at the transaction date).
Following this capital increase, the ownership interest held by the Group in Santander Consumer Bank, S.A. (Poland) was diluted to 70% of the share capital.
viii. Sale of James Hay Holdings Limited
On March 10, 2010, Santander Private Banking UK Limited completed the sale of James Hay Holdings Limited (including its five subsidiaries) through the transfer of all the shares of James Hay Holdings Limited to IFG UK Holdings Limited, a subsidiary of the IFG Group, for a total of GBP 39 million.
F-55
ix. Sale of Companhia Brasileira de Soluções e Serviços
In July 2010 the agreement entered into with Banco do Brasil S.A. and Banco Bradesco S.A. for the sale to these two entities of Santander Group’s ownership interest in Companhia Brasileira de Soluções e Serviços-CBSS (15.32% of the share capital) was executed. The sale price was approximately EUR 88.9 million, giving rise to a gain of EUR 80 million, which was recognized under Gains/(losses) on disposal of assets not classified as non-current assets held for sale (EUR 33 million net of tax and non-controlling interests) in the consolidated income statement for 2010.
x. Purchase of 24.9% of Grupo Financiero Santander, S.A. B de C.V.
On June 9, 2010, Banco Santander announced that it had entered into an agreement with Bank of America whereby it would acquire the 24.9% ownership interest that the latter held in Grupo Financiero Santander S.A. B de C.V. for USD 2,500 million. The transaction, which was completed in the third quarter of 2010, gave rise to a decrease in the balances of Non-controlling interests and Reserves of EUR 1,177 million and EUR 843 million, respectively. Following the transaction, Santander’s ownership interest in Grupo Financiero Santander S.A. B de C.V. stands at 99.9%.
xi. Bid for Santander BanCorp
The bid launched by Administración de Bancos Latinoamericanos Santander, S.L. (Ablasa), a wholly-owned subsidiary of Santander, for the portion of the share capital of Santander BanCorp (Puerto Rico) that it did not control, ended on July 22, 2010. Shareholders owning 7.8% of the shares accepted the offer and, therefore, following the transaction Ablasa held 98.4% of the total share capital of Santander BanCorp.
Ablasa acquired the remaining shares through a transaction performed in Puerto Rico on July 29, 2010 known as a short form merger, whereby the shares held by the shareholders who did not accept the bid were redeemed and these shareholders received in exchange the same amount in cash that was paid in the bid (USD 12.69 per share), without interest and net of any applicable tax withholding.
The transaction totalled approximately USD 56 million (EUR 44 million), which gave rise to a decrease of EUR 45 million in Non-controlling interests and an increase of EUR 1 million in Reserves.
After the short form merger was completed, Santander BanCorp is now a wholly-owned subsidiary of Banco Santander. Its shares are no longer listed on the New York and Latibex stock exchanges and it is no longer required to file certain periodic information with the US Securities and Exchange Commission.
xii. Agreement with Skandinaviska Enskilda Banken (SEB Group) for the acquisition of its commercial banking business in Germany
On July 12, 2010, the Santander Group announced the agreement with Skandinaviska Enskilda Banken (SEB Group) for the purchase by the German subsidiary Santander Consumer Bank AG of the SEB Group’s commercial banking business in Germany. As a result of the acquisition of this business, which comprises 173 branches and provides services to a million customers, the number of Santander Consumer Bank branches in Germany almost doubled and the Group’s headcount increased by approximately 2,200. The transaction was completed on January 31, 2011, onceafter receiving the relevant regulatory approvals had been obtained, forapproval, amounting to EUR 494 million, subject to such adjustments as might arise after the review of the net assets acquired.million.
F-56
The detail of the provisional fair values of the identifiable assets acquired and liabilities assumed at the acquisition date, the cost of the investment and the goodwill is as follows:
| Millions of euros | ||||
Cash and balances with central banks | 61 | |||
Loans and receivables | 8,202 | |||
Tangible assets | 8 | |||
Other assets | 82 | |||
|
| |||
Total assets | 8,353 | |||
|
| |||
Deposits from credit institutions | 710 | |||
Customer deposits | 4,486 | |||
Marketable debt securities and Other financial liabilities | 2,467 | |||
Provisions (**) | 299 | |||
Other liabilities | 42 | |||
|
| |||
Total liabilities | 8,004 | |||
|
| |||
Net asset value | 349 | |||
|
| |||
Non-controlling interests | — | |||
|
| |||
Cost of investment | (494 | ) | ||
|
| |||
Goodwill at February 1, 2011 (***) | 145 | |||
|
| |||
| (*) | Of which approximately 83% relate to mortgage loans and the remainder to consumer loans. The estimate of fair value included additional impairment losses of EUR 126 million |
| (**) | Of which approximately EUR 66 million |
| (***) | Belongs to the Santander Consumer Holding |
The acquired business contributed a loss of EUR 58 million to pre-tax profit for 2011.
xiii. Acquisition of Bank Zachodni WBK, S.A.
On February 7, 2011, the Group announced the preparation in Poland of a takeover bid for all the shares of the Polish company Bank Zachodni WBK, S.A. (“BZ WBK”), which Allied Irish Bank (“AIB”), owner of 70.36% of BZ WBK, was obliged to accept, by virtue of the agreement entered into with Banco Santander in September 2010.
On February 18, 2011, notification of non-opposition to the Group’s acquisition of a significant holding was received from the financial regulator in Poland -KNF.
On April 1, 2011, the Group acquired 69,912,653 shares of Bank Zachodni WBK, S.A. representing 95.67% of the capital of this entity. The purchase of the aforementioned shares gave rise to a disbursement of EUR 3,987 million. Also, as had already been announced, on the same date Santander acquired the 50% ownership interest held by AIB in Bank Zachodni WBK Asset Management, S.A. for EUR 174 million in cash. Subsequently, based on the terms and conditions of the takeover bid, certain non-controlling shareholders of BZ WBK opted to sell their shares. As a result, the Group acquired 421,859 additional shares for EUR 24 million.
At the date of formal preparation of these consolidated financial statements, the Group had allocated the fair value of the identifiable assets acquired and liabilities assumed on a provisional basis. This analysis will be concluded, in any case, by the deadline of twelve months after the acquisition date permitted by the applicable standard.
F-57
Following is the detail of the provisional fair values of the identifiable assets acquired and liabilities assumed at the acquisition date, the cost of the investment and the goodwill translated to euros at the exchange rate at the date of acquisition:
| ||||
| ||||
| ||||
| ||||
| ||||
| ||||
| ||||
| ||||
| ||||
| ||||
| ||||
| ||||
| ||||
| ||||
| ||||
| ||||
| ||||
| ||||
At December 31, 2011, the Group held a total of 70,334,512 shares of Bank Zachodni WBK, S.A. (96.25%).
At December 31, 2011, Bank Zachodni WBK, S.A. had contributed a profit of EUR 207 million to the Group. Had the acquisition taken place on January 1, 2011, the profit contributed to the Group would have been approximately EUR 276 million.
xiv.ii. Acquisition of Santander Banif Inmobiliario
On December 3, 2010, for purely commercial reasons, the Group decided to contribute resources to the Santander Banif Inmobiliario, F.I.I. property investment fund (“the Fund”) through the subscription of new units and the granting of a two-year liquidity guarantee in order to meet any outstanding redemption claims by the unitholders and to avoid winding up the Fund. The Group offered the unitholders of the Fund the possibility, before February 16, 2011, to submit new requests for the total or partial redemption of their units or for the total or partial revocation of any redemption requests that they had previously submitted and had not been met.
Redemptions from this Fund, which is managed by the Group entity Santander Real Estate, S.G.I.I.C. S.A., had been suspended for two years in February 2009, in accordance with the request filed with the Spanish National Securities Market Commission (CNMV), due to the lack of sufficient liquidity to meet the redemptions requested at that date, which were in excess of 10% of net assets.
F-58
On March 1, 2011, the Group paid the full amount of the redemptions requested by the Fund’s unitholders, i.e. EUR 2,326 million (93.01% of the Fund’s net assets), through the subscription of the related units by the Group at their redemption value at February 28, 2011.
TheSince the Group already had a non-controlling interest in the Fund, and, therefore, following the aforementioned acquisition the Group ownsowned 95.54% of the Fund. Furthermore, the suspension of redemptions was lifted from said date and the Fund is operating normally.
At the date of formal preparation of these consolidated financial statements, the Group had allocated the fair value of the identifiable assets acquired and liabilities assumed on a provisional basis. This analysis will be concluded, in any case, by the deadline of twelve months after the acquisition date permitted by the applicable standard.
The detail of the provisional fair values of the identifiable assets acquired and liabilities assumed at the acquisition date, the cost of the investment and the goodwill is as follows:
| Millions of euros | ||||
Cash and balances with central banks and | 69 | |||
Loans and receivables | 10 | |||
Tangible assets | 2,756 | |||
Other assets | 9 | |||
|
| |||
Total assets | 2,844 | |||
|
| |||
Customer deposits | 81 | |||
Deposits from credit institutions | 245 | |||
Other liabilities | 17 | |||
|
| |||
Total liabilities | 343 | |||
|
| |||
Net asset value | 2,501 | |||
|
| |||
Non-controlling interests | (112 | ) | ||
|
| |||
Cost of investment | (2,389 | ) | ||
|
| |||
Goodwill at March 1, 2011 | — | |||
|
| |||
At the reporting date no adjustments had been made to the fair value of the assets and liabilities acquired; however, it is considered that these adjustments, if any, will not be material since the Fund recognises its assets at net asset value.
At December 31, 2011, Santander Banif Inmobiliario F.I.I. had contributed a pre-tax loss of EUR 106 million to the Group.
In 2012 the Group acquired Fund units amounting to EUR 22 million and, accordingly, its ownership interest rose to 97.63% (in 2013 it rose to 99.65%).
xv.iii. Chile
In 2011 the Group performed various sales of shares representing 9.72% of the share capital of Banco Santander Chile for a total of USD 1,241 million, which gave rise to increases of EUR 434 million in Group reserves and EUR 373 million in non-controlling interests. Following these transactions, the Group holds 67% of the share capital of Banco Santander Chilethis entity and it has undertakenundertook not to reduce its percentage of ownership for one year.
F-59
xvi. Latamiv. Latin American insurance companies
On February 22, 2011, Banco Santander, S.A. and the insurance company Zurich Financial Services Group entered into an agreement to create a strategic alliance that will boostaimed at boosting Santander Group’s bancassurance business in five key Latin American markets: Brazil, Chile, Mexico, Argentina and Uruguay.
Once the required authorisationsauthorizations had been obtained from the various regulators, in the fourth quarter of 2011 Zurich acquired, for EUR 1,044 million, 51% of the share capital of ZSZurich Santander Insurance América, S.L. (holding company for the Group’s insurance “factories” in Latin America), thereby gaining control over this company, and it has takentook over management of the companies concerned. The agreement also provides for deferred payments based on the achievement of the business plan targets over the coming 25 years.
Following this transaction Banco Santander retained 49% of the share capital of the holding company and entered into a distribution agreement for the sale of insurance products in each of the signatory countries for 25 years (see Note 13).
As a result of the aforementioned transaction, the Group recognized a gain of EUR 908 million (EUR 641 million net(net of the related tax effect) under Gains (losses) on disposal of assets not classified as non-current assets held for sale in the consolidated income statement for 2011 (see Note 49), of which EUR 233 million related to the measurement at fair value of the 49% ownership interest retained in this company.
xvii.v. SCUSA
In December 2011 Santander Consumer USA Inc. (SCUSA) increased capital by USD 1,158 million, of which USD 1,000 million were paid by Sponsor Auto Finance Holdings Series LP (Auto Finance(Sponsor Holdings) -an, an investee of funds controlled by Warburg Pincus LLC, Kohlberg Kravis Roberts & Co. L.P. and Centerbridge Partners L.P.-CenterbridgePartners L.P., and the remainder by DDFS LLC (DDFS) -a, a company controlled by Thomas G. Dundon, the Chief Executive OfficerCEO of SCUSA-.SCUSA. Following this capital increase, Auto FinanceSponsor Holdings and Thomas G. Dundon (indirectly) held equity interests of approximately 24% and 11%, respectively, in SCUSA, while the Group’s equity interest therein is 65%.
Also, the Group has entered into an agreement with these shareholders which, inter alia, grants Auto FinanceSponsor Holdings and DDFS LLC representation on the board of directors of SCUSA and establishes a voting system whereby strategic, financial and operating decisions, as well as other significant decisions associated with the ordinary management of SCUSA, are subject to joint approval by Santander Group and the aforementioned shareholders and, accordingly, SCUSA is nowbecame controlled jointly by all the shareholders.
Also asAs provided for in the shareholders’ agreement, if SCUSA’s earnings for 2014 and 2015 exceed certain targets, SCUSA may be required to pay up to USD 595 million to Santander Holdings USA, Inc. (SHUSA). If SCUSA’s earnings do not surpass those targets in 2014 and 2015, SCUSA may be obliged to make a payment of up to that same amount to Auto FinanceSponsor Holdings. At the date of the transaction, the Group’sThe Bank’s directors considered that SCUSA would achieve the targets set for 2014 and 2015 and that it would therefore not have to make any significant payments to either of the aforementioned shareholders under the agreement.
Lastly, the shareholders’ agreement establishes that both Auto FinanceSponsor Holdings and DDFS will be entitled to sell to SHUSA their ownership interests in the share capital of SCUSA at market value on the fourth, fifth and seventh anniversaries of completion of the transaction, unless a public offering of SCUSA shares has taken place prior to those dates. The agreement also provides for this same entitlement in the event of a situation ofan impasse in relation to any of the matters subject to joint approval by the general meeting or the board of directors of SCUSA.
Following this transaction Santander Group holds a 65% ownership interest in SCUSA and controls this company jointly with the aforementioned shareholders (see Note 13).
As a result of the aforementioned transaction, in 2011 the Group recognized a gain of EUR 872 million under Gains (losses) on disposal of assets not classified as non-current assets held for sale (see Note 49), of which EUR 649 million related to the measurement at fair value of the 65% ownership interest retained in this company.
F-60
The fair value of SCUSA was determined using comparable market data, recent transactions and discounted cash flow analyses, taking into account contingent payments.
Following this transaction, at December 31, 2013, the Group held a 65% ownership interest in SCUSA and controlled this company jointly with the aforementioned shareholders (see Note 13).
In January 2014, a public offering of SCUSA shares took place and it was admitted to trading on the New York Stock Exchange, having placed 21.6% of its share capital. Following this placement, the aforementioned shareholders’ agreement was terminated and, accordingly, the Group controls SCUSA (see Note 1.h).
xviii. Metrovacesavi. Banco Santander (Brasil) S.A.
On February 20, 2009, certain creditIn January and March 2012 the Group transferred shares representing 4.41% and 0.77% of Banco Santander (Brasil), S.A. to two leading international financial institutions includingthat have undertaken to deliver these shares to the Bank and Banesto,holders of the bonds convertible into shares of Banco Santander (Brasil), S.A. issued by Banco Santander, S.A. in October 2010 upon maturity of the bonds. This transaction did not give rise to any change in the Group’s equity (see Note 34).
These shares were delivered on November 7, 2013.
vii. Colombia
In December 2011, the Group entered into an agreement with the Chilean group Corpbanca to sell its shareholding in Banco Santander Colombia S.A. and its other business subsidiaries in this country (Santander Investment Valores Colombia S.A., Comisionista de Bolsa Comercial, Santander Investment Colombia S.A., Santander Investment Trust Colombia S.A., Sociedad Fiduciaria y Agencia de Seguros Santander, Ltda.).
Following the obtainment of the regulatory authorizations from the competent authorities and the delisting of the shares of Banco Santander Colombia S.A., in the second quarter of 2012 the Group sold its shareholding in Banco Santander Colombia S.A. and its other business subsidiaries in this country to the Corpbanca Group for a total of USD 1,229 million (EUR 983 million), giving rise to a gain of EUR 619 million which was recognized by the Group under Gains/(losses) on disposal of assets not classified as non-current assets held for sale in the consolidated income statement for 2012 (see Note 49).
viii. Grupo Financiero Santander México, S.A.B. de C.V.
In August 2012 the Group announced its intention to file prospectuses with the Mexican National Banking and Securities Commission (CNBV) and the US Securities and Exchange Commission for the restructuringplacement of shares of the debtsubsidiary Grupo Financiero Santander México, S.A. B. de C.V. in the secondary market.
The public offering for 1,469,402,029 series B shares of Grupo Financiero Santander México, S.A. B. de C.V. was completed on September 26, 2012. The transaction was made up of a Mexican tranche, consisting of shares, and an international tranche, including the Sanahuja Group, whereby these credit institutions received, as dationUnited States, consisting of American Depositary Shares (ADSs) representing five shares each.
The share placement was priced at MXN 31.25 (USD 2.437) per share.
Also, the underwriters involved in payment for this group’s debts, shares representing 54.75% of the share capital of Metrovacesa. The aforementioned agreement also envisaged the acquisition by the creditor entities ofoffering were granted an option, exercisable before October 25, to purchase an additional 10.77% of220,410,304 shares.
Once the share capital of Metrovacesa,offering as a whole had been completed and the underwriters had exercised their options, the percentage sold was 24.9%, which gave rise to an additional disbursementincreases of EUR 2141,092 million for the Group,in Reserves, EUR 1,493 million in Non-controlling interests and other conditions concerning the administration of this company.EUR 263 million in Valuation adjustments - Exchange differences in 2012.
Following the execution of the agreement, Santander Group had an ownership interest of 23.63% inix. Metrovacesa, S.A., of which a 5.38% stake was subject to a four-year call option.
In 2009 and 2010 the Group recognized impairment losses on this investment, the carrying amount of which at December 31, 2010 was EUR 402 million.
On March 17, 2011, the creditor entities that had been party to an agreement to restructure the aforementioned restructuring agreementSanahuja Group’s debt in 2009, whereby they received Metrovacesa, S.A. shares as a dation in payment for the group’s debts, entered into a new capitalisationcapitalization and voting agreement relating to Metrovacesa, S.A., subject to certain conditions precedent, including the performance by Metrovacesa, S.A. of a capital increase through monetary contributions and the conversion of debt into capital, whereby the creditor entities taken as a whole would convert approximately EUR 1,360 million of Metrovacesa’sMetrovacesa, S.A.’s financial debt into capital, the Group’s share of which would be EUR 492 million.million would relate to the Group.
On June 28, 2011, the shareholders at the annual general meeting of Metrovacesa, S.A. resolved to approve the aforementioned capital increase, subject to certain conditions precedent such as the Spanish National Securities Market Commission (CNMV) releasing the Group from the obligation to launch a takeover bid for all of the share capital, since the transaction might raise the Group’s holding in the share capital of Metrovacesa, S.A. above 30%. This release was granted on July 6, 2011.
Following the performance of the aforementioned capital increase, the Group now ownsbecame the owner of 34.88% of the shares of Metrovacesa.Metrovacesa, S.A. This ownership interest is recognized under Investments in the consolidated balance sheet and is accounted for using the equity method (see Note 13).
On December 19, 2012, the creditor entities that took part in the aforementioned debt restructuring agreement announced that they had reached an agreement to promote the delisting of the shares of Metrovacesa, S.A. and they voted in favor of this at the general meeting held for this purpose on January 29, 2013. Following the approval of the delisting and the public takeover offer by the shareholders at the Metrovacesa, S.A. general meeting, the entities prepared a delisting public takeover offer aimed at the Metrovacesa, S.A. shareholders that did not enter into the agreement, at EUR 2.28 per share. The Group’s share of the delisting public takeover offer was 45.56% and, as a result, following 97.29% acceptance of the public takeover offer, the Group acquired an additional 1.953% of Metrovacesa, S.A. for which it paid EUR 44 million. Following this transaction, at December 31, 2013, the Group held an ownership interest of 36.82% in the share capital of Metrovacesa, S.A.
xix.x. Bank Zachodni WBK S.A.
On February 7, 2011, the Group announced the preparation in Poland of a takeover bid for all the shares of the Polish company Bank Zachodni WBK, S.A. (“BZ WBK”), which Allied Irish Bank (“AIB”), owner of 70.36% of BZ WBK, was obliged to accept, by virtue of the agreement entered into with Banco Santander, S.A. in September 2010.
On February 18, 2011, notification of non-opposition to the Group’s acquisition of a significant holding was received from the financial regulator in Poland -KNF.
On April 1, 2011, the Group acquired 69,912,653 shares of Bank Zachodni WBK, S.A. representing 95.67% of the capital of this entity. The purchase of the aforementioned shares gave rise to a disbursement of EUR 3,987 million. Also, as had already been announced, on the same date the Group acquired the 50% ownership interest held by AIB in Bank Zachodni WBK Asset Management, S.A. for EUR 174 million in cash. Subsequently, based on the terms and conditions of the takeover bid, certain non-controlling shareholders of BZ WBK opted to sell their shares. As a result, the Group acquired 421,859 additional shares for EUR 24 million.
Following is the detail of the fair values of the identifiable assets acquired and liabilities assumed at the acquisition date, the cost of the investment and the goodwill translated to euros at the exchange rate at the date of acquisition:
| Millions of euros | ||||
Cash and balances with central banks | 316 | |||
Loans and advances to credit institutions | 386 | |||
Financial liabilities held for trading | 691 | |||
Available-for-sale financial assets | 3,422 | |||
Loans and receivables - loans and advances to customers (*) | 8,346 | |||
Tangible assets | 113 | |||
Intangible assets (**) | 94 | |||
Other assets | 226 | |||
Total assets | 13,594 | |||
Customer deposits (***) | 10,288 | |||
Deposits from credit institutions | 797 | |||
Provisions | 46 | |||
Other liabilities | 464 | |||
Total liabilities | 11,595 | |||
Net assets | 1,999 | |||
Non-controlling interests | (75 | ) | ||
Cost of investment | (4,185 | ) | ||
Goodwill at April 1, 2011 | 2,261 | |||
| (*) | EUR 15 million of additional impairment losses were considered in estimating the fair value of the loans and receivables. |
| (**) | The estimate identified a customer list amounting to approximately EUR 54 million. |
| (***) | In the estimate customer deposits were reduced by approximately EUR 178 million. |
At December 31, 2011, the Group held a total of 70,334,512 shares of Bank Zachodni WBK, S.A. (96.25%).
In 2011 Bank Zachodni WBK, S.A. contributed EUR 207 million to the profit of the Group. Had the acquisition taken place on January 1, 2011, the profit contributed to the Group in 2011 would have been approximately EUR 276 million.
In August 2012, Bank Zachodni WBK S.A. performed a capital increase amounting to PLN 332 million (EUR 81 million) which was not subscribed by the Group, giving rise to a reduction of EUR 12 million in Reserves and EUR 5 million in Valuation adjustments, and to an increase of EUR 93 million in Non-controlling interests, considering the Group’s effective ownership interest in the entity. Following the aforementioned transaction, the Group held 94.23% of the entity’s share capital.
xi. Merger of Bank Zachodni WBK S.A. and Kredyt Bank S.A.
On February 28, 2012, the Group announced that Banco Santander, S.A. and KBC Bank NV (KBC) had entered into an investment agreement to merge their two subsidiaries in Poland, Bank Zachodni WBK S.A. and Kredyt Bank S.A., respectively, following which the Group controlled approximately 76.5% of the entity resulting from the merger and KBC controlled 16.4%, with the remaining 7.1% being owned by non-controlling interests. Also, the Group undertook to place a portion of its ownership interest among investors and to acquire up to 5% of the entity resulting from the merger in order to help KBC to reduce its holding in the merged entity to below 10%. KBC’s objective is to dispose of its entire investment in order to maximize its value.
It was agreed to carry out the transaction through a capital increase at Bank Zachodni WBK S.A., whose new shares would be offered to KBC and the other shareholders of Kredyt Bank S.A. in exchange for shares in Kredyt Bank S.A. The related exchange ratio was established at 6.96 shares of Bank Zachodni S.A. for every 100 shares of Kredyt Bank S.A.
In the first few days of 2013, following obtainment of the related authorization from the Polish financial regulator (KNF), the aforementioned transaction was carried out. As a result, the Group controlled approximately 75.2% of the post-merger entity and KBC controlled approximately 16.2%, with the remaining 8.6% being owned by non-controlling interests. This transaction gave rise to an increase of EUR 1,037 million in Non-controlling interests – EUR 169 million as a result of the acquisition of control of Kredyt Bank S.A. and EUR 868 million as a result of the reduction in the percentage of ownership of Bank Zachodni WBK S.A.
The detail of the provisional fair values of the identifiable assets acquired and liabilities assumed at the business combination date, the cost of the investment and the goodwill is as follows:
| Millions of euros | ||||
Cash and balances with central banks | 351 | |||
Loans and receivables - loans and advances to customers (*) | 6,767 | |||
Available-for-sale financial assets | 2,547 | |||
Other assets (**) | 692 | |||
Total assets | 10,357 | |||
Deposits from credit institutions | 1,414 | |||
Customer deposits | 7,620 | |||
Other liabilities | 642 | |||
Total liabilities | 9,676 | |||
Net assets | 681 | |||
Non-controlling interests | (169 | ) | ||
Cost of investment | 838 | |||
Goodwill at January 2013 (***) | 326 | |||
| (*) | EUR 122 million of additional impairment losses were considered in estimating the fair value of the loans and receivables. |
| (**) | The estimate identified intangible assets amounting to EUR 51 million. |
| (***) | Belongs to the Bank Zachodni WBK S.A. cash-generating unit (see Note 17). |
On March 22, 2013, Banco Santander, S.A. and KBC completed the placement of all the shares owned by KBC and 5.2% of the share capital of Bank Zachodni WBK S.A. held by the Group in the market for EUR 285 million, which gave rise to an increase of EUR 292 million in Non-controlling interests.
Following these transactions, the Group holds 70% of the share capital of Bank Zachodni WBK S.A. and the remaining 30% is held by non-controlling interests.
xii. Agreement to purchase Royal Bank of Scotland branch offices
In August 2010 Santander UK plc announced that it had entered into an agreement to acquire the portion of the banking business carried on by Royal Bank of Scotland (RBS) through its branches in England and Wales and the NatWest network in Scotland, as well as certain SME and corporate banking centres.centers.
On October 12, 2012, the Group announced that the agreement had become null and void due to the foreseeable breach of the terms and conditions thereof by the agreed deadline (February 2013).
xiii. Merger by absorption of Banesto and Banco Banif
On December 17, 2012, Banco Santander, S.A. announced that it had resolved to approve the plan for the merger by absorption of Banco Español de Crédito, S.A. (Banesto) and Banco Banif, S.A. (Sole-Shareholder Company) as part of the restructuring of the Spanish financial sector.
On January 9, 2013, the boards of directors of Banco Santander, S.A. and Banesto approved the common draft terms of merger. Also, on 28 January 2013, the boards of directors of Banco Santander, S.A. and Banco Banif, S.A. (Sole-Shareholder Company) approved the related common draft terms of merger. The acquisition is currentlydraft terms of merger were approved by the shareholders of Banco Santander, S.A. and Banesto at the annual general meetings held on March 22 and 21, respectively.
On April 29, 2013, pursuant to the common draft terms of merger and the resolutions of the shareholders at annual general meetings of the two companies, Banco Santander, S.A. announced the regime and procedure for the exchange of shares of Banesto for those of Banco Santander, S.A. Banco Santander, S.A. exchanged the Banesto shares for treasury shares at a ratio of 0.633 shares of Banco Santander, S.A., of EUR 0.5 par value each, for each share of Banesto, of EUR 0.79 par value each, without any additional cash payment. As a result of this exchange, Non-controlling interests fell by EUR 455 million.
On May 3, 2013, the public deed of the merger by absorption of Banesto, which was extinguished, was registered at the Cantabria Mercantile Registry. Also, on April 30, the public deed of the merger by absorption of Banco Banif S.A. (Sole-Shareholder Company) was executed, and this entity was extinguished. The public deed was registered at the Cantabria Mercantile Registry on May 7, 2013.
xiv. Insurance business in progressSpain
On December 20, 2012, the Group announced that it had reached an agreement with Aegon to strengthen the bancassurance business in Spain. The agreement does not affect savings, health and is expectedvehicle insurance, which continue to be completedmanaged by Banco Santander.
In June 2013, having received the relevant authorizations from the Directorate-General of Insurance and Pension Funds and from the European competition authorities, Aegon acquired a 51% ownership interest in the fourth quartertwo insurance companies created by the Group for these purposes, one for life insurance and the other for general insurance (currently Aegon Santander Vida Seguros y Reaseguros, S.A. and Aegon Santander Generales Seguros y Reaseguros, S.A.), for which it paid EUR 220 million, thereby gaining joint control together with the Group over the aforementioned companies. The agreement also includes payments to Aegon that are deferred over two years and amounts receivable for the Group that are deferred over five years, depending on the business plan.
The aforementioned agreement includes the execution of 2012, oncea distribution agreement for the necessary approvals have been obtained and certain other conditions have been met.
xx. Colombia
In December 2011sale of insurance products in Spain for 25 years through commercial networks, for which the Group will receive commissions at market rates.
This transaction gave rise to a gain of EUR 385 million recognized under Gains (losses) on disposal of assets not classified as non-current assets held for sale (EUR 270 million net of tax), of which EUR 186 million related to the fair value recognition of the 49% ownership interest retained by the Group.
xv. Agreement with Elavon Financial Services Limited
On October 19, 2012, Banco Santander, S.A. announced that it had entered into an agreement with Elavon Financial Services Limited to jointly develop the Chilean group Corpbanca forpayment services business in Spain through point-of-sale credit and debit card terminals at merchants.
This transaction involved the salecreation of its ownership interests ina joint venture, 51% owned by Elavon and 49% owned by Banco Santander, Colombia S.A. and otherto which Santander Group transferred its aforementioned payment services business subsidiaries in Colombia.Spain (excluding the former Banesto).
The sale is subject to the obtainment of the regulatory authorisations from the competent authorities and the delisting of the shares of Banco Santander Colombia S.A. This transaction is expected to bewas completed in the first half of 2012.2013 and generated a gain of EUR 122 million (EUR 85 million net of tax).
* * * * *xvi. Agreement with Warburg Pincus and General Atlantic
On May 30, 2013, the Group announced that it had entered into an agreement with subsidiaries of Warburg Pincus and General Atlantic to foster the global development of its asset management unit, Santander Asset Management (SAM). According to the terms and conditions of the agreement, Warburg Pincus and General Atlantic will together own 50% of the holding company created by the Group which will own the eleven management companies the Group has, mainly in Europe and Latin America, while the other 50% will be held by the Group.
The purpose of the alliance is to enable SAM to improve its ability to compete with the large independent international management companies, since the businesses to be strengthened include asset management in the global institutional market, with the additional advantage of having knowledge and experience in those markets in which the Group is present. The agreement also envisages the distribution of products managed by SAM in the countries in which the Group has a commercial network for a period of ten years, renewable for five additional two-year periods, for which the Group will receive commissions at market rates, thus benefiting from broadening the range of products and services to offer its customers. SAM will also distribute its products and services internationally, outside the Group’s commercial network.
Since the aforementioned management companies belonged to different Group companies, prior to the completion of the transaction a corporate restructuring took place whereby each of the management companies was sold, by its shareholders, for its fair value, to SAM Investment Holdings Limited (SAM), a holding company created by the Group. The aggregate value of the management companies was approximately EUR 1,700 million.
Subsequently, in December 2013, once the required authorizations had been received from the various regulators, the agreement was executed through the acquisition of a 50% ownership interest in SAM’s share capital by Sherbrooke Acquisition Corp SPC (an investee of Warburg Pincus and General Atlantic) for EUR 449 million. At that date, SAM had financing from third parties for EUR 845 million. The agreement includes deferred contingent amounts payable and receivable for the Group based on the achievement of the business plan targets over the coming five years.
Also, the Group entered into a shareholders agreement with these shareholders regulating, inter alia, the taking of strategic, financial, operational and other significant decisions regarding the ordinary management of SAM on a joint basis. Certain restrictions on the transferability of the shares were also agreed, and a commitment was made by the two parties to retain the restrictions for at least 18 months. Lastly, Sherbrooke Acquisition Corp SPC will be entitled to sell to the Group its ownership interest in the share capital of SAM at market value on the fifth and seventh anniversaries of the transaction, unless a public offering of SAM shares has taken place prior to those dates.
Following these transactions, at year-end the Group held a 50% ownership interest in SAM and controlled this company jointly with the aforementioned shareholders (see Note 13).
As a result of the aforementioned transaction, the Group recognized a gain of EUR 1,372 million under Gains (losses) on disposal of assets not classified as non-current assets held for sale in the consolidated income statement for 2013 (see Note 49), of which EUR 671 million related to the fair value of the 50% ownership interest retained by the Group.
xvii. Agreement with El Corte Inglés
On October 7, 2013, the Group announced that it had entered into a strategic agreement through its subsidiary Santander Consumer Finance, S.A. with El Corte Inglés, S.A. in the area of consumer finance, which includes the acquisition of 51% of the share capital of Financiera El Corte Inglés E.F.C., S.A., with El Corte Inglés, S.A. retaining the remaining 49%. Santander Consumer will pay approximately EUR 140 million for 51% of the share capital of Financiera El Corte Inglés E.F.C., S.A. Completion of this transaction was subject to, among other conditions, obtainment of the relevant regulatory and competition authorizations, which were obtained in the first quarter of 2014 (see note 1.h).
xviii. Agreement with Apollo
On November 21, 2013, the Group announced that it had reached a preliminary agreement with Apollo European Principal Finance Fund II, a fund managed by subsidiaries of Apollo Global Management, LLC, for the sale of the platform for managing the loan recovery activities of Banco Santander, S.A. in Spain and for managing and marketing the properties relating to this activity.
Following this transaction, the Group will retain the property assets and credit portfolio on its balance sheet, while management of these assets will be carried out from the platform owned by Apollo.
This agreement was completed in January 2014 (see Note 1.h).
The cost, total assets and grosstotal income of the other consolidated companies acquired and disposed of in the last three years were not material with respect to the related consolidated totals.
F-61
| c) | Off-shore entities |
The Group does not currently has 15have any subsidiaries resident in off-shore territories which are not considered tax havens according to the list published by the OECDOECD.
In accordance with Spanish legislation, the Group has 12 subsidiaries resident in December 2011.
At present 2off-shore territories. One of these subsidiaries areis currently in liquidation and, over the next few years, the liquidation of a further 4four more subsidiaries, all of which are scantly activesubstantially inactive or inactive, is expected to commence in 2012.expected.
Following the above-mentionedthese planned disposals, the Group willwould have a total of 9seven off-shore subsidiaries.subsidiaries pursuant to the criteria under Spanish legislation. These entities have 180152 employees, located mainly in Jersey and the Isle of Man, and are classified by activity as detailed below:
i. Operating subsidiaries engaging in banking or financial activities or in services:
| i. | Operating subsidiaries engaging in banking or financial activities or in services: |
Abbey National International Limited in Jersey, which engages mainly in remote banking for British customers, not resident in the UK, who are offered traditional savings products.
Alliance & Leicester International Limited, a bank located in the Isle of Man, which focuses on attracting funds through savings accounts and deposits.
ii. Scantly active, inactive or mere asset holding subsidiaries:
| ii. | Substantially inactive or inactive subsidiaries: |
Serfin International Bank and Trust, Limited (Cayman Islands), an inactive bank.
Whitewick Limited (Jersey), an inactive company.
iii. Issuing companies
| iii. | Issuing companies: |
The Group has fivethree issuing companies located in the following jurisdictions:
Issuers of preference shares:
Banesto Holdings, Ltd. (Guernsey)
Totta & Açores Financing, Limited (Cayman Islands)
Issuers of debt:
Santander Central Hispano Financial Services, Ltd. (Cayman Islands)
Santander Central Hispano International, Ltd. (Cayman Islands)
Santander Central Hispano Issuances, Ltd. (Cayman Islands)
The preference share and subordinated debt issues launched by the aforementioned issuers were authorized by the Bank of Spain or the Bank of Portugal as computable for eligible capital calculation purposes. Once the issues launched by these issuers have been redeemed, these entities will be liquidated.
The individual results of these subsidiaries, calculated in accordance with local accounting principles, are shown in the Appendices to these notes to the consolidated financial statements together with other data thereon.
It should be noted that the individual results include transactions performed with other Group companies, such as dividend collection, recognition and reversal of provisions and corporate restructuring results which, in accordance with accounting standards, are eliminated on consolidation in order to avoid the duplication of profit or the recognition of intra-Group results. Individual results also include the profit attributable to the holders of preference shares. Therefore, they are not representative of the Group’s operations in these countries or of the results contributed to Santanderthe Group.
F-62
The banks and companies, whose activities are detailed above, contributed a profit of approximately EUR 2324 million to the Group’s consolidated profit in 2011.2013.
Additionally,Also, the Group has four branches,five branches: three located in the Cayman Islands, and one in the Isle of Man (disposal of this last-mentioned branch is scheduled to beginand one in 2012).Jersey. These branches report to, and consolidate their balance sheets and income statements with, their respective foreign parents.
Spain is expected towill foreseeably enter into an information exchange agreementagreements with the Cayman Islands, as a result of which this country will cease to have the status of a tax haven for the purposes of Spanish legislation. Once this agreement becomes effective, the Group will have four subsidiaries resident for tax purposes in off-shore territories, namely the Isle of Man, Jersey and Guernsey. Although it is possible that agreements will alsoGuernsey and, accordingly, these territories would cease to be entered into with these last-mentioned jurisdictions, ittax havens under Spanish law and, consequently, the Group would no longer have any entities in off-shore territories. It should be noted that, according to the list published by the OECD, none of these three jurisdictions is considered a tax haven.
Also, the Group controls from Brazil a securitization special-purpose vehicle in the Cayman Islands,company called Brazil Foreign Diversified Payment Rights Finance Company and it manages a segregated portfolio company called Santander Brazil Global Investment Fund SPC in the Cayman Islands, and manages from the UK a protected cell company in Guernsey called Guaranteed Investment Product 1 PCC Ltd. Additionally, the Group has, directly or indirectly, various financial investments located in tax havens including, inter alia, Asiabridge Fund I LLC in Mauritius, The HSH Coinvest (Cayman) Trust B in the Cayman Islands, Olivant Limited in Guernsey and JC Flowers III in the Cayman Islands.
Singapore and Hong Kong, where the Group has one subsidiary and two branches, are no longer considered off-shore centers from January and April 2013, respectively, following the application of the provisions contained in the international double taxation conventions signed with Spain in 2011.
The Group also has five subsidiaries domiciled in off-shore territories that are not considered to be off-shore entities since they are resident for tax purposes in, and operate exclusively from, the UK.
The Group also has six subsidiaries and one branch located in the Bahamas (three of which engage in banking activities) and it has financial investments in this country, which ceased to be considered a tax haven for the purposes of Spanish legislation as a result of the entry into force in August 2011 of the information exchange agreement entered into between the Kingdom of Spain and the Commonwealth of The Bahamas. These subsidiaries contributed a profit of approximately EUR 146 million to the Group’s consolidated profit in 2011.
Also, in July 2011 the Spain-Panama international tax treaty came into force. The Group has a subsidiary in Panama that conducts a scant banking activity.
Lastly, Singapore and Hong Kong, where the Group has one subsidiary and two branches, ceased to be considered off-shore centres following the international tax treaties entered into with Spain in 2011.
* * * * *
The Group has established the proper procedures and controls (risk management, supervision, verification and review plans and periodic reports) to prevent reputational and legal risk arising at these entities. Also, the Group has continued to implement its policy to reduce the number of off-shore units. The financial statements of the Group’s off-shore units are audited by member firms of Deloitte.
F-63
| 4. | Distribution of the Bank’s profit, Shareholder remuneration scheme and Earnings per share |
| a) | Distribution of the Bank’s profit and |
The distribution of the Bank’s net profit for 20112013 that the board of directors will propose for approval by the shareholders at the annual general meeting is as follows:
| Millions of | ||||||
| ||||||
Of which: | ||||||
Distributed at December 31, | ||||||
Third interim dividend Final dividend for |
| 235 236 | ||||
| ||||||
To voluntary reserves | ||||||
|
| |||||
Net profit for the year | ||||||
|
| |||||
| (*) | Recognized under Shareholders’ |
| (**) | Assuming a percentage of cash requests of 13.6%. If the amount used to acquire rights from shareholders |
In addition to the EUR 1,837877 million indicated above, EUR 1,6954,400 million in shares (including those expected to be requested as remuneration equivalent to the third interim dividend) were allocated to the remuneration of shareholders under the shareholder remuneration scheme (Santander Dividendo Elección) approved by the shareholders at the annual general meeting held on June 17, 2011,March 22, 2013, whereby the Bank offered shareholders the possibility to opt to receive an amount equivalent to the first, second and third interim dividends out of 20112013 profit in cash or new shares. For these purposes,
Similarly, within the executive committee of Banco Santander resolved, at its meeting held on November 2, 2011, and it is expected that on January 31, 2012 it will resolve, on expiryframework of the acceptance periodshareholder remuneration scheme (Santander Dividendo Elección) the implementation of which will be submitted for the Santander Dividendo Elección programme for the third interim dividend, to carry out capital increases with a charge to voluntary reserves arising from unappropriated profits as approvedapproval by the shareholders at the annual general meeting, the Bank will offer shareholders the possibility of June 17, 2011 (see Note 31).
Similarly, on December 19, 2011, the board of directors resolvedopting to propose to the shareholders at the Bank’s general meeting to be held in March 2012 that they adopt a resolution to increase capital in order to offer the option of receivingreceive an amount equivalent to the final dividend for 20112013 in cash or innew shares. The Bank’s directors consider that 86%86.4% of shareholders will request remuneration in shares and, therefore, it is anticipated that the shareholders will be paid approximately EUR 267 million in cash and EUR 1,7281,498 million in shares.
F-64
The provisional accounting statements prepared by the Bank pursuant to legal requirements evidencing the existence of sufficient funds for the distribution of the interim dividends were as follows:
| Millions of euros | ||||||||||||||||
| 05/31/11 | 09/30/11 | 12/31/11 | 12/31/11 | |||||||||||||
| First | Second | Third (*) | Fourth (*) | |||||||||||||
Profit after tax | 1,256 | 1,625 | 2,151 | 2,151 | ||||||||||||
Dividends paid | — | (1,141 | ) | (1,428 | ) | (1,570 | ) | |||||||||
|
|
|
|
|
|
|
| |||||||||
| 1,256 | 484 | 723 | 581 | |||||||||||||
|
|
|
|
|
|
|
| |||||||||
Interim dividends in cash and amount relating to the acquisition, with a waiver of exercise, of bonus share rights from shareholders under the Santander Dividendo Elección programme | 1,141 | 287 | 142 | (**) | 267 | (**) | ||||||||||
|
|
|
|
|
|
|
| |||||||||
Cumulative amount | 1,141 | 1,428 | 1,570 | 1,837 | ||||||||||||
|
|
|
|
|
|
|
| |||||||||
Date of payment | 01/08/11 | 01/11/11 | 01/02/12 | 01/05/12 | ||||||||||||
|
|
|
|
|
|
|
| |||||||||
The board of directors will propose to the shareholders at the annual general meeting that remuneration of approximately EUR 0.60 per share be paid for 2011.2013.
| b) | Earnings per share from continuing and discontinued operations |
i. Basic earnings per share
| i. | Basic earnings per share |
Basic earnings per share are calculated by dividing the net profit attributable to the Group by the weighted average number of ordinary shares outstanding during the year, excluding the average number of treasury shares held in the year.
Accordingly:
| 12/31/11 | 12/31/10 | 12/31/09 | ||||||||||
Profit attributable to the Group (millions of euros) | 5,351 | 8,181 | 8,942 | |||||||||
Profit (Loss) from discontinued operations (net of non-controlling interests) (millions of euros) | (24 | ) | (27 | ) | 27 | |||||||
Profit from continuing operations (net of non-controlling interests) (millions of euros) | 5,375 | 8,208 | 8,915 | |||||||||
Weighted average number of shares outstanding | 8,408,973,592 | 8,210,983,846 | 8,075,814,950 | |||||||||
Assumed conversion of convertible debt | 483,059,180 | 475,538,339 | 478,409,443 | |||||||||
|
|
|
|
|
| |||||||
Adjusted number of shares | 8,892,032,772 | 8,686,522,185 | 8,554,224,393 | |||||||||
|
|
|
|
|
| |||||||
Basic earnings per share (euros) | 0.60 | 0.94 | 1.04 | |||||||||
|
|
|
|
|
| |||||||
Basic earnings per share from discontinued operations (euros) | (0.00 | ) | (0.00 | ) | 0.00 | |||||||
|
|
|
|
|
| |||||||
Basic earnings per share from continuing operations (euros) | 0.60 | 0.94 | 1.04 | |||||||||
|
|
|
|
|
| |||||||
| 12/31/13 | 12/31/12 | 12/31/11 | ||||||||||
Profit attributable to the Group (millions of euros) | 4,370 | 2,295 | 5,330 | |||||||||
Profit (Loss) from discontinued operations (net of non-controlling interests) (millions of euros) | (15 | ) | 70 | 15 | ||||||||
Profit from continuing operations (net of non-controlling interests) (millions of euros) | 4,385 | 2,225 | 5,315 | |||||||||
Weighted average number of shares outstanding | 10,836,110,583 | 9,451,734,994 | 8,408,973,592 | |||||||||
Assumed conversion of convertible debt | — | 314,953,901 | 483,059,180 | |||||||||
|
|
|
|
|
| |||||||
Adjusted number of shares | 10,836,110,583 | 9,766,688,895 | 8,892,032,772 | |||||||||
|
|
|
|
|
| |||||||
Basic earnings per share (euros) | 0.40 | 0.23 | 0.60 | |||||||||
|
|
|
|
|
| |||||||
Basic earnings per share from discontinued operations (euros) | (0.00 | ) | 0.01 | 0.00 | ||||||||
|
|
|
|
|
| |||||||
Basic earnings per share from continuing operations (euros) | 0.40 | 0.22 | 0.60 | |||||||||
|
|
|
|
|
| |||||||
F-65
ii. Diluted earnings per share
| ii. | Diluted earnings per share |
In calculating diluted earnings per share, the amount of profit attributable to ordinary shareholders and the weighted average number of shares outstanding, net of treasury shares, are adjusted to take into account all the dilutive effects inherent to potential ordinary shares (share options).shares.
Accordingly, diluted earnings per share were determined as follows:
| 12/31/13 | 12/31/12 | 12/31/11 | ||||||||||||||||||||||
| 12/31/11 | 12/31/10 | 12/31/09 | ||||||||||||||||||||||
Profit attributable to the Group (millions of euros) | 5,351 | 8,181 | 8,942 | 4,370 | 2,295 | 5,330 | ||||||||||||||||||
Profit (Loss) from discontinued operations (net of non-controlling interests) (millions of euros) | (24 | ) | (27 | ) | 27 | (15 | ) | 70 | 15 | |||||||||||||||
Profit from continuing operations (net of non-controlling interests) (millions of euros) | 5,375 | 8,208 | 8,915 | 4,385 | 2,225 | 5,315 | ||||||||||||||||||
Dilutive effect of changes in profit for the year arising from potential conversion of ordinary shares | — | — | — | — | — | — | ||||||||||||||||||
Weighted average number of shares outstanding | 8,408,973,592 | 8,210,983,846 | 8,075,814,950 | 10,836,110,583 | 9,451,734,994 | 8,408,973,592 | ||||||||||||||||||
Assumed conversion of convertible debt | 483,059,180 | 475,538,339 | 478,409,443 | — | 314,953,901 | 483,059,180 | ||||||||||||||||||
Dilutive effect of options/rights on shares | 64,715,094 | 57,607,691 | 59,108,134 | 51,722,251 | 66,057,677 | 64,715,094 | ||||||||||||||||||
|
|
|
|
|
| |||||||||||||||||||
Adjusted number of shares | 8,956,747,866 | 8,744,129,876 | 8,613,332,527 | 10,887,832,834 | 9,832,746,572 | 8,956,747,866 | ||||||||||||||||||
|
|
|
|
|
| |||||||||||||||||||
Diluted earnings per share (euros) | 0.60 | 0.94 | 1.04 | 0.40 | 0.23 | 0.60 | ||||||||||||||||||
|
|
|
|
|
| |||||||||||||||||||
Diluted earnings per share from discontinued operations (euros) | (0.00 | ) | (0.00 | ) | 0.00 | (0.00 | ) | 0.01 | 0.00 | |||||||||||||||
|
|
|
|
|
| |||||||||||||||||||
Diluted earnings per share from continuing operations (euros) | 0.60 | 0.94 | 1.04 | 0.40 | 0.22 | 0.60 | ||||||||||||||||||
|
|
|
|
|
| |||||||||||||||||||
| 5. | Remuneration and other benefits paid to the Bank’s directors and senior managers |
| a) | Remuneration of directors |
i. Bylaw-stipulated directors’ emoluments and attendance fees
| i. | Bylaw-stipulated emoluments |
Article 58 of the Bank’s current Bylaws approved by the shareholders at the annual general meeting held on June 21, 2008 providesestablished that the share in the Bank’s profit for each year that the directors will be entitled to receive for discharging their duties as members of the board of directors -annual emolument and attendance fees- will be equal to 1% of the Bank’s net profit for the year. However,year, although the board of directorsitself may resolve to reduce this percentage.
The amount set by the board of directors for 2011,2012, which was calculated pursuant to the aforementioned Article 58 of the Bylaws, was 0.275%0.321% of the Bank’s profit for 2011 (2010: 0.183% in like-for-like terms).2012.
At the proposal of the appointments and remuneration committee, the directors at the boardThe annual general meeting held on December 19, 2011 resolvedMarch 22, 2013 approved an amendment to the Bylaws, whereby the remuneration of directors in their capacity as board members now consists of an annual fixed amount determined by the shareholders at the annual general meeting. This amount shall remain in effect unless the shareholders resolve to change it at a general meeting. However, the board of directors may elect to reduce the amount in any years in which it deems such action justified. The remuneration established for 2013 by the annual general meeting was EUR 6 million, with two components: (a) an annual emolument and (b) attendance fees.
The specific amount payable for 2011 by 6% with respectthe above-mentioned items to the amounts paid outeach of the profits for 2010.directors is determined by the board of directors. For such purpose, it takes into consideration the positions held by each director on the board, their attendance of board meetings, their membership of the various committees and their attendance of committee meetings.
The total bylaw-stipulated emoluments earned by the directors in 2013 amounted to EUR 4.3 million.
Annual emolument
F-66
Hence, theThe amounts received individually by each board member in 20112013 and 20102012 based on the positions held by them on the board and their membership of the board committees were as follows:
| Euros | ||||||||
| 2011 | 2010 | |||||||
Members of the board of directors | 99,946 | 106,326 | ||||||
Members of the executive committee | 200,451 | 213,246 | ||||||
Members of the audit and compliance committee | 46,530 | 49,500 | ||||||
Members of the appointments and remuneration committee | 27,918 | 29,700 | ||||||
First and fourth deputy chairmen | 33,502 | 35,640 | ||||||
| Euros | ||||
| 2013-2012 | ||||
Members of the board of directors | 84,954 | |||
Members of the executive committee | 170,383 | |||
Members of the audit and compliance committee | 39,551 | |||
Members of the appointments and remuneration committee | 23,730 | |||
First and fourth deputy chairmen (1) | 28,477 | |||
Furthermore,
| (1) | In 2013 the total amount of EUR 28,477 was paid to the current third deputy chairman and the former fourth deputy chairman, in proportion to the time during which each held office in the year. |
Attendance fees
The directors receive fees for attending board and committee meetings, excluding executive committee meetings, since no attendance fees are received for this committee.
The amounts of the fees for attending the meetingsBy resolution of the board of directors, and of the board committees (excluding the executive committee) were the same in 2011 as in 2010, in accordance withat the proposal made byof the appointments and remuneration committee, at its meeting on December 14, 2010the fees for attending board and approved by the directorscommittee meetings -excluding executive committee meetings, for which no attendance fees have been established- have remained unchanged since 2008 and will be maintained at the board meeting on December 20, 2010. These attendance fees were approved by the directors at the board meeting held on December 17, 2007 in the following amounts:same amounts as from January 1, 2014.
Attendance fees per meeting | Euros | |||
| 2008-2013 | ||||
Board of directors | ||||
Resident directors | 2,540 | |||
Non-resident directors | 2,057 | |||
Risk committee and audit and compliance committee | ||||
Resident directors | 1,650 | |||
Non-resident directors | 1,335 | |||
All other committees | ||||
Resident directors | 1,270 | |||
Non-resident directors | 1,028 | |||
Board of directors: EUR 2,540
| ii. | Salaries |
The executive directors’ gross annual salary for resident directors2013 and EUR 2,057 for non-resident directors.2012 was as follows:
Risk committee and audit and compliance committee: EUR 1,650 for resident directors and EUR 1,335 for non-resident directors.
| Thousands of euros | ||||||||
| 2013 | 2012 | |||||||
Mr Emilio Botín-Sanz de Sautuola y García de los Ríos | 1,344 | 1,344 | ||||||
Mr Javier Marín Romano(1) | 2,000 | — | ||||||
Mr Matías Rodríguez Inciarte | 1,710 | 1,710 | ||||||
Ms Ana Patricia Botín-Sanz de Sautuola y O’Shea(2) | 2,005 | 2,100 | ||||||
Mr Juan Rodríguez Inciarte | 987 | 987 | ||||||
Mr Alfredo Sáenz Abad(3) | — | 3,703 | ||||||
|
|
|
| |||||
Total | 8,046 | 9,844 | ||||||
|
|
|
| |||||
Other committees: EUR 1,270 for resident directors and EUR 1,028 for non-resident directors.
ii. Salaries
| (1) | Annualized amount of the chief executive officer’s salary. However, the amount actually received in 2013 was EUR 1,600,000, which is the sum of his remuneration as executive vice president of the Bank for the first four months of the year and his remuneration as chief executive officer for the remaining eight. |
| (2) | The gross annual salary for 2011 was revised in the case of Ms Ana Patricia Botín-Sanz de Sautuola y O’Shea to reflect the assumption of new responsibilities as chief executive officer of Santander UK and was established at EUR 2 million which, at the exchange rate published by the Bank of Spain on the business day prior to December 20, 2010 -the date on which the current fixed salary remuneration of the aforementioned executive director was approved by the board of directors-, amounted to GBP 1,702 thousand. The euro amounts shown in the above table are the equivalent values calculated by applying the average exchange rates for those years to her remuneration in pounds sterling. |
| (3) | Retired from the board on April 29, 2013. The gross salary received until that date is shown, together with his other remuneration, in section iii) below. |
The fixed salarymaximum variable remuneration of the executive directors for 20112013 and 20102012 approved by the board at the proposal of the appointments and remuneration committee was as follows:
| Thousands of euros | ||||||||
| 2011 | 2010 | |||||||
Mr. Emilio Botín-Sanz de Sautuola y García de los Ríos | 1,344 | 1,344 | ||||||
Mr. Alfredo Sáenz Abad | 3,703 | 3,703 | ||||||
Mr. Matías Rodríguez Inciarte | 1,710 | 1,710 | ||||||
Ms. Ana Patricia Botín-Sanz de Sautuola y O’Shea | 1,962 | 1,353 | ||||||
Mr. Francisco Luzón López (*) | 1,656 | 1,656 | ||||||
Mr. Juan Rodríguez Inciarte | 987 | 987 | ||||||
|
|
|
| |||||
Total | 11,362 | 10,753 | ||||||
|
|
|
| |||||
| Thousands of euros | ||||||||
| 2013 | 2012 | |||||||
Mr Emilio Botín-Sanz de Sautuola y García de los Ríos | 1,412 | 1,412 | ||||||
Mr Javier Marín Romano(1) | 2,500 | — | ||||||
Mr Matías Rodríguez Inciarte | 2,308 | 2,669 | ||||||
Ms Ana Patricia Botín-Sanz de Sautuola y O’Shea(2) | 2,212 | 2,247 | ||||||
Mr Juan Rodríguez Inciarte | 1,480 | 1,557 | ||||||
Mr Alfredo Sáenz Abad | — | 3,510 | ||||||
|
|
|
| |||||
Total | 9,912 | 11,395 | ||||||
|
|
|
| |||||
F-67
The maximum variable remuneration of the executive directors for 2011 and 2010 approved by the board at the proposal of the appointments and remuneration committee was as follows:
| Thousands of euros | ||||||||
| 2011 | 2010 | |||||||
Mr. Emilio Botín-Sanz de Sautuola y García de los Ríos | 2,825 | 3,263 | ||||||
Mr. Alfredo Sáenz Abad | 7,019 | 8,107 | ||||||
Mr. Matías Rodríguez Inciarte | 3,568 | 4,122 | ||||||
Ms. Ana Patricia Botín-Sanz de Sautuola y O’Shea (*) | 2,667 | 3,871 | ||||||
Mr. Francisco Luzón López | 3,717 | 4,294 | ||||||
Mr. Juan Rodríguez Inciarte | 2,082 | 2,405 | ||||||
|
|
|
| |||||
Total | 21,879 | 26,062 | ||||||
|
|
|
| |||||
| (2) | Equivalent euro value of the |
The second and third cycles of the deferred conditional variable remuneration plan were approved in 2012 and 2013 under the same payment terms as the first cycle of the plan (see Note 5.e), whereby payment of a portion of the variable remuneration for these years is deferred over three years for it to be paid, where appropriate, in three equal portions, 50% in cash and 50% in Santander shares, provided that the conditions for entitlement to the remuneration are met. Similarly, the portion of the variable remuneration that is not deferred (immediate payment) is paid 50% in cash and 50% in shares.
The amounts shown in the foregoing table reflect the maximum total variable remuneration allocated to the executive directors for each year. These amounts include both the cash-based and share-based variable remuneration (according to the plans agreed in each year) and both the remuneration payable immediately and that which, as the case may be, is payable following a deferral period.
In recent years the Group has adapted its remuneration policy to the new requirements and best practices, increasing the variable remuneration to be deferred and paid in shares, rather than in cash. The following table shows a breakdownthe form of payment of the variable remuneration:remuneration for 2012 and 2013:
| Thousands of euros | ||||||||||||||||
| 2011 (1) | 2010 (2) | |||||||||||||||
| Immediate payment | Deferred payment | Immediate payment | Deferred payment | |||||||||||||
Mr. Emilio Botín-Sanz de Sautuola y García de los Ríos | 1,130 | 1,695 | 1,682 | 1,581 | ||||||||||||
Mr. Alfredo Sáenz Abad | 2,808 | 4,212 | 3,351 | 4,756 | ||||||||||||
Mr. Matías Rodríguez Inciarte | 1,427 | 2,141 | 1,994 | 2,128 | ||||||||||||
Ms. Ana Patricia Botín-Sanz de Sautuola y O’Shea | 1,067 | 1,600 | 1,980 | (3) | 1,891 | (3) | ||||||||||
Mr. Francisco Luzón López | 1,487 | 2,230 | 2,146 | 2,148 | ||||||||||||
Mr. Juan Rodríguez Inciarte | 833 | 1,249 | 1,304 | 1,101 | ||||||||||||
|
|
|
|
|
|
|
| |||||||||
Total | 8,752 | 13,127 | 12,457 | 13,605 | ||||||||||||
|
|
|
|
|
|
|
| |||||||||
| Thousands of euros | ||||||||||||||||||||||||||||||||
| 2013 | 2012 | |||||||||||||||||||||||||||||||
| Immediate payment in cash (20%) | Immediate payment in shares (20%) | Deferred payment in cash (30%)(1) | Deferred payment in shares (30%)(1) | Immediate payment in cash (20%) | Immediate payment in shares (20%) | Deferred payment in cash (30%)(2) | Deferred payment in shares (30%)(2) | |||||||||||||||||||||||||
Mr Emilio Botín-Sanz de Sautuola y García de los Ríos | 282 | 282 | 424 | 424 | 282 | 282 | 424 | 424 | ||||||||||||||||||||||||
Mr Javier Marín Romano | 500 | 500 | 750 | 750 | — | — �� | — | — | ||||||||||||||||||||||||
Mr Matías Rodríguez Inciarte | 462 | 462 | 692 | 692 | 534 | 534 | 801 | 801 | ||||||||||||||||||||||||
Ms Ana Patricia Botín-Sanz de Sautuola y O’Shea(3) | 442 | 442 | 664 | 664 | 449 | 449 | 674 | 674 | ||||||||||||||||||||||||
Mr Juan Rodríguez Inciarte | 296 | 296 | 444 | 444 | 311 | 311 | 467 | 467 | ||||||||||||||||||||||||
Mr Alfredo Sáenz Abad | — | — | — | — | 702 | 702 | 1,053 | 1,053 | ||||||||||||||||||||||||
|
|
|
|
|
|
|
|
|
|
|
|
|
|
|
| |||||||||||||||||
Total | 1,982 | 1,982 | 2,974 | 2,974 | 2,278 | 2,278 | 3,419 | 3,419 | ||||||||||||||||||||||||
|
|
|
|
|
|
|
|
|
|
|
|
|
|
|
| |||||||||||||||||
| (1) |
| (2) |
| (3) |
The amounts of immediate and deferred payments in shares shown in the table above correspond to the following numbers of shares:
| Number of shares | ||||||||||||||||||||||||
| 2013 | 2012 | |||||||||||||||||||||||
| Immediate payment | Deferred payment (1) | Total | Immediate payment | Deferred payment (2) | Total | |||||||||||||||||||
Mr Emilio Botín-Sanz de Sautuola y García de los Ríos | 42,287 | 63,431 | 105,718 | 43,952 | 65,927 | 109,879 | ||||||||||||||||||
Mr Javier Marín Romano | 74,850 | 112,275 | 187,125 | — | — | — | ||||||||||||||||||
Mr Matías Rodríguez Inciarte | 69,092 | 103,639 | 172,731 | 83,059 | 124,589 | 207,648 | ||||||||||||||||||
Ms Ana Patricia Botín-Sanz de Sautuola y O’Shea | 66,241 | 99,362 | 165,603 | 69,916 | 104,874 | 174,790 | ||||||||||||||||||
Mr Juan Rodríguez Inciarte | 44,299 | 66,448 | 110,747 | 48,466 | 72,699 | 121,165 | ||||||||||||||||||
Mr Alfredo Sáenz Abad | — | — | — | 109,211 | 163,817 | 273,028 | ||||||||||||||||||
|
|
|
|
|
|
|
|
|
|
|
| |||||||||||||
Total | 296,769 | 445,155 | 741,924 | 354,604 | 531,906 | 886,510 | ||||||||||||||||||
|
|
|
|
|
|
|
|
|
|
|
| |||||||||||||
| (1) | In 3 years: 2015, 2016 and 2017 subject to continued service, with the |
| (2) | In 3 years: 2014, 2015 and 2016 subject to |
F-68
The amounts relating to the variable share-based remuneration reflect the equivalent value, at the agreement date, of the maximum number of shares that may be received by the directors for their participation in the various plans. The number of shares that each director will actually receive on expiry of each plan will depend on the director’s compliance with the conditions for entitlement thereto (see Note 5.e).
iii. Detail by director
| iii. | Detail by director |
The detail, by Bank director, of the foregoing remuneration for 20112013 is provided below. The salaries of the executive directors disclosed in the table below relatecorrespond to the maximum amounts for each item approved by the board of directors as period remuneration, regardlessirrespective of the actual year of payment and of any amounts paid to the directors under the agreed deferred remuneration scheme. Note 5.e) below includes disclosures on the shares delivered by virtue of the deferred remuneration schemes in place in previous years the conditions for delivery of which were met in the relatedcorresponding years.
F-69
| Thousands of euros | ||||||||||||||||||||||||||||||||||||||||||||||||||||||||||||
Directors | 2011 | 2010 | ||||||||||||||||||||||||||||||||||||||||||||||||||||||||||
| Bylaw-stipulated emoluments | Salaries of executive directors | Other remuneration (b) | Total | Total | ||||||||||||||||||||||||||||||||||||||||||||||||||||||||
| Annual emolument | Attendance fees | |||||||||||||||||||||||||||||||||||||||||||||||||||||||||||
| Board | Executive Committee | Audit and compliance committee | Appointments and remuneration committee | Board | Other fees | Fixed remuneration | Variable - Immediate payment | Variable - Deferred payment (a) | Total | |||||||||||||||||||||||||||||||||||||||||||||||||||
| In cash | In shares | In cash | In shares | |||||||||||||||||||||||||||||||||||||||||||||||||||||||||
Mr. Emilio Botín-Sanz de Sautuola y García de los Ríos | 100 | 200 | — | — | 30 | 4 | 1,344 | 565 | 565 | 847 | 847 | 4,168 | 1 | 4,505 | 4,959 | |||||||||||||||||||||||||||||||||||||||||||||
Mr. Fernando de Asúa Álvarez | 133 | 200 | 47 | 28 | 30 | 186 | — | — | — | — | — | — | — | 625 | 654 | |||||||||||||||||||||||||||||||||||||||||||||
Mr. Alfredo Sáenz Abad | 100 | 200 | — | — | 30 | 4 | 3,703 | 1,404 | 1,404 | 2,106 | 2,106 | 10,723 | 548 | 11,604 | 12,635 | |||||||||||||||||||||||||||||||||||||||||||||
Mr. Matías Rodríguez Inciarte | 100 | 200 | — | — | 33 | 163 | 1,710 | 714 | 714 | 1,071 | 1,071 | 5,280 | 239 | 6,015 | 6,569 | |||||||||||||||||||||||||||||||||||||||||||||
Mr. Manuel Soto Serrano | 133 | — | 47 | 28 | 30 | 36 | — | — | — | — | — | — | — | 274 | 279 | |||||||||||||||||||||||||||||||||||||||||||||
Assicurazioni Generali, SpA.(1) | 96 | — | — | — | 12 | — | — | — | — | — | — | — | — | 108 | 139 | |||||||||||||||||||||||||||||||||||||||||||||
Mr. Antonio Basagoiti García-Tuñón | 100 | 200 | — | — | 33 | 158 | — | — | — | — | — | — | 7 | 498 | 510 | |||||||||||||||||||||||||||||||||||||||||||||
Ms. Ana Patricia Botín-Sanz de Sautuola y O’Shea | 100 | 200 | — | — | 28 | 1 | 1,962 | 534 | 534 | 800 | 800 | 4,630 | 51 | 5,010 | 5,592 | (c) | ||||||||||||||||||||||||||||||||||||||||||||
Mr. Francisco Javier Botín-Sanz de Sautuola y O’Shea (2) | 100 | — | — | — | 30 | — | — | — | — | — | — | — | — | 130 | 131 | |||||||||||||||||||||||||||||||||||||||||||||
Lord Burns (Terence) | 100 | — | — | — | 19 | — | — | — | — | — | — | — | — | 119 | 125 | |||||||||||||||||||||||||||||||||||||||||||||
Mr. Vittorio Corbo Lioi (3) | 45 | — | — | — | 8 | — | — | — | — | — | — | — | — | 53 | — | |||||||||||||||||||||||||||||||||||||||||||||
Mr. Guillermo de la Dehesa Romero | 100 | 200 | — | 28 | 33 | 15 | — | — | — | — | — | — | — | 377 | 390 | |||||||||||||||||||||||||||||||||||||||||||||
Mr. Rodrigo Echenique Gordillo (4) | 100 | 200 | 47 | 28 | 33 | 35 | — | — | — | — | — | — | 37 | 480 | 423 | |||||||||||||||||||||||||||||||||||||||||||||
Mr. Antonio Escámez Torres | 100 | 200 | — | — | 33 | 154 | — | — | — | — | — | — | 41 | 528 | 530 | |||||||||||||||||||||||||||||||||||||||||||||
Mr. Ángel Jado Becerro de Bengoa (5) | 100 | — | — | — | 33 | — | — | — | — | — | — | — | — | 133 | 72 | |||||||||||||||||||||||||||||||||||||||||||||
Mr. Francisco Luzón López (6) | 100 | 200 | — | — | 30 | 1 | 1,656 | 743 | 743 | 1,115 | 1,115 | 5,372 | 1,089 | 6,792 | 7,297 | |||||||||||||||||||||||||||||||||||||||||||||
Mr. Abel Matutes Juan | 100 | — | 47 | — | 30 | 21 | — | — | — | — | — | — | — | 198 | 197 | |||||||||||||||||||||||||||||||||||||||||||||
Mr. Juan Rodríguez Inciarte | 100 | — | — | — | 28 | 96 | 987 | 416 | 416 | 625 | 625 | 3,069 | 120 | 3,413 | 3,759 | |||||||||||||||||||||||||||||||||||||||||||||
Mr. Luis Ángel Rojo Duque (7) | 39 | — | 18 | 11 | 8 | 9 | — | — | — | — | — | — | — | 85 | 215 | |||||||||||||||||||||||||||||||||||||||||||||
Mr. Luis Alberto Salazar-Simpson Bos | 100 | — | 47 | — | 30 | 21 | — | — | — | — | — | — | — | 198 | 200 | |||||||||||||||||||||||||||||||||||||||||||||
Ms. Isabel Tocino Biscarolasaga (8) | 100 | — | — | 13 | 30 | 5 | — | — | — | — | — | — | — | 148 | 134 | |||||||||||||||||||||||||||||||||||||||||||||
|
|
|
|
|
|
|
|
|
|
|
|
|
|
|
|
|
|
|
|
|
|
|
|
|
|
|
|
|
| |||||||||||||||||||||||||||||||
Total 2011 | 2,046 | 2,005 | 251 | 135 | 575 | 909 | 11,362 | 4,376 | 4,376 | 6,564 | 6,564 | 33,242 | 2,133 | 41,293 | — | |||||||||||||||||||||||||||||||||||||||||||||
|
|
|
|
|
|
|
|
|
|
|
|
|
|
|
|
|
|
|
|
|
|
|
|
|
|
|
|
|
| |||||||||||||||||||||||||||||||
Total 2010 | 2,168 | 2,132 | 248 | 149 | 482 | 904 | 10,753 | 12,457 | — | — | 13,605 | 36,815 | 1,912 | — | 44,810 | |||||||||||||||||||||||||||||||||||||||||||||
|
|
|
|
|
|
|
|
|
|
|
|
|
|
|
|
|
|
|
|
|
|
|
|
|
|
|
|
|
| |||||||||||||||||||||||||||||||
Directors | Thousands of euros | Change (%) | ||||||||||||||||||||||||||||||||||||||||||||||||||||||||||||||
| 2013 | 2012 | |||||||||||||||||||||||||||||||||||||||||||||||||||||||||||||||
| Bylaw-stipulated emoluments | Executive director salary remuneration | Other remuneration (b) | Total | Total (c) | ||||||||||||||||||||||||||||||||||||||||||||||||||||||||||||
| Annual emolument | Attendance fees | |||||||||||||||||||||||||||||||||||||||||||||||||||||||||||||||
| Board | Executive committee | Audit and compliance committee | Appointments and remuneration committee | Board | Other fees | |||||||||||||||||||||||||||||||||||||||||||||||||||||||||||
| Fixed | Variable - immediate payment | Variable - deferred payment (a) | ||||||||||||||||||||||||||||||||||||||||||||||||||||||||||||||
| In cash | In shares | In cash | In shares | Total | ||||||||||||||||||||||||||||||||||||||||||||||||||||||||||||
Mr Emilio Botín-Sanz de Sautuola y García de los Ríos | 85 | 170 | — | — | 33 | 5 | 1,344 | 282 | 282 | 424 | 424 | 2,757 | 1 | 3,051 | 3,061 | (0.3 | %) | |||||||||||||||||||||||||||||||||||||||||||||||
Mr Javier Marín Romano (1) | 57 | 115 | — | — | 15 | 3 | 1,600 | 500 | 500 | 750 | 750 | 4,100 | 51 | 4,341 | — | — | ||||||||||||||||||||||||||||||||||||||||||||||||
Mr Fernando de Asúa Álvarez | 113 | 170 | 40 | 24 | 33 | 199 | — | — | — | — | — | — | — | 579 | 567 | 2.1 | % | |||||||||||||||||||||||||||||||||||||||||||||||
Mr Matías Rodríguez Inciarte | 85 | 170 | — | — | 30 | 160 | 1,710 | 462 | 462 | 692 | 692 | 4,018 | 265 | 4,729 | 5,154 | (8.2 | %) | |||||||||||||||||||||||||||||||||||||||||||||||
Mr Guillermo de la Dehesa Romero (2) | 104 | 170 | 27 | 24 | 33 | 36 | — | — | — | — | — | — | — | 394 | 320 | 23.3 | % | |||||||||||||||||||||||||||||||||||||||||||||||
Ms Ana Patricia Botín-Sanz de Sautuola y O’Shea | 85 | 170 | — | — | 25 | 4 | 2,005 | 442 | 442 | 664 | 664 | 4,217 | 339 | 4,840 | 5,140 | (5.8 | %) | |||||||||||||||||||||||||||||||||||||||||||||||
Mr Francisco Javier Botín-Sanz de Sautuola y O’Shea (3) | 85 | — | — | — | 28 | — | — | — | — | — | — | — | — | 113 | 108 | 4.7 | % | |||||||||||||||||||||||||||||||||||||||||||||||
Lord Burns (Terence) (4) | 85 | — | — | — | 19 | — | — | — | — | — | — | — | — | 103 | 106 | (1.9 | %) | |||||||||||||||||||||||||||||||||||||||||||||||
Mr Vittorio Corbo Lioi | 85 | — | — | — | 21 | — | — | — | — | — | — | — | — | 106 | 106 | 0 | % | |||||||||||||||||||||||||||||||||||||||||||||||
Mr Rodrigo Echenique Gordillo | 85 | 170 | 40 | 24 | 33 | 111 | — | — | — | — | — | — | 30 | 493 | 415 | 18.7 | % | |||||||||||||||||||||||||||||||||||||||||||||||
Ms Esther Giménez-Salinas i Colomer (5) | 85 | — | — | — | 28 | 1 | — | — | — | — | — | — | — | 114 | 82 | 39.1 | % | |||||||||||||||||||||||||||||||||||||||||||||||
Mr Ángel Jado Becerro de Bengoa | 85 | — | — | — | 30 | — | — | — | — | — | — | — | — | 115 | 110 | 4.6 | % | |||||||||||||||||||||||||||||||||||||||||||||||
Mr Abel Matutes Juan | 85 | — | 40 | — | 25 | 19 | — | — | — | — | — | — | — | 169 | 169 | 0 | % | |||||||||||||||||||||||||||||||||||||||||||||||
Mr Juan Rodríguez Inciarte | 85 | — | — | — | 33 | 94 | 987 | 296 | 296 | 444 | 444 | 2,467 | 151 | 2,830 | 2,937 | (3.7 | %) | |||||||||||||||||||||||||||||||||||||||||||||||
Ms Isabel Tocino Biscarolasaga (6) | 85 | 115 | — | 24 | 33 | 175 | — | — | — | — | — | — | — | 432 | 257 | 68.1 | % | |||||||||||||||||||||||||||||||||||||||||||||||
Mr Juan Miguel Villar Mir (7) | 56 | — | — | — | 15 | — | — | — | — | — | — | — | — | 71 | — | — | ||||||||||||||||||||||||||||||||||||||||||||||||
Mr Alfredo Sáenz Abad (8) | 28 | 56 | — | — | 18 | 3 | 1,234 | — | — | — | — | 1,234 | 561 | 1,899 | 8,237 | (76.9 | %) | |||||||||||||||||||||||||||||||||||||||||||||||
Mr Manuel Soto Serrano (8) | 37 | — | 13 | 8 | 15 | 64 | — | — | — | — | — | — | — | 137 | 352 | (61.2 | %) | |||||||||||||||||||||||||||||||||||||||||||||||
Mr Francisco Luzón López (9) | — | — | — | — | — | — | — | — | — | — | — | — | — | — | 130 | — | ||||||||||||||||||||||||||||||||||||||||||||||||
Mr Antonio Basagoiti García-Tuñón (10) | — | — | — | — | — | — | — | — | — | — | — | — | — | — | 115 | — | ||||||||||||||||||||||||||||||||||||||||||||||||
Mr Antonio Escámez Torres (10) | — | — | — | — | — | — | — | — | — | — | — | — | — | — | 118 | — | ||||||||||||||||||||||||||||||||||||||||||||||||
Mr Luis Alberto Salazar-Simpson Bos (10) | — | — | — | — | — | — | — | — | — | — | — | — | — | — | 44 | — | ||||||||||||||||||||||||||||||||||||||||||||||||
|
|
|
|
|
|
|
|
|
|
|
|
|
|
|
|
|
|
|
|
|
|
|
|
|
|
|
|
|
|
|
| |||||||||||||||||||||||||||||||||
Total 2013 | 1,415 | 1,308 | 158 | 103 | 468 | 874 | 8,880 | 1,982 | 1,982 | 2,974 | 2,974 | 18,792 | 1,398 | 24,517 | — | (10.9 | %) | |||||||||||||||||||||||||||||||||||||||||||||||
|
|
|
|
|
|
|
|
|
|
|
|
|
|
|
|
|
|
|
|
|
|
|
|
|
|
|
|
|
|
|
| |||||||||||||||||||||||||||||||||
Total 2012 | 1,464 | 1,287 | 168 | 119 | 409 | 900 | 9,952 | 2,278 | 2,278 | 3,419 | 3,419 | 21,347 | 1,833 | — | 27,528 | |||||||||||||||||||||||||||||||||||||||||||||||||
|
|
|
|
|
|
|
|
|
|
|
|
|
|
|
|
|
|
|
|
|
|
|
|
|
|
|
|
|
|
|
| |||||||||||||||||||||||||||||||||
| (1) |
| (2) |
| Member of the audit and compliance committee and third deputy chairman since April 29, 2013. |
| (3) | Amounts delivered to the Fundación Botin. |
| (4) | Retired from the board on December |
| (5) | Board member since |
| (6) | Member of the risk committee since March 30, 2012 and of the executive committee since April 29, 2013. |
| (7) | Board member since May 7, 2013. |
| (8) | Retired from the board on April 29, 2013. |
| (9) | Retired from the board on January 23, 2012. |
| (a) | Maximum deferred variable remuneration for the period approved by the board of directors, at the related meetings, for each of the directors. |
| (b) | Includes, inter alia, the life and medical insurance costs borne by the Group relating to Bank directors. |
| (c) |
Following the amendment made by the Group in 2011 to its remuneration policy in order to adapt to the new European standards and recommendations on remuneration, the foregoing table was prepared including the maximum variable remuneration agreed for that year, regardless of the deferral of a portion thereof over several years and of the amount that will ultimately be received, since collection of the deferred amounts is subject to certain conditions being met. For comparison purposes, the figures for 2010 were prepared using consistent criteria.
F-70
| b) | Remuneration of the board members as representatives of the Bank |
By resolution of the executive committee, all the remuneration received by the Bank’s directors who represent the Bank on the boards of directors of listed companies in which the Bank has a stake, (at the expense ofpaid by those companies)companies and which relatesrelating to appointments made after March 18, 2002, will accrueaccrues to the Group. TheIn 2013 and 2012 the Bank’s directors did not receive any remuneration received in respect of representation duties of this kind, relating to appointments agreed upon before March 18, 2002, was as follows:these representative duties.
| Thousands of euros | ||||||||||
Company | 2011 | 2010 | ||||||||
Mr. Emilio Botín-Sanz de Sautuola y García de los Ríos | Shinsei Bank, Ltd. | — | — | |||||||
Mr. Antonio Escámez Torres | Attijariwafa Bank Société Anonyme | — | 10.0 | |||||||
|
|
|
| |||||||
| — | 10.0 | |||||||||
|
|
|
| |||||||
Mr. Emilio Botín-Sanz de Sautuola y García de los Ríos ceased to discharge his duties as director of Shinsei Bank, Ltd. on June 23, 2009 and received compensation of EUR 73.1 thousand.
Also, in 2008, 2007, 2006 and 2005 Mr. Emilio Botín-Sanz de Sautuola y García de los Ríos had received, in each year, options to acquire shares of Shinsei Bank, Ltd. (Shinsei), the detail being as follows: 10,000 shares at a price of JPY 416 each in 2008; 10,000 shares at a price of JPY 555 each in 2007; 25,000 shares at a price of JPY 825 each in 2006; and 25,000 shares at a price of JPY 601 each in 2005. At December 31, 2011, the market price of the Shinsei share was JPY 80 and, therefore, regardless of the stipulated exercise periods, the options granted in those years would not have given rise to any gains had they been exercised.
Furthermore, otherThree directors of the Bank received a total of EUR 1,4131,184 thousand in 20112013 as members of the boards of directors of Group companies (2010:(2012: EUR 7411,317 thousand), the detail being as follows: Lord Burns received EUR 600736 thousand as non-executive chairman of the board of directors of the Group companies Santander UK plc and Alliance & Leicester plc.Plc.; Mr. Antonio Basagoiti García-Tuñón received EUR 375 thousand as non-executive chairman of the board of directors of Banesto and in bylaw stipulated directors’ fees; Mr.Mr Matías Rodríguez Inciarte received EUR 42 thousand as a non-executive director of U.C.I., S.A., and Mr.Mr Vittorio Corbo Lioi received EUR 107406 thousand, of which he received EUR 104 thousand as a non-executive director of Banco Santander Chile, and EUR 289284 thousand for advisory services provided to that entity.entity and EUR 18 thousand as non-executive director of Grupo Financiero Santander México, S.A.B. de C.V.
| c) | Post-employment and other long-term benefits |
In 2012, within the eventframework of pre-retirement or retirement, the executive directors have the right to receive a supplementary pension which may be externalisedmeasures implemented by the Bank.
In prior yearsGroup in order to mitigate the board of directors ofrisks arising from the Bank resolveddefined-benefit pension obligations payable to changecertain employees, which led to an agreement with the workers’ representatives to convert the defined-benefit obligations existing under the collective agreement into defined-contribution plans (see Note 25), the contracts of the executive directors and the other members of the Bank’s senior management -the senior executives- granting themwhich provided for defined-benefit pension obligations were amended to convert these obligations into a defined-contribution employee welfare system, which was externalized to Santander Seguros y Reaseguros, Compañía Aseguradora, S.A. The new system grants the executive directors the right to receive a pension benefit upon retirement, regardless of whether or not they are in the Bank’s employ on that date, based on the date of retirement -or pre-retirement, as appropriate-contributions made to optthe aforementioned system, and replaced the right to receive a pension supplement which had previously been payable to them upon retirement. The new system expressly excludes any obligation of the accrued pensions -or amounts similar thereto-Bank to the executive directors other than the conversion of the previous system into the new employee welfare system, which took place in 2012, and, as the formcase may be, the annual contributions to be made as described below 1. In the event of an annuity or a lump sum, i.e. in one single payment, in full but not in part. The board also resolved thatpre-retirement, the senior executivesexecutive directors who have not reachedexercised the retirement age may opt, after reaching the age of 60, and each year thereafter until the age of 64,option to receive their accrued pensions in the form of a lump sum which will be determined atare entitled to receive an annual emolument until the date of economic effect of exercising the option and which they (or their heirs,retirement.
The initial balance for each executive director in the event of death) will be entitlednew defined-contribution welfare system was that corresponding to receive when they retire or are declared disabled; any person who exercises this option must undertake not to take pre-retirement, retire early or retire, in all cases at his/her own request, within two years from the exercise date. In order to maintain the financial neutrality for the Group, the amount to be received in the form of a lump sum by the commitment beneficiary at the date of retirement must be the aliquot part of the market value of the assets assigned to coverin which the mathematical provisions offor the policy instrumenting these commitments to senior executivesrespective accrued obligations had been invested, at the date on which the former pension obligations were converted into the new welfare system.2.
Following the aforementioned amendment, from 2013 onwards the Bank will make annual contributions to the employee welfare system for the benefit of economic effect of exercising the option. Theexecutive directors and senior executives, in proportion to their respective pensionable bases, until they leave the Group, or until their retirement from the Group, death or disability (including, as the case may be, during the pre-retirement period). No contributions are made for the executive directors and senior executives who, reach the age of 60 and, prior to the ageconversion of retirement, do not optthe defined-benefit pension obligations into the current defined-contribution employee welfare system, had exercised the option to receive their accrued pensions aspension rights in a lump sum, and who are still in service on reaching the age of retirement -or who at the datesum.
| 1 | As provided for in the contracts of the executive directors and members of senior management prior to their modification, Mr Emilio Botín-Sanz de Sautuola y García de los Ríos and Mr Matías Rodríguez Inciarte had exercised the option to receive the accrued pensions -or amounts similar thereto- in the form of a lump sum (i.e. in a single payment), which meant that no further pension benefit would accrue to them from that time, and the lump sum to be received, which would be updated at the agreed-upon interest rate, was fixed. |
| 2 | In the case of Mr Emilio Botín-Sanz de Sautuola y García de los Ríos and Mr Matías Rodríguez Inciarte, the initial balance corresponded to the amounts that were set when, as described above, they exercised the option to receive a lump sum, and includes the interest accrued on these amounts from that date. |
The terms of the contract entered into have passed the age of retirement- must state whether they wish to opt for this form of benefit. The exercise of this option will mean, in all cases, that no further pension benefit will accrue and, from the date of economic effect of exercising the option, the lump sum to be received, which will be updated at the agreed-upon interest rate, will be fixed. Should the senior executive subsequently die whilst still in service and prior to retirement, the lump sum of the pension will correspond to his/her heirs. Lastly, the board of directors also regulatedemployee welfare system regulate the impact of the deferral of the computable variable remuneration on the determinationbenefit payments covered by the system upon retirement and, as the case may be, the withholding tax on shares arising from such remuneration.
In 2013, as a result of his appointment as chief executive officer, changes were introduced to the contract of Mr Javier Marín Romano with respect to the pension obligations (or similar amounts),stipulated in the form of an annuity or a lump sum, for pre-retirement, early retirement or normal retirement.
F-71
In 2009 Mr. Emilio Botín Sanz de Sautuola y García de los Ríos and Mr. Alfredo Sáenz Abad, who had passed the age of retirement, exercised the option to receive their respective accrued pensions as a lump sum on the date of effective retirement.
In 2010 Mr. Matías Rodríguez Inciarte, who had reached the age of 60, exercised the option to receive his accrued pension as a lump sum on the date of effective retirement.
senior management contract. The total balance of supplementary pension obligations assumed by the Group over the years to its current and retired employees, which is covered mostly by in-house provisions which amounted to EUR 9,045 million at December 31, 2011, includes the obligations to those who have been directors of the Bank during the year and who discharge (or have discharged) executive functions.
The following table provides information on the pension obligations assumed and covered by the Group in respect of the Bank’s executive directors:
| Thousands of euros | ||||||||
| 2011 | 2010 | |||||||
Mr. Emilio Botín-Sanz de Sautuola y García de los Ríos | 25,400 | 25,029 | ||||||
Mr. Alfredo Sáenz Abad | 87,758 | 86,620 | ||||||
Mr. Matías Rodríguez Inciarte | 45,224 | 44,560 | ||||||
Ms. Ana Patricia Botín-Sanz de Sautuola y O’Shea | 31,856 | 31,329 | ||||||
Mr. Francisco Luzón López | 63,608 | (*) | 55,950 | |||||
Mr. Juan Rodríguez Inciarte | 12,309 | 11,629 | ||||||
|
|
|
| |||||
| 266,155 | 255,117 | |||||||
|
|
|
| |||||
Since the aforementioned option has been exercised, the amounts included in the foregoing table in respect of the directors Mr. Emilio Botín Sanz de Sautuola y García de los Ríos, Mr. Alfredo Sáenz Abad and Mr. Matías Rodríguez Inciarte are those relatingannual contribution to the aforementioned lump sums, and no further amounts will accrue to each of them in respect of pensions following the exercise of the aforementioned option. The lump sums are updated at the agreed-upon interest rate.
The other amounts in the foregoing table relate to the accrued present actuarial value of the future annual payments to be made by the Group. These amounts were obtained using actuarial calculations and cover the obligations to pay the respective pension supplements or lump sums. In the case of Ms. Ana Patricia Botín-Sanz de Sautuola y O’Shea, these supplements or lump sums wereemployee welfare system is now calculated as 100%80% of the sum of theof: (i) fixed annual salary received at the date of effective retirement or, in her case, at the date of opting to receive the benefit in a lump sum plusremuneration; and (ii) 30% of the arithmeticalarithmetic mean of the last three gross amounts of variable salary payments received until that date. In addition,remuneration. Also, the pensionable base in relation to the death and permanent disability scheme provided for in his senior management contract is now 100% of fixed annual remuneration. Under his senior management contract, which is currently suspended, the annual contribution is 55% of his fixed remuneration, and the pensionable base in the caseevent of Mr. Francisco Luzón López, to the amount thus calculated will be added the amounts received by him in the year before retirementdeath or pre-retirement or, where appropriate, at the datedisability is 80% of opting to receive the benefit inhis fixed remuneration.
Following is a lump sum, in his capacity as a memberdetail of the board of directors or the committeesbalances relating to each of the Bank or of other consolidable Group companiescurrent executive directors under the new welfare system at December 31, 2013 and in the case of Mr. Juan Rodríguez Inciarte, 100% of the gross fixed annual salary received atinitial balances that corresponded to them in 2012 on the dateconversion of effective retirement or, where appropriate, at the date of opting to receive the benefit in a lump sum.
| Thousands of euros | ||||||||
| 2013 | 2012 | |||||||
Mr Emilio Botín-Sanz de Sautuola y García de los Ríos | 25,864 | 25,566 | ||||||
Mr Javier Marín Romano | 4,346 | (1) | — | |||||
Mr Matías Rodríguez Inciarte | 46,058 | 45,524 | ||||||
Ms Ana Patricia Botín-Sanz de Sautuola y O’Shea | 37,202 | (2) | 34,941 | |||||
Mr Juan Rodríguez Inciarte | 13,410 | 12,824 | ||||||
Mr Alfredo Sáenz Abad (3) | — | 88,174 | ||||||
|
|
|
| |||||
| 126,880 | 207,029 | |||||||
|
|
|
| |||||
F-72
On January 23, 2012, Mr. Francisco Luzón López took voluntary pre-retirement and resigned from his positions as director and executive vice president of the Bank and head of the Americas division, and opted to receive his accrued pre-retirement pension (EUR 2.8 million) as a lump sum. This amount, which is included in the figure shown in the foregoing table, will be paid to him as follows: EUR 2.5 million in 2012 and EUR 0.1 million each year in 2013, 2014 and 2015.
Mr. Francisco Luzón López retained his right to opt, on reaching retirement age, to receive his accrued retirement pension as an annuity or a lump sum -i.e., in one single payment- in full but not in part.
| (1) | Includes both his rights under the welfare system described above and those to which he is entitled, for the period prior to his appointment as chief executive officer, under the executive pension scheme of which he became an inactive participant on his appointment. |
| (2) | Includes the amounts relating to the period of provision of services at Banesto, externalized with another insurance company. |
| (3) | In April 2013, upon his retirement, Mr Alfredo Sáenz Abad requested payment of the pensions to which he was entitled in a lump sum (EUR 88.5 million gross). For such purpose, his pension rights were settled, in accordance with the applicable contractual and legal terms, through: i) the payment in cash of EUR 38.2 million relating to the net amount of the pension calculated taking into account the fixed remuneration, and EUR 12.2 million relating to the net amount of the pension calculated taking into account the accrued variable remuneration at the retirement date, and ii) the investment by Mr Sáenz of those EUR 12.2 million in Santander shares (2,216,082 shares), which were deposited at the Bank on a restricted basis until April 29, 2018. |
The Group also continues to havehas pension obligations to other directors amounting to EUR 3918 million (December 31, 2010:2012: EUR 4018 million). The payments made in 20112013 to the members of the board entitled to post-employment benefits amounted to EUR 2.61.2 million (2010:(2012: EUR 2.61.6 million).
PensionLastly, the contracts of the executive directors who had not exercised the option referred to above prior to the conversion of the defined-benefit pension obligations into the current welfare system include a supplementary welfare regime for the contingency of death (surviving spouse and child benefits) and permanent disability of serving directors.
The provisions recognized in 2013 and reversed in 2011 amounted to EUR 7,826 thousand2012 for retirement pensions and EUR 886 thousand, respectively (2010: EUR 9,570 thousandsupplementary benefits (surviving spouse and EUR 7,408 thousand, respectively).child benefits, and permanent disability) were as follows:
| Thousands of euros | ||||||||
| 2013 | 2012 | |||||||
Mr Emilio Botín-Sanz de Sautuola y García de los Ríos | — | — | ||||||
Mr Javier Marín Romano | 2,006 | — | ||||||
Mr Matías Rodríguez Inciarte | — | — | ||||||
Ms Ana Patricia Botín-Sanz de Sautuola y O’Shea | 1,443 | 2,078 | ||||||
Mr Juan Rodríguez Inciarte | 609 | 78 | ||||||
Mr Alfredo Sáenz Abad | — | — | ||||||
|
|
|
| |||||
| 4,058 | 2,166 | |||||||
|
|
|
| |||||
| d) | Insurance |
The Group has taken out life insurance policies for the Bank’s directors, who will be entitled to receive benefits if they are declared disabled; in the event of death, the benefits will be payable to their heirs. The premiums paid by the Group are included in the Other remuneration column of the table shown in Note 5.a.iii above. Also, the following table provides information on the sums insured for the Bank’s executive directors:
| Thousands of euros | ||||||||
| 2011 | 2010 | |||||||
Mr. Emilio Botín-Sanz de Sautuola y García de los Ríos | — | — | ||||||
Mr. Alfredo Sáenz Abad | 11,108 | 11,108 | ||||||
Mr. Matías Rodríguez Inciarte | 5,131 | 5,131 | ||||||
Ms. Ana Patricia Botín-Sanz de Sautuola y O’Shea | 988 | 1,403 | ||||||
Mr. Francisco Luzón López | 9,934 | 9,934 | ||||||
Mr. Juan Rodríguez Inciarte | 2,961 | 2,961 | ||||||
|
|
|
| |||||
| 30,122 | 30,537 | |||||||
|
|
|
| |||||
| Insured sum (Thousands of euros) | ||||||||
| 2013 | 2012 | |||||||
Mr Emilio Botín-Sanz de Sautuola y García de los Ríos | — | — | ||||||
Mr Javier Marín Romano | 2,400 | — | ||||||
Mr Matías Rodríguez Inciarte | 5,131 | 5,131 | ||||||
Ms Ana Patricia Botín-Sanz de Sautuola y O’Shea | 6,000 | 6,000 | ||||||
Mr Juan Rodríguez Inciarte | 2,961 | 2,961 | ||||||
Mr Alfredo Sáenz Abad | — | 11,108 | ||||||
|
|
|
| |||||
| 16,492 | 25,200 | |||||||
|
|
|
| |||||
Additionally, other directors have life insurance policies the cost of which is borne by the Group, the related insured sum being EUR 31.4 million at December 31, 2011 (2010:2013 (2012: EUR 31.4 million).
| e) | Deferred variable |
Following is a description of the various share delivery plans instrumenting the directors’ share-based deferred variable remuneration (see Note 47):
i) Performance share plan
| i) | Performance share plan |
This plan involves successive three-year cycles of share deliveries to the beneficiaries, as part of their variable remuneration for the year in which each cycle begins, so that each year one cycle will begin and, from 2009 onwards, another cycle will also end. Following the changes implemented in 2011 to the remuneration policy for the executive directors, the latter ceaseceased to be beneficiaries of the cycle approved in 2011 and of any successive cycles which are approved.2011.
The table below shows the maximum number of optionsrights granted to each executive director in each cycle and the number of shares received in 20112012 and 20102013 under the I11I12 and I10I13 incentive plans (Plans I11I12 and I10)I13), respectively. As established in these plans, the number of shares received was determined by the degree of achievement of the targets to which each plan was tied, and all planstied. Plan I12 fell short of the maximum number and Plan I13 fell short of the minimum number.
F-73
| Options at January 1, 2010 | Options granted in 2010 (number) | Shares delivered in 2010 (number) | Options cancelled in 2010 (number) | Options at December 31, 2010 | Shares delivered in 2011 (number) | Options cancelled in 2011 (number) | Options at December 31, 2011 | Grant date | Share delivery deadline | |||||||||||||||||||||||||||||||
Plan I10: | ||||||||||||||||||||||||||||||||||||||||
Mr. Emilio Botín-Sanz de Sautuola y García de los Ríos | 62,589 | — | (56,825 | ) | (5,764 | ) | — | — | — | — | 23/06/07 | 31/07/10 | ||||||||||||||||||||||||||||
Mr. Alfredo Sáenz Abad | 164,894 | — | (149,707 | ) | (15,187 | ) | — | — | — | — | 23/06/07 | 31/07/10 | ||||||||||||||||||||||||||||
Mr. Matías Rodríguez Inciarte | 79,627 | — | (72,293 | ) | (7,334 | ) | — | — | — | — | 23/06/07 | 31/07/10 | ||||||||||||||||||||||||||||
Ms. Ana Patricia Botín-Sanz de Sautuola y O’Shea (1) | 41,835 | — | (37,982 | ) | (3,853 | ) | — | — | — | — | 23/06/07 | 31/07/10 | ||||||||||||||||||||||||||||
Mr. Francisco Luzón López | 67,029 | — | (60,856 | ) | (6,173 | ) | — | — | — | — | 23/06/07 | 31/07/10 | ||||||||||||||||||||||||||||
Mr. Juan Rodríguez Inciarte (2) | 64,983 | — | (58,998 | ) | (5,985 | ) | — | — | — | — | 23/06/07 | 31/07/10 | ||||||||||||||||||||||||||||
|
|
|
|
|
|
|
|
|
|
|
|
|
|
|
| |||||||||||||||||||||||||
| 480,957 | — | (436,661 | ) | (44,296 | ) | — | — | — | — | |||||||||||||||||||||||||||||||
|
|
|
|
|
|
|
|
|
|
|
|
|
|
|
| |||||||||||||||||||||||||
Plan I11: | ||||||||||||||||||||||||||||||||||||||||
Mr. Emilio Botín-Sanz de Sautuola y García de los Ríos | 68,848 | — | — | — | 68,848 | 59,209 | (9,639 | ) | — | 21/06/08 | 31/07/11 | |||||||||||||||||||||||||||||
Mr. Alfredo Sáenz Abad | 189,628 | — | — | — | 189,628 | 163,080 | (26,548 | ) | — | 21/06/08 | 31/07/11 | |||||||||||||||||||||||||||||
Mr. Matías Rodríguez Inciarte | 87,590 | — | — | — | 87,590 | 75,327 | (12,263 | ) | — | 21/06/08 | 31/07/11 | |||||||||||||||||||||||||||||
Ms. Ana Patricia Botín-Sanz de Sautuola y O’Shea (1) | 46,855 | — | — | — | 46,855 | 40,295 | (3) | (6,560 | ) | — | 21/06/08 | 31/07/11 | ||||||||||||||||||||||||||||
Mr. Francisco Luzón López | 77,083 | — | — | — | 77,083 | 66,291 | (10,792 | ) | — | 21/06/08 | 31/07/11 | |||||||||||||||||||||||||||||
Mr. Juan Rodríguez Inciarte | 50,555 | — | — | — | 50,555 | 43,477 | (7,078 | ) | — | 21/06/08 | 31/07/11 | |||||||||||||||||||||||||||||
|
|
|
|
|
|
|
|
|
|
|
|
|
|
|
| |||||||||||||||||||||||||
| 520,559 | — | — | — | 520,559 | 447,679 | (72,880 | ) | — | ||||||||||||||||||||||||||||||||
|
|
|
|
|
|
|
|
|
|
|
|
|
|
|
| |||||||||||||||||||||||||
Plan I12: | ||||||||||||||||||||||||||||||||||||||||
Mr. Emilio Botín-Sanz de Sautuola y García de los Ríos | 82,941 | — | — | — | 82,941 | — | — | 82,941 | 19/06/09 | 31/07/12 | ||||||||||||||||||||||||||||||
Mr. Alfredo Sáenz Abad | 228,445 | — | — | — | 228,445 | — | — | 228,445 | 19/06/09 | 31/07/12 | ||||||||||||||||||||||||||||||
Mr. Matías Rodríguez Inciarte | 105,520 | — | — | — | 105,520 | — | — | 105,520 | 19/06/09 | 31/07/12 | ||||||||||||||||||||||||||||||
Ms. Ana Patricia Botín-Sanz de Sautuola y O’Shea (1) | 56,447 | — | — | — | 56,447 | — | — | 56,447 | 19/06/09 | 31/07/12 | ||||||||||||||||||||||||||||||
Mr. Francisco Luzón López (4) | 92,862 | — | — | — | 92,862 | — | — | 92,862 | 19/06/09 | 31/07/12 | ||||||||||||||||||||||||||||||
Mr. Juan Rodríguez Inciarte | 60,904 | — | — | — | 60,904 | — | — | 60,904 | 19/06/09 | 31/07/12 | ||||||||||||||||||||||||||||||
|
|
|
|
|
|
|
|
|
|
|
|
|
|
|
| |||||||||||||||||||||||||
| 627,119 | — | — | — | 627,119 | — | — | 627,119 | |||||||||||||||||||||||||||||||||
|
|
|
|
|
|
|
|
|
|
|
|
|
|
|
| |||||||||||||||||||||||||
Plan I13 | ||||||||||||||||||||||||||||||||||||||||
Mr. Emilio Botín-Sanz de Sautuola y García de los Ríos | — | 82,941 | — | — | 82,941 | — | — | 82,941 | 11/06/10 | 31/07/13 | ||||||||||||||||||||||||||||||
Mr. Alfredo Sáenz Abad | — | 228,445 | — | — | 228,445 | — | — | 228,445 | 11/06/10 | 31/07/13 | ||||||||||||||||||||||||||||||
Mr. Matías Rodríguez Inciarte | — | 105,520 | — | — | 105,520 | — | — | 105,520 | 11/06/10 | 31/07/13 | ||||||||||||||||||||||||||||||
Ms. Ana Patricia Botín-Sanz de Sautuola y O’Shea (1) | — | 56,447 | — | — | 56,447 | — | — | 56,447 | 11/06/10 | 31/07/13 | ||||||||||||||||||||||||||||||
Mr. Francisco Luzón López (4) | — | 92,862 | — | — | 92,862 | — | — | 92,862 | 11/06/10 | 31/07/13 | ||||||||||||||||||||||||||||||
Mr. Juan Rodríguez Inciarte | — | 60,904 | — | — | 60,904 | — | — | 60,904 | 11/06/10 | 31/07/13 | ||||||||||||||||||||||||||||||
|
|
|
|
|
|
|
|
|
|
|
|
|
|
|
| |||||||||||||||||||||||||
| — | 627,119 | — | — | 627,119 | — | — | 627,119 | |||||||||||||||||||||||||||||||||
|
|
|
|
|
|
|
|
|
|
|
|
|
|
|
|
|
|
|
| |||||||||||||||||||||
| Rights at January 1, 2012 | Shares delivered in 2012 (number) | Rights cancelled in 2012 (number) | Rights at December 31, 2012 | Shares delivered in 2013 (number) | Rights cancelled in 2013 (number) | Rights at December 31, 2013 | Grant date | Share delivery deadline | ||||||||||||||||||||||||||||
Plan I12: | ||||||||||||||||||||||||||||||||||||
Mr Emilio Botín-Sanz de Sautuola y García de los Ríos | 82,941 | 24,882 | (58,059 | ) | — | — | — | — | 19/06/09 | 31/07/12 | ||||||||||||||||||||||||||
Mr Alfredo Sáenz Abad | 228,445 | 68,534 | (159,911 | ) | — | — | — | — | 19/06/09 | 31/07/12 | ||||||||||||||||||||||||||
Mr Matías Rodríguez Inciarte | 105,520 | 31,656 | (73,864 | ) | — | — | — | — | 19/06/09 | 31/07/12 | ||||||||||||||||||||||||||
Ms Ana Patricia Botín-Sanz de Sautuola y O’Shea(1) | 56,447 | 16,934 | (2) | (39,513 | ) | — | — | — | — | 19/06/09 | 31/07/12 | |||||||||||||||||||||||||
Mr Francisco Luzón López(3) | 92,862 | — | (92,862 | ) | — | — | — | — | 19/06/09 | 31/07/12 | ||||||||||||||||||||||||||
Mr Juan Rodríguez Inciarte | 60,904 | 18,271 | (42,633 | ) | — | — | — | — | 19/06/09 | 31/07/12 | ||||||||||||||||||||||||||
|
|
|
|
|
|
|
|
|
|
|
|
|
| |||||||||||||||||||||||
| 627,119 | 160,277 | (466,842 | ) | — | — | — | — | |||||||||||||||||||||||||||||
|
|
|
|
|
|
|
|
|
|
|
|
|
| |||||||||||||||||||||||
Plan I13 | ||||||||||||||||||||||||||||||||||||
Mr Emilio Botín-Sanz de Sautuola y García de los Ríos | 82,941 | — | — | 82,941 | — | (82,941 | ) | — | 11/06/10 | 31/07/13 | ||||||||||||||||||||||||||
Mr Alfredo Sáenz Abad(4) | 228,445 | — | — | 228,445 | — | (228,445 | ) | — | 11/06/10 | 31/07/13 | ||||||||||||||||||||||||||
Mr Matías Rodríguez Inciarte | 105,520 | — | — | 105,520 | — | (105,520 | ) | — | 11/06/10 | 31/07/13 | ||||||||||||||||||||||||||
Ms Ana Patricia Botín-Sanz de Sautuola y O’Shea(1) | 56,447 | — | — | 56,447 | — | (56,447 | ) | — | 11/06/10 | 31/07/13 | ||||||||||||||||||||||||||
Mr Francisco Luzón López(3) | 92,862 | — | (92,862 | ) | — | — | — | — | 11/06/10 | 31/07/13 | ||||||||||||||||||||||||||
Mr Juan Rodríguez Inciarte | 60,904 | — | — | 60,904 | — | (60,904 | ) | — | 11/06/10 | 31/07/13 | ||||||||||||||||||||||||||
|
|
|
|
|
|
|
|
|
|
|
|
|
| |||||||||||||||||||||||
| 627,119 | — | (92,862 | ) | 534,257 | — | (534,257 | ) | — | ||||||||||||||||||||||||||||
|
|
|
|
|
|
|
|
|
|
|
|
|
| |||||||||||||||||||||||
| (1) | Without prejudice to the Banesto shares corresponding to |
| (2) |
| In |
| Following his resignation on January 23, 2012, |
| (4) | Following his resignation on April 29, 2013, Mr Alfredo Sáenz Abad lost his entitlement arising from his participation in these plans since he did not meet all the conditions stipulated for the shares to be received. |
F-74
ii) Obligatory investment share plan
| ii) | Obligatory investment share plan |
Pursuant to the obligatory investment share plan (see Note 47), and also as part of the deferred share-based variable remuneration for each period, the current executive directors acquired, prior to February 28, 2008, February 28, 2009 and February 28, 2010, the number of Bank shares shown in the table below, which involved an investmentcorresponding to the second and third cycles of EUR 1.5 million in 2008, EUR 0.8 million in 2009 and EUR 1.5 million in 2010.this plan. Executive directors who hold the shares acquired through the obligatory investment and remain in the Group’s employ for three years from the date on which the obligatory investment is made are entitled to receive the same number of Bank shares as that composing their initial obligatory investment.
The shareholders at the annual general meeting of June 19, 2009 introduced, for the third cycle, a requirement additional to that of remaining in the Group’s employ, which is that in the three-year period from the investment in the shares, none of the following circumstances should exist: (i) poor financial performance of the Group; (ii) breach by the beneficiary of the codes of conduct or other internal regulations, including, in particular, those relating to risks, where applicable to the executive in question; or (iii) material restatement of the Group’s financial statements, except when it is required pursuant to a change in accounting standards.
| Maximum number of shares to be delivered | ||||||||||||
| 3rd cycle 2010-2012 | 2nd cycle 2009-2011 | 1st cycle 2008-2010 | ||||||||||
Mr. Emilio Botín-Sanz de Sautuola y García de los Ríos | 20,515 | 19,968 | 16,306 | |||||||||
Mr. Alfredo Sáenz Abad | 49,000 | 47,692 | 37,324 | |||||||||
Mr. Matías Rodríguez Inciarte | 25,849 | 25,159 | 20,195 | |||||||||
Ms. Ana Patricia Botín-Sanz de Sautuola y O’Shea (1) | 18,446 | 16,956 | 13,610 | |||||||||
Mr. Francisco Luzón López (2) | 28,434 | 27,675 | 22,214 | |||||||||
Mr. Juan Rodríguez Inciarte | 15,142 | 14,738 | 14,617 | |||||||||
|
|
|
|
|
| |||||||
| 157,386 | 152,188 | 124,266 | ||||||||||
|
|
|
|
|
| |||||||
| Maximum number of shares to be delivered (3) | ||||||||
| 3rd cycle 2010-2012 | 2nd cycle 2009-2011 | |||||||
Mr Emilio Botín-Sanz de Sautuola y García de los Ríos | 20,515 | 19,968 | ||||||
Mr Javier Marín Romano (1) | 11,092 | — | ||||||
Mr Matías Rodríguez Inciarte | 25,849 | 25,159 | ||||||
Ms Ana Patricia Botín-Sanz de Sautuola y O’Shea (2) | 18,446 | 16,956 | ||||||
Mr Juan Rodríguez Inciarte | 15,142 | 14,738 | ||||||
|
|
|
| |||||
| 91,044 | 76,821 | |||||||
|
|
|
| |||||
| (1) |
| (2) | The maximum number of shares corresponding to |
Since the condition to retain the aforementioned shares acquired in the first cycle and the additional requirement to stay in the Group for three years had been complied with, in March 2011February 2012 and 2013, as approved by the board, at the proposal of the appointments and remuneration committee, the gross number of shares detailed inabove relating to the foregoing tablesecond and third cycles accrued to the executive directors, whichand this number is equivalentequal to the number of shares initially acquired by them. Also, the shares relating to the second cycle will be delivered in February 2012, once compliance with the conditions for delivery thereof has been verified -holding the shares acquired and remaining in the Group’s employ-.
| iii) | Deferred conditional delivery share plan |
F-75
iii) Deferred conditional delivery share plan
AtThe 2010 variable remuneration of the executive directors and Group executives or employees whose variable remuneration or annual bonus for 2010 exceeded, in general, meeting held on June 11, 2010,EUR 300,000 (gross) was approved by the shareholders approvedboard of directors through the instrumentation of the first cycle of the deferred conditional delivery share plan, applicable to the variable remuneration for 2010 of the executive directors and executives and employees of Santander Group whose variable remuneration or annual bonus for 2010 generally exceeded EUR 300,000 (gross), with a view to deferringwhereby a portion of the aforementioned variable remuneration or bonus is being deferred over a period of three years in whichfor it willto be paid, where appropriate, in Santander shares. Application of this cycle, insofar as it entails the delivery of shares to the plan beneficiaries, was authorized by the annual general meeting held on June 11, 2010.
In addition to the requirement that the beneficiary remains in the Group’s employ, with the exceptions included in the plan regulations, the accrual of the share-based deferred remuneration is conditional upon none of the following circumstances existing, in the opinion of the board of directors, during the period prior to each of the deliveries: (i) poor financial performance of the Group; (ii) breach by the beneficiary of internal regulations, including, in particular, those relating to risks; (iii) material restatement of the Group’s financial statements, except when it is required pursuant to a change in accounting standards; or (iv) significant changes in economic capital and the qualitative assessment of risk.
The share-based bonus will be deferred over three years and will be paid, where appropriate, in three instalments starting inafter the first year.
The number of shares allocated to eachthe executive directordirectors for deferral purposes, the shares delivered in 2012 (first third), in 2013 (second third) and the shares relating tothat were approved by the first ofboard for delivery in February 2014 (third third), once the three deliveries envisaged under this plan,conditions for receiving them have been met, are as follows:
| Number of shares deferred on bonus for 2010 (2) | Number of shares delivered in 2012 (1st third) (2) | Number of shares delivered in 2013 (2nd third) (2) | Number of shares to be delivered in 2014 ( | |||||||||||||
| 94,345 | 31,448 | 31,448 | 31,448 | ||||||||||||
| 12,583 | 12,583 | ||||||||||||||
| 135,188 | 45,063 | 45,063 | 45,063 | ||||||||||||
| 91,187 | 30,395 | 30,395 | 19,240 | ||||||||||||
| ||||||||||||||||
| 61,386 | 20,462 | 20,462 | 20,462 | ||||||||||||
| Shares of Banesto, as authorized by the shareholders of that entity at the annual general meeting of February 23, 2011. Following the merger of Banesto with the Bank, 19,240 shares of the Bank will be delivered in 2014, equal to the 30,395 shares of Banesto authorized by the annual general meeting. |
| On January 23, 2012, |
iv) Deferred conditional variable remunerationFurthermore, Mr Alfredo Sáenz Abad ceased to discharge his duties as director on April 29, 2013. In accordance with the plan
The shareholders at regulations, Mr Alfredo Sáenz Abad retains the annual general meetingright to receive, if appropriate, 104,150 shares in 2014, subject to compliance with the conditions established in the plan for them to be received. Also, in both 2012 and 2013 he received 104,150 shares relating to the number of June 17, 2011 approvedshares to which he was entitled as a result of the accrual of the first cycleand second thirds of the deferred conditional variable remuneration plan in relation to the variable remuneration or bonusportion of his 2010 bonus.
| iv) | Deferred conditional variable remuneration plan |
The bonuses for 2011, 2012 and 2013 of the executive directors and certain executives (including senior management) and employees who assume risks, perform control functions or receive an overall remuneration which putsplacing them on the same remuneration level as senior executives and employees who assume risks (all of themwhom are referred to asidentified staff, in accordance with theGuidelines on Remuneration Policies and Practicesapproved by theCommittee of European Banking Supervisors on December 10, 2010). were approved by the board of directors and instrumented, respectively, through the first, second and third cycles of the deferred conditional variable remuneration plan. Application of these cycles, insofar as they entail the delivery of shares to the plan beneficiaries, was authorized, respectively, by the annual general meetings held on June 17, 2011, March 30, 2012 and March 22, 2013.
The purpose of this first cyclethese plans is to defer a portion of the variable remuneration or bonus of the beneficiaries thereof over a period of three years for it to be paid, where appropriate, in cash and in Santander shares; the other portion of the variable remuneration is also to be paid in cash and Santander shares, upon commencement of the cycle,cycles, in accordance with the rules set forth below.
F-76
The variable remuneration will be paid in accordance with the following percentages, based on the timing of the payment and the group to which the beneficiary belongs (the “immediate payment percentage” identifies the portion of the bonus for which payment is not deferred, and the “deferred percentage” identifies the portion of the bonus for which payment is deferred):
| Immediate payment percentage | Deferred percentage | |||||||
Executive directors | 40 | % | 60 | % | ||||
Division directors and other executives of the Group with a similar profile | 50 | % | 50 | % | ||||
Other executives subject to supervision | 60 | % | 40 | % | ||||
The payment of the deferred percentage of the bonus applicable in each case will be deferred over a period of three years and will be paid in thirds, within fifteen days following the anniversaries of the initial date (that on which the immediate payment percentage is paid) in 2013, 2014 and 2015 for the deferred remuneration of 2011; in 2014, 2015 and 2016 for the deferred remuneration of 2012; and in 2015, 2016 and 2017 for the deferred remuneration of 2013, 50% being paid in cash and 50% in shares, provided that the conditions listedindicated below are met.
In addition to the requirement that the beneficiary remains in the Group’s employ, with the exceptions included in the plan regulations, the accrual of the deferred remuneration is conditional upon none of the following circumstances existing in-in the opinion of the board of directors and following a proposal of the appointments and remuneration committeecommittee- during the period prior to each of the deliveries: (i) poor financial performance of the Group; (ii) breach by the beneficiary of internal regulations, including, in particular, those relating to risks; (iii) material restatement of the Group’s financial statements, except when it is required pursuant to a change in accounting standards; or (iv) significant changes in the Group’s economic capital or risk profile.
On each delivery, the beneficiaries will be paid an amount in cash equal to the dividends paid foron the amount deferred in shares and the interest on the amount deferred in cash. If theSantander Dividendo Elección scrip dividend scheme is applied, they will be paid the price offered by the Bank for the bonus share rights relating to those shares.
The maximum number of shares to be delivered is calculated taking into account the amount resulting from applying the applicable taxes and the volume-weighted average prices for the 15 trading sessions prior to the date on which the board of directors approves the bonus for the Bank’s executive directors for 2011.each year.
The table below shows the number of Santander shares allocatedassigned, as variable remuneration for 2011, 2012 and 2013, to each executive director, distinguishing between those which have beenand the gross shares delivered to them in 2012 and those subject2013, by way of either immediate payment or deferred payment, in the latter case once the board had determined, at the proposal of the appointments and remuneration committee, that the third relating to a three-year deferral, is as follows:each plan had accrued:
| Maximum number of shares to be delivered | ||||||||||||
| Immediate payment | Deferred payment | Total | ||||||||||
Mr. Emilio Botín-Sanz de Sautuola y García de los Ríos | 99,552 | 149,327 | 248,879 | |||||||||
Mr. Alfredo Sáenz Abad | 247,366 | 371,049 | 618,415 | |||||||||
Mr. Matías Rodríguez Inciarte | 125,756 | 188,634 | 314,390 | |||||||||
Ms. Ana Patricia Botín-Sanz de Sautuola y O’Shea | 94,002 | 141,002 | 235,004 | |||||||||
Mr. Francisco Luzón López(1) | 130,996 | 196,494 | 327,490 | |||||||||
Mr. Juan Rodríguez Inciarte | 73,380 | 110,070 | 183,450 | |||||||||
|
|
|
|
|
| |||||||
| 771,052 | 1,156,576 | 1,927,628 | ||||||||||
|
|
|
|
|
| |||||||
Share-based variable remuneration | Maximum number of shares to be delivered at January 1, 2012 | Shares delivered in 2012 (immediate payment of 2011 variable remuneration) | 2012 variable remuneration (maximum number of shares to be delivered) | Maximum number of shares to be delivered at December 31, 2012 | Shares delivered in 2013 (immediate payment of 2012 variable remuneration) | Shares delivered in 2013 (deferred payment of 2011 variable remuneration) | 2013 variable remuneration (maximum number of shares to be delivered) | Maximum number of shares to be delivered at December 31, 2013 | ||||||||||||||||||||||||
Variable remuneration (2011) | ||||||||||||||||||||||||||||||||
Mr Emilio Botín-Sanz de Sautuola y García de los Ríos | 248,879 | (99,552 | ) | — | 149,327 | — | (49,776 | ) | — | 99,551 | ||||||||||||||||||||||
Mr Javier Marín Romano | 155,764 | (77,882 | ) | — | 77,882 | — | (25,961 | ) | — | 51,921 | ||||||||||||||||||||||
Mr Matías Rodríguez Inciarte | 314,390 | (125,756 | ) | — | 188,634 | — | (62,878 | ) | — | 125,756 | ||||||||||||||||||||||
Ms Ana Patricia Botín-Sanz de Sautuola y O’Shea | 235,004 | (94,002 | ) | — | 141,002 | — | (47,001 | ) | — | 94,001 | ||||||||||||||||||||||
Mr Juan Rodríguez Inciarte | 183,450 | (73,380 | ) | — | 110,070 | — | (36,690 | ) | — | 73,380 | ||||||||||||||||||||||
Mr Francisco Luzón López(1) | 327,490 | (130,996 | ) | — | 196,494 | — | (65,498 | ) | — | 130,996 | ||||||||||||||||||||||
Mr Alfredo Sáenz Abad(2) | 618,415 | (247,366 | ) | — | 371,049 | — | (123,683 | ) | — | 247,366 | ||||||||||||||||||||||
|
|
|
|
|
|
|
|
|
|
|
|
|
|
|
| |||||||||||||||||
| 2,083,392 | (848,934 | ) | — | 1,234,458 | — | (411,487 | ) | — | 822,971 | |||||||||||||||||||||||
|
|
|
|
|
|
|
|
|
|
|
|
|
|
|
| |||||||||||||||||
Variable remuneration (2012) | ||||||||||||||||||||||||||||||||
Mr Emilio Botín-Sanz de Sautuola y García de los Ríos | — | — | 109,879 | 109,879 | (43,952 | ) | — | — | 65,927 | |||||||||||||||||||||||
Mr Javier Marín Romano | — | — | 116,908 | 116,908 | (58,454 | ) | — | — | 58,454 | |||||||||||||||||||||||
Mr Matías Rodríguez Inciarte | — | — | 207,648 | 207,648 | (83,059 | ) | — | — | 124,589 | |||||||||||||||||||||||
Ms Ana Patricia Botín-Sanz de Sautuola y O’Shea | — | — | 174,790 | 174,790 | (69,916 | ) | — | — | 104,874 | |||||||||||||||||||||||
Mr Juan Rodríguez Inciarte | — | — | 121,165 | 121,165 | (48,466 | ) | — | — | 72,699 | |||||||||||||||||||||||
Mr Alfredo Sáenz Abad(2) | — | — | 273,028 | 273,028 | (109,211 | ) | — | — | 163,817 | |||||||||||||||||||||||
|
|
|
|
|
|
|
|
|
|
|
|
|
|
|
| |||||||||||||||||
| — | — | 1,003,418 | 1,003,418 | (413,058 | ) | — | — | 590,360 | ||||||||||||||||||||||||
|
|
|
|
|
|
|
|
|
|
|
|
|
|
|
| |||||||||||||||||
Variable remuneration (2013) | ||||||||||||||||||||||||||||||||
Mr Emilio Botín-Sanz de Sautuola y García de los Ríos | — | — | — | — | — | — | 105,718 | 105,718 | ||||||||||||||||||||||||
Mr Javier Marín Romano | — | — | — | — | — | — | 187,125 | 187,125 | ||||||||||||||||||||||||
Mr Matías Rodríguez Inciarte | — | — | — | — | — | — | 172,731 | 172,731 | ||||||||||||||||||||||||
Ms Ana Patricia Botín-Sanz de Sautuola y O’Shea | — | — | — | — | — | — | 165,603 | 165,603 | ||||||||||||||||||||||||
Mr Juan Rodríguez Inciarte | — | — | — | — | — | — | 110,747 | 110,747 | ||||||||||||||||||||||||
|
|
|
|
|
|
|
|
|
|
|
|
|
|
|
| |||||||||||||||||
| — | — | — | — | — | — | 741,924 | 741,924 | |||||||||||||||||||||||||
|
|
|
|
|
|
|
|
|
|
|
|
|
|
|
| |||||||||||||||||
| (1) | On January 23, 2012, |
| (2) | Mr Alfredo Sáenz Abad ceased to discharge his duties as director on April 29, 2013. The deferred amounts, in cash (two gross payments of EUR 702 thousand each, relating to the deferred variable remuneration for 2011, and three of EUR 351 thousand each, relating to the deferred variable remuneration for 2012) and in shares (see table above), relating to the deferred variable remuneration for 2011 and 2012, will be paid to him on the corresponding maturity dates, together with the remuneration relating to the shares (dividends and amounts offered for the bonus share rights if the Santander Dividendo Elección scrip dividend scheme is applied) and the interest accrued on the cash amounts, subject to compliance with the requirements set forth in the related resolutions of the general meetings and the plans’ regulations, as well as all other terms set forth therein. |
Furthermore, the table below shows the cash delivered in 2012 and 2013, by way of either immediate payment or deferred payment, in the latter case once the board had determined, at the proposal of the appointments and remuneration committee, that the third relating to each plan had accrued:
F-77
| Thousands of euros | ||||||||||||
| 2013 | 2012 | |||||||||||
| Cash paid (immediate payment of 2012 variable remuneration) | Cash paid (1st third deferred payment of 2011 variable remuneration) | Cash paid (immediate payment of 2011 variable remuneration) | ||||||||||
Mr Emilio Botín-Sanz de Sautuola y García de los Ríos | 282 | 282 | 565 | |||||||||
Mr Javier Marín Romano | 376 | 147 | 442 | |||||||||
Mr Matías Rodríguez Inciarte | 534 | 357 | 714 | |||||||||
Ms Ana Patricia Botín-Sanz de Sautuola y O’Shea | 449 | (1) | 286 | (1) | 534 | (1) | ||||||
Mr Juan Rodríguez Inciarte | 311 | 208 | 416 | |||||||||
Mr Francisco Luzón López | — | 371 | 743 | |||||||||
Mr Alfredo Sáenz Abad | 702 | 702 | 1,404 | |||||||||
|
|
|
|
|
| |||||||
| 2,654 | 2,353 | 4,818 | ||||||||||
|
|
|
|
|
| |||||||
| (1) | Equivalent euro value of the original amount in pounds sterling. |
| f) | Loans |
The Group’s direct risk exposure to the Bank’s directors and the guarantees provided for them are detailed below. These transactions were made on an arm’s-length basis or the related compensation in kind was charged:recognized:
| Thousands of euros | ||||||||||||||||||||||||
| 2011 | 2010 | |||||||||||||||||||||||
| Loans and credits | Guarantees | Total | Loans and credits | Guarantees | Total | |||||||||||||||||||
Mr. Alfredo Sáenz Abad | 8 | — | 8 | 31 | — | 31 | ||||||||||||||||||
Mr. Matías Rodríguez Inciarte | 1 | — | 1 | 14 | — | 14 | ||||||||||||||||||
Mr. Manuel Soto Serrano | 1 | — | 1 | 2 | — | 2 | ||||||||||||||||||
Mr. Antonio Basagoiti García-Tuñón | 12 | 1 | 13 | 36 | 1 | 37 | ||||||||||||||||||
Ms. Ana Patricia Botín-Sanz de Sautuola y O’Shea | 6 | — | 6 | 2 | — | 2 | ||||||||||||||||||
Mr. Javier Botín-Sanz de Sautuola y O’Shea | 3 | — | 3 | 5 | — | 5 | ||||||||||||||||||
Mr. Rodrigo Echenique Gordillo | 1,500 | — | 1,500 | 16 | — | 16 | ||||||||||||||||||
Mr. Antonio Escámez Torres | 1,851 | — | 1,851 | 1,500 | — | 1,500 | ||||||||||||||||||
Mr. Angel Jado Becerro de Bengoa | 3,004 | — | 3,004 | 3,002 | — | 3,002 | ||||||||||||||||||
Mr. Francisco Luzón López | 11,670 | — | 11,670 | 9,230 | — | 9,230 | ||||||||||||||||||
Mr. Juan Rodríguez Inciarte | 321 | — | 321 | 370 | — | 370 | ||||||||||||||||||
Mr. Luis Alberto Salazar-Simpson Bos | 3 | — | 3 | 401 | — | 401 | ||||||||||||||||||
Ms. Isabel Tocino Biscarolasaga | 322 | — | 322 | 30 | — | 30 | ||||||||||||||||||
|
|
|
|
|
|
|
|
|
|
|
| |||||||||||||
| 18,702 | 1 | 18,703 | 14,639 | 1 | 14,640 | |||||||||||||||||||
|
|
|
|
|
|
|
|
|
|
|
| |||||||||||||
| Thousands of euros | ||||||||||||||||||||||||
| 2013 | 2012 | |||||||||||||||||||||||
| Loans and credits | Guarantees | Total | Loans and credits | Guarantees | Total | |||||||||||||||||||
Mr Javier Marín Romano (1) | 707 | — | 707 | — | — | — | ||||||||||||||||||
Mr Matías Rodríguez Inciarte | 17 | — | 17 | 13 | — | 13 | ||||||||||||||||||
Ms Ana Patricia Botín-Sanz de Sautuola y O’Shea | — | — | — | 7 | — | 7 | ||||||||||||||||||
Mr Javier Botín-Sanz de Sautuola y O’Shea | 22 | — | 22 | 13 | — | 13 | ||||||||||||||||||
Mr Vittorio Corbo Lioi | 4 | — | 4 | — | — | — | ||||||||||||||||||
Mr Rodrigo Echenique Gordillo | 650 | — | 650 | 1,178 | — | 1,178 | ||||||||||||||||||
Mr Ángel Jado Becerro de Bengoa | 7 | — | 7 | 7 | — | 7 | ||||||||||||||||||
Mr Juan Rodríguez Inciarte | 4,734 | — | 4,734 | 5,313 | — | 5,313 | ||||||||||||||||||
Ms Isabel Tocino Biscarolasaga | 20 | — | 20 | 42 | — | 42 | ||||||||||||||||||
Mr Alfredo Sáenz Abad (2) | — | — | — | 17 | — | 17 | ||||||||||||||||||
|
|
|
|
|
|
|
|
|
|
|
| |||||||||||||
| 6,161 | — | 6,161 | 6,591 | — | 6,591 | |||||||||||||||||||
|
|
|
|
|
|
|
|
|
|
|
| |||||||||||||
| (1) | Appointed chief executive officer on April 29, 2013. |
| (2) | Retired from the board on April 29, 2013. |
| g) | Senior managers |
Following is a detail of the maximum remuneration approved for the Bank’s executive vice presidents(*) in 20112013 and 2010:2012:
| Number of managers (1) | Thousands of euros | |||||||||||||||||||||||||||||||||||
| Salaries | Other remuneration (4) | Total | ||||||||||||||||||||||||||||||||||
| Variable - Immediate payment | Variable - Deferred payment | |||||||||||||||||||||||||||||||||||
| Fixed | In cash | In shares | In cash | In shares | Total | |||||||||||||||||||||||||||||||
2010 | 23 | 23,756 | 28,484 | — | — | 26,697 | (2) | 78,937 | 5,510 | 84,447 | ||||||||||||||||||||||||||
2011 | 22 | 23,095 | 12,584 | (3) | 12,584 | 12,584 | 12,584 | 73,431 | 7,887 | 81,318 | ||||||||||||||||||||||||||
| Number of managers (1) | Thousands of euros | |||||||||||||||||||||||||||||||||||||
| Salaries | Other remuneration (3) | Total | ||||||||||||||||||||||||||||||||||||
| Fixed | Variable - Immediate payment | Variable - Deferred payment(2) | Total | |||||||||||||||||||||||||||||||||||
| In cash | In shares | In cash | In shares | |||||||||||||||||||||||||||||||||||
| 2013 | 28 | 26,040 | 9,521 | 9,521 | 9,588 | 9,588 | 64,257 | 8,416 | 72,673 | |||||||||||||||||||||||||||||
| 2012 | 24 | 24,580 | 10,689 | 10,689 | 10,769 | 10,769 | 67,495 | 6,615 | 74,111 | |||||||||||||||||||||||||||||
| (*) | Excluding executive directors’ remuneration, which is detailed above. |
| (1) | At some point in the year they occupied the position of executive vice president. The amounts reflect the remuneration for the full year regardless of the number of months in which the position of executive vice president was occupied. |
| (2) |
|
The shareholders at the annual general |
Includes other remuneration items, such as life insurance premiums amounting to EUR |
Following is a detail of the maximum number of Santander shares that the Bank’s executive vice presidents (excluding executive directors) were entitled to receive at December 31, 20112013 and 20102012 relating to the deferred portion under the various plans then in force (see Note 47):
F-78
Maximum number of shares to be delivered | 12/31/11 | 12/31/10 | ||||||
Plan I11 | — | 1,226,754 | ||||||
Plan I12 | 1,468,762 | (1) | 1,468,762 | |||||
Plan I13 | 1,468,762 | (2) | 1,468,762 | |||||
First cycle of obligatory investment | — | 261,681 | ||||||
Second cycle of obligatory investment | 452,994 | 508,764 | ||||||
Third cycle of obligatory investment | 293,140 | 330,104 | ||||||
Deferred conditional delivery plan | 1,496,628 | (3) | 1,496,628 | |||||
Deferred variable remuneration plan | 2,119,944 | (4) | — | |||||
Maximum number of shares to be delivered | 12/31/13 | 12/31/12 | ||||||
Plan I13 | — | 1,463,987 | (1) | |||||
Third cycle - obligatory investment plan | — | 286,317 | ||||||
Deferred conditional delivery plan (2010) | 482,495 | 980,780 | (2) | |||||
Deferred conditional variable remuneration plan (2011) | 1,480,251 | (5) | 2,076,477 | (3) | ||||
Deferred conditional variable remuneration plan (2012) | 1,660,832 | (5) | 1,622,485 | (4) | ||||
Deferred conditional variable remuneration plan (2013) | 1,341,718 | (6) | — | |||||
| (1) | In addition, they |
| (2) | In addition, they |
| (3) | In addition, they |
| (4) | In addition, they |
| (5) | For the executives who joined from Banesto, the Banesto shares were converted into Santander shares at EUR 0.633 per share. |
| (6) | In addition, they were entitled to a maximum of 165,000 Santander Brasil shares at December 31, 2013 and to a maximum of 844,070 options on Santander Brasil shares (344,070 under the share option plan approved in 2011, the exercise of which, subject to the plan’s terms and conditions, may commence in July 2014, plus 500,000 under the share option plan approved in 2013, the exercise of which, subject to the plan’s terms and conditions, may commence in July 2016). |
In 20112013 and 2010,2012, since the conditions established in the relatedcorresponding deferred share-based remuneration schemes fromfor prior years had been met, in addition to the payment of the related cash amounts, the following number of Santander shares was delivered to the executive vice presidents:
Number of shares delivered | 2011 | 2010 | ||||||
Plan I10 | — | 1,078,730 | ||||||
Plan I11 | 1,042,130 | (1) | — | |||||
First cycle of obligatory investment | 232,852 | — | ||||||
Number of shares delivered | 2013 | 2012 | ||||||
Plan I12 | — | 439,195 | (1) | |||||
Second cycle - obligatory investment plan | — | 442,319 | ||||||
Third cycle - obligatory investment plan | 275,325 | — | ||||||
Deferred conditional delivery plan (2010) | 482,494 | (3) | 490,388 | (2) | ||||
Deferred conditional variable remuneration plan (2011) | 708,375 | (4) | — | |||||
| (1) | In addition, |
| (2) | In addition, 14,705 Banesto shares were delivered. |
| (3) | In addition, 14,705 Banesto shares were delivered. |
| (4) | In addition, 50,159 Banesto shares were delivered. |
The actuarial liability recognizedAs indicated in respectNote 5.c, in 2012 the contracts of post-employment benefits earned bythe members of the Bank’s executive vice presidents totalledsenior management which provided for defined-benefit pension obligations were amended to convert these obligations into a defined-contribution employee welfare system, which was externalized to Santander Seguros y Reaseguros Compañía Aseguradora, S.A. The new system grants the senior executives the right to receive a pension benefit upon retirement, regardless of whether or not they are in the Bank’s employ on that date, based on the contributions made to the aforementioned system, and replaces the right to receive a pension supplement which had previously been payable to them upon retirement. The new system expressly excludes any obligation of the Bank to the executives other than the conversion of the previous system into the new employee welfare system, which took place in 2012, and, as the case may be, the annual contributions to be made. In the event of pre-retirement, the senior executives who have not exercised the option described in Note 5.c are entitled to an annual emolument until the date of retirement.
The senior executives’ beginning balance under the new employee welfare system amounted to EUR 267 million287 million. This balance reflects the market value, at the date of conversion of the former pension obligations into the new employee welfare system, of the assets in which the provisions for the respective accrued obligations had been invested. The balance at December 31, 2011 (December 31, 2010: EUR 227 million). Settlements of EUR 47 million took place in 2010. The net charge to the consolidated income statement2013 amounted to EUR 29 million312 million.
The contracts of the senior executives who had not exercised the option referred to in 2011 (2010: EUR 31 million). Note 5.c) prior to the conversion of the defined-benefit pension obligations into the current welfare system include a supplementary welfare regime for the contingencies of death (surviving spouse and child benefits) and permanent disability of serving executives.
Additionally, the total sum insured under life and accident insurance policies relating to this group of employees amounted to EUR 6692 million at December 31, 20112013 (December 31, 2010:2012: EUR 6173 million).
Lastly, settlements of EUR 10.7 million took place in 2012. The net charge to the consolidated income statement amounted to EUR 19.7 million in 2013 (2012: EUR 17.5 million).
| h) | Post-employment benefits to former directors and former executive vice presidents |
The post-employment benefits paid and settlements madepaid in 20112013 to former directors of the Bank, other than those detailed in Note 5.c) and below3, amounted to EUR 7.2 million (2012: EUR 10 million). Also, the post-employment benefits and settlements paid in 2013 to former executive vice presidents amounted to EUR 7.921 million and(2012: EUR 7.8 million, respectively (2010:7.1 million).
In 2013 a release of EUR 7.9 million and EUR 33 million, respectively).
The amounts707 thousand was recognized in the consolidated income statement for 2011 in connection with the provisions for the Group’s pension and similar obligations to former directors of the Bank (including the insurance premiums for the supplementary surviving spouse/child and former executive vice presidents were zeropermanent disability benefits), and a period provision of EUR 4091,153 thousand respectively (2010: releasewas recognized in relation to former executive vice presidents (2012: period provisions of EUR 1732 thousand and a zero period provision,EUR 509 thousand were recognized, respectively).
Furthermore, Provisions—Provisions - Provision for pensions and similar obligations in the consolidated balance sheet at December 31, 20112013 included EUR 78 million and EUR 12093 million in respect of the post-employment benefit obligations to former directors of the Bank (December 31, 2012: EUR 162 million, including those relating to Mr Francisco Luzón) and EUR 121 million corresponding to former executive vice presidents respectively (2010:(2012: EUR 82.3 million and EUR 116.8 million, respectively)120 million).
F-79
| i) |
The Bank has signed contracts with all its executive directors. The Bank’sfollowing executive directors have indefinite-term employment contracts. Executive directors whose contracts are terminated voluntarily or due to breach of duties are not entitled to receive any economic compensation. Under current conditions, if the contracts are terminated for reasons attributable to the Bank or due to objective circumstances (such as those affecting the executive directors’ functional and organic statute), the directors are entitled, at the date of termination of their employment relationship with the Bank, to the following:
In the cases of Mr. Emilio Botín-Sanz de Sautuola y García de los Ríos and Mr. Alfredo Sáenz Abad, to retire and to receive the amounts relating to the accrued pensions in a lump sum (EUR 25,400 thousand and EUR 87,758 thousand, respectively), without any additional amounts accruing in respect of pensions from the effective date for economic purposes of exercise of the consolidation option referred to in Note 5.c.
Had Mr. Alfredo Sáenz Abad’s contract been terminated in 2009, he would have been able to choose between retiring or receiving severance pay equivalent to 40% of his fixed annual salary multiplied by the number of years’ service in banking, up to a maximum of ten times his fixed annual salary. However, Mr. Alfredo Sáenz Abad waived his right to receive this severance pay.
In the case of Mr. Matías Rodríguez Inciarte, to take pre-retirement and to receive the amount relating to the accrued pension in a lump sum (EUR 45,224 thousand), without any additional amounts accruing in respect of pensions from the effective date for economic purposes of exercise of the consolidation option referred to in Note 5.c.
At December 31, 2009, Mr. Matías Rodríguez Inciarte would have beenwill be entitled to take pre-retirement andin the event of termination for reasons other than voluntary termination or breach of duties, in which case they will be entitled to accruethe benefits indicated below:
In the case of Ms.Ms Ana Patricia Botín-Sanz de Sautuola y O’Shea pursuantwill be entitled to a change in her contract approved by the directors at the board meeting held on January 24, 2011, following the report of the appointments and remuneration committee, to take pre-retirement and to accrue a pension supplement. At December 31, 2011, thean annual pension supplementemolument that would amount to EUR 2,5572,692 thousand at December 31, 2013 (December 31, 2010:2012: EUR 2,556 thousand; December 31, 2009: EUR 1,8412,645 thousand).
At December 31, 2009, Ms. Ana Patricia Botín-Sanz de Sautuola y O’Shea was entitled to receive a termination benefit amounting to five years’ annual fixed salary at the date of termination -EUR 6,472 thousand-, although this entitlement to termination benefit ceased as a result of the change in her contract.
In the case of Mr.Mr Juan Rodríguez Inciarte pursuantwill be entitled to a change in his contract approved by the directors at the board meeting held on January 24, 2011, following the report of the appointments and remuneration committee, to take pre-retirement and to accrue a pension supplement. At December 31, 2011, thean annual pension supplementemolument that would amount to EUR 948987 thousand at December 31, 2013 (December 31, 2010:2012: EUR 908 thousand; December 31, 2009: EUR 869987 thousand).
At December 31, 2009, Mr. Juan Rodríguez Inciarte was entitled to receive a termination benefit amounting to five years’ annual fixed salary at the date of termination—EUR 4,936 thousand-, although this entitlement to termination benefit ceased as a result of the change in his contract.
If Ms.Mr Javier Marín Romano, Ms Ana Patricia Botín-Sanz de Sautuola y O’Shea or Mr.Mr Juan Rodríguez Inciarte retire or take pre-retirement, they have the right to opt to receive the pensions accrued -or similar amounts-annual emoluments in the form of an annuity or a lump sum -i.e. in a single payment- in full but not in part.
| 3 | In January 2013, upon his retirement, Mr Francisco Luzón López requested payment of the pensions to which he was entitled in a lump sum (EUR 65.4 million gross). For such purpose, his pension rights were settled, in accordance with the applicable contractual and legal terms, through: i) the payment in cash of EUR 21.1 million relating to the net amount of the pension calculated taking into account the fixed remuneration and the bylaw-stipulated emoluments, and EUR 7.1 million relating to the net amount of the pension calculated taking into account the accrued variable remuneration at the retirement date, ii) the investment by Mr Luzón of those EUR 7.1 million in Santander shares (1,144,110 shares), which shall be deposited on a restricted basis until 23 January 2017 and iii) the investment by the Bank of the gross remaining amount of the pension (EUR 6.6 million), calculated taking into account the unaccrued variable remuneration, in Santander shares (1,061,602 shares) that will be delivered to Mr Luzón (subject to the same restriction period mentioned above and net of tax) or will ultimately remain in the Bank’s possession depending on whether or not the variable remuneration giving rise to them finally accrues to him. Of these 1,061,602 shares, to date 400,148 have been delivered to Mr Luzón, on the accrual of the variable remuneration giving rise to them, and have been deposited on a restricted basis until 23 January 2017. |
For their part, without prejudicethe other executive directors may take retirement at any time and, therefore, claim from the insurer the benefits corresponding to them under the externalized employee welfare system described in Note 5.c, with no obligation whatsoever being incumbent upon the Bank in such circumstances.
| j) | Contract termination |
The executive directors and senior executives have indefinite-term employment contracts. Executive directors or senior executives whose contracts are terminated voluntarily or due to breach of duties are not entitled to receive any economic compensation. If the Bank terminates the contract for any other reason, they will be entitled only to the right to exercise their respective options, after reaching the age of 60 (see Note 5.c).corresponding legally-stipulated termination benefit.
Mr. Francisco Luzón López retired as a director and executive vice president on January 23, 2012 (see Note 5.c).
F-80
Additionally, otherOther non-director members of the Group’s senior management, other than those whose contracts were amended in 2012 as indicated above, have contracts which entitle them, in certain circumstances, to receive benefitsan extraordinary contribution to their welfare system in the event of termination for reasons other than voluntary redundancy, retirement, disability or serious breach of duties. These benefits are recognized as a provision for pensions and similar obligations and as a staff cost only when the employment relationship between the Bank and its managersexecutives is terminated before the normal retirement date.
In accordance with the requirements of Articles 229 and 230 of the Spanish Limited Liability Companies Law, (Ley de Sociedades de Capital), in order to enhance the transparency of listed companies, following is a detail of the investments held by the directors and persons related to them in the share capital of entities engaging incompanies whose object is banking, financing or lending; and of the management or governing functions, if any, that the directors discharge thereat:
Director | Corporate name | Number of | Functions | |||||
| Bankinter, S.A.(1) | — | ||||||
| Bank of America Corporation | 560 | — | ||||||
| Santander Investment, S.A. | — | Chairman | ||||||
| Allfunds Bank, S.A. | |||||||
|
|
|
| Director (2)
| ||||
Ms Ana Patricia Botín-Sanz de Sautuola y O’Shea | 6,000,000 | — | ||||||
| Santander UK plc | — | |||||||
| ||||||||
| ||||||||
|
|
|
| |||||
| Bankinter, S.A. | |||||||
| — | ||||||||
|
|
| ||||||
|
|
|
| |||||
F-81
|
| ||||||||
Lord Burns (Terence) | Lloyds Banking Group plc (*) | 3,745 | — | ||||||
Barclays plc (*)
| | 1,901
| —
| ||||||
| — | Chairman | ||||||||
| Banco Santander Chile | — | Director | ||||||
| Banco Santander (México), S.A. Institución de Banca Múltiple, Grupo Financiero Santander | — | Director(2) | |||||||
| Santander Consumo, S.A. de C.V., Sofom.e.r. | — | Director(2) | |||||||
| Santander Hipotecario, S.A. de C.V., Sofom.e.r. | — | Director(2) | |||||||
| Goldman Sachs & Co. (The Goldman Sachs Group. Inc.) | 19,546 | — | ||||||
| Banco | — | ||||||||
| Wells Fargo & Co. | 4,500 | — | ||||||
| — | |||||||||
|
|
| |||||||
| Santander Investment, S.A. | — | Director | |||||||
| Allfunds Bank, S.A. | — | Deputy chairman | |||||||
| Banco Santander International | — | Director | |||||||
| |||||||||
| |||||||||
| — | Director | ||||||||
| |||||||||
| — | |||||||||
| Banco Bilbao Vizcaya Argentaria, S.A. (*) | — | |||||||
| — | |||||||||
F-82
|
| |||||||
| Banco Bilbao Vizcaya Argentaria, S.A.(4) | — | ||||||
| Wells Fargo & Co. | 107 | — | ||||||
| Santander UK plc | — | Deputy chairman | ||||||
|
|
| ||||||
| Santander Consumer Finance, S.A. | — | Director | ||||||
| Banco Bilbao Vizcaya Argentaria, S.A. (*) | 367,234 | — | |||||
| HSBC Holdings plc | 14,254 | — | ||||||
| Lloyds Banking Group plc | 522 | — | ||||||
| Banco Bradesco S.A. (*) | 1,815 | — | ||||||
| Caixabank, S.A. (*) | 6,349 | — | ||||||
| Banco Popular Español, S.A. (*) | 14,380 | — | ||||||
| Banco Banif, S.A. | — | Chairman(2) | ||||||
| Santander Investment, S.A. | — | Deputy chairman(2) | ||||||
| Santander Private Banking S.p.A. | — | Chairman(2) | ||||||
Mr Manuel Soto Serrano(5) | Banco Bilbao Vizcaya Argentaria, S.A. | 183,214 | — | |||||
| Istituto per le Opere di Religione (IOR) | — | Member(5) | ||||||
Ms Isabel Tocino Biscarolasaga | Banco Bilbao Vizcaya Argentaria, S.A. | |||||||
| — | ||||||||
| (*) | Ownership interests held by related persons. |
| Non-executive. |
| Held jointly with a related person. |
| (5) | Retired from the board on April 29, 2013. Data at 2012 year-end. |
| (6) | Non-executive member of the control committee. |
None of the members of the board of directors perform, as independent professionals or as employees, any activities of the kind indicated in the foregoing table.
With regard to situations of conflict of interest, as stipulated in Article 30 of the Rules and Regulations of the Board, the directors must notify the board of any direct or indirect conflict with the interests of the Bank in which they may be involved. If the conflict arises from a transaction, the director shall not be allowed to conduct it unless the board, following a report from the appointments and remuneration committee, approves such transaction.
The director involved shall not participate in the deliberations and decisions on the transaction to which the conflict refers.
In the case of directors, the body responsible for resolving conflicts of interest is the board of directors itself.
In 2013, on the occasions listed below, certain directors abstained from participating in and voting on the deliberations of the meetings of the board of directors and its committees.
The board, without the involvement of the interested party, following a report by the appointments and remuneration committee, authorized the purchase on an arm’s-length basis of shares representing up to 0.25% of the Bank’s share capital by Espacio Activos Financieros, S.L.U., a company controlled indirectly by Mr Juan Miguel Villar Mir.
Also, 29 occasions involved proposals for the appointment or re-election of directors; 26 occasions related to the approval of remuneration conditions, and other terms and conditions of the directors’ contracts, including the authorization of the financing policy for executive directors; 18 occasions referred to the procedure required of the Bank, as a credit institution, to assess the suitability of the members of the board of directors and the holders of key functions, pursuant to Royal Decree 1245/1995, as worded in Royal Decree 256/2013; on 18 occasions the subject of debate were proposals to provide funding or guarantees for companies related to various directors; on five occasions the abstention occurred in connection with the annual verification of the directors’ status which, pursuant to Article 6.3 of the Rules and Regulations of the Board, the appointments and remuneration committee performed at its meeting of February 13, 2013; two occasions involved proposals for the appointment of two independent directors to positions at the Banco Santander Foundation and one related to the appointment of a relative of an executive director as a board member of a Group subsidiary; one occasion involved the approval of a contribution to a foundation chaired by a director; and a further three occasions involved the placing on record in the minutes the gratitude for the work performed by a director.
Lastly, Lord Burns abstained from participating in the resolutions adopted by the board in relation to his resignation as director with effect from December 31, 2013, and his appointment as a member of the international advisory board as from January 1, 2014.
| 6. | Loans and advances to credit institutions |
The detail, by classification, type and currency, of Loans and advances to credit institutions in the consolidated balance sheets is as follows:
| Millions of euros | ||||||||||||
| 2011 | 2010 | 2009 | ||||||||||
Classification: | ||||||||||||
Financial assets held for trading | 4,636 | 16,216 | 5,953 | |||||||||
Other financial assets at fair value through profit or loss | 4,701 | 18,831 | 16,243 | |||||||||
Loans and receivables | 42,389 | 44,808 | 57,641 | |||||||||
|
|
|
|
|
| |||||||
| 51,726 | 79,855 | 79,837 | ||||||||||
|
|
|
|
|
| |||||||
Type: | ||||||||||||
Reciprocal accounts | 2,658 | 1,264 | 713 | |||||||||
Time deposits | 11,419 | 13,548 | 21,382 | |||||||||
Reverse repurchase agreements | 10,647 | 36,721 | 29,490 | |||||||||
Other accounts | 27,002 | 28,322 | 28,252 | |||||||||
|
|
|
|
|
| |||||||
| 51,726 | 79,855 | 79,837 | ||||||||||
|
|
|
|
|
| |||||||
Currency: | ||||||||||||
Euro | 26,066 | 46,254 | 50,346 | |||||||||
Pound sterling | 4,481 | 8,100 | 4,632 | |||||||||
US dollar | 9,784 | 13,451 | 11,210 | |||||||||
Other currencies | 11,431 | 12,067 | 13,675 | |||||||||
Impairment losses | (36 | ) | (17 | ) | (26 | ) | ||||||
Of which: due to country risk | (2 | ) | (8 | ) | (8 | ) | ||||||
|
|
|
|
|
| |||||||
| 51,726 | 79,855 | 79,837 | ||||||||||
|
|
|
|
|
| |||||||
F-83
| Millions of euros | ||||||||||||
| 2013 | 2012 | 2011 | ||||||||||
Classification: | ||||||||||||
Financial assets held for trading | 5,503 | 9,843 | 4,636 | |||||||||
Other financial assets at fair value through profit or loss | 13,444 | 10,272 | 4,701 | |||||||||
Loans and receivables | 56,017 | 53,785 | 42,389 | |||||||||
|
|
|
|
|
| |||||||
| 74,964 | 73,900 | 51,726 | ||||||||||
|
|
|
|
|
| |||||||
Type: | ||||||||||||
Reciprocal accounts | 1,858 | 1,863 | 2,658 | |||||||||
Time deposits | 16,284 | 15,669 | 11,419 | |||||||||
Reverse repurchase agreements | 29,702 | 25,486 | 10,647 | |||||||||
Other accounts | 27,120 | 30,882 | 27,002 | |||||||||
|
|
|
|
|
| |||||||
| 74,964 | 73,900 | 51,726 | ||||||||||
|
|
|
|
|
| |||||||
Currency: | ||||||||||||
Euro | 33,699 | 36,955 | 26,066 | |||||||||
Pound sterling | 4,964 | 3,787 | 4,481 | |||||||||
US dollar | 14,915 | 13,567 | 9,784 | |||||||||
Other currencies | 21,423 | 19,621 | 11,431 | |||||||||
Impairment losses (Note 10) | (37 | ) | (30 | ) | (36 | ) | ||||||
Of which: due to country risk | (11 | ) | — | (2 | ) | |||||||
|
|
|
|
|
| |||||||
| 74,964 | 73,900 | 51,726 | ||||||||||
|
|
|
|
|
| |||||||
The loans and advances to credit institutions classified under Financial assets held for trading consist mainly of securities of foreign institutions purchasedacquired under reverse repurchase agreements, and time deposits, whereas those classified under Other financial assets at fair value through profit or loss consist of securitiesassets of Spanish public sector entities and otherforeign institutions purchasedacquired under reverse repurchase agreements.
The loans and advances to credit institutions classified under Loans and receivables are mainly guarantees given in cashdeposits to credit institutions and time deposits.
The impairment losses on financial assets classified as loansrecognized in Loans and receivables are disclosed in Note 10.
Note 51 contains a detail of the residual maturity periods of loansLoans and receivables and of the related average interest rates.
| 7. | Debt instruments |
a) Breakdown
| a) | Detail |
The detail, by classification, type and currency, of Debt instruments in the consolidated balance sheets is as follows:
| Millions of euros | ||||||||||||
| 2011 | 2010 | 2009 | ||||||||||
Classification: | ||||||||||||
Financial assets held for trading | 52,704 | 57,872 | 49,921 | |||||||||
Other financial assets at fair value through profit or loss | 2,649 | 4,605 | 7,365 | |||||||||
Available-for-sale financial assets | 81,589 | 79,689 | 79,289 | |||||||||
Loans and receivables | 6,840 | 8,429 | 14,959 | |||||||||
|
|
|
|
|
| |||||||
| 143,782 | 150,595 | 151,534 | ||||||||||
|
|
|
|
|
| |||||||
Type: | ||||||||||||
Spanish government debt securities | 39,309 | 35,663 | 38,313 | |||||||||
Foreign government debt securities | 60,553 | 63,602 | 44,007 | |||||||||
Issued by financial institutions | 16,324 | 23,761 | 39,853 | |||||||||
Other fixed-income securities | 27,847 | 27,713 | 29,528 | |||||||||
Impairment losses | (251 | ) | (144 | ) | (167 | ) | ||||||
|
|
|
|
|
| |||||||
| 143,782 | 150,595 | 151,534 | ||||||||||
|
|
|
|
|
| |||||||
Currency: | ||||||||||||
Euro | 61,577 | 61,844 | 72,745 | |||||||||
Pound sterling | 5,394 | 11,125 | 11,882 | |||||||||
US dollar | 20,383 | 23,442 | 25,745 | |||||||||
Other currencies | 56,679 | 54,328 | 41,329 | |||||||||
Impairment losses | (251 | ) | (144 | ) | (167 | ) | ||||||
|
|
|
|
|
| |||||||
| 143,782 | �� | 150,595 | 151,534 | |||||||||
|
|
|
|
|
| |||||||
Classification: Financial assets held for trading Other financial assets at fair value through profit or loss Available-for-sale financial assets Loans and receivables Type: Spanish government debt securities Foreign government debt securities Issued by financial institutions Other fixed-income securities Impairment losses Currency: Euro Pound sterling US dollar Other currencies Impairment losses At December 31, 2011, the nominal amount of Spanish government debt securities assigned to certain own or third-party commitments amounted to EUR 2,540 million (December 31, 2010: EUR 3,684 million; December 31, 2009: EUR 16,509 million). Millions of euros 2013 2012 2011 40,841 43,101 52,704 3,875 3,460 2,649 79,844 87,724 81,589 7,886 7,059 6,840 132,446 141,344 143,782 32,880 37,141 39,309 59,660 67,222 60,553 17,206 12,297 16,324 22,907 24,828 27,847 (207 ) (144 ) (251 ) 132,446 141,344 143,782 63,263 63,169 61,577 7,709 9,240 5,394 14,195 18,183 20,383 47,486 50,896 56,679 (207 ) (144 ) (251 ) 132,446 141,344 143,782
Additionally, at December 31, 2011 other debt securities totalling EUR 41,359 million had been assigned to own obligations (December 31, 2010: EUR 23,350 million; December 31, 2009: EUR 23,152 million), mainly as security for credit facilities received by the Group.
F-84
b) Breakdown
| b) | Breakdown |
The detail,breakdown, by origin of the issuer, of Debt instruments at December 31, 20112013, 2012 and 2010,2011, net of impairment losses, is as follows:
| Millions of euros | ||||||||||||||||||||||||||||||||||||||||||||||||||||||||||||||||||||||||||||||||
| Millions of euros | 2013 | 2012 | 2011 | |||||||||||||||||||||||||||||||||||||||||||||||||||||||||||||||||||||||||||||
| 2011 | 2010 | Private fixed- income | Public fixed- income | Total | % | Private fixed- income | Public fixed- income | Total | % | Private fixed- income | Public fixed- income | Total | % | |||||||||||||||||||||||||||||||||||||||||||||||||||||||||||||||||||
| Private fixed- income | Public fixed- income | Total | % | Private fixed- income | Public fixed- income | Total | % | |||||||||||||||||||||||||||||||||||||||||||||||||||||||||||||||||||||||||
Spain | 8,409 | 39,309 | 47,718 | 33.19 | % | 7,915 | 35,663 | 43,578 | 28.94 | % | 11,752 | 32,880 | 44,632 | 33.70 | % | 10,046 | 37,141 | 47,187 | 33.38 | % | 8,409 | 39,309 | 47,718 | 33.19 | % | |||||||||||||||||||||||||||||||||||||||||||||||||||||||
United States | 11,147 | 2,030 | 13,177 | 9.16 | % | 10,793 | 2,953 | 13,746 | 9.13 | % | 5,945 | 3,997 | 9,942 | 7.51 | % | 5,994 | 6,965 | 12,959 | 9.17 | % | 11,147 | 2,030 | 13,177 | 9.16 | % | |||||||||||||||||||||||||||||||||||||||||||||||||||||||
United Kingdom | 8,529 | 1,654 | 10,183 | 7.08 | % | 14,721 | 4,170 | 18,891 | 12.54 | % | 3,268 | 5,112 | 8,380 | 6.33 | % | 3,865 | 7,528 | 11,393 | 8.06 | % | 8,529 | 1,654 | 10,183 | 7.08 | % | |||||||||||||||||||||||||||||||||||||||||||||||||||||||
Portugal | 3,704 | 1,824 | 5,528 | 3.84 | % | 6,108 | 2,819 | 8,927 | 5.93 | % | 2,634 | 3,465 | 6,099 | 4.60 | % | 2,843 | 2,217 | 5,060 | 3.58 | % | 3,704 | 1,824 | 5,528 | 3.84 | % | |||||||||||||||||||||||||||||||||||||||||||||||||||||||
Poland | 723 | 5,184 | 5,907 | 4.46 | % | 462 | 2,611 | 3,073 | 2.17 | % | 108 | 3,649 | 3,757 | 2.61 | % | |||||||||||||||||||||||||||||||||||||||||||||||||||||||||||||||||
Italy | 545 | 653 | 1,198 | 0.83 | % | 289 | 767 | 1,056 | 0.70 | % | 733 | 2,857 | 3,590 | 2.71 | % | 375 | 619 | 994 | 0.70 | % | 545 | 653 | 1,198 | 0.83 | % | |||||||||||||||||||||||||||||||||||||||||||||||||||||||
Ireland | 642 | — | 642 | 0.45 | % | 570 | — | 570 | 0.38 | % | 848 | — | 848 | 0.64 | % | 739 | — | 739 | 0.52 | % | 642 | — | 642 | 0.45 | % | |||||||||||||||||||||||||||||||||||||||||||||||||||||||
Greece | — | 84 | 84 | 0.06 | % | — | 177 | 177 | 0.12 | % | — | — | — | — | — | — | — | — | — | 84 | 84 | 0.06 | % | |||||||||||||||||||||||||||||||||||||||||||||||||||||||||
Other European countries | 3,437 | 7,823 | 11,260 | 7.83 | % | 4,377 | 6,192 | 10,569 | 7.02 | % | 5,357 | 3,607 | 8,964 | 6.77 | % | 4,244 | 6,009 | 10,253 | 7.25 | % | 3,329 | 4,174 | 7,503 | 5.22 | % | |||||||||||||||||||||||||||||||||||||||||||||||||||||||
Brazil | 4,867 | 29,607 | 34,474 | 23.98 | % | 2,504 | 30,948 | 33,452 | 22.21 | % | 4,954 | 19,852 | 24,806 | 18.73 | % | 4,810 | 27,359 | 32,169 | 22.76 | % | 4,867 | 29,607 | 34,474 | 23.98 | % | |||||||||||||||||||||||||||||||||||||||||||||||||||||||
Mexico | 534 | 11,426 | 11,960 | 8.32 | % | 902 | 10,756 | 11,658 | 7.74 | % | 566 | 8,156 | 8,722 | 6.59 | % | 501 | 8,817 | 9,318 | 6.59 | % | 534 | 11,426 | 11,960 | 8.32 | % | |||||||||||||||||||||||||||||||||||||||||||||||||||||||
Chile | 577 | 2,528 | 3,105 | 2.16 | % | 1,084 | 2,281 | 3,365 | 2.23 | % | 1,467 | 1,272 | 2,739 | 2.07 | % | 1,377 | 2,124 | 3,501 | 2.48 | % | 577 | 2,528 | 3,105 | 2.16 | % | |||||||||||||||||||||||||||||||||||||||||||||||||||||||
Other American countries | 1,275 | 1,583 | 2,858 | 1.99 | % | 1,616 | 1,524 | 3,140 | 2.09 | % | 1,384 | 995 | 2,379 | 1.80 | % | 1,208 | 1,163 | 2,371 | 1.68 | % | 1,275 | 1,583 | 2,858 | 1.99 | % | |||||||||||||||||||||||||||||||||||||||||||||||||||||||
Rest of the world | 360 | 1,235 | 1,595 | 1.11 | % | 451 | 1,015 | 1,466 | 0.97 | % | 275 | 5,163 | 5,438 | 4.11 | % | 517 | 1,810 | 2,327 | 1.65 | % | 360 | 1,235 | 1,595 | 1.11 | % | |||||||||||||||||||||||||||||||||||||||||||||||||||||||
|
|
|
|
|
|
|
|
|
|
|
|
|
|
|
|
|
|
|
| |||||||||||||||||||||||||||||||||||||||||||||||||||||||||||||
| 44,026 | 99,756 | 143,782 | 100.00 | % | 51,330 | 99,265 | 150,595 | 100.00 | % | 39,906 | 92,540 | 132,446 | 100 | % | 36,981 | 104,363 | 141,344 | 100 | % | 44,026 | 99,756 | 143,782 | 100.00 | % | ||||||||||||||||||||||||||||||||||||||||||||||||||||||||
|
|
|
|
|
|
|
|
|
|
|
|
|
|
|
| �� |
|
|
|
| ||||||||||||||||||||||||||||||||||||||||||||||||||||||||||||
The detail, by issuer rating, of Debt instruments at December 31, 20112013, 2012 and 20102011 is as follows:
| Millions of euros | ||||||||||||||||||||||||||||||||
| 2011 | 2010 | |||||||||||||||||||||||||||||||
| Private fixed- income | Public fixed- income | Total | % | Private fixed- income | Public fixed- income | Total | % | |||||||||||||||||||||||||
AAA | 19,250 | 5,205 | 21,906 | 15.23 | % | 25,618 | 14,036 | 39,654 | 26.33 | % | ||||||||||||||||||||||
AA | 2,056 | 3,885 | 5,631 | 3.92 | % | 5,428 | 35,842 | 41,270 | 27.41 | % | ||||||||||||||||||||||
A (*) | 9,457 | 45,489 | 56,331 | 39.18 | % | 6,152 | 6,067 | 12,219 | 8.11 | % | ||||||||||||||||||||||
BBB (**) | 2,739 | 42,377 | 47,977 | 33.37 | % | 6,217 | 41,734 | 47,951 | 31.84 | % | ||||||||||||||||||||||
Below BBB | 2,196 | 2,800 | 4,898 | 3.41 | % | 1,040 | 1,586 | 2,626 | 1.74 | % | ||||||||||||||||||||||
Unrated | 8,328 | — | 7,039 | 4.89 | % | 6,875 | — | 6,875 | 4.57 | % | ||||||||||||||||||||||
|
|
|
|
|
|
|
|
|
|
|
|
|
|
|
| |||||||||||||||||
| 44,026 | 99,756 | 143,782 | 100.00 | % | 51,330 | 99,265 | 150,595 | 100.00 | % | |||||||||||||||||||||||
|
|
|
|
|
|
|
|
|
|
|
|
|
|
|
| |||||||||||||||||
| Millions of euros | ||||||||||||||||||||||||||||||||||||||||||||||||
| 2013 | 2012 | 2011 | ||||||||||||||||||||||||||||||||||||||||||||||
| Private fixed- income | Public fixed- income | Total | % | Private fixed- income | Public fixed- income | Total | % | Private fixed- income | Public fixed- income | Total | % | |||||||||||||||||||||||||||||||||||||
AAA | 10,357 | 7,847 | 18,204 | 13.74 | % | 15,754 | 11,711 | 27,465 | 19.43 | % | 19,250 | 5,205 | 24,455 | 17.01 | % | |||||||||||||||||||||||||||||||||
AA | 2,884 | 11,304 | 14,188 | 10.71 | % | 714 | 12,724 | 13,438 | 9.51 | % | 2,056 | 3,885 | 5,941 | 4.13 | % | |||||||||||||||||||||||||||||||||
A | 5,036 | 5,184 | 10,220 | 7.72 | % | 5,524 | 2,611 | 8,135 | 5.76 | % | 9,457 | 45,489 | 54,946 | 38.21 | % | |||||||||||||||||||||||||||||||||
BBB | 7,158 | 64,341 | 71,499 | 53.98 | % | 3,460 | 74,435 | 77,895 | 55.11 | % | 2,739 | 42,377 | 45,116 | 31.38 | % | |||||||||||||||||||||||||||||||||
Below BBB | 6,386 | 3,864 | 10,250 | 7.74 | % | 4,052 | 2,882 | 6,934 | 4.90 | % | 2,196 | 2,800 | 4,996 | 3.47 | % | |||||||||||||||||||||||||||||||||
Unrated | 8,085 | — | 8,085 | 6.11 | % | 7,477 | — | 7,477 | 5.29 | % | 8,328 | — | 8,328 | 5.79 | % | |||||||||||||||||||||||||||||||||
|
|
|
|
|
|
|
|
|
|
|
|
|
|
|
|
|
|
|
|
|
|
|
| |||||||||||||||||||||||||
| 39,906 | 92,540 | 132,446 | 100.00 | % | 36,981 | 104,363 | 141,344 | 100.00 | % | 44,026 | 99,756 | 143,782 | 100.00 | % | ||||||||||||||||||||||||||||||||||
|
|
|
|
|
|
|
|
|
|
|
|
|
|
|
|
|
|
|
|
|
|
|
| |||||||||||||||||||||||||
The distribution of exposure by rating shown in the foregoing table has been affected by the various reviews of sovereign issuer ratings conducted in recent years, the main reviews having been those of Spain (from A in 2011 to BBB in 2012) and Chile (from A in 2011 to AA in 2012). Also, at December 31, 2013 the exposures with BBB ratings included mainly, in addition to the Spanish sovereign exposures, the sovereign exposures in Mexico and Brazil, while those with ratings below BBB included the Portuguese sovereign exposures (BB).
F-85
The detail, by type of financial instrument, of Private fixed-income securities at December 31, 20112013, 2012 and 2010,2011, net of impairment losses, is as follows:
| Millions of euros | Millions of euros | |||||||||||||||||||
| 2011 | 2010 | 2013 | 2012 | 2011 | ||||||||||||||||
Securitised mortgage bonds | 7,080 | 6,830 | ||||||||||||||||||
Securitized mortgage bonds | 2,936 | 6,835 | 7,080 | |||||||||||||||||
Other asset-backed bonds | 3,100 | 2,815 | 2,781 | 1,497 | 3,100 | |||||||||||||||
Floating rate debt | 16,668 | 19,476 | 10,857 | 15,883 | 16,668 | |||||||||||||||
Fixed rate debt | 17,178 | 22,209 | 23,332 | 12,766 | 17,178 | |||||||||||||||
|
|
|
|
| ||||||||||||||||
Total | 44,026 | 51,330 | 39,906 | 36,981 | 44,026 | |||||||||||||||
|
|
|
|
| ||||||||||||||||
c) Impairment losses
| c) | Impairment losses |
The changes in the impairment losses on Available-for-sale financial assets—assets - Debt instruments are summarisedsummarized below:
| Millions of euros | ||||||||||||||||||||||||
| Millions of euros | 2013 | 2012 | 2011 | |||||||||||||||||||||
| 2011 | 2010 | 2009 | ||||||||||||||||||||||
Balance at beginning of year | 119 | 167 | 181 | 129 | 235 | 119 | ||||||||||||||||||
Net impairment losses for the year | 124 | (9 | ) | (4 | ) | 72 | 13 | 124 | ||||||||||||||||
Of which: | ||||||||||||||||||||||||
Impairment losses charged to income | 125 | 14 | 42 | |||||||||||||||||||||
Impairment losses charged to income (Note 29) | 89 | 18 | 125 | |||||||||||||||||||||
Impairment losses reversed with a credit to income | (1 | ) | (22 | ) | (46 | ) | (18 | ) | (5 | ) | (1 | ) | ||||||||||||
Write-off of assets due to impairment | — | (20 | ) | — | ||||||||||||||||||||
Assets written off | — | (109 | ) | — | ||||||||||||||||||||
Exchange differences and other items | (8 | ) | (19 | ) | (10 | ) | (13 | ) | (10 | ) | (8 | ) | ||||||||||||
|
|
|
|
|
| |||||||||||||||||||
Balance at end of year | 235 | 119 | 167 | 188 | 129 | 235 | ||||||||||||||||||
|
|
| ||||||||||||||||||||||
|
|
| ||||||||||||||||||||||
Of which: | ||||||||||||||||||||||||
By geographical location of risk: | ||||||||||||||||||||||||
European Union | 155 | 48 | 98 | 105 | 51 | 155 | ||||||||||||||||||
Latin America | 80 | 71 | 69 | 83 | 78 | 80 | ||||||||||||||||||
Also, the impairment losses on Loans and receivables (EUR 1619 million, EUR 2515 million and EUR 016 million at December 31, 2011, 20102013, 2012 and 2009,2011, respectively) are disclosed in Note 10.
d) Other disclosures
| d) | Other information |
At December 31, 2013, the nominal amount of debt securities assigned to certain own or third-party commitments, mainly to secure financing facilities received by the Group, amounted to EUR 42,433 million. Of these debt securities, EUR 12,550 million related to Spanish government debt.
The detail, by term to maturity, of the debt instruments pledged as security for certain commitments, is as follows:
| Maturity | ||||||||||||||||||||||||||||||||
| 1 day | 1 week | 1 month | 3 months | 6 months | 1 year | More than 12 months | Total | |||||||||||||||||||||||||
Government debt securities | 11 | % | 53 | % | 16 | % | 13 | % | 4 | % | 0 | % | 2 | % | 100 | % | ||||||||||||||||
Other debt instruments | 65 | % | 4 | % | 2 | % | 4 | % | 11 | % | 4 | % | 10 | % | 100 | % | ||||||||||||||||
|
|
|
|
|
|
|
|
|
|
|
|
|
|
|
| |||||||||||||||||
Total | 12 | % | 45 | % | 20 | % | 12 | % | 5 | % | 3 | % | 2 | % | 100 | % | ||||||||||||||||
|
|
|
|
|
|
|
|
|
|
|
|
|
|
|
| |||||||||||||||||
There are no particular conditions relating to the pledge of these assets that need to be disclosed.
Note 29 contains a detail of the valuation adjustments recognized in equity on available-for-sale financial assets.
Note 51 contains a detail of the residual maturity periods of available-for-saleAvailable-for-sale financial assets and of loansLoans and receivables and of the related average interest rates.
Note 54 shows the Group’s total exposure, by origin of the issuer, to the so-called peripheral euro-zone countries.
F-86
| 8. | Equity instruments |
a) Breakdown
| a) | Breakdown |
The detail, by classification and type, of Equity instruments in the consolidated balance sheets is as follows:
| Millions of euros | ||||||||||||
| 2011 | 2010 | 2009 | ||||||||||
Classification: | ||||||||||||
Financial assets held for trading | 4,744 | 8,850 | 9,248 | |||||||||
Other financial assets at fair value through profit or loss | 465 | 8,267 | 5,877 | |||||||||
Available-for-sale financial assets | 5,024 | 6,546 | 7,331 | |||||||||
|
|
|
|
|
| |||||||
| 10,233 | 23,663 | 22,456 | ||||||||||
|
|
|
|
|
| |||||||
Type: | ||||||||||||
Shares of Spanish companies | 2,960 | 4,778 | 4,982 | |||||||||
Shares of foreign companies | 4,582 | 6,469 | 7,526 | |||||||||
Investment fund units and shares | 2,691 | 4,560 | 4,255 | |||||||||
Other securities | — | 7,856 | 5,693 | |||||||||
Of which: unit linked (*) | — | 7,856 | 5,693 | |||||||||
|
|
|
|
|
| |||||||
| 10,233 | 23,663 | 22,456 | ||||||||||
|
|
|
|
|
| |||||||
| Millions of euros | ||||||||||||
| 2013 | 2012 | 2011 | ||||||||||
Classification: | ||||||||||||
Financial assets held for trading | 4,967 | 5,492 | 4,744 | |||||||||
Other financial assets at fair value through profit or loss | 866 | 688 | 465 | |||||||||
Available-for-sale financial assets | 3,955 | 4,542 | 5,024 | |||||||||
|
|
|
|
|
| |||||||
| 9,788 | 10,722 | 10,233 | ||||||||||
|
|
|
|
|
| |||||||
Type: | ||||||||||||
Shares of Spanish companies | 2,629 | 3,338 | 2,960 | |||||||||
Shares of foreign companies | 4,711 | 4,726 | 4,582 | |||||||||
Investment fund units and shares | 2,448 | 2,658 | 2,691 | |||||||||
|
|
|
|
|
| |||||||
| 9,788 | 10,722 | 10,233 | ||||||||||
|
|
|
|
|
| |||||||
Note 29 contains a detail of the valuation adjustments recognized in equity on available-for-sale financial assets, and also the related impairment losses.
| b) | Changes |
The changes in Available-for-sale financial assets-Equityassets - Equity instruments were as follows:
| Millions of euros | ||||||||||||
| 2011 | 2010 | 2009 | ||||||||||
Balance at beginning of year | 6,546 | 7,331 | 6,382 | |||||||||
Changes in the scope of consolidation | (493 | ) | — | 467 | ||||||||
Of which: | ||||||||||||
Metrovacesa (Note 3) | (402 | ) | — | — | ||||||||
Transfers (Note 13) | — | — | 53 | |||||||||
Net additions /(disposals) | (862 | ) | (1,077 | ) | (191 | ) | ||||||
Of which: | ||||||||||||
Cielo | — | (651 | ) | — | ||||||||
Metrovacesa | — | — | 938 | |||||||||
France Telecom | — | — | (378 | ) | ||||||||
Attijariwafa Bank | — | — | (367 | ) | ||||||||
Valuation adjustments | (167 | ) | 292 | 620 | ||||||||
|
|
|
|
|
| |||||||
Balance at end of year | 5,024 | 6,546 | 7,331 | |||||||||
|
|
|
|
|
| |||||||
| Millions of euros | ||||||||||||
| 2013 | 2012 | 2011 | ||||||||||
Balance at beginning of year | 4,542 | 5,024 | 6,546 | |||||||||
Changes in the scope of consolidation | — | — | (493 | ) | ||||||||
Of which: | ||||||||||||
Metrovacesa, S.A. (Note 3) | — | — | (402 | ) | ||||||||
Net additions (disposals) | (722 | ) | (666 | ) | (862 | ) | ||||||
Of which: | ||||||||||||
Sareb | 44 | 164 | — | |||||||||
Valuation adjustments | 135 | 184 | (167 | ) | ||||||||
|
|
|
|
|
| |||||||
Balance at end of year | 3,955 | 4,542 | 5,024 | |||||||||
|
|
|
|
|
| |||||||
The main acquisitions and disposals made in 2011, 20102013, 2012 and 20092011 were as follows:
i. France Telecom España, S.A. (France Telecom)
| i. | Sociedad de Gestión de Activos Procedentes de la Reestructuración Bancaria,S.A. (Sareb) |
On April 29, 2009,In December 2012 the Group, announced it hadtogether with other Spanish financial institutions, entered into an agreement with Atlas Services Nederland BV (a wholly-owned subsidiaryto invest in the Spanish Bank Restructuring Asset Management Company (Sareb). The Group undertook to make an investment of France Telecom)up to sellEUR 840 million (25% in capital and 75% in subordinated debt), and at December 31, 2012, it had paid EUR 164 million of capital and EUR 490 million of subordinated debt.
In February 2013, following the Group’s 5.01% ownership interest in France Telecom España, S.A. forreview of the own funds that Sareb required, the aforementioned undertaking was reduced to EUR 378 million. This transaction generated a loss for806 million, and the Group disbursed the remaining EUR 44 million of capital and EUR 14 million.
F-87
ii. Attijariwafa Bank Société Anonyme
On December 28, 2009, the Group sold to the Moroccan company Société Nationale d’Investissement (SNI) 10% of the share capital of Attijariwafa Bank for MAD 4,149.4 million (approximately EUR 367 million at the closing exchange rate). This transaction gave rise to a gain of EUR 218 million for Santander Group, which was recognized under Gains/(losses) on non-current assets held for sale not classified as discontinued operations in the consolidated income statement for 2009 (see Note 50).
iii. Cielo, S.A.
In July 2010 the Group entered into an agreement with Banco do Brasil S.A. and Banco Bradesco S.A. for the sale to these two entities of all the shares held by Santander Group in Cielo S.A.—formerly Visanet—(7.20% of the share capital). The agreed-upon sale price was BRL 1,487 million (approximately EUR 651 million), which gave rise to a gain of EUR 212 million, net of taxes and non-controlling interests.
c) Notifications of acquisitions of investments
| c) | Notifications of acquisitions of investments |
The notifications made by the Bank in 2011,2013, in compliance with Article 155 of the Spanish Limited Liability Companies Law (Ley de Sociedades de Capital) and Article 53 of Spanish Securities Market Law 24/1998 (Ley del Mercado de Valores),1988, of the acquisitions and disposals of holdings in investees are listed in Appendix IV.
| 9. | Trading derivatives (assets and liabilities) and Short positions |
a) Trading derivatives
| a) | Trading derivatives |
The detail, by type of inherent risk, of the fair value of the trading derivatives arranged by the Group is as follows (see Note 36):
| Millions of euros | ||||||||||||||||||||||||
| 2011 | 2010 | 2009 | ||||||||||||||||||||||
| Debit balance | Credit balance | Debit balance | Credit balance | Debit balance | Credit balance | |||||||||||||||||||
Interest rate risk | 79,212 | 79,090 | 51,675 | 52,117 | 43,413 | 43,136 | ||||||||||||||||||
Currency risk | 16,032 | 16,278 | 14,445 | 16,016 | 11,364 | 9,892 | ||||||||||||||||||
Price risk | 5,853 | 7,068 | 5,643 | 6,413 | 3,995 | 5,076 | ||||||||||||||||||
Other risks | 1,401 | 647 | 1,306 | 733 | 1,084 | 609 | ||||||||||||||||||
|
|
|
|
|
|
|
|
|
|
|
| |||||||||||||
| 102,498 | 103,083 | 73,069 | 75,279 | 59,856 | 58,713 | |||||||||||||||||||
|
|
|
|
|
|
|
|
|
|
|
| |||||||||||||
| Millions of euros | ||||||||||||||||||||||||
| 2013 | 2012 | 2011 | ||||||||||||||||||||||
| Debit balance | Credit balance | Debit balance | Credit balance | Debit balance | Credit balance | |||||||||||||||||||
Interest rate risk | 43,185 | 43,154 | 89,404 | 86,956 | 77,016 | 76,834 | ||||||||||||||||||
Currency risk | 11,315 | 10,181 | 16,516 | 16,692 | 16,032 | 16,278 | ||||||||||||||||||
Price risk | 3,247 | 4,609 | 3,289 | 5,081 | 5,853 | 7,068 | ||||||||||||||||||
Other risks | 1,152 | 943 | 1,110 | 1,014 | 3,597 | 2,903 | ||||||||||||||||||
|
|
|
|
|
|
|
|
|
|
|
| |||||||||||||
| 58,899 | 58,887 | 110,319 | 109,743 | 102,498 | 103,083 | |||||||||||||||||||
|
|
|
|
|
|
|
|
|
|
|
| |||||||||||||
F-88
b) Short positions
| b) | Short positions |
Following is a breakdown of the short positions:
| Millions of euros | ||||||||||||||||||||||||
| Millions of euros | 2013 | 2012 | 2011 | |||||||||||||||||||||
| 2011 | 2010 | 2009 | ||||||||||||||||||||||
Borrowed securities: | ||||||||||||||||||||||||
Debt instruments | 1,775 | 2,580 | 1,537 | 3,921 | 5,371 | 1,775 | ||||||||||||||||||
Of which: Santander UK plc | 850 | 1,173 | 896 | 3,260 | 4,989 | 850 | ||||||||||||||||||
Equity instruments | 572 | 279 | 106 | 189 | 551 | 572 | ||||||||||||||||||
Short sales: | ||||||||||||||||||||||||
Debt instruments | 7,836 | 9,443 | 3,497 | 11,840 | 9,259 | 7,836 | ||||||||||||||||||
Of which: Banco Santander | 6,560 | 9,200 | 2,530 | |||||||||||||||||||||
Of which: | ||||||||||||||||||||||||
Banco Santander, S.A. | 6,509 | 5,946 | 6,560 | |||||||||||||||||||||
Banco Santander (México), S.A., Institución de Banca Múltiple, Grupo Financiero Santander, Mexico | 2,882 | 3,266 | 1,235 | |||||||||||||||||||||
Banco Santander (Brasil), S.A. | 2,388 | — | — | |||||||||||||||||||||
Equity instruments | 4 | — | — | 1 | — | 4 | ||||||||||||||||||
|
|
|
|
|
| |||||||||||||||||||
| 10,187 | 12,302 | 5,140 | 15,951 | 15,181 | 10,187 | |||||||||||||||||||
|
|
|
|
|
| |||||||||||||||||||
| 10. | Loans and advances to customers |
a) Breakdown
| a) | Detail |
The detail, by classification, of Loans and advances to customers in the consolidated balance sheets is as follows:
| Millions of euros | ||||||||||||||||||||||||
| Millions of euros | 2013 | 2012 | 2011 | |||||||||||||||||||||
| 2011 | 2010 | 2009 | ||||||||||||||||||||||
Financial assets held for trading | 8,056 | 755 | 10,076 | 5,079 | 9,162 | 8,056 | ||||||||||||||||||
Other financial assets at fair value through profit or loss | 11,748 | 7,777 | 8,329 | 13,196 | 13,936 | 11,748 | ||||||||||||||||||
Loans and receivables | 730,296 | 715,621 | 664,146 | 650,581 | 696,014 | 728,737 | ||||||||||||||||||
Of which: | ||||||||||||||||||||||||
Disregarding impairment losses | 749,232 | 735,318 | 682,019 | 675,484 | 721,436 | 747,543 | ||||||||||||||||||
Impairment losses | (18,936 | ) | (19,697 | ) | (17,873 | ) | (24,903 | ) | (25,422 | ) | (18,806 | ) | ||||||||||||
Of which, due to country risk | (41 | ) | (41 | ) | (37 | ) | (31 | ) | (42 | ) | (41 | ) | ||||||||||||
|
|
|
|
|
| |||||||||||||||||||
| 750,100 | 724,153 | 682,551 | 668,856 | 719,112 | 748,541 | |||||||||||||||||||
|
|
|
|
|
| |||||||||||||||||||
Loans and advances to customers disregarding impairment losses | 769,036 | 743,850 | 700,424 | |||||||||||||||||||||
Loans and advances to customers disregarding impairment losses (*) | 693,759 | 744,534 | 767,347 | |||||||||||||||||||||
|
|
|
|
|
| |||||||||||||||||||
| (*) | Includes Valuation adjustments for accrued interest receivable and other items amounting to EUR 2,593 million at December 31, 2013 (2012: EUR 3,481 million; 2011: EUR 2,950 million). |
Note 51 contains a detail of the residual maturity periods of loans and receivables and of the related average interest rates.
Note 54 shows the Group’s total exposure, by origin of the issuer, to so-called peripheral euro-zone countries.issuer.
There are no loans and advances to customers for material amounts without fixed maturity dates.
F-89
b) Breakdown
| b) | Breakdown |
Following is a detail,breakdown, by loan type and status, borrower sector, geographical area of residence and interest rate formula, of the loans and advances to customers of the Group, which reflect the Group’s exposure to credit risk in its core business, disregarding impairment losses:
| Millions of euros | ||||||||||||||||||||||||
| Millions of euros | 2013 | 2012 | 2011 | |||||||||||||||||||||
| 2011 | 2010 | 2009 | ||||||||||||||||||||||
Loan type and status: | ||||||||||||||||||||||||
Commercial credit | 13,635 | 15,737 | 17,454 | 11,898 | 12,054 | 13,581 | ||||||||||||||||||
Secured loans | 448,681 | 430,072 | 411,778 | 396,432 | 428,259 | 446,882 | ||||||||||||||||||
Reverse repurchase agreements | 18,438 | 6,166 | 13,958 | 13,223 | 19,383 | 18,365 | ||||||||||||||||||
Other term loans (*) | 228,449 | 234,857 | 204,224 | |||||||||||||||||||||
Other term loans | 203,267 | 218,728 | 227,093 | |||||||||||||||||||||
Finance leases | 18,399 | 20,260 | 20,873 | 15,871 | 16,241 | 18,326 | ||||||||||||||||||
Receivable on demand | 10,147 | 8,850 | 8,088 | 10,155 | 11,087 | 8,893 | ||||||||||||||||||
Impaired assets | 31,287 | 27,908 | 24,049 | 40,320 | 35,301 | 31,257 | ||||||||||||||||||
|
|
| ||||||||||||||||||||||
| 769,036 | 743,850 | 700,424 | ||||||||||||||||||||||
|
|
| ||||||||||||||||||||||
By borrower sector: | ||||||||||||||||||||||||
Public sector—Spain (**) | 12,147 | 12,137 | 9,803 | |||||||||||||||||||||
Public sector—Other countries (***) | 4,394 | 3,527 | 2,861 | |||||||||||||||||||||
Individuals | 429,477 | 395,622 | 379,297 | |||||||||||||||||||||
Energy | 12,671 | 12,504 | 11,521 | |||||||||||||||||||||
Construction | 24,076 | 26,708 | 22,696 | |||||||||||||||||||||
Manufacturing | 49,209 | 47,568 | 40,534 | |||||||||||||||||||||
Services | 137,708 | 147,299 | 134,638 | |||||||||||||||||||||
Other sectors | 99,354 | 98,485 | 99,074 | |||||||||||||||||||||
Valuation adjustments for Accrued interest receivable and other items | 2,593 | 3,481 | 2,950 | |||||||||||||||||||||
|
|
|
|
|
| |||||||||||||||||||
| 769,036 | 743,850 | 700,424 | 693,759 | 744,534 | 767,347 | |||||||||||||||||||
|
|
|
|
|
| |||||||||||||||||||
Geographical area: | ||||||||||||||||||||||||
Spain | 214,558 | 227,613 | 230,345 | 173,852 | 200,014 | 214,558 | ||||||||||||||||||
European Union (excluding Spain) | 357,888 | 320,284 | 311,777 | 328,118 | 335,727 | 356,199 | ||||||||||||||||||
United States and Puerto Rico | 48,596 | 57,882 | 49,501 | 43,566 | 51,186 | 48,596 | ||||||||||||||||||
Other OECD countries | 7,760 | 6,432 | 5,256 | 9,184 | 10,894 | 7,760 | ||||||||||||||||||
Latin America | 136,434 | 122,940 | 96,470 | 129,529 | 138,071 | 136,434 | ||||||||||||||||||
Rest of the world | 3,800 | 8,699 | 7,075 | 9,510 | 8,642 | 3,800 | ||||||||||||||||||
|
|
|
|
|
| |||||||||||||||||||
| 769,036 | 743,850 | 700,424 | 693,759 | 744,534 | 767,347 | |||||||||||||||||||
|
|
|
|
|
| |||||||||||||||||||
Interest rate formula: | ||||||||||||||||||||||||
Fixed interest rate | 292,846 | 297,259 | 286,445 | |||||||||||||||||||||
Fixed rate | 280,188 | 299,937 | 292,373 | |||||||||||||||||||||
Floating rate | 476,190 | 446,591 | 413,979 | 413,571 | 444,597 | 474,974 | ||||||||||||||||||
|
|
|
|
|
| |||||||||||||||||||
| 769,036 | 743,850 | 700,424 | 693,759 | 744,534 | 767,347 | |||||||||||||||||||
|
|
|
|
|
| |||||||||||||||||||
At December 31, 2013, the Group had granted loans amounting to EUR 13,374 million (December 31, 2012: EUR 16,884 million; December 31, 2011: EUR 12,147 million) to the Spanish public sector (which had ratings of BBB, BBB and A at December 31, 2013, 2012 and 2011, respectively), and EUR 4,402 million to the public sector in other countries (December 31, 2012: EUR 4,983 million; December 31, 2011: EUR 4,394 million). At December 31, 2013, the breakdown of this amount by issuer rating was as follows: 12.8% AA, 0.8% A, 72.1% BBB and 14.2% below BBB.
At December 31, 2013, the Group had EUR 635,663 million of loans and advances to customers classified as other than non-performing (excluding loans granted to the public sector). The percentage breakdown of these loans and advances by counterparty credit quality is as follows: 8.29% AAA, 15.96% AA, 17.80% A, 24.36% BBB and 33.59% below BBB.
The above-mentioned ratings were obtained by converting the internal ratings awarded to customers by the Group into the external ratings classification established by Standard & Poor’s, in order to make them more readily comparable.
Following is a detail, by activity, of the loans and advances to customers at December 31, 2013, net of impairment losses:
| Millions of euros | ||||||||||||||||||||||||||||||||||||
| Total | Without collateral | Secured loans | ||||||||||||||||||||||||||||||||||
| Net exposure | Loan-to-value ratio (a) | |||||||||||||||||||||||||||||||||||
| Of which: Property collateral | Of which: Other collateral | Less than or equal to 40% | More than 40% and less than or equal to 60% | More than 60% and less than or equal to 80% | More than 80% and less than or equal to 100% | More than 100% | ||||||||||||||||||||||||||||||
Public sector | 17,756 | 16,834 | 107 | 815 | 316 | 333 | 30 | 29 | 214 | |||||||||||||||||||||||||||
Other financial institutions | 29,220 | 4,561 | 16,994 | 7,665 | 8,140 | 822 | 2,836 | 10,133 | 2,728 | |||||||||||||||||||||||||||
Non-financial companies and individual traders | 229,896 | 134,386 | 50,153 | 45,357 | 30,694 | 16,043 | 16,666 | 20,851 | 11,256 | |||||||||||||||||||||||||||
Of which: | ||||||||||||||||||||||||||||||||||||
Construction and property development | 20,738 | 3,581 | 14,822 | 2,335 | 6,893 | 3,516 | 3,675 | 1,449 | 1,624 | |||||||||||||||||||||||||||
Civil engineering construction | 3,470 | 2,361 | 636 | 473 | 220 | 208 | 151 | 249 | 281 | |||||||||||||||||||||||||||
Large companies | 130,708 | 86,918 | 12,602 | 31,188 | 13,162 | 5,308 | 5,016 | 14,656 | 5,648 | |||||||||||||||||||||||||||
SMEs and individual traders | 74,980 | 41,526 | 22,093 | 11,361 | 10,419 | 7,011 | 7,824 | 4,497 | 3,703 | |||||||||||||||||||||||||||
Other households and non-profit institutions serving households | 395,329 | 89,156 | 293,343 | 12,830 | 63,475 | 76,642 | 104,267 | 49,708 | 12,081 | |||||||||||||||||||||||||||
Of which: | ||||||||||||||||||||||||||||||||||||
Residential | 291,262 | 2,105 | 288,195 | 962 | 60,222 | 72,102 | 99,455 | 47,315 | 10,063 | |||||||||||||||||||||||||||
Consumer loans | 91,984 | 79,969 | 2,025 | 9,990 | 2,316 | 3,547 | 3,699 | 894 | 1,559 | |||||||||||||||||||||||||||
Other purposes | 12,083 | 7,082 | 3,123 | 1,878 | 937 | 993 | 1,113 | 1,499 | 459 | |||||||||||||||||||||||||||
|
|
|
|
|
|
|
|
|
|
|
|
|
|
|
|
|
| |||||||||||||||||||
Subtotal | 672,201 | 244,937 | 360,597 | 66,667 | 102,625 | 93,840 | 123,799 | 80,721 | 26,279 | |||||||||||||||||||||||||||
|
|
|
|
|
|
|
|
|
|
|
|
|
|
|
|
|
| |||||||||||||||||||
Less: collectively assessed impairment losses | 3,345 | |||||||||||||||||||||||||||||||||||
|
| |||||||||||||||||||||||||||||||||||
Total | 668,856 | |||||||||||||||||||||||||||||||||||
|
| |||||||||||||||||||||||||||||||||||
Memorandum item | ||||||||||||||||||||||||||||||||||||
Refinanced and restructured transactions | 41,755 | 11, 777 | 25,387 | 4,591 | 8,955 | 7,134 | 8,088 | 3,888 | 1,913 | |||||||||||||||||||||||||||
|
|
|
|
|
|
|
|
|
|
|
|
|
|
|
|
|
| |||||||||||||||||||
Note 54 contains information relating to the restructured/refinanced loan book.
| Impairment losses |
F-90
c) Impairment losses
The changes in the impairment losses on the assets making up the balances of Loans and receivables—receivables - Loans and advances to customers, Loans and receivables—receivables - Loans and advances to credit institutions (see Note 6) and Loans and receivables—receivables - Debt instruments (see Note 7) were as follows:
| Millions of euros | ||||||||||||||||||||||||
| Millions of euros | 2013 | 2012 | 2011 | |||||||||||||||||||||
| 2011 | 2010 | 2009 | ||||||||||||||||||||||
Balance at beginning of year | 19,739 | 17,899 | 12,720 | 25,467 | 18,858 | 19,544 | ||||||||||||||||||
Impairment losses charged to income for the year | 12,840 | 11,468 | 12,003 | |||||||||||||||||||||
Net impairment losses charged to income for the year | 12,054 | 19,839 | 12,750 | |||||||||||||||||||||
Of which: | ||||||||||||||||||||||||
Individually assessed | 15,939 | 14,770 | 13,948 | |||||||||||||||||||||
Collectively assessed | 1,182 | 1,405 | 2,206 | |||||||||||||||||||||
Impairment losses charged to income | 17,551 | 23,002 | 16,781 | |||||||||||||||||||||
Impairment losses reversed with a credit to income | (4,281 | ) | (4,707 | ) | (4,151 | ) | (5,497 | ) | (3,163 | ) | (4,031 | ) | ||||||||||||
Changes in the scope of consolidation (Note 3) | (1,267 | ) | — | 1,426 | — | (266 | ) | (1,267 | ) | |||||||||||||||
Write-off of impaired balances against recorded impairment allowance | (12,430 | ) | (10,913 | ) | (9,795 | ) | (10,626 | ) | (11,346 | ) | (12,293 | ) | ||||||||||||
Exchange differences and other changes | 106 | 1,285 | 1,545 | (1,936 | ) | (1,618 | ) | 124 | ||||||||||||||||
|
|
|
|
|
| |||||||||||||||||||
Balance at end of year | 18,988 | 19,739 | 17,899 | 24,959 | 25,467 | 18,858 | ||||||||||||||||||
|
|
|
|
|
| |||||||||||||||||||
Of which: | ||||||||||||||||||||||||
By method of assessment: | ||||||||||||||||||||||||
Individually | 15,343 | 14,584 | 11,628 | |||||||||||||||||||||
Individually assessed | 21,604 | 21,540 | 15,267 | |||||||||||||||||||||
Of which: due to country risk (Note 2.g) | 43 | 49 | 46 | 42 | 42 | 43 | ||||||||||||||||||
Collectively assessed | 3,645 | 5,155 | 6,271 | 3,355 | 3,927 | 3,591 | ||||||||||||||||||
By geographical location of risk: | ||||||||||||||||||||||||
Spain | 6,907 | 6,810 | 6,993 | 12,279 | 11,711 | 6,907 | ||||||||||||||||||
Rest of Europe | 4,957 | 4,695 | 4,435 | 5,918 | 5,625 | 4,827 | ||||||||||||||||||
Americas | 7,124 | 8,234 | 6,471 | 6,762 | 8,131 | 7,124 | ||||||||||||||||||
By classification of assets: | ||||||||||||||||||||||||
Loans and advances to credit institutions | 36 | 17 | 26 | |||||||||||||||||||||
Debt instruments | 16 | 25 | — | |||||||||||||||||||||
Loans and advances to credit institutions (Note 6) | 37 | 30 | 36 | |||||||||||||||||||||
Debt instruments (Note 7) | 19 | 15 | 16 | |||||||||||||||||||||
Loans and advances to customers | 18,936 | 19,697 | 17,873 | 24,903 | 25,422 | 18,806 | ||||||||||||||||||
The increase in impairment losses experienced in 2012 was associated mainly with two factors: (i) the rise in non-performing loans ratios in certain sectors in Spain, caused by the worsening of Spain’s macroeconomic situation as a result of economic slowdown, falling consumer spending and job market deterioration, with the unemployment rate exceeding 25% (particularly significant in this context was the increase in the non-performing loans ratio in the real estate sector – 47.7% at December 31, 2012, compared with 28.6% in 2011); and (ii) the upward shift in non-performing loans ratios in certain financial industries (Brazil, Chile and Portugal).
The decrease in credit loss provisions experienced in 2013 was associated with two factors: (i) lower levels of provisioning in Brazil, the United Kingdom, Portugal, Santander Consumer Finance and the United States; and (ii) the continued stabilization of the Spanish economy, featuring a slower pace of GDP shrinkage in the year - in comparison with 2012 -, together with positive growth in the last two quarters, for the first time since 2011, a certain improvement in private consumer spending and a stabilization of the unemployment rate.
Previously written-off assets recovered in 2011, 20102013, 2012 and 20092011 amounted to EUR 1,8001,068 million, EUR 1,2011,316 million and EUR 9151,784 million, respectively. Taking into account these amounts and those recognized in
Impairment losses charged to income for the year in the foregoing table, impairment losses on Loans and receivables amounted to EUR 11,04010,986 million in 2011,2013, EUR 10,26718,523 million in 20102012 and EUR 11,08810,966 million in 2009.2011.
d) Impaired assets
| d) | Impaired and non-performing assets |
The detail of the changes in the balance of the financial assets classified as Loans and receivables—receivables - Loans and advances to customers and considered to be impaired due to credit risk is as follows:
| Millions of euros | ||||||||||||
| 2011 | 2010 | 2009 | ||||||||||
Balance at beginning of year | 27,908 | 24,049 | 13,994 | |||||||||
Net additions | 16,040 | 13,575 | 18,046 | |||||||||
Written-off assets | (12,430 | ) | (10,913 | ) | (9,795 | ) | ||||||
Changes in scope of consolidation | 69 | 239 | 1,006 | |||||||||
Exchange differences and other | (300 | ) | 958 | 798 | ||||||||
|
|
|
|
|
| |||||||
Balance at end of year | 31,287 | 27,908 | 24,049 | |||||||||
|
|
|
|
|
| |||||||
F-91
| Millions of euros | ||||||||||||
| 2013 | 2012 | 2011 | ||||||||||
Balance at beginning of year | 35,301 | 31,257 | 27,863 | |||||||||
Net additions | 16,438 | 16,167 | 15,920 | |||||||||
Written-off assets | (10,626 | ) | (11,346 | ) | (12,293 | ) | ||||||
Changes in the scope of consolidation | 699 | (626 | ) | 69 | ||||||||
Exchange differences and other | (1,492 | ) | (151 | ) | (302 | ) | ||||||
|
|
|
|
|
| |||||||
Balance at end of year | 40,320 | 35,301 | 31,257 | |||||||||
|
|
|
|
|
| |||||||
This amount, after deducting the related allowances, represents the Group’s best estimate of the fairpresent value of the estimated future cash flows of the impaired assets.
At December 31, 2011,2013, the Group’s written-off assets totalledtotaled EUR 30,006 million (December 31, 2012: EUR 28,745 million; December 31, 2011: EUR 26,763 million.million).
Following is a detail of the financial assets classified as loansLoans and receivables and considered to be impaired due to credit risk at December 31, 2011,2013, classified by geographical location of risk and by age of the oldest past-due amount:
| Millions of euros | ||||||||||||||||||||||||||||||||||||||||||||||||
| With no past-due balances or less | ||||||||||||||||||||||||||||||||||||||||||||||||
| With balances past due by | Millions of euros | |||||||||||||||||||||||||||||||||||||||||||||||
| than 3 | More than | With no past-due balances or less than 3 months past due | With balances past due by | |||||||||||||||||||||||||||||||||||||||||||||
| months | 3 to 6 | 6 to 9 | 9 to 12 | 12 | 3 to 6 months | 6 to 9 months | 9 to 12 months | More than 12 months | Total | |||||||||||||||||||||||||||||||||||||||
| past due | months | months | months | months | Total | |||||||||||||||||||||||||||||||||||||||||||
Spain | 2,962 | 3,574 | 1,589 | 1,956 | 4,902 | 14,983 | 6,876 | 3,327 | 1,707 | 1,700 | 8,255 | 21,865 | ||||||||||||||||||||||||||||||||||||
European Union (excluding Spain) | 474 | 3,360 | 1,018 | 703 | 2,752 | 8,307 | 1,791 | 3,141 | 994 | 763 | 3,461 | 10,150 | ||||||||||||||||||||||||||||||||||||
United States and Puerto Rico | 406 | 282 | 137 | 118 | 533 | 1,476 | 322 | 178 | 78 | 43 | 417 | 1,038 | ||||||||||||||||||||||||||||||||||||
Other OECD countries | 9 | 34 | 37 | 43 | 1 | 124 | 12 | 38 | 29 | 10 | 49 | 138 | ||||||||||||||||||||||||||||||||||||
Latin America | 440 | 2,438 | 1,339 | 1,075 | 1,103 | 6,395 | 819 | 2,671 | 1,194 | 1,050 | 1,393 | 7,127 | ||||||||||||||||||||||||||||||||||||
Rest of the world | — | 2 | — | — | — | 2 | — | — | — | — | 2 | 2 | ||||||||||||||||||||||||||||||||||||
|
|
|
|
|
|
|
|
|
|
|
| |||||||||||||||||||||||||||||||||||||
| 4,291 | 9,690 | 4,120 | 3,895 | 9,291 | 31,287 | 9,820 | 9,355 | 4,002 | 3,566 | 13,577 | 40,320 | |||||||||||||||||||||||||||||||||||||
|
|
|
|
|
|
|
|
|
|
|
| |||||||||||||||||||||||||||||||||||||
The detail at December 31, 20102012 is as follows:
| Millions of euros | ||||||||||||||||||||||||
| With no past-due balances or less | �� | |||||||||||||||||||||||
| With balances past due by | ||||||||||||||||||||||||
| than 3 | More than | |||||||||||||||||||||||
| months | 3 to 6 | 6 to 9 | 9 to 12 | 12 | ||||||||||||||||||||
| past due | months | months | months | months | Total | |||||||||||||||||||
Spain | 2,726 | 1,835 | 1,511 | 1,001 | 5,240 | 12,313 | ||||||||||||||||||
European Union (excluding Spain) | 308 | 2,782 | 1,192 | 759 | 2,190 | 7,231 | ||||||||||||||||||
United States and Puerto Rico | 898 | 567 | 231 | 139 | 817 | 2,652 | ||||||||||||||||||
Other OECD countries | 18 | 35 | 37 | 34 | — | 124 | ||||||||||||||||||
Latin America | 768 | 2,310 | 894 | 791 | 822 | 5,585 | ||||||||||||||||||
Rest of the world | — | 3 | — | — | — | 3 | ||||||||||||||||||
|
|
|
|
|
|
|
|
|
|
|
| |||||||||||||
| 4,718 | 7,532 | 3,865 | 2,724 | 9,069 | 27,908 | |||||||||||||||||||
|
|
|
|
|
|
|
|
|
|
|
| |||||||||||||
F-92
| Millions of euros | ||||||||||||||||||||||||
| With no past-due balances or less than 3 months past due | With balances past due by | |||||||||||||||||||||||
| 3 to 6 months | 6 to 9 months | 9 to 12 months | More than 12 months | Total | ||||||||||||||||||||
Spain | 3,268 | 3,364 | 2,058 | 1,263 | 6,372 | 16,325 | ||||||||||||||||||
European Union (excluding Spain) | 233 | 3,782 | 1,232 | 821 | 3,280 | 9,348 | ||||||||||||||||||
United States and Puerto Rico | 327 | 216 | 111 | 83 | 484 | 1,221 | ||||||||||||||||||
Other OECD countries | 12 | 42 | 40 | 43 | — | 137 | ||||||||||||||||||
Latin America | 535 | 3,263 | 1,641 | 1,282 | 1,548 | 8,269 | ||||||||||||||||||
Rest of the world | — | — | — | — | 1 | 1 | ||||||||||||||||||
|
|
|
|
|
|
|
|
|
|
|
| |||||||||||||
| 4,375 | 10,667 | 5,082 | 3,492 | 11,685 | 35,301 | |||||||||||||||||||
|
|
|
|
|
|
|
|
|
|
|
| |||||||||||||
The detail at December 31, 20092011 is as follows:
| Millions of euros | ||||||||||||||||||||||||||||||||||||||||||||||||
| With no past- due balances | ||||||||||||||||||||||||||||||||||||||||||||||||
| With balances past due by | Millions of euros | |||||||||||||||||||||||||||||||||||||||||||||||
| or less than 3 | More than | With no past-due balances or less than 3 months past due | With balances past due by | |||||||||||||||||||||||||||||||||||||||||||||
| months past | 3 to 6 | 6 to 9 | 9 to 12 | 12 | 3 to 6 months | 6 to 9 months | 9 to 12 months | More than 12 months | Total | |||||||||||||||||||||||||||||||||||||||
| due | months | months | months | months | Total | |||||||||||||||||||||||||||||||||||||||||||
Spain | 2,172 | 1,431 | 1,356 | 956 | 4,287 | 10,202 | 2,962 | 3,574 | 1,589 | 1,956 | 4,902 | 14,983 | ||||||||||||||||||||||||||||||||||||
European Union (excluding Spain) | 276 | 3,343 | 977 | 689 | 1,418 | 6,703 | 474 | 3,330 | 1,018 | 703 | 2,752 | 8,277 | ||||||||||||||||||||||||||||||||||||
United States and Puerto Rico | 361 | 1,024 | 352 | 248 | 572 | 2,557 | 406 | 282 | 137 | 118 | 533 | 1,476 | ||||||||||||||||||||||||||||||||||||
Other OECD countries | 5 | 35 | 23 | 16 | 23 | 102 | 9 | 34 | 37 | 43 | 1 | 124 | ||||||||||||||||||||||||||||||||||||
Latin America | 398 | 1,893 | 977 | 688 | 516 | 4,472 | 440 | 2,438 | 1,339 | 1,075 | 1,103 | 6,395 | ||||||||||||||||||||||||||||||||||||
Rest of the world | — | 4 | 3 | 2 | 4 | 13 | — | 2 | — | — | — | 2 | ||||||||||||||||||||||||||||||||||||
|
|
|
|
|
|
|
|
|
|
|
| |||||||||||||||||||||||||||||||||||||
| 3,212 | 7,730 | 3,688 | 2,599 | 6,820 | 24,049 | 4,291 | 9,660 | 4,120 | 3,895 | 9,291 | 31,257 | |||||||||||||||||||||||||||||||||||||
|
|
|
|
|
|
|
|
|
|
|
| |||||||||||||||||||||||||||||||||||||
Set forth below for each class of impaired assets are the gross amount, associated allowances and information relating to the collateral and/or other credit enhancements obtained at December 31, 2013: Without associated collateral With property collateral With other collateral Balance at end of year When classifying assets in the foregoing table, the main factors considered by the Group to determine whether an asset has become impaired are the existence of amounts past due -assets impaired due to arrears- or other circumstances that lead it to believe that not all the contractual cash flows will be recovered -assets impaired for reasons other than arrears-, such as a deterioration of the borrower’s financial situation, the worsening of its capacity to generate funds or difficulties experienced by it in accessing credit. Millions of euros Gross
amount Allowance
recognized Estimated
collateral
value (*) 15,697 10,600 — 24,423 8,068 15,361 200 109 88 40,320 18,777 15,449 (*) Includes the estimated collateral value associated with each loan. Accordingly, it does not include any other cash flows that might be obtained, such as those associated with the personal guarantees of the borrowers. e) SecuritizationLoans classified as standard: past-due amounts receivable
In addition, at December 31, 2013, there were assets with amounts receivable that were past due by three months or less, the detail of which, by age of the oldest past-due amount, is as follows:
| Millions of euros | ||||||||||||
| Less than 1 month | 1 to 2 months | 2 to 3 months | ||||||||||
Loans and advances to customers | 2,450 | 631 | 416 | |||||||||
Public sector | 5 | — | 1 | |||||||||
Private sector | 2,445 | 631 | 415 | |||||||||
|
|
|
|
|
| |||||||
Total | 2,450 | 631 | 416 | |||||||||
|
|
|
|
|
| |||||||
| e) | Securitization |
Loans and advances to customers includes, inter alia, the securitisedsecuritized loans transferred to third parties on which the Group has retained the risks and rewards, albeit partially, and which therefore, in accordance with the applicable accounting standards, cannot be derecognized. The breakdown of the securitisedsecuritized loans, by type of original financial instrument, and of the securitisedsecuritized loans derecognized because the stipulated requirements were met (see Note 2.e) is shown below. Note 22 details the liabilities associated with these securitization transactions.
| Millions of euros | ||||||||||||
| 2011 | 2010 | 2009 | ||||||||||
Derecognized | 8,227 | 9,647 | 10,837 | |||||||||
Of which: | ||||||||||||
Securitised mortgage assets (*) | 8,221 | 9,635 | 10,232 | |||||||||
Other securitised assets | 6 | 12 | 605 | |||||||||
Retained on the balance sheet | 137,939 | 133,046 | 123,706 | |||||||||
Of which: | ||||||||||||
Securitised mortgage assets | 103,655 | 99,842 | 90,182 | |||||||||
Of which: UK assets | 81,286 | 73,865 | 64,592 | |||||||||
Other securitised assets | 34,284 | 33,204 | 33,524 | |||||||||
|
|
|
|
|
| |||||||
Total | 146,166 | 142,693 | 134,543 | |||||||||
|
|
|
|
|
| |||||||
| Millions of euros | ||||||||||||
| 2013 | 2012 | 2011 | ||||||||||
Derecognized | 3,618 | 6,251 | 8,227 | |||||||||
Of which | ||||||||||||
Securitized mortgage assets | 3,618 | 6,249 | 8,221 | |||||||||
Other securitized assets | — | 2 | 6 | |||||||||
Retained on the balance sheet | 78,229 | 95,981 | 137,939 | |||||||||
Of which | ||||||||||||
Securitized mortgage assets | 56,277 | 69,354 | 103,655 | |||||||||
Of which: UK assets | 45,296 | 56,037 | 81,286 | |||||||||
Other securitized assets | 21,952 | 26,627 | 34,284 | |||||||||
|
|
|
|
|
| |||||||
Total | 81,847 | 102,232 | 146,166 | |||||||||
|
|
|
|
|
| |||||||
Securitization is used as a tool for the management of regulatory capital and as a means of diversifying the Group’s liquidity sources. In 2011, 20102013, 2012 and 20092011 the Group did not derecognisederecognize any of the securitizations performed, and the balance shown as derecognized infor those years relates to securitizations performed in prior years.
The loans derecognized include assets of Santander Holdings USA, Inc. amounting to approximately EUR 3,082 million at December 31, 2013 (December 31, 2012: EUR 5,603 million; December 31, 2011: EUR 7,188 million) that were sold, prior to this company’s inclusion in the Group, on the secondary market for multifamily loans, and over which control was transferred and substantially all the associated risks and rewards were not retained. At December 31, 2013, the Group recognized under Other liabilities an obligation amounting to EUR 49 million (December 31, 2012: EUR 91 million; December 31, 2011: EUR 105 million), which represents the fair value of the retained credit risk.
The loans retained on the face of the balance sheet include the loans associated with securitizations in which the Group retains a subordinated debt and/or grants any manner of credit enhancements to the new holders. In 2012, following the Bank of England’s decision to accept, as collateral in its liquidity programs, not only securitizations but also all mortgage loans with a given credit quality, the Group companies in the UK redeemed GBP 33,800 million of securitized mortgage assets in order to manage more efficiently the on-balance-sheet liquidity of Santander UK.
F-93The loans transferred through securitization are mainly mortgage loans, loans to companies and consumer loans.
| 11. | Hedging derivatives |
The detail, by type of risk hedged, of the fair value of the derivatives qualifying for hedge accounting is as follows (see Note 36):
| Millions of euros | ||||||||||||||||||||||||||||||||||||||||||||||||
| Millions of euros | 2013 | 2012 | 2011 | |||||||||||||||||||||||||||||||||||||||||||||
| 2011 | 2010 | 2009 | Assets | Liabilities | Assets | Liabilities | Assets | Liabilities | ||||||||||||||||||||||||||||||||||||||||
| Assets | Liabilities | Assets | Liabilities | Assets | Liabilities | |||||||||||||||||||||||||||||||||||||||||||
Fair value hedges | 9,424 | 5,501 | 8,007 | 5,833 | 7,585 | 4,296 | 5,403 | 4,146 | 7,467 | 5,492 | 9,424 | 5,501 | ||||||||||||||||||||||||||||||||||||
Of which: Portfolio hedges | 1,493 | 2,515 | 1,540 | 2,683 | 1,553 | 2,820 | 610 | 1,703 | 544 | 2,621 | 1,493 | 2,515 | ||||||||||||||||||||||||||||||||||||
Cash flow hedges | 313 | 773 | 153 | 438 | 202 | 720 | 1,766 | 1,023 | 344 | 553 | 313 | 773 | ||||||||||||||||||||||||||||||||||||
Hedges of net investments in foreign operations | 161 | 170 | 67 | 363 | 47 | 175 | 1,132 | 114 | 125 | 399 | 161 | 170 | ||||||||||||||||||||||||||||||||||||
|
|
|
|
|
|
|
|
|
|
|
| |||||||||||||||||||||||||||||||||||||
| 9,898 | 6,444 | 8,227 | 6,634 | 7,834 | 5,191 | 8,301 | 5,283 | 7,936 | 6,444 | 9,898 | 6,444 | |||||||||||||||||||||||||||||||||||||
|
|
|
|
|
|
|
|
|
|
|
| |||||||||||||||||||||||||||||||||||||
Note 36 contains a description of the Group’s main hedges.
| 12. | Non-current assets held for sale |
The detail of Non-current assets held for sale in the consolidated balance sheets is as follows:
| Millions of euros | Millions of euros | |||||||||||||||||||||||
| 2011 | 2010 | 2009 | 2013 | 2012 | 2011 | |||||||||||||||||||
Equity instruments | — | — | 4 | |||||||||||||||||||||
Tangible assets | 5,171 | 5,972 | 5,111 | 4,845 | 4,259 | 5,171 | ||||||||||||||||||
Of which: | ||||||||||||||||||||||||
Foreclosed assets and acquired assets | 5,112 | 5,874 | 4,939 | |||||||||||||||||||||
Foreclosed assets | 4,742 | 4,196 | 5,112 | |||||||||||||||||||||
Of which: Property assets in Spain (Note 54) | 4,274 | 5,196 | 4,530 | 4,146 | 3,674 | 4,274 | ||||||||||||||||||
Other tangible assets held for sale | 59 | 98 | 172 | 103 | 63 | 59 | ||||||||||||||||||
Other assets | 167 | 313 | 674 | 47 | 1,441 | 1,726 | ||||||||||||||||||
|
|
|
|
|
| |||||||||||||||||||
| 5,338 | 6,285 | 5,789 | 4,892 | 5,700 | 6,897 | |||||||||||||||||||
|
|
|
|
|
| |||||||||||||||||||
At December 31, 2011,2013, the allowance that coverscovering the value of the foreclosed assets and acquired assets amounted to EUR 4,5124,955 million (December 31, 2010:(2012: EUR 2,5004,416 million; December 31, 2009:2011: EUR 2,0814,512 million), which represents a coverage ratio of 46.88%51.1% of the assets’ gross value of the portfolio (2010: 29.85%(2012: 51.3%; 2009: 29.64%2011: 46.9%). The net charges recorded in those years amounted to EUR 2,037335 million, EUR 298449 million and EUR 1,3502,037 million, respectively (see Note 50).
In 2013 the Group sold, for EUR 735 million, foreclosed properties with a gross carrying amount of EUR 1,236 million, for which provisions totaling EUR 402 million had been recognized. These sales gave rise to losses of EUR 99 million; in addition, other tangible assets were sold for EUR 82 million, giving rise to a gain of EUR 12 million (see Note 50).
At December 31, 2012 and 2011, Other assets included assets amounting to EUR 1,370 million and EUR 1,559 million, respectively, corresponding to the Santander UK credit card business. This business was sold for EUR 770 million on May 10, 2013, giving rise to a loss of EUR 14 million, which was recognized under Profit (loss) from discontinued operations (net) in the accompanying consolidated income statement.
F-94
| 13. | Investments |
a) Breakdown
| a) | Breakdown |
The detail, by company, of Investments—AssociatesInvestments (see Note 2.b) is as follows:
| Millions of euros | ||||||||||||
| 2011 | 2010 | 2009 | ||||||||||
Santander Consumer USA Inc. | 2,063 | — | — | |||||||||
Metrovacesa, S.A. | 772 | — | — | |||||||||
ZS Insurance América S.L. | 1,017 | — | — | |||||||||
Banco Caixa Geral Totta Angola, S.A. | 92 | 95 | — | |||||||||
Other companies | 211 | 178 | 164 | |||||||||
|
|
|
|
|
| |||||||
| 4,155 | 273 | 164 | ||||||||||
|
|
|
|
|
| |||||||
Associates Zurich Santander Insurance América, S.L. Metrovacesa, S.A. Other companies Jointly controlled entities Santander Consumer USA Inc. SAM Investment Holdings Limited Aegon Santander Seguros Other companies At December 31, 2011, the cost of the investments detailed in the foregoing table included EUR 1,682 million relating to goodwill (December 31, 2010: EUR 71 million; December 31, 2009: EUR 9 million). Millions of euros 2013 2012 2011 826 1,013 1,017 647 649 772 356 295 293 1,829 1,957 2,082 2,159 2,026 2,063 449 — — 213 — — 886 471 10 3,707 2,497 2,073
b) Changes
| b) | Changes |
The changes in Investments—AssociatesInvestments were as follows:
| Millions of euros | ||||||||||||||||||||||||
| Millions of euros | 2013 | 2012 | 2011 | |||||||||||||||||||||
| 2011 | 2010 | 2009 | ||||||||||||||||||||||
Balance at beginning of year | 273 | 164 | 1,323 | 4,454 | 4,155 | 273 | ||||||||||||||||||
Acquisitions (disposals) and capital increases (reductions) (Note 3) | 23 | (30 | ) | (1 | ) | |||||||||||||||||||
Acquisitions (disposals) and capital increases (reductions) | 422 | 34 | 23 | |||||||||||||||||||||
Santander Elavon Merchant Services Entidad de Pago, S.L. | 88 | — | — | |||||||||||||||||||||
Changes in the scope of consolidation (Note 3) | 3,919 | 101 | (1,346 | ) | 769 | 394 | 3,919 | |||||||||||||||||
Of which: | ||||||||||||||||||||||||
SAM Investment Holdings Limited | 449 | — | — | |||||||||||||||||||||
Aegon Santander Seguros | 211 | — | — | |||||||||||||||||||||
Santander Consumer USA Inc. | 2,063 | — | — | — | — | 2,063 | ||||||||||||||||||
ZS Insurance América, S.L. | 932 | — | — | |||||||||||||||||||||
Zurich Santander Insurance América, S.L. | — | — | 932 | |||||||||||||||||||||
Metrovacesa, S.A. | 894 | — | — | — | — | 894 | ||||||||||||||||||
Santander Holdings USA, Inc. (formerly Sovereign Bancorp, Inc.) | — | — | (1,346 | ) | ||||||||||||||||||||
Transfers | — | — | (53 | ) | ||||||||||||||||||||
Effect of equity accounting | 57 | 17 | (1 | ) | 500 | 427 | 57 | |||||||||||||||||
Impairment losses | (100 | ) | — | — | — | — | (100 | ) | ||||||||||||||||
Dividends paid | (13 | ) | (16 | ) | (5 | ) | ||||||||||||||||||
Dividends paid and reimbursements of share premium | (303 | ) | (508 | ) | (13 | ) | ||||||||||||||||||
Exchange differences and other changes | (4 | ) | 37 | 247 | (306 | ) | (48 | ) | (4 | ) | ||||||||||||||
|
|
|
|
|
| |||||||||||||||||||
Balance at end of year | 4,155 | 273 | 164 | 5,536 | 4,454 | 4,155 | ||||||||||||||||||
|
|
|
|
|
| |||||||||||||||||||
c) Impairment losses
| c) | Impairment losses |
No significantIn 2013 and 2012 there was no evidence of material impairment was disclosed with respect toon the Group’s investments in 2010 and 2009.associates. In 2011 an impairment loss of EUR 100 million on the investment in Metrovacesa, S.A. was recognized under Impairment losses on other assets (net)— - Other assets in the consolidated income statement.
F-95
d) Other disclosures
| d) | Other information |
Following is a summary of the financial information on the companies accounted for using the equity method (obtained from the information available at the date onof preparation of the financial statements):
| Millions of euros | ||||||||||||||||||||||||
| Millions of euros | 2013 | 2012 | 2011 | |||||||||||||||||||||
| 2011 | 2010 | 2009 | ||||||||||||||||||||||
Total assets | 32,344 | 4,630 | 2,604 | 63,443 | 54,367 | 32,344 | ||||||||||||||||||
Total liabilities | (24,519 | ) | (3,828 | ) | (2,160 | ) | (55,483 | ) | (46,933 | ) | (24,519 | ) | ||||||||||||
|
|
|
|
|
| |||||||||||||||||||
Net assets | 7,825 | 802 | 444 | 7,960 | 7,434 | 7,825 | ||||||||||||||||||
|
|
|
|
|
| |||||||||||||||||||
Group’s share of net assets | 2,473 | 202 | 155 | 3,755 | 2,769 | 2,473 | ||||||||||||||||||
Goodwill | 1,682 | 71 | 9 | 1,781 | 1,685 | 1,682 | ||||||||||||||||||
Of which: | ||||||||||||||||||||||||
Santander Consumer USA Inc. | 999 | — | — | 937 | 979 | 999 | ||||||||||||||||||
ZS Insurance América, S.L. | 526 | — | — | |||||||||||||||||||||
Zurich Santander Insurance América, S.L. | 526 | 526 | 526 | |||||||||||||||||||||
|
|
|
|
|
| |||||||||||||||||||
Total Group share | 4,155 | 273 | 164 | 5,536 | 4,454 | 4,155 | ||||||||||||||||||
|
|
|
|
|
| |||||||||||||||||||
Total income | 8,428 | 1,047 | 311 | 11,756 | 10,232 | 8,428 | ||||||||||||||||||
|
|
|
|
|
| |||||||||||||||||||
Total profit | 1,212 | 70 | 77 | 1,029 | 612 | 1,212 | ||||||||||||||||||
|
|
|
|
|
| |||||||||||||||||||
Group’s share of profit | 57 | 17 | (1 | ) | 500 | 427 | 57 | |||||||||||||||||
|
|
|
|
|
| |||||||||||||||||||
Following is a summary of the financial information for 2013 on the main associates and jointly controlled entities (obtained from the information available at the date of preparation of the financial statements):
| Millions of euros | ||||||||||||||||
| Total assets | Total liabilities | Total income | Total profit | |||||||||||||
Associates | 22,305 | (19,032 | ) | 4,943 | 277 | |||||||||||
Of which: | ||||||||||||||||
Zurich Santander Insurance América, S.L. | 10,340 | (9,563 | ) | 3,684 | 274 | |||||||||||
|
|
|
|
|
|
|
| |||||||||
Jointly controlled entities | 41,138 | (36,451 | ) | 6,813 | 752 | |||||||||||
|
|
|
|
|
|
|
| |||||||||
Of which: | ||||||||||||||||
Santander Consumer USA Inc. | 19,589 | (17,708 | ) | 4,175 | 495 | |||||||||||
SAM Investment Holdings Limited | 1,185 | (312 | ) | 853 | 145 | |||||||||||
Unión de Créditos Inmobiliarios, S.A., EFC | 12,553 | (12,175 | ) | 553 | 17 | |||||||||||
|
|
|
|
|
|
|
| |||||||||
Total | 63,443 | (55,483 | ) | 11,756 | 1,029 | |||||||||||
|
|
|
|
|
|
|
| |||||||||
At December 31, 2013, the Group did not hold any ownership interests in jointly controlled entities or associates whose shares are listed. At December 31, 2012, the only investment in listed associates was the investment held in Metrovacesa, S.A., the fair value of which, taking into consideration its quoted price at December 31, 2012, was EUR 761 million (EUR 2.21 per share).
| 14. | Insurance contracts linked to pensions |
The detail of Insurance contracts linked to pensions (see Note 25.c)in the consolidated balance sheets is as follows:
| Millions of euros | ||||||||||||||||||||||||
| Millions of euros | 2013 | 2012 | 2011 | |||||||||||||||||||||
| 2011 | 2010 | 2009 | ||||||||||||||||||||||
Assets relating to insurance contracts covering post-employment benefit plan obligations: | ||||||||||||||||||||||||
Banco Santander, S.A. | 1,926 | 1,986 | 2,093 | 342 | 214 | 1,926 | ||||||||||||||||||
Banesto | 191 | 202 | 228 | — | 190 | 191 | ||||||||||||||||||
Other Spanish companies | 29 | 30 | 31 | — | 1 | 29 | ||||||||||||||||||
Assets relating to insurance contracts covering other similar obligations: | ||||||||||||||||||||||||
Banco Santander, S.A. | — | 1 | 2 | |||||||||||||||||||||
Other Spanish companies | — | 1 | 2 | |||||||||||||||||||||
|
|
|
|
|
| |||||||||||||||||||
| 2,146 | 2,220 | 2,356 | 342 | 405 | 2,146 | |||||||||||||||||||
|
|
|
|
|
| |||||||||||||||||||
In 2012 the Group entered into an agreement with Generali España, S.A. to terminate a portion of the insurance contracts linked to pensions which it held with this insurance company (see Note 25.c).
F-96
| 15. | Liabilities under insurance contracts and Reinsurance assets |
The detail of Liabilities under insurance contracts and Reinsurance assets in the consolidated balance sheets (see Note 2.j) is as follows:
| Millions of euros | ||||||||||||||||||||||||||||||||||||||||||||||||||||||||||||||||||||||||
| 2011 | 2010 | 2009 | Millions of euros | |||||||||||||||||||||||||||||||||||||||||||||||||||||||||||||||||||||
| Direct insurance and | Total | Direct insurance and | Total | Direct insurance and | Total | 2013 | 2012 | 2011 | ||||||||||||||||||||||||||||||||||||||||||||||||||||||||||||||||
Technical provisions for: | reinsurance assumed | Reinsurance ceded | (balance payable) | reinsurance assumed | Reinsurance ceded | (balance payable) | reinsurance assumed | Reinsurance ceded | (balance payable) | Direct insurance and reinsurance assumed | Reinsurance ceded | Total (balance payable) | Direct insurance and reinsurance assumed | Reinsurance ceded | Total (balance payable) | Direct insurance and reinsurance assumed | Reinsurance ceded | Total (balance payable) | ||||||||||||||||||||||||||||||||||||||||||||||||||||||
Unearned premiums and unexpired risks | 166 | (86 | ) | 80 | 371 | (170 | ) | 201 | 455 | (196 | ) | 259 | 245 | (36 | ) | 209 | 137 | (68 | ) | 69 | 166 | (86 | ) | 80 | ||||||||||||||||||||||||||||||||||||||||||||||||
Life insurance: | 229 | (78 | ) | 151 | 3,061 | (51 | ) | 3,010 | 4,745 | (56 | ) | 4,689 | ||||||||||||||||||||||||||||||||||||||||||||||||||||||||||||
Life insurance | 546 | (183 | ) | 363 | 479 | (229 | ) | 250 | 229 | (78 | ) | 151 | ||||||||||||||||||||||||||||||||||||||||||||||||||||||||||||
Claims outstanding | 66 | (55 | ) | 11 | 514 | (65 | ) | 449 | 483 | (52 | ) | 431 | 315 | (55 | ) | 261 | 391 | (61 | ) | 330 | 66 | (55 | ) | 11 | ||||||||||||||||||||||||||||||||||||||||||||||||
Bonuses and rebates | 25 | (6 | ) | 19 | 14 | — | 14 | 17 | — | 17 | ||||||||||||||||||||||||||||||||||||||||||||||||||||||||||||||
Life insurance policies | 17 | — | 17 | 22 | — | 22 | 19 | — | 19 | |||||||||||||||||||||||||||||||||||||||||||||||||||||||||||||||
where the investment risk is borne by the policyholders | — | — | — | 5,763 | — | 5,763 | 10,939 | — | 10,939 | |||||||||||||||||||||||||||||||||||||||||||||||||||||||||||||||
Other technical provisions | 39 | (35 | ) | 4 | 718 | (260 | ) | 458 | 275 | (113 | ) | 162 | 299 | (76 | ) | 222 | 404 | (66 | ) | 338 | 39 | (35 | ) | 4 | ||||||||||||||||||||||||||||||||||||||||||||||||
|
|
|
|
|
|
|
|
|
|
|
|
|
|
|
|
|
| |||||||||||||||||||||||||||||||||||||||||||||||||||||||
| 517 | (254 | ) | 263 | 10,449 | (546 | ) | 9,903 | 16,916 | (417 | ) | 16,499 | 1,430 | (356 | ) | 1,074 | 1,425 | (424 | ) | 1,001 | 517 | (254 | ) | 263 | |||||||||||||||||||||||||||||||||||||||||||||||||
|
|
|
|
|
|
|
|
|
|
|
|
|
|
|
|
|
| |||||||||||||||||||||||||||||||||||||||||||||||||||||||
The decrease inOn July 19, 2012 the above line items arose fromGroup entered into an agreement with Abbey Life Assurance Company Limited (“Abbey Life Assurance”), a subsidiary of Deutsche Bank, for Abbey Life Assurance to reinsure the saleentire individual life risk portfolios of the Santander Group insurance companies in Latin AmericaSpain and Portugal. Under this agreement, the Group transferred to Zurich (see Note 3)Abbey Life Assurance, in exchange for a non-refundable up-front amount calculated on the basis of market conditions, its annual renewable life insurance policy portfolio at June 30, 2012 and the potential renewals of these policies. Abbey Life Assurance will assume, from the agreement date, all the risks and rewards relating to the term of these policies and their potential renewals (i.e. both the risk of changes in the actual rates of mortality and permanent total disability compared with the estimated rates, and the lapse risk of the portfolio, credit risk on the part of the insureds, etc.). The Group will continue to carry out the administrative management (servicing) of these policies, as agent, and will receive in exchange from Abbey Life Assurance a market consideration independent of the up-front amount received.
Since the significant risks and rewards have been transferred, this transaction gave rise to income of EUR 435 million recognized under Other operating income - Income from insurance and reinsurance contracts issued in the 2012 consolidated income statement (EUR 308 million net of tax).
F-97
| 16. | Tangible assets |
a) Changes
| a) | Changes |
The changes in Tangible assets in the consolidated balance sheetsheets were as follows:
| Millions of euros | ||||||||||||||||
| For own use | Leased out under an operating lease | Investment property | Total | |||||||||||||
Cost: | ||||||||||||||||
Balances at January 1, 2009 | 9,906 | 2,474 | 907 | 13,287 | ||||||||||||
Additions / Disposals (net) due to change in the scope of consolidation | 464 | 63 | — | 527 | ||||||||||||
Additions / disposals (net) | 264 | (188 | ) | 38 | 114 | |||||||||||
Transfers and other changes | (188 | ) | 13 | 280 | 105 | |||||||||||
Exchange differences (net) | 793 | 38 | (2 | ) | 829 | |||||||||||
|
|
|
|
|
|
|
| |||||||||
Balances at December 31, 2009 | 11,239 | 2,400 | 1,223 | 14,862 | ||||||||||||
Additions / Disposals (net) due to change in the scope of consolidation | 37 | 11 | — | 48 | ||||||||||||
Additions / disposals (net) | 1,545 | 821 | 268 | 2,634 | ||||||||||||
Transfers and other changes | (32 | ) | (24 | ) | 47 | (9 | ) | |||||||||
Exchange differences (net) | 600 | 18 | 23 | 641 | ||||||||||||
|
|
|
|
|
|
|
| |||||||||
Balances at December 31, 2010 | 13,389 | 3,226 | 1,561 | 18,176 | ||||||||||||
Additions / Disposals (net) due to change in the scope of consolidation | 473 | (187 | ) | 2,759 | 3,045 | |||||||||||
Additions / disposals (net) | 905 | (13 | ) | 59 | 951 | |||||||||||
Transfers and other changes | 114 | 35 | (61 | ) | 88 | |||||||||||
Exchange differences (net) | (279 | ) | 15 | (11 | ) | (275 | ) | |||||||||
|
|
|
|
|
|
|
| |||||||||
Balances at December 31, 2011 | 14,602 | 3,076 | 4,307 | 21,985 | ||||||||||||
|
|
|
|
|
|
|
| |||||||||
Accumulated depreciation: | ||||||||||||||||
Balances at January 1, 2009 | (4,229 | ) | (508 | ) | (25 | ) | (4,762 | ) | ||||||||
Additions / Disposals (net) due to change in the scope of consolidation | (256 | ) | (15 | ) | (1 | ) | (272 | ) | ||||||||
Disposals | 584 | 40 | 3 | 627 | ||||||||||||
Transfers and other changes | 9 | (194 | ) | (5 | ) | (190 | ) | |||||||||
Charge for the year | (762 | ) | — | (8 | ) | (770 | ) | |||||||||
Exchange differences and other items | (355 | ) | (10 | ) | — | (365 | ) | |||||||||
|
|
|
|
|
|
|
| |||||||||
Balances at December 31, 2009 | (5,009 | ) | (687 | ) | (36 | ) | (5,732 | ) | ||||||||
Disposals | 330 | 169 | 3 | 502 | ||||||||||||
Transfers and other changes | (63 | ) | (360 | ) | (11 | ) | (434 | ) | ||||||||
Charge for the year | (846 | ) | — | (10 | ) | (856 | ) | |||||||||
Exchange differences and other items | (259 | ) | (8 | ) | — | (267 | ) | |||||||||
|
|
|
|
|
|
|
| |||||||||
Balances at December 31, 2010 | (5,847 | ) | (886 | ) | (54 | ) | (6,787 | ) | ||||||||
Disposals due to change in the scope of consolidation | 22 | 43 | — | 65 | ||||||||||||
Disposals | 158 | 274 | 6 | 438 | ||||||||||||
Transfers and other changes | (328 | ) | (253 | ) | (66 | ) | (647 | ) | ||||||||
Charge for the year | (904 | ) | (2 | ) | (15 | ) | (921 | ) | ||||||||
Exchange differences and other items | 117 | (8 | ) | — | 109 | |||||||||||
|
|
|
|
|
|
|
| |||||||||
Balances at December 31, 2011 | (6,782 | ) | (832 | ) | (129 | ) | (7,743 | ) | ||||||||
|
|
|
|
|
|
|
| |||||||||
| Millions of euros | ||||||||||||||||
| For own use | Leased out under an operating lease | Investment property | Total | |||||||||||||
Cost: | ||||||||||||||||
Balances at January 1, 2011 | 13,389 | 3,226 | 1,561 | 18,176 | ||||||||||||
Additions/disposals (net) due to change in the scope of consolidation | 473 | (187 | ) | 2,759 | 3,045 | |||||||||||
Additions/disposals (net) | 905 | (13 | ) | 59 | 951 | |||||||||||
Transfers, exchange differences and other items | (165 | ) | 50 | (72 | ) | (187 | ) | |||||||||
|
|
|
|
|
|
|
| |||||||||
Balances at December 31, 2011 | 14,602 | 3,076 | 4,307 | 21,985 | ||||||||||||
Additions/disposals (net) due to change in the scope of consolidation | 41 | (11 | ) | (69 | ) | (39 | ) | |||||||||
Additions/disposals (net) | 795 | (105 | ) | 105 | 795 | |||||||||||
Transfers, exchange differences and other items | 342 | 157 | (78 | ) | 421 | |||||||||||
|
|
|
|
|
|
|
| |||||||||
Balances at December 31, 2012 | 15,780 | 3,117 | 4,265 | 23,162 | ||||||||||||
Additions/disposals (net) due to change in the scope of consolidation | (17 | ) | — | 541 | 524 | |||||||||||
Additions/disposals (net) | 1,021 | (124 | ) | (23 | ) | 874 | ||||||||||
Transfers, exchange differences and other items | (989 | ) | 212 | (139 | ) | (916 | ) | |||||||||
|
|
|
|
|
|
|
| |||||||||
Balances at December 31, 2013 | 15,795 | 3,205 | 4,644 | 23,644 | ||||||||||||
|
|
|
|
|
|
|
| |||||||||
Accumulated depreciation: | ||||||||||||||||
Balances at January 1, 2011 | (5,847 | ) | (886 | ) | (54 | ) | (6,787 | ) | ||||||||
Disposals due to change in the scope of consolidation | 22 | 43 | — | 65 | ||||||||||||
Disposals | 158 | 274 | 6 | 438 | ||||||||||||
Charge for the year | (898 | ) | (2 | ) | (15 | ) | (915 | ) | ||||||||
Transfers, exchange differences and other items | (217 | ) | (261 | ) | (66 | ) | (544 | ) | ||||||||
|
|
|
|
|
|
|
| |||||||||
Balances at December 31, 2011 | (6,782 | ) | (832 | ) | (129 | ) | (7,743 | ) | ||||||||
Disposals due to change in the scope of consolidation | 44 | — | 7 | 51 | ||||||||||||
Disposals | 423 | 229 | 8 | 660 | ||||||||||||
Charge for the year | (1,059 | ) | (1 | ) | (13 | ) | (1,073 | ) | ||||||||
Transfers, exchange differences and other items | (252 | ) | (265 | ) | (37 | ) | (554 | ) | ||||||||
|
|
|
|
|
|
|
| |||||||||
Balances at December 31, 2012 | (7,626 | ) | (869 | ) | (164 | ) | (8,659 | ) | ||||||||
Disposals due to change in the scope of consolidation | 16 | — | — | 16 | ||||||||||||
Disposals | 280 | 179 | 14 | 473 | ||||||||||||
Charge for the year | (1,020 | ) | (1 | ) | (17 | ) | (1,038 | ) | ||||||||
Transfers, exchange differences and other items | 416 | (235 | ) | (36 | ) | 145 | ||||||||||
|
|
|
|
|
|
|
| |||||||||
Balances at December 31, 2013 | (7,934 | ) | (926 | ) | (203 | ) | (9,063 | ) | ||||||||
|
|
|
|
|
|
|
| |||||||||
Impairment losses: Balances at January 1, 2011 Impairment charge for the year Exchange differences Balances at December 31, 2011 Impairment charge for the year Disposals due to change in the scope of consolidation Exchange differences Balances at December 31, 2012 Impairment charge for the year Disposals due to change in the scope of consolidation Exchange differences Balances at December 31, 2013 Tangible assets, net: Balances at December 31, 2011 Balances at December 31, 2012 Balances at December 31, 2013 Millions of euros For own use Leased out
under an
operating
lease Investment
property Total (34 ) (16 ) (197 ) (247 ) 2 (22 ) (131 ) (151 ) 9 (8 ) 1 2 (23 ) (46 ) (327 ) (396 ) (10 ) (23 ) (185 ) (218 ) — — (50 ) (50 ) 15 1 6 22 (18 ) (68 ) (556 ) (642 ) (53 ) (24 ) (260 ) (337 ) — — 39 39 (3 ) — 16 13 (74 ) (92 ) (761 ) (927 ) 7,797 2,198 3,851 13,846 8,136 2,179 3,545 13,860 7,787 2,187 3,680 13,654
F-98
| Millions of euros | ||||||||||||||||
| For own use | Leased out under an operating lease | Investment property | Total | |||||||||||||
Impairment losses: | ||||||||||||||||
Balances at January 1, 2009 | (12 | ) | — | (11 | ) | (23 | ) | |||||||||
Impairment charge for the year | (30 | ) | (2 | ) | (85 | ) | (117 | ) | ||||||||
Additions / Disposals (net) due to change in the scope of consolidation | (22 | ) | — | — | (22 | ) | ||||||||||
Exchange differences and other | 36 | (8 | ) | — | 28 | |||||||||||
|
|
|
|
|
|
|
| |||||||||
Balances at December 31, 2009 | (28 | ) | (10 | ) | (96 | ) | (134 | ) | ||||||||
Impairment charge for the year | (22 | ) | (3 | ) | (82 | ) | (107 | ) | ||||||||
Exchange differences | 16 | (3 | ) | (19 | ) | (6 | ) | |||||||||
|
|
|
|
|
|
|
| |||||||||
Balances at December 31, 2010 | (34 | ) | (16 | ) | (197 | ) | (247 | ) | ||||||||
Impairment charge for the year | 2 | (22 | ) | (131 | ) | (151 | ) | |||||||||
Exchange differences | 9 | (8 | ) | 1 | 2 | |||||||||||
|
|
|
|
|
|
|
| |||||||||
Balances at December 31, 2011 | (23 | ) | (46 | ) | (327 | ) | (396 | ) | ||||||||
|
|
|
|
|
|
|
| |||||||||
Tangible assets, net: | ||||||||||||||||
Balances at December 31, 2009 | 6,202 | 1,703 | 1,091 | 8,996 | ||||||||||||
Balances at December 31, 2010 | 7,508 | 2,324 | 1,310 | 11,142 | ||||||||||||
Balances at December 31, 2011 | 7,797 | 2,198 | 3,851 | 13,846 | ||||||||||||
b) Property, plant and equipment for own use
| b) | Property, plant and equipment for own use |
The detail, by class of asset, of Property, plant and equipment—equipment - For own use in the consolidated balance sheetsheets is as follows:
| Millions of euros | ||||||||||||||||
| Cost | Accumulated depreciation | Impairment losses | Carrying amount | |||||||||||||
Land and buildings | 4,431 | (1,116 | ) | (28 | ) | 3,287 | ||||||||||
IT equipment and fixtures | 2,526 | (1,754 | ) | — | 771 | |||||||||||
Furniture and vehicles | 4,118 | (2,081 | ) | — | 2,037 | |||||||||||
Construction in progress and other items | 165 | (58 | ) | — | 107 | |||||||||||
|
|
|
|
|
|
|
| |||||||||
Balances at December 31, 2009 | 11,239 | (5,009 | ) | (28 | ) | 6,202 | ||||||||||
|
|
|
|
|
|
|
| |||||||||
Land and buildings | 5,393 | (1,354 | ) | (34 | ) | 4,005 | ||||||||||
IT equipment and fixtures | 2,904 | (2,076 | ) | — | 828 | |||||||||||
Furniture and vehicles | 4,833 | (2,346 | ) | — | 2,487 | |||||||||||
Construction in progress and other items | 259 | (71 | ) | — | 188 | |||||||||||
|
|
|
|
|
|
|
| |||||||||
Balances at December 31, 2010 | 13,389 | (5,847 | ) | (34 | ) | 7,508 | ||||||||||
|
|
|
|
|
|
|
| |||||||||
Land and buildings | 5,654 | (1,565 | ) | (23 | ) | 4,066 | ||||||||||
IT equipment and fixtures | 3,304 | (2,419 | ) | — | 885 | |||||||||||
Furniture and vehicles | 5,239 | (2,719 | ) | — | 2,520 | |||||||||||
Construction in progress and other items | 406 | (80 | ) | — | 326 | |||||||||||
|
|
|
|
|
|
|
| |||||||||
Balances at December 31, 2011 | 14,603 | (6,783 | ) | (23 | ) | 7,797 | ||||||||||
|
|
|
|
|
|
|
| |||||||||
F-99
| Millions of euros | ||||||||||||||||
| Cost | Accumulated depreciation | Impairment losses | Carrying amount | |||||||||||||
Land and buildings | 5,654 | (1,565 | ) | (23 | ) | 4,066 | ||||||||||
IT equipment and fixtures | 3,304 | (2,419 | ) | — | 885 | |||||||||||
Furniture and vehicles | 5,239 | (2,719 | ) | — | 2,520 | |||||||||||
Construction in progress and other items | 405 | (79 | ) | — | 326 | |||||||||||
|
|
|
|
|
|
|
| |||||||||
Balances at December 31, 2011 | 14,602 | (6,782 | ) | (23 | ) | 7,797 | ||||||||||
|
|
|
|
|
|
|
| |||||||||
Land and buildings | 5,735 | (1,583 | ) | (18 | ) | 4,134 | ||||||||||
IT equipment and fixtures | 4,174 | (3,087 | ) | — | 1,087 | |||||||||||
Furniture and vehicles | 5,403 | (2,873 | ) | — | 2,530 | |||||||||||
Construction in progress and other items | 468 | (83 | ) | — | 385 | |||||||||||
|
|
|
|
|
|
|
| |||||||||
Balances at December 31, 2012 | 15,780 | (7,626 | ) | (18 | ) | 8,136 | ||||||||||
|
|
|
|
|
|
|
| |||||||||
Land and buildings | 5,781 | (1,624 | ) | (74 | ) | 4,083 | ||||||||||
IT equipment and fixtures | 4,168 | (3,271 | ) | — | 897 | |||||||||||
Furniture and vehicles | 5,616 | (2,983 | ) | — | 2,633 | |||||||||||
Construction in progress and other items | 230 | (56 | ) | — | 174 | |||||||||||
|
|
|
|
|
|
|
| |||||||||
Balances at December 31, 2013 | 15,795 | (7,934 | ) | (74 | ) | 7,787 | ||||||||||
|
|
|
|
|
|
|
| |||||||||
The carrying amount at December 31, 20112013 in the foregoing table includes the following approximate amounts:
EUR 5,2545,615 million (December 31, 2010:2012: EUR 5,1045,615 million; December 31, 2009:2011: EUR 4,7175,254 million) relating to property, plant and equipment owned by Group entities and branch offices located abroad.
EUR 793138 million (December 31, 2010:2012: EUR 660208 million; December 31, 2009:2011: EUR 196793 million) relating to property, plant and equipment being acquired under finance leases by the consolidated entities (Note 2.c discloses additional information on these items).
c) Investment property
| c) | Investment property |
The fair value of investment property at December 31, 20112013 amounted to EUR 3,8603,689 million (2010:(2012: EUR 1,3193,548 million; 2009:2011: EUR 1,1003,860 million). A comparison of the fair value of investment property at December 31, 2011, 20102013, 2012 and 20092011 with the carrying amount gives rise to gross unrealisedunrealized gains of EUR 9 million for each of those years,2013, EUR 3 million for 2012 and EUR 9 million for 2011, of which EUR 59 million, EUR 12 million and EUR 15 million, respectively, are attributable to the Group.
The rental income earned from investment property and the direct costs related both to investment properties that generated rental income in 2011, 20102013, 2012 and 20092011 and to investment properties that did not generate rental income in those years are not material in the context of the consolidated financial statements.
d) Sale of properties
| d) | Sale of properties |
In 2007 and 2008 the Group sold ten hallmark properties, and 1,152 GroupBank branch offices in Spain and its head office complex (Ciudad Financiera or Santander Business Campus) to various buyers. Simultaneously,Also, the Group entered into operating leases (with maintenance, insurance and taxes payable by the Group) on those properties with the buyers for various compulsorynon-cancellable terms (12 to 15 years for the hallmark properties, and 24 to 26 years for the branch offices)offices and 40 years for the Santander Business Campus), with various rent review agreements applicable during those periods.periods and the possible extensions thereof. The agreements are renewablebetween the parties also provided for five- or seven-year periods up to a total of 40 years, for the hallmark properties, and 45 years for the branch offices, and in general they provide for rents to be adjusted to market value in each renewal period. The agreements also include a purchase optionoptions that in general may be exercisedare exercisable by the Group on final expiry of the leases at the market value of the properties on the related dates, which will be determined, if appropriate, by independent experts.
Also, on September 12, 2008,expiry dates; the Group sold its head office complex (Ciudad Financiera or Santander Business Campus) to Marme Inversiones 2007, S.L. and simultaneously entered into an operating lease agreement with this company for the complex (with maintenance, insurance and taxes payable by the Group), with a compulsory term of 40 years, during which the rent (initially set at EUR 6.8 million per month, payable quarterly) will be reviewed annually based on the variation in the preceding twelve months in the Harmonised Consumer Price Index of the euro zone multiplied by 1.74, with a minimum of 2.20% during the first ten years and a maximum of 6% throughout the lease term. The agreement includes an option exercisable by the Group on final expiry of the lease to purchase the Business Campus at its market value on the expiry date -the market value will be determined, ifwhere appropriate, by independent experts-, and a right of first refusal if the lessor should wish to sell the Business Campus. In addition to the two aforementioned agreements, the Group entered into abased in part on third additional promotion agreement, whereby during the first 20 years of the lease term it can request Marme Inversiones 2007, S.L. to construct buildings additional to those already existing at the Business Campus or to acquire additional land (from the third year onwards) to be included in the Business Campus, all under certain terms and conditions and with a maximum total cost of approximately EUR 296 million, which would subsequently be included in the lease agreement.
The most noteworthy feature of the other agreed terms and conditions, all of which are customary market conditions for operating lease agreements, is that none of the aforementioned lease agreements provides for the transfer of ownership of the properties to the Group on expiry thereof, and the Group is entitled not to renew the rentals beyond the minimum compulsory term. Furthermore, the Group has not granted any guarantee to the buyers for any losses that might arise from the early termination of the agreements or for possible fluctuations in the residual value of the aforementioned properties.party appraisals.
F-100
The rental expense recognized by the Group in 20112013 in connection with these operating lease agreements amounted to EUR 286 million (2012: EUR 269 million; 2011: EUR 257 million.million). At December 31, 2011,2013, the present value of the minimum future payments that the Group will incur duringin the compulsory term (since it is considered that the agreements will not be renewed and the existing purchase options will not be exercised) amounted to EUR 218230 million payable within one year, (December 31, 2010: EUR 212 million; December 31, 2009: EUR 189 million), EUR 805847 million payable at between one and five years (December 31, 2010: EUR 784 million; December 31, 2009: EUR 697 million) -EUR 211 million in the second year (December 31, 2010: EUR 205 million; December 31, 2009: EUR 183 million), EUR 204 million in the third year (December 31, 2010: EUR 199 million; December 31, 2009: EUR 177 million), EUR 198 million in the fourth year (December 31, 2010: EUR 193 million; December 31, 2009: EUR 172 million) and EUR 192 million in the fifth year (December 31, 2010: EUR 187 million; December 31, 2009: EUR 166 million)-, and EUR 1,9401,821 million payable at more than five years (December 31, 2010: EUR 2,010 million; December 31, 2009: EUR 1,764 million).years.
17. Intangible assets—Goodwill
| 17. | Intangible assets – Goodwill |
The detail of Goodwill, based on the companiescash-generating units giving rise thereto, (see Note 3.c), is as follows:
| Millions of euros | ||||||||||||
| 2011 | 2010 | 2009 | ||||||||||
Santander UK plc | 8,896 | 8,633 | 8,361 | |||||||||
Banco Santander (Brasil) S.A. | 7,878 | 8,755 | 7,706 | |||||||||
Bank Zachodni WBK S.A. | 2,019 | — | — | |||||||||
Santander Holdings USA, Inc. | 1,587 | 1,537 | 1,425 | |||||||||
Banco Santander Totta, S.A. | 1,040 | 1,641 | 1,641 | |||||||||
Santander Consumer Holding GmbH (formerly CC-Holding) | 1,315 | 1,169 | 1,029 | |||||||||
Banco Santander – Chile | 742 | 798 | 683 | |||||||||
Grupo Financiero Santander, S.A. B de C.V. | 531 | 484 | 423 | |||||||||
Banesto | 369 | 369 | 369 | |||||||||
Santander Consumer Bank AS | 138 | 137 | 129 | |||||||||
Santander Consumer Bank S.p.A. | 106 | 106 | 106 | |||||||||
Santander Consumer USA Inc. | — | 523 | 493 | |||||||||
Banco Santander Consumer Portugal, S.A. | — | 59 | 122 | |||||||||
Other companies | 468 | 411 | 378 | |||||||||
|
|
|
|
|
| |||||||
Total goodwill | 25,089 | 24,622 | 22,865 | |||||||||
|
|
|
|
|
| |||||||
| Millions of euros | ||||||||||||
| 2013 | 2012 | 2011 | ||||||||||
Santander UK | 8,913 | 9,105 | 8,896 | |||||||||
Banco Santander (Brazil) | 5,840 | 7,035 | 7,878 | |||||||||
Bank Zachodni WBK | 2,487 | 2,210 | 2,019 | |||||||||
Santander Holdings USA | 1,489 | 1,556 | 1,587 | |||||||||
Santander Consumer Holding (Germany) | 1,315 | 1,315 | 1,315 | |||||||||
Banco Santander Totta | 1,040 | 1,040 | 1,040 | |||||||||
Banco Santander- Chile | 687 | 788 | 742 | |||||||||
Grupo Financiero Santander (Mexico) | 541 | 558 | 531 | |||||||||
Other companies | 969 | 1,019 | 1,081 | |||||||||
|
|
|
|
|
| |||||||
Total goodwill | 23,281 | 24,626 | 25,089 | |||||||||
|
|
|
|
|
| |||||||
The changes in Goodwill were as follows:
| Millions of euros | ||||||||||||
| 2013 | 2012 | 2011 | ||||||||||
Balance at beginning of year | 24,626 | 25,089 | 24,622 | |||||||||
Additions (Note 3) | 398 | 87 | 2,557 | |||||||||
Of which: | ||||||||||||
Bank Zachodni WBK | 326 | — | 2,261 | |||||||||
Skandinaviska Enskilda Banken | — | — | 145 | |||||||||
Impairment losses | (40 | ) | (156 | ) | (660 | ) | ||||||
Of which: | ||||||||||||
Santander Consumer Bank, S.p.A. (Italy) | — | (156 | ) | — | ||||||||
Banco Santander Totta, S.A. | — | — | (601 | ) | ||||||||
Disposals or changes in scope of consolidation (Note 3) | (39 | ) | — | (716 | ) | |||||||
Of which: | ||||||||||||
Santander Consumer USA Inc. | — | — | (541 | ) | ||||||||
Santander Seguros S.A. (Brazil) | — | — | (173 | ) | ||||||||
Exchange differences and other items | (1,664 | ) | (394 | ) | (714 | ) | ||||||
|
|
|
|
|
| |||||||
Balance at end of year | 23,281 | 24,626 | 25,089 | |||||||||
|
|
|
|
|
| |||||||
The Group has goodwill generated by cash-generating units located in non-euro currency countries (mainly the UK, Brazil, the United States, Poland, Mexico and Chile) and, therefore, this gives rise to exchange differences on the translation to euros, at closing rates, of the amounts of goodwill denominated in foreign currencies. In accordance with current regulations, these exchange differences were recognized with a charge to the heading Valuation adjustments - Exchange differences in equity and a credit to Goodwill in assets. The change in the balance of this heading is disclosed in the consolidated statement of recognized income and expense.
At least once per year (or whenever there is any indication of impairment), the Group reviews goodwill for impairment (i.e. a potential reduction in its recoverable value to below its carrying amount). The first step that must be taken in order to perform this analysis is the identification of the cash-generating units, i.e. the Group’s smallest identifiable groups of assets that generate cash inflows that are largely independent of the cash inflows from other assets or groups of assets.
The costamount to be recovered of each cash-generating unit is determined taking into consideration the carrying amount (including any fair value adjustments arising on the business combination) of all the assets and liabilities of all the independent legal entities comprising the cash-generating unit, together with the related goodwill.
The amount to be recovered of the cash-generating unit including goodwill, is compared with its recoverable amount in order to determine whether there is any impairment. In order
The Group’s assesses the existence of any indication that might be considered to determine the recoverable amount, the Group uses market prices, if available, valuations performed by independent experts, or internal estimates.
In order to determine the fair valuebe evidence of impairment of the cash-generating units,unit by reviewing information including the Group’s directors use:following: (i) certain macroeconomic variables that might affect its investments (population data, political situation, economic situation -including bankarisation-bankarization-, among others); and (ii) various microeconomic variables comparing the investments of the Group with the financial services industry of the country in which the Group carries on most of its business activities (balance sheet composition, total funds under management, results, efficiency ratio, capital adequacy ratio, return on equity, among others);.
Regardless of whether there is any indication of impairment, every year the Group calculates the recoverable amount of each cash-generating unit to which goodwill has been allocated and, (iii)to this end, it uses price quotations, if available, market references (multiples), internal estimates and based in part on third party appraisals.
Firstly, the Group determines the recoverable amount by calculating the fair value of each cash-generating unit on the basis of the quoted price of the cash-generating units, if available, and of the price earnings (P/E) ratio of the investments as compared with the P/E ratio of the stock market in the country in which the investments are located and thatratios of comparable local financial institutions.
F-101
To supplement this,In addition, the Group performs estimates of the recoverable amounts of certain cash-generating units by calculating their value in use using discounted cash flow projections. In order to performThe main assumptions used in this calculation the most significant assumptions used are: (i) cash flowearnings projections which are based on the five-year financial budgets approved by the directors;directors which normally cover a five-year period (unless a longer time horizon can be justified), (ii) discount rates which are determined as the cost of capital consisting oftaking into account the risk-free rate of return plus a risk premium in line with the market and the business in which the units operate;operate and (iii) a constant growth raterates used in order to extrapolate the cash flows inearnings to perpetuity which is determined consideringdo not exceed the evolution of GDP oflong-term average growth rate for the market in which the cash-generating unit in question operates.
The cash flow projections used to obtain the values in use are based on the financial budgets approved by both local management of the related local units and the Group’s directors. The Group’s budgetary estimation process is common for all the cash-generating units. The local management teams prepare their budgets using the following key assumptions:
| a) | Microeconomic variables of the cash-generating unit: management takes into consideration the current balance sheet structure, the product mix on offer and the business decisions taken by local management in this regard. |
| b) | Macroeconomic variables: growth is estimated on the basis of the changing environment, taking into consideration expected GDP growth in the unit’s geographical location and forecast trends in interest and exchange rates. These data, which are based on external information sources, are provided by the Group’s economic research service. |
| c) | Past performance variables: in addition, management takes into consideration in the projection the difference (both positive and negative) between the cash-generating unit’s past performance and that of the market. |
Following is a detail of the main assumptions used in determining the recoverable amount, at 2013 year-end, of the most significant cash-generating units which were valued using the discounted cash flow method:
| Projected period | Discount rate (*) | Nominal perpetual growth rate | ||||||||||
Santander UK | 5 years | 10.3 | % | 2.5 | % | |||||||
Banco Santander (Brazil) | 5 years | 14.8 | % | 7.0 | % | |||||||
Santander Holdings USA | 5 years | 10.5 | % | 2.5 | % | |||||||
Santander Consumer Holding (Germany) | 5 years | 9.7 | % | 2.5 | % | |||||||
Banco Santander Totta | 5 years | 12.2 | % | 3.0 | % | |||||||
| (*) | Post-tax discount rate for the purpose of consistency with the earnings projections used. |
Given the degree of uncertainty related toof these assumptions, the directors carry outGroup performs a sensitivity analysis thereof using reasonably possiblereasonable changes in the key assumptions on which the recoverable amountsamount of the cash-generating units areis based in order to confirm thatwhether their recoverable amount still exceeds their carrying amount. The sensitivity analysis involved adjusting the discount rate by +/- 50 basis points and the perpetuity growth rate by +/-50 basis points. Following the sensitivity analysis performed, the value in use of all the cash-generating units still exceeds their recoverable amount.
The amount to be recovered of Bank Zachodni WBK, Banco Santander –Chile and Grupo Financiero Santander México was calculated as the fair values of the aforementioned cash-generating units obtained from the market prices of their shares at year-end. This value exceeded the recoverable amounts still exceed the carrying amounts and therefore no impairment would be recorded through the income statement.amount.
Based on the foregoing, and in accordance with the estimates, projections and sensitivity analyses available to the Bank’s directors, in 20112013 the Group recognized impairment losses on goodwill totallingtotaling EUR 66040 million (2010:(2012: EUR 63156 million; 2009:2011: EUR 3660 million) under Impairment losses on other assets—assets (net) - Goodwill and other intangible assets. In 2011 all thesethe impairment losses recognized related to the Group’sGroup subsidiaries in Portugal (Banco Santander Totta, S.A. and Banco Santander Consumer Portugal, S.A.).Portugal. These losses were attributableattributed to the macroeconomic deterioration experienced by Portugal,in Portugal. In 2012 the impairment losses recognized, which prompted a worseningwere due mainly to the deterioration of the key assumptions usedbusiness expectations, related mainly to calculate the recoverable amount (expected profit and perpetual growth and discount rate).Group subsidiaries in Italy.
At December 31, 2011,2013, none of the cash-generating units with significant goodwill other than the units mentioned above, had a recoverable amount at or nearapproximating their carrying amount. The recoverable amount is considered to itsbe close to the carrying amount.
Theamount when reasonable changes in Goodwill were as follows:
| Millions of euros | ||||||||||||
| 2011 | 2010 | 2009 | ||||||||||
Balance at the begining of the year | 24,622 | 22,865 | 18,836 | |||||||||
Additions (Note 3) | 2,557 | 16 | 2,300 | |||||||||
Of which: | ||||||||||||
Santander Holdings USA, Inc. (formerly Sovereign Bancorp, Inc.) | — | — | 1,601 | |||||||||
Santander Cards UK Limited | — | — | 359 | |||||||||
Real Tokio Marine | — | — | 152 | |||||||||
Bank Zachodni WBK S.A. | 2,261 | — | — | |||||||||
Skandinaviska Enskild Banken | 145 | — | — | |||||||||
Adjustments to initial acquisition price allocation | — | 167 | 628 | |||||||||
Impairment losses | (660 | ) | (63 | ) | (3 | ) | ||||||
Of which: | ||||||||||||
Banco Santander Totta, S.A. | (601 | ) | — | — | ||||||||
Disposals or changes in scope of consolidation (Note 3) | (716 | ) | — | (1,288 | ) | |||||||
Of which: | ||||||||||||
Banco Santander (Brasil) S.A. | — | — | (1,286 | ) | ||||||||
Santander Consumer USA Inc. | (541 | ) | — | — | ||||||||
Santander Seguros S.A. (Brasil) | (173 | ) | — | — | ||||||||
Exchange differences and other items | (714 | ) | 1,637 | 2,392 | ||||||||
|
|
|
|
|
| |||||||
Balance at the end of year | 25,089 | 24,622 | 22,865 | |||||||||
|
|
|
|
|
| |||||||
The Group has goodwill generated by cash-generating units located in non-euro currency countries (mainly the UK, Brazil, the United States, Poland, Mexico and Chile) and, therefore, this gives rise to exchange differences on the translation to euros, at closing rates, of the amounts of goodwill denominated in foreign currencies. In accordance with current regulations, these exchange differences were recognized with a charge to the heading Valuation adjustments—Exchange differences in equity and a credit to Goodwill in assets. The changemain assumptions used in the balance of this heading is disclosed invaluation cause the consolidated statement of recognized income and expense.recoverable amount to be below the amount to be recovered.
F-102
18. Intangible assets—Other intangible assets
| 18. | Intangible assets - Other intangible assets |
The detail of Intangible assets—assets - Other intangible assets in the consolidated balance sheets and of the changes therein in 2011, 20102013, 2012 and 20092011 is as follows:
| Millions of euros | Millions of euros | |||||||||||||||||||||||||||||||||||||||||||||||||||||||||||
Millions of euros | Estimated | December 31, 2010 | Net additions and disposals | Change in scope of consolidation | Amortization and impairment | Application of amortization and impairment | Exchange differences and other | December 31, 2011 | ||||||||||||||||||||||||||||||||||||||||||||||||||||
| Estimated useful life | December 31, 2012 | Net additions and disposals | Change in scope of consolidation | Amortization and impairment | Application of amortization and impairment | Exchange differences and other | December 31, 2013 | |||||||||||||||||||||||||||||||||||||||||||||||||||||
With indefinite useful life: | ||||||||||||||||||||||||||||||||||||||||||||||||||||||||||||
Brand names | 44 | — | (30 | ) | — | — | — | 14 | 14 | 2 | — | — | — | (1 | ) | 15 | ||||||||||||||||||||||||||||||||||||||||||||
With finite useful life: | ||||||||||||||||||||||||||||||||||||||||||||||||||||||||||||
IT developments | 3 to 7 years | 4,237 | 1,420 | 145 | — | (570 | ) | (105 | ) | 5,127 | 3 to 7 years | 5,285 | 1,229 | 4 | — | (679 | ) | (293 | ) | 5,546 | ||||||||||||||||||||||||||||||||||||||||
Other | 1,899 | 62 | (104 | ) | — | (254 | ) | (109 | ) | 1,494 | 1,373 | (46 | ) | 37 | — | (37 | ) | (195 | ) | 1,132 | ||||||||||||||||||||||||||||||||||||||||
Accumulated amortization | (2,732 | ) | — | (112 | ) | (1,188 | ) | 799 | 83 | (3,150 | ) | (3,106 | ) | — | (3 | ) | (1,353 | ) | 715 | 144 | (3,603 | ) | ||||||||||||||||||||||||||||||||||||||
Impairment losses | (6 | ) | — | — | (501 | ) | 25 | (9 | ) | (491 | ) | (130 | ) | — | — | (1 | ) | 1 | — | (130 | ) | |||||||||||||||||||||||||||||||||||||||
|
|
|
|
|
|
|
|
|
|
|
|
|
| |||||||||||||||||||||||||||||||||||||||||||||||
| 3,442 | 1,482 | (101 | ) | (1,689 | ) | — | (140 | ) | 2,994 | 3,436 | 1,185 | 38 | (1,354 | ) | — | (345 | ) | 2,960 | ||||||||||||||||||||||||||||||||||||||||||
|
|
|
|
|
|
|
|
|
|
|
|
|
| |||||||||||||||||||||||||||||||||||||||||||||||
| Millions of euros | ||||||||||||||||||||||||||||||||||||||||||||||||||||||||||||
| Estimated useful life | December 31, 2011 | Net additions and disposals | Change in scope of consolidation | Amortization and impairment | Application of amortization and impairment | Exchange differences and other | December 31, 2012 | |||||||||||||||||||||||||||||||||||||||||||||||||||||
With indefinite useful life: | ||||||||||||||||||||||||||||||||||||||||||||||||||||||||||||
Brand names | 14 | — | — | — | — | — | 14 | |||||||||||||||||||||||||||||||||||||||||||||||||||||
With finite useful life: | ||||||||||||||||||||||||||||||||||||||||||||||||||||||||||||
IT developments | 3 to 7 years | 5,127 | 1,098 | 45 | — | (911 | ) | (74 | ) | 5,285 | ||||||||||||||||||||||||||||||||||||||||||||||||||
Other | 1,494 | 545 | 11 | — | (552 | ) | (125 | ) | 1,373 | |||||||||||||||||||||||||||||||||||||||||||||||||||
Accumulated amortization | (3,150 | ) | — | (28 | ) | (1,110 | ) | 1,139 | 43 | (3,106 | ) | |||||||||||||||||||||||||||||||||||||||||||||||||
Impairment losses | (491 | ) | — | — | 5 | 324 | 32 | (130 | ) | |||||||||||||||||||||||||||||||||||||||||||||||||||
|
|
|
|
|
|
| ||||||||||||||||||||||||||||||||||||||||||||||||||||||
| 2,994 | 1,643 | 28 | (1,105 | ) | — | (124 | ) | 3,436 | ||||||||||||||||||||||||||||||||||||||||||||||||||||
|
|
|
|
|
|
| ||||||||||||||||||||||||||||||||||||||||||||||||||||||
With indefinite useful life: Brand names With finite useful life: IT developments Other Accumulated amortization Impairment losses Millions of euros Estimated
useful life December 31,
2010 Net
additions
and
disposals Change in
scope of
consolidation Amortization
and impairment Application of
amortization
and
impairment Exchange
differences
and other December 31,
2011 44 — (30 ) — — — 14 3 to 7
years 4,237 1,420 145 — (570 ) (105 ) 5,127 1,899 62 (104 ) — (249 ) (114 ) 1,494 (2,732 ) — (112 ) (1,183 ) 794 83 (3,150 ) (6 ) — — (501 ) 25 (9 ) (491 ) 3,442 1,482 (101 ) (1,684 ) — (145 ) 2,994
| Millions of euros | ||||||||||||||||||||||||||||||
Millions of euros | Estimated | December 31, 2009 | Net additions and disposals | Change in scope of consolidation | Amortization and impairment | Application of amortization and impairment | Exchange differences and other | December 31, 2010 | ||||||||||||||||||||||
With indefinite useful life: | ||||||||||||||||||||||||||||||
Brand names | 41 | — | — | — | — | 3 | 44 | |||||||||||||||||||||||
With finite useful life: | ||||||||||||||||||||||||||||||
Credit cards (Abbey) | 5 years | 27 | — | — | — | (27 | ) | — | — | |||||||||||||||||||||
IT developments | 3 to 7 years | 2,942 | 1,338 | — | — | (357 | ) | 314 | 4,237 | |||||||||||||||||||||
Other | 1,697 | 133 | 2 | — | (62 | ) | 129 | 1,899 | ||||||||||||||||||||||
Accumulated amortization | (1,921 | ) | — | — | (1,085 | ) | 437 | (163 | ) | (2,732 | ) | |||||||||||||||||||
Impairment losses | (8 | ) | — | — | (6 | ) | 9 | (1 | ) | (6 | ) | |||||||||||||||||||
|
|
|
|
|
|
|
|
|
|
|
|
|
| |||||||||||||||||
| 2,778 | 1,471 | 2 | (1,091 | ) | — | 282 | 3,442 | |||||||||||||||||||||||
|
|
|
|
|
|
|
|
|
|
|
|
|
| |||||||||||||||||
F-103
| Millions of euros | ||||||||||||||||||||||||||||||||
Millions | Estimated useful life | December 31, 2008 | Net additions and disposals | Change in scope of consolidation | Amortization and impairment | Application of amortization and impairment | Exchange differences and other | December 31, 2009 | ||||||||||||||||||||||||
With indefinite useful life: | ||||||||||||||||||||||||||||||||
Brand names | 41 | 1 | — | — | — | (1 | ) | 41 | ||||||||||||||||||||||||
With finite useful life: | ||||||||||||||||||||||||||||||||
Credit cards (Abbey) | 5 years | 25 | — | — | — | — | 2 | 27 | ||||||||||||||||||||||||
IT developments | 3 years | 2,175 | 856 | 25 | — | (502 | ) | 388 | 2,942 | |||||||||||||||||||||||
Other | 886 | 488 | 160 | — | (36 | ) | 199 | 1,697 | ||||||||||||||||||||||||
Accumulated amortization | (1,332 | ) | — | (41 | ) | (826 | ) | 516 | (238 | ) | (1,921 | ) | ||||||||||||||||||||
Impairment losses | (7 | ) | — | — | (29 | ) | 22 | 6 | (8 | ) | ||||||||||||||||||||||
|
|
|
|
|
|
|
|
|
|
|
|
|
| |||||||||||||||||||
| 1,788 | 1,345 | 144 | (855 | ) | — | 356 | 2,778 | |||||||||||||||||||||||||
|
|
|
|
|
|
|
|
|
|
|
|
|
| |||||||||||||||||||
At December 31, 2011, 2010 and 2009, the Group reviewed the useful lives of its intangible assets and adjusted the carrying amounts of these assets on the basis of the estimated economic benefits currently expected to be obtained therefrom. As a result of this review, in 2011 the Group recognized impairment losses amounting to EUR 501 million under Impairment losses on other assets—Goodwill and other intangible assets (2010: EUR 6 million and 2009: EUR 29 million).
19. Other assets
| 19. | Other assets |
The detail of Other assets is as follows:
| Millions of euros | ||||||||||||||||||||||||
| Millions of euros | 2013 | 2012 | 2011 | |||||||||||||||||||||
| 2011 | 2010 | 2009 | ||||||||||||||||||||||
Transactions in transit | 616 | 304 | 440 | 127 | 224 | 616 | ||||||||||||||||||
Net pension plan assets (Note 25) | 1,510 | 984 | 502 | 149 | 348 | 299 | ||||||||||||||||||
Prepayments and accrued income | 2,032 | 2,559 | 2,259 | 2,114 | 1,756 | 2,032 | ||||||||||||||||||
Other | 3,541 | 3,285 | 2,412 | 3,344 | 3,046 | 3,541 | ||||||||||||||||||
Inventories | 319 | 455 | 519 | �� | 80 | 173 | 319 | |||||||||||||||||
|
|
|
|
|
| |||||||||||||||||||
| 8,018 | 7,587 | 6,132 | 5,814 | 5,547 | 6,807 | |||||||||||||||||||
|
|
|
|
|
| |||||||||||||||||||
F-104
20. Deposits from central banks and Deposits from credit institutions
| 20. | Deposits from central banks and Deposits from credit institutions |
The detail, by classification, counterparty, type and currency, of Deposits from central banks and Deposits from credit institutions in the consolidated balance sheets is as follows:
| Millions of euros | ||||||||||||||||||||||||
| Millions of euros | 2013 | 2012 | 2011 | |||||||||||||||||||||
| 2011 | 2010 | 2009 | ||||||||||||||||||||||
Classification: | ||||||||||||||||||||||||
Financial liabilities held for trading | 17,027 | 40,976 | 46,116 | 11,334 | 9,420 | 17,027 | ||||||||||||||||||
Of which: | ||||||||||||||||||||||||
Deposits from central banks | 7,740 | 12,605 | 2,985 | 3,866 | 1,128 | 7,740 | ||||||||||||||||||
Deposits from credit institutions | 9,287 | 28,371 | 43,131 | 7,468 | 8,292 | 9,287 | ||||||||||||||||||
Other financial liabilities at fair value through profit or loss | 9,742 | 19,600 | 22,848 | 11,741 | 11,876 | 9,742 | ||||||||||||||||||
Of which: | ||||||||||||||||||||||||
Deposits from central banks | 1,510 | 337 | 10,103 | 2,097 | 1,014 | 1,510 | ||||||||||||||||||
Deposits from credit institutions | 8,232 | 19,263 | 12,745 | 9,644 | 10,862 | 8,232 | ||||||||||||||||||
Financial liabilities at amortised cost | 116,369 | 79,536 | 73,127 | |||||||||||||||||||||
Financial liabilities at amortized cost | 86,322 | 131,670 | 116,369 | |||||||||||||||||||||
Of which: | ||||||||||||||||||||||||
Deposits from central banks | 34,996 | 8,644 | 22,345 | 9,788 | 50,938 | 34,996 | ||||||||||||||||||
Deposits from credit institutions | 81,373 | 70,892 | 50,782 | 76,534 | 80,732 | 81,373 | ||||||||||||||||||
|
|
|
|
|
| |||||||||||||||||||
| 143,138 | 140,112 | 142,091 | 109,397 | 152,966 | 143,138 | |||||||||||||||||||
|
|
|
|
|
| |||||||||||||||||||
Type: | ||||||||||||||||||||||||
Reciprocal accounts | 604 | 423 | 948 | 755 | 508 | 604 | ||||||||||||||||||
Time deposits | 82,817 | 57,233 | 78,325 | 55,839 | 92,491 | 82,817 | ||||||||||||||||||
Other demand accounts | 3,396 | 2,678 | 3,341 | 3,425 | 3,225 | 3,396 | ||||||||||||||||||
Repurchase agreements | 51,316 | 78,197 | 56,818 | 49,378 | 50,742 | 51,316 | ||||||||||||||||||
Central bank credit account drawdowns | 5,005 | 1,580 | 2,659 | — | 6,000 | 5,005 | ||||||||||||||||||
Hybrid financial liabilities | — | 1 | — | |||||||||||||||||||||
|
|
|
|
|
| |||||||||||||||||||
| 143,138 | 140,112 | 142,091 | 109,397 | 152,966 | 143,138 | |||||||||||||||||||
|
|
|
|
|
| |||||||||||||||||||
Currency: | ||||||||||||||||||||||||
Euro | 81,044 | 52,872 | 58,458 | 63,947 | 98,808 | 81,044 | ||||||||||||||||||
Pound sterling | 9,787 | 25,309 | 34,720 | 6,993 | 8,566 | 9,787 | ||||||||||||||||||
US dollar | 31,175 | 43,996 | 37,066 | 27,509 | 34,904 | 31,175 | ||||||||||||||||||
Other currencies | 21,132 | 17,935 | 11,847 | 10,948 | 10,688 | 21,132 | ||||||||||||||||||
|
|
|
|
|
| |||||||||||||||||||
| 143,138 | 140,112 | 142,091 | 109,397 | 152,966 | 143,138 | |||||||||||||||||||
|
|
|
|
|
| |||||||||||||||||||
Both asset and liability balances with central banks have increased afterin 2012 following the liquidity injections by the central banks in countries where the Group operates, particularly in the euro zone. The European Central Bank (ECB) has implemented extraordinary monetary policy measures, including a wider range of collateral and three-year liquidity auctions.
The Group continued to go toattend these auctions and deposit inat the ECB most of the funds captured, which has significantly increasedincreasing the liquidity buffer and improvedimproving its structure by replacing short-term maturities with longer term funding. The only Group entity that has a net structural borrowing position from the ECB is Banco Santander Totta, S.A. (close to EUR 4 billion).repaid most of these amounts in January 2013.
Note 51 contains a detail of the residual maturity periods of financial liabilities at amortisedamortized cost and of the related average interest rates.
F-105
21. Customer deposits
| 21. | Customer deposits |
The detail, by classification, geographical area and type, of Customer deposits is as follows:
| Millions of euros | ||||||||||||||||||||||||
| Millions of euros | 2013 | 2012 | 2011 | |||||||||||||||||||||
| 2011 | 2010 | 2009 | ||||||||||||||||||||||
Classification: | ||||||||||||||||||||||||
Financial liabilities held for trading | 16,574 | 7,849 | 4,658 | 8,500 | 8,897 | 16,574 | ||||||||||||||||||
Other financial liabilities at fair value through profit or loss | 26,982 | 27,142 | 14,636 | 26,484 | 28,638 | 26,982 | ||||||||||||||||||
Financial liabilities at amortised cost | 588,977 | 581,385 | 487,681 | |||||||||||||||||||||
Financial liabilities at amortized cost | 572,853 | 589,104 | 588,977 | |||||||||||||||||||||
|
|
|
|
|
| |||||||||||||||||||
| 632,533 | 616,376 | 506,975 | 607,837 | 626,639 | 632,533 | |||||||||||||||||||
|
|
|
|
|
| |||||||||||||||||||
Geographical area: | ||||||||||||||||||||||||
Spain | 202,022 | 218,788 | 170,760 | 185,460 | 192,588 | 202,022 | ||||||||||||||||||
European Union (excluding Spain) | 260,529 | 230,929 | 199,169 | 259,903 | 261,135 | 260,529 | ||||||||||||||||||
United States and Puerto Rico | 43,437 | 40,855 | 37,851 | 43,773 | 45,129 | 43,437 | ||||||||||||||||||
Other OECD countries | 939 | 998 | 1,101 | |||||||||||||||||||||
Latin America | 125,343 | 124,334 | 96,805 | 116,666 | 126,842 | 125,343 | ||||||||||||||||||
Rest of the world | 263 | 472 | 1,289 | 2,035 | 945 | 1,202 | ||||||||||||||||||
|
|
|
|
|
| |||||||||||||||||||
| 632,533 | 616,376 | 506,975 | 607,837 | 626,639 | 632,533 | |||||||||||||||||||
|
|
|
|
|
| |||||||||||||||||||
Type: | ||||||||||||||||||||||||
Demand deposits- | ||||||||||||||||||||||||
Current accounts | 155,455 | 148,066 | 135,895 | 167,787 | 144,305 | 155,455 | ||||||||||||||||||
Savings accounts | 140,583 | 136,694 | 127,941 | 164,214 | 167,389 | 140,583 | ||||||||||||||||||
Other demand deposits | 3,179 | 3,431 | 3,570 | 3,512 | 3,443 | 3,179 | ||||||||||||||||||
Time deposits- | ||||||||||||||||||||||||
Fixed-term deposits | 257,498 | 275,629 | 192,245 | 225,471 | 257,583 | 257,498 | ||||||||||||||||||
Home-purchase savings accounts | 174 | 231 | 316 | 102 | 132 | 174 | ||||||||||||||||||
Discount deposits | 732 | 448 | 448 | 1,156 | 1,345 | 732 | ||||||||||||||||||
Hybrid financial liabilities | 4,594 | 4,754 | 5,447 | 3,324 | 3,128 | 4,594 | ||||||||||||||||||
Other term deposits | 139 | 154 | 212 | 463 | 590 | 139 | ||||||||||||||||||
Notice deposits | 1,338 | 1,316 | 2,208 | 21 | 969 | 1,338 | ||||||||||||||||||
Repurchase agreements | 68,841 | 45,653 | 38,693 | 41,787 | 47,755 | 68,841 | ||||||||||||||||||
|
|
|
|
|
| |||||||||||||||||||
| 632,533 | 616,376 | 506,975 | 607,837 | 626,639 | 632,533 | |||||||||||||||||||
|
|
|
|
|
| |||||||||||||||||||
Note 51 contains a detail of the residual maturity periods of financial liabilities at amortisedamortized cost and of the related average interest rates.
| 22. | Marketable debt securities |
F-106
22. Marketable debt securities
a) Breakdown
| a) | Breakdown |
The detail, by classification and type, of Marketable debt securities is as follows:
| Millions of euros | ||||||||||||||||||||||||
| Millions of euros | 2013 | 2012 | 2011 | |||||||||||||||||||||
| 2011 | 2010 | 2009 | ||||||||||||||||||||||
Classification: | ||||||||||||||||||||||||
Financial liabilities held for trading | 77 | 366 | 586 | 1 | 1 | 77 | ||||||||||||||||||
Other financial liabilities at fair value through profit or loss | 8,185 | 4,278 | 4,887 | 4,086 | 4,904 | 8,185 | ||||||||||||||||||
Financial liabilities at amortised cost | 189,110 | 188,229 | 206,490 | |||||||||||||||||||||
Financial liabilities at amortized cost | 171,390 | 201,064 | 189,110 | |||||||||||||||||||||
|
|
|
|
|
| |||||||||||||||||||
| 197,372 | 192,873 | 211,963 | 175,477 | 205,969 | 197,372 | |||||||||||||||||||
|
|
|
|
|
| |||||||||||||||||||
Type: | ||||||||||||||||||||||||
Bonds and debentures outstanding | 185,530 | 185,869 | 183,250 | 161,274 | 183,686 | 185,530 | ||||||||||||||||||
Notes and other securities | 11,842 | 7,004 | 28,713 | 14,203 | 22,283 | 11,842 | ||||||||||||||||||
|
|
|
|
|
| |||||||||||||||||||
| 197,372 | 192,873 | 211,963 | 175,477 | 205,969 | 197,372 | |||||||||||||||||||
|
|
|
|
|
| |||||||||||||||||||
At December 31, 2011, 20102013 and 2009,2012, none of these issues was convertible into Bank shares or granted privileges or rights which, in certain circumstances, make them convertible into shares (except forshares. At December 31, 2011, the only issues with these features were the “Valores Santander” issue which is described(described in Note 34.a)., which were converted into shares in 2012.
Note 51 contains a detail of the residual maturity periods of financial liabilities at amortisedamortized cost at 2011, 20102013, 2012 and 20092011 year-end and of the related average interest rates in those years.
b) Bonds and debentures outstanding
| b) | Bonds and debentures outstanding |
The detail, by currency of issue, of Bonds and debentures outstanding is as follows:
| December 31, 2011 | ||||||||||||||||||||||||||||||||||||||||
| Outstanding | Annual Interest rate (%) | |||||||||||||||||||||||||||||||||||||||
| issue amount | December 31, 2013 | |||||||||||||||||||||||||||||||||||||||
| in foreign | Outstanding issue amount in foreign currency (millions) | Annual interest rate (%) | ||||||||||||||||||||||||||||||||||||||
| Millions of euros | currency |
Millions of euros | ||||||||||||||||||||||||||||||||||||||
Currency of issue | 2011 | 2010 | 2009 | (millions) | 2013 | 2012 | 2011 | |||||||||||||||||||||||||||||||||
Euro | 116,590 | 120,705 | 122,454 | 116,590 | 3.63 | % | 85,120 | 111,173 | 116,590 | 85,120 | 3.64 | % | ||||||||||||||||||||||||||||
US dollar | 28,995 | 33,680 | 36,535 | 37,517 | 2.21 | % | 25,641 | 26,186 | 28,995 | 35,361 | 2.88 | % | ||||||||||||||||||||||||||||
Pound sterling | 20,483 | 17,735 | 13,829 | 17,110 | 6.64 | % | 20,237 | 24,707 | 20,483 | 16,872 | 2.79 | % | ||||||||||||||||||||||||||||
Brazilian real | 12,790 | 7,391 | 3,768 | 30,899 | 7.04 | % | 15,017 | 14,581 | 12,790 | 48,920 | 7.73 | % | ||||||||||||||||||||||||||||
Hong Kong dollar | 5,026 | 170 | 283 | 53,748 | 3.72 | % | ||||||||||||||||||||||||||||||||||
Chilean peso | 3,714 | 3,777 | 3,180 | 2,493,352 | 4.19 | % | 3,360 | 3,906 | 3,714 | 2,434,430 | 4.25 | % | ||||||||||||||||||||||||||||
Other currencies | 2,958 | 2,581 | 3,484 | 6,873 | 2,963 | 2,675 | ||||||||||||||||||||||||||||||||||
|
|
|
|
|
| |||||||||||||||||||||||||||||||||||
Balance at end of year | 185,530 | 185,869 | 183,250 | 161,274 | 183,686 | 185,530 | ||||||||||||||||||||||||||||||||||
|
|
|
|
|
| |||||||||||||||||||||||||||||||||||
F-107
The changes in Bonds and debentures outstanding were as follows:
| Millions of euros | ||||||||||||||||||||||||
| Millions of euros | 2013 | 2012 | 2011 | |||||||||||||||||||||
| 2011 | 2010 | 2009 | ||||||||||||||||||||||
Balance at beginning of year | 185,869 | 183,250 | 194,291 | 183,686 | 185,530 | 185,869 | ||||||||||||||||||
Net inclusion of entities in the Group | (6,064 | ) | 831 | 10,760 | — | (1,649 | ) | (6,064 | ) | |||||||||||||||
Of which: | ||||||||||||||||||||||||
Santander Consumer USA Inc. | (6,025 | ) | 831 | — | — | — | (6,025 | ) | ||||||||||||||||
Santander Holdings USA, Inc. (Sovereign Bancorp, Inc.) | — | — | 10,759 | |||||||||||||||||||||
Issues | 91,215 | 116,239 | 60,999 | 61,754 | 80,817 | 91,215 | ||||||||||||||||||
Of which: | ||||||||||||||||||||||||
Santander UK Group | ||||||||||||||||||||||||
Bonds in other currencies | 49,497 | 24,221 | 33,257 | 23,491 | 32,162 | 49,497 | ||||||||||||||||||
Bond in pounds sterling | 8,301 | 51,052 | 4,945 | 5,877 | 13,281 | 8,301 | ||||||||||||||||||
Banco Santander (Brasil) S.A. | ||||||||||||||||||||||||
Banco Santander (Brasil), S.A. | ||||||||||||||||||||||||
Bonds | 6,783 | 3,984 | 80 | 5,777 | 6,461 | 6,783 | ||||||||||||||||||
Real estate letters of credit | 3,927 | 3,218 | 2,311 | 4,989 | 5,359 | 3,927 | ||||||||||||||||||
Agricultural letters of credit | 1,274 | 410 | 458 | 478 | 1,612 | 1,274 | ||||||||||||||||||
Santander International Debt, S.A. Sole-Shareholder Company—Bonds | 8,635 | 10,012 | 2,928 | |||||||||||||||||||||
Santander International Debt, S.A. Sole-Shareholder Company – Bonds | 4,654 | 9,727 | 8,635 | |||||||||||||||||||||
Banco Santander, S.A. | ||||||||||||||||||||||||
Territorial bonds - fixed rate | 4,000 | — | — | |||||||||||||||||||||
Mortgage-backed bonds - fixed rate | 1,990 | 4,089 | — | |||||||||||||||||||||
Bonds | 3,978 | 2,110 | — | 323 | — | 3,978 | ||||||||||||||||||
Mortgage-backed bonds—fixed rate | — | 2,027 | 1,500 | |||||||||||||||||||||
Santander Consumer Finance, S.A. – Bonds | 2,325 | 1,012 | 481 | |||||||||||||||||||||
Banco Santander – Chile – Bonds | 1,469 | 1,436 | 874 | |||||||||||||||||||||
Motor 2013 PLC – Asset-backed securities | 598 | — | — | |||||||||||||||||||||
Bilkreditt 5 Limited – Asset-backed securities | 494 | — | — | |||||||||||||||||||||
Bilkreditt 3 Limited – Asset-backed securities | 468 | — | — | |||||||||||||||||||||
SC Germany Auto 2013-12 UG – Asset-backed securities | 466 | — | — | |||||||||||||||||||||
Santander Consumer Bank A.S. – Bonds | 443 | 816 | 4 | |||||||||||||||||||||
Dansk Auto Finansiering 1 Ltd. – Asset-backed securities | 416 | — | — | |||||||||||||||||||||
SC Germany Auto 2013-1 UG (Haftungsbeschraenkt) - Asset-backed securities | 407 | — | — | |||||||||||||||||||||
Banco Santander (México), S.A., Institución de Banca Múltiple, Grupo Financiero Santander – Bonds | 392 | 780 | — | |||||||||||||||||||||
SCF Rahoituspalvelut 2013 Limited – Asset-backed securities | 384 | — | — | |||||||||||||||||||||
Santander Holdings USA, Inc. – Bonds | 362 | 453 | 384 | |||||||||||||||||||||
Bilkreditt 4 Limited- Asset-backed securities | 357 | — | — | |||||||||||||||||||||
Trade Maps 3 Ireland Limited – Debentures – floating rate | 313 | — | — | |||||||||||||||||||||
Santander Consumer Bank Spólka Akcyjna – Bonds | 256 | 112 | 213 | |||||||||||||||||||||
Fondo de Titulización de Activos PYMES Santander 6 – Asset-backed securities | 235 | — | — | |||||||||||||||||||||
Santander Consumer Bank S.P.A. – Bonos – floating rate | 100 | — | 650 | |||||||||||||||||||||
Santander International Products, Plc. – Bonds | 65 | — | — | |||||||||||||||||||||
Banesto | ||||||||||||||||||||||||
Mortgage-backed bonds – fixed rate | — | 955 | 600 | |||||||||||||||||||||
Bonds | 1,452 | 5,979 | 4,556 | — | 949 | 1,452 | ||||||||||||||||||
Mortgage-backed bonds—fixed rate | 600 | 565 | 2,807 | |||||||||||||||||||||
Motor 2012 PLC – Asset-backed securities | — | 895 | — | |||||||||||||||||||||
Svensk Autofinans 1 Limited - Asset-backed securities | — | 407 | — | |||||||||||||||||||||
SCF Rahoituspalvelut Limited - Asset-backed securities | — | 237 | — | |||||||||||||||||||||
Banco Santander Totta, S.A. | ||||||||||||||||||||||||
Mortgage debentures | 875 | 950 | 1,000 | — | — | 875 | ||||||||||||||||||
Bonds | 359 | 342 | 1,520 | — | — | 359 | ||||||||||||||||||
Banco Santander—Chile—Bonds | 874 | 2,135 | 859 | |||||||||||||||||||||
Santander Consumer Bank, S.p.A.—Bonds—floating rate | 650 | — | — | |||||||||||||||||||||
SC Private Cars 2010—1 Limited—Asset-backed securities | 591 | — | — | |||||||||||||||||||||
Santander Consumer Finance, S.A.—Bonds | 481 | 150 | — | |||||||||||||||||||||
Santander Holdings USA, Inc.—Bonds | 384 | — | — | |||||||||||||||||||||
Motor 2011 PLC—Asset-backed securities | 320 | — | — | |||||||||||||||||||||
Bilkreditt 1Limited—Asset-backed securities | 288 | — | — | |||||||||||||||||||||
Santander Consumer Bank Spólka Akcyjna—Bonds | 213 | 166 | — | |||||||||||||||||||||
Brazil Foreign Diversified Payment Rights Finance Company Asset-backed securities | 193 | 185 | — | |||||||||||||||||||||
Santander Consumer USA Inc—Asset-backed securities | — | 4,642 | — | |||||||||||||||||||||
Santander US Debt, S.A. Sole-Shareholder Company—Debentures—floating rate | — | 3,068 | 1,032 | |||||||||||||||||||||
Totta (Ireland), PLC- Bonds—floating rate | — | 112 | 3,380 | |||||||||||||||||||||
Banco Santander (México), S.A., Institución de Banca Múltiple, Grupo Financiero Santander—Bonds | — | 10 | 164 | |||||||||||||||||||||
Redemptions and repurchases | (81,395 | ) | (112,730 | ) | (75,614 | ) | ||||||||||||||||||
SC Private Cars 2010- 1 Limited – Asset-backed securities | — | — | 591 | |||||||||||||||||||||
Motor 2011 PLC - Asset-backed securities | — | — | 320 | |||||||||||||||||||||
Bilkreditt 1Limited - Asset-backed securities | — | — | 288 | |||||||||||||||||||||
Brazil Foreign Diversified Payment Rights Finance Company | ||||||||||||||||||||||||
Asset-backed securities | — | — | 193 | |||||||||||||||||||||
Redemptions | (73,619 | ) | (78,706 | ) | (81,395 | ) | ||||||||||||||||||
Of which: | ||||||||||||||||||||||||
Santander UK Group | (51,707 | ) | (70,071 | ) | (48,277 | ) | (37,388 | ) | (41,862 | ) | (51,707 | ) | ||||||||||||
Banco Santander, S.A. | (11,434 | ) | (6,542 | ) | (2,968 | ) | ||||||||||||||||||
Santander International Debt, S.A. Sole-Shareholder Company | (7,795 | ) | (11,576 | ) | (2,672 | ) | (10,437 | ) | (8,479 | ) | (7,795 | ) | ||||||||||||
Banco Santander (Brasil), S.A. | (8,246 | ) | (9,346 | ) | (6,102 | ) | ||||||||||||||||||
Santander International Products, Plc. | (1,605 | ) | — | — | ||||||||||||||||||||
Banco Santander- Chile | (1,263 | ) | (1,112 | ) | (520 | ) | ||||||||||||||||||
Santander Consumer Finance, S.A. | (1,012 | ) | (481 | ) | (150 | ) | ||||||||||||||||||
Banco Santander Totta, S.A. | (962 | ) | (1,014 | ) | (2,477 | ) | ||||||||||||||||||
Santander US Debt, S.A. Sole-Shareholder Company | (947 | ) | (1,146 | ) | (1,118 | ) | ||||||||||||||||||
Santander Consumer Bank Spolka Akcyjna | (48 | ) | (68 | ) | (167 | ) | ||||||||||||||||||
Santander Consumer Bank AG | (6 | ) | (863 | ) | (317 | ) | ||||||||||||||||||
Banesto | — | (6,401 | ) | (7,748 | ) | |||||||||||||||||||
Santander Holdings USA, Inc. | — | (9,652 | ) | — | — | (1,236 | ) | — | ||||||||||||||||
Banesto | (7,748 | ) | (7,134 | ) | (4,971 | ) | ||||||||||||||||||
Totta (Ireland), PLC | (112 | ) | (3,380 | ) | (849 | ) | — | — | (112 | ) | ||||||||||||||
Banco Santander (Brasil) S.A. | (6,102 | ) | (3,116 | ) | (2,278 | ) | ||||||||||||||||||
Banco Santander, S.A. | (2,968 | ) | (1,965 | ) | (1,545 | ) | ||||||||||||||||||
Hipottota No. 6 Ltd. | — | (1,818 | ) | — | ||||||||||||||||||||
Santander US Debt, S.A. Sole-Shareholder Company | (1,118 | ) | (1,562 | ) | (13,156 | ) | ||||||||||||||||||
Banco Santander Totta, S.A. | (2,477 | ) | (1,383 | ) | (1,430 | ) | ||||||||||||||||||
Santander Consumer USA Inc. | — | (519 | ) | (155 | ) | |||||||||||||||||||
Banco Santander—Chile | (520 | ) | (228 | ) | — | |||||||||||||||||||
Santander Consumer Bank S.p.A. | — | (26 | ) | — | ||||||||||||||||||||
Santander Consumer Bank AG | (317 | ) | — | (149 | ) | |||||||||||||||||||
Santander Consumer Bank Spolka Akcyjna | (167 | ) | — | — | ||||||||||||||||||||
Santander Consumer Finance, S.A. | (150 | ) | — | — | ||||||||||||||||||||
Santander Central Hispano International Limited | — | — | (46 | ) | ||||||||||||||||||||
Exchange differences | (11 | ) | 2,098 | 1,459 | (5,590 | ) | (636 | ) | (11 | ) | ||||||||||||||
Other changes | (4,084 | ) | (3,819 | ) | (8,645 | ) | (4,957 | ) | (1,670 | ) | (4,084 | ) | ||||||||||||
|
|
|
|
|
| |||||||||||||||||||
Balance at the end of the year | 185,530 | 185,869 | 183,250 | |||||||||||||||||||||
Balance at end of year | 161,274 | 183,686 | 185,530 | |||||||||||||||||||||
|
|
|
|
|
| |||||||||||||||||||
F-108
c) Notes and other securities
| c) | Notes and other securities |
These notes were issued basically by Banco Santander, S.A., Santander Consumer Finance, S.A., Santander Commercial Paper, S.A. (Sole-Shareholder Company), Abbey National North America LLC, Abbey National,Santander UK, plc, Santander Holdings USA, Inc. (formerly Sovereign Bancorp, Inc.), Banco Santander (México), S.A., Institución de Banca Múltiple, Grupo Financiero Santander, Banesto, Santander Consumer Finance,Banco de Emisiones, S.A. and, Fondo de Titulización de Activos Santander 2.2 and Santander International Products, Plc.
d) Guarantees
| d) | Guarantees |
At December 31, 2011,Set forth below is information on the liabilities secured by financial assets:
| Millions of euros | ||||||||||||
| 2013 | 2012 | 2011 | ||||||||||
Asset-backed securities | 30,020 | 35,853 | 37,466 | |||||||||
Of which, mortgage-backed securities | 22,843 | 29,938 | 31,719 | |||||||||
Other mortgage securities | 59,984 | 67,214 | 76,243 | |||||||||
Of which: mortgage-backed bonds | 32,717 | 38,500 | 42,717 | |||||||||
|
|
|
|
|
| |||||||
| 90,004 | 103,067 | 113,709 | ||||||||||
|
|
|
|
|
| |||||||
The main characteristics of the assets amounted to EUR 113,709 million,underlying the detail beingaforementioned financial liabilities are as follows:
| Millions of euros | ||||||||||||
| 2011 | 2010 | 2009 | ||||||||||
Asset-backed securities | 37,466 | 39,279 | 37,945 | |||||||||
Of which: mortgage-backed securities | 31,719 | 28,059 | 27,481 | |||||||||
Other mortgage securities | 76,243 | 65,187 | 53,994 | |||||||||
Of which: mortgage-backed bonds | 42,717 | 41,960 | 42,204 | |||||||||
|
|
|
|
|
| |||||||
| 113,709 | 104,466 | 91,939 | ||||||||||
|
|
|
|
|
| |||||||
The mortgage-backed securities and other mortgage securities are secured by mortgage loans with average maturities of more than ten years. The main terms and conditions of these loans are listed below:
| 1. |
First mortgage for acquisition and/or refurbishment of principal or second residence, which at the date of securitization must not have any amounts more than 30 days past due. For these purposes, financing granted to property developers is excluded.
| a. | Mortgage-backed securities- these securities are secured by securitized mortgage assets (see Note 10.e) with average maturities of longer than ten years that must: be a first mortgage for acquisition of principal or second residence, be current in payments, have a loan-to-value ratio below 80% and have a liability insurance policy in force covering at least the appraisal value. The value of the financial liabilities broken down in the foregoing table is lower than the balance of the assets securing them - securitized assets retained on the balance sheet - mainly because the Group repurchases a portion of the bonds issued, and in such cases they are not recognized on the liabilities side of the consolidated balance sheet. |
Appraisal conducted by specialist valuer.
The amount of the loan does not exceed 80% of the lower of the appraised value and the purchase price, unless additional guarantees are provided (borrower’s payment capacity, other collateral, guarantors of solvency or mortgage credit insurance), in which case this limit may be extended up to a maximum of 120%.
Each of the mortgaged properties must have at least one liability insurance policy in force. The capital insured must not be lower than either the appraised value (excluding the land) or the amount of the loan.
| b. | Other asset-backed securities- including asset-backed securities and notes issued by special-purpose vehicles secured mainly by mortgage loans that do not meet the foregoing requirements and other loans (mainly personal loans with average maturities of five years and loans to SMEs with average maturities of seven years). |
| 2. |
Transactions classified as non-performing, at pre-action stage and at procedural stage.
Transactions without appraisal by a specialist valuer.
Transactions exceeding 80% of the appraised value in residential financing and 60% in the case of other assets.
Second mortgages or mortgages with insufficient collateral.
Transactions without insurance or with insufficient insurance.
F-109
The other securitizations, including asset-backed securities and notes issued by special-purpose vehicles (SPVs), are secured by:
Mortgage loans to individuals to finance the acquisition and refurbishment of homes with an average maturity of more than ten years.
Personal consumer finance loans with no specific guarantee and unsecured loans with an average maturity of five years.
Loans to SMEs (non-financial small and medium-sized enterprises) secured by State guarantees, and loans to companies (micro companies, SMEs, companies and large companies) secured by property mortgages, the borrower’s personal guarantee, guarantees and other collateral other than property mortgages, with an average maturity of seven years.
Mortgage and non-mortgage loans to finance municipalities, autonomous communities and subsidiaries with an average maturity of more than ten years.
Asset-backed securities issued by various European special-purpose vehicles backed by German and Italian loans for the purchase of vehicles and Italian personal loans, with an average maturity of eight years.
Commercial credit of Banco Santander (ordinary invoice discounting, occasional discounting and advances to customers on legitimate receivables) with an average maturity of 45 days.
The fair value of the guaranteescollateral or security received by the Group (financial and non-financial assets) which the Group is authorized to sell or pledge even if the collateral or security owner of the guarantee has not defaulted is scantlynot material taking into account the Group’s financial statements as a whole.
e) Spanish mortgage-market issues
| e) | Spanish mortgage-market issues |
The members of the boardsboard of directors of the Group hereby state that the Group entities operating in the Spanish mortgage-market issues area have established and implemented specific policies and procedures in place to cover all activities relating to thecarried on and comply with mortgage-market issues launched by the Group, which guarantee strict compliance with the mortgage market regulations applicable to these activities as provided for in Royal Decree 716/2009, of April 24, implementing certain provisions of Mortgage Market Law 2/1981, of March 25, and, by application thereof, in Bank of Spain Circulars 7/2010 and 5/2011, and other financial and mortgage system regulations. Also, financial management defines the Group entities’ funding strategy.
The risk policies applicable to mortgage market transactions envisage maximum loan-to-value (LTV) ratios, and specific policies are also in place adapted to each mortgage product, which occasionally require the application of stricter limits.
The Bank’s general policies in this respect require the repayment capacity of each potential customer (the effort ratio in loan approval) to be analyzed using specific indicators that must be met. This analysis must determine whether each customer’s income is sufficient to meet the repayments of the loan requested. In addition, the analysis of each customer must include a conclusion on the stability over time of the customer’s income considered with respect to the life of the loan. The aforementioned indicator used to measure the repayment capacity (effort ratio) of each potential customer takes into account mainly the relationship between the potential debt and the income generated, considering on the one hand the monthly repayments of the loan requested and other transactions and, on the other, the monthly salary income and other duly supported income.
The Group entities have specialised document comparison procedures and tools for verifying customer information and solvency (see Note 54).solvency.
The Group entities’ procedures envisage that each mortgage originated in the mortgage market must be individually valued by an appraisal company not related to the Group.
F-110
In accordance with Article 5 of Mortgage Market Law 41/2007, Article 5, establishes that any appraisal company approved by the Bank of Spain may issue valid appraisal reports. However, as permitted by this same article, the Group entities perform a series ofseveral checks and select, from among these companies, a small group with which it entersthey enter into cooperation agreements with special conditions and automated control mechanisms. The Group’s internal regulations specify, in detail, each of the internally approved companies, as well as the approval requirements and procedures and the controls established to uphold them. In this connection, the regulations establish the functions of an appraisal company committee on which the various areas of the Group related to these companies are represented. The aim of the committee is to regulate and adapt the internal regulations and the activities of the appraisal companies to the current market and business situation.
Basically, the companies wishing to cooperate with the Group must have a significant level of activity in the mortgage market in the area in which they operate, they must pass a preliminary screening process based on criteria of independence, technical capacity and solvency -in order to ascertain the continuity of their business- and, lastly, they must pass a series of tests prior to obtaining definitive approval.
In order to comply in full with the legislation, any appraisal provided by the customer is reviewed, irrespective of which appraisal company issues it, to check that the requirements, procedures and methods used to prepare it are formally adapted to the valued asset pursuant to current legislation and that the values reported are customary in the market.
Following is a detail of the face value of the outstanding mortgage loans and credits that support the issuance of mortgage-backed and mortgage bonds.
The information at December 31, 2011 required by Bank of Spain Circulars 7/2010 and 5/2011, pursuant to the aforementionedby application of Royal Decree 716/2009, of April 24, is disclosed in the separate financial statements of each of the Spanish Group entities subject to this legislation.as follows:
| Millions of | ||||
Face value of the outstanding mortgage loans and credits that support the issuance of mortgage-backed and mortgage bonds pursuant to Royal Decree 716/2009 (excluding | ||||
Of which: | ||||
Loans eligible to cover issues of mortgage-backed securities | ||||
Transfers of assets retained on balance sheet: mortgage-backed certificates and other | ||||
Mortgage-backed bonds
The mortgage-backed bonds (“cédulas hipotecarias”) issued by Group entities are securities the principal and interest of which are specifically secured by mortgages, there being no need for registration in the Property Register and without prejudice to the issuer’s unlimited liability.
The mortgage-backed bonds include the holder’s financial claim on the issuer, secured as indicated in the preceding paragraph, and may be enforced to claim payment from the issuer after maturity. The holders of these securities have the status of special preferential creditors vis-à-vis all other creditors (established in Article 1923.3 of the Spanish Civil Code) in relation to all the mortgage loans and credits registered in the issuer’s favourfavor and, where appropriate, in relation to the cash flows generated by the derivative financial instruments associated with the issues.
F-111
In the event of insolvency, the holders of thesemortgage-backed bonds will enjoy the special privilege established in Article 90.1.1 of Insolvency Law 22/2003, of July 9. Without prejudice to the foregoing, in accordance with Article 84.2.7 of the Insolvency Law, during the insolvency proceedings, the payments relating to the repayment of the principal and interest of the bonds issued and outstanding at the date of the insolvency filing will be settled up to the amount of the income received by the insolvent party from the mortgage loans and credits and, where appropriate, from the replacement assets backing the bonds and from the cash flows generated by the financial instruments associated with the issues (Final Provision 19 of the Insolvency Law).
If, due to a timing mismatch, the income received by the insolvent party is insufficient to meet the payments described in the preceding paragraph, the insolvency managers must settle them by realisingrealizing the replacement assets set aside to cover the issue and, if this is not sufficient, they must obtain financing to meet the mandated payments to the holders of the mortgage-backed bonds, and the finance provider must be subrogated to the position of the bond-holders.
In the event that the measure indicated in Article 155.3 of the Insolvency Law were to be adopted, the payments to all holders of the mortgage-backed bonds issued would be made on a pro-rata basis, irrespective of the issue dates of the bonds.
The outstanding mortgage-backed bonds issued by the Group totalledtotaled EUR 42,71732,717 million at December 31, 20112013 (all of which were denominated in euros), of which EUR 25,99932,071 million were issued by Banco Santander, S.A.; EUR 15,553 million were issued by Banesto and EUR 1,165646 million were issued by Santander Consumer Finance, S.A. The issues outstanding at December 31, 20112013 and 20102012 are detailed in the separate financial statements of each of these companies.
MortgageMortgage-backed bond issuers have an early redemption option solely for the purpose of complying with the limits on the volume of outstanding mortgage-backed bonds stipulated by mortgage market regulations.
None of the mortgage-backed bonds issued by the Group entities had replacement assets assigned to them.
23. Subordinated liabilities
a) Breakdown
| 23. | Subordinated liabilities |
| a) | Breakdown |
The detail, by currency of issue, of Subordinated liabilities in the consolidated balance sheets is as follows:
| Millions of euros | December 31, 2011 | |||||||||||||||||||||||||||||||||||||||
| Outstanding | Annual interest rate (%) | |||||||||||||||||||||||||||||||||||||||
| issue amount | ||||||||||||||||||||||||||||||||||||||||
| in foreign | ||||||||||||||||||||||||||||||||||||||||
| currency | Millions of euros | December 31, 2013 | ||||||||||||||||||||||||||||||||||||||
Currency of issue | 2011 | 2010 | 2009 | (millions) | 2013 | 2012 | 2011 | Outstanding issue amount in foreign currency (millions) | Annual interest rate (%) | |||||||||||||||||||||||||||||||
Euro | 6,848 | 13,701 | 16,598 | 6,848 | 6.88 | % | 4,600 | 5,214 | 6,848 | 4,600 | 3.59 | % | ||||||||||||||||||||||||||||
US dollar | 5,637 | 6,259 | 9,298 | 7,294 | 7.37 | % | 4,413 | 3,932 | 5,637 | 6,085 | 5.95 | % | ||||||||||||||||||||||||||||
Pound sterling | 4,568 | 4,876 | 6,441 | 3,816 | 9.74 | % | 2,750 | 3,292 | 4,568 | 2,293 | 8.90 | % | ||||||||||||||||||||||||||||
Brazilian real | 4,515 | 4,372 | 3,490 | 10,908 | 11.11 | % | 2,734 | 4,409 | 4,515 | 8,906 | 8.36 | % | ||||||||||||||||||||||||||||
Other currencies | 1,424 | 1,267 | 978 | 1,642 | 1,391 | 1,424 | ||||||||||||||||||||||||||||||||||
|
|
|
|
|
| |||||||||||||||||||||||||||||||||||
Balance at end of year | 22,992 | 30,475 | 36,805 | 16,139 | 18,238 | 22,992 | ||||||||||||||||||||||||||||||||||
|
|
|
|
|
| |||||||||||||||||||||||||||||||||||
Of which, preference shares | 449 | 435 | 430 | |||||||||||||||||||||||||||||||||||||
Of which, preference shares (acciones preferentes) | 401 | 421 | 449 | |||||||||||||||||||||||||||||||||||||
|
|
| ||||||||||||||||||||||||||||||||||||||
Of which, preference shares (participaciones preferentes) | 3,652 | 4,319 | 5,447 | |||||||||||||||||||||||||||||||||||||
Note 51 contains a detail of the residual maturity periods of subordinated liabilities at each year-end and of the related average interest rates in each year.
F-112
| b) | Changes |
The changes in Subordinated liabilities in the last three years were as follows:
| Millions of euros | ||||||||||||||||||||||||
| Millions of euros | 2013 | 2012 | 2011 | |||||||||||||||||||||
| 2011 | 2010 | 2009 | ||||||||||||||||||||||
Balance at beginning of year | 30,475 | 36,805 | 38,873 | 18,238 | 22,992 | 30,475 | ||||||||||||||||||
Net inclusion of entities in the Group (Note 3) | 99 | — | 1,598 | 237 | (1 | ) | 99 | |||||||||||||||||
Bank Zachodni WBK, S.A. | 99 | — | — | |||||||||||||||||||||
Santander Holdings USA, Inc. | — | — | 1,598 | |||||||||||||||||||||
Bank Zachodni WBK S.A. | — | — | 99 | |||||||||||||||||||||
Issues | 171 | 287 | 6,874 | 1,027 | 2 | 171 | ||||||||||||||||||
Of which: | ||||||||||||||||||||||||
Santander UK plc | 599 | — | — | |||||||||||||||||||||
Banco Santander (México), S.A., Institución de Banca Múltiple | 235 | — | — | |||||||||||||||||||||
Banco Santander- Chile | 169 | 206 | 48 | 191 | — | 169 | ||||||||||||||||||
Banco Santander, S.A. | — | 73 | 9 | |||||||||||||||||||||
Santander Finance Capital, S.A., Sole-Shareholder Company | — | — | 2,463 | |||||||||||||||||||||
Santander Finance Preferred, S.A., Sole-Shareholder Company | — | — | 1,576 | |||||||||||||||||||||
Santander Issuances, S.A., Sole-Shareholder Company | — | — | 1,544 | |||||||||||||||||||||
Santander International Preferred, S.A., Sole-Shareholder Company | — | — | 690 | |||||||||||||||||||||
Banesto | — | — | 497 | |||||||||||||||||||||
Redemptions and repurchases | (8,616 | ) | (7,728 | ) | (9,316 | ) | (1,915 | ) | (4,080 | ) | (8,616 | ) | ||||||||||||
Of which: | ||||||||||||||||||||||||
Banco Santander (Brasil) S.A. | (663 | ) | — | — | ||||||||||||||||||||
Santander Issuances, S.A., Sole-Shareholder Company | (3,190 | ) | (1,852 | ) | (500 | ) | (608 | ) | (1,253 | ) | (3,190 | ) | ||||||||||||
Abbey National Capital Trust I | (278 | ) | (203 | ) | — | |||||||||||||||||||
Santander Holdings USA, Inc. | (193 | ) | (264 | ) | (517 | ) | ||||||||||||||||||
Santander PR Capital Trust I | (91 | ) | — | — | ||||||||||||||||||||
Santander Perpetual, S.A., Sole-Shareholder Company | (28 | ) | (155 | ) | (35 | ) | ||||||||||||||||||
Banco Santander, S.A. | (28 | ) | (66 | ) | (294 | ) | ||||||||||||||||||
Banco Santander – Chile | (7 | ) | (168 | ) | (8 | ) | ||||||||||||||||||
Santander Finance Preferred, S.A., Sole-Shareholder Company | (7 | ) | (99 | ) | — | |||||||||||||||||||
Santander Finance Capital, S.A., Sole-Shareholder Company | (1,943 | )(*) | (1,000 | ) | (2,280 | ) | (4 | ) | — | (1,943 | )(*) | |||||||||||||
Santander Banco de Emisiones, S.A. | (6 | ) | — | — | ||||||||||||||||||||
Santander UK plc | — | (1,166 | ) | (847 | ) | |||||||||||||||||||
Banesto | — | (608 | ) | (506 | ) | |||||||||||||||||||
Santander Central Hispano Issuances Limited | (1,195 | ) | (1,484 | ) | (1,027 | ) | — | — | (1,195 | ) | ||||||||||||||
Santander UK plc | (847 | ) | (1,453 | ) | (3,468 | ) | ||||||||||||||||||
Santander Holdings USA, Inc. | (517 | ) | (148 | ) | — | |||||||||||||||||||
Banesto | (506 | ) | (17 | ) | (131 | ) | ||||||||||||||||||
Santander Perpetual, S.A., Sole-Shareholder Company | (35 | ) | (848 | ) | (588 | ) | ||||||||||||||||||
Banco Santander (Brasil) S.A. | — | (347 | ) | (20 | ) | |||||||||||||||||||
Banco Santander Totta, S.A. | — | (254 | ) | (25 | ) | |||||||||||||||||||
Santander Finance Preferred, S.A., Sole-Shareholder Company | — | — | (1,174 | ) | ||||||||||||||||||||
Exchange differences | 230 | 1,161 | 708 | (923 | ) | (190 | ) | 230 | ||||||||||||||||
Other changes | 633 | (50 | ) | (1,932 | ) | (525 | ) | (485 | ) | 633 | ||||||||||||||
|
|
|
|
|
| |||||||||||||||||||
Balance at end of year | 22,992 | 30,475 | 36,805 | 16,139 | 18,238 | 22,992 | ||||||||||||||||||
|
|
|
|
|
| |||||||||||||||||||
| (*) | On December 30, 2011, 341,802,171 new shares were issued (3.837% of the share capital) as part of the repurchase offer made to the holders of Series X preference shares issued by Santander Finance Capital, S.A., Sole-Shareholder Company (see Note 31). |
| c) | Other disclosures |
This item includes the preference shares (participaciones preferentes) and other financial instruments issued by the consolidated companies which, although equity for legal purposes, do not meet the requirements for classification as equity (preference shares).
The preference shares do not carry any voting rights and are non-cumulative. They were subscribed to by non-Group third parties and, except for the shares of Santander UK plc referred to below, are redeemable at the discretion of the issuer, based on the terms and conditions of each issue.
For the purposes of payment priority, preference shares (participaciones preferentes) are junior to all general creditors and to subordinated deposits. The remuneration ofreturn on these securities, which have no voting rights, is conditionaldependent upon the obtainment ofearning sufficient distributable profit and upon the limits imposed by Spanish banking regulations on equity.
F-113
The other issues are subordinated and, therefore, rankfor the purposes of payment priority, they are junior to all general creditors of the issuers. The issues launched by Santander Central Hispano Issuances Limited, Santander Central Hispano Financial Services Limited, Santander Issuances, S.A. (Sole-Shareholder Company), Santander Perpetual, S.A. (Sole-Shareholder Company), Santander Finance Capital, S.A. (Sole-Shareholder Company), Santander International Preferred, S.A. (Sole-Shareholder Company) and, Santander Finance Preferred S.A. (Sole-Shareholder Company) and Santander Banco de Emisiones, S.A. are guaranteed by the Bank or by restricted deposits arranged by the Bank for this purpose.
Except for those described in Note 34.a, at At December 31, 20112013, the balance of these issues amounted to EUR 7,904 million.
At December 31, 2013, none of these issues was convertible into Bank shares or granted privileges or rights which, in certain circumstances, might make them convertible into shares.
At December 31, 2011,2013, Santander UK plc had a GBP 200 million subordinated issue which is convertible, at Santander UK plc’s option, into preference shares of Santander UK plc, at a price of GBP 1 per share. Also, in 2010 the Group launched an issue of bonds mandatorily exchangeable for shares of Banco Santander (Brasil), S.A. (see Note 34).
The interest accrued interest on the subordinated liabilities amounted to EUR 1,9401,260 million in 2011 (2010:2013 (2012: EUR 2,2301,650 million; 2009:2011: EUR 2,3541,940 million) (see Note 39).
24. Other financial liabilities
| 24. | Other financial liabilities |
The detail of Other financial liabilities in the consolidated balance sheets is as follows:
| Millions of euros | ||||||||||||||||||||||||
| Millions of euros | 2013 | 2012 | 2011 | |||||||||||||||||||||
| 2011 | 2010 | 2009 | ||||||||||||||||||||||
Trade payables | 1,249 | 2,080 | 1,902 | 1,031 | 1,255 | 1,249 | ||||||||||||||||||
Clearing houses | 1,330 | 1,485 | 735 | 841 | 573 | 1,330 | ||||||||||||||||||
Tax collection accounts: | ||||||||||||||||||||||||
Tax payables | 1,949 | 2,106 | 1,915 | 2,197 | 2,021 | 1,949 | ||||||||||||||||||
Factoring accounts payable | 390 | 416 | 449 | 194 | 201 | 390 | ||||||||||||||||||
Unsettled financial transactions | 3,656 | 3,183 | 2,754 | 3,063 | 5,080 | 3,656 | ||||||||||||||||||
Other financial liabilities | 9,647 | 10,074 | 11,848 | 9,084 | 10,115 | 9,647 | ||||||||||||||||||
|
|
|
|
|
| |||||||||||||||||||
| 18,221 | 19,344 | 19,603 | 16,410 | 19,245 | 18,221 | |||||||||||||||||||
|
|
|
|
|
| |||||||||||||||||||
Note 51 contains a detail of the residual maturity periods of other financial assets and liabilities at each year-end.
25. Provisions
| 25. | Provisions |
| a) | Breakdown |
The detail of Provisions in the consolidated balance sheets is as follows:
| Millions of euros | Millions of euros | |||||||||||||||||||||||
| 2011 | 2010 | 2009 | 2013 | 2012 | 2011 | |||||||||||||||||||
Provision for pensions and similar obligations | 9,045 | 9,519 | 10,629 | |||||||||||||||||||||
Provisions for pensions and similar obligations | 9,126 | 10,353 | 10,782 | |||||||||||||||||||||
Provisions for taxes and other legal contingencies | 3,663 | 3,670 | 3,283 | 2,727 | 3,100 | 3,663 | ||||||||||||||||||
Provisions for contingent liabilities and commitments (Note 2): | 659 | 1,030 | 642 | 693 | 617 | 659 | ||||||||||||||||||
Of which: due to country risk | 11 | 19 | 18 | 4 | 3 | 11 | ||||||||||||||||||
Other provisions | 2,205 | 1,441 | 2,979 | 1,929 | 2,078 | 2,205 | ||||||||||||||||||
|
|
|
|
|
| |||||||||||||||||||
Provisions | 15,572 | 15,660 | 17,533 | 14,475 | 16,148 | 17,309 | ||||||||||||||||||
|
|
|
|
|
| |||||||||||||||||||
F-114
| b) | Changes |
The changes in Provisions in the last three years were as follows:
| Millions of euros | ||||||||||||||||||||||||||||||||||||||||||||||||||||||||||||||||||||||||||||||||||||||||||||||||
| 2011 | 2010 | 2009 | Millions of euros | |||||||||||||||||||||||||||||||||||||||||||||||||||||||||||||||||||||||||||||||||||||||||||||
| Contingent | Contingent | Contingent | 2013 | 2012 | 2011 | |||||||||||||||||||||||||||||||||||||||||||||||||||||||||||||||||||||||||||||||||||||||||||
| liabilities and | Other | liabilities and | Other | liabilities and | Other | Pensions | Contingent liabilities and commitments | Other provisions | Total | Pensions | Contingent liabilities and commitments | Other provisions | Total | Pensions | Contingent liabilities and commitments | Other provisions | Total | |||||||||||||||||||||||||||||||||||||||||||||||||||||||||||||||||||||||||||||||
| Pensions | commitments | provisions | Total | Pensions | commitments | provisions | Total | Pensions | commitments | provisions | Total | |||||||||||||||||||||||||||||||||||||||||||||||||||||||||||||||||||||||||||||||||||||
Balances at beginning of year | 9,519 | 1,030 | 5,111 | 15,660 | 10,629 | 642 | 6,262 | 17,533 | 11,198 | 679 | 5,860 | 17,737 | 10,353 | 617 | 5,178 | 16,148 | 10,782 | 659 | 5,868 | 17,309 | 10,591 | 1,030 | 5,111 | 16,732 | ||||||||||||||||||||||||||||||||||||||||||||||||||||||||||||||||||||||||
Net inclusion of entities in the Group | 71 | 4 | (71 | ) | 4 | — | 4 | 8 | 12 | 44 | 125 | (26 | ) | 143 | (1 | ) | 15 | — | 14 | (60 | ) | (1 | ) | (16 | ) | (77 | ) | 71 | 4 | (71 | ) | 4 | ||||||||||||||||||||||||||||||||||||||||||||||||||||||||||||||||
Additions charged to income: | ||||||||||||||||||||||||||||||||||||||||||||||||||||||||||||||||||||||||||||||||||||||||||||||||
Interest expense and similar charges (Note 39) | 357 | — | — | 357 | 481 | — | — | 481 | 482 | — | — | 482 | 363 | — | — | 363 | 398 | — | — | 398 | 357 | — | — | 357 | ||||||||||||||||||||||||||||||||||||||||||||||||||||||||||||||||||||||||
Personnel expenses (Note 47) | 138 | — | — | 138 | 146 | — | — | 146 | 176 | — | — | 176 | 88 | — | — | 88 | 145 | — | — | 145 | 138 | — | — | 138 | ||||||||||||||||||||||||||||||||||||||||||||||||||||||||||||||||||||||||
Period provisions | 198 | (153 | ) | 2,556 | 2,601 | 188 | 69 | 876 | 1,133 | 339 | 46 | 1,407 | 1,792 | 397 | 126 | 1,659 | 2,182 | (184 | ) | 68 | 1,594 | 1,478 | 225 | (153 | ) | 2,544 | 2,616 | |||||||||||||||||||||||||||||||||||||||||||||||||||||||||||||||||||||
Other additions arising from insurance contracts linked to pensions | 7 | — | — | 7 | (29 | ) | — | — | (29 | ) | (30 | ) | — | — | (30 | ) | (27 | ) | — | — | (27 | ) | (161 | ) | — | — | (161 | ) | 7 | — | — | 7 | ||||||||||||||||||||||||||||||||||||||||||||||||||||||||||||||||
Changes in value recognized in equity | (90 | ) | — | — | (90 | ) | 1,682 | — | — | 1,682 | 927 | — | — | 927 | ||||||||||||||||||||||||||||||||||||||||||||||||||||||||||||||||||||||||||||||||||
Payments to pensioners and pre-retirees with a charge to internal provisions | (1,051 | ) | — | — | (1,051 | ) | (1,258 | ) | — | — | (1,258 | ) | (1,191 | ) | — | — | (1,191 | ) | (1,086 | ) | — | — | (1,086 | ) | (980 | ) | — | — | (980 | ) | (1,051 | ) | — | — | (1,051 | ) | ||||||||||||||||||||||||||||||||||||||||||||||||||||||||||||
Benefits paid due to settlements | (2 | ) | — | — | (2 | ) | (1,006 | ) | — | — | (1,006 | ) | — | — | — | — | ||||||||||||||||||||||||||||||||||||||||||||||||||||||||||||||||||||||||||||||||
Insurance premiums paid | (2 | ) | — | — | (2 | ) | (3 | ) | — | — | (3 | ) | (1 | ) | — | — | (1 | ) | (6 | ) | — | — | (6 | ) | 54 | — | — | 54 | (2 | ) | — | — | (2 | ) | ||||||||||||||||||||||||||||||||||||||||||||||||||||||||||||||
Payments to external funds | (614 | ) | — | — | (614 | ) | (1,205 | ) | — | — | (1,205 | ) | (594 | ) | — | — | (594 | ) | (217 | ) | — | — | (217 | ) | (268 | ) | — | — | (268 | ) | (614 | ) | — | — | (614 | ) | ||||||||||||||||||||||||||||||||||||||||||||||||||||||||||||
Amount used | — | — | (1,473 | ) | (1,473 | ) | — | — | (3,364 | ) | (3,364 | ) | — | — | (1,412 | ) | (1,412 | ) | ||||||||||||||||||||||||||||||||||||||||||||||||||||||||||||||||||||||||||||||
Amounts used | — | — | (1,661 | ) | (1,661 | ) | — | — | (2,161 | ) | (2,161 | ) | — | — | (1,473 | ) | (1,473 | ) | ||||||||||||||||||||||||||||||||||||||||||||||||||||||||||||||||||||||||||||||
Transfers, exchange differences and other changes | 422 | (222 | ) | (255 | ) | (55 | ) | 570 | 315 | 1,329 | 2,214 | 206 | (208 | ) | 433 | 431 | (646 | ) | (65 | ) | (520 | ) | (1,231 | ) | (49 | ) | (109 | ) | (107 | ) | (265 | ) | 133 | (222 | ) | (243 | ) | (332 | ) | |||||||||||||||||||||||||||||||||||||||||||||||||||||||||
|
|
|
|
|
|
|
|
|
|
|
|
|
|
|
|
|
|
|
|
|
|
|
| |||||||||||||||||||||||||||||||||||||||||||||||||||||||||||||||||||||||||
Balances at end of year | 9,045 | 659 | 5,868 | 15,572 | 9,519 | 1,030 | 5,111 | 15,660 | 10,629 | 642 | 6,262 | 17,533 | 9,126 | 693 | 4,656 | 14,475 | 10,353 | 617 | 5,178 | 16,148 | 10,782 | 659 | 5,868 | 17,309 | ||||||||||||||||||||||||||||||||||||||||||||||||||||||||||||||||||||||||
|
|
|
|
|
|
|
|
|
|
|
|
|
|
|
|
|
|
|
|
|
|
|
| |||||||||||||||||||||||||||||||||||||||||||||||||||||||||||||||||||||||||
F-115
| c) |
The detail of Provisions for pensions and similar obligations is as follows:
| Millions of euros | Millions of euros | |||||||||||||||||||||||
| 2011 | 2010 | 2009 | 2013 | 2012 | 2011 | |||||||||||||||||||
Provisions for post-employment plans—Spanish entities | 5,215 | 5,247 | 5,443 | |||||||||||||||||||||
Provisions for post-employment plans - Spanish entities | 4,643 | 4,909 | 5,913 | |||||||||||||||||||||
Of which: defined benefit | 5,211 | 5,244 | 5,439 | 4,633 | 4,900 | 5,908 | ||||||||||||||||||
Provisions for other similar obligations—Spanish entities | 2,781 | 3,273 | 3,851 | |||||||||||||||||||||
Provisions for other similar obligations - Spanish entities | 2,161 | 2,404 | 2,781 | |||||||||||||||||||||
Of which: pre-retirements | 2,769 | 3,262 | 3,842 | 2,149 | 2,389 | 2,769 | ||||||||||||||||||
Provisions for post-employment plans—Santander UK plc | 36 | 28 | 496 | |||||||||||||||||||||
Provisions for post-employment plans and other similar obligations—Other foreign subsidiaries | 1,013 | 971 | 839 | |||||||||||||||||||||
Provisions for post-employment plans - Santander UK plc | 806 | 409 | 255 | |||||||||||||||||||||
Provisions for post-employment plans and other similar obligations - Other foreign subsidiaries | 1,516 | 2,631 | 1,833 | |||||||||||||||||||||
Of which: defined benefit | 1,006 | 966 | 829 | 1,512 | 2,626 | 1,827 | ||||||||||||||||||
|
|
|
|
|
| |||||||||||||||||||
Provisions for pensions and similar obligations | 9,045 | 9,519 | 10,629 | 9,126 | 10,353 | 10,782 | ||||||||||||||||||
|
|
|
|
|
| |||||||||||||||||||
i. Spanish entities—Post-employment plans and other similar obligations
| i. | Spanish entities - Post-employment plans and other similar obligations |
At December 31, 2011, 20102013, 2012 and 2009,2011, the Spanish entities had post-employment benefit obligations under defined contribution and defined benefit plans. In addition, in various years some of the consolidated entities offered certain of their employees the possibility of taking pre-retirement and, therefore, provisions are recognized each year for the obligations to employees taking pre-retirement -in terms of salaries and other employee benefit costs- from the date of their pre-retirement to the date of effective retirement. In 2013, 1,621 employees accepted the pre-retirement and voluntary redundancy offer, and the provision recognized to cover these obligations totaled EUR 334 million.
In 2012, the Bank and Banesto reached an agreement with the employees’ representatives to alter the form of the defined-benefit obligations arising from the collective agreement into defined-contribution plans. In addition, the senior executives’ contracts with defined-benefit pension obligations were amended to alter such obligations into a defined-contribution employee welfare system.
The amount of the obligations accrued with respect to all the current employees, both those subject to the collective agreement and executives, whose defined-benefit obligations were converted into defined-contribution plans, totaled EUR 1,389 million. The obligations thus altered were externalized through the execution of various insurance contracts with Spanish insurance companies. The effect of the settlement of such defined-benefit obligations is shown in the tables below.
The expenses incurred by the Group in respect of contributions to defined contribution plans amounted to EUR 108 million in 2013 (2012: EUR 54 million; 2011: EUR 50 million).
The amount of the defined benefit obligations was determined on the basis of the work performed by independent actuaries using the following actuarial techniques:
| 1. | Valuation method: projected unit credit method, which sees each period of service as giving rise to an additional unit of benefit entitlement and measures each unit separately. |
| 2. | Actuarial assumptions used: unbiased and mutually compatible. Specifically, the most significant actuarial assumptions used in the calculations were as follows: |
| Post-employment plans | Other similar obligations | |||||||||||
| 2013 | 2012 | 2011 | 2013 | 2012 | 2011 | |||||||
Annual discount rate | 3.00% | 2.75% and 3% in the case of Banesto | 4.00% | 3.00% | 2.75% and 3% in the case of Banesto | 4.00% | ||||||
Mortality tables | PERM/F-2000 | GRM/F-95(PERM/F-2000 in the case of Banesto) | GRM/F-95(PERM/F-2000 in the case of Banesto) | PERM/F-2000 | GRM/F-95(PERM/F-2000 in the case of Banesto) | GRM/F-95(PERM/F-2000 in the case of Banesto) | ||||||
Cumulative annual CPI growth | 1.5% | 1.5% | 1.5% | 1.5% | 1.5% | 1.5% | ||||||
Annual salary increase rate | 2.50% (*) | 2% (*) | 2.50% (2.9% in the case of Banesto) | n/a | n/a | n/a | ||||||
Annual social security pension increase rate | 1.5% | 1.5% | 1.5% | n/a | n/a | n/a | ||||||
Annual benefit increase rate | n/a | n/a | n/a | 0% to 1.5% | 0% to 1.5% | 0% to 1.5% | ||||||
| (*) | Corresponds to the Group’s defined-benefit obligations. |
The discount rate used for the flows was determined by reference to high-quality corporate bonds (at least AA in euros) that coincide with the terms of the obligations. The portfolio of bonds taken into consideration excludes callable, puttable and sinkable bonds which could distort the indices.
Any changes in the main assumptions could affect the calculation of the obligations. At December 31, 2013, if the discount rate used had been decreased or increased by 50 basis points, there would have been an increase or decrease in the present value of the post-employment obligations of +/- 5% and an increase or decrease in the present value of the long-term obligations of +/- 0.80%. These changes would be offset in part by increases or decreases in the fair value of the assets and insurance contracts linked to pensions.
| 3. | The estimated retirement age of each employee is the first day at which the employee is entitled to retire or the agreed-upon age, as appropriate. |
The fair value of insurance contracts was determined as the present value of the related payment obligations, taking into account the following assumptions:
| Post-employment plans | Other similar obligations | |||||||||||
| 2013 | 2012 | 2011 | 2013 | 2012 | 2011 | |||||||
Expected rate of return on plan assets | 3.0% | 2.75% and 3% in the case of Banesto | 4.0% | n/a | n/a | — | ||||||
Expected rate of return on reimbursement rights | 3.0% | 2.75% and 3% in the case of Banesto | 4.0% | n/a | n/a | 4.0% | ||||||
The funding status of the defined benefit obligations in 2013 and the four preceding years is as follows:
| Millions of euros | ||||||||||||||||||||||||||||||||||||||||
| Post-employment plans | Other similar obligations | |||||||||||||||||||||||||||||||||||||||
| 2013 | 2012 | 2011 | 2010 | 2009 | 2013 | 2012 | 2011 | 2010 | 2009 | |||||||||||||||||||||||||||||||
Present value of the obligations: | ||||||||||||||||||||||||||||||||||||||||
To current employees | 50 | 58 | 1,533 | 1,240 | 1,200 | — | — | — | — | — | ||||||||||||||||||||||||||||||
Vested obligations to retired employees | 4,483 | 4,765 | 4,367 | 4,471 | 4,708 | — | — | — | — | — | ||||||||||||||||||||||||||||||
To pre-retirees | — | — | — | — | — | 2,149 | 2,389 | 2,769 | 3,262 | 3,842 | ||||||||||||||||||||||||||||||
Long-service bonuses and other benefits | — | — | — | — | — | 11 | 7 | 7 | 8 | 9 | ||||||||||||||||||||||||||||||
Other | 257 | 221 | 185 | 181 | 183 | 1 | 8 | 5 | 3 | — | ||||||||||||||||||||||||||||||
|
|
|
|
|
|
|
|
|
|
|
|
|
|
|
|
|
|
|
| |||||||||||||||||||||
| 4,790 | 5,044 | 6,085 | 5,892 | 6,091 | 2,161 | 2,404 | 2,781 | 3,273 | 3,851 | |||||||||||||||||||||||||||||||
Less- | ||||||||||||||||||||||||||||||||||||||||
Fair value of plan assets | 157 | 144 | 177 | 183 | 184 | — | — | — | — | — | ||||||||||||||||||||||||||||||
|
|
|
|
|
|
|
|
|
|
|
|
|
|
|
|
|
|
|
| |||||||||||||||||||||
Provisions - Provisions for pensions | 4,633 | 4,900 | 5,908 | 5,709 | 5,907 | 2,161 | 2,404 | 2,781 | 3,273 | 3,851 | ||||||||||||||||||||||||||||||
|
|
|
|
|
|
|
|
|
|
|
|
|
|
|
|
|
|
|
| |||||||||||||||||||||
Of which: | ||||||||||||||||||||||||||||||||||||||||
Internal provisions for pensions | 4,293 | 4,495 | 3,762 | 3,490 | 3,554 | 2,161 | 2,404 | 2,781 | 3,272 | 3,848 | ||||||||||||||||||||||||||||||
Insurance contracts linked to pensions (Note 14) | 342 | 405 | 2,146 | 2,219 | 2,353 | — | — | — | 1 | 3 | ||||||||||||||||||||||||||||||
Unrecognized net assets for pensions | (2 | ) | — | — | — | — | — | — | — | — | — | |||||||||||||||||||||||||||||
The amounts recognized in the consolidated income statements in relation to the aforementioned defined benefit obligations are as follows:
| Millions of euros | ||||||||||||||||||||||||
| Post-employment plans | Other similar obligations | |||||||||||||||||||||||
| 2013 | 2012 | 2011 | 2013 | 2012 | 2011 | |||||||||||||||||||
Current service cost | 10 | 53 | 52 | — | 1 | 1 | ||||||||||||||||||
Interest cost (net) | 139 | 204 | 208 | 61 | 101 | 117 | ||||||||||||||||||
Expected return on insurance contracts linked to pensions | (11 | ) | (45 | ) | (86 | ) | — | — | — | |||||||||||||||
Extraordinary charges (credits)- | ||||||||||||||||||||||||
Actuarial (gains)/losses recognized in the year | — | — | — | 3 | 66 | (3 | ) | |||||||||||||||||
Past service cost | 30 | 22 | 25 | 34 | 21 | — | ||||||||||||||||||
Pre-retirement cost | 8 | — | 2 | 326 | 55 | 55 | ||||||||||||||||||
Effect of curtailment/settlement | (6 | ) | (401 | ) | (7 | ) | — | 1 | — | |||||||||||||||
|
|
|
|
|
|
|
|
|
|
|
| |||||||||||||
| 170 | (167 | ) | 194 | 424 | 245 | 170 | ||||||||||||||||||
|
|
|
|
|
|
|
|
|
|
|
| |||||||||||||
In addition, in 2013 Valuation adjustments – Other valuation adjustments increased by EUR 52 million with respect to defined benefit obligations (2012: a decrease of EUR 533 million; 2011: a decrease of EUR 233 million).
The changes in the present value of the accrued defined benefit obligations were as follows:
| Millions of euros | ||||||||||||||||||||||||
| Post-employment plans | Other similar obligations | |||||||||||||||||||||||
| 2013 | 2012 | 2011 | 2013 | 2012 | 2011 | |||||||||||||||||||
Present value of the obligations at beginning of year | 5,044 | 6,085 | 5,892 | 2,404 | 2,781 | 3,273 | ||||||||||||||||||
Net inclusion of entities in the Group | (5 | ) | — | — | — | — | — | |||||||||||||||||
Current service cost | 10 | 53 | 52 | — | 1 | 1 | ||||||||||||||||||
Interest cost | 145 | 211 | 215 | 61 | 101 | 117 | ||||||||||||||||||
Pre-retirement cost | 8 | — | 2 | 326 | 55 | 55 | ||||||||||||||||||
Effect of curtailment/settlement | (6 | ) | (401 | ) | (7 | ) | — | — | — | |||||||||||||||
Benefits paid due to settlements | — | (1,006 | ) | — | — | — | — | |||||||||||||||||
Other benefits paid | (394 | ) | (317 | ) | (330 | ) | (661 | ) | (624 | ) | (666 | ) | ||||||||||||
Past service cost | 30 | 15 | 24 | 34 | 21 | — | ||||||||||||||||||
Actuarial (gains)/losses (*) | (79 | ) | 382 | 235 | 3 | 66 | (3 | ) | ||||||||||||||||
Other | 37 | 22 | 2 | (6 | ) | 3 | 4 | |||||||||||||||||
|
|
|
|
|
|
|
|
|
|
|
| |||||||||||||
Present value of the obligations at end of year | 4,790 | 5,044 | 6,085 | 2,161 | 2,404 | 2,781 | ||||||||||||||||||
|
|
|
|
|
|
|
|
|
|
|
| |||||||||||||
| (*) | Including in 2013 demographic actuarial losses of EUR 19 million and financial actuarial gains of EUR 98 million in the post-employment plans. |
The changes in the fair value of plan assets and of insurance contracts linked to pensions were as follows:
Plan assets
| Millions of euros | ||||||||||||
| Post-employment plans | ||||||||||||
| 2013 | 2012 | 2011 | ||||||||||
Fair value of plan assets at beginning of year | 144 | 177 | 183 | |||||||||
Expected return on plan assets | 6 | 7 | 7 | |||||||||
Actuarial gains/(losses) | — | 11 | (5 | ) | ||||||||
Contributions/(surrenders) | 5 | (42 | ) | 2 | ||||||||
Benefits paid | (12 | ) | (9 | ) | (10 | ) | ||||||
Other | 14 | — | — | |||||||||
|
|
|
|
|
| |||||||
Fair value of plan assets at end of year | 157 | 144 | 177 | |||||||||
|
|
|
|
|
| |||||||
Insurance contracts linked to pensions
| Millions of euros | ||||||||||||||||||||||||
| Post-employment plans | Other similar obligations | |||||||||||||||||||||||
| 2013 | 2012 | 2011 | 2013 | 2012 | 2011 | |||||||||||||||||||
Fair value of insurance contracts linked to pensions at beginning of year | 405 | 2,146 | 2,219 | — | — | 1 | ||||||||||||||||||
Expected return on insurance contracts (Note 38) | 11 | 45 | 86 | — | — | — | ||||||||||||||||||
Actuarial gains/(losses) | (27 | ) | (162 | ) | 7 | — | 1 | — | ||||||||||||||||
Premiums paid/(surrenders) (Note 14) | — | (1,565 | ) | (16 | ) | — | (1 | ) | — | |||||||||||||||
Benefits paid | (47 | ) | (59 | ) | (150 | ) | — | — | (1 | ) | ||||||||||||||
|
|
|
|
|
|
|
|
|
|
|
| |||||||||||||
Fair value of insurance contracts linked to pensions at end of year | 342 | 405 | 2,146 | — | — | — | ||||||||||||||||||
|
|
|
|
|
|
|
|
|
|
|
| |||||||||||||
In view of the conversion of the defined-benefit obligations to defined-contribution obligations, the Group will not make material current contributions in Spain in 2014 to fund its defined-benefit pension obligations.
The plan assets and the insurance contracts linked to pensions are instrumented mainly through insurance policies.
The following table shows the estimated benefits payable at December 31, 2013 for the next ten years:
| Millions of euros | ||||
2014 | 928 | |||
2015 | 834 | |||
2016 | 727 | |||
2017 | 622 | |||
2018 | 531 | |||
2019 to 2023 | 1,797 | |||
| ii. | United Kingdom |
At the end of each of the last three years, the businesses in the United Kingdom had post-employment benefit obligations under defined contribution and defined benefit plans. The expenses incurred in respect of contributions to defined contribution plans amounted to EUR 5062 million in 2011 (2010:2013 (2012: EUR 4753 million; 2009:2011: EUR 4435 million).
The amount of the defined benefit obligations was determined on the basis of the work performed by independent actuaries using the following actuarial techniques:
| 1. | Valuation method: projected unit credit method, which sees each period of service as giving rise to an additional unit of benefit entitlement and measures each unit separately. |
| 2. | Actuarial assumptions used: unbiased and mutually compatible. Specifically, the most significant actuarial assumptions used in the calculations were as follows: |
Post-employment plans | Other similar obligations | 2013 | 2012 | 2011 | ||||||||||||||
2011 | 2010 | 2009 | 2011 | 2010 | 2009 | |||||||||||||
Annual discount rate | 4.00% | 4.0% | 4.0% | 4.0% | 4.0% | 4.0% | 4.45% | 4.50% | 4.95% | |||||||||
Mortality tables | GRM/F-95 (PERM/F-2000 in the case of Banesto) | GRM/F-95 (PERM/F-2000 in the case of Banesto) | GRM/F-95 (PERM/F-2000 in the case of Banesto) | GRM/F-95 (PERM/F-2000 in the case of Banesto) | GRM/F-95 (PERM/F-2000 in the case of Banesto) | GRM/F-95 (PERM/F-2000 in the case of Banesto) | 103 S1 Light TMC | 103 S1 Light TMC | 103 S1 Light TMC | |||||||||
Cumulative annual CPI growth | 1.5% | 1.5% | 1.5% | 1.5% | 1.5% | 1.5% | 3.40% | 2.85% | 3.10% | |||||||||
Annual salary increase rate | 2.50% (2.9% in the case of Banesto) | 2.50% (2.9% in the case of Banesto) | 2.50% (2.9% in the case of Banesto) | n/a | n/a | n/a | 3.40% | 2.85% | 3.10% | |||||||||
Annual social security pension increase rate | 1.5% | 1.5% | 1.5% | n/a | n/a | n/a | ||||||||||||
Annual benefit increase rate | n/a | n/a | n/a | 0% to 1.5% | 0% to 1.5% | 0% to 1.5% | ||||||||||||
Annual pension increase rate | 3.15% | 2.75% | 3.00% | |||||||||||||||
The discount rate used isfor the flows was determined by reference to high-quality corporate bonds. (at least AA in pounds sterling) that required by Spanish legislation for measuring similar obligations, which is published annually bycoincide with the Directorate-General of Insurance (Resolution of January 3, 2011). The maximum rate to be used in 2011 was set at 4.82%. This figure relates to 100%terms of the average interest ratesobligations. The portfolio of Government bonds fortaken into consideration excludes callable, puttable and sinkable bonds which could distort the last quarterindices.
Any changes in the main assumptions could affect the calculation of the year prior to thatobligations. At December 31, 2013, if the discount rate used had been decreased or increased by 50 basis points, there would have been an increase or decrease in which the rate is applicable.
F-116
The fair value of insurance contracts was determined as the present value of the related payment obligations taking into accountof +/- 10%. If the following assumptions:inflation assumption had been increased or decreased by 50 basis points, there would have been an increase or decrease in the present value of the obligations of +/- 7%. These changes would be offset in part by increases or decreases in the fair value of the assets.
| Post-employment plans | Other similar obligations | |||||||||||||||||||||||
| 2011 | 2010 | 2009 | 2011 | 2010 | 2009 | |||||||||||||||||||
Expected rate of return on plan assets | 4.0 | % | 4.0 | % | 4.0 | % | — | — | — | |||||||||||||||
Expected rate of return on reimbursement rights | 4.0 | % | 4.0 | % | 4.0 | % | 4.0 | % | 4.0 | % | 4.0 | % | ||||||||||||
The funding status of the defined benefit obligations in 20112013 and the four preceding years is as follows:
| Millions of euros | ||||||||||||||||||||||||||||||||||||||||
| Post-employment plans | Other similar obligations | |||||||||||||||||||||||||||||||||||||||
| 2011 | 2010 | 2009 | 2008 | 2007 | 2011 | 2010 | 2009 | 2008 | 2007 | |||||||||||||||||||||||||||||||
Present value of the obligations: | ||||||||||||||||||||||||||||||||||||||||
To current employees | 1,533 | 1,240 | 1,200 | 1,273 | 1,259 | — | — | — | — | — | ||||||||||||||||||||||||||||||
Vested obligations to retired employees | 4,367 | 4,471 | 4,708 | 4,828 | 4,876 | — | — | — | — | — | ||||||||||||||||||||||||||||||
To pre-retirees | — | — | — | — | — | 2,769 | 3,262 | 3,842 | 4,158 | 3,950 | ||||||||||||||||||||||||||||||
Long-service bonuses and other obligations | — | — | — | — | — | 7 | 8 | 9 | 8 | 50 | ||||||||||||||||||||||||||||||
Other | 185 | 181 | 183 | 181 | 174 | 5 | 3 | — | — | 1 | ||||||||||||||||||||||||||||||
|
|
|
|
|
|
|
|
|
|
|
|
|
|
|
|
|
|
|
| |||||||||||||||||||||
| 6,085 | 5,892 | 6,091 | 6,282 | 6,309 | 2,781 | 3,273 | 3,851 | 4,166 | 4,001 | |||||||||||||||||||||||||||||||
Less- | ||||||||||||||||||||||||||||||||||||||||
Fair value of plan assets | 177 | 183 | 184 | 193 | 192 | — | — | — | — | — | ||||||||||||||||||||||||||||||
Unrecognized actuarial (gains)/losses | 690 | 457 | 462 | 489 | 487 | — | — | — | — | — | ||||||||||||||||||||||||||||||
Unrecognized past service cost | 7 | 8 | 6 | 7 | 4 | — | — | — | — | — | ||||||||||||||||||||||||||||||
|
|
|
|
|
|
|
|
|
|
|
|
|
|
|
|
|
|
|
| |||||||||||||||||||||
Provisions—Provisions for pensions | 5,211 | 5,244 | 5,439 | 5,593 | 5,626 | 2,781 | 3,273 | 3,851 | 4,166 | 4,001 | ||||||||||||||||||||||||||||||
|
|
|
|
|
|
|
|
|
|
|
|
|
|
|
|
|
|
|
| |||||||||||||||||||||
Of which: | ||||||||||||||||||||||||||||||||||||||||
Internal provisions for pensions | 3,065 | 3,025 | 3,086 | 3,153 | 3,114 | 2,781 | 3,272 | 3,848 | 4,159 | 3,987 | ||||||||||||||||||||||||||||||
Insurance contracts linked to pensions (Note 14) | 2,146 | 2,220 | 2,353 | 2,440 | 2,512 | — | 1 | 3 | 7 | 14 | ||||||||||||||||||||||||||||||
| Millions of euros | ||||||||||||||||||||
| 2013 | 2012 | 2011 | 2010 | 2009 | ||||||||||||||||
Present value of the obligations | 10,120 | 9,260 | 8,467 | 7,824 | 7,116 | |||||||||||||||
|
|
|
|
|
|
|
|
|
| |||||||||||
Less- | ||||||||||||||||||||
Fair value of plan assets | 9,455 | 9,194 | 8,496 | 7,617 | 5,910 | |||||||||||||||
|
|
|
|
|
|
|
|
|
| |||||||||||
Provisions - Provisions for pensions | 665 | 66 | (29 | ) | 207 | 1,206 | ||||||||||||||
|
|
|
|
|
|
|
|
|
| |||||||||||
Of which: | ||||||||||||||||||||
Internal provisions for pensions | 806 | 409 | 255 | 261 | 1,207 | |||||||||||||||
Net assets for pensions | (141 | ) | (343 | ) | (284 | ) | (54 | ) | (1 | ) | ||||||||||
The amounts recognized in the consolidated income statementstatements in relation to the aforementioned defined benefit obligations are as follows:
| Millions of euros | ||||||||||||||||||||||||
| Post-employment plans | Other similar obligations | |||||||||||||||||||||||
| 2011 | 2010 | 2009 | 2011 | 2010 | 2009 | |||||||||||||||||||
Current service cost | 52 | 52 | 55 | 1 | 1 | 1 | ||||||||||||||||||
Interest cost | 215 | 215 | 226 | 117 | 139 | 153 | ||||||||||||||||||
Expected return on plan assets | (7 | ) | (7 | ) | (7 | ) | — | — | — | |||||||||||||||
Expected return on insurance contracts linked to pensions | (86 | ) | (90 | ) | (95 | ) | — | — | — | |||||||||||||||
Extraordinary charges (credits)- | ||||||||||||||||||||||||
Actuarial (gains)/losses recognized in the year | 1 | 3 | 10 | (3 | ) | (14 | ) | 38 | ||||||||||||||||
Past service cost | 25 | 40 | 29 | — | 28 | — | ||||||||||||||||||
Pre-retirement cost | 2 | 1 | (19 | ) | 55 | 10 | 257 | |||||||||||||||||
Other | (7 | ) | (21 | ) | (51 | ) | — | (10 | ) | — | ||||||||||||||
|
|
|
|
|
|
|
|
|
|
|
| |||||||||||||
| 195 | 193 | 148 | 170 | 154 | 449 | |||||||||||||||||||
|
|
|
|
|
|
|
|
|
|
|
| |||||||||||||
| Millions of euros | ||||||||||||
| 2013 | 2012 | 2011 | ||||||||||
Current service cost | 32 | 49 | 46 | |||||||||
Interest cost (net) | 1 | 34 | 45 | |||||||||
|
|
|
|
|
| |||||||
| 33 | 83 | 91 | ||||||||||
|
|
|
|
|
| |||||||
In addition, in 2013 Valuation adjustments – Other valuation adjustments decreased by EUR 697 million with respect to defined benefit obligations (2012: a decrease of EUR 182 million; 2011: an increase of EUR 29 million).
F-117
The changes in the present value of the accrued defined benefit obligations were as follows:
| Millions of euros | ||||||||||||||||||||||||
| Post-employment plans | Other similar obligations | |||||||||||||||||||||||
| 2011 | 2010 | 2009 | 2011 | 2010 | 2009 | |||||||||||||||||||
Present value of the obligations at beginning of year | 5,892 | 6,091 | 6,282 | 3,273 | 3,851 | 4,166 | ||||||||||||||||||
Current service cost | 52 | 52 | 55 | 1 | 1 | 1 | ||||||||||||||||||
Interest cost | 215 | 215 | 226 | 117 | 139 | 153 | ||||||||||||||||||
Pre-retirement cost | 2 | 1 | (19 | ) | 55 | 10 | 257 | |||||||||||||||||
Effect of curtailment/settlement | (7 | ) | (21 | ) | (51 | ) | — | (10 | ) | — | ||||||||||||||
Benefits paid | (330 | ) | (465 | ) | (383 | ) | (666 | ) | (732 | ) | (765 | ) | ||||||||||||
Past service cost | 24 | 42 | 29 | — | 28 | — | ||||||||||||||||||
Actuarial (gains)/losses | 235 | (32 | ) | (52 | ) | (3 | ) | (14 | ) | 38 | ||||||||||||||
Other | 2 | 9 | 4 | 4 | — | 1 | ||||||||||||||||||
|
|
|
|
|
|
|
|
|
|
|
| |||||||||||||
Present value of the obligations at end of year | 6,085 | 5,892 | 6,091 | 2,781 | 3,273 | 3,851 | ||||||||||||||||||
|
|
|
|
|
|
|
|
|
|
|
| |||||||||||||
The changes in the fair value of plan assets and of insurance contracts linked to pensions were as follows:
Plan assets
| Millions of euros | ||||||||||||
| Post-employment plans | ||||||||||||
| 2011 | 2010 | 2009 | ||||||||||
Fair value of plan assets at beginning of year | 183 | 184 | 193 | |||||||||
Expected return on plan assets | 7 | 7 | 7 | |||||||||
Actuarial gains/(losses) | (5 | ) | (1 | ) | (4 | ) | ||||||
Contributions | 2 | 3 | (1 | ) | ||||||||
Benefits paid | (10 | ) | (10 | ) | (11 | ) | ||||||
|
|
|
|
|
| |||||||
Fair value of plan assets at end of year | 177 | 183 | 184 | |||||||||
|
|
|
|
|
| |||||||
Insurance contracts linked to pensions
| Millions of euros | ||||||||||||||||||||||||
| Post-employment plans | Other similar obligations | |||||||||||||||||||||||
| 2011 | 2010 | 2009 | 2011 | 2010 | 2009 | |||||||||||||||||||
Fair value of insurance contracts linked to pensions at beginning of year | 2,220 | 2,353 | 2,440 | 1 | 3 | 7 | ||||||||||||||||||
Expected return on insurance contracts (Note 38) | 86 | 90 | 95 | — | — | — | ||||||||||||||||||
Actuarial gains/(losses) | 6 | (28 | ) | (31 | ) | — | — | — | ||||||||||||||||
Premiums paid | (16 | ) | (39 | ) | 7 | — | — | — | ||||||||||||||||
Benefits paid | (150 | ) | (156 | ) | (158 | ) | (1 | ) | (2 | ) | (4 | ) | ||||||||||||
|
|
|
|
|
|
|
|
|
|
|
| |||||||||||||
Fair value of insurance contracts linked to pensions at end of year | 2,146 | 2,220 | 2,353 | — | 1 | 3 | ||||||||||||||||||
|
|
|
|
|
|
|
|
|
|
|
| |||||||||||||
In 2012 the Group expects to make contributions in Spain to fund its defined benefit pension obligations for amounts similar to those made in 2011.
The plan assets and the insurance contracts linked to pensions are instrumented through insurance policies.
F-118
The following table shows the estimated benefits payable at December 31, 2011 for the next ten years:
| Millions of euros | ||||
2012 | 1,069 | |||
2013 | 920 | |||
2014 | 849 | |||
2015 | 759 | |||
2016 | 669 | |||
2017 to 2021 | 2,354 | |||
ii. United Kingdom
At the end of each of the last three years, the businesses in the United Kingdom had post-employment benefit obligations under defined contribution and defined benefit plans. The expenses incurred in respect of contributions to defined contribution plans amounted to EUR 35 million in 2011 (2010: EUR 55 million; 2009: EUR 22 million).
The amount of the defined benefit obligations was determined on the basis of the work performed by independent actuaries using the following actuarial techniques:
| Millions of euros | ||||||||||||
| 2013 | 2012 | 2011 | ||||||||||
Present value of the obligations at beginning of year | 9,260 | 8,467 | 7,824 | |||||||||
Current service cost | 32 | 49 | 46 | |||||||||
Interest cost | 396 | 427 | 417 | |||||||||
Benefits paid | (239 | ) | (258 | ) | (236 | ) | ||||||
Actuarial (gains)/losses (*) | 852 | 367 | 169 | |||||||||
Exchange differences and other items | (181 | ) | 208 | 247 | ||||||||
|
|
|
|
|
| |||||||
Present value of the obligations at end of year | 10,120 | 9,260 | 8,467 | |||||||||
|
|
|
|
|
| |||||||
| (*) |
| 2011 | 2010 | 2009 | ||||
Annual discount rate | 4.95% | 5.45% | 5.75% | |||
Mortality tables | 103 S1 Light TMC | 103 S1 Light TMC | PX92MC C2009 | |||
Cumulative annual CPI growth | 3.10% | 3.5% | 3.4% | |||
Annual salary increase rate | 3.10% | 3.5% | 3.4% | |||
Annual pension increase rate | 3.00% | 3.4% | 3.3% |
The funding status of the defined benefit obligations in 2011 and the four preceding years is as follows:
| Millions of euros | ||||||||||||||||||||
| 2011 | 2010 | 2009 | 2008 | 2007 | ||||||||||||||||
Present value of the obligations | 8,467 | 7,824 | 7,116 | 5,445 | 6,248 | |||||||||||||||
|
|
|
|
|
|
|
|
|
| |||||||||||
Less- | ||||||||||||||||||||
Fair value of plan assets | 8,496 | 7,617 | 5,910 | 4,591 | 4,913 | |||||||||||||||
Unrecognized actuarial (gains)/losses | 824 | 767 | 787 | 202 | 60 | |||||||||||||||
|
|
|
|
|
|
|
|
|
| |||||||||||
Provisions—Provisions for pensions | (853 | ) | (560 | ) | 419 | 652 | 1,275 | |||||||||||||
|
|
|
|
|
|
|
|
|
| |||||||||||
Of which: | ||||||||||||||||||||
Internal provisions for pensions | 36 | 28 | 496 | 744 | 1,275 | |||||||||||||||
Net assets for pensions | (889 | ) | (588 | ) | (77 | ) | (92 | ) | — | |||||||||||
F-119
The amounts recognized in the consolidated income statement in relation to the aforementioned defined benefit obligations are as follows:
| Millions of euros | ||||||||||||
| 2011 | 2010 | 2009 | ||||||||||
Current service cost | 46 | 43 | 72 | |||||||||
Interest cost | 417 | 416 | 367 | |||||||||
Expected return on plan assets | (448 | ) | (370 | ) | (320 | ) | ||||||
Extraordinary charges (credits): | ||||||||||||
Actuarial (gains)/losses recognized in the year | 5 | 22 | — | |||||||||
Past service cost | — | — | (1 | ) | ||||||||
|
|
|
|
|
| |||||||
| 20 | 111 | 118 | ||||||||||
|
|
|
|
|
| |||||||
The changes in the present value of the accrued defined benefit obligations were as follows:
| Millions of euros | ||||||||||||
| 2011 | 2010 | 2009 | ||||||||||
Present value of the obligations at beginning of year | 7,824 | 7,116 | 5,445 | |||||||||
Current service cost | 46 | 43 | 72 | |||||||||
Interest cost | 417 | 416 | 367 | |||||||||
Past service cost | — | — | (1 | ) | ||||||||
Benefits paid | (236 | ) | (241 | ) | (261 | ) | ||||||
Actuarial (gains)/losses | 169 | 244 | 1,050 | |||||||||
Exchange differences and other items | 247 | 246 | 444 | |||||||||
|
|
|
|
|
| |||||||
Present value of the obligations at end of year | 8,467 | 7,824 | 7,116 | |||||||||
|
|
|
|
|
| |||||||
The changes in the fair value of the plan assets were as follows:
| Millions of euros | ||||||||||||||||||||||||
| Millions of euros | 2013 | 2012 | 2011 | |||||||||||||||||||||
| 2011 | 2010 | 2009 | ||||||||||||||||||||||
Fair value of plan assets at beginning of year | 7,617 | 5,910 | 4,591 | 9,194 | 8,496 | 7,617 | ||||||||||||||||||
Expected return on plan assets | 448 | 370 | 320 | 395 | 393 | 372 | ||||||||||||||||||
Actuarial gains/(losses) | 122 | 273 | 364 | 155 | 186 | 198 | ||||||||||||||||||
Contributions | 294 | 1,121 | 564 | 133 | 180 | 294 | ||||||||||||||||||
Benefits paid | (236 | ) | (241 | ) | (261 | ) | (239 | ) | (258 | ) | (236 | ) | ||||||||||||
Exchange differences and other changes | 251 | 184 | 332 | (183 | ) | 197 | 251 | |||||||||||||||||
|
|
|
|
|
| |||||||||||||||||||
Fair value of plan assets at end of year | 8,496 | 7,617 | 5,910 | 9,455 | 9,194 | 8,496 | ||||||||||||||||||
|
|
|
|
|
| |||||||||||||||||||
In 20122014 the Group expects to make contributions to fund these obligations for amounts similar to those made in 2011.2013.
The main categories of plan assets as a percentage of total plan assets are as follows:
| 2011 | 2010 | 2009 | ||||||||||
Equity instruments | 30 | % | 34 | % | 39 | % | ||||||
Debt instruments | 54 | % | 58 | % | 54 | % | ||||||
Properties | 2 | % | 1 | % | 1 | % | ||||||
Other | 14 | % | 7 | % | 6 | % | ||||||
F-120
The expected return on plan assets was determined on the basis of the market expectations for returns over the duration of the related obligations.
| 2013 | 2012 | 2011 | ||||||||||
Equity instruments | 24 | % | 27 | % | 30 | % | ||||||
Debt instruments | 59 | % | 56 | % | 54 | % | ||||||
Properties | 11 | % | 3 | % | 2 | % | ||||||
Other | 6 | % | 14 | % | 14 | % | ||||||
The following table shows the estimated benefits payable at December 31, 20112013 for the next ten years:
| Millions | Millions of euros | |||||||
| of euros | ||||||||
2012 | 259 | |||||||
2013 | 276 | |||||||
2014 | 294 | 257 | ||||||
2015 | 314 | 274 | ||||||
2016 | 335 | 292 | ||||||
2017 to 2021 | 2,055 | |||||||
2017 | 311 | |||||||
2018 | 332 | |||||||
2019 to 2023 | 2,028 | |||||||
iii. Other foreign subsidiaries
| iii. | Other foreign subsidiaries |
Certain of the consolidated foreign entities have acquired commitments to their employees similar to post-employment benefits.
At December 31, 2011, 20102013, 2012 and 2009,2011, these entities had defined contributiondefined-contribution and defined benefitdefined-benefit post-employment benefit obligations. The expenses incurred in respect of contributions to defined contribution plans amounted to EUR 53 million in 2011 (2010:2013 (2012: EUR 49 million; 2009:2011: EUR 4852 million).
The actuarial assumptions used by these entities (discount rates, mortality tables and cumulative annual CPI growth) are consistent with the economic and social conditions prevailing in the countries in which they are located.
Specifically, the discount rate used for the flows was determined by reference to high-quality corporate bonds, except in the case of Brazil where there is no extensive corporate bond market and, accordingly the discount rate was determined by reference to the series B bonds issued by the Brazilian National Treasury Secretariat for a term coinciding with that of the obligations.
Any changes in the main assumptions could affect the calculation of the obligations. At December 31, 2013, if the discount rate used had been decreased or increased by 50 basis points, there would have been a decrease or increase in the present value of the obligations of +/- 5%. These changes would be offset in part by increases or decreases in the fair value of the assets.
The funding status of the obligations similar to post-employment benefits and other long-term benefits in 20112013 and the four preceding years is as follows:
| Millions of euros | ||||||||||||||||||||
| 2011 | 2010 | 2009 | 2008 | 2007 | ||||||||||||||||
Present value of the obligations | 11,245 | 11,062 | 9,078 | 6,735 | 7,264 | |||||||||||||||
|
|
|
|
|
|
|
|
|
| |||||||||||
Less- | ||||||||||||||||||||
Fair value of plan assets | 9,745 | 10,176 | 8,497 | 6,307 | 6,725 | |||||||||||||||
Unrecognized actuarial (gains)/losses | 1,393 | 667 | 632 | 386 | 134 | |||||||||||||||
Unrecognized past service cost | 8 | — | 3 | — | — | |||||||||||||||
|
|
|
|
|
|
|
|
|
| |||||||||||
Provisions—Provisions for pensions | 99 | 219 | (54 | ) | 42 | 405 | ||||||||||||||
|
|
|
|
|
|
|
|
|
| |||||||||||
Of which: | ||||||||||||||||||||
Internal provisions for pensions | 1,006 | 966 | 829 | 688 | 821 | |||||||||||||||
Net assets for pensions | (621 | ) | (396 | ) | �� | (425 | ) | (418 | ) | (239 | ) | |||||||||
Unrecognized net assets for pensions | (286 | ) | (351 | ) | (458 | ) | (228 | ) | (177 | ) | ||||||||||
In January 2007 Banco do Estado de São Paulo, S.A.- Banespa (which merged with Banco Santander Banespa, S.A. on August 31, 2006) externalised a portion of the pension obligations to employees for which it still recognized an internal fund and for this purpose arranged an external plan or fund managed by Banesprev. As a result of this externalisation, the related assets and liabilities were transferred to Banesprev, and Provisions—Provisions for pensions and similar obligations at December 31, 2007 included the present value of the aforementioned obligations, net of the fair value of the related plan assets and the net unrecognized cumulative actuarial gains and/or losses.
F-121
| Millions of euros | ||||||||||||||||||||
| 2013 | 2012 | 2011 | 2010 | 2009 | ||||||||||||||||
Present value of the obligations | 9,289 | 12,814 | 11,245 | 11,062 | 9,078 | |||||||||||||||
Less- | ||||||||||||||||||||
Of which: with a charge to the participants | 133 | 125 | — | — | — | |||||||||||||||
|
|
|
|
|
|
|
|
|
| |||||||||||
Fair value of plan assets | 7,938 | 10,410 | 9,745 | 10,176 | 8,497 | |||||||||||||||
|
|
|
|
|
|
|
|
|
| |||||||||||
Provisions - Provisions for pensions | 1,218 | 2,279 | 1,500 | 886 | 581 | |||||||||||||||
|
|
|
|
|
|
|
|
|
| |||||||||||
Of which: | ||||||||||||||||||||
Internal provisions for pensions | 1,512 | 2,626 | 1,827 | 1,340 | 1,165 | |||||||||||||||
Net assets for pensions | (8 | ) | (5 | ) | (15 | ) | (8 | ) | (8 | ) | ||||||||||
Unrecognized net assets for pensions | (286 | ) | (342 | ) | (312 | ) | (446 | ) | (576 | ) | ||||||||||
In December 2011, the Portuguese financial institutions, including Banco Santander Totta, S.A., transferred in part their pension obligations to the social security authorities. As a result, Banco Santander Totta, S.A. transferred the related assets and liabilities and Provisions—Provisions - Provisions for pensions and similar obligations at December 31, 2011 included the present value of the obligations, net of the fair value of the related plan assets and the net unrecognized cumulative actuarial gains and/or losses.assets.
The amounts recognized in the consolidated income statementstatements in relation to these obligations are as follows:
| Millions of euros | ||||||||||||||||||||||||
| Millions of euros | 2013 | 2012 | 2011 | |||||||||||||||||||||
| 2011 | 2010 | 2009 | ||||||||||||||||||||||
Current service cost | 39 | 50 | 49 | 46 | 42 | 39 | ||||||||||||||||||
Interest cost | 1,031 | 939 | 736 | |||||||||||||||||||||
Expected return on plan assets | (968 | ) | (851 | ) | (672 | ) | ||||||||||||||||||
Interest cost (net) | 162 | 116 | 192 | |||||||||||||||||||||
Extraordinary charges (credits): | ||||||||||||||||||||||||
Actuarial (gains)/losses recognized in the year | 174 | 83 | 73 | (1 | ) | 7 | 1 | |||||||||||||||||
Past service cost | 7 | 2 | — | |||||||||||||||||||||
Pre-retirement cost | 24 | 31 | 9 | — | (10 | ) | 24 | |||||||||||||||||
Other | (77 | ) | 11 | (10 | ) | (2 | ) | (4 | ) | (77 | ) | |||||||||||||
|
|
|
|
|
| |||||||||||||||||||
| 223 | 263 | 185 | 212 | 153 | 179 | |||||||||||||||||||
|
|
|
|
|
| |||||||||||||||||||
In addition, in 2013 Valuation adjustments – Other valuation adjustments increased by EUR 735 million with respect to defined benefit obligations (2012: a decrease of EUR 968 million; 2011: a decrease of EUR 723 million).
The changes in the present value of the accrued obligations were as follows:
| Millions of euros | ||||||||||||||||||||||||
| Millions of euros | 2013 | 2012 | 2011 | |||||||||||||||||||||
| 2011 | 2010 | 2009 | ||||||||||||||||||||||
Present value of the obligations at beginning of year | 11,062 | 9,078 | 6,735 | 12,814 | 11,245 | 11,062 | ||||||||||||||||||
Net inclusion of entities in the Group | 71 | — | 68 | 4 | (70 | ) | 71 | |||||||||||||||||
Current service cost | 39 | 50 | 49 | 46 | 42 | 39 | ||||||||||||||||||
Interest cost | 1,031 | 939 | 736 | 951 | 1,010 | 1,031 | ||||||||||||||||||
Pre-retirement cost | 24 | 31 | 9 | — | 13 | 24 | ||||||||||||||||||
Effect of curtailment/settlement | (5 | ) | (8 | ) | (209 | ) | (1 | ) | (16 | ) | (5 | ) | ||||||||||||
Benefits paid | (739 | ) | (717 | ) | (587 | ) | (686 | ) | (735 | ) | (739 | ) | ||||||||||||
Benefits paid due to settlements | (2 | ) | (41 | ) | — | |||||||||||||||||||
Past service cost | 9 | 17 | 3 | 7 | — | 9 | ||||||||||||||||||
Actuarial (gains)/losses | 553 | 585 | 830 | |||||||||||||||||||||
Actuarial (gains)/losses (*) | (2,039 | ) | 2,352 | 553 | ||||||||||||||||||||
Exchange differences and other items | (800 | ) | 1,087 | 1,444 | (1,805 | ) | (986 | ) | (800 | ) | ||||||||||||||
|
|
|
|
|
| |||||||||||||||||||
Present value of the obligations at end of year | 11,245 | 11,062 | 9,078 | 9,289 | 12,814 | 11,245 | ||||||||||||||||||
|
|
|
|
|
| |||||||||||||||||||
| (*) | Including in 2013 demographic actuarial losses of EUR 28 million and financial actuarial gains of EUR 2,067 million. |
The changes in the fair value of the plan assets were as follows:
| Millions of euros | ||||||||||||||||||||||||
| Millions of euros | 2013 | 2012 | 2011 | |||||||||||||||||||||
| 2011 | 2010 | 2009 | ||||||||||||||||||||||
Fair value of plan assets at beginning of year | 10,176 | 8,497 | 6,307 | 10,410 | 9,745 | 10,176 | ||||||||||||||||||
Net inclusion of entities in the Group | — | — | 49 | — | 10 | — | ||||||||||||||||||
Expected return on plan assets | 968 | 851 | 672 | 789 | 894 | 839 | ||||||||||||||||||
Actuarial gains/(losses) | (353 | ) | 351 | 449 | (1,314 | ) | 1,259 | (224 | ) | |||||||||||||||
Contributions | 353 | 130 | 158 | 239 | 165 | 353 | ||||||||||||||||||
Benefits paid | (674 | ) | (646 | ) | (533 | ) | (641 | ) | (687 | ) | (674 | ) | ||||||||||||
Exchange differences and other items | (725 | ) | 993 | 1,395 | (1,545 | ) | (976 | ) | (725 | ) | ||||||||||||||
|
|
|
|
|
| |||||||||||||||||||
Fair value of plan assets at end of year | 9,745 | 10,176 | 8,497 | 7,938 | 10,410 | 9,745 | ||||||||||||||||||
|
|
|
|
|
| |||||||||||||||||||
In 20122014 the Group expects to make contributions to fund these obligations for amounts similar to those made in 2011.2013.
F-122
The main categories of plan assets as a percentage of total plan assets are as follows:
| 2011 | 2010 | 2009 | ||||||||||
Equity instruments | 4 | % | 9 | % | 12 | % | ||||||
Debt instruments | 85 | % | 86 | % | 83 | % | ||||||
Properties | 3 | % | 1 | % | 1 | % | ||||||
Other | 8 | % | 4 | % | 4 | % | ||||||
The expected return on plan assets was determined on the basis of the market expectations for returns over the duration of the related obligations.
| 2013 | 2012 | 2011 | ||||||||||
Equity instruments | 10 | % | 6 | % | 4 | % | ||||||
Debt instruments | 85 | % | 86 | % | 85 | % | ||||||
Properties | 2 | % | 4 | % | 3 | % | ||||||
Other | 3 | % | 4 | % | 8 | % | ||||||
The following table shows the estimated benefits payable at December 31, 20112013 for the next ten years:
| Millions of euros | Millions of euros | |||||||
2012 | 735 | |||||||
2013 | 767 | |||||||
2014 | 800 | 661 | ||||||
2015 | 835 | 683 | ||||||
2016 | 873 | 712 | ||||||
2017 to 2021 | 5,207 | |||||||
2017 | 737 | |||||||
2018 | 766 | |||||||
2019 to 2023 | 4,282 | |||||||
| d) | Provisions for taxes and other legal contingencies and Other provisions |
The balances of Provisions—Provisions - Provisions for taxes and other legal contingencies and Provisions—Provisions - Other provisions, which include, inter alia, provisions for restructuring costs and tax-related and non-tax-related proceedings, were estimated using prudent calculation procedures in keeping with the uncertainty inherent to the obligations covered. The definitive date of the outflow of resources embodying economic benefits for the Group depends on each obligation. In certain cases, these obligations have no fixed settlement period and, in other cases, are baseddepend on the legal proceedings in progress.
The detail, by geographical area, of Provisions for taxes and other legal contingencies and Other provisions is as follows:
| Millions of euros | ||||||||||||||||||||||||
| Millions of euros | 2013 | 2012 | 2011 | |||||||||||||||||||||
| 2011 | 2010 | 2009 | ||||||||||||||||||||||
Recognized by Spanish companies | 680 | 840 | 828 | 1,007 | 722 | 680 | ||||||||||||||||||
Recognized by other EU companies | 1,523 | 536 | 537 | 1,134 | 1,483 | 1,523 | ||||||||||||||||||
Recognized by other companies | 3,665 | 3,735 | 4,897 | 2,515 | 2,973 | 3,665 | ||||||||||||||||||
Of which: | ||||||||||||||||||||||||
Brazil | 3,364 | 3,664 | 3,428 | 2,263 | 2,750 | 3,364 | ||||||||||||||||||
|
|
|
|
|
| |||||||||||||||||||
| 5,868 | 5,111 | 6,262 | 4,656 | 5,178 | 5,868 | |||||||||||||||||||
|
|
|
|
|
| |||||||||||||||||||
Set forth below is the detail, by type of provision, of the balance at December 31, 2013, 2012 and 2011 of Provisions for taxes and other legal contingencies and Other provisions. The types of provision were determined by grouping together items of a similar nature:
| Millions of euros | ||||||||||||
| 2013 | 2012 | 2011 | ||||||||||
Provisions for taxes | 1,177 | 1,198 | 1,346 | |||||||||
Provisions for employment-related proceedings (Brazil) | 638 | 975 | 1,390 | |||||||||
Provisions for other legal proceedings | 912 | 927 | 927 | |||||||||
Provision for customer remediation (UK) | 465 | 803 | 863 | |||||||||
Regulatory framework-related provisions (UK) | 201 | 227 | 211 | |||||||||
Provision for restructuring | 378 | 120 | 98 | |||||||||
Other | 885 | 928 | 1,033 | |||||||||
|
|
|
|
|
| |||||||
| 4,656 | 5,178 | 5,868 | ||||||||||
|
|
|
|
|
| |||||||
F-123Relevant information is set forth below in relation to each type of provision shown in the preceding table:
The provisions for employment-related proceedings (Brazil) relate to claims filed by trade unions, associations, the prosecutor’s office and ex-employees claiming employment rights to which, in their view, they are entitled, particularly the payment of overtime and other employment rights, including litigation concerning retirement benefits. The number and nature of these proceedings, which are common for banks in Brazil, justify the classification of these provisions in a separate category or as a separate type from the rest. The Group calculates the provisions associated with these claims in accordance with past experience of payments made in relation to claims for similar items. When claims do not fall within these categories, a case-by-case assessment is performed and the amount of the provision is calculated in accordance with the status of each proceeding and the risk assessment carried out by the legal advisers. The average duration of the employment-related proceedings is eight years.
The provisions for other legal proceedings include provisions for court, arbitration or administrative proceedings (other than those included in other categories or types of provisions disclosed separately) brought against Santander Group companies.
The provisions for customer remediation (UK) include the estimated cost of payments to remedy errors relating to the sale of certain products in the UK. To calculate the provision for customer remediation, the best estimate of the provision made by management is used, which is based on the estimated number of claims to be received and, of these, the number that will be accepted, as well as the estimated average payment per case.
The regulatory framework-related provisions (UK) include mainly the provisions relating to the following issues concerning Santander UK:
The provisions for restructuring include only the direct costs arising from restructuring processes carried out by various Group companies.
Qualitative information on the main litigation is provided in Note 25.e to the consolidated financial statements.
Our general policy is to record provisions for tax and legal proceedings in which we assess the chances of loss to be probable and we do not record provisions when the chances of loss are possible or remote. We determine the amounts to be provided for as our best estimate of the expenditure required to settle the corresponding claim based, among other factors, on a case-by-case analysis of the facts and the legal opinion of internal and external counsel or by considering the historical average amount of the loss incurred in claims of the same nature. The definitive date of the outflow of resources embodying economic benefits for the Group depends on each obligation. In certain cases, the obligations do not have a fixed settlement term and, in others, they depend on legal proceedings in progress.
The detail of the changes in Provisions for taxes and other legal contingencies and Other provisions is set forth in Note 25.b. With respect to Brazil, the main charges to the consolidated income statement in 2013 related to EUR 346 million due to provisions for restructuring, EUR 247 million due to civil contingencies and EUR 336 million due to employment-related claims in Brazil. This increase is offset in part by the use of the available provisions, of which EUR 500 million relate to employment-related payments, EUR 215 million to civil payments and EUR 62 million to the use of the restructuring provision, and to the effect of exchange differences. In the UK, provisions of EUR 312 million were recognized mainly in connection with the regulatory framework (the bank levy and the Financial Services Compensation Scheme (FSCS)), an increase offset by EUR 317 million in payments relating to the bank levy and the FSCS and the use of EUR 319 million of provisions for customer remediation.
The detail of the changes in 2012 in Provisions for taxes and other legal contingencies and Other provisions is set forth in Note 25.b and related mainly to the changes in the provisions in Brazil and in the UK. The main charges to the consolidated income statement in 2012 corresponded to EUR 573 million arising from the employment-related claims in Brazil and EUR 264 million due to provisions for customer remediation in the UK. This increase was comfortably offset by the use of the available provisions, of which EUR 730 million corresponded to employment-related claims in Brazil and EUR 392 million to customer remediation in the UK and the effect of exchange differences.
| e) | Litigation and other matters |
i. Tax-relatedproceedings
At December 31, 2011,As of the date of this report, the main tax-related proceedings concerning the Group were as follows:
“Mandados de Segurança”Legal actions filed by Banco Santander (Brasil) S.A. and certain Group companies in Brazil challenging the increase in the rate of Brazilian social contribution tax on net income from 9% to 15% stipulated by Interim Measure 413/2008, ratified by Law 11,727/2008.
“Mandados de Segurança”Legal actions filed by certain Group companies in Brazil claiming their right to pay the Brazilian social contribution tax on net income at a rate of 8% and 10% from 1994 to 1998.
“Mandados de Segurança”Legal actions filed by Banco Santander Brasil, S.A. (currently Banco Santander (Brasil), S.A.) and other Group entities claiming their right to pay the Brazilian PIS and COFINS social contributions only on the income from the provision of services. In the case of Banco Santander Brasil, S.A., the “Mandado de Segurança”legal action was declared unwarranted and an appeal was filed at the Federal Regional Court. In September 2007 the Federal Regional Court found in favor of Banco Santander Brasil, S.A., but the Brazilian authorities appealed against the judgment at the Federal Supreme Court. In the case of Banco ABN AMRO Real, S.A. (currently Banco Santander (Brasil), S.A.), in March 2007 the court found in its favor, but the Brazilian authorities appealed against the judgment at the Federal Regional Court, which handed down a decision partly upholding the appeal in September 2009. Banco Santander (Brasil), S.A. filed an appeal at the Federal Supreme Court.
Law 12,865/2013 established a program of payments or deferrals of certain tax and social security debts, exempting the entities availing themselves of the law from paying late-payment interest and resulting in the legal actions brought being withdrawn. In November 2013 Banco Santander (Brasil) S.A. partially availed itself of this program but only with respect to the legal actions brought by the former Banco ABN AMRO Real, Leasing, S.A. Arrendamiento Mercantilin relation to the period from September 2006 to April 2009, and with respect to other minor actions brought by other entities in its Group. However, the legal actions brought by Banco Santander (Brasil), S.A. and those of Banco ABN AMRO Real, S.A. relating to the periods prior to September 2006, for which the estimated loss was provided for, are still pending.
Banco Santander (Brasil), S.A. and other Group companies in Brazil are involved in several administrative and legal proceedings against various municipalities that demand payment of the Service Tax on certain items of income from transactions not classified as provisions of services.
Provisions were not recognized in connection with the amount considered to be a contingent liability.
In addition, Banco Santander (Brasil), S.A. and other Group companies in Brazil are involved in several administrative and legal proceedings against the tax authorities in connection with the taxation for social security purposes of certain items which are not considered to be employee remuneration. Provisions were not recognized in connection with the amount considered to be a contingent liability.
In December 2008 the Brazilian tax authorities issued an infringement notice against Banco Santander (Brasil), S.A. in relation to income tax (IRPJ and CSL)CSLL) for 2002 to 2004. The tax authorities took the view that Banco Santander (Brasil), S.A. did not meet the necessary legal requirements to be able to deduct the amortization of the goodwill arising on the acquisition of Banespa (currently Banco Santander (Brasil), S.A.). Banco Santander (Brasil) S.A. filed an appeal against the infringement notice at Conselho Administrativo de Recursos Fiscais (“CARF”)(CARF), which on October 21, 2011 unanimously decided to render the infringement notice null and void. The tax authorities may appealhave appealed against this decision at a higher administrative instance.level. In June 2010 the Brazilian tax authorities issued infringement notices in relation to this same matter for 2005 to 2007. Banco Santander (Brasil), S.A. filed an appeal against these procedures at CARF.CARF, which was partially dismissed on October 8, 2013. This decision will be appealed at the higher instance of CARF (Tax Appeal High Chamber). In December 2013 the Brazilian tax authorities issued an infringement notice relating to 2008, the last year for amortization of the goodwill. This infringement notice will be appealed by Banco Santander (Brasil), S.A. Based on the advice of its external legal counsel and in view of the recentfirst decision by CARF, the Group considers that the stance taken by the Brazilian tax authorities is incorrect and that there are sound defense arguments to appeal against the infringement notice.notices. Accordingly, the risk of incurring a loss is remote. Consequently, no provisions have beenwere not recognized in connection with these proceedings because this matter should not affect the consolidated financial statements.
F-124
A claim was filed against Abbey National Treasury Services plc byIn June 2013, the Brazilian tax authorities abroadissued an infringement notice against Banco Santander (Brasil), S.A. as the party liable for tax on the capital gain allegedly obtained in relationBrazil by Sterrebeeck B.V., an entity that is not a resident of Brazil, as a result of the “incorporação de ações” (merger of shares) transaction carried out in August 2008. As a result of the aforementioned transaction, Banco Santander (Brasil), S.A. acquired all of the shares of Banco ABN AMRO Real, S.A. and ABN AMRO Brasil Dois Participações, S.A. through the delivery to these entities’ shareholders of newly issued shares of Banco Santander (Brasil), S.A., issued in a capital increase carried out for that purpose. The Brazilian tax authorities take the refundview that in the aforementioned transaction Sterrebeeck B.V. recognized gain subject to tax in Brazil consisting of certain tax creditsthe difference between the issue value of the shares of Banco Santander (Brasil), S.A. that were received and other associated amounts. A favorable judgmentthe acquisition cost of the shares delivered in exchange. The Group lodged an appeal against the infringement notice at first instance was handed down in September 2006, although the judgment was appealed againstFederal Tax Office and considers, based on the advice of its external legal counsel, that the stance taken by the Brazilian tax authorities is not correct, that there are sound defense arguments to appeal against the infringement notice and that, therefore, the risk of loss is remote. Consequently, the Group has not recognized any provisions in January 2007 andconnection with these proceedings because this matter should not affect the court found in favor of the latter in June 2010. Abbey National Treasury Services plc appealed against this decision at a higher court and in December 2011 the tax authorities confirmed their intention to file the related pleadings. The higher court hearing took place in April 2012 the judgement found in favor of the tax authorities upholding their appeal. Abbey National Treasury Services plc are evaluating the impact of this judgement.
Legal action brought by Sovereign Bancorp, Inc. (currently Santander Holdings USA, Inc.) claiming its right to take a foreign tax credit in connection with taxes paid outside the United States forin fiscal years 2003 to 2005 in relation to financing transactions carried out with an international bank. Santander Holdings USA Inc. considers that, in accordance with applicable tax legislation, it is entitled to claim these foreign tax credits taken with respect to the transactions and deduct the related issuance and financing costs. In addition, if the outcome of this legal action is favorable to the interests of Santander Holdings USA Inc.,Inc, the amounts paid over by the entity in relation to this matter with respect to 2006 and 2007 would also have to be refunded.
At the date of approval of these consolidatedthis annual financial statementsreport on Form 20-F certain other less significant tax-related proceedings were also in progress.
ii. Non-tax-relatedNon-tax related proceedings
At December 31, 2011,As of the date of this report, the main non-tax-related proceedings concerning the Group were as follows:
Customer remediation: claims associated with the sale by Santander UK of certain financial products (principally payment protection insurance)insurance or PPI) to its customers.
The provisions recorded by Santander UK in respect of customer remediation comprise the estimated cost of making redress payments with respect to the past sales of products. In calculating the customer remediation provision, management’s best estimate of the provision was calculated based on conclusions regarding the number of claims that will be received, of those, the number that will be upheld, and the estimated average settlement per case.
Payment protection insurance is a UK insurance product offering payment protection on unsecured personal loans (and credit cards). The product was sold by all UK banks. The mis-selling issues are predominantly related to business written before 2009. The nature and profitability of the product has changed materially since 2008, in part due to customer and regulatory pressure. The product was sold by all UK banks – the mis-selling issues are predominantly related to business written before 2009.2008.
On July 1, 2008, the UK Financial Ombudsman Service (“FOS”(‘FOS’) referred concerns regarding the handling of PPI complaints to the UK FSA as an issue of wider implication.Financial Services Authority (‘FSA’). On September 29, 2009 and March 9, 2010, the FSA issued consultation papers on PPI complaints handling.handling as an issue of wider implication. The FSA published its Policy Statement on August 10, 2010, setting out evidential provisionsthe evidence and guidance on the fair assessment of a complaint and the calculation of redress, as well as a requirement for firms to reassess historically rejected complaints which had to be implemented by December 1, 2010.
On October 8, 2010, the British Bankers’ Association (“BBA”(‘BBA’), the principal trade association for the UK banking and financial services sector, filed on behalf of certain financial institutions (which did not include Santander UK)UK plc) an application for permission to seek judicial review against the FSA and the FOS. The BBA sought an order quashing the FSA Policy Statement and an order quashing the decision of the FOS to determine PPI sales in accordance with the guidance published on its website in November 2008. The Judicial Reviewjudicial review was heard in the courts in January 2011 and on April 20, 2011 judgment was handed down by the High Court dismissing the BBA’s application.proceeding brought by the BBA.
Santander UK did not participate in the legal action undertaken by other UK banks and hashad been consistently making provisions and settling claims with regards to PPI complaints liabilities since they began to increase in recent years. However, aliabilities.
A detailed review of the provision was performed by Santander UK in the first half of the year2011 which was necessary in light of current conditions,the new situation, including the High Court ruling injudgment of April 2011, the BBA’s subsequent decision not to appeal it and the consequent increase in actual claims levels. As a result, the provision has been revised to reflect the new information.
F-125
There are still a number of uncertainties as to the eventual costs from any such contact and/or redress given the inherent difficulties of assessing the impact of detailed implementation of the Policy Statement for all PPI complaints, uncertainties around the ultimate emergence period for complaints, the availability of supporting evidence and the activities of claims management companies, all of which will significantly affect complaints volumes, uphold rates and redress costs.revised.
In this context, in the first half of 2011 the Group recognized a provision, with a post-taxnet effect on results of €620 million (GBP538(GBP 538 million), which was calculated on the basis of anthe estimate of the number of claims that willwould be received, of the number of claims that willwould be upheld and of the estimated average amount of compensation in each case,case.
Following the payments made until December 31, 2013, the remaining provision recognized in line with what other UK banks had done.relation to PPI sales totaled GBP 165 million.
The following table shows information on the total claims received up to December 31, 2013 and the resolution thereof:
(number of claims, in thousands)
| 2013 | 2012 | 2011 | ||||||||||
Claims outstanding at the beginning of the period | 31 | 1 | — | |||||||||
Claims received | 363 | 437 | 111 | |||||||||
Claims rejected as being invalid(1) | (298 | ) | (258 | ) | (90 | ) | ||||||
Resolved claims(2) | (82 | ) | (149 | ) | (20 | ) | ||||||
|
|
|
|
|
| |||||||
Claims outstanding at the end of the period | 14 | 31 | 1 | |||||||||
|
|
|
|
|
| |||||||
Lanetro, S.A. (currently Zed Worldwide, S.A.): claim (ordinary lawsuit no. 558/2002) filed by Lanetro, S.A. against Banco Santander, S.A. at the Madrid Court of First Instance no. 34, requesting that the Bank comply with the obligation
| (1) | Includes rejected claims relating to customers that had never purchased payment protection insurance from Santander UK. |
| (2) | Customers are entitled to appeal to the Financial Ombudsman Service (FOS) if their claims are rejected. The FOS may uphold or reject an appeal and if an appeal is upheld, Santander UK is required to compensate the customer. The table shows the result of appeals relating to paid or rejected claims. |
The amount settled in relation to subscribe to €30.05 million of a capital increase at the plaintiff.paid claims in 2013 totaled GBP 217 million.
On December 16, 2003, a judgment was handed down dismissing the plaintiff’s request. The subsequent appeal filed by Lanetro, S.A. was upheld by a decisionmain cause of the Madrid Provincial Appellate Court on October 27, 2006.
In a decision handed down on March 30, 2010,increase in claims in 2011 was the Supreme Court dismissed an extraordinary appeal against procedural infringements and partly upheld a cassation appeal filed in both casesmedia coverage of this issue following the dismissal by the Bank against the decisionHigh Court of the Madrid Provincial Appellate Court.
Zed Worldwide, S.A. requested the court-ordered enforcement of the decision. On January 25, 2011, the court issued an order to enforce the decision handed down by the Madrid Provincial Appellate Court, whereby the Bank has to subscribe to 75.1 million shares at their par value of €0.4 per share, totaling €30.05 million. Zed Worldwide, S.A. filed an appeal for reconsideration of the order enforcing the decision, which the Bank opposed. On May 23, 2011, the Bank was served notice of the decision of May 6, 2011, dismissing the appeal for reconsiderationjudicial review filed by the British Bankers’ Association and upholding the orderlaunch of January 25, 2011. On July 14, 2011, Zed Worldwide, S.A. filedcampaigns by claim management companies in relation to these products.
There was also an appeal againstincrease in claims in 2012 due to greater media coverage of the decision dismissingissue, a rise in the previous appeal for reconsideration;activity of claims management companies and the proactive policy followed by Santander UK, which contacted over 300,000 customers directly.
Lastly, the number of claims received fell by 17% in this regard,2013 compared to 2012 and the Bank has duly appearedassociated costs also fell significantly, particularly in the last quarter of 2013.
The provision recognized at the end of 2013 represents the best estimate by Group management, taking into account the opinion of its advisers and filed a notice of opposition.the costs to be incurred in relation to any compensation that may result from the redress measures associated with the sales of payment protection insurance (PPI) in the UK. The provision was calculated on the basis of the following key assumptions resulting from judgments made by management:
These assumptions were based on the following information:
These assumptions are reviewed, updated and validated on a regular basis using the latest available information, such as, the number of claims received, the percentage of claims lost, the potential impact of any change in that percentage, etc. and any new evaluation of the estimated population.
Group management reviews the provision required at each relevant date, taking into account the latest available information on the aforementioned assumptions as well as past experience.
The most relevant factor for calculating the balance of the provision is the number of claims received as well as the expected level of future claims. The percentage of claims lost is calculated on the basis of the analysis of the sale process. The average cost of compensation is calculated in a reasonable manner as the Group manages a high volume of claims and the related population is homogenous.
The damages claimed are broken down as follows: (i) €18,428,076.43 relating to the value of the property auctioned; (ii) €32,608,895 relating to the loss of profit on the properties lost by the plaintiff, which was prevented from continuing its business activity as a property developer; and (iii) €360,000 relating to loss of rental income.
On March 2, 2010, the court of first instance handed down a decision partly upholding both the claim filed against the Bank and the counterclaim, ordering the Bank to pay the plaintiff €4,458,960.61, and Galesa to pay the Bank €1,428,075.70, which resulted in a net loss of €3,030,874.91 for the Bank. Two appeals against this decision were filed on May 31, 2010, one by Galesa and the other by the Bank.counterclaim. On November 11, 2010, the Alicante Provincial Appellate Court handed down a decision upholding the appeal filed by the Bank and dismissing the appeal brought by Galesa de Promociones, S.A., as a result of which and by way of offsetting the indemnity obligations payable by each party, the Bank became a creditor of Galesa in the amount €400,000.€0.4 million.
Galesa filed a cassation appeal with the Supreme Court against this decision, which was given leave to proceed in an order dated October 11, 2011, and the Bank submitted a notice of opposition.
F-126
Declaratory large claims action brought at the Madrid Court of First Instance no. 19 (case no. 87/2001) in connection with a claim filed by Inversión Hogar,de Promociones, S.A. against the Bank. This claim sought the termination of a settlement agreement entered into between the Bank and the plaintiff on December 11, 1992.
On May 19, 2006, a judgment was handed down at first instance, whereby the agreement was declared to be terminated and the Bank was ordered to pay €1.8 million, plus the related legal interest since February 1997, to return a property that was given in payment under the aforementioned agreement, to pay an additional €72.9 million relating to the replacement value of the assets foreclosed and subsequently sold by the Bank, and to pay all the related court costs. The Bank and Inversión Hogar, S.A. filed appeals against the judgment.
On July 30, 2007, the Madrid Provincial Appellate Court handed down a decision upholding in full the appeal filed by the Bank, reversing the judgment issued at first instance and dismissing the appeal filed by Inversión Hogar, S.A. On completion of the clarification procedure, Inversión Hogar, S.A. and its subsidiaries filed a cassation appeal against the aforementionedabove decision and an extraordinary appeal for procedural infringements at the Civil Division of theSupreme Court. The appeal was dismissed in a Supreme Court judgment dated July 17, 2013, against which issued an order on December 1, 2009, admitting for consideration the appealsappellant filed by Inversión Hogar S.A. and subsidiaries. On October 18, 2011, a judgment was handed down declaring that the appeals filed were not admissible. The appellants filed various applications for clarification of the judgment, challenges and a motion for annulment, which were dismissed.was rejected. The appellants have subsequently filed new requests and reconsideration appeals.Bank has not recognized a provision in this connection.
Claim in an ordinary proceeding filed by Inés Arias Domínguez and a further 17 persons against Santander Investment, S.A. at Madrid Court of First Instance no. 13 (case no. 928/2007), seeking damages of approximately €43 million, plus interest and costs. The plaintiffs, who were former shareholders of Yesocentro, S.A. (Yesos y Prefabricados del Centro, S.A.), alleged that Santander Investment, S.A. breached the advisory services agreement entered into on October 19, 1989 between the former Banco Santander de Negocios, S.A. and the plaintiffs, in relation to the sale of shares owned by the plaintiffs to another company called Invercámara, S.A. This claim was contested by Santander Investment, S.A. on November 5, 2007.
After the declaration of the stay of the proceeding based on civil prejudgement decreed by the ordinary court resolution dated September 11, 2008 which was confirmed by the County Court of Madrid resolution dated May 24, 2010, pre-trial hearing has taken place on the April 16, 2012.
After the Madrid Provincial Appellate Court had rendered null and void the award handed down in the previous arbitration proceeding, on September 8, 2011, Banco Santander, S.A. filed a new request for arbitration with the Secretary of the Spanish Arbitration Court against the business entity DELFORCADelforca 2008, Sociedad de Valores, S.A. (formerly Gaesco Bolsa Sociedad de Valores, S.A.), claiming €66,418,077.27€66 million that the latter owes Banco Santander, S.A.it as a result of the declaration on January 4, 2008 of the early termination by the Bank of all the financial transactions agreed upon between the parties.
On August 3, 2012, Delforca 2008, S.A. was declared to be in a position of voluntary insolvency by Barcelona Commercial Court no. 10, which had agreed as part of the financial transaction frameworkinsolvency proceeding to stay the arbitration proceeding and the effects of the arbitration agreement entered into by Banco Santander, S.A. and Delforca 2008, S.A. The Bank filed an appeal against this decision, which was dismissed and it then proceeded to prepare a challenge with a view to filing a future appeal. The Arbitration Court, in compliance with the aforementioned companydecision of the Commercial Court, agreed on January 20, 2013 to stay the arbitration proceedings at the stage reached at that date until a decision could be reached in this respect in the insolvency proceeding.
In addition, as part of the insolvency proceeding of Delforca 2008, S.A., Banco Santander, S.A. notified its claim against the insolvent party with a view to having the claim recognized as a contingent ordinary claim without specified amount. However, the insolvency manager opted to exclude Banco Santander, S.A.‘s claim from the provisional list of creditors and, accordingly, Banco Santander, S.A. filed an ancillary claim on which a decision has not yet been handed down. In this ancillary claim (still in progress), Delforca 2008, S.A. and the insolvency manager are seeking to obtain a decision from the Court on the merits of the dispute between Banco Santander, S.A. and Delforca 2008, S.A. and, accordingly, Banco Santander, S.A. has appealed against the interlocutory order that admitted for consideration the evidence proposed by them. The appeal was not given leave to proceed and Banco Santander has prepared the corresponding protest.
As part of the same insolvency proceeding, Delforca 2008, S.A. has filed another ancillary claim requesting the termination of the arbitration agreement included in the framework financial transactions agreement entered into by that party and Banco Santander, S.A. andin 1998, as well as the termination of the financial transactions performed underobligation that allegedly binds the agreement. This arbitrationinsolvent party to the High Council of Chambers of Commerce (Spanish Arbitration Court). Banco Santander, S.A. filed its reply to the complaint on June 21, 2013, although it has repeatedly questioned the court’s objective jurisdiction to hear the complaint, as has the High Council of Chambers of Commerce, Industry and Shipping. The Commercial Court dismissed the motions for declinatory exception filed by Banco Santander and also dismissed the motion for declinatory exception filed by the High Council. These decisions have been appealed.
On December 30, 2013, Banco Santander filed a complaint requesting the termination of the insolvency proceeding is currentlyof Delforca 2008, S.A. due to supervening disappearance of the alleged insolvency of the company.
In addition, in progress.
Additionally,April 2009 Mobilaria Monesa, S.L.S.A. (parent of the former Gaesco)Delforca 2008, S.A.) filed a claim against Banco Santander, S.A. at Santander Court of First Instance no. 5, reproducingclaiming damages which it says it incurred as a result of the claims discussed and resolved in the aforementioned arbitration proceeding, a circumstance which was brought to the Court’s attention in the notice of opposition thereto(in its opinion) unwarranted claim filed by the Bank.
Bank against its subsidiary, reproducing the same objections as Delforca 2008, S.A. This proceeding has currently been stayed on preliminary civil ruling grounds, against which Mobilaria Monesa, S.A. filed an appeal which was stayeddismissed by the SantanderCantabria Provincial Appellate Court in an ordera judgment dated December 20, 2010 due toJanuary 16, 2014.
Lastly, on April 11, 2012, Banco Santander, S.A. was notified of the Court admitting the preliminary civil ruling grounds claimedclaim filed by the Bank.
The above stay continues to be in effect due to an order dated October 11, 2011Delforca 2008, S.A., heard by SantanderMadrid Court of First Instance no. 5, based on21, in which it sought indemnification for the newdamage and losses it alleges it incurred due to the (in its opinion) unwarranted claim by the Bank. Delforca 2008, S.A. made the request in a counterclaim filed in the arbitration proceeding broughtthat concluded with the annulled award, putting the figure at up to €218 million, although in its present claim it invokes Article 219.3 of the Civil Procedure Law in order to leave for a subsequent proceeding the amount to be settled (as the case may be) by the Bank. The aforementioned Court has dismissed the motion for declinatory exception proposed by Banco Santander, S.A. An appeal was filed against this order by DELFORCA 2008, Sociedad de Valores S.A. atas the Santander Provincial Appellate Court.
F-127
Finally, by resolution stated by court order of first instance number 1 of Madrid,matter has been admitted an application –legal proceeding 398/2012, action-a-law suit DELFORCA 2008 against Banco Santander S.A.- in claim of an indeterminate sum,referred for the purpose of compensation of damages, derived from the performance of Banco Santander with regards to the declaration of the early termination od Financial Transaction Framework Agreement (CMOF) entered into between the above mentioned company and the Bank, as well as the financial transactions covered by the agreement. The Bank in the process of pleading against the said law suit.
arbitration. This decision is pending appeal. The Group considers that the risk of loss arising as a result of these matters is remote and, accordingly, it has not recognized any provisions in connection with these proceedings.
Former employees of Banco do Estado de São Paulo S.A., Santander Banespa, Cia. de Arrendamiento Mercantil: a claim was filed in 1998 by the association of retired Banespa employees (AFABESP) on behalf of its members, requesting the payment of a half-yearly bonus initially envisaged in the entity’s Bylaws in the event that the entity obtained a profit and that the distribution of this profit in the form of this bonus, were approved by the board of directors. The bonus was not paid in 1994 and 1995 since the bank did not make a profit and partial payments were made from 1996 to 2000, in variable percentages as agreed by the board of directors, and the relevant clause was eliminated from the Bylaws in 2001. In September 2005 theThe Regional LaborEmployment Court ordered Banco Santander Banespa, Cia. de Arrendamiento Mercantil (currently Banco Santander (Brasil) S.A.) to pay the half-yearly bonus and the bank subsequently lodged an appeal at the High Labor Court. A decision was handed down on June 25, 2008 which ordered the bank to pay thethis half-yearly bonus from 1996 onwards for a maximum amount equivalent toin September 2005 and the share inbank filed an appeal against the profits. Appeals against this decision were filed at the High LaborEmployment Court (“TST”) and, subsequently, at the Supreme Federal Court. The High Labor Court ordered the aforementioned half-yearly bonus to be paid. The Supreme Court (“STF”). The TST confirmed the judgment against the bank, whereas the STF rejected the extraordinary appeal filed by the bank in a decision adopted by only one of the Bank by a monocraticCourt members, thereby also upholding the order issued to the bank. This decision maintaining the earlier condemnation. Santander brought Regimental Appeal which awaits decisionwas appealed by the Supreme Court. The Regimental Appeal is an internalbank and the association. Only the appeal filedlodged by the bank has been given leave to proceed and will be decided upon by the STF in the Supreme Court itself, in order to refer the monocratic decision to a group of five ministers.
“Planos economicos”: Like the rest of the banking system, Santander BrasilBrazil has been the subject of claims from customers, mostly depositors, and of class actions brought for a common reason, by consumer protection associations and the public prosecutor’s office, among others, in connection with the possible effectsarising from a series of certain legislative changes relating to differences in the monetary adjustments to interest on bank deposits and other inflation-linked contracts (planos económicos)calculation of inflation (“planos economicos”). The plaintiffsclaimants considered that their vested rights in relation to the inflationary adjustments had been impaired due to the immediate application of these adjustments. In April 2010, the High Court of Justice (“STJ”) set the statute of limitationslimitation period for these class actions at five years, as claimed by the banks, rather than twenty years, as sought by the plaintiffs,claimants, which will probably significantly reduce the number of actions of this kind brought and the amounts claimed in this connection. As regards the substance of the matter, the decisions issued to date have been adverse for the banks, although two proceedings have been brought at the High Court of JusticeSTJ and the Supreme Federal Court (“STF”) with which the matter is expected to be definitively settled. In August 2010, the High Court of JusticeSTJ handed down a decision finding for the plaintiffs in terms of substance, but excluding one of the planos“planos” from the claim, thereby reducing the claimed amount thereof, and once again confirming the five-year statute of limitations period for these class actions.period. Shortly thereafter, the Supreme Federal CourtSTF issued an injunctive relief order whereby all the proceedings in progress in this connection were stayed until this court issues a final decision on the matter. Consequently, enforcementIn spite of the aforementioned decisionfact STF started the judgement on November 2013, a formal ruling has not been issued and there is no assurance of when a formal ruling will be handed down by either the High Court of Justice was also stayed.STJ or the STF.
Proceeding under Civil Procedure Law (case no. 1043/2009) conducted at Madrid Court of First Instance no. 26, following a claim brought by Banco Occidental de Descuento, Banco Universal, C.A. against the Bank for USD 150,000,000150 million in principal plus USD 4,656,1644.7 million in interest, upon alleged termination of an escrow contract. On October 7, 2010, the Bank was served notice of a decision dated October 1, 2010 which
The court upheld the claim filedbut did not make a specific pronouncement on costs. A judgment handed down by the Madrid Provincial Appellate Court on October 9, 2012 upheld the appeal lodged by the Bank and dismissed the appeal lodged by Banco Occidental de Descuento, Banco Universal, C.A. without a ruling being issued in relation to court costs. Both, dismissing the plaintiff and the defendant filed appeals to a superior court: the plaintiff in connection with the decision not to award costs and the Bank in connection with the restclaim. The dismissal of the decision. Both parties alsoclaim was confirmed in an ancillary order to the judgment dated December 28, 2012. An appeal was filed notices of oppositionat the Supreme Court by Banco Occidental de Descuento against the appeal filed by the other party, and appeared at theMadrid Provincial Appellate Court.
F-128
In addition, on March 29, 2011Court decision. The Bank has challenged the appeal. The Bank filed a notice of opposition against the specific measures provisionally enforcing the judgment. The Bank’s opposition to the aforementioned measures was upheldhas not recognized any provisions in a decision dated September 5, 2011.this connection.
On January 26, 2011, notice was served on the Bank of an ancillary insolvency claim to annul acts detrimental to the assets available to creditors as part of the voluntary insolvency proceedings of Mediterráneo Hispa Group, S.A. at the Murcia Commercial Court no. 2. The aim of the principal action is to request annulment of the application of the proceeds obtained by the company undergoing insolvency from an asset sale and purchase transaction involving €31,704,000€32 million in principal and €2,711,567.02€2.7 million in interest. On November 24, 2011, the hearing was held with the examination of the proposed evidence. On February 29, 2012,Upon completion of the hearing, it was resolved to conduct a final evidence was produced.
The bankruptcy of various Lehman Group companies was made public on September 15, 2008. Various customers of Santander Group were affected by this situation since they had invested in securities issued by Lehman or in other products which had such assets underlying the securities.
On November 12, 2008, the Group announced the implementation of a solution (which was of a strictly commercial, exceptional nature and did not imply any admission of mis-selling) for holders of oneAs of the products sold -Seguro Banif Estructurado- issued by the insurance company Axa Aurora Vida, which had as its underlying security a bond issued and guaranteed by Lehman.
The solution involved replacing the Lehman issuer risk with the issuer risk of Santander Group subsidiaries. The exchange period ended on December 23, 2008. As a result of the exchange, at 2008 year-end a loss of €46 million was recognized in the consolidated income statement (€33 million after tax).
In February 2009 the Group offered a similar solution to other customers affected by the Lehman bankruptcy. The costdate of this transaction, before tax, was €143 million (€100 million after tax), which were recognized in the consolidated income statement for 2008.
Certainreport, certain claims havehad been filed in relation to this matter. The Bank’s directors and its legal advisers consider that the various Lehman products were sold in accordance with the applicable legal regulations in force at the time of each sale or subscription and that the fact that the Group acted as intermediary didwould not give rise to any liability for it in relation to the insolvency of Lehman. Accordingly, the risk of loss is considered to be remote.remote and, as a result, the Group has not recognized any provisions in this connection.
The intervention, on the grounds of alleged fraud, of Bernard L. Madoff Investment Securities LLC (“Madoff Securities”) by the SECUS Securities and Exchange Commission (“SEC”) took place in December 2008. The exposure of customers of the Group through the subfund Optimal Strategic US Equity (“Optimal Strategic”) subfund was €2,330 million, of which €2,010 million related to institutional investors and international private banking customers, and the remaining €320 million were inmade up the investment portfolios of the Group’s private banking customers in Spain, who were qualifying investors.
On January 27, 2009, the Group announced its decision to offer a solution to those of its private banking customers who had invested in Optimal Strategic and had been affected by the alleged fraud. This solution, which was applied to the principal amount invested, net of redemptions, totaled €1,380 million. It consisted of a replacement of assets whereby the private banking customers could exchange their investments in Optimal Strategic US for preference shares to be issued by the Group for the aforementioned amount, with an annual coupon of 2% and a call option that could be exercised by the issuer in year ten. At December 31, 2008, the Group determined that these events had to be considered to be adjusting events after the reporting period, as defined in IAS 10.3, because they provided evidence of conditions that existed at the endAs of the reporting period and, therefore, taking into account IAS 37.14, it recognized the pre-tax costdate of this transaction for the Group (€500 million -€350 million after tax-) under Gains/Losses on financial assets and liabilities in the consolidated income statement for 2008.
The Group has at all times exercised due diligence in the management of its customers’ investments in the Optimal Strategic fund. These products have always been sold in a transparent way pursuant to applicable legislation and established procedures and, accordingly, the decision to offer a solution was taken in view of the exceptional circumstances attaching to this case and based on solely commercial reasons, due to the interest the Group has in maintaining its business relationship with these customers.
F-129
At the time of the intervention, Madoff Securities was a broker-dealer authorized, registered and supervised by the SEC and was also authorized as an investment advisor by the US Financial Industry Regulatory Authority. As the SEC itself has stated, Madoff Securities had been regularly inspected by the aforementioned supervisory body in recent years, and at no time was its reputation and solvency questioned by the market or by the US supervisory authorities.
On March 18, 2009, the Group issued the preference shares earmarked for the replacement of assets offered to the private banking customers affected by the intervention of Madoff Securities and those affected by the Lehman bankruptcy who were not able to participate in the exchange made on December 23, 2008 (referred to above). The preference shares have been listed on the London Stock Exchange since March 23, 2009. The level of acceptance of the exchange proposal was close to 97%.
On May 26, 2009, two funds managed by Optimal Investment Services, S.A. (“OIS”), an indirect subsidiary of Banco Santander, S.A., announced that they had entered into an agreement with Irving H. Picard, the court-appointed trustee for the liquidation of Madoff Securities. Under the agreement, the trustee allowed the funds’ claims in the liquidation proceeding and reduced his clawback demands on the funds by the amounts withdrawn by the latter from Madoff Securities, in the 90 days prior to bankruptcy, which US legislation allows him to claim, in exchange for the partial payment of those demands by the funds. The funds are Optimal Strategic U.S. Equity Limited and Optimal Arbitrage Limited. These are the only Optimal funds that had accounts at Madoff Securities.
Pursuant to the agreement, the funds’ claims against Madoff Securities’ estate were allowed in their full amounts, calculated on a cash-in, cash-out basis, of USD 1,540,141,277.60 and USD 9,807,768.40, respectively, and the funds were entitled to Securities Investor Protection Corporation advances of USD 500,000 each. The funds paid 85% of the clawback claims asserted by the trustee. The payments totaled USD 129,057,094.60 for Strategic U.S. Equity and USD 106,323,953.40 for Arbitrage.
The funds agreed not to file any other claims against Madoff Securities’ estate (in liquidation). The agreement also contains an “equal treatment” provision, so that if the trustee settled similar clawback claims for less than 85%, the funds would receive a rebate of a portion of their payments to make the percentages applied to the funds equal to those applied to other investors in comparable situations.
The agreement followed the trustee’s investigation of Optimal’s conduct in dealing with Madoff Securities, including a review of Optimal’s documents relating to its due diligence, in which the trustee concluded that its conduct did not provide grounds to assert any claim against the Optimal companies or any other entity of Santander Group (other than the clawback claims described above, which did not arise from any inappropriate conduct by the funds).
The agreement contains releases of all clawback and other claims the trustee may have against the funds for any matters arising out of the funds’ investments with Madoff Securities. The trustee’s release applies to all potential claims against other Optimal companies, Santander Group companies and their investors, directors, agents and employees who agree to release the trustee and the Madoff Securities estate (in liquidation), to the extent the claims arise out of the funds’ dealings with Madoff Securities. It also releases the funds from potential clawback liability for any other withdrawals made by them from Madoff Securities.
The agreement between the trustee and the aforementioned Optimal funds was approved by the United States Bankruptcy Court in New York on June 16, 2009.
Madoff Securities is currently in liquidation in accordance with the Securities Investor Protection Act of 1970 at the United States Bankruptcy Court in New York. Bernard L. Madoff, the chief executive of Madoff Securities, pleaded guilty to perpetrating what was probably the largest pyramid fraud in history and was sentenced to 150 years’ imprisonment.
In April 2011, by means of a corporate operation, the funds Optimal Multiadvisors Ltd / Optimal Strategic US Equity Series, Optimal Multiadvisors Ireland plc / Optimal Strategic US Equity Ireland Euro Fund and Optimal Multiadvisors Ireland plc / Optimal Strategic US Equity Ireland US Dollar Fund offered unitholders the possibility of voluntarily liquidating their units and shares in these funds in exchange for shares in a special purpose vehicle in the Bahamas (SPV Optimal SUS Ltd., the “SPV”) to which Optimal Strategic US Equity Ltd., the company through which the aforementioned funds held their assets, assigned in full the claim recognized by the trustee of the Madoff Securities liquidation, mentioned previously, the nominal amount of which totaled USD 1,540,141,277.60 and became part of the assets of the SPV.
F-130
This arrangement enabled the investors to take direct control of their proportional part of the claim against the insolvency estate of Madoff Securities and also enabled them to sell their claim directly or by means of a sales procedure through a private auction organized by OIS.
As a result of this transaction, 1,021 million shares of the 1,539 million issued by the SPV are now directly owned by the unitholders of the three aforementioned Optimal Strategic US Equity funds that accepted the exchange of their units in the fund for shares of the SPV. Furthermore, 991 million of those 1,021 million shares were sold in the subsequent private auction organized by OIS, while 30 million opted not to participate in the auction. The remaining fund unitholders decided to maintain their units in the funds and not participate in the transaction.
The price reached in the auction of the SPV shares was equal to 72.14% of the amount of the claim against Madoff Securities, which meant that those unitholders were able to recover approximately 35% of the value of their investment in the Optimal Strategic US Equity funds at October 30, 2008.
The Santander Group, as a unitholder of the Optimal Strategic US Equity funds, opted to accept the exchange and subsequent partial sale of a portion of its units in the funds, and it recognized in the 2011 income statement, as a result of the cash proceeds from that sale, a recovery of approximately €249 million of the initial loss.
At December 31, 2011, the Santander Group held an interest of approximately 20% in the SPV through the Optimal Strategic US Equity fund.
At the date hereof,report, certain claims havehad been filed in relation to this matter. The Group is currently assessing the appropriate legal action to be taken. As indicated above, the Group considers that it has at all times exercised due diligence and that these products have always been sold in a transparent way pursuant to applicable legislation and established procedures. Therefore, except for the three casesa specific case in which the decisions handed down partially upheld the claim based on the particular circumstances of these casesthat case (which havehas been appealed against by the Bank), no provisions were recognized for the other claims since the risk of loss is considered to be remote. Accordingly, the Group has not recognized any provisions in this connection.
On December 17, 2010,At the Bankend of New York Mellon Trust Company, National Association (“the Trustee”) filed a complaintfirst quarter of 2013, news stories were published stating that the public sector was debating the validity of the interest rate swaps arranged between various financial institutions and public sector companies in Portugal, particularly in the U.S. District Court for the Southern District of New York (the “NY Court”) solely as the trustee for the Trust for Preferred Income Equity Redeemable Securities (“PIERS”)public transport industry.
The swaps under an indenture dated September 1, 1999, as amended, against Santander Holdings USA, Inc. (formerly Sovereign Bancorp, Inc.) (“Sovereign”). The complaint asserts that the acquisition of Sovereigndebate included swaps arranged by Banco Santander Totta with the public companies Metropolitano de Lisboa, E.P.E. (MdL), Metro de Porto, S.A. (MdP), Sociedade de Transportes Colectivos do Porto, S.A. (STCP) and Companhia Carris de Ferro de Lisboa, S.A. (Carris). These swaps were arranged prior to 2008, i.e. before the start of the financial crisis, and had been executed without incident.
In view of this situation Banco Santander Totta took the initiative to request a court judgment on January 31, 2009 constituted a “changethe validity of control”the swaps in the jurisdiction of the United Kingdom to which the swaps are subject. The corresponding claims were filed in May 2013.
After the Bank had filed the claims, the four companies (MdL, MdP, STCP and Carris) notified Banco Santander Totta that they were suspending payment of the amounts owed under the Trust PIERS.
Ifswaps until a final decision had been handed down in the acquisition is deemed to constitute a “change of control”UK jurisdiction in accordance with the definitions applicable toproceedings. MdL, MdP and Carris suspended payment in September 2013 and STCP did the Trust PIERS, Sovereign would be obliged to pay a considerably higher interest rate on the Sovereign subordinated debentures heldsame in trust for the holderDecember 2013.
Consequently, Banco Santander Totta extended each of the Trust PIERSclaims to include the unpaid amounts.
On November 29, 2013, the companies presented their defences in which they claimed, namely, that the swaps were null and void under Portuguese law and, accordingly, that they should be refunded the principal amount of the debentures would accrete to USD 50 per debenture as of the effective date of the “change of control”. Under the Trust PIERS, no “change of control” occurs if, among other reasons, the consideration in the acquisition consisted of shares of common stock traded on a national securities exchange.amounts paid.
On February 14, 2014, Banco Santander S.A. issued American Depositary Shares (ADSs) in relationTotta presented its replies and defences to the acquisition that were traded on the New York Stock Exchange.
The increased rate in the event of a “change of control” is defined in the indenture as the greater of (i) 7.41% per annum; and (ii) the rate determined by a reference agent in accordance with a process established in the indenture.
There is no “change of control” under the Trust PIERS indenture, among other reasons, if the consideration for the acquisition consisted of shares of common stock listed on a national securities market. Banco Santander issued American Depositary Shares (ADSs) in relation to the acquisition that were traded and continue to be traded on the New York Stock Exchange.
The NY Court was asked to declare that the acquisition of Sovereign was a “change of control” under the Indenture and seeks damages equal to the interest that the complaint alleges, should have been paid by Sovereign to the Trust PIERS holders. On December 13, 2011, the NY Court issuedcounterclaims, restating its decision granting the Trustee’s motion for summary judgmentcase and denying the cross-motion filed by Sovereign. The NY Court ruled that the term “common stock” usedcompanies’ arguments, as set out in the “change of control” provision of the Indenture did not include ADSs and, therefore, a “change of control” had occurred. The NY Court referred the matter of the calculation of damages to a magistrate judge. This inquest on damages is unlikely to be concluded before June 2012. A final judgment that may be appealed will not enter until damages are determined.
F-131
At December 31, 2011, the Group had recognized provisions for the estimated amount of the contingency with third parties (USD 139 million), which includes the accrued interest at 7.410% from January 31, 2009 to December 31, 2011 and the value of accreting the debentures to par (USD 50). In its Application for Damages submitted on March 16, 2012, the Trustee claims that the reset rate under the Indenture should be 13.61%, which if accepted by the NY Court would increase the impact of the unfavorable outcome described above. The Trustee requests damages in excess of USD 277,707,040 for unpaid back interest (USD 277,707,040 representing unpaid back interest through March 12, 2012) plus approximately USD 2,000,000 in legal fees. The Group’s liability would be 40.53% of the total claim, percentage which represents the contingency with third parties.their November 29 defences.
On April 16, Sovereign4, 2014, the companies submitted a responsetheir replies to the Trustee’s Damages Application, arguing that the reset rate should bedefences to counterclaims. These proceedings are still in no event higher than 8.31%. The magistrate has yet to schedule a hearing as to damages. The Group continues to assert that the acquisition of Sovereign by Banco Santander did not constitute a “change of control” under the Trust PIERS Indenture and that the Trustee’s damages are exaggerated. Accordingly, Sovereign intends to appeal the NY Court’s finding that the acquisition was a “change of control” and the damages assessed, upon completion of the inquest and entry of a final judgment against Sovereign.progress.
The Bank and its subsidiarieslegal advisers consider that the Bank acted at all times in accordance with applicable legislation and under the terms of the swaps, and take the view that the UK courts will confirm the full validity and effectiveness of the swaps. As a result, the Bank has not recognized any provisions in connection with this matter.
The Bank and the other Group companies are from time to time subject to certain claims and, partiestherefore, are party to certain legal proceedings incidental to the normal course of itstheir business including(including those in connection with the Group’s lending activities, relationships with the Group’s employees and other commercial or tax matters.matters).
Uncertainties exist about whatIn this context, it must be considered that the eventual outcome of these pending matters will be, whatcourt proceedings is uncertain, particularly in the timingcase of the ultimate resolution of these matters will be or what the eventual loss, fines or penalties related to each pending matter may be particularly where the claimants seek veryclaims for large or indeterminate damages, or where the cases present novelamounts, those based on legal theories, involveissues for which there are no precedents, those that affect a large number of parties or are in early stages of discovery.those at a very preliminary stage.
Considering allWith the information available information,to it, the Bank believesGroup considers that at December 31, 2013, 2012 and 2011, 2010 and 2009 year-end the Groupit had reliably estimated the obligation related toobligations associated with each proceeding and had recognized, adequatewhere necessary, sufficient provisions when required, thatto cover reasonably cover theany liabilities that mightmay arise fromas a result of these tax-relatedtax and non-tax-related proceedings andlegal situations. It also believes that liabilities related toany liability arising from such claims and proceedings shouldwill not have, in the aggregate,overall, a material adverse effect on the Group’s business, financial condition,position or results of operations.
The total amount of payments made by the Group arising from litigation in 2011, 2010 and 2009 is not material with respect to these consolidated financial statements.
| 26. | Other liabilities |
The detail of Other liabilities in the consolidated balance sheets is as follows:
| Millions of euros | ||||||||||||||||||||||||
| Millions of euros | 2013 | 2012 | 2011 | |||||||||||||||||||||
| 2011 | 2010 | 2009 | ||||||||||||||||||||||
Transactions in transit | 866 | 321 | 326 | 505 | 784 | 866 | ||||||||||||||||||
Accrued expenses and deferred income | 5,413 | 4,891 | 5,439 | 5,004 | 5,124 | 5,413 | ||||||||||||||||||
Other | 3,237 | 2,388 | 1,860 | 2,774 | 2,054 | 3,237 | ||||||||||||||||||
|
|
|
|
|
| |||||||||||||||||||
| 9,516 | 7,600 | 7,625 | 8,283 | 7,962 | 9,516 | |||||||||||||||||||
|
|
|
|
|
| |||||||||||||||||||
| 27. | Tax matters |
| a) | Consolidated Tax Group |
Pursuant to current legislation, the Consolidated Tax Group includes Banco Santander, S.A. (as the Parent) and the Spanish subsidiaries that meet the requirements provided for in Spanish legislation regulating the taxation of the consolidated profits of corporate groups (as the controlled entities).
The other Group companies file income tax returns in accordance with the tax regulations applicable to them.
F-132
| b) | Years open for review by the tax authorities |
At December 31, 2011,2013, the Consolidated Tax Group had the years from 2005 to 20112013 open for review in relation to the main taxes applicable to it.
The other entities have the corresponding years open for review, pursuant to their respective tax regulations.
The tax audit of 2003 and 2004 for the main taxes applicable to the Consolidated Tax Group was completed in April 2010. Most of the tax assessments issued were signed on a contested basis.
In 20112013 there were no developments with a significant impact in connection with the tax disputes at various instances which were pending resolution at December 31, 2010.2012.
Because of the possible different interpretations which can be made of the tax regulations, the outcome of the tax audits of the years reviewed and of the open years might give rise to contingent tax liabilities which cannot be objectively quantified. However, the Group’s tax advisers consider that it is unlikely that such contingent liabilities will become actual liabilities, and that in any event the tax charge which might arise therefrom would not materially affect the consolidated financial statements of the Group.
| c) | Reconciliation |
The reconciliation of the income tax expense calculated at the domestic tax rate applicable in Spain (30%) to the income tax expense recognized and the detail of the effective tax rate are as follows:
| Millions of Euros | Millions of euros | |||||||||||||||||||||||
| 2011 | 2010 | 2009 | 2013 | 2012 | 2011 | |||||||||||||||||||
Consolidated profit before tax: | ||||||||||||||||||||||||
Consolidated operating profit (loss) before tax: | ||||||||||||||||||||||||
From continuing operations | 7,939 | 12,052 | 10,588 | 7,652 | 3,583 | 7,858 | ||||||||||||||||||
From discontinued operations | (23 | ) | (25 | ) | 46 | (18 | ) | 99 | 32 | |||||||||||||||
|
|
|
|
|
| |||||||||||||||||||
| 7,916 | 12,027 | 10,634 | 7,634 | 3,682 | 7,890 | |||||||||||||||||||
|
|
|
|
|
| |||||||||||||||||||
Taxation at Spain corporation tax rate (30%) | 2,375 | 3,608 | 3,190 | |||||||||||||||||||||
Effect of taxing foreign jurisdictions results at different statutory | 390 | 270 | 102 | |||||||||||||||||||||
Of which, from | ||||||||||||||||||||||||
Income tax at tax rate applicable in Spain (30%) | 2,290 | 1,105 | 2,367 | |||||||||||||||||||||
Effect of application of the various tax rates applicable in each country(*) | 96 | 170 | 390 | |||||||||||||||||||||
Of which: | ||||||||||||||||||||||||
Brazil | 390 | 441 | 278 | 304 | 318 | 390 | ||||||||||||||||||
United Kingdom | (52 | ) | (52 | ) | (40 | ) | (90 | ) | (96 | ) | (52 | ) | ||||||||||||
United States of America | 113 | 64 | 2 | |||||||||||||||||||||
United States | 37 | 43 | 113 | |||||||||||||||||||||
Chile | (112 | ) | (129 | ) | (102 | ) | (105 | ) | (108 | ) | (112 | ) | ||||||||||||
Effect of profit on associates and joint ventures | (17 | ) | (5 | ) | — | |||||||||||||||||||
Tax impact of intra-group transfer of subsidiary (1) | — | — | (450 | ) | ||||||||||||||||||||
Gains not subject to tax (2) | (262 | ) | — | (728 | ) | |||||||||||||||||||
Tax deduction in Brazil of its local goodwill | (534 | ) | (626 | ) | (551 | ) | ||||||||||||||||||
Local tax effect of transactions eliminated in the consolidation process | (268 | ) | (304 | ) | (299 | ) | ||||||||||||||||||
Effect of profit or loss of associates and jointly controlled entities | (153 | ) | (128 | ) | (17 | ) | ||||||||||||||||||
Effect of gains not subject to taxation(1) | (61 | ) | (186 | ) | (262 | ) | ||||||||||||||||||
Effect of deduction of goodwill in Brazil | (274 | ) | (414 | ) | (414 | ) | ||||||||||||||||||
Tax effect on local books of transactions eliminated on consolidation | (42 | ) | (86 | ) | (188 | ) | ||||||||||||||||||
Permanent differences | 93 | (18 | ) | (42 | ) | 254 | 158 | (104 | ) | |||||||||||||||
|
|
|
|
|
| |||||||||||||||||||
Current income tax | 1,777 | 2,925 | 1,222 | 2,110 | 619 | 1,772 | ||||||||||||||||||
|
|
| ||||||||||||||||||||||
|
|
| ||||||||||||||||||||||
Effective tax rate | 22.45 | % | 24.32 | % | 11.49 | % | 27.64 | % | 16.82 | % | 22.46 | % | ||||||||||||
Of which: | ||||||||||||||||||||||||
Continuing operations | 1,776 | 2,923 | 1,207 | 2,113 | 590 | 1,755 | ||||||||||||||||||
Discontinued operations | 1 | 2 | 15 | |||||||||||||||||||||
Discontinued operations (Note 37) | (3 | ) | 29 | 17 | ||||||||||||||||||||
Of which: | ||||||||||||||||||||||||
Current tax | 3,211 | 2,610 | 2,082 | 3,511 | 3,066 | 3,206 | ||||||||||||||||||
Deferred taxes | (1,434 | ) | 315 | (860 | ) | (1,401 | ) | (2,447 | ) | (1,434 | ) | |||||||||||||
Taxes paid in the year | 1,924 | 2,078 | 1,527 | 3,577 | 3,162 | 1,924 | ||||||||||||||||||
| (1) | Tax effect |
F-133
| d) | Tax recognized in equity |
In addition to the income tax recognized in the consolidated income statement, the Group recognized the following amounts in consolidated equity:equity in 2013, 2012 and 2011:
| Millions of euros | ||||||||||||||||||||||||
| Millions of euros | 2013 | 2012 | 2011 | |||||||||||||||||||||
| 2011 | 2010 | 2009 | ||||||||||||||||||||||
Net tax credited (charged) to equity: | ||||||||||||||||||||||||
Measurement of available-for-sale fixed-income securities | 396 | 387 | (373 | ) | 162 | (283 | ) | 9 | ||||||||||||||||
Measurement of available-for-sale equity securities | 51 | 134 | 35 | (51 | ) | (64 | ) | (83 | ) | |||||||||||||||
Measurement of cash flow hedges | 69 | 70 | 106 | (38 | ) | 23 | (1 | ) | ||||||||||||||||
Actuarial gains (losses) | (331 | ) | 538 | 326 | ||||||||||||||||||||
Measurement of entities accounted for using the equity method | 4 | — | — | 39 | (15 | ) | 4 | |||||||||||||||||
|
|
|
|
|
| |||||||||||||||||||
| 520 | 591 | (232 | ) | (219 | ) | 199 | 255 | |||||||||||||||||
|
|
|
|
|
| |||||||||||||||||||
| e) | Deferred taxes |
Tax assets in the consolidated balance sheets includes debit balances with the Spanish Public Treasury relating to deferred tax assets. Tax liabilities includes the liability for the Group’s various deferred tax liabilities.
On June 26, 2013, the Basel III legal framework was included in European law through Directive 2013/36 (CRD IV) and Regulation 575/2013 on prudential requirements for credit institutions and investment firms (CRR), directly applicable in every Member State as from January 1, 2014, albeit with a gradual timetable with respect to the application of, and compliance with, various requirements.
This new legislation establishes that deferred tax assets, the use of which relies on future profits being obtained, must be deducted from regulatory capital.
In this regard, pursuant to Basel III, in recent years several countries have amended their tax regimes with respect to certain deferred tax assets so that they may continue to be considered regulatory capital since their use does not rely on the future profits of the entities that generate them (referred to hereinafter as “monetisable tax assets”).
Italy had a very similar regime to that described above, which was introduced by Decree-Law no. 225, of December 29, 2010, and amended by Law no. 10, of February 26, 2011.
In addition, in 2013 in Brazil, by means of Provisional Measure no. 608, of February 28, 2013 and, in Spain, through Royal Decree-Law 14/2013, of November 29, tax regimes were established whereby certain deferred tax assets (arising from credit loss provisions in Brazil and credit loss provisions, provisions for foreclosed assets and pension and pre-retirement obligations in Spain), may be converted into tax receivables in specific circumstances. As a result, their use does not rely on the entities obtaining future profits and, accordingly, they are exempt from deduction from regulatory capital.
The detail of Tax assets—Deferreddeferred tax assets, by classification as monetisable or non-monetisable assets, and Tax liabilities—Deferredof deferred tax liabilities at December 31, 2013 is as follows:
| Millions of euros | ||||||||||||
| 2011 | 2010 | 2009 | ||||||||||
Tax assets: | 17,761 | 17,089 | 15,827 | |||||||||
Of which: | ||||||||||||
Banco Santander (Brasil) S.A. | 4,138 | 3,572 | 3,410 | |||||||||
Santander Holdings USA, Inc. | 1,506 | 1,933 | 1,925 | |||||||||
Santander UK Group | 431 | 656 | 909 | |||||||||
Pre-retirements | 866 | 887 | 989 | |||||||||
Other pensions | 692 | 806 | 910 | |||||||||
Valuation adjustments | 1,017 | 1,265 | 602 | |||||||||
Tax liabilities: | 3,073 | 4,312 | 3,667 | |||||||||
Of which: | ||||||||||||
Banco Santander (Brasil) S.A. | 458 | 626 | 553 | |||||||||
Santander UK Group | 268 | 409 | 405 | |||||||||
Banco Santander (México), S.A., Institución de Banca Múltiple, Grupo Financiero Santander | 121 | 275 | 65 | |||||||||
Santander Holdings USA, Inc. | 120 | 128 | 107 | |||||||||
Santander Consumer Bank AG | 102 | 85 | 92 | |||||||||
Valuation adjustments | 547 | 678 | 744 | |||||||||
F-134
The detail of the deferred tax assets and liabilities at December 31, 2011, on the basis of their expected recovery/payment, is as follows:
| Millions of euros | ||||||||||||||||
| 2013 | 2012 | 2011 | ||||||||||||||
| Monetisable (*) | Other | |||||||||||||||
Tax assets: | 7,902 | 13,166 | 20,942 | 18,455 | ||||||||||||
Tax losses and tax credits | — | 5,523 | 7,643 | 5,862 | ||||||||||||
Temporary differences | 7,902 | 7,643 | 13,299 | 12,593 | ||||||||||||
Of which: | ||||||||||||||||
Non-deductible provisions | — | 2,365 | 2,353 | 2,212 | ||||||||||||
Valuation of financial instruments | — | 1,213 | 1,700 | 1,715 | ||||||||||||
Credit losses | 3,989 | 920 | 3,341 | 2,609 | ||||||||||||
Pensions | 3,286 | 553 | 2,897 | 2,482 | ||||||||||||
Valuation of tangible and intangible assets | 627 | 522 | 731 | 1,075 | ||||||||||||
Tax liabilities: | — | 1,825 | 2,603 | 2,865 | ||||||||||||
Temporary differences | — | 1,825 | 2,603 | 2,865 | ||||||||||||
Of which: | ||||||||||||||||
Valuation of financial instruments | — | 729 | 1,314 | 934 | ||||||||||||
Leasing | — | 461 | 760 | 1,094 | ||||||||||||
| (*) | ||||
| ||||
| ||||
| ||||
| ||||
| ||||
| Not deducted from regulatory capital | ||||
The changes in Tax Assets—assets - Deferred and Tax Liabilities—liabilities - Deferred in the last three years were as follows:
| Millions of euros | ||||||||||||||||||||||||||||||||||||||||||||||||
| Millions of euros | Balances at December 31, 2012 | (Charge)/ Credit to income | Foreign currency balance translation differences and other items | (Charge)/ Credit to asset and liability valuation adjustments | Acquisitions for the year (net) | Balances at December 31, 2013 | ||||||||||||||||||||||||||||||||||||||||||
| Balances at December 31, 2010 | (Charge)/ credit to income | Foreign currency balance translation differences and other items | (Charge)/ Credit to asset and liability revaluation reserve | Acquisitions for the year (net) | Balances at December 31, 2011 | |||||||||||||||||||||||||||||||||||||||||||
Deferred tax assets | 17,089 | 1,081 | (198 | ) | (17 | ) | (194 | ) | 17,761 | 20,942 | 1,236 | (494 | ) | (616 | ) | — | 21,068 | |||||||||||||||||||||||||||||||
Deferred tax liabilities | (4,312 | ) | 353 | 784 | 103 | (1 | ) | (3,073 | ) | (2,603 | ) | 165 | 259 | 361 | (7 | ) | (1,825 | ) | ||||||||||||||||||||||||||||||
|
|
|
|
|
|
|
|
|
|
|
| |||||||||||||||||||||||||||||||||||||
| 12,777 | 1,434 | 586 | 86 | (195 | ) | 14,688 | 18,339 | 1,401 | (235 | ) | (255 | ) | (7 | ) | 19,243 | |||||||||||||||||||||||||||||||||
|
|
|
|
|
|
|
|
|
|
|
| |||||||||||||||||||||||||||||||||||||
Deferred tax assets Deferred tax liabilities Millions of euros Balances at
December 31,
2011 (Charge)/
Credit to
income Foreign
currency
balance
translation
differences
and other
items (Charge)/
Credit to asset
and liability
valuation
adjustments Acquisitions
for the year
(net) Balances at
December 31,
2012 18,455 2,211 (28 ) 326 (22 ) 20,942 (2,865 ) 236 197 (201 ) 30 (2,603 ) 15,590 2,447 169 125 8 18,339
| Millions of euros | ||||||||||||||||||||||||||||||||||||||||||||||||
| Millions of euros | Balances at December 31, 2010 | (Charge)/ Credit to income | Foreign currency balance translation differences and other items | (Charge)/ Credit to asset and liability valuation adjustments | Acquisitions for the year (net) | Balances at December 31, 2011 | ||||||||||||||||||||||||||||||||||||||||||
| Balances at December 31, 2009 | (Charge)/ Credit to income | Foreign currency balance translation differences and other items | (Charge)/ Credit to asset and liability revaluation reserve | Acquisitions for the year (net) | Balances at December 31, 2010 | |||||||||||||||||||||||||||||||||||||||||||
Deferred tax assets | 15,827 | 72 | 882 | 233 | 75 | 17,089 | 17,467 | 1,081 | (198 | ) | 299 | (194 | ) | 18,455 | ||||||||||||||||||||||||||||||||||
Deferred tax liabilities | (3,667 | ) | (387 | ) | (381 | ) | 122 | 1 | (4,312 | ) | (4,113 | ) | 353 | 784 | 112 | (1 | ) | (2,865 | ) | |||||||||||||||||||||||||||||
|
|
|
|
|
|
|
|
|
|
|
| |||||||||||||||||||||||||||||||||||||
| 12,160 | (315 | ) | 501 | 355 | 76 | 12,777 | 13,354 | 1,434 | 586 | 411 | (195 | ) | 15,590 | |||||||||||||||||||||||||||||||||||
|
|
|
|
|
|
|
|
|
|
|
| |||||||||||||||||||||||||||||||||||||
| Millions of euros | ||||||||||||||||||||||||
| Balances at December 31, 2008 | (Charge)/ Credit to income | Foreign currency balance translation differences and other items | (Charge)/ Credit to asset and liability revaluation reserve | Acquisitions for the year (net) | Balances at December 31, 2009 | |||||||||||||||||||
Deferred tax assets | 14,644 | 895 | (1,736 | ) | (165 | ) | 2,189 | 15,827 | ||||||||||||||||
Deferred tax liabilities | (3,464 | ) | (35 | ) | 246 | (307 | ) | (107 | ) | (3,667 | ) | |||||||||||||
|
|
|
|
|
|
|
|
|
|
|
| |||||||||||||
| 11,180 | 860 | (1,490 | ) | (472 | ) | 2,082 | 12,160 | |||||||||||||||||
|
|
|
|
|
|
|
|
|
|
|
| |||||||||||||
F-135
| f) | Other |
In conformity with the Listing Rules Instrument 2005 published by the UK Financial ServicesConduct Authority, it is hereby stated that shareholders of the Bank resident in the United Kingdom will be entitled to a tax credit in respect of the withholdings the Bank is required to make from the dividends to be paid to them. The shareholders of the Bank resident in the United Kingdom who hold their ownership interest in the Bank through Santander Nominee Service will be informed directly of the amount thus withheld and of any other data they may require to complete their tax returns in the United Kingdom. The other shareholders of the Bank resident in the United Kingdom should contact their bank or securities broker.
| 28. | Non-controlling interests |
Non-controlling interests include the net amount of the equity of subsidiaries attributable to equity instruments that do not belong, directly or indirectly, to the Bank, including the portion attributed to them of profit for the year.
| a) | Breakdown |
The detail, by Group company, of Equity—Equity - Non-controlling interests is as follows:
| Millions of euros | ||||||||||||
| 2011 | 2010 | 2009 | ||||||||||
Banco Santander (Brasil) S.A. | 3,606 | 3,557 | 2,571 | |||||||||
Banco Santander — Chile | 916 | 512 | 383 | |||||||||
Banesto | 573 | 504 | 555 | |||||||||
Grupo Financiero Santander, S.A. B de C.V. | 5 | 6 | 787 | |||||||||
Santander BanCorp | — | — | 35 | |||||||||
Other companies | 557 | 397 | 402 | |||||||||
|
|
|
|
|
| |||||||
| 5,657 | 4,976 | 4,733 | ||||||||||
|
|
|
|
|
| |||||||
Profit for the year attributable to non-controlling interests | 788 | 921 | 470 | |||||||||
Of which: | ||||||||||||
Banco Santander (Brasil) S.A. | 517 | 539 | 114 | |||||||||
Banco Santander—Chile | 183 | 175 | 135 | |||||||||
Banesto | 3 | 57 | 27 | |||||||||
Grupo Financiero Santander, S.A. B de C.V. | 2 | 130 | 160 | |||||||||
Santander BanCorp | — | 2 | 3 | |||||||||
Other companies | 83 | 18 | 31 | |||||||||
|
|
|
|
|
| |||||||
| 6,445 | 5,897 | 5,203 | ||||||||||
|
|
|
|
|
| |||||||
| Millions of euros | ||||||||||||
| 2013 | 2012 | 2011 | ||||||||||
Banco Santander (Brasil), S.A. | 4,292 | 4,920 | 3,525 | |||||||||
Bank Zachodni WBK S.A. | 1,372 | 168 | 62 | |||||||||
Grupo Financiero Santander México, S.A.B. de C.V. | 978 | 1,296 | 5 | |||||||||
Banco Santander - Chile | 950 | 1,027 | 916 | |||||||||
Banesto | — | 627 | 559 | |||||||||
Other companies | 568 | 609 | 499 | |||||||||
|
|
|
|
|
| |||||||
| 8,160 | 8,647 | 5,566 | ||||||||||
|
|
|
|
|
| |||||||
Profit/(Loss) for the year attributable to non-controlling interests | 1,154 | 768 | 788 | |||||||||
Of which: | ||||||||||||
Banco Santander (Brasil), S.A. | 494 | 585 | 516 | |||||||||
Banco Santander - Chile | 221 | 208 | 183 | |||||||||
Grupo Financiero Santander México, S.A.B. de C.V. | 251 | 59 | 2 | |||||||||
Bank Zachodni WBK S.A. | 123 | 13 | 8 | |||||||||
Banesto | — | (138 | ) | 3 | ||||||||
Other companies | 65 | 41 | 76 | |||||||||
|
|
|
|
|
| |||||||
| 9,314 | 9,415 | 6,354 | ||||||||||
|
|
|
|
|
| |||||||
F-136
| b) | Changes |
The changes in Non-controlling interests are summarisedsummarized as follows:
| Millions of euros | ||||||||||||||||||||||||
| Millions of euros | 2013 | 2012 | 2011 | |||||||||||||||||||||
| 2011 | 2010 | 2009 | ||||||||||||||||||||||
Balance at beginning of year | 5,897 | 5,203 | 2,415 | 9,415 | 6,354 | 5,860 | ||||||||||||||||||
Changes in scope of consolidation (*) | 132 | 105 | 27 | |||||||||||||||||||||
Banesto Group merger (Note 3) | (455 | ) | — | — | ||||||||||||||||||||
Changes in scope of consolidation | 199 | 27 | 132 | |||||||||||||||||||||
Change in proportion of ownership interest | 405 | (731 | ) | (1 | ) | 925 | 3,337 | 405 | ||||||||||||||||
Dividends paid to non-controlling interests | (747 | ) | (409 | ) | (431 | ) | ||||||||||||||||||
Changes in capital and other items | 57 | (10 | ) | 57 | ||||||||||||||||||||
Profit for the year attributable to non-controlling interests | 1,154 | 768 | 788 | |||||||||||||||||||||
Valuation adjustments (including exchange differences) | (403 | ) | 793 | 416 | (1,234 | ) | (652 | ) | (457 | ) | ||||||||||||||
Dividends paid to non-controlling interests | (431 | ) | (400 | ) | (233 | ) | ||||||||||||||||||
Changes in capital (**) and other items | 57 | 6 | 2,109 | |||||||||||||||||||||
Profit for the year attributable to non-controlling interests | 788 | 921 | 470 | |||||||||||||||||||||
|
|
|
|
|
| |||||||||||||||||||
Balance at end of year | 6,445 | 5,897 | 5,203 | 9,314 | 9,415 | 6,354 | ||||||||||||||||||
|
|
|
|
|
| |||||||||||||||||||
As described in Note 3, in 2010 the Bank acquired non-controlling interests previously held by third parties in Grupo Financiero Santander, S.A. de C.V. and Santander BanCorp, which led to a total reduction of EUR 1,223 million in the balance of Non-controlling interests. Also, in the third quarter of 2010 the Group sold 2.616% of Banco Santander (Brasil) S.A.’s share capital. The selling price amounted to EUR 867 million, which gave rise to increases of EUR 162 million in Reserves and EUR 790 million in Non-controlling interests, and a decrease of EUR 85 million in Valuation adjustments—Exchange differences.
In addition, as described in Note 3, in 2011 the Group sold 9.72% of the share capital of Banco Santander—Santander - Chile. The selling price amounted to USD 1,241 million, which gave rise to increases of EUR 434 million in Reserves and EUR 373 million in Non-controlling interests.
Also, as indicated in Note 3, in 2012 the Group sold 24.9% of its ownership interest in Grupo Financiero Santander México, S.A.B. de C.V., thus giving rise to an increase of EUR 1,092 million in Reserves, EUR 1,493 million in Non-controlling interests and EUR 263 million in Valuation adjustments - Exchange differences.
In January and March 2012 the Group transferred shares accounting for 4.41% and 0.77% of Banco Santander (Brasil) S.A. to two leading international financial institutions, generating an increase in the balance of Non-controlling interests of EUR 1,532 million (see Note 34).
Lastly, in 2013 the Group reduced its ownership interest in Bank Zachodni WBK S.A. to 70%, thereby generating an increase in the balance of Non-controlling interests of EUR 1,329 million (see Note 3).
The foregoing changes are shown in the consolidated statement of changes in total equity.
| c) | Other information |
The financial information on the subsidiaries with significant non-controlling interests at December 31, 2013 is summarized below:
| Millions of euros (*) | ||||||||||||||||
| Banco Santander (Brazil) | Banco Santander (Chile) | Grupo Financiero Santander (Mexico) | Bank Zachodni WBK | |||||||||||||
Total assets | 133,925 | 38,553 | 48,398 | 25,106 | ||||||||||||
Total liabilities | 122,383 | 36,431 | 45,584 | 23,230 | ||||||||||||
|
|
|
|
|
|
|
| |||||||||
Net assets | 11,542 | 2,122 | 2,814 | 1,876 | ||||||||||||
|
|
|
|
|
|
|
| |||||||||
Total income | 13,565 | 2,261 | 3,040 | 1,331 | ||||||||||||
|
|
|
|
|
|
|
| |||||||||
Total profit | 2,044 | 624 | 936 | 447 | ||||||||||||
|
|
|
|
|
|
|
| |||||||||
| (*) | Information prepared in accordance with the segment reporting criteria described in Note 52 and, therefore, it does not coincide with the information published separately by each entity. |
| 29. | Valuation adjustments |
The balances of Valuation adjustments include the amounts, net of the related tax effect, of the adjustments to assets and liabilities recognized temporarily in equity through the consolidated statement of recognized income and expense until they are extinguished or realised, when they are recognized definitively as shareholders’ equity through the consolidated income statement.expense. The amounts arising from subsidiaries and jointly controlled entities are presented, on a line by line basis, in the appropriate items according to their nature.
It should be noted that the consolidated statement of recognized income and expense presents items separately according to their nature, grouping together those which, pursuant to the applicable accounting standards, will not be subsequently reclassified to profit or loss when the requirements established by the related accounting standards are met. Also, with respect to items that may be reclassified to profit or loss, the consolidated statement of recognized income and expense includes the changes toin Valuation adjustments as follows:
Revaluation gains (losses): includes the amount of the income, net of the expenses incurred in the year, recognized directly in equity. The amounts recognized in equity in the year remain under this item, even if in the same year they are transferred to the income statement or to the initial carrying amount of the assets or liabilities or are reclassified to another line item.
Amounts transferred to income statement: includes the amount of the revaluation gains and losses previously recognized in equity, even in the same year, which are recognized in the income statement.
F-137
Amounts transferred to initial carrying amount of hedged items: includes the amount of the revaluation gains and losses previously recognized in equity, even in the same year, which are recognized in the initial carrying amount of assets or liabilities as a result of cash flow hedges.
Other reclassifications: includes the amount of the transfers made in the year between the various valuation adjustment items.
The amounts of these items are recognized gross, including the amount of the valuation adjustments relating to non-controlling interests, and the corresponding tax effect is presented under a separate item, except in the case of entities accounted for using the equity method, the amounts for which are presented net of the tax effect.
| a) | Available-for-sale financial assets |
Valuation adjustments—adjustments - Available-for-sale financial assets includes the net amount of unrealisedunrealized changes in the fair value of assets classified as available-for-sale financial assets (see Notes 7 and 8).
F-138
The breakdown, by type of instrument and geographical origin of the issuer, of Valuation adjustments—adjustments - Available-for-sale financial assets at December 31, 20112013, 2012 and 20102011 is as follows:
| Millions of euros | ||||||||||||||||||||||||||||||||||||||||||||||||||||||||||||||||||||||||||||||||||||||||||||||||
| Millions of euros | December 31, 2013 | December 31, 2012 | December 31, 2011 | |||||||||||||||||||||||||||||||||||||||||||||||||||||||||||||||||||||||||||||||||||||||||||||
| December 31, 2011 | December 31, 2010 | December 31, 2009 | Revaluation gains | Revaluation losses | Net revaluation gains/ (losses) | Fair value | Revaluation gains | Revaluation losses | Net revaluation gains/ (losses) | Fair value | Revaluation gains | Revaluation losses | Net revaluation gains/ (losses) | Fair value | ||||||||||||||||||||||||||||||||||||||||||||||||||||||||||||||||||||||||||||||||||
| Revaluation gains | Revaluation losses | Net revaluation gains/ (losses) | Fair value | Revaluation gains | Revaluation losses | Net revaluation gains/ (losses) | Fair value | Revaluation gains | Revaluation losses | Net revaluation gains/ (losses) | Fair value | |||||||||||||||||||||||||||||||||||||||||||||||||||||||||||||||||||||||||||||||||||||
Debt instruments | ||||||||||||||||||||||||||||||||||||||||||||||||||||||||||||||||||||||||||||||||||||||||||||||||
Government debt securities and debt instruments issued by central banks | ||||||||||||||||||||||||||||||||||||||||||||||||||||||||||||||||||||||||||||||||||||||||||||||||
Spain | 125 | (1,175 | ) | (1,050 | ) | 29,976 | 272 | (1,797 | ) | (1,525 | ) | 27,050 | 250 | (10 | ) | 240 | 28,208 | 356 | (496 | ) | (140 | ) | 25,664 | 68 | (1,286 | ) | (1,218 | ) | 29,288 | 125 | (1,175 | ) | (1,050 | ) | 29,976 | |||||||||||||||||||||||||||||||||||||||||||||||||||||||||||||
Rest of Europe | 18 | (507 | ) | (489 | ) | 4,959 | 19 | (229 | ) | (210 | ) | 3,871 | 17 | (4 | ) | 13 | 3,996 | 28 | (143 | ) | (115 | ) | 12,080 | 112 | (179 | ) | (66 | ) | 10,891 | 18 | (507 | ) | (489 | ) | 4,959 | |||||||||||||||||||||||||||||||||||||||||||||||||||||||||||||
Latin America and rest of the world | 426 | (48 | ) | 378 | 22,058 | 503 | (211 | ) | 292 | 27,785 | 172 | (135 | ) | 37 | 26,409 | 38 | (217 | ) | (179 | ) | 17,134 | 627 | (37 | ) | 589 | 23,759 | 426 | (48 | ) | 378 | 22,058 | |||||||||||||||||||||||||||||||||||||||||||||||||||||||||||||||||
Private-sector debt securities | 264 | (352 | ) | (88 | ) | 24,596 | 461 | (347 | ) | 114 | 20,983 | 390 | (165 | ) | 225 | 20,677 | 258 | (280 | ) | (22 | ) | 24,966 | 215 | (184 | ) | 31 | 23,786 | 264 | (352 | ) | (88 | ) | 24,596 | |||||||||||||||||||||||||||||||||||||||||||||||||||||||||||||||
|
|
|
|
|
|
|
|
|
|
|
|
|
|
|
|
|
|
|
|
|
|
|
| |||||||||||||||||||||||||||||||||||||||||||||||||||||||||||||||||||||||||
| 833 | (2,082 | ) | (1,249 | ) | 81,589 | 1,255 | (2,584 | ) | (1,329 | ) | 79,689 | 829 | (314 | ) | 515 | 79,289 | 680 | (1,136 | ) | (456 | ) | 79,844 | 1,022 | (1,686 | ) | (664 | ) | 87,724 | 833 | (2,082 | ) | (1,249 | ) | 81,589 | ||||||||||||||||||||||||||||||||||||||||||||||||||||||||||||||
Equity instruments | ||||||||||||||||||||||||||||||||||||||||||||||||||||||||||||||||||||||||||||||||||||||||||||||||
Domestic | ||||||||||||||||||||||||||||||||||||||||||||||||||||||||||||||||||||||||||||||||||||||||||||||||
Spain | 68 | (91 | ) | (23 | ) | 1,433 | 82 | (326 | ) | (244 | ) | 1,878 | 86 | (282 | ) | (197 | ) | 2,478 | 132 | (10 | ) | 122 | 1,432 | 201 | (34 | ) | 167 | 1,233 | 68 | (91 | ) | (23 | ) | 1,433 | ||||||||||||||||||||||||||||||||||||||||||||||||||||||||||||||
International | ||||||||||||||||||||||||||||||||||||||||||||||||||||||||||||||||||||||||||||||||||||||||||||||||
Rest of Europe | 111 | (160 | ) | (49 | ) | 1,279 | 47 | (266 | ) | (219 | ) | 1,325 | — | (192 | ) | (192 | ) | 1,734 | 158 | (25 | ) | 133 | 974 | 75 | (46 | ) | 29 | 1,135 | 111 | (160 | ) | (49 | ) | 1,279 | ||||||||||||||||||||||||||||||||||||||||||||||||||||||||||||||
United States | 94 | (35 | ) | 59 | 1,032 | 71 | (32 | ) | 39 | 1,550 | 83 | (5 | ) | 79 | 1,168 | 20 | (1 | ) | 19 | 661 | 15 | (5 | ) | 10 | 1,022 | 94 | (35 | ) | 59 | 1,032 | ||||||||||||||||||||||||||||||||||||||||||||||||||||||||||||||||||
Latin America and rest of the world | 352 | (67 | ) | 285 | 1,280 | 543 | (39 | ) | 504 | 1,793 | 655 | (215 | ) | 440 | 1,952 | 235 | (18 | ) | 217 | 888 | 265 | (56 | ) | 209 | 1,152 | 352 | (67 | ) | 285 | 1,280 | ||||||||||||||||||||||||||||||||||||||||||||||||||||||||||||||||||
|
|
|
|
|
|
|
|
|
|
|
|
|
|
|
|
|
|
|
|
|
|
|
| |||||||||||||||||||||||||||||||||||||||||||||||||||||||||||||||||||||||||
| 625 | (353 | ) | 272 | 5,024 | 743 | (663 | ) | 80 | 6,546 | 824 | (694 | ) | 130 | 7,331 | 545 | (54 | ) | 491 | 3,955 | 556 | (141 | ) | 415 | 4,542 | 625 | (353 | ) | 272 | 5,024 | |||||||||||||||||||||||||||||||||||||||||||||||||||||||||||||||||||
Of which: | ||||||||||||||||||||||||||||||||||||||||||||||||||||||||||||||||||||||||||||||||||||||||||||||||
Listed | 424 | (255 | ) | 170 | 2,745 | 569 | (552 | ) | 17 | 4,089 | 667 | (668 | ) | (1 | ) | 5,877 | 313 | (26 | ) | 287 | 1,330 | 311 | (68 | ) | 243 | 1,849 | 424 | (255 | ) | 169 | 2,745 | |||||||||||||||||||||||||||||||||||||||||||||||||||||||||||||||||
Unlisted | 201 | (98 | ) | 103 | 2,279 | 174 | (111 | ) | 63 | 2,457 | 157 | (26 | ) | 131 | 1,455 | 232 | (28 | ) | 204 | 2,625 | 245 | (73 | ) | 172 | 2,693 | 201 | (98 | ) | 103 | 2,279 | ||||||||||||||||||||||||||||||||||||||||||||||||||||||||||||||||||
|
|
|
|
|
|
|
|
|
|
|
|
|
|
|
|
|
|
|
|
|
|
|
| |||||||||||||||||||||||||||||||||||||||||||||||||||||||||||||||||||||||||
| 1,458 | (2,435 | ) | (977 | ) | 86,613 | 1,998 | (3,247 | ) | (1,249 | ) | 86,235 | 1,653 | (1,008 | ) | 645 | 86,621 | 1,225 | (1,190 | ) | 35 | 83,799 | 1,578 | (1,827 | ) | (249 | ) | 92,266 | 1,458 | (2,435 | ) | (977 | ) | 86,613 | |||||||||||||||||||||||||||||||||||||||||||||||||||||||||||||||
|
|
|
|
|
|
|
|
|
|
|
|
|
|
|
|
|
|
|
|
|
|
|
| |||||||||||||||||||||||||||||||||||||||||||||||||||||||||||||||||||||||||
F-139
At each reporting date the Group assesses whether there is any objective evidence that the instruments classified as available-for-sale (debt securities and equity instruments) are impaired.
This assessment includes but is not limited to an analysis of the following information: i) the issuer’s economic and financial position, the existence of default or late payment, analysis of the issuer’s solvency, the evolution of its business, short-term projections, trends observed with respect to its earnings and, if applicable, its dividend distribution policy; ii) market-related information such as changes in the general economic situation, changes in the issuer’s sector which might affect its ability to pay; iii) changes in the fair value of the security analyzed, analysis of the origins of such changes—changes - whether they are intrinsic or the result of the general uncertainty concerning the economy or the country—country - and iv) independent analysts’ reports and forecasts and other independent market information.
In the case of quoted equity instruments, when the changes in the fair value of the instrument under analysis are assessed, the duration and significance of the fall in its market price below cost for the Group is taken into account. As a general rule, for these purposes the Group considers a significant fall to be a 40% drop in the value of the asset and/or a continued fall over a period of 18 months. Nevertheless, it should be noted that the Group assesses, on a case-by-case basis each of the securities that have suffered losses, and monitors the performance of their prices, recognisingrecognizing an impairment loss as soon as it is considered that the recoverable amount could be affected, even though the price may not have fallen by the percentage or for the duration mentioned above.
If, after the above assessment has been carried out, the Group considers that the presence of one or more of these factors could affect recovery of the cost of the asset, an impairment loss is recognized in the income statement for the amount of the loss in equity under Valuation adjustments. Also, where the Group does not intend and/or is not able to hold the investment for a sufficient amount of time to recover the cost, the instrument is written down to its fair value.
At the end of 20112013 the Group performed the assessment described above and recognized in the consolidated income statement impairment losses of EUR 12589 million in respect of debt instruments (2010:(2012: EUR 1418 million; 2009:2011: EUR 42 million)125 million, of which EUR 106 million related to Greek sovereign debt) and of EUR 704169 million in respect of equity instruments (2010:which had suffered a significant and prolonged fall in price at December 31, 2013 (2012: EUR 319344 million; 2009:2011: EUR 494 million). The impairment losses recognized on debt instruments in 2011 included EUR 106704 million, relating to Greek sovereign debt. In addition, the impairment losses recognized on equity instruments in 2011 includedof which EUR 592 million relatingrelated to the impairment of the ownership interests in Iberdrola, S.A. and Assicurazioni Generali SpA. These equity instruments had suffered a significant and prolonged fall in price at December 31, 2011.SpA).
At the end of 2011, 70.1%2013, 65.05% of the losses recognized under Valuation adjustments—adjustments - Available-for-sale financial assets arising from debt securities had been incurred in more than twelve months. Most of the losses on government debt securities recognized in the Group’s equity (approximately 96.9%68.71% of the total) related to the decline in value of Spanish and Portuguese government debt securities. This decline in value was not prompted by interest rate changes but rather by an increase in the credit risk spreads due to Eurozone debt market tensions exacerbated by the interventions of Ireland, Greece and Portugal;in recent years; there had not been any default on payments of interest nor was there any evidence that the issuers would fail to continue to meet their payment obligations in the future, with respect both to principal and interest, and thus prevent recovery of the carrying amount of such securities.
At the end of 2011, 80%2013, 45.82% of the losses recognized under Valuation adjustments—adjustments - Available-for-sale financial assets arising from equity instruments had been incurred in more than twelve months. After carrying out the aforementioned assessment, the Group concluded that, given its ability and intention to hold the securities in the long term, it did not expect the factors giving rise to the decline in value described above to have an impact on future cash flows and, therefore, no impairment loss was required to be recognized at year-end.
F-140
| b) | Cash flow hedges |
Valuation adjustments—adjustments - Cash flow hedges includes the gains or losses attributable to hedging instruments that qualify as effective hedges. These amounts will remain under this heading until they are recognized in the consolidated income statement in the periods in which the hedged items affect it (see Note 11).
Accordingly, amounts representing valuation losses will be offset in the future by gains generated by the hedged instruments.
| c) | Hedges of net investments in foreign operations and Exchange differences |
Valuation adjustments—adjustments - Hedges of net investments in foreign operations includes the net amount of changes in the value of hedging instruments in hedges of net investments in foreign operations, for the portion of these changes considered as effective hedges (see Note 11).
Valuation adjustments—adjustments - Exchange differences includes the net amount of exchange differences arising on non-monetary items whose fair value is adjusted against equity and the differences arising on the translation to euros of the balances of the consolidated entities whose functional currency is not the euro (see Note 2.a).
The changes in 20102013 and 2012 reflect the effect arising from the depreciation of foreign currencies, mainly of the Brazilian real. The changes in 2011 reflect the effect arising from the appreciation or depreciation of foreign currencies, mainly of the pound sterling and the Brazilian real.
Of the change in the balance in the twothese years, a loss of EUR 1,665 million in 2013, EUR 388 million in 2012 and EUR 771 million in 2011 and a gain of EUR 1,640 million in 2010 related to the measurement of goodwill.
The detail, by country, of Valuation adjustments—adjustments - Hedges of net investments in foreign operations and Valuation adjustments—adjustments - Exchange differences is as follows:
| Millions of euros | ||||||||||||||||||||||||
| Millions of euros | 2013 | 2012 | 2011 | |||||||||||||||||||||
| 2011 | 2010 | 2009 | ||||||||||||||||||||||
Net balance at end of year | (3,208 | ) | (894 | ) | (3,555 | ) | (10,642 | ) | (5,970 | ) | (3,208 | ) | ||||||||||||
Of which: | ||||||||||||||||||||||||
Arising on consolidation: | ||||||||||||||||||||||||
Subsidiaries: | (3,208 | ) | (891 | ) | (3,558 | ) | (10,642 | ) | (5,970 | ) | (3,208 | ) | ||||||||||||
Brazil Group | 713 | 2,750 | 1,125 | (5,480 | ) | (2,627 | ) | 713 | ||||||||||||||||
Santander UK Group | (2,364 | ) | (2,096 | ) | (2,405 | ) | ||||||||||||||||||
Mexico Group | (1,171 | ) | (900 | ) | (1,217 | ) | ||||||||||||||||||
Argentina Group | (618 | ) | (287 | ) | (141 | ) | ||||||||||||||||||
Chile Group | 23 | 301 | (89 | ) | (453 | ) | (80 | ) | 23 | |||||||||||||||
Mexico Group | (1,217 | ) | (452 | ) | (1,011 | ) | ||||||||||||||||||
Santander UK Group | (2,405 | ) | (3,196 | ) | (2,965 | ) | ||||||||||||||||||
SHUSA Group | (352 | ) | (50 | ) | 27 | |||||||||||||||||||
Other | (322 | ) | (294 | ) | (618 | ) | (204 | ) | 70 | (208 | ) | |||||||||||||
Associates | — | (3 | ) | 3 | ||||||||||||||||||||
| d) | Entities accounted for using the equity method |
Valuation adjustments—adjustments - Entities accounted for using the equity method includes the amounts of valuation adjustments recognized in equity arising from associates.associates and jointly controlled entities.
The net changes in Valuation adjustments—adjustments - Entities accounted for using the equity method were as follows:
| Millions of euros | ||||||||||||||||||||||||
| Millions of euros | 2013 | 2012 | 2011 | |||||||||||||||||||||
| 2011 | 2010 | 2009 | ||||||||||||||||||||||
Balance at beginning of year | — | — | (148 | ) | (152 | ) | (95 | ) | — | |||||||||||||||
Revaluation gains (losses) | (38 | ) | — | — | (283 | ) | (61 | ) | (38 | ) | ||||||||||||||
Net amounts transferred to profit or loss | 23 | 21 | — | |||||||||||||||||||||
Transfers | (57 | ) | — | 148 | (34 | ) | (17 | ) | (57 | ) | ||||||||||||||
|
|
|
|
|
| |||||||||||||||||||
Balance at end of year | (95 | ) | — | — | (446 | ) | (152 | ) | (95 | ) | ||||||||||||||
|
|
|
|
|
| |||||||||||||||||||
Of which: | ||||||||||||||||||||||||
Metrovacesa | (34 | ) | — | — | ||||||||||||||||||||
ZS Insurance América, S.L. | (14 | ) | — | — | ||||||||||||||||||||
Metrovacesa, S.A. | (63 | ) | (55 | ) | (34 | ) | ||||||||||||||||||
Zurich Santander Insurance América S.L. | (90 | ) | 49 | (14 | ) | |||||||||||||||||||
Santander Consumer USA Inc. | (145 | ) | (92 | ) | — | |||||||||||||||||||
| e) | Other valuation adjustments |
Valuation adjustments - Other valuation adjustments include the actuarial gains and losses and the return on plan assets, less the administrative expenses and taxes inherent to the plan, and any change in the effect of the asset ceiling, excluding amounts included in net interest on the net defined benefit liability (asset).
The changes in this balance are shown in the consolidated statement of recognized income and expense, and the most significant changes in 2013 related to:
F-141
| 30. | Shareholders’ equity |
Shareholders’ equity includes the amounts of equity contributions from shareholders, accumulated profit or loss recognized through the consolidated income statement, and components of compound financial instruments having the substance of permanent equity. Amounts arising from subsidiaries are presented in the appropriate items based on their nature.
The changes in Shareholders’ equity are presented in the consolidated statement of changes in total equity. Significant information on certain items of Shareholders’ equity and the changes therein in 20112013 is set forth below.
| 31. | Issued capital |
| a) | Changes |
At December 31, 2008, the share capital consisted of 7,994,059,403 shares with a total par value of EUR 3,997 million.
On January 28, 2009, the shareholders at the general meeting of Sovereign Bancorp, Inc. approved its acquisition by the Bank and on January 30, 2009 the Bank increased capital through the issue of 161,546,320 ordinary shares for an effective amount (par value plus premium) of EUR 1,302 million.
Additionally, after completion on October 5, 2009 of the period for the voluntary conversion of “Valores Santander” into shares, and in accordance with the terms established in the related prospectus, on October 13, 2009, 257,647 new shares were issued to cater for this exchange.
On November 2, 2009, the bonus issue through which the “Santander Dividendo Elección” programme is instrumented took place, whereby 72,962,765 shares (0.89% of the share capital) relating to bonus share rights were issued in the proportion of one new share for 91 existing shares, for an amount of EUR 36.5 million.
On October 7, 2010, after completion on October 4, 2010 of the period for the voluntary conversion of “Valores Santander” into shares, and in accordance with the terms established in the related prospectus, 11,582,632 new shares were issued to cater for the conversion of 33,544 debt securities.
On November 2, 2010, the bonus issue through which the “Santander Dividendo Elección” programme is instrumented took place, whereby 88,713,331 shares (1.08% of the share capital) were issued, corresponding to a capital increase of EUR 44 million.
Following these transactions, at December 31, 2010 the Bank’s share capital consisted of 8,329,122,098 shares with a total par value of EUR 4,164.5 million.
On February 1, 2011, the bonus issue through which the “Santander Dividendo Elección” programmescrip dividend scheme (see Note 4) is instrumented took place, whereby 111,152,906 shares (1.33% of the share capital) relating to bonus share rights were issued in the proportion of one new share for 65 existing shares, for an amount of EUR 55.5 million.
Additionally, on October 7, 2011, after completion on October 3, 2011 of the period for the voluntary conversion of “Valores Santander” into shares, and in accordance with the terms established in the prospectus, 1,223,457 new shares were issued to cater for this exchange.
On November 2, 2011, the bonus issue through which the “Santander Dividendo Elección” programmescrip dividend scheme is instrumented took place, whereby 125,742,571 shares (1.49% of the share capital) were issued, corresponding to a capital increase of EUR 62.8 million.
F-142
Finally, 341,802,171 new shares (3.837% of the share capital) with a par value of EUR 171 million and a share premium of EUR 1,773 million were issued on December 30, 2011 within the framework of the repurchase offer aimed atmade to the holders of Series X preference shares issued by Santander Finance Capital, who, upon accepting this offer, irrevocably requested to subscribe new shares of the Bank for the amount received by them in the repurchase.
At December 31, 2011, the Bank’s share capital consisted of 8,909,043,203 shares with a total par value of EUR 4,454.5 million.
On January 31, 2012 and May 2, 2012, the bonus issues through which the “Santander Dividendo Elección” scrip dividend scheme is instrumented took place, whereby 167,810,197 and 284,326,000 shares (1.85% and 3.04% of the share capital, respectively) were issued, giving rise to bonus issues of EUR 83.9 million and EUR 142.2 million, respectively.
The shareholders at the annual general meeting on March 30, 2012 resolved to grant holders of “Valores Santander” (see Note 34.a) the option to request the voluntary conversion of their shares on four occasions prior to October 4, 2012, the date of their mandatory conversion. As a result of the exercise of this option and of the mandatory conversion, 73,927,779 shares were issued on June 7, 193,095,393 on July 5, 37,833,193 on August 7, 14,333,873 on September 6 and 200,311,513 on October 9, 2012, relating to capital increases of EUR 37 million, EUR 97 million, EUR 19 million, EUR 7 million and EUR 100 million, respectively.
Also, on July 31, 2012 and November 2, 2012, the bonus issues through which the “Santander Dividendo Elección” scrip dividend scheme is instrumented took place, whereby 218,391,102 and 222,107,497 shares (2.22% and 2.15% of the share capital, respectively) were issued, giving rise to bonus issues of EUR 109.2 and EUR 111.1 million, respectively.
At December 31, 2012, the Bank’s share capital consisted of 10,321,179,750 shares with a total par value of EUR 5,161 million.
On January 30, 2013, April 30, 2013, July 31, 2013 and October 31, 2013, the bonus issues through which the “Santander Dividendo Elección” scrip dividend scheme is instrumented took place, whereby 217,503,395, 270,917,436, 282,509,392 and 241,310,515 shares (2.06%, 2.51%, 2.55% and 2.13% of the share capital, respectively) were issued, giving rise to bonus issues of EUR 108.8 million, EUR 135.5 million, EUR 141.3 million and EUR 120.7 million, respectively.
At December 31, 2013, the Bank’s share capital consisted of 11,333,420,488 shares with a total par value of EUR 5,667 million.
The Bank’s shares are listed on the Spanish Stock Market Interconnection System and on the New York, London, Milan, Lisbon, Buenos Aires and Mexico Stock Exchanges, and all of them have the same features and rights. At December 31, 2011,2013, the only shareholders listed in the Bank’s shareholders register with ownership interests of more than 3% were State Street Bank & Trust (with an 8.34%a 9.33% holding), Chase Nominees Limited (with a 7.97%7.05% holding), EC Nominees Ltd. (with a 6.46% holding) and The Bank of New York Mellon (with a 5.55%5.35% holding), EC Nominees Ltd. (with a 4.57% holding), Clearstream Banking (with a 3.49% holding) and Guaranty Nominees (with a 3.29% holding). These
However, the Bank understands that these ownership interests are held in custody on behalf of customers,third parties and that none of the above, as far as the Bank is not aware, has an ownership interest of anymore than 3% of these ultimate shareholders individually holding a stake of 3%the Bank’s share capital or more.voting power.
| b) | Other considerations |
The shareholders at the annual general meeting held on June 19, 2009March 22, 2013 authorized additional share capital of EUR 2,038.9 million, of which EUR 171 million were used in the repurchase offer announced by the Bank on December 2, 2011, aimed at the holders of Series X preference shares issued by Santander Finance Capital, who, upon accepting this offer, irrevocably requested to subscribe new shares of the Bank for the amount received by them in the repurchase.2,635 million. The Bank’s directors have until June 19, 2012March 22, 2016 to carry out capital increases up to this limit. The resolution empowers the board to fully or partially disapply the pre-emption right in accordance with the terms of Article 308506 of the Spanish Limited Liability Companies Law, (Ley de Sociedades de Capital).although this power is limited to EUR 1,054 million.
The shareholders at the annual general meeting of June 17, 2011March 22, 2013 resolved to increase the Bank’s capital by a par value of EUR 500 million and granted the board the broadest powers to set the date and establish the terms and conditions of this capital increase within one year from the date of the aforementioned annual general meeting. If the board does not exercise the powers delegated to it within the period established by the annual general meeting, these powers will be rendered null and void.
In addition, the aforementioned annual general meeting authorized the board to issue fixed-income securities, convertible into or exchangeable for shares of the Bank, for up to a total of EUR 8,00010,000 million or the equivalent amount in another currency. The Bank’s directors have until June 17, 2016March 22, 2018 to execute this resolution.
At December 31, 2011,2013, the shares of the following companies were listed on official stock markets: Banco Santander Río, S.A.; Banco Santander Colombia, S.A.; Grupo Financiero Santander S.A. BMéxico, S.A.B. de C.V.; Banco Santander—Santander - Chile; Cartera Mobiliaria, S.A., SICAV; Santander Chile Holding S.A.; Banco Santander (Brasil) S.A.; Banco Español de Crédito, S.A. and Bank Zachodni WBK S.A.
At December 31, 2011,2013, the number of Bank shares owned by third parties and managed by Group management companies (mainly portfolio, collective investment undertaking and pension fund managers) and managed jointly was 29.154 million, which represented 0.33%0.48% of the Bank’s share capital. In addition, the number of Bank shares owned by third parties and received as security was 71.1227.2 million (equal to 0.80%2% of the Bank’s share capital).
At December 31, 2011,2013, the capital increases in progress at Group companies and the additional capital authorized by their shareholders at the respective general meetings were not material at Group level (see Appendix V).
F-143
| 32. | Share premium |
Share premium includes the amount paid up by the Bank’s shareholders in capital issues in excess of the par value.
The Spanish Limited Liability Companies Law(Ley de Sociedades de Capital) expressly permits the use of the share premium account balance to increase capital at the entities at which it is recognized and does not establish any specific restrictions as to its use.
The increase in the balance of the Share premium in 20112012 and 20102011 relates to the capital increases detailed in Note 31.a. In 2013 the balance of the Share premium was reduced by EUR 506 million to cater for the capital increases arising from the “Santander Dividendo Elección” scrip dividend scheme. Also, in 20112013 an amount of EUR 24102 million was transferred from the Share premium account to the Legal reserve (2010:(2012: EUR 10141 million; 2011: EUR 24 million) (see Note 33.b.i).
| 33. | Reserves |
| a) | Definitions |
Shareholders’ equity—Reserves—equity - Reserves - Accumulated reserves (losses) includes the net amount of the accumulated profit or loss recognized in previous years through the consolidated income statement that, in the distribution of profit, was appropriated to equity, and the own equity instrument issuance expenses and the differences between the selling price of treasury shares and the cost of acquisition thereof.
Shareholders’ equity—equity - Reserves (losses) of entities accounted for using the equity method includes the net amount of the accumulated profit or loss generated in previous years by entities accounted for using the equity method, recognized through the consolidated income statement.
| b) | Breakdown |
The detail of Accumulated reserves (losses) and Reserves (losses) of entities accounted for using the equity method is as follows:
| Millions of euros | ||||||||||||
| 2011 | 2010 | 2009 | ||||||||||
Accumulated reserves: | ||||||||||||
Restricted reserves- | ||||||||||||
Legal reserve | 857 | 833 | 822 | |||||||||
Reserve for treasury shares | 821 | 737 | 532 | |||||||||
Revaluation reserve Royal Decree-Law 7/1996 | 43 | 43 | 43 | |||||||||
Reserve for retired capital | 11 | 11 | 11 | |||||||||
Voluntary reserves (*) | 1,246 | 1,745 | 2,282 | |||||||||
Consolidation reserves attributed to the Bank | 7,107 | 6,652 | 6,752 | |||||||||
Reserves at subsidiaries | 22,836 | 18,234 | 14,098 | |||||||||
|
|
|
|
|
| |||||||
| 32,921 | 28,255 | 24,540 | ||||||||||
Reserves of entities accounted for using the equity method: | ||||||||||||
Associates | 59 | 52 | 68 | |||||||||
|
|
|
|
|
| |||||||
| 32,980 | 28,307 | 24,608 | ||||||||||
|
|
|
|
|
| |||||||
| Millions of euros | ||||||||||||
| 2013 | 2012 | 2011 | ||||||||||
Accumulated reserves (losses): | ||||||||||||
Restricted reserves- | ||||||||||||
Legal reserve | 1,134 | 1,032 | 857 | |||||||||
Reserve for treasury shares | 1,509 | 1,549 | 821 | |||||||||
Revaluation reserve Royal Decree-Law 7/1996 | 43 | 43 | 43 | |||||||||
Reserve for retired capital | 11 | 11 | 11 | |||||||||
Voluntary reserves | 3,220 | 125 | 1,246 | |||||||||
Consolidation reserves attributable to the Bank | 7,968 | 8,551 | 7,107 | |||||||||
Reserves at subsidiaries | 23,973 | 25,587 | 22,836 | |||||||||
|
|
|
|
|
| |||||||
| 37,858 | 36,898 | 32,921 | ||||||||||
Reserves (losses) of entities accounted for using the equity method: | ||||||||||||
Associates | 263 | 255 | 59 | |||||||||
|
|
|
|
|
| |||||||
| 38,121 | 37,153 | 32,980 | ||||||||||
|
|
|
|
|
| |||||||
F-144
| i. | Legal reserve |
Under the Consolidated Spanish Limited Liability Companies Law, 10% of net profit for each year must be transferred to the legal reserve. These transfers must be made until the balance of this reserve reaches 20% of the share capital. The legal reserve can be used to increase capital provided that the remaining reserve balance does not fall below 10% of the increased share capital amount.
In 20112013 the Bank transferred EUR 24102 million (2010: EUR 10 million) from the Share premium account to the Legal reserve, as a resultreserve. In 2012 the Bank transferred EUR 141 million from the Share premium account and EUR 34 million of which,2011 profit to the Legal reserve. In 2011 the Bank transferred EUR 24 million from the Share premium account to the Legal reserve.
Consequently, once again, after the capital increases described in Note 31 had been carried out, the balance of the Legal reserve reached 20% of the share capital, and at December 31, 2013 the Legal reserve was still EUR 34 million short of reaching 20% of share capital (see Note 4).at the stipulated level.
| ii. | Reserve for treasury shares |
Pursuant to the Consolidated Spanish Limited Liability Companies Law, (Ley de Sociedades de Capital), a restricted reserve has been recognized for an amount equal to the carrying amount of the Bank shares owned by subsidiaries. The balance of this reserve will become unrestricted when the circumstances that made it necessary to record it cease to exist. Additionally, this reserve covers the outstanding balance of loans granted by the Group secured by Bank shares and the amount equivalent to loans granted by Group companies to third parties for the acquisition of treasury shares.
| iii. | Revaluation reserve Royal Decree Law 7/1996, of June |
The balance of Revaluation reserve Royal Decree-Law 7/1996 can be used, free of tax, to increase share capital. From January 1, 2007, the balance of this account can be taken to unrestricted reserves, provided that the monetary surplus has been realised.realized. The surplus will be deemed to have been realisedrealized in respect of the portion on which depreciation has been taken for accounting purposes or when the revalued assets have been transferred or derecognized.
If the balance of this reserve were used in a manner other than that provided for in Royal Decree-Law 7/1996, of June 7, it would be subject to taxation.
| iv. | Reserves of subsidiaries and jointly controlled entities |
The detail, by company, of Reserves of subsidiaries and jointly controlled entities, based on the companies’ contribution to the Group (considering the effect of consolidation adjustments) is as follows:
F-145
| Millions of euros | ||||||||||||||||||||||||
| Millions of euros | 2013 | 2012 | 2011 | |||||||||||||||||||||
| 2011 | 2010 | 2009 | ||||||||||||||||||||||
Banco Santander (Brasil), S.A. (Consolidated Group) | 4,395 | 2,904 | 1,940 | 6,478 | 5,237 | 4,395 | ||||||||||||||||||
Banesto | 4,341 | 4,195 | 4,031 | |||||||||||||||||||||
Santander UK Group | 4,189 | 3,418 | 2,689 | 5,428 | 4,764 | 4,189 | ||||||||||||||||||
Banesto (*) | — | 4,327 | 4,341 | |||||||||||||||||||||
Banco Santander – Chile | 2,736 | 3,072 | 2,691 | |||||||||||||||||||||
Banco Santander (México), S.A., Institución de Banca Múltiple, Grupo Financiero Santander | 2,399 | 1,931 | 1,623 | 2,573 | 2,104 | 2,399 | ||||||||||||||||||
Banco Santander—Chile | 2,691 | 1,834 | 1,598 | |||||||||||||||||||||
Banco Santander Totta, S.A. (Consolidated Group) (*) | 1,985 | 1,949 | 1,683 | |||||||||||||||||||||
Grupo Santander Consumer Finance | 794 | 797 | 723 | |||||||||||||||||||||
Banco Santander Totta, S.A. (Consolidated Group) | 1,890 | 1,860 | 1,985 | |||||||||||||||||||||
Santander Consumer Finance Group | 1,189 | 1,351 | 794 | |||||||||||||||||||||
Santander Holdings USA | 1,084 | 624 | 122 | |||||||||||||||||||||
Santander Seguros y Reaseguros, Compañía Aseguradora, S.A. | 432 | 331 | 237 | 515 | 387 | 432 | ||||||||||||||||||
Banco Banif, S.A.(*) | — | 349 | 307 | |||||||||||||||||||||
Banco Santander Río, S.A. | 395 | 61 | (77 | ) | ||||||||||||||||||||
Banco Santander International | 348 | 288 | 245 | |||||||||||||||||||||
Cartera Mobiliaria, S.A., SICAV | 334 | 336 | 315 | 339 | 329 | 334 | ||||||||||||||||||
Banco Banif, S.A. | 307 | 274 | 210 | |||||||||||||||||||||
Banco Santander (Suisse) SA | 242 | 333 | 84 | |||||||||||||||||||||
Santander Investment, S.A. | 247 | 217 | 230 | 222 | 219 | 247 | ||||||||||||||||||
Banco Santander International (United States) | 245 | 206 | 241 | |||||||||||||||||||||
Banco Santander (Suisse) S.A. | 84 | 44 | 151 | |||||||||||||||||||||
Banco Santander Río, S.A. | (77 | ) | (227 | ) | (412 | ) | ||||||||||||||||||
Bank Zachodni WBK, S.A. | 175 | 62 | — | |||||||||||||||||||||
Exchange differences, consolidation adjustments and other | 470 | 25 | (1,161 | ) | 359 | 220 | 348 | |||||||||||||||||
|
|
|
|
|
| |||||||||||||||||||
| 22,836 | 18,234 | 14,098 | 23,973 | 25,587 | 22,836 | |||||||||||||||||||
|
|
|
|
|
| |||||||||||||||||||
Of which: restricted | 1,815 | 1,563 | 1,271 | 2,062 | 2,241 | 1,815 | ||||||||||||||||||
|
|
| ||||||||||||||||||||||
| (*) |
| (**) | Includes the charge relating to cumulative exchange differences in the transition to International Financial Reporting Standards. |
| 34. | Other equity instruments and Treasury shares |
| a) | Other equity instruments |
Other equity instruments includes the equity component of compound financial instruments, the increase in equity due to personnel remuneration, and other items not recognized in other Shareholders’Shareholders��� equity items.
At December 31, 2009,2011, Other equity instruments related mainly to “Valores Santander”, which are described below:
“Valores Santander”
In 2007, in order to partially finance the takeover bid launched on ABN AMRO, Santander Emisora 150, S.A. Sole-Shareholder Company issued securities mandatorily convertible into newly-issued ordinary shares of the Bank (“Valores Santander”) amounting to EUR 7,000 million. It was possible to exchange these securities voluntarily for Bank shares on October 4, 2011, 2010, 2009 and 2008 and they will bewere mandatorily exchanged on October 4, 2012.
The reference price of the Bank’s share for conversion purposes was set at EUR 16.04 per share, and the conversion ratio of the debt securities -i.e. the number of Bank shares corresponding to each “Valor Santander” for conversion purposes- is 311.76 shares for each “Valor Santander”. The nominal interest rate on these securities was 7.30% until October 4, 2008 and Euribor plus 2.75% thereafter until the securities are exchanged for shares.
Subsequent to issue, Banco Santander, S.A. resolved on several occasions, in accordance with the prospectus, to change the conversion ratio of these securities. The latest revision was carried out in view of the bonus share issue performed by Banco Santander,which took place on July 30, 2012, through which the Santander“Santander Dividendo Elección programmen” scrip dividend scheme was put into effect for the payment of the remuneration equivalent to the second interim dividend for 2011,instrumented, and the new reference price of the shares of Banco Santander, shareS.A. for conversion purposes was set at EUR 13.9312.96 per share. Consequently, the new conversion ratio applicable to the “Valores Santander” is 358.94was 385,802 shares of Banco Santander, S.A. for each “Valor Santander”, the result of dividing the face value of each “Valor Santander” (EUR 5,000) by the aforementioned reference price (EUR 13.93)12.96).
F-146
In 2011, 3,458The shareholders at the annual general meeting on March 30, 2012 resolved to grant holders of “Valores Santander” the option to request the voluntary conversion of their shares on four occasions prior to October 4, 2012, the date of their mandatory conversion. Specifically, holders of “Valores Santander” who so desired could request the conversion thereof in the 15 calendar days prior to June 4, July 4, August 4 and September 4, 2012. As a result of this option and of the mandatory conversion, on June 7, 2012 195,923 “Valores Santander” were voluntarily converted into Bank shares (2010: 33,544(July 5, 2012: 511,769 shares; August 7, 2012: 98,092 shares; September 6, 2012: 37,160 shares; October 9, 2012: 519,300 shares). This conversion gave rise tocaused a reduction of EUR 176,811 million (2010: EUR 168 million) in Other equity instruments and increases of EUR 0.6260 million and EUR 16.76,551 million in Issued capital and Share premium, respectively (2010: EUR 6 million and EUR 162 million, respectively).respectively.
In 2011,2012 interest of EUR 268226 million (2010:(2011: EUR 243 million; 2009: EUR 381268 million) was paid on the “Valores Santander” with a charge to reserves. This interest was recognized under Other increases/(decreases) in equity in the consolidated statement of changes in total equity.
The balance of Other equity instruments increased in 2010 due mainly to the issue described below:
Agreement with Qatar Holding
In October 2010 several investors from the Emirate of Qatar subscribed and paid an issue launched by Banco Santander, S.A. of bonds mandatorily exchangeable for shares of Banco Santander (Brasil), S.A. The issue amounted to USD 2,819 million, of which Qatar Holding subscribed USD 2,719 million. The bonds were set to mature on October 29, 2013, at which time they willwould be automatically exchanged for shares of Banco Santander (Brasil), S.A. equivalent to 5% of its share capital.capital at the issue date. The exchange price iswas BRL 23.75 per share (domestic unit) and the bonds pay a coupon in US dollars of 6.75% per annum.
TheAt the issue date, the Group recognized EUR 366 million, relating to the present value of the interest payable, under Financial liabilities at amortised cost—amortized cost - Marketable debt securities and the remaining amount (EUR 1,668 million) in equity under Other equity instruments—instruments - Equity component of compound financial instruments.
In January and March 2012 the Group transferred shares representing 4.41% and 0.77% of Banco Santander (Brasil) S.A. to two leading international financial institutions that undertook to deliver these shares to the holders of the bonds convertible into shares of Banco Santander (Brasil) S.A. issued by Banco Santander, S.A. in October 2010 upon the maturity of the bonds and under the terms laid down therein. As a result of these transactions, the balances of Other equity instruments and Valuation adjustments were reduced by EUR 1,668 million and EUR 26 million, respectively, and the balances of Reserves and Non-controlling interests increased by EUR 162 million and EUR 1,532 million, respectively, and, accordingly, there was no impact on Equity.
The delivery of the aforementioned shares took place on November 7, 2013.
| b) | Treasury shares |
Shareholders’ equity—equity - Treasury shares includes the amount of own equity instruments held by all the Group entities.
Transactions involving own equity instruments, including their issuance and cancellation, are recognized directly in equity, and no profit or loss may be recognized on these transactions. The costs of any transaction involving own equity instruments are deducted directly from equity, net of any related tax effect.
The shareholders atOn October 21, 2013, the Bank’s annual general meetingboard of directors amended the regulation of its treasury share policy in order to take into account the criteria recommended by the CNMV, establishing limits on June 11, 2010average daily purchase trading and time limits. Also, a maximum price per share was set the maximum number of Bank shares that the Bank and/or any Group subsidiary are authorized to acquire at a number equivalent to 10% of the fully paid share capital amount, atfor purchase orders and a minimum price per share price not lower than par value and a maximum share price of up to 3% higher than the latest quoted price with respect to which the Bank did not trade for its own account in the Spanish Stock Market Interconnection System (including the block market) on the acquisition date concerned.sale orders.
The Bank’s shares owned by the consolidated companies accounted for 0.474%0.013% of issued share capital at December 31, 20112013 (December 31, 2010: 0.268%; December 31, 2009: 0.031%2012 and 2011: 0.474%).
The average purchase price of the Bank’s shares in 20112013 was EUR 7.385.74 per share and the average selling price was EUR 7.415.75 per share.
The effect on equity, net of tax, arising from the purchase and sale of Bank shares was a EUR 3128 million reduction in 2011 (2010:2013 (2012: EUR 1885 million reduction; 2009:increase; 2011: EUR 32131 million increase)reduction).
F-147
| 35. | Memorandum items |
Memorandum items relates to balances representing rights, obligations and other legal situations that in the future may have an impact on net assets, as well as any other balances needed to reflect all transactions performed by the consolidated entities although they may not impinge on their net assets.
| a) | Contingent liabilities |
Contingent liabilities includes all transactions under which an entity guarantees the obligations of a third party and which result from financial guarantees granted by the entity or from other types of contract. The detail is as follows:
| Millions of euros | ||||||||||||||||||||||||
| Millions of euros | 2013 | 2012 | 2011 | |||||||||||||||||||||
| 2011 | 2010 | 2009 | ||||||||||||||||||||||
Financial guarantees | 15,417 | 18,395 | 20,974 | 13,479 | 14,437 | 15,417 | ||||||||||||||||||
Of which: | ||||||||||||||||||||||||
Financial bank guarantees | 14,697 | 17,518 | 19,726 | 12,186 | 13,706 | 14,697 | ||||||||||||||||||
Doubtful guarantees | 720 | 604 | 489 | 1,293 | 731 | 720 | ||||||||||||||||||
Irrevocable documentary credits | 2,978 | 3,816 | 2,637 | 2,430 | 2,866 | 2,978 | ||||||||||||||||||
Other bank guarantees and indemnities provided | 29,093 | 36,733 | 35,192 | 24,690 | 27,285 | 29,093 | ||||||||||||||||||
Other guarantees | 28,937 | 29,331 | 28,025 | 24,496 | 27,089 | 28,937 | ||||||||||||||||||
Undertakings to provide bank guarantees | 156 | 7,402 | 7,167 | 194 | 196 | 156 | ||||||||||||||||||
Other contingent liabilities | 554 | 851 | 453 | 450 | 445 | 554 | ||||||||||||||||||
Assets earmarked for third-party obligations | 108 | 108 | — | 128 | 108 | 108 | ||||||||||||||||||
Other contingent liabilities | 446 | 743 | 453 | 322 | 337 | 446 | ||||||||||||||||||
|
|
|
|
|
| |||||||||||||||||||
| 48,042 | 59,795 | 59,256 | 41,049 | 45,033 | 48,042 | |||||||||||||||||||
|
|
|
|
|
| |||||||||||||||||||
A significant portion of these guarantees will expire without any payment obligation materialisingmaterializing for the consolidated entities and, therefore, the aggregate balance of these commitments cannot be considered as an actual future need for financing or liquidity to be provided by the Group to third parties.
Income from guarantee instruments is recognized under Fee and commission income in the consolidated income statements and is calculated by applying the rate established in the related contract to the nominal amount of the guarantee.
At December 31, 2011,2013, the Group had recognized provisions of EUR 659693 million to cover contingent liabilities (December 31, 2010:2012: EUR 1,030617 million; December 31, 2009:2011: EUR 642659 million) (see Note 25).
i. Financial guarantees
Financial guarantees includes, inter alia, financial guarantee contracts such as financial bank guarantees, credit derivatives sold, and risks arising from derivatives arranged for the account of third parties.
ii. Other bank guarantees and indemnities provided
Other bank guarantees and indemnities providedThis item includes guarantees other than those classified as financial, such as technical guarantees, guarantees covering the import and export of goods and services, irrevocable formal undertakings to provide bank guarantees, legally enforceable letters of guarantee and other guarantees of any kind.
iii. Other contingent liabilities
Other contingent liabilities includes the amount of any contingent liability not included in other items.
F-148
| b) | Contingent commitments |
Contingent commitments includes those irrevocable commitments that could give rise to the recognition of financial assets.
The detail is as follows:
| Millions of euros | ||||||||||||||||||||||||
| Millions of euros | 2013 | 2012 | 2011 | |||||||||||||||||||||
| 2011 | 2010 | 2009 | ||||||||||||||||||||||
Drawable by third parties | 181,559 | 179,964 | 150,563 | 154,314 | 187,664 | 181,559 | ||||||||||||||||||
Financial asset forward purchase commitments | 307 | 1,589 | 3,302 | 82 | 891 | 307 | ||||||||||||||||||
Regular way financial asset purchase contracts | 2,324 | 2,702 | 3,447 | 8,222 | 15,040 | 2,324 | ||||||||||||||||||
Securities subscribed but not paid | 20 | 26 | 29 | 12 | 15 | 20 | ||||||||||||||||||
Securities placement and underwriting commitments | 5 | 21 | — | 6 | 5 | 5 | ||||||||||||||||||
Documents delivered to clearing houses | 10,925 | 17,410 | 4,765 | 9,901 | 12,132 | 10,925 | ||||||||||||||||||
Other contingent commitments | 242 | 1,997 | 1,425 | 260 | 295 | 242 | ||||||||||||||||||
|
|
|
|
|
| |||||||||||||||||||
| 195,382 | 203,709 | 163,531 | 172,797 | 216,042 | 195,382 | |||||||||||||||||||
|
|
|
|
|
| |||||||||||||||||||
| c) | Off-balance-sheet funds under management |
The detail of off-balance-sheet funds managed by the Group and by jointly controlled companies is as follows:
| Millions of euros | ||||||||||||||||||||||||
| Millions of euros | 2013 | 2012 | 2011 | |||||||||||||||||||||
| 2011 | 2010 | 2009 | ||||||||||||||||||||||
Investment funds | 102,611 | 113,510 | 105,216 | 93,304 | 89,176 | 102,611 | ||||||||||||||||||
Pension funds | 9,645 | 10,965 | 11,310 | 10,879 | 10,076 | 9,645 | ||||||||||||||||||
Assets under management | 19,200 | 20,314 | 18,364 | 20,987 | 18,889 | 19,200 | ||||||||||||||||||
|
|
|
|
|
| |||||||||||||||||||
| 131,456 | 144,789 | 134,890 | 125,170 | 118,141 | 131,456 | |||||||||||||||||||
|
|
|
|
|
| |||||||||||||||||||
| d) | Third-party securities held in custody |
At December 31, 2011,2013, the Group held in custody debt securities and equity instruments totallingtotaling EUR 853,509 million (December 31, 2012: EUR 725,609 million; December 31, 2011: EUR 768,917 millionmillion) entrusted to it by third parties.
F-149
| 36. |
The detail of the notional and/or contractual amounts and the market values of the trading and hedging derivatives held by the Group is as follows:
| Millions of euros | ||||||||||||||||||||||||||||||||||||||||||||||||
| Millions of euros | 2013 | 2012 | 2011 | |||||||||||||||||||||||||||||||||||||||||||||
| 2011 | 2010 | 2009 | Notional amount | Market value | Notional amount | Market value | Notional amount | Market value | ||||||||||||||||||||||||||||||||||||||||
| Notional amount | Market value | Notional amount | Market value | Notional amount | Market value | |||||||||||||||||||||||||||||||||||||||||||
Trading derivatives: | ||||||||||||||||||||||||||||||||||||||||||||||||
Interest rate risk- | ||||||||||||||||||||||||||||||||||||||||||||||||
Forward rate agreements | 205,780 | (13 | ) | 63,575 | (19 | ) | 150,906 | (1,177 | ) | 120,773 | (2 | ) | 324,031 | (7 | ) | 205,780 | (13 | ) | ||||||||||||||||||||||||||||||
Interest rate swaps | 2,344,783 | 366 | 2,097,581 | 481 | 1,693,804 | 918 | 2,454,752 | 1,190 | 2,114,198 | 2,942 | 2,344,783 | 366 | ||||||||||||||||||||||||||||||||||||
Options and futures | 889,900 | (231 | ) | 1,057,816 | (904 | ) | 1,001,660 | 537 | ||||||||||||||||||||||||||||||||||||||||
Options, futures and other derivatives | 605,532 | (1,157 | ) | 655,091 | (487 | ) | 782,874 | (171 | ) | |||||||||||||||||||||||||||||||||||||||
Credit risk- | ||||||||||||||||||||||||||||||||||||||||||||||||
Credit default swaps | 79,822 | 49 | 90,119 | 18 | 107,026 | (60 | ) | |||||||||||||||||||||||||||||||||||||||||
Foreign currency risk- | ||||||||||||||||||||||||||||||||||||||||||||||||
Foreign currency purchases and sales | 232,619 | (122 | ) | 165,747 | (2,226 | ) | 108,031 | (525 | ) | 186,207 | 1,935 | 187,976 | 278 | 232,619 | (122 | ) | ||||||||||||||||||||||||||||||||
Foreign currency options | 50,376 | 32 | 41,419 | (182 | ) | 45,983 | (81 | ) | 45,196 | 200 | 49,442 | (18 | ) | 50,376 | 32 | |||||||||||||||||||||||||||||||||
Currency swaps | 226,042 | (157 | ) | 183,109 | 838 | 112,361 | 2,079 | 255,731 | (1,001 | ) | 277,392 | (436 | ) | 226,042 | (157 | ) | ||||||||||||||||||||||||||||||||
Securities and commodities derivatives and other | 187,497 | (460 | ) | 241,185 | (198 | ) | 160,867 | (606 | ) | 95,634 | (1,202 | ) | 149,737 | (1,714 | ) | 187,497 | (460 | ) | ||||||||||||||||||||||||||||||
|
|
|
|
|
|
|
|
|
|
|
| |||||||||||||||||||||||||||||||||||||
| 4,136,997 | (585 | ) | 3,850,432 | (2,210 | ) | 3,273,612 | 1,144 | 3,843,647 | 12 | 3,847,986 | 576 | 4,136,997 | (585 | ) | ||||||||||||||||||||||||||||||||||
|
|
|
|
|
|
|
|
|
|
|
| |||||||||||||||||||||||||||||||||||||
Hedging derivatives: | ||||||||||||||||||||||||||||||||||||||||||||||||
Interest rate risk- | ||||||||||||||||||||||||||||||||||||||||||||||||
Forward rate agreements | — | — | — | — | — | — | ||||||||||||||||||||||||||||||||||||||||||
Interest rate swaps | 179,010 | 2,546 | 211,964 | 1,225 | 218,539 | 1,751 | 219,103 | 1,456 | 195,416 | 2,154 | 179,010 | 2,546 | ||||||||||||||||||||||||||||||||||||
Options and futures | 3,574 | 84 | 7,314 | 18 | 21,144 | (26 | ) | |||||||||||||||||||||||||||||||||||||||||
Options, futures and other derivatives | 2,144 | 12 | 8,006 | 19 | 2,169 | 34 | ||||||||||||||||||||||||||||||||||||||||||
Credit risk- | ||||||||||||||||||||||||||||||||||||||||||||||||
Credit default swaps | 760 | (14 | ) | 833 | (7 | ) | 1,405 | 50 | ||||||||||||||||||||||||||||||||||||||||
Foreign currency risk- | ||||||||||||||||||||||||||||||||||||||||||||||||
Foreign currency purchases and sales | 3,351 | (8 | ) | 3,875 | (4 | ) | 1,714 | (14 | ) | 24,161 | 630 | 24,758 | (278 | ) | 3,351 | (8 | ) | |||||||||||||||||||||||||||||||
Foreign currency options | 37,724 | (9 | ) | 30,989 | (294 | ) | 21,784 | (128 | ) | 3,883 | 409 | 24,740 | (34 | ) | 37,724 | (9 | ) | |||||||||||||||||||||||||||||||
Currency swaps | 21,931 | 981 | 26,913 | 748 | 14,715 | 1,091 | 38,760 | 525 | 38,895 | (399 | ) | 21,931 | 981 | |||||||||||||||||||||||||||||||||||
Securities and commodities derivatives and other | 443 | (140 | ) | 985 | (100 | ) | 1,007 | (32 | ) | 258 | — | 278 | 37 | 443 | (140 | ) | ||||||||||||||||||||||||||||||||
|
|
|
|
|
|
|
|
|
|
|
| |||||||||||||||||||||||||||||||||||||
| 246,033 | 3,454 | 282,040 | 1,593 | 278,903 | 2,643 | 289,069 | 3,018 | 292,926 | 1,492 | 246,033 | 3,454 | |||||||||||||||||||||||||||||||||||||
|
|
|
|
|
|
|
|
|
|
|
| |||||||||||||||||||||||||||||||||||||
| 4,383,030 | 2,869 | 4,132,472 | (617 | ) | 3,552,515 | 3,787 | ||||||||||||||||||||||||||||||||||||||||||
|
|
|
|
|
| |||||||||||||||||||||||||||||||||||||||||||
The notional and/or contractual amounts of the contracts entered into do not reflect the actual risk assumed by the Group, since the net position in these financial instruments is the result of offsetting and/or combining them. This net position is used by the Group basically to hedge the interest rate, underlying asset price or foreign currency risk; the results on these financial instruments are recognized under Gains/losses on financial assets and liabilities (net) in the consolidated income statements and increase or offset, as appropriate, the gains or losses on the investments hedged (see Note 11).
Additionally, in order to interpret correctly the results on the Securities and commodities derivatives shown in the foregoing table, it should be considered that these items relate mostly to securities options for which a premium has been received which offsets their negative market value. Also, this market value is offset by positive market values generated by symmetrical positions in the Group’s held-for-trading portfolio.
The Group manages the credit risk exposure of these contracts through netting arrangements with its main counterparties and by receiving assets as collateral for its risk positions.
The detail of the cumulative credit risk exposure, by type of financial derivative, is as follows:positions (see Note 2.f).
F-150
| Millions of euros | ||||||||||||
| 2011 | 2010 | 2009 | ||||||||||
Credit derivatives | 549 | 855 | 1,942 | |||||||||
Securities derivatives | 2,052 | 2,191 | 2,763 | |||||||||
Fixed-income derivatives | 130 | 95 | 343 | |||||||||
Currency derivatives | 20,243 | 21,139 | 21,568 | |||||||||
Interest rate derivatives | 41,494 | 29,234 | 23,438 | |||||||||
Commodities derivatives | 398 | 252 | 138 | |||||||||
Collateral received | (11,508 | ) | (6,873 | ) | (7,430 | ) | ||||||
|
|
|
|
|
| |||||||
| 53,358 | 46,893 | 42,761 | ||||||||||
|
|
|
|
|
| |||||||
The cumulative credit risk exposure is presented in terms of Equivalent Credit Risk (“ECR”). ECR is composed of the current exposure of the contract (mark to market in case of derivatives) plus the Potential Future Exposure (PFE) which is defined as the maximum expected credit exposure over a specified period of time and that expresses its potential evolution. This metric is internally used for management purposes.
The notional amounts and fair values of the hedging derivatives, by type of hedge, is as follows:
| Millions of euros | ||||||||||||||||||||||||||||||||||||||||||||||||
| Millions of euros | 2013 | 2012 | 2011 | |||||||||||||||||||||||||||||||||||||||||||||
| 2011 | 2010 | 2009 | Notional amount | Fair value | Notional amount | Fair value | Notional amount | Fair value | ||||||||||||||||||||||||||||||||||||||||
| Notional amount | Fair value | Notional amount | Fair value | Notional amount | Fair value | |||||||||||||||||||||||||||||||||||||||||||
Fair value hedges | 158,096 | 3,924 | 212,705 | 2,174 | 203,975 | 3,289 | 229,439 | 1,257 | 195,486 | 1,975 | 158,096 | 3,924 | ||||||||||||||||||||||||||||||||||||
Cash flow hedges | 57,034 | (461 | ) | 43,090 | (285 | ) | 66,194 | (518 | ) | 55,417 | 743 | 56,311 | (209 | ) | 57,034 | (461 | ) | |||||||||||||||||||||||||||||||
Hedges of net investments in foreign operations | 30,903 | (9 | ) | 26,245 | (296 | ) | 8,735 | (128 | ) | 4,213 | 1,018 | 41,129 | (274 | ) | 30,903 | (9 | ) | |||||||||||||||||||||||||||||||
|
|
|
|
|
|
|
|
|
|
|
| |||||||||||||||||||||||||||||||||||||
| 246,033 | 3,454 | 282,040 | 1,593 | 278,904 | 2,643 | 289,069 | 3,018 | 292,926 | 1,492 | 246,033 | 3,454 | |||||||||||||||||||||||||||||||||||||
|
|
|
|
|
|
|
|
|
|
|
| |||||||||||||||||||||||||||||||||||||
Following is thea description of the main hedges (including the results of the hedging instrument and the hedged item attributable to the hedged risk):
i. Fair value and cash flow hedgesHedge accounting
Micro-hedges
The Group, as part of its financial risk management strategy and for the purpose of reducing mismatches in the accounting treatment of its transactions, enters into interest rate, foreign currency or equity hedging derivatives, depending on the nature of the hedged risk.
In line with its objective, the Group classifies its hedges into the following categories:
Interest rate risk hedges of portfolios of financial instruments
The main hedges of portfolios of financial instruments in the Group are described below:
Hedges for the purpose of eliminating exposure to the interest rate risk of mortgage loan portfolios.
|
Hedges for the purpose of covering the interest rate risk of fixed-rate consumer loans
Hedges for the purpose of covering the interest rate risk of floating rate deposits from financial institutions.
F-151
These hedges are recognized mainly at Santander UK plc, Banesto, Santander Consumer Finance Group and Bank Zachodni WBK S.A.
At December 31, 2011, the Santander Group had arranged fair value hedges and cashi. Cash flow hedges to hedge the interest rate risk on portfolios of financial instruments. In the case of the fair value hedges, the gain or loss on the hedged items is recognized in assets or liabilities under Changes in the fair value of hedged items in portfolio hedges of interest rate risk.
At 2011 year-end, gains of EUR 2,024 million and losses of EUR 876 million were recognized in respect of the hedged items of these fair value macro-hedges.
In 2011 a net loss of EUR 83 million (December 31, 2010: EUR 1 million; December 31, 2009: EUR 138 million); attributable to the hedged risk, was recognized in the income statement in relation to the hedging instruments and the hedged items, as a result of the EUR 1,461 million gain on the derivatives and the loss of EUR 1,544 million (2010: expense of EUR 586 million and income of EUR 585 million; 2009: expense of EUR 146 million and income of EUR 8 million).
The fair value of the cash flow hedges, net of the related tax effect, is recognized with a charge or credit tounder Valuation adjustments—adjustments - Cash flow hedges in the Group’s equity. The detail of the terms, from December 31, 2011,2013, within which it is expected that the amounts recognized under Valuation adjustments—adjustments - Cash flow hedges in consolidated equity at that date will be recognized in futurethe consolidated income statements in the coming years is as follows:
| Millions of euros | Millions of euros | |||||||||||||||||||||||||||||||
2011 | Less than 1 year | 1 to 5 years | After 5 years | Total | ||||||||||||||||||||||||||||
2013 | Within 1 year | 1 to 5 Years | More than 5 Years | Total | ||||||||||||||||||||||||||||
Debit balances (losses) | (28 | ) | (347 | ) | (86 | ) | (461 | ) | (116 | ) | (54 | ) | (63 | ) | (233 | ) | ||||||||||||||||
The net amount recognized as an equity valuation adjustment in 2013, as a result of the cash flow hedges, was a reduction of EUR 14 million. The net amount transferred from equity to 2013 profit was EUR 416 million, relating to the accrual to the net interest margin of the cash flow hedges. The impact on 2013 profit and loss of the ineffectiveness of the Group’s cash flow hedges was a net gain of EUR 2 million (see Note 44). ii. Fair value hedges In 2013 a net loss of EUR 117 million was recognized (gains of EUR 1,205 million on hedged items and losses of EUR 1,322 million on hedging derivatives) on cash flow hedging transactions (see Note 44). The main transactions were performed by the Bank, the details being as follows: The financial management area of the Bank, as Parent of the Group, uses derivatives to hedge the interest rate risk and foreign currency risk of the issues of instrumental companies of the Group guaranteed by the Bank. At December 31, 2013, it held hedging derivatives for a notional amount equivalent to EUR 42,101 million, the market value of which represented a gain of EUR 1,745 million which is offset in profit and loss on measurement of the hedged issues. The net result of this hedge is a net loss of EUR 82.3 million. The main currencies of these fair value hedges are: the euro, with a notional amount of EUR 38,273 million and gains on derivatives of EUR 1,785 million, the US dollar, with a notional amount of EUR 1,692 million and gains on derivatives of EUR 91 million, and sterling, with a notional amount of EUR 1,526 million and a loss on derivatives of EUR 122 million. Also, the Bank uses derivatives to hedge the interest rate risk of government and corporate bonds recognized as available-for-sale assets for accounting purposes. At December 31, 2013, the notional amount of these derivatives was EUR 3,935 million and their market value gave rise to a loss of EUR 621 million, which was offset by the result of measuring the bonds at their hedged risk, giving rise to a net overall gain on these hedges of EUR 1.8 million. Lastly, the Bank has two fair value macro-hedges from its merger with Banesto in 2013. At year-end, the notional amount of the related derivatives was EUR 6,096 million and their market value gave rise to a loss of EUR 23.5 million. Including the measurement of the hedged items, the net result of the macro-hedges was a gain of EUR 5.2 million. iii. Foreign currency hedges (net investments in foreign operations)
As part of its financial strategy, the Group hedges the foreign currency risk arising from its investments in non-euro-zone countries. To this end, it arranges foreign currency derivatives in order to take a long position in euros vis-à-vis the local currency of the investment.
At December 31, 2013, the total notional amount of the hedges of these investments was the equivalent of EUR 19,507 million, of which EUR 12,928 million related to foreign currency swaps, EUR 1,942 million to foreign currency options and EUR 4,638 million to spot foreign currency sales.
By currency,
In addition to these hedges with derivatives, spot foreign currency sales were made to offset the structural foreign currency risk: spot sales were made of US dollars against euros, which amounted to EUR 1,293 million and gave rise to a gain of EUR 68 million, and of pounds sterling against euros, which totaled EUR 3,345 million and gave rise to a gain of EUR 214 million.
At 2012 year-end, the Group held foreign currency options in this connection with an equivalent euro notional amount of EUR 12,370 million, of which EUR 10,468 million were denominated in Brazilian reals and EUR 1,902 million in Polish zloty. In 2012 losses amounting to EUR 571 million, which arose from the settlement of options that were exercised, were taken to equity. At 2012 year-end, the market value of the options not yet exercised represented an unrealized net loss of EUR 33 million. In addition to foreign currency options, the Group had also arranged other hedging derivatives to round off its hedging of the structural foreign currency risk of its foreign currency investments: Chilean pesos for a notional amount of EUR 2,327 million, which gave rise to a loss of EUR 360 million; Brazilian reals for a notional amount of EUR 2,722 million, with a loss of EUR 377 million; and Mexican pesos for a total notional amount of EUR 4,172 million, with a loss of EUR 266 million.
Lastly, in addition to these hedges involving derivatives, foreign currency spot sales were made to offset structural foreign currency risk. By currency, spot sales were made of US dollars against euros, which amounted to EUR 1,805 million and gave rise to a gain of EUR 38 million, and of pounds sterling against euros, which totaled EUR 6,377 million and gave rise to a loss of EUR 170 million.
At 2011 year-end, the Group held foreign currency options in this connection with an equivalent euro nominal value of EUR 16,688 million, of which EUR 14,456 million were denominated in Brazilian reais,reals, EUR 942 million in Mexican pesos and EUR 1,290 million in Polish zloty. In 2011 losses amounting to EUR 83 million arising from the settlement of options that were exercised in the year were taken to reserves.equity. At 2011 year-end, the market value of the options not yet exercised represented an unrealisedunrealized loss of EUR 71 million. In addition to these foreign currency options, the Group had also arranged other hedging derivatives to round off its strategy for hedging the structural foreign currency risk of its investments in the following currencies: the Chilean peso,pesos for a total notional amount of EUR 3,515 million, which gave rise to a gain of EUR 95 million in 2011. the poundmillion; pounds sterling for a notional amount of EUR 5,604 million, which gave rise to a loss of EUR 168 million in 2011,2011; and the Mexican peso,pesos for a total notional amount in currency swaps of EUR 2,880 million, with a gain of EUR 86 million.
Lastly, in addition to these hedges involving derivatives, in 2011 the structural currency risk of the underlying carrying amount in US dollars was neutralisedneutralized by hedging it directly through the spot sale of US dollars against euros, for a total amount of EUR 2,216 million, which gave rise to a loss of EUR 195 million in 2011.
Due toIn line with the accounting treatmentpurpose of hedges ofhedging the underlying carrying amount of currency holdings, the overall gains or losses obtained from the derivatives in theseaforementioned hedges are offset from an equity position by the depreciation or appreciationvaluation adjustments in euros of the value of the Group’s investments in its investees.
For their part, the hedges of net investments in foreign operations did not generate gains or losses for ineffectiveness in 2013.
F-152
At 2010 year-end, the Group held foreign currency options in this connection with an equivalent euro nominal value of EUR 13,375 million, of which EUR 10,030 million were denominated in Brazilian reais and EUR 3,345 million in Mexican pesos. In 2010 losses amounting to EUR 1,313 million arising from the settlement of options that were exercised in the year were taken to reserves. At 2010 year-end, the market value of the options not yet exercised represented an unrealised loss of EUR 320 million. In addition to these options, the Group arranged other derivatives hedging the exposure to Chilean pesos with an equivalent euro value of EUR 2,759 million, which gave rise to a loss of EUR 316 million in 2010. The hedge, through short currency positions taken using futures, of the underlying carrying amount in pounds sterling, for a notional amount of EUR 4,930 million, recorded a loss of EUR 109 million in 2010. The overall losses incurred by the hedging derivatives are offset from an equity position by the appreciation in euros of the value of these Group investments.
At 2009 year-end, the Group held foreign currency options in this connection with an equivalent euro nominal value of EUR 9,404 million, of which EUR 7,461 million were denominated in Brazilian reais and EUR 1,943 million in Mexican pesos. In 2009 losses amounting to EUR 292 million arising from the settlement of options that were exercised in the year were taken to reserves. At 2009 year-end, the market value of the options not yet exercised represented an unrealised loss of EUR 153 million. In addition to these options, the Group arranged other derivatives hedging the exposure to Chilean pesos with an equivalent euro value of EUR 1,478 million, which gave rise to a loss of EUR 107 million in 2009. The hedge, through short currency positions, of the underlying carrying amount in pounds sterling, for a notional amount of GBP 4,485 million, recorded a loss of EUR 339 million in 2009. The overall losses incurred by the hedging derivatives are offset from an equity position by the appreciation in euros of the value of these Group investments.
| 37. | Discontinued operations |
No significant operations were discontinued in 20112013, 2012 or 2010.2011.
| a) |
Banco de Venezuela, S.A., Banco Universal
On July 6, 2009, Banco Santander announced that it had closed the sale of the stake in Banco de Venezuela, S.A., Banco Universal to Banco de Desarrollo Económico y Social de Venezuela, a public institution of the Bolivarian Republic of Venezuela, for USD 1,050 million, of which USD 630 million were received in cash on that date and the remainder was received before year-end. This sale did not have a material impact on the Group’s consolidated income statement.
| Profit or loss and net cash flows from discontinued operations |
The detail of the profit or loss from discontinued operations is set forth below.
The comparative figuresbalance sheets and income statements for 2011 and 2012 were restated in order to include the operations classifiedpresent Santander UK’s cards business that was acquired from GE (General Electric) in prior years as discontinued:a discontinued operation (see Note 1.e):
| Millions of euros | ||||||||||||
| 2011 | 2010 | 2009 | ||||||||||
Interest income/(charges) | 15 | 33 | 248 | |||||||||
Income for companies accounted for using the equity method | — | — | 1 | |||||||||
Net fee and commission income | 2 | 2 | 48 | |||||||||
Gains/losses on financial assets and liabilities | — | — | 10 | |||||||||
Exchange differences | — | — | (1 | ) | ||||||||
Other operating income (net) | — | — | (8 | ) | ||||||||
|
|
|
|
|
| |||||||
Total income | 17 | 35 | 298 | |||||||||
Personnel expenses | (5 | ) | (6 | ) | (59 | ) | ||||||
Other general administrative expenses | (8 | ) | (9 | ) | (61 | )�� | ||||||
Depreciation and amortization | (2 | ) | (1 | ) | (11 | ) | ||||||
Provisions | — | — | (19 | ) | ||||||||
Impairment losses on financial assets | (23 | ) | (37 | ) | (104 | ) | ||||||
|
|
|
|
|
| |||||||
Profit (loss) from operations | (21 | ) | (18 | ) | 44 | |||||||
Gains (losses) on disposal of assets not classified as non-current assets held for sale | (2 | ) | (7 | ) | 2 | |||||||
|
|
|
|
|
| |||||||
Profit (loss) before tax | (23 | ) | (25 | ) | 46 | |||||||
|
|
|
|
|
| |||||||
Income tax | (1 | ) | (2 | ) | (15 | ) | ||||||
|
|
|
|
|
| |||||||
Profit (loss) from discontinued operations | (24 | ) | (27 | ) | 31 | |||||||
|
|
|
|
|
| |||||||
F-153
| Millions of euros | ||||||||||||
| 2013 | 2012 | 2011 | ||||||||||
Interest income/(charges) | 84 | 232 | 242 | |||||||||
Net fee and commission income | 22 | 48 | 65 | |||||||||
Gains/losses on financial assets and liabilities | — | — | — | |||||||||
Other operating income/(expenses) | — | (2 | ) | (3 | ) | |||||||
|
|
|
|
|
| |||||||
Total income | 106 | 278 | 304 | |||||||||
Personnel expenses | (7 | ) | (19 | ) | (26 | ) | ||||||
Other general administrative expenses | (23 | ) | (114 | ) | (123 | ) | ||||||
Depreciation and amortization | (2 | ) | (6 | ) | (13 | ) | ||||||
Provisions (net) | (6 | ) | (6 | ) | (11 | ) | ||||||
Impairment losses on financial assets | (6 | ) | (36 | ) | (97 | ) | ||||||
|
|
|
|
|
| |||||||
Gains (losses) on disposal of assets not classified as non-current assets held for sale | (80 | ) | 2 | (2 | ) | |||||||
|
|
|
|
|
| |||||||
Profit (loss) before tax | (18 | ) | 99 | 32 | ||||||||
|
|
|
|
|
| |||||||
Income tax | 3 | (29 | ) | (17 | ) | |||||||
|
|
|
|
|
| |||||||
Profit (loss) from discontinued operations | (15 | ) | 70 | 15 | ||||||||
|
|
|
|
|
| |||||||
Additionally, following is a detail of the net cash flows attributable to the operating, investing and financing activities of discontinued operations.
| Millions of euros | ||||||||||||||||||||||||
| Millions of euros | 2013 | 2012 | 2011 | |||||||||||||||||||||
| 2011 | 2010 | 2009 | ||||||||||||||||||||||
Cash and cash equivalents at beginning of year | — | — | 2,623 | — | — | — | ||||||||||||||||||
Cash flows from operating activities | 2 | (2 | ) | (2,043 | ) | 2 | (3 | ) | 13 | |||||||||||||||
Cash flows from investing activities | (2 | ) | 2 | 143 | (2 | ) | 3 | (13 | ) | |||||||||||||||
Cash flows from financing activities | — | — | (723 | ) | — | — | — | |||||||||||||||||
|
|
|
|
|
| |||||||||||||||||||
Cash and cash equivalents at end of year | — | — | — | — | — | — | ||||||||||||||||||
|
|
|
|
|
| |||||||||||||||||||
The detail of the assets and liabilities associated with the operations discontinued in 2009 is as follows:
| ||||
| ||||
| ||||
| ||||
| ||||
| ||||
| ||||
| ||||
| ||||
| ||||
| ||||
| ||||
| ||||
| ||||
| ||||
| ||||
| ||||
| ||||
| ||||
| ||||
| ||||
| Earnings per share relating to discontinued operations |
The earnings per share relating to discontinued operations were as follows:
| 2011 | 2010 | 2009 | ||||||||||
Basic earnings per share (euros) | (0.00 | ) | (0.00 | ) | 0.00 | |||||||
Diluted earnings per share (euros) | (0.00 | ) | (0.00 | ) | 0.00 | |||||||
| 2013 | 2012 | 2011 | ||||||||||
Basic earnings per share (euros) | (0.00 | ) | 0.01 | 0.00 | ||||||||
Diluted earnings per share (euros) | (0.00 | ) | 0.01 | 0.00 | ||||||||
F-154
| 38. | Interest and similar income |
Interest and similar income in the consolidated income statement comprises the interest accruing in the year on all financial assets with an implicit or explicit return, calculated by applying the effective interest method, irrespective of measurement at fair value; and the rectifications of income as a result of hedge accounting. Interest is recognized gross, without deducting any tax withheld at source.
The detail of the main interest and similar income items earned in 2012, 2011 2010 and 20092010 is as follows:
| Millions of euros | ||||||||||||||||||||||||
| Millions of euros | 2013 | 2012 | 2011 | |||||||||||||||||||||
| 2011 | 2010 | 2009 | ||||||||||||||||||||||
Balances with the Bank of Spain and other central banks | 3,192 | 1,933 | 357 | 2,701 | 2,693 | 3,192 | ||||||||||||||||||
Loans and advances to Credit institutions | 1,061 | 1,045 | 2,521 | |||||||||||||||||||||
Loans and advances to credit institutions | 766 | 1,034 | 1,061 | |||||||||||||||||||||
Debt instruments | 7,406 | 6,232 | 5,586 | 6,435 | 7,093 | 7,406 | ||||||||||||||||||
Loans and advances to customers | 46,909 | 41,854 | 42,082 | 40,206 | 46,127 | 46,670 | ||||||||||||||||||
Insurance contracts linked to pensions (Note 25) | 86 | 90 | 95 | 11 | 45 | 86 | ||||||||||||||||||
Other interest | 2,202 | 1,753 | 2,532 | 1,328 | 1,799 | 2,203 | ||||||||||||||||||
|
|
|
|
|
| |||||||||||||||||||
| 60,856 | 52,907 | 53,173 | 51,447 | 58,791 | 60,618 | |||||||||||||||||||
|
|
|
|
|
| |||||||||||||||||||
Most of the interest and similar income was generated by the Group’s financial assets that are measured either at amortized cost or at fair value through equity.
| 39. | Interest expense and similar charges |
Interest expense and similar charges in the consolidated income statement includes the interest accruing in the year on all financial liabilities with an implicit or explicit return, including remuneration in kind, calculated by applying the effective interest method, irrespective of measurement at fair value; the rectifications of cost as a result of hedge accounting; and the interest cost attributable to provisions recorded for pensions.
The detail of the main items of interest expense and similar charges accrued in 2012, 2011 2010 and 20092010 is as follows:
| Millions of euros | Millions of euros | |||||||||||||||||||||||
| 2011 | 2010 | 2009 | 2013 | 2012 | 2011 | |||||||||||||||||||
Deposit from the Bank of Spain and other central banks | 448 | 304 | 296 | |||||||||||||||||||||
Deposit from credit institutions | 2,427 | 1,369 | 2,989 | |||||||||||||||||||||
Balances with the Bank of Spain and other central banks | 118 | 522 | 448 | |||||||||||||||||||||
Deposits from credit institutions | 1,852 | 1,959 | 2,417 | |||||||||||||||||||||
Customer deposits | 16,819 | 13,446 | 11,811 | 14,805 | 16,403 | 16,818 | ||||||||||||||||||
Marketable debt securities | 6,430 | 4,959 | 6,237 | 6,880 | 7,277 | 6,430 | ||||||||||||||||||
Subordinated liabilities (Note 23) | 1,940 | 2,230 | 2,354 | 1,260 | 1,650 | 1,940 | ||||||||||||||||||
Provisions for pensions (Note 25) | 357 | 481 | 482 | 363 | 398 | 357 | ||||||||||||||||||
Other interest | 1,614 | 894 | 2,705 | 234 | 659 | 1,614 | ||||||||||||||||||
|
|
|
|
|
| |||||||||||||||||||
| 30,035 | 23,683 | 26,874 | 25,512 | 28,868 | 30,024 | |||||||||||||||||||
|
|
|
|
|
| |||||||||||||||||||
Most of the interest expense and similar charges was generated by the Group’s financial liabilities that are measured at amortized cost.
F-155
| 40. | Income from equity instruments |
Income from equity instruments includes the dividends and payments on equity instruments out of profits generated by investees after the acquisition of the equity interest.
The detail of Income from equity instruments is as follows:
| Millions of euros | ||||||||||||||||||||||||
| Millions of euros | 2013 | 2012 | 2011 | |||||||||||||||||||||
| 2011 | 2010 | 2009 | ||||||||||||||||||||||
Equity instruments classified as: | ||||||||||||||||||||||||
Financial liabilities held for trading | 268 | 242 | 238 | |||||||||||||||||||||
Financial assets held for trading | 264 | 290 | 268 | |||||||||||||||||||||
Available-for-sale financial assets | 126 | 120 | 198 | 114 | 133 | 126 | ||||||||||||||||||
|
|
|
|
|
| |||||||||||||||||||
| 394 | 362 | 436 | 378 | 423 | 394 | |||||||||||||||||||
|
|
|
|
|
| |||||||||||||||||||
| 41. | Income |
Income forfrom companies accounted for using the equity method comprises the amount of profit or loss attributable to the Group generated during the year by associates.associates and jointly controlled entities.
The detail of Income forfrom companies accounted for using the equity method is as follows:
| Millions of euros | ||||||||||||
| 2011 | 2010 | 2009 | ||||||||||
ZS Insurance América, S.L. | 59 | — | — | |||||||||
Sovereign Bancorp, Inc. (*) | — | — | (16 | ) | ||||||||
Other companies | (2 | ) | 17 | 15 | ||||||||
|
|
|
|
|
| |||||||
| 57 | 17 | (1 | ) | |||||||||
|
|
|
|
|
| |||||||
| Millions of euros | ||||||||||||
| 2013 | 2012 | 2011 | ||||||||||
Santander Consumer USA Inc. | 322 | 349 | — | |||||||||
Zurich Santander Insurance América, S.L. | 138 | 134 | 59 | |||||||||
Metrovacesa, S.A. | (40 | ) | (100 | ) | — | |||||||
Other companies | 80 | 44 | (2 | ) | ||||||||
|
|
|
|
|
| |||||||
| 500 | 427 | 57 | ||||||||||
|
|
|
|
|
| |||||||
| 42. | Fee and commission income |
Fee and commission income comprises the amount of all fees and commissions accruing in favourfavor of the Group in the year, except those that form an integral part of the effective interest rate on financial instruments.
The detail of Fee and commission income is as follows:
F-156
| Millions of euros | ||||||||||||||||||||||||
| Millions of euros | 2013 | 2012 | 2011 | |||||||||||||||||||||
| 2011 | 2010 | 2009 | ||||||||||||||||||||||
Collection and payment services: | ||||||||||||||||||||||||
Bills | 317 | 316 | 327 | 333 | 336 | 317 | ||||||||||||||||||
Demand accounts | 1,028 | 995 | 859 | 1,163 | 1,209 | 1,028 | ||||||||||||||||||
Cards | 2,348 | 1,980 | 1,762 | 2,890 | 2,746 | 2,291 | ||||||||||||||||||
Cheques and other | 290 | 286 | 280 | 165 | 226 | 290 | ||||||||||||||||||
Orders | 432 | 351 | 309 | 347 | 347 | 432 | ||||||||||||||||||
|
|
|
|
|
| |||||||||||||||||||
| 4,415 | 3,928 | 3,537 | 4,898 | 4,864 | 4,358 | |||||||||||||||||||
|
|
|
|
|
| |||||||||||||||||||
Marketing of non-banking financial products: | ||||||||||||||||||||||||
Investment funds | 1,195 | 1,198 | 1,070 | 1,040 | 1,074 | 1,195 | ||||||||||||||||||
Pension funds | 145 | 152 | 149 | 163 | 143 | 145 | ||||||||||||||||||
Insurance | 2,493 | 2,161 | 1,964 | 2,399 | 2,451 | 2,462 | ||||||||||||||||||
|
|
|
|
|
| |||||||||||||||||||
| 3,833 | 3,511 | 3,183 | 3,602 | 3,668 | 3,802 | |||||||||||||||||||
|
|
|
|
|
| |||||||||||||||||||
Securities services: | ||||||||||||||||||||||||
Securities underwriting and placement | 204 | 302 | 254 | 208 | 204 | 204 | ||||||||||||||||||
Securities trading | 337 | 310 | 325 | 316 | 323 | 337 | ||||||||||||||||||
Administration and custody | 217 | 222 | 243 | 212 | 214 | 217 | ||||||||||||||||||
Asset management | 77 | 84 | 67 | 107 | 103 | 77 | ||||||||||||||||||
|
|
|
|
|
| |||||||||||||||||||
| 835 | 918 | 889 | 843 | 844 | 835 | |||||||||||||||||||
|
|
|
|
|
| |||||||||||||||||||
Other: | ||||||||||||||||||||||||
Foreign exchange | 252 | 178 | 155 | 243 | 229 | 252 | ||||||||||||||||||
Financial guarantees | 501 | 530 | 485 | 476 | 484 | 501 | ||||||||||||||||||
Commitment fees | 233 | 213 | 200 | 329 | 282 | 233 | ||||||||||||||||||
Other fees and commissions | 2,680 | 2,403 | 2,277 | 2,082 | 2,361 | 2,659 | ||||||||||||||||||
|
|
|
|
|
| |||||||||||||||||||
| 3,666 | 3,324 | 3,117 | 3,130 | 3,356 | 3,645 | |||||||||||||||||||
|
|
|
|
|
| |||||||||||||||||||
| 12,749 | 11,681 | 10,726 | 12,473 | 12,732 | 12,640 | |||||||||||||||||||
|
|
|
|
|
| |||||||||||||||||||
| Fee and commission expense |
Fee and commission expense shows the amount of all fees and commissions paid or payable by the Group in the year, except those that form an integral part of the effective interest rate on financial instruments.
The detail of Fee and commission expense is as follows:
| Millions of euros | ||||||||||||||||||||||||
| Millions of euros | 2013 | 2012 | 2011 | |||||||||||||||||||||
| 2011 | 2010 | 2009 | ||||||||||||||||||||||
Fees and commissions assigned to third parties | 1,449 | 1,223 | 1,051 | 1,718 | 1,616 | 1,404 | ||||||||||||||||||
Of which: Cards | 1,034 | 842 | 728 | 1,279 | 1,203 | 990 | ||||||||||||||||||
Brokerage fees on lending and deposit transactions | 44 | 42 | 29 | 37 | 36 | 44 | ||||||||||||||||||
Other fees and commissions | 784 | 681 | 566 | 957 | 819 | 784 | ||||||||||||||||||
|
|
|
|
|
| |||||||||||||||||||
| 2,277 | 1,946 | 1,646 | 2,712 | 2,471 | 2,232 | |||||||||||||||||||
|
|
|
|
|
| |||||||||||||||||||
| 44. | Gains/losses on financial assets and liabilities |
Gains/losses on financial assets and liabilities includes the amount of the valuation adjustments of financial instruments, except those attributable to interest accrued as a result of application of the effective interest method and to allowances, and the gains or losses obtained from the sale and purchase thereof.
F-157
| a) | Breakdown |
The detail, by origin, of Gains/losses on financial assets and liabilities is as follows:
| Millions of euros | Millions of euros | |||||||||||||||||||||||
| 2011 | 2010 | 2009 | 2013 | 2012 | 2011 | |||||||||||||||||||
Financial assets and liabilities held for trading (*) | 1,733 | 1,460 | 2,113 | |||||||||||||||||||||
Other financial instruments at fair value through profit or loss (*) | 21 | 70 | 198 | (6 | ) | 159 | 21 | |||||||||||||||||
Financial instruments not measured at fair value through profit or loss | 803 | 791 | 1,631 | 1,622 | 1,789 | 803 | ||||||||||||||||||
Of which: Available-for-sale financial assets | 627 | 1,020 | 862 | 1,490 | 915 | 627 | ||||||||||||||||||
Of which: | ||||||||||||||||||||||||
Debt instruments | 328 | 438 | 440 | 1,345 | 576 | 328 | ||||||||||||||||||
Equity instruments | 299 | 582 | 422 | 145 | 339 | 299 | ||||||||||||||||||
Of which: Other | 176 | (229 | ) | 769 | 132 | 874 | 176 | |||||||||||||||||
Of which: | ||||||||||||||||||||||||
Due to change of shares | 144 | — | 724 | |||||||||||||||||||||
Due to repurchase of securitizations | — | — | 97 | |||||||||||||||||||||
Hedging derivatives and other | (99 | ) | (9 | ) | (125 | ) | ||||||||||||||||||
Other financial assets and liabilities held for trading (*) | 2,113 | 1,312 | 2,098 | |||||||||||||||||||||
Due to exchange and repurchase of securities | — | 870 | 144 | |||||||||||||||||||||
Hedging derivatives (Note 36) | (115 | ) | (79 | ) | (99 | ) | ||||||||||||||||||
|
|
|
|
|
| |||||||||||||||||||
| 2,838 | 2,164 | 3,802 | 3,234 | 3,329 | 2,838 | |||||||||||||||||||
|
|
|
|
|
| |||||||||||||||||||
| Includes the net gain or loss arising from transactions involving debt securities, equity instruments and derivatives included in this portfolio, since the Group manages its risk in these instruments on a global basis. |
Gains/losses dueDue to exchange of shares and repurchase of securitizationssecurities
In July 2009, the Group offered the holders of certain securities issued by various Group companies (with a total nominal amount of approximately EUR 9,100 million) the possibility of exchanging these securities for newly-issued Group securities plus a cash premium. Holders of securities with a cumulative nominal amount of EUR 4,527 million subscribed to this exchange. Since the characteristics of the securities received and delivered in the exchange differ substantially, the Group wrote down the original financial liability and recognized a new financial liability for the securities delivered, and credited to income an amount of EUR 724 million relating to the difference between the carrying amount of the financial liability written down and the value of the consideration delivered.
Additionally, in August 2009 the Group invited the holders of securitization bonds to submit offers for the sale of their securities. The end nominal amount of bonds repurchased by the Group amounted to EUR 609 million, and the Group recognized with a credit to income an amount of EUR 97 million relating to the difference between the carrying amount of the financial liability written down and the value of the consideration delivered in cash.
On January 11, 2010, Banco Santander, S.A. invited the holders of subordinated bonds (corresponding to 13 different series issued by various Santander Group entities, with a combined outstanding amount of approximately EUR 3,300 million) to submit offers for the sale of all or part of their securities, to be purchased in cash by Banco Santander. The level of acceptance of the invitation was approximately 60% and the total nominal amount of the securities accepted for purchase was approximately EUR 2,000 million.
Also, on February 17, 2010, Banco Santander, S.A. invited the holders of perpetual subordinated bonds issued by Santander Perpetual, S.A. (Sole-Shareholder Company), with a combined outstanding nominal amount of approximately USD 1,500 million (of which Santander holds approximately USD 350 million) to submit offers for the sale of all or part of their securities, to be purchased in cash by Banco Santander. The nominal amount accepted was USD 1,093 million, 95% of the total targeted by the offer.
These transactions did not give rise to any significant gains or losses in 2010.
F-158
Lastly, November 15, 2011, Banco Santander, S.A. offered the holders of subordinated bonds issued by Santander Issuances, S.A. (Sole-Shareholder Company) with a combined outstanding nominal amount of approximately EUR 5,499 million and GBP 1,143 million the possibility of exchanging these securities for newly-issued, non-subordinated fixed-income securities of the Group denominated in pounds sterling and euros. Holders of securities with a cumulative nominal amount of EUR 1,256 million and GBP 217 million subscribed to this exchange. Since the characteristics of the securities received and delivered in the exchange differ substantially, the Group wrote down the original financial liability and recognized a new financial liability for the securities delivered, and credited to income an amount of EUR 144 million (EUR 100 million net of the related tax effect) relating to the difference between the carrying amount of the financial liability written down and the fair value of the consideration delivered.
In 2012 the Group performed several securities exchange and repurchase transactions for which EUR 870 million were credited to income in that year. In July the Group offered the holders of certain securities issued by Santander UK plc the possibility of exchanging these securities for newly-issued Santander UK plc securities; in August Banco Santander, S.A. and Santander Financial Exchanges Limited invited the holders of securities of various issues of Santander Finance Preferred, S.A. (Sole-Shareholder Company), Santander Perpetual, S.A. (Sole-Shareholder Company) and Santander Issuances, S.A. (Sole-Shareholder Company) to submit offers for the sale of their securities, to be purchased in cash; in February Banco Español de Crédito, S.A. offered the holders of preference shares of various issues the possibility of exchanging these securities for securities of a new non-convertible bond issue and in September it offered the holders of securities of various issues to submit an offer for the sale of their securities, to be purchased in cash.
| b) | Financial assets and liabilities at fair value through profit or loss |
The detail of the amount of the asset balances is as follows:
| Millions of euros | ||||||||||||||||||||||||
| Millions of euros | 2013 | 2012 | 2011 | |||||||||||||||||||||
| 2011 | 2010 | 2009 | ||||||||||||||||||||||
Loans and advances to credit institutions | 9,337 | 35,047 | 22,196 | 18,947 | 20,115 | 9,337 | ||||||||||||||||||
Loans and advances to customers | 19,804 | 8,532 | 18,405 | 18,275 | 23,098 | 19,804 | ||||||||||||||||||
Debt instruments | 55,353 | 62,475 | 57,286 | 44,716 | 46,561 | 55,353 | ||||||||||||||||||
Equity instruments | 5,209 | 17,119 | 15,125 | 5,833 | 6,180 | 5,209 | ||||||||||||||||||
Derivatives | 102,498 | 73,069 | 59,856 | 58,899 | 110,319 | 102,498 | ||||||||||||||||||
|
|
|
|
|
| |||||||||||||||||||
| 192,201 | 196,242 | 172,868 | 146,670 | 206,273 | 192,201 | |||||||||||||||||||
|
|
|
|
|
| |||||||||||||||||||
The foregoing table shows the maximum credit risk exposure of these assets. The Group mitigates and reduces this exposure as follows:
With respect to derivatives, the Group has entered into framework agreements with a large number of credit institutions and customers for the netting-off of asset positions and the provision of collateral for non-payment. For derivatives arranged with customers, the Group also applies a risk premium accrual policy.
At December 31, 2011,2013, the actual credit risk exposure of the derivatives was EUR 53,358 million (see Note 36).49,994 million.
Loans and advances to credit institutions and Loans and advances to customers included reverse repos amounting to EUR 21,54031,335 million at December 31, 2011.
Also, mortgage-backed assets totalledtotaled EUR 4,8992,491 million.
Debt instruments include EUR 41,19936,047 million of Spanish and foreign government securities.
At December 31, 2011,2013, the amount of the change in the year in the fair value of financial assets at fair value through profit or loss attributable to variations in their credit risk (spread) was not material.
The detail of the amount of the liability balances is as follows:
| Millions of euros | ||||||||||||
| 2011 | 2010 | 2009 | ||||||||||
Deposits from central banks | (9,250 | ) | (12,942 | ) | (13,088 | ) | ||||||
Deposits from credit institutions | (17,519 | ) | (47,634 | ) | (55,876 | ) | ||||||
Customer deposits | (43,556 | ) | (34,991 | ) | (19,294 | ) | ||||||
Marketable debt securities | (8,262 | ) | (4,644 | ) | (5,473 | ) | ||||||
Short positions | (10,187 | ) | (12,302 | ) | (5,140 | ) | ||||||
Other financial liabilities | — | — | (303 | ) | ||||||||
Derivatives | (103,083 | ) | (75,279 | ) | (58,713 | ) | ||||||
|
|
|
|
|
| |||||||
| (191,857 | ) | (187,792 | ) | (157,887 | ) | |||||||
|
|
|
|
|
| |||||||
F-159
The difference between the amount recognized as liabilities at fair value and the amount which the Group would contractually be required to pay to the holders of the related obligations at maturity, in other than derivative transactions, was EUR 45 million at December 31, 2011.
| Millions of euros | ||||||||||||
| 2013 | 2012 | 2011 | ||||||||||
Deposits from central banks | (5,963 | ) | (2,142 | ) | (9,250 | ) | ||||||
Deposits from credit institutions | (17,112 | ) | (19,154 | ) | (17,519 | ) | ||||||
Customer deposits | (34,984 | ) | (37,535 | ) | (43,556 | ) | ||||||
Marketable debt securities | (4,087 | ) | (4,905 | ) | (8,262 | ) | ||||||
Short positions | (15,951 | ) | (15,181 | ) | (10,187 | ) | ||||||
Derivatives | (58,887 | ) | (109,743 | ) | (103,083 | ) | ||||||
|
|
|
|
|
| |||||||
| (136,984 | ) | (188,660 | ) | (191,857 | ) | |||||||
|
|
|
|
|
| |||||||
| 45. | Exchange differences |
Exchange differences shows basically the gains or losses on currency dealings, the differences that arise on translations of monetary items in foreign currencies to the functional currency, and those disclosed on non-monetary assets in foreign currency at the time of their disposal.
| 46. | Other operating income and Other operating expenses |
Other operating income and Other operating expenses in the consolidated income statementstatements include:
| Millions of euros | Millions of euros | |||||||||||||||||||||||
| 2011 | 2010 | 2009 | 2013 | 2012 | 2011 | |||||||||||||||||||
Insurance activity income | 392 | 378 | 339 | |||||||||||||||||||||
Insurance activity | 117 | 593 | 392 | |||||||||||||||||||||
Income from insurance and reinsurance contracts issued | 6,748 | 7,162 | 7,113 | 4,724 | 5,541 | 6,748 | ||||||||||||||||||
Of which: | ||||||||||||||||||||||||
Insurance and reinsurance premium income | 6,547 | 6,845 | 6,950 | 4,513 | 4,667 | 6,547 | ||||||||||||||||||
Reinsurance income | 201 | 317 | 163 | |||||||||||||||||||||
Reinsurance income (Note 15) | 211 | 874 | 201 | |||||||||||||||||||||
Expenses of insurance and reinsurance contracts | (6,356 | ) | (6,784 | ) | (6,774 | ) | (4,607 | ) | (4,948 | ) | (6,356 | ) | ||||||||||||
Of which: | ||||||||||||||||||||||||
Claims paid and other insurance-related expenses | (4,852 | ) | (5,816 | ) | (3,016 | ) | (4,497 | ) | (4,440 | ) | (4,852 | ) | ||||||||||||
Net provisions for insurance contract liabilities | (1,202 | ) | (689 | ) | (3,540 | ) | 382 | (323 | ) | (1,202 | ) | |||||||||||||
Reinsurance premiums paid | (302 | ) | (279 | ) | (218 | ) | (492 | ) | (185 | ) | (302 | ) | ||||||||||||
Non-financial services | 151 | 135 | 140 | 93 | 137 | 151 | ||||||||||||||||||
Sales and income from the provision of non-financial services | 400 | 340 | 378 | 322 | 369 | 400 | ||||||||||||||||||
Cost of sales | (249 | ) | (205 | ) | (238 | ) | (229 | ) | (232 | ) | (249 | ) | ||||||||||||
Other operating income and expenses | (525 | ) | (407 | ) | (335 | ) | (501 | ) | (620 | ) | (522 | ) | ||||||||||||
Other operating income | 902 | 693 | 438 | 857 | 783 | 902 | ||||||||||||||||||
Of which, fees and commissions offsetting direct costs | 119 | 70 | 117 | 115 | 130 | 119 | ||||||||||||||||||
Other operating expenses | (1,427 | ) | (1,100 | ) | (773 | ) | (1,358 | ) | (1,403 | ) | (1,424 | ) | ||||||||||||
Of which, Deposit Guarantee Fund | (346 | ) | (307 | ) | (318 | ) | (559 | ) | (530 | ) | (346 | ) | ||||||||||||
|
|
|
|
|
| |||||||||||||||||||
| 18 | 106 | 144 | (291 | ) | 110 | 21 | ||||||||||||||||||
|
|
|
|
|
| |||||||||||||||||||
Most of the Bank’s insurance activity is carried on in life insurance.
| 47. | Personnel expenses |
| a) | Breakdown |
The detail of Personnel expenses is as follows:
| Millions of euros | ||||||||||||
| 2011 | 2010 | 2009 | ||||||||||
Wages and salaries | 7,399 | 6,636 | 6,060 | |||||||||
Social security costs | 1,314 | 1,188 | 1,055 | |||||||||
Additions to provisions for defined benefit pension plans (Note 25) | 138 | 146 | 176 | |||||||||
Contributions to defined contribution pension funds (Note 25) | 138 | 151 | 114 | |||||||||
Share-based remuneration costs | 185 | 153 | 148 | |||||||||
Of which, Bank directors | 4 | 5 | 6 | |||||||||
Other Personnel expenses | 1,152 | 1,055 | 898 | |||||||||
|
|
|
|
|
| |||||||
| 10,326 | 9,329 | 8,451 | ||||||||||
|
|
|
|
|
| |||||||
| Millions of euros | ||||||||||||
| 2013 | 2012 | 2011 | ||||||||||
Wages and salaries | 7,215 | 7,343 | 7,382 | |||||||||
Social security costs | 1,296 | 1,353 | 1,313 | |||||||||
Additions to provisions for defined benefit pension plans (Note 25) | 88 | 145 | 138 | |||||||||
Contributions to defined contribution pension funds (Note 25) | 223 | 155 | 137 | |||||||||
Share-based remuneration costs | 103 | 133 | 185 | |||||||||
Of which, Bank directors (*) | 1 | 4 | 4 | |||||||||
Other personnel expenses | 1,144 | 1,177 | 1,150 | |||||||||
|
|
|
|
|
| |||||||
| 10,069 | 10,306 | 10,305 | ||||||||||
|
|
|
|
|
| |||||||
| (*) | Relating to amounts associated with the performance share plans |
F-160
| b) | Headcount |
The average number of employees in the Group, by professional category, was as follows:
| Average number of employees (**) | Average number of employees (**) | |||||||||||||||||||||||
| 2011 | 2010 | 2009 | 2013 | 2012 | 2011 | |||||||||||||||||||
The Bank: | ||||||||||||||||||||||||
The Bank(**): | ||||||||||||||||||||||||
Senior management (*) | 100 | 100 | 87 | 133 | 96 | 100 | ||||||||||||||||||
Other line personnel | 16,502 | 16,289 | 16,292 | 23,403 | 16,545 | 16,502 | ||||||||||||||||||
Clerical staff | 3,048 | 3,284 | 3,625 | 3,421 | 2,845 | 3,048 | ||||||||||||||||||
General services personnel | 30 | 31 | 33 | 28 | 29 | 30 | ||||||||||||||||||
|
|
|
|
|
| |||||||||||||||||||
| 19,680 | 19,704 | 20,037 | 26,985 | 19,515 | 19,680 | |||||||||||||||||||
Banesto | 9,049 | 9,272 | 9,678 | |||||||||||||||||||||
Banesto(**) | — | 8,762 | 9,049 | |||||||||||||||||||||
Rest of Spain | 7,236 | 6,749 | 5,970 | 6,931 | 6,708 | 7,236 | ||||||||||||||||||
Santander UK plc | 20,241 | 18,845 | 20,809 | 19,773 | 20,355 | 20,061 | ||||||||||||||||||
Banco Santander (Brasil) S.A. | 53,431 | 53,829 | 51,339 | |||||||||||||||||||||
Other companies (**) | 77,596 | 64,510 | 62,243 | |||||||||||||||||||||
Banco Santander (Brasil), S.A. | 51,462 | 53,543 | 53,431 | |||||||||||||||||||||
Other companies(***) | 81,222 | 79,752 | 77,596 | |||||||||||||||||||||
|
|
|
|
|
| |||||||||||||||||||
| 187,233 | 172,909 | 170,076 | 186,373 | 188,635 | 187,053 | |||||||||||||||||||
|
|
|
|
|
| |||||||||||||||||||
| Categories of deputy assistant executive vice presidents and above, including senior management. |
| Banesto employees are included under Banco Santander, S.A. in 2013 following the merger (see Note 3.b.xiii). |
| (***) | Excluding personnel assigned to discontinued operations. |
The functional breakdown, by gender, at December 31, 20112013 is as follows:
| Functional breakdown by gender | ||||||||||||||||||||||||||||||||||||||||||||||||
| Functional breakdown by gender | Senior executives | Other executives | Other personnel | |||||||||||||||||||||||||||||||||||||||||||||
| Senior executives | Other executives | Other personnel | Men | Women | Men | Women | Men | Women | ||||||||||||||||||||||||||||||||||||||||
| Men | Women | Men | Women | Men | Women | |||||||||||||||||||||||||||||||||||||||||||
Continental Europe | 1,537 | 380 | 6,700 | 3,143 | 24,134 | 27,039 | 1,339 | 269 | 5,824 | 2,711 | 23,035 | 28,770 | ||||||||||||||||||||||||||||||||||||
United Kingdom | 134 | 29 | 977 | 384 | 9,957 | 15,239 | 162 | 34 | 1,140 | 490 | 9,100 | 13,797 | ||||||||||||||||||||||||||||||||||||
Latin America | 708 | 114 | 5,433 | 2,843 | 39,175 | 55,423 | 660 | 117 | 5,387 | 3,109 | 36,213 | 50,801 | ||||||||||||||||||||||||||||||||||||
|
|
|
|
|
|
|
|
|
|
|
| |||||||||||||||||||||||||||||||||||||
| 2,379 | 523 | 13,110 | 6,370 | 73,266 | 97,701 | 2,161 | 420 | 12,351 | 6,310 | 68,348 | 93,368 | |||||||||||||||||||||||||||||||||||||
|
|
|
|
|
|
|
|
|
|
|
| |||||||||||||||||||||||||||||||||||||
The same information, expressed in percentage terms at December 31, 2011,2013, is as follows:
| Functional breakdown by gender | ||||||||||||||||||||||||||||||||||||||||||||||||
| Functional breakdown by gender | Senior executives | Other executives | Other personnel | |||||||||||||||||||||||||||||||||||||||||||||
| Senior executives | Other executives | Other personnel | Men | Women | Men | Women | Men | Women | ||||||||||||||||||||||||||||||||||||||||
| Men | Women | Men | Women | Men | Women | |||||||||||||||||||||||||||||||||||||||||||
Continental Europe | 80 | % | 20 | % | 68 | % | 32 | % | 47 | % | 53 | % | 83 | % | 17 | % | 68 | % | 32 | % | 44 | % | 56 | % | ||||||||||||||||||||||||
United Kingdom | 82 | % | 18 | % | 72 | % | 28 | % | 40 | % | 60 | % | 83 | % | 17 | % | 70 | % | 30 | % | 40 | % | 60 | % | ||||||||||||||||||||||||
Latin America | 86 | % | 14 | % | 66 | % | 34 | % | 41 | % | 59 | % | 85 | % | 15 | % | 63 | % | 37 | % | 42 | % | 58 | % | ||||||||||||||||||||||||
|
|
|
|
|
|
|
|
|
|
|
| |||||||||||||||||||||||||||||||||||||
| 82 | % | 18 | % | 67 | % | 33 | % | 43 | % | 57 | % | 84 | % | 16 | % | 66 | % | 34 | % | 42 | % | 58 | % | |||||||||||||||||||||||||
|
|
|
|
|
|
|
|
|
|
|
| |||||||||||||||||||||||||||||||||||||
The labourlabor relations between employees and the various Group companies are governed by the related collective labour agreements or similar regulations.
| c) | Share-based payments |
The main share-based payments granted by the Group in force at December 31, 2011, 20102013, 2012 and 20092011 are described below.
F-161
i. Bank
In recent years, as part of the deferredThe variable remuneration the Group has set up remuneration systems tied to the performance of the stock market price of the shares of the Bank, based on the achievement of certain targets indicated below:
| Number of | Euros | Date of commencement | Date of expiry | |||||||||||||||||||||||||
| shares (in thousands) | Exercise price | Year granted | Employee group | Number of persons | of exercise period | of exercise period | ||||||||||||||||||||||
Plans outstanding at 01/01/09 | 72,381 | |||||||||||||||||||||||||||
|
| |||||||||||||||||||||||||||
Shares delivered (Plan I09) | (8,979 | ) | — | 2007 | Executives | (5,066 | ) | 06/23/07 | 07/31/09 | |||||||||||||||||||
Options cancelled, net (Plan I06) | (29,073 | ) | 9,09 | — | Executives | (957 | ) | 01/15/08 | 01/15/09 | |||||||||||||||||||
Options cancelled, net (Plan I09) | (1,470 | ) | — | 2007 | Executives | (410 | ) | 06/23/07 | 07/31/09 | |||||||||||||||||||
Options granted (Plan I12) | 18,867 | — | 2009 | Executives | 6,510 | 06/19/09 | 07/31/12 | |||||||||||||||||||||
|
| |||||||||||||||||||||||||||
Plans outstanding at 12/31/09 | 51,726 | |||||||||||||||||||||||||||
|
| |||||||||||||||||||||||||||
Shares delivered (Plan I10) | (12,947 | ) | — | 2007 | Executives | (4,930 | ) | 06/23/07 | 07/31/10 | |||||||||||||||||||
Options cancelled, net (Plan I10) | (2,790 | ) | — | 2007 | Executives | (577 | ) | 06/23/07 | 07/31/10 | |||||||||||||||||||
Options granted (Plan I13) | 19,613 | — | 2010 | Executives | 6,782 | 06/11/10 | 07/31/13 | |||||||||||||||||||||
|
| |||||||||||||||||||||||||||
Plans outstanding at 12/31/10 | 55,602 | |||||||||||||||||||||||||||
|
| |||||||||||||||||||||||||||
Shares delivered (Plan I11) | (13,472 | ) | — | 2008 | Executives | (5,379 | ) | 06/21/08 | 07/31/11 | |||||||||||||||||||
Options cancelled, net (Plan I11) | (3,650 | ) | — | 2008 | Executives | (392 | ) | 06/21/08 | 07/31/11 | |||||||||||||||||||
Options granted (Plan I14) | 16,286 | — | 2011 | Executives | 6,500 | 06/17/11 | 07/31/14 | |||||||||||||||||||||
|
| |||||||||||||||||||||||||||
Plans outstanding at 12/31/11 | 54,766 | |||||||||||||||||||||||||||
|
| |||||||||||||||||||||||||||
Of which: | ||||||||||||||||||||||||||||
Plan I12 | 18,867 | — | 2009 | Executives | 6,510 | 06/19/09 | 07/31/12 | |||||||||||||||||||||
Plan I13 | 19,613 | — | 2010 | Executives | 6,782 | 06/11/10 | 07/31/13 | |||||||||||||||||||||
Plan I14 | 16,286 | — | 2011 | Executives | 6,500 | 06/17/11 | 07/31/14 | |||||||||||||||||||||
Long-term incentive policy
At the board meeting on March 26, 2007, following the report of the appointments and remuneration committee, the Bank’s directors approved a long-term incentive policy aimed atfor the Bank’s executive directors and certain executive personnel of the Bank and of other Santander Group companies. This policy, through which the deferred share-based variable remuneration is paid,companies includes Bank share-based payments, and itsthe implementation of which requires, in conformity with the law and the Bank’s Bylaws, specific resolutions to be adopted by the general meeting.
Were it necessary or advisable for legal, regulatory or other similar reasons, the delivery mechanisms described below may be adapted in specific cases without altering the maximum number of shares linked to the plan or the essential conditions to which the delivery thereof is subject. These adaptations may involve replacing the delivery of shares with the delivery of cash amounts of an equal value.
The plans shaping the aforementioned incentive policy are as follows: (i) performance share plan; (ii) obligatory investment share plan; (iii) deferred conditional delivery share plan and (iv) deferred conditional variable remuneration plan. The characteristics of the plans are set forth below:
(i) Performance share plan
| (i) | Performance share plan |
TheThis deferred share-based variable remuneration iswas instrumented through a multiannual incentive plan which is payable in shares of the Bank. The beneficiaries of the plan are the executive directors and other members of senior management, together with any other Group executives determined by the board of directors or, when delegated by it, the executive committee.committee, except for Plan PI14 (approved in 2011), of which the executive directors and senior executives who participate in the deferred conditional variable remuneration plan are not beneficiaries.
F-162
This plan involves successive three-year cycles of share deliveries to the beneficiaries, so that each year one cycle will begin and, from 2009 onwards, another cycle will also end. The aim is to establish an adequate sequence between the end of the incentive programme linked to the previous Plan I06 and the successive cycles of this plan. Thus, the first two cycles commenced in July 2007, the first cycle having a duration of two years (PI09) and the second cycle having a standard three-year term (PI10).beneficiaries. In June 2008, 2009, 2010 and 2011 the third, fourth, fifth and sixth and final cycles of the performance share plan (PI11, PI12, PI13 and Pl14, respectively) were approved. On July 31, 2009, 20102011, 2012 and 20112013 the first, secondthird, fourth and thirdfifth cycles (Pl09, Pl10(Pl11, P12 and Pl11)PI13, respectively) were cancelled.settled.
For each cycle a maximum number of shares is established for each beneficiary who remains in the Group’s employ for the duration of the plan. The target, which, if met, will determine the number of shares to be delivered, is defined by comparing the Group’sTotal Shareholder Return (TSR) performance of the shares of Banco Santander, S.A. with thatthe TSR of a benchmark group of financial institutions and, is linked to only one parameter, namely Total Shareholder Return (TSR). With regard to the plans approved until June 2008, the targets, which, if met, determined the number of shares to be delivered, were definedfor Plan Pl11, also by comparing the Group’s performancegrowth in Earnings per Share (EPS) of the Group with thatthe EPS of a benchmark group of financial institutions and were linked to two parameters, namely Total Shareholder Return (TSR) and growth in Earnings per Share (EPS).entities.
The ultimate number of shares to be delivered will bein the aforementioned cycles was determined in each of the cycles by the degree of achievement of the targets on the third anniversary of commencement of each cycle, (with the exception of the first cycle, for which the second anniversary was considered), and the shares willwould be delivered within a maximum period of seven months from the beginning of the year in which the corresponding cycle ends.ended.
AtIn the endcase of the cycle of plans Pl12 and Pl13,Plan PI14, the TSR for Santander and each of the benchmark entitiescriterion will be calculated and the results will be ranked from firstapplied to last, thereby determiningdetermine the percentage of shares to be delivered, if any, before the end of July 2015, based on the following scale and in accordance with Santander’s relative position among the benchmark group of benchmark financial institutions:
Santander’s place in the TSR ranking | Percentage of maximum shares to be delivered | |||
In the case of Plan PI14, the TSR criterion will determine the percentage of shares to be delivered, based on the following scale and in accordance with Santander’s relative position among the group of benchmark financial institutions:
| |||||||
| 1st to 5th | 100.0 | % | |||||
6th | 86.0 | % | |||||
7th | 72.0 | % | |||||
8th | 58.0 | % | |||||
9th | 44.0 | % | |||||
10th | 30.0 | % | |||||
11th and below | 0 | % | |||||
F-163
Any benchmark group entity that is acquired by another company, whose shares cease trading or that ceases to exist, will be excluded from the benchmark group. In an event of this or any similar nature, the comparison with the benchmark group will be performed in such a way that the maximum percentage of shares will be deliveredreceived if Santander ranks within the first quartile (including the 25th percentile) of the benchmark group; no shares will be delivered if Santander ranks below the median (50th percentile); 30% of the maximum amount of shares will be delivered if Santander is placed at the median (50th percentile). The linear interpolation method will be used for calculating the corresponding percentage for positions between the median and the first quartile (25th percentile) (neither included).
The fair value of the equity instruments granted under these plansthe plan in force at December 31, 2013 (Pl14) is EUR 26764 million, (of which EUR 74 million correspond to PI14), and this amount is being charged to Personnel expenses, with a credit to equity, over the specific period in which the beneficiaries provide their services to the Group.
Plan I11 maturedPI13 expired in 2011. As established2013, without any shares having been delivered to the plan beneficiaries, since the minimum target for shares to be delivered was not achieved.
Following is a summary of the changes in the aforementionedcycles of this plan in the number of shares received by each beneficiary was determined by the degree of achievement of the targetsperiod from 2011 to which Plan I11 was tied and, since it fell short of the maximum number established, the unearned options were cancelled.2013:
| No. of shares (thousands) | Year granted | Employee group | Number of persons | Date of commencement of exercise period | Date of expiry of exercise period | |||||||||||||||||||
Plans outstanding at 01/01/11 | 55,602 | |||||||||||||||||||||||
|
| |||||||||||||||||||||||
Shares delivered (Plan PI11) | (13,472 | ) | 2008 | Executives | (5,379 | ) | 06/21/08 | 07/31/11 | ||||||||||||||||
Net rights cancelled (Plan PI11) | (3,650 | ) | 2008 | Executives | (392 | ) | 06/21/08 | 07/31/11 | ||||||||||||||||
Rights granted (Plan PI14) | 16,286 | 2011 | Executives | 6,500 | 06/17/11 | 07/31/14 | ||||||||||||||||||
|
| |||||||||||||||||||||||
Plans outstanding at 12/31/11 | 54,766 | |||||||||||||||||||||||
|
| |||||||||||||||||||||||
Shares delivered (Plan PI12) | (5,056 | ) | 2009 | Executives | (5,749 | ) | 06/17/09 | 07/31/12 | ||||||||||||||||
Net rights cancelled (Plan PI12) | (13,811 | ) | 2009 | Executives | (761 | ) | 06/19/09 | 07/31/12 | ||||||||||||||||
Net rights cancelled (Plan PI14) | (1,810 | ) | 2011 | Executives | (199 | ) | 06/17/11 | 07/31/14 | ||||||||||||||||
|
| |||||||||||||||||||||||
Plans outstanding at 12/31/12 | 34,089 | |||||||||||||||||||||||
|
| |||||||||||||||||||||||
Net rights cancelled (Plan PI13) | (19,613 | ) | 2010 | Executives | (6,782 | ) | 06/11/10 | 07/31/13 | ||||||||||||||||
|
| |||||||||||||||||||||||
Plans outstanding at 12/31/13 | 14,476 | |||||||||||||||||||||||
|
| |||||||||||||||||||||||
Of which: | ||||||||||||||||||||||||
Plan PI14 | 14,476 | 2011 | Executives | 6,699 | 06/17/11 | 07/31/14 | ||||||||||||||||||
(ii) Obligatory investment share plan
TheThis deferred share-based variable remuneration iswas instrumented through this multiannuala multi-year incentive plan which is payable in shares of the Bank and is conditional upon compliance with certain investment and continued Group service requirements.
The current beneficiaries of thethis plan are the Group’s top 27 executives, who includewere the executive directors, non-director members of the Bank’s senior management and other Group executives (see Note 5).determined by the board of directors.
This plan, which was discontinued in 2010, iswas structured in three-year cycles. The beneficiaries of the plan musthad to use 10% of their gross annual variable cash-based remuneration (or bonus) to acquire shares of the Bank in the market (the “Obligatory Investment”). As resolved byIn accordance with the shareholders atterms and conditions of the relevant general shareholders’ meeting,corresponding cycles, the obligatory investmentsObligatory Investments were made before February 29, 2008, February 28, 2009 and February 28, 2010, respectively.
Participants who holdheld the shares acquired through the obligatory investmentObligatory Investment and remainremained in the Group’s employ for three years from the date on which the obligatory investment isObligatory Investment was made will be(until 2011, 2102 and 2013, respectively) were entitled to receive the same number of Bank shares as that composing their initial obligatory investment.
The shares willwould be delivered within a maximum period of one month from the third anniversary of the date on which the obligatory investment was made.
The shareholders at the annual general meeting of June 19,
In 2009 a requirement was introduced for the third cycle a requirement additional to that of remaining in the Group’s employ, which is that in the three-year period from the investment in the shares, none of the following circumstances should exist:occur: (i) poor financial performance of the Group; (ii) breach by the beneficiary of the codes of conduct or other internal regulations, including, in particular, those relating to risks, where applicable to the executive in question; or (iii) material restatement of the Group’s financial statements, except when it is required pursuant to a change in accounting standards.
This plan was settled with the delivery of the shares of the third cycle in March 2013.
(iii) Deferred conditional delivery share plan
AtIn 2011, 2012 and 2013 the annual general meeting held on June 11, 2010,Bank’s board of directors, at the shareholdersproposal of the appointments and remuneration committee, approved the first cyclesecond, third and fourth cycles of the deferred conditional delivery share plan. This deferred share-based variable remuneration is instrumented through a multiannual incentive plan which is payable in sharesto instrument payment of the Bank. The beneficiariesshare-based bonus of the plan are the executive directors andGroup executives andor employees of the Group whose variable remuneration or annual bonus for 2010 generally2011, 2012 and 2013, respectively, exceeded, in general, EUR 0.3 million (gross), with a view to deferring a portion of the aforementioned variable remuneration or bonus over a period of three years in which it will be paid in Santander shares.
F-164
The share-based bonus is deferred over three years and will be paid, where appropriate, in three instalments starting in Since these cycles entailed the first year. The amount indelivery of Bank shares, is calculated based on the tranches of the following scale established by the board of directors on the basis of the gross variable cash-based remuneration or annual bonus for 2010:
| ||||
The condition for accrual of the share-based deferred remuneration was, in addition to that of the beneficiary remaining in the Group’s employ, with the exceptions envisaged in the plan regulations, that none of the following circumstances should occur in the period prior to each of the deliveries: (i) poor financial performance of the Group; (ii) breach by the beneficiary of the codes of conduct or other internal regulations, including, in particular, those relating to risks, where applicable to the executive in question; (iii) material restatement of the Group’s financial statements, except when it is required pursuant to a change in accounting standards; or (iv) significant changes in economic capital and the qualitative assessment of risk.
The shareholders at the annual general meeting onmeetings of June 17, 2011, March 30, 2012 and March 22, 2013 approved, respectively, the application of the second, cycle of this plan. The beneficiaries are the executives or employeesthird and fourth cycles of the Group whose variable remuneration or annual bonus for 2011 generally exceeds EUR 0.3 million (gross), with a view to deferring a portion of the aforementioned variable remuneration or bonus over a period of three years in which it will be paid in Santander shares. This second cycle isdeferred conditional delivery share plan. These cycles are not applicable to the executive directors or other members of senior executives andmanagement or other executives who are beneficiaries of the deferred conditional variable remuneration plan described below.
The share-based bonus is deferred over three years and will be paid, where appropriate, in three instalments starting in the first year. The amount in shares is calculated based on the tranches of the following scale established by the board of directors on the basis of the gross variable cash-based remuneration or annual bonus for 2011:the year:
Benchmark bonus
| Percentage (deferred) | |||
300 or less | 0 | % | ||
300 to 600 (inclusive) | 20 | % | ||
More than 600 | 30 | % | ||
The condition for accrual of the share-based deferred remuneration was, in addition to that of the beneficiary remaining in the Group’s employ, with the exceptions envisaged in the plan regulations, that none of the following circumstances should occur in the period prior to each of the deliveries: (i) poor financial performance of the Group; (ii) breach by the beneficiary of internal regulations, including, in particular, those relating to risks; (iii) material restatement of the Group’s financial statements, except when it is required pursuant to a change in accounting standards; or (iv) significant changes in the Group’s economic capital or risk profile.
F-165
(iv) Deferred conditional variable remuneration plan
The shareholdersIn 2011, 2012 and 2013 the Bank’s board of directors, at the annual general meetingproposal of June 17, 2011the appointments and remuneration committee, approved the first, cyclesecond and third cycles of the deferred conditional variable remuneration plan in relation to instrument payment of the variable remuneration or bonus for 2011, 2012 and 2013, respectively, of the executive directors and certain executives (including senior management) and employees whose professional activities significantly impact the risk profile or who assume risks, perform control functions or receive an overall remuneration which puts them on the same remuneration level as senior executives and employees who assume riskswhose professional activities significantly impact the risk profile (all of themwhom are referred to as identified staff,,in accordance with the Guidelines on Remuneration Policies and Practices approved by the Committee Ofof European Banking Supervisors on December 10, 2010). Since the aforementioned cycles entail the delivery of Bank shares, the shareholders at the annual general meetings of June 17, 2011, March 30, 2012 and March 22, 2013 approved, respectively, the application of the first, second and third cycles of the deferred conditional variable remuneration plan.
The purpose of this first cyclethese cycles is to defer a portion of the variable remuneration or bonus of the beneficiaries thereof over a period of three years for it to be paid, where appropriate, in cash and in Santander shares; the other portion of the variable remuneration is also to be paid in cash and Santander shares, upon commencement of the cycle,cycles, in accordance with the rules set forth below:below.
The variable remuneration will be paid in accordance with the following percentages, based on the timing of the payment and the group to which the beneficiary belongs (the “immediate payment percentage” identifies the portion of the bonus for which payment is not deferred, and the “deferred percentage” identifies the portion of the bonus for which payment is deferred):
| Immediate payment percentage (*) | Deferred percentage (*) | |||||||||||||||
| Immediate payment percentage | Deferred percentage | |||||||||||||||
Executive directors | 40 | % | 60 | % | 40 | % | 60 | % | ||||||||
Division directors and other executives of the Group with a similar profile | 50 | % | 50 | % | 50 | % | 50 | % | ||||||||
Other executives subject to supervision | 60 | % | 40 | % | 60 | % | 40 | % | ||||||||
| (*) | Generally applicable percentages. In some countries deferred percentages may be higher for certain categories of executives, thereby giving rise to lower immediate payment percentages. |
The payment of the deferred percentage of the bonus applicable in each case will be deferred over a period of 3three years and will be paid in thirds,three equal instalments, within fifteen15 days following the anniversaries of the initial date (the date on which the immediate payment percentage is paid) in 2013, 2014 and 2015 for the first cycle and within 30 days following the anniversaries of the initial date in 2013, 2014, 2015 and 2016 for the second cycle, and in 2015, 2016 and 2017 for the third cycle, 50% being paid in cash and 50% in shares, provided that the conditions described below are met.
In addition to the requirement that the beneficiary remains in the Group’s employ, with the exceptions included in the plan regulations, the accrual of the deferred remuneration is conditional upon none of the following circumstances existingoccurring -in the opinion of the board of directors and following a proposal of the appointments and remuneration committee-, during the period prior to each of the deliveries: (i) poor financial performance of the Group; (ii) breach by the beneficiary of internal regulations, including, in particular, those relating to risks; (iii) material restatement of the Group’s financial statements, except when it is required pursuant to a change in accounting standards; or (iv) significant changes in the Group’s economic capital or risk profile.
On each delivery, the beneficiaries will be paid an amount in cash equal to the dividends paid foron the deferred amount in shares and the interest on the amount accrued in cash. If the Santander Dividendo Elección scrip dividend scheme is applied, they will be paid the price offered by the Bank for the bonus share rights corresponding to those shares.
The maximum number of shares to be delivered is calculated taking into account the amount resulting from applying the applicable taxes and the volume-weighted average prices for the 15 trading sessions prior to the date on which the board of directors approves the bonus for the Bank’s executive directors for 2011.
F-166
ii. Santander UK plc
The long-term incentive plans on shares of the Bank granted by management of Santander UK plc to its employees are as follows:
| Number of shares | Exercise price in pounds sterling (*) | Year granted | Employee Group | Number of persons | Date of commencement of exercise period | Date of expiry of exercise period | Number of shares (in thousands) | Exercise price in pounds sterling (*) | Year granted | Employee group | Number of persons | Date of commencement of exercise period | Date of expiry of exercise period | |||||||||||||||||||||||||||||||||||
Plans outstanding at 01/01/09 | 6,153 | 7.00 | ||||||||||||||||||||||||||||||||||||||||||||||
|
| |||||||||||||||||||||||||||||||||||||||||||||||
Options granted (Sharesave) | 4,528 | 7.26 | 2009 | Employees | 7,066 | (**) | 11/01/09 | 11/01/12 | ||||||||||||||||||||||||||||||||||||||||
| 11/01/09 | 11/01/14 | |||||||||||||||||||||||||||||||||||||||||||||||
Options exercised | (678 | ) | 3.85 | |||||||||||||||||||||||||||||||||||||||||||||
Options cancelled (net) or not exercised | (1,278 | ) | 7.48 | |||||||||||||||||||||||||||||||||||||||||||||
|
| |||||||||||||||||||||||||||||||||||||||||||||||
Plans outstanding at 12/31/09 | 8,725 | 7.24 | ||||||||||||||||||||||||||||||||||||||||||||||
|
| |||||||||||||||||||||||||||||||||||||||||||||||
Options granted (Sharesave) | 3,359 | 6.46 | 2010 | Employees | 4,752 | (**) | 11/01/10 | 11/01/13 | ||||||||||||||||||||||||||||||||||||||||
| 11/01/10 | 11/01/15 | |||||||||||||||||||||||||||||||||||||||||||||||
Options exercised | (72 | ) | 7.54 | |||||||||||||||||||||||||||||||||||||||||||||
Options cancelled (net) or not exercised | (3,073 | ) | 6.82 | |||||||||||||||||||||||||||||||||||||||||||||
|
| |||||||||||||||||||||||||||||||||||||||||||||||
Plans outstanding at 12/31/10 | 8,939 | 7.09 | ||||||||||||||||||||||||||||||||||||||||||||||
Plans outstanding at 01/01/11 | 8,939 | 7.09 | ||||||||||||||||||||||||||||||||||||||||||||||
|
|
| ||||||||||||||||||||||||||||||||||||||||||||||
Options granted (Sharesave) | 7,725 | 4.46 | 2011 | Employees | 7,429 | (**) | 11/01/11 | 11/01/14 | 7,725 | 4.46 | 2011 | Employees | 7,429 | (**) | 11/01/11 | 11/01/14 | ||||||||||||||||||||||||||||||||
| 11/01/11 | 11/01/16 | 11/01/11 | 11/01/16 | |||||||||||||||||||||||||||||||||||||||||||||
Options exercised | (43 | ) | 4.09 | (43 | ) | 4.09 | ||||||||||||||||||||||||||||||||||||||||||
Options cancelled (net) or not exercised | (5,348 | ) | 6.92 | (5,348 | ) | 6.92 | ||||||||||||||||||||||||||||||||||||||||||
|
|
| ||||||||||||||||||||||||||||||||||||||||||||||
Plans outstanding at 12/31/11 | 11,273 | 11,273 | ||||||||||||||||||||||||||||||||||||||||||||||
| ||||||||||||||||||||||||||||||||||||||||||||||||
Options granted (Sharesave) | 10,012 | 3.66 | 2012 | Employees | 7,089 | (**) | 11/01/12 | 11/01/15 | ||||||||||||||||||||||||||||||||||||||||
| 11/01/12 | 11/01/17 | |||||||||||||||||||||||||||||||||||||||||||||||
Options exercised | (3 | ) | 4.56 | |||||||||||||||||||||||||||||||||||||||||||||
Options cancelled (net) or not exercised | (6,468 | ) | 5.34 | |||||||||||||||||||||||||||||||||||||||||||||
| ||||||||||||||||||||||||||||||||||||||||||||||||
Plans outstanding at 12/31/12 | 14,814 | |||||||||||||||||||||||||||||||||||||||||||||||
| ||||||||||||||||||||||||||||||||||||||||||||||||
Options granted (Sharesave) | 4,340 | 3.69 | 2013 | Employees | 13,110 | (**) | 11/01/13 | 11/01/16 | ||||||||||||||||||||||||||||||||||||||||
| 11/01/13 | 11/01/18 | |||||||||||||||||||||||||||||||||||||||||||||||
Options exercised | (78 | ) | 4.02 | |||||||||||||||||||||||||||||||||||||||||||||
Options cancelled (net) or not exercised | (3,169 | ) | 4.72 | |||||||||||||||||||||||||||||||||||||||||||||
| ||||||||||||||||||||||||||||||||||||||||||||||||
Plans outstanding at 12/31/13 | 15,907 | |||||||||||||||||||||||||||||||||||||||||||||||
Of which: | ||||||||||||||||||||||||||||||||||||||||||||||||
Executive Options | 12 | 4.54 | 2003-2004 | Executives | 2 | 03/26/06 | 03/24/13 | 12 | 4.54 | 2004 | Executives | 2 | 03/26/06 | 03/24/13 | ||||||||||||||||||||||||||||||||||
Sharesave | 11,261 | 5.37 | 2008-2011 | Employees | 12,421 | (**) | 11/01/08 | 11/01/16 | 15,895 | 3.98 | 2009-2013 | Employees | 14,189 | (**) | 04/01/09 | 05/01/18 | ||||||||||||||||||||||||||||||||
| (*) | At December 31, |
| (**) | Number of accounts/contracts. A single employee may have more than one account/contract. |
In 2008 the Group launched a voluntary savings scheme for Santander UK employees (Sharesave Scheme) whereby employees who join the scheme will have between GBP 5 and GBP 250 deducted from their net monthly pay over a period of three or five years. When this period has ended, the employees may use the amount saved to exercise options on shares of the Bankbank at an exercise price calculated by reducing by up to 20% the average purchase and sale prices of the Bankbank shares in the three trading sessions prior to the approval of the planscheme by the UK tax authorities (HMRC). This approval must be received within 21 to 41 days following the publication of the Group’s results for the first half of the year. This scheme which commenced in September 2008, was approved by the shareholdersboard of directors, at the proposal of the appointments and remuneration committee, and, since it involved the delivery of Bank shares, its application was authorized by the annual general meeting held on June 21, 2008 and is2008. Also, the scheme was authorized by the UK tax authorities (HMRC). At and commenced in September 2008. In 2009, 2010, 2011, 2012 and 2013, at the annual general meetings held on June 19, 2009, June 11, 2010, and June 17, 2011, March 30, 2012 and March 22, 2013, respectively, the shareholders approved a planthe application of schemes previously approved by the board and with similar features to the planscheme approved in 2008.
iii. Fair value
The fair value of each plan granted by the Group is calculated at the grant date. With the exception of the share option plans which include terms relating to market conditions, the transfer terms included in the vesting conditions are not taken into account to estimate fair value. The transfer terms that are not based on market conditions are taken into account by adjusting the number of shares or share options included in the measurement of the service cost of the employee so that, ultimately, the amount recognized in the consolidated income statement is based on the number of shares or share options transferred. When the transfer terms are related to market conditions, the charge for the services received is recognized regardless of whether the market conditions for the transfer are met, although the non-market transfer terms must be satisfied. The share price volatility is based on the implicit volatility scale for the Bank’s shares at the exercise prices and the duration corresponding to most of the sensitivities.
F-167
The fair value of the performance share plans was calculated as follows:
| PI12 | PI13 | PI14 | ||||||||||||||||||||||||||
| PI11 | PI12 | PI13 | PI14 | |||||||||||||||||||||||||
Expected volatility (*) | 19.31 | % | 42.36 | % | 49.65 | % | 51.35 | % | 42.36 | % | 49.65 | % | 51.35 | % | ||||||||||||||
Annual dividend yield based on last few years | 3.47 | % | 4.88 | % | 6.34 | % | 6.06 | % | 4.88 | % | 6.34 | % | 6.06 | % | ||||||||||||||
Risk-free interest rate (Treasury Bond yield (zero coupon) over the period of the plan) | 4.835 | % | 2.04 | % | 3.33 | % | 4.073 | % | 2.04 | % | 3.33 | % | 4.073 | % | ||||||||||||||
| (*) | Calculated on the basis of historical volatility over the corresponding period |
The application of the simulation model results in a percentage value of 44.9% for the I11 plan, which was applied to 50% of the value of the options granted in order to determine the cost per books of the TSR-based portion of the incentive, and percentage values of 55.42% for thePlan I12, plan, 62.62% for thePlan I13 plan and 55.39% for the l14 plan.Plan l14. Since this valuation refers to a market condition, it cannot be adjusted after the grant date.
The fair value of each option granted by Santander UK was estimated at the grant date using a European/American Partial Differential Equation model with the following assumptions:
| 2013 | 2012 | 2011 | ||||||||||
| 2011 | 2010 | 2009 | ||||||||||
Risk-free interest rate | 1.7%-5.2% | 1.7%-5.2% | 2.5%-3.5% | 1.2%-1.7% | 0.73%-1.04% | 1.41%-1.64% | ||||||
Dividend increase | (2.6)% | 8% | 10% | 16%-19% | 16%-17% | 14%-16% | ||||||
Volatility of underlying shares based on historical volatility over 5 years | 20.3%-42.2% | 20.3%-39.4% | 29.0%-34.4% | |||||||||
Volatility of underlying shares based on historical volatility over five years | 32.15%-32.32% | 38.62%-39.41% | 41.03%-41.9% | |||||||||
Expected life of options granted | 3 and 5 years | 3 and 5 years | 3 and 5 years | 3 and 5 years | 3 and 5 years | 3 and 5 years | ||||||
F-168
| 48. | Other general administrative expenses |
| a) | Breakdown |
The detail of Other general administrative expenses is as follows:
| Millions of euros | ||||||||||||||||||||||||
| Millions of euros | 2013 | 2012 | 2011 | |||||||||||||||||||||
| 2011 | 2010 | 2009 | ||||||||||||||||||||||
Property, fixtures and supplies | 1,845 | 1,731 | 1,614 | 1,980 | 1,916 | 1,846 | ||||||||||||||||||
Other administrative expenses | 1,723 | 1,555 | 1,436 | |||||||||||||||||||||
Technology and systems | 875 | 798 | 785 | 992 | 889 | 828 | ||||||||||||||||||
Advertising | 695 | 634 | 594 | 630 | 662 | 690 | ||||||||||||||||||
Communications | 659 | 670 | 632 | 519 | 638 | 649 | ||||||||||||||||||
Technical reports | 467 | 428 | 360 | 493 | 491 | 466 | ||||||||||||||||||
Per diems and travel expenses | 313 | 276 | 262 | |||||||||||||||||||||
Taxes other than income tax | 401 | 376 | 313 | 445 | 415 | 400 | ||||||||||||||||||
Surveillance and cash courier services | 412 | 401 | 331 | 425 | 432 | 412 | ||||||||||||||||||
Per diems and travel expenses | 284 | 297 | 312 | |||||||||||||||||||||
Insurance premiums | 65 | 57 | 47 | 59 | 61 | 65 | ||||||||||||||||||
Other administrative expenses | 1,556 | 1,694 | 1,671 | |||||||||||||||||||||
|
|
|
|
|
| |||||||||||||||||||
| 7,455 | 6,926 | 6,374 | 7,383 | 7,495 | 7,339 | |||||||||||||||||||
|
|
|
|
|
| |||||||||||||||||||
| b) | Technical reports and other |
Technical reports includesinclude the fees paid by the various Group companies (detailed in the accompanying Appendices) tofor the services provided by their respective auditors, the detail being as follows:
| Millions of euros | ||||||||||||
| 2013 | 2012 | 2011 | ||||||||||
Audit fees | 35.9 | 38.1 | 36.2 | |||||||||
Audit-related fees | 20.8 | 20.6 | 13.6 | |||||||||
Tax fees | 4.6 | 4.3 | 3.8 | |||||||||
All other fees | 6.5 | 8.1 | 5.7 | |||||||||
|
|
|
|
|
| |||||||
Total | 67.8 | 71.1 | 59.3 | |||||||||
|
|
|
|
|
| |||||||
The fees for the auditdetail of the financial statements of Group companies amounted to EUR 20.4 million, the detail beingmain items included in Audit fees is as follows:
| Millions of euros | ||||||||||||
| 2011 | 2010 | 2009 | ||||||||||
Audit of the financial statements of the companies audited by Deloitte | 20.4 | 21.6 | 19.6 | |||||||||
Of which: | ||||||||||||
Santander UK plc | 3.9 | 4.1 | 3.7 | |||||||||
Santander Holdings USA, Inc. (formerly Sovereign Bancorp, Inc.) | 2.2 | 2.5 | 2.3 | |||||||||
Banco Santander (Brasil), S.A. | 1.6 | 1.7 | 1.5 | |||||||||
Audit of the Bank’s separate and consolidated financial statements | 1.1 | 1.1 | 1.0 | |||||||||
| Millions of euros | ||||||||||||
| 2011 | 2010 | 2009 | ||||||||||
Internal control audit (SOX) and regulatory capital audit (Basel) | 6.2 | 6.5 | 6.8 | |||||||||
Other reports required by the different national supervisory bodies of the countries in which the Group operates | 4.6 | 4.2 | 4.2 | |||||||||
|
|
|
|
|
| |||||||
| 10.8 | 10.7 | 11.0 | ||||||||||
|
|
|
|
|
| |||||||
| Millions of euros | ||||||||||||
| 2013 | 2012 | 2011 | ||||||||||
Audit of the financial statements of the companies audited by Deloitte | 21.7 | 21.0 | 20.4 | |||||||||
Of which: | ||||||||||||
Santander UK plc | 5.0 | 4.4 | 3.9 | |||||||||
Santander Holdings USA, Inc. | 2.4 | 2.2 | 2.2 | |||||||||
Banco Santander (Brasil), S.A. | 1.7 | 1.8 | 1.6 | |||||||||
Audit of the Bank’s separate and consolidated financial statements | 2.1 | 2.0 | 2.0 | |||||||||
Other audit engagements | 14.2 | 17.1 | 15.8 | |||||||||
Of which: | ||||||||||||
Internal control audit (SOX) and capital audit (Basel) | 5.9 | 5.8 | 6.2 | |||||||||
Audit of the Group’s half-yearly financial statements | 6.0 | 5.8 | 5.5 | |||||||||
Issue of comfort letters | 2.3 | 2.5 | 2.1 | |||||||||
|
|
|
|
|
| |||||||
Audit fees | 35.9 | 38.1 | 36.2 | |||||||||
|
|
|
|
|
| |||||||
The fees for the auditdetail of the consolidated half-yearly financial statements amounted to EUR 5.5 million (2010: EUR 5.4 million, 2009: EUR 5.3 million). In addition, the Group provided audit services required for the issuance of debt securities and share placements, for EUR 4.1 million (2010: EUR 2.5 million; 2009: EUR 0.7 million), services related to the review of the proper migration of data to new platforms, for EUR 5.2 million,main items included in Audit-related fees is as well as due diligence review work and audits of other corporate transactions, for EUR 6.9 million (2010: EUR 6.4 million; 2009: EUR 2.9 million).
| Millions of euros | ||||||||||||
| 2013 | 2012 | 2011 | ||||||||||
Other recurring engagements and reports required by the various national supervisory bodies of the countries in which the Group operates | 7.6 | 6.7 | 4.6 | |||||||||
Non-recurring reviews required by regulators | 1.1 | 2.1 | 0.2 | |||||||||
Due diligence reviews | 3.1 | 1.8 | 1.5 | |||||||||
Issuance of other attest reports | 3.7 | 2.8 | 1.8 | |||||||||
Reviews of procedures, data and controls and other services | 5.3 | 7.2 | 5.5 | |||||||||
|
|
|
|
|
| |||||||
Total audit-related fees | 20.8 | 20.6 | 13.6 | |||||||||
|
|
|
|
|
| |||||||
F-169
The fees for the tax advisory services provided to various Group companies amounted to EUR 3.8 million (2010: EUR 3.9 million; 2009: EUR 3.2 million) and the fees for other non-attest services amounted to EUR 2.6 million (2010: EUR 1.7 million; 2009: EUR 1.5 million).Other information
The services commissioned fromprovided by the Group’s auditors meet the independence requirements stipulated by the consolidated Audit Law (Legislative Royal Decree 1/2011, of July 31) and by the Sarbanes-Oxley Act of 2002, and they did not involve the performance of any work that is incompatible with the audit function.
Lastly, the Group commissioned services from audit firms other than Deloitte amounting to EUR 3748.6 million (2010:(2012: EUR 18.938.7 million; 2009:2011: EUR 14.937 million).
| 49. | Gains/(losses) on disposal of assets not classified as non-current assets held for sale |
The detail of Gains/(losses) on disposal of assets not classified as non-current assets held for sale is as follows:
| Millions of euros | ||||||||||||||||||||||||
| Millions of euros | 2013 | 2012 | 2011 | |||||||||||||||||||||
| 2011 | 2010 | 2009 | ||||||||||||||||||||||
Gains: | ||||||||||||||||||||||||
On disposal of tangible assets | 128 | 206 | 51 | |||||||||||||||||||||
On disposal of tangible assets (*) | 74 | 219 | 128 | |||||||||||||||||||||
On disposal of investments | 1,795 | 193 | 1,531 | 2,167 | 775 | 1,795 | ||||||||||||||||||
Of which: | ||||||||||||||||||||||||
Santander Consumer USA (Note 3) | 872 | — | — | |||||||||||||||||||||
Management companies (Note 3) | 1,372 | — | — | |||||||||||||||||||||
Insurance companies in Spain (Note 3) | 385 | — | — | |||||||||||||||||||||
Payment services company (Note 3) | 122 | — | — | |||||||||||||||||||||
Santander Consumer USA Inc. (Note 3) | — | — | 872 | |||||||||||||||||||||
Latam insurance companies (Note 3) | 908 | — | — | — | — | 908 | ||||||||||||||||||
Banco Santander (Brasil) S.A. (Note 3) | — | — | 1,499 | |||||||||||||||||||||
Banco Santander Colombia (Note 3) | — | 619 | — | |||||||||||||||||||||
|
|
|
|
|
| |||||||||||||||||||
| 1,923 | 399 | 1,582 | 2,241 | 994 | 1,923 | |||||||||||||||||||
|
|
|
|
|
| |||||||||||||||||||
Losses: | ||||||||||||||||||||||||
On disposal of tangible assets | (76 | ) | (9 | ) | (13 | ) | (78 | ) | (87 | ) | (76 | ) | ||||||||||||
On disposal of investments | (1 | ) | (40 | ) | (4 | ) | (11 | ) | (1 | ) | (1 | ) | ||||||||||||
|
|
|
|
|
| |||||||||||||||||||
| (77 | ) | (49 | ) | (17 | ) | (89 | ) | (88 | ) | (77 | ) | |||||||||||||
|
|
|
|
|
| |||||||||||||||||||
| 1,846 | 350 | 1,565 | 2,152 | 906 | 1,846 | |||||||||||||||||||
|
|
|
|
|
| |||||||||||||||||||
| Includes in 2012 the gains recognized on the sale of the Canalejas complex (Spain) (EUR 87 million), of certain branches and offices in Mexico (EUR 80 million) and of a property in New York (EUR 47 million). |
The detail of Gains/(losses) onof non-current assets held for sale not classified as discontinued operations is as follows:
| Millions of euros | ||||||||||||
Cost | 2011 | 2010 | 2009 | |||||||||
Tangible assets | (2,109 | ) | (332 | ) | (1,362 | ) | ||||||
Impairment of non-current assets held for sale (Note 12) | (2,037 | ) | (298 | ) | (1,350 | ) | ||||||
Loss on sale (Note 12) | (72 | ) | (34 | ) | (12 | ) | ||||||
Other gains | — | 113 | 243 | |||||||||
Of which: | ||||||||||||
Attijariwafa Bank | — | — | 218 | |||||||||
Other losses | — | (71 | ) | (106 | ) | |||||||
|
|
|
|
|
| |||||||
| (2,109 | ) | (290 | ) | (1,225 | ) | |||||||
|
|
|
|
|
| |||||||
| Millions of euros | ||||||||||||
Net balance | 2013 | 2012 | 2011 | |||||||||
Non-current assets held for sale | (422 | ) | (757 | ) | (2,109 | ) | ||||||
Impairment (Note 12) | (335 | ) | (449 | ) | (2,037 | ) | ||||||
Loss on sale (Note 12) | (87 | ) | (308 | ) | (72 | ) | ||||||
|
|
|
|
|
| |||||||
| (422 | ) | (757 | ) | (2,109 | ) | |||||||
|
|
|
|
|
| |||||||
F-170
| 51. | Other disclosures |
| a) | Residual maturity periods and average interest rates |
The detail, by maturity, of the balances of certain items in the consolidated balance sheetssheet is as follows:
| December 31, 2011 | December 31, 2013 | |||||||||||||||||||||||||||||||||||||||||||||||||||||||||||||||||||||||
| Millions of euros | Average interest rate | Millions of euros | Average interest rate | |||||||||||||||||||||||||||||||||||||||||||||||||||||||||||||||||||||
| On | Within 1 | 1 to 3 | 3 to 12 | 1 to 3 | 3 to 5 | After 5 | On demand | Within 1 month | 1 to 3 months | 3 to 12 months | 1 to 3 years | 3 to 5 years | After 5 years | Total | ||||||||||||||||||||||||||||||||||||||||||||||||||||||||||
| demand | month | months | months | years | years | years | Total | |||||||||||||||||||||||||||||||||||||||||||||||||||||||||||||||||
Assets: | ||||||||||||||||||||||||||||||||||||||||||||||||||||||||||||||||||||||||
Cash and balances with central banks | 68,634 | 21,921 | 2,772 | 3,130 | 66 | — | 1 | 96,524 | 5.59 | % | 70,303 | 4,565 | 1,410 | 706 | — | — | 119 | 77,103 | 2.53 | % | ||||||||||||||||||||||||||||||||||||||||||||||||||||
Available-for-sale financial assets- Debt instruments | 84 | 3,650 | 2,288 | 9,131 | 14,734 | 11,446 | 40,256 | 81,589 | 5.25 | % | ||||||||||||||||||||||||||||||||||||||||||||||||||||||||||||||
Loans and receivables- | 12,963 | 16,476 | 1,385 | 2,652 | 1,547 | 1,841 | 5,525 | 42,389 | 4.22 | % | ||||||||||||||||||||||||||||||||||||||||||||||||||||||||||||||
Available-for-sale financial assets- | ||||||||||||||||||||||||||||||||||||||||||||||||||||||||||||||||||||||||
Debt instruments | 200 | 3,034 | 2,194 | 5,100 | 13,243 | 16,965 | 39,108 | 79,844 | 4.60 | % | ||||||||||||||||||||||||||||||||||||||||||||||||||||||||||||||
Loans and receivables- | ||||||||||||||||||||||||||||||||||||||||||||||||||||||||||||||||||||||||
Loans and advances to credit institutions | 13,794 | 25,619 | 3,710 | 2,120 | 3,360 | 2,415 | 4,999 | 56,017 | 2.36 | % | ||||||||||||||||||||||||||||||||||||||||||||||||||||||||||||||
Loans and advances to customers | 24,468 | 39,916 | 32,585 | 79,727 | 102,718 | 67,432 | 383,450 | 730,296 | 6.77 | % | 13,475 | 45,117 | 28,939 | 70,130 | 88,822 | 67,727 | 336,371 | 650,581 | 5.69 | % | ||||||||||||||||||||||||||||||||||||||||||||||||||||
Debt instruments | 58 | 1,688 | 737 | 339 | 399 | 1,220 | 2,399 | 6,840 | 3.34 | % | 3 | 1,024 | 646 | 1,470 | 1,042 | 283 | 3,418 | 7,886 | 3.01 | % | ||||||||||||||||||||||||||||||||||||||||||||||||||||
|
|
|
|
|
|
|
|
|
|
|
|
|
|
|
|
|
| |||||||||||||||||||||||||||||||||||||||||||||||||||||||
| 106,207 | 83,651 | 39,767 | 94,979 | 119,464 | 81,939 | 431,631 | 957,638 | 6.38 | % | 97,775 | 79,359 | 36,899 | 79,526 | 106,467 | 87,390 | 384,015 | 871,431 | 5.07 | % | |||||||||||||||||||||||||||||||||||||||||||||||||||||
|
|
|
|
|
|
|
|
|
|
|
|
|
|
|
|
|
| |||||||||||||||||||||||||||||||||||||||||||||||||||||||
Liabilities: | ||||||||||||||||||||||||||||||||||||||||||||||||||||||||||||||||||||||||
Financial liabilities at amortised cost: | ||||||||||||||||||||||||||||||||||||||||||||||||||||||||||||||||||||||||
Financial liabilities at amortized cost: | ||||||||||||||||||||||||||||||||||||||||||||||||||||||||||||||||||||||||
Deposits from central banks | 113 | 9,601 | 5 | 1 | — | 25,276 | — | 34,996 | 1.63 | % | 485 | 3,207 | 156 | 312 | 5,628 | — | — | 9,788 | 0.27 | % | ||||||||||||||||||||||||||||||||||||||||||||||||||||
Deposits from credit institutions | 2,276 | 27,970 | 10,756 | 14,897 | 10,983 | 14,331 | 160 | 81,373 | 5.69 | % | 2,756 | 27,665 | 5,578 | 14,436 | 13,106 | 7,837 | 5,156 | 76,534 | 2.18 | % | ||||||||||||||||||||||||||||||||||||||||||||||||||||
Customer deposits | 299,631 | 87,398 | 40,465 | 74,515 | 63,284 | 14,301 | 9,383 | 588,977 | 2.64 | % | 328,508 | 53,108 | 26,039 | 80,639 | 63,278 | 9,576 | 11,705 | 572,853 | 2.55 | % | ||||||||||||||||||||||||||||||||||||||||||||||||||||
Marketable debt securities (*) | 503 | 8,093 | 13,532 | 23,325 | 52,077 | 33,899 | 57,681 | 189,110 | 7.64 | % | 146 | 8,551 | 17,198 | 27,092 | 53,966 | 20,667 | 43,770 | 171,390 | 3.72 | % | ||||||||||||||||||||||||||||||||||||||||||||||||||||
Subordinated liabilities | 77 | 1 | 2 | 237 | 2,846 | 3,402 | 16,427 | 22,992 | 6.38 | % | 24 | 159 | 2 | 821 | 2,468 | 2,723 | 9,942 | 16,139 | 6.02 | % | ||||||||||||||||||||||||||||||||||||||||||||||||||||
Other financial liabilities | 6,184 | 2,637 | 6,274 | 367 | 1,632 | 420 | 707 | 18,221 | n.a. | 5,524 | 7,476 | 1,613 | 312 | 486 | 115 | 884 | 16,410 | n/a | ||||||||||||||||||||||||||||||||||||||||||||||||||||||
|
|
|
|
|
|
|
|
|
|
|
|
|
|
|
|
|
| |||||||||||||||||||||||||||||||||||||||||||||||||||||||
| 308,784 | 135,700 | 71,034 | 113,342 | 130,822 | 91,629 | 84,358 | 935,669 | 4.00 | % | 337,443 | 100,166 | 50,586 | 123,612 | 138,932 | 40,918 | 71,457 | 863,114 | 2.80 | % | |||||||||||||||||||||||||||||||||||||||||||||||||||||
|
|
|
|
|
|
|
|
|
|
|
|
|
|
|
|
|
| |||||||||||||||||||||||||||||||||||||||||||||||||||||||
Difference (assets less liabilities) | (202,577 | ) | (52,049 | ) | (31,267 | ) | (18,363 | ) | (11,358 | ) | (9,690 | ) | 347,273 | 21,969 | (239,668 | ) | (20,807 | ) | (13,687 | ) | (44,086 | ) | (32,465 | ) | 46,472 | 312,558 | 8,317 | |||||||||||||||||||||||||||||||||||||||||||||
|
|
|
|
|
|
|
|
|
|
|
|
|
|
|
| |||||||||||||||||||||||||||||||||||||||||||||||||||||||||
| (*) | Includes promissory notes, certificates of deposit and other short-term debt issues. |
Both asset and liability balances with central banks have increased afterin 2012 following the liquidity injections by the central banks in countries where the Group operates, particularly in the euro zone. The European Central Bank (ECB) has implemented extraordinary monetary policy measures, including a wider range of collateral and three-year liquidity auctions.
The Group continued to go toattend these auctions and deposit inat the ECB most of the funds captured, which significantly increasingincreased the liquidity buffer and improvingimproved its structure by replacing short-term maturities bywith longer term funding. The only Group entity that has arepaid most of these amounts to the ECB in the first quarter of 2013. The Group’s net structural borrowing position from the ECB iswas EUR 6 thousand million at December 31, 2013, due mainly to Banco Santander Totta, S.A. (close to EUR 4 billion).
F-171
| December 31, 2012 | ||||||||||||||||||||||||||||||||||||||||||||||||||||||||||||||||||||||||
| December 31, 2010 | Millions of euros | Average interest rate | ||||||||||||||||||||||||||||||||||||||||||||||||||||||||||||||||||||||
| Millions of euros | Average interest rate | On demand | Within 1 month | 1 to 3 months | 3 to 12 months | 1 to 3 years | 3 to 5 years | More than 5 years | Total | |||||||||||||||||||||||||||||||||||||||||||||||||||||||||||||||
| On demand | Within 1 month | 1 to 3 months | 3 to 12 months | 1 to 3 years | 3 to 5 years | After 5 years | Total | |||||||||||||||||||||||||||||||||||||||||||||||||||||||||||||||||
Assets: | ||||||||||||||||||||||||||||||||||||||||||||||||||||||||||||||||||||||||
Cash and balances with central banks | 64,653 | 8,354 | 2,664 | 2,031 | 66 | — | 17 | 77,785 | 4.71 | % | 68,501 | 45,030 | 2,061 | 2,699 | — | — | 197 | 118,488 | 1.74 | % | ||||||||||||||||||||||||||||||||||||||||||||||||||||
Available-for-sale financial assets- | ||||||||||||||||||||||||||||||||||||||||||||||||||||||||||||||||||||||||
Debt instruments | 291 | 1,939 | 1,395 | 5,836 | 26,329 | 11,086 | 32,813 | 79,689 | 5.23 | % | 55 | 2,050 | 2,786 | 7,935 | 14,656 | 13,141 | 47,101 | 87,724 | 4.56 | % | ||||||||||||||||||||||||||||||||||||||||||||||||||||
Loans and receivables- | ||||||||||||||||||||||||||||||||||||||||||||||||||||||||||||||||||||||||
Loans and advances to credit institutions | 10,205 | 17,131 | 2,017 | 3,551 | 2,511 | 1,199 | 8,194 | 44,808 | 3.67 | % | 11,120 | 26,482 | 3,406 | 3,987 | 1,507 | 753 | 6,530 | 53,785 | 2.37 | % | ||||||||||||||||||||||||||||||||||||||||||||||||||||
Loans and advances to customers | 19,338 | 35,294 | 33,879 | 77,766 | 105,792 | 74,138 | 369,414 | 715,621 | 5.33 | % | 16,560 | 38,953 | 29,528 | 74,048 | 103,089 | 70,857 | 362,979 | 696,014 | 5.29 | % | ||||||||||||||||||||||||||||||||||||||||||||||||||||
Debt instruments | 30 | 1,556 | 867 | 1,046 | 932 | 409 | 3,589 | 8,429 | 2.04 | % | 3 | 945 | 277 | 527 | 1,541 | 421 | 3,345 | 7,059 | 2.90 | % | ||||||||||||||||||||||||||||||||||||||||||||||||||||
|
|
|
|
|
|
|
|
|
|
|
|
|
|
|
|
|
| |||||||||||||||||||||||||||||||||||||||||||||||||||||||
| 94,517 | 64,274 | 40,822 | 90,230 | 135,630 | 86,832 | 414,027 | 926,332 | 5.16 | % | 96,239 | 113,460 | 38,058 | 89,196 | 120,793 | 85,172 | 420,152 | 963,070 | 4.61 | % | |||||||||||||||||||||||||||||||||||||||||||||||||||||
|
|
|
|
|
|
|
|
|
|
|
|
|
|
|
|
|
| |||||||||||||||||||||||||||||||||||||||||||||||||||||||
Liabilities: | ||||||||||||||||||||||||||||||||||||||||||||||||||||||||||||||||||||||||
Financial liabilities at amortised cost: | ||||||||||||||||||||||||||||||||||||||||||||||||||||||||||||||||||||||||
Financial liabilities at amortized cost: | ||||||||||||||||||||||||||||||||||||||||||||||||||||||||||||||||||||||||
Deposits from central banks | 704 | 7,486 | 305 | 2 | 65 | 82 | — | 8,644 | 1.12 | % | 948 | 4,678 | 1,173 | 1 | 44,138 | — | — | 50,938 | 0.77 | % | ||||||||||||||||||||||||||||||||||||||||||||||||||||
Deposits from credit institutions | 3,603 | 22,172 | 9,116 | 12,272 | 9,218 | 10,500 | 4,012 | 70,893 | 4.23 | % | 4,611 | 25,839 | 7,863 | 15,958 | 11,845 | 11,076 | 3,540 | 80,732 | 2.81 | % | ||||||||||||||||||||||||||||||||||||||||||||||||||||
Customer deposits | 282,895 | 71,286 | 47,990 | 79,457 | 68,481 | 16,467 | 14,809 | 581,385 | 2.88 | % | 306,051 | 79,513 | 34,738 | 88,012 | 60,827 | 13,992 | 5,971 | 589,104 | 1.90 | % | ||||||||||||||||||||||||||||||||||||||||||||||||||||
Marketable debt securities (*) | 1,669 | 8,869 | 10,356 | 20,403 | 63,476 | 25,960 | 57,496 | 188,229 | 2.48 | % | 707 | 13,616 | 13,924 | 44,466 | 54,158 | 27,291 | 46,902 | 201,064 | 3.76 | % | ||||||||||||||||||||||||||||||||||||||||||||||||||||
Subordinated liabilities | 69 | 20 | 1,361 | 137 | 2,318 | 1,776 | 24,794 | 30,475 | 5.98 | % | 203 | 230 | 280 | 1,226 | 1,377 | 5,169 | 9,753 | 18,238 | 5.45 | % | ||||||||||||||||||||||||||||||||||||||||||||||||||||
Other financial liabilities | 8,151 | 2,516 | 4,539 | 351 | 2,643 | 403 | 740 | 19,343 | N/A | 4,101 | 3,309 | 7,403 | 211 | 517 | 339 | 3,365 | 19,245 | n.a. | ||||||||||||||||||||||||||||||||||||||||||||||||||||||
|
|
|
|
|
|
|
|
|
|
|
|
|
|
|
|
|
| |||||||||||||||||||||||||||||||||||||||||||||||||||||||
| 297,091 | 112,349 | 73,667 | 112,622 | 146,201 | 55,188 | 101,851 | 898,969 | 2.99 | % | 316,621 | 127,185 | 65,381 | 149,874 | 172,862 | 57,867 | 69,531 | 959,321 | 2.38 | % | |||||||||||||||||||||||||||||||||||||||||||||||||||||
|
|
|
|
|
|
|
|
|
|
|
|
|
|
|
|
|
| |||||||||||||||||||||||||||||||||||||||||||||||||||||||
Difference (assets less liabilities) | (202,574 | ) | (48,075 | ) | (32,845 | ) | (22,392 | ) | (10,571 | ) | 31,644 | 312,176 | 27,363 | (220,382 | ) | (13,725 | ) | (27,323 | ) | (60,678 | ) | (52,069 | ) | 27,305 | 350,621 | 3,749 | ||||||||||||||||||||||||||||||||||||||||||||||
|
|
|
|
|
|
|
|
|
|
|
|
|
|
|
| |||||||||||||||||||||||||||||||||||||||||||||||||||||||||
| (*) | Includes promissory notes, certificates of deposit and other short-term debt issues. |
| December 31, 2011 | ||||||||||||||||||||||||||||||||||||||||||||||||||||||||||||||||||||||||
| December 31, 2009 | Millions of euros | Average interest rate | ||||||||||||||||||||||||||||||||||||||||||||||||||||||||||||||||||||||
| Millions of euros | Average interest rate | On demand | Within 1 month | 1 to 3 months | 3 to 12 months | 1 to 3 years | 3 to 5 years | More than 5 years | Total | |||||||||||||||||||||||||||||||||||||||||||||||||||||||||||||||
| On demand | Within 1 month | 1 to 3 months | 3 to 12 months | 1 to 3 years | 3 to 5 years | After 5 years | Total | |||||||||||||||||||||||||||||||||||||||||||||||||||||||||||||||||
Assets: | ||||||||||||||||||||||||||||||||||||||||||||||||||||||||||||||||||||||||
Cash and balances with central banks | 19,998 | 10,585 | 521 | 3,310 | 475 | — | — | 34,889 | 4.07 | % | 68,634 | 21,921 | 2,772 | 3,130 | 66 | — | 1 | 96,524 | 5.59 | % | ||||||||||||||||||||||||||||||||||||||||||||||||||||
Available-for-sale financial assets- | ||||||||||||||||||||||||||||||||||||||||||||||||||||||||||||||||||||||||
Debt instruments | 67 | 5,180 | 1,082 | 4,163 | 10,224 | 28,967 | 29,606 | 79,289 | 5.01 | % | 84 | 3,650 | 2,288 | 9,131 | 14,734 | 11,446 | 40,256 | 81,589 | 5.25 | % | ||||||||||||||||||||||||||||||||||||||||||||||||||||
Loans and receivables- | ||||||||||||||||||||||||||||||||||||||||||||||||||||||||||||||||||||||||
Loans and advances to credit institutions | 9,834 | 22,660 | 5,893 | 6,893 | 1,692 | 2,190 | 8,479 | 57,641 | 3.15 | % | 12,963 | 16,476 | 1,385 | 2,652 | 1,547 | 1,841 | 5,525 | 42,389 | 4.22 | % | ||||||||||||||||||||||||||||||||||||||||||||||||||||
Loans and advances to customers | 12,401 | 35,749 | 33,408 | 69,955 | 82,397 | 82,769 | 347,467 | 664,146 | 6.08 | % | 24,467 | 39,832 | 32,459 | 79,274 | 102,134 | 67,195 | 383,376 | 728,737 | 6.74 | % | ||||||||||||||||||||||||||||||||||||||||||||||||||||
Debt instruments | 70 | 321 | 506 | 1,738 | 2,387 | 4,297 | 5,640 | 14,959 | 4.57 | % | 58 | 1,688 | 737 | 339 | 399 | 1,220 | 2,399 | 6,840 | 3.34 | % | ||||||||||||||||||||||||||||||||||||||||||||||||||||
|
|
|
|
|
|
|
|
|
|
|
|
|
|
|
|
|
| |||||||||||||||||||||||||||||||||||||||||||||||||||||||
| 42,370 | 74,495 | 41,410 | 86,059 | 97,175 | 118,223 | 391,192 | 850,924 | 5.67 | % | 106,206 | 83,567 | 39,641 | 94,526 | 118,880 | 81,702 | 431,557 | 956,079 | 6.36 | % | |||||||||||||||||||||||||||||||||||||||||||||||||||||
|
|
|
|
|
|
|
|
|
|
|
|
|
|
|
|
|
| |||||||||||||||||||||||||||||||||||||||||||||||||||||||
Liabilities: | ||||||||||||||||||||||||||||||||||||||||||||||||||||||||||||||||||||||||
Financial liabilities at amortised cost: | ||||||||||||||||||||||||||||||||||||||||||||||||||||||||||||||||||||||||
Financial liabilities at amortized cost: | ||||||||||||||||||||||||||||||||||||||||||||||||||||||||||||||||||||||||
Deposits from central banks | 383 | 7,359 | 258 | 14,109 | 6 | 227 | 3 | 22,345 | 1.69 | % | 113 | 9,601 | 5 | 1 | — | 25,276 | — | 34,996 | 1.63 | % | ||||||||||||||||||||||||||||||||||||||||||||||||||||
Deposits from credit institutions | 7,978 | 13,161 | 2,611 | 15,253 | 5,238 | 4,962 | 1,578 | 50,782 | 2.68 | % | 2,276 | 27,970 | 10,756 | 14,897 | 10,983 | 14,331 | 160 | 81,373 | 5.69 | % | ||||||||||||||||||||||||||||||||||||||||||||||||||||
Customer deposits | 235,974 | 69,839 | 47,546 | 64,755 | 34,148 | 30,571 | 4,848 | 487,681 | 2.70 | % | 299,631 | 87,398 | 40,465 | 74,515 | 63,284 | 14,301 | 9,383 | 588,977 | 2.64 | % | ||||||||||||||||||||||||||||||||||||||||||||||||||||
Marketable debt securities (*) | 1,079 | 16,545 | 12,709 | 37,033 | 50,302 | 31,498 | 57,324 | 206,490 | 2.38 | % | 503 | 8,093 | 13,532 | 23,325 | 52,077 | 33,899 | 57,681 | 189,110 | 3.32 | % | ||||||||||||||||||||||||||||||||||||||||||||||||||||
Subordinated liabilities | 3,412 | 752 | 34 | 1,841 | 1,714 | 3,097 | 25,955 | 36,805 | 5.69 | % | 77 | 1 | 2 | 237 | 2,846 | 3,402 | 16,427 | 22,992 | 6.38 | % | ||||||||||||||||||||||||||||||||||||||||||||||||||||
Other financial liabilities | 6,765 | 5,992 | 1,680 | 2,072 | 1,675 | 646 | 470 | 19,300 | N/A | 6,184 | 2,637 | 6,274 | 367 | 1,632 | 420 | 707 | 18,221 | n.a | ||||||||||||||||||||||||||||||||||||||||||||||||||||||
�� |
|
|
|
|
|
|
|
|
|
|
|
|
|
|
|
|
|
| ||||||||||||||||||||||||||||||||||||||||||||||||||||||
| 255,591 | 113,648 | 64,838 | 135,063 | 93,083 | 71,001 | 90,178 | 823,402 | 2.73 | % | 308,784 | 135,700 | 71,034 | 113,342 | 130,822 | 91,629 | 84,358 | 935,669 | 3.10 | % | |||||||||||||||||||||||||||||||||||||||||||||||||||||
|
|
|
|
|
|
|
|
|
|
|
|
|
|
|
|
|
| |||||||||||||||||||||||||||||||||||||||||||||||||||||||
Difference (assets less liabilities) | (213,221 | ) | (39,153 | ) | (23,428 | ) | (49,004 | ) | 4,092 | 47,222 | 301,014 | 27,522 | (202,578 | ) | (52,133 | ) | (31,393 | ) | (18,816 | ) | (11,942 | ) | (9,927 | ) | 347,199 | 20,410 | ||||||||||||||||||||||||||||||||||||||||||||||
|
|
|
|
|
|
|
|
|
|
|
|
|
|
|
| |||||||||||||||||||||||||||||||||||||||||||||||||||||||||
| (*) | Includes promissory notes, certificates of deposit and other short-term debt issues. |
The detail of the undiscounted contractual maturities of the existing financial liabilities at amortized cost at December 31, 2013 is as follows:
F-172
| December 31, 2013 | ||||||||||||||||||||||||||||||||
| Millions of euros | ||||||||||||||||||||||||||||||||
| On demand | Within 1 month | 1 to 3 months | 3 to 12 months | 1 to 3 years | 3 to 5 years | More than 5 years | Total | |||||||||||||||||||||||||
Financial liabilities at amortized cost (*): | ||||||||||||||||||||||||||||||||
Deposits from central banks | 482 | 3,185 | 155 | 310 | 5,589 | — | — | 9,720 | ||||||||||||||||||||||||
Deposits from credit institutions | 2,740 | 27,502 | 5,545 | 14,351 | 13,029 | 7,791 | 5,126 | 76,084 | ||||||||||||||||||||||||
Customer deposits | 327,853 | 53,002 | 25,987 | 80,478 | 63,152 | 9,557 | 11,682 | 571,712 | ||||||||||||||||||||||||
Marketable debt securities | 141 | 8,260 | 16,612 | 26,169 | 52,127 | 19,963 | 42,278 | 165,549 | ||||||||||||||||||||||||
Subordinated liabilities | 22 | 143 | 2 | 736 | 2,212 | 2,441 | 8,911 | 14,465 | ||||||||||||||||||||||||
Other financial liabilities | 5,524 | 7,476 | 1,613 | 312 | 486 | 115 | 884 | 16,410 | ||||||||||||||||||||||||
|
|
|
|
|
|
|
|
|
|
|
|
|
|
|
| |||||||||||||||||
| 336,761 | 99,567 | 49,914 | 123,356 | 136,595 | 39,866 | 68,880 | 853,940 | |||||||||||||||||||||||||
|
|
|
|
|
|
|
|
|
|
|
|
|
|
|
| |||||||||||||||||
| (*) | The analysis of the expiry dates of the derivatives is not broken down because this is not essential to the comprehension of the cash flow schedule, since substantially all of them are subject to netting arrangements with other derivatives held with the same counterparty. |
In the Group’s experience, no outflows of cash or other financial assets take place prior to the contractual maturity date that might affect the information broken down above.
| b) | Equivalent euro value of assets and liabilities |
The detail of the main foreign currency balances in the consolidated balance sheet, based on the nature of the related items, is as follows:
| Equivalent value in millions of euros | ||||||||||||||||||||||||||||||||||||||||||||||||
| Equivalent value in millions of euros | 2013 | 2012 | 2011 | |||||||||||||||||||||||||||||||||||||||||||||
| 2011 | 2010 | 2009 | Assets | Liabilities | Assets | Liabilities | Assets | Liabilities | ||||||||||||||||||||||||||||||||||||||||
| Assets | Liabilities | Assets | Liabilities | Assets | Liabilities | |||||||||||||||||||||||||||||||||||||||||||
Cash and balances with central banks | 73,487 | — | 69,690 | — | 28,198 | — | 71,328 | — | 70,756 | — | 73,487 | — | ||||||||||||||||||||||||||||||||||||
Financial assets/liabilities held for trading | 110,645 | 89,833 | 112,990 | 96,089 | 94,069 | 87,066 | 72,888 | 61,473 | 106,813 | 80,893 | 110,645 | 89,833 | ||||||||||||||||||||||||||||||||||||
Other financial instruments at fair value through profit or loss | 7,457 | 23,442 | 18,271 | 20,154 | 18,407 | 27,195 | ||||||||||||||||||||||||||||||||||||||||||
Other financial assets at fair value through profit or loss | 9,177 | 9,953 | 10,448 | 10,480 | 7,457 | 23,442 | ||||||||||||||||||||||||||||||||||||||||||
Available-for-sale financial assets | 44,248 | — | 45,491 | — | 43,048 | — | 43,558 | — | 50,144 | — | 44,248 | — | ||||||||||||||||||||||||||||||||||||
Loans and receivables | 470,114 | — | 453,787 | — | 408,161 | — | 454,791 | — | 466,933 | — | 468,555 | — | ||||||||||||||||||||||||||||||||||||
Investments | 3,161 | — | 161 | — | 92 | — | 3,941 | — | 3,336 | — | 3,161 | — | ||||||||||||||||||||||||||||||||||||
Tangible assets | 5,349 | — | 5,270 | — | 3,918 | — | 5,611 | — | 5,667 | — | 5,349 | — | ||||||||||||||||||||||||||||||||||||
Intangible assets | 24,374 | — | 24,024 | — | 21,659 | — | 22,422 | — | 24,269 | — | 24,374 | — | ||||||||||||||||||||||||||||||||||||
Financial liabilities at amortised cost | — | 544,218 | — | 537,904 | — | 456,697 | ||||||||||||||||||||||||||||||||||||||||||
Liabilities under insurance contracts | — | — | — | 9,516 | — | 6,675 | ||||||||||||||||||||||||||||||||||||||||||
Financial liabilities at amortized cost | — | 526,588 | — | 560,483 | — | 544,218 | ||||||||||||||||||||||||||||||||||||||||||
Other | 20,811 | 45,275 | 20,877 | 43,440 | 20,864 | 32,207 | 20,700 | 23,817 | 22,360 | 50,971 | 22,037 | 44,998 | ||||||||||||||||||||||||||||||||||||
|
|
|
|
|
|
|
|
|
|
|
| |||||||||||||||||||||||||||||||||||||
| 759,646 | 702,768 | 750,561 | 707,103 | 638,416 | 609,840 | 704,416 | 621,831 | 760,726 | 702,827 | 759,313 | 702,491 | |||||||||||||||||||||||||||||||||||||
|
|
|
|
|
|
|
|
|
|
|
| |||||||||||||||||||||||||||||||||||||
| c) | Fair value of financial assets and liabilities not measured at fair value |
The financial assets owned by the Group are measured at fair value in the accompanying consolidated balance sheet, except for cash and balances with central banks, loans and receivables, equity instruments whose market value cannot be estimated reliably and derivatives that have these instruments as their underlyings and are settled by delivery thereof.
Similarly, the Group’s financial liabilities -except for financial liabilities held for trading, those measured at fair value and derivatives other than those having as their underlying equity instruments whose market value cannot be estimated reliably- are measured at amortisedamortized cost in the accompanying consolidated balance sheet.
F-173
i) Financial assets measured at other than fair value
Following is a comparison of the carrying amounts of the Group’s financial assetsinstruments measured at other than fair value and their respective fair values at year-end:
| Millions of euros | ||||||||||||||||||||||||
| 2011 | 2010 | 2009 | ||||||||||||||||||||||
| Carrying | Fair | Carrying | Fair | Carrying | Fair | |||||||||||||||||||
Assets | amount | value | amount | value | amount | value | ||||||||||||||||||
Loans and receivables: | ||||||||||||||||||||||||
Loans and advances to credit institutions | 42,389 | 42,351 | 44,808 | 45,103 | 57,641 | 58,121 | ||||||||||||||||||
Loans and advances to customers | 730,296 | 741,556 | 715,621 | 721,887 | 664,146 | 676,218 | ||||||||||||||||||
Debt instruments | 6,840 | 6,583 | 8,429 | 8,097 | 14,959 | 13,718 | ||||||||||||||||||
|
|
|
|
|
|
|
|
|
|
|
| |||||||||||||
| 779,525 | 790,490 | 768,858 | 775,087 | 736,746 | 748,057 | |||||||||||||||||||
|
|
|
|
|
|
|
|
|
|
|
| |||||||||||||
| i) | Financial assets measured at other than fair value |
ii)
| Millions of euros | ||||||||||||||||||||||||||||||||||||
| 2013 | 2012 | 2011 | ||||||||||||||||||||||||||||||||||
Assets | Carrying amount | Fair value | Level 1 | Level 2 | Level 3 | Carrying amount | Fair value | Carrying amount | Fair value | |||||||||||||||||||||||||||
Loans and receivables: | ||||||||||||||||||||||||||||||||||||
Loans and advances to credit institutions | 56,017 | 56,213 | — | — | 56,213 | 53,785 | 54,397 | 42,389 | 42,351 | |||||||||||||||||||||||||||
Loans and advances to customers | 650,581 | 651,338 | — | — | 651,338 | 696,014 | 702,685 | 728,737 | 739,997 | |||||||||||||||||||||||||||
Debt instruments | 7,886 | 7,858 | — | 3,017 | 4,841 | 7,059 | 7,241 | 6,840 | 6,583 | |||||||||||||||||||||||||||
|
|
|
|
|
|
|
|
|
|
|
|
|
|
|
|
|
| |||||||||||||||||||
| 714,484 | 715,409 | — | 3,017 | 712,392 | 756,858 | 764,323 | 777,966 | 788,931 | ||||||||||||||||||||||||||||
|
|
|
|
|
|
|
|
|
|
|
|
|
|
|
|
|
| |||||||||||||||||||
| ii) | Financial liabilities measured at other than fair value |
| Millions of euros | ||||||||||||||||||||||||||||||||||||
| 2013 | 2012 | 2011 | ||||||||||||||||||||||||||||||||||
Liabilities | Carrying amount | Fair value | Level 1 | Level 2 | Level 3 | Carrying amount | Fair value | Carrying amount | Fair value | |||||||||||||||||||||||||||
Financial liabilities at amortized cost: | ||||||||||||||||||||||||||||||||||||
Deposits from central banks | 9,788 | 9,788 | — | — | 9,788 | 50,938 | 50,938 | 34,996 | 34,996 | |||||||||||||||||||||||||||
Deposits from credit institutions | 76,534 | 76,636 | — | 76,636 | — | 80,732 | 81,819 | 81,373 | 82,287 | |||||||||||||||||||||||||||
Customer deposits | 572,853 | 570,312 | — | — | 570,312 | 589,104 | 590,278 | 588,977 | 589,173 | |||||||||||||||||||||||||||
Marketable debt securities subordinated liabilities | 171,390 | 170,787 | 41,355 | 129,432 | — | 201,064 | 204,014 | 189,110 | 190,410 | |||||||||||||||||||||||||||
Other financial liabilities | 16,139 | 16,342 | — | 16,342 | — | 18,238 | 18,356 | 22,992 | 25,175 | |||||||||||||||||||||||||||
Financial liabilities at amortized cost: | 16,410 | 16,407 | — | — | 16,407 | 19,245 | 19,246 | 18,221 | 18,195 | |||||||||||||||||||||||||||
|
|
|
|
|
|
|
|
|
|
|
|
|
|
|
|
|
| |||||||||||||||||||
| 863,114 | 860,272 | 41,355 | 222,410 | 596,507 | 959,321 | 964,651 | 935,669 | 940,236 | ||||||||||||||||||||||||||||
|
|
|
|
|
|
|
|
|
|
|
|
|
|
|
|
|
| |||||||||||||||||||
The main valuation methods and inputs used in the estimates at December 31, 2013 of the fair values of the financial assets and liabilities in the foregoing table were as follows:
| i) | The fair value of Deposits from central banks was taken to be their carrying amount since they are mainly short-term balances. |
| ii) | Deposits from credit institutions: the fair value was obtained by the present value method using market interest rates and spreads. |
| iii) | Customer deposits: the fair value was estimated using the present value method. The estimates were made considering factors such as the expected maturity of the transactions and the Group’s current cost of funding in similar transactions. |
| iv) | Marketable debt securities and Subordinated liabilities: the fair value was calculated based on market prices for these instruments -when available- or by the present value method using market interest rates and spreads. |
In addition, the fair value of Cash and balances with central banks was taken to be their carrying amount since they are mainly short-term balances.
Lastly, at December 31, 2013, 2012 and 2011, equity instruments amounting to EUR 461 million, EUR 507 million and EUR 458 million, respectively, and recognized as available-for-sale financial assets were measured at other thancost in the consolidated balance sheet because it was not possible to estimate their fair value reliably, since they related to investments in entities not listed on organized markets and, consequently, the non-observable inputs were significant.
Following is a comparison
| d) | Exposure of the Group to Europe’s peripheral countries |
The detail at December 31, 2013 and 2012, by type of the carrying amountsfinancial instrument, of the Group’s financial liabilities measured at other than fair valuesovereign risk exposure to Europe’s peripheral countries and their respective fair values at year-end:of the short positions held with them, taking into consideration the criteria established by the European Banking Authority (EBA) –explained in Note 54– is as follows:
| Millions of euros | ||||||||||||||||||||||||
| 2011 | 2010 | 2009 | ||||||||||||||||||||||
| Carrying | Fair | Carrying | Fair | Carrying | Fair | |||||||||||||||||||
Liabilities | amount | value | amount | value | amount | value | ||||||||||||||||||
Financial liabilities at amortised cost: | ||||||||||||||||||||||||
Deposits from central banks | 34,996 | 34,996 | 8,644 | 8,644 | 22,345 | 22,349 | ||||||||||||||||||
Deposits from credit institutions | 81,373 | 82,287 | 70,893 | 71,036 | 50,781 | 50,905 | ||||||||||||||||||
Customer deposits | 588,977 | 589,173 | 581,385 | 582,624 | 487,681 | 488,675 | ||||||||||||||||||
Marketable debt securities | 189,110 | 190,410 | 188,229 | 189,671 | 206,490 | 206,765 | ||||||||||||||||||
Subordinated liabilities | 22,992 | 25,175 | 30,475 | 32,006 | 36,805 | 37,685 | ||||||||||||||||||
Other financial liabilities | 18,221 | 18,194 | 19,343 | 19,282 | 19,300 | 19,636 | ||||||||||||||||||
|
|
|
|
|
|
|
|
|
|
|
| |||||||||||||
| 935,669 | 940,235 | 898,969 | 903,263 | 823,403 | 826,015 | |||||||||||||||||||
|
|
|
|
|
|
|
|
|
|
|
| |||||||||||||
Sovereign risk by country of issuer/borrower at December 31, 2013 (*) | ||||||||||||||||||||||||||||||||
| Millions of euros | ||||||||||||||||||||||||||||||||
| Debt instruments | Loans and advances to customers (**) | Total net direct exposure | Derivatives (***) | |||||||||||||||||||||||||||||
| Financial assets held for trading and other financial assets at fair value through profit or loss | Short positions | Available- for-sale financial assets | Loans and receivables | Other than CDSs | CDSs | |||||||||||||||||||||||||||
Spain | 4,783 | (2,079 | ) | 21,144 | 1,145 | 13,374 | 38,367 | (153 | ) | — | ||||||||||||||||||||||
Portugal | 148 | — | 2,076 | — | 583 | 2,807 | — | — | ||||||||||||||||||||||||
Italy | 2,571 | (1,262 | ) | 77 | — | — | 1,386 | — | 2 | |||||||||||||||||||||||
Greece | — | — | — | — | — | — | — | — | ||||||||||||||||||||||||
Ireland | — | — | — | — | — | — | 199 | — | ||||||||||||||||||||||||
| (*) | Information prepared under EBA standards. Also, there are government debt securities on the insurance companies’ balance sheets amounting to EUR 5,645 million (of which EUR 4,783 million, EUR 654 million and EUR 208 million relate to Spain, Portugal and Italy, respectively) and off-balance-sheet exposure other than derivatives –contingent liabilities and commitments– amounting to EUR 1,884 million (EUR 1,627 million, EUR 118 million, EUR 137 million and EUR 2 million to Spain, Portugal, Italy and Ireland, respectively). |
| (**) | Presented without taking into account the valuation adjustments recognized (EUR 20 million). |
| (***) | “Other than CDSs” refers to the exposure to derivatives based on the location of the counterparty, irrespective of the location of the underlying. “CDSs” refers to the exposure to CDSs based on the location of the underlying. |
Sovereign risk by country of issuer/borrower at December 31, 2012 (*) | ||||||||||||||||||||||||||||||||
| Millions of euros | ||||||||||||||||||||||||||||||||
| Debt instruments | Loans and advances to customers (**) | Total net direct exposure | Derivatives (***) | |||||||||||||||||||||||||||||
| Financial assets held for trading and other financial assets at fair value through profit or loss | Short positions | Available- for-sale financial assets | Loans and receivables | Other than CDSs | CDSs | |||||||||||||||||||||||||||
Spain | 6,473 | (2,070 | ) | 24,654 | 1,173 | 15,356 | 45,586 | (234 | ) | — | ||||||||||||||||||||||
Portugal | — | — | 1,684 | — | 616 | 2,300 | — | 1 | ||||||||||||||||||||||||
Italy | 353 | (425 | ) | 76 | — | — | 4 | — | — | |||||||||||||||||||||||
Greece | — | — | — | — | — | — | — | — | ||||||||||||||||||||||||
Ireland | — | — | — | — | — | — | 284 | — | ||||||||||||||||||||||||
| (*) | Information prepared under EBA standards. Also, there are government debt securities on the insurance companies’ balance sheets amounting to EUR 4,276 million (of which EUR 3,935 million, EUR 156 million and EUR 185 million relate to Spain, Portugal and Italy, respectively) and off-balance-sheet exposure other than derivatives –contingent liabilities and commitments– amounting to EUR 2,578 million (EUR 2,341 million, EUR 33 million and EUR 204 million to Spain, Portugal and Italy, respectively). |
| (**) | Presented without taking into account the valuation adjustments recognized (EUR 20 million). |
| (***) | “Other than CDSs” refers to the exposure to derivatives based on the location of the counterparty, irrespective of the location of the underlying. “CDSs” refers to the exposure to CDSs based on the location of the underlying. |
The detail of the Group’s other exposure to other counterparties (private sector, central banks and other public entities that are not considered to be sovereign risks) in the aforementioned countries at December 31, 2013 and 2012 is as follows:
Exposure to other counterparties by country of issuer/borrower at December 31, 2013 (*) | ||||||||||||||||||||||||||||||||||||
| Millions of euros | ||||||||||||||||||||||||||||||||||||
| Debt instruments | Derivatives (***) | |||||||||||||||||||||||||||||||||||
| Balances with central banks | Reverse repurchase agreements | Financial assets held for trading and other financial assets at fair value through profit or loss | Available- for-sale financial assets | Loans and receivables | Loans and advances to customers (**) | Total net direct exposure | Other than CDSs | CDSs | ||||||||||||||||||||||||||||
Spain | 816 | 7,451 | 3,148 | 7,826 | 1,804 | 160,478 | 181,523 | 1,981 | (44 | ) | ||||||||||||||||||||||||||
Portugal | 1,716 | — | 209 | 1,168 | 1,845 | 25,578 | 30,516 | 1,454 | (1 | ) | ||||||||||||||||||||||||||
Italy | 11 | — | 368 | 273 | 93 | 6,490 | 7,235 | (115 | ) | (2 | ) | |||||||||||||||||||||||||
Greece | — | — | — | — | — | 80 | 80 | — | — | |||||||||||||||||||||||||||
Ireland | — | — | 229 | 360 | 259 | 507 | 1,355 | 1,031 | — | |||||||||||||||||||||||||||
| (*) | Also, the Group has off-balance-sheet exposure other than derivatives –contingent liabilities and commitments– amounting to EUR 48.659 million, EUR 5.982 million, EUR 2,717 million, EUR 4 million and EUR 93 million to counterparties in Spain, Portugal, Italy, Greece and Ireland, respectively. |
| (**) | Presented excluding valuation adjustments and impairment losses recognized (EUR 13,209 million). |
| (***) | “Other than CDSs” refers to the exposure to derivatives based on the location of the counterparty, irrespective of the location of the underlying. “CDSs” refers to the exposure to CDSs based on the location of the underlying. |
Exposure to other counterparties by country of issuer/borrower at December 31, 2012 (*) | ||||||||||||||||||||||||||||||||||||
| Millions of euros | ||||||||||||||||||||||||||||||||||||
| Debt instruments | Derivatives (***) | |||||||||||||||||||||||||||||||||||
| Balances with central banks | Reverse repurchase agreements | Financial assets held for trading and other financial assets at fair value through profit or loss | Available- for-sale financial assets | Loans and receivables | Loans and advances to customers (**) | Total net direct exposure | Other than CDSs | CDSs | ||||||||||||||||||||||||||||
Spain | 1,218 | 11,471 | 2,598 | 7,225 | 1,130 | 184,658 | 208,300 | 7,180 | (40 | ) | ||||||||||||||||||||||||||
Portugal | 1,156 | — | 997 | 676 | 1,547 | 25,243 | 29,619 | 1,809 | (4 | ) | ||||||||||||||||||||||||||
Italy | 3 | — | 176 | 122 | 83 | 7,513 | 7,897 | (2 | ) | 8 | ||||||||||||||||||||||||||
Greece | — | — | — | — | — | 96 | 96 | — | — | |||||||||||||||||||||||||||
Ireland | — | — | 146 | 414 | 179 | 481 | 1,220 | 344 | — | |||||||||||||||||||||||||||
| (*) | Also, the Group has off-balance-sheet exposure other than derivatives –contingent liabilities and commitments– amounting to EUR 63.101 million, EUR 7.397 million, EUR 3,234 million, EUR 135 million and EUR 224 million to counterparties in Spain, Portugal, Italy, Greece and Ireland, respectively. |
| (**) | Presented excluding valuation adjustments and impairment losses recognized (EUR 12,671 million). |
| (***) | “Other than CDSs” refers to the exposure to derivatives based on the location of the counterparty, irrespective of the location of the underlying. “CDSs” refers to the exposure to CDSs based on the location of the underlying. |
Following is certain information on the notional amount of the CDSs at December 31, 2013 and 2012 detailed in the foregoing tables:
12/31/13 | ||||||||||||||||||||||||||
Millions of euros | ||||||||||||||||||||||||||
| Notional amount | Fair value | |||||||||||||||||||||||||
| Bought | Sold | Net | Bought | Sold | Net | |||||||||||||||||||||
Spain | Sovereign Other | — | — | — | �� | — | — | — | ||||||||||||||||||
| 1,735 | 2,277 | (542 | ) | (18 | ) | (26 | ) | (44 | ) | |||||||||||||||||
Portugal | Sovereign Other | 192 | 174 | 18 | 5 | (5 | ) | — | ||||||||||||||||||
| 223 | 278 | (55 | ) | 1 | (2 | ) | (1 | ) | ||||||||||||||||||
Italy | Sovereign Other | 603 | 570 | 33 | (1 | ) | 3 | 2 | ||||||||||||||||||
| 834 | 913 | (79 | ) | (2 | ) | — | (2 | ) | ||||||||||||||||||
Greece | Sovereign Other | — | — | — | — | — | — | |||||||||||||||||||
| 5 | 5 | — | — | — | — | |||||||||||||||||||||
Ireland | Sovereign Other | 4 | 4 | — | — | — | — | |||||||||||||||||||
| 6 | 6 | — | — | — | — | |||||||||||||||||||||
12/31/12 | ||||||||||||||||||||||||||
Millions of euros | ||||||||||||||||||||||||||
| Notional amount | Fair value | |||||||||||||||||||||||||
| Bought | Sold | Net | Bought | Sold | Net | |||||||||||||||||||||
Spain | Sovereign Other | — | — | — | — | — | — | |||||||||||||||||||
| 2,202 | 2,952 | (750 | ) | 3 | (43 | ) | (40 | ) | ||||||||||||||||||
Portugal | Sovereign Other | 225 | 207 | 18 | 14 | (13 | ) | 1 | ||||||||||||||||||
| 398 | 418 | (20 | ) | 7 | (11 | ) | (4 | ) | ||||||||||||||||||
Italy | Sovereign Other | 518 | 608 | (90 | ) | 12 | (12 | ) | — | |||||||||||||||||
| 1,077 | 1,025 | 52 | 40 | (32 | ) | 8 | ||||||||||||||||||||
Greece | Sovereign Other | — | — | — | — | — | — | |||||||||||||||||||
| 20 | 20 | — | 1 | (1 | ) | — | ||||||||||||||||||||
Ireland | Sovereign Other | 9 | 9 | — | — | — | — | |||||||||||||||||||
| 16 | 16 | — | — | — | — | |||||||||||||||||||||
| 52. | Geographical and business segment reporting |
| a) | Geographical segments |
Business segment reporting is a basic tool used for monitoring and managing the Group’s various activities.
In 2013 the Group made the following changes to its criteria for the management and presentation of its financial information by segment compared to those employed for the year ended December 31, 2012:
Consequently, the segment information for 2012 and 2011 shown below has been recalculated using these criteria in order to make it comparable.
This primary level of segmentation, which is based on the Group’s management structure, comprises five segments: four operating areas plus the Corporate Activities Unit. The operating areas, which include all the business activities carried on therein by the Group, are Continental Europe, the United Kingdom, (Santander UK), Latin America and Sovereign,the United States, based on the location of the Group’s assets.
The Continental Europe area encompasses all the Commercial Banking (including the Private Banking entity Banco Banif, S.A.), Wholesale Bankingcommercial banking, wholesale banking, asset management and Asset Management and Insuranceinsurance business activities carried on in Europe with the exception of the United Kingdom.Kingdom, and the segment relating to real estate operations discontinued in Spain. Latin America includes all the financial activities carried on by the Group through its banks and subsidiaries, as well as the specialisedspecialized units of Santander Private Banking, which is treated as a globally managed independent unit, and the New York business. SovereignThe United States area includes the businesses of the Sovereign unit that was acquired in 2009.Santander Bank and Santander Consumer USA Inc.
The Corporate Activities segment includes the centralized management business relating to financial and industrial investments, the financial management of the Parent’s structural currency position and its structural interest rate risk position and the management of liquidity and equity through issues and securitizations. As the Group’s holding unit, this segment handles the total capital and reserves, capital allocations and liquidity with the other businesses.
F-174
The financial statementsinformation of each operating segment areis prepared by aggregating the figures for the Group’s various business units. The basic information used for segment reporting comprises the accounting data of the legal units composing each segment and the data available fromin the management information systems. All segment financial statements have been prepared on a basis consistent with the accounting policies used by the Group. When calculating the net interest income of each business, internal transfer prices are applied both to assets and liabilities. Having observed that after three years of financial and liquidity crisis the actual cost of liquidity deviated from the benchmark curve used for the units, in 2011 the Group decided to revise the system for measuring net interest income and modified the internal transfer price applied by the corporate centre to the units, adding to the base curve a liquidity spread based on the duration of each transaction. The figures for 2010 and 2009 relating to segment reporting have been recalculated in order to facilitate their comparison with the figures for 2011.
Consequently, the sum of the figures in the various segment income statements of the various segments is equal to those in the consolidated income statement. With regard to the balance sheet, due to the required segregation of the various business units (included in a single consolidated balance sheet), the amounts lent and borrowed between the units are shown as increases in the assets and liabilities of each business. These amounts relating to intra-Group liquidity are eliminated and are shown in the Intra-Group eliminations column in the table below in order to reconcile the amounts contributed by each business unit to the consolidated Group’s balance sheet.
There are no customers located in areas other than those in which the Group’s assets are located that generate income exceeding 10% of total income.
The condensed balance sheets and income statements of the various geographical segments are as follows:
F-175
| Millions of euros | ||||||||||||||||||||||||||||
| 2011 | ||||||||||||||||||||||||||||
(Condensed) balance sheet | Continental Europe | United Kingdom | Latin America | Sovereign | Corporate activities | Intra-Group eliminations | Total | |||||||||||||||||||||
Loans and advances to customers | 315,082 | 252,154 | 139,867 | 40,194 | 2,803 | — | 750,100 | |||||||||||||||||||||
Financial assets held for trading (excluding loans and advances) | 78,802 | 41,441 | 31,705 | 271 | 7,727 | — | 159,946 | |||||||||||||||||||||
Available-for-sale financial assets | 24,640 | 55 | 26,186 | 12,435 | 23,297 | — | 86,613 | |||||||||||||||||||||
Loans and advances to credit institutions | 51,638 | 19,672 | 19,181 | 677 | 59,583 | (99,025 | ) | 51,726 | ||||||||||||||||||||
Non-current assets | 5,045 | 2,288 | 4,312 | 480 | 4,715 | — | 16,840 | |||||||||||||||||||||
Other asset accounts | 28,586 | 39,833 | 53,594 | 3,643 | 138,783 | (78,138 | ) | 186,301 | ||||||||||||||||||||
|
|
|
|
|
|
|
|
|
|
|
|
|
| |||||||||||||||
Total assets / liabilities | 503,793 | 355,443 | 274,845 | 57,700 | 236,908 | (177,163 | ) | 1,251,526 | ||||||||||||||||||||
|
|
|
|
|
|
|
|
|
|
|
|
|
| |||||||||||||||
Customer deposits | 247,582 | 194,318 | 134,078 | 36,884 | 19,671 | — | 632,533 | |||||||||||||||||||||
Marketable debt securities | 39,709 | 70,505 | 23,253 | 1,653 | 62,252 | — | 197,372 | |||||||||||||||||||||
Subordinated liabilities | 965 | 8,260 | 6,015 | 2,275 | 5,477 | — | 22,992 | |||||||||||||||||||||
Liabilities under insurance contracts | 517 | — | — | — | — | — | 517 | |||||||||||||||||||||
Deposits from central banks and credit institutions | 88,143 | 31,178 | 46,813 | 9,934 | 66,094 | (99,025 | ) | 143,137 | ||||||||||||||||||||
Other liability accounts | 96,088 | 38,330 | 45,170 | 2,412 | 6,299 | (10,439 | ) | 177,860 | ||||||||||||||||||||
Equity (share capital + reserves) | 30,789 | 12,852 | 19,516 | 4,542 | 77,115 | (67,699 | ) | 77,115 | ||||||||||||||||||||
|
|
|
|
|
|
|
|
|
|
|
|
|
| |||||||||||||||
Other customer funds under management | 45,809 | 15,744 | 69,902 | 1 | — | — | 131,456 | |||||||||||||||||||||
|
|
|
|
|
|
|
|
|
|
|
|
|
| |||||||||||||||
Investment funds | 31,038 | 15,744 | 55,829 | — | — | — | 102,611 | |||||||||||||||||||||
Pension funds | 9,645 | — | — | — | — | — | 9,645 | |||||||||||||||||||||
Assets under management | 5,126 | — | 14,073 | 1 | — | — | 19,200 | |||||||||||||||||||||
|
|
|
|
|
|
|
|
|
|
|
|
|
| |||||||||||||||
Customer funds under management | 334,064 | 288,826 | 233,248 | 40,812 | 87,403 | — | 984,353 | |||||||||||||||||||||
|
|
|
|
|
|
|
|
|
|
|
|
|
| |||||||||||||||
F-176
| Millions of euros | ||||||||||||||||||||||||||||
| 2010 | ||||||||||||||||||||||||||||
(Condensed) balance sheet | Continental Europe | United Kingdom | Latin America | Sovereign | Corporate activities | Intra-Group eliminations | Total | |||||||||||||||||||||
Loans and advances to customers | 323,660 | 233,856 | 127,268 | 36,724 | 2,645 | — | 724,153 | |||||||||||||||||||||
Financial assets held for trading (excluding loans and advances) | 57,690 | 45,187 | 31,580 | 211 | 5,123 | — | 139,791 | |||||||||||||||||||||
Available-for-sale financial assets | 23,843 | 204 | 30,697 | 10,203 | 21,288 | — | 86,235 | |||||||||||||||||||||
Loans and advances to credit institutions | 66,925 | 29,136 | 21,632 | 722 | 36,869 | (75,429 | ) | 79,855 | ||||||||||||||||||||
Non-current assets | 4,965 | 2,323 | 4,880 | 507 | 1,909 | — | 14,584 | |||||||||||||||||||||
Other asset accounts | 22,160 | 42,063 | 57,186 | 3,430 | 139,496 | (91,452 | ) | 172,883 | ||||||||||||||||||||
|
|
|
|
|
|
|
|
|
|
|
|
|
| |||||||||||||||
Total assets / liabilities | 499,243 | 352,769 | 273,243 | 51,797 | 207,330 | (166,881 | ) | 1,217,501 | ||||||||||||||||||||
|
|
|
|
|
|
|
|
|
|
|
|
|
| |||||||||||||||
Customer deposits | 247,715 | 184,548 | 137,848 | 32,007 | 14,258 | — | 616,376 | |||||||||||||||||||||
Marketable debt securities | 48,413 | 64,326 | 15,377 | 1,945 | 62,812 | — | 192,873 | |||||||||||||||||||||
Subordinated liabilities | 1,740 | 8,143 | 5,683 | 2,781 | 12,128 | — | 30,475 | |||||||||||||||||||||
Liabilities under insurance contracts | 933 | 1 | 9,515 | — | — | — | 10,449 | |||||||||||||||||||||
Deposits from central banks and credit institutions | 77,059 | 54,179 | 38,102 | 9,567 | 36,634 | (75,429 | ) | 140,112 | ||||||||||||||||||||
Other liability accounts | 95,963 | 29,811 | 45,913 | 2,297 | 11,075 | (28,265 | ) | 156,794 | ||||||||||||||||||||
Equity (share capital + reserves) | 27,420 | 11,761 | 20,805 | 3,200 | 70,423 | (63,187 | ) | 70,422 | ||||||||||||||||||||
|
|
|
|
|
|
|
|
|
|
|
|
|
| |||||||||||||||
Other customer funds under management | 53,968 | 14,369 | 77,180 | 30 | — | — | 145,547 | |||||||||||||||||||||
|
|
|
|
|
|
|
|
|
|
|
|
|
| |||||||||||||||
Investment funds | 37,519 | 14,369 | 61,622 | — | — | — | 113,510 | |||||||||||||||||||||
Pension funds | 10,965 | — | — | — | — | — | 10,965 | |||||||||||||||||||||
Assets under management | 5,484 | — | 14,800 | 30 | — | — | 20,314 | |||||||||||||||||||||
Savings insurance | — | — | 758 | — | — | — | 758 | |||||||||||||||||||||
|
|
|
|
|
|
|
|
|
|
|
|
|
| |||||||||||||||
Customer funds under management | 351,836 | 271,386 | 236,087 | 36,763 | 89,197 | — | 985,269 | |||||||||||||||||||||
|
|
|
|
|
|
|
|
|
|
|
|
|
| |||||||||||||||
F-177
| Millions of euros | ||||||||||||||||||||||||||||
| 2009 | ||||||||||||||||||||||||||||
(Condensed) balance sheet | Continental Europe | United Kingdom | Latin America | Sovereign | Corporate activities | Intra-Group eliminations | Total | |||||||||||||||||||||
Loans and advances to customers | 319,236 | 230,503 | 97,901 | 34,605 | 306 | — | 682,551 | |||||||||||||||||||||
Financial assets held for trading (excluding loans and advances) | 50,764 | 41,245 | 22,521 | 163 | 4,332 | — | 119,025 | |||||||||||||||||||||
Available-for-sale financial assets | 20,131 | 898 | 29,154 | 9,568 | 26,869 | — | 86,620 | |||||||||||||||||||||
Loans and advances to credit institutions | 90,354 | 28,921 | 22,146 | 496 | 43,550 | (105,630 | ) | 79,837 | ||||||||||||||||||||
Non-current assets | 4,995 | 1,483 | 3,926 | 391 | 979 | — | 11,774 | |||||||||||||||||||||
Other asset accounts | 21,825 | 24,652 | 38,105 | 3,568 | 144,697 | (102,125 | ) | 130,722 | ||||||||||||||||||||
|
|
|
|
|
|
|
|
|
|
|
|
|
| |||||||||||||||
Total assets / liabilities | 507,305 | 327,702 | 213,753 | 48,791 | 220,733 | (207,755 | ) | 1,110,529 | ||||||||||||||||||||
|
|
|
|
|
|
|
|
|
|
|
|
|
| |||||||||||||||
Customer deposits | 198,120 | 166,631 | 108,122 | 30,888 | 3,214 | — | 506,975 | |||||||||||||||||||||
Marketable debt securities | 50,610 | 58,611 | 8,411 | 11,236 | 83,095 | — | 211,963 | |||||||||||||||||||||
Subordinated liabilities | 2,079 | 8,577 | 4,888 | 2,129 | 19,132 | — | 36,805 | |||||||||||||||||||||
Liabilities under insurance contracts | 10,287 | 3 | 6,626 | — | — | — | 16,916 | |||||||||||||||||||||
Deposits from central banks and credit institutions | 115,299 | 60,089 | 32,765 | 736 | 38,832 | (105,630 | ) | 142,091 | ||||||||||||||||||||
Other liability accounts | 105,245 | 27,067 | 34,995 | 1,689 | 11,275 | (49,677 | ) | 130,594 | ||||||||||||||||||||
Equity (share capital + reserves) | 25,665 | 6,724 | 17,946 | 2,113 | 65,185 | (52,448 | ) | 65,185 | ||||||||||||||||||||
|
|
|
|
|
|
|
|
|
|
|
|
|
| |||||||||||||||
Other customer funds under management | 70,289 | 10,937 | 62,759 | 327 | — | — | 144,312 | |||||||||||||||||||||
|
|
|
|
|
|
|
|
|
|
|
|
|
| |||||||||||||||
Investment funds | 44,598 | 10,937 | 49,681 | — | — | — | 105,216 | |||||||||||||||||||||
Pension funds | 11,310 | — | — | — | — | — | 11,310 | |||||||||||||||||||||
Assets under management | 5,499 | — | 12,538 | 327 | — | — | 18,364 | |||||||||||||||||||||
Savings insurance | 8,882 | — | 540 | — | — | — | 9,422 | |||||||||||||||||||||
|
|
|
|
|
|
|
|
|
|
|
|
|
| |||||||||||||||
Customer funds under management | 321,099 | 244,755 | 184,180 | 44,580 | 105,441 | — | 900,055 | |||||||||||||||||||||
|
|
|
|
|
|
|
|
|
|
|
|
|
| |||||||||||||||
F-178
| Millions of euros | ||||||||||||||||||||||||
| 2011 | ||||||||||||||||||||||||
(Condensed) | Continental Europe | United Kingdom | Latin America | Sovereign | Corporate activities | Total | ||||||||||||||||||
INTEREST INCOME/(CHARGES) | 10,666 | 4,176 | 16,473 | 1,678 | (2,172 | ) | 30,821 | |||||||||||||||||
Income from equity instruments | 264 | 1 | 72 | 1 | 56 | 394 | ||||||||||||||||||
Income for companies accounted for using the equity method | 14 | 1 | 37 | — | 5 | 57 | ||||||||||||||||||
Net fee and commission income (expense) | 4,051 | 1,070 | 4,991 | 375 | (15 | ) | 10,472 | |||||||||||||||||
Gains/losses on financial assets and liabilities (net) and exchange differences (net) | 233 | 405 | 1,067 | 190 | 421 | 2,316 | ||||||||||||||||||
Other operating income/(expenses) | 119 | 25 | (198 | ) | (56 | ) | 128 | 18 | ||||||||||||||||
TOTAL INCOME | 15,347 | 5,678 | 22,442 | 2,188 | (1,577 | ) | 44,078 | |||||||||||||||||
Personnel expenses | (3,725 | ) | (1,391 | ) | (4,456 | ) | (469 | ) | (285 | ) | (10,326 | ) | ||||||||||||
Other administrative expenses | (2,273 | ) | (812 | ) | (3,528 | ) | (394 | ) | (448 | ) | (7,455 | ) | ||||||||||||
Depreciation and amortization of tangible and intangible assets | (614 | ) | (351 | ) | (925 | ) | (113 | ) | (106 | ) | (2,109 | ) | ||||||||||||
Net impairment losses on financial assets | (4,206 | ) | (585 | ) | (5,447 | ) | (375 | ) | (1,255 | ) | (11,868 | ) | ||||||||||||
Provisions (net) | (138 | ) | (969 | ) | (1,232 | ) | (42 | ) | (220 | ) | (2,601 | ) | ||||||||||||
Net impairment losses on non-financial assets | (48 | ) | — | (38 | ) | (18 | ) | (1,413 | ) | (1,517 | ) | |||||||||||||
Other non-financial gains/(losses) | (304 | ) | (3 | ) | 241 | (1 | ) | (196 | ) | (263 | ) | |||||||||||||
PROFIT (LOSS) BEFORE TAX | 4,039 | 1,567 | 7,057 | 776 | (5,500 | ) | 7,939 | |||||||||||||||||
Income tax | (1,049 | ) | (422 | ) | (1,655 | ) | (250 | ) | 1,600 | (1,776 | ) | |||||||||||||
PROFIT (LOSS) FROM ORDINARY ACTIVITIES | 2,990 | 1,145 | 5,402 | 526 | (3,900 | ) | 6,163 | |||||||||||||||||
Profit (loss) from discontinued operations | (24 | ) | — | — | — | — | (24 | ) | ||||||||||||||||
CONSOLIDATED PROFIT (LOSS) FOR THE YEAR | 2,966 | 1,145 | 5,402 | 526 | (3,900 | ) | 6,139 | |||||||||||||||||
Attributable to non-controlling interests | 117 | — | 738 | — | (67 | ) | 788 | |||||||||||||||||
PROFIT (LOSS) ATTRIBUTABLE TO THE PARENT | 2,849 | 1,145 | 4,664 | 526 | (3,833 | ) | 5,351 | |||||||||||||||||
F-179
| Millions of euros | ||||||||||||||||||||||||||||||||||||||||||||||||
| 2010 | 2009 | |||||||||||||||||||||||||||||||||||||||||||||||
(Condensed) | Continental Europe | United Kingdom | Latin America | Sovereign | Corporate activities | Total | Continental Europe | United Kingdom | Latin America | Sovereign | Corporate activities | Total | ||||||||||||||||||||||||||||||||||||
INTEREST INCOME/(CHARGES) | 9,872 | 4,766 | 14,678 | 1,736 | (1,828 | ) | 29,224 | 10,966 | 4,298 | 11,959 | 1,160 | (2,084 | ) | 26,299 | ||||||||||||||||||||||||||||||||||
Income from equity instruments | 217 | — | 80 | 1 | 64 | 362 | 218 | — | 96 | 1 | 121 | 436 | ||||||||||||||||||||||||||||||||||||
Income for companies accounted for using the equity method | 9 | — | 10 | — | (2 | ) | 17 | 7 | — | 10 | (3 | ) | (15 | ) | (1 | ) | ||||||||||||||||||||||||||||||||
Net fee and commission income (expense) | 3,679 | 1,027 | 4,661 | 408 | (40 | ) | 9,735 | 3,697 | 1,083 | 3,925 | 380 | (5 | ) | 9,080 | ||||||||||||||||||||||||||||||||||
Gains/losses on financial assets and liabilities (net) and exchange differences (net) | 846 | 462 | 1,410 | 29 | (142 | ) | 2,605 | 687 | 506 | 1,663 | 14 | 1,376 | 4,246 | |||||||||||||||||||||||||||||||||||
Other operating income/(expenses) | 170 | 29 | (163 | ) | (67 | ) | 137 | 106 | 138 | 28 | 15 | (89 | ) | 52 | 144 | |||||||||||||||||||||||||||||||||
TOTAL INCOME | 14,793 | 6,284 | 20,676 | 2,107 | (1,811 | ) | 42,049 | 15,713 | 5,915 | 17,668 | 1,463 | (555 | ) | 40,204 | ||||||||||||||||||||||||||||||||||
Personnel expenses | (3,343 | ) | (1,295 | ) | (3,955 | ) | (468 | ) | (268 | ) | (9,329 | ) | (3,220 | ) | (1,257 | ) | (3,210 | ) | (457 | ) | (307 | ) | (8,451 | ) | ||||||||||||||||||||||||
Other administrative expenses | (1,958 | ) | (946 | ) | (3,238 | ) | (364 | ) | (420 | ) | (6,926 | ) | (1,896 | ) | (959 | ) | (2,822 | ) | (309 | ) | (388 | ) | (6,374 | ) | ||||||||||||||||||||||||
Depreciation and amortization of tangible and intangible assets | (616 | ) | (309 | ) | (778 | ) | (105 | ) | (132 | ) | (1,940 | ) | (548 | ) | (253 | ) | (566 | ) | (115 | ) | (114 | ) | (1,596 | ) | ||||||||||||||||||||||||
Net impairment losses on financial assets | (4,048 | ) | (930 | ) | (4,687 | ) | (510 | ) | (268 | ) | (10,443 | ) | (3,286 | ) | (881 | ) | (4,979 | ) | (571 | ) | (1,861 | ) | (11,578 | ) | ||||||||||||||||||||||||
Provisions (net) | (40 | ) | (151 | ) | (990 | ) | (66 | ) | 114 | (1,133 | ) | (99 | ) | (195 | ) | (681 | ) | (55 | ) | (762 | ) | (1,792 | ) | |||||||||||||||||||||||||
Net impairment losses on non-financial assets | (48 | ) | — | (12 | ) | (19 | ) | (207 | ) | (286 | ) | (42 | ) | — | (22 | ) | (1 | ) | (100 | ) | (165 | ) | ||||||||||||||||||||||||||
Other non-financial gains/(losses) | (56 | ) | 47 | 255 | (8 | ) | (178 | ) | 60 | (73 | ) | (7 | ) | 40 | (2 | ) | 382 | 340 | ||||||||||||||||||||||||||||||
PROFIT (LOSS) BEFORE TAX | 4,684 | 2,700 | 7,271 | 567 | (3,170 | ) | 12,052 | 6,549 | 2,363 | 5,428 | (47 | ) | (3,705 | ) | 10,588 | |||||||||||||||||||||||||||||||||
Income tax | (1,219 | ) | (735 | ) | (1,693 | ) | (143 | ) | 867 | (2,923 | ) | (1,770 | ) | (639 | ) | (1,257 | ) | 22 | 2,437 | (1,207 | ) | |||||||||||||||||||||||||||
PROFIT (LOSS) FROM ORDINARY ACTIVITIES | 3,465 | 1,965 | 5,578 | 424 | (2,303 | ) | 9,129 | 4,779 | 1,724 | 4,171 | (25 | ) | (1,268 | ) | 9,381 | |||||||||||||||||||||||||||||||||
Profit (loss) from discontinued operations | (14 | ) | — | — | — | (13 | ) | (27 | ) | (45 | ) | — | 91 | — | (15 | ) | 31 | |||||||||||||||||||||||||||||||
CONSOLIDATED PROFIT (LOSS) FOR THE YEAR | 3,451 | 1,965 | 5,578 | 424 | (2,316 | ) | 9,102 | 4,734 | 1,724 | 4,262 | (25 | ) | (1,283 | ) | 9,412 | |||||||||||||||||||||||||||||||||
Attributable to non-controlling interests | 96 | — | 850 | — | (25 | ) | 921 | 66 | — | 428 | — | (24 | ) | 470 | ||||||||||||||||||||||||||||||||||
PROFIT (LOSS) ATTRIBUTABLE TO THE PARENT | 3,355 | 1,965 | 4,728 | 424 | (2,291 | ) | 8,181 | 4,668 | 1,724 | 3,834 | (25 | ) | (1,259 | ) | 8,942 | |||||||||||||||||||||||||||||||||
| Millions of euros | ||||||||||||||||||||||||||||
| 2013 | ||||||||||||||||||||||||||||
(Condensed) balance sheet | Continental Europe | United Kingdom | Latin America | United States | Corporate Activities | Intra-Group eliminations | Total | |||||||||||||||||||||
Total assets | 436,641 | 323,744 | 249,978 | 54,331 | 181,722 | (130,778 | ) | 1,115,638 | ||||||||||||||||||||
|
|
|
|
|
|
|
|
|
|
|
|
|
| |||||||||||||||
Loans and advances to customers | 266,355 | 231,046 | 132,542 | 37,682 | 1,231 | — | 668,856 | |||||||||||||||||||||
Financial assets held for trading (excluding loans and advances) | 50,317 | 28,832 | 23,108 | 117 | 2,333 | — | 104,707 | |||||||||||||||||||||
Available-for-sale financial assets | 37,319 | 6,003 | 20,947 | 8,854 | 10,676 | — | 83,799 | |||||||||||||||||||||
Loans and advances to credit institutions | 38,506 | 17,136 | 28,213 | 348 | 28,774 | (38,013 | ) | 74,964 | ||||||||||||||||||||
Non-current assets (*) | 6,297 | 2,498 | 3,931 | 585 | 3,303 | — | 16,614 | |||||||||||||||||||||
Other asset accounts | 37,847 | 38,229 | 41,237 | 6,745 | 135,405 | (92,765 | ) | 166,698 | ||||||||||||||||||||
|
|
|
|
|
|
|
|
|
|
|
|
|
| |||||||||||||||
Total liabilities and equity | 436,641 | 323,744 | 249,978 | 54,331 | 181,722 | (130,778 | ) | 1,115,638 | ||||||||||||||||||||
|
|
|
|
|
|
|
|
|
|
|
|
|
| |||||||||||||||
Customer deposits | 256,138 | 187,467 | 125,844 | 35,537 | 2,851 | — | 607,837 | |||||||||||||||||||||
Marketable debt securities | 16,781 | 64,093 | 28,987 | 1,146 | 64,470 | — | 175,477 | |||||||||||||||||||||
Subordinated liabilities | 406 | 5,805 | 4,832 | 1,225 | 3,871 | — | 16,139 | |||||||||||||||||||||
Liabilities under insurance contracts | 1,430 | — | — | — | — | — | 1,430 | |||||||||||||||||||||
Deposits from central banks and credit institutions | 59,041 | 26,882 | 24,825 | 8,101 | 28,561 | (38,013 | ) | 109,397 | ||||||||||||||||||||
Other accounts (**) | 77,194 | 26,855 | 45,253 | 2,649 | 1,193 | (28,562 | ) | 124,582 | ||||||||||||||||||||
Equity (share capital and reserves) | 25,651 | 12,642 | 20,237 | 5,673 | 80,776 | (64,203 | ) | 80,776 | ||||||||||||||||||||
|
|
|
|
|
|
|
|
|
|
|
|
|
| |||||||||||||||
Other customer funds under management | 50,962 | 9,645 | 64,563 | — | — | — | 125,170 | |||||||||||||||||||||
|
|
|
|
|
|
|
|
|
|
|
|
|
| |||||||||||||||
Investment funds | 33,445 | 9,645 | 50,214 | — | — | — | 93,304 | |||||||||||||||||||||
Pension funds | 10,879 | — | — | — | — | — | 10,879 | |||||||||||||||||||||
Assets under management | 6,638 | — | 14,349 | — | — | — | 20,987 | |||||||||||||||||||||
|
|
|
|
|
|
|
|
|
|
|
|
|
| |||||||||||||||
Customer funds under management (***) | 324,287 | 267,010 | 224,226 | 37,908 | 71,192 | — | 924,623 | |||||||||||||||||||||
|
|
|
|
|
|
|
|
|
|
|
|
|
| |||||||||||||||
| (*) |
| (**) | Including, in addition to liability items not broken down, the balances of Valuation adjustments, Non-controlling interests and Profit for |
| (***) | Including Customer deposits, Marketable debt securities, Subordinated liabilities and Other customer funds under management. |
The Corporate Activities segment acts as the Group’s holding company. Therefore, it manages all equity (share capital and reserves of all the units) and determines the allocation thereof to each unit. The Group’s equity (EUR 80,776 million) is initially assigned to this segment, and is then allocated in accordance with corporate policies to the business units (EUR 64,203 million). This allocation is shown as an asset of the Corporate Activities segment (included in Other asset accounts) and as a liability of each business unit (included in Equity (share capital and reserves)). Therefore, the allocation is reflected in the intra-Group elimination adjustment balance sheet in order not to duplicate the balances and obtain the total consolidated balance sheet for the Group.
(Condensed) balance sheet Total assets Loans and advances to customers Financial assets held for trading (excluding loans and advances) Available-for-sale financial assets Loans and advances to credit institutions Non-current assets (*) Other asset accounts Total liabilities and equity Customer deposits Marketable debt securities Subordinated liabilities Liabilities under insurance contracts Deposits from central banks and credit institutions Other accounts (**) Equity (share capital and reserves) Other customer funds under management Investment funds Pension funds Assets under management Customer funds under management (***) Millions of euros 2012 Continental
Europe United
Kingdom Latin America United
States Corporate
Activities Intra-Group
eliminations Total 495,272 359,058 269,627 62,950 243,455 (160,762 ) 1,269,600 283,427 249,157 140,090 41,331 5,107 — 719,112 87,992 38,177 28,403 275 4,065 — 158,912 38,309 6,718 23,499 14,791 8,949 — 92,266 49,020 18,124 25,799 714 50,422 (70,179 ) 73,900 5,697 2,561 4,490 560 3,988 — 17,296 30,827 44,321 47,346 5,279 170,924 (90,583 ) 208,114 495,272 359,058 269,627 62,950 243,455 (160,762 ) 1,269,600 256,154 194,452 134,765 38,116 3,152 — 626,639 21,119 73,919 28,107 820 82,002 2 205,969 118 5,534 5,734 1,986 4,866 — 18,238 1,425 — — — — — 1,425 78,177 29,313 32,131 14,221 69,304 (70,180 ) 152,966 107,245 42,689 48,481 2,628 4,442 (20,811 ) 184,674 31,034 13,151 20,409 5,179 79,689 (69,773 ) 79,689 43,391 13,919 60,831 — — — 118,141 27,080 13,919 48,177 — — — 89,176 10,076 — — — — — 10,076 6,235 — 12,654 — — — 18,889 320,782 287,824 229,437 40,922 90,020 2 968,987
| (*) | Including Tangible assets and Other intangible assets. |
| (**) | Including, in addition to liability items not broken down, the balances of Valuation adjustments, Non-controlling interests and Profit for the year attributable to the Parent. |
| (***) | Including Customer deposits, Marketable debt securities, Subordinated liabilities and Other customer funds under management. |
(Condensed) balance sheet Total assets Loans and advances to customers Financial assets held for trading (excluding loans and advances) Available-for-sale financial assets Loans and advances to credit institutions Non-current assets (*) Other asset accounts Total liabilities and equity Customer deposits Marketable debt securities Subordinated liabilities Liabilities under insurance contracts Deposits from central banks and credit institutions Other accounts (**) Equity (share capital and reserves) Other customer funds under management Investment funds Pension funds Assets under management Customer funds under management Millions of euros 2011 Continental
Europe United
Kingdom Latin America United
States Corporate
Activities Intra-Group
eliminations Total 497,157 355,542 275,105 59,785 289,766 (226,346 ) 1,251,009 303,117 254,140 139,867 40,194 5,078 6,145 748,541 79,230 41,440 31,705 271 7,300 — 159,946 40,424 55 26,186 12,435 7,513 — 86,613 43,635 16,808 19,181 677 68,502 (97,077 ) 51,726 5,359 2,290 4,312 493 4,385 1 16,840 25,392 40,809 53,854 5,715 196,988 (135,415 ) 187,343 497,157 355,542 275,105 59,785 289,766 (226,346 ) 1,251,009 244,836 194,317 134,078 36,884 22,418 — 632,533 16,586 70,823 23,253 1,653 83,721 1,336 197,372 181 8,260 6,015 2,275 6,260 1 22,992 517 — — — — — 517 72,239 31,203 46,832 11,570 139,668 (158,374 ) 143,138 133,418 37,922 45,435 2,862 (39,416 ) (2,879 ) 177,342 29,380 13,017 19,492 4,541 77,115 (66,430 ) 77,115 40,050 15,744 69,902 1 5,759 — 131,456 27,124 15,744 55,829 — 3,914 — 102,611 8,159 — — — 1,486 — 9,645 4,767 — 14,073 1 359 — 19,200 301,653 289,144 233,248 40,813 118,158 1,337 984,353
F-180
| (*) | Including Tangible assets and Other intangible assets. |
| (**) | Including, in addition to liability items not broken down, the balances of Valuation adjustments, Non-controlling interests and Profit for the year attributable to the Parent. |
| (***) | Including Customer deposits, Marketable debt securities, Subordinated liabilities and Other customer funds under management. |
| Millions of euros | ||||||||||||||||||||||||
| 2013 | ||||||||||||||||||||||||
(Condensed) income statement | Continental Europe | United Kingdom | Latin America | United States | Corporate Activities | Total | ||||||||||||||||||
INTEREST INCOME/(CHARGES) | 8,123 | 3,451 | 15,186 | 1,409 | (2,234 | ) | 25,935 | |||||||||||||||||
Dividends | 265 | 1 | 54 | 23 | 35 | 378 | ||||||||||||||||||
Income from companies accounted for using the equity method | (19 | ) | 4 | 202 | 321 | (8 | ) | 500 | ||||||||||||||||
Net fee and commission income (expense) | 3,552 | 991 | 4,874 | 394 | (50 | ) | 9,761 | |||||||||||||||||
Gains/losses on financial assets and liabilities (net) and exchange differences (net) | 775 | 403 | 1,038 | 69 | 1,109 | 3,394 | ||||||||||||||||||
Other operating income (expenses) | (111 | ) | 30 | (271 | ) | (58 | ) | 119 | (291 | ) | ||||||||||||||
TOTAL INCOME | 12,585 | 4,880 | 21,083 | 2,158 | (1,029 | ) | 39,677 | |||||||||||||||||
General administrative expenses | (5,807 | ) | (2,181 | ) | (7,801 | ) | (1,097 | ) | (566 | ) | (17,452 | ) | ||||||||||||
Personnel expenses | (3,527 | ) | (1,401 | ) | (4,319 | ) | (606 | ) | (216 | ) | (10,069 | ) | ||||||||||||
Other general administrative expenses | (2,280 | ) | (780 | ) | (3,482 | ) | (491 | ) | (350 | ) | (7,382 | ) | ||||||||||||
Depreciation and amortization | (769 | ) | (424 | ) | (904 | ) | (163 | ) | (131 | ) | (2,391 | ) | ||||||||||||
Provisions (net) | (158 | ) | (232 | ) | (783 | ) | (50 | ) | (959 | ) | (2,182 | ) | ||||||||||||
Impairment losses | (3,766 | ) | (580 | ) | (6,533 | ) | 4 | (352 | ) | (11,227 | ) | |||||||||||||
Impairment losses on non-financial assets | (65 | ) | (4 | ) | (25 | ) | (16 | ) | (393 | ) | (503 | ) | ||||||||||||
Other income and charges | (374 | ) | — | 307 | 2 | 1,795 | 1,730 | |||||||||||||||||
PROFIT (LOSS) BEFORE TAX | 1,646 | 1,459 | 5,344 | 838 | (1,635 | ) | 7,652 | |||||||||||||||||
Income tax | (376 | ) | (301 | ) | (1,208 | ) | (113 | ) | (115 | ) | (2,113 | ) | ||||||||||||
PROFIT (LOSS) FROM CONTINUING OPERATIONS | 1,270 | 1,158 | 4,136 | 725 | (1,750 | ) | 5,539 | |||||||||||||||||
Loss from discontinued operations | (6 | ) | (9 | ) | — | — | — | (15 | ) | |||||||||||||||
CONSOLIDATED PROFIT (LOSS) FOR THE YEAR | 1,264 | 1,149 | 4,136 | 725 | (1,750 | ) | 5,524 | |||||||||||||||||
Attributable to non-controlling interests | 137 | — | 879 | — | 138 | 1,154 | ||||||||||||||||||
PROFIT (LOSS) ATTRIBUTABLE TO THE PARENT | 1,127 | 1,149 | 3,257 | 725 | (1,888 | ) | 4,370 | |||||||||||||||||
(Condensed) income INTEREST INCOME/(CHARGES) Dividends Income from companies accounted for using the equity method Net fee and commission income (expense) Gains/losses on financial assets and liabilities (net) and exchange differences (net) Other operating income (expenses) TOTAL INCOME General administrative expenses Personnel expenses Other general administrative expenses Depreciation and amortization Provisions (net) Impairment losses Impairment losses on non-financial assets Other income and charges PROFIT (LOSS) BEFORE TAX Income tax PROFIT (LOSS) FROM CONTINUING OPERATIONS Profit (Loss) from discontinued operations CONSOLIDATED PROFIT (LOSS) FOR THE YEAR Attributable to non-controlling interests PROFIT (LOSS) ATTRIBUTABLE TO THE PARENT Millions of euros 2012 2011
statement Continental
Europe United
Kingdom Latin
America United
States Corporate
Activities Total Continental
Europe United
Kingdom Latin
America United
States Corporate
Activities Total 8,854 3,336 17,881 1,695 (1,843 ) 29,923 7,976 4,128 16,473 3,289 (1,272 ) 30,594 289 1 60 20 53 423 264 1 72 1 56 394 (88 ) (5 ) 183 341 (4 ) 427 17 1 36 — 3 57 3,625 1,190 5,097 378 (29 ) 10,261 3,767 1,015 4,992 643 (9 ) 10,408 306 1,231 1,071 244 288 3,140 254 405 1,067 192 398 2,316 (19 ) 24 (358 ) (73 ) 536 110 131 28 (198 ) (57 ) 117 21 12,967 5,777 23,934 2,605 (999 ) 44,284 12,409 5,578 22,442 4,068 (707 ) 43,790 (5,790 ) (2,311 ) (8,253 ) (1,037 ) (410 ) (17,801 ) (5,805 ) (2,131 ) (8,037 ) (1,169 ) (502 ) (17,644 ) (3,498 ) (1,492 ) (4,643 ) (571 ) (102 ) (10,306 ) (3,535 ) (1,407 ) (4,480 ) (645 ) (238 ) (10,305 ) (2,292 ) (819 ) (3,610 ) (466 ) (308 ) (7,495 ) (2,270 ) (724 ) (3,557 ) (524 ) (264 ) (7,339 ) (667 ) (379 ) (871 ) (146 ) (120 ) (2,183 ) (590 ) (343 ) (932 ) (126 ) (107 ) (2,098 ) (130 ) (522 ) (1,027 ) (170 ) 371 (1,478 ) (437 ) (964 ) (1,052 ) (43 ) (120 ) (2,616 ) (9,903 ) (1,220 ) (7,380 ) (265 ) (112 ) (18,880 ) (3,694 ) (559 ) (5,448 ) (1,006 ) (1,087 ) (11,794 ) (27 ) — (17 ) (24 ) (440 ) (508 ) (75 ) — (39 ) (118 ) (1,285 ) (1,517 ) (757 ) 5 226 7 668 149 (1,719 ) 9 62 — 1,385 (263 ) (4,307 ) 1,350 6,612 970 (1,042 ) 3,583 89 1,590 6,996 1,606 (2,423 ) 7,858 1,490 (312 ) (1,484 ) (165 ) (119 ) (590 ) 133 (424 ) (1,636 ) (554 ) 726 (1,755 ) (2,817 ) 1,038 5,128 805 (1,161 ) 2,993 222 1,166 5,360 1,052 (1,697 ) 6,103 (7 ) 77 — — — 70 (24 ) 39 — — — 15 (2,824 ) 1,115 5,128 805 (1,161 ) 3,063 198 1,205 5,360 1,052 (1,697 ) 6,118 (79 ) — 866 — (19 ) 768 28 — 738 48 (26 ) 788 (2,745 ) 1,115 4,262 805 (1,142 ) 2,295 170 1,205 4,622 1,004 (1,671 ) 5,330
Following is the detail of revenue by the geographical segments used by the Group. For the purposes of the table below, revenue is deemed to be that recognized under Interest and similar income, Income from equity instruments, Fee and commission income, Gains/Losses on financial assets and liabilities (net) and Other operating income in the accompanying consolidated income statements for 2011, 20102013 and 2009.2012.
Segment | Revenue (millions of euros) | |||||||||||||||||||||||||||||||||||||||||||||||||||||||||||
| Revenue from external customers | Inter-segment revenue | Total revenue | ||||||||||||||||||||||||||||||||||||||||||||||||||||||||||
| 2011 | 2010 | 2009 | 2011 | 2010 | 2009 | 2011 | 2010 | 2009 | ||||||||||||||||||||||||||||||||||||||||||||||||||||
| Revenue (millions of euros) | ||||||||||||||||||||||||||||||||||||||||||||||||||||||||||||
| Revenue from external customers | Inter-segment revenue | Total revenue | ||||||||||||||||||||||||||||||||||||||||||||||||||||||||||
| 2013 | 2012 | 2013 | 2012 | 2013 | 2012 | |||||||||||||||||||||||||||||||||||||||||||||||||||||||
Continental Europe | 30,585 | 27,538 | 31,968 | 565 | 130 | 1,297 | 31,150 | 27,668 | 33,265 | 24,369 | 27,139 | 1,141 | 248 | 25,510 | 27,387 | |||||||||||||||||||||||||||||||||||||||||||||
United Kingdom | 10,674 | 10,201 | 10,595 | 176 | 92 | 1,287 | 10,850 | 10,293 | 11,882 | 9,612 | 11,019 | 1,180 | 1,294 | 10,792 | 12,313 | |||||||||||||||||||||||||||||||||||||||||||||
Latin America | 40,046 | 35,197 | 30,101 | (176 | ) | (414 | ) | 480 | 39,870 | 34,783 | 30,581 | 33,071 | 37,025 | 388 | 262 | 33,459 | 37,287 | |||||||||||||||||||||||||||||||||||||||||||
Sovereign | 2,865 | 2,850 | 2,496 | (40 | ) | (42 | ) | (19 | ) | 2,825 | 2,808 | 2,477 | ||||||||||||||||||||||||||||||||||||||||||||||||
Corporate activities | 717 | (477 | ) | 906 | (2,400 | ) | 2,980 | 5,206 | (1,683 | ) | 2,503 | 6,112 | ||||||||||||||||||||||||||||||||||||||||||||||||
United States | 2,369 | 3,066 | 119 | (62 | ) | 2,488 | 3,004 | |||||||||||||||||||||||||||||||||||||||||||||||||||||
Corporate Activities | 4,015 | 3,718 | 6,862 | 9,056 | 10,877 | 12,774 | ||||||||||||||||||||||||||||||||||||||||||||||||||||||
Inter-segment revenue adjustments and eliminations | — | — | — | 1,875 | (2,746 | ) | (8,251 | ) | 1,875 | (2,746 | ) | (8,251 | ) | — | — | (9,690 | ) | (10,798 | ) | (9,690 | ) | (10,798 | ) | |||||||||||||||||||||||||||||||||||||
|
|
|
|
|
|
|
|
|
|
|
|
|
|
| ||||||||||||||||||||||||||||||||||||||||||||||
| 84,887 | 75,309 | 76,066 | — | — | — | 84,887 | 75,309 | 76,066 | 73,436 | 81,967 | — | — | 73,436 | 81,967 | ||||||||||||||||||||||||||||||||||||||||||||||
|
|
|
|
|
|
|
|
|
|
|
|
|
|
| ||||||||||||||||||||||||||||||||||||||||||||||
| b) | Business segments |
At this secondary level of segment reporting, the Group is structured into commercial banking, asset management and insurance, and global wholesale banking;banking and the segment relating to real estate operations discontinued in Spain; the sum of these threefour segments is equal to that of the primary geographical operating geographical segments. Total figures for the Group are obtained by adding to the business segments the data for the corporate activities segment.
The commercial banking segment encompasses the entire commercial banking business (except for the corporate banking business managed globally using the global relationship model). The asset management and insurance segment includes the contribution to the Group arising from the design and management of the investment fund, pension and insurance businesses of the various units. The global wholesale banking segment reflects the returns on the global corporate banking business, those on investment banking and markets worldwide, including all the globally managed treasury departments and the equities business.
The condensed income statements and other significant data are as follows:
(Condensed) income INTEREST INCOME/(CHARGES) Income from equity instruments Income from companies accounted for using the equity method Net fee and commission income (expense) Gains/losses on financial assets and liabilities (net) and exchange differences (net) Other operating income (expenses) TOTAL INCOME General administrative expenses Personnel expenses Other general administrative expenses Depreciation and amortization Provisions (net) Impairment losses Net impairment losses on non-financial assets Other non-financial gains (losses) PROFIT (LOSS) BEFORE TAX Income tax PROFIT (LOSS) FROM CONTINUING OPERATIONS Profit (Loss) from discontinued operations CONSOLIDATED PROFIT (LOSS) FOR THE YEAR Attributable to non-controlling interests PROFIT (LOSS) ATTRIBUTABLE TO THE PARENTF-181 Millions of euros 2013 2012
statement Commercial
banking Global
whole-sale
banking Asset
management
and
insurance Real estate
operations
discontinued in
Spain Corporate
Activities Total Commercial
banking Global
whole-sale
banking Asset
management
and
insurance Real estate
operations
discontinued in
Spain Corporate
Activities Total 25,552 2,464 115 38 (2,234 ) 25,935 28,865 2,708 119 74 (1,843 ) 29,923 78 265 — — 35 378 86 284 — — 53 423 401 (1 ) 148 (40 ) (8 ) 500 400 — 131 (100 ) (4 ) 427 8,193 1,254 349 15 (50 ) 9,761 8,471 1,360 418 41 (29 ) 10,261 1,119 1,159 6 1 1,109 3,394 2,004 840 3 5 288 3,140 (553 ) 7 145 (8 ) 118 (291 ) (630 ) (16 ) 223 (3 ) 536 110 34,790 5,148 763 6 (1,030 ) 39,677 39,196 5,176 894 17 (999 ) 44,284 (14,890 ) (1,549 ) (285 ) (162 ) (566 ) (17,452 ) (15,343 ) (1,592 ) (272 ) (184 ) (410 ) (17,801 ) (8,669 ) (988 ) (149 ) (47 ) (216 ) (10,069 ) (8,986 ) (1,013 ) (160 ) (45 ) (102 ) (10,306 ) (6,221 ) (561 ) (136 ) (115 ) (350 ) (7,383 ) (6,357 ) (579 ) (112 ) (139 ) (308 ) (7,495 ) (2,027 ) (186 ) (33 ) (13 ) (132 ) (2,391 ) (1,848 ) (171 ) (35 ) (9 ) (120 ) (2,183 ) (1,173 ) (47 ) (3 ) — (959 ) (2,182 ) (1,815 ) (17 ) (17 ) — 371 (1,478 ) (9,506 ) (952 ) (7 ) (410 ) (352 ) (11,227 ) (12,182 ) (420 ) (2 ) (6,164 ) (112 ) (18,880 ) (73 ) (37 ) — — (393 ) (503 ) (44 ) (24 ) — — (440 ) (508 ) 249 12 2 (328 ) 1,795 1,730 219 (5 ) 8 (741 ) 668 149 7,370 2,389 437 (907 ) (1,637 ) 7,652 8,183 2,947 576 (7,081 ) (1,042 ) 3,583 (1,509 ) (661 ) (101 ) 272 (114 ) (2,113 ) (1,675 ) (827 ) (154 ) 2,185 (119 ) (590 ) 5,861 1,728 336 (635 ) (1,751 ) 5,539 6,508 2,120 422 (4,896 ) (1,161 ) 2,993 (15 ) — — — — (15 ) 70 — — — — 70 5,846 1,728 336 (635 ) (1,751 ) 5,524 6,578 2,120 422 (4,896 ) (1,161 ) 3,063 769 224 24 — 137 1,154 686 209 20 (128 ) (19 ) 768 5,077 1,504 312 (635 ) (1,888 ) 4,370 5,892 1,911 402 (4,768 ) (1,142 ) 2,295
| Millions of euros | ||||||||||||||||||||||||||||||||||||||||||||||||||||||||||||
| 2011 | 2010 | 2009 | ||||||||||||||||||||||||||||||||||||||||||||||||||||||||||
(Condensed) | Commercial banking | Global wholesale banking | Asset management and insurance | Corporate activities | Total | Commercial banking | Global wholesale banking | Asset management and insurance | Corporate activities | Total | Commercial banking | Global wholesale banking | Asset management and insurance | Corporate activities | Total | |||||||||||||||||||||||||||||||||||||||||||||
INTEREST INCOME/(CHARGES) | 30,273 | 2,457 | 263 | (2,172 | ) | 30,821 | 28,144 | 2,676 | 232 | (1,828 | ) | 29,224 | 25,674 | 2,508 | 201 | (2,084 | ) | 26,299 | ||||||||||||||||||||||||||||||||||||||||||
Income from equity instruments | 95 | 242 | 1 | 56 | 394 | 101 | 197 | — | 64 | 362 | 128 | 187 | — | 121 | 436 | |||||||||||||||||||||||||||||||||||||||||||||
Income for companies accounted for using the equity method | 22 | — | 30 | 5 | 57 | 19 | — | �� | — | (2 | ) | 17 | 14 | — | — | (15 | ) | (1 | ) | |||||||||||||||||||||||||||||||||||||||||
Net fee and commission income (expenses) | 8,933 | 1,174 | 380 | (15 | ) | 10,472 | 8,059 | 1,292 | 424 | (40 | ) | 9,735 | 7,526 | 1,128 | 431 | (5 | ) | 9,080 | ||||||||||||||||||||||||||||||||||||||||||
Gains/losses on financial assets and liabilities (net) and exchange differences (net) | 1,106 | 785 | 4 | 421 | 2,316 | 1,333 | 1,364 | 50 | (142 | ) | 2,605 | 1,452 | 1,384 | 34 | 1,376 | 4,246 | ||||||||||||||||||||||||||||||||||||||||||||
Other operating income/(expenses) | (537 | ) | 17 | 410 | 128 | 18 | (384 | ) | (22 | ) | 375 | 137 | 106 | (224 | ) | (22 | ) | 338 | 52 | 144 | ||||||||||||||||||||||||||||||||||||||||
TOTAL INCOME | 39,892 | 4,675 | 1,088 | (1,577 | ) | 44,078 | 37,272 | 5,507 | 1,081 | (1,811 | ) | 42,049 | 34,570 | 5,185 | 1,004 | (555 | ) | 40,204 | ||||||||||||||||||||||||||||||||||||||||||
Personnel expenses | (8,874 | ) | (998 | ) | (169 | ) | (285 | ) | (10,326 | ) | (8,002 | ) | (898 | ) | (161 | ) | (268 | ) | (9,329 | ) | (7,237 | ) | (758 | ) | (149 | ) | (307 | ) | (8,451 | ) | ||||||||||||||||||||||||||||||
Other administrative expenses | (6,369 | ) | (509 | ) | (129 | ) | (448 | ) | (7,455 | ) | (5,928 | ) | (445 | ) | (133 | ) | (420 | ) | (6,926 | ) | (5,445 | ) | (411 | ) | (130 | ) | (388 | ) | (6,374 | ) | ||||||||||||||||||||||||||||||
Depreciation and amortization of tangible and intangible assets | (1,832 | ) | (136 | ) | (35 | ) | (106 | ) | (2,109 | ) | (1,623 | ) | (137 | ) | (48 | ) | (132 | ) | (1,940 | ) | (1,362 | ) | (88 | ) | (32 | ) | (114 | ) | (1,596 | ) | ||||||||||||||||||||||||||||||
Net impairment losses on financial assets | (10,471 | ) | (141 | ) | (1 | ) | (1,255 | ) | (11,868 | ) | (10,168 | ) | (5 | ) | (2 | ) | (268 | ) | (10,443 | ) | (9,741 | ) | 34 | (10 | ) | (1,861 | ) | (11,578 | ) | |||||||||||||||||||||||||||||||
Provisions (net) | (2,325 | ) | (10 | ) | (46 | ) | (220 | ) | (2,601 | ) | (1,221 | ) | (11 | ) | (15 | ) | 114 | (1,133 | ) | (999 | ) | 5 | (36 | ) | (762 | ) | (1,792 | ) | ||||||||||||||||||||||||||||||||
Net impairment losses on non-financial assets | (82 | ) | (22 | ) | — | (1,413 | ) | (1,517 | ) | (69 | ) | (10 | ) | — | (207 | ) | (286 | ) | (61 | ) | (3 | ) | (1 | ) | (100 | ) | (165 | ) | ||||||||||||||||||||||||||||||||
Other non-financial gains/(losses) | (57 | ) | — | (10 | ) | (196 | ) | (263 | ) | 232 | 5 | 1 | (178 | ) | 60 | (42 | ) | — | — | 382 | 340 | |||||||||||||||||||||||||||||||||||||||
PROFIT (LOSS) BEFORE TAX | 9,882 | 2,859 | 698 | (5,500 | ) | 7,939 | 10,493 | 4,006 | 723 | (3,170 | ) | 12,052 | 9,683 | 3,964 | 646 | (3,705 | ) | 10,588 | ||||||||||||||||||||||||||||||||||||||||||
Income tax | (2,383 | ) | (766 | ) | (227 | ) | 1,600 | (1,776 | ) | (2,519 | ) | (1,071 | ) | (200 | ) | 867 | (2,923 | ) | (2,341 | ) | (1,084 | ) | (219 | ) | 2,437 | (1,207 | ) | |||||||||||||||||||||||||||||||||
PROFIT (LOSS) FROM ORDINARY ACTIVITIES | 7,499 | 2,093 | 471 | (3,900 | ) | 6,163 | 7,974 | 2,935 | 523 | (2,303 | ) | 9,129 | 7,342 | 2,880 | 427 | (1,268 | ) | 9,381 | ||||||||||||||||||||||||||||||||||||||||||
Profit (loss) from discontinued operations | (24 | ) | — | — | — | (24 | ) | (14 | ) | — | — | (13 | ) | (27 | ) | 46 | — | — | (15 | ) | 31 | |||||||||||||||||||||||||||||||||||||||
CONSOLIDATED PROFIT (LOSS) FOR THE YEAR | 7,475 | 2,093 | 471 | (3,900 | ) | 6,139 | 7,960 | 2,935 | 523 | (2,316 | ) | 9,102 | 7,388 | 2,880 | 427 | (1,283 | ) | 9,412 | ||||||||||||||||||||||||||||||||||||||||||
Attributable to non-controlling interests | 582 | 221 | 52 | (67 | ) | 788 | 648 | 238 | 60 | (25 | ) | 921 | 334 | 132 | 28 | (24 | ) | 470 | ||||||||||||||||||||||||||||||||||||||||||
PROFIT (LOSS) ATTRIBUTABLE TO THE PARENT | 6,893 | 1,872 | 419 | (3,833 | ) | 5,351 | 7,312 | 2,697 | 463 | (2,291 | ) | 8,181 | 7,054 | 2,748 | 399 | (1,259 | ) | 8,942 | ||||||||||||||||||||||||||||||||||||||||||
F-182
| 53. | Related parties |
The parties related to the Group are deemed to include, in addition to its subsidiaries, associates and jointly controlled entities, the Bank’s key management personnel (the members of its board of directors and the executive vice presidents, together with their close family members) and the entities over which the key management personnel may exercise significant influence or control.
Following is a detail of the ordinary business transactions performed by the Group with its related parties, distinguishing between associates and jointly controlled entities, members of the Bank’s board of directors, the Bank’s executive vice presidents, and other related parties. Related-party transactions were made on terms equivalent to those that prevail in arm’s-length transactions or, when this was not the case, the related compensation in kind was recognized.
Assets: Loans and advances to credit institutions Loans and advances to customers Debt instruments Liabilities: Deposits from credit institutions Customer deposits Marketable debt securities Income statement: Interest and similar income Interest expense and similar charges Gains/losses on financial assets and liabilities Fee and commission income Fee and commission expense Other: Contingent liabilities Contingent commitments Derivative financial instruments Millions of euros 2013 2012 2011 Associates
and jointly
controlled
entities Members
of the board
of directors Executive
vice
presidents Other
related
parties Associates
and jointly
controlled
entities Members
of the board
of directors Executive
vice
presidents Other
related
parties Associates
and jointly
controlled
entities Members
of the board
of directors Executive
vice
presidents Other
related
parties 9,425 6 36 1,599 6,626 7 33 1,417 6,507 19 31 1,902 7,392 — — — 5,635 — — — 5,855 — — — 1,331 6 36 424 544 7 33 1,233 146 19 31 1,508 702 — — 1,175 447 — — 184 506 — — 394 (946 ) (9 ) (10 ) (197 ) (544 ) (14 ) (15 ) (529 ) (1,250 ) (22 ) (27 ) (364 ) (440 ) — — — (422 ) — — — (1,136 ) — — — (498 ) (9 ) (10 ) (197 ) (122 ) (14 ) (15 ) (529 ) (114 ) (22 ) (27 ) (364 ) (8 ) — — — — — — — — — — — 143 — — 29 161 — (1 ) 69 177 — (1 ) 60 112 — — 8 94 — — 36 155 — — 35 (22 ) — — (7 ) (4 ) — (1 ) (5 ) (2 ) — (1 ) (4 ) 12 — — 25 59 — — 24 12 — — 20 502 — — (5 ) 43 — — 14 50 — — 9 (31 ) — — — (31 ) — — — (38 ) — — — 14,029 — 4 4,137 12,573 1 7 2,958 10,866 1 10 5,051 74 — — 145 — — — 303 222 — — 590 1,063 — 4 96 3,431 1 7 3 257 1 10 3 12,892 — — 3,897 9,142 — — 2,652 10,387 — — 4,458
F-183
| Millions of euros | ||||||||||||||||||||||||||||||||||||||||||||||||
| 2011 | 2010 | 2009 | ||||||||||||||||||||||||||||||||||||||||||||||
| Associates and jointly controlled entities | Members of the board of directors | Executive vice presidents | Other related parties | Associates and jointly controlled entities | Members of the board of directors | Executive vice presidents | Other related parties | Associates and jointly controlled entities | Members of the board of directors | Executive vice presidents | Other related parties | |||||||||||||||||||||||||||||||||||||
Assets: | ||||||||||||||||||||||||||||||||||||||||||||||||
Loans and advances to credit institutions | 5,855 | — | — | — | 3,921 | — | — | — | 3,990 | — | — | — | ||||||||||||||||||||||||||||||||||||
Loans and advances to customers | 146 | 19 | 31 | 1,508 | 144 | 15 | 30 | 1,330 | 149 | 7 | 24 | 1,664 | ||||||||||||||||||||||||||||||||||||
Debt instruments | 506 | — | — | 394 | 594 | — | — | 534 | 609 | — | — | 117 | ||||||||||||||||||||||||||||||||||||
Liabilities: | ||||||||||||||||||||||||||||||||||||||||||||||||
Deposits from credit institutions | (1,136 | ) | — | — | — | (231 | ) | — | — | — | (204 | ) | — | — | — | |||||||||||||||||||||||||||||||||
Customer deposits | (114 | ) | (22 | ) | (27 | ) | (364 | ) | (183 | ) | (16 | ) | (59 | ) | (498 | ) | (217 | ) | (8 | ) | (41 | ) | (551 | ) | ||||||||||||||||||||||||
Marketable debt securities | — | — | — | — | — | — | — | (2,828 | ) | — | — | — | (1,007 | ) | ||||||||||||||||||||||||||||||||||
Income statement: | ||||||||||||||||||||||||||||||||||||||||||||||||
Interest and similar income | 155 | — | — | 35 | 78 | — | — | 173 | 96 | — | 1 | 111 | ||||||||||||||||||||||||||||||||||||
Interest expense and similar charges | (2 | ) | — | (1 | ) | (4 | ) | (3 | ) | — | (1 | ) | (19 | ) | (9 | ) | — | (1 | ) | (31 | ) | |||||||||||||||||||||||||||
Gains/losses on financial assets and liabilities | 12 | — | — | 20 | 37 | — | — | 9 | 57 | — | — | 8 | ||||||||||||||||||||||||||||||||||||
Fee and commission income | 50 | — | — | 9 | 41 | — | — | 19 | 22 | — | — | 10 | ||||||||||||||||||||||||||||||||||||
Fee and commission expense | (38 | ) | — | — | — | (13 | ) | — | — | — | (11 | ) | — | — | — | |||||||||||||||||||||||||||||||||
Other: | ||||||||||||||||||||||||||||||||||||||||||||||||
Contingent liabilities | 222 | — | — | 590 | 2 | — | — | 442 | — | — | — | 491 | ||||||||||||||||||||||||||||||||||||
Contingent commitments | 257 | 1 | 10 | 3 | 90 | 1 | 5 | 3 | 137 | 1 | 3 | 3 | ||||||||||||||||||||||||||||||||||||
Derivative financial instruments | 10,387 | — | — | 4,458 | 6,878 | — | — | 1,378 | 6,868 | — | — | 3,153 | ||||||||||||||||||||||||||||||||||||
In addition to the detail provided above, there were insurance contracts linked to pensions amounting to EUR 2,146342 million at December 31, 20112013 (December 31, 2010:2012: EUR 2,220405 million; December 31, 2009:2011: EUR 2,3562,146 million).
| 54. | Risk management |
F-1841. CORPORATE RISK MANAGEMENT, CONTROL AND APPETITE PRINCIPLES
54. Risk management
1.1 Corporate risk management, control and appetite principles
The Group’s risk management model underlying the business model is based on the following principles:
At Santanderthe Group, the risk management and control process is conducted as follows:
Santander’s
1.2 Risk culture
The risk culture is based on the principles of the Group’s risk management fully identifiesmodel detailed above and is transmitted to all of the organization’s business and management units, supported, inter alia, by the following levers:
F-185
Santander Group calculates the minimum regulatory capital in conformity with Bank of Spain Circular 3/2008 and subsequent amendments thereto on the calculation and control of minimum capital requirements for credit institutions. This Circular completed the transposition into Spanish banking legislation of the various European Union directives.
As a result of the new developments in the framework of BIS III, Santander Group has taken measures to apply the future requirements -increased levels of high-quality capital and two additional buffers: the capital conservation and countercyclical buffers- sufficiently in advance.
1.3 Risk appetite at Santanderthe Group
At Santander, riskRisk appetite is defined at the Group as the amount and type of risk that it considers reasonable to assume in implementing its business strategy, soin order to ensure that the Groupit can maintain its ordinary activitycontinue to operate normally if unexpected events occur thatoccur. To this end, severe scenarios are taken into account, which might have an adverse impact on its levels of capital level,or liquidity, its profits and/or its share price.
The board of directors is the body responsible for establishing and annually updating the Group’s risk appetite, for monitoring theits actual risk profile and for ensuring consistency between the two. Senior management is responsible for achieving the desired risk profile and for managing risk in the Group’s day-to-day operations. The establishment of the risk appetite encompasses both the risks which Santander assumes as part of its strategic objective, for which target and maximum exposure criteria -and minimum risk/return targets- are set, and the risks which the Group does not wish to assume but which cannot be wholly avoided. The board ensures that regard is had to both the amount and type of the significant risks for the Group deriving from the approved annual budget and from the medium-term strategic plan, and that sufficient resources to manage and control these risks are set aside at global and local level.
The board of directors regularly, at least once a year, reviews the Group’s risk appetite and the framework for the management thereof, analyses the effects of improbable but plausible stress scenarios and takes the appropriate action to ensure that the policies laid down in this respect are complied with.
The risk appetite is determined both for the Group as a whole and for each of the main business units. Theunits using a corporate methodology adapted to the circumstances of each unit/market. At local level, the boards of directors of the related subsidiaries must approveare responsible for approving the respective risk appetite proposals adaptedonce they have been validated by the Group’s executive committee.
Senior management is responsible for achieving the desired risk profile -which is reflected in the approved annual budget and in the medium-term strategic plan-, and for the day-to-day management of risk. Thus, it ensures that the habitual limit structures formalized for each risk are properly connected to the corporate framework.established risk appetite metrics.
These limit structures for each risk are complementary to the risk appetite and fundamental to the articulation of an effective management thereof on a day-to-day basis. If the established risk appetite levels are reached, the required management measures must be adopted so that the desired risk profile can be restored.
Every quarter, the risk committee and the executive committee of the Group check compliance with the risk appetite at both Group and business unit level.
In 2013 further progress was made in the effective application of the risk appetite framework at the Group through both the related quarterly reviews referred to above and its implementation in certain of the Group’s main units.
Risk appetite framework
The SantanderGroup’s risk appetite framework contains both quantitative and qualitative elements and elements making up a group of primary metrics and a separate series of supplementary indicators.
Quantitative elements of the risk appetite
The primary quantitative metrics of the risk appetite are as follows:
These metrics are calculated for severe stress scenarios that are plausible but unlikely to occur.
Also, the Group has a series of transversal metrics aimed at limiting excessive concentration of the risk profile, both in terms of risk factors and from the perspective of customers, businesses, geographical areas and products.
Losses
One of the three primary metrics used to formulate the Group’s risk appetite is expressed in terms of the maximum unexpected effect on results that the Group is willing to accept in the event of adverse scenarios that are plausible but unlikely to occur.
These scenarios affect mainly both the losses arising from credit risk exposure of retail and wholesale portfolios (considering both the direct credit loss and the reduction in margin) and the potential adverse effect of the exposure to market risk. After applying these credit and market impacts to the budgeted results, in the context of the monitoring of the risk appetite, senior management assesses whether the resulting margin is sufficient to absorb any unexpected effects arising from technology and operational risk and compliance and reputational risk.
The time horizon for the materialization of the adverse effects for all the risks considered is generally three years, or one year for market risk. Accordingly, the risk appetite framework should be complied with for each of the following three years.
With regard to this loss metric, the Group’s risk appetite establishes that the combined effect on all risks arising from these scenarios must be lower than the net margin after ordinary provisions, i.e. ordinary operating profit/(loss) before tax.
Capital position
The Group has decided to operate with an ample capital base that enables it not only to meet regulatory requirements but also to have a reasonable capital buffer.
Also, in view of the related stress scenarios referred to in the preceding section, the Group’s risk appetite establishes that its risk profile must be such that the unexpected effect of these stress scenarios does not impair the core capital ratio by more than 100 basis points.
This capital approach included in the risk appetite framework is complementary to and consistent with the capital target for the Group that was approved as part of the capital planning process (Pillar II) implemented at the Group for a period of three years.
Liquidity position
The Group has implemented a funding model based on autonomous subsidiaries that are responsible for covering its liquidity requirements. Based on this premise, liquidity management is performed at the level of each of the subsidiaries within the corporate management framework which implements its basic principles (decentralization, medium- and long-term balance between the source and the use of funds, high weighting of customer deposits, diversification of wholesale sources, low recourse to short-term funding, sufficient liquidity reserve) and it is based on three fundamental pillars (governance model, balance sheet analysis and liquidity risk measurement, and management adapted to the needs of the business).
The Group’s liquidity risk appetite establishes a structural funding ratio of over 100%, i.e. the medium- and long-term customer deposits, capital and issues must exceed the structural funding needs defined basically as loans and credits and investments in Group companies. In addition, liquidity position and horizon targets are set for local and global systemic stress scenarios and idiosyncratic stress scenarios.
Supplementary quantitative metrics (applicableof concentration risk appetite
The Group wishes to maintain a widely diversified risk portfolio from the perspective of its exposure to large risks, to certain markets and to specific products. This is obtained firstly by virtue of the Group’s focus on the retail banking business with a high level of international diversification.
Concentration risk is measured using the following metrics for which risk appetite thresholds are established as a proportion of capital or loans and credits (generally):
Non-financial risks
Qualitative elements of the risk appetite
The qualitative elements of the risk appetite framework define, both generally and for the main risk factors, the position that Santander’s senior management wishes to adopt or maintain in the development of its business model. In general, the Santander GroupGroup’s risk appetite framework is based on maintaining the following qualitative objectives:
F-186
Quantitative elements of the risk appetite
The quantitative elements of the risk appetite framework consist of the following basic metrics:
The maximum losses the entity may have to assume,
The minimum capital position the entity wishes to maintain, and
The minimum liquidity position the entity wishes to have in case of stress scenarios that are plausible but unlikely to occur.
Also, the Group has available a series of transversal metrics aimed at limiting excessive concentration of the risk profile in terms of risk factors and from the perspective of customers, businesses, geographical areas and products.
In the risk appetite framework, a distinction is drawn between:
F-187
Risk tolerance is the difference between the risk appetite and the target risk. The risk appetite framework includes the setting of a series of triggers that are set off as the risk tolerance is used up. Once these levels have been reached and the board has been informed, the framework provides for the required management measures to be taken to effectively restore the risk profile.
Losses
One of the three basic metrics used to formulate Santander’s risk appetite is expressed in terms of the maximum losses that Santander is willing to accept in the event of adverse -internal and external- scenarios that are plausible but unlikely to occur.
To this end, the Bank periodically analyses the impact, in terms of losses, of subjecting the portfolios and the other elements composing its risk profile to stress scenarios that take into account different probabilities of occurrence.
The time horizon for the realisation of the adverse effects for all the risks considered is usually twelve months, except in the case of credit risk, for which a supplementary impact analysis is performed with a three-year time horizon.
Capital position
Santander wishes to operate with an ample capital base that enables it not only to fulfil regulatory requirements but also to have a reasonable capital buffer. The Bank has set a core capital target of 10%, i.e. one percentage point above the 9% required by the European Banking Authority (EBA).
The capital target spans a period of three years, as part of the capital planning process implemented at the Group.
Liquidity position
The liquidity management model at the Group is based on the following principles:
Decentralised liquidity model: the subsidiaries have autonomy as part of the coordinated management at Group level.
Ample structural liquidity position underpinned by stable funding: mainly customer deposits (based mainly on the retail segment) and medium- and long-term wholesale financing (with a target average maturity of more than three years).
Extensive access to wholesale markets and diversification in terms of the maturity periods, instruments and markets.
High capacity for discounting at central banks.
In view of the Group’s desire to have a structure based on autonomous subsidiaries, liquidity management is performed at each subsidiary. Accordingly, all of them must be self-sufficient as regards the availability of liquidity.
Transversal risk appetite metrics: concentration
Santander wishes to maintain a widely diversified risk portfolio from the perspective of its exposure to large risks, to certain markets and to specific products. This is obtained firstly by virtue of Santander’s focus on the retail banking business with a high level of international diversification.
F-188
Concentration risk: this is measured using three approaches that include limits which are set as warning or control signals:
|
|
|
Specific objectives by type of risk
Also, Santander Group’s risk appetite framework also contains specific qualitative objectives for the followingvarious types of risk:risk considered:
Credit riskLiving wills (recovery and resolution plans)
Complete management of the credit risk cycle usingThe Group has a corporate management model based on the establishment of budgets, a structure of limits and plans to manage them, and on the integrated follow-up and control thereof at global level.
A global interrelated view of credit risk exposure, by portfolio, including, by way of example, lines committed, guarantees, off-balance-sheet risk, etc.
Involvement of the risk function in all credit risk acceptance in conjunction with a strict structure regarding the delegation of powers, thus avoiding decisions being made by individuals.
Systematic use of scoring and rating models.
Centralised control of counterparty risk in real time.
Market risk
Moderate market risk appetite.
Customer-centric business model with scant exposure to own-account business activities.
Independent calculation of the results of market activities by the risk function.
Daily centralised control of the market risk of trading activities (daily VaR).
Strict ex-ante control of the products, underlyings, currencies, etc. for which transactions are authorized and of the related valuation models.
Structural risks
Conservative management of on-balance-sheet interest rate risk and liquidity based on policies referred to in previous sections.
Active management of exchange rates in relation to the hedging of the capital and earnings of the subsidiaries.
Lower sensitivity of margins and capital to changes in interest rates in stress scenarios.
Limited assumption of credit risk in the management of the Group’s balance sheet.
Limited assumption of cross-border risk.
Technological and operational risk
Supervision of the management of technological and operational risk by the risk function through the approval of the related management framework and limit structure.
Management approach focusing on the mitigation of risk based on the monitoring and control of gross losses/gross income, self-assessment questionnaires/risk maps, and management indicators.
Operational and technological integration model implemented through a series of corporate platforms and tools.
F-189
Systems architecture with the appropriate repetitions and controls to minimise the probability of high impact events occurring and to limit the severity if they do occur.
Master business continuity plan rolled out at local level; local contingency plans coordinated with the corporate technological and operational risk area.
Compliance and reputational risk
Compliance with all regulatory requirements, thus ensuring that qualifications in audits and substantial recommendations in supervisors’ reviews are avoided.
Maintenance of the confidence of customers, shareholders, employees and society in general in the Group’s solvency and reputation.
Maintenance of a zero appetite for compliance and reputational risk through corporate policies, implemented locally, supported by risk indicators and by the functioning of corporate and local committees facilitating the identification, monitoring and mitigation of the following types of risk:
Anti-money laundering (analysis and resolution committee);
Compliance (regulatory compliance committee): codes of conduct in securities markets; transactions giving rise to suspicion of market abuse; institutional relations; MiFID regulations; customer claims submitted to supervisors; data protection legislation; the code of conduct for employees;
Product selling: reputational risk management office and committees for the approval, sale and monitoring of products observing operational risk, behavioural risk and reputational risk criteria.
Registration and monitoring of disciplinary proceedings, total cost of losses, including fines and penalties.
Continuous monitoring of compliance and reputational risk-related audits, supervisors’ reviews and the corresponding recommendations.
Risk appetite and living will
The Group’s corporate structure is based on autonomous subsidiaries that are self-sufficient in capital and liquidity terms thus minimising the useand it ensures that none of non-operating or purely instrumental companies, and ensuring that no subsidiarythese subsidiaries has a risk profile that might jeopardisejeopardize the Group’s solvency.
In 2010 Santanderthe Group filed its corporate living will with the supervisor of the consolidated Group, the Bank of Spain. As required, the living will includes a recovery plan and all the information required to plan a possible liquidation (resolution plan). Also, although it was not required, in 2010 more summarisedsummarized individual plansliving wills were prepared for the important geographical units, including Brazil, Mexico, Chile, Portugal and the UK.
In 20112013 the secondfourth version of the corporate living will was filed, secondprepared. As with the first three versions were also preparedin 2010, 2011 and 2012, the Group submitted the fourth version of the living will to its CMG (Crisis Management Group) in September 2013. The 2013 living will comprises the corporate plan (corresponding to Banco Santander, S.A.) and the individual plans for most of its most important summarised voluntary local plansunits (the UK, Brazil, Mexico, the US – Santander USA, Germany and progress was made onPortugal). Particularly noteworthy are the preparationcases of the mandatory local plansUK, Germany and Portugal, where, irrespective of the Group companies that willobligation to be obliged to file them.
Mention must be made of the important contribution that the preparationpart of the corporate living will, makes to the conceptual delimitation of the Group’s risk appetite and risk profile.a complete version was prepared in compliance with local regulatory initiatives.
1. CORPORATE GOVERNANCE OF THE RISK FUNCTION.
| 2. | CORPORATE GOVERNANCE OF THE RISK FUNCTION |
The risk committee is responsible for proposing the Group’s risk policy for approval by the board within its governing and supervisory powers. Furthermore, the committee ensures that the Group’s activities are consistent with its risk appetite level and, in this regard, it sets global limits for the main risk exposures, which it reviews systematically, and decides upon any transactions that exceed the powers delegated to lower-ranking bodies.
The risk committee, an executive body that adopts decisions within the scope of the powers delegated by the board, is presided over by the thirdsecond deputy chairman of Santanderthe Group and also comprises a further four membersdirectors of the Bank’s board of directors.Bank.
The responsibilities assigned to the risk committee are essentially as follows:
F-190
The various types of risk (financial, operational, technological, legal and reputational, inter alia) facing the Group;
The information and internal control systems to be used to control and manage these risks;
The level of risk deemed acceptable by the Group;
The measures envisaged to mitigate the impact of the identified risks in the event that they materialise.
To conduct systematic reviews of the Group’s exposure to its main customers, economic activity sectors, geographical areas and types of risk.
To authoriseauthorize the management tools and risk models and ascertain the result of their internal validation.
To ensure that the Group’s actions are consistent with the previously defined risk appetite.
To be informed of, assess and follow anysuch remarks and recommendations thatas may periodically be periodically made by the supervisory authorities in discharging their function.
To resolve transactions outside the powers delegated to lower-ranking bodies and the overall limits for pre-classified risk categories for economic groups or in relation to exposure by type of risk.
The risk committee has delegated certain of its powers to risk subcommittees which are structured by geographical area, business line and type of risk, all of which are defined in the corporate risk governance model.
In addition, both the executive committee and the board of directors of the Bank pay particular attention to the management of the Group’s risks.
The thirdboard of directors will propose to the shareholders at the 2014 annual general meeting that the Bylaws be amended to provide, in compliance with the recent CRD IV Directive, for the creation of a new committee responsible for assisting the board on matters relating to risk oversight. When this committee has been created, the risk committee will retain its competencies regarding risk management.
The second deputy chairman of the Group is the person ultimately responsible for risk management. He is also a member of the board of directors and chairman of the risk committee. Twocommittee, and two general risk units whichreport to him. These units are independent of the business areas from both a hierarchical and functional standpoint, report to the third deputy chairman. The organisationaland their organizational and functional structure of these units is as follows:
The areas of the risk unit are divided into twothree blocks:
|
|
The three corporate structure areasfor the management and control of financial risks (credit, market and structural risk) and the sixcontrol of other risks. This block includes the following areas: loans to individuals, loans to companies, loan approval and monitoring, market and structural risks and non-financial risk control.
In compliance with the aforementioned structure, the Group has defined a planning and governance area which supports and advises the risk unit and is responsible for implementing the organisational model and ensuring the effective executioncoordination of internal controlnew projects and the systems model.internal management of all the units, and a risk monitoring and consolidation area responsible for overseeing all risks on an overall basis.
The scope of action of these functions is global, i.e. they feature in all the units in which the risk division acts and this structure is mirrored in the local units. The fundamental elements through which the global functions are replicated in each unit are the corporate frameworks. These are the central elements for disseminating and transferring global practices, reflecting the action policies and criteria for each area and establishing the Group’s compliance standards to be applied at all local units.
F-191
In general, it is possible to distinguish the main functions performed by the global areas of the GDRDGR and by the units:
The risk unit establishes risk policies and criteria, global limits and decision-making and control processes; it generates management schemes, systems and tools; and it adapts the best practices of both the banking industry and the various local units for their application in the Group.
The local units apply the policies and systems to the local market; they adapt the management schemes and organisationorganization to the corporate frameworks; they contribute criticism and best practices; and they lead local projects.
The integrated risk control and internal risk validation unit, with global-reaching corporate responsibilities, which provide support to the Group’s governing bodies, namely:
Internal validation of the credit and market risk and economic capital models in order to measure their suitability for management and regulatory purposes. The validation exercise envisages the review of the theoretical fundamentals of the model, the quality of the data used to build and calibrate the model, and its use and the associated corporate governance process.
Integrated risk control, the purpose of which is to supervise the quality of the Group’s risk management, in orderseeking to ensure that the systems for the management and control of the risks inherent to its activity comply with the strictest criteria and the best practices observed in the industry and/or required by the regulators, and to verifyverifying that the risk profile actually assumed is within the guidelines laid down by senior management.
2.3. INTEGRATED RISK CONTROL
In 2008 Santander Group launched the integrated risk control function, which meant the early adoption of the new regulatory requirements then under discussion by the main bodies and forums (Basel Committee, CEBS, FSF, etc.) and of the recommendations on best risk management practices made by various public and private organisations.
Organisation, mission and features of the function AND INTERNAL RISK VALIDATION
The integrated risk control function isand internal risk validation functions are located, inat corporate level, within the integrated risk control and internal risk validation unit. This function providesunit, reporting directly to the second deputy chairman of the Group and chairman of the risk committee, and provide support for the Group’s governing bodies in risk control and management supportmatters.
3.1 Integrated risk control function
In 2008 the Group launched the integrated risk control function in order to ensure an integrated view of the management of all the risks affecting the performance of the Group’s governing bodies.
ordinary activities. The risks which are given particulartaken into consideration are: credit risk (including concentration and counterparty risks); market risk (including liquidity risk and structural interest rate and foreign currency risks); operational and technology risk; and compliance and reputational risk.
The integrated risk control missionfunction is articulated in three complementary activities:
1) To guarantee that the management and control systems for the various risks inherent in Santanderthe Group’s activities comply with the most stringent criteria and the best practices observed in the industry and/or required by regulators;
2) To ensure that senior management has an all-embracing view of the profiles of the various risks assumed at any time and that these profiles are consistent with the pre-determined risk appetite; and
3) To supervise adequate compliance, in due time and form, with any recommendations on risk management and control made as a result of inspections conducted by internal audit and by the competent supervisory authorities.
F-192
The integrated risk control function supportssupervisors to which the risk committee by providing it with the best risk management practices.Group is subject.
The main features of the function are as follows:
Globalis characterized by having global and corporate scope:scope and encompasses all risks, all businesses and all geographical areas;
areas. It is a third layer of control which follows the control performed in the first instance by the officer responsible for managing and controlling each risk at each business or functional unit (first layer of control) and by each officer responsible for the control of each risk at corporate level (second layer of control). This system ensures a vision and, therefore, the integrated controlmonitoring of all the risks incurred as a resultby the Group in the performance of Santander Group’sits business activities.
3.2 Independent internal validation of risk models
Special attention is paidIn addition to constituting a regulatory requirement, the internal validation of risk models function provides essential support to the development of best practicesboard’s risk committee and the local and corporate risk committees in the financial services industry, so thatperformance of their duties to authorize the use of the models (for management and regulatory purposes) and to review them regularly.
To this end, a sufficiently independent specialized unit of the Group isissues an expert opinion on the adequacy of the internal models for the intended internal management and/or regulatory purposes (calculation of regulatory capital, level of provisions, etc.), expressing a conclusion on their robustness, usefulness and effectiveness.
At the Group, internal validation covers all models used in a position to promptly incorporate any relevant advance.
the risk function, i.e. credit, market, structural and operational risk models and economic and regulatory capital models. The available informationscope of the validation includes not only the more theoretical or methodological aspects, but also the technology systems and the resources assigned by Santander Group todata quality that facilitate and underpin the controleffective operation of the various risks are optimisedmodels and, in order to avoid overlaps.
Methodology and toolsgeneral, all the relevant aspects of risk management (controls, reporting, uses, involvement of senior management, etc.).
This function is performed using anat a global and corporate level in order to ensure uniformity of application, and is implemented through five regional centers located in Madrid, London, São Paulo, New York and Wroclaw (Poland). From a functional standpoint, these centers are fully accountable to the corporate center, which makes it possible to ensure consistency in the performance of their activities. This system facilitates the application of a corporate methodology that is supported by a set of tools developed internally developedby the Group that provide a robust corporate framework to be used at all the Group’s units and which automate certain verifications to ensure efficient reviews.
It should be noted that the Group’s corporate internal validation framework is fully consistent with the internal validation standards for advanced approaches issued by the Bank of Spain and by the other supervisors to which the Group is subject. Accordingly, the Group maintains the segregation of functions between internal validation and internal audit, which, in its role as the last layer of control at the Group, is responsible for reviewing the methodology, tools and work performed by internal validation and for giving its opinion on the degree of effective independence.
4. CLUSTERS OF RISK
The Group’s senior management considers that there are clusters of risk that affect its business and, therefore, the risks arising from it. These clusters and the actions adopted to mitigate them are as follows:
The constant monitoring of the implementation of this methodology, making it traceable and objectifiable. Bothchanges in the methodologyregulatory framework and the toolsanticipation of these changes to enable Banco Santander to adapt swiftly to the new requirements constitute the basic pillars of the three complementary activities referredBank’s approach to above are articulated in the following modules:
Module 1) Testing or review guidelines have been defined for each risk, divided into control areas (e.g. corporate governance, organisational structure, management systems, management integration, technology environment, contingency plans and business continuity, etc.).these matters.
The Group performs the tests and gathers the relevant evidence assessed in the process -which enables it to standardise the control parameterspublic policy department, which forms part of the various risks- on a yearly basis, withcommunication, corporate marketing and studies division, assumes the inclusiontask of new tests if required. In 2011 the tests were given a complete review taking as reference the best practices observed in the industry and/or required by regulatorsmonitoring and also considering the experience gathered in this area in previous years.
The supporting tool is the Risk Control Monitor (RCM), which serves as a repository for the findings of each test and for the related working papers. In addition, the position of each risk is reviewed every six months, monitoring the recommendations arising from the annual integrated risk control report.
Module 2) Senior management is provided with the relevant monitoring capacity in terms of an all-embracing view of the various risks assumed and their consistency with the pre-determined risk appetite.
Module 3) In order to proactively follow up the recommendations on risk management and control made by internal audit and by the supervisory authorities, the Group uses SEGRE, a tool which also enables the recommendations made by the integrated risk control function itself to be registered.
The Bank of Spain has unrestricted access these tools and, accordingly, to the working papers used to perform the integrated risk control function.
Activities in 2011
(a) The third review cycle of the various risks was completed in close cooperation with the corporate risk control areas, and the management and control systems in place for these risks were tested and assessed; Areas for improvement were identified, giving rise to recommendations, with the related implementation schedule agreed upon with the risk areas, together with the half-yearly follow-up of the progress made with respect to the 2010 recommendations;
F-193
(b) Periodic reports were submitted to the board of directors and the executive committee, giving an integrated view of all the risks; and reports on the function itself were submitted to the risk committee and the audit and compliance committee;
(c) Work continued on extending the integrated risk control model to the Group’s main units, and the initiatives arising in the various countries in this area were coordinated; and
(d) The risk area,managing regulatory alerts, in coordination with the Public Policy areageneral secretary’s division, the controller’s unit, the finance and otherrisk divisions and the support and business areas representedaffected by these alerts. The persons responsible for public policy at division level hold meetings on a monthly basis and those responsible for public policy at country level hold a teleconference every month in order to ensure coordination at Group level.
This approach is encouraged and supported from the highest echelons of the Bank’s senior management. The public policy committee, which is chaired by the CEO, is the forum where the main regulatory changes are reported, the impact thereof is analyzed and the strategy to be adopted regarding these matters is designed.
Following is an analysis of the Group’s main types of risk: credit, market, operational and reputational risks.
3.5. CREDIT RISK
3.15.1 Introduction to the treatment of credit risk
Credit risk is the possibility of loss stemming from the total or partial failure of our customers or counterparties to meet their financial obligations to the Group.
The specialisation of Santander Group’sIn credit risk functionmanagement terms, segmentation is based on the typedistinction between two types of customer and, accordingly, a distinction is made between individualised customers and standardised customers throughout the risk management process:customers:
IndividualisedIndividualized customers are defined as those to which a risk analyst has been assigned, basically because of the risk assumed.assigned. This category includes global wholesale banking customers (corporates, financial institutions and certain enterprises belonging tosovereigns) and the retail banking.banking companies whose risk level is above a set exposure threshold for each unit. Risk management is performed through expert analysis supplemented by decision-making support tools based on internal risk assessment models.
StandardisedStandardized risks: standardized customers are those which have not been expressly assigned a risk analyst. This category generallysegment includes exposures to individuals, individual entrepreneurs,independent professionals and retail banking enterprises not classified as individualisedindividualized customers. Management of these risks is based on internal risk assessment and automatic decision-making models, supplemented subsidiarily, when required by the model is not comprehensive enough or is not sufficiently accurate, byexpert judgment of teams of analysts specialising in this typeanalysts.
The Group has a mainly retail profile, with more than 80% of risk.its total risk exposure being generated by its commercial banking business.
5.2 Main aggregates and variations3.2
The profile of the credit risk assumed by the Group is characterised by a diversified geographical distribution and the prevalence of retail banking operations.
A.5.2.1 Global credit risk map—2011map - 2013
2011 was marked by a slight increase inFollowing are the main aggregates relating to credit risk exposure of 0.8% due,arising on the one hand, to a change in the method of accounting for a Group company in the US, which is reflected mainly in a decline in the credit drawn down by customers, and, on the other hand, to the combination of two factors: the reduction in balances drawable by customers (-0.2%) as a result of the lower volume of lines committed in an economic environment of weakened demand for credit at the most important units; and the growth in credit institution drawdowns (13.6%).
Disregarding the effect of changes in the exchange rates of the main currencies against the euro and the change in the method of accounting for a Group company described above, credit risk exposure grew by 2.8% in 2011.
Spain continues to be the most significant unit as regards credit risk exposure, albeit with a decline of 1.4% on December 2010. Other European countries represent more than one third of credit risk exposure. Particularly noteworthy in this respect is the presence in the United Kingdom. Taken as a whole, Europe, including Spain, represents 71% of the total exposure.
In Latin America, which accounts for 22% of the total, 97% of the credit risk exposure is rated investment-grade.
At 2011 year-end, exposure in the United States represented 6.1% of the total for the Group.
F-194
B. Variations in aggregates in 2011
The changes in non-performing loans continue to reflect the impact of the deterioration of the economic environment, while the contraction in the cost of credit in 2011 shows prudent anticipatory risk management which, in general, has enabled Santander to keep these two figures below those of its competitors. As a result, the Group has a significant NPL coverage ratio.
The non-performing loans ratio stood at 3.89% in December 2011, up 34 basis points in the year, reflecting a slowdown in the growth experienced by this ratio in recent quarters. Non-performing loans fell at Santander Consumer Finance and Sovereign, but rose in both the economies worse affected by the crisis, namely Spain and Portugal, and, to a lesser extent, in the countries better placed in the economic cycle, such as the UK. In Latin America as a whole, the changes in non-performing loans went hand in hand with lending growth, and the cost of remained stable. The NPL coverage ratio was 61.4%, as compared with a coverage ratio of 72.7% at the end of credit 2010.
| Credit risk exposure to | Credit risk exposure to customers(1) (millions of euros) | Non-performing loans ratio (%) | Coverage ratio (%) | |||||||||||||||||||||||||||||||||||||||||||||||||||||||||||||||||
customers * (millions of euros) | Non-performing loans ratio (%) | Coverage ratio (%) | Cost of credit (% of risk) (3) | 2013 | 2012 | 2011 | 2013 | 2012 | 2011 | 2013 | 2012 | 2011 | ||||||||||||||||||||||||||||||||||||||||||||||||||||||||
| 2011 | 2010 | 2011 | 2010 | 2011 | 2010 | 2011(2) | 2010 (1) | |||||||||||||||||||||||||||||||||||||||||||||||||||||||||||||
Continental Europe | 364,622 | 370,673 | 5.20 | 4.34 | 55.5 | 71.4 | 1.10 | 1.62 | 312,167 | 332,261 | 353,506 | 9.13 | 6.29 | 5.24 | 57.3 | 77.0 | 55.2 | |||||||||||||||||||||||||||||||||||||||||||||||||||
Santander Network | 118,060 | 126,705 | 8.47 | 5.52 | 39.9 | 51.8 | 1.42 | 1.89 | ||||||||||||||||||||||||||||||||||||||||||||||||||||||||||||
Banesto | 78,860 | 86,213 | 5.01 | 4.11 | 53.1 | 54.4 | 0.96 | 1.52 | ||||||||||||||||||||||||||||||||||||||||||||||||||||||||||||
Spain | 189,783 | 210,536 | 223,456 | 7.49 | 3.84 | 3.30 | 44.0 | 50.0 | 50.9 | |||||||||||||||||||||||||||||||||||||||||||||||||||||||||||
Santander Consumer Finance | 63,093 | 67,820 | 3.77 | 4.95 | 113.0 | 128.4 | 1.43 | 2.85 | 50,628 | 59,387 | 59,442 | 4.01 | 3.90 | 3.97 | 105.3 | 109.5 | 109.3 | |||||||||||||||||||||||||||||||||||||||||||||||||||
Portugal | 30,607 | 32,265 | 4.06 | 2.90 | 54.9 | 60.0 | 0.90 | 0.30 | 26,810 | 28,188 | 30,607 | 8.12 | 6.56 | 4.06 | 50.0 | 53.1 | 54.9 | |||||||||||||||||||||||||||||||||||||||||||||||||||
Poland | 18,101 | 10,601 | 9,120 | 7.84 | 4.72 | 4.89 | 61.8 | 68.3 | 65 | |||||||||||||||||||||||||||||||||||||||||||||||||||||||||||
United Kingdom | 255,735 | 244,707 | 1.86 | 1.76 | 38.1 | 45.8 | 0.32 | 0.34 | 235,627 | 254,066 | 257,698 | 1.98 | 2.05 | 1.85 | 41.6 | 44.1 | 37.5 | |||||||||||||||||||||||||||||||||||||||||||||||||||
|
|
|
|
|
|
|
| |||||||||||||||||||||||||||||||||||||||||||||||||||||||||||||
Latin America | 159,445 | 149,333 | 4.32 | 4.11 | 97.0 | 103.6 | 3.57 | 3.53 | 150,979 | 160,413 | 159,445 | 5.03 | 5.42 | 4.32 | 84.6 | 87.5 | 97.0 | |||||||||||||||||||||||||||||||||||||||||||||||||||
Brazil | 91,035 | 84,440 | 5.38 | 4.91 | 95.2 | 100.5 | 5.28 | 4.93 | 79,216 | 89,142 | 91,035 | 5.64 | 6.86 | 5.38 | 95.1 | 90.2 | 95.2 | |||||||||||||||||||||||||||||||||||||||||||||||||||
Mexico | 19,446 | 16,432 | 1.82 | 1.84 | 175.7 | 214.9 | 1.63 | 3.12 | 24,024 | 22,038 | 19,446 | 3.66 | 1.94 | 1.82 | 97.5 | 157.3 | 175.7 | |||||||||||||||||||||||||||||||||||||||||||||||||||
Chile | 28,462 | 28,858 | 3.85 | 3.74 | 73.4 | 88.7 | 1.40 | 1.57 | 31,645 | 32,697 | 28,462 | 5.91 | 5.17 | 3.85 | 51.1 | 57.7 | 73.4 | |||||||||||||||||||||||||||||||||||||||||||||||||||
Puerto Rico | 4,559 | 4,360 | 8.64 | 10.59 | 51.4 | 57.5 | 2.25 | 3.22 | 4,023 | 4,567 | 4,559 | 6.29 | 7.14 | 8.64 | 61.6 | 62.0 | 51.4 | |||||||||||||||||||||||||||||||||||||||||||||||||||
Colombia | 2,568 | 2,275 | 1.01 | 1.56 | 299.1 | 199.6 | 0.59 | 0.68 | ||||||||||||||||||||||||||||||||||||||||||||||||||||||||||||
Argentina | 4,957 | 4,097 | 1.15 | 1.69 | 206.9 | 149.1 | 0.67 | 0.72 | 5,283 | 5,378 | 4,957 | 1.42 | 1.71 | 1.15 | 140.4 | 143.3 | 206.9 | |||||||||||||||||||||||||||||||||||||||||||||||||||
Sovereign | 43,052 | 40,604 | 2.85 | 4.61 | 96.2 | 75.4 | 1.04 | 1.16 | ||||||||||||||||||||||||||||||||||||||||||||||||||||||||||||
|
|
|
|
|
|
|
| |||||||||||||||||||||||||||||||||||||||||||||||||||||||||||||
United States | 40,349 | 44,678 | 43,052 | 2.23 | 2.29 | 2.85 | 93.6 | 105.9 | 96.2 | |||||||||||||||||||||||||||||||||||||||||||||||||||||||||||
Total Group | 822,657 | 804,036 | 3.89 | 3.55 | 61.4 | 72.7 | 1.41 | 1.56 | 738,558 | 793,448 | 820,968 | 5.64 | 4.54 | 3.90 | 61.7 | 72.4 | 61.0 | |||||||||||||||||||||||||||||||||||||||||||||||||||
Memorandum item: | ||||||||||||||||||||||||||||||||||||||||||||||||||||||||||||||||||||
Spain | 271,180 | 283,424 | 5.49 | 4.24 | 45.5 | 57.9 | 1.04 | 1.53 | ||||||||||||||||||||||||||||||||||||||||||||||||||||||||||||
| Including gross loans and advances to customers, guarantees, documentary credits and |
At 2013 year-end credit risk exposure had fallen by 7%. This fall was experienced across the board, except for Brazil, Mexico, Chile and Poland, where growth was observed in 2013 in local currency terms. These lending levels, together with non-performing loans of EUR 41,652 million, placed the Group’s non-performing loans ratio at 5.64% (up 110 basis points. on 2012).
The Group’s coverage ratio stood at 62%. It is important to take into account that the ratio is reduced by the relative proportion of the mortgage portfolios (especially in the UK and Spain), which require lower on-balance-sheet provisions since they are secured by collateral.
5.3 Detail of geographical areas with the highest concentrations
Following is a description of the portfolios in the geographical areas where the Group’s risk concentration is highest:
5.3.1 UK
Credit risk exposure to UK customers amounted to EUR 235,627 million at the end of December 2013, and represented 31.9% of the Group total.
Due to its importance, not only to Santander UK, but also to Santander Group’s lending activity as a whole, the mortgage loan portfolio (which totaled EUR 177,617 million at the end of December 2013) must be highlighted.
This portfolio is composed entirely of first-mortgage home purchase or refurbishment loans to new and existing customers, since transactions involving second or successive liens on mortgaged properties are no longer originated.
The property on which the mortgage guarantee is constituted must be located in the UK, irrespective of where the funding is to be employed, except for certain one-off transactions. Loans may be granted for the purchase of residences abroad, but the mortgage guarantee must in all cases be constituted on a property located in the UK.
Geographically speaking, the credit risk exposure is concentrated mainly in the South East of England, where house price indices reflect a more stable behavior, even in times of economic slowdown.
Properties are appraised independently prior to the approval of each new transaction, in accordance with the Group’s risk management principles.
For mortgage loans that have already been granted, the appraised value of the mortgaged property is updated quarterly by an independent agency using an automatic appraisal system in accordance with standard procedure in the market and in compliance with current legislation.
The non-performing loans ratio rose from 1.74% in 2012 to 1.88% at 2013 year-end.
This rise can be explained mainly by the fall in loans and credits due to the application of the strict lending and pricing policies implemented in recent years. The effect of these measures has been to reduce exposure to certain worst performing subsegments, such as interest-only mortgages, to a greater extent than the new lending generated, with the corresponding reduction in total stock.
There was a significant improvement in the performance of non-performing loans as a result of the more favorable macroeconomic environment and the increase in re-performing loans due to the improved efficiency of the recovery teams. Thus, the amount of non-performing loans increased by 1.1% to EUR 3,453 million, including foreclosed homes, compared with the 8.5% rise in 2012.
The credit policies limit the maximum loan-to-value criteria to 90% for loans on which principal and interest are repaid and to 50% for loans on which interest is paid periodically and the principal is repaid on maturity.
Current credit risk policies expressly prohibit loans considered to be high risk (subprime mortgages), and establish demanding requirements regarding the credit quality of both loans and customers. For example, the granting of mortgage loans with LTVs exceeding 100% has been forbidden since 2009. Between 2009 and 2012 less than 0.1% of new production had an LTV higher than 90%.
5.3.2 Spain
5.3.2.1 Portfolio overview
Total credit risk in Spain (including guarantees and documentary credits but excluding the real-estate run off unit) amounted to EUR 189,783 million (26% of the Group total), with an adequate degree of diversification in terms of both products and customer segments. In 2013 lending levels continued to fall as a result of the decrease in the demand for credit and the economic situation. The non-performing loans ratio stood at 7.49%. The coverage ratio stood at 44%.
5.3.2.2 Portfolio of home purchase loans to families
Home purchase loans granted to families in Spain stood at EUR 55,158 million at 2013 year-end. Of this amount, 98% was secured by mortgages.
| 31-12-13 | ||||||||
In millions of | Gross amount | Of which: Impaired | ||||||
Home purchase loans | 55,158 | 4,041 | ||||||
Without mortgage guarantee | 863 | 461 | ||||||
With mortgage guarantee | 54,295 | 3,580 | ||||||
The risk profile of the home purchase mortgage loan portfolio in Spain remained at a medium-low level, with limited prospects of additional impairment:
| 12/31/13 | ||||||||||||||||||||||||
| Loan-to-value ratio | ||||||||||||||||||||||||
In millions of euros | Less than or equal to 40% | More than 40% and less than 60% | More than 60% and less than 80% | More than 80% and less than or equal to 100% | More than 100% | Total | ||||||||||||||||||
Initial gross amount | 12,703 | 16,642 | 18,185 | 5,683 | 1,083 | 54,295 | ||||||||||||||||||
Of which: Impaired | 277 | 641 | 1,353 | 951 | 358 | 3,580 | ||||||||||||||||||
For internal management purposes, the Group updates the LTV ratios at least once a year, taking into consideration published house price indices. Also, if a debtor becomes impaired the Group updates the appraisals undertaken by valuers, which are taken into account in the estimate of impairment losses.
5.3.2.3 Portfolio of loans to non-real estate companies
The EUR 106,042 million of loans granted directly to SMEs and companies constitute the most important lending segment in Spain, representing 56% of the total.
Most of the portfolio relates to individualized customers to which a risk analyst has been assigned because of the risk assumed. The risk analyst monitors the customer on an ongoing basis in all the phases of the risk cycle.
The non-performing loans ratio of this portfolio was 8.72% in 2013, impacted by the continuity of the complicated economic environment and by the drop in lending.
5.3.2.4 Real estate loan portfolio
Gross real estate exposure in Spain amounted to EUR 20,936 million at 2013 year-end, of which EUR 12,105 million relate to loans and EUR 8,831 million to foreclosed properties. Of these amounts, EUR 11,355 million of loans and EUR 7,990 million of foreclosed properties are managed using a specialized management model in a separate unit called “Real estate operations discontinued in Spain”, which also manages investments in the real estate industry (Metrovacesa, S.A. and the Spanish Bank Restructuring Asset Management Company).
The policy of severely reducing the balances in this segment continued in 2013.
| Millions of euros | ||||||||||||
| 31-12-13 | 31-12-12 | 31-12-11 | ||||||||||
Balance at beginning of year | 15,867 | 23,442 | 27,334 | |||||||||
Foreclosed assets | (848 | ) | (930 | ) | (914 | ) | ||||||
Reductions(1) | (2,114 | ) | (5,670 | ) | (2,742 | ) | ||||||
Written-off assets | (800 | ) | (975 | ) | (236 | ) | ||||||
|
|
|
|
|
| |||||||
Balance at end of year (net) | 12,105 | 15,867 | 23,442 | |||||||||
|
|
|
|
|
| |||||||
The NPL ratio of this portfolio ended the year at 61.7% (compared with 47.7% at December 2012) due to the increase in the proportion of impaired assets in the problem loan portfolio and, in particular, to the sharp reduction in lending in this segment. The table below shows the distribution of the portfolio. The coverage ratio of the real estate exposure in Spain stands at 41.1%.
| 12/31/13 | ||||||||||||
Millions of euros | Gross amount | Excess over collateral value | Specific allowance | |||||||||
Financing for construction and property development recorded by the Group’s credit institutions (business in Spain) | 12,105 | 5,173 | 4,981 | |||||||||
Of which: Impaired | 7,473 | 3,869 | 3,960 | |||||||||
Of which: Substandard | 2,972 | 1,011 | 1,021 | |||||||||
Memorandum item: Written-off assets | 1,642 | |||||||||||
Memorandum item: Data from the public consolidated balance sheet | 12/31/13 | |||
Millions of | Carrying amount | |||
Total | 160,478 | |||
Total consolidated assets | 1,115,638 | |||
Impairment losses and credit risk allowances. Collective coverage (business in Spain) | 213 | |||
The Group calculates the loan loss allowance individually as the difference between the carrying amount of the debt and the present value of its estimated cash flows over the life of the agreement, including those from the guarantees, less costs to sell.
F-195At year-end, this portfolio had low concentration and an adequate level of collateral and allowances.
| Loans: Gross amount | Loans: Gross amount | |||||||
| 12/31/13 | 12/31/12 | |||||||
1. Without mortgage guarantee | 1,562 | 2,225 | ||||||
2. With mortgage guarantee | 10,543 | 13,642 | ||||||
2.1 Completed buildings | 5,600 | 7,025 | ||||||
2.1.1 Residential | 3,192 | 3,491 | ||||||
2.1.2 Other | 2,408 | 3,534 | ||||||
2.2 Buildings under construction | 685 | 1,493 | ||||||
2.2.1 Residential | 573 | 1,080 | ||||||
2.2.2 Other | 112 | 413 | ||||||
2.3 Land | 4,258 | 5,124 | ||||||
2.3.1 Developed land | 3,751 | 4,705 | ||||||
2.3.2 Other land | 507 | 419 | ||||||
|
|
|
| |||||
Total | 12,105 | 15,867 | ||||||
|
|
|
| |||||
C. DistributionPolicies and strategies in place for the management of these risks
The policies in force for the management of this portfolio, which are reviewed and approved on a regular basis by the Group’s senior management, are currently geared towards reducing and securing the outstanding exposure, albeit without neglecting any viable new business that may be identified.
In order to manage this credit exposure, the Group has specialized teams that not only form part of the risk areas but also supplement the management of this exposure and cover the entire life cycle of these transactions: commercial management, legal processes, court procedures and potential recovery management.
As has already been discussed in this section, the Group’s anticipatory management of these risks enabled it to significantly reduce its exposure, and it has a granular, geographically diversified portfolio in which the financing of second residences accounts for a very small proportion of the total.
Mortgage lending on non-urban land represents a low percentage of mortgage exposure to land, while the remainder relates to land already classified as urban or developable, which can therefore be developed.
In the case of home financing projects in which the construction work has already been completed, the significant reduction in the exposure is supported by various actions. As well as the specialized marketing channels already in existence, campaigns were carried out with the support of specific teams of managers for this function who, in the case of the Santander Network, were directly supervised by the recoveries business area. These campaigns, which involved the direct management of the projects with property developers and purchasers, reducing sale prices and adapting the lending conditions to the buyers’ needs, enabled loans already in force to be subrogated. These subrogations enable the Group to diversify its risk in a business segment that displays a clearly lower non-performing loans ratio.
The loan approval processes are managed by specialist teams which, working in direct coordination with the sales teams, have a set of clearly defined policies and criteria:
In addition to the permanent control performed by its risk monitoring teams, the Group has a specialist technical unit that monitors and controls this portfolio with regard to the stage of completion of construction work, planning compliance and sales control, and validates and controls progress billing payments. The Group has created a set of specific tools for this function. All mortgage distributions, amounts drawn down of any kind, changes made to the grace periods, etc. are authorized on a centralized basis.
In the case of construction-phase projects that are experiencing difficulties of any kind, the policy adopted is to ensure completion of the construction work so as to obtain completed buildings that can be sold in the market. To achieve this aim, the projects are analyzed on a case-by-case basis in order to adopt the most effective series of measures for each case (structured payments to suppliers to ensure completion of the work, specific schedules for drawing down amounts, etc.).
The management of on-balance-sheet property assets is performed by companies that specialize in the sale of property (Altamira Santander Real Estate, S.A.) and is supplemented by the commercial network structure. The sale prices are reduced in line with market conditions.
Foreclosed properties
As a last resort, the acquisition and foreclosure of property assets is one of the mechanisms adopted in Spain in order to manage the portfolio efficiently. At December 31, 2013, the net balance of these assets amounted to EUR 4,146 million (gross amount: EUR 8,831 million; recognized allowance: EUR 4,685 million).
The following table shows the detail of the foreclosure of property assets by the businesses in Spain at 2013 and 2012 year-end:
| 12/31/13 | 12/31/12 | |||||||||||||||
Millions of euros | Carrying amount | Of which: Allowance | Carrying amount | Of which: Allowance | ||||||||||||
Property assets arising from financing provided to construction and property development companies | 3,397 | 4,151 | 2,906 | 3,650 | ||||||||||||
Of which: | ||||||||||||||||
Completed buildings | 1,059 | 727 | 793 | 498 | ||||||||||||
Residential | 492 | 338 | 393 | 236 | ||||||||||||
Other | 567 | 389 | 400 | 262 | ||||||||||||
Buildings under construction | 366 | 369 | 283 | 281 | ||||||||||||
Residential | 366 | 368 | 274 | 273 | ||||||||||||
Other | — | 1 | 9 | 8 | ||||||||||||
Land | 1,972 | 3,055 | 1,830 | 2,871 | ||||||||||||
Developed land | 926 | 1,390 | 1,302 | 2,024 | ||||||||||||
Other land | 1,046 | 1,665 | 528 | 847 | ||||||||||||
Property assets from home purchase mortgage loans to households | 747 | 530 | 707 | 454 | ||||||||||||
Other foreclosed property assets | 2 | 4 | 61 | 60 | ||||||||||||
|
|
|
|
|
|
|
| |||||||||
Total property assets | 4,146 | 4,685 | 3,674 | 4,164 | ||||||||||||
|
|
|
|
|
|
|
| |||||||||
Equity instruments, ownership interests and financing provided to non-consolidated companies holding these assets | 647 | 751 | 649 | 749 | ||||||||||||
|
|
|
|
|
|
|
| |||||||||
Total | 4,793 | 5,436 | 4,323 | 4,913 | ||||||||||||
|
|
|
|
|
|
|
| |||||||||
In recent years, the Group has considered asset acquisition/foreclosure to be a more efficient method for resolving cases of default than legal proceedings. The Group initially recognizes foreclosed assets at the lower of the carrying amount of the debt (net of provisions) and the fair value of the acquired/foreclosed asset (less estimated costs to sell). If fair value (less costs to sell) is lower than the net value of the debt, the difference is recognized under Impairment losses on financial assets (net) - Loans and receivables in the consolidated income statement for the year. Subsequent to initial recognition, the assets are measured at the lower of fair value (less costs to sell) and the amount initially recognized. The fair value of this type of assets is determined by the Group’s directors based on evidence obtained from qualified valuers or evidence of recent transactions.
The changes in foreclosed assets were as follows:
| Thousands of millions of euros | ||||||||
| 2013 | 2012 | |||||||
Gross additions | 1.9 | 2.1 | ||||||
Disposals | 0.9 | 2.8 | ||||||
Difference | 1 | (0.7 | ) | |||||
5.3.3 Brazil
The loan portfolio in Brazil amounted to EUR 79,216 million (11% of the Group total), and had an adequate degree of diversification and a predominantly retail profile. 55% of loans are loans to individuals, consumer loans and loans to SMEs.
In 2013 the portfolio grew by 7.1% (excluding changes in exchange rates) as compared with 11% in 2012. This growth is in line with the nominal growth of the Brazilian economy and the average performance of private banks in Brazil.
The NPL ratio was 5.64% at 2013 year-end, compared with 6.86% in 2012, reflecting the improvement in the credit quality of the portfolio, especially loans to individuals.
The non-performing loans coverage ratio stands at 95% (2012 year-end: 90%).
5.4. Credit risk from other standpoints
5.4.1 Credit risk from financial market operations
This concept includes the credit risk arising in treasury operations with customers, mainly retail profile (commercial banking represents 85.6%credit institutions. These operations are performed using both money market financing products arranged with various financial institutions and derivative products intended to provide service to the Group’s customers.
The exposure is measured using an MtM methodology (replacement value of derivatives or amount drawn down of committed facilities) plus potential future exposure (add-on). Calculations are also performed of capital at risk or unexpected loss (i.e. the loss which, once the expected loss is subtracted, constitutes the economic capital, net of guarantees and recoveries).
When the markets close, the exposures are recalculated by adjusting all the transactions to their new time horizon, the potential future exposure is adjusted and mitigation measures are applied (netting arrangements, collateral arrangements, etc.) so that the exposures can be controlled daily against the limits approved by senior management. Risk control is performed using an integrated, real-time system that enables the Group to know at any time the unused exposure limit with respect to any counterparty, any product and maturity and at any Group unit.
5.4.2 Concentration risk
Concentration risk control is key to the risk management process. The Group continuously monitors the degree of credit risk concentration, by country, sector and customer group.
The risk committee establishes the risk policies and reviews the exposure limits required to ensure adequate management of credit risk concentration.
The Group is subject to Bank of Spain regulations on large exposures. Pursuant to the rules contained in Bank of Spain Circular 3/2008 (on the calculation and control of minimum capital requirements) and subsequent amendments thereto, the value of a credit institution’s total exposure to a single individual, entity or economic group, including the non-consolidated portion of its business)own economic group, may not exceed 25% of its capital. Exposures to a single individual, legal entity or economic group are deemed to be large exposures when their value exceeds 10% of the credit institution’s capital. Exposures to governments and central banks belonging to the OECD are excluded from this treatment.
At December 31, 2013, there were certain economic groups with respect to which the Group’s exposure initially exceeded 10% of capital: seven financial institutions, one central government and one central counterparty in the EU. After applying risk mitigation techniques and the regulations applicable to large exposures, all of these exposures fell below 4% of eligible capital.
At December 31, 2013, the Group’s credit exposure to the top 20 borrower economic and financial groups, excluding AAA-rated governments and sovereign bonds denominated in local currency, accounted for 4.7% of the credit risk exposure to customers (lending plus off-balance-sheet exposures), slightly less than in 2012.
The Group does not have any exposures to central counterparties that exceed 5% of capital. The top 10 IFIs account for EUR 14,769 million.
Santander Group’s risk division works closely with the finance division in the active management of credit portfolios, which includes reducing the concentration of exposures through several techniques, such as the arrangement of credit derivatives for hedging purposes or the performance of securitization transactions, in order to optimize the risk/return ratio of the total portfolio.
The detail, by activity and geographical area of the counterparty, of the concentration of the Group’s risk at December 31, 2013 is as follows:
| 12/31/13 | ||||||||||||||||||||
Millions of euros | Total | Spain | Other EU countries | Americas | Rest of the world | |||||||||||||||
Credit institutions | 147,993 | 26,142 | 69,665 | 48,481 | 3,705 | |||||||||||||||
Public sector | 113,441 | 46,880 | 22,358 | 38,931 | 5,272 | |||||||||||||||
Of which: | ||||||||||||||||||||
Central government | 92,780 | 32,216 | 21,646 | 33,649 | 5,269 | |||||||||||||||
Other | 20,661 | 14,664 | 712 | 5,282 | 3 | |||||||||||||||
Other financial institutions | 52,393 | 11,833 | 24,031 | 14,036 | 2,493 | |||||||||||||||
Non-financial companies and individual entrepreneurs | 293,297 | 98,642 | 65,783 | 115,972 | 12,900 | |||||||||||||||
Of which: | ||||||||||||||||||||
Property construction and development | 21,477 | 7,159 | 4,542 | 9,623 | 153 | |||||||||||||||
Civil engineering construction | 6,849 | 4,611 | 2,030 | 139 | 69 | |||||||||||||||
Large companies | 170,377 | 51,036 | 37,535 | 74,777 | 7,029 | |||||||||||||||
SMEs and individual entrepreneurs | 94,594 | 35,836 | 21,676 | 31,433 | 5,649 | |||||||||||||||
Other households and non-profit institutions serving households | 396,157 | 66,876 | 254,679 | 73,068 | 1,534 | |||||||||||||||
Of which: | ||||||||||||||||||||
Residential | 291,267 | 54,441 | 205,536 | 30,349 | 941 | |||||||||||||||
Consumer loans | 92,036 | 7,823 | 46,712 | 36,931 | 570 | |||||||||||||||
Other purposes | 12,854 | 4,612 | 2,431 | 5,788 | 23 | |||||||||||||||
|
|
|
|
|
|
|
|
|
| |||||||||||
Subtotal | 1,003,281 | 250,373 | 436,516 | 290,488 | 25,904 | |||||||||||||||
|
|
|
|
|
|
|
|
|
| |||||||||||
Less: collectively assessed impairment losses | 3,439 | |||||||||||||||||||
|
| |||||||||||||||||||
Total (*) | 999,842 | |||||||||||||||||||
|
| |||||||||||||||||||
| (*) | For the purposes of this table, the definition of risk includes the following items in the public balance sheet: Loans and advances to credit institutions, Loans and advances to customers, Debt instruments, Equity instruments, Trading derivatives, Hedging derivatives, Investments and Contingent liabilities. |
5.4.3 Country risk
Country risk is a credit risk component inherent in all cross-border credit transactions due to circumstances other than ordinary commercial risk. Its main elements are sovereign risk, transfer risk and other risks that can affect international financial operations (war, natural disasters, balance of payments crises, etc.).
At December 31, 2013, the country risk exposure for which allowances must be recorded amounted to EUR 382 million (December 31, 2012: EUR 342 million). The allowance recognized in this connection at 2013 year-end amounted to EUR 47 million, as compared with EUR 45 million at 2012 year-end.
The country risk exposure for which allowances must be recorded is moderate. Total country risk exposure, irrespective of whether or not allowances must be recorded, is also moderate. Except for the group 1 countries (considered by the Bank of Spain to have the lowest level of risk(4)), exposure to an individual country in no case exceeds 1% of the Group’s total assets.
The Group’s country risk management policies continued to adhere to a principle of maximum prudence, and country risk is assumed, applying highly selective criteria, in transactions that are clearly profitable for the Group and bolster its overall relationship with its customers.
5.4.4 Sovereign risk
As a general rule, the Group considers sovereign risk to be the risk assumed in transactions with the central bank (including the regulatory cash reserve requirement), the issuer risk of the Treasury or similar body (government debt securities) and the risk arising from transactions with public entities that have the following features: their funds are obtained only from fiscal income; they are legally recognized as entities directly included in the government sector; and their activities are of a non-commercial nature.
This criterion, which has been employed historically by the Group, differs in certain respects from that requested by the European Banking Authority (EBA) for its periodic stress tests. The most significant differences are that the EBA’s criteria do not include risk exposure to central banks, the Group insurance companies’ exposures, exposure to public-sector companies or indirect exposure by means of guarantees or other instruments. However, they do include exposure to public authorities in general (including regional and local authorities), not only the central government sector.
Sovereign risk exposure (per the criteria applied at the Group) arises mainly from the subsidiary banks’ obligations to make certain deposits at the corresponding central banks and from the fixed-income portfolios held as part of the on-balance-sheet structural interest rate risk management strategy. The vast majority of these exposures are taken in local currency and are financed out of local customer deposits, also denominated in local currency.
In general, total exposure to sovereign risk has remained relatively stable in recent years, which seems reasonable if the strategic reasons for it, discussed above, are taken into account.
| 4. | This group includes transactions with ultimate obligors resident in European Union countries, Norway, Switzerland, Iceland, the US, Canada, Japan, Australia and New Zealand. |
The detail at December 31, 2013 and 2012, based on the Group’s management of each portfolio, of the Group’s sovereign risk exposure, net of the short positions held with the respective countries, taking into consideration the aforementioned criterion established by the European Banking Authority (EBA), is as follows:
| 12/31/13 | ||||||||||||||||
| Millions of euros | ||||||||||||||||
| Portfolio | ||||||||||||||||
Country | Financial assets held for trading and Other financial assets at fair value through profit or loss (*) | Available-for-sale financial assets | Loans and receivables | Total net direct exposure | ||||||||||||
Spain | 4,359 | 21,144 | 12,864 | 38,367 | ||||||||||||
Portugal | 148 | 2,076 | 583 | 2,807 | ||||||||||||
Italy | 1,309 | 77 | — | 1,386 | ||||||||||||
Greece | — | — | — | — | ||||||||||||
Ireland | — | — | — | — | ||||||||||||
Rest of eurozone | (1,229 | ) | 67 | — | (1,161 | ) | ||||||||||
UK | (1,375 | ) | 3,777 | — | 2,402 | |||||||||||
Poland | 216 | 4,770 | 43 | 5,030 | ||||||||||||
Rest of Europe | 5 | 117 | — | 122 | ||||||||||||
US | 519 | 2,089 | 63 | 2,671 | ||||||||||||
Brazil | 8,618 | 8,901 | 223 | 17,743 | ||||||||||||
Mexico | 3,188 | 2,362 | 2,145 | 7,695 | ||||||||||||
Chile | (485 | ) | 1,037 | 534 | 1,086 | |||||||||||
Rest of Americas | 268 | 619 | 663 | 1,550 | ||||||||||||
Rest of world | 5,219 | 596 | 146 | 5,964 | ||||||||||||
|
|
|
|
|
|
|
| |||||||||
Total | 20,762 | 47,632 | 17,268 | 85,661 | ||||||||||||
|
|
|
|
|
|
|
| |||||||||
| (*) | Net of short positions amounting to EUR 17,658 million. |
In addition, at December 31, 2013, the Group had net direct derivatives exposures the fair value of which amounted to EUR (206) million and net indirect derivatives exposures the fair value of which amounted to EUR 6 million. Also, the Group did not have any exposure to held-to-maturity investments.
| 12/31/12 | ||||||||||||||||
| Millions of euros | ||||||||||||||||
| Portfolio | ||||||||||||||||
Country | Financial assets held for trading and Other financial assets at fair value through profit or loss (*) | Available-for-sale financial assets | Loans and receivables | Total net direct exposure | ||||||||||||
Spain | 4,403 | 24,654 | 16,528 | 45,586 | ||||||||||||
Portugal | — | 1,684 | 616 | 2,300 | ||||||||||||
Italy | (71 | ) | 76 | — | 4 | |||||||||||
Greece | — | — | — | — | ||||||||||||
Ireland | — | — | — | — | ||||||||||||
Rest of eurozone | 943 | 789 | — | 1,731 | ||||||||||||
UK | (2,628 | ) | 4,419 | — | 1,792 | |||||||||||
Poland | 669 | 2,898 | 26 | 3,592 | ||||||||||||
Rest of Europe | 10 | — | — | 10 | ||||||||||||
US | (101 | ) | 1,783 | 30 | 1,712 | |||||||||||
Brazil | 14,067 | 11,745 | 351 | 26,163 | ||||||||||||
Mexico | 4,510 | 2,444 | 2,381 | 9,335 | ||||||||||||
Chile | (293 | ) | 1,667 | 521 | 1,895 | |||||||||||
Rest of Americas | 214 | 916 | 771 | 1,900 | ||||||||||||
Rest of world | 1,757 | 645 | 234 | 2,636 | ||||||||||||
|
|
|
|
|
|
|
| |||||||||
Total | 23,480 | 53,718 | 21,457 | 98,655 | ||||||||||||
|
|
|
|
|
|
|
| |||||||||
| (*) | Net of short positions amounting to EUR 15,282 million. |
In addition, at December 31, 2012, the Group had net direct derivatives exposures the fair value of which amounted to EUR (330) million and net indirect derivatives exposures the fair value of which amounted to EUR (33) million. Also, the Group did not have any exposure to held-to-maturity investments.
5.4.5 Environmental risk
In line with the Group’s commitment to sustainability, the environmental risk analysis of credit transactions is one of the main portfolios consistfeatures of products securedthe strategic corporate social responsibility plan. The analysis is founded on two major cornerstones:
5.5. Credit risk cycle
The credit risk management process consists of identifying, analyzing, controlling and deciding on, as appropriate, the risks incurred in the Group’s operations. The parties involved in this process are the business areas, senior management and the risk units.
The process involves the board of directors, the executive committee and the risk committee, which establishes the risk policies and procedures, and the limits and delegations of powers, and approves and supervises the scope of action of the risk function.
The risk cycle comprises three different phases: pre-sale, sale and post-sale. The process is being permanently updated, with collateral (mortgages).the findings and conclusions of the post-sale phase being fed back into the risk analysis and planning of the pre-sale phase.

3.3 Metrics5.5.1. Risk analysis and measurement toolscredit rating process
A. Credit rating toolsIn general, the risk analysis consists of examining the customer’s ability to meet its contractual obligations to the Bank. This involves analyzing the customer’s credit quality, its risk transactions, its solvency and the return to be obtained in view of the risk assumed.
Since 1993 the Group has used proprietary internal rating or scoring models to measure the credit quality of a given customer or transaction. Each rating or score relates to a certain probability of default or non-payment, determined on the basis of the Group’s historical experience, with the exception of certain portfolios classified as low default portfolios, the probability of default on which is assigned using external sources. More than 200 internal rating models for this purpose. These mechanisms are used in all the Group’s loan approvalindividualized segments, both the wholesale segments (sovereigns, financial institutions and risk monitoring process.corporate banking) and the other individualized companies and institutions.
GlobalThe rating tools are applied to the sovereign risk, financial institution and global wholesale banking segments. Management of these segments is centralised at Group level, for both rating calculation and risk monitoring purposes. These tools assign a rating to each customer, which is obtained from a quantitative or automatic module based on balance sheet ratios or macroeconomic variables and supplemented by the analyst’s expert judgement.
In the case of individualised portfolios, such as corporates and institutions, at the Santander Group Parent a single methodology has been defined for constructing a rating in each country. In this regard, the calculation of the rating is based on an automatic module that includes an initial intervention by the analyst that may or may not be complemented subsequently. The automatic module determines the rating in two phases, a quantitative phase and a qualitative phase. The latter is based on a corrective questionnaire which enables the analyst to modify the automatic score by up to ±2 rating points. The quantitative rating is determined by analysing the credit performance of a sample of customers and the correlation with their financial statements. The corrective questionnaire consists of 24 questions divided into 6 assessment areas. The automatic rating (quantitative + corrective questionnaire) may in turn be modified by the analyst by overwriting it or using a manual scoring module.judgment.
Ratings assigned to customers are reviewed periodically to include any new financial information available and the experience in the banking relationship. The frequency of the reviews is increased in the case of customers that reach certain levels in the automatic warning systems and of customers classified as requiring special monitoring. The rating tools themselves are also reviewed in order to progressively fine-tune the ratings they provide.
For standardised customers, both legal entities and individuals,In contrast to the Group hasuse of ratings in the individualized segments, in the standardized segment scoring techniques predominate; in general, these tools that automatically assign a score to the proposed transactions.
These loan approval systems are supplemented by performance rating models. These tools provide enhanced predictability of the risk assumed and are used for preventive activities such as marketing and limit assignment.
B. Credit risk parameters
The assessment of customers or transactions using rating or scoring systems constitutes a judgement of their credit quality, which is quantified through the probability of default (PD).
In addition to the probability of default, the quantification of credit risk requires the estimation of other parameters, such as exposure at default (EAD) and the percentage of EAD that will not be recovered (loss given default or LGD). Therefore, other relevant factors are taken into account in estimating the risk involved in transactions, such as the quantification of off-balance-sheet exposures, which depends on the type of product, or the analysis of expected recoveries, which is related to the guarantees provided and other characteristics of the transaction: type of product, term, etc.
F-196
These factors are the main credit risk parameters. Their combination facilitates calculation of the probable loss or expected loss (EL). This loss is considered to be an additional cost of the activity which is reflected in the risk premium and must be charged in the transaction price.
These risk parameters also make it possible to calculate the regulatory capital in accordance with the regulations deriving from Bank of Spain Circular 3/2008 (on the calculation and control of minimum capital requirements) and subsequent amendments thereto. Under the advanced approach, regulatory capital is determined as the difference between unexpected loss and expected loss.
Unexpected loss is the basis for the capital calculation and refers to a very high, albeit scantly probable, level of loss, which is not deemed to be recurring and must be catered for using capital.
For portfolios with scant internal default experience, such as banks, sovereign risk or global wholesale banking, risk parameter estimates (PD, LGD and EAD) are based on external sources: market prices or studies conducted by rating agencies gathering the shared experience of a sufficient number of entities. These portfolios are known as low default portfolios.
For all other portfolios, parameter estimates are based on the entity’s internal experience. The PD is calculated by observing the cases of new arrears in relation to the final rating assigned to customers or to the scoring assigned to the related transactions.
LGD calculation is based on the observation of the recoveries of defaulted loans, taking into account not only the income and expenses associated with the recovery process, but also the timing thereof and the indirect costs arising from the recovery process.
EAD is estimated by comparing the use of committed facilities at the time of default and their use under normal (performing) circumstances.
The parameters estimated for each global portfolio are the same for all the Group’s units. Therefore, a financial institution with an 8.5 rating will have the same PD, regardless of the Group unit in which its exposure is accounted for. By contrast, the retail portfolios have specific rating and scoring systems in each of the Group’s units, which require separate estimates and specific assignment of parameters in each case.
The parameters are then assigned to the units’ on-balance-sheet transactions in order to calculate the expected losses and the capital requirements associated with their exposure.
C. Global rating scales
For regulatory capital calculation purposes the following tables are used, which assign PD on the basis of internal rating ranges, with a minimum value of 0.03%.
| Wholesale banking | Banks | |||||||||||
Internal rating | PD | Internal rating | PD | |||||||||
8.5 to 9.3 | 0.030 | % | 8.5 to 9.3 | 0.030 | % | |||||||
8.0 to 8.5 | 0.033 | % | 8.0 to 8.5 | 0.039 | % | |||||||
7.5 to 8.0 | 0.056 | % | 7.5 to 8.0 | 0.066 | % | |||||||
7.0 to 7.5 | 0.095 | % | 7.0 to 7.5 | 0.111 | % | |||||||
6.5 to 7.0 | 0.161 | % | 6.5 to 7.0 | 0.186 | % | |||||||
6.0 to 6.5 | 0.271 | % | 6.0 to 6.5 | 0.311 | % | |||||||
5.5 to 6.0 | 0.458 | % | 5.5 to 6.0 | 0.521 | % | |||||||
5.0 to 5.5 | 1.104 | % | 5.0 to 5.5 | 0.874 | % | |||||||
4.5 to 5.0 | 2.126 | % | 4.5 to 5.0 | 1.465 | % | |||||||
4.0 to 4.5 | 3.407 | % | 4.0 to 4.5 | 2.456 | % | |||||||
3.5 to 4.0 | 5.462 | % | 3.5 to 4.0 | 4.117 | % | |||||||
3.0 to 3.5 | 8.757 | % | 3.0 to 3.5 | 6.901 | % | |||||||
2.5 to 3.0 | 14.038 | % | 2.5 to 3.0 | 11.569 | % | |||||||
2.0 to 2.5 | 22.504 | % | 2.0 to 2.5 | 19.393 | % | |||||||
1.5 to 2.0 | 36.077 | % | 1.5 to 2.0 | 32.509 | % | |||||||
Less than 1.5 | 57.834 | % | Less than 1.5 | 54.496 | % | |||||||
F-197
These PDs are applied consistently across the Group in keeping with the global management of these portfolios. As can be seen, although the PD assigned to the internal rating is not exactly the same for the same rating in both portfolios, it is very similar in the tranches where most exposure is concentrated, i.e. in the rating tranches above 6.
D. Distribution of EAD and associated expected loss (EL)
The table below details the distribution, by segment, of the outstanding credit risk exposure in terms of EAD, PD, LGD and EL. Approximately 78% of total risk exposure to customers (excluding sovereign and counterparty risks and other assets) relates to the corporate, SME and individuals segments, which reflects the commercial orientation of Santander Group’s business and risks. The expected loss arising from customer exposure is 1.30%, as compared with 1.05% for the Group’s total credit risk exposure, and, accordingly, the profile of the credit risk assumed can be classified as medium-low.
Data in millions of euros
| Segmentation of credit risk exposure | ||||||||||||||||||||
| EAD (1) | % | Average PD | Average LGD | EL | ||||||||||||||||
Sovereign debt | 159,775 | 15.2 | % | 0.14 | % | 13.9 | % | 0.02 | % | |||||||||||
Banks and other financial institutions | 51,574 | 4.9 | % | 0.27 | % | 59.6 | % | 0.16 | % | |||||||||||
Public sector | 14,654 | 1.4 | % | 1.44 | % | 14.8 | % | 0.21 | % | |||||||||||
Corporate | 155,702 | 14.8 | % | 0.94 | % | 39.9 | % | 0.37 | % | |||||||||||
SMEs | 163,005 | 15.5 | % | 5.44 | % | 30.5 | % | 1.66 | % | |||||||||||
Mortgage loans to individuals | 330,435 | 31.5 | % | 3.10 | % | 8.9 | % | 0.28 | % | |||||||||||
Consumer loans to individuals | 124,913 | 11.9 | % | 7.94 | % | 55.1 | % | 4.38 | % | |||||||||||
Credit cards - individuals | 32,374 | 3.1 | % | 4.74 | % | 64.8 | % | 3.07 | % | |||||||||||
Other assets | 17,465 | 1.7 | % | 3.73 | % | 27.5 | % | 1.02 | % | |||||||||||
Memorandum item - customers (2) | 821,083 | 78.2 | % | 3.93 | % | 33.1 | % | 1.30 | % | |||||||||||
|
|
|
|
|
|
|
|
|
| |||||||||||
Total | 1,049,897 | 100.0 | % | 3.17 | % | 33.0 | % | 1.05 | % | |||||||||||
|
|
|
|
|
|
|
|
|
| |||||||||||
Data at December 2011
3.4. Observed loss: measures of cost of credit
To supplement the use of the advanced models described above, other habitual measures are used to facilitate prudent and effective management of credit risk based on observed loss.
The cost of credit risk at Santander Group is measured using different approaches: variation in non-performing loans in the recovery process (ending doubtful assets—beginning doubtful assets + assets written off—recovery of assets written off), net credit loss provisions (provisions to specific allowances—recovery of assets written off) and net assets written off (assets written off—recovery of assets written off).
The general trend in recent years has been for Santander to keep the cost of credit at low levels. In 2011 the cost of credit, which was down by 15 basis points, was the result of the continuing appreciable deterioration of the economic climate and the retail portfolio mix which, albeit with a higher expected loss, displayed higher direct and indirect returns and a more predictable risk profile.
3.5 Credit risk cycle
The risk management process consists of identifying, measuring, analysing, controlling, negotiating and deciding on, as appropriate, the risks incurred in the Group’s operations. The parties involved in this process are the risk taking areas, senior management and the risk units.
F-198
The process begins at the board of directors, the executive committee and the risk committee, which establishes the risk policies and procedures, and the limits and delegations of powers, and approves and supervises the scope of action of the risk function.
The risk cycle comprises three different phases: pre-sale, sale and post-sale:
Pre-sale: this phase includes the risk planning and target setting processes, determination of the Group’s risk appetite, approval of new products, risk analysis and credit rating process, and limit setting.
Sale: this is the decision-making phase for both pre-classified and specific transactions.
Post-sale: this phase comprises the risk monitoring, measurement and control processes and the recovery process.
A.5.5.2 Risk limit planning and setting
RiskThe purpose of this phase is to efficiently and comprehensively limit setting is a dynamic process that identifies the Group’s risk appetite throughlevels the discussion of business proposals and the attitude to risk.Group assumes.
ThisThe credit risk planning process is defined inused to establish the global risk limit plan, an agreed-upon comprehensive document for the integrated management of the balance sheetbudgets and the inherent risks, which establishes risk appetitelimits at portfolio or customer level depending on the basis of the various factors involved.segment in question.
The risk limits are founded on two basic structures: customers/segments and products.
For individualised risks, customers represent the most basic level, and individual limits are established (pre-classification) when certain features, generally materiality, concur.
For large corporate groups a pre-classification model, based on an economic capital measurement and monitoring system, is used. As regards the corporate segment, a simplified pre-classification model is applied for customers meeting certain requirements (thorough knowledge, rating, etc.).
InThus, in the case of standardisedstandardized risks, the risk limits are planned and set using a credit management programme (PGC, using the Spanish acronym), a documentdocuments agreed upon by the business areas and the risk units and approved by the risk committee or its delegated committees, which containscontain the expected results of transactions in terms of risk and return, as well as the limits applicable to the activity and the related risk management.
For individualized risks, the analysis is conducted at customer level. When certain features concur for a given customer, an individual limit is established (pre-classification). Thus, for large corporate groups a pre-classification model, based on an economic capital measurement and monitoring system, is used. The result of the pre-classification is the maximum level of risk that can be assumed vis-à-vis a customer or group in terms of amount or maturity. In the corporate segment, a simplified pre-classification model is applied for customers meeting certain requirements (thorough knowledge, rating, etc.). Scenario analysis An important aspect of the planning phase is the consideration of the volatility of the macroeconomic variables that affect the performance of the portfolios. The Group simulates their performance in various adverse and stress scenarios (stress testing), which enables it to assess the Group’s capital adequacy in the event of certain future circumstantial situations. These simulations are performed systematically on the Group’s most important portfolios in accordance with a corporate methodology which: The simulation models used by the Group rely on data from a complete economic cycle to calibrate the behavior of the credit risk parameters in response to changes in the macroeconomic variables. These models undergo regular backtesting and recalibration processes in order to ensure that they provide a correct reflection of the relationship between the macroeconomic variables and the risk parameters. The scenario analysis enables senior management to gain a clearer understanding of the performance of the portfolio in response to changing market and circumstantial conditions and it is a basic tool for assessing the sufficiency of the provisions recognized to cater for stress scenarios. Definition of assumptions and (base/stress) scenarios The risk and loss parameters are projected, usually with a three-year time horizon, using various economic scenarios that include the main macroeconomic variables (GDP, unemployment rate, housing prices, inflation, etc.). The economic scenarios defined are based on different stress levels, ranging from the base or most probable scenario to more stressed economic scenarios which, although less probable, could possibly arise. These scenarios are generally defined by the Group’s economic research service, in coordination with the research services of each unit, using as a reference the data published by the main international organizations.B. RiskDefines benchmark scenarios (at global level and for each of the Group units).Determines the sensitivity of the credit ratingrisk parameters (PD and LGD) to the significant macroeconomic variables for each portfolio, as well as their levels in the proposed scenarios.Estimates the expected loss associated with each of the scenarios considered and the changes in the risk profile of each portfolio in response to changes in the relevant macroeconomic variables.
A global stress scenario is defined that describes a situation of worldwide crisis and the manner in which it affects each of the main geographical regions in which Santander Group is present. In addition, a local stress scenario is defined which, affecting certain of the Group’s main units in an isolated fashion, includes a higher level of stress than the global stress scenario.
At the meetings of the capital coordination committee, senior management of the Group is apprised of, proposes any changes it deems appropriate and ultimately approves the definitive set of scenarios to be used in conducting the Group’s stress test.
Uses of the scenario analysis
The scenario analysis techniques are useful throughout the credit risk cycle. The various uses can be classified as follows:
The planning and management applications of the tests include most notably their use in the preparation of the annual budget and the ongoing monitoring thereof. The use of the tests in establishing and monitoring the Group’s risk appetite is also of particular significance.
Results obtained
The various stress tests performed, for both regulatory and management purposes, have evidenced the strength and validity of the Group’s business model, as a result of its resilience to stress scenarios for both the Group as a whole and each of its main units.
In this regard, in each risk appetite update submitted to the board of directors, it has been confirmed that, even in the most adverse stress scenarios, the Group continues to report profits and maintain adequate capital levels.
One of the most important conclusions to be drawn from the scenario analysis is the benefit contributed by the Group’s diversification in terms of geographical regions, industries and its non-concentration on major customers, which enables it to comfortably withstand adverse macroeconomic scenarios.
5.5.3 Transaction decision-making
The sale phase comprises the decision-making process,
Risk analysis the aim of which is to analyses and resolve upon transactions, since approval by the risk unit is a pre-requisite for the approvalarrangement of loans to customers by the Group.
any risk transaction. This analysis consists of examining the customer’s ability to meet its contractual obligations to the Bank, which involves analysing the customer’s credit quality, its risk transactions, its solvency and the return to be obtained in view of the risk assumed.
The risk analysis is conducted every time a new customer or transaction arises or with a pre-established frequency, depending on the segment involved. Additionally, the credit rating is examined and reviewed whenever a warning system is triggered or an event affecting the customer/transaction occurs.
C. Transaction decision-making
The purpose ofprocess must consider the transaction decision-making process is to analyse transactionsapproval policies defined and adopt resolutions thereon, takingtake into account both the risk appetite and any transaction elements that are important in achieving a balance between risk and return.
Since 1993In the standardized customer sphere, the management of large volumes of loan transactions is facilitated by the use of automatic decision-making models that rate the customer/loan relationship. Thus, loans are classified in homogeneous risk groups using the rating assigned to the transaction by the model on the basis of information on the features of each transaction and the borrower. These models are used in individual banking and business banking and for standardized SMEs.
As stated above, the previous limit-setting stage can follow two different paths, giving rise to different types of decisions in the individualized customer sphere:
Credit risk mitigation techniques
The Group applies various methods of reducing credit risk, depending, inter alia, on the type of customer and product. As we shall see, some of these methods are specific to a particular type of transaction (e.g. real estate guarantees) while others apply to groups of transactions (e.g. netting and collateral arrangements).
The various mitigation techniques can be grouped into the following categories:
Determination of a net balance by counterparty.
Netting refers to the possibility of determining a net balance of transactions of the same type, under the umbrella of a framework agreement such as ISDA or similar agreements.
It consists of aggregating the positive and negative market values of the derivatives transactions entered into by us with a particular counterparty, so that, in the event of default, the counterparty owes the Group has been using, among others,(or the RORAC (return on risk-adjusted capital) methodology forGroup owes the counterparty, if the net figure is negative) a single net figure and not a series of positive or negative amounts relating to each of the transactions entered into with the counterparty.
An important aspect of framework agreements is that they represent a single legal obligation encompassing all the transactions they cover. This is the key to being able to set off the risks of all the transactions covered by the contract with the same counterparty.
Collateral
Collateral refers to the assets pledged by the customer or a third party to secure the performance of an obligation. Collateral may be:
From the risk analysis and pricingacceptance standpoint, collateral of the highest possible quality is required. For regulatory capital calculation purposes, only collateral that meets the minimum quality requirements described in the decision-making processBasel capital accords can be taken into consideration.
One very important example of financial collateral is the collateral agreement. Collateral agreements are a set of instruments with a determined economic value and high liquidity that are deposited or transferred by a counterparty in favor of another party in order to guarantee or reduce such counterparty credit risk as might arise from the portfolios of derivative transactions between the parties in which there is exposure to risk.
Collateral agreements vary in nature but, whichever the specific form of collateralization may be, the ultimate aim, as in the netting technique, is to reduce counterparty risk.
Transactions subject to collateral agreements are assessed periodically (normally on transactions and deals.a daily basis). The agreed-upon parameters defined in the agreement are applied to the net balance arising from these assessments, from which the collateral amount (normally cash or securities) payable to or receivable from the counterparty is obtained.
With regard to real estate collateral, periodic re-appraisal processes are in place, based on the actual market values for the different types of real estate, which meet all the requirements established by the regulator.
When mitigation techniques are used, the minimum requirements established in the credit risk management policy manual are adhered to. In short, these consist of monitoring the following:
F-199
D. Risk monitoring
In order
Personal guarantees and credit quality control, in additionderivatives
Personal guarantees are guarantees that make a third party liable for another party’s obligations to the tasks performedGroup. They include, for example, security deposits, suretyships and standby letters of credit. Only guarantees provided by third parties that meet the minimum requirements established by the internal audit division,supervisor can be recognized for capital calculation purposes.
Credit derivatives are financial instruments whose main purpose is to hedge credit risk by buying protection from a third party, whereby the Bank transfers the risk unit has a specific risk monitoring function, consisting of local and global teams, to which specific resources and personsthe issuer of the underlying instrument. Credit derivatives are OTC instruments, i.e. they are not traded in charge have been assigned.organized markets. Credit derivative hedges, mainly credit default swaps, are entered into with leading financial institutions.
This5.5.4 Monitoring
The monitoring function is basedfounded on an ongoinga process of permanentongoing observation, which makes it possible to enabledetect early detection of any incidentschanges that might arise in customers’ credit quality, so that action can be taken to correct any deviations with an adverse impact.
Monitoring is based on the evolutionsegmentation of customers, is performed by dedicated local and global risk teams and is complemented by the risk,work performed by internal audit.
The function involves, inter alia, identifying and monitoring companies under special surveillance, reviewing ratings and the transactions, the customers and their environment, with a view to adopting mitigating actions. The riskongoing monitoring function is specialised by customer segment.of standardized customers’ indicators.
For this purpose aThe system called “companies under special surveillance” (FEVE, using the Spanish acronym) has been designed that distinguishes four categories based on the degree of concern raised by the circumstances observed (extinguish, secure, reduce and monitor). The inclusion of a companyposition in the FEVE system does not mean that there has been a default, but rather that it is deemed advisable to adopt a specific policy for this company,the position in question, to place a person in charge and to set the policy implementation period. Customers classified as FEVE are reviewed at least every six months, or every three months for those classified in the most severe categories. A company can be classified as FEVE as a result of the monitoring process itself, a review performed by internal audit, a decision made by the sales manager responsible for that company or the triggering of the automatic warning system.
Assigned ratings are reviewed at least annually, but should any weakness be detected, or depending on the rating itself, more frequent reviews are performed.
For exposures to standardisedstandardized customers, the key indicators are monitored in order to detect any variance in the performance of the loan portfolio with respect to the forecasts contained in the credit management programmes.programs.
Debt restructuring5.5.5 Measurement and payment agreementscontrol
Debt restructuring forms part ofIn addition to monitoring customers’ credit quality, the ongoing management ofGroup establishes the control procedures required to analyze the current credit risk exposure to customers, although the practice becomes more important in times of weak economic activity. Debt restructurings arise when the customer is not in a position to meet its payment obligations to the lender and, accordingly, consideration is given to the possibility of adapting the debt to the customer’s changed ability to pay and/or improving the guarantees.
The use of debt restructurings at Santander Group banks makes it necessary to establish common practices that enable these risks to be kept under surveillance. With this purpose in mind, the corporate customer debt restructuring policy was created. The policy, which was approved by the risk committee, includes a series of definitions, general principles and operations policies that must be applied throughout the Group.
As part of their continuous monitoring activities, the risk departmentsportfolio and the recoveries business area, in coordination withchanges therein over the business areas, perform centralised actions to identify which customers might be restructuring targets. The ability to pay is the central factor of the analysis, since the purpose of the restructuring is for the customer to continue to settle its debts. The factors considered are non-payment or frequent payment delays and a reduction in income levels that might indicate a change in the customer’s economic situation and, accordingly, a deterioration in its ability to pay.various credit risk phases.
The risk departments, in coordination withcontrol function is performed by assessing risks from various complementary perspectives, the recoveriesmain pillars being control by geographical location, business area, are responsible for approvingmanagement model, product, etc., thus facilitating the restructuring transaction,early detection of specific areas of attention and the amendmentpreparation of action plans to correct possible impairment.
Each control pillar can be analyzed in two ways:
1.- Quantitative and qualitative analysis of the terms and conditions of the loan, the improvement of the guarantees, if required, andportfolio
In the analysis of the risks assumed.
At Santander Group, restructuring is confined, with stringent and selective criteria, to transactions:
that are viable and whose initial impairment is not very severe,
in which customers have a willingness to pay,
that improve the Bank’s position in terms of expected loss, and
in which restructuring does not discourage an additional effort by customers.
F-200
For exposures to standardised customers, the following general rules are applied rigorously, although exceptional circumstances are handled on a case-by-case basis. In the case of individualised customers, these principles may be used as a point of reference, but a case-by-case analysis is of particular importance.
The overall customer risk is assessed.
The exposure to the customer is not increased.
All the alternatives to refinancing and their impacts are assessed, making sure that the results of this solution exceed those which would foreseeably be obtained if no refinancing were performed.
Special attention is paid to the guarantees and the possible future changes in their value.
Its use is restricted, and priority is given to the restructuring of loans that requires an additional effort from customers, and actions that only postpone the problem are avoided.
Restructured transactions are subject to special monitoring, which continues until the debt has been repaid in full.
For individualised customers, a detailed, case-by-case analysis is performed, in which the use of expert judgement makes it possible to establish the most suitable conditions.
In addition to the close monitoring of these portfolios by the Group’s risk management teams, the competent supervisory authorities and Santander Group’s internal audit pay special attention to the control and appropriate assessment of restructured portfolios.
Two types of transactions can be distinguished, depending on the management status of the restructured loans:
Restructurings of loans to customers classified as standard (performing) which, due to a change in the customer’s economic position, experiences a temporary deterioration in its ability to pay. This contingency may be resolved by adapting the terms and conditions of the debt to the customer’s current ability to pay, thus enabling the customer to meet its payment obligation. These transactions are not considered to be cause for concern, but rather a temporary circumstance to be handled as part of the habitual relationship with the customer. Also, since there was no reason to foresee possible losses, it is not necessary to recogniseportfolio, any credit loss allowances to cover these transactions. Once the terms and conditions have been changed, the customer will certainly be able to continually meet its payment deadlines without any problem.
The restructuring of loans classified as non-performing, due to payment arrears or other situations, is known as refinancing.
Refinancing does not entail the release of provisions and the loan continues to be classified as non-performing, unless:
The criteria established in Bank of Spain Circular-based regulations are met (i.e. collection of ordinary interest outstanding and, in any case, provision of new effective guarantees or reasonable assurance of payment capacity);
The precautionary provisions included, using the accounting principle of prudence, in the Group’s corporate policy are met (sustained payment for a period of between three and twelve months, depending on the transaction features and the type of guarantee).
As regards credit loss allowances, the restructuring of a given transaction should not affect the provisions assigned to it. When a restructured transaction becomes non-performing it is deemed to be substandard, which gives rise to an increase in the period provisions recognized by the Group. The allowance percentage applicable to restructured transactions that become non-performing again shall be calculated from the date the transaction first became doubtful.
Payment agreements
The foregoing criteria are aimed mainly at situations with a low impact on the customer’s ability to pay. In situations of serious deterioration, restructuring the loan is not considered to be an option and the Group seeks to reach an agreement with the customer the purpose of which is to recover all or part of the loan and to minimise losses, assuming, on occasion, one or more of the following circumstances:
F-201
There is no reasonable assurance of payment; arrears of more than 180 days or debts classified as written off.
Contractual terms and conditions are agreed that do not fulfil the general principles laid down in the corporate restructuring policy described in the preceding section: forgiveness of principal and/or interest, repayments that do not cover current interest, or an increase in risk.
Credit risk exposure in Spain
a. Portfolio overview
The total credit risk exposure (including guarantees and documentary credits) of Santander’s businesses in Spain was EUR 271,180 million at 2011 year-end.
The non-performing loans ratio stood at 5.49% at the end of 2011, with NPLs concentrated mostly in the sectors most affected by the deterioration of the economic climate. This ratio, although higher than that published in 2010, increased by less than that of the total aggregate levels of the credit institutions in the Spanish financial system (according to periodic information published by the Bank of Spain), as a result both of the Group’s habitual prudence in risk management and of the slower growth in 2011 of the NPL ratios of a large proportion of the portfolios composing the Group’s lending in Spain.
The total allowances available for the possible losses arising from these loans represent a coverage ratio of 45.5%.
In accordance with Bank of Spain regulations and instructions, the Group classifies as substandard any performing loans for which there is no reason to classify them as doubtful, but which exhibit a weakness which might give rise to defaults and losses in the future, because the customers concerned are the weakest of a certain group or sector that has been affected by extraordinary higher-risk circumstances.
b. Analysis of home purchase loan portfolio
In line with the Bank of Spain’s guidelines for transparency for the market regarding the property market, following is a detail of the loans granted to households for the acquisition of homes by the main businesses in Spain. This portfolio, which is one of the largest in Spain, amounted to EUR 59,453 million (98% of which was secured by mortgages) at 2011 year-end, accounting for 22% of total credit risk in Spain.
In millions of euros | 12/31/11 | 12/31/10 | ||||||||||||||
| Gross amount | Of which: Doubtful | Gross amount | Of which: Doubtful | |||||||||||||
Home purchase loans | 59,453 | 1,607 | 61,936 | 1,388 | ||||||||||||
Without mortgage guarantee | 918 | 28 | 549 | 30 | ||||||||||||
With mortgage guarantee | 58,535 | 1,579 | 61,387 | 1,358 | ||||||||||||
In the home purchase loans detailed in the foregoing table, the guarantee is the financed home on which the Group has priority in the event of default. At December 31, 2011, 97% of these loans related to principal-residence houses (December 31, 2010: 94%).
The non-performing loans ratio of the mortgage loan portfolio reflected the economic environment in 2011, and ended the year at 2.7%, up 50 basis points compared to 2010 year-end, a figure clearly lower than that recorded by the other businesses in Spain. Since this type of portfolio (home purchase loans to individuals) has the average LTV ratios (51.6%) are low as a percentage of the debt, the recent decreases in value of the properties pledged as additional collateral for these transactions did not have an effect on the credit loss provisions recognised for these transactions.
F-202
The specific characteristics of the home purchase mortgage loan portfolio in Spain result in a medium-low risk profile and limited prospects of additional impairment:
All mortgage transactions include principal repayments from the very first day.
There is a habitual practice of early repayment, as a result of which the average life of transactions is much shorter than the contractual term.
Debtors provide all their assets as security, not just the home.
Most of the mortgages are floating rate loans with fixed spreads tied to Euribor.
High quality of the collateral, which relates almost exclusively to principal-residence loans.
88% of the portfolio has an LTV of less than 80%.
Stable average effort ratio at around 29%.
In millions of euros | 12/31/11 | |||||||||||||||||||
| Loan to value | ||||||||||||||||||||
| Less than or equal to 40% | More than 40% and less than 60% | More than 60% and less than 80% | More than 80% and less than or equal to 100% | More than 100% | ||||||||||||||||
Gross amount* | 15,653 | 14,053 | 16,747 | 9,518 | 2,564 | |||||||||||||||
Gross amount | 13,020 | 16,503 | 21,941 | 6,474 | 597 | |||||||||||||||
Of which: Doubtful | 177 | 271 | 598 | 425 | 107 | |||||||||||||||
For internal management purposes, the Group updates the LTV ratios at least once a year, taking into consideration published house price indices. Also, if a debtor becomes doubtful the Group updates the appraisals undertaken by valuers, which are taken into account in the estimate of impairment losses.
c. Property financing provided for construction and property development
The portfolio relating to this sector, defined in accordance with the Bank of Spain’s purpose-based classification guidelines, amounted to EUR 23,442 million in Spain, and reflected a significant decrease in comparison with previous years (25% with respect to 2009 and 14% with respect to 2010, on a like-for-like basis). This represents a market share of approximately 10%, based on the latest published information on the system for June 2011, substantially lower than the market share of the Group’s businesses in Spain taken as a whole. When foreclosed properties of EUR 8,552 million are included, the total figure amounts to EUR 31,994 million, representing 4% of the Group’s total lending, including foreclosed properties.
The reduction of the risk exposure to this sector was due largely to the introduction of an approval policy for new loans adapted to the situation of the sector, which resulted in the repayment of outstanding loan transactions, and to the proactive management of existing risks.
F-203
| 12/31/2011 | 12/31/2010 | |||||||||||||||||||||||
Millions of euros | Gross amount | Excess over collateral value | Specific allowance | Gross amount | Excess over collateral value | Specific allowance | ||||||||||||||||||
Financing for construction and property development registered by the Group’s credit institutions (business in Spain) | 23,442 | 12,213 | 2,824 | 27,334 | 13,296 | 1,890 | ||||||||||||||||||
Of which: Doubtful | 6,722 | 3,467 | 2,211 | 4,636 | 2,391 | 1,321 | ||||||||||||||||||
Of which: Substandard | 3,916 | 2,246 | 613 | 4,932 | 2,715 | 569 | ||||||||||||||||||
Memorandum item: Written-off assets | 236 | 589 | ||||||||||||||||||||||
Memorandum item: Data from the consolidated public balance sheet | 12/31/2011 | 12/31/2010 | ||||||||||||||||||||||
Millions of euros | Carrying amount | Carrying amount | ||||||||||||||||||||||
Total loans and advances to customers excluding the public sector (business in Spain) | 206,101 | 216,726 | ||||||||||||||||||||||
Total consolidated assets | 1,251,526 | 1,217,501 | ||||||||||||||||||||||
Impairment losses and credit risk allowances. Collective coverage (business in Spain) | 327 | 768 | ||||||||||||||||||||||
The excess over collateral corresponds to the amount of loan which is not covered by the value of the property collateral assigned to each loan. Accordingly, this collateral value does not include any other expected cash flows from the debtor, such as borrower’s ordinary cash flows or the results from the sale of the debtors other assets.
A large portion of the doubtful and substandard assets listed in the table exhibit some indicators of deterioration in the borrower’s overall financial condition but did not require the full provisioning of all amounts not covered by the collateral due to the following reasons:
All the transactions included in the substandard category are current in payment and, accordingly, the credit is expected to be recovered through the borrower’s ordinary cash flows rather than through the execution of the guarantee
With respect to doubtful loans: around 34% thereof are current in payment and the unprovisioned amount is expected to be recovered in two ways:
Firstly, through the ordinary repayments of the loans.
Secondly, on the basis of the collateral and personal guarantees provided by the borrower. Pursuant to the legislation currently in force in Spain, the borrower’s personal guarantee, and that of the guarantors of a transaction, extends to all the present and future assets thereof until the guaranteed debts are paid in full. In view of this regulation, our recovery management includes the ongoing monitoring of existing or current obligations and guarantees in order to maximise the amount recovered, irrespective of whether the position is on the balance sheet or has been deemed doubtful or written-off.
Taking the above into consideration, we can confirm that we recover in a highly satisfactory manner standard balances, substandard balances and, to a lesser extent, balances relating to doubtful loans through the borrower’s ordinary cash flows.
F-204
At 2011 year-end, the non-performing loans ratio of this portfolio was 28.6%, mirroring the downturn experienced by the sector. Of the EUR 10,638 million classified as doubtful and substandard loans, 58% relate to debtors who are current in their payments.
The exposure to the construction and property development for real estate purposes sector includes a high proportion of mortgage loans (EUR 18,705 million, representing 80% of the portfolio—December 2010: 78%), the detail being as follows:
| Loans: Gross amount | Loans: Gross amount | |||||||
Millions of euros | 12/31/11 | 12/31/10 | ||||||
1. Without mortgage guarantee | 4,737 | 6,124 | ||||||
2. With mortgage guarantee | 18,705 | 21,210 | ||||||
2.1 Completed buildings | 11,805 | 12,709 | ||||||
2.1.1 Residential | 6,006 | 5,247 | ||||||
2.1.2 Other | 5,799 | 7,462 | ||||||
2.2 Buildings under construction | 1,985 | 2,548 | ||||||
2.2.1 Residential | 1,458 | 1,991 | ||||||
2.2.2 Other | 527 | 557 | ||||||
2.3 Land | 4,915 | 5,953 | ||||||
2.3.1 Developed land | 3,118 | 3,678 | ||||||
2.3.2 Other land | 1,797 | 2,275 | ||||||
|
|
|
| |||||
Total | 23,442 | 27,334 | ||||||
|
|
|
| |||||
The Group evaluates this portfolio individually and calculates the amount of the specific allowance as the difference between the carrying amount and the present value of its estimated future cash flows and taking into account all amounts that are expected to be received over the remaining life of the instrument, including, where appropriate, those which may result from the collateral less the costs from obtaining and subsequently selling it.
A product of particular relevance in the property development portfolio is the developer mortgage loan for housing construction, exposure to which totalled EUR 7,467 million at 2011 year-end, approximately 0.9% of Santander Group’s total lending. Exposure to this product decreased by an even higher rate in 2011 (24%) than in 2010 (20%) and 2009 (9.3%).
At year-end, this portfolio had low concentration and an adequate level of collateral and allowances.
The analysis of the portfolio distribution, by stage of the work in progress of the financed developments, is as follows:
Developments with completed work / certificate of final completion obtained: 79.2% of outstanding risk.
Developments with a percentage of completion of more than 80%: 6.4% of outstanding risk.
Developments with a percentage of completion of between 50 and 80%: 5.2% of outstanding risk.
Percentage of completion of less than 50%: 9.2%.
The detail of the stages of completion of the property developments shows that nearly 86% of the financed developments of this kind are complete or are close to completion, thus having overcome the construction risk.
Policies and strategies in place for the management of these risks
The policies in force for the management of this portfolio, which are reviewed and approved on a regular basis by the Group’s senior management, are currently geared towards reducing and securing the outstanding exposure, albeit without neglecting any viable new business that may be identified.
In order to manage this credit exposure, Santander Group has specialised teams that not only form part of the risk areas but also supplement the management of this exposure and cover the entire life cycle of these transactions: commercial management, legal processes, court procedures and potential recovery management.
F-205
As previously discussed in this section, the Group’s anticipatory management of these risks enabled it to significantly reduce its exposure (developer mortgage loan exposure fell by 45% between 2008 and 2011), and it has a granular, geographically diversified portfolio in which the financing of second residences accounts for a very small proportion of the total.
Mortgage financing provided for non-urban land accounts for a small percentage (6%) of the mortgage exposure to land transactions; the remainder relates to land already classified as urban or developable and which can therefore be developed.
In the case of financing projects for housing whose construction is already complete, the significant reduction of exposure (-24% in 2011) was achieved through various different measures. As well as the specialised marketing channels already in existence, campaigns were carried out with the support of specific teams of managers for this function who, in the case of the Santander Network, were directly supervised by the recoveries business area. These campaigns, which involved the direct management of the projects with property developers and purchasers, reducing sale prices and adapting the lending conditions to the buyers’ needs, enabled loans already in force to be subrogated. These subrogations enable the Group to diversify its risk in a business segment that displays a clearly lower non-performing loans ratio.
The loan approval processes are managed by specialist teams which, working in direct coordination with the sales teams, have a set of clearly defined policies and criteria:
Developers with an ample solvency profile and proven experience in the market.
Strict criteria regarding the specific parameters of the transactions: exclusive financing for the construction cost, high percentages of accredited sales, principal residence financing, etc.
Support of financing of government-subsidised housing, with accredited sales percentages.
Restricted financing of land purchases, subject to the restoration of a sufficient level of coverage in existing financing arrangements or to the obtainment of increased collateral.
In addition to the permanent control performed by its risk monitoring teams, the Group has a specialist technical unit that monitors and controls this portfolio with regard to the stage of completion of construction work, planning compliance and sales control, and validates and controls progress billing payments. Santander has created a set of specific tools for this function. All the mortgage distribution, amounts drawn down of any kind, changes made to the grace periods, etc. are authorized on a centralised basis.
In the case of construction-phase projects that are experiencing difficulties of any kind, the policy adopted is to ensure completion of the construction work so as to obtain completed buildings that can be sold in the market. To achieve this aim, the projects are analyzed on a case-by-case basis in order to adopt the most effective series of measures for each case (structured payments to suppliers to ensure completion of the work, specific schedules for drawing down amounts, etc.).
In those cases requiring analysis of some kind of restructuring of the outstanding exposure, the restructuring is conducted jointly by the risk unit and the recovery business area, in advance of any default situations, applying criteria aimed at endowing projects with a payment structure that facilitates their successful completion. These restructuring transactions are authorized centrally by expert teams, thus ensuring the application of strict criteria consistent with the principles of prudence governing the Group’s risk management. Provisions to cover expected losses on these positions are recognized when possible losses are identified and the positions are classified before default occurs, as set forth in the regulations defined by the Bank of Spain.
The management of on-balance-sheet property assets is performed by companies that specialise in the sale of property (Altamira Santander Real Estate and Promodomus) and is supplemented by the commercial network structure. The assets are sold with price reductions in keeping with the market situation.
F-206
Foreclosed properties
One of the mechanisms employed in Spain as a last resort to ensure the efficient management of the portfolio is the purchase and foreclosure of property assets. At December 31, 2011, the net balance of these assets amounted to EUR 4,274 million (gross amount: EUR 8,552 million; recognized allowance: EUR 4,278 million).
The following table shows the detail of the assets acquired and foreclosed by businesses in Spain at 2011 and 2010 year-end:
Millions of euros | 12/31/11 | 12/31/10 | ||||||||||||||
| Carrying amount | Of which: Allowance | Carrying amount | Of which: Allowance | |||||||||||||
Property assets arising from financing provided to construction and property development companies | 2,988 | 3,536 | 3,607 | 1,790 | ||||||||||||
Of which: | ||||||||||||||||
Completed buildings | 1,001 | 760 | 825 | 268 | ||||||||||||
Residential | 661 | 505 | 539 | 175 | ||||||||||||
Other | 340 | 255 | 286 | 93 | ||||||||||||
Buildings under construction | 255 | 265 | 425 | 139 | ||||||||||||
Residential | 235 | 244 | 424 | 138 | ||||||||||||
Other | 20 | 21 | 1 | 1 | ||||||||||||
Land | 1,732 | 2,511 | 2,357 | 1,383 | ||||||||||||
Developed land | 1,121 | 1,540 | 1,460 | 775 | ||||||||||||
Other land | 611 | 971 | 897 | 608 | ||||||||||||
Property assets from home purchase mortgage loans to households | 1,223 | 689 | 1,137 | 369 | ||||||||||||
Other foreclosed property assets | 63 | 53 | 452 | 154 | ||||||||||||
|
|
|
|
|
|
|
| |||||||||
Total property assets | 4,274 | 4,278 | 5,196 | 2,313 | ||||||||||||
|
|
|
|
|
|
|
| |||||||||
Equity instruments of, ownership interests in and financing provided to non-consolidated companies holding these assets | 818 | 580 | 402 | 438 | ||||||||||||
|
|
|
|
|
|
|
| |||||||||
Total | 5,092 | 4,858 | 5,598 | 2,751 | ||||||||||||
|
|
|
|
|
|
|
| |||||||||
In recent years, the Group has considered asset acquisition/foreclosure to be a more efficient method for resolving cases of default than legal proceedings. To account for the acquired and foreclosed assets, the Group initially records the property at the lesser value between the amount of the debt (net of allowances) and the fair value of the acquired or foreclosed asset less the estimated selling costs. If the fair value (less selling costs) is lower than the amount of the debt, the difference is recognized within the caption Impairment losses on financial assets (net) - Loans and receivables in the consolidated income statement for the period. Subsequent to initial recognition, the asset is measured at the lower of fair value (less selling costs) and the amount initially recognized. The fair value of this type of asset is determined by management based on market evidence obtained from appraisals performed by qualified professionals.
We recalibrate the Loss Given Default (LGD) values used by our internal model considering a number of factors, including any decline in collateral values. Accordingly any decrease in collateral values will mean a decrease in the recoveries rates and this will cause higher LGD values in the calibration and, consequently, an increase in the allowances for loan losses.
Therefore, the amount of losses recorded in the caption Impairment losses on financial assets (net)—Loans and receivables when we initially recognized acquired and foreclosed assets is not significant.
2011 was an especially difficult year for the Spanish economy. Business activity slowed clearly throughout the year, and this trend intensified in the last quarter, with a quarter-on-quarter fall of 0.3% in GDP, compared with no change in the previous quarter, due mainly to the decline in consumption. The situation in the labour market also deteriorated in the last quarter, with the unemployment rate reaching 22.85%.
On 20 November 2011, a change of government took place, and the far-reaching reforms announced during the election campaign started.
F-207
The continuation of these trends, combined with the substantial effort for budgetary consolidation, indicates a return to recession for the Spanish economy according to all the forecasts.
With respect to the property market, the across-the-board trend of lower prices continued. According to the official information published by the Spanish Ministry of Development, during the second half of 2011, home sales fell 17% in Spain, as a consequence of the deterioration of the economic conditions and of the increasing loss of confidence in the real-estate sector. This fact together with increasingly difficult financing conditions due to the crisis of the sovereign debt of certain countries of the Eurozone (Greece, Portugal, Italy and Spain) and the uncertainty on the viability of certain financial institutions, meant that a large part of the real estate transactions for residential and tertiary use (commercial, offices) were at prices with significant discounts.
This situation was reflected in an increase in losses on sale transactions performed by the Group in the last quarter of the year. Also, in that period the Group received non-binding offers from various property market operators to which it had offered the chance to acquire a significant volume of its land and property in Spain. The offers showed considerable discounts on the cost of the related properties and demonstrated the difficulty of finding investors interested in acquiring land. Lastly, an increase was observed in the average length of time these assets are held, which in the Group’s case was an average of 27 months.
Against this backdrop of a deterioration in the outlook for the Spanish economy and a reduction in the amounts recovered from the sale of properties, prior to the formal preparation of the consolidated financial statements for 2011, the Group’s directors conducted an in-depth review of the recoverable values of the property assets in Spain in order to consider the conditions in the current Spanish property market, taking into account the features of the Group’s property assets, using specialist external appraisals for this purpose. These appraisals confirmed the reduction in the value of the properties anticipated by the indicators described in the paragraph above.
As a result of this process, at year-end the Group recognised in its consolidated financial statements provisions, in addition to that resulted from applying the minimum percentages that the Bank of Spain requires from Spanish credit institutions in relation to this type of assets, that increased the coverage of foreclosed property in Spain to 50 per cent.
Net additions to acquired and foreclosed assets continued to fall in both 2010 and 2011, due to the higher rate of increase in disposals (+12%) to that of additions (+8%). The balance of these assets fell slightly in the last quarter of 2011, and the figure is expected to show a downward trend in the coming years.
| Thousands of millions of euros | ||||||||
| 2011 | 2010 | |||||||
Gross additions | 2.3 | 2.1 | ||||||
Disposals | 1.3 | 1.1 | ||||||
Difference | 1.0 | 1.0 | ||||||
Analysis of the mortgage portfolio in the United Kingdom
With regard to standardised exposures, in addition to the loan portfolio in Spain, the mortgage loan portfolio in the United Kingdom is particularly noteworthy because of its significance with respect to Santander Group’s total lending.
This portfolio is composed entirely of first-mortgage loan transactions on properties located throughout the United Kingdom, since transactions involving second or successive liens on the mortgaged properties are no longer originated.
Geographically speaking, the credit risk exposure is concentrated mainly in the Greater London area, where house price indices reflect a more stable behaviour, even in times of economic slowdown.
F-208
All properties are appraised by authorized valuers prior to the approval of the transaction, in accordance with the Group’s risk management principles and in keeping with the methodology defined by the Royal Institution of Chartered Surveyors.
The portfolio performed favourably in 2011, achieving a non-performing loans ratio of 1.46% at year-end (2010: 1.41%), the result of both the ongoing monitoring and control of the portfolio and the strict credit policies in place, which include, among other measures, a maximum loan-to-value ratio with respect to the properties securing the loans. On the basis of these policies, since 2009 no mortgages with an LTV of more than 100% have been granted. The average LTV ratio stands at 53%.
There is no risk appetite for loans deemed to be “high risk” (subprime mortgages) and, therefore, the credit risk policies in force expressly prohibit the granting of loans of this kind, establishing stringent credit quality requirements for both transactions and customers. Buy-to-let mortgage loans, which have the highest risk profile, represent a scant percentage (barely 1%) of the total portfolio amount.
Another indicator of the sound performance of the portfolio is the small volume of foreclosed properties, which amounted to EUR 160 million at 2011 year-end, representing just 0.07% of total mortgage exposure. The efficient management of foreclosures, coupled with the existence of a dynamic market in which foreclosed homes can be sold in a short space of time, contributes to the good results achieved.
E. Risk control function
Supplementing the management process, the risk control function obtains a global view of the Group’s loan portfolio, through the various phases of the risk cycle, with a level of detail sufficient to permit the assessment of the current situation of the exposure and any changes therein.
The aim of the control model is to assess the solvency risk assumed in order to detect any areas requiring attention and to propose measures to correct any possible impairment. Therefore, it is essential that the control activity itself be accompanied by an analysis component aimed at facilitating a proactive approach to the early detection of problems and the subsequent recommendation of action plans.
Any variances in the Group’s risk exposure fromwith respect to budgets, limits and benchmarks are controlled on an ongoing and systematic basis, and the impacts of these variances in certain future situations, both of an exogenous nature and those arising from strategic decisions, are assessed in order to establish measures that place the profile and amount of the loan portfolio within the parameters set by the Group.
In addition to the traditional metrics, the following, inter alia, are used in the credit risk control phase:
VMG measures the change in non-performing loans in the period, discounting the loans written off and taking recoveries into account.
It is an aggregate measure at portfolio level that enables action to be taken in the event of deteriorations in the trend of non-performing loans.
It is obtained as the result of the ending balance less the beginning balance of non-performing loans for the period in question, plus the loans written off in the period, less any previously written-off loans recovered in that same period.
VMG and its component parts play a decisive role as monitoring variables.
Expected loss is the estimated financial loss that will occur over the next twelve months on the portfolio existing at any given time.
It is an additional cost of the activity and must be charged in the transaction price. It is calculated using three basic parameters:
Thus, other relevant factors are taken into account in estimating the risk involved in transactions, such as the quantification of off-balance-sheet exposures, or the expected percentage of recoveries, which is related to the guarantees associated with the transaction and other characteristics of the transaction: type of product, term, etc.
The risk control functionparameters are also involved in the calculation of both economic and regulatory capital. The inclusion of capital metrics in management is performed by assessing risks from various complementary perspectives,fundamental to the main pillar being control by geographical location, business area, management model, product and process, thus facilitating the detection of specific areas of action requiring decision-making.
In 2011 the control processes ensuring fulfilmentrationalization of the Group’s corporate credit risk management criteria were boosted. Also, the uniformityuse of capital.
2.- Assessment of the control model enabled data flow standards to be established, portfolio-based analysis thereof and the monitoringprocesses
This includes a systematic periodic review of the main management metrics,procedures and methodology, and is performed over the entire credit risk cycle to ensure that they are in a coordination exercise between the global areaforce and the various units at which the action programmes were defined with specific milestones to enable the situation of each unit to converge with the global model.effective.
In 2006, within the corporate framework established in the Group for compliance with the Sarbanes-Oxley Act, a corporate tool was made available on the Group’s intranet for the documentation and certification of all the subprocesses, operational risks and related mitigating controls. TheIn this connection, the risk division assesses annually the efficiency of the internal control of its activities.activities on an annual basis.
F-209
Scenario analysis
AsFurthermore, the integrated risk control and internal risk validation unit, as part of its ongoingmission to supervise the quality of the Group’s risk monitoringmanagement, guarantees that the systems for the management and control process, the Group performs simulations of the performance ofrisks inherent to its portfolio in various adverseactivity comply with the strictest criteria and stress scenarios (stress testing). This enables the Group to assess its capital adequacybest practices observed in the event of certain future circumstantial situations. These simulationsindustry and/or required by the regulators. Also, internal audit is responsible for ensuring that the policies, methods and procedures are performed systematically onappropriate, effectively implemented and regularly reviewed.
5.5.6 Recovery management
The recovery activity is a significant function in the Group’s most important portfolios in accordance with a corporate methodology which:
Calculates the sensitivity of the credit risk parameters (PD and LGD) to certain macroeconomic variables.
Designs benchmark scenarios (at global level and for each of the Group units).
Identifies “break-off scenarios” (the levels above which the sensitivity of the risk factors to macroeconomic variables is more accentuated) and the distance of these break-off scenarios from the current situation and the benchmark scenarios.
Estimates the expected loss associated with each of the set scenarios and the changes in the risk profile of each portfolio in response to changes in certain macroeconomic variables.
The simulation models used by the Group rely on data from a complete economic cycle to calibrate the behaviour of the credit risk parameters in response to changes in the macroeconomic variables.
The scenarios are developed from the standpoint of each unit and the Group as a whole. The main macroeconomic variables contained in these scenarios are as follows:
Unemployment rate
Housing prices
GDP
Interest rate
Inflation
The scenario analysis enables senior management to gain a clearer understanding of the foreseeable performance of the portfolio in response to changing market and circumstantial conditions and it is a basic tool for assessing the adequacy of the provisions recognized to cater for stress scenarios.
The analyses performed, in both base and acid scenarios, for the Group as a whole and each of the units, over a three-year horizon, demonstrate the strength of the balance sheet in the various projected market and macroeconomic scenarios.
EU stress testsarea.
In order to test banks’ solvencymanage recovery properly, action is taken in four main phases: arrears management, recovery of non-performing loans, recovery of written-off loans and resilience in an adverse scenario, in 2011 the European Banking Authority (EBA), in conjunction with the Bank of Spain, the European Central Bank, the European Commission and the European Systemic Risk Board (ESRB), conducted stress tests on 91 banks representing 65% of the total assets of the European banking system.
The EBA stress test analyzed the level of capital that banks would have in 2012 and their performance compared to 2010 year-end (starting point) in two types of scenarios: a benchmark stress scenario and an adverse stress scenario. The exercise assumed a static balance sheet and a constant business model by geographical area and product strategy, but did not take into account acquisitions or divestments and, accordingly, it did not reflect Bank management’s estimate of the Group’s earnings performance in the next two years. Initially, the banks examined had to have a minimum core Tier 1 ratio of 5% in the worst scenario.
The results published on July 15, 2011 showed that in the most extreme scenario, the Group would be able, without receiving public support, to generate profit, distribute dividends and continue to generate capital. In the most extreme stress scenario, Santander would end 2012 with a core Tier 1 ratio of 8.4%, comfortably above the 5% minimum required.
F-210
F. Loan recovery
Recovery management is one of the strategic cornerstones of the Bank’s risk management.
For the performance of this function, which is essentially a business activity, the Bank has in place a corporate management model which defines the general operating guidelines. These guidelines are applied in the various geographical areas in which the Bank is present, adapted as required to suit the local business models and the economic situation of the respective environments.
Fundamentally, this corporate model establishes management procedures and circuits on the basis of customer characteristics, distinguishing between a mass management approach using multiple channels and a more personalised or individualised management, as appropriate, through the assignment of specific internal or external managers.
Thus, based on this management segmentation, various mechanisms were established to ensure the recovery management of default customers from the earliest stages of arrears to the ultimate write-off of the debt.foreclosed assets. In this connection,fact, the actions taken by the recovery function vis-à-vis customers commence oneven before the first daymissed payment, i.e. when there are signs of non-paymenta deterioration of the debtcustomer’s ability to pay, and they end when the customer’s debt has been paid or has returned to performing status. In some segments preventative managementThe recovery function aims to anticipate default events and focuses on preventive management.
The current macroeconomic environment has a direct effect on customer default and non-performing loans ratios. Therefore, the quality of customersthe portfolios is performed before they fall into arrears.
Loan recovery, thus conceived as an integrated business,fundamental to the development and growth of our businesses in the various countries, and particular attention is basedpaid, on an ongoing review of management processespermanent basis, to the debt collection and methodology. It is supported byrecovery functions in order to guarantee that this quality reaches the expected levels at all the Group’s resources, with the participation and cooperation of other areas (Commercial, Resources, Technology, Human Resources), and technological solutions for enhanced effectiveness and efficiency are developed.times.
The recoveries unitGroup has in place a practical hands-on training programmecorporate management model that aims to broaden knowledge, facilitatedefines the exchange of ideas and best practices and furthergeneral recovery action guidelines. These guidelines are applied in the professional development ofvarious countries, always taking into account the individuals and the teams, and at all times seeks to integratelocal peculiarities required for the recovery process into the Group’s ordinary commercial activity.
In 2011 the loan recovery management indicators reflected the difficult economic situation that some of the countries in which the Group has a presence are suffering, with a higher net NPL inflows and net charge-offs figure than in 2010, mainlyactivity, due either to the local economic environment, to the business model or to a combination of both. This corporate model is subject to the permanent review and enhancement of the management processes and methodology that underpin it. For the Group, recovery management entails the direct involvement of all areas of management (sales, technology and operations, human resources and risk), which has contributed to the incorporation of solutions improving the effectiveness and efficiency of the aforementioned model.
The differing characteristics of customers make segmentation necessary in order to ensure proper recovery management. The mass management of large groups of customers with similar profiles and products is performed using highly technological processes, while personalized and individualized management is reserved for customers who, due to their profile, require the assignment of a specific manager and a more tailored analysis.
The recovery activity has been aligned with the social and economic reality of the different countries, and various management mechanisms have been used, all involving appropriate prudential criteria, based on the age, collateral and conditions of the transaction, while always ensuring that at least the required ratings and consequently,provisions are maintained.
Within the increasing difficultyrecovery function particular emphasis has been placed on using the mechanisms referred to above for early arrears management, in obtainingaccordance with corporate policies, considering the various local realities and closely monitoring the production, inventory and performance of those local areas. The aforementioned policies are reviewed and adapted periodically in order to reflect both best management practices and any applicable regulatory amendments.
In addition to the measures aimed at adapting transactions to the customer’s ability to pay, special mention should be made of recovery results at these units. Therefore,management, in which alternative solutions to legal action are sought to ensure the early collection of debts.
One of the channels for the recovery of debts of customers whose ability to pay has deteriorated severely is foreclosure (either court-ordered or through dation in payment) of the property assets securing the transactions. In geographical regions that are highly exposed to real estate risk, such as Spain, the Group has ensuredvery efficient instruments in place to manage the sale of such assets, thus making it possible for the Bank to recuperate its management capabilitycapital and implemented new strategies aimedreduce its on-balance-sheet stock of property assets at increasing recoveriesa much faster pace than other financial institutions.
Forborne loan portfolio
The term “forborne loan portfolio” refers, for the purposes of non-performing loans.
However, the recovery of written-off assets reported very good results.
3.6 CreditGroup’s risk from other standpoints
Certain areas and/or specific views of credit risk deserve specialist attention, complementary to global risk management.
A. Concentration risk
Concentration risk control is keymanagement, to the risk management process. The Group continuously monitors the degreeconcepts of credit risk concentration, by geographical area/country, economic sector, product“restructurings” and customer group.
The risk committee establishes the risk policies and reviews the exposure limits required to ensure adequate management of credit risk concentration.
The Group is subject to Bank of Spain regulations on “Large Exposures”. Pursuant to the rules contained“refinancings” as defined in Bank of Spain Circular 3/2008 (on6/2012, which relate to transactions in which the calculationcustomer has, or might foreseeably have, financial difficulty in meeting its payment obligations under the terms and controlconditions of minimum capital requirements)the current agreement and, accordingly, the agreement has been modified or cancelled or even a new transaction has been entered into.
The Group has a detailed corporate policy for debt forbearance that is applicable to all countries, complies with the aforementioned Bank of Spain Circular 6/2012 and follows the general principles recently published by the European Banking Authority for transactions of this kind.
This corporate policy establishes strict prudential criteria for the assessment of these loans:
Also, the valuecorporate policy sets out various criteria for determining the scope of transactions qualifying as forborne exposures by defining a detailed series of objective indicators that are indicative of situations of financial difficulty.
Accordingly, transactions not classified as impaired at the date of forbearance are generally considered to be experiencing financial difficulty if at that date they were more than one month past due. Where no payments have been missed or there are no payments more than one month past due, other indicators of financial difficulty are taken into account, including most notably the following:
Once it has been determined that the reasons for the modification are effectively due to financial difficulties, a more precise classification is performed based on the degree of impairment and management status of the credit institution’s capital. Exposuresoriginal transactions, distinguishing between the following types of forbearance:
| • | Ex-ante forbearance: where the original transaction has not been classified as impaired and has an amount more than one month (but not more than three months) past due at the time the modification is arranged. If the transaction has an amount past due by one month or less, or even if the transaction is current in its payment, it will also be considered as a case of ex-ante forbearance if, based on the aforementioned indicators, there is any sign evidencing the existence of financial difficulties. |
| • | Ex-post forbearance: the ex-post concept refers to forbearance transactions in which, at the date of forbearance, the exposures have already been classified as impaired, either due to arrears or for other reasons (i.e. for subjective reasons or reasons other than arrears). |
The corporate policy also establishes different treatments that are applicable to governmentsforbearance transactions in cases of advanced impairment. The classification requirements and central banks belongingcriteria are more stringent for transactions of this kind than for other forbearance transactions.
As regards the strategies to be applied, corporate policy requires the customer’s ability and willingness to pay to be analyzed and a distinction to be drawn between the severity and the estimated duration of the impairment. The results of this analysis will be used as a basis for deciding whether the debt should be forborne and the most appropriate way of doing so for each case:
| 1. | When borrowers display a severe but transitory deterioration in their ability to pay (which is expected to be recovered in a short space of time), short-term adjustment strategies are applied, such as a payment moratorium on the principal or the reduction of instalments for a short, limited period until the ability to pay is recovered. |
| 2. | When borrowers display a slight deterioration in their ability to pay (an early recovery of which is not expected), more long-term strategies are applied, such as reducing instalments by deferring either the maturity date or a portion of the principal, which would be paid at the same time as the last instalment, at all times securing its payment through the provision of effective guarantees. |
In any case, through a case-by-case analysis, priority is given to modifications for customers displaying a slight but prolonged deterioration, since those experiencing severe but transitory deterioration carry a higher risk, as they depend on the accuracy of the estimated time of their future recovery. Cases of severe deterioration deemed to be prolonged over time are not considered for forbearance.
Corporate policy also establishes mechanisms for the management and control of loan forbearance, which allow it to handle forborne transactions in a differentiated way, paying particular attention to the OECD are excluded from this treatment.
F-211
At December 31, 2011, there were several finance groups
Once forbearance measures have been adopted, transactions that have to remain classified as impaired because at the date of forbearance they do not meet the requirements to be classified in a different category(5) must comply with a prudential payment schedule in order to assure reasonable certainty as to the recovery of the customer’s ability to pay.
If there is any (non-technical) irregularity in payments during that period, the probation period starts again.
On successful completion of the probation period, the duration of which depends on the customer’s situation and the transaction features (term and guarantees provided), the transaction is no longer classified as impaired, but is temporarily classified as substandard until the transaction becomes fully performing again. Once the transaction has returned to performing, the monitoring and management of the forborne transaction continues until a series of requirements have been met, including most notably: a minimum period of two financial institutionsyears must have elapsed since commencement of the forbearance; repayment of 20% of the principal and settlement of the amounts that were past due at the time of forbearance.
By contrast, if following arrangement of forbearance there is no improvement in the US and one central counterparty incustomer’s payment performance, the EU. Followingpossibility of extending new forbearance measures will be considered, with the application of risk mitigation techniques and the regulations applicable to large exposures, the exposure to each of these entities represented less than 3.5% of eligible capital.
At December 31, 2011, the Group’s credit exposure to the top 20 borrower economic and financial groups, excluding AAA-rated governments and sovereign bonds denominated in local currency, accounted for 5.0% of the credit risk exposure to customers (lending plus off-balance-sheet exposures), which compares favourably with the year-ago figure of 6%.
From a sector-based standpoint, the distribution of the corporate portfolio is adequately diversified.more stringent classification/return-to-performing criteria.
The Group’s risk division works closely with the finance division in the active management of credit portfolios, which includes reducing the concentration of exposures through several techniques, such as the arrangement of credit derivatives for hedging purposes or the performance of securitization transactions, in order to optimise the risk/return ratio of the total portfolio.
B. Credit risk from financial market operations
This concept includes the credit risk arising in treasury operations with customers, mainly credit institutions. These operations are performed using both money market financing products arranged with various financial institutions and derivative products intended to provide service to the Group’s customers.
Risk control is performed using an integrated, real-time system that enables the Group to know at any time the unused exposure limit with respect to any counterparty, any product and maturity and at any Group unit.
Credit risk is measured at its current market value and its potential value (exposure value considering the future variation in the underlying market factors). Therefore, the credit risk equivalent (CRE) is defined as the sum of net replacement value plus the maximum potential value of the contracts in the future. Calculations are also performed of capital at risk or unexpected loss (i.e. the loss which, once the expected loss is subtracted, constitutes the economic capital, net of guarantees and recoveries).
The total credit risk exposure to credit institutions from financial market operations stands at 59.6%. By type of product, 59.4% relates to derivative transactions, mainly products without optionality, and the remaining 40.6% to liquidity and traditional financing products.
Derivative transactions are concentrated on counterparties with high credit ratings and, therefore, 56.6% of the risk exposure is to counterparties with a credit rating of A or above. In 2011 the total exposure arising from these transactions in terms of credit risk equivalent was EUR 53,358 million.
The distribution of the credit risk exposure arising from derivatives, by counterparty, is as follows: 46% to banks, 33% to large corporations and 9% to SMEs.
With respect to the geographical distribution of the risk exposure, 13% is to Spanish counterparties, 18% to UK counterparties (operations performed mainly by Santander UK) and 30% to other European countries, 10% to the United States and 14% to Latin America.
Credit derivative transactions
Santander Group uses credit derivatives to hedge credit transactions, to conduct customer business in financial markets, and as part of its trading operations. Credit derivatives represent a small portion of the Group’s operations as compared with other similar banks and are subject to strict internal controls and to sound operational risk minimisation policies.
F-212
The risk inherent to these transactions is controlled using a wide array of limits such as VaR, nominal value by rating, sensitivity to spread by rating and name, sensitivity to recovery rate and sensitivity to correlation. Jump-to-default limits are also set by individual name, geographical area, sector and liquidity.
In notional terms, the position in CDSs includes protection purchased for EUR 57,220 million and protection sold for EUR 51,212 million. At December 31, 2011, the fair value of the CDSs reflected losses of EUR 121 million in the trading portfolio and gains of EUR 60 million in the hedging portfolio. The underlyings relate mainly to indices, tranches of securitised assets, individual issuer risks and issuer baskets. The risk covered by the derivative is in some cases first losses and in other cases other risk tranches.
The valuation of CDSs on a single underlying is obtained by estimating the probability of default of the underlying at maturity based on the credit spreads quoted in the market and the recovery rate. Once the future cash flows of the transaction have been estimated, they are discounted to present value using the market risk-free yield curve. In the case of CDSs on baskets, the joint probability of default of the underlyings is determined using the Standard Gaussian Copula model. The main inputs used to determine the underlying cost of credit of the CDSs are quoted credit risk premiums and the correlation between quoted CDSs of various issuers.
C. Country risk
Country risk is a credit risk component inherent in all cross-border credit transactions due to circumstances other than ordinary commercial risk. Its main elements are sovereign risk, transfer risk and other risks that can affect international financial operations (war, natural disasters, balance of payments crises, etc.).
At December 31, 2011, the country risk exposure for which allowances must be recorded amounted to EUR 380 million, EUR 19 million of which related to intra-Group transactions. At 2010 year-end, the total regulatory country risk exposure amounted to EUR 435 million. The allowance recognized in this connection at 2011 year-end amounted to EUR 55 million, as compared with EUR 69 million at 2010 year-end.
The Group’s country risk management policies continued to adhere to a principle of maximum prudence, and country risk is assumed, applying highly selective criteria, in transactions that are clearly profitable for the Group and bolster its overall relationship with its customers.
D. Sovereign risk
As a general rule, at Santander Group sovereign risk is considered to be the risk assumed in transactions with the central bank (including the regulatory cash reserve requirement), the issuer risk of the Treasury or Republic (government debt securities) and the risk arising from transactions with public entities with the following features: their funds are obtained only from fiscal income; they are legally recognized as entities directly included in the government sector; and their activities areforbearance of a non-commercial nature.
At December 31, 2011, the sovereign risk, calculated using the Santander criterion, was distributed among Europe (56.3%), Latin America (35.4%), the United States (7.3%) and other regions (1.0%). Noteworthy were the contributions from Spain (29.8%) and the United Kingdom (16.1%) in Europe and from Brazil (24.3%) and Mexico (6.6%) in Latin America. Sovereign risk increased with respect to 2010 year-end mainlytransaction classified as impaired, irrespective of whether, as a result of the forbearance, the transaction becomes current in its payments, does not change the default date considered when the provision was determined. Also, the forbearance of a transaction classified as impaired does not give rise to any release of the related provisions.
| 5 | Bank of Spain Circular 6/2012: the refinancing or restructuring of transactions that are not current in their payments does not interrupt their arrears, nor does it give rise to their reclassification to one of the previous categories, unless there is reasonable certainty that the customer will be able to meet its payment obligations within the established time frame or new effective collateral is provided, and, in both cases, unless at least the ordinary outstanding interest is received, late-payment interest is not taken into account. |
Quantitative information required by Bank of Spain Circular 6/2012
Set forth below is the quantitative information required by Bank of Spain Circular 6/2012 on the restructured/refinanced transactions in sovereign risk exposuresforce at December 31, 2013. The following terms are used in Bank of Spain Circular 6/2012 with the meanings specified:
CURRENT REFINANCING AND RESTRUCTURING BALANCES (a)
| Millions of euros | ||||||||||||||||||||||||||||||||||||||||||||||||||||||||||||||||||||||||||||||||||||||||||||
| Standard (b) | Substandard | Impaired | Total | |||||||||||||||||||||||||||||||||||||||||||||||||||||||||||||||||||||||||||||||||||||||||
| Full property mortgage guarantee | Other collateral (c) | Without collateral | Full property mortgage guarantee | Other collateral (c) | Without collateral | Specific allowance | Full property mortgage guarantee | Other collateral (c) | Without collateral | Specific allowance | ||||||||||||||||||||||||||||||||||||||||||||||||||||||||||||||||||||||||||||||||||
| Number of trans- actions | Gross amount | Number of trans- actions | Gross amount | Number of trans- actions | Gross amount | Number of trans- actions | Gross amount | Number of trans- actions | Gross amount | Number of trans- actions | Gross amount | Number of trans- actions | Gross amount | Number of trans- actions | Gross amount | Number of trans- actions | Gross amount | Number of trans- actions | Gross amount | Specific allowance | ||||||||||||||||||||||||||||||||||||||||||||||||||||||||||||||||||||||||
Public sector | — | — | 7 | 203 | 140 | 391 | — | — | — | — | 5 | 1 | — | 1 | 1 | — | — | 20 | 30 | 7 | 173 | 626 | 7 | |||||||||||||||||||||||||||||||||||||||||||||||||||||||||||||||||||||
Other legal entities and individual entrepreneurs | 7,568 | 3,602 | 3,370 | 1,134 | 61,874 | 3,866 | 8,624 | 4,157 | 827 | 775 | 35,955 | 1,803 | 1,213 | 11,231 | 8,690 | 3,040 | 2,085 | 88,486 | 5,316 | 7,731 | 220,975 | 31,430 | 8,944 | |||||||||||||||||||||||||||||||||||||||||||||||||||||||||||||||||||||
Of which: Financing for construction and property development | 247 | 638 | 41 | 20 | 176 | 19 | 1,674 | 1,327 | 105 | 241 | 816 | 158 | 638 | 3,786 | 4,891 | 103 | 792 | 961 | 1,072 | 3,466 | 7,909 | 9,158 | 4,104 | |||||||||||||||||||||||||||||||||||||||||||||||||||||||||||||||||||||
Other individuals | 66,480 | 5,592 | 11,784 | 513 | 472,908 | 1,389 | 51,344 | 5,139 | 7,207 | 350 | 302,697 | 1,045 | 562 | 46,539 | 4,607 | 23,056 | 742 | 985,793 | 2,170 | 2,334 | 1,967,808 | 21,546 | 2,896 | |||||||||||||||||||||||||||||||||||||||||||||||||||||||||||||||||||||
|
|
|
|
|
|
|
|
|
|
|
|
|
|
|
|
|
|
|
|
|
|
|
|
|
|
|
|
|
|
|
|
|
|
|
|
|
|
|
|
|
|
|
|
|
| |||||||||||||||||||||||||||||||||||||||||||||||
Total | 74,048 | 9,194 | 15,161 | 1,850 | 534,922 | 5,646 | 59,968 | 9,296 | 8,034 | 1,125 | 338,657 | 2,849 | 1,775 | 57,771 | 13,298 | 26,096 | 2,827 | 1,074,299 | 7,516 | 10,072 | 2,188,956 | 53,602 | 11,847 | |||||||||||||||||||||||||||||||||||||||||||||||||||||||||||||||||||||
|
|
|
|
|
|
|
|
|
|
|
|
|
|
|
|
|
|
|
|
|
|
|
|
|
|
|
|
|
|
|
|
|
|
|
|
|
|
|
|
|
|
|
|
|
| |||||||||||||||||||||||||||||||||||||||||||||||
| (a) | Including all refinanced or restructured transactions as defined in section 1.g) of Annex IX of Bank of Spain Circular 4/2004 |
| (b) | Standard risks classified as under special monitoring pursuant to section 7.a) of Annex IX of Bank of Spain Circular 4/2004 |
| (c) | Including transactions without a full property mortgage guarantee, i.e. with a loan-to-value ratio of more than 1, and transactions with collateral other than a real estate mortgage, irrespective of their loan-to-value ratio |
The transactions presented in the foregoing tables were classified at December 31, 2013, by nature, as follows:
The table below shows the changes in 2013 in the forborne loan portfolio:
| Millions of euros | 2013 | |||
Beginning balance | 55,714 | |||
Of which: Other than impaired | 37,497 | |||
Impaired assets | 18,217 | |||
Additions | 17,241 | |||
Reductions (*) | (19,353 | ) | ||
Balance at end of year | 53,602 | |||
Of which: Other than impaired | 29,961 | |||
Impaired assets | 23,641 | |||
| (*) | Including, mainly, debt repayments, foreclosures and write-offs and transactions that have ceased to be subject to special monitoring because the aforementioned requirements have been met. |
The level of forbearance at the Group fell by 3.8% year-on-year as a result of the exposuresrecovery effort, the exchange rate effect and the deleveraging of Bank Zachodni WBK S.A. (concentratedthe real estate industry in Poland) inSpain. The specific allowance of the scopetotal forborne loan portfolio increased by 5 percentage points to 22%.
56% of consolidation, which were partially offsetthe forborne loan transactions are classified as other than impaired. Particularly noteworthy is the high level of existing guarantees (70% of transactions are secured by collateral) and the reductionadequate coverage provided by specific allowances (43% specific coverage ratio for the impaired portfolio).
Spain accounts for 60% (EUR 32,271 million) of exposures to the United Kingdom and Switzerland.
F-213
Group’s forborne loan portfolio, down EUR 596 million year-on-year. The detail of Santander Group’s total risk exposure to the so-called peripheral countries of the euro zone at December 31, 2011, distinguishing, based on the country of the issuer or borrower, between sovereign risk and private sector exposure,forborne loan portfolio by purpose is as follows:
Sovereign risk by country of issuer/borrower (**) | ||||||||||||||||||||||||||||||||||||||||
| Millions of euros | ||||||||||||||||||||||||||||||||||||||||
| Debt instruments (Note 7) | Derivatives | |||||||||||||||||||||||||||||||||||||||
| Balances with central banks | Financial assets held for trading and Other financial assets at fair value through profit or loss | Available- for-sale financial assets | Loans and receivables | Loans and advances to customers (Note 10) (*) | Direct exposure | Indirect exposure (CDSs) | Total on- balance- sheet exposure | Contingent liabilities and commitments (Note 35) | Total exposure | |||||||||||||||||||||||||||||||
Spain | 4,841 | 8,060 | 29,975 | 1,274 | 12,147 | 225 | — | 56,522 | 2,848 | 59,370 | ||||||||||||||||||||||||||||||
Portugal | 1,359 | 83 | 1,741 | — | 847 | 846 | — | 4,876 | 272 | 5,148 | ||||||||||||||||||||||||||||||
Italy | 9 | 406 | 247 | — | — | 15 | (15 | ) | 662 | — | 662 | |||||||||||||||||||||||||||||
Greece | — | — | 84 | — | — | — | — | 84 | — | 84 | ||||||||||||||||||||||||||||||
Ireland | — | — | — | — | — | 139 | — | 139 | — | 139 | ||||||||||||||||||||||||||||||
Private sector exposure by country of issuer/borrower (**) | ||||||||||||||||||||||||||||||||||||||||
| Millions of euros | ||||||||||||||||||||||||||||||||||||||||
| Debt instruments (Note 7) | Derivatives | |||||||||||||||||||||||||||||||||||||||
| Loans and advances to credit institutions (Note 6) | Financial assets held for trading and Other financial assets at fair value through profit or loss | Available- for-sale financial assets | Loans and receivables | Loans and advances to customers (Note 10) (*) | Direct exposure | Indirect exposure (CDSs) | Total on- balance- sheet exposure | Contingent liabilities and commitments (Note 35) | Total exposure | |||||||||||||||||||||||||||||||
Spain | 5,547 | 2,069 | 5,385 | 955 | 202,411 | 3,226 | (46 | ) | 219,547 | 63,025 | 282,572 | |||||||||||||||||||||||||||||
Portugal | — | 862 | 907 | 1,935 | 23,337 | 468 | (8 | ) | 27,501 | 7,706 | 35,207 | |||||||||||||||||||||||||||||
Italy | — | 359 | 88 | 98 | 11,705 | (308 | ) | (4 | ) | 11,938 | 3,402 | 15,340 | ||||||||||||||||||||||||||||
Greece | — | — | — | — | 170 | 64 | — | 234 | 138 | 372 | ||||||||||||||||||||||||||||||
Ireland | — | 211 | 281 | 150 | 491 | 286 | — | 1,419 | 110 | 1,529 | ||||||||||||||||||||||||||||||
F-214
Following is certain information on the notional amount
Millions of euros | ||||||||||||||||||||||||||
| Notional amount | Fair value | |||||||||||||||||||||||||
| Bought | Sold | Net | Bought | Sold | Net | |||||||||||||||||||||
Spain | Sovereign | — | — | — | — | — | — | |||||||||||||||||||
Private | 3,288 | 4,122 | (834 | ) | 96 | (142 | ) | (46 | ) | |||||||||||||||||
Portugal | Sovereign | 211 | 211 | — | 60 | (60 | ) | — | ||||||||||||||||||
Private | 409 | 448 | (39 | ) | 93 | (101 | ) | (8 | ) | |||||||||||||||||
Italy | Sovereign | 429 | 614 | (185 | ) | 46 | (61 | ) | (15 | ) | ||||||||||||||||
Private | 1,106 | 1,129 | (23 | ) | 114 | (118 | ) | (4 | ) | |||||||||||||||||
Greece | Sovereign | 223 | 223 | — | 158 | (158 | ) | — | ||||||||||||||||||
Private | 54 | 44 | 10 | 9 | (9 | ) | — | |||||||||||||||||||
Ireland | Sovereign | 9 | 9 | — | 1 | (1 | ) | — | ||||||||||||||||||
Private | 60 | 60 | — | 5 | (5 | ) | — | |||||||||||||||||||
As regards Latin America as a whole, the sovereign risk exposure arose mainly from Santander subsidiary banks’ obligations
In none of the issuer country totalled EUR 2,462 million, which accounts for 3.5% of the total sovereign risk exposure to Latin American issuers.
E. Environmental risk
The environmental risk analysis of credit transactions is one of the main features of the strategic corporate social responsibility plan. The analysis is founded on two major cornerstones:
The Equator Principles: an initiative of the International Finance Corporation of the World Bank. These principles constitute an international standard for the analysis of the social and environmental implications of project finance transactions. The adoption of these principles involves the commitment to assess, using a sequential methodology, the social and environmental risks of the projects financed:
For transactions amounting to USD 10 million or more, an initial general questionnaire is completed, designed to establish the social and environmental risks of the project (which is classified, from higher to lower risk, into category A, B or C, respectively) and the degree of compliance of the transaction with the Equator Principles.
For projects classified into the highest-risk categories (categories A and B), a more exhaustive questionnaire is completed, which is adapted according to the business sector involved.
Depending on the category and location of the projects, a social and environmental audit is conducted (by independent external advisers). To this end, specific questionnaires have been developed for the sectorsother geographical regions in which the BankGroup is most active. Furthermore,present does the Bank organises social and environmental training courses for both its risk management teams and the heads of its business units.
The VIDA tool: implemented since 2004, the main aim of this tool is to assess the environmental risk of both current and potential customer companies, using a system that classifies eachforborne loan portfolio represent more than 1% of the companies into one of seven categories, depending on the degree of environmental risk incurred.
F-215
4.6. MARKET RISK
4.16.1 Activities subject to market risk and types of market risk
The measurement, control and monitoring of the market risk area comprises all operationsfinancial activities in which net worth risk is assumed.assumed as a result of changes in market factors. This risk arises from changes in the risk factors -interest rates, inflation rates, exchange rates, equity prices, credit spreads, commodity prices and the volatility thereof- and from the liquidity risk of the various products and markets in which the Group operates.
All these market risks can be mitigated in part or in full through the use of derivatives such as options, futures, forwards and swaps.
In addition, there are other market risks, which are more difficult to hedge, the detail being as follows:
The activities are segmented by risk type as follows:
| a) |
| b) |
| • | Structural foreign currency risk/hedges of results: |
Structural equities risk: this item includes equity investments in non-consolidated financial and non-financial companies that give rise to equities risk.and available-for-sale portfolios comprising equity positions.
The Treasury area is responsibleGlobal Banking and Markets division carries the main responsibility for managing the positions taken in the trading activity.business in order to develop customer business in financial markets and, secondly, to a lesser extent, to take own-account positions.
The Financial Management areafinancial management division is responsible for managingexecuting the balance sheetstructural risk management risk and structural risks centrallystrategy through the application of uniform methodologies adapted to the situation of each market in which the Group operates. Thus,operates, either directly through the Parent or in the convertible currencies area, financial management directly manages the Parent’s risks and coordinates the management ofcoordination with the other units operating in these currencies.units. Decisions affecting the management of these risks are taken through the ALCO committees in the respective countries and, ultimately, byin coordination with the Parent’sGroup’s markets committee.
The aim pursued by financial management is to ensure the stability and recurring nature of both the net interest margin of the commercial activity and the Group’s economic value, whilst maintaining adequate liquidity and solvency levels.
Each of these activities is measured and analyzed using different toolsmetrics in order to reflect their risk profiles as accurately as possible.
4.26.2. Market risks in 2013
6.2.1 Trading
In 2013 the Group maintained its strategy of focusing its trading activity on the customer business and minimizing as far as possible the outstanding directional risk exposures in net terms. This was reflected in the VaR, which performed in line with the average of the last three years.
The derivative activity is focused mainly on marketing investment products and hedging risk for customers. Management is geared towards ensuring that the net outstanding risk is as low as possible.
This type of transaction includes equity, fixed-income and foreign currency options. The management units in which this activity was carried out are primarily Spain, Santander UK and, to a lesser extent, Brazil and Mexico.
The Group continued to have very limited exposure to complex structured instruments or vehicles, as a reflection of its culture of management in which prudence in risk management constitutes one of its principal symbols of identity. Specifically, at 2013 year-end, the Group had:
| • | CDOs and CLOs: the Group’s position continued to be scantly material, at EUR 194 million. This position is largely a result of the integration of the Alliance&Leicester portfolio in 2008. |
| • | Hedge funds: the total exposure was not material (EUR 317 million at December 31, 2013) and consisted largely of the financing provided to these funds (EUR 136 million), the remainder being through direct portfolio investment or derivatives with the hedge funds. This exposure featured low loan-to-value ratios, at around 25% (collateral of EUR 1,260 million at the end of December). The risk exposure to this type of counterparty is analyzed on a case-by-case basis, and the percentages of collateral are established according to the features and assets of each fund. |
| • | Conduits: there was no exposure. |
| • | Monolines: Santander Group’s exposure to monoline insurers amounted to EUR 141 million in December 2013(6)), and was concentrated mainly on an indirect exposure amounting to EUR 138 million, by virtue of the guarantee provided by entities of this kind for various traditional financing or securitization transactions. The exposure was to double-default risk in this case. The primary underlyings had high credit ratings. The small remainder was direct exposure (e.g. through the purchase of a credit default swap to protect it against the risk of default of these insurance companies). Exposure decreased by 7% with respect to 2012. |
In short, it can be affirmed that, in general, the exposure to instruments of this kind in the ordinary course of the Group’s business continued to decrease in 2013. It is due mainly to the integration of exposures at entities acquired by the Group, such as Alliance&Leicester and Sovereign (in 2008 and 2009, respectively). All these exposures were known at the time of the purchase and adequate provisions were recognized. Since their integration in the Group these exposures have been reduced notably, the final objective being their derecognition.
| 6 | The guarantees provided by monoline insurers in US Municipal Bonds are not treated as exposure. These bonds amounted to EUR 566 million at December 2013. |
The Group’s policy with respect to the approval of new transactions involving these products continues to be very prudent and conservative and is subject to strict supervision by the Group’s senior management. Before authorizing a new transaction, product or underlying, the risk division checks:
Provided the two aforementioned conditions are met, the risk division ascertains:
Calibration and test measures
In 2013 the Group continued to perform regular analyses and tests to check the accuracy of the value-at-risk (VaR) calculation model, and drew conclusions which enabled it to verify the reliability of the model. The objective of these tests is to determine whether it is possible to accept or reject the model used to estimate the maximum loss of a portfolio for a given confidence level and time horizon.
The most important tests are the backtesting exercises, which are analyzed at local and global level by the market risk control units. The backtesting methodology is applied homogenously to all the Group’s portfolios and sub-portfolios.
The backtesting exercise consists of comparing the projected VaR measurements, for a given confidence level and time horizon, with the actual losses obtained in the same time horizon.
Three types of backtesting are calculated and assessed at the Group:
In the first case, for the entire portfolio, in 2013 there were two violations of VaR at 99% (i.e. days when the daily loss was higher than VaR): on May 31, mainly in Brazil, due to the sharper-than-normal increase in the Brazilian real curves, both the nominal curve and the curve indexed to inflation (IPCA); and on July 11, mainly in Spain, due to sharper-than-normal changes in curves and their volatility, and in Brazil, due to a significant appreciation of the Brazilian real against the dollar.
The number of violations is in line with the expected performance of the VaR calculation model, given that a confidence level of 99% and a time horizon of one year are used (with a longer time horizon one could expect an average of two or three violations a year).
The backtesting exercises are carried out regularly for each significant portfolio or strategy of each Group trading unit, and their main objective (as in the case of the other benchmark tests) is to detect anomalies in the VaR model of each portfolio in question (e.g. deficiencies in the parameterization of the valuation models of certain instruments, scantly adequate proxies, etc.). This is a dynamic process in the context of the procedure to review and validate the model.
6.2.2 Structural market risks(7)
6.2.2.1 Structural interest rate risk
Europe and the United States
In these mature markets which are witnessing a scenario of low interest rates, the general positioning has been to maintain balance sheets with a positive sensitivity to short-term interest rate rises in terms of the net interest margin (NIM). In the case of the market value of equity (MVE), the risk is determined by the long-term interest rate expectations in each market, based on their economic performance indicators.
In any case, the level of exposure in all countries is very low in relation to the annual budget and the amount of capital. Also, in 2013 the general trend was for exposure to remain unchanged or decrease.
At the end of December 2013, the sensitivity of the net interest margin at one year to parallel shifts of 100 basis points was concentrated on the euro, US dollar and pound sterling yield curves, the Parent bank, the US subsidiary and Santander UK being the main contributors with EUR 111 million, USD 54 million and GBP 39 million, respectively. The sensitivity of the margin for other convertible currencies was scantly material.
Also at 2012 year-end, the most significant sensitivity of the market value of equity to parallel shifts of 100 basis points (EUR 1,478 million at the Parent bank) was that of the euro yield curve. With respect to the US dollar and pound sterling curves, the sensitivities were USD 285 million and GBP 16 million, respectively.
Latin America
Due to the differences in macroeconomic context and the degree of maturity of these markets, the positions with respect to the net interest margin (NIM) were not homogenous. Accordingly, in certain geographical areas the balance sheets were positioned for rising interest rates and in others they were positioned for falling rates.
In relation to the sensitivity of the market value of equity (MVE), the general positioning of the balance sheets was such that the average term of the assets exceeded that of the liabilities (negative sensitivity to interest rate rises).
The risk in the main geographical areas was reduced or maintained in 2013. In any case, the level of exposure in all countries is very low in relation to the annual budget and the amount of capital.
For Latin America taken as a whole, the risk consumption at December 2013, measured in terms of 100 basis points. sensitivity of the net interest margin(8), stood at EUR 103 million (December 2012: EUR 89 million).
6.2.2.1 VaR of on-balance-sheet structural interest rate risk
In addition to sensitivities to interest rate fluctuations (it assess changes of +/- 25, +/- 50, +/- 75 and +/- 100 basis points.), the Group uses other methods to monitor on-balance-sheet structural interest rate risk including, inter alia, scenario analysis and VaR calculations, using a methodology similar to that used for financial assets held for trading.
Structural interest rate risk, measured in terms of one-day VaR at 99%, averaged EUR 782 million in 2013. The contribution to structural interest rate risk by the balance sheets in Europe and the US is considerably higher than the balance sheets in Latin America. Worthy of note are the large difference between the two areas and the increased volatility in the emerging countries at 2013 year-end.
| (7) | Includes the total balance sheet, except for financial assets and liabilities held for trading |
| (8) | Betas are used to aggregate sensitivities of various curves. |
6.2.2.2 Structural foreign currency risk/hedges of results
Structural foreign currency risk arises from the Group’s operations in foreign currencies, and relates mainly to long-term investments, and the results and hedges of those investments.
Foreign currency risk is managed dynamically in order to limit the impact on capital of currency depreciations and optimize the financial cost of hedges.
The Group’s general policy for managing the foreign currency risk on long-term investments is to finance these investments in the currency in which they are denominated, provided that the market is sufficiently deep and the cost is justified by the expected currency depreciation. Also, hedges are arranged on an as-needed basis when it is considered that a local currency may weaken against the euro more quickly than it is being discounted in the market.
At 2013 year-end, the largest long-term exposures (with their potential impact on equity) were, in descending order, in the pound sterling, the Brazilian real, the US dollar, the Mexican peso, the Chilean peso and the Polish zloty. The Group hedges a portion of these long-term exposures through foreign exchange derivatives.
Additionally, the financial management division at consolidated level is responsible for managing the foreign currency risk inherent in the expected results and dividends of the Group at the units whose base currency is not the euro.
6.2.2.3 Structural equity risk
The Group has equity positions in its balance sheet (banking book) in addition to the trading positions. These positions are classified as available-for-sale financial assets (equity instruments) or as investments, depending on the length of time they are expected to remain in the portfolio.
These positions are exposed to market risk. VaR is calculated for these positions using series of market prices for listed shares and proxies for unlisted securities. At December 31, 2013, one-day VaR at 99% was EUR 235.3 million (December 31, 2012: EUR 281.4 million; December 31, 2011: EUR 305.7 million).
6.2.2.4 On-balance-sheet market risk
In short, a homogeneous metric such as VaR can be used to monitor the total market risk inherent in the balance sheet (banking book), distinguishing between fixed-income (considering both interest rates and credit spreads for ALCO portfolios), exchange rate and equities.
In general, it can be said that total on-balance-sheet VaR is not high in terms of the Group’s volume of assets or capital. In recent years it has shown a downward trend due to the decrease in foreign currency risk and structural equities risk.
6.3 Methodologies
A.6.3.1 Trading
The standard methodology applied to trading activities by Santanderthe Group in 20112013 was Value at Risk (VaR), which measures the maximum expected loss with a given confidence level and time horizon. This methodology was based on a standard historical simulation with a 99% confidence level and a one-day time horizon. Statistical adjustments were made to enable the swift and efficient incorporation of the most recent events that condition the level of risk assumed. Specifically, the Group uses a time window of two2 years or 520 daily data obtained retrospectively from the reference date of the VaR calculation1.calculation. Two figures are calculated each day, one by applying an exponential decline factor which gives a lesser weighting to more distant observations in time, and another with uniform weightings for all observations. The VaR reported is the higher of these two figures.
The historical simulation VaR has many advantages as a risk metric (it summarizes in one single number a portfolio’s market risk, it is based on market changes that have actually occurred without having to make assumptions regarding functions or correlation between market factors, etc.), but it also has limitations. The most significant limitations are the high sensitivity of the historical window used, the inability to capture plausible events with a major impact if they do not occur in the historical window used, the existence of measurement parameters in which there is no market input available (such as correlations, dividends and recovery rates) and the slow adaptation to new volatilities and correlations if the most recent data are given the same weight as the oldest data.
Certain of these limitations are corrected by using stressed VaR (see below), by calculating a VaR with exponential decline and by applying conservative valuation adjustments.
F-216
VaR is not the only measure. It is used because it is easy to calculate and because it provides a good reference of the level of risk incurred by the Group. However, other measures are simultaneously being taken to enable the Group to exercise greater risk control in all the markets in which it operates.
One of these measures is scenario analysis, which consists of defining behaviourbehavior scenarios for various financial variables and determining the impact on results of applying them to the Group’s activities. These scenarios can replicate past events (such as crises) or, conversely, determine plausible scenarios that are unrelated to past events.
On a regular basis (at least once a month) the Group calculates and analyses the potential impact on results of applying different stress scenarios to all the trading portfolios, considering the same situations by risk factor. A minimum of three types of scenarios are defined (plausible,(possible, severe and extreme) are defined which, together with VaR, make it possible to obtain a much more complete spectrum of the risk profile.
Also,In addition, certain warning triggers are in place for the global scenarios, based on the historical results of those scenarios and on the capital associated with the portfolio in question. If the levels triggering the warning are surpassed, the persons responsible for managing the portfolio in question are informed so that they can take the appropriate measures. Furthermore, the results of the global stress tests, and any possible excesses over the warning levels set, are reviewed regularly by the global market risks committee, which, if it considers it necessary, informs senior management.
The market risk area, in accordance with the principle of independence of the business units, also monitors daily the positions of each unit and the global positions, through an exhaustive control of changes in the portfolios, the aim being to detect possible incidents and correct them immediately.
The positions are traditionally used to quantify the net volume of the market values of the portfolio transactions, grouped by main risk factor, considering the delta value of any futures and options that might exist. All the risk positions can be expressed in the base currency of the unit and in the reporting currency.
Market risk sensitivity measures are those which measure the changes (sensitivity) of the market value of an instrument or portfolio to changes in each of the risk factors. The sensitivity of the value of an instrument to changes in market factors can be obtained through analytical estimates using partial derivatives or through a complete revaluation of the portfolio.
Also, the daily preparation of an income statement is an excellent risk indicator, insofar as it allows us to identify the impact of changes in financial variables on the portfolios.
Lastly,Particularly worthy of note is the control of derivatives and credit management activities which, due to their atypical nature, derivatives and credit management activities are controlledis performed daily using specific measures. In the case of derivatives, a control is conducted of sensitivities to fluctuations in the price of the underlying (delta and gamma), in volatility (vega) and in time (theta). For credit management activities, measures such as sensitivity to spread, jump-to-default and risk concentrations by rating level are reviewed systematically.
With respect to the credit risk inherent in the trading portfolios, and in keeping with the recommendations made by the Basel Committee on Banking Supervision and with current regulations, an additional metric, the incremental risk charge (IRC), is calculated to cover the default risk and rating migration risk not properly captured in the VaR, by measuring the variation in the related credit spreads. The instruments subject to control are basically fixed-income government and corporate bonds, derivatives on bonds (forwards, options, etc.) and credit derivatives (credit default swaps, asset-backed securities, etc.). The method used to calculate the IRC is based on direct measurements on the loss distribution tails at the appropriate percentile (99.9%). over a one-year time horizon. The Monte Carlo method is used and one million simulations are applied.
B. Balance sheet management
6.3.2 Structural market risks 6.3.2.1 Structural interest rate riskInterest
The Group analyses the sensitivity of the net interest margin and market value of equity to changes in interest rates. This sensitivity arises from maturity and interest rate repricing gaps in the various balance sheet items.
On the basis of the balance-sheet interest rate position, and considering the market situation and outlook, the necessary financial measures are adopted to align this position with that desired by the Bank.Group. These measures can range from the taking of positions on markets to the definition of the interest rate features of commercial products.
The metrics used by the Group to control interest rate risk in these activities are the interest rate gap, the sensitivity of net interest margin and market value of equity to changes in interest rates, the duration of capital and value at risk (VaR) and scenario analysis.in order to calculate economic capital.
a) Interest rate gap of assets and liabilities
The interest rate gap analysis focuses on the mismatches between the interest reset periods of on-balance-sheet assets and liabilities and of off-balance-sheet items. This analysis facilitates a basic snapshot of the balance sheet structure and enables concentrations of interest rate risk in the various repricing bucketsmaturities to be detected. Additionally, it is a useful tool for estimating the possible impact of potential changes in interest rates on the Group’s net interest margin and market value of equity.
F-217
The flows of all the on- and off-balance-sheet aggregates must be broken down and placed at the point of repricing or maturity. The duration and sensitivity of aggregates that do not have a contractual maturity date are analyzed and estimated using an internal model.
b) Net interest margin (NIM) sensitivity
The sensitivity of the net interest margin measures the change in the expected net interest income for a specific period (twelve months) given a shift in the yield curve.
The sensitivity of the net interest margin is calculated by simulating the margin both for a scenario of changes in the yield curve and for the current scenario, the sensitivity being the difference between the two margins so calculated.
c) Market value of equity (MVE) sensitivity
The sensitivity of the market value of equity is a complementary measure to the sensitivity of the net interest margin.
This sensitivity measures the interest rate risk implicit in the market value of equity based on the effect of changes in interest rates on the present values of financial assets and liabilities.
d) Value at risk (VaR)
The value at risk for balance sheet aggregates and investment portfolios is calculated by applying the same standard as that used for trading: historical simulation with a confidence level of 99% and a one-day time horizon. As for the trading portfolios, the Group uses a time window of two years or 520 daily data obtained retrospectively from the reference date of the VaR calculation.
e) Scenario analysis
Two interest rate performance scenarios are established: maximum volatility and sudden crisis. These scenarios are applied to the activities under analysis, thus obtaining the impact on the market value of equity and the net interest margin projections for the year.
Liquidity risk
Liquidity risk is associated with the Group’s ability to fund its commitments at reasonable market prices and to carry out its business plans with stable sources of funding. The Group permanently monitors maximum gap profiles.
The measures used to control liquidity risk in balance sheet management are the liquidity gap, liquidity ratios, stress scenarios and contingency plans.
a) Liquidity gap
The liquidity gap provides information on contractual and expected cash inflows and outflows for a given period for each currency in which the Group operates. The gap measures net cash requirements or surpluses at a given date and reflects the liquidity level maintained under normal market conditions.
The Group conducts two types of liquidity gap analyses, depending on the balance sheet item in question:
1.- Contractual liquidity gap: all cash-flow generating on- and off-balance-sheet items are analyzed and placed at the point of contractual maturity. For assets and liabilities without contractual maturities, an internal analysis model is used based on a statistical study of the time series of the products, and the so-called stable or unstable balance for liquidity purposes is determined.
F-218
2.- Operational liquidity gap: this is a scenario for normal liquidity profile conditions, since the cash flows of the on-balance-sheet items are placed at the point of probable liquidity rather than at the point of contractual maturity. In this analysis, the definition of the behaviour scenario (renewal of liabilities, discounts in portfolio disposals, renewal of assets, etc.) is the fundamental point.
b) Liquidity ratios
The liquidity ratio compares liquid assets available for sale or transfer (after the relevant discounts and adjustments have been applied) with the total amount of liabilities (including contingencies). This ratio shows, by non-consolidable currency, the Group’s capacity to immediately respond to its commitments.
Cumulative net liquidity is defined as the 30-day cumulative gap obtained from the modified liquidity gap. The modified contractual liquidity gap is calculated on the basis of the contractual liquidity gap, and places liquid assets at the point of settlement or transfer rather than at the point of maturity. This indicator is calculated for each of the significant currencies.
Additionally, other ratios or metrics relating to the structural liquidity position are used:
Loans to net assets
Customer deposits, insurance and medium-/long-term financing to loans
Customer deposits, insurance and medium-/long-term financing, equity and other liabilities to total loans and fixed assets
Short-term funding to net liabilities
Survival horizon
c) Scenario analysis/ Contingency plan
Santander Group’s liquidity management focuses on adopting all the measures required to prevent a crisis. It is not always possible to predict the causes of a liquidity crisis and, therefore, contingency plans focus on the modelling of potential crises by analysing various scenarios, the identification of crisis types, internal and external communications, and individual responsibilities.
The contingency plan spans management activity from local unit to head office level. At the first sign of a crisis, it specifies clear lines of communication and suggests a wide range of responses to different levels of crisis.
Since a crisis can occur locally or globally, each local unit must prepare a contingency funding plan. Each local unit must inform headquarters of its contingency plan at least every six months so that it can be reviewed and updated. However, these plans must be updated more frequently if market conditions make this advisable.
Lastly, Santander Group continues to be actively involved in the process initiated by the Basel Committee and other international bodies to strengthen the liquidity of financial institutions2, through two channels: on the one hand, by participating in the calibration of the proposed regulatory changes -basically the introduction of two new ratios: the Liquidity Coverage Ratio (LCR) and the Net Stable Funding Ratio (NSFR)- and, on the other, by being present at the various forums created to discuss and make suggestions on the issue (the European Banking Federation, etc.), in both cases in close cooperation with the Bank of Spain.
C.6.3.2.2 Structural foreign currency risk / Hedgeshedges of results / Structural equities risk
These activities are monitored by measuring positions, VaR and results.results on a daily basis.
6.3.2.3 Structural equity risk
These activities are monitored by measuring positions, VaR and results on a monthly basis.
6.4 Management framework
Organizational and governance structure
The market and structural risk area forms part of one of the two Group risk units. The tasks of the market risk function are as follows:
These tasks are based on five basic pillars that are crucial for a correct market risk management:
F-219
D. Complementary measures
Market risk management is in turn guided by the Also, in the CalibrationMeasurement, analysis and test measuresBack-testing consistscontrol of performing a comparativemarket and liquidity risk.Calculation, analysis, between VaR estimatesexplanation and daily clean results (i.e. profit or loss generatedreconciliation of results.Definition, capture, validation and distribution of market data.Approval of limits, products and underlyings.Consolidation of data.portfolios at the endfollowing basic principles:Involvement of senior management.Independence of the preceding day valued at following-day prices). The aim of these tests is to verify and provide a measure of the accuracy of the models used to calculate VaR.Back-testing analyses performed at Santander Group comply, at the very least, with the BIS recommendations regarding the verification of the internal systems used to measure and manage financial risks. Additionally, Santander Group also conducts hypothesis tests: excess tests, normality tests, Spearman’s rank correlation, average excess measures, etc.The assessment models are regularly calibrated and tested by a specialised unit. Apartrisk function from the regular calibrationbusiness.Clear definition of powers.Risk measurement.Risk limitation.Analysis and control of risk positions.Establishment of risk policies and procedures.Assessment of risk methodologies validated or developed by the VaR methodology no significant changes were made during the reporting periods or are expected to be madearea.future.same way as the market risk function is structured at corporate or global level, each local market risk unit adapts its functions to its specific business, operational and legal requirement characteristics.Scenario analysisOn a regular basis (at least once a month)For the Group calculatescorrect functioning of global policies and analyses the potential impact on results of applying different stress scenarios to all the trading portfolios, considering the same situations by risk factor.In addition, certain warning triggers are in place for the global scenarios, based on the historical results of those scenarios and on the capital associated with the portfolio in question. If the levels triggering the warning are surpassed, the persons responsible for managing the portfolio in question are informed so that they can take the appropriate measures. Furthermore, the results of the global stress tests, and any possible excesses over the warning levels set, are reviewed regularly bytheir local implementation, the global market risks committee, which, if it considers it necessary, informs seniorrisk area and the local units perform different functions:Global market risk area:Establishes, proposes and documents the risk policies and criteria, the global limits and the decision-making and control processes.Generates management structures, systems and tools.Promotes and supports their implementation and ensures they work effectively at all units.Gains knowledge of, assimilates and adapts the best practices inside and outside the Group.Boosts activity in order to obtain results.Consolidates, analyses and controls the market risk incurred by all units the area is responsible for.Local market risk units:Manage risks.
Coordination with other areas
Joint efforts are made daily with other areas to mitigate operational risk. This coordination work comprises mainlyMeasure, analyze and control market risk within the reconciliationscope of positions, risks and results.
4.3. Control system
A. Limit settingtheir responsibilities.
The limit setting process is performed together with the budgeting activity andmarket risk area’s exclusive collective body is the tool usedglobal market risk committee (CGRM).
The CGRM is the body responsible for the Group’s market risk function at both centralized level (global area) and local level (local units). The CGRM reports directly to establish the assetsrisk committee, the body ultimately responsible for the risk function at the Group.
Limit control system.
Market and liabilities of each business activity. Limitliquidity risk limit setting is a dynamic process that respondsdepends on the Group’s risk appetite level. This process forms part of the annual limits plan, which is promoted by the Group’s senior management and is led by the risk unit and, therefore, it involves all the entities comprising the Group.
1. Limit setting
The market risk limits applied at the Group are set on the basis of different metrics and seek to cover all activities subject to market risk from multiple perspectives, by applying conservative criteria. The main limits are:
Trading limits:
On-balance-sheet structural interest rate risk
Structural foreign currency risk
These general limits are complemented by other sub-limits. Accordingly, the market risk area has a sufficiently granular limit structure to effectively control the various market risk factors to which the Group is exposed. Thus, it monitors daily the positions of each unit and the global positions, through an exhaustive control of changes in the portfolios, the aim being to detect possible incidents and correct them immediately. Also, the daily preparation of an income statement by the market risk area is an excellent risk indicator, insofar as it allows us to identify the impact of changes in financial variables on the portfolios.
2. Limit structure
The risk committee approves limits at business/unit level in an annual limit setting process. Changes that are subsequently requested may be approved by the global market risk committee, in accordance with its delegated powers.
These limits are requested by the head of business in each country/entity on the basis of the specific nature of the business and upon the achievement of the budget set, seeking consistency between the limits and the risk-return ratio.
Sub-limits to the level of risk appetite considered acceptable by senior management.
B. Objectivesaforementioned activities are set on the basis of the limits structureparticular local characteristics of the products and of the internal organization of the business, in order to increase the control of the positions held in each business. Sub-limits are set by risk factor, currency position, equity position, sensitivity by currency and maturity, vega by maturity, etc.
3. Limit compliance and control
The business units must comply with the approved limits structure requiresat all times. Any possible excesses would trigger a process to be performed that pursues, inter alia,series of actions by the following objectives:
To identifylocal and delimit, in an efficient and comprehensive manner, the main types of financialglobal market risk incurred, so that they are consistent with business management and the defined strategy.
To quantify and communicate to the business areas, the risk management committees or the risk committee aimed at leading to reductions in risk levels and profile deemed acceptable by senior management so asa stricter risk control or executive actions which could oblige the risk takers to avoid undesired risks.
To give flexibility toreduce the business areas for the efficient and timely assumption of financial risks, depending on market changes, and for the implementation of the business strategies, provided that the acceptable levels of risk areassumed.
The persons responsible for market risk at local level notify the heads of business of excesses. The heads of business must explain the reasons for the excess and, where appropriate, provide an action plan to remedy the situation. The business unit must reply, in writing and on the same day, to the requirement made of it to either reduce the position to within the limits in force or to detail a strategy that justifies an increase in the limits.
6.5 Internal model
At 2013 year-end, the Group had obtained the Bank of Spain’s approval for the internal market risk model for the calculation of regulatory capital in the trading portfolios of the Spain, Chile, Mexico and Portugal units. The Group intends to gradually extend this approval to its other units.
The consolidated regulatory capital for the Group per the internal market risk model is obtained by adding the regulatory capital of each of the units for which the related approval has been obtained from the Bank of Spain. This criterion for consolidating the Group’s capital is conservative, since it does not exceeded.
F-220
To allow business makers to assume risks which, although prudent, are sufficient to obtain the budgeted results.
To delimit the range of products and underlyings with which each treasury unit can operate, takingtake into account features such as assessment model and systems, liquiditythe savings in capital arising from the diversification effect among the various geographical areas.
Following this approval, the regulatory capital of the instruments involved, etc.
4.4. Riskstrading activities for the above-mentioned scope is calculated using advanced approaches, applying as fundamental metrics VaR, Stressed VaR and resultsthe incremental risk capital charge (IRC) for default risk and rating migration risk, in 2011
A. Tradingkeeping with the new banking capital requirements in the Basel accords and, in particular, in the European CRD IV directive (which transposes the Basel III accord).
The average VaRGroup cooperates closely with the Bank of Spain to make further progress in the scope of application of the internal model (at geographical and operational levels) and in the impact analysis of new requirements, in line with the documents issued by the Basel Committee to strengthen the capital of financial institutions.
7. LIQUIDITY AND FUNDING RISK
7.1 Introduction to the treatment of liquidity and funding risk
Liquidity and funding risk management has always been a basic element of the Group’s market trading operationsbusiness strategy and a fundamental cornerstone, together with capital, on which the strength of its balance sheet rests.
Liquidity has become increasingly important in 2011,recent years due to the growing stresses in the financial markets in the framework of a global economic crisis. This scenario has emphasized the importance of banks having appropriate funding structures and strategies to ensure their intermediation activity.
During this period of stress, the Group has enjoyed an adequate liquidity position, which has represented a competitive advantage in terms of carrying on and expanding its activity in a demanding environment.
This improved position held by the Group as a whole has been based on a decentralized funding model composed by subsidiaries that are autonomous and self-sufficient in terms of liquidity. Each subsidiary is responsible for covering the liquidity needs arising from its current and future activity, by means of either deposits taken from its customers in its area of influence, or through recourse to the wholesale markets where it operates, under management and supervision procedures coordinated at EUR 22.4 million, was lower thanGroup level.
This is a funding structure that for 2010 (EUR 28.7 million), despite the continuing episodesis most effective in situations of high volatilitymarket stress as it prevents difficulties in one area from affecting funding capacity in other areas and, therefore, the Group as a whole, which could occur if a centralized funding model were used.
In addition, at the Group this funding structure also benefits from the advantages of having a commercial banking model with a significant presence (business shares of around 10% or more) in ten markets with great potential, with the focus on retail customers and a high level of efficiency. As a result, the subsidiaries have a considerable capacity to attract stable deposits, as well as a significant issue capacity in the wholesale markets of those countries, generally in their own currencies, which is bolstered by the strength afforded by their franchise and membership of a leading group.
7.2 Liquidity management framework - Monitoring and control of liquidity risk
Structural liquidity management seeks to finance the Group’s recurring business with optimal maturity and cost conditions, avoiding the need to assume undesired liquidity risks.
Liquidity management at the Group is based on the followingprinciples:
In order to ensure the sovereign debt crisiseffective application of these principles by all the Group entities, it was necessary to develop a single management framework resting on the following three cornerstones:
Average VaR fell by EUR 6.3 million with respect to 2010. This reduction occurred across all the risk factors and was concentrated in credit spreads and equities, which fell from EUR 20.9 million to EUR 15.0 million, and from EUR 8.0 million to EUR 4.8 million, respectively.
Calibration and test measures
Pursuant to the recommendations issued by BIS for the calibration and control of the efficiency of internal market risk measurement and management systems, in 2011 the Group regularly performed the required benchmark tests and analyses, and drew conclusions which enabled it to verify the reliability of the model.
In 2011 there were three exceptions to VaR at 99% (i.e. days when the daily loss was higher than VaR): August 4 and August 8, which can be explained mainly by the sharp increase in credit spreads, the sudden fall of the stock markets and the depreciation of most currencies against the dollar due to the worsening of the sovereign debt crisis in the euro zone and to increased fears of a major slowdown in the global economy; and September 12, due to the significant increase in credit spreads, affecting mainly financials and Greece.
B. Balance sheet management3
B1. Interest rate risk
a)Convertible currencies
At the end of December 2011, the sensitivity of the net interest margin at one year to parallel increases of 100 basis points was concentrated on the pound sterling yield curve, Santander UK plc being the main contributor with GBP 191 million. The exposure to the euro yield curve fell substantially with respect to December 2010 (to EUR 96 million), and the sensitivity was mostly concentrated in the consumer loan unit in Germany (EUR 66 million, excluding its subsidiaries in Austria and Belgium). As for the USD yield curve, the largest concentration was in the US subsidiary, with a sensitivity of USD 76 million. The sensitivity of the margin for other convertible currencies was scantly material.
Also at 2010 year-end, the equity value sensitivity to parallel increases of 100 basis points in the euro yield curve was EUR 723 million and was mostly concentrated on the Parent bank, albeit with far lower figures than at December 2010. With respect to the pound sterling curve, the sensitivity was GBP 376 million.
In the current environment of low interest rates, the Bank’s sensitivity to rate increases, in terms of net interest margin and equity value, is positive.
F-221
b)Latin America
The interest rate risk in balance sheet management portfolios in Latin America, measured in terms of sensitivity of the net interest margin (NIM) at one year to a parallel increase of 100 basis points (b.p.) in the yield curve, remained at low levels throughout 2011.
Measured in terms of market value of equity (MVE) sensitivity, interest rate risk fluctuated within a band between EUR 753 million and EUR 1,036 million. From April onwards, sensitivity increased due mainly to the growth in lending and the ALCO portfolio in Brazil, as well as to the rise in fixed-rate loans in Mexico following the inclusion of the loan portfolio acquired from General Electric.
At the end of December 2011, the risk consumption for the region, measured in terms of 100 b.p. sensitivity of the MVE, stood at EUR 957 million (December 2010: EUR 763 million), while the net interest margin risk at one year, measured in terms of 100 b.p. sensitivity, was EUR 79 million (December 2010: EUR 45 million).
B2. Structural credit risk management
The aim of structural credit risk management is to reduce, through the sale of assets, the concentrations that arise naturally as a result of commercial activity. These sales are offset by the acquisition of other assets which permit diversification of the loan portfolio as a whole. The financial management area analyses these strategies and submits management proposals to the ALCO with a view to optimising credit risk exposure and contributing to the creation of value.
During 2011, as part of the Group’s liquidity management:
Assets amounting to more than EUR 73,000 million were securitised, around one third of which were placed in the market and the remainder were retained by the Group’s various units. These retained securitization transactions increased the Group’s liquidity position since they can be discounted at central banks.
Higher tranches of asset-backed bonds issued by Group companies were repurchased in the secondary market (around EUR 100 million).
B3. FundingAn in-depth balance-sheet analysis and liquidity risk management
The Group’s liquidity management frameworkmeasurement to support the decision-making process and the control thereof.
1. Liquidity management framework
Liquidity management is based on three basic pillars:
A. Organisational7.2.1 Organizational and governance model
Decisions relating to all structural risks, including liquidity risk, are made throughthough local asset-liability committees (ALCOs), in coordination with the markets committee.
The markets committee which is the senior decision-makinghighest-ranking body at Group level responsible for coordinating and supervising all the global decisions affecting liquidity risk measurement, management and control.
The markets committee It is presided overchaired by the Entity’sBank’s chairman and consists ofits members are the second deputy chairman and managing director, the third deputy chairman (who, in turn, is ultimately responsible for the Group’schairman of the risk management)committee), the CEO, finance executive vice president and risk executive vice presidentpresidents, and thecertain heads of the business and analysis units.
There are alsoFollowing the aforementioned principles, the local ALCO committees for both convertible currencies (basicallyestablish strategies to guarantee and/or anticipate the euro,funding requirements of their business. They are assisted in the US dollar and the pound sterling) and the currenciesperformance of emerging economies.
F-222
The management of structural risks, including liquidity risk, is performedtheir duties by the financial management area and the control of these risks is the responsibility of the global market risk area. Both areas provide support to the ALCOs by submitting managementarea, which submit analyses and management proposals and controllingmonitor compliance with the respective limits set.
Accordingly, in keepingIn line with governance best governance practices,practice, the Group establisheshas traditionally maintained a clear division between the implementation of the financial management strategy (for which the financial management area is responsible) and its monitoring and control (which is the responsibility of the market risk area).
B. Management
Structural liquidity management seeks to financeThis governance model has been reinforced by being integrated into a more global vision of the Group’s recurring business with optimal maturityrisks, namely the Group risk appetite framework, which responds to the demands from market regulators and cost conditions, avoidingparticipants, as a result of the needfinancial crisis, for banks to assume undesiredstrengthen their risk management and control systems.
With respect to the liquidity risks.
Fundingrisk profile and liquidity management is based on the following principles:
• Broad base of highly stable on-balance-sheet customer deposits and funds (including retail promissory notes): more than 85% of these deposits are retail deposits captured by the various commercial units inappetite, the Group’s main markets.
• Financing of stable on-balance-sheet liquidity needs (commercial gap or difference between lending and deposits) through medium- and long-term issues, establishing a surplus of structural financing in orderstrategy when conducting its businesses aims to cope with possible adverse situations.
• Diversification of funding sources to reduce risk with respect to:
• Instruments/investors
• Markets/currencies
• Maturities
• Strict control of short-term funding needs, in keeping with the Group’s policy of minimising the raising of short-term financing.
• Autonomy and responsibility of subsidiaries in the management of liquidity funding, with no structural support from the Parent.
In practice, based on the aforementioned principles, the liquidity management performed by the Group consists of the following:
• Preparation of a liquidity plan each year on the basis of the funding needs arising from the budgets of each business. Based on these liquidity requirements and taking into account certain prudential limits on the raising of short-term market financing, financial management establishes an issue and securitization plan for the year.
• Year-round monitoring of the actual changes instructure the balance sheet to make it as resilient as possible to potential liquidity stress scenarios. The liquidity appetite metrics are therefore structured by applying, on an individual basis, the principles of the Group’s liquidity management model, with specific levels for the structural funding ratio and minimum liquidity horizons under various stress scenarios, as detailed in the financing requirements, which results in the relevant updates of the plan.following sections.
• Maintaining an active presence in a broad and diversified set of funding markets. In particular, the Group has more than ten major independent issuer units which avoid any dependence on a specific market and endow it with significant issuance capabilities in various markets.
• Supported by the foregoing, the Group has an adequate structure of medium- and long-term issues, well diversified by product (senior, subordinate, preference, mortgage-backed bond) and with a conservative average term (4.2 years at 2011 year-end), in addition to the asset-backed bonds placed in the market.
F-223
Only in the case of Santander Consumer Finance, the Parent (Banco Santander, S.A.) satisfies any additional liquidity requirement, always at market prices considering the term of the financing and the internal rating of the liquidity taker.
C.7.2.2 Balance sheet analysis and liquidity risk measurement
Funding and liquidity decision-making is based on a thorough understanding of the Group’s current situation (environment, strategy, balance sheet and liquidity position), of the future liquidity needs of the businesses (liquidity projection) and of the accessibility and situation of the funding sources in wholesale markets.
Its aim is to ensure that the Group maintains optimum liquidity levels to cover its short- and long-term liquidity requirements with stable funding requirements, optimisingsources, optimizing the impact of the funding costcosts on the income statement.
This requires the monitoring of the balance sheet structure, the preparation of short- and medium-term liquidity projections and the establishment of basic metrics, consistent with those described in the following section.metrics.
Simultaneously, various scenario analyses are conducted considering the additional liquidity needs that could arise if certain extremevery severe but plausiblevery unlikely events occur. These events might have a varying effect on the various balance sheet items and/or funding sources (extent of roll-over of wholesale financing, run-off of deposits, impairment of liquid assets, etc.), due either to the global market conditions or to the Group’s specific situation.
All this enablesThe results of these balance-sheet, projection and scenario analyses provide the Groupinputs required to respondprepare the Group’s various contingency plans, which, if necessary, would enable it to anticipate a broad rangespectrum of potential adverse situations and to implement early, if necessary, the related contingency plans.situations.
TheseAll these measures are in line with the practices being promoted by the Basel Committee to strengthen the liquidity of financial institutions, the objective of which is to define a framework of principles and metrics that, arein some cases, is currently in the observation phase.
2. Current liquidity positionphase and, in others, at the development stage.
The Group maintains an excellent structural liquidity positionmeasurements, metrics and has the ability to cope with further market stress conditions, as reflectedanalyses used by the following factors:Group and subsidiaries in liquidity risk management and control are shown in greater detail below:
A. Robust balance sheetMethodology for liquidity risk monitoring and control
The balance sheet at 2011 year-end had a sound structure consistent with the Group’s commercial nature. The loan portfolio, which accounted for 77% of net assets on the liquidity balance sheet, was fully funded by customer deposits and medium- and long-term financing, including asset-backed bonds placed in the market. Similarly, structural liquidity needs, i.e. loans and fixed assets, were also fully funded by structural funds (deposits, medium- and long-term financing and equity).
As regards wholesale market funding, the Group’s structure is based mainly on medium- and long-term instruments, which in aggregate account for 90% of total wholesale market funding.
Together with the special financing of the Federal Home Loan Banks in the United States and the asset-backed bonds placed in the market, the bulk of the medium- and long-term financing relates to debt issues with an outstanding balance of close to EUR 162,000 million at 2011 year-end, an average residual maturity of more than four years and an adequate distribution profile (no single year accounts for more than 20% of the balance outstanding).
Short-term funding is a residual portion of the structure (2% of total liabilities) and is amply covered by liquid assets. At 2011 year-end, the structural liquidity surplus (i.e. the surplus of structural funds over loans and fixed assets) stood at EUR 119,000 million.
Excluding the retail promissory notes placedrisk measures adopted by the commercial networks in Spain in 2011, since they replaced existing deposits,Group pursue the structural liquidity surplus of short-term funding amounts to EUR 125,000 million.
F-224
This sound structural position is complemented by
Two kinds of basic metrics are used to control liquidity risk: short term and structural. Dynamic metrics include basically the liquidity gap, while static metrics feature the net structural balance-sheet position. The Group has operational subsidiaries. These include most notablysupplements these metrics by developing various stress scenarios. Following is a detailed description of these three metrics:
a) Liquidity gap
The liquidity gap provides information on potential cash inflows and outflows -both contractual and those estimated using assumptions- for a given period. Liquidity gap analyses are prepared for each of the three major monetary institutions which control the three basicmain currencies in which the Group operates:operates.
The gap supplies data on the euro,projected sources and applications of funds of all on- and off-balance sheet items in specific time periods. This analysis tool is obtained by considering the pound sterlingnet result of the maturity and cash flow structure for each of the US dollar.time buckets established. The tool is constructed by including the available liquidity and contrasting it with the liquidity requirements resulting from maturities.
At 2011 year-end,In practice, since the total capacity of assets available for discountingsame item will behave differently at the various central banksGroup subsidiaries, a set of common standards and methodologies are in place to make it possible to construct the liquidity risk profiles of each unit in a uniform manner and to submit these profiles in a comparable form to the Bank’s senior management.
Consequently, as this analysis has to be performed on an individual basis for each subsidiary in view of their autonomous management, a consolidated view of the Group’s liquidity gaps is of very limited use for the management and understanding of liquidity risk.
The various analyses conducted using the liquidity gap as a basis include most notably the wholesale funding analysis. Based on this analysis, a metric has been defined the aim of which is to ensure that the Group has access through its subsidiaries stoodsufficient liquid assets to attain a minimum liquidity horizon in a scenario in which wholesale financing is not renewed on maturity; this minimum horizon is set at approximately EUR 100,000 million. This figure,90 days at the Group.
The minimum liquidity horizons are established at corporate level and on a uniform basis for all units/countries, which is similarmust calculate their wholesale liquidity metric for the main currencies in which they operate.
Bearing in mind the pressures experienced by the markets in recent years, the wholesale liquidity gap has been monitored particularly closely at the Parent and at the units in the euro zone.
At the end of 2013, all units were comfortably positioned with respect to the amounthorizons set at 2010 year-end,corporate level for the aforementioned scenario.
b) Net structural position
The purpose of this metric is to determine the resultreasonableness of the balance-sheet funding structure. The Group’s aim is to ensure that its structural needs (lending, non-current assets, etc.) are satisfied by means of an active strategy for generating discountable assets, underpinned byappropriate combination of wholesale funding sources and a stable retail customer base.
Each unit prepares its liquidity balance sheet based on the developmentnature of its business and compares its liquidity needs with the various funding sources available to it. The essential factors taken into account in determining this metric are the degree of recurrence of the customerbusiness to be financed, the stability of the funding sources and the readiness with which assets can be converted into cash.
In practice, each subsidiary prepares its own liquidity balance sheet (different from the balance sheet for accounting purposes) by classifying the various asset, liability and off-balance-sheet items on the basis of their nature in terms of liquidity. Thus, the funding structure of each subsidiary is determined, which must at all times conform to a fundamental premise: namely that the basic businesses which enablesmust be financed with stable funds and medium and long-term financing. The combination of these measures guarantees the robustness of the Bank’s financial structure and the sustainability of its business plans.
At the end of 2013, the Group to offset both the maturitieshad a structural liquidity surplus of existing assets and the increasing “haircuts” applied to collateral by central banks in exchange for liquidity.EUR 150,000 million.
B. Funding dynamicsc) Scenario analysis
In 2011 Santander maintainedorder to supplement the robust structural liquidity position achievedaforementioned metrics, the Group develops a series of stress scenarios. Its main objective is to identify the critical factors in 2010, amidst an environment of maximum stress in both the retail and wholesale spheres of the business.
In addition to the fierce competition for retail deposits in the main European markets, which had already begun in 2010, the second half of 2011 saw the drying-up of the euro-zone wholesale markets as a result of the confidenceeach potential crisis regarding the solvency of sovereign debt and the growth capacity of the European peripheral countries. The difficulties facing wholesale issues raised banks’ appetite for retail deposits and, at the same time, hindered accessto define the most appropriate management measures to address each of the situations assessed.
In their liquidity analyses the units generally consider three different scenarios: systemic, idiosyncratic and hybrid which, given the Group’s characteristics, have been adapted to also take into account a local and a global systemic crisis. These scenarios constitute the minimum standard analysis established for all Group units to be reported to senior management. Also, each unit develops ad-hoc scenarios which replicate major historical crises or the liquidity risks specific to its particular environment.
The fundamental characteristics of the three base scenarios are as follows:
Within this category, the crisis that a local unit might suffer as a result of a crisis at the Parent, Banco Santander, S.A., is considered to be a specific scenario. This scenario was particularly relevant in 2012 in view of the tensions experienced in the peripheral eurozone countries.
These metrics and scenario definitions are directly related to the definition and execution of the liquidity contingency plan that is the responsibility of financial management.
At the end of 2013, in the event of a potential systemic crisis affecting the wholesale funding of the units located in Spain, Santander Group would have an adequate liquidity position. In particular, the wholesale liquidity horizon metric in Spain (included within the liquidity gap measures) would show levels exceeding 90 days in which the liquidity reserve would cover all wholesale financing maturities if they were not renewed.
In 2011addition to these three metrics, the Group has defined a series of internal and market variables to act as early warning signals for potential crises; these signals are also capable of indicating the nature and severity of such crises. The incorporation of these variables in day-to-day liquidity management enables the Group to anticipate any situations that might have an adverse effect on its liquidity risk. Although these alerts vary from country to country and from entity to entity, based on the specific conditioning factors in each case, certain parameters are used across the Group, such as the price of Banco Santander CDSs, the changes in deposits and the trend in central bank official interest rates.
7.2.3 Management tailored to business needs
Santander Group performs its liquidity management at subsidiary and/or business unit level in order to finance its recurring activities with the appropriate terms and prices. In practice, in keeping with the funding principles mentioned above, the liquidity management at these units consists of the following:
The effectiveness of this management effort is based on the fact that it is implemented at all subsidiaries. Specifically, each subsidiary budgets the liquidity requirements resulting from its intermediation activity and assesses its own ability to raise funds in the wholesale markets so that, in ongoing coordination with the Group, it can establish an issue and securitization plan.
Traditionally, the Group’s main subsidiaries have been self-sufficient in terms of their structural funding. The exception has been Santander Consumer Finance (SCF) which, because it specializes in consumer financing mainly through dealer/retailer recommendations, has required the financial support of other Group units, continuedespecially the Parent.
7.3 Funding strategy and evolution of liquidity in 2013
7.3.1 Funding strategy
In the last few years the Group’s funding activity has achieved its goal of obtaining sufficient funds for the Group’s recurring business, in a highly demanding environment marked by a heightened perception of risk, scant liquidity at certain time horizons and the increased cost of funding.
This sound performance was underpinned by the extension of the management model to raiseall Group subsidiaries, including recent acquisitions, and, above all, by the adaptation of subsidiaries’ strategies to the growing market demands. These demands were not uniform across the markets and reached far higher levels of their on-balance-sheet customer depositsdifficulty and pressure in certain areas, such as the basisperipheral regions of Europe.
In any case, it is possible to identify a series of general trends in the policies implemented by Group’s subsidiaries in their funding and liquidity management strategies over the last five years, namely:
Following the tightening of conditions on the wholesale markets, the Group’s decentralized subsidiaries model, with proprietary issues and ratings programs, contributed to maintaining the Group’s high-level participation in the developed wholesale markets, even in the most demanding periods, such as the two-year period encompassing 2011 and 2012.
In particular, the Group has raised its total discount capacity in lending. Althoughrecent years to around EUR 145,000 million.
In 2012, in view of the highest percentage increases were recordedstresses on the euro markets, the Group pursued a prudent strategy of depositing most of the funds raised by it in the three-year auctions as an immediate liquidity reserve at the Latin American units, this failed to offset the strong growth in lending in the region, most notably in Brazil and Mexico, resulting in the disappearanceEuropean System of central banks, while maintaining a very limited net global position. The reduction of the traditional deposit surplus. By contrast, the developed countries undergoing deleveraging generally reported moderate growth in deposits, albeit outstripping that of loans, which enabled these countries to further reduce the commercial gap.
As an exception, the commercial units in Spain, following their major deposit-taking drive in 2010, reduced deposit volumes in 2011 after having prioritised the recovery of spreads through the non-renewal of the most expensive deposits and the issuance of promissory notes aimed at attracting new retail customer funds. All in all, on-balance-sheet deposits and funds shrank to a lesser degree than loans, whichstresses enabled the Group in 2013 to further improverepay the commercial gapECB all of the funds received by Spain in Spain.the three-year auctions, thereby reducing its net recourse to funding at the end of 2013 to the lowest levels in five years. Such funding was basically concentrated in Portugal.
Furthermore,Thanks to all these developments, based on a sound liquidity management model, the Group was highly activecurrently enjoys a very robust funding structure. The basic features of this distinguishing structure are as an issuer throughoutfollows:
Customer deposits are the year, launching issues more uninterruptedlyGroup’s major source of funding. If retail promissory notes are included (given that in the regions and businesses less affected by the issuance difficulties experienced in the euro zone after the summer. By using issuers spanningSpain they are a broad range of markets and currencies and by taking advantagesubstitute for term deposits), these deposits represent around two thirds of the windows offered by the euro markets, particularly in the first halfGroup’s net liabilities (i.e. of the year, Santander was able to raise EUR 40,000 million through medium-liquidity balance sheet) and long-term issues inat the market, more than in 2010, thus permitting 124% coverageend of 2013 they accounted for the maturities and redemptions projected for the year.91% of net loans.
The medium- and long-term issues, basically senior debt and mortgage-backed bonds, were concentrated in Spain and the United Kingdom (72% altogether), followed by Latin America (led by Brazil), which increased its contribution to account for 24% of total issues in 2011.
As regards securitizations, in 2011 the Group’s subsidiaries taken as a whole performed on the market outright sales of asset-backed securities and structured transactions
Medium and long-term wholesale funding represents 20% of the Group’s funding and enables it to comfortably cater for more than halfthe net loans not financed with customer deposits (commercial gap).
7.3.2 Evolution of placements, wasliquidity in 2013
At the growthend of 2013, in comparison with 2012, the Group reported:
The Group maintains its capacity to access the wholesalevarious markets and, therefore, contributed toon which it operates, strengthened by the openingincorporation of new markets. A caseissuer units. In 2013 it launched issues and securitizations in point is Norway, where the Group performed the country’s first-ever securitization of vehicle loans.
F-225
This issue capacity is underpinned by the Group’s credit quality. In any case, for the duration of the current climate of uncertainty, Santander will continue to implement a conservative policy regarding issuances, as it did in 2011, in order to further reinforce its sound current position.
C) Structural foreign currency risk/hedges of results
Structural foreign currency risk arises from the Group’s operations in foreign11 currencies, and relates mainly to long-term investments, and the results and hedges of those investments.
Foreign currency risk is managed dynamically in order to limit the impact on capital of currency depreciations and optimise the financial cost of hedges.
The Group’s general policy for managing the foreign currency risk on long-term investments is to finance these investments in the currency in which they are denominated, provided that the market is sufficiently deep and the cost is justified by the expected currency depreciation. Also, hedges are arranged on an as-needed basis when it is considered that a local currency may weaken against the euro more quickly than it is being discounted17 significant issuers in the market.
At 2011 year-end, the largest long-term exposures (with their potential impact on equity) were concentrated, in descending order, on the Brazilian real, the pound sterling, the US dollar, the Mexican peso and the Polish zloty. The Group hedges a portion of these long-term exposures through foreign exchange derivatives.
Additionally, the financial management division at consolidated level is responsible for managing the foreign currency risk inherent in the expected results and dividends of the Group at the units whose base currency is not the euro.
D) Structured financing
Despite the complicated economic climate, in 2011 Santander Group achieved 13.2% growth in structured financing, to reach a total committed investment of EUR 22,017 million at December 31, 20114, distributed among 727 transactions, thereby boosting the diversification and internationalisation of the business. By transaction type, the project finance business maintained its leading position,14 countries participated, with an exposureaverage maturity of EUR 13,528 million distributed among 514 transactions (exposure of EUR 12,198 million, after discounting the exposure transferred to two CLO special-purpose vehicles in 2008 and 2009), followed by the acquisition finance business, with an investment of EUR 4,434 million in 50 transactions (of which EUR 1,746 million related to 12 margin call loans) and, lastly, LBOs and other structured financing transactions, which totalled EUR 4,055 million (154 transactions).approximately 3.7 years.
A structured operations portfolio is also held as a result of the integration of the UK Alliance & Leicester group in 2008. This is a diversified portfolio consisting entirely of specialised lending transactions. The committed exposure at 2011 year-end amounted to GBP 4,167 million (EUR 4,989 million) relating to 214 transactions. This exposure fell by 15.5% with respect to 2010 year-end.
E) Exposures related to complex structured assets
Santander Group continued to have very limited exposure to complex structured instruments or vehicles, as a reflection of its culture of management in which prudence in risk management constitutes one of its principal symbols of identity. Specifically, at 2011 year-end, the Group had:
|
F-226
|
|
|
|
In short, it can be affirmed that, in general, the exposure to instruments of this kind in the ordinary course of the Group’s business continued to decrease in 2011. It is due mainly to the integration of exposures at entities acquired by the Group, such as Alliance & Leicester plc and Sovereign Bancorp Inc. (in 2008 and 2009, respectively). All these exposures were known at the time of the purchase and adequate provisions were recognized. Since their integration in the Group these exposures have been reduced notably, the final objective being their derecognition.
The Group’s policy with respect to the approval of new transactions involving these products continues to be very prudent and conservative and is subject to strict supervision by the Group’s senior management. Before approval is given for a new transaction, product or underlying, the risk division checks:
whether there is an adequate valuation model (mark-to-market, mark-to-model or mark-to-liquidity) to monitor the value of each exposure.
whether the inputs enabling application of this valuation model are observable in the market.
Provided the two aforementioned conditions are met, the risk division ascertains:
the availability of adequate systems duly adapted for the calculation and daily monitoring of the results, positions and risks of the new transactions envisaged.
the degree of liquidity of the product or underlying, with a view to arranging the related hedge on a timely basis.
4.5. Internal model
At 2011 year-end, Santander Group obtained the Bank of Spain’s approval for the internal market risk model for the calculation of regulatory capital in the trading portfolios of the Spain, Chile and Portugal units. The Group intends to gradually extend this approval to its other units.
F-227
Following this approval, the regulatory capital of the trading activities for the above-mentioned scope is calculated using advanced approaches, applying VaR as a fundamental metric and incorporating the new Stressed VaR metrics and the incremental risk capital charge for default risk and rating migration risk (replacing the former incremental default risk charge), in keeping with the new “Basel 2.5” capital requirements.
The Group cooperates closely with the Bank of Spain to make further progress in the scope of application of the internal model (at geographical and operational levels) and in the impact analysis of new requirements, in line with the documents issued by the Basel Committee to strengthen the capital of financial institutions7.
5.8. OPERATIONAL RISK
8.1 Definition and objectives
SantanderThe Group defines operational risk as “the risk of loss resulting from inadequate or failed internal processes, human resources or systems or from external events”. Unlike other risks, this is generally a risk that is not associated with products or businesses, but is found in processes and/or assets and is generated internally (people, systems, processes) or as a result of external risks, such as natural disasters.
The aim pursued by the Group in operational risk control and management is primarily to identify, measure/assess, control/mitigate and inform aboutreport on this risk.
The Group’s priority, therefore, is to identify and eliminate any clusters of operational risk, irrespective of whether losses have been incurred. Measurement of this risk also contributes to the establishment of priorities in operational risk management.
For the purpose of calculating regulatory capital for operational risk, Santanderthe Group decided to opt initially for the standardisedstandardized approach provided for under Basel II standards. TheIn this regard, the Group is assessing the most appropriate timeembarked on a project for 2014 to shift to advanced measurement approachesAdvanced Measurement Approaches (AMA) taking into account, however, that: a), for which it has already satisfied the majority of the regulatory requirements. In any event, it should be noted that the short-term priority in operational risk management iscontinues to be focused on mitigation;mitigation.
8.2 Corporate governance and b) most of the regulatory requirements established for use of the AMA must be incorporated in the standardised approach and, at the present time, these requirements have already been included in the operational risk management approach used by Santander Group.
Managementorganizational model
The organisationalorganizational model for risk management and control follows the Basel guidelines and establishes three levelslines of control:defence:
First level:line: identification, management and control functions at first instance performed by the Group’s units
Second level: supervisionline: independent control functions to ensure that risks are properly identified and managed by the first lines of defence, within the established general action frameworks.
It should be noted that in 2013 the Group bolstered the operational risk control function by creating, as part of the risk unit, the non-financial risk control area to complement the control function performed by the corporate areas
Third level: integrated control functions performed by the risk division, from the integrated risk control and internal risk validation area (CIVIR).
This model is reviewed
Operational risk control is conducted at the first and second level by the technology and operations division and forms part of the Group’s deep-rooted risk management culture. Within this division, the corporate technology and operational risk area (ACRTO), created in 2008, is responsible for the definition of policies and methodology and for the management and control of technology and operational risks. The implementation, integration and local adaptation of the policies and guidelines established by the corporate area are the responsibility of the local operational risk resources areas, through the operational risk officers identified in each unit.
F-228
This operational risk management structure is based on the knowledge and experience of the executives and professionals of the various Group units, with particular importance being attached to the role of the local operational risk officers.
The Group has the following committees for operational risk management and control:
The Group oversees and controls technology and operational risk through its governing bodies. The Group’s board of directors, executive committee and management committee periodically address significant aspects concerning the management and mitigation of operational risk.
In addition, further to approval by the risk committee, the Group formally establishes the operational risk limits on an annual basis. A risk appetite is established which must fall within the low and medium-low risk profiles, which are defined in accordance with various ratio levels. Limits by country and for the Group are established based on the net loss to total income ratio. An assessment is also performed of the operational risk management status of the countries in accordance with certain internal indicators.
8.3 Risk management model
The technology and operational risk management model includes the following phases:
Identification of the operational risk inherent in all the Bank’sGroup’s activities, products, processes and systems.
Objective and continued measurement and assessment of operational risk, consistent with the industry and regulatory standards (Basel, Bank of Spain, etc.), and setting of risk tolerance limits.
Continuous monitoring of operational risk exposures, implementation of control procedures, improvement of internal awareness and mitigation of losses.
Establishment of mitigation measures to eliminate or minimiseminimize operational risk.
Generation of periodic reports on the exposure to operational risk and its level of control for senior management and the Group’s areas/units, and reporting to the market and the regulatory authorities.
Definition and implementation of systems enabling the Group to monitor and control operational risk exposures. These systems are integrated into the Group’s daily management, using the current technology and maximisingmaximizing the automation of applications.
Definition and documentation of operational risk management policies and implementation of the related methodologies consistent with current regulations and best practices.
The operational risk control model implemented by Santanderthe Group provides the following benefits:
Integrated and effective management of operational risk (identification, measurement/assessment, control/mitigation and information)reporting).
Improved knowledge of actual and potential operational risks and better assignment to business and support lines.
The information on operational risk helps improve processes and controls and reduce losses and income volatility.
Setting of limits for operational risk appetite.
Model implementation: global initiatives and results
The main functions, activities and global initiatives adopted, which seek to ensure the effective management of operational and technology risk, can be summarised as follows:
Definition and implementation of the corporate technology and operational risk management framework.
Designation of head coordinators and creation of operational risk departments at the local units.
Training and experience sharing: communication of best practices within the Group.
Fostering of mitigation plans: control of both the implementation of corrective measures and projects under development.
Definition of policies and structures to minimise the impacts on the Group in the event of major disasters.
Adequate control of the activities carried out by third parties, enabling the Group to respond to potential critical situations.
Provide adequate information on this type of risk.
F-229
The corporate function strengthens technology risk management and fosters the following aspects, inter alia:
Security of information systems.
Promotion of contingency and business continuity plans.
Management of technology risk (risk associated with the use of technology -development and maintenance of applications, design, implementation and maintenance of technology platforms, production of computer processes, etc.).
Substantially all the Group units are currently included in the model, with a high degree of uniformity. However, the different pace of the implementation, phases, timetables and historic depth of the respective databases gives rise to differences in the level of progress between one country and another.
In general:
Classified databases of operational incidents are received on a monthly basis. The captured eventsgeneral, all the Group’s units continue to improve all matters relating to operational risk are not restricted by thresholds, i.e. none are excluded due to their amount, and they include events affecting the accounts (including positive effects) and those not affecting the accounts.
Self-assessment questionnaires completed by the main Group units are received and analyzed and their results materialisemanagement, as disclosed in the preparation of risk maps.annual review performed by internal audit.
A corporate systemThe main functions, activities and global initiatives which have been adopted and seek to ensure the effective management of operational and technology risk, indicators is in place, which is updated continuously in coordination with the internal control area.
The most significant and frequent events are identified and analyzed, and mitigation measures are adopted and disseminated to the other Group units as best practice guidelines.
Databases are reconciled with the accounting records.
In addition, in 2011 the Group units made further progress in the performance of risk self-assessment exercises, through the introduction of frequency, severity and worst-case scenario estimates. More specifically, experts from the various business and support areas assessed the risk associated with their processes and activities and estimated the average frequency of the materialisation of risks and their average severity. The exercises also included assessment of highest loss in addition to average loss, as well as evaluation of the control environment.
All the above will enable limits tocan be established on the basis of the distribution and modelling of expected/unexpected losses.
In 2011 the Group completed the implementation of a new corporate system that supports substantially all the operational risk management tools and facilitates the information and reporting functions and requirements at both local and corporate level. The most noteworthy features of the system aresummarized as follows:
It is equipped with the following modules: event registration, risk mapDefinition and assessment, indicators and reporting systems.
It is applicable to all Group entities.
It automates all operational risk management processes.
In 2012 the following improvements will be made to the platform:
Inclusion of scenario analysis methodology to supplement the methods currently in place at the Group and enable the assessment of highest-severity potential risks.
Strengtheningimplementation of the procedures for active operational risk management through the introduction and monitoring of mitigation measures.
F-230
The Group monitors and controlscorporate technology and operational risk through its governing bodies. Accordingly, the meetingsmanagement framework.
Furthermore, each year
With regard to technology risk management, the corporate function continues to strengthen significant aspects, such as the following:
In 2013 the corporate framework for agreements with third parties and control of suppliers was approved, and is applicable for all the entities over which the Group exercises effective control. The framework develops and defines the principle of operational responsibility, and establishes itsthe benchmarks to be taken into consideration in agreements with suppliers, with the primary objective being to establish the principles governing the relationships between Group entities and suppliers, from start to finish, paying particular attention to the following:
This framework also establishes the necessary responsibility, while respecting an appropriate segregation of functions, in order to ensure that risks may be properly identified, the service controlled and supervision maintained within the Group.
8.4 Risk measurement and assessment model
In order to measure and assess technology and operational risk, profilesthe Group defined a set of quantitative and limits, subjectqualitative corporate techniques/tools that are combined to approval by the risk committee. The Group’s risk appetite is established, and must be in the low or medium-low profile, which is defined on the basis of various ratios. In this regard, limits are set by country and at Group levelperform a diagnosis, based on the gross lossidentified risks, and obtain a valuation, through the measurement/assessment, of the area/unit.
8.5 Business continuity plan
The Group has a business continuity management system (BCMS) to gross income ratio.
Also, once a month and in each country,ensure the various local resources areas hold monitoring committee meetings withcontinuity of the corporate area. In February 2011 the corporate anti-fraud committee was set up to analyse the situationbusiness processes of fraudits entities in the event of a disaster or serious incident.
This basic objective consists of the following:
Lastly, it should be noted that ACRTO-CIVIR committee meetings were held on a quarterly basis in 2011. These meetings address significant
8.6 Other matters relating to operational risk managementcontrol and control issues from an integrated risk control perspective.monitoring
Analysis and monitoring of controls in market operations
In view of the specific features and complexity of financial markets, the Group considers it necessary to steadilycontinuously strengthen the operational control of its financial market activities, thus bolsteringactivities. Therefore, in 2013, the highly stringent and conservative risk and operational principles already applied on a regular basis by Santander Group.
In additioncontrol model for this business continued to monitoring all operational control-related matters, in all its units the Group placed greaterbe improved, with particular emphasis on the following aspects:points:
ReviewAnalysis of the valuation models and, in general,individual operations of each treasury operator to detect any possible anomalous conduct.
The business is also undergoing a global transformation, combined with the modernization of the portfolios.
Processes fortechnology platforms and operating processes involving a robust control model that enables the captureoperational risk associated with this activity to be reduced.
Operational risk information system
The Group has a corporate information system that supports the operational risk management tools and independent validation of prices.
Adequate confirmation of transactions with counterparties.
Review of transaction cancellations/modifications.
Reviewfacilitates the information and monitoring ofreporting functions and needs at local and corporate level.
The system offers event recording modules, risk mapping and assessment, indicators, mitigation and reporting systems, and is applicable to all the effectiveness of guarantees, collateral and risk mitigators.Group entities.
Corporate information
The corporate technology and operational risk control area has a system for integral management of operational risk information (IGIRO), which every quarter consolidatesthat provides data on the Group’s main risk elements. The information available from each country/unit in the operational risk sphere and givesis consolidated to provide a global view with the following features:
Two levels of information: one corporate, with consolidated information, and the other individualisedindividualized for each country/unit.
Dissemination of the best practices among the countries/units of Santanderthe Group, obtained from the combined study of the results of qualitative and quantitative analyses of operational risk.
Information is alsospecifically prepared on the following aspects:
SantanderThe Group’s operational risk management model.
Scope of action.
Analysis of the internal event database and the database of operational losses.
F-231
Operational risk cost and accounting reconciliation.
Self-assessment questionnaires.
Key Risk Indicators.
Mitigating measures/active management.
Business continuity plans and contingency plans.
Regulatory framework: BIS II.
Insurance.
This information acts as the basis for meeting reporting requirements vis-à-visto the risk committee, senior management, regulators, rating agencies, etc.
The role of insurance in operational risk management
SantanderThe Group considers insurance as a key factor in operational risk management. Since 2004 the operational risk area has worked closely with the Group’s insurance management area in Santander Group in all activities leading to improvements in the two areas. Some notable examples are as follows:
Cooperation in the presentation of Santanderthe Group’s operational risk management and control model to insurers and reinsurers.
Analysis and follow-up of the recommendations and suggestions for improving operational risks made by insurance companies, through previous audits performed by specialisedspecialized companies, and of the subsequent implementation thereof.
Sharing of the information generated in the two areas in order to strengthen the quality of error basesdatabases and the cover ofprovided by the insurance policies forof the various operational risks.
Close cooperation between local operational risk officers and local insurance coordinators in order to enhance operational risk mitigation.
Regular meetings to report on specific activities, statements of position and projects in the two areas.
Active participation of the two areas in the global insurance sourcing desk, the highest technical body in the Group responsible for the definition of insurance coverage and arrangement strategies.
6.9. COMPLIANCE AND REPUTATIONAL RISK
Santander Group defines reputational9.1 Definitions and objective
Compliance risk is the risk of receiving penalties (financial or otherwise) or being subject to other types of disciplinary measures by the supervisors as a result of failing to comply with laws, regulations, standards, the organization’s self-regulatory standards or codes of conduct applicable to the activity carried on.
Reputational risk is the risk associated with the perception of the BankGroup held by the various internal and external stakeholders with which it is related as a resultpart of its business activities, which may have an adverse impact on results or business expectations. This risk includes legal, economic, financial, ethical, social and environmental aspects.
Various Group governance structures are involvedThe Group’s objective regarding compliance risk is: (i) to minimize the probability of irregularities arising; and (ii) to identify, report and swiftly resolve any irregularities that might possibly arise. As for reputational risk, bearing in mind the diversity of sources from which it can arise, management of this risk aims to identify such sources and ensure that they are duly attended to so that the probability of their occurring is reduced and the possible impact thereof is mitigated.
9.2 Corporate governance and organizational model
It is the responsibility of the Bank’s board of directors, as part of its supervisory function, to approve the Group’s general risk policy. In the corporate compliance and reputational risk depending on the sources thereof. Thus, the audit and compliance committee provides support toarea, the board is in this connection and supervises compliance withcharge of the Group’s general code of conduct, the global policy on the prevention of money laundering and terrorist financing and the product and service marketing policy.
The risk committee proposes the Group’s risk policy to the board. Also, as the body responsible for global risk management, it measures reputational risk in its area of activity and decision-making.
The audit and compliance committee is entrusted, inter alia, with the functions of supervising compliance with legal requirements, watching over the effectiveness of internal control and risk management systems, supervising compliance with the Group’s code of conduct in the securities markets, with the manuals and procedures for the prevention of money-laundering and, in general, with the bank’s rules of governance and compliance, and making any necessary proposals for improvement, as well as reviewing compliance of the actions and measures resulting from reports or actions of the administrative supervisory and control authorities.
The compliance function reports to the board on an ongoing basis, mainly through the audit and compliance committee, to which the Group’s head of compliance reported at the twelve meetings held by this committee in 2013. The Group’s head of compliance also reported to one meeting of the risk committee in 2013, without prejudice to attending other sessions of this committee when transactions with a possible impact from the reputational risk standpoint were submitted to it.
Lastly, the corporate committees for regulatory compliance, analysis and resolution and marketing (the last two specialize in their respective subjects: the prevention of money laundering and the marketing of products and services) are collective bodies with basic competencies which have a global scope (all geographical areas, all businesses) and are replicated at local level.
The risk unit monitors the compliance risk control framework both from the integrated risk control and internal risk validation area (CIVIR), in the exercise of its functions to support the risk committee, and from the non-financial risk control area created in 2013.
The organizational model revolves around the corporate compliance and reputational risk area, forming part of the general secretary’s division, which is entrusted with managing the Group’s compliance and reputational risks. Within this area, which is led by the Group’s head of compliance, are the corporate regulatory compliance risk management office, the corporate reputational risk management office and the corporate financial intelligence unit (UCIF), which is responsible for the prevention of money laundering and terrorist financing. This structure is replicated at local level and also in the global businesses, the appropriate functional reporting channels to the corporate area having been established.
9.3 Risk appetite model
The risk committee was informed at its meeting held on October 2013 of the Group’s risk appetite model applicable to compliance and reputational risk. The model is characterized by the following three elements:
Data of the communications received from the various supervisors each month is fed into the assessment matrix. Each of these communications is allocated a score depending on the risk they represent in terms of: (i) costs due to fines; (ii) process reorganization costs; and (iii) the impact on the brand and reputational risk. These assessments are compared with ratings assigned by internal audit with respect to compliance.
Each local unit is allocated a weighting based on its attributable profit and volume of assets, which can be used to obtain an overall score for the Group.
9.4 Risk management model
The main responsibility for compliance and reputational risk management is shared by the compliance department and the various business and support units that conduct the activities giving rise to risk. The responsibility for developing policies and implementing the corresponding controls lies with the compliance department, which is also responsible for advising senior management on these matters and fostering a culture of compliance, all as part of an annual program whose effectiveness is periodically evaluated.
The compliance department directly manages the basic components of these risks (money laundering, codes of conduct, product marketing, etc.) and ensures that the other components are duly addressed by the corresponding Group unit (responsible financing, data protection, customer claims, etc.), for which purpose it has established the appropriate control and verification systems.
The integrated risk control and internal risk validation area ensures that the risk management model is properly executed. Also, as part of its functions, internal audit performs the tests and reviews required to check that the standards and procedures established at the Group are being complied with.
The central plank of the Group’s compliance program is the general code of conduct. This code contains the ethical principles and standards of conduct that must guide the actions of all the Group employees and is complemented in certain matters by the standards contained in the industry-specific codes and manuals(9)
| 9 | The industry-specific codes and manuals include the prevention of money laundering and terrorist financing manual, the code of conduct in securities markets, the procedures manual for the sale of financial products, the analysis code of conduct, the research policy manual, the use of information and communications technology conduct manual, the property management conduct manual, the purchasing management conduct manual, etc., in addition to the notes and circulars implementing specific points of these codes and manuals. |
Also, the code establishes: i) the functions and responsibilities regarding compliance by the Group’s relevant governing bodies and divisions; ii) the standards regulating the consequences of the failure to comply; and iii) a channel for reporting and processing notifications of allegedly unlawful actions.
It is the role of the corporate compliance office, under the supervision of the audit and compliance committee and the regulatory compliance committee, to ensure the effective implementation and monitoring of the general code of conduct.
The regulatory compliance committee, which is chaired by the Group’s general secretary, has authority on all matters relating to the compliance function, without prejudice to the matters assigned to the two specialist bodies in this area (the corporate marketing committee with regard to the marketing of products and services, and the analysis and resolution committee with regard to the prevention of money laundering and terrorist financing). The regulatory compliance committee is composed of representatives from internal audit, the general secretary’s division, financial management, human resources and the most directly affected business units.
The Group’s compliance department has been entrusted with the following compliance and reputational risk management functions:
| 1. | Implementing the Group’s general code of conduct and other codes and industry-specific manuals. |
| 2. | Supervising the training activities on the compliance program conducted by the human resources area. |
| 3. | Directing investigations into any possible breaches, with help from internal audit, and proposing the appropriate penalties to the related committee. |
| 4. | Cooperating with internal audit in the periodic reviews carried out by internal audit on compliance with the general code and with the industry-specific codes and manuals, without prejudice to the periodic reviews of matters of regulatory compliance which are conducted by the compliance department directly. |
| 5. | Receiving and handling the complaints made by employees or third parties through the whistleblowing facility. |
| 6. | Advising on the resolution of doubts arising from the application of the codes and manuals. |
| 7. | Preparing an annual report on the application of the compliance program for submission to the audit and compliance committee. |
| 8. | Regularly reporting to the general secretary, the audit and compliance committee and the board of directors on the implementation of the compliance policy and the compliance program. |
| 9. | Assessing, every year, the changes that it might be appropriate to make to the compliance program, particularly in the event of detecting unregulated risk areas and improvable procedures, and proposing such changes to the audit and compliance committee. |
As regards the industry-specific codes and manuals, the focus of the compliance program is on the following operational spheres, inter alia:
Prevention of money laundering and the financing of terrorism
Policies
As a socially responsible organization, it is a strategic objective for the Group to have an advanced effective system for the prevention of money laundering and the financing of terrorism that is constantly adapted to the latest international regulations and has the capacity to respond to the appearance of new techniques employed by criminal organizations.
The prevention of money laundering and terrorist financing function is articulated in certain policies that establish minimum standards that the Group’s units must observe, and which are prepared in conformity with the principles contained in the 40 recommendations of the Financial Action Task Force (FATF) and the obligations and stipulations of Directive 2005/60/EC of the European Parliament and of the Council of October 26, 2005 on the prevention of the use of the financial system for the purpose of money laundering and terrorist financing.
The corporate policy and the standards implementing it must obligatorily be complied with at all Group units worldwide. In this regard, units should be taken to be all the Group’s banks, subsidiaries, departments or branches, both in Spain and abroad, which, in accordance with their legal status, must be subject to the regulations on the prevention of money laundering and terrorist financing.
Governance and organization
The organization of the prevention of money laundering and terrorist financing function is divided into three parts: the analysis and resolution committee (CAR), the corporate financial intelligence unit (UCIF) and the persons in charge of prevention at various levels.
The CAR is a collective body with a corporate scope which is chaired by the Group’s general secretary and is composed of representatives of internal audit, the general secretary’s division, human resources and the most directly affected business units. The CAR held four meetings in 2013.
The UCIF’s function is to establish, coordinate and supervise the systems and procedures for the prevention of money laundering and terrorist financing at all Group units.
Also, there are persons responsible for the prevention of money laundering and terrorist financing at four different levels: area, unit, branch and account. Their mission in general,each case is to support the Bank’s governanceUCIF from the position of proximity to customers and compliance rules,operations.
At consolidated level, a total of 781 professionals perform the prevention of money laundering and terrorist financing function at the Group (three-quarters of that number on a full-time basis) at 173 units established in 36 countries.
The Group has established corporate systems at all its units and business areas based on decentralized computer software which makes any required proposals for improvement.it possible to present directly to the account branches or the relationship managers the transactions and customers which need to be analyzed because of their risk. The aforementioned tools are supplemented by other tools used centrally by the teams of analysts in the prevention units and, based on certain risk profiles and changes in certain customer operational behavior patterns, they enable transactions that might be linked to money laundering or terrorist financing to be analyzed, identified on a preventative basis and monitored.
The Group is a founder member, along with ten other large international banks, of the Wolfsberg Group. The Wolfsberg Group’s objective is to establish international standards to increase the effectiveness of programs to combat money laundering and terrorist financing in the financial community. Various initiatives have been developed which have addressed, inter alia, issues such as the prevention of money laundering in private banking and correspondent banking, and the financing of terrorism. The regulatory authorities and experts in this area consider that the Wolfsberg Group and the principles and guidelines set by it represent an important step in the fight against money laundering, corruption, terrorism and other serious crimes.
Marketing of products and services
F-232Policies
SantanderThe Group manages the reputational risk that may arise from an inadequate sale of products or an improper provision of services by the Group in accordance with the corporate policies for the management of reputational risk arising fromregarding the marketing of products and services.
These corporate policies aim to establish a single corporate framework for all regions, businesses and entities that: (i) reinforces the organisationalorganizational structures; (ii) ensures that decision-making committees oversee not only the approval of products and services, but also the monitoring thereof over their whole lives; and (iii) establishes the guidelines for defining uniform Group-wide criteria and procedures for the marketing of products and services, encompassingwhich encompass all its phases (approval, pre-sale, sale and follow-up or post-sale).
These policies are developed and specifically adapted to the actual local situation and to local regulatory requirements through the local internal rules of the various Group units, once authorisationauthorization has been obtained from the corporate compliance and reputational risk area.
Accordingly, the new versionGovernance and organization
The management of the procedures manual for the sale of financial products (“the manual”) is a specific adaptation of the corporate marketing policies to the actual Spanish situation and to local regulatory requirements (such as the EU MiFID directive) and, therefore, applies to Banco Santander, S.A. and its subsidiaries operating in Spain that do not have their own manual.
The financial products included in the material scope of this manual are fixed-income and equity securities or other financial instruments, money market instruments, shares or units in collective investment undertakings, traded derivatives, OTC derivatives and atypical financial contracts. Nevertheless, the corporate marketing committee may opt to include other financial products within the scope of the procedures manual.
The reputational risk that maymight arise from an inadequate salethe incorrect selling of products or an improper provision of services is organized by corporate and local marketing committees, the Group is managed mainly throughglobal consultative committee, the following bodies:
Riskcorporate monitoring committee, (CDR)
It is the responsibility of the board, as part of its supervisory function, to define the Group’s risk policy.
The risk committee, in its capacity as the body responsible for globaland corporate and local reputational risk management and for all banking operations, assesses, with the support of the general secretary’s division, the reputational risk within its scope of competence in areas for which it has decision-making powers.
Corporate marketing committee (CCC)offices.
The corporate marketing committee (“CCC”)(CCC) is the Group’s highest decision-making body regarding the approval and monitoring of products and services. Chaired by the Group’s general secretary, it is composed of representatives of the following divisions: risk, financial management, technology and operations, general secretary’s division, the controller’s unit, internal audit, commercial banking, Santander Global Banking & Markets,global wholesale banking, private banking, asset management and insurance.
The CCC pays particular attention to the suitability of the product or service for the environment in which it is to be marketed, placing particular emphasis on ensuring that:
Each product or service is sold by competent sales personnel.
Customers are furnished with the required appropriate information.
The product or service fits the customer’s risk profile.
Each product or service is assigned to the appropriate market, not only from a legal or tax standpoint, but also with regard to the financial culture of that market.
The product or service meets the requirements of the corporate marketing policies and, in general, the applicable internal or external regulations.
F-233
Also, local marketing committees (“CLCs”)(CLCs) are created at local level to channel proposals for the approval of new products to the CCC -after issuing a favorable opinion, since initially they do not have any delegated powers- and to approve products that are not new and the related marketing campaigns.
In their respective approval processes the marketing committees’ actions are guided by a risk-based approach, from the view point of both the Bank and the customer.
Global consultative committee (CGC)
The global consultative committee (CGC) is the advisory body of the corporate marketing committee and consists of area representatives who provide an insight into risks, regulationregulations and markets. The global consultative committee,CGC, which meets roughly on an estimateda quarterly basis, may recommend the review of products affected by market changes, impaired solvency (country, sectors or companies) or changes in the Group’s market perception at medium and long term.
CorporateThe corporate monitoring committee (CCS)
Since 2009 this is the Group’s decision-making body regarding the monitoring of products and services. This committee has met on a weekly basis to monitor products. Chairedis chaired by the general secretary it involves the participation ofand is attended by internal audit, legal advisory, compliance, customer care and the business areas concerned (with the ongoing representation of the commercial network). The committee meetings raiseIt meets weekly, and resolveconsiders and resolves specific issues relating to the marketingselling of products and services.services at a local level as well as at the level of the Group units outside Spain.
Corporate reputational risk management office
The purpose of the corporate reputational risk management office which forms part of the corporate compliance and reputational risk area,(OCGRR) is to provide the relevant governing bodies with the information required to enable them: (i) to conduct an appropriate analysis of risk in the approval phase, with a twofold focus: impact on the Bank and impact on customers; and (ii) to monitor products over their life cycle.
At local level the Group creates the corresponding reputational risk management offices have been established, which are responsible for promoting corporate culture and for ensuring that products are approved and monitored in the respective local spheres in keeping with corporate guidelines.
In 2011Conduct in securities markets
Policy
This is set by the various reputationalcode of conduct in the securities markets, complemented, inter alia, by the code of conduct for analysis activities, the research policy manual and the procedure for detecting, analyzing and communicating transactions suspected of market abuse.
Governance and organization
The organization is centered on the corporate compliance office and local and subsidiaries’ compliance divisions.
The Group’s compliance department performs the following main functions in relation to the rules of conduct in securities markets:
| 1. | Registering and controlling sensitive information that is known by and/or generated at the Group; |
| 2. | Keeping lists of the securities affected and the initiated persons, and monitoring transactions with these securities; |
| 3. | Monitoring transactions with restricted securities depending on the type of activity, portfolios or groups to which the restriction applies; |
| 4. | Receiving and attending to notifications of, and requests for, authorization of transactions for own account; |
| 5. | Controlling transactions for own account of the persons subject to compliance with the code of conduct; |
| 6. | Managing breaches; |
| 7. | Resolving any issues raised concerning the Code of Conduct in Securities Markets (CCMV); |
| 8. | Recording and resolving conflicts of interest and the situations that might give rise to them; |
| 9. | Assessing and managing any conflicts that might arise in the analysis activity. |
| 10. | Maintain the files required to control compliance with the obligations established in the CCMV; |
| 11. | Develop ordinary contact with the regulators; |
| 12. | Organizing training and, in general, performing the actions required to apply the CCMV; and |
| 13. | Analyzing actions that might be suspected of constituting market abuse and, where appropriate, reporting them to the supervisors. |
Criminal risk prevention
The Group’s compliance department has also been entrusted with the management offices conducted a follow-up of the products approved.criminal risk prevention model, which resulted from the entry into force of Organic Law 5/2010, which made legal entities criminally responsible for crimes committed on their account or for their benefit by directors or representatives or employees as a result of a lack of control.
7. COMPLIANCE WITH THE NEW REGULATORY FRAMEWORKTowards the end of 2013 an review certification process of the Group’s criminal risk prevention model was performed by an external expert, which verified the following: i) the effective implementation of the Group’s internal rules, ii) the existence of general control measures and; iii) the existence of specific control measures. The conclusions were satisfactory. Also, the criminal code reform project currently under way was monitored, with a view to anticipating as far as possible the adaptation tasks.
Throughout 2011 SantanderRelationships with supervisors and dissemination of information to the markets
The compliance department is responsible for responding to the information requirements of the regulatory and supervisory bodies, both in Spain and in other countries where the Group took partoperates, monitoring implementation of the measures arising from the reports or inspections conducted by these bodies and supervising the way in which the Group disseminates institutional information in the markets, transparently and in accordance with the regulators’ requirements. The audit and compliance committee is informed of the main issues at each of its meetings.
10. CAPITAL
10.1 Compliance with the new regulatory framework
The regulations known as Basel III, which establish new global capital and liquidity standards for financial institutions, came into force in 2014.
From the capital standpoint, Basel III redefines what is considered to be available capital at financial institutions (including new deductions and raising the requirements for eligible equity instruments), increases the minimum capital requirements, requires financial institutions to operate permanently with capital buffers, and adds new requirements in relation to the risks considered.
The Group shares the ultimate objective pursued by the regulator with this new framework, namely to endow the international financial system with greater stability and resilience. In this regard, for many years the Group has collaborated on the impact studies steeredfor calibrating the new rules conducted by the Basel Committee and the European Banking Authority (EBA) and coordinated locallyat local level by the Bank of Spain to gaugeSpain.
In Europe, the impactnew standards have been implemented through Directive 2013/36/EU, known as the Capital Requirements Directive (“CRD IV”), and the related Capital Requirements Regulation (“CRR”), which is directly applicable in all EU member states (as part of the newSingle Rulebook). In addition, the standards are subject to Implementing Technical Standards commissioned from the European Banking Authority (EBA), some of which will be issued in the coming months/years.
The Capital Requirements Regulation came into force on January 1, 2014, with many of its rules subject to various implementation timetables. This transitional implementation phase, which affects mainly the definition of eligible capital, concludes at the end of 2017, except with regard to the deduction for deferred tax assets, the transition period for which lasts until 2023.
Subsequent to the transposition of Basel III regulationsinto European legislation, the Basel Committee has continued to issue additional standards, some in the form of public consultation processes, which when implemented, will establishentail a future amendment of CRD IV and the CRR. The Group will continue to support the regulators by offering its opinions and participating in impact studies.
The Group currently has robust capital ratios, in keeping with its business model and risk profile, which, coupled with its substantial capacity to generate capital organically and the gradual implementation timetable envisaged for the new capital and liquidity standardsrequirements in the legislation, place it in a position to comply with stricter and more standardised criteria at international level.Basel III.
SantanderWith regard to credit risk, the Group intendsis continuing to adopt over the next few years,its plan to implement the advanced internal ratings-based (AIRB) approach under Basel II for substantially all its banks, and it intends to do so until the percentage of net exposure of the loan portfolio covered by this approach exceeds 90%. The attainment of this short-term objective in the short term will also dependsdepend on the acquisitions of new entities and the need for the various supervisors to coordinate the validation processes offor the internal approaches. The Group is present in geographical areas where there is a common legal framework among supervisors, as is the case in Europe through the Capital Requirements Directive. However, in other jurisdictions, the same process is subject to the framework of cooperation between the home and host country supervisors under different legislations, which in practice entails adapting to the different criteria and timetables in order to obtain authorisationauthorization to use the advanced approaches on a consolidated basis.
F-234
Accordingly, Santanderthe Group continued in 20112013 with the project for the progressive implementation of the technology platforms and methodological improvements required for the roll-out of the AIRB approaches for regulatory capital calculation purposes at the remaining Group units. SantanderTo date the Group has obtained authorisationauthorization from the supervisory authorities to use advanced approaches for the calculation of regulatory capital requirements for credit risk for the Parent, and the main subsidiaries in Spain, the United Kingdom and Portugal, and certain portfolios in Mexico, Brazil and Chile, andas well as for Santander Consumer Finance in Spain which represent nearly two thirds of its total exposure at 2011 year-end.and the United States. The Group’s Basel implementation strategy is focused on obtaining authorisationauthorization for the use of AIRB approaches at the main entities in the Americas and at consumer banking entities in Europe.
As regards the other risks explicitly addressed in Pillar I of the Basel Capital Accord, Santander Group is authorized to use its internal model for market risk with respect to the treasury areas’ trading activities in Spain and in 2010 it obtained authorisation for the Chile and Portugal units, thus continuing implementation of the roll-out plan it submitted to the Bank of Spain for the other units.
With regard to operational risk, the Group currently uses the standardized approach for regulatory capital calculation purposes and has embarked on a project to roll out AMA approaches once it has collated sufficient data using its own management model. The Group considers that the internal model should be developed primarily on the basis of the experience accumulated in managing an entity through the corporate guidelines and criteria established after assuming control, which are a distinctive feature of Santander Group. The Group has performed numerous acquisitionsfeature.
As regards the other risks explicitly addressed in recent years and, as a result, a longer maturity period will be required in order to develop the internal model based on its own management experiencePillar I of the various acquired entities. However, althoughBasel Capital Accord, Santander Group has initially decidedbeen authorized to use its internal model for market risk on the standardised approach for regulatory capital calculation purposes, it is considering the possibility of adopting AMA approaches once it has collated sufficient data using its own management modeltreasury areas’ trading activities in order to make as much use as possibleSpain, Chile, Portugal and Mexico, thus continuing implementation of the virtues that characteriseroll-out plan it submitted to the Group.Bank of Spain for the other units.
With respect to Pillar II, Santanderthe Group uses an economic capital approach to quantify its global risk profile and its capital adequacy position as part of the internal capital adequacy assessment process (ICAAP) at consolidated level. This process whichincludes regulatory and economic capital planning under several alternative economic scenarios, in order to ensure that the internal capital adequacy targets are met even in plausible but highly unlikely adverse scenarios. The ICAAP exercise is supplemented with a qualitative description of the risk management and internal control systems, is reviewed by internal audit and internal validation teams and is subject to a corporate governance structure that culminates in its approval by the Group’s board of directors, which also establishes the strategic factors relating to risk appetite and capital adequacy targets on an annual basis. The economic capital model considers risks not included in Pillar I (concentration risk, interest rate risk and business risk). The Group’s diversification offsets the additional capital required for the aforementioned risks.
In accordance with the capital requirements set by the European Directive and Bank of Spain rules, Santanderthe Group publishes its Pillar III disclosures report on an annual basis. This report the first edition of which was published with data at December 31, 2008, comfortably meets the market transparency requirements in relation to the so-called Pillar III. SantanderThe Group considers that the market reporting requirements areto be fundamental in order to complement the minimum capital requirements of Pillar I and the supervisory review process performed through Pillar II. In this respect, it is incorporating in its Pillar III disclosures report incorporates the recommendations made by the Committee of European Banking Supervisors (CEBS, now the EBA)Authority (EBA), in order to makethus making Santander Group an international benchmark in terms of market transparency, as is already the case with its annual report.
Parallel to the roll-out of advanced approaches at the various Group units, Santander Group is carrying out an ambitious ongoing training process on Basel at all levels of the organisation,organization, covering a significant number of professionals from all areas and divisions, with a particular focus on those most affected by the changes arising from the adoption of the new international capital standards.
Internal validation of risk models10.2 Economic capital
In additionEconomic capital is the capital required, based on an internally-developed model, to constituting a regulatory requirement,support all the internal validation function provides essential support to the board’s risk committee and the local and corporate risk committees in the performance of their duties to authorise the userisks of the models (for management and regulatory purposes) and to review them regularly.
Internal model validation involvesbusiness activity with a given solvency level. In the obtainment,case of Santander Group, the solvency level is determined by a sufficiently independent specialised unit of the Entity, of an expert opinion on the adequacy of the internal models for the intended internal management and/or regulatory purposes (calculation of regulatory capital, level of provisions, etc.), expressing a conclusion on their robustness, usefulness and effectiveness.
F-235
Internal model validation at Santander encompasses credit risk models, market risk models, financial asset pricing models and the economic capital model. The scope of the validation includes not only the more theoretical or methodological aspects, but also the technology systems and the quality of the data the models provide, onAA-/A+ long-term target rating, which their effective operation relies, and,results in general, all the relevant aspects of risk management (controls, reporting, uses, involvement of senior management, etc.).
The internal validation function is located, at corporate level, within the integrated risk control and internal risk validation area (CIVIR) and reports directly to the third deputy chairman of the Group and chairman of the risk committee. This function is performed at a global and corporate level in order to ensure uniformity of application, and is implemented through four regional centres located in Madrid, London, Sao Paulo and New York. From a functional and hierarchical standpoint, these centres are fully accountable to the corporate centre, thus ensuring consistency in the performance of their activities. This system facilitates the application of a corporate methodology that is supported by a set99.95% confidence level (higher than the regulatory 99.90%) for the purpose of tools developed internally by Santander that provide a robust corporate framework to be used at allcalculating the Group’s units and which automate certain verifications to ensure efficient reviews.
It should be noted that Santander Group’s corporate internal validation framework is fully consistent with the internal validation standards for advanced approaches issued by the Bank of Spain. Accordingly, the Group maintains the segregation of functions between internal validation and internal audit, which, in its role as the last layer of control at the Group, is responsible for reviewing the methodology, tools and work performed by internal validation and for giving its opinion on the degree of effective independence.
8. ECONOMIC CAPITAL
The concept of economic capital has traditionally been contrasted with that of regulatory capital, the latter being the measure required by capital adequacy regulations. The Basel II capital framework has without doubt brought the two concepts closer together. While Pillar I determines the minimum regulatory capital requirements, Pillar II quantifies, through economic capital, the Group’s overall capital adequacy position.capital.
The Group’s economic capital model enables it to quantifycomplements the consolidated risk profile taking into accountregulatory approach by including in its measurement all the significant risks incurred in the Group’s operations. Accordingly, it considers risks such as concentration risk, structural interest rate risk, business risk, pension risk and other risks outside the scope of the business (including risks not contemplated in regulatory capital), as well asPillar I capital requirements. Economic capital also includes the diversification effect, inherentwhich in a multi-national, multi-business groupthe case of Santander Group, owing to the multinational, multibusiness nature of its operations, is of key importance in determining its overall risk and solvency profile.
Comparison of regulatory and economic capital requirements is distorted because there are certain risks, such as Santander. The Group uses this model to prepare itsgoodwill, which for regulatory purposes are presented as deductions from the eligible capital base instead of being included as capital requirements. Similarly, the economic capital required for these risks can be presented as deductions from the internal capital adequacy assessment report in accordance with Bankbase (following the regulatory method) or as part of Spain regulationsthe economic capital requirements, which is the preferred option within the frameworkGroup. Furthermore, as we have mentioned above, measurement of economic capital includes certain risks that are not present in the regulatory approach (the so-called Pillar II of Basel II.risks).
The concept of diversification is fundamental tofor the proper measurement and understanding of the risk profile of a group with global operations. Although it is an intuitive conceptoperations such as Santander Group. The fact that has beenthe Group conducts its business activities in various countries through a partstructure of risk management since the very beginningsdifferentiated legal entities, across a broad spectrum of the banking business, diversification cancustomer and product segments, thereby also be explained in termsincurring various types of the imperfect correlation between the various risks, which means that the largest loss eventsGroup’s earnings are less vulnerable to any adverse situation that might arise with respect to a particular market, portfolio, customer or risk. Despite the current high level of globalization of the world’s economies, the economic cycles are not the same and do not occur simultaneouslyhave the same intensity in all portfolios or for all types of risk. Consequently, the sum of the economic capital of the various geographical regions. As a result, groups with global presence display more stable results and have a greater capacity to withstand possible crises affecting specific markets or portfolios, and typeswhich is synonymous with a lower level of risk, taken separately, is higher than the Group’s total economic capital.risk. In other words, the risk and the associated economic capital borne by the Group as a whole is less than the risk and the capital arising from the sum of its various components considered separately.
Additionally,
Lastly, the economic capital measurement and aggregation model also considers the concentration risk for wholesale portfolios (large corporations, banks and sovereigns), in terms of both the size of their exposure and their industry-based or geographical concentration. Any geographical or product concentration in retail portfolios is captured through the application of an appropriate correlation model.
Furthermore, economicEconomic capital is particularly well-suiteda fundamental tool for the internal Group management purposes, since it permitsand implementation of the Group’s strategy, from the viewpoint of both the assessment of targets, pricescapital adequacy and the management of portfolio and business viabilities, inter alia, and helps maximiserisk.
With regard to capital adequacy, in the Group’s profitability.
Analysiscontext of Pillar II of the globalBasel Capital Accord, the Group conducts the internal capital adequacy assessment process using its economic capital model. To this end, the Group plans the business performance and the capital requirements under a central scenario and under alternative stress scenarios. With this planning the Group ensures that it will continue to meet its capital adequacy targets, even in adverse economic scenarios.
Also, the economic capital metrics make it possible to assess risk-return targets, price transactions on a risk profilebasis and gauge the economic viability of projects, units or lines of business, with the ultimate objective of maximizing the generation of shareholder value.
Capital planning and stress tests
Capital stress tests have gained particular significance as a tool for the dynamic evaluation of banks’ risk exposure and capital adequacy. A new forward-looking assessment model is becoming a key component of capital adequacy analysis.
This forward-looking assessment is based on both macroeconomic and idiosyncratic scenarios that are highly improbable but nevertheless plausible. To conduct the assessment, it is necessary to have robust planning models capable of transferring the effects defined in the projected scenarios to the various elements that have a bearing on the adequacy of a bank’s capital.
The distributionultimate goal of economic capital amongstress tests is to perform a complete evaluation of banks’ risk exposure and capital adequacy in order to determine any possible capital requirements that would arise if banks failed to meet the main business areas reflectsregulatory or internal capital targets set.
In particular, the diversified natureEuropean Central Bank (ECB) has announced that the current comprehensive assessment that it will carry out in the course of 2014 ahead of taking up its role as the single supervisor (as part of the Group’s business activities and risk. In 2011 this diversification was affectedSingle Supervisory Mechanism (SSM)) will culminate in a stress test to be conducted by the varying growth performance acrossEuropean Banking Authority (EBA) in collaboration with the geographical areas,ECB itself, which is scheduled to be completed by November 2014. The objective of this entire process is to eradicate any possible uncertainty as to the purchasesolvency of the SEB businessEuropean banking system, to provide transparency on the resilience and solvency of banks and, where required in Germany, by the acquisition of Bank Zachodni WBK S.A. in Poland and, to a lesser degree, by the sale of a portionlight of the Latin American insurance business.test results, to adopt any necessary measures (including possible additional capital requirements).
More specifically, the forthcoming stress test will be conducted on a total sample of 124 banks covering at least 50% of the banking sector in each EU Member State (as expressed in terms of assets). The stress test will be carried out over a three-year time horizon and will assess the impact of risk drivers on the solvency of banks, including credit risk, market risk, sovereign risk, securitization and cost of funding.
The capital hurdle rates, measured in terms of Common Equity Tier 1 (CET1), are expected to be 8% CET1 for the baseline scenario and 5.5% CET1 for the adverse scenario. Publication of the results of the stress test is scheduled for the end of October 2014.
As a starting point for the stress test and within the scope of the comprehensive assessment, throughout 2014 the ECB will conduct an asset quality review (AQR), an in-depth analysis of banks’ balance sheets and the quality of their assets.
The Group has defined a capital planning and stress testing process not only to enable it to respond to the various regulatory exercises, but also to serve as a key tool forming an integral part of the Bank’s management and strategy.
F-236
Continental Europe accounts for almost 40%The purpose of the internal capital planning and stress testing process is to ensure the current and future sufficiency of the Group’s capital, while Latin America accounts for more thaneven in adverse but plausible economic scenarios. To this end, taking as a third (Brazil: 21%)basis the Group’s initial position (as defined by its financial statements, its capital base, its risk parameters and its regulatory ratios), the United Kingdom 10% and Sovereign 6%; the corporate financial management and investments area, which assumes the risk stemming from exposure to structural foreign currency risk (risk arising from holding investments in foreign subsidiaries denominated in currencies other than the euro) and mostestimates are made of the equity investments, represents 11%.expected outcomes for the Group in various business environments (including severe recessions as well as “normal” macroeconomic scenarios), and the Group’s capital adequacy ratios, projected generally over a three-year period, are obtained.
The diversification benefit under the economic capital model, including both intra-risk (i.e. geographical) and inter-risk diversification, amounted to approximately 22% in December 2011.
Additionally, the main purposeprocess implemented provides a comprehensive view of the Group’s capital planning is to obtain future projectionsfor the time horizon analyzed and in each of economic andthe scenarios defined. The analysis incorporates regulatory capital, so aseconomic capital and available capital metrics.
This process facilitates achievement of the ultimate goal pursued by capital planning, since it has become a strategically important element for the Group that:
In addition, the entire process is carried out with the maximum involvement and under the close supervision of senior management, and within a framework that guarantees suitable governance and the application of adequate levels of challenge, review and analysis to all components of the process.
One of the key elements in the capital planning and stress testing exercises, since it plays a particularly important role in income statement projections for the adverse scenarios defined, is the calculation of the provisions that would be required in those scenarios, primarily the provisions recognized to cover losses on the loan portfolios. Specifically, in order to calculate the credit loss provisions for its loan portfolio, Santander Group uses a methodology which ensures that, at all times, it has a level of provisions sufficient to cover all the credit losses projected by its internal expected loss models.
This methodology is widely accepted and is similar to that used in previous stress-testing exercises (e.g. the 2011 EBA stress test or the 2012 stress test on the Spanish banking sector).
Lastly, the capital planning and stress testing process culminates in an analysis of capital adequacy in the various scenarios. For each scenario, capital planning incorporatesscenarios designed and over the established time horizon. The aim is to assess the Group’s earnings forecasts, in a manner consistent withcapital adequacy and to ensure that it meets both its strategicinternal capital targets (organic and inorganic growth, pay-out ratio, etc.),all regulatory requirements.
In the performancecourse of the economyrecent economic crisis, the Group underwent four stress tests in which it proved its strength and solvency in the most extreme and severe macroeconomic scenarios. All the stress situations,tests evidenced that, thanks mainly to the Group’s business model and identifies possible capital management strategies enablinggeographical diversification, Banco Santander will continue to generate profit for its shareholders and to comply with the Bank to optimise its capital adequacy position and return on capital.most stringent regulatory requirements.
RORAC and value creation
SantanderThe Group has used RORAC methodology in its risk management since 1993, with the following objectives:
Calculation of economic capital requirements and of the return thereon for the Group’s business units, segments, portfolios and customers, in order to facilitate an optimal allocation of economic capital.
Budgeting of capital requirements and RORACs of the Group’s business units and inclusion thereof in their compensation plans.
Analysis and setting of prices in the decision-making process for transactions (loan approval) and customers (monitoring).
The RORAC methodology facilitates the comparison, on a like-for-like basis, of the performance of transactions, customers, portfolios and businesses, and identifies those which achieve a risk-adjusted return higher than the Group’s cost of capital, thus aligning risk management and business management with the aim of maximisingmaximizing value creation, which is the ultimate objective of Group senior management.
The Group periodically assesses the level of and evolution ofthe changes in the value creation (VC) and return on risk-adjusted capital (RORAC) of the Group and of its main business units. The VC is the profit generated over and above the cost of the economic capital (EC) used, and is calculated using the following formula:
VC = Profit - (average EC x cost of capital)
The profit used is obtained by making the required adjustments to accounting profit in order to reflect only the recurring profit obtained by each unit from its business activity.
The minimum rate of return on capital that a transaction should achieve is determined by the cost of capital, which is the minimum remuneration required by shareholders. In order to objectively calculate this rate, the premium that shareholders demand for investing in the Group is added to the risk-free return. This premium depends essentially on the degree of volatility of the market price of the Banco Santander share in relation to the market trend. The cost of capital for 2011 applied to the various Group units was 13.862%.
If a transaction or portfolio yields a positive return, it will be contributing to the Group’s profit, although it will only create shareholder value when this return exceeds the cost of capital.
2013 witnessed an uneven performance of the business units in terms of value creation, although the instances of decreasing value creation predominated. The Group’s return on risk-adjusted capital (RORAC) amply exceededresults and, therefore, the estimated costRORAC and value creation figures were shaped by the weakness of capital for 2011.
F-237
55. Other Disclosures
| 55. | Other Disclosures |
This Note includes relevant information about additional disclosure requirements.
55.1 Consolidated financial statements
Following are the consolidated balance sheets and consolidated statements of income of the Group under the IFRS reformatted to conform to the presentation guidelines for bank holding companies set forth in Regulation S-X Article 9 of the Securities and Exchange Commission of the United States of America.
The preparation of these financial statements requires management to make estimates and assumptions that affect the reported amounts and allocations of assets and liabilities and disclosure of contingent assets and liabilities and the reported amounts of revenues and expenses during the reported period. Actual results could differ from those estimates.
F-238
| Millions of Euros | ||||||||||||
| CONSOLIDATED BALANCE SHEET | 2011 | 2010 | 2009 | |||||||||
Assets | ||||||||||||
Cash and due from banks | 87,085 | 70,858 | 28,232 | |||||||||
Interest earning deposits in other banks | 25,042 | 25,063 | 29,288 | |||||||||
Securities purchased under agreements to resell | 11,817 | 9,989 | 21,288 | |||||||||
Trading account assets | 192,201 | 196,242 | 172,868 | |||||||||
Banks | 14,146 | 35,054 | 22,715 | |||||||||
Loans | 14,995 | 8,525 | 17,886 | |||||||||
Derivatives | 102,498 | 73,069 | 59,856 | |||||||||
Debt securities | 55,353 | 62,477 | 57,286 | |||||||||
Equity securities | 5,209 | 17,117 | 15,125 | |||||||||
Investment securities | 93,453 | 94,664 | 101,579 | |||||||||
Available-for-sale | 93,453 | 94,664 | 101,579 | |||||||||
Net Loans and leases | 714,479 | 702,459 | 653,349 | |||||||||
Loans and leases, net of unearned income | 733,363 | 722,121 | 671,184 | |||||||||
Less-Allowance for loan losses | (18,884 | ) | (19,662 | ) | (17,835 | ) | ||||||
Premises and equipment, net | 13,985 | 12,780 | 11,499 | |||||||||
Investment in affiliated companies | 4,155 | 273 | 164 | |||||||||
Other assets | 107,163 | 102,953 | 89,906 | |||||||||
Intangible Assets | 2,994 | 3,442 | 2,778 | |||||||||
Goodwill in consolidation | 25,089 | 24,622 | 22,865 | |||||||||
Accrual Accounts | 2,032 | 2,559 | 2,259 | |||||||||
Hedge derivatives | 9,898 | 8,227 | 7,834 | |||||||||
Others | 67,150 | 64,103 | 54,170 | |||||||||
|
|
|
|
|
| |||||||
Total assets | 1,249,380 | 1,215,281 | 1,108,173 | |||||||||
|
|
|
|
|
| |||||||
Liabilities | ||||||||||||
Deposits | 653,036 | 633,938 | 554,134 | |||||||||
Non interest deposits | 5,380 | 4,825 | 5,394 | |||||||||
Interest bearing | 647,656 | 629,113 | 548,740 | |||||||||
Demand deposits | 160,540 | 153,185 | 142,484 | |||||||||
Savings deposits | 140,583 | 136,694 | 127,941 | |||||||||
Time deposits | 346,533 | 339,234 | 278,315 | |||||||||
Certificates of deposit | — | — | — | |||||||||
Short-term debt | 131,930 | 130,730 | 124,189 | |||||||||
Long-term debt | 208,590 | 216,476 | 220,090 | |||||||||
Other liabilities | 172,965 | 153,222 | 135,890 | |||||||||
Taxes Payable | 8,174 | 8,618 | 7,005 | |||||||||
Accounts Payable | 6,632 | 8,286 | 7,859 | |||||||||
Accrual Accounts | 5,470 | 4,953 | 5,503 | |||||||||
Pension Allowance | 6,899 | 7,299 | 8,273 | |||||||||
Stock borrowing liabilities | — | — | — | |||||||||
Derivatives | 109,527 | 81,913 | 63,904 | |||||||||
Liabilities under insurance contracts | 517 | 10,449 | 16,916 | |||||||||
Other Provisions | 6,526 | 6,141 | 6,904 | |||||||||
Short securities positions | 10,187 | 12,303 | 5,140 | |||||||||
Others | 19,033 | 13,260 | 14,386 | |||||||||
|
|
|
|
|
| |||||||
Total liabilities | 1,166,521 | 1,134,366 | 1,034,303 | |||||||||
Equity | ||||||||||||
Stockholders’ equity | ||||||||||||
Capital stock | 4,455 | 4,164 | 4,114 | |||||||||
Additional paid-in-capital | 31,223 | 29,457 | 29,305 | |||||||||
Other additional capital | (1,821 | ) | (1,462 | ) | (2,326 | ) | ||||||
Current year earnings | 5,351 | 8,181 | 8,943 | |||||||||
Other reserves | 37,206 | 34,678 | 28,631 | |||||||||
|
|
|
|
|
| |||||||
Total stockholders’ equity | 76,414 | 75,018 | 68,667 | |||||||||
|
|
|
|
|
| |||||||
Non-controlling interests | 6,445 | 5,897 | 5,203 | |||||||||
Total Equity | 82,859 | 80,915 | 73,870 | |||||||||
Total liabilities and Equity | 1,249,380 | 1,215,281 | 1,108,173 | |||||||||
Assets Cash and due from banks Interest earning deposits in other banks Securities purchased under agreements to resell Trading account assets Banks Loans Derivatives Debt securities Equity securities Investment securities Available-for-sale Net Loans and leases Loans and leases, net of unearned income Less-Allowance for loan losses Premises and equipment, net Investment in affiliated companies Other assets Intangible Assets Goodwill in consolidation Accrual Accounts Hedge derivatives Others Total assets Liabilities Deposits Non interest deposits Interest bearing Demand deposits Savings deposits Time deposits Certificates of deposit Short-term debt Long-term debt Other liabilities Taxes Payable Accounts Payable Accrual Accounts Pension Allowance Stock borrowing liabilities Derivatives Liabilities under insurance contracts Other Provisions Short securities positions Others Total liabilities Equity Stockholders’ equity Capital stock Additional paid-in-capital Other additional capital Current year earnings Other reserves Total stockholders’ equity Non-controlling interests Total Equity Total liabilities and EquityF-239 Millions of Euros 2013 2012 2011 72,512 111,663 87,085 26,405 28,214 25,042 16,192 13,527 11,817 146,670 206,273 192,201 29,792 31,644 14,146 7,430 11,569 14,995 58,899 110,319 102,498 44,716 46,561 55,353 5,833 6,180 5,209 91,685 99,325 93,453 91,685 99,325 93,453 642,441 683,449 712,920 667,270 708,831 731,675 (24,829 ) (25,382 ) (18,755 ) 13,812 14,483 13,985 5,536 4,454 4,155 100,042 107,806 108,206 2,960 3,436 2,994 23,281 24,626 25,089 2,112 1,757 2,032 8,301 7,936 9,898 63,388 70,051 68,193 1,115,295 1,269,194 1,248,864 624,616 678,383 653,036 5,623 5,285 5,380 618,993 673,098 647,656 172,074 149,186 160,540 164,214 167,389 140,583 282,705 356,523 346,533 — — — 105,111 120,481 131,930 177,671 202,223 208,590 127,996 186,832 174,494 6,079 7,765 7,966 4,731 4,908 6,632 5,068 5,181 5,470 8,784 9,948 8,636 — — — 64,170 116,187 109,527 1,430 1,425 517 5,348 5,795 6,526 15,951 15,181 10,187 16,435 20,442 19,033 1,035,394 1,187,919 1,168,050 5,667 5,161 4,455 36,804 37,412 31,223 (415 ) (937 ) (1,821 ) 4,370 2,295 5,330 24,161 27,929 35,273 70,587 71,860 74,460 9,314 9,415 6,354 79,901 81,275 80,814 1,115,295 1,269,194 1,248,864
The Group has issued Mortgage backed securities, calledCédulas Hipotecarias (see Note 22). Additionally, as of December 31, 2011, 20102013, 2012 and 2009,2011, the investment debt securities assigned to certain Group or third-party commitments amounted to € 42,433 million, €61,335 million and €43,899 million, €27,034 million and €39,661 million, respectively.
CONSOLIDATED STATEMENTS OF INCOME
| Millions of Euros | Millions of Euros | |||||||||||||||||||||||
| CONSOLIDATED STATEMENTS OF INCOME | 2011 | 2010 | 2009 | |||||||||||||||||||||
| 2013 | 2012 | 2011 | ||||||||||||||||||||||
Interest income: | ||||||||||||||||||||||||
Interest and fees on loans and leases | 48,031 | 42,514 | 42,708 | 41,378 | 47,076 | 47,793 | ||||||||||||||||||
Interest on deposits in other banks | 3,806 | 2,881 | 3,362 | 1,778 | 2,851 | 3,806 | ||||||||||||||||||
Interest on securities purchased under agreements to resell | 1,175 | 979 | 1,156 | 1,813 | 1,474 | 1,175 | ||||||||||||||||||
Interest on investment securities | 8,152 | 6,801 | 6,285 | 6,846 | 7,767 | 8,152 | ||||||||||||||||||
Dividends | — | — | 5 | — | — | — | ||||||||||||||||||
Total interest income | 61,164 | 53,175 | 53,516 | 51,815 | 59,168 | 60,926 | ||||||||||||||||||
Interest expenses: | ||||||||||||||||||||||||
Interest on deposits | (17,045 | ) | (13,733 | ) | (15,852 | ) | (14,663 | ) | (16,563 | ) | (17,034 | ) | ||||||||||||
Interest on short-term borrowings | (4,531 | ) | (3,258 | ) | (2,929 | ) | (3,852 | ) | (4,397 | ) | (4,531 | ) | ||||||||||||
Interest on long-term debt | (6,928 | ) | (5,117 | ) | (6,562 | ) | (5,901 | ) | (6,731 | ) | (6,928 | ) | ||||||||||||
Total interest expense | (28,504 | ) | (22,108 | ) | (25,343 | ) | (24,416 | ) | (27,691 | ) | (28,493 | ) | ||||||||||||
Interest income / (Charges) | 32,660 | 31,067 | 28,173 | 27,399 | 31,477 | 32,433 | ||||||||||||||||||
Provision for credit losses | (11,164 | ) | (10,258 | ) | (11,010 | ) | (11,058 | ) | (18,536 | ) | (11,090 | ) | ||||||||||||
Interest income / (Charges) after provision for credit losses | 21,496 | 20,809 | 17,163 | 16,341 | 12,941 | 21,343 | ||||||||||||||||||
Non interest income: | ||||||||||||||||||||||||
Commissions and fees from fiduciary activities | 1,340 | 1,350 | 1,220 | 1,204 | 1,217 | 1,340 | ||||||||||||||||||
Commissions and fees from securities activities, net | 668 | 784 | 774 | 678 | 702 | 668 | ||||||||||||||||||
Fees and commissions from insurance activities | 8,939 | 9,044 | 8,858 | 6,631 | 7,807 | 8,908 | ||||||||||||||||||
Other Fees and commissions, net | 5,971 | 5,439 | 5,122 | 5,480 | 5,890 | 5,938 | ||||||||||||||||||
Gains (losses) from: | ||||||||||||||||||||||||
Affiliated companies’ securities | 1,851 | 170 | 1,522 | 2,662 | 1,200 | 1,851 | ||||||||||||||||||
Investment securities | (540 | ) | 2,108 | 4,552 | 3,350 | 2,483 | (540 | ) | ||||||||||||||||
Foreign exchange, derivatives and other, net | 2,169 | 320 | (812 | ) | (137 | ) | 339 | 2,169 | ||||||||||||||||
Sale of premises | 52 | 197 | 37 | (4 | ) | 133 | 52 | |||||||||||||||||
Income from non financial entities | 401 | 345 | 382 | 322 | 369 | 401 | ||||||||||||||||||
Gains on sale of non-current assets / liabilities held for sale not classified as discontinued operations | 92 | 210 | 415 | 122 | 325 | 92 | ||||||||||||||||||
Other income | 1,113 | 811 | 487 | 962 | 1,110 | 1,113 | ||||||||||||||||||
Total non interest income | 22,056 | 20,778 | 22,557 | 21,270 | 21,575 | 21,992 | ||||||||||||||||||
Non interest expense: | ||||||||||||||||||||||||
Salaries and employee benefits | (10,860 | ) | (9,917 | ) | (9,177 | ) | (10,838 | ) | (10,501 | ) | (10,865 | ) | ||||||||||||
Occupancy expense of premises, depreciation and maintenance, net | (2,693 | ) | (2,502 | ) | (2,255 | ) | (2,969 | ) | (2,940 | ) | (2,688 | ) | ||||||||||||
General and administrative expenses | (5,683 | ) | (5,280 | ) | (4,890 | ) | (5,451 | ) | (5,626 | ) | (5,566 | ) | ||||||||||||
Impairment of goodwill | (760 | ) | (63 | ) | (3 | ) | (40 | ) | (156 | ) | (760 | ) | ||||||||||||
Impairment / amortization of intangible assets | (1,689 | ) | (1,091 | ) | (855 | ) | (1,355 | ) | (1,106 | ) | (1,685 | ) | ||||||||||||
Impairment of tangible assets | (2,176 | ) | (530 | ) | (1,503 | ) | (764 | ) | (1,019 | ) | (2,176 | ) | ||||||||||||
Provisions for specific allowances | (2,387 | ) | (924 | ) | (1,444 | ) | (1,761 | ) | (1,646 | ) | (2,375 | ) | ||||||||||||
Payments to Deposit Guarantee Fund | (346 | ) | (307 | ) | (318 | ) | (559 | ) | (530 | ) | (346 | ) | ||||||||||||
Insurance claims | (7,164 | ) | (7,591 | ) | (7,605 | ) | (4,831 | ) | (5,516 | ) | (7,164 | ) | ||||||||||||
Expenses of non financial entities | (249 | ) | (205 | ) | (244 | ) | (231 | ) | (232 | ) | (249 | ) | ||||||||||||
Losses on sale of non-current assets / liabilities held for sale not classified as discontinued operations | (404 | ) | (201 | ) | (289 | ) | (210 | ) | (633 | ) | (404 | ) | ||||||||||||
Other expenses | (1,202 | ) | (924 | ) | (549 | ) | (950 | ) | (1,028 | ) | (1,199 | ) | ||||||||||||
Total non interest expense | (35,613 | ) | (29,535 | ) | (29,132 | ) | (29,959 | ) | (30,933 | ) | (35,477 | ) | ||||||||||||
Income before income taxes | 7,939 | 12,052 | 10,588 | 7,652 | 3,583 | 7,858 | ||||||||||||||||||
Income tax expense | (1,776 | ) | (2,923 | ) | (1,207 | ) | (2,113 | ) | (590 | ) | (1,755 | ) | ||||||||||||
Net consolidated income for the year | 6,163 | 9,129 | 9,381 | 5,539 | 2,993 | 6,103 | ||||||||||||||||||
Net income attributed to non-controlling interests | 788 | 921 | 466 | 1,154 | 768 | 788 | ||||||||||||||||||
Income from discontinued operation, net of taxes | (24 | ) | (27 | ) | 27 | (15 | ) | 70 | 15 | |||||||||||||||
NET INCOME ATTRIBUTED TO THE GROUP | 5,351 | 8,181 | 8,942 | 4,370 | 2,295 | 5,330 | ||||||||||||||||||
CONSOLIDATED PROFIT FOR THE YEAR OTHER RECOGNIZED INCOME AND EXPENSE Items that will not be reclassified to profit or loss Actuarial gains/(losses) on defined benefit pension plans Non-current assets held for sale Income tax relating to items that will not be reclassified to profit or loss Items that may be reclassified to profit or loss Available-for-sale financial assets: Revaluation gains/(losses) Amounts transferred to income statement Other reclassifications Cash flow hedges: Revaluation gains/(losses) Amounts transferred to income statement Amounts transferred to initial carrying amount of hedged items Other reclassifications Hedges of net investments in foreign operations: Revaluation gains/(losses) Amounts transferred to income statement Other reclassifications Exchange differences: Revaluation gains/(losses) Amounts transferred to income statement Other reclassifications Non-current assets held for sale: Revaluation gains/(losses) Amounts transferred to income statement Other reclassifications Entities accounted for using the equity method: Revaluation gains/(losses) Amounts transferred to income statement Other reclassifications Other recognized income and expense Income tax relating to items that may be reclassified to profit or loss TOTAL RECOGNIZED INCOME AND EXPENSE Attributable to the Parent Attributable to non-controlling interests 2013 2012 2011 5,524 3,063 6,118 (5,912 ) (3,711 ) (3,145 ) 188 (1,123 ) (575 ) 502 (1,708 ) (880 ) — — — (314 ) 585 305 (6,100 ) (2,588 ) (2,570 ) (99 ) 1,171 344 1,150 1,729 231 (1,250 ) (558 ) 156 1 — (43 ) 47 (84 ) (17 ) 463 129 (109 ) (416 ) (249 ) 92 — — — — 36 — 1,117 (1,107 ) 106 1,074 (1,336 ) 13 38 229 9 5 — 84 (7,027 ) (2,170 ) (2,824 ) (7,019 ) (1,833 ) (2,906 ) (37 ) (330 ) 85 29 (7 ) (3 ) — — — — — — — — — — — — (294 ) (57 ) (95 ) (283 ) (61 ) (37 ) 23 21 — (34 ) (17 ) (58 ) — — — 156 (341 ) (84 ) (388 ) (648 ) 2,973 (308 ) (764 ) 2,642 (80 ) 116 331
F-240
Following are the summarizedcondensed balance sheets of Banco Santander, S.A. as of December 31, 2011, 200102013, 2012 and 2009.2011.
| 2013 | 2012 | 2011 | ||||||||||||||||||||||
CONDENSED BALANCE SHEETS (Parent company only) | 2011 | 2010 | 2009 | (Millions of Euros) | ||||||||||||||||||||
| (Millions of Euros) | ||||||||||||||||||||||||
Assets | ||||||||||||||||||||||||
Cash and due from banks | 73,254 | 70,716 | 70,923 | 64,402 | 94,931 | 73,254 | ||||||||||||||||||
Of which: | ||||||||||||||||||||||||
To bank subsidiaries | 35,270 | 35,591 | 36,459 | 27,244 | 30,004 | 35,270 | ||||||||||||||||||
Trading account assets | 91,330 | 67,807 | 57,262 | 63,928 | 95,556 | 91,330 | ||||||||||||||||||
Investment securities | 43,746 | 29,850 | 34,034 | 53,598 | 47,097 | 43,746 | ||||||||||||||||||
Of which: | ||||||||||||||||||||||||
To bank subsidiaries | 16,581 | 9,576 | 3,873 | 20,656 | 18,491 | 16,581 | ||||||||||||||||||
To non-bank subsidiaries | — | — | 353 | — | 164 | — | ||||||||||||||||||
Net Loans and leases | 174,775 | 186,505 | 174,645 | 187,758 | 152,933 | 174,775 | ||||||||||||||||||
Of which: | ||||||||||||||||||||||||
To non-bank subsidiaries | 37,602 | 31,039 | 28,948 | 23,549 | 26,553 | 37,602 | ||||||||||||||||||
Investment in affiliated companies | 68,559 | 60,497 | 67,430 | 70,527 | 72,714 | 68,559 | ||||||||||||||||||
Of which: | ||||||||||||||||||||||||
To bank subsidiaries | 62,988 | 58,105 | 64,776 | 62,234 | 64,550 | 62,988 | ||||||||||||||||||
To non-bank subsidiaries | 5,571 | 2,392 | 2,654 | 8,293 | 8,163 | 5,571 | ||||||||||||||||||
Premises and equipment, net | 1,211 | 1,272 | 1,339 | 1,851 | 990 | 1,211 | ||||||||||||||||||
Other assets | 13,134 | 12,648 | 10,436 | 16,829 | 11,694 | 13,282 | ||||||||||||||||||
|
|
|
|
|
| |||||||||||||||||||
Total assets | 466,009 | 429,295 | 416,069 | 458,893 | 475,915 | 466,157 | ||||||||||||||||||
Liabilities | ||||||||||||||||||||||||
Deposits | 225,232 | 221,027 | 236,833 | 247,206 | 249,928 | 225,232 | ||||||||||||||||||
Of which: | ||||||||||||||||||||||||
To bank subsidiaries | 17,447 | 27,779 | 19,263 | 21,610 | 20,775 | 17,447 | ||||||||||||||||||
To non-bank subsidiaries | 56,818 | 59,393 | 75,312 | 46,347 | 54,300 | 56,818 | ||||||||||||||||||
Short-term debt | 42,785 | 26,924 | 13,598 | 38,391 | 34,080 | 42,785 | ||||||||||||||||||
Long-term debt | 56,486 | 59,801 | 59,885 | 54,632 | 48,643 | 56,486 | ||||||||||||||||||
Total debt | 99,271 | 86,725 | 73,483 | 93,023 | 82,723 | 99,271 | ||||||||||||||||||
Of which: | ||||||||||||||||||||||||
To bank subsidiaries | 4,009 | 133 | — | 1,883 | 4,474 | 4,009 | ||||||||||||||||||
To non-bank subsidiaries | 25,815 | 29,111 | 31,162 | 18,680 | 18,174 | 25,815 | ||||||||||||||||||
Other liabilities | 96,128 | 76,825 | 59,572 | 69,919 | 98,707 | 96,619 | ||||||||||||||||||
|
|
|
|
|
| |||||||||||||||||||
Total liabilities | 420,631 | 384,577 | 369,888 | 410,148 | 431,358 | 421,122 | ||||||||||||||||||
Stockholders’ equity | ||||||||||||||||||||||||
Capital stock | 4,455 | 4,165 | 4,114 | 5,667 | 5,161 | 4,455 | ||||||||||||||||||
Retained earnings and other reserves | 40,923 | 40,553 | 42,067 | 43,078 | 39,396 | 40,580 | ||||||||||||||||||
|
|
|
|
|
| |||||||||||||||||||
Total stockholders’ equity | 45,378 | 44,718 | 46,181 | 48,745 | 44,557 | 45,035 | ||||||||||||||||||
Total liabilities and Stockholders’ Equity | 466,009 | 429,295 | 416,069 | 458,893 | 475,915 | 466,157 | ||||||||||||||||||
In the financial statements of the Parent Company, investments in subsidiaries, jointly controlled entities and associates are recorded at cost.
Following are the summarizedcondensed statements of income of Banco Santander, S.A. for the years ended December 31, 2011, 20102012, 2012 and 2009.
F-241
CONDENSED STATEMENTS OF INCOME (Parent company only) | 2011 | 2010 | 2009 | 2013 | 2012 | 2011 | ||||||||||||||||||
| (Millions of Euros) | ||||||||||||||||||||||||
| (Millions of Euros) | ||||||||||||||||||||||||
Interest income | ||||||||||||||||||||||||
Interest from earning assets | 10,355 | 9,061 | 11,410 | 10,568 | 10,448 | 10,355 | ||||||||||||||||||
Dividends from affiliated companies | 3,913 | 5,515 | 2,457 | 2,769 | 5,311 | 3,913 | ||||||||||||||||||
Of which: | ||||||||||||||||||||||||
From bank subsidiaries | 3,557 | 5,452 | 1,887 | 1,788 | 4,716 | 3,557 | ||||||||||||||||||
From non-bank subsidiaries | 356 | 63 | 570 | 981 | 595 | 356 | ||||||||||||||||||
|
|
|
|
|
| |||||||||||||||||||
| 14,268 | 14,576 | 13,867 | 13,337 | 15,759 | 14,268 | |||||||||||||||||||
Interest expense | (7,193 | ) | (5,817 | ) | (7,117 | ) | (7,178 | ) | (6,677 | ) | (7,193 | ) | ||||||||||||
|
|
|
|
|
| |||||||||||||||||||
Interest income / (Charges) | 7,075 | 8,759 | 6,750 | 6,159 | 9,082 | 7,075 | ||||||||||||||||||
Provision for credit losses | (1,985 | ) | (2,132 | ) | (331 | ) | (2,887 | ) | (6,072 | ) | (1,985 | ) | ||||||||||||
|
|
|
|
|
| |||||||||||||||||||
Interest income / (Charges) after provision for credit losses | 5,090 | 6,627 | 6,419 | 3,272 | 3,010 | 5,090 | ||||||||||||||||||
Non interest income: | 393 | 716 | 1,484 | 4,875 | 4,638 | 393 | ||||||||||||||||||
Non interest expense: | (3,295 | ) | (3,950 | ) | (3,688 | ) | (7,509 | ) | (6,649 | ) | (3,293 | ) | ||||||||||||
|
|
|
|
|
| |||||||||||||||||||
Income before income taxes | 2,188 | 3,393 | 4,215 | 638 | 999 | 2,190 | ||||||||||||||||||
Income tax expense | (37 | ) | (61 | ) | (63 | ) | 392 | 384 | (37 | ) | ||||||||||||||
|
|
|
|
|
| |||||||||||||||||||
Net income | 2,151 | 3,332 | 4,152 | 1,030 | 1,383 | 2,153 | ||||||||||||||||||
Following are the summarizedcondensed statement of comprehensive income of Banco Santander, S.A. for the years ended December 31, 2013, 2012 and 2011:
CONDENSED STATEMENTS OF COMPREHENSIVE INCOME (Parent company only) | Millions of Euros | |||||||||||
| 2013 | 2012 | 2011 | ||||||||||
NET INCOME | 1,030 | 1,383 | 2,153 | |||||||||
OTHER COMPREHENSIVE INCOME | 1,380 | (450 | ) | 345 | ||||||||
Items that may be reclassified subsequently to profit or loss | 1,315 | (111 | ) | 446 | ||||||||
Available-for-sale financial assets: | 1,759 | (135 | ) | 617 | ||||||||
Revaluation gains/(losses) | 2,767 | (112 | ) | 357 | ||||||||
Amounts transferred to income statement | (1,008 | ) | (23 | ) | 260 | |||||||
Other reclassifications | — | — | — | |||||||||
Cash flow hedges: | 3 | — | — | |||||||||
Revaluation gains/(losses) | 10 | — | — | |||||||||
Amounts transferred to income statement | (7 | ) | — | — | ||||||||
Amounts transferred to initial carrying amount of hedged items | — | — | — | |||||||||
Other reclassifications | — | — | — | |||||||||
Hedges of net investments in foreign operations: | 118 | (20 | ) | 17 | ||||||||
Revaluation gains/(losses) | 118 | (20 | ) | 21 | ||||||||
Amounts transferred to income statement | — | — | (4 | ) | ||||||||
Other reclassifications | — | — | — | |||||||||
Exchange differences: | — | — | — | |||||||||
Non-current assets held for sale: | — | — | — | |||||||||
Actuarial gains/(losses) on pension plans | — | — | — | |||||||||
Other comprehensive income | — | — | — | |||||||||
Income tax | (565 | ) | 44 | (188 | ) | |||||||
Items that will not be reclassified to profit or loss: | 65 | (339 | ) | (101 | ) | |||||||
Actuarial gains/(losses) on pension plans | 93 | (470 | ) | (145 | ) | |||||||
Income tax | (28 | ) | 131 | 44 | ||||||||
TOTAL COMPREHENSIVE INCOME | 2,410 | 933 | 2,498 | |||||||||
Following are the condensed cash flow statements of Banco Santander, S.A. for the years ended December 31, 2011, 20102013, 2012 and 2009.2011.
CONDENSED CASH FLOW STATEMENTS (Parent company only) | 2011 | 2010 | 2009 | 2013 | 2012 | 2011 | ||||||||||||||||||
| (Millions of Euros) | (Millions of Euros) | |||||||||||||||||||||||
1. Cash flows from operating activities | ||||||||||||||||||||||||
Consolidated profit | 2,151 | 3,332 | 4,151 | 1,030 | 1,383 | 2,153 | ||||||||||||||||||
Adjustments to profit | 4,172 | 3,054 | 1,306 | 6,426 | 6,814 | 4,170 | ||||||||||||||||||
Net increase/decrease in operating assets | (2,958 | ) | 14,923 | (12,901 | ) | 50,394 | 18,872 | 2,958 | ||||||||||||||||
Net increase/decrease in operating liabilities | 17,295 | 13,166 | (26,129 | ) | (93,431 | ) | 5,784 | 17,295 | ||||||||||||||||
Reimbusements/payments of income tax | 6 | 215 | 254 | |||||||||||||||||||||
Reimbursements/payments of income tax | 99 | 82 | 6 | |||||||||||||||||||||
Total net cash flows from operating activities (1) | 26,582 | 4,844 | (7,517 | ) | (35,482 | ) | 32,935 | 26,582 | ||||||||||||||||
2. Cash flows from investing activities | ||||||||||||||||||||||||
Investments (-) | (9,377 | ) | (1,329 | ) | (3,642 | ) | (1,398 | ) | (6,235 | ) | (9,377 | ) | ||||||||||||
Divestments (+) | 1,470 | 4,577 | 2,027 | 698 | 4,281 | 1,470 | ||||||||||||||||||
Total net cash flows from investment activities (2) | (7,907 | ) | 3,248 | (1,615 | ) | (700 | ) | (1,954 | ) | (7,907 | ) | |||||||||||||
3. Cash flows from financing activities | ||||||||||||||||||||||||
Disposal of own equity instruments | 2,621 | 2,343 | 32 | 2,893 | 1,266 | 2,621 | ||||||||||||||||||
Acquisition of own equity instruments | (2,621 | ) | (2,314 | ) | (61 | ) | (2,857 | ) | (1,324 | ) | (2,621 | ) | ||||||||||||
Issuance of debt securities | — | 6,970 | 1,946 | — | — | — | ||||||||||||||||||
Redemption of debt securities | (3,881 | ) | (9,438 | ) | — | (36 | ) | (6,891 | ) | (3,881 | ) | |||||||||||||
Dividends paid | (3,489 | ) | (4,107 | ) | (4,387 | ) | (818 | ) | (1,287 | ) | (3,489 | ) | ||||||||||||
Issuance/Redemption of equity instruments | — | — | — | — | — | — | ||||||||||||||||||
Other collections/payments related to financing activities | (115 | ) | (377 | ) | (438 | ) | (286 | ) | (675 | ) | (115 | ) | ||||||||||||
Total net cash flows from financing activities (3) | (7,485 | ) | (6,923 | ) | (2,908 | ) | (1,104 | ) | (8,911 | ) | (7,485 | ) | ||||||||||||
4. Effect of exchange rate changes on cash and cash equivalents (4) | 110 | 251 | 113 | (148 | ) | (66 | ) | 110 | ||||||||||||||||
5. Net increase/decrease in cash and cash equivalents (1+2+3+4) | 11,300 | 1,420 | (11,927 | ) | (37,434 | ) | 22,004 | 11,300 | ||||||||||||||||
Cash and cash equivalents at beginning of period | 8,047 | 6,627 | 18,554 | 48,363 | 19,347 | 8,047 | ||||||||||||||||||
Cash and cash equivalents at end of period | 19,347 | 8,047 | 6,627 | 10,929 | 41,351 | 19,347 | ||||||||||||||||||
F-242
55.2 Preference Shares and Preferred Securities
The following table shows the balance of the preference shares and preferred securities as of December 31, 2011, 20102013, 2012 and 2009:2011:
| 2011 | 2010 | 2009 | 2013 | 2012 | 2011 | |||||||||||||||||||
| (Millions of Euros) | (Millions of Euros) | |||||||||||||||||||||||
Preference shares | 449 | 435 | 430 | 401 | 421 | 449 | ||||||||||||||||||
Preferred securities | 5,447 | 6,917 | 7,315 | 3,652 | 4,319 | 5,447 | ||||||||||||||||||
|
|
|
|
|
| |||||||||||||||||||
Total at year-end | 5,896 | 7,352 | 7,745 | |||||||||||||||||||||
|
|
| ||||||||||||||||||||||
Total at year-end 4 | 4,053 | 4,740 | 5,896 | |||||||||||||||||||||
Both Preference Shares and Preferred Securities are recorded under the “Financial liabilities at amortized cost – Subordinated Liabilities” caption in the consolidated balance sheet as of December 31, 2011, 20102013, 2012 and 2009.2011.
Preference Shares include the financial instruments issued by the consolidated companies which, although equity for legal purposes, do not meet the requirements for classification as equity in the financial statements. These shares do not carry any voting rights and are non-cumulative. They were subscribed to by non-Group third parties except for the shares of Santander UK, plc amounting to GBP 200 million, are redeemable at the discretion of the issuer, based on the conditions of the issuer. None of these issues are convertible into Bank shares or granted privileges or right which, in certain circumstances, make them convertibles into shares.
This category includes non-cumulative preferred non-voting shares issued by Banesto Holdings, Santander UK plc, and Santander Holdings USA, Inc., Santander Bank, National Association and Banesto Holdings, Ltd.
For the purposes of payment priority, Preferred Securities are junior to all general creditors and to subordinated deposits. The payment of dividends on these securities, which have no voting rights, is conditional upon the obtainment of sufficient distributable profit and upon the limits imposed by Spanish banking regulations on equity.
This category includes non-cumulative preferred non-voting securities issued by Santander Finance Capital, S.A. (Unipersonal), Santander Finance Preferred, S.A. (Unipersonal), and Santander International Preferred, S.A. (Sociedad Unipersonal), guaranteed by the Bank. It also includes non-cumulative preferred non-voting securities issued by Banesto Preferentes, S.A, Banco Español de Crédito,Santander, S.A., Santander PR Capital Trust and Santander UK Group.
Except the issues of Santander PR Capital Trust I, which redeems in 2036, all preference
Preference shares and preferred securities are perpetual securities and there is no obligation that requires the Group to redeem them. All securities have been fully subscribed by third parties outside the Group. In the consolidated balance sheets, these securities are shown net of any temporary operations relating to liquidity guarantees (see Note 23 and Exhibit III), and are described in the table below:
F-243
Outstanding at December 31, 2011 | ||||||||||||||||||
| Amount in | Outstanding at December 31, 2013 | |||||||||||||||||
Preference Shares | currency | Redemption | Amount in currency (million) | Interest rate | Redemption | |||||||||||||
Issuer/Date of issue | Currency | (million) | Interest rate | Option (1) | Currency | |||||||||||||
Banesto Holding, Ltd, December 1992 | US Dollar | 45.1 | 10.500% | June 30, 2012 | US Dollar | 1.6 | 10.50% | June 30, 2012 | ||||||||||
Santander UK plc, October 1995 | Pounds Sterling | 68.0 | 10.375% | No option | Pounds Sterling | 80.3 | 10.375% | No option | ||||||||||
Santander UK plc, February 1996 | Pounds Sterling | 68.0 | 10.375% | No option | Pounds Sterling | 80.3 | 10.375% | No option | ||||||||||
Santander UK plc, March 2004 | Pounds Sterling | 13.6 | 5.827% | March 22, 2016 | Pounds Sterling | 6.5 | 5.827% | March 22, 2016 | ||||||||||
Santander UK plc, May 2006 | Pounds Sterling | 34.9 | 6.222% (2) | May 24, 2019 | Pounds Sterling | 34.9 | 6.222%(2) | May 24, 2019 | ||||||||||
Santander Holdings USA, Inc, August 2000 | US Dollar | 149.0 | 12.000% | May 16, 2020 | ||||||||||||||
Santander Holdings USA, Inc, May 2006 | US Dollar | 75.5 | 7.300% | May 15, 2011 | ||||||||||||||
Santander Bank, National Association, August 2000 | US Dollar | 150.4 | 12.000% | May 16, 2020 | ||||||||||||||
Santander Holdings USA, Inc, May 2006 (*) | US Dollar | 75.5 | 7.300% | May 15, 2011 | ||||||||||||||
Outstanding at December 31, 2011 | Outstanding at December 31, 2013 | |||||||||||||||||
Preferred Securities | Amount in currency | Interest rate | Maturity date | Amount in currency (million) | Interest rate | Maturity date | ||||||||||||
Issuer/Date of issue | Currency | (million) | Currency | |||||||||||||||
Banesto Group | ||||||||||||||||||
Banco Santander, S.A. | ||||||||||||||||||
Banco Español de Crédito, October 2004 | Euro | 86.9 | €CMS 10 + 0.125% | Perpetuity | Euro | 36.5 | €CMS 10 + 0.125% | Perpetuity | ||||||||||
Banco Español de Crédito (1), November 2004 | Euro | 153.0 | 5.5% | Perpetuity | Euro | 106.7 | 5.5% | Perpetuity | ||||||||||
Banco Español de Crédito, June 2009 | Euro | 497.5 | 6.0% | Perpetuity | Euro | 7.8 | 6.0% | Perpetuity | ||||||||||
Santander Finance Capital, S.A. (Unipersonal) | ||||||||||||||||||
March 2009 | US Dollar | 18.2 | 2.0% | Perpetuity | US Dollar | 18.2 | 2.0% | Perpetuity | ||||||||||
March 2009 | US Dollar | 25.0 | 2.0% | Perpetuity | US Dollar | 25.0 | 2.0% | Perpetuity | ||||||||||
March 2009 | Euro | 313.7 | 2.0% | Perpetuity | Euro | 310.1 | 2.0% | Perpetuity | ||||||||||
March 2009 | Euro | 153.7 | 2.0% | Perpetuity | Euro | 153.5 | 2.0% | Perpetuity | ||||||||||
June 2009 | Euro | 22.0 | Euribor (3M) + 2.2% | Perpetuity | Euro | 20.9 | Euribor (3M) + 2.2% | Perpetuity | ||||||||||
Santander Finance Preferred, S.A. (Unipersonal) | ||||||||||||||||||
March 2004 | US Dollar | 89.3 | 6.41% | Perpetuity | ||||||||||||||
March 2004 (*) | US Dollar | 89.3 | 6.41% | Perpetuity | ||||||||||||||
September 2004 | Euro | 174.2 | €CMS 10 +0.05% subject to a maximum distribution of 8% per annum | Perpetuity | Euro | 144.0 | €CMS 10 +0.05% subject to a maximum distribution of 8% per annum | Perpetuity | ||||||||||
October 2004 | Euro | 165.1 | 5.75% | Perpetuity | Euro | 155.0 | 5.75% | Perpetuity | ||||||||||
November 2006 | US Dollar | 161.8 | 6.80% | Perpetuity | ||||||||||||||
January 2007 | US Dollar | 109.5 | 6.50% | Perpetuity | ||||||||||||||
March 2007 | US Dollar | 210.1 | US3M + 0.52% | Perpetuity | ||||||||||||||
November 2006 (*) | US Dollar | 161.8 | 6.80% | Perpetuity | ||||||||||||||
January 2007 (*) | US Dollar | 109.5 | 6.50% | Perpetuity | ||||||||||||||
March 2007 (*) | US Dollar | 210.4 | US3M + 0.52% | Perpetuity | ||||||||||||||
July 2007 | Pounds Sterling | 6.8 | 7.01% | Perpetuity | Pounds Sterling | 4.9 | 7.01% | Perpetuity | ||||||||||
July 2009 | Pounds Sterling | 679.4 | Libor (3M) + 7.66% | Perpetuity | Pounds Sterling | 640.7 | Libor (3M) + 7.66% | Perpetuity | ||||||||||
July 2009 | Euro | 125.7 | Euribor (3M) + 7.66% | Perpetuity | Euro | 111.8 | Euribor (3M) + 7.66% | Perpetuity | ||||||||||
September 2009 | US Dollar | 161.6 | USD Libor (3M) + 7.67% | Perpetuity | ||||||||||||||
September 2009 | US Dollar | 825.1 | 10.50% | Perpetuity | ||||||||||||||
September 2009 (*) | US Dollar | 161.6 | USD Libor (3M) + 7.67% | Perpetuity | ||||||||||||||
September 2009 (*) | US Dollar | 825.1 | 10.50% | Perpetuity | ||||||||||||||
Santander International Preferred S.A. (Sociedad Unipersonal) | ||||||||||||||||||
March 2009 | US Dollar | 980.2 | 2.00% | Perpetuity | US Dollar | 979.9 | 2.00% | Perpetuity | ||||||||||
March 2009 | Euro | 8.6 | 2.00% | Perpetuity | Euro | 8.6 | 2.00% | Perpetuity | ||||||||||
Santander UK Group | ||||||||||||||||||
Abbey National Capital Trust I, February 2000 | US Dollar | 621.8 | Fixed to 8.963% until June 30, 2030, and from this date, 2.825% + Libor USD (3M) | Perpetuity | ||||||||||||||
Abbey National Plc, February 2001(3) | Pounds Sterling | 101.8 | 7.037% | Perpetuity | Pounds Sterling | 101.8 | 7.037% | Perpetuity | ||||||||||
Abbey National Plc, August 2002 | Pounds Sterling | 12.0 | Fixed to 6.984% until February 9, 2018, and thereafter, at a rate reset semi-annually of 1.86% per annum + Libor GBP (6M) | Perpetuity | Pounds Sterling | 12.0 | Fixed to 6.984% until February 9, 2018, and thereafter, at a rate reset semi-annually of 1.86% per annum + Libor GBP (6M) | Perpetuity | ||||||||||
Santander PR Capital Trust I | ||||||||||||||||||
February 2006 | US Dollar | 125 | 6.750% | July 2036 | ||||||||||||||
| (1) | From these |
| (2) | That issuance is a Fixed/Floating Rate Non-Cumulative Callable Preference Shares. Dividends will accrue on a principal amount equal to £1,000 per Preference Share at a rate of 6.222 per cent. per annum in respect of the period from (and including) May 24, 2006 (the Issue Date) to (but excluding) May 24, 2019 (the First Call Date) and thereafter at a rate reset quarterly equal to 1.13 per cent. per annum above the London interbank offered rate for three-month sterling deposits. From (and including) the Issue Date to (but excluding) the First Call Date, dividends, if declared, will be paid annually in |
| (3) | From February 14, 2026, this issue will bear interest at a rate, reset every five years, of 3.75% per annum above the gross redemption yield on a five-year specified United Kingdom government security. |
| (*) | Listed in the U.S. |
F-244
In accordance with Reg. S-X Rule 3-10, Financial Statements of Guarantors and Issuers of Guaranteed Securities Registered or Being Registered, Santander Finance Capital, S.A. (Unipersonal), Santander Finance Preferred, S.A. (Unipersonal) and Santander International Preferred, S.A. (Unipersonal)— - issuers of registered preferred securities guaranteed by Banco Santander, S.A.— - do not file the financial statements required for a registrant by Regulation S-X as:
Santander Finance Preferred, S.A. (Unipersonal) is 100% owned finance subsidiary of Banco Santander, S.A. who fully and unconditionally guarantees the preferred securities (Series 1, 4, 5, 6, 10 and 11 are listed in the United States). No other subsidiary of the Bank guarantees such securities.
Santander Finance Capital, S.A. (Unipersonal) is 100% owned finance subsidiary of Banco Santander, S.A. that fully and unconditionally guarantees the preferred securities (not listed in United States). No other subsidiary of the Bank guarantees such securities.
Santander International Preferred, S.A. (Unipersonal) is 100% owned finance subsidiary of Banco Santander, S.A. that fully and unconditionally guarantees the preferred securities (not listed in United States). No other subsidiary of the Bank guarantees such securities.
The condensed financial statements of Santander Finance Capital, S.A. (Unipersonal), Santander Finance Preferred, S.A. (Unipersonal) and Santander International Preferred, S.A. (Sociedad Unipersonal) for the years ended December 31, 20112012 and 20102011 are the following:
SANTANDER FINANCE CAPITAL, S.A. (UNIPERSONAL)
Santander Finance Capital, S.A. (Unipersonal) was established in Spain on July 8, 2003.
The common stock of the company is wholly100% owned by Banco Santander, S.A.
Presented below are the condensed balance sheet, condensed statements of income and statements of changes in the stockholders’ equity for Santander Finance Capital, S.A. (Unipersonal), prepared in conformity with IFRS.
Balance sheets
| Thousands of Euros | Thousands of Euros | |||||||||||||||
| SANTANDER FINANCE CAPITAL, S.A. (UNIPERSONAL) | 2011 | 2010 | 2013 | 2012 | ||||||||||||
Assets: | ||||||||||||||||
Cash | 4,757 | 5,070 | 1,604 | 1,631 | ||||||||||||
Deposits with Parent Bank | 522,520 | 2,465,064 | 519,307 | 520,722 | ||||||||||||
Accrual accounts | 7,934 | 8,458 | 8,022 | 7,999 | ||||||||||||
Other assets | — | — | — | — | ||||||||||||
|
|
|
| |||||||||||||
Total Assets | 535,211 | 2,478,592 | 528,933 | 530,352 | ||||||||||||
Liabilities and stockholders’ equity: | ||||||||||||||||
LIABILITIES: | ||||||||||||||||
Public entities | 3,107 | 3,946 | 22 | 23 | ||||||||||||
Accrual accounts | 7,952 | 8,465 | 7,877 | 7,960 | ||||||||||||
Non-commercial debts | — | — | — | — | ||||||||||||
Commercial debts | 23 | 38 | 18 | 36 | ||||||||||||
Debts with Group companies | 367 | 227 | 4,278 | 423 | ||||||||||||
Provisions for taxes | — | — | — | — | ||||||||||||
Preferred securities | 522,671 | 2,465,144 | 515,698 | 520,893 | ||||||||||||
|
|
|
| |||||||||||||
Total Liabilities | 534,120 | 2,477,820 | 527,893 | 529,335 | ||||||||||||
STOCKHOLDERS’ EQUITY: | ||||||||||||||||
Capital stock | 151 | 151 | 151 | 151 | ||||||||||||
Retained earnings | 621 | (2 | ) | 866 | 940 | |||||||||||
Net income | 319 | 623 | 23 | (74 | ) | |||||||||||
|
|
|
| |||||||||||||
Total Stockholders’ Equity | 1,091 | 772 | 1,040 | 1,017 | ||||||||||||
Total Liabilities and Stockholders’ Equity | 535,211 | 2,478,592 | 528,933 | 530,352 | ||||||||||||
|
| |||||||||||||||
F-245
Statement of income
| Thousands of Euros | Thousands of Euros | |||||||||||||||
| SANTANDER FINANCE CAPITAL, S.A. (UNIPERSONAL) | 2011 | 2010 | 2013 | 2012 | ||||||||||||
Interest income | 93,879 | 119,964 | 10,673 | 10,873 | ||||||||||||
Interest expenses | (93,300 | ) | (119,024 | ) | (10,522 | ) | (10,813 | ) | ||||||||
Non interest income | — | — | ||||||||||||||
Non interest expenses | (121 | ) | (159 | ) | (133 | ) | (78 | ) | ||||||||
Non interest income | 1 | — | ||||||||||||||
Corporate income tax | (140 | ) | (158 | ) | 5 | (56 | ) | |||||||||
|
|
|
| |||||||||||||
Net income / (loss) | 319 | 623 | 23 | (74 | ) | |||||||||||
|
|
|
| |||||||||||||
Statement of changes in stockholders’ equitycomprehensive income
Changes in Stockholders’ Equity | Capital stock | Retained Earnings | Net income | Total Stockholders’ Equity | ||||||||||||||||
| Common Shares | Thousands of Euros | |||||||||||||||||||
Balance at January 1, 2010 | 1,505 | 151 | 243 | (245 | ) | 149 | ||||||||||||||
2009 Income allocation | — | — | (245 | ) | 245 | — | ||||||||||||||
Net income 2010 | — | — | — | 623 | 623 | |||||||||||||||
Balance at December 31, 2010 | 1,505 | 151 | (2 | ) | 623 | 772 | ||||||||||||||
2010 Income allocation | — | — | 623 | (623 | ) | — | ||||||||||||||
Net income 2011 | — | — | — | 319 | 319 | |||||||||||||||
Balance at December 31, 2011 | 1,505 | 151 | 621 | 319 | 1,091 | |||||||||||||||
CONDENSED STATEMENTS OF COMPREHENSIVE INCOME (Parent company only) | Thousands of Euros | |||||||
| 2013 | 2012 | |||||||
NET INCOME/(LOSS) | 23 | (74 | ) | |||||
Income and expense recognized directly in equity | — | — | ||||||
Arising from revaluation of financial instruments: | — | — | ||||||
Arising from cash flow hedges | — | — | ||||||
Grants, donations and legacies received | — | — | ||||||
Arising from actuarial gains and losses and other adjustments | — | — | ||||||
Tax effect | — | — | ||||||
Total income and expense recognized directly in equity | — | — | ||||||
Transfers to profit or loss | — | — | ||||||
Arising from revaluation of financial instruments: | — | — | ||||||
Arising from cash flow hedges | — | — | ||||||
Grants, donations and legacies received | — | — | ||||||
Tax effect | — | — | ||||||
Total transfers to profit or loss | — | — | ||||||
TOTAL COMPREHENSIVE INCOME | 23 | (74 | ) | |||||
Statement of Changes in Stockholders’ Equity | Capital stock | Retained Earnings | Net income | Total Stockholders’ Equity | ||||||||||||||||
Changes in Stockholders’ Equity | Common Shares | Thousands of Euros | ||||||||||||||||||
Balance at December 31, 2011 | 1,505 | 151 | 621 | 319 | 1,091 | |||||||||||||||
|
|
|
|
|
|
|
|
|
| |||||||||||
2011 Income allocation | — | — | 319 | (319 | ) | — | ||||||||||||||
Net income 2012 | — | — | — | (74 | ) | (74 | ) | |||||||||||||
|
|
|
|
|
|
|
|
|
| |||||||||||
Balance at December 31, 2012 | 1,505 | 151 | 940 | (74 | ) | 1,017 | ||||||||||||||
|
|
|
|
|
|
|
|
|
| |||||||||||
2012 Income allocation | — | — | (74 | ) | 74 | — | ||||||||||||||
Net income 2013 | — | — | — | 23 | 23 | |||||||||||||||
|
|
|
|
|
|
|
|
|
| |||||||||||
Balance at December 31, 2013 | 1,505 | 151 | 866 | 23 | 1,040 | |||||||||||||||
|
|
|
|
|
|
|
|
|
| |||||||||||
In October 2005, the board of directors authorized a capital increase of 903 shares of common stock with a €100 par value. This capital increase was fully subscribed and paid by Banco Santander, S.A.
After this capital increase, the capital stock of Santander Finance Capital S.A. (Unipersonal), as of December 31, 2005, amounted to 1,505 shares of common stock with a €100 par value, fully subscribed and paid by Banco Santander, S.A. (wholly owner of this company).
F-246
Preferred Securities
| Issue Date | Thousands of Euros at 12/31/ | |||||||
Issuances | ||||||||
Series VI | 03/18/2009 | |||||||
Series VII | 03/18/2009 | |||||||
Series VIII | 03/18/2009 | 313,745 | ||||||
Series IX | 03/18/2009 | 153,700 | ||||||
Series X | 06/30/2009 | |||||||
|
| |||||||
Total | ||||||||
Issuances expenses | ||||||||
Series VI | (3 | ) | ||||||
Series VII | (15 | ) | ||||||
Series VIII | ( | ) | ||||||
Series IX | ( | ) | ||||||
Series X | — | |||||||
|
| |||||||
Total | ( | ) | ||||||
|
| |||||||
Total | ||||||||
|
| |||||||
| - | Series I: on October 3, 2003, Santander Finance Capital, S.A. (Unipersonal) issued 18,000,000 preference securities, at €25 par value. On April 7, 2009 the company redeemed the whole series. |
| - | Series II: on February 18, 2004, Santander Finance Capital, S.A. (Unipersonal) issued 16,000,000 preference securities, at €25 par value. On March 31, 2009 the company redeemed the whole series. |
| - | Series III: on July 30, 2004, Santander Finance Capital, S.A. (Unipersonal) issued 30,000,000 preference securities, at €25 par value. On August 17, 2009 the company redeemed the whole series. |
| - | Series IV: on September 30, 2004, Santander Finance Capital, S.A. (Unipersonal) issued 27,200,000 preference securities, at €25 par value. On August 17, 2009 the company redeemed the whole series. |
| - | Series V: on April 12, 2005, Santander Finance Capital, S.A. (Unipersonal) issued 40,000,000 preference securities, at €25 par value. On July 12, 2010 the company redeemed the whole series. |
| - | Series VI: on March 18, 2009, Santander Finance Capital, S.A. (Unipersonal) issued 12,122 preference securities, at €1,500 par value. |
| - | Series VII: on March 18, 2009, Santander Finance Capital, S.A. (Unipersonal) issued 333 preference securities, at €75,000 par value. |
| - | Series VIII: on March 18, 2009, Santander Finance Capital, S.A. (Unipersonal) issued 313,745 preference securities, at €1,000 par value. |
| - | Series IX: on March 18, 2009, Santander Finance Capital, S.A. (Unipersonal) issued 3,074 preference securities, at €50,000 par value. |
| - | Series X: on June 30, 2009, Santander Finance Capital, S.A. (Unipersonal) issued 78,624,629 preference securities, at €25 par value. |
Series I: on October 3, 2003, Santander Finance Capital, S.A. (Unipersonal) issued 18,000,000 preference securities, at €25 par value. On April 7, 2009 the company redeemed the whole series.
Series II: on February 18, 2004, Santander Finance Capital, S.A. (Unipersonal) issued 16,000,000 preference securities, at €25 par value. On March 31, 2009 the company redeemed the whole series.
Series III: on July 30, 2004, Santander Finance Capital, S.A. (Unipersonal) issued 30,000,000 preference securities, at €25 par value. On August 17, 2009 the company redeemed the whole series.
Series IV: on September 30, 2004, Santander Finance Capital, S.A. (Unipersonal) issued 27,200,000 preference securities, at €25 par value. On August 17, 2009 the company redeemed the whole series.
Series V: on April 12, 2005, Santander Finance Capital, S.A. (Unipersonal) issued 40,000,000 preference securities, at €25 par value. On July 12, 2010 the company redeemed the whole series.
Series VI: on March 18, 2009, Santander Finance Capital, S.A. (Unipersonal) issued 12,122 preference securities, at €1,500 par value.
Series VII: on March 18, 2009, Santander Finance Capital, S.A. (Unipersonal) issued 333 preference securities, at €75,000 par value.
Series VIII: on March 18, 2009, Santander Finance Capital, S.A. (Unipersonal) issued 313,745 preference securities, at €1,000 par value.
Series IX: on March 18, 2009, Santander Finance Capital, S.A. (Unipersonal) issued 3,074 preference securities, at €50,000 par value.
Series X: on June 30, 2009, Santander Finance Capital, S.A. (Unipersonal) issued 78,624,629 preference securities, at €25 par value.
On December 2, 2011, we announced an offer (the “Repurchase Offer”) to repurchase Series X Preferred Securities issued by Santander Finance Capital, S.A.U. in June 2009 and guaranteed by the Bank (the “Series X Preferred Securities”) and a simultaneous public offer to subscribe for newly-issued shares of Banco Santander (the “New Shares”), on the terms set out below. We refer to the Repurchase Offer and the issuance of New Shares as the “Capital Increase.”
In order to participate in the Repurchase Offer, holders of Series X Preferred Securities were required to irrevocably subscribe the number of New Shares which corresponded to the repurchase price of their Series X Preferred Securities. The New Shares were offered solely to the abovementioned holders of Series X Preferred Securities who accepted the Repurchase Offer.
F-247
The issue price of the New Shares (nominal plus premium) equaled to the arithmetic mean of the average weighted prices of Banco Santander shares on the Spanish stock exchanges during the Acceptance Period. Consequently, the number of New Shares to be subscribed by each holder of Series X Preferred Securities who accepted the Repurchase Offer was the result from dividing the nominal value of the preferred securities (€25.00) by the issue price of the New Shares.
On December 28, 2011, we announced that during the acceptance period, the holders of 77,743,969 preferred securities, representing 98.88% of the preference shares outstanding, had accepted the repurchase offer.
The holders of these preferred securities subscribed 341,802,171 shares under the Capital Increase. Consequently, the total amount (nominal plus premium) subscribed was €1,943,599,225 and the nominal value of the Capital Increase was €170,901,085.50. The New Shares represented 3.84% of the share capital of Banco Santander following the Capital Increase.
On December 30, 2011, Banco Santander acquired the Series X Preferred Securities and the new shares subscribed by the holders of those preferred securities were paid up.
These issues are perpetual and can be redeemable at the option of the issuer, subject to the consent of the Bank of Spain, in whole or in part, at any time after five years from the issue date.
All the issues of Santander Finance Capital, S.A. (Unipersonal) are guaranteed by Banco Santander, S.A.
SANTANDER FINANCE PREFERRED, S.A. (UNIPERSONAL)
Santander Finance Preferred, S.A. (Unipersonal) was established in Spain on February 27, 2004.
The common stock of the company is wholly100% owned by Banco Santander, S.A.
Presented below are the condensed balance sheet, condensed statements of income and statements of changes in the stockholders’ equity for Santander Finance Preferred, S.A. (Unipersonal), prepared in conformity with IFRS.
F-248
Balance sheets
| Thousands of Euros | Thousands of Euros | |||||||||||||||
| SANTANDER FINANCE PREFERRED, S.A. (UNIPERSONAL) | 2011 | 2010 | 2013 | 2012 | ||||||||||||
| Assets: | ||||||||||||||||
Cash | 33,238 | 28,567 | 33,176 | 34,117 | ||||||||||||
Deposits with Parent Bank | 3,737,691 | 3,641,218 | 3,615,746 | 3,725,047 | ||||||||||||
Accrual accounts | 73,508 | 71,895 | 63,344 | 64,393 | ||||||||||||
|
|
|
| |||||||||||||
Total Assets | 3,844,437 | 3,741,680 | 3,712,266 | 3,823,557 | ||||||||||||
| Liabilities and stockholders’ equity: | ||||||||||||||||
LIABILITIES: | ||||||||||||||||
Public entities | 27 | 18 | — | — | ||||||||||||
Accrual accounts | 55,561 | 53,890 | 51,549 | 52,588 | ||||||||||||
Commercial debts | 86 | 36 | 59 | 38 | ||||||||||||
Non-commercial debts | — | — | — | — | ||||||||||||
Deferred income | — | — | — | — | ||||||||||||
Debts with group companies | 1,296,968 | 1,259,534 | 1,343,549 | 1,377,472 | ||||||||||||
Provisions for taxes | — | — | — | — | ||||||||||||
Preferred securities | 2,488,782 | 2,426,482 | 2,313,824 | 2,389,994 | ||||||||||||
|
|
|
| |||||||||||||
Total Liabilities | 3,841,424 | 3,739,960 | 3,708,981 | 3,820,092 | ||||||||||||
STOCKHOLDERS’ EQUITY: | ||||||||||||||||
Capital stock | 151 | 151 | 151 | 151 | ||||||||||||
Retained earnings | 1,569 | 2,672 | 3,314 | 2,862 | ||||||||||||
Net income | 1,293 | (1,103 | ) | (180 | ) | 452 | ||||||||||
|
|
|
| |||||||||||||
Total Stockholders’ Equity | 3,013 | 1,720 | 3,285 | 3,465 | ||||||||||||
Total Liabilities and Stockholders’ Equity | 3,844,437 | 3,741,680 | 3,712,266 | 3,823,557 | ||||||||||||
Statement of income
| Thousands of Euros | Thousands of Euros | |||||||||||||||
| SANTANDER FINANCE PREFERRED, S.A. (UNIPERSONAL) | 2011 | 2010 | 2013 | 2012 | ||||||||||||
Interest income | 293,086 | 302,097 | 278,782 | 299,859 | ||||||||||||
Interest expenses | (290,977 | ) | (301,946 | ) | (277,885 | ) | (298,166 | ) | ||||||||
Non interest income | 669 | — | — | — | ||||||||||||
Non interest expenses | (1,403 | ) | (1,254 | ) | (1,077 | ) | (863 | ) | ||||||||
Corporate income tax | (82 | ) | — | — | (378 | ) | ||||||||||
|
|
|
| |||||||||||||
Net income / (loss) | 1,293 | (1,103 | ) | (180 | ) | 452 | ||||||||||
|
|
|
| |||||||||||||
Statement of comprehensive income
CONDENSED STATEMENTS OF COMPREHENSIVE INCOME (Parent company only) | Thousands of Euros | |||||||
| 2013 | 2012 | |||||||
NET INCOME/(LOSS) | (180 | ) | 452 | |||||
Income and expense recognized directly in equity | — | — | ||||||
Arising from revaluation of financial instruments: | — | — | ||||||
Arising from cash flow hedges | — | — | ||||||
Grants, donations and legacies received | — | — | ||||||
Arising from actuarial gains and losses and other adjustments | — | — | ||||||
Tax effect | — | — | ||||||
Total income and expense recognized directly in equity | — | — | ||||||
Transfers to profit or loss | — | — | ||||||
Arising from revaluation of financial instruments: | — | — | ||||||
Arising from cash flow hedges | — | — | ||||||
Grants, donations and legacies received | — | — | ||||||
Tax effect | — | — | ||||||
Total transfers to profit or loss | — | — | ||||||
TOTAL COMPREHENSIVE INCOME | (180 | ) | 452 | |||||
F-249
Statement of changes in stockholders’ equity
Changes in Stockholders’ Equity | Capital stock | Retained Earnings | Net income | Total Stockholders’ Equity | ||||||||||||||||
| Common Shares | Thousands of Euros | |||||||||||||||||||
Balance at January 1, 2010 | 1,505 | 151 | 1,340 | 1,332 | 2,823 | |||||||||||||||
|
|
|
|
|
|
|
|
|
| |||||||||||
2009 Income allocation | — | — | 1,332 | (1,332 | ) | — | ||||||||||||||
Net income 2010 | — | — | — | (1,103 | ) | (1,103 | ) | |||||||||||||
|
|
|
|
|
|
|
|
|
| |||||||||||
Balance at December 31, 2010 | 1,505 | 151 | 2,672 | (1,103 | ) | 1,720 | ||||||||||||||
|
|
|
|
|
|
|
|
|
| |||||||||||
2010 Income allocation | — | — | (1,103 | ) | 1,103 | — | ||||||||||||||
Net income 2011 | — | — | — | 1,293 | 1,293 | |||||||||||||||
|
|
|
|
|
|
|
|
|
| |||||||||||
Balance at December 31, 2011 | 1,505 | 151 | 1,569 | 1,293 | 3,013 | |||||||||||||||
|
|
|
|
|
|
|
|
|
| |||||||||||
Changes in Stockholders’ Equity | Capital stock | Retained Earnings | Net income | Total Stockholders’ Equity | ||||||||||||||||
| Common Shares | Thousands of Euros | |||||||||||||||||||
Balance at December 31, 2011 | 1,505 | 151 | 1,569 | 1,293 | 3,013 | |||||||||||||||
|
|
|
|
|
|
|
|
|
| |||||||||||
2011 Income allocation | — | — | 1,293 | (1,293 | ) | — | ||||||||||||||
Net income 2012 | — | — | — | 452 | 452 | |||||||||||||||
|
|
|
|
|
|
|
|
|
| |||||||||||
Balance at December 31, 2012 | 1,505 | 151 | 2,862 | 452 | 3,465 | |||||||||||||||
|
|
|
|
|
|
|
|
|
| |||||||||||
2012 Income allocation | — | — | 452 | (452 | ) | — | ||||||||||||||
Net income 2013 | — | — | — | (180 | ) | (180 | ) | |||||||||||||
|
|
|
|
|
|
|
|
|
| |||||||||||
Balance at December 31, 2013 | 1,505 | 151 | 3,314 | (180 | ) | 3,285 | ||||||||||||||
|
|
|
|
|
|
|
|
|
| |||||||||||
In October 2005, the board of directors authorized a capital increase of 903 shares of common stock with a €100 par value. This capital increase was fully subscribed and paid by Banco Santander, S.A.
After this capital increase, the capital stock of Santander Finance Preferred, S.A. (Unipersonal), as of December 31, 2005, amounted to 1,505 shares of common stock with a €100 par value, fully subscribed and paid by Banco Santander, S.A. (wholly owner of this company).
Preferred Securities
| Issue Date | Thousands of Euros at 12/31/ | ||||||||
Issuances | |||||||||
Series 1- $190,000 | 03/11/2004 | ||||||||
Series 2- €300,000 | 09/30/2004 | 300,000 | |||||||
Series 3- €200,000 | 10/08/2004 | 200,000 | |||||||
Series 4- $500,000 | 11/21/2006 | ||||||||
Series 5- $600,000 | 31/01/2007 | ||||||||
Series 6- $350,000 | 05/03/2007 | ||||||||
Series 7- £250,000 | 07/10/2007 | ||||||||
Series 8- £679,400 | 07/27/2009 | ||||||||
Series 9- €125,700 | 07/27/2009 | 125,700 | |||||||
Series 10- $825,110 | 09/29/2009 | ||||||||
Series 11- $161,587 | 09/29/2009 | ||||||||
|
| ||||||||
Issuances expenses | |||||||||
Series 1 | — | ||||||||
Series 2 | — | ||||||||
Series 3 | — | ||||||||
Series 4 | — | ||||||||
Series 5 | ( | ) | |||||||
Series 6 | ( | ) | |||||||
Series 7 | — | ||||||||
Series 8 | ( | ) | |||||||
Series 9 | ( | ) | |||||||
Series 10 | ( | ) | |||||||
Series 11 | ( | ) | |||||||
|
| ||||||||
| ( | ) | ||||||||
|
| ||||||||
Total | |||||||||
|
| ||||||||
F-250
| - | Series 1: on March 11, 2004, Santander Finance Preferred, S.A. (Unipersonal) issued 7,600,000 preferred securities, at $25 par value. |
| - | Series 2: on September 30, 2004, Santander Finance Preferred, S.A. (Unipersonal) issued 300,000 preferred securities, at €1,000 par value. |
| - | Series 3: on October 8, 2004, Santander Finance Preferred, S.A. (Unipersonal) issued 200,000 preferred securities, at €1,000 par value. |
| - | Series 4: on November 21, 2006 Santander Finance Preferred, S.A. (Unipersonal) issued 20,000,000 preferred securities, at €25 par value. |
| - | Series 5: on January 31, 2007 Santander Finance Preferred, S.A. (Unipersonal) issued 24,000,000 preferred securities, at $25 par value. |
| - | Series 6: on March 5, 2007 Santander Finance Preferred, S.A. (Unipersonal) issued 14,000,000 preferred securities, at $25 par value. |
| - | Series 7: on July 10, 2007 Santander Finance Preferred, S.A. (Unipersonal) issued 5,000 preferred securities, at £50,000 par value. |
| - | Series 8: on July 27, 2009, Santander Finance Preferred, S.A. (Unipersonal) issued 13,588 preferred securities, at £50,000 par value. |
| - | Series 9: on July 27, 2009, Santander Finance Preferred, S.A. (Unipersonal) issued 2,514 preferred securities, at €50,000 par value. |
| - | Series 10: on September 29, 2009, Santander Finance Preferred, S.A. (Unipersonal) issued 33,004,383 preferred securities, at $25 par value. |
| - | Series 11: on September 29, 2009, Santander Finance Preferred, S.A. (Unipersonal) issued 161,587 preferred securities, at $1,000 par value. |
| - | These issues are perpetual and can be redeemable at the option of the issuer, subject to the consent of the Bank of Spain, in whole or in part, at any time after five years from the issue date. |
| - | All the issues of Santander Finance Preferred, S.A. (Unipersonal) are guaranteed by Banco Santander, S.A. |
| - | On July 9, 2009, we published on the international markets offers to exchange issues of securities eligible to be included in capital issued by Santander and its subsidiaries. The exchange envisaged the delivery of new securities that meet the current market standards and regulatory requirements to be classified as equity at the consolidated Group level. For this purpose Santander Finance Preferred, S.A. (Unipersonal) issued Series 8, 9, 10 and 11 above. |
Series 1: on March 11, 2004, Santander Finance Preferred, S.A. (Unipersonal) issued 7,600,000 preferred securities, at $25 par value.
Series 2: on September 30, 2004, Santander Finance Preferred, S.A. (Unipersonal) issued 300,000 preferred securities, at €1,000 par value.
Series 3: on October 8, 2004, Santander Finance Preferred, S.A. (Unipersonal) issued 200,000 preferred securities, at €1,000 par value.
Series 4: on November 21, 2006 Santander Finance Preferred, S.A. (Unipersonal) issued 20,000,000 preferred securities, at €25 par value.
Series 5: on January 31, 2007 Santander Finance Preferred, S.A. (Unipersonal) issued 24,000,000 preferred securities, at $25 par value.
Series 6: on March 5, 2007 Santander Finance Preferred, S.A. (Unipersonal) issued 14,000,000 preferred securities, at $25 par value.
Series 7: on July 10, 2007 Santander Finance Preferred, S.A. (Unipersonal) issued 5,000 preferred securities, at £50,000 par value.
Series 8: on July 27, 2009, Santander Finance Preferred, S.A. (Unipersonal) issued 13,588 preferred securities, at £50,000 par value.
Series 9: on July 27, 2009, Santander Finance Preferred, S.A. (Unipersonal) issued 2,514 preferred securities, at €50,000 par value.
Series 10: on September 29, 2009, Santander Finance Preferred, S.A. (Unipersonal) issued 33,004,383 preferred securities, at $25 par value.
Series 11: on September 29, 2009, Santander Finance Preferred, S.A. (Unipersonal) issued 161,587 preferred securities, at $1,000 par value.
These issues are perpetual and can be redeemable at the option of the issuer, subject to the consent of the Bank of Spain, in whole or in part, at any time after five years from the issue date.
All the issues of Santander Finance Preferred, S.A. (Unipersonal) are guaranteed by Banco Santander, S.A.
On July 9, 2009, we published on the international markets offers to exchange issues of securities eligible to be included in capital issued by Santander and its subsidiaries. The exchange envisaged the delivery of new securities that meet the current market standards and regulatory requirements to be classified as equity at the consolidated Group level. For this purpose Santander Finance Preferred, S.A. (Unipersonal) issued Series 8, 9, 10 and 11 above.
F-251
SANTANDER INTERNATIONAL PREFERRED, S.A. (SOCIEDAD UNIPERSONAL)
Santander International Preferred, S.A. (Sociedad Unipersonal) was established in Spain on February 17, 2009.
The common stock of the company is wholly100% owned by Banco Santander, S.A.
Presented below are the condensed balance sheet, condensed statements of income and statements of changes in the stockholders’ equity for Santander International Preferred, S.A. (Sociedad Unipersonal), prepared in conformity with IFRS.
Balance sheets
| Thousands of Euros | Thousands of Euros | Thousands of Euros | Thousands of Euros | |||||||||||||
| SANTANDER INTERNATIONAL PREFERRED, S.A. (SOCIEDAD UNIPERSONAL) | 2011 | 2010 | 2013 | 2012 | ||||||||||||
| Assets: | ||||||||||||||||
Cash | 231 | 142 | 452 | 278 | ||||||||||||
Deposits with Parent Bank | 766,447 | 742,455 | 719,626 | 751,800 | ||||||||||||
Accrual accounts | 12,255 | 11,904 | 11,471 | 12,137 | ||||||||||||
Other current assets | — | — | 1 | — | ||||||||||||
|
|
|
| |||||||||||||
Total Assets | 778,933 | 754,501 | 731,550 | 764,215 | ||||||||||||
| Liabilities and stockholders’ equity: | ||||||||||||||||
LIABILITIES: | ||||||||||||||||
Public entities | — | — | — | — | ||||||||||||
Commercial debts | 14 | 26 | 13 | 17 | ||||||||||||
Debts with group companies | 656 | 9 | 874 | 697 | ||||||||||||
Accrual accounts | 12,098 | 11,762 | 11,389 | 11,901 | ||||||||||||
Preferred securities | 766,026 | 742,622 | 719,045 | 751,385 | ||||||||||||
|
|
|
| |||||||||||||
Total Liabilities | 778,794 | 754,419 | 731,321 | 764,000 | ||||||||||||
STOCKHOLDERS’ EQUITY: | ||||||||||||||||
Capital stock | 60 | 60 | 60 | 60 | ||||||||||||
Retained earnings | 22 | (17 | ) | 155 | 79 | |||||||||||
Net income | 57 | 39 | 14 | 76 | ||||||||||||
|
|
|
| |||||||||||||
Total Stockholders’ Equity | 139 | 82 | 229 | 215 | ||||||||||||
Total Liabilities and Stockholders’ Equity | 778,933 | 754,501 | 731,550 | 764,215 | ||||||||||||
Statement of income
| Thousands of Euros | Thousands of Euros | Thousands of Euros | Thousands of Euros | |||||||||||||
| SANTANDER INTERNATIONAL PREFERRED, S.A. (SOCIEDAD UNIPERSONAL) | 2011 | 2010 | 2013 | 2012 | ||||||||||||
Interest income | 14,421 | 15,171 | 15,067 | 15,666 | ||||||||||||
Interest expenses | (14,275 | ) | (15,034 | ) | (14,966 | ) | (15,494 | ) | ||||||||
Non interest income | — | — | — | — | ||||||||||||
Non interest expenses | (65 | ) | (89 | ) | (81 | ) | (58 | ) | ||||||||
Corporate income tax | (24 | ) | (9 | ) | (6 | ) | (38 | ) | ||||||||
|
|
|
| |||||||||||||
Net income / (loss) | 57 | 39 | 14 | 76 | ||||||||||||
|
|
|
| |||||||||||||
Statement of comprehensive income
CONDENSED STATEMENTS OF COMPREHENSIVE INCOME (Parent company only) NET INCOME/(LOSS) Income and expense recognized directly in equity Arising from revaluation of financial instruments: Arising from cash flow hedges Grants, donations and legacies received Arising from actuarial gains and losses and other adjustments Tax effect Total income and expense recognized directly in equity Transfers to profit or loss Arising from revaluation of financial instruments: Arising from cash flow hedges Grants, donations and legacies received Tax effect Total transfers to profit or loss TOTAL COMPREHENSIVE INCOMEF-252 Thousands of Euros 2013 2012 14 76 — — — — — — — — — — — — — — — — — — — — — — — — — — 14 76
Statement of changes in stockholders’ equity
Changes in Stockholders’ Equity | Capital stock | Retained Earnings | Net income | Total Stockholders’ Equity | ||||||||||||||||
| Common Shares | Thousands of Euros | |||||||||||||||||||
Balance at January 1, 2010 | 602 | 60 | — | (17 | ) | 43 | ||||||||||||||
|
|
|
|
|
|
|
|
|
| |||||||||||
2009 Income allocation | — | — | (17 | ) | 17 | — | ||||||||||||||
Net income 2010 | — | — | — | 39 | 39 | |||||||||||||||
|
|
|
|
|
|
|
|
|
| |||||||||||
Balance at December 31, 2010 | 602 | 60 | (17 | ) | 39 | 82 | ||||||||||||||
|
|
|
|
|
|
|
|
|
| |||||||||||
2010 Income allocation | — | — | 39 | (39 | ) | — | ||||||||||||||
Net income 2011 | — | — | — | 57 | 57 | |||||||||||||||
|
|
|
|
|
|
|
|
|
| |||||||||||
Balance at December 31, 2011 | 602 | 60 | 22 | 57 | 139 | |||||||||||||||
|
|
|
|
|
|
|
|
|
| |||||||||||
Changes in Stockholders’ Equity | Capital stock | Retained Earnings | Net income | Total Stockholders’ Equity | ||||||||||||||||
| Common Shares | Thousands of Euros | |||||||||||||||||||
Balance at December 31, 2011 | 602 | 60 | 22 | 57 | 139 | |||||||||||||||
|
|
|
|
|
|
|
|
|
| |||||||||||
2011 Income allocation | — | — | 57 | (57 | ) | — | ||||||||||||||
Net income 2012 | — | — | — | 76 | 76 | |||||||||||||||
|
|
|
|
|
|
|
|
|
| |||||||||||
Balance at December 31, 2012 | 602 | 60 | 79 | 76 | 215 | |||||||||||||||
|
|
|
|
|
|
|
|
|
| |||||||||||
2012 Income allocation | — | — | 76 | (76 | ) | — | ||||||||||||||
Net income 2013 | — | — | — | 14 | 14 | |||||||||||||||
|
|
|
|
|
|
|
|
|
| |||||||||||
Balance at December 31, 2013 | 602 | 60 | 155 | 14 | 229 | |||||||||||||||
|
|
|
|
|
|
|
|
|
| |||||||||||
At December 31, 2011,2013, the capital stock of Santander International Preferred, S.A. (Sociedad Unipersonal) amounted to 602 shares of common stock with a €100 par value, fully subscribed and paid by Banco Santander, S.A. (wholly owner of this company).
Preferred Securities
| Issue Date | Thousands of Euros at 12/31/ | |||||||
Issuances | ||||||||
Series 1 ($) | 03/19/2009 | |||||||
Series 2 (€) | 03/19/2009 | 8,582 | ||||||
|
| |||||||
Issuances expenses | ( | ) | ||||||
|
| |||||||
Total | ||||||||
|
| |||||||
| - | Series 1: on March 19, 2009, Santander International Preferred, S.A. (Sociedad Unipersonal) issued 653,995 preferred securities, at $1,500 par value. |
| - | Series 2: on March 19, 2009, Santander International Preferred, S.A. (Sociedad Unipersonal) issued 8,582 preferred securities, at €1,000 par value. |
| - | These issues are perpetual and can be redeemable at the option of the issuer, subject to the consent of the Bank of Spain, in whole or in part, at any time after ten years from the issue date. |
| - | All the issues of Santander Finance Preferred, S.A. (Sociedad Unipersonal) are guaranteed by Banco Santander, S.A. |
Series 1: on March 19, 2009, Santander International Preferred, S.A. (Sociedad Unipersonal) issued 653,995 preferred securities, at $1,500 par value.
Series 2: on March 19, 2009, Santander International Preferred, S.A. (Sociedad Unipersonal) issued 8,582 preferred securities, at €1,000 par value.
These issues are perpetual and can be redeemable at the option of the issuer, subject to the consent of the Bank of Spain, in whole or in part, at any time after ten years from the issue date.
All the issues of Santander Finance Preferred, S.A. (Sociedad Unipersonal) are guaranteed by Banco Santander, S.A.
55.3 US Registered senior debt
SANTANDER US DEBT, S.A. (Sociedad Unipersonal)
Santander US Debt, S.A. (Sociedad Unipersonal) was established in Spain on February 27, 2004.
The common stock of the company is wholly100% owned by Banco Santander, S.A. The entity issues senior debt and the issuances are guaranteed fully and unconditionally by Banco Santander, S.A.
On December 31, 2011,2013, no entity of Grupo Santander has issued senior debt that is registered in the U.S. It is expected that Santander US Debt, S.A. (Sociedad Unipersonal) issue U.S. registered senior debt during 2012.2014.
F-253
Presented below are the condensed balance sheet, condensed statements of income and statements of changes in the stockholders’ equity for Santander US Debt, S.A. (Sociedad Unipersonal), prepared in conformity with IFRS.
Balance sheets
| Thousands of Euros | Thousands of Euros | Thousands of Euros | Thousands of Euros | |||||||||||||
| SANTANDER US DEBT, S.A. (SOCIEDAD UNIPERSONAL) | 2011 | 2010 | 2013 | 2012 | ||||||||||||
| Assets: | ||||||||||||||||
Cash | 1,226 | 739 | 1,032 | 1,906 | ||||||||||||
Deposits with Parent Bank | 3,190,347 | 4,212,792 | 992,369 | 1,991,609 | ||||||||||||
Other current assets | 6 | — | 1 | 1 | ||||||||||||
|
|
|
| |||||||||||||
Total Assets | 3,191,579 | 4,213,531 | 993,402 | 1,993,516 | ||||||||||||
| Liabilities and stockholders’ equity: | ||||||||||||||||
LIABILITIES: | ||||||||||||||||
Public entities | 26 | 23 | 29 | — | ||||||||||||
Commercial debts | 35 | 35 | 38 | 24 | ||||||||||||
Debts with group companies | 25,228 | 5,081 | 3,300 | 972 | ||||||||||||
Senior debt | 3,166,041 | 4,208,069 | 989,765 | 1,992,186 | ||||||||||||
|
|
|
| |||||||||||||
Total Liabilities | 3,191,330 | 4,213,208 | 993,132 | 1,993,182 | ||||||||||||
STOCKHOLDERS’ EQUITY: | ||||||||||||||||
Capital stock | 120 | 120 | 120 | 120 | ||||||||||||
Retained earnings | 203 | 443 | 214 | 129 | ||||||||||||
Net income | (74 | ) | (240 | ) | (64 | ) | 85 | |||||||||
|
|
|
| |||||||||||||
Total Stockholders’ Equity | 249 | 323 | 270 | 334 | ||||||||||||
Total Liabilities and Stockholders’ Equity | 3,191,579 | 4,213,531 | 993,402 | 1,993,516 | ||||||||||||
Statement of income
| Thousands of Euros | Thousands of Euros | Thousands of Euros | Thousands of Euros | |||||||||||||
| SANTANDER US DEBT, S.A. (SOCIEDAD UNIPERSONAL) | 2011 | 2010 | 2013 | 2012 | ||||||||||||
Interest income | 81,377 | 65,042 | 52,477 | 71,733 | ||||||||||||
Interest expenses | (80,402 | ) | (64,875 | ) | (51,996 | ) | (71,029 | ) | ||||||||
Non interest income | — | 111 | 15 | 148 | ||||||||||||
Non interest expenses | (1,058 | ) | (518 | ) | (560 | ) | (768 | ) | ||||||||
Corporate income tax | 9 | — | — | 1 | ||||||||||||
|
|
|
| |||||||||||||
Net income / (loss) | (74 | ) | (240 | ) | (64 | ) | 85 | |||||||||
|
|
|
| |||||||||||||
Statement of comprehensive income
CONDENSED STATEMENTS OF COMPREHENSIVE INCOME (Parent company only) | Thousands of Euros | |||||||
| 2013 | 2012 | |||||||
NET INCOME/(LOSS) | (64 | ) | 85 | |||||
Income and expense recognized directly in equity | — | — | ||||||
Arising from revaluation of financial instruments: | — | — | ||||||
Arising from cash flow hedges | — | — | ||||||
Grants, donations and legacies received | — | — | ||||||
Arising from actuarial gains and losses and other adjustments | — | — | ||||||
Tax effect | — | — | ||||||
Total income and expense recognized directly in equity | — | — | ||||||
Transfers to profit or loss | — | — | ||||||
Arising from revaluation of financial instruments: | — | — | ||||||
Arising from cash flow hedges | — | — | ||||||
Grants, donations and legacies received | — | — | ||||||
Tax effect | — | — | ||||||
Total transfers to profit or loss | — | — | ||||||
TOTAL COMPREHENSIVE INCOME | (64 | ) | 85 | |||||
F-254
Statement of changes in stockholders’ equity
Changes in Stockholders’ Equity | Capital stock | Retained Earnings | Net income | Total Stockholders’ Equity | ||||||||||||||||
| Common Shares | Thousands of Euros | |||||||||||||||||||
Balance at January 1, 2010 | 1,200 | 120 | 431 | 12 | 563 | |||||||||||||||
|
|
|
|
|
|
|
|
|
| |||||||||||
2009 Income allocation | — | — | 12 | (12 | ) | — | ||||||||||||||
Net income 2010 | — | — | — | (240 | ) | (240 | ) | |||||||||||||
|
|
|
|
|
|
|
|
|
| |||||||||||
Balance at December 31, 2010 | 1,200 | 120 | 443 | (240 | ) | 323 | ||||||||||||||
|
|
|
|
|
|
|
|
|
| |||||||||||
2010 Income allocation | — | — | (240 | ) | 240 | — | ||||||||||||||
Net income 2011 | — | — | — | (74 | ) | (74 | ) | |||||||||||||
|
|
|
|
|
|
|
|
|
| |||||||||||
Balance at December 31, 2011 | 1,200 | 120 | 203 | (74 | ) | 249 | ||||||||||||||
|
|
|
|
|
|
|
|
|
| |||||||||||
Changes in Stockholders’ Equity | Capital stock | Retained Earnings | Net income | Total Stockholders’ Equity | ||||||||||||||||
| Common Shares | Thousands of Euros | |||||||||||||||||||
Balance at December 31, 2011 | 1,200 | 120 | 203 | (74 | ) | 249 | ||||||||||||||
|
|
|
|
|
|
|
|
|
| |||||||||||
2011 Income allocation | — | — | (74 | ) | 74 | — | ||||||||||||||
Net income 2012 | — | — | — | 85 | 85 | |||||||||||||||
|
|
|
|
|
|
|
|
|
| |||||||||||
Balance at December 31, 2012 | 1,200 | 120 | 129 | 85 | 334 | |||||||||||||||
|
|
|
|
|
|
|
|
|
| |||||||||||
2012 Income allocation | — | — | 85 | (85 | ) | — | ||||||||||||||
Net income 2013 | — | — | — | (64 | ) | (64 | ) | |||||||||||||
|
|
|
|
|
|
|
|
|
| |||||||||||
Balance at December 31, 2013 | 1,200 | 120 | 214 | (64 | ) | 270 | ||||||||||||||
|
|
|
|
|
|
|
|
|
| |||||||||||
At December 31, 2011,2013, the capital stock of Santander US Debt, S.A. (Sociedad Unipersonal) amounted to 1,200 shares of common stock with a €100 par value, fully subscribed and paid by Banco Santander, S.A. (wholly owner of this company).
F-255
Exhibit I
Subsidiaries of Banco Santander, S.A. (1)
| % of ownership held by the Bank | % of voting | % of ownership held by the Bank | % of voting power (c) | |||||||||||||||||||||||||||||||||
Company | Location | Direct | Indirect | power (c) | Line of business | Location | Direct | Indirect | 2013 | 2012 | Line of business | |||||||||||||||||||||||||
2 & 3 Triton Limited | United Kingdom | 0.00% | 100.00% | 100.00% | PROPERTY | United Kingdom | 0.00 | % | 100.00 | % | 100.00 | % | 100.00 | % | PROPERTY | |||||||||||||||||||||
A & L CF (Guernsey) Limited (e) | Guernsey | 0.00% | 100.00% | 100.00% | LEASING | Guernsey | 0.00 | % | 100.00 | % | 100.00 | % | 100.00 | % | LEASING | |||||||||||||||||||||
A & L CF (Jersey) Limited (e) | Jersey | 0.00% | 100.00% | 100.00% | LEASING | Jersey | 0.00 | % | 100.00 | % | 100.00 | % | 100.00 | % | LEASING | |||||||||||||||||||||
A & L CF (Jersey) No.2 Limited (e) | Jersey | 0.00% | 100.00% | 100.00% | LEASING | |||||||||||||||||||||||||||||||
A & L CF December (1) Limited | United Kingdom | 0.00% | 100.00% | 100.00% | LEASING | United Kingdom | 0.00 | % | 100.00 | % | 100.00 | % | 100.00 | % | LEASING | |||||||||||||||||||||
A & L CF December (10) Limited | United Kingdom | 0.00% | 100.00% | 100.00% | LEASING | United Kingdom | 0.00 | % | 100.00 | % | 100.00 | % | 100.00 | % | LEASING | |||||||||||||||||||||
A & L CF December (11) Limited | United Kingdom | 0.00% | 100.00% | 100.00% | LEASING | United Kingdom | 0.00 | % | 100.00 | % | 100.00 | % | 100.00 | % | LEASING | |||||||||||||||||||||
A & L CF June (1) Limited | United Kingdom | 0.00% | 100.00% | 100.00% | LEASING | United Kingdom | 0.00 | % | 100.00 | % | 100.00 | % | 100.00 | % | LEASING | |||||||||||||||||||||
A & L CF June (2) Limited | United Kingdom | 0.00% | 100.00% | 100.00% | LEASING | United Kingdom | 0.00 | % | 100.00 | % | 100.00 | % | 100.00 | % | LEASING | |||||||||||||||||||||
A & L CF June (3) Limited | United Kingdom | 0.00% | 100.00% | 100.00% | LEASING | United Kingdom | 0.00 | % | 100.00 | % | 100.00 | % | 100.00 | % | LEASING | |||||||||||||||||||||
A & L CF June (6) Limited (b) | United Kingdom | 0.00% | 100.00% | 100.00% | LEASING | |||||||||||||||||||||||||||||||
A & L CF June (7) Limited (b) | United Kingdom | 0.00% | 100.00% | 100.00% | LEASING | |||||||||||||||||||||||||||||||
A & L CF June (8) Limited | United Kingdom | 0.00% | 100.00% | 100.00% | LEASING | United Kingdom | 0.00 | % | 100.00 | % | 100.00 | % | 100.00 | % | LEASING | |||||||||||||||||||||
A & L CF March (1) Limited | United Kingdom | 0.00% | 100.00% | 100.00% | LEASING | |||||||||||||||||||||||||||||||
A & L CF March (3) Limited (b) | United Kingdom | 0.00% | 100.00% | 100.00% | LEASING | |||||||||||||||||||||||||||||||
A & L CF March (1) Limited (b) | United Kingdom | 0.00 | % | 100.00 | % | 100.00 | % | 100.00 | % | LEASING | ||||||||||||||||||||||||||
A & L CF March (5) Limited | United Kingdom | 0.00% | 100.00% | 100.00% | LEASING | United Kingdom | 0.00 | % | 100.00 | % | 100.00 | % | 100.00 | % | LEASING | |||||||||||||||||||||
A & L CF March (6) Limited | United Kingdom | 0.00% | 100.00% | 100.00% | LEASING | United Kingdom | 0.00 | % | 100.00 | % | 100.00 | % | 100.00 | % | LEASING | |||||||||||||||||||||
A & L CF March (8) Limited (b) | United Kingdom | 0.00% | 100.00% | 100.00% | LEASING | |||||||||||||||||||||||||||||||
A & L CF March (9) Limited (b) | United Kingdom | 0.00% | 100.00% | 100.00% | LEASING | |||||||||||||||||||||||||||||||
A & L CF September (2) Limited (b) | United Kingdom | 0.00% | 100.00% | 100.00% | LEASING | |||||||||||||||||||||||||||||||
A & L CF September (3) Limited | United Kingdom | 0.00% | 100.00% | 100.00% | LEASING | United Kingdom | 0.00 | % | 100.00 | % | 100.00 | % | 100.00 | % | LEASING | |||||||||||||||||||||
A & L CF September (4) Limited | United Kingdom | 0.00% | 100.00% | 100.00% | LEASING | United Kingdom | 0.00 | % | 100.00 | % | 100.00 | % | 100.00 | % | LEASING | |||||||||||||||||||||
A & L CF September (5) Limited | United Kingdom | 0.00% | 100.00% | 100.00% | LEASING | |||||||||||||||||||||||||||||||
A N (123) plc | United Kingdom | 0.00% | 100.00% | 100.00% | HOLDING COMPANY | |||||||||||||||||||||||||||||||
A & L CF September (5) Limited (b) | United Kingdom | 0.00 | % | 100.00 | % | 100.00 | % | 100.00 | % | LEASING | ||||||||||||||||||||||||||
A N (123) Limited | United Kingdom | 0.00 | % | 100.00 | % | 100.00 | % | 100.00 | % | HOLDING COMPANY | ||||||||||||||||||||||||||
A N Loans Limited (b) | United Kingdom | 0.00 | % | 100.00 | % | 100.00 | % | 100.00 | % | FINANCE | ||||||||||||||||||||||||||
A&L Services Limited | Isle of Man | 0.00% | 100.00% | 100.00% | BANKING | Isle of Man | 0.00 | % | 100.00 | % | 100.00 | % | 100.00 | % | SERVICES | |||||||||||||||||||||
Abbey Business Services (India) Private Limited | India | 0.00% | 100.00% | 100.00% | HOLDING COMPANY | India | 0.00 | % | 100.00 | % | 100.00 | % | 100.00 | % | HOLDING COMPANY | |||||||||||||||||||||
Abbey Covered Bonds (Holdings) Limited | United Kingdom | — | (a) | — | SECURITIZATION | United Kingdom | — | (a) | — | — | SECURITIZATION | |||||||||||||||||||||||||
Abbey Covered Bonds (LM) Limited | United Kingdom | — | (a) | — | SECURITIZATION | United Kingdom | — | (a) | — | — | SECURITIZATION | |||||||||||||||||||||||||
Abbey Covered Bonds LLP | United Kingdom | — | (a) | — | SECURITIZATION | United Kingdom | — | (a) | — | — | SECURITIZATION | |||||||||||||||||||||||||
Abbey National (America) Holdings Inc. | United States | 0.00% | 100.00% | 100.00% | HOLDING COMPANY | United States | 0.00 | % | 100.00 | % | 100.00 | % | 100.00 | % | HOLDING COMPANY | |||||||||||||||||||||
Abbey National (America) Holdings Limited | United Kingdom | 0.00 | % | 100.00 | % | 100.00 | % | 100.00 | % | HOLDING COMPANY | ||||||||||||||||||||||||||
Abbey National (Holdings) Limited | United Kingdom | 0.00 | % | 100.00 | % | 100.00 | % | 100.00 | % | HOLDING COMPANY | ||||||||||||||||||||||||||
Abbey National Beta Investments Limited | United Kingdom | 0.00 | % | 100.00 | % | 100.00 | % | 100.00 | % | FINANCE | ||||||||||||||||||||||||||
Abbey National Business Office Equipment Leasing Limited | United Kingdom | 0.00 | % | 100.00 | % | 100.00 | % | 100.00 | % | LEASING | ||||||||||||||||||||||||||
Abbey National Financial Investments 3 B.V. | The Netherlands | 0.00 | % | 100.00 | % | 100.00 | % | 100.00 | % | FINANCE | ||||||||||||||||||||||||||
Abbey National Financial Investments 4 B.V. | The Netherlands | 0.00 | % | 100.00 | % | 100.00 | % | 100.00 | % | FINANCE | ||||||||||||||||||||||||||
Abbey National GP (Jersey) Limited | Jersey | 0.00 | % | 100.00 | % | 100.00 | % | 100.00 | % | FINANCE | ||||||||||||||||||||||||||
Abbey National International Limited | Jersey | 0.00 | % | 100.00 | % | 100.00 | % | 100.00 | % | BANKING | ||||||||||||||||||||||||||
Abbey National Investments (b) | United Kingdom | 0.00 | % | 100.00 | % | 100.00 | % | 100.00 | % | FINANCE | ||||||||||||||||||||||||||
Abbey National Investments Holdings Limited (b) | United Kingdom | 0.00 | % | 100.00 | % | 100.00 | % | 100.00 | % | HOLDING COMPANY | ||||||||||||||||||||||||||
Abbey National Legacy Holdings Limited (b) | United Kingdom | 0.00 | % | 100.00 | % | 100.00 | % | 100.00 | % | HOLDING COMPANY | ||||||||||||||||||||||||||
Abbey National Legacy Limited (b) | United Kingdom | 0.00 | % | 100.00 | % | 100.00 | % | 100.00 | % | HOLDING COMPANY | ||||||||||||||||||||||||||
Company Location Line of business Abbey National Nominees Limited SECURITIES COMPANY Abbey National North America Holdings Limited HOLDING COMPANY Abbey National North America LLC FINANCE Abbey National Pension (Escrow Services) Limited PENSION FUND MANAGEMENT COMPANY Abbey National PLP (UK) Limited FINANCE Abbey National Property Investments FINANCE Abbey National Securities Inc. SECURITIES COMPANY Abbey National September Leasing (3) Limited (b) LEASING Abbey National Treasury Investments FINANCE Abbey National Treasury Services (Transport Holdings) Limited (b) HOLDING COMPANY Abbey National Treasury Services Investments Limited FINANCE Abbey National Treasury Services Overseas Holdings HOLDING COMPANY Abbey National Treasury Services plc BANKING Abbey National UK Investments FINANCE Abbey Stockbrokers (Nominees) Limited SECURITIES COMPANY Abbey Stockbrokers Limited SECURITIES COMPANY Ablasa Participaciones, S.L. HOLDING COMPANY Ablasa Participações S.A. HOLDING COMPANY Administración de Bancos Latinoamericanos Santander, S.L. HOLDING COMPANY Aevis Europa, S.L. CARDS Afisa S.A. FUND MANAGEMENT COMPANY Agrícola Tabaibal, S.A. AGRICULTURE AND LIVESTOCK AKB Marketing Services Sp. Z.o.o. MARKETING AL (ROUTH) Limited HOLDING COMPANY Alcaidesa Golf, S.L. SPORTS OPERATIONS Alcaidesa Holding, S.A. PROPERTY Alcaidesa Inmobiliaria, S.A. PROPERTY Alcaidesa Servicios, S.A. SERVICES ALCF Investments Limited (b) FINANCE ALIL Services Limited SERVICES Aljarafe Golf, S.A. PROPERTY Aljardi SGPS, Lda. HOLDING COMPANY Alliance & Leicester (Jersey) Limited (b) FINANCE Alliance & Leicester Cash Solutions Limited FINANCE Alliance & Leicester Commercial Bank plc FINANCE Alliance & Leicester Commercial Finance (Holdings) plc (b) HOLDING COMPANY Alliance & Leicester Equity Investments (Guarantee) Limited (b) FINANCE Alliance & Leicester Estate Agents (Mortgage & Finance) Limited (b) FINANCE % of ownership held by
the Bank % of voting power (c) Direct Indirect 2013 2012 United Kingdom 0.00 % 100.00 % 100.00 % 100.00 % United Kingdom 0.00 % 100.00 % 100.00 % 100.00 % United States 0.00 % 100.00 % 100.00 % 100.00 % United Kingdom 0.00 % 100.00 % 100.00 % 100.00 % United Kingdom 0.00 % 100.00 % 100.00 % 100.00 % United Kingdom 0.00 % 100.00 % 100.00 % 100.00 % United States 0.00 % 100.00 % 100.00 % 100.00 % United Kingdom 0.00 % 100.00 % 100.00 % 100.00 % United Kingdom 0.00 % 100.00 % 100.00 % 100.00 % United Kingdom 0.00 % 100.00 % 100.00 % 100.00 % United Kingdom 0.00 % 100.00 % 100.00 % 100.00 % United Kingdom 0.00 % 100.00 % 100.00 % 99.99 % United Kingdom 0.00 % 100.00 % 100.00 % 100.00 % United Kingdom 0.00 % 100.00 % 100.00 % 100.00 % United Kingdom 0.00 % 100.00 % 100.00 % 100.00 % United Kingdom 0.00 % 100.00 % 100.00 % 100.00 % Spain 100.00 % 0.00 % 100.00 % 100.00 % Brazil 0.00 % 75.25 % 100.00 % 100.00 % Spain 24.11 % 75.89 % 100.00 % 100.00 % Spain 68.80 % 0.00 % 68.80 % — Chile 0.00 % 100.00 % 100.00 % 100.00 % Spain 0.00 % 74.23 % 100.00 % 100.00 % Poland 0.00 % 100.00 % 100.00 % 100.00 % United Kingdom 0.00 % 100.00 % 100.00 % — Spain 0.00 % 50.00 % 100.00 % 50.00 % Spain 0.00 % 50.00 % 50.00 % 50.00 % Spain 0.00 % 50.00 % 100.00 % 50.00 % Spain 0.00 % 50.00 % 100.00 % 50.00 % United Kingdom 0.00 % 100.00 % 100.00 % 100.00 % Isle of Man 0.00 % 100.00 % 100.00 % 100.00 % Spain 0.00 % 89.41 % 89.41 % 89.41 % Portugal 0.00 % 100.00 % 100.00 % 100.00 % United Kingdom 0.00 % 100.00 % 100.00 % 100.00 % United Kingdom 0.00 % 100.00 % 100.00 % 100.00 % United Kingdom 0.00 % 100.00 % 100.00 % 100.00 % United Kingdom 0.00 % 100.00 % 100.00 % 100.00 % United Kingdom — (a) — — United Kingdom 0.00 % 100.00 % 100.00 % 100.00 %
Company Location Line of business Alliance & Leicester Financing plc (b) FINANCE Alliance & Leicester Independent Financial Advisers Limited (b) FINANCE Alliance & Leicester Investments (Derivatives No.3) Limited FINANCE Alliance & Leicester Investments (Derivatives) Limited FINANCE Alliance & Leicester Investments (No.2) Limited FINANCE Alliance & Leicester Investments (No.3) LLP (b) FINANCE Alliance & Leicester Investments (No.4) Limited (b) FINANCE Alliance & Leicester Investments Limited FINANCE Alliance & Leicester Limited BANKING Alliance & Leicester Personal Finance Limited FINANCE Alliance & Leicester Print Services Limited (b) SERVICES Alliance Bank Limited (b) FINANCE Alliance Corporate Services Limited (b) FINANCE Altamira Asset Management, S.L. HOLDING COMPANY Altamira Santander Real Estate Distribución, S.A. SERVICES Altamira Santander Real Estate, S.A. PROPERTY Amazonia Trade Limited HOLDING COMPANY Andaluza de Inversiones, S.A. HOLDING COMPANY ANITCO Limited HOLDING COMPANY Aquanima Brasil Ltda. E-COMMERCE Aquanima Chile S.A. E-COMMERCE Aquanima México S. de R.L. de C.V. E-COMMERCE Aquanima S.A. SERVICES Argenline, S.A. FINANCE Asesora Caraban, C.A. SECURITIES COMPANY Asesoría Estratega, S.C. SERVICES Atual Companhia Securitizadora de Créditos Financeiros FINANCIAL SERVICES Aurum Inversiones Limitada HOLDING COMPANY Aviación Antares, A.I.E. FULL-SERVICE LEASING Aviación Británica, A.I.E. FULL-SERVICE LEASING Aviación Centaurus, A.I.E. FULL-SERVICE LEASING Aviación Intercontinental, A.I.E. FULL-SERVICE LEASING Aviación RC II, A.I.E. FULL-SERVICE LEASING Aviación Real, A.I.E. FULL-SERVICE LEASING Aviación Regional Cántabra, A.I.E. FULL-SERVICE LEASING Aviación Scorpius, A.I.E. FULL-SERVICE LEASING Aviación Tritón, A.I.E. FULL-SERVICE LEASING Aymoré Crédito, Financiamento e Investimento S.A. FINANCE Bajondillo, S.A. PROPERTY Banbou S.A.R.L. HOLDING COMPANYF-256 % of ownership held by
the Bank % of voting power (c) Direct Indirect 2013 2012 United Kingdom 0.00 % 100.00 % 100.00 % 100.00 % United Kingdom 0.00 % 100.00 % 100.00 % 100.00 % United Kingdom 0.00 % 100.00 % 100.00 % 100.00 % United Kingdom 0.00 % 100.00 % 100.00 % 100.00 % United Kingdom 0.00 % 100.00 % 100.00 % 100.00 % United Kingdom 0.00 % 100.00 % 100.00 % 100.00 % United Kingdom 0.00 % 100.00 % 100.00 % 100.00 % United Kingdom 0.00 % 100.00 % 100.00 % 100.00 % United Kingdom 0.00 % 100.00 % 100.00 % 100.00 % United Kingdom 0.00 % 100.00 % 100.00 % 100.00 % United Kingdom 0.00 % 100.00 % 100.00 % 100.00 % United Kingdom 0.00 % 100.00 % 100.00 % 100.00 % United Kingdom 0.00 % 100.00 % 100.00 % 100.00 % Spain 72.50 % 27.50 % 100.00 % — Spain 0.00 % 100.00 % 100.00 % — Spain 98.85 % 1.15 % 100.00 % 100.00 % United Kingdom 100.00 % 0.00 % 100.00 % 100.00 % Spain 0.00 % 100.00 % 100.00 % 100.00 % United Kingdom 0.00 % 100.00 % 100.00 % 100.00 % Brazil 0.00 % 100.00 % 100.00 % 100.00 % Chile 0.00 % 100.00 % 100.00 % 100.00 % Mexico 0.00 % 100.00 % 100.00 % 100.00 % Argentina 0.00 % 100.00 % 100.00 % 100.00 % Uruguay 0.00 % 100.00 % 100.00 % 100.00 % Venezuela 0.00 % 90.00 % 90.00 % 90.00 % Mexico 0.00 % 100.00 % 100.00 % 100.00 % Brazil 0.00 % 75.25 % 100.00 % 100.00 % Chile 50.00 % 50.00 % 100.00 % 100.00 % Spain 99.99 % 0.01 % 100.00 % 100.00 % Spain 99.99 % 0.01 % 100.00 % 100.00 % Spain 99.99 % 0.01 % 100.00 % 100.00 % Spain 65.00 % 0.00 % 65.00 % 65.00 % Spain 99.99 % 0.01 % 100.00 % 100.00 % Spain 99.99 % 0.01 % 100.00 % 100.00 % Spain 73.58 % 0.00 % 73.58 % 73.58 % Spain 99.99 % 0.01 % 100.00 % 100.00 % Spain 99.99 % 0.01 % 100.00 % 100.00 % Brazil 0.00 % 75.25 % 100.00 % 100.00 % Spain 100.00 % 0.00 % 100.00 % 100.00 % France 0.00 % 90.00 % 100.00 % 100.00 %
| % of ownership held by the Bank | % of voting | |||||||||||||||
Company | Location | Direct | Indirect | power (c) | Line of business | |||||||||||
Abbey National (America) Holdings Limited | United Kingdom | 0.00% | 100.00% | 100.00% | HOLDING COMPANY | |||||||||||
Abbey National (CF Trustee) Limited | United Kingdom | 0.00% | 100.00% | 100.00% | ASSET MANAGEMENT COMPANY | |||||||||||
Abbey National (Holdings) Limited | United Kingdom | 0.00% | 100.00% | 100.00% | HOLDING COMPANY | |||||||||||
Abbey National Alpha Investments (b) | United Kingdom | 0.00% | 100.00% | 100.00% | FINANCE | |||||||||||
Abbey National American Investments Limited | United Kingdom | 0.00% | 100.00% | 100.00% | FINANCE | |||||||||||
Abbey National Baker Street Investments (b) | United Kingdom | 0.00% | 100.00% | 100.00% | FINANCE | |||||||||||
Abbey National Beta Investments Limited | United Kingdom | 0.00% | 100.00% | 100.00% | FINANCE | |||||||||||
Abbey National Business Cashflow Finance Limited (b) | United Kingdom | 0.00% | 100.00% | 100.00% | FACTORING | |||||||||||
Abbey National Business Office Equipment Leasing Limited | United Kingdom | 0.00% | 100.00% | 100.00% | LEASING | |||||||||||
Abbey National Capital LP I | United States | — | (a) | — | FINANCE | |||||||||||
Abbey National Financial Investments 3 B.V. | The Netherlands | 0.00% | 100.00% | 100.00% | FINANCE | |||||||||||
Abbey National Financial Investments 4 B.V. | The Netherlands | 0.00% | 100.00% | 100.00% | FINANCE | |||||||||||
Abbey National General Insurance Services Limited (b) | United Kingdom | 0.00% | 100.00% | 100.00% | ADVISORY SERVICES | |||||||||||
Abbey National GP (Jersey) Limited | Jersey | 0.00% | 100.00% | 100.00% | FINANCE | |||||||||||
Abbey National Group Pension Schemes Trustees Limited | United Kingdom | 0.00% | 100.00% | 100.00% | ASSET MANAGEMENT COMPANY | |||||||||||
Abbey National Homes Limited (b) | United Kingdom | 0.00% | 100.00% | 100.00% | FINANCE | |||||||||||
Abbey National International Limited | Jersey | 0.00% | 100.00% | 100.00% | BANKING | |||||||||||
Abbey National Investments | United Kingdom | 0.00% | 100.00% | 100.00% | FINANCE | |||||||||||
Abbey National Legacy Holdings Limited | United Kingdom | 0.00% | 100.00% | 100.00% | HOLDING COMPANY | |||||||||||
Abbey National Legacy Leasing Limited | United Kingdom | 0.00% | 100.00% | 100.00% | HOLDING COMPANY | |||||||||||
Abbey National Legacy Limited | United Kingdom | 0.00% | 100.00% | 100.00% | HOLDING COMPANY | |||||||||||
Abbey National Nominees Limited | United Kingdom | 0.00% | 100.00% | 100.00% | BROKER-DEALER | |||||||||||
Abbey National North America Holdings Limited | United Kingdom | 0.00% | 100.00% | 100.00% | HOLDING COMPANY | |||||||||||
Abbey National North America LLC | United States | 0.00% | 100.00% | 100.00% | FINANCE | |||||||||||
Abbey National Pension (Escrow Services) Limited | United Kingdom | 0.00% | 100.00% | 100.00% | PENSION FUND MANAGEMENT COMPANY | |||||||||||
Abbey National Personal Pensions Trustee Limited (b) | United Kingdom | 0.00% | 100.00% | 100.00% | ASSET MANAGEMENT COMPANY | |||||||||||
Abbey National PLP (UK) Limited | United Kingdom | 0.00% | 100.00% | 100.00% | FINANCE | |||||||||||
Abbey National Property Investments | United Kingdom | 0.00% | 100.00% | 100.00% | FINANCE | |||||||||||
Abbey National Property Services Limited (b) | United Kingdom | 0.00% | 100.00% | 100.00% | PROPERTY | |||||||||||
Abbey National Securities Inc. | United States | 0.00% | 100.00% | 100.00% | BROKER-DEALER | |||||||||||
Abbey National September Leasing (3) Limited | United Kingdom | 0.00% | 100.00% | 100.00% | LEASING | |||||||||||
Abbey National Sterling Capital plc (b) | United Kingdom | 0.00% | 100.00% | 100.00% | FINANCE | |||||||||||
Abbey National Treasury Investments | United Kingdom | 0.00% | 100.00% | 100.00% | FINANCE | |||||||||||
| % of ownership held by the Bank | % of voting power (c) | |||||||||||||||||||
Company | Location | Direct | Indirect | 2013 | 2012 | Line of business | ||||||||||||||
Banco Bandepe S.A. | Brazil | 0.00 | % | 75.25 | % | 100.00 | % | 100.00 | % | BANKING | ||||||||||
Banco de Albacete, S.A. | Spain | 100.00 | % | 0.00 | % | 100.00 | % | 100.00 | % | BANKING | ||||||||||
Banco de Asunción, S.A. in voluntary liquidation (b) | Paraguay | 0.00 | % | 99.33 | % | 99.33 | % | 99.33 | % | BANKING | ||||||||||
Banco Madesant - Sociedade Unipessoal, S.A. | Portugal | 0.00 | % | 100.00 | % | 100.00 | % | 100.00 | % | BANKING | ||||||||||
Banco Santander - Chile | Chile | 0.00 | % | 67.01 | % | 67.18 | % | 67.18 | % | BANKING | ||||||||||
Banco Santander (Brasil), S.A. | Brazil | 0.00 | % | 75.25 | % | 76.19 | % | 76.09 | % | BANKING | ||||||||||
Banco Santander (México), S.A., Institución de Banca Múltiple, Grupo Financiero Santander México | Mexico | 0.00 | % | 75.08 | % | 99.99 | % | 99.99 | % | BANKING | ||||||||||
Banco Santander (Panamá), S.A. | Panama | 0.00 | % | 100.00 | % | 100.00 | % | 100.00 | % | BANKING | ||||||||||
Banco Santander (Suisse) SA | Switzerland | 0.00 | % | 100.00 | % | 100.00 | % | 100.00 | % | BANKING | ||||||||||
Banco Santander Bahamas International Limited | Bahamas | 0.00 | % | 100.00 | % | 100.00 | % | 100.00 | % | BANKING | ||||||||||
Banco Santander Consumer Portugal, S.A. | Portugal | 0.00 | % | 100.00 | % | 100.00 | % | 100.00 | % | BANKING | ||||||||||
Banco Santander de Negocios Colombia | Colombia | 0.00 | % | 99.99 | % | 99.99 | % | — | FINANCE | |||||||||||
Banco Santander International | United States | 100.00 | % | 0.00 | % | 100.00 | % | 100.00 | % | BANKING | ||||||||||
Banco Santander Perú S.A. | Peru | 99.00 | % | 1.00 | % | 100.00 | % | 100.00 | % | BANKING | ||||||||||
Banco Santander Puerto Rico | Puerto Rico | 0.00 | % | 100.00 | % | 100.00 | % | 100.00 | % | BANKING | ||||||||||
Banco Santander Río S.A. | Argentina | 8.23 | % | 91.07 | % | 98.45 | % | 99.02 | % | BANKING | ||||||||||
Banco Santander Totta, S.A. | Portugal | 0.00 | % | 99.79 | % | 99.91 | % | 99.89 | % | BANKING | ||||||||||
Banco Santander, S.A. | Uruguay | 97.75 | % | 2.25 | % | 100.00 | % | 100.00 | % | BANKING | ||||||||||
Banesto Banca Privada Gestión, S.A. S.G.I.I.C. | Spain | 100.00 | % | 0.00 | % | 100.00 | % | 100.00 | % | FUND MANAGEMENT COMPANY | ||||||||||
Bank Zachodni WBK S.A. | Poland | 70.00 | % | 0.00 | % | 70.00 | % | 94.23 | % | BANKING | ||||||||||
Bansa Santander S.A. | Chile | 0.00 | % | 100.00 | % | 100.00 | % | 100.00 | % | PROPERTY | ||||||||||
Bansalud, S.L. | Spain | 53.00 | % | 12.00 | % | 65.00 | % | 65.00 | % | TECHNOLOGY SERVICES | ||||||||||
Bansamex, S.A. | Spain | 50.00 | % | 0.00 | % | 50.00 | % | 50.00 | % | CARDS | ||||||||||
Bayones ECA Limited | Ireland | — | (a) | — | — | FINANCE | ||||||||||||||
BCLF 2013-1 B.V. | The Netherlands | — | (a) | — | — | SECURITIZATION | ||||||||||||||
Bel Canto SICAV Erodiade | Luxembourg | 100.00 | % | 0.00 | % | 100.00 | % | 100.00 | % | OPEN-END INVESTMENT COMPANY | ||||||||||
Besaya ECA Limited | Ireland | — | (a) | — | — | FINANCE | ||||||||||||||
BFI Serwis Sp. z o.o. w likwidacji (b) | Poland | 0.00 | % | 70.00 | % | 100.00 | % | — | FUND MANAGEMENT COMPANY | |||||||||||
Bilkreditt 1 Limited | Ireland | — | (a) | — | — | SECURITIZATION | ||||||||||||||
Bilkreditt 2 Limited | Ireland | — | (a) | — | — | SECURITIZATION | ||||||||||||||
Bilkreditt 3 Limited | Ireland | — | (a) | — | — | SECURITIZATION | ||||||||||||||
Bilkreditt 4 Limited | Ireland | — | (a) | — | — | SECURITIZATION | ||||||||||||||
Bilkreditt 5 Limited | Ireland | — | (a) | — | — | SECURITIZATION | ||||||||||||||
Blue Energy Ridgewind Investments Limited | United Kingdom | 0.00 | % | 100.00 | % | 100.00 | % | — | ELECTRICITY PRODUCTION | |||||||||||
Blue Energy Ridgewind Operations Limited | United Kingdom | 0.00 | % | 100.00 | % | 100.00 | % | — | HOLDING COMPANY | |||||||||||
Bracken Securities Holdings Limited (b) | United Kingdom | — | (a) | — | — | SECURITIZATION | ||||||||||||||
Brazil Foreign Diversified Payment Rights Finance Company | Cayman Islands | — | (a) | — | — | SECURITIZATION | ||||||||||||||
Broxsted Solar Co Limited | United Kingdom | 0.00 | % | 100.00 | % | 100.00 | % | — | ELECTRICITY PRODUCTION | |||||||||||
BRS Investments S.A. | Argentina | 0.00 | % | 100.00 | % | 100.00 | % | 100.00 | % | HOLDING COMPANY | ||||||||||
Company Location Line of business BST International Bank, Inc. BANKING BZ WBK Asset Management S.A. FUND MANAGEMENT COMPANY BZ WBK Faktor Sp. z o.o. FINANCIAL SERVICES BZ WBK Finanse Sp. z o.o. FINANCIAL SERVICES BZ WBK Inwestycje Sp. z o.o. SECURITIES COMPANY BZ WBK Leasing S.A. LEASING BZ WBK Nieruchomości S.A. SERVICES BZ WBK Towarzystwo Funduszy Inwestycyjnych S.A. FUND MANAGEMENT COMPANY BZ WBK - Aviva Towarzystwo Ubezpieczeń na Życie S.A. INSURANCE BZ WBK - Aviva Towarzystwo Ubezpieczeń Ogólnych S.A. INSURANCE C.S.N.S.P. 442, S.A. ELECTRICITY PRODUCTION C.S.N.S.P. 451, S.A. ELECTRICITY PRODUCTION Caja de Emisiones con Garantía de Anualidades Debidas por el Estado, S.A. FINANCE Cántabra de Inversiones, S.A. HOLDING COMPANY Cántabro Catalana de Inversiones, S.A. HOLDING COMPANY CAPB Limited BANKING Capital Riesgo Global, SCR de Régimen Simplificado, S.A. VENTURE CAPITAL COMPANY Capital Street Delaware, LP HOLDING COMPANY Capital Street Holdings, LLC HOLDING COMPANY Capital Street REIT Holdings, LLC HOLDING COMPANY Capital Street S.A. FINANCE Carfax (Guernsey) Limited (e) INSURANCE BROKER Carpe Diem Salud, S.L. SECURITIES INVESTMENT Cartera Mobiliaria, S.A., SICAV SECURITIES INVESTMENT Casa de Bolsa Santander, S.A. de C.V., Grupo Financiero Santander México SECURITIES COMPANY Cater Allen Holdings Limited HOLDING COMPANY Cater Allen International Limited SECURITIES COMPANY Cater Allen Limited BANKING Cater Allen Lloyd’s Holdings Limited HOLDING COMPANY Cater Allen Pensions Limited (b) PENSION FUND MANAGEMENT COMPANY Cater Allen Syndicate Management Limited ADVISORY SERVICES Central Eólica Santo Antonio De Padua S.A. ELECTRICITY PRODUCTION Central Eólica Sao Cristovao S.A. ELECTRICITY PRODUCTION Central Eólica Sao Jorge S.A. ELECTRICITY PRODUCTION Certidesa, S.L. LEASE OF AIRCRAFT % of ownership held by
the Bank % of voting power (c) Direct Indirect 2013 2012 Puerto Rico 0.00 % 99.79 % 100.00 % 100.00 % Poland 50.00 % 35.00 % 100.00 % 100.00 % Poland 0.00 % 70.00 % 100.00 % 100.00 % Poland 0.00 % 70.00 % 100.00 % 100.00 % Poland 0.00 % 70.00 % 100.00 % 100.00 % Poland 0.00 % 70.00 % 100.00 % 100.00 % Poland 0.00 % 69.99 % 99.99 % 99.99 % Poland 0.00 % 85.00 % 100.00 % 100.00 % Poland 0.00 % 46.20 % 66.00 % 50.00 % Poland 0.00 % 46.20 % 66.00 % 50.00 % Portugal 0.00 % 100.00 % 100.00 % — Portugal 0.00 % 100.00 % 100.00 % — Spain 62.87 % 0.00 % 62.87 % 62.87 % Spain 100.00 % 0.00 % 100.00 % 100.00 % Spain 100.00 % 0.00 % 100.00 % 100.00 % United Kingdom 0.00 % 100.00 % 100.00 % 100.00 % Spain 95.46 % 4.54 % 100.00 % 100.00 % United States 0.00 % 100.00 % 100.00 % 100.00 % United States 0.00 % 100.00 % 100.00 % 100.00 % United States 0.00 % 100.00 % 100.00 % 100.00 % Luxembourg 0.00 % 100.00 % 100.00 % 100.00 % Guernsey 0.00 % 100.00 % 100.00 % 100.00 % Spain 100.00 % 0.00 % 100.00 % 100.00 % Spain 0.00 % 81.74 % 93.24 % 93.08 % Mexico 0.00 % 75.06 % 99.97 % 99.97 % United Kingdom 0.00 % 100.00 % 100.00 % 100.00 % United Kingdom 0.00 % 100.00 % 100.00 % 100.00 % United Kingdom 0.00 % 100.00 % 100.00 % 100.00 % United Kingdom 0.00 % 100.00 % 100.00 % 100.00 % United Kingdom 0.00 % 100.00 % 100.00 % 100.00 % United Kingdom 0.00 % 100.00 % 100.00 % 100.00 % Brazil 0.00 % 75.25 % 100.00 % 100.00 % Brazil 0.00 % 75.25 % 100.00 % 100.00 % Brazil 0.00 % 75.25 % 100.00 % 100.00 % Spain 0.00 % 100.00 % 100.00 % 100.00 %
Company Location Line of business Clínica Sear, S.A. HEALTHCARE Club Zaudin Golf, S.A. SERVICES Conaraz Inversiones, SICAV, S.A. OPEN-END INVESTMENT COMPANY Costa Canaria de Veneguera, S.A. PROPERTY Crawfall S.A. SERVICES Credisol, S.A. (b) FINANCE CRV Distribuidora de Títulos e Valores Mobiliários MANAGEMENT COMPANY Dansk Auto Finansiering 1 Ltd SECURITIZATION Darep Limited REINSURANCE Desarrollos Eólicos Mexicanos de Oaxaca 2, S.A.P.I. de C.V. ELECTRICITY PRODUCTION Digital Procurement Holdings N.V. HOLDING COMPANY Diners Club Spain, S.A. CARDS Dirección Estratega, S.C. SERVICES Dom Maklerski BZ WBK S.A. SECURITIES COMPANY Dudebasa, S.A. Sole-Shareholder Company FINANCE Egmere Airfield Solar Park Limited ELECTRICITY PRODUCTION Elerco, S.A. PROPERTY Empresas Banesto 5, Fondo de Titulización de Activos SECURITIZATION Empresas Banesto 6, Fondo de Titulización de Activos SECURITIZATION EOL Brisa Energias Renováveis S.A. ELECTRICITY PRODUCTION EOL Vento Energias Renováveis S.A. ELECTRICITY PRODUCTION EOL Wind Energias Renováveis S.A. ELECTRICITY PRODUCTION Eolsiponto S.r.l. ELECTRICITY PRODUCTION Ercole Investments, SICAV, S.A. OPEN-END INVESTMENT COMPANY Erestone S.A.S. PROPERTY FFB - Participações e Serviços, Sociedade Unipessoal, S.A. HOLDING COMPANY Fideicomiso 100740 SLPT FINANCE Fideicomiso 2002114 HOLDING COMPANY Fideicomiso GFSSLPT Banca Serfín, S.A. FINANCE Fideicomiso Super Letras Hipotecarias Clase I TRUST SERVICES Fideicomiso Super Letras Hipotecarias Clase II TRUST SERVICES First National Motor Business Limited LEASING First National Motor Contracts Limited LEASING First National Motor Facilities Limited LEASING First National Motor Finance Limited ADVISORY SERVICES First National Motor Leasing Limited LEASING First National Motor plc LEASINGF-257 % of ownership held by
the Bank % of voting power (c) Direct Indirect 2013 2012 Spain 50.58 % 0.00 % 50.58 % 50.58 % Spain 0.00 % 85.04 % 95.11 % 95.11 % Spain 80.78 % 0.00 % 80.78 % — Spain 37.09 % 37.14 % 74.23 % 74.23 % Uruguay 100.00 % 0.00 % 100.00 % 100.00 % Uruguay 0.00 % 100.00 % 100.00 % 100.00 % Brazil 0.00 % 75.25 % 100.00 % 100.00 % Ireland — (a) — — Ireland 100.00 % 0.00 % 100.00 % 100.00 % Mexico 0.00 % 79.99 % 79.99 % 26.00 % The Netherlands 0.00 % 100.00 % 100.00 % 100.00 % Spain 75.00 % 0.00 % 75.00 % 75.00 % Mexico 0.00 % 100.00 % 100.00 % 100.00 % Poland 0.00 % 70.00 % 99.99 % 99.99 % Spain 100.00 % 0.00 % 100.00 % 100.00 % United Kingdom 0.00 % 100.00 % 100.00 % — Spain 100.00 % 0.00 % 100.00 % 100.00 % Spain — (a) — — Spain — (a) — — Brazil 0.00 % 100.00 % 100.00 % 100.00 % Brazil 0.00 % 100.00 % 100.00 % 100.00 % Brazil 0.00 % 100.00 % 100.00 % 100.00 % Italy 0.00 % 92.00 % 92.00 % — Spain 99.97 % 0.00 % 99.97 % — France 0.00 % 90.00 % 90.00 % 90.00 % Portugal 0.00 % 100.00 % 100.00 % 100.00 % Mexico 0.00 % 75.08 % 100.00 % 100.00 % Mexico 0.00 % 75.02 % 100.00 % 100.00 % Mexico 0.00 % 75.08 % 100.00 % 100.00 % Argentina 0.00 % 99.30 % 100.00 % 100.00 % Argentina 0.00 % 99.30 % 100.00 % 100.00 % United Kingdom 0.00 % 100.00 % 100.00 % 100.00 % United Kingdom 0.00 % 100.00 % 100.00 % 100.00 % United Kingdom 0.00 % 100.00 % 100.00 % 100.00 % United Kingdom 0.00 % 100.00 % 100.00 % 100.00 % United Kingdom 0.00 % 100.00 % 100.00 % 100.00 % United Kingdom 0.00 % 100.00 % 100.00 % 100.00 %
% of ownership held by | % of voting | |||||||||||||
Company | Location | Direct | Indirect | power (c) | Line of business | |||||||||
Abbey National Treasury Services (Transport Holdings) Limited | United Kingdom | 0.00% | 100.00% | 100.00% | HOLDING COMPANY | |||||||||
Abbey National Treasury Services Investments Limited | United Kingdom | 0.00% | 100.00% | 100.00% | FINANCE | |||||||||
Abbey National Treasury Services Overseas Holdings | United Kingdom | 0.00% | 99.99% | 99.99% | HOLDING COMPANY | |||||||||
Abbey National Treasury Services plc | United Kingdom | 0.00% | 100.00% | 100.00% | BANKING | |||||||||
Abbey National UK Investments | United Kingdom | 0.00% | 100.00% | 100.00% | FINANCE | |||||||||
Abbey Stockbrokers (Nominees) Limited | United Kingdom | 0.00% | 100.00% | 100.00% | BROKER-DEALER | |||||||||
Abbey Stockbrokers Limited | United Kingdom | 0.00% | 100.00% | 100.00% | BROKER-DEALER | |||||||||
ABN AMRO Administradora de Cartões de Crédito Ltda. (d) | Brazil | 0.00% | 0.00% | 0.00% | CARDS | |||||||||
ABN AMRO Brasil dois Participações S.A. (d) | Brazil | 0.00% | 0.00% | 0.00% | HOLDING COMPANY | |||||||||
ABN AMRO Brasil Partipações e Investimentos S.A. (d) | Brazil | 0.00% | 0.00% | 0.00% | HOLDING COMPANY | |||||||||
Acapulco Energias Renováveis S.A. | Brazil | 0.00% | 100.00% | 100.00% | ELECTRICITY PRODUCTION | |||||||||
Administración de Bancos Latinoamericanos Santander, S.L. | Spain | 24.11% | 75.89% | 100.00% | HOLDING COMPANY | |||||||||
AEH Purchasing, Ltd. | Ireland | — | (a) | — | SECURITIZATION | |||||||||
Afisa S.A. | Chile | 0.00% | 100.00% | 100.00% | FUND MANAGEMENT COMPANY | |||||||||
Agencia de Seguros Santander, Ltda. | Colombia | 0.00% | 100.00% | 100.00% | INSURANCE | |||||||||
Agrícola Tabaibal, S.A. | Spain | 0.00% | 66.59% | 100.00% | AGRICULTURE AND LIVESTOCK | |||||||||
Agropecuaria Tapirapé S.A. (d) | Brazil | 0.00% | 0.00% | 0.00% | AGRICULTURE AND LIVESTOCK | |||||||||
AKB Marketing Services Sp. Z.o.o. | Poland | 0.00% | 70.00% | 100.00% | MARKETING | |||||||||
Aktúa Soluciones Financieras, S.A. | Spain | 0.00% | 89.71% | 100.00% | FINANCIAL SERVICES | |||||||||
Alcaidesa Golf, S.L. | Spain | 0.00% | 44.86% | 50.01% | SPORTS OPERATIONS | |||||||||
Alcaidesa Holding, S.A. (consolidated) | Spain | 0.00% | 44.86% | 50.01% | PROPERTY | |||||||||
Alcaidesa Inmobiliaria, S.A. | Spain | 0.00% | 44.86% | 50.01% | PROPERTY | |||||||||
Alcaidesa Servicios, S.A. | Spain | 0.00% | 44.86% | 50.01% | SERVICES | |||||||||
ALCF Investments Limited (b) | United Kingdom | 0.00% | 100.00% | 100.00% | FINANCE | |||||||||
Aljarafe Golf, S.A. | Spain | 0.00% | 80.21% | 89.41% | PROPERTY | |||||||||
Aljardi SGPS, Lda. | Portugal | 0.00% | 100.00% | 100.00% | HOLDING COMPANY | |||||||||
Alliance & Leicester (Holdings) Limited | United Kingdom | 0.00% | 100.00% | 100.00% | HOLDING COMPANY | |||||||||
Alliance & Leicester (Jersey) Limited | United Kingdom | 0.00% | 100.00% | 100.00% | FINANCE | |||||||||
Alliance & Leicester Cash Solutions Limited | United Kingdom | 0.00% | 100.00% | 100.00% | FINANCE | |||||||||
Alliance & Leicester Commercial Bank plc | United Kingdom | 0.00% | 100.00% | 100.00% | FINANCE | |||||||||
Alliance & Leicester Commercial Finance (Holdings) plc | United Kingdom | 0.00% | 100.00% | 100.00% | HOLDING COMPANY | |||||||||
Alliance & Leicester Equity Investments (Guarantee) Limited | United Kingdom | — | (a) | — | FINANCE | |||||||||
Alliance & Leicester Estate Agents (Mortgage & Finance) Limited (b) | United Kingdom | 0.00% | 100.00% | 100.00% | FINANCE | |||||||||
| % of ownership held by the Bank | % of voting power (c) | |||||||||||||||||||
Company | Location | Direct | Indirect | 2013 | 2012 | Line of business | ||||||||||||||
First National Tricity Finance Limited | United Kingdom | 0.00 | % | 100.00 | % | 100.00 | % | 100.00 | % | FINANCE | ||||||||||
Fomento e Inversiones, S.A. | Spain | 100.00 | % | 0.00 | % | 100.00 | % | 100.00 | % | HOLDING COMPANY | ||||||||||
Fondo de Titulización de Activos PYMES Banesto 3 | Spain | — | (a) | — | — | SECURITIZATION | ||||||||||||||
Fondo de Titulización de Activos PYMES Santander 3 | Spain | — | (a) | — | — | SECURITIZATION | ||||||||||||||
Fondo de Titulización de Activos PYMES Santander 4 | Spain | — | (a) | — | — | SECURITIZATION | ||||||||||||||
Fondo de Titulización de Activos PYMES Santander 5 | Spain | — | (a) | — | — | SECURITIZATION | ||||||||||||||
Fondo de Titulización de Activos PYMES Santander 6 | Spain | — | (a) | — | — | SECURITIZATION | ||||||||||||||
Fondo de Titulización de Activos PYMES Santander 7 | Spain | — | (a) | — | — | SECURITIZATION | ||||||||||||||
Fondo de Titulización de Activos Santander 2 | Spain | — | (a) | — | — | SECURITIZATION | ||||||||||||||
Fondo de Titulización de Activos Santander Consumer Spain 09-1 | Spain | — | (a) | — | — | SECURITIZATION | ||||||||||||||
Fondo de Titulización de Activos Santander Consumer Spain Auto 2010-1 | Spain | — | (a) | — | — | SECURITIZATION | ||||||||||||||
Fondo de Titulización de Activos Santander Consumer Spain Auto 2011-1 | Spain | — | (a) | — | — | SECURITIZATION | ||||||||||||||
Fondo de Titulización de Activos Santander Consumer Spain Auto 2012-1 | Spain | — | (a) | — | — | SECURITIZATION | ||||||||||||||
Fondo de Titulización de Activos Santander Consumer Spain Auto 2013-1 | Spain | — | (a) | — | — | SECURITIZATION | ||||||||||||||
Fondo de Titulización de Activos Santander Empresas 1 | Spain | — | (a) | — | — | SECURITIZATION | ||||||||||||||
Fondo de Titulización de Activos Santander Empresas 10 | Spain | — | (a) | — | — | SECURITIZATION | ||||||||||||||
Fondo de Titulización de Activos Santander Empresas 2 | Spain | — | (a) | — | — | SECURITIZATION | ||||||||||||||
Fondo de Titulización de Activos Santander Empresas 3 | Spain | — | (a) | — | — | SECURITIZATION | ||||||||||||||
Fondo de Titulización de Activos Santander Empresas 8 | Spain | — | (a) | — | — | SECURITIZATION | ||||||||||||||
Fondo de Titulización de Activos Santander Empresas 9 | Spain | — | (a) | — | — | SECURITIZATION | ||||||||||||||
Fondo de Titulización de Activos Santander Financiación 5 | Spain | — | (a) | — | — | SECURITIZATION | ||||||||||||||
Fondo de Titulización de Activos Santander Hipotecario 7 | Spain | — | (a) | — | — | SECURITIZATION | ||||||||||||||
Fondo de Titulización de Activos Santander Hipotecario 8 | Spain | — | (a) | — | — | SECURITIZATION | ||||||||||||||
Fondo de Titulización de Activos Santander Hipotecario 9 | Spain | — | (a) | — | — | SECURITIZATION | ||||||||||||||
Fondo de Titulización de Activos Santander Público 1 | Spain | — | (a) | — | — | SECURITIZATION | ||||||||||||||
Fondo de Titulización Santander Financiación 1 | Spain | — | (a) | — | — | SECURITIZATION | ||||||||||||||
Fondos Santander, S.A. Administradora de Fondos de Inversión (in liquidation) (b) | Uruguay | 0.00 | % | 100.00 | % | 100.00 | % | 100.00 | % | FUND MANAGEMENT COMPANY | ||||||||||
Formación Integral, S.A. | Spain | 100.00 | % | 0.00 | % | 100.00 | % | 100.00 | % | TRAINING | ||||||||||
Company Location Line of business Fortensky Trading, Ltd. FINANCE Fosse (Master Issuer) Holdings Limited SECURITIZATION Fosse Funding (No.1) Limited SECURITIZATION Fosse Master Issuer PLC SECURITIZATION Fosse PECOH Limited SECURITIZATION Fosse Trustee (UK) Limited SECURITIZATION Fosse Trustee Limited SECURITIZATION FTPYME Banesto 2, Fondo de Titulización de Activos SECURITIZATION FTPYME Santander 2 Fondo de Titulización de Activos SECURITIZATION Garilar, S.A. INTERNET Geoban UK Limited SERVICES Geoban, S.A. SERVICES Gesban México Servicios Administrativos Globales, S.A. de C.V. SERVICES Gesban Santander Servicios Profesionales Contables Limitada INTERNET Gesban Servicios Administrativos Globales, S.L. SERVICES Gesban UK Limited COLLECTION AND PAYMENT SERVICES Gestión de Instalaciones Fotovoltaicas, S.L. Sole-Shareholder Company ELECTRICITY PRODUCTION Gestora de Procesos S.A. in liquidation (b) HOLDING COMPANY Gestora Patrimonial Calle Francisco Sancha 12, S.L. SECURITIES AND PROPERTY MANAGEMENT Girobank Carlton Investments Limited (b) FINANCE Girobank Investments Limited (b) FINANCE Golden Bar (securization) S.r.l. SECURITIZATION Golden Bar Securitization Programme IV 2009-1 SECURITIZATION Golden Bar Stand Alone 2011-1 SECURITIZATION Golden Bar Stand Alone 2011-2 SECURITIZATION Golden Bar Stand Alone 2011-3 SECURITIZATION Golden Bar Stand Alone 2012-1 SECURITIZATION Golden Bar Stand Alone 2012-2 SECURITIZATION Golden Bar Stand Alone 2013-1 SECURITIZATION Golden Bar Stand Alone 2013-2 SECURITIZATION Grupo Alcanza, S.A. de C.V. HOLDING COMPANY Grupo Empresarial Santander, S.L. HOLDING COMPANY Grupo Financiero Santander México, S.A.B. de C.V. HOLDING COMPANY Grupo Konecta Centros Especiales de Empleo, S.L. TELEMARKETING Grupo Konecta Maroc S.A.R.L. à associé unique TELEMARKETING Grupo Konecta UK Limited FINANCE Grupo Konectanet México, S.A. de C.V. TELEMARKETING Grupo Konectanet, S.L. HOLDING COMPANY % of ownership held by
the Bank % of voting power (c) Direct Indirect 2013 2012 Ireland 0.00 % 100.00 % 100.00 % 100.00 % United Kingdom — (a) — — United Kingdom 0.00 % 100.00 % 100.00 % 100.00 % United Kingdom 0.00 % 100.00 % 100.00 % 100.00 % United Kingdom — (a) — — United Kingdom — (a) — — Jersey — (a) — — Spain — (a) — — Spain — (a) — — Uruguay 0.00 % 100.00 % 100.00 % 100.00 % United Kingdom 0.00 % 100.00 % 100.00 % 100.00 % Spain 100.00 % 0.00 % 100.00 % 100.00 % Mexico 0.00 % 100.00 % 100.00 % 100.00 % Chile 0.00 % 100.00 % 100.00 % 100.00 % Spain 99.99 % 0.01 % 100.00 % 100.00 % United Kingdom 0.00 % 100.00 % 100.00 % 100.00 % Spain 0.00 % 100.00 % 100.00 % 100.00 % Peru 0.00 % 100.00 % 100.00 % 100.00 % Spain 68.80 % 0.00 % 68.80 % — United Kingdom 0.00 % 100.00 % 100.00 % 100.00 % United Kingdom 0.00 % 100.00 % 100.00 % 100.00 % Italy — (a) — — Italy — (a) — — Italy — (a) — — Italy — (a) — — Italy — (a) — — Italy — (a) — — Italy — (a) — — Italy — (a) — — Italy — (a) — — Mexico 100.00 % 0.00 % 100.00 % 100.00 % Spain 99.11 % 0.89 % 100.00 % 100.00 % Mexico 51.05 % 24.04 % 75.13 % 75.17 % Spain 0.00 % 51.86 % 100.00 % 100.00 % Morocco 0.00 % 51.86 % 100.00 % 100.00 % United Kingdom 0.00 % 51.86 % 100.00 % 100.00 % Mexico 0.00 % 51.86 % 100.00 % 100.00 % Spain 7.08 % 44.77 % 51.86 % 51.86 %
Company Location Line of business GTS El Centro Equity Holdings LLC ELECTRICITY PRODUCTION Guaranty Car, S.A. Sole-Shareholder Company AUTOMOTIVE Hall Farm Wind Holdings Limited HOLDING COMPANY Hansar Finance Limited (b) FINANCE Hipototta No. 1 FTC SECURITIZATION Hipototta No. 1 plc SECURITIZATION Hipototta No. 4 FTC SECURITIZATION Hipototta No. 4 plc SECURITIZATION Hipototta No. 5 FTC SECURITIZATION Hipototta No. 5 plc SECURITIZATION Hipototta No. 7 FTC SECURITIZATION Hipototta No. 7 Limited SECURITIZATION Hipototta No. 8 FTC (b) SECURITIZATION Hipototta No. 8 Limited (b) SECURITIZATION Hispamer Renting, S.A. Sole-Shareholder Company FULL-SERVICE LEASING Holbah II Limited HOLDING COMPANY Holbah Limited HOLDING COMPANY Holmes Funding Limited SECURITIZATION Holmes Holdings Limited SECURITIZATION Holmes Master Issuer plc SECURITIZATION Holmes Trustees Limited SECURITIZATION Holneth B.V. HOLDING COMPANY Hualle, S.A. SECURITIES INVESTMENT Ibérica de Compras Corporativas, S.L. E-COMMERCE Independence Community Bank Corp. HOLDING COMPANY Independence Community Commercial Reinvestment Corp. HOLDING COMPANY Infraestructuras Americanas, S.L. HOLDING COMPANY Ingeniería de Software Bancario, S.L. IT SERVICES Inmo Francia 2, S.A. PROPERTY Instituto Santander Serfin, A.C. NOT-FOR-PROFIT INSTITUTE Insurance Funding Solutions Limited FINANCE Interfinance Holanda B.V. HOLDING COMPANY Inversiones Marítimas del Mediterráneo, S.A. INACTIVE Isban Argentina S.A. FINANCIAL SERVICES Isban Brasil S.A. SERVICES Isban Chile S.A. IT SERVICES Isban DE GmbH IT SERVICES Isban México, S.A. de C.V. IT SERVICES Isban U.K., Ltd. IT SERVICES Konecta Activos Inmobiliarios, S.L. PROPERTY Konecta Brazil Outsourcing, Ltda. SERVICES Konecta Broker, S.L. SERVICES Konecta Bto, S.L. TELECOMMUNICATIONS Konecta Chile Limitada SERVICES Konecta Colombia Grupo Konecta Colombia Ltda TELEMARKETINGF-258 % of ownership held by
the Bank % of voting power (c) Direct Indirect 2013 2012 United Kingdom 0.00 % 74.20 % 74.20 % — Spain 0.00 % 100.00 % 100.00 % 100.00 % United Kingdom 0.00 % 100.00 % 100.00 % — United Kingdom 0.00 % 100.00 % 100.00 % 100.00 % Portugal — (a) — — Ireland — (a) — — Portugal — (a) — — Ireland — (a) — — Portugal — (a) — — Ireland — (a) — — Portugal — (a) — — Ireland — (a) — — Portugal — (a) — — Ireland — (a) — — Spain 0.00 % 100.00 % 100.00 % 100.00 % Bahamas 0.00 % 100.00 % 100.00 % 100.00 % Bahamas 0.00 % 100.00 % 100.00 % 100.00 % United Kingdom — (a) — — United Kingdom — (a) — — United Kingdom — (a) — — United Kingdom — (a) — — The Netherlands 0.00 % 100.00 % 100.00 % 100.00 % Spain 100.00 % 0.00 % 100.00 % 100.00 % Spain 97.17 % 2.82 % 100.00 % 100.00 % United States 0.00 % 100.00 % 100.00 % 100.00 % United States 0.00 % 100.00 % 100.00 % 100.00 % Spain 0.00 % 100.00 % 100.00 % 100.00 % Spain 100.00 % 0.00 % 100.00 % 100.00 % Spain 100.00 % 0.00 % 100.00 % 100.00 % Mexico 0.00 % 75.08 % 100.00 % 100.00 % United Kingdom 0.00 % 100.00 % 100.00 % 100.00 % The Netherlands 100.00 % 0.00 % 100.00 % 100.00 % Spain 100.00 % 0.00 % 100.00 % 100.00 % Argentina 87.42 % 12.58 % 100.00 % 100.00 % Brazil 0.00 % 100.00 % 100.00 % 100.00 % Chile 0.00 % 100.00 % 100.00 % 100.00 % Germany 0.00 % 100.00 % 100.00 % 100.00 % Mexico 0.00 % 100.00 % 100.00 % 100.00 % United Kingdom 0.00 % 100.00 % 100.00 % 100.00 % Spain 0.00 % 49.34 % 52.80 % 52.80 % Brazil 0.00 % 51.85 % 99.99 % 99.99 % Spain 0.00 % 51.86 % 100.00 % 100.00 % Spain 0.00 % 51.86 % 100.00 % 100.00 % Chile 0.00 % 51.86 % 100.00 % 100.00 % Colombia 0.00 % 51.86 % 100.00 % 100.00 %
% of ownership held by | % of voting | |||||||||||||
Company | Location | Direct | Indirect | power (c) | Line of business | |||||||||
Alliance & Leicester Financing plc (b) | United Kingdom | 0.00% | 100.00% | 100.00% | FINANCE | |||||||||
Alliance & Leicester Independent Financial Advisers Limited (b) | United Kingdom | 0.00% | 100.00% | 100.00% | FINANCE | |||||||||
Alliance & Leicester International Holdings Limited (b) | Isle of Man | 0.00% | 100.00% | 100.00% | HOLDING COMPANY | |||||||||
Alliance & Leicester International Limited | Isle of Man | 0.00% | 100.00% | 100.00% | BANKING | |||||||||
Alliance & Leicester Investments (Derivatives No.3) Limited | United Kingdom | 0.00% | 100.00% | 100.00% | FINANCE | |||||||||
Alliance & Leicester Investments (Derivatives) Limited | United Kingdom | 0.00% | 100.00% | 100.00% | FINANCE | |||||||||
Alliance & Leicester Investments (Jersey) Limited (b) | United Kingdom | 0.00% | 100.00% | 100.00% | FINANCE | |||||||||
Alliance & Leicester Investments (No.2) Limited | United Kingdom | 0.00% | 100.00% | 100.00% | FINANCE | |||||||||
Alliance & Leicester Investments (No.3) LLP (b) | United Kingdom | 0.00% | 100.00% | 100.00% | FINANCE | |||||||||
Alliance & Leicester Investments (No.4) Limited | United Kingdom | 0.00% | 100.00% | 100.00% | FINANCE | |||||||||
Alliance & Leicester Investments Limited | United Kingdom | 0.00% | 100.00% | 100.00% | FINANCE | |||||||||
Alliance & Leicester Personal Finance Limited | United Kingdom | 0.00% | 100.00% | 100.00% | FINANCE | |||||||||
Alliance & Leicester plc | United Kingdom | 0.00% | 100.00% | 100.00% | BANKING | |||||||||
Alliance & Leicester Print Services Limited (b) | United Kingdom | 0.00% | 100.00% | 100.00% | SERVICES | |||||||||
Alliance & Leicester Share Ownership Trust Limited (b) | United Kingdom | 0.00% | 100.00% | 100.00% | FINANCE | |||||||||
Alliance & Leicester Sharesafe Limited (b) | United Kingdom | 0.00% | 100.00% | 100.00% | FINANCE | |||||||||
Alliance & Leicester Unit Trust Managers Limited (b) | United Kingdom | 0.00% | 100.00% | 100.00% | FUND AND PORTFOLIO MANAGER | |||||||||
Alliance Bank Limited | United Kingdom | 100.00% | 0.00% | 100.00% | FINANCE | |||||||||
Alliance Corporate Services Limited | United Kingdom | 0.00% | 100.00% | 100.00% | FINANCE | |||||||||
Almacenadora Somex, S.A. de C.V. | Mexico | 0.00% | 97.10% | 97.24% | WAREHOUSING | |||||||||
Altamira Santander Real Estate, S.A. | Spain | 93.62% | 6.38% | 100.00% | PROPERTY | |||||||||
Andaluza de Inversiones, S.A. | Spain | 0.00% | 100.00% | 100.00% | HOLDING COMPANY | |||||||||
ANITCO Limited | United Kingdom | 0.00% | 100.00% | 100.00% | HOLDING COMPANY | |||||||||
Aquanima Brasil Ltda. | Brazil | 0.00% | 99.43% | 100.00% | E-COMMERCE | |||||||||
Aquanima Chile S.A. | Chile | 0.00% | 99.43% | 100.00% | E-COMMERCE | |||||||||
Aquanima México S. de R.L. de C.V. | Mexico | 0.00% | 99.43% | 100.00% | E-COMMERCE | |||||||||
Aquanima S.A. | Argentina | 0.00% | 99.43% | 100.00% | SERVICES | |||||||||
Argenline, S.A. | Uruguay | 0.00% | 100.00% | 100.00% | FINANCE | |||||||||
Arka Emerging Markets SICAV – FIS | Luxemburgo | 0.00% | 67.69% | 70.33% | OPEN-END INVESTMENT COMPANY | |||||||||
Asesoría Estratega, S.C. | Mexico | 0.00% | 100.00% | 100.00% | SERVICES | |||||||||
Aurum S.A. | Chile | 50.00% | 50.00% | 100.00% | HOLDING COMPANY | |||||||||
Austin Solar I, LLC (b) | United States | 0.00% | 100.00% | 100.00% | ELECTRICITY PRODUCTION | |||||||||
Aviación Antares, A.I.E. | Spain | 99.99% | 0.01% | 100.00% | RENTING | |||||||||
Aviación Centaurus, A.I.E. | Spain | 99.99% | 0.01% | 100.00% | RENTING | |||||||||
Aviación Intercontinental, A.I.E. | Spain | 65.00% | 0.00% | 65.00% | RENTING | |||||||||
| % of ownership held by the Bank | % of voting power (c) | |||||||||||||||||||
Company | Location | Direct | Indirect | 2013 | 2012 | Line of business | ||||||||||||||
Konecta Field Marketing, S.A. | Spain | 0.00 | % | 51.86 | % | 100.00 | % | 100.00 | % | MARKETING | ||||||||||
Konecta Gestión Integral de Procesos, S.L. | Spain | 0.00 | % | 51.86 | % | 100.00 | % | 100.00 | % | SERVICES | ||||||||||
Konecta Portugal, Lda. | Portugal | 0.00 | % | 51.86 | % | 100.00 | % | 100.00 | % | MARKETING | ||||||||||
Konecta Servicios Administrativos y Tecnológicos, S.L. | Spain | 0.00 | % | 51.86 | % | 100.00 | % | 100.00 | % | SERVICES | ||||||||||
Konecta Servicios de BPO, S.L. | Spain | 0.00 | % | 51.86 | % | 100.00 | % | 99.97 | % | SERVICES | ||||||||||
Konecta Soluciones Globales, S.L. | Spain | 0.00 | % | 51.86 | % | 100.00 | % | 100.00 | % | SERVICES | ||||||||||
Konectanet Andalucía, S.L. | Spain | 0.00 | % | 51.86 | % | 100.00 | % | 100.00 | % | SERVICES | ||||||||||
Konectanet Comercialización, S.L. | Spain | 0.00 | % | 51.86 | % | 100.00 | % | 100.00 | % | MARKETING | ||||||||||
Kontacta Comunicaciones, S.A. | Spain | 0.00 | % | 51.48 | % | 99.27 | % | 75.00 | % | SERVICES | ||||||||||
Kredyt Lease, S.A. | Poland | 0.00 | % | 70.00 | % | 100.00 | % | — | LEASING | |||||||||||
La Unión Resinera Española, S.A. | Spain | 76.79 | % | 19.55 | % | 96.35 | % | 96.44 | % | CHEMICALS | ||||||||||
Laboratorios Indas, S.A. | Spain | 0.00 | % | 73.22 | % | 73.22 | % | 73.22 | % | HEALTH PRODUCTS | ||||||||||
Langton Funding (No.1) Limited | United Kingdom | 0.00 | % | 100.00 | % | 100.00 | % | 100.00 | % | SECURITIZATION | ||||||||||
Langton Mortgages Trustee (UK) Limited | United Kingdom | — | (a) | — | — | SECURITIZATION | ||||||||||||||
Langton Mortgages Trustee Limited | Jersey | — | (a) | — | — | SECURITIZATION | ||||||||||||||
Langton PECOH Limited | United Kingdom | — | (a) | — | — | SECURITIZATION | ||||||||||||||
Langton Securities (2008-1) plc | United Kingdom | 0.00 | % | 100.00 | % | 100.00 | % | 100.00 | % | SECURITIZATION | ||||||||||
Langton Securities (2010-1) PLC | United Kingdom | 0.00 | % | 100.00 | % | 100.00 | % | 100.00 | % | SECURITIZATION | ||||||||||
Langton Securities (2010-2) PLC | United Kingdom | 0.00 | % | 100.00 | % | 100.00 | % | 100.00 | % | SECURITIZATION | ||||||||||
Langton Securities (2012-1) PLC | United Kingdom | 0.00 | % | 100.00 | % | 100.00 | % | 100.00 | % | SECURITIZATION | ||||||||||
Langton Securities Holdings Limited | United Kingdom | — | (a) | — | — | SECURITIZATION | ||||||||||||||
Laparanza, S.A. | Spain | 61.59 | % | 0.00 | % | 61.59 | % | 61.59 | % | AGRICULTURE AND LIVESTOCK | ||||||||||
Larix Chile Inversiones Limitada | Chile | 0.00 | % | 100.00 | % | 100.00 | % | 100.00 | % | FINANCE | ||||||||||
Lease Totta No. 1 FTC | Portugal | — | (a) | — | — | SECURITIZATION | ||||||||||||||
Leasetotta No. 1 Limited | Ireland | — | (a) | — | — | SECURITIZATION | ||||||||||||||
Liquidity Import Finance Limited (b) | United Kingdom | 0.00 | % | 100.00 | % | 100.00 | % | 100.00 | % | FACTORING | ||||||||||
Liquidity Limited | United Kingdom | 0.00 | % | 100.00 | % | 100.00 | % | 100.00 | % | FACTORING | ||||||||||
Lizar Sp. z o.o. | Poland | 0.00 | % | 70.00 | % | 100.00 | % | — | LEASING | |||||||||||
Luresa Inmobiliaria, S.A. | Spain | 0.00 | % | 100.00 | % | 100.00 | % | 100.00 | % | PROPERTY | ||||||||||
Luri 1, S.A. (d) | Spain | 5.80 | % | 0.00 | % | 100.00 | % | 100.00 | % | PROPERTY | ||||||||||
Luri 2, S.A. (d) | Spain | 5.00 | % | 0.00 | % | 100.00 | % | 100.00 | % | PROPERTY | ||||||||||
Luri 4, S.A. Sole-Shareholder Company | Spain | 100.00 | % | 0.00 | % | 100.00 | % | 100.00 | % | PROPERTY | ||||||||||
Luri Land, S.A. (d) | Belgium | 0.00 | % | 5.36 | % | 100.00 | % | 100.00 | % | PROPERTY | ||||||||||
MAC No. 1 Limited | United Kingdom | — | (a) | — | — | MORTGAGE LOAN COMPANY | ||||||||||||||
Mantiq Investimentos Ltda. | Brazil | 0.00 | % | 75.25 | % | 100.00 | % | 100.00 | % | SECURITIES COMPANY | ||||||||||
Marylebone Road CBO 3 BV (b) | The Netherlands | — | (a) | — | — | SECURITIZATION | ||||||||||||||
Master Red Europa, S.L. | Spain | 68.80 | % | 0.00 | % | 68.80 | % | — | CARDS | |||||||||||
Mata Alta, S.L. | Spain | 0.00 | % | 61.59 | % | 100.00 | % | 100.00 | % | PROPERTY | ||||||||||
Med 2001 Inversiones, SICAV, S.A. | Spain | 99.99 | % | 0.00 | % | 99.99 | % | — | OPEN-END INVESTMENT COMPANY | |||||||||||
Merciver, S.L. | Spain | 99.90 | % | 0.10 | % | 100.00 | % | 100.00 | % | FINANCIAL ADVISORY | ||||||||||
Middlewick Wind Farm Holdings Limited | United Kingdom | 0.00 | % | 100.00 | % | 100.00 | % | — | ELECTRICITY PRODUCTION | |||||||||||
Middlewick Wind Farm Limited | United Kingdom | 0.00 | % | 100.00 | % | 100.00 | % | — | ELECTRICITY PRODUCTION | |||||||||||
Motor 2011 Holdings Limited (b) | United Kingdom | — | (a) | — | — | SECURITIZATION | ||||||||||||||
Motor 2011 PLC (b) | United Kingdom | 0.00 | % | 100.00 | % | 100.00 | % | 100.00 | % | SECURITIZATION | ||||||||||
Company Location Line of business Motor 2012 Holdings Limited SECURITIZATION Motor 2012 PLC SECURITIZATION Motor 2013 Holdings Limited SECURITIZATION Motor 2013 PLC SECURITIZATION Multinegocios S.A. ADVISORY SERVICES Multiservicios de Negocios Limitada FINANCIAL SERVICES Natixis Corporate Financement – Compartment Hexagone INVESTMENT FUND Naviera Mirambel, S.L. FINANCE Naviera Trans Gas, A.I.E. FULL-SERVICE LEASING Naviera Trans Ore, A.I.E. FULL-SERVICE LEASING Naviera Trans Wind, S.L. FULL-SERVICE LEASING Nebraska Wind I LLC HOLDING COMPANY Norbest AS SECURITIES INVESTMENT Novimovest – Fundo de Investimento Imobiliário INVESTMENT FUND NW Services CO. E-COMMERCE Oil-Dor, S.A. FINANCE Open Bank, S.A. BANKING Optimal Alternative Investments, S.G.I.I.C., S.A. FUND MANAGEMENT COMPANY Optimal Investment Services S.A. FUND MANAGEMENT COMPANY Optimal Multiadvisors Ireland Plc / Optimal Strategic US Equity Ireland Euro Fund FUND MANAGEMENT COMPANY Optimal Multiadvisors Ireland Plc / Optimal Strategic US Equity Ireland US Dollar Fund FUND MANAGEMENT COMPANY Optimal Multiadvisors Ltd / Optimal Strategic US Equity Series (consolidated) FUND MANAGEMENT COMPANY Paglialonga Due S.r.l. Unipersonale ELECTRICITY PRODUCTION Parasant SA HOLDING COMPANY Parley Court Solar Park Limited ELECTRICITY PRODUCTION PBE Companies, LLC PROPERTY PECOH Limited SECURITIZATION Penare Farm Solar Park Limited ELECTRICITY PRODUCTION Pereda Gestión, S.A. HOLDING COMPANY Pingham International, S.A. SERVICES Portada S.A. in liquidation (b) FINANCE Portal Universia Argentina S.A. INTERNET Portal Universia Portugal, Prestação de Serviços de Informática, S.A. INTERNET Portal Universia, S.A. INTERNET Produban Servicios Informáticos Generales, S.L. SERVICES Produban Serviços de Informática S.A. IT SERVICES Producciones Ramses, A.I.E. FILM FINANCING Programa Multi Sponsor PMS, S.A. ADVERTISING % of ownership held by
the Bank % of voting power (c) Direct Indirect 2013 2012 United Kingdom — (a) — — United Kingdom 0.00 % 100.00 % 100.00 % 100.00 % United Kingdom — (a) — — United Kingdom 0.00 % 100.00 % 100.00 % — Chile 0.00 % 99.54 % 100.00 % 100.00 % Chile 0.00 % 100.00 % 100.00 % 100.00 % France 100.00 % 0.00 % 100.00 % — Spain 0.00 % 100.00 % 100.00 % 100.00 % Spain 99.99 % 0.01 % 100.00 % 100.00 % Spain 99.99 % 0.01 % 100.00 % 100.00 % Spain 99.99 % 0.01 % 100.00 % 100.00 % United States 0.00 % 100.00 % 100.00 % 100.00 % Norway 7.94 % 92.06 % 100.00 % 100.00 % Portugal 0.00 % 71.45 % 71.60 % — United States 0.00 % 100.00 % 100.00 % 100.00 % Spain 100.00 % 0.00 % 100.00 % 99.99 % Spain 100.00 % 0.00 % 100.00 % 100.00 % Spain 0.00 % 100.00 % 100.00 % 100.00 % Switzerland 0.00 % 100.00 % 100.00 % 100.00 % Ireland 0.00 % 54.18 % 51.25 % 51.09 % Ireland 0.00 % 43.72 % 51.26 % 54.47 % Bahamas 0.00 % 53.47 % 54.10 % 63.79 % Italy 0.00 % 100.00 % 100.00 % — Switzerland 100.00 % 0.00 % 100.00 % 100.00 % United Kingdom 0.00 % 100.00 % 100.00 % — United States 0.00 % 100.00 % 100.00 % 100.00 % United Kingdom — (a) — — United Kingdom 0.00 % 100.00 % 100.00 % — Spain 99.99 % 0.01 % 100.00 % 100.00 % Uruguay 0.00 % 100.00 % 100.00 % 100.00 % Chile 0.00 % 96.17 % 96.17 % 96.17 % Argentina 0.00 % 75.75 % 75.75 % 75.75 % Portugal 0.00 % 100.00 % 100.00 % 100.00 % Spain 0.00 % 56.56 % 56.56 % 56.56 % Spain 99.96 % 0.04 % 100.00 % 100.00 % Brazil 0.00 % 100.00 % 100.00 % 100.00 % Spain 99.00 % 1.00 % 100.00 % — Spain 50.00 % 50.00 % 100.00 % 100.00 %
Company Location Line of business Promociones y Servicios Monterrey, S.A. de C.V. PROPERTY Promociones y Servicios Polanco, S.A. de C.V. PROPERTY Promociones y Servicios Santiago, S.A. de C.V. PROPERTY Promodomus Desarrollo de Activos, S.L. PROPERTY Punta Lima, LLC LEASING Puntoform, S.L. TRAINING REB Empreendimentos e Administradora de Bens S.A. HOLDING COMPANY Reintegra, S.A. SERVICES Reliz Sp. z o.o. w upadłości likwidacyjnej (b) FULL-SERVICE LEASE Retail Financial Services Limited FINANCE Riobank International (Uruguay) SAIFE (b) BANKING Rosenlease, S.L. FULL-SERVICE LEASING Rosteral, SICAV, S.A. OPEN-END INVESTMENT COMPANY Ruevilliot 26, S.L. PROPERTY Saja Eca Limited FINANCE SAM UK Investment Holdings Limited HOLDING COMPANY Sancap Investimentos e Participações S.A. HOLDING COMPANY Saninv - Gestão e Investimentos, Sociedade Unipessoal, S.A. HOLDING COMPANY Sansol S.r.l. HOLDING COMPANY Santander (CF Trustee Property Nominee) Limited SERVICES Santander (CF Trustee) Limited ASSET MANAGEMENT COMPANY Santander (UK) Group Pension Scheme Trustees Limited ASSET MANAGEMENT COMPANY Santander Agente de Valores Limitada SECURITIES COMPANY Santander Ahorro Inmobiliario 2 S.I.I., S.A. PROPERTY Santander AM Holding, S.L. HOLDING COMPANY Santander Asset Finance (December) Limited LEASING Santander Asset Finance plc LEASING Santander Asset Management - Sociedade Gestora de Fundos de Investimento Mobiliário, S.A. FUND MANAGEMENT COMPANY Santander Asset Management Chile S.A. SECURITIES INVESTMENT Santander Back-Offices Globales Especializados, S.A. SERVICES Santander Back-Offices Globales Mayoristas, S.A. SERVICES Santander Banca de Inversión Colombia SAS FINANCIAL SERVICES Santander Banco de Emisiones, S.A. BANKING Santander BanCorp HOLDING COMPANY Santander Banif Inmobiliario, F.I.I. PROPERTY Santander Bank & Trust Ltd. BANKING Santander Bank, National Association BANKINGF-259 % of ownership held by
the Bank % of voting power (c) Direct Indirect 2013 2012 Mexico 0.00 % 100.00 % 100.00 % 100.00 % Mexico 0.00 % 100.00 % 100.00 % 100.00 % Mexico 0.00 % 100.00 % 100.00 % 100.00 % Spain 0.00 % 51.00 % 51.00 % 51.00 % United States 0.00 % 100.00 % 100.00 % — Spain 0.00 % 51.86 % 100.00 % 100.00 % Brazil 0.00 % 100.00 % 100.00 % 100.00 % Spain 55.00 % 45.00 % 100.00 % 100.00 % Poland 0.00 % 70.00 % 100.00 % — United Kingdom 0.00 % 100.00 % 100.00 % 100.00 % Uruguay 0.00 % 100.00 % 100.00 % 100.00 % Spain 99.99 % 0.01 % 100.00 % 99.99 % Spain 99.98 % 0.00 % 99.98 % — Spain 70.00 % 0.00 % 70.00 % 70.00 % Ireland — (a) — — United Kingdom 77.67 % 22.33 % 100.00 % — Brazil 0.00 % 75.25 % 100.00 % 100.00 % Portugal 0.00 % 100.00 % 100.00 % 100.00 % Italy 0.00 % 100.00 % 100.00 % 100.00 % United Kingdom 0.00 % 100.00 % 100.00 % 100.00 % United Kingdom 0.00 % 100.00 % 100.00 % 100.00 % United Kingdom 0.00 % 100.00 % 100.00 % 100.00 % Chile 0.00 % 67.33 % 100.00 % 100.00 % Spain 85.50 % 0.01 % 85.51 % 78.06 % Spain 100.00 % 0.00 % 100.00 % 100.00 % United Kingdom 0.00 % 100.00 % 100.00 % 100.00 % United Kingdom 0.00 % 100.00 % 100.00 % 100.00 % Portugal 0.00 % 100.00 % 100.00 % 100.00 % Chile 0.01 % 99.83 % 100.00 % 100.00 % Spain 99.99 % 0.01 % 100.00 % 100.00 % Spain 100.00 % 0.00 % 100.00 % 100.00 % Colombia 0.00 % 100.00 % 100.00 % — Spain 100.00 % 0.00 % 100.00 % 100.00 % Puerto Rico 0.00 % 100.00 % 100.00 % 100.00 % Spain 99.65 % 0.00 % 99.65 % 98.73 % Bahamas 0.00 % 100.00 % 100.00 % 100.00 % United States 0.00 % 100.00 % 100.00 % 100.00 %
| % of ownership held by the Bank | % of voting | |||||||||||||||
Company | Location | Direct | Indirect | power (c) | Line of business | |||||||||||
Aviación RC II, A.I.E. | Spain | 99.99 | % | 0.01 | % | 100.00 | % | RENTING | ||||||||
Aviación Real, A.I.E. | Spain | 99.99 | % | 0.01 | % | 100.00 | % | RENTING | ||||||||
Aviación Regional Cántabra, A.I.E. | Spain | 73.58 | % | 0.00 | % | 73.58 | % | RENTING | ||||||||
Aviación Scorpius, A.I.E. | Spain | 99.99 | % | 0.01 | % | 100.00 | % | RENTING | ||||||||
Aviación Tritón, A.I.E. | Spain | 99.99 | % | 0.01 | % | 100.00 | % | RENTING | ||||||||
Aymoré Crédito, Financiamento e Investimento S.A. | Brazil | 0.00 | % | 81.53 | % | 100.00 | % | FINANCE | ||||||||
Bajondillo, S.A. | Spain | 0.00 | % | 89.71 | % | 100.00 | % | PROPERTY | ||||||||
Baker Street Risk and Insurance (Guernsey) Limited (b) | Guernsey | 0.00 | % | 100.00 | % | 100.00 | % | INSURANCE | ||||||||
Banbou S.A.R.L. | France | 0.00 | % | 90.00 | % | 100.00 | % | HOLDING COMPANY | ||||||||
Banco Bandepe S.A. | Brazil | 0.00 | % | 81.53 | % | 100.00 | % | BANKING | ||||||||
Banco Banif, S.A. | Spain | 100.00 | % | 0.00 | % | 100.00 | % | BANKING | ||||||||
Banco Comercial e de Investimento Sudameris S.A. (d) | Brazil | 0.00 | % | 0.00 | % | 0.00 | % | BANKING | ||||||||
Banco de Albacete, S.A. | Spain | 100.00 | % | 0.00 | % | 100.00 | % | BANKING | ||||||||
Banco de Asunción, S.A. (b) | Paraguay | 0.00 | % | 99.33 | % | 99.33 | % | BANKING | ||||||||
Banco Español de Crédito, S.A. | Spain | 88.88 | % | 0.83 | % | 89.71 | % | BANKING | ||||||||
Banco Madesant—Sociedade Unipessoal, S.A. | Portugal | 0.00 | % | 100.00 | % | 100.00 | % | BANKING | ||||||||
Banco Santander—Chile | Chile | 0.00 | % | 67.01 | % | 67.18 | % | BANKING | ||||||||
Banco Santander (Brasil) S.A. | Brazil | 1.00 | % | 80.53 | % | 81.56 | % | BANKING | ||||||||
Banco Santander (México), S.A., Institución de Banca Múltiple, Grupo Financiero Santander | Mexico | 0.00 | % | 99.86 | % | 99.99 | % | BANKING | ||||||||
Banco Santander (Panamá), S.A. | Panamá | 0.00 | % | 100.00 | % | 100.00 | % | BANKING | ||||||||
Banco Santander (Suisse) SA | Switzerland | 0.00 | % | 100.00 | % | 100.00 | % | BANKING | ||||||||
Banco Santander Bahamas International Limited | Bahamas | 0.00 | % | 100.00 | % | 100.00 | % | BANKING | ||||||||
Banco Santander Colombia, S.A. | Colombia | 0.00 | % | 97.85 | % | 97.85 | % | BANKING | ||||||||
Banco Santander Consumer Portugal, S.A. | Portugal | 0.00 | % | 100.00 | % | 100.00 | % | BANKING | ||||||||
Banco Santander International | United States | 100.00 | % | 0.00 | % | 100.00 | % | BANKING | ||||||||
Banco Santander Perú S.A. | Peru | 99.00 | % | 1.00 | % | 100.00 | % | BANKING | ||||||||
Banco Santander Puerto Rico | Puerto Rico | 0.00 | % | 100.00 | % | 100.00 | % | BANKING | ||||||||
Banco Santander Río S.A. | Argentina | 8.23 | % | 91.07 | % | 99.30 | % | BANKING | ||||||||
Banco Santander Totta, S.A. | Portugal | 0.00 | % | 99.75 | % | 99.88 | % | BANKING | ||||||||
Banco Santander, S.A. | Uruguay | 98.04 | % | 1.96 | % | 100.00 | % | BANKING | ||||||||
Banesto Banca Privada Gestión, S.A. S.G.I.I.C. | Spain | 0.00 | % | 89.71 | % | 100.00 | % | FUND MANAGEMENT COMPANY | ||||||||
Banesto Banco de Emisiones, S.A. | Spain | 0.00 | % | 89.71 | % | 100.00 | % | BANKING | ||||||||
Banesto Bolsa, S.A., Sdad. Valores y Bolsa | Spain | 0.00 | % | 89.71 | % | 100.00 | % | BROKER-DEALER | ||||||||
Banesto Financial Products, Plc. | Ireland | 0.00 | % | 89.71 | % | 100.00 | % | FINANCE | ||||||||
Banesto Renting, S.A. | Spain | 0.00 | % | 89.71 | % | 100.00 | % | FINANCE | ||||||||
| % of ownership held by the Bank | % of voting power (c) | |||||||||||||||||||
Company | Location | Direct | Indirect | 2013 | 2012 | Line of business | ||||||||||||||
Santander Benelux, S.A./N.V. | Belgium | 83.20 | % | 16.80 | % | 100.00 | % | 100.00 | % | BANKING | ||||||||||
Santander Brasil Administradora de Consórcio Ltda. | Brazil | 0.00 | % | 75.25 | % | 100.00 | % | 100.00 | % | SERVICES | ||||||||||
Santander Brasil Advisory Services S.A. | Brazil | 0.00 | % | 72.64 | % | 96.52 | % | 96.52 | % | CONSULTANCY SERVICES | ||||||||||
Santander Brasil, EFC, S.A. | Spain | 0.00 | % | 75.25 | % | 100.00 | % | 100.00 | % | FINANCE | ||||||||||
Santander Capital Desarrollo, SGECR, S.A. | Spain | 100.00 | % | 0.00 | % | 100.00 | % | 100.00 | % | VENTURE CAPITAL COMPANY | ||||||||||
Santander Capital Structuring, S.A. de C.V. | Mexico | 0.00 | % | 100.00 | % | 100.00 | % | 100.00 | % | COMMERCE | ||||||||||
Santander Capitalização S.A. | Brazil | 0.00 | % | 75.25 | % | 100.00 | % | 100.00 | % | INSURANCE | ||||||||||
Santander Carbón Finance, S.A. | Spain | 99.98 | % | 0.02 | % | 100.00 | % | 100.00 | % | SECURITIES INVESTMENT | ||||||||||
Santander Cards Ireland Limited | Ireland | 0.00 | % | 100.00 | % | 100.00 | % | 100.00 | % | CARDS | ||||||||||
Santander Cards Limited | United Kingdom | 0.00 | % | 100.00 | % | 100.00 | % | 100.00 | % | CARDS | ||||||||||
Santander Cards UK Limited | United Kingdom | 0.00 | % | 100.00 | % | 100.00 | % | 100.00 | % | FINANCE | ||||||||||
Santander Carteras, S.G.C., S.A. | Spain | 0.00 | % | 100.00 | % | 100.00 | % | 100.00 | % | FUND MANAGEMENT COMPANY | ||||||||||
Santander Central Hispano Financial Services Limited | Cayman Islands | 100.00 | % | 0.00 | % | 100.00 | % | 100.00 | % | FINANCE | ||||||||||
Santander Central Hispano Issuances Limited | Cayman Islands | 100.00 | % | 0.00 | % | 100.00 | % | 100.00 | % | FINANCE | ||||||||||
Santander Chile Holding S.A. | Chile | 22.11 | % | 77.43 | % | 99.54 | % | 99.54 | % | HOLDING COMPANY | ||||||||||
Santander Commercial Paper, S.A. Sole-Shareholder Company | Spain | 100.00 | % | 0.00 | % | 100.00 | % | 100.00 | % | FINANCE | ||||||||||
Santander Consulting (Beijing) Co., Ltd. | China | 0.00 | % | 100.00 | % | 100.00 | % | 100.00 | % | ADVISORY SERVICES | ||||||||||
Santander Consumer (UK) plc | United Kingdom | 0.00 | % | 100.00 | % | 100.00 | % | 100.00 | % | FINANCE | ||||||||||
Santander Consumer Bank AG | Germany | 0.00 | % | 100.00 | % | 100.00 | % | 100.00 | % | BANKING | ||||||||||
Santander Consumer Bank AS | Norway | 0.00 | % | 100.00 | % | 100.00 | % | 100.00 | % | FINANCE | ||||||||||
Santander Consumer Bank GmbH | Austria | 0.00 | % | 100.00 | % | 100.00 | % | 100.00 | % | FINANCE | ||||||||||
Santander Consumer Bank, S.A. | Poland | 0.00 | % | 100.00 | % | 100.00 | % | 70.00 | % | BANKING | ||||||||||
Santander Consumer Bank S.p.A. | Italy | 0.00 | % | 100.00 | % | 100.00 | % | 100.00 | % | FINANCE | ||||||||||
Santander Consumer Beteiligungsverwaltungsgesellschaft mbH | Germany | 0.00 | % | 100.00 | % | 100.00 | % | 100.00 | % | HOLDING COMPANY | ||||||||||
Santander Consumer Chile S.A. | Chile | 51.00 | % | 0.00 | % | 51.00 | % | 51.00 | % | FINANCE | ||||||||||
Santander Consumer Credit Services Limited | United Kingdom | 0.00 | % | 100.00 | % | 100.00 | % | 100.00 | % | FINANCE | ||||||||||
Santander Consumer Finance Benelux B.V. | The Netherlands | 0.00 | % | 100.00 | % | 100.00 | % | 100.00 | % | FINANCE | ||||||||||
Santander Consumer Finance Media S.r.l. | Italy | 0.00 | % | 65.00 | % | 65.00 | % | 65.00 | % | FINANCE | ||||||||||
Santander Consumer Finance Oy | Finland | 0.00 | % | 100.00 | % | 100.00 | % | 100.00 | % | FINANCE | ||||||||||
Santander Consumer Finance Zrt. | Hungary | 0.00 | % | 100.00 | % | 100.00 | % | 100.00 | % | FINANCE | ||||||||||
Santander Consumer Finance, S.A. | Spain | 63.19 | % | 36.81 | % | 100.00 | % | 100.00 | % | BANKING | ||||||||||
Santander Consumer Finanse S.A. | Poland | 0.00 | % | 100.00 | % | 100.00 | % | 70.00 | % | SERVICES | ||||||||||
Santander Consumer Holding Austria GmbH | Austria | 0.00 | % | 100.00 | % | 100.00 | % | 100.00 | % | HOLDING COMPANY | ||||||||||
Santander Consumer Holding GmbH | Germany | 0.00 | % | 100.00 | % | 100.00 | % | 100.00 | % | HOLDING COMPANY | ||||||||||
Santander Consumer Leasing GmbH | Germany | 0.00 | % | 100.00 | % | 100.00 | % | 100.00 | % | LEASING | ||||||||||
Santander Consumer Multirent Sp. z.o.o. | Poland | 0.00 | % | 100.00 | % | 100.00 | % | 100.00 | % | LEASING | ||||||||||
Santander Consumer Renting, S.L. | Spain | 0.00 | % | 100.00 | % | 100.00 | % | 100.00 | % | FULL-SERVICE LEASING | ||||||||||
Santander Consumer Services GmbH | Austria | 0.00 | % | 100.00 | % | 100.00 | % | 100.00 | % | SERVICES | ||||||||||
Santander Consumer Unifin S.p.A. | Italy | 0.00 | % | 100.00 | % | 100.00 | % | 100.00 | % | FINANCE | ||||||||||
Santander Consumer, EFC, S.A. | Spain | 0.00 | % | 100.00 | % | 100.00 | % | 100.00 | % | FINANCE | ||||||||||
Santander Consumo Perú S.A. | Peru | 55.00 | % | 0.00 | % | 55.00 | % | 55.00 | % | FINANCE | ||||||||||
Santander Consumo, S.A. de C.V., SOFOM, E.R. | Mexico | 0.00 | % | 75.08 | % | 100.00 | % | 100.00 | % | CARDS | ||||||||||
Company Location Line of business Santander Corredora de Seguros Limitada INSURANCE BROKER Santander Corretora de Câmbio e Valores Mobiliários S.A. SECURITIES COMPANY Santander de Titulización S.G.F.T., S.A. FUND MANAGEMENT COMPANY Santander Energías Renovables I, SCR de Régimen Simplificado, S.A. VENTURE CAPITAL COMPANY Santander Envíos, S.A. TRANSFER OF FUNDS FOR IMMIGRANTS Santander Equity Investments Limited FINANCE Santander Estates Limited PROPERTY Santander Factoring, S.A. FACTORING Santander Factoring y Confirming, S.A., E.F.C. FACTORING Santander Finance 2012-1 LLC FINANCIAL SERVICES Santander Financial Exchanges Limited FINANCE Santander Financial Products plc FINANCE Santander Financial Services, Inc. FINANCE Santander Fundo de Investimento Amazonas Multimercado Crédito Privado Investimento no Exterior INVESTMENT FUND Santander fundo de Investimento Diamantina Multimercado Crédito Privado Investimento no exterior INVESTMENT FUND Santander Fundo de Investimento em Cotas de Fundos de Investimento Contract i Referenciado DI INVESTMENT FUND Santander Fundo de Investimento Financial Renda Fixa INVESTMENT FUND Santander Fundo de Investimento Guarujá Multimercado Crédito Privado Investimento no Exterior INVESTMENT FUND Santander Fundo de Investimento Renda Fixa Capitalization INVESTMENT FUND Santander Fundo de Investimento SBAC Referenciado di Crédito Privado INVESTMENT FUND Santander Fundo de Investimento Unix Multimercado Crédito Privado INVESTMENT FUND Santander GBM Secured Financing Limited SECURITIZATION Santander Gestão de Activos, SGPS, S.A. HOLDING COMPANY Santander Gestión de Recaudación y Cobranzas Ltda. FINANCIAL SERVICES Santander Gestión Inmobiliaria, S.A. PROPERTY Santander Getnet Serviços para Meios de Pagamento, S.A. SERVICES Santander Global Consumer Finance Limited FINANCE Santander Global Facilities, S.A. de C.V. PROPERTY MANAGEMENT Santander Global Facilities, S.L. PROPERTY Santander Global Property México, S.A. de C.V. PROPERTY Santander Global Property U.S.A., Inc. SERVICES % of ownership held by
the Bank % of voting power (c) Direct Indirect 2013 2012 Chile 0.00 % 67.10 % 100.00 % 100.00 % Brazil 0.00 % 75.25 % 100.00 % 100.00 % Spain 81.00 % 19.00 % 100.00 % 100.00 % Spain 56.76 % 0.00 % 56.76 % 56.76 % Spain 100.00 % 0.00 % 100.00 % 100.00 % United Kingdom 0.00 % 100.00 % 100.00 % 100.00 % United Kingdom 0.00 % 100.00 % 100.00 % 100.00 % Chile 0.00 % 99.54 % 100.00 % 100.00 % Spain 100.00 % 0.00 % 100.00 % 100.00 % United States 0.00 % 100.00 % 100.00 % 100.00 % United Kingdom 100.00 % 0.00 % 100.00 % 100.00 % Ireland 0.00 % 100.00 % 100.00 % 100.00 % Puerto Rico 100.00 % 0.00 % 100.00 % 100.00 % Brazil 0,00 % 75,25 % 100.00 % — Brazil 0,00 % 75,25 % 100.00 % — Brazil 0,00 % 84,99 % 100.00 % — Brazil 0,00 % 75,25 % 100.00 % — Brazil 0,00 % 75,25 % 100,00 % — Brazil 0,00 % 75,25 % 100,00 % — Brazil 0,00 % 75,25 % 100,00 % — Brazil 0,00 % 75,25 % 100,00 % — Ireland — (a) — — Portugal 0.00 % 99.79 % 100.00 % 100.00 % Chile 0.00 % 99.54 % 100.00 % 100.00 % Spain 0.01 % 99.99 % 100.00 % 100.00 % Brazil 0.00 % 37.63 % 50.00 % 50.00 % United Kingdom 0.00 % 100.00 % 100.00 % 100.00 % Mexico 100.00 % 0.00 % 100.00 % 100.00 % Spain 100.00 % 0.00 % 100.00 % 100.00 % Mexico 0.00 % 100.00 % 100.00 % 100.00 % United States 0.00 % 100.00 % 100.00 % 100.00 %
Company Location Line of business Santander Global Property, S.L. SECURITIES INVESTMENT Santander Global Services, S.A. (b) SERVICES Santander Global Sport, S.A. SPORTS OPERATIONS Santander Guarantee Company LEASING Santander Hipotecario 1 Fondo de Titulización de Activos SECURITIZATION Santander Hipotecario 2 Fondo de Titulización de Activos SECURITIZATION Santander Hipotecario 3 Fondo de Titulización de Activos SECURITIZATION Santander Hipotecario, S.A. de C.V., SOFOM, E.R. FINANCE Santander Holanda B.V. HOLDING COMPANY Santander Holding Internacional, S.A. HOLDING COMPANY Santander Holding Vivienda, S.A. de C.V. SERVICES Santander Holdings USA, Inc. HOLDING COMPANY Santander Insurance Agency, Inc. INSURANCE BROKER Santander Insurance Agency, U.S., LLC INSURANCE Santander Insurance Europe Limited INSURANCE BROKER Santander Insurance Holding, S.L. HOLDING COMPANY Santander Insurance Life Limited INSURANCE BROKER Santander Insurance Services Ireland Limited SERVICES Santander Insurance Services UK Limited ASSET MANAGEMENT COMPANY Santander Intermediación Correduría de Seguros, S.A. INSURANCE BROKER Santander International Debt, S.A. Sole-Shareholder Company FINANCE Santander International Products, Plc. FINANCE Santander International Securities, Inc. SECURITIES COMPANY Santander Inversiones Limitada HOLDING COMPANY Santander Investment Bank Limited BANKING Santander Investment Bolsa, S.V., S.A. SECURITIES COMPANY Santander Investment Chile Limitada FINANCE Santander Investment I, S.A. HOLDING COMPANY Santander Investment Limited INACTIVE Santander Investment Securities Inc. SECURITIES COMPANY Santander Investment, S.A. BANKING Santander Issuances, S.A., Sole-Shareholder Company FINANCE Santander Lease, S.A., E.F.C. LEASING Santander Leasing S.A. Arrendamento Mercantil LEASING Sovereign Leasing, LLC LEASING Santander Lending Limited MORTGAGE LOAN COMPANY Santander Mediación Operador de Banca-Seguros Vinculado, S.A. INSURANCE BROKERAGE Santander Merchant S.A. HOLDING COMPANYF-260 % of ownership held
by the Bank % of voting power (c) Direct Indirect 2013 2012 Spain 97.34 % 2.66 % 100.00 % 100.00 % Uruguay 0.00 % 100.00 % 100.00 % 100.00 % Spain 100.00 % 0.00 % 100.00 % 100.00 % United Kingdom 0.00 % 100.00 % 100.00 % 100.00 % Spain — (a) — — Spain — (a) — — Spain — (a) — — Mexico 0.00 % 75.08 % 100.00 % 100.00 % The Netherlands 0.00 % 100.00 % 100.00 % 100.00 % Spain 99.95 % 0.05 % 100.00 % 100.00 % Mexico 0.00 % 75.08 % 100.00 % 100.00 % United States 100.00 % 0.00 % 100.00 % 100.00 % Puerto Rico 0.00 % 100.00 % 100.00 % 100.00 % United States 0.00 % 100.00 % 100.00 % 100.00 % Ireland 0.00 % 100.00 % 100.00 % 100.00 % Spain 99.99 % 0.01 % 100.00 % 100.00 % Ireland 0.00 % 100.00 % 100.00 % 100.00 % Ireland 0.00 % 100.00 % 100.00 % 100.00 % United Kingdom 0.00 % 100.00 % 100.00 % 100.00 % Spain 0.00 % 100.00 % 100.00 % 100.00 % Spain 100.00 % 0.00 % 100.00 % 100.00 % Ireland 99.99 % 0.01 % 100.00 % 99.99 % United States 0.00 % 100.00 % 100.00 % 100.00 % Chile 0.00 % 100.00 % 100.00 % 100.00 % Bahamas 0.00 % 100.00 % 100.00 % 100.00 % Spain 0.00 % 100.00 % 100.00 % 100.00 % Chile 0.00 % 100.00 % 100.00 % 100.00 % Spain 100.00 % 0.00 % 100.00 % 100.00 % Bahamas 0.00 % 100.00 % 100.00 % 100.00 % United States 0.00 % 100.00 % 100.00 % 100.00 % Spain 100.00 % 0.00 % 100.00 % 100.00 % Spain 100.00 % 0.00 % 100.00 % 100.00 % Spain 70.00 % 30.00 % 100.00 % 100.00 % Brazil 0.00 % 75.25 % 99.99 % 99.99 % United States 0.00 % 100.00 % 100.00 % 100.00 % United Kingdom 0.00 % 100.00 % 100.00 % 100.00 % Spain 34.00 % 64.00 % 100.00 % 100.00 % Argentina 0.00 % 100.00 % 100.00 % 100.00 %
| % of ownership held by the Bank | % of voting | |||||||||||||||
Company | Location | Direct | Indirect | power (c) | Line of business | |||||||||||
Banesto Securities, Inc. | United States | 0.00 | % | 89.71 | % | 100.00 | % | FINANCE | ||||||||
Banif Gestión, S.A., S.G.I.I.C. | Spain | 0.00 | % | 100.00 | % | 100.00 | % | FUND MANAGEMENT COMPANY | ||||||||
Bank Zachodni WBK S.A. | Poland | 96.25 | % | 0.00 | % | 96.25 | % | BANKING | ||||||||
Bansa Santander S.A. | Chile | 0.00 | % | 100.00 | % | 100.00 | % | PROPERTY | ||||||||
Bansamex, S.A. | Spain | 50.00 | % | 0.00 | % | 50.00 | % | CARDS | ||||||||
Bel Canto SICAV Erodiade | Luxembourg | 0.00 | % | 100.00 | % | 100.00 | % | OPEN-END INVESTMENT COMPANY | ||||||||
Besaya ECA Limited | Ireland | — | (a | ) | — | FINANCE | ||||||||||
Beta Cero, S.A. | Spain | 0.00 | % | 78.94 | % | 88.00 | % | FINANCE | ||||||||
Bilkreditt 1 Limited | Ireland | — | (a | ) | — | SECURITIZATION | ||||||||||
Bilkreditt 2 Limited | Ireland | — | (a | ) | — | SECURITIZATION | ||||||||||
Bracken Securities Holdings Limited (b) | United Kingdom | — | (a | ) | — | SECURITIZATION | ||||||||||
Bracken Securities Option Limited (b) | United Kingdom | 0.00 | % | 100.00 | % | 100.00 | % | SECURITIZATION | ||||||||
Bracken Securities plc (b) | United Kingdom | 0.00 | % | 100.00 | % | 100.00 | % | SECURITIZATION | ||||||||
Brazil Foreign Diversified Payment Rights Finance Company | Cayman Islands | — | (a | ) | — | SECURITIZATION | ||||||||||
BRS Investments S.A. | Argentina | 0.00 | % | 100.00 | % | 100.00 | % | HOLDING COMPANY | ||||||||
BST International Bank, Inc. | Puerto Rico | 0.00 | % | 99.75 | % | 100.00 | % | BANKING | ||||||||
BST SME No. 1 | Portugal | — | (a | ) | — | SECURITIZATION | ||||||||||
BZ WBK Asset Management S.A. | Poland | 50.00 | % | 48.12 | % | 100.00 | % | FUND MANAGEMENT COMPANY | ||||||||
BZ WBK Faktor Sp. z o.o. | Poland | 0.00 | % | 96.25 | % | 100.00 | % | FINANCIAL SERVICES | ||||||||
BZ WBK Finanse & Leasing S.A. | Poland | 0.00 | % | 96.25 | % | 100.00 | % | LEASING AND FULL-SERVICE LEASING | ||||||||
BZ WBK Finanse Sp. z o.o. | Poland | 0.00 | % | 96.25 | % | 100.00 | % | FINANCIAL SERVICES | ||||||||
BZ WBK Inwestycje Sp. z o.o. | Poland | 0.00 | % | 96.25 | % | 100.00 | % | BROKER-DEALER | ||||||||
BZ WBK Leasing S.A. | Poland | 0.00 | % | 96.25 | % | 100.00 | % | LEASING | ||||||||
BZ WBK Nieruchomości S.A. | Poland | 0.00 | % | 96.24 | % | 99.99 | % | SERVICES | ||||||||
BZ WBK Towarzystwo Funduszy Inwestycyjnych S.A. | Poland | 0.00 | % | 98.12 | % | 100.00 | % | FUND MANAGEMENT COMPANY | ||||||||
CA Premier Banking Limited | United Kingdom | 0.00 | % | 100.00 | % | 100.00 | % | BANKING | ||||||||
Caja de Emisiones con Garantía de Anualidades Debidas por el Estado, S.A. | Spain | 0.00 | % | 56.40 | % | 62.87 | % | FINANCE | ||||||||
Cántabra de Inversiones, S.A. | Spain | 100.00 | % | 0.00 | % | 100.00 | % | HOLDING COMPANY | ||||||||
Cántabric Financing, Plc (b) | Ireland | — | (a | ) | — | SECURITIZATION | ||||||||||
Cántabro Catalana de Inversiones, S.A. | Spain | 100.00 | % | 0.00 | % | 100.00 | % | HOLDING COMPANY | ||||||||
Capital Riesgo Global, SCR de Régimen Simplificado, S.A. | Spain | 93.53 | % | 6.47 | % | 100.00 | % | VENTURE CAPITAL COMPANY | ||||||||
Capital Street Delaware, LP | United States | 0.00 | % | 100.00 | % | 100.00 | % | HOLDING COMPANY | ||||||||
| % of ownership held by the Bank | % of voting power (c) | |||||||||||||||||||
Company | Location | Direct | Indirect | 2013 | 2012 | Line of business | ||||||||||||||
Santander Microcrédito Assessoria Financeira S.A. | Brazil | 0.00 | % | 75.25 | % | 100.00 | % | 100.00 | % | FINANCIAL SERVICES | ||||||||||
Santander Multiobrigações - Fundo de Investimento Mobiliário Aberto de Obrigações de Taxa variável | Portugal | 0,00 | % | 91,03 | % | 91,20 | % | — | INVESTMENT FUND | |||||||||||
Santander Operaciones Retail, S.A. | Spain | 0.00 | % | 100.00 | % | 100.00 | % | 100.00 | % | SERVICES | ||||||||||
Santander Overseas Bank, Inc. | Puerto Rico | 0.00 | % | 100.00 | % | 100.00 | % | 100.00 | % | BANKING | ||||||||||
Santander Paraty Qif PLC | Ireland | 0,00 | % | 75,25 | % | 100,00 | % | — | INVESTMENT COMPANY | |||||||||||
Santander Participações S.A. | Brazil | 0.00 | % | 75.25 | % | 100.00 | % | 100.00 | % | HOLDING COMPANY | ||||||||||
Santander PB UK (Holdings) Limited | United Kingdom | 0.00 | % | 100.00 | % | 100.00 | % | 100.00 | % | FINANCE | ||||||||||
Santander Pensões - Sociedade Gestora de Fundos de Pensões, S.A. | Portugal | 0.00 | % | 100.00 | % | 100.00 | % | 100.00 | % | PENSION FUND MANAGEMENT COMPANY | ||||||||||
Santander Perpetual, S.A., Sole-Shareholder Company | Spain | 100.00 | % | 0.00 | % | 100.00 | % | 100.00 | % | FINANCE | ||||||||||
Santander Private Banking Gestión, S.A., S.G.I.I.C. | Spain | 0.00 | % | 100.00 | % | 100.00 | % | 100.00 | % | FUND MANAGEMENT COMPANY | ||||||||||
Santander Private Banking s.p.a. | Italy | 100.00 | % | 0.00 | % | 100.00 | % | 100.00 | % | BANKING | ||||||||||
Santander Private Banking UK Limited | United Kingdom | 0.00 | % | 100.00 | % | 100.00 | % | 100.00 | % | PROPERTY | ||||||||||
Santander Private Equity, S.A., S.G.E.C.R. | Spain | 90.00 | % | 9.98 | % | 100.00 | % | 100.00 | % | VENTURE CAPITAL MANAGEMENT COMPANY | ||||||||||
Santander Private Real Estate Advisory, S.A. | Spain | 100.00 | % | 0.00 | % | 100.00 | % | 100.00 | % | PROPERTY | ||||||||||
Santander Public Sector SCF S.A. | France | 94.00 | % | 6.00 | % | 100.00 | % | — | FINANCE | |||||||||||
Santander Real Estate, S.G.I.I.C., S.A. | Spain | 0.00 | % | 100.00 | % | 100.00 | % | 100.00 | % | FUND MANAGEMENT COMPANY | ||||||||||
Santander Río Servicios S.A. | Argentina | 0.00 | % | 99.97 | % | 100.00 | % | 100.00 | % | ADVISORY SERVICES | ||||||||||
Santander Río Sociedad de Bolsa S.A. | Argentina | 0.00 | % | 99.34 | % | 100.00 | % | 100.00 | % | SECURITIES COMPANY | ||||||||||
Santander Río Trust S.A. | Argentina | 0.00 | % | 99.97 | % | 100.00 | % | 100.00 | % | SERVICES | ||||||||||
Santander S.A. - Serviços Técnicos, Administrativos e de Corretagem de Seguros | Brazil | 0.00 | % | 84.99 | % | 100.00 | % | 100.00 | % | INSURANCE BROKER | ||||||||||
Santander S.A. Corredores de Bolsa | Chile | 0.00 | % | 83.18 | % | 100.00 | % | 100.00 | % | SECURITIES COMPANY | ||||||||||
Santander S.A. Sociedad Securitizadora | Chile | 0.00 | % | 67.13 | % | 100.00 | % | 100.00 | % | FUND MANAGEMENT COMPANY | ||||||||||
Santander Secretariat Services Limited | United Kingdom | 0.00 | % | 100.00 | % | 100.00 | % | 100.00 | % | HOLDING COMPANY | ||||||||||
Santander Securities LLC | Puerto Rico | 0.00 | % | 100.00 | % | 100.00 | % | 100.00 | % | SECURITIES COMPANY | ||||||||||
Santander Seguros y Reaseguros, Compañía Aseguradora, S.A. | Spain | 0.00 | % | 100.00 | % | 100.00 | % | 100.00 | % | INSURANCE | ||||||||||
Santander Service GmbH | Germany | 0.00 | % | 100.00 | % | 100.00 | % | 100.00 | % | SERVICES | ||||||||||
Santander Servicios Corporativos, S.A. de C.V. | Mexico | 0.00 | % | 75.08 | % | 100.00 | % | 100.00 | % | SERVICES | ||||||||||
Santander Servicios de Recaudación y Pagos Limitada | Chile | 0.00 | % | 67.01 | % | 100.00 | % | 100.00 | % | SERVICES | ||||||||||
Santander Servicios Especializados, S.A. de C.V. | Mexico | 0.00 | % | 75.08 | % | 100.00 | % | 100.00 | % | FINANCIAL SERVICES | ||||||||||
Santander Tecnología y Operaciones A.E.I.E. | Spain | — | (a) | — | — | SERVICES | ||||||||||||||
Santander Totta Seguros, Companhia de Seguros de Vida, S.A. | Portugal | 0.00 | % | 99.88 | % | 100.00 | % | 100.00 | % | INSURANCE | ||||||||||
Santander Totta, SGPS, S.A. | Portugal | 0.00 | % | 99.88 | % | 99.88 | % | 99.87 | % | HOLDING COMPANY | ||||||||||
Santander Trade Services Limited | Hong-Kong | 0.00 | % | 100.00 | % | 100.00 | % | 100.00 | % | SERVICES | ||||||||||
Company Location Line of business Santander UK Foundation Limited CHARITABLE SERVICES Santander UK Group Holdings Limited FINANCE Santander UK Investments FINANCE Santander UK plc BANKING Santander US Debt, S.A. Sole-Shareholder Company FINANCE Santander Vivienda, S.A. de C.V., Sociedad Financiera de Objeto Múltiple, Entidad Regulada (SOFOM E.R.) FINANCE Santos Energia Participações S.A. HOLDING COMPANY Santotta-Internacional, SGPS, Sociedade Unipessoal, Lda. HOLDING COMPANY Santusa Holding, S.L. HOLDING COMPANY SC Germany Auto 08-2 Limited (b) SECURITIZATION SC Germany Auto 2009-1 Limited SECURITIZATION SC Germany Auto 2010-1 UG (haftungsbeschränkt) SECURITIZATION SC Germany Auto 2011-1 UG (haftungsbeschränkt) SECURITIZATION SC Germany Auto 2011-2 UG (haftungsbeschränkt) SECURITIZATION SC Germany Auto 2013-1 UG (haftungsbeschränkt) SECURITIZATION SC Germany Auto 2013-2 UG (haftungsbeschränkt) SECURITIZATION SC Germany Consumer 08-1 Limited (b) SECURITIZATION SC Germany Consumer 09-1 Limited (b) SECURITIZATION SC Germany Consumer 10-1 Limited (b) SECURITIZATION SC Germany Consumer 11-1 Limited (b) SECURITIZATION SC Germany Consumer 2013-1 UG (haftungsbeschränkt) SECURITIZATION SC Germany Vehicles 2013-1 UG (haftungsbeschränkt) SECURITIZATION SCF Ajoneurohallinto Limited SECURITIZATION SCF Ajoneuvohallinta Limited SECURITIZATION SCF Rahoituspalvelut 2013 Limited SECURITIZATION SCF Rahoituspalvelut Limited SECURITIZATION SCI BANBY PRO PROPERTY Scottish Mutual Pensions Limited (b) INSURANCE Serfin International Bank and Trust, Limited BANKING Services and Promotions Delaware Corp HOLDING COMPANY Services and Promotions Miami LLC PROPERTY Servicio de Alarmas Controladas por Ordenador, S.A. SECURITY Servicios Administrativos y Financieros Ltda. SERVICES Servicios Corporativos Seguros Serfin, S.A. de C.V. (b) SERVICES Servicios de Cobranza, Recuperación y Seguimiento, S.A. de C.V. FINANCE Servicios de Cobranzas Fiscalex Ltda. SERVICES Servicios Universia Venezuela S.U.V., S.A. (b) INTERNET % of ownership held
by the Bank % of voting power (c) Direct Indirect 2013 2012 United Kingdom — (a) — — United Kingdom 100.00 % 0.00 % 0.00 % — United Kingdom 100.00 % 0.00 % 100.00 % 100.00 % United Kingdom 77.67 % 22.33 % 100.00 % 100.00 % Spain 100.00 % 0.00 % 100.00 % 100.00 % Mexico 0.00 % 75.08 % 100.00 % — Brazil 0.00 % 75.25 % 100.00 % 99.99 % Portugal 0.00 % 99.79 % 100.00 % 100.00 % Spain 69.76 % 30.24 % 100.00 % 100.00 % Ireland — (a) — — Ireland — (a) — — Germany — (a) — — Germany — (a) — — Germany — (a) — — Germany — (a) — — Germany — (a) — — Ireland — (a) — — Ireland — (a) — — Ireland — (a) — — Ireland — (a) — — Germany — (a) — — Germany — (a) — — Ireland — (a) — — Ireland — (a) — — Ireland — (a) — — Ireland — (a) — — France 0.00 % 90.00 % 100.00 % 100.00 % United Kingdom 0.00 % 100.00 % 100.00 % 100.00 % Cayman Islands 0.00 % 99.79 % 100.00 % 100.00 % United States 0.00 % 100.00 % 100.00 % 100.00 % United States 0.00 % 100.00 % 100.00 % 100.00 % Spain 99.99 % 0.01 % 100.00 % 100.00 % Chile 0.00 % 100.00 % 100.00 % 100.00 % Mexico 0.00 % 100.00 % 100.00 % 100.00 % Mexico 0.00 % 100.00 % 100.00 % 100.00 % Chile 0.00 % 99.54 % 100.00 % 100.00 % Venezuela 0.00 % 82.99 % 82.99 % 82.99 %
Company Location Line of business Sheppards Moneybrokers Limited ADVISORY SERVICES Shiloh III Wind Project, LLC ELECTRICITY PRODUCTION Silk Finance No. 3 Limited SECURITIZATION Sinvest Inversiones y Asesorías Limitada FINANCE Sistema 4B, S.L. (consolidated) CARDS Sociedad Integral de Valoraciones Automatizadas, S.A. APPRAISALS Societa’ Energetica Pezzullo S.r.l. Unipersonale ELECTRICITY PRODUCTION Societa’ Energetica Vibonese Due S.r.l. ELECTRICITY PRODUCTION Socur, S.A. FINANCE Sodepro, S.A. FINANCE Solar Red, SGPS, S.A. HOLDING COMPANY Solarlaser Limited PROPERTY SOV APEX LLC HOLDING COMPANY Sovereign Capital Trust IV FINANCE Sovereign Capital Trust IX FINANCE Sovereign Capital Trust V INACTIVE Sovereign Capital Trust VI FINANCE Sovereign Community Development Company HOLDING COMPANY Sovereign Delaware Investment Corporation HOLDING COMPANY Sovereign Lease Holdings, LLC FINANCIAL SERVICES Sovereign Precious Metals, LLC PURCHASE AND SALE OF PRECIOUS METALS Sovereign REIT Holdings, Inc. HOLDING COMPANY Sovereign Securities Corporation, LLC SECURITIES COMPANY Sovereign Spirit Limited (e) LEASING Sterrebeeck B.V. HOLDING COMPANY Suleyado 2003, S.L. SECURITIES INVESTMENT Suzuki Servicios Financieros, S.L. INTERMEDIATION Svensk Autofinans 1 Limited SECURITIZATION Swesant SA HOLDING COMPANY Synergy Abstract, LP INSURANCE Task Moraza, S.L. HOLDING COMPANY Taxagest Sociedade Gestora de Participações Sociais, S.A. HOLDING COMPANY Teatinos Siglo XXI Inversiones S.A. HOLDING COMPANY Teylada, S.A. in liquidation (b) SECURITIES INVESTMENT The Alliance & Leicester Corporation Limited PROPERTY The National & Provincial Building Society Pension Fund Trustees Limited ASSET MANAGEMENT COMPANY The Prepaid Card Company Limited (b) FINANCE Time Finance Limited (b) SERVICES Time Retail Finance Limited (b) SERVICESF-261 % of ownership held
by the Bank % of voting power (c) Direct Indirect 2013 2012 United Kingdom 0.00 % 100.00 % 100.00 % 100.00 % United States 0.00 % 100.00 % 100.00 % 100.00 % Ireland — (a) — — Chile 0.00 % 100.00 % 100.00 % 100.00 % Spain 68.80 % 0.00 % 68.80 % — Spain 100.00 % 0.00 % 100.00 % 100.00 % Italy 0.00 % 100.00 % 100.00 % — Italy 0.00 % 100.00 % 100.00 % — Uruguay 100.00 % 0.00 % 100.00 % 100.00 % Spain 100.00 % 0.00 % 100.00 % 100.00 % Portugal 0.00 % 100.00 % 100.00 % 50.00 % United Kingdom 0.00 % 100.00 % 100.00 % 100.00 % United States 0.00 % 100.00 % 100.00 % 100.00 % United States 0.00 % 100.00 % 100.00 % 100.00 % United States 0.00 % 100.00 % 100.00 % 100.00 % United States 0.00 % 100.00 % 100.00 % 100.00 % United States 0.00 % 100.00 % 100.00 % 100.00 % United States 0.00 % 100.00 % 100.00 % 100.00 % United States 0.00 % 100.00 % 100.00 % 100.00 % United States 0.00 % 100.00 % 100.00 % 100.00 % United States 0.00 % 100.00 % 100.00 % 100.00 % United States 0.00 % 100.00 % 100.00 % 100.00 % United States 0.00 % 100.00 % 100.00 % 100.00 % Bermuda 0.00 % 100.00 % 100.00 % 100.00 % The Netherlands 100.00 % 0.00 % 100.00 % 100.00 % Spain 0.00 % 100.00 % 100.00 % 100.00 % Spain 0.00 % 51.00 % 51.00 % 51.00 % Ireland — (a) — — Switzerland 0.00 % 100.00 % 100.00 % 100.00 % United States 0.00 % 70.00 % 70.00 % 70.00 % Spain 0.00 % 73.22 % 73.22 % 73.22 % Portugal 0.00 % 99.79 % 100.00 % 100.00 % Chile 50.00 % 50.00 % 100.00 % 100.00 % Spain 11.11 % 88.89 % 100.00 % 100.00 % United Kingdom 0.00 % 100.00 % 100.00 % 100.00 % United Kingdom — (a) — — United Kingdom 0.00 % 80.00 % 80.00 % 80.00 % United Kingdom 0.00 % 100.00 % 100.00 % 100.00 % United Kingdom 0.00 % 100.00 % 100.00 % 100.00 %
| % of ownership held by the Bank | % of voting | |||||||||||||||
Company | Location | Direct | Indirect | power (c) | Line of business | |||||||||||
Capital Street S.A. | Luxembourg | 0.00 | % | 100.00 | % | 100.00 | % | FINANCE | ||||||||
Carfax (Guernsey) Limited (e) | Guernsey | 0.00 | % | 100.00 | % | 100.00 | % | INSURANCE BROKER | ||||||||
Carpe Diem Salud, S.L. | Spain | 100.00 | % | 0.00 | % | 100.00 | % | SECURITIES INVESTMENT | ||||||||
Cartera Mobiliaria, S.A., SICAV | Spain | 0.00 | % | 81.01 | % | 92.90 | % | SECURITIES INVESTMENT | ||||||||
Casa de Bolsa Santander, S.A. de C.V., Grupo Financiero Santander | Mexico | 0.00 | % | 99.83 | % | 99.97 | % | BROKER-DEALER | ||||||||
Cater Allen Holdings Limited | United Kingdom | 0.00 | % | 99.99 | % | 100.00 | % | HOLDING COMPANY | ||||||||
Cater Allen International Limited | United Kingdom | 0.00 | % | 99.99 | % | 100.00 | % | BROKER-DEALER | ||||||||
Cater Allen Limited | United Kingdom | 0.00 | % | 100.00 | % | 100.00 | % | BANKING | ||||||||
Cater Allen Lloyd’s Holdings Limited | United Kingdom | 0.00 | % | 99.99 | % | 100.00 | % | HOLDING COMPANY | ||||||||
Cater Allen Pensions Limited | United Kingdom | 0.00 | % | 100.00 | % | 100.00 | % | PENSION FUND MANAGEMENT COMPANY | ||||||||
Cater Allen Syndicate Management Limited | United Kingdom | 0.00 | % | 99.99 | % | 100.00 | % | ADVISORY SERVICES | ||||||||
Catmoll, S.L. | Spain | 100.00 | % | 0.00 | % | 100.00 | % | PROPERTY | ||||||||
Certidesa, S.L. | Spain | 0.00 | % | 100.00 | % | 100.00 | % | LEASE OF AIRCRAFT | ||||||||
Churchtown Farm Solar Limited | United Kingdom | 0.00 | % | 80.00 | % | 80.00 | % | ELECTRICITY PRODUCTION | ||||||||
Clínica Sear, S.A. | Spain | 0.00 | % | 45.37 | % | 50.58 | % | HEALTHCARE | ||||||||
Club Zaudin Golf, S.A. | Spain | 0.00 | % | 76.29 | % | 95.11 | % | SERVICES | ||||||||
Companhia Santander de Valores—Distribuidora de Títulos e Valores Mobiliários | Brazil | 0.00 | % | 81.53 | % | 100.00 | % | MANAGEMENT COMPANY | ||||||||
Costa Canaria de Veneguera, S.A. | Spain | 0.00 | % | 66.59 | % | 74.23 | % | PROPERTY | ||||||||
Crawfall S.A. | Uruguay | 100.00 | % | 0.00 | % | 100.00 | % | SERVICES | ||||||||
Credicenter Empreendimentos e Promoções Ltda. (d) | Brazil | 0.00 | % | 0.00 | % | 0.00 | % | FINANCIAL SERVICES | ||||||||
Credisol, S.A. (b) | Uruguay | 0.00 | % | 100.00 | % | 100.00 | % | CARDS | ||||||||
Crefisa, Inc. | Puerto Rico | 100.00 | % | 0.00 | % | 100.00 | % | FINANCE | ||||||||
Cruzeiro Factoring Sociedade de Fomento Comercial Ltda. (d) | Brazil | 0.00 | % | 0.00 | % | 0.00 | % | FACTORING | ||||||||
Darep Limited | Ireland | 0.00 | % | 100.00 | % | 100.00 | % | REINSURANCE | ||||||||
Depósitos Portuarios, S.A. | Spain | 0.00 | % | 89.71 | % | 100.00 | % | SERVICES | ||||||||
Digital Procurement Holdings N.V. | The Netherlands | 0.00 | % | 99.43 | % | 100.00 | % | HOLDING COMPANY | ||||||||
Diners Club Spain, S.A. | Spain | 75.00 | % | 0.00 | % | 75.00 | % | CARDS | ||||||||
Dirección Estratega, S.C. | Mexico | 0.00 | % | 100.00 | % | 100.00 | % | SERVICES | ||||||||
Dom Maklerski BZ WBK S.A. | Poland | 0.00 | % | 96.24 | % | 99.99 | % | BROKER-DEALER | ||||||||
Dudebasa, S.A. | Spain | 0.00 | % | 89.71 | % | 100.00 | % | FINANCE | ||||||||
East Langford Solar Limited | United Kingdom | 0.00 | % | 80.00 | % | 80.00 | % | ELECTRICITY PRODUCTION | ||||||||
F-262
| % of ownership held by the Bank | % of voting | |||||||||
Company | Location | Direct | Indirect | power (c) | Line of business | |||||
Elerco, S.A. | Spain | 0.00% | 89.71% | 100.00% | PROPERTY | |||||
Embuaca Geração e Comercialização de Energia S.A. | Brazil | 0.00% | 63.88% | 100.00% | ELECTRICITY PRODUCTION | |||||
Empresas Banesto 1, Fondo de Titulización de Activos | Spain | — | (a) | — | SECURITIZATION | |||||
Empresas Banesto 2, Fondo de Titulización de Activos | Spain | — | (a) | — | SECURITIZATION | |||||
Empresas Banesto 5, Fondo de Titulización de Activos | Spain | — | (a) | — | SECURITIZATION | |||||
Empresas Banesto 6, Fondo de Titulización de Activos | Spain | — | (a) | — | SECURITIZATION | |||||
EOL Brisa Energias Renováveis S.A. | Brazil | 0.00% | 100.00% | 100.00% | ELECTRICITY PRODUCTION | |||||
EOL Vento Energias Renováveis S.A. | Brazil | 0.00% | 100.00% | 100.00% | ELECTRICITY PRODUCTION | |||||
EOL Wind Energias Renováveis S.A. | Brazil | 0.00% | 100.00% | 100.00% | ELECTRICITY PRODUCTION | |||||
Eólica Bela Vista Geração e Comercialização de Energia S.A. | Brazil | 0.00% | 63.88% | 100.00% | ELECTRICITY PRODUCTION | |||||
Eólica Icaraí Geração e Comercialização de Energia S.A. | Brazil | 0.00% | 63.88% | 100.00% | ELECTRICITY PRODUCTION | |||||
Eólica Mar e Terra Geração e Comercialização de Energia S.A. | Brazil | 0.00% | 63.88% | 100.00% | ELECTRICITY PRODUCTION | |||||
Erestone S.A.S. | France | 0.00% | 90.00% | 90.00% | PROPERTY | |||||
FFB—Participações e Serviços, Sociedade Unipessoal, S.A. | Portugal | 0.00% | 100.00% | 100.00% | HOLDING COMPANY | |||||
Fideicomiso 100740 SLPT | Mexico | 0.00% | 99.86% | 100.00% | FINANCE | |||||
Fideicomiso Financiero Río Personales I | Argentina | 0.00% | 99.30% | 100.00% | TRUST SERVICES | |||||
Fideicomiso GFSSLPT Banca Serfín, S.A. | Mexico | 0.00% | 99.86% | 100.00% | FINANCE | |||||
Fideicomiso Super Letras Hipotecarias Clase I | Argentina | 0.00% | 99.30% | 100.00% | TRUST SERVICES | |||||
Fideicomiso Super Letras Hipotecarias Clase II | Argentina | 0.00% | 99.30% | 100.00% | TRUST SERVICES | |||||
Financiación Banesto 1, Fondo de Titulización de Activos | Spain | — | (a) | — | SECURITIZATION | |||||
Financiera Alcanza, S.A. de C.V., Sociedad Financiera de Objeto Múltiple, Entidad Regulada | Mexico | 0.00% | 100.00% | 100.00% | FINANCE | |||||
First National Motor Business Limited | United Kingdom | 0.00% | 100.00% | 100.00% | LEASING | |||||
First National Motor Contracts Limited | United Kingdom | 0.00% | 100.00% | 100.00% | LEASING | |||||
First National Motor Facilities Limited | United Kingdom | 0.00% | 100.00% | 100.00% | LEASING | |||||
First National Motor Finance Limited | United Kingdom | 0.00% | 100.00% | 100.00% | ADVISORY SERVICES | |||||
First National Motor Leasing Limited | United Kingdom | 0.00% | 100.00% | 100.00% | LEASING | |||||
First National Motor plc | United Kingdom | 0.00% | 100.00% | 100.00% | LEASING | |||||
First National Tricity Finance Limited | United Kingdom | 0.00% | 100.00% | 100.00% | FINANCE | |||||
Fomento e Inversiones, S.A. | Spain | 100.00% | 0.00% | 100.00% | HOLDING COMPANY | |||||
Fondo de Titulización de Activos Santander 2 | Spain | — | (a) | — | SECURITIZATION | |||||
F-263
| % of ownership held by the Bank | % of voting | |||||||||
Company | Location | Direct | Indirect | power (c) | Line of business | |||||
Fondo de Titulización de Activos Santander Consumer Spain 09-1 | Spain | — | (a) | — | SECURITIZATION | |||||
Fondo de Titulización de Activos Santander Consumer Spain Auto 06 | Spain | — | (a) | — | SECURITIZATION | |||||
Fondo de Titulización de Activos Santander Consumer Spain Auto 07-1 | Spain | — | (a) | — | SECURITIZATION | |||||
Fondo de Titulización de Activos Santander Consumer Spain Auto 2010-1 | Spain | — | (a) | — | SECURITIZATION | |||||
Fondo de Titulización de Activos Santander Consumer Spain Auto 2011-1 | Spain | — | (a) | — | SECURITIZATION | |||||
Fondo de Titulización de Activos Santander Empresas 1 | Spain | — | (a) | — | SECURITIZATION | |||||
Fondo de Titulización de Activos Santander Empresas 10 | Spain | — | (a) | — | SECURITIZATION | |||||
Fondo de Titulización de Activos Santander Empresas 2 | Spain | — | (a) | — | SECURITIZATION | |||||
Fondo de Titulización de Activos Santander Empresas 3 | Spain | — | (a) | — | SECURITIZATION | |||||
Fondo de Titulización de Activos Santander Empresas 4 | Spain | — | (a) | — | SECURITIZATION | |||||
Fondo de Titulización de Activos Santander Empresas 5 | Spain | — | (a) | — | SECURITIZATION | |||||
Fondo de Titulización de Activos Santander Empresas 6 | Spain | — | (a) | — | SECURITIZATION | |||||
Fondo de Titulización de Activos Santander Empresas 7 | Spain | — | (a) | — | SECURITIZATION | |||||
Fondo de Titulización de Activos Santander Empresas 8 | Spain | — | (a) | — | SECURITIZATION | |||||
Fondo de Titulización de Activos Santander Empresas 9 | Spain | — | (a) | — | SECURITIZATION | |||||
Fondo de Titulización de Activos Santander Financiación 5 | Spain | — | (a) | — | SECURITIZATION | |||||
Fondo de Titulización de Activos Santander Hipotecario 6 | Spain | — | (a) | — | SECURITIZATION | |||||
Fondo de Titulización de Activos Santander Hipotecario 7 | Spain | — | (a) | — | SECURITIZATION | |||||
Fondo de Titulización de Activos Santander Hipotecario 8 | Spain | — | (a) | — | SECURITIZATION | |||||
Fondo de Titulización de Activos Santander Público 1 | Spain | — | (a) | — | SECURITIZATION | |||||
Fondo de Titulización Hipotecaria Banesto 4 | Spain | — | (a) | — | SECURITIZATION | |||||
Fondo de Titulización Santander Financiación 1 | Spain | — | (a) | — | SECURITIZATION | |||||
Fondo de Titulización Santander Financiación 2 | Spain | — | (a) | — | SECURITIZATION | |||||
Fondo de Titulización Santander Financiación 3 | Spain | — | (a) | — | SECURITIZATION | |||||
Fondo de Titulización Santander Financiación 4 | Spain | — | (a) | — | SECURITIZATION | |||||
Fondos Santander, S.A. Administradora de Fondos de Inversión (in liquidation) (b) | Uruguay | 0.00% | 100.00% | 100.00% | FUND MANAGEMENT COMPANY | |||||
Formación Integral, S.A. | Spain | 0.00% | 89.71% | 100.00% | TRAINING | |||||
Fortensky Trading, Ltd. | Ireland | 0.00% | 100.00% | 100.00% | FINANCE | |||||
Fosse (Master Issuer) Holdings Limited | United Kingdom | — | (a) | — | SECURITIZATION | |||||
Fosse Funding (No.1) Limited | United Kingdom | 0.00% | 100.00% | 100.00% | SECURITIZATION | |||||
Fosse Master Issuer PLC | United Kingdom | 0.00% | 100.00% | 100.00% | SECURITIZATION | |||||
Fosse PECOH Limited | United Kingdom | — | (a) | — | SECURITIZATION | |||||
Fosse Trustee (UK) Limited | United Kingdom | — | (a) | — | SECURITIZATION | |||||
F-264
| % of ownership held by the Bank | % of voting | |||||||||||||||
Company | Location | Direct | Indirect | power (c) | Line of business | |||||||||||
Fosse Trustee Limited | Jersey | — | (a | ) | — | SECURITIZATION | ||||||||||
FTPYME Banesto 2, Fondo de Titulización de Activos | Spain | — | (a | ) | — | SECURITIZATION | ||||||||||
FTPYME Santander 2 Fondo de Titulización de Activos | Spain | — | (a | ) | — | SECURITIZATION | ||||||||||
Garilar, S.A. | Uruguay | 0.00 | % | 100.00 | % | 100.00 | % | INTERNET | ||||||||
GEOBAN Deutschland GmbH | Germany | 0.00 | % | 100.00 | % | 100.00 | % | SERVICES | ||||||||
Geoban UK Limited | United Kingdom | 0.00 | % | 100.00 | % | 100.00 | % | SERVICES | ||||||||
Geoban, S.A. | Spain | 100.00 | % | 0.00 | % | 100.00 | % | SERVICES | ||||||||
Gesban México Servicios Administrativos Globales, S.A. de C.V. | Mexico | 0.00 | % | 100.00 | % | 100.00 | % | SERVICES | ||||||||
Gesban Santander Servicios Profesionales Contables Limitada | Chile | 0.00 | % | 100.00 | % | 100.00 | % | INTERNET | ||||||||
Gesban Servicios Administrativos Globales, S.L. | Spain | 99.99 | % | 0.01 | % | 100.00 | % | SERVICES | ||||||||
Gesban UK Limited | United Kingdom | 0.00 | % | 100.00 | % | 100.00 | % | COLLECTION AND PAYMENT SERVICES | ||||||||
Gescoban Soluciones, S.A. | Spain | 0.00 | % | 89.71 | % | 100.00 | % | FINANCE | ||||||||
Gestión de Instalaciones Fotovoltaicas, S.L. Sole-Shareholder Company | Spain | 0.00 | % | 100.00 | % | 100.00 | % | ELECTRICITY PRODUCTION | ||||||||
Gestión Santander, S.A. de C.V., Sociedad Operadora de Sociedades de Inversión, Grupo Financiero Santander | Mexico | 0.00 | % | 99.87 | % | 100.00 | % | FUND MANAGEMENT COMPANY | ||||||||
Gestora de Procesos S.A. in liquidation (b) | Peru | 0.00 | % | 100.00 | % | 100.00 | % | HOLDING COMPANY | ||||||||
Girobank Carlton Investments Limited | United Kingdom | 0.00 | % | 100.00 | % | 100.00 | % | FINANCE | ||||||||
Girobank Investments Limited (b) | United Kingdom | 0.00 | % | 100.00 | % | 100.00 | % | FINANCE | ||||||||
Golden Bar (Securitization) S.r.l. | Italy | — | (a | ) | — | SECURITIZATION | ||||||||||
Golden Bar Securitization Programme (GB10) | Italy | — | (a | ) | — | SECURITIZATION | ||||||||||
Golden Bar Securitization Programme I | Italy | — | (a | ) | — | SECURITIZATION | ||||||||||
Golden Bar Securitization Programme IV | Italy | — | (a | ) | — | SECURITIZATION | ||||||||||
Golden Bar Securitization Programme V | Italy | — | (a | ) | — | SECURITIZATION | ||||||||||
Golden Bar Securitization Programme VI | Italy | — | (a | ) | — | SECURITIZATION | ||||||||||
Grupo Alcanza, S.A. de C.V. | Mexico | 100.00 | % | 0.00 | % | 100.00 | % | HOLDING COMPANY | ||||||||
Grupo Empresarial Santander, S.L. | Spain | 99.11 | % | 0.89 | % | 100.00 | % | HOLDING COMPANY | ||||||||
Grupo Financiero Santander, S.A. B de C.V. | Mexico | 74.75 | % | 25.12 | % | 99.87 | % | HOLDING COMPANY | ||||||||
Guaranty Car, S.A. Sole-Shareholder Company | Spain | 0.00 | % | 100.00 | % | 100.00 | % | AUTOMOTIVE | ||||||||
Hansar Finance Limited (b) | United Kingdom | 0.00 | % | 100.00 | % | 100.00 | % | FINANCE | ||||||||
Hipototta No. 1 FTC | Portugal | — | (a | ) | — | SECURITIZATION | ||||||||||
Hipototta No. 1 plc | Ireland | — | (a | ) | — | SECURITIZATION | ||||||||||
Hipototta No. 10 FTC (b) | Portugal | — | (a | ) | — | SECURITIZATION | ||||||||||
Hipototta No. 10 Limited (b) | Ireland | — | (a | ) | — | SECURITIZATION | ||||||||||
Hipototta No. 11 | Portugal | — | (a | ) | — | SECURITIZATION | ||||||||||
Hipototta No. 12 | Portugal | — | (a | ) | — | SECURITIZATION | ||||||||||
Hipototta No. 2 FTC (b) | Portugal | — | (a | ) | — | SECURITIZATION | ||||||||||
F-265
| % of ownership held by the Bank | % of voting | |||||||||||||||
Company | Location | Direct | Indirect | power (c) | Line of business | |||||||||||
Hipototta No. 2 plc (b) | Ireland | — | (a | ) | — | SECURITIZATION | ||||||||||
Hipototta No. 3 FTC (b) | Portugal | — | (a | ) | — | SECURITIZATION | ||||||||||
Hipototta No. 3 plc (b) | Ireland | — | (a | ) | — | SECURITIZATION | ||||||||||
Hipototta No. 4 FTC | Portugal | — | (a | ) | — | SECURITIZATION | ||||||||||
Hipototta No. 4 plc | Ireland | — | (a | ) | — | SECURITIZATION | ||||||||||
Hipototta No. 5 FTC | Portugal | — | (a | ) | — | SECURITIZATION | ||||||||||
Hipototta No. 5 plc | Ireland | — | (a | ) | — | SECURITIZATION | ||||||||||
Hipototta No. 7 FTC | Portugal | — | (a | ) | — | SECURITIZATION | ||||||||||
Hipototta No. 7 Limited | Ireland | — | (a | ) | — | SECURITIZATION | ||||||||||
Hipototta No. 8 FTC (b) | Portugal | — | (a | ) | — | SECURITIZATION | ||||||||||
Hipototta No. 8 Limited (b) | Ireland | — | (a | ) | — | SECURITIZATION | ||||||||||
Hispamer Renting, S.A. Sole-Shareholder Company | Spain | 0.00 | % | 100.00 | % | 100.00 | % | FULL-SERVICE LEASING | ||||||||
Holbah II Limited | Bahamas | 0.00 | % | 100.00 | % | 100.00 | % | HOLDING COMPANY | ||||||||
Holbah Limited | Bahamas | 0.00 | % | 100.00 | % | 100.00 | % | HOLDING COMPANY | ||||||||
Holmes Funding 2 Limited (b) | United Kingdom | 0.00 | % | 100.00 | % | 100.00 | % | SECURITIZATION | ||||||||
Holmes Funding Limited | United Kingdom | — | (a | ) | — | SECURITIZATION | ||||||||||
Holmes Holdings Limited | United Kingdom | — | (a | ) | — | SECURITIZATION | ||||||||||
Holmes Master Issuer 2 PLC (b) | United Kingdom | 0.00 | % | 100.00 | % | 100.00 | % | SECURITIZATION | ||||||||
Holmes Master Issuer plc | United Kingdom | — | (a | ) | — | SECURITIZATION | ||||||||||
Holmes Trustees Limited | United Kingdom | — | (a | ) | — | SECURITIZATION | ||||||||||
Holneth B.V. | The Netherlands | 0.00 | % | 100.00 | % | 100.00 | % | HOLDING COMPANY | ||||||||
HRE Investment Holdings II-A S.à.r.l. | Luxembourg | 0.00 | % | 73.70 | % | 0.00 | % | HOLDING COMPANY | ||||||||
HSH Delaware L.P. | United States | 0.00 | % | 69.83 | % | 0.00 | % | HOLDING COMPANY | ||||||||
Hualle, S.A. | Spain | 0.00 | % | 89.71 | % | 100.00 | % | SECURITIES INVESTMENT | ||||||||
Ibérica de Compras Corporativas, S.L. | Spain | 91.63 | % | 7.80 | % | 100.00 | % | E-COMMERCE | ||||||||
Independence Community Bank Corp. | United States | 0.00 | % | 100.00 | % | 100.00 | % | HOLDING COMPANY | ||||||||
Independence Community Commercial Reinvestment Corp. | United States | 0.00 | % | 100.00 | % | 100.00 | % | HOLDING COMPANY | ||||||||
Infraestructuras Americanas, S.L. | Spain | 0.00 | % | 100.00 | % | 100.00 | % | HOLDING COMPANY | ||||||||
Ingeniería de Software Bancario, S.L. | Spain | 100.00 | % | 0.00 | % | 100.00 | % | IT SERVICES | ||||||||
Inmo Francia 2, S.A. | Spain | 0.00 | % | 100.00 | % | 100.00 | % | PROPERTY | ||||||||
Instituto Santander Serfin, A.C. | Mexico | 0.00 | % | 99.86 | % | 100.00 | % | NOT-FOR-PROFIT INSTITUTE | ||||||||
Insurance Funding Solutions Limited | United Kingdom | 0.00 | % | 100.00 | % | 100.00 | % | FINANCE | ||||||||
Interfinance Holanda B.V. | The Netherlands | 100.00 | % | 0.00 | % | 100.00 | % | HOLDING COMPANY | ||||||||
Inversiones Marítimas del Mediterráneo, S.A. | Spain | 100.00 | % | 0.00 | % | 100.00 | % | INACTIVE | ||||||||
Isban Argentina S.A. | Argentina | 87.42 | % | 12.58 | % | 100.00 | % | FINANCIAL SERVICES | ||||||||
F-266
| % of ownership held by the Bank | % of voting | |||||||||||||||
Company | Location | Direct | Indirect | power (c) | Line of business | |||||||||||
Isban Brasil S.A. | Brazil | 0.00 | % | 100.00 | % | 100.00 | % | SERVICES | ||||||||
Isban Chile S.A. | Chile | 0.00 | % | 100.00 | % | 100.00 | % | IT SERVICES | ||||||||
Isban DE GmbH | Germany | 0.00 | % | 100.00 | % | 100.00 | % | IT SERVICES | ||||||||
Isban México, S.A. de C.V. | Mexico | 100.00 | % | 0.00 | % | 100.00 | % | IT SERVICES | ||||||||
Isban U.K., Ltd. | United Kingdom | 0.00 | % | 100.00 | % | 100.00 | % | IT SERVICES | ||||||||
Island Insurance Corporation | Puerto Rico | 0.00 | % | 99.99 | % | 99.99 | % | INSURANCE | ||||||||
J.C. Flowers II-A L.P. | Canada | 0.00 | % | 69.53 | % | 4.43 | % | HOLDING COMPANY | ||||||||
JCF BIN II-A | Mauritania | 0.00 | % | 69.47 | % | 4.43 | % | HOLDING COMPANY | ||||||||
JCF II-A AIV K L.P. | Canada | 0.00 | % | 69.54 | % | 0.00 | % | HOLDING COMPANY | ||||||||
JCF II-A Special AIV K L.P. | Canada | 0.00 | % | 72.29 | % | 4.99 | % | HOLDING COMPANY | ||||||||
Jupiter III C.V. | The Netherlands | 0.00 | % | 72.75 | % | 4.99 | % | HOLDING COMPANY | ||||||||
Jupiter JCF AIV II-A C.V. | The Netherlands | 0.00 | % | 69.41 | % | 4.99 | % | HOLDING COMPANY | ||||||||
La Unión Resinera Española, S.A. (consolidated) | Spain | 74.87 | % | 21.48 | % | 96.44 | % | CHEMICALS | ||||||||
Laboratorios Indas, S.A. | Spain | 0.00 | % | 73.22 | % | 73.22 | % | HEALTH PRODUCTS | ||||||||
Langton Funding (No.1) Limited | United Kingdom | 0.00 | % | 100.00 | % | 100.00 | % | SECURITIZATION | ||||||||
Langton Mortgages Trustee (UK) Limited | United Kingdom | — | (a | ) | — | SECURITIZATION | ||||||||||
Langton Mortgages Trustee Limited | Jersey | — | (a | ) | — | SECURITIZATION | ||||||||||
Langton PECOH Limited | United Kingdom | — | (a | ) | — | SECURITIZATION | ||||||||||
Langton Securities (2008-1) plc | United Kingdom | 0.00 | % | 100.00 | % | 100.00 | % | SECURITIZATION | ||||||||
Langton Securities (2008-2) plc (b) | United Kingdom | 0.00 | % | 100.00 | % | 100.00 | % | SECURITIZATION | ||||||||
Langton Securities (2008-3) plc | United Kingdom | 0.00 | % | 100.00 | % | 100.00 | % | SECURITIZATION | ||||||||
Langton Securities (2010-1) PLC | United Kingdom | 0.00 | % | 100.00 | % | 100.00 | % | SECURITIZATION | ||||||||
Langton Securities (2010-2) PLC | United Kingdom | 0.00 | % | 100.00 | % | 100.00 | % | SECURITIZATION | ||||||||
Langton Securities Holdings Limited | United Kingdom | — | (a | ) | — | SECURITIZATION | ||||||||||
Laparanza, S.A. | Spain | 61.59 | % | 0.00 | % | 61.59 | % | AGRICULTURE AND LIVESTOCK | ||||||||
Larix Chile Inversiones Limitada | Chile | 0.00 | % | 89.71 | % | 100.00 | % | FINANCE | ||||||||
Lease Totta No. 1 FTC | Portugal | — | (a | ) | — | SECURITIZATION | ||||||||||
Leasetotta No. 1 Limited | Ireland | — | (a | ) | — | SECURITIZATION | ||||||||||
Liquidity Import Finance Limited | United Kingdom | 0.00 | % | 100.00 | % | 100.00 | % | FACTORING | ||||||||
Liquidity Limited | United Kingdom | 0.00 | % | 100.00 | % | 100.00 | % | FACTORING | ||||||||
Luresa Inmobiliaria, S.A. | Spain | 0.00 | % | 96.35 | % | 100.00 | % | PROPERTY | ||||||||
Luri 1, S.A. (f) | Spain | 0.00 | % | 5.59 | % | 100.00 | % | PROPERTY | ||||||||
Luri 2, S.A. (f) | Spain | 0.00 | % | 4.82 | % | 100.00 | % | PROPERTY | ||||||||
Luri 4, S.A. Sole-Shareholder Company | Spain | 100.00 | % | 0.00 | % | 100.00 | % | PROPERTY | ||||||||
Luri Land, S.A. (f) | Belgium | 0.00 | % | 5.16 | % | 100.00 | % | PROPERTY | ||||||||
F-267
| % of ownership held by the Bank | % of voting | |||||||||||||||
Company | Location | Direct | Indirect | power (c) | Line of business | |||||||||||
| MAC No. 1 Limited | United Kingdom | — | (a | ) | — | MORTGAGE LOAN COMPANY | ||||||||||
Magnolia Termosolar, S.L. | Spain | 0.00 | % | 65.00 | % | 65.00 | % | ELECTRICITY PRODUCTION | ||||||||
Manor Farm Solar Limited | United Kingdom | 0.00 | % | 80.00 | % | 80.00 | % | ELECTRICITY PRODUCTION | ||||||||
Mantiq Investimentos Ltda. | Brazil | 0.00 | % | 81.53 | % | 100.00 | % | BROKER-DEALER | ||||||||
Marylebone Road CBO 3 BV | The Netherlands | — | (a | ) | — | SECURITIZATION | ||||||||||
Mata Alta, S.L. | Spain | 0.00 | % | 61.59 | % | 100.00 | % | PROPERTY | ||||||||
Merciver, S.L. | Spain | 0.00 | % | 89.71 | % | 100.00 | % | FINANCIAL ADVISORY | ||||||||
Mesena CLO 2011-1 B.V. | The Netherlands | — | (a | ) | — | SECURITIZATION | ||||||||||
Mesena Servicios de Gestión Inmobiliaria, S.A. | Spain | 0.00 | % | 89.71 | % | 100.00 | % | PROPERTY | ||||||||
Mitre Capital Partners Limited | United Kingdom | 0.00 | % | 100.00 | % | 100.00 | % | MORTGAGE LOAN COMPANY | ||||||||
Money Card (Holdings) Limited (b) | United Kingdom | 0.00 | % | 80.00 | % | 100.00 | % | HOLDING COMPANY | ||||||||
Money Card Limited (b) | United Kingdom | 0.00 | % | 80.00 | % | 100.00 | % | FINANCIAL SERVICES | ||||||||
Motor 2011 Holdings Limited | United Kingdom | — | (a | ) | — | SECURITIZATION | ||||||||||
Motor 2011 PLC | United Kingdom | 0.00 | % | 100.00 | % | 100.00 | % | SECURITIZATION | ||||||||
MS Participações Societárias S.A. | Brazil | 0.00 | % | 63.88 | % | 78.35 | % | HOLDING COMPANY | ||||||||
Mugo Termosolar, S.L. | Spain | 0.00 | % | 65.00 | % | 65.00 | % | ELECTRICITY PRODUCTION | ||||||||
Multinegocios S.A. | Chile | 0.00 | % | 99.54 | % | 100.00 | % | ADVISORY SERVICES | ||||||||
Multiservicios de Negocios Limitada | Chile | 0.00 | % | 100.00 | % | 100.00 | % | FINANCIAL SERVICES | ||||||||
N&P (B.E.S.) Loans (b) | United Kingdom | 0.00 | % | 100.00 | % | 100.00 | % | LEASING | ||||||||
Naviera Mirambel, S.L. | Spain | 0.00 | % | 100.00 | % | 100.00 | % | FINANCE | ||||||||
Naviera Trans Gas, A.I.E. | Spain | 99.99 | % | 0.01 | % | 100.00 | % | FULL-SERVICE LEASING | ||||||||
Naviera Trans Ore, A.I.E. | Spain | 99.99 | % | 0.01 | % | 100.00 | % | FULL-SERVICE LEASING | ||||||||
Naviera Trans Wind, S.L. | Spain | 99.99 | % | 0.01 | % | 100.00 | % | FULL-SERVICE LEASING | ||||||||
Nebraska Wind I LLC | United States | 0.00 | % | 100.00 | % | 100.00 | % | ELECTRICITY PRODUCTION | ||||||||
NIB Special Investors IV-A LP | Canada | 0.00 | % | 99.70 | % | 4.99 | % | HOLDING COMPANY | ||||||||
NIB Special Investors IV-B LP | Canada | 0.00 | % | 95.86 | % | 4.99 | % | HOLDING COMPANY | ||||||||
Norbest AS | Norway | 7.94 | % | 92.06 | % | 100.00 | % | SECURITIES INVESTMENT | ||||||||
NW Services CO. | United States | 0.00 | % | 99.43 | % | 100.00 | % | E-COMMERCE | ||||||||
Oil-Dor, S.A. | Spain | 0.00 | % | 89.70 | % | 99.99 | % | FINANCE | ||||||||
Olimpo CLO 2010-1 Limited | Ireland | — | (a | ) | — | SECURITIZATION | ||||||||||
Open Bank, S.A. | Spain | 100.00 | % | 0.00 | % | 100.00 | % | BANKING | ||||||||
Optimal Alternative Investments, S.G.I.I.C., S.A. | Spain | 0.00 | % | 100.00 | % | 100.00 | % | FUND MANAGEMENT COMPANY | ||||||||
F-268
Company | Location | % of ownership held by the Bank | % of voting | Line of business | ||||||||||||
| Direct | Indirect | power (c) | ||||||||||||||
Optimal Investment Services S.A. | Switzerland | 0.00 | % | 100.00 | % | 100.00 | % | FUND MANAGEMENT COMPANY | ||||||||
Optimal Multiadvisors Ireland Plc / Optimal Strategic US Equity Ireland Euro Fund | Ireland | 0.00 | % | 45.39 | % | 44.53 | % | FUND MANAGEMENT COMPANY | ||||||||
Optimal Multiadvisors Ireland Plc / Optimal Strategic US Equity Ireland US Dollar Fund | Ireland | 0.00 | % | 95.11 | % | 95.06 | % | FUND MANAGEMENT COMPANY | ||||||||
Optimal Multiadvisors Ltd / Optimal Strategic US Equity Series (consolidated) | Bahamas | 0.00 | % | 59.25 | % | 58.46 | % | FUND MANAGEMENT COMPANY | ||||||||
Palm Valley Topco LLC (consolidated) | United States | 0.00 | % | 100.00 | % | 100.00 | % | ELECTRICITY PRODUCTION | ||||||||
Parasant SA | Switzerland | 100.00 | % | 0.00 | % | 100.00 | % | HOLDING COMPANY | ||||||||
PBE Companies, LLC | United States | 0.00 | % | 100.00 | % | 100.00 | % | PROPERTY | ||||||||
PECOH Limited | United Kingdom | — | (a | ) | — | SECURITIZATION | ||||||||||
Pereda Gestión, S.A. | Spain | 99.99 | % | 0.01 | % | 100.00 | % | HOLDING COMPANY | ||||||||
Perevent Empresa de Servicios Eventuales S.A. | Argentina | 0.00 | % | 99.97 | % | 100.00 | % | SERVICES | ||||||||
Pingham International, S.A. | Uruguay | 0.00 | % | 100.00 | % | 100.00 | % | SERVICES | ||||||||
Portada S.A. in liquidation (b) | Chile | 0.00 | % | 96.17 | % | 96.17 | % | FINANCE | ||||||||
Portal Universia Argentina S.A. | Argentina | 0.00 | % | 77.50 | % | 77.50 | % | INTERNET | ||||||||
Portal Universia Portugal, Prestação de Serviços de Informática, S.A. | Portugal | 0.00 | % | 100.00 | % | 100.00 | % | INTERNET | ||||||||
Portal Universia, S.A. | Spain | 0.00 | % | 56.56 | % | 56.56 | % | INTERNET | ||||||||
Portfolio Solar I LLC | United States | 0.00 | % | 100.00 | % | 100.00 | % | ELECTRICITY PRODUCTION | ||||||||
Préstamos de Consumo S.A. (b) | Argentina | 0.00 | % | 99.99 | % | 99.99 | % | FINANCE | ||||||||
Procura Digital de Venezuela, S.A. | Venezuela | 0.00 | % | 99.43 | % | 100.00 | % | E-COMMERCE | ||||||||
Produban Servicios Informáticos Generales, S.L. | Spain | 98.44 | % | 1.56 | % | 100.00 | % | SERVICES | ||||||||
Produban Serviços de Informática S.A. | Brazil | 0.00 | % | 100.00 | % | 100.00 | % | IT SERVICES | ||||||||
Promociones y Servicios Monterrey, S.A. de C.V. | Mexico | 0.00 | % | 100.00 | % | 100.00 | % | PROPERTY | ||||||||
Promociones y Servicios Polanco, S.A. de C.V. | Mexico | 0.00 | % | 100.00 | % | 100.00 | % | PROPERTY | ||||||||
Promociones y Servicios Santiago, S.A. de C.V. | Mexico | 0.00 | % | 100.00 | % | 100.00 | % | PROPERTY | ||||||||
Promodomus Desarrollo de Activos, S.L. | Spain | 0.00 | % | 45.75 | % | 51.00 | % | PROPERTY | ||||||||
PSB Inmobilien GmbH | Germany | 0.00 | % | 100.00 | % | 100.00 | % | PROPERTY | ||||||||
RACS Energias Renováveis S.A. | Brazil | 0.00 | % | 100.00 | % | 100.00 | % | ELECTRICITY PRODUCTION | ||||||||
Real Corretora de Seguros S.A. (d) | Brazil | 0.00 | % | 0.00 | % | 0.00 | % | INSURANCE BROKER | ||||||||
REB Empreendimentos e Administradora de Bens S.A. | Brazil | 0.00 | % | 100.00 | % | 100.00 | % | PROPERTY | ||||||||
Reintegra Comercial España, S.L. | Spain | 0.00 | % | 100.00 | % | 100.00 | % | SERVICES | ||||||||
Reintegra, S.A. | Spain | 55.00 | % | 45.00 | % | 100.00 | % | SERVICES | ||||||||
Retail Financial Services Limited | United Kingdom | 0.00 | % | 100.00 | % | 100.00 | % | FINANCE | ||||||||
F-269
| % of ownership held by the Bank | % of voting | |||||||||||||||
Company | Location | Direct | Indirect | power (c) | Line of business | |||||||||||
Riobank International (Uruguay) SAIFE (b) | Uruguay | 0.00 | % | 100.00 | % | 100.00 | % | BANKING | ||||||||
Rosenlease, S.L. | Spain | 99.99 | % | 0.00 | % | 99.99 | % | FULL-SERVICE LEASING | ||||||||
Ruevilliot 26, S.L. | Spain | 0.00 | % | 70.00 | % | 70.00 | % | PROPERTY | ||||||||
Sánchez Ramade Santander Financiera, S.L. | Spain | 0.00 | % | 50.00 | % | 50.00 | % | FINANCIAL SERVICES | ||||||||
Saninv—Gestão e Investimentos, S.A. | Portugal | 0.00 | % | 100.00 | % | 100.00 | % | HOLDING COMPANY | ||||||||
Sansol S.r.l. | Italy | 0.00 | % | 100.00 | % | 100.00 | % | ELECTRICITY PRODUCTION | ||||||||
Santander (CF Trustee Property Nominee) Limited | United Kingdom | 0.00 | % | 100.00 | % | 100.00 | % | SERVICES | ||||||||
Santander Administradora de Consórcios Ltda. | Brazil | 0.00 | % | 81.53 | % | 100.00 | % | FINANCE | ||||||||
Santander Advisory Services S.A. | Brazil | 0.00 | % | 81.53 | % | 100.00 | % | ADVISORY SERVICES | ||||||||
Santander Agente de Valores Limitada | Chile | 0.00 | % | 67.33 | % | 100.00 | % | BROKER-DEALER | ||||||||
Santander Ahorro Inmobiliario 2 S.I.I., S.A. | Spain | 69.11 | % | 0.01 | % | 69.12 | % | PROPERTY | ||||||||
Santander AM Holding, S.L. | Spain | 100.00 | % | 0.00 | % | 100.00 | % | HOLDING COMPANY | ||||||||
Santander Asset Finance (December) Limited | United Kingdom | 0.00 | % | 100.00 | % | 100.00 | % | LEASING | ||||||||
Santander Asset Finance plc | United Kingdom | 0.00 | % | 100.00 | % | 100.00 | % | LEASING | ||||||||
Santander Asset Management—Sociedade Gestora de Fundos de Investimento Mobiliário, S.A. | Portugal | 0.00 | % | 99.75 | % | 100.00 | % | FUND MANAGEMENT COMPANY | ||||||||
Santander Asset Management Chile S.A. | Chile | 0.01 | % | 99.83 | % | 100.00 | % | SECURITIES INVESTMENT | ||||||||
Santander Asset Management Corporation | Puerto Rico | 0.00 | % | 100.00 | % | 100.00 | % | ASSET MANAGEMENT | ||||||||
Santander Asset Management Distribuidora de Títulos e Valores Mobiliários Ltda. (d) | Brazil | 0.00 | % | 0.00 | % | 0.00 | % | ASSET MANAGEMENT | ||||||||
Santander Asset Management Ireland, Ltd. (b) | Ireland | 0.00 | % | 100.00 | % | 100.00 | % | FUND MANAGEMENT COMPANY | ||||||||
Santander Asset Management Luxembourg, S.A. | Luxembourg | 0.00 | % | 100.00 | % | 100.00 | % | FUND MANAGEMENT COMPANY | ||||||||
Santander Asset Management S.A. Administradora General de Fondos | Chile | 0.00 | % | 67.02 | % | 100.00 | % | FUND MANAGEMENT COMPANY | ||||||||
Santander Asset Management UK Holdings Limited | United Kingdom | 0.00 | % | 100.00 | % | 100.00 | % | HOLDING COMPANY | ||||||||
Santander Asset Management UK Limited | United Kingdom | 0.00 | % | 100.00 | % | 100.00 | % | FUND AND PORTFOLIO MANAGER | ||||||||
Santander Asset Management, S.A., S.G.I.I.C. | Spain | 28.30 | % | 71.70 | % | 100.00 | % | FUND MANAGEMENT COMPANY | ||||||||
Santander Back-Offices Globales Especializados, S.A. | Spain | 99.99 | % | 0.01 | % | 100.00 | % | SERVICES | ||||||||
Santander Back-Offices Globales Mayoristas, S.A. | Spain | 100.00 | % | 0.00 | % | 100.00 | % | SERVICES | ||||||||
Santander BanCorp | Puerto Rico | 0.00 | % | 100.00 | % | 100.00 | % | HOLDING COMPANY | ||||||||
Santander Banif Inmobiliario, F.I.I. | España | 65.75 | % | 30.97 | % | 97.81 | % | PROPERTY | ||||||||
Santander Bank & Trust Ltd. | Bahamas | 0.00 | % | 100.00 | % | 100.00 | % | BANKING | ||||||||
Santander Benelux, S.A./N.V. | Belgium | 83.20 | % | 16.80 | % | 100.00 | % | BANKI NG | ||||||||
F-270
| % of ownership held by the Bank | % of voting | |||||||||||||||
Company | Location | Direct | Indirect | power (c) | Line of business | |||||||||||
Santander Brasil Administradora de Consórcio Ltda. | Brazil | 0.00 | % | 81.53 | % | 100.00 | % | SERVICES | ||||||||
Santander Brasil Arrendamento Mercantil S.A. (d) | Brazil | 0.00 | % | 0.00 | % | 0.00 | % | LEASING | ||||||||
Santander Brasil Asset Management Distribuidora de Títulos e Valores Mobiliários S.A. | Brazil | 0.00 | % | 81.53 | % | 100.00 | % | ASSET MANAGEMENT | ||||||||
Santander Brasil S.A. Corretora de Títulos e Valores Mobiliários (d) | Brazil | 0.00 | % | 0.00 | % | 0.00 | % | BROKER-DEALER | ||||||||
Santander Capital Desarrollo, SGECR, S.A. | Spain | 100.00 | % | 0.00 | % | 100.00 | % | VENTURE CAPITAL COMPANY | ||||||||
Santander Capital Structuring, S.A. de C.V. | Mexico | 0.00 | % | 100.00 | % | 100.00 | % | COMMERCE | ||||||||
Santander Capitalização S.A. | Brazil | 0.00 | % | 81.53 | % | 100.00 | % | INSURANCE | ||||||||
Santander Carbón Finance, S.A. | Spain | 99.98 | % | 0.02 | % | 100.00 | % | SECURITIES INVESTMENT | ||||||||
Santander Cards Ireland Limited | Ireland | 0.00 | % | 100.00 | % | 100.00 | % | CARDS | ||||||||
Santander Cards Limited | United Kingdom | 0.00 | % | 100.00 | % | 100.00 | % | FINANCIAL SERVICES | ||||||||
Santander Cards UK Limited | United Kingdom | 0.00 | % | 100.00 | % | 100.00 | % | FINANCE | ||||||||
Santander Carteras, S.G.C., S.A. | Spain | 0.00 | % | 100.00 | % | 100.00 | % | FUND MANAGEMENT COMPANY | ||||||||
Santander Central Hispano Financial Services Limited | Cayman Islands | 100.00 | % | 0.00 | % | 100.00 | % | FINANCE | ||||||||
Santander Central Hispano International Limited | Cayman Islands | 100.00 | % | 0.00 | % | 100.00 | % | FINANCE | ||||||||
Santander Central Hispano Issuances Limited | Cayman Islands | 100.00 | % | 0.00 | % | 100.00 | % | FINANCE | ||||||||
Santander Chile Holding S.A. | Chile | 22.11 | % | 77.43 | % | 99.54 | % | HOLDING COMPANY | ||||||||
Santander CHP S.A. | Brazil | 0.00 | % | 78.73 | % | 96.56 | % | MANAGEMENT COMPANY | ||||||||
Santander Commercial Paper, S.A. Sole-Shareholder Company | Spain | 100.00 | % | 0.00 | % | 100.00 | % | FINANCE | ||||||||
Santander Consulting (Beijing) Co., Ltd. | China | 0.00 | % | 100.00 | % | 100.00 | % | ADVISORY SERVICES | ||||||||
Santander Consumer (UK) plc | United Kingdom | 0.00 | % | 100.00 | % | 100.00 | % | ADVISORY SERVICES | ||||||||
Santander Consumer Bank AG | Germany | 0.00 | % | 100.00 | % | 100.00 | % | BANKING | ||||||||
Santander Consumer Bank AS | Norway | 0.00 | % | 100.00 | % | 100.00 | % | FINANCE | ||||||||
Santander Consumer Bank GmbH | Austria | 0.00 | % | 100.00 | % | 100.00 | % | FINANCE | ||||||||
Santander Consumer Bank S.p.A. | Italy | 0.00 | % | 100.00 | % | 100.00 | % | FINANCE | ||||||||
Santander Consumer Bank Spólka Akcyjna | Poland | 0.00 | % | 70.00 | % | 70.00 | % | BANKING | ||||||||
Santander Consumer Beteiligungsverwaltungsgesellschaft mbH | Germany | 0.00 | % | 100.00 | % | 100.00 | % | HOLDING COMPANY | ||||||||
Santander Consumer Chile S.A. | Chile | 51.00 | % | 0.00 | % | 51.00 | % | FINANCE | ||||||||
Santander Consumer Credit Services Limited | United Kingdom | 0.00 | % | 100.00 | % | 100.00 | % | FINANCE | ||||||||
Santander Consumer Debit GmbH | Germany | 0.00 | % | 100.00 | % | 100.00 | % | SERVICES | ||||||||
Santander Consumer Finance a.s. | Czech Republic | 0.00 | % | 100.00 | % | 100.00 | % | LEASING | ||||||||
Santander Consumer Finance Benelux B.V. | The Netherlands | 0.00 | % | 100.00 | % | 100.00 | % | FINANCE | ||||||||
Santander Consumer Finance Media S.r.l. | Italy | 0.00 | % | 65.00 | % | 65.00 | % | FINANCE | ||||||||
Santander Consumer Finance Oy | Finland | 0.00 | % | 100.00 | % | 100.00 | % | FINANCE | ||||||||
F-271
| % of ownership held by the Bank | % of voting | |||||||||||||||
Company | Location | Direct | Indirect | power (c) | Line of business | |||||||||||
Santander Consumer Finance Zrt. | Hungary | 0.00 | % | 100.00 | % | 100.00 | % | FINANCE | ||||||||
Santander Consumer Finance, S.A. | Spain | 63.19 | % | 36.81 | % | 100.00 | % | BANKING | ||||||||
Santander Consumer Finanse Spólka Akcyjna | Poland | 0.00 | % | 100.00 | % | 100.00 | % | SERVICES | ||||||||
Santander Consumer Holding Austria GmbH | Austria | 0.00 | % | 100.00 | % | 100.00 | % | HOLDING COMPANY | ||||||||
Santander Consumer Holding GmbH | Germany | 0.00 | % | 100.00 | % | 100.00 | % | HOLDING COMPANY | ||||||||
Santander Consumer Leasing GmbH | Germany | 0.00 | % | 100.00 | % | 100.00 | % | LEASING | ||||||||
Santander Consumer Leasing s.r.o. | Czech Republic | 0.00 | % | 100.00 | % | 100.00 | % | FINANCE | ||||||||
Santander Consumer Multirent Spółka z ograniczoną odpowiedzialnością | Poland | 0.00 | % | 70.00 | % | 100.00 | % | LEASING | ||||||||
Santander Consumer Renting, S.L. | Spain | 0.00 | % | 100.00 | % | 100.00 | % | FULL-SERVICE LEASING | ||||||||
Santander Consumer Services GmbH | Austria | 0.00 | % | 100.00 | % | 100.00 | % | SERVICES | ||||||||
Santander Consumer, EFC, S.A. | Spain | 0.00 | % | 100.00 | % | 100.00 | % | FINANCE | ||||||||
Santander Consumo, S.A. de C.V., SOFOM, E.R. | Mexico | 0.00 | % | 99.86 | % | 100.00 | % | CARDS | ||||||||
Santander Corredora de Seguros Limitada | Chile | 0.00 | % | 67.10 | % | 100.00 | % | INSURANCE BROKER | ||||||||
Santander Corretora de Câmbio e Valores Mobiliários S.A. | Brazil | 0.00 | % | 81.53 | % | 100.00 | % | BROKER-DEALER | ||||||||
Santander de Titulización S.G.F.T., S.A. | Spain | 81.00 | % | 19.00 | % | 100.00 | % | FUND MANAGEMENT COMPANY | ||||||||
Santander Energías Renovables I, SCR de Régimen Simplificado, S.A. | Spain | 56.76 | % | 0.00 | % | 56.76 | % | VENTURE CAPITAL COMPANY | ||||||||
Santander Envíos, S.A. | Spain | 100.00 | % | 0.00 | % | 100.00 | % | TRANSFER OF FUNDS FOR IMMIGRANTS | ||||||||
Santander Estates Limited | United Kingdom | 0.00 | % | 100.00 | % | 100.00 | % | PROPERTY | ||||||||
Santander Factoring S.A. | Chile | 0.00 | % | 99.54 | % | 100.00 | % | FACTORING | ||||||||
Santander Factoring y Confirming, S.A., E.F.C. | Spain | 100.00 | % | 0.00 | % | 100.00 | % | FACTORING | ||||||||
Santander Financial Exchanges Limited | United Kingdom | 100.00 | % | 0.00 | % | 100.00 | % | FINANCE | ||||||||
Santander Financial Products plc | Ireland | 0.00 | % | 100.00 | % | 100.00 | % | FINANCE | ||||||||
Santander Financial Services, Inc. | Puerto Rico | 0.00 | % | 100.00 | % | 100.00 | % | LENDING COMPANY | ||||||||
Santander GBM Secured Financing Limited | Ireland | — | (a | ) | — | SECURITIZATION | ||||||||||
Santander Gestão de Activos, SGPS, S.A. | Portugal | 0.00 | % | 99.75 | % | 100.00 | % | HOLDING COMPANY | ||||||||
Santander Gestión de Recaudación y Cobranzas Ltda. | Chile | 0.00 | % | 99.54 | % | 100.00 | % | FINANCIAL SERVICES | ||||||||
Santander Gestión Inmobiliaria, S.A. | Spain | 0.01 | % | 99.99 | % | 100.00 | % | PROPERTY | ||||||||
Santander Getnet Serviços para Meios de Pagamento S.A. | Brazil | 0.00 | % | 40.76 | % | 50.00 | % | SERVICES | ||||||||
Santander Global Consumer Finance Limited | United Kingdom | 0.00 | % | 100.00 | % | 100.00 | % | FINANCE | ||||||||
Santander Global Facilities, S.A. de C.V. | Mexico | 100.00 | % | 0.00 | % | 100.00 | % | PROPERTY MANAGEMENT | ||||||||
Santander Global Facilities, S.L. | Spain | 100.00 | % | 0.00 | % | 100.00 | % | HOLDING COMPANY | ||||||||
Santander Global Property Alemania GmbH | Germany | 0.00 | % | 100.00 | % | 100.00 | % | SERVICES | ||||||||
Santander Global Property México, S.A. de C.V. | Mexico | 0.00 | % | 100.00 | % | 100.00 | % | PROPERTY | ||||||||
F-272
| % of ownership held by the Bank | % of voting | |||||||||||||||
Company | Location | Direct | Indirect | power (c) | Line of business | |||||||||||
Santander Global Property U.S.A., Inc. | United States | 0.00 | % | 100.00 | % | 100.00 | % | SERVICES | ||||||||
Santander Global Property, S.L. | Spain | 97.21 | % | 2.79 | % | 100.00 | % | SECURITIES INVESTMENT | ||||||||
Santander Global Services, S.A. (b) | Uruguay | 0.00 | % | 100.00 | % | 100.00 | % | SERVICES | ||||||||
Santander Global Sport, S.A. | Spain | 100.00 | % | 0.00 | % | 100.00 | % | SPORTS OPERATIONS | ||||||||
Santander Guarantee Company | United Kingdom | 0.00 | % | 100.00 | % | 100.00 | % | LEASING | ||||||||
Santander Hipotecario 1 Fondo de Titulización de Activos | Spain | — | (a | ) | — | SECURITIZATION | ||||||||||
Santander Hipotecario 2 Fondo de Titulización de Activos | Spain | — | (a | ) | — | SECURITIZATION | ||||||||||
Santander Hipotecario 3 Fondo de Titulización de Activos | Spain | — | (a | ) | — | SECURITIZATION | ||||||||||
Santander Hipotecario 4 Fondo de Titulización de Activos | Spain | — | (a | ) | — | SECURITIZATION | ||||||||||
Santander Hipotecario 5, Fondo de Titulización de Activos | Spain | — | (a | ) | — | SECURITIZATION | ||||||||||
Santander Hipotecario, S.A. de C.V., SOFOM, E.R. | Mexico | 0.00 | % | 99.86 | % | 100.00 | % | FINANCE | ||||||||
Santander Holanda B.V. | The Netherlands | 100.00 | % | 0.00 | % | 100.00 | % | HOLDING COMPANY | ||||||||
Santander Holding Internacional, S.A. | Spain | 99.95 | % | 0.05 | % | 100.00 | % | HOLDING COMPANY | ||||||||
Santander Holding Vivienda, S.A. de C.V. | Mexico | 0.00 | % | 99.86 | % | 100.00 | % | SERVICES | ||||||||
Santander Holdings USA, Inc. | United States | 100.00 | % | 0.00 | % | 100.00 | % | HOLDING COMPANY | ||||||||
Santander Insurance Agency, Inc. | Puerto Rico | 0.00 | % | 100.00 | % | 100.00 | % | INSURANCE BROKER | ||||||||
Santander Insurance Agency, U.S., LLC | United States | 0.00 | % | 100.00 | % | 100.00 | % | INSURANCE | ||||||||
Santander Insurance Europe Limited | Ireland | 0.00 | % | 100.00 | % | 100.00 | % | INSURANCE BROKER | ||||||||
Santander Insurance Holding, S.L. | Spain | 99.99 | % | 0.01 | % | 100.00 | % | HOLDING COMPANY | ||||||||
Santander Insurance Life Limited | Ireland | 0.00 | % | 100.00 | % | 100.00 | % | INSURANCE BROKER | ||||||||
Santander Insurance Services Ireland Limited | Ireland | 0.00 | % | 100.00 | % | 100.00 | % | SERVICES | ||||||||
Santander Insurance Services UK Limited | United Kingdom | 0.00 | % | 100.00 | % | 100.00 | % | ASSET MANAGEMENT COMPANY | ||||||||
Santander Intermediación Correduría de Seguros, S.A. | Spain | 0.00 | % | 100.00 | % | 100.00 | % | INSURANCE BROKER | ||||||||
Santander International Debt, S.A. Sole-Shareholder Company | Spain | 100.00 | % | 0.00 | % | 100.00 | % | FINANCE | ||||||||
Santander Inversiones Limitada | Chile | 0.00 | % | 100.00 | % | 100.00 | % | HOLDING COMPANY | ||||||||
Santander Investimentos em Participações S.A. (d) | Brazil | 0.00 | % | 0.00 | % | 0.00 | % | COLLECTION AND PAYMENT SERVICES | ||||||||
Santander Investment Bank Limited | Bahamas | 0.00 | % | 100.00 | % | 100.00 | % | BANKING | ||||||||
Santander Investment Bolsa, S.V., S.A. | Spain | 0.00 | % | 100.00 | % | 100.00 | % | BROKER-DEALER | ||||||||
Santander Investment Chile Limitada | Chile | 0.00 | % | 100.00 | % | 100.00 | % | FINANCE | ||||||||
Santander Investment Colombia S.A. | Colombia | 0.00 | % | 100.00 | % | 100.00 | % | HOLDING COMPANY | ||||||||
Santander Investment I, S.A. | Spain | 100.00 | % | 0.00 | % | 100.00 | % | HOLDING COMPANY | ||||||||
Santander Investment Limited | Bahamas | 0.00 | % | 100.00 | % | 100.00 | % | BROKER-DEALER | ||||||||
Santander Investment Securities Inc. | United States | 0.00 | % | 100.00 | % | 100.00 | % | BROKER-DEALER | ||||||||
Santander Investment Trust Colombia S.A., Sociedad Fiduciaria | Colombia | 0.00 | % | 100.00 | % | 100.00 | % | FUND MANAGEMENT COMPANY | ||||||||
F-273
| % of ownership held by the Bank | % of voting | |||||||||||||||
Company | Location | Direct | Indirect | power (c) | Line of business | |||||||||||
Santander Investment Valores Colombia S.A., Comisionista de Bolsa Comercial | Colombia | 0.00 | % | 97.96 | % | 100.00 | % | BROKER-DEALER | ||||||||
Santander Investment, S.A. | Spain | 100.00 | % | 0.00 | % | 100.00 | % | BANKING | ||||||||
Santander ISA Managers Limited | United Kingdom | 0.00 | % | 100.00 | % | 100.00 | % | FUND AND PORTFOLIO MANAGER | ||||||||
Santander Issuances, S.A. Sole-Shareholder Company | Spain | 100.00 | % | 0.00 | % | 100.00 | % | FINANCE | ||||||||
Santander Lease, S.A., E.F.C. | Spain | 70.00 | % | 30.00 | % | 100.00 | % | LEASING | ||||||||
Santander Leasing S.A. Arrendamento Mercantil | Brazil | 0.00 | % | 81.52 | % | 99.99 | % | LEASING | ||||||||
Santander Limited | United Kingdom | 0.00 | % | 100.00 | % | 100.00 | % | HOLDING COMPANY | ||||||||
Santander Mediación Operador de Banca-Seguros Vinculado, S.A. | Spain | 21.00 | % | 75.97 | % | 100.00 | % | INSURANCE BROKERAGE | ||||||||
Santander Merchant S.A. | Argentina | 0.00 | % | 100.00 | % | 100.00 | % | HOLDING COMPANY | ||||||||
Santander Microcrédito Assessoria Financeira S.A. | Brazil | 0.00 | % | 81.53 | % | 100.00 | % | FINANCIAL SERVICES | ||||||||
Santander Operaciones Retail, S.A. | Spain | 0.00 | % | 100.00 | % | 100.00 | % | SERVICES | ||||||||
Santander Overseas Bank, Inc. | Puerto Rico | 0.00 | % | 100.00 | % | 100.00 | % | BANKING | ||||||||
Santander PB UK (Holdings) Limited | United Kingdom | 0.00 | % | 100.00 | % | 100.00 | % | FINANCE | ||||||||
Santander Pensiones, S.A., E.G.F.P. | Spain | 21.20 | % | 78.80 | % | 100.00 | % | PENSION FUND MANAGEMENT COMPANY | ||||||||
Santander Pensões—Sociedade Gestora de Fundos de Pensões, S.A. | Portugal | 0.00 | % | 99.75 | % | 100.00 | % | PENSION FUND MANAGEMENT COMPANY | ||||||||
Santander Perpetual, S.A. Sole-Shareholder Company | Spain | 100.00 | % | 0.00 | % | 100.00 | % | FINANCE | ||||||||
Santander Portfolio Management UK Limited | United Kingdom | 0.00 | % | 100.00 | % | 100.00 | % | FINANCE | ||||||||
Santander Private Banking s.p.a. | Italy | 100.00 | % | 0.00 | % | 100.00 | % | BANKING | ||||||||
Santander Private Banking UK Limited | United Kingdom | 0.00 | % | 100.00 | % | 100.00 | % | PROPERTY | ||||||||
Santander Private Equity, S.A., S.G.E.C.R. | Spain | 90.00 | % | 9.97 | % | 100.00 | % | VENTURE CAPITAL MANAGEMENT COMPANY | ||||||||
Santander Private Real Estate Advisory, S.A. Sole-Shareholder Company | Spain | 0.00 | % | 100.00 | % | 100.00 | % | PROPERTY | ||||||||
Santander Real Estate, S.G.I.I.C., S.A. | Spain | 0.00 | % | 100.00 | % | 100.00 | % | FUND MANAGEMENT COMPANY | ||||||||
Santander Río Asset Management Gerente de Fondos Comunes de Inversión S.A. | Argentina | 0.00 | % | 100.00 | % | 100.00 | % | FUND MANAGEMENT COMPANY | ||||||||
Santander Río Servicios S.A. | Argentina | 0.00 | % | 99.97 | % | 100.00 | % | ADVISORY SERVICES | ||||||||
Santander Río Sociedad de Bolsa S.A. | Argentina | 0.00 | % | 99.34 | % | 100.00 | % | BROKER-DEALER | ||||||||
Santander Río Trust S.A. | Argentina | 0.00 | % | 99.97 | % | 100.00 | % | SERVICES | ||||||||
Santander S.A.—Corretora de Câmbio e Títulos (d) | Brazil | 0.00 | % | 0.00 | % | 0.00 | % | BROKER-DEALER | ||||||||
F-274
| % of ownership held by the Bank | % of voting | |||||||||||||||
Company | Location | Direct | Indirect | power (c) | Line of business | |||||||||||
| Santander S.A. - Serviços Técnicos, Administrativos e de Corretagem de Seguros | Brazil | 0.00 | % | 81.53 | % | 100.00 | % | INSURANCE BROKER | ||||||||
Santander S.A. Corredores de Bolsa | Chile | 0.00 | % | 83.18 | % | 100.00 | % | BROKER-DEALER | ||||||||
Santander S.A. Sociedad Securitizadora | Chile | 0.00 | % | 67.13 | % | 100.00 | % | FUND MANAGEMENT COMPANY | ||||||||
Santander Securities (Brasil) Corretora de Valores Mobiliários S.A. (d) | Brazil | 0.00 | % | 0.00 | % | 0.00 | % | BROKER-DEALER | ||||||||
Santander Securities Corporation | Puerto Rico | 0.00 | % | 100.00 | % | 100.00 | % | BROKER-DEALER | ||||||||
Santander Seguros y Reaseguros, Compañía Aseguradora, S.A. | Spain | 0.00 | % | 97.32 | % | 100.00 | % | INSURANCE | ||||||||
Santander Service GmbH | Germany | 0.00 | % | 100.00 | % | 100.00 | % | SERVICES | ||||||||
Santander Servicios Corporativos, S.A. de C.V. | Mexico | 0.00 | % | 99.86 | % | 100.00 | % | SERVICES | ||||||||
Santander Servicios de Recaudación y Pagos Limitada | Chile | 0.00 | % | 67.01 | % | 100.00 | % | SERVICES | ||||||||
Santander Servicios Especializados, S.A. de C.V. | Mexico | 0.00 | % | 99.86 | % | 100.00 | % | FINANCIAL SERVICES | ||||||||
Santander Tecnología y Operaciones A.E.I.E. | Spain | — | (a | ) | — | SERVICES | ||||||||||
Santander Totta Seguros, Companhia de Seguros de Vida, S.A. | Portugal | 0.00 | % | 99.87 | % | 100.00 | % | INSURANCE | ||||||||
Santander Totta, SGPS, S.A. | Portugal | 0.00 | % | 99.87 | % | 99.87 | % | HOLDING COMPANY | ||||||||
Santander Trade Services Limited | Hong-Kong | 0.00 | % | 100.00 | % | 100.00 | % | SERVICES | ||||||||
Santander UK Foundation Limited | United Kingdom | — | (a | ) | — | SECURITIZATION | ||||||||||
Santander UK Investments | United Kingdom | 100.00 | % | 0.00 | % | 100.00 | % | LEASING | ||||||||
Santander UK Loans Limited | United Kingdom | 0.00 | % | 100.00 | % | 100.00 | % | FINANCE | ||||||||
Santander UK plc | United Kingdom | 77.67 | % | 22.33 | % | 100.00 | % | BANKING | ||||||||
Santander Unit Trust Managers UK Limited | United Kingdom | 0.00 | % | 100.00 | % | 100.00 | % | FUND AND PORTFOLIO MANAGER | ||||||||
Santander US Debt, S.A. Sole-Shareholder Company | Spain | 100.00 | % | 0.00 | % | 100.00 | % | FINANCE | ||||||||
Santander Venezuela Sociedad Administradora de Entidades de Inversión Colectiva, C.A. | Venezuela | 0.00 | % | 90.00 | % | 100.00 | % | FUND MANAGEMENT COMPANY | ||||||||
Santos Energia Participações S.A. | Brazil | 0.00 | % | 81.52 | % | 99.99 | % | HOLDING COMPANY | ||||||||
Santotta-Internacional, SGPS, Sociedade Unipessoal, Lda. | Portugal | 0.00 | % | 99.75 | % | 100.00 | % | HOLDING COMPANY | ||||||||
Santusa Holding, S.L. | Spain | 69.76 | % | 30.24 | % | 100.00 | % | HOLDING COMPANY | ||||||||
Saturn Japan II Sub C.V. | The Netherlands | 0.00 | % | 69.30 | % | 0.00 | % | HOLDING COMPANY | ||||||||
Saturn Japan III Sub C.V. | The Netherlands | 0.00 | % | 72.71 | % | 0.00 | % | HOLDING COMPANY | ||||||||
SC Germany Auto 08-2 Limited | Ireland | — | (a | ) | — | SECURITIZATION | ||||||||||
SC Germany Auto 2009-1 Limited | Ireland | — | (a | ) | — | SECURITIZATION | ||||||||||
SC Germany Auto 2010-1 UG (haftungsbeschränkt) | Germany | — | (a | ) | — | SECURITIZATION | ||||||||||
SC Germany Auto 2011-1 UG (haftungsbeschränkt) | Germany | — | (a | ) | — | SECURITIZATION | ||||||||||
SC Germany Auto 2011-2 UG (haftungsbeschränkt) | Germany | — | (a | ) | — | SECURITIZATION | ||||||||||
SC Germany Consumer 08-1 Limited | Ireland | — | (a | ) | — | SECURITIZATION | ||||||||||
SC Germany Consumer 09-1 Limited | Ireland | — | (a | ) | — | SECURITIZATION | ||||||||||
SC Germany Consumer 10-1 Limited | Ireland | — | (a | ) | — | SECURITIZATION | ||||||||||
F-275
| % of ownership held by the Bank | % of voting | |||||||||||||||
Company | Location | Direct | Indirect | power (c) | Line of business | |||||||||||
SC Germany Consumer 11 -1 Limited | Ireland | — | (a | ) | — | SECURITIZATION | ||||||||||
SC Private Cars 2010-1 Limited | Ireland | — | (a | ) | — | SECURITIZATION | ||||||||||
SCI BANBY PRO | France | 0.00 | % | 90.00 | % | 100.00 | % | PROPERTY | ||||||||
Scottish Mutual Pensions Limited | United Kingdom | 0.00 | % | 100.00 | % | 100.00 | % | FINANCE | ||||||||
Serfin International Bank and Trust, Limited | Cayman Islands | 0.00 | % | 99.75 | % | 100.00 | % | BANKING | ||||||||
Services and Promotions Delaware Corporation | United States | 0.00 | % | 100.00 | % | 100.00 | % | HOLDING COMPANY | ||||||||
Services and Promotions Miami LLC | United States | 0.00 | % | 100.00 | % | 100.00 | % | PROPERTY | ||||||||
Servicio de Alarmas Controladas por Ordenador, S.A. | Spain | 99.99 | % | 0.01 | % | 100.00 | % | SECURITY | ||||||||
Servicios Administrativos y Financieros Ltda. | Chile | 0.00 | % | 100.00 | % | 100.00 | % | SERVICES | ||||||||
Servicios Corporativos Seguros Serfin, S.A. de C.V. (b) | Mexico | 0.00 | % | 100.00 | % | 100.00 | % | SERVICES | ||||||||
Servicios de Cobranza, Recuperación y Seguimiento, S.A. de C.V. | Mexico | 0.00 | % | 100.00 | % | 100.00 | % | SERVICES | ||||||||
Servicios de Cobranzas Fiscalex Ltda. | Chile | 0.00 | % | 99.54 | % | 100.00 | % | SERVICES | ||||||||
Servicios Universia Venezuela S.U.V., S.A. (b) | Venezuela | 0.00 | % | 82.99 | % | 82.99 | % | INTERNET | ||||||||
Sheppards Moneybrokers Limited | United Kingdom | 0.00 | % | 99.99 | % | 100.00 | % | ADVISORY SERVICES | ||||||||
Silk Finance No. 3 Limited | Ireland | — | (a | ) | — | SECURITIZATION | ||||||||||
Sinvest Inversiones y Asesorías Limitada | Chile | 0.00 | % | 100.00 | % | 100.00 | % | FINANCE | ||||||||
Sistema 4B, S.A. | Spain | 52.79 | % | 13.34 | % | 67.67 | % | CARDS | ||||||||
Sociedad Integral de Valoraciones Automatizadas, S.A. | Spain | 100.00 | % | 0.00 | % | 100.00 | % | APPRAISALS | ||||||||
Socur, S.A. | Uruguay | 100.00 | % | 0.00 | % | 100.00 | % | FINANCE | ||||||||
Sodepro, S.A. | Spain | 0.00 | % | 89.71 | % | 100.00 | % | FINANCE | ||||||||
Solarlaser Limited | United Kingdom | 0.00 | % | 100.00 | % | 100.00 | % | PROPERTY | ||||||||
SOV APEX LLC | United States | 0.00 | % | 100.00 | % | 100.00 | % | HOLDING COMPANY | ||||||||
Sovereign Bank | United States | 0.00 | % | 100.00 | % | 100.00 | % | BANKING | ||||||||
Sovereign Capital Trust IV | United States | 0.00 | % | 100.00 | % | 100.00 | % | FINANCE | ||||||||
Sovereign Capital Trust IX | United States | 0.00 | % | 100.00 | % | 100.00 | % | FINANCE | ||||||||
Sovereign Capital Trust V | United States | 0.00 | % | 100.00 | % | 100.00 | % | FINANCE | ||||||||
Sovereign Capital Trust VI | United States | 0.00 | % | 100.00 | % | 100.00 | % | FINANCE | ||||||||
Sovereign Community Development Company | United States | 0.00 | % | 100.00 | % | 100.00 | % | HOLDING COMPANY | ||||||||
Sovereign Delaware Investment Corporation | United States | 0.00 | % | 100.00 | % | 100.00 | % | HOLDING COMPANY | ||||||||
Sovereign Leasing, LLC | United States | 0.00 | % | 100.00 | % | 100.00 | % | LEASING | ||||||||
Sovereign Precious Metals, LLC | United States | 0.00 | % | 100.00 | % | 100.00 | % | PURCHASE AND SALE OF PRECIOUS METALS | ||||||||
Sovereign REIT Holdings, Inc. | United States | 0.00 | % | 100.00 | % | 100.00 | % | HOLDING COMPANY | ||||||||
Sovereign Securities Corporation, LLC | United States | 0.00 | % | 100.00 | % | 100.00 | % | BROKER-DEALER | ||||||||
Sovereign Spirit Limited (e) | Bermuda | 0.00 | % | 100.00 | % | 100.00 | % | LEASING | ||||||||
Sterrebeeck B.V. | The Netherlands | 100.00 | % | 0.00 | % | 100.00 | % | HOLDING COMPANY | ||||||||
| Suleyado 2003, S.L. | Spain | 0.00 | % | 100.00 | % | 100.00 | % | SECURITIES INVESTMENT | ||||||||
F-276
| % of ownership held by the Bank | % of voting | |||||||||||||||
Company | Location | Direct | Indirect | power (c) | Line of business | |||||||||||
Suzuki Servicios Financieros, S.L. | Spain | 0.00 | % | 51.00 | % | 51.00 | % | INTERMEDIATION | ||||||||
Swesant SA | Switzerland | 0.00 | % | 100.00 | % | 100.00 | % | HOLDING COMPANY | ||||||||
Synergy Abstract, LP | United States | 0.00 | % | 70.00 | % | 70.00 | % | INSURANCE | ||||||||
Task Moraza, S.L. | Spain | 0.00 | % | 73.22 | % | 73.22 | % | HOLDING COMPANY | ||||||||
Taxagest Sociedade Gestora de Participações Sociais, S.A. | Portugal | 0.00 | % | 99.75 | % | 100.00 | % | HOLDING COMPANY | ||||||||
Teatinos Siglo XXI Inversiones Limitada | Chile | 50.00 | % | 50.00 | % | 100.00 | % | HOLDING COMPANY | ||||||||
Teylada, S.A. in liquidation (b) | Spain | 11.11 | % | 88.89 | % | 100.00 | % | SECURITIES INVESTMENT | ||||||||
The Alliance & Leicester Corporation Limited | United Kingdom | 0.00 | % | 100.00 | % | 100.00 | % | PROPERTY | ||||||||
The HSH AIV 4 Trust | United States | 0.00 | % | 69.83 | % | 4.99 | % | HOLDING COMPANY | ||||||||
The JCF HRE AIV II-A Trust (b) | United States | 0.00 | % | 73.70 | % | 4.99 | % | HOLDING COMPANY | ||||||||
The National & Provincial Building Society Pension Fund Trustees Limited | United Kingdom | — | (a | ) | — | ASSET MANAGEMENT COMPANY | ||||||||||
The Prepaid Card Company Limited | United Kingdom | 0.00 | % | 80.00 | % | 80.00 | % | FINANCE | ||||||||
Time Finance Limited | United Kingdom | 0.00 | % | 100.00 | % | 100.00 | % | SERVICES | ||||||||
Time Retail Finance Limited | United Kingdom | 0.00 | % | 100.00 | % | 100.00 | % | SERVICES | ||||||||
Títulos de Renta Fija, S.A. | Spain | 100.00 | % | 0.00 | % | 100.00 | % | SECURITIES INVESTMENT | ||||||||
Tonopah Solar I LLC | United States | 0.00 | % | 100.00 | % | 100.00 | % | ELECTRICITY PRODUCTION | ||||||||
Tornquist Asesores de Seguros S.A. (b) | Argentina | 0.00 | % | 99.99 | % | 99.99 | % | ADVISORY SERVICES | ||||||||
Totta & Açores Inc. Newark | United States | 0.00 | % | 99.75 | % | 100.00 | % | BANKING | ||||||||
Totta (Ireland), PLC | Ireland | 0.00 | % | 99.75 | % | 100.00 | % | FINANCE | ||||||||
Totta Consumer No.1 | Portugal | — | (a | ) | — | SECURITIZATION | ||||||||||
Totta Urbe—Empresa de Administração e Construções, S.A. | Portugal | 0.00 | % | 99.75 | % | 100.00 | % | PROPERTY | ||||||||
Tuttle & Son Limited | United Kingdom | 0.00 | % | 100.00 | % | 100.00 | % | COLLECTION AND PAYMENT SERVICES | ||||||||
UNIFIN S.p.A. | Italy | 0.00 | % | 100.00 | % | 100.00 | % | FINANCE | ||||||||
Universia Brasil S.A. | Brazil | 0.00 | % | 100.00 | % | 100.00 | % | INTERNET | ||||||||
Universia Chile S.A. | Chile | 0.00 | % | 83.29 | % | 83.29 | % | INTERNET | ||||||||
Universia Colombia S.A.S. | Colombia | 0.00 | % | 99.98 | % | 99.98 | % | INTERNET | ||||||||
Universia Holding, S.L. | Spain | 99.99 | % | 0.01 | % | 100.00 | % | HOLDING COMPANY | ||||||||
Universia México, S.A. de C.V. | Mexico | 0.00 | % | 100.00 | % | 100.00 | % | INTERNET | ||||||||
Universia Perú, S.A. | Peru | 0.00 | % | 70.82 | % | 70.82 | % | INTERNET | ||||||||
Universia Puerto Rico, Inc. | Puerto Rico | 0.00 | % | 100.00 | % | 100.00 | % | INTERNET | ||||||||
Valores Santander Casa de Bolsa, C.A. | Venezuela | 0.00 | % | 90.00 | % | 90.00 | % | BROKER-DEALER | ||||||||
F-277
| % of ownership held by the Bank | % of voting | % of ownership held by the Bank | % of voting power (c) | |||||||||||||||||||||||||||||||||
Company | Location | Direct | Indirect | power (c) | Line of business | Location | Direct | Indirect | 2013 | 2012 | Line of business | |||||||||||||||||||||||||
Victoria Solar Casteluccia S.r.l. | Italy | 0.00 | % | 99.04 | % | 99.04 | % | ELECTRICITY PRODUCTION | ||||||||||||||||||||||||||||
Títulos de Renta Fija, S.A. | Spain | 100.00 | % | 0.00 | % | 100.00 | % | 100.00 | % | SECURITIES INVESTMENT | ||||||||||||||||||||||||||
Tonopah Solar I LLC | United States | 0.00 | % | 100.00 | % | 100.00 | % | 100.00 | % | HOLDING COMPANY | ||||||||||||||||||||||||||
Tornquist Asesores de Seguros S.A. (b) | Argentina | 0.00 | % | 99.99 | % | 99.99 | % | 99.99 | % | ADVISORY SERVICES | ||||||||||||||||||||||||||
Totta & Açores Inc. Newark | United States | 0.00 | % | 99.79 | % | 100.00 | % | 100.00 | % | BANKING | ||||||||||||||||||||||||||
Totta (Ireland), PLC | Ireland | 0.00 | % | 99.79 | % | 100.00 | % | 100.00 | % | FINANCE | ||||||||||||||||||||||||||
Totta Urbe - Empresa de Administração e Construções, S.A. | Portugal | 0.00 | % | 99.79 | % | 100.00 | % | 100.00 | % | PROPERTY | ||||||||||||||||||||||||||
Trade Maps 3 Hong Kong Limited | Hong-Kong | — | (a) | — | — | SECURITIZATION | ||||||||||||||||||||||||||||||
Trade Maps 3 Ireland Limited | Ireland | — | (a) | — | — | SECURITIZATION | ||||||||||||||||||||||||||||||
Turyocio Viajes y Fidelización, S.A. (b) | Spain | 0.00 | % | 65.06 | % | 65.06 | % | 65.06 | % | TRAVEL | ||||||||||||||||||||||||||
Tuttle & Son Limited | United Kingdom | 0.00 | % | 100.00 | % | 100.00 | % | 100.00 | % | COLLECTION AND PAYMENT SERVICES | ||||||||||||||||||||||||||
Universal Support, S.A. | Spain | 0.00 | % | 51.86 | % | 100.00 | % | 100.00 | % | TELEMARKETING | ||||||||||||||||||||||||||
Universia Brasil S.A. | Brazil | 0.00 | % | 100.00 | % | 100.00 | % | 100.00 | % | INTERNET | ||||||||||||||||||||||||||
Universia Chile S.A. | Chile | 0.00 | % | 85.11 | % | 85.11 | % | 84.39 | % | INTERNET | ||||||||||||||||||||||||||
Universia Colombia S.A.S. | Colombia | 0.00 | % | 100.00 | % | 100.00 | % | 100.00 | % | INTERNET | ||||||||||||||||||||||||||
Universia Holding, S.L. | Spain | 100.00 | % | 0.00 | % | 100.00 | % | 100.00 | % | HOLDING COMPANY | ||||||||||||||||||||||||||
Universia México, S.A. de C.V. | Mexico | 0.00 | % | 100.00 | % | 100.00 | % | 100.00 | % | INTERNET | ||||||||||||||||||||||||||
Universia Perú, S.A. | Peru | 0.00 | % | 76.66 | % | 76.66 | % | 84.45 | % | INTERNET | ||||||||||||||||||||||||||
Universia Puerto Rico, Inc. | Puerto Rico | 0.00 | % | 100.00 | % | 100.00 | % | 100.00 | % | INTERNET | ||||||||||||||||||||||||||
Viking Collection Services Limited | United Kingdom | 0.00 | % | 100.00 | % | 100.00 | % | FINANCE | United Kingdom | 0.00 | % | 100.00 | % | 100.00 | % | 100.00 | % | FINANCE | ||||||||||||||||||
Vista Capital de Expansión, S.A. SGECR | Spain | 0.00 | % | 50.00 | % | 50.00 | % | VENTURE CAPITAL MANAGEMENT COMPANY | Spain | 0.00 | % | 50.00 | % | 50.00 | % | 50.00 | % | VENTURE CAPITAL MANAGEMENT COMPANY | ||||||||||||||||||
Vista Desarrollo, S.A. SCR de Régimen Simplificado | Spain | 100.00 | % | 0.00 | % | 100.00 | % | VENTURE CAPITAL COMPANY | Spain | 100.00 | % | 0.00 | % | 100.00 | % | 100.00 | % | VENTURE CAPITAL COMPANY | ||||||||||||||||||
W.N.P.H. Gestão e Investimentos Sociedade Unipessoal, S.A. | Portugal | 0.00 | % | 100.00 | % | 100.00 | % | SECURITIES INVESTMENT | Portugal | 0.00 | % | 100.00 | % | 100.00 | % | 100.00 | % | PORTFOLIO MANAGEMENT | ||||||||||||||||||
Wallcesa, S.A. | Spain | 100.00 | % | 0.00 | % | 100.00 | % | SECURITIES INVESTMENT | Spain | 100.00 | % | 0.00 | % | 100.00 | % | 100.00 | % | SECURITIES INVESTMENT | ||||||||||||||||||
Wandylaw Holdings Ltd | United Kingdom | 0.00 | % | 100.00 | % | 100.00 | % | — | HOLDING COMPANY | |||||||||||||||||||||||||||
Wandylaw Wind Farm Ltd | United Kingdom | 0.00 | % | 100.00 | % | 100.00 | % | — | ELECTRICITY PRODUCTION | |||||||||||||||||||||||||||
Waypoint Insurance Group, Inc. | United States | 0.00 | % | 100.00 | % | 100.00 | % | HOLDING COMPANY | United States | 0.00 | % | 100.00 | % | 100.00 | % | 100.00 | % | HOLDING COMPANY | ||||||||||||||||||
Webmotors S.A. | Brazil | 0.00 | % | 81.53 | % | 100.00 | % | SERVICES | ||||||||||||||||||||||||||||
Wex Point España, S.L. | Spain | 0.00 | % | 89.71 | % | 100.00 | % | SERVICES | ||||||||||||||||||||||||||||
Webcasas, S.A. | Brazil | 0.00 | % | 84.99 | % | 100.00 | % | — | INTERNET | |||||||||||||||||||||||||||
Whitewick Limited | Jersey | 0.00 | % | 100.00 | % | 100.00 | % | HOLDING COMPANY | Jersey | 0.00 | % | 100.00 | % | 100.00 | % | 100.00 | % | INACTIVE | ||||||||||||||||||
WIM Servicios Corporativos, S.A. de C.V. | Mexico | 0.00 | % | 100.00 | % | 100.00 | % | ADVISORY SERVICES | Mexico | 0.00 | % | 100.00 | % | 100.00 | % | 100.00 | % | ADVISORY SERVICES | ||||||||||||||||||
| (a) | Companies over which effective control is exercised. |
| (b) | Company in liquidation at December 31, |
| (c) | Pursuant to Article 3 of Royal Decree 1159/2010, of September 17, approving the rules for the preparation of consolidated financial statements, in order to determine voting power, the voting power relating to subsidiaries or to other persons acting in their own name but on behalf of Group companies was added to the voting power directly held by the Parent. For these purposes, the number of votes corresponding to the Parent in relation to companies over which it exercises indirect control is the number corresponding to each subsidiary holding a direct ownership interest in such companies. |
| (d) |
| (e) | Company resident in the UK for tax purposes. |
| (1) | The preference share issuer companies are detailed in Appendix III, together with other relevant information. |
F-278
Exhibit II
Companies in which Santander Group has ownership interests of more than 5% (b)(c), associates of Santander Group and jointly controlled entities
| % of ownership held by the Bank | % of voting | % of ownership held by the Bank | % of voting power (b) | |||||||||||||||||||||||||||||||||||
Company | Location | Direct | Indirect | power (a) | Line of business | Location | Direct | Indirect | 2013 | 2012 | Line of business | Type of company | ||||||||||||||||||||||||||
26 Rue Villiot S.A.S. | France | 0.00 | % | 35.00 | % | 50.00 | % | PROPERTY | France | 0.00 | % | 35.00 | % | 50.00 | % | 50.00 | % | PROPERTY | Jointly controlled entity | |||||||||||||||||||
3E1 Sp. z o.o | Poland | 0.00 | % | 12.26 | % | 21.60 | % | — | ELECTRICITY PRODUCTION | — | ||||||||||||||||||||||||||||
Administrador Financiero de Transantiago S.A. | Chile | 0.00 | % | 13.40 | % | 20.00 | % | PAYMENT AND COLLECTION SERVICES | Chile | 0.00 | % | 13.40 | % | 20.00 | % | 20.00 | % | COLLECTION AND PAYMENT SERVICES | Associate | |||||||||||||||||||
Affirmative Insurance Holdings Inc. (consolidated) | United States | 0.00 | % | 5.03 | % | 0.00 | % | INSURANCE | ||||||||||||||||||||||||||||||
Aegón Santander Generales Seguros y Reaseguros, S.A. | Spain | 0.00 | % | 49.00 | % | 49.00 | % | 100.00 | % | INSURANCE | Jointly controlled entity | |||||||||||||||||||||||||||
Aegón Santander Vida Seguros y Reaseguros, S.A. | Spain | 0.00 | % | 49.00 | % | 49.00 | % | 100.00 | % | INSURANCE | Jointly controlled entity | |||||||||||||||||||||||||||
Affirmative Insurance Holdings Inc. (consolidado) | United States | 0.00 | % | 5.03 | % | 0.00 | % | 0.00 | % | INSURANCE | — | |||||||||||||||||||||||||||
Affirmative Investment LLC | United States | 0.00 | % | 9.86 | % | 4.99 | % | HOLDING COMPANY | United States | 0.00 | % | 5.03 | % | 4.99 | % | 4.99 | % | HOLDING COMPANY | — | |||||||||||||||||||
Agres, Agrupación Restauradores, S.L. | Spain | 0.00 | % | 38.58 | % | 43.01 | % | RESTAURANTS | Spain | 0.00 | % | 43.00 | % | 43.00 | % | 43.01 | % | RESTAURANTS | Associate | |||||||||||||||||||
Aguas de Fuensanta, S.A. | Spain | 0.00 | % | 37.87 | % | 42.21 | % | FOOD | Spain | 36.78 | % | 0.00 | % | 36.78 | % | 42.21 | % | FOOD | Associate | |||||||||||||||||||
Alcover AG | Switzerland | 27.91 | % | 0.00 | % | 27.91 | % | INSURANCE | Switzerland | 27.91 | % | 0.00 | % | 27.91 | % | 27.91 | % | INSURANCE | — | |||||||||||||||||||
Allfunds Bank, S.A. | Spain | 50.00 | % | 0.00 | % | 50.00 | % | BANKING | Spain | 50.00 | % | 0.00 | % | 50.00 | % | 50.00 | % | BANKING | Jointly controlled entity | |||||||||||||||||||
Allfunds International S.A. | Luxembourg | 0.00 | % | 50.00 | % | 50.00 | % | FINANCIAL SERVICES | Luxembourg | 0.00 | % | 50.00 | % | 50.00 | % | 50.00 | % | FINANCIAL SERVICES | Jointly controlled entity | |||||||||||||||||||
Allfunds International Schweiz AG | Switzerland | 0.00 | % | 50.00 | % | 50.00 | % | 50.00 | % | SERVICES | Jointly controlled entity | |||||||||||||||||||||||||||
Allfunds Nominee Limited | United Kingdom | 0.00 | % | 50.00 | % | 50.00 | % | HOLDING COMPANY | United Kingdom | 0.00 | % | 50.00 | % | 50.00 | % | 50.00 | % | HOLDING COMPANY | Jointly controlled entity | |||||||||||||||||||
Anekis, S.A. | Spain | 24.75 | % | 24.75 | % | 49.50 | % | ADVERTISING | Spain | 24.75 | % | 24.75 | % | 49.50 | % | 49.50 | % | ADVERTISING | Associate | |||||||||||||||||||
Aquajerez, S.L. | Spain | 0.00 | % | 49.00 | % | 49.00 | % | — | WATER SUPPLY | Associate | ||||||||||||||||||||||||||||
Arena Communications Network, S.L. | Spain | 20.00 | % | 0.00 | % | 20.00 | % | ADVERTISING | Spain | 20.00 | % | 0.00 | % | 20.00 | % | 20.00 | % | ADVERTISING | Associate | |||||||||||||||||||
Attijari Factoring Maroc, S.A. | Morocco | 0.00 | % | 29.16 | % | 29.16 | % | FACTORING | Morocco | 0.00 | % | 28.95 | % | 28.95 | % | 28.99 | % | FACTORING | Associate | |||||||||||||||||||
Attijariwafa Bank Société Anonyme (consolidated) | Morocco | 0.00 | % | 5.55 | % | 5.55 | % | BANKING | ||||||||||||||||||||||||||||||
Attijariwafa Bank Société Anonyme (consolidado) | Morocco | 0.00 | % | 5.26 | % | 5.26 | % | 5.32 | % | BANKING | — | |||||||||||||||||||||||||||
Autopistas del Sol S.A. | Argentina | 0.00 | % | 14.17 | % | 14.17 | % | MOTORWAY CONCESSIONS | Argentina | 0.00 | % | 7.14 | % | 7.14 | % | 14.17 | % | MOTORWAY CONCESSIONS | — | |||||||||||||||||||
Aviva Powszechne Towarzystwo Emerytalne Aviva BZ WBK S.A. | Poland | 0.00 | % | 9.62 | % | 10.00 | % | PENSION FUND MANAGEMENT COMPANY | Poland | 0.00 | % | 7.00 | % | 10.00 | % | 10.00 | % | PENSION FUND MANAGEMENT COMPANY | — | |||||||||||||||||||
Aviva Towarzystwo Ubezpieczeń na Życie S.A. | Poland | 0.00 | % | 9.62 | % | 10.00 | % | INSURANCE | Poland | 0.00 | % | 7.00 | % | 10.00 | % | 10.00 | % | INSURANCE | — | |||||||||||||||||||
Banco Caixa Geral Totta de Angola, S.A. | Angola | 0.00 | % | 24.93 | % | 24.99 | % | BANKING | Angola | 0.00 | % | 24.94 | % | 24.99 | % | 24.99 | % | BANKING | Associate | |||||||||||||||||||
Banco Internacional da Guiné-Bissau, S.A. (e) | Guinea Bissau | 0.00 | % | 48.88 | % | 49.00 | % | BANKING | ||||||||||||||||||||||||||||||
Bee Cave (TX)—HC Apartments Syndicated Holdings, LLC | United States | 0.00 | % | 33.33 | % | 33.33 | % | PROPERTY | ||||||||||||||||||||||||||||||
Benim—Sociedade Imobiliária, S.A. (consolidated) | Portugal | 0.00 | % | 25.75 | % | 25.81 | % | PROPERTY | ||||||||||||||||||||||||||||||
BZ WBK—Aviva Towarzystwo Ubezpieczeń na Życie S.A. | Poland | 0.00 | % | 48.12 | % | 50.00 | % | INSURANCE | ||||||||||||||||||||||||||||||
Company Location Line of business Banco Internacional da Guiné-Bissau, S.A. (a) Bank of Beijing Consumer Finance Company Benim - Sociedade Imobiliária, S.A. (consolidado) BW Guirapá I S.A. Cantabria Capital, SGECR, S.A. Carnes Estellés, S.A. (a) Cartera del Norte, S.A. CCPT - ComprarCasa, Rede Serviços Imobiliários, S.A. Central Eólica Angical S.A. Central Eólica Caititu S.A. Central Eólica Coqueirinho S.A. Central Eólica Corrupião S.A. Central Eólica Inhambu S.A. Central Eólica Tamanduá Mirim S.A. Central Eólica Teiu S.A. Centro de Compensación Automatizado S.A. Centro para el Desarrollo, Investigación y Aplicación de Nuevas Tecnologías, S.A. Comder Contraparte Central S.A Companhia de Arrendamento Mercantil RCI Brasil Companhia de Crédito, Financiamento e Investimento RCI Brasil Companhia Promotora UCI Compañía Española de Seguros de Crédito a la Exportación, S.A., Compañía de Seguros y Reaseguros (consolidado) Comprarcasa Servicios Inmobiliarios, S.A. Dirgenfin, S.L. Ecosistema Virtual para la Promoción del Comercio, S.L. Eko Energy Sp. z o.o Elincasiol S.L. (consolidado) Energía Eólica de México, S.A. de C.V. (consolidado) Energía Renovable del Istmo, S.A. de C.V. Enerstar Villena, S.A. Farma Wiatrowa Jablowo Sp. z o.o FC2Egestión, S.L. Federal Home Loan Bank of Pittsburgh % of ownership
held by the Bank % of voting power
(b) Direct Indirect 2013 2012 Type of company Guinea Bissau 0.00 % 48.90 % 49.00 % 49.00 % BANKING — China 0.00 % 20.00 % 20.00 % — FINANCE Associate Portugal 0.00 % 25.76 % 25.81 % 25.81 % PROPERTY Associate Brazil 0.00 % 30.53 % 40.57 % — HOLDING COMPANY Associate Spain 50.00 % 0.00 % 50.00 % 50.00 % VENTURE CAPITAL MANAGEMENT COMPANY Associate Spain 21.41 % 0.00 % 21.41 % 21.41 % FOOD Associate Spain 36.10 % 0.00 % 36.10 % 36.10 % FINANCE Associate Portugal 0.00 % 47.56 % 47.56 % 47.56 % PROPERTY SERVICES Jointly
controlled entity Brazil 0.00 % 30.53 % 40.57 % — ELECTRICITY PRODUCTION Associate Brazil 0.00 % 30.53 % 40.57 % — ELECTRICITY PRODUCTION Associate Brazil 0.00 % 30.53 % 40.57 % — ELECTRICITY PRODUCTION Associate Brazil 0.00 % 30.53 % 40.57 % — ELECTRICITY PRODUCTION Associate Brazil 0.00 % 30.53 % 40.57 % — ELECTRICITY PRODUCTION Associate Brazil 0.00 % 30.53 % 40.57 % — ELECTRICITY PRODUCTION Associate Brazil 0.00 % 30.53 % 40.57 % — ELECTRICITY PRODUCTION Associate Chile 0.00 % 22.34 % 33.33 % 33.33 % COLLECTION AND PAYMENT SERVICES Associate Spain 0.00 % 49.00 % 49.00 % 49.00 % TECHNOLOGY Associate Chile 0.00 % 7.43 % 11.09 % — FINANCIAL SERVICES Associate Brazil 0.00 % 30.02 % 39.89 % 39.90 % LEASING Jointly
controlled entity Brazil 0.00 % 30.02 % 39.90 % 39.90 % FINANCE Jointly
controlled entity Brazil 0.00 % 25.00 % 25.00 % 25.00 % FINANCIAL SERVICES Jointly
controlled entity Spain 20.53 % 0.55 % 21.08 % 21.08 % CREDIT INSURANCE — Spain 0.00 % 50.00 % 50.00 % 47.50 % PROPERTY SERVICES Jointly
controlled entity Spain 0.00 % 50.00 % 50.00 % 40.00 % REAL ESTATE DEVELOPMENT Jointly
controlled entity Spain 33.33 % 0.00 % 33.33 % — SERVICES Associate Poland 0.00 % 12.49 % 22.00 % — ELECTRICITY PRODUCTION — Spain 0.00 % 46.19 % 46.19 % — ELECTRICITY PRODUCTION Jointly
controlled entity Mexico 0.00 % 50.00 % 50.00 % 100.00 % HOLDING COMPANY Jointly
controlled entity Mexico 0.00 % 50.00 % 50.00 % — ELECTRICITY PRODUCTION Jointly
controlled entity Spain 0.00 % 42.20 % 42.20 % — ELECTRICITY PRODUCTION Jointly
controlled entity Poland 0.00 % 12.26 % 21.60 % — ELECTRICITY PRODUCTION — Spain 0.00 % 50.00 % 50.00 % 50.00 % ENVIRONMENTAL MANAGEMENT Jointly
controlled entity United States 0.00 % 15.23 % 15.23 % 21.01 % BANKING —
Company Location Line of business Federal Reserve Bank of Boston Fondo de Titulización de Activos UCI 11 Fondo de Titulización de Activos UCI 14 Fondo de Titulización de Activos UCI 15 Fondo de Titulización de Activos UCI 16 Fondo de Titulización de Activos UCI 17 Fondo de Titulización de Activos UCI 18 Fondo de Titulización Hipotecaria UCI 10 Fondo de Titulización Hipotecaria UCI 12 Fortune Auto Finance Co., Ltd Friedrichstrasse, S.L. Gestión Santander, S.A. de C.V., Sociedad Operadora de Sociedades de Inversión, Grupo Financiero Santander México Gire S.A. Grupo Alimentario de Exclusivas, S.A. (a) Helican Desarrollo Eólico, S.L. Hidroatlixco, S.A.P.I. DE C.V. HLC – Centrais de Cogeração, S.A. HRE Investment Holdings II-A S.à.r.l. HSH Delaware L.P. Hyundai Capital Germany GmbH Hyundai Capital UK Limited Ideia Produções e Design Ltda - ME Imperial Holding S.C.A. Indice Iberoamericano de Investigación y Conocimiento, A.I.E. Inmo Alemania Gestión de Activos Inmobiliarios, S.A. Inversiones ZS América Dos Ltda Inversiones ZS América SpA Invico S.A. J.C. Flowers I L.P. J.C. Flowers II-A L.P.F-279 % of ownership
held by the Bank % of voting power
(b) Direct Indirect 2013 2012 Type of company United States 0.00 % 28.38 % 28.38 % 40.18 % BANKING — Spain — (d) — — SECURITIZATION Jointly
controlled entity Spain — (d) — — SECURITIZATION Jointly
controlled entity Spain — (d) — — SECURITIZATION Jointly
controlled entity Spain — (d) — — SECURITIZATION Jointly
controlled entity Spain — (d) — — SECURITIZATION Jointly
controlled entity Spain — (d) — — SECURITIZATION Jointly
controlled entity Spain — (d) — — SECURITIZATION Jointly
controlled entity Spain — (d) — — SECURITIZATION Jointly
controlled entity China 0.00 % 50.00 % 50.00 % — FINANCE Jointly
controlled entity Spain 35.00 % 0.00 % 35.00 % 35.00 % PROPERTY Associate Mexico 0.00 % 50.00 % 50.00 % 100.00 % FUND MANAGEMENT COMPANY Jointly
controlled entity Argentina 0.00 % 57.92 % 58.33 % 58.33 % COLLECTION AND PAYMENT SERVICES Associate Spain 40.46 % 0.00 % 40.46 % 47.23 % FOOD Associate Spain 0.00 % 46.00 % 46.00 % 46.00 % ELECTRICITY PRODUCTION Jointly
controlled entity Mexico 0.00 % 50.76 % 50.76 % — ELECTRICITY PRODUCTION Jointly
controlled entity Portugal 0.00 % 24.46 % 24.49 % 24.49 % ELECTRICITY PRODUCTION — Luxembourg 0.00 % 73.70 % 0.00 % 0.00 % HOLDING COMPANY — United States 0.00 % 69.19 % 0.00 % 0.00 % HOLDING COMPANY — Germany 0.00 % 49.99 % 49.99 % 49.99 % SERVICES Jointly
controlled entity United Kingdom 0.00 % 50.01 % 50.01 % 50.01 % FINANCE Jointly
controlled entity Brazil 0.00 % 59.49 % 70.00 % — SERVICES Jointly
controlled entity Luxembourg 0.00 % 36.36 % 36.36 % 36.36 % SECURITIES INVESTMENT — Spain 0.00 % 51.00 % 51.00 % 51.00 % INFORMATION SYSTEM Jointly
controlled entity Spain 0.00 % 20.00 % 20.00 % 20.00 % HOLDING COMPANY — Chile 0.00 % 49.00 % 49.00 % 49.00 % SECURITIES AND REAL ESTATE INVESTMENT Associate Chile 0.00 % 49.00 % 49.00 % 49.00 % SECURITIES AND REAL ESTATE INVESTMENT Associate Poland 0.00 % 14.76 % 21.09 % 12.21 % COMMERCE — United States 0.00 % 10.60 % 4.99 % 4.99 % HOLDING COMPANY — Canada 0.00 % 69.40 % 4.43 % 4.43 % HOLDING COMPANY —
| % of ownership held by the Bank | % of voting | |||||||||||||||
Company | Location | Direct | Indirect | power (a) | Line of business | |||||||||||
BZ WBK - Aviva Towarzystwo Ubezpieczeń Ogólnych S.A. | Poland | 0.00 | % | 48.12 | % | 50.00 | % | INSURANCE | ||||||||
Cantabria Capital, SGECR, S.A. | Spain | 50.00 | % | 0.00 | % | 50.00 | % | VENTURE CAPITAL MANAGEMENT COMPANY | ||||||||
Carnes Estellés, S.A. | Spain | 0.00 | % | 19.21 | % | 21.41 | % | FOOD | ||||||||
Cartera del Norte, S.A. | Spain | 0.00 | % | 32.38 | % | 36.10 | % | FINANCE | ||||||||
CCPT—ComprarCasa, Rede Serviços Imobiliários, S.A. | Portugal | 0.00 | % | 50.00 | % | 50.00 | % | PROPERTY SERVICES | ||||||||
Centro de Compensación Automatizado S.A. | Chile | 0.00 | % | 22.34 | % | 33.33 | % | PAYMENT AND COLLECTION SERVICES | ||||||||
Centro para el Desarrollo, Investigación y Aplicación de Nuevas Tecnologías, S.A. | Spain | 0.00 | % | 43.96 | % | 49.00 | % | TECHNOLOGY | ||||||||
Charta Leasing No.1 Limited | United Kingdom | 0.00 | % | 50.00 | % | 50.00 | % | LEASING | ||||||||
Charta Leasing No.2 Limited | United Kingdom | 0.00 | % | 50.00 | % | 50.00 | % | LEASING | ||||||||
Companhia de Arrendamento Mercantil RCI Brasil | Brazil | 0.00 | % | 32.52 | % | 39.88 | % | LEASING | ||||||||
Companhia de Crédito, Financiamento e Investimento RCI Brasil | Brazil | 0.00 | % | 32.27 | % | 39.58 | % | FINANCE | ||||||||
Compañía Española de Seguros de Crédito a la Exportación, S.A., Compañía de Seguros y Reaseguros (consolidated) | Spain | 13.95 | % | 6.45 | % | 21.08 | % | CREDIT INSURANCE | ||||||||
Comprarcasa Servicios Inmobiliarios, S.A. | Spain | 0.00 | % | 47.50 | % | 47.50 | % | PROPERTY SERVICES | ||||||||
Desarrollos Eólicos Mexicanos de Oaxaca 2, S.A.P.I. de C.V. | Mexico | 0.00 | % | 26.00 | % | 26.00 | % | ELECTRICITY PRODUCTION | ||||||||
Dirgenfin, S.L. | Spain | 0.00 | % | 35.88 | % | 40.00 | % | REAL ESTATE DEVELOPMENT | ||||||||
FC2Egestión, S.L. | Spain | 0.00 | % | 50.00 | % | 50.00 | % | ENVIRONMENTAL MANAGEMENT | ||||||||
Federal Home Loan Bank of Pittsburgh | United States | 0.00 | % | 15.11 | % | 15.11 | % | BANKING | ||||||||
Fondo de Titulización de Activos UCI 11 | Spain | — | (c | ) | — | SECURITIZATION | ||||||||||
Fondo de Titulización de Activos UCI 14 | Spain | — | (c | ) | — | SECURITIZATION | ||||||||||
Fondo de Titulización de Activos UCI 15 | Spain | — | (c | ) | — | SECURITIZATION | ||||||||||
Fondo de Titulización de Activos UCI 16 | Spain | — | (c | ) | — | SECURITIZATION | ||||||||||
Fondo de Titulización de Activos UCI 17 | Spain | — | (c | ) | — | SECURITIZATION | ||||||||||
Fondo de Titulización de Activos UCI 18 | Spain | — | (c | ) | — | SECURITIZATION | ||||||||||
Fondo de Titulización Hipotecaria UCI 10 | Spain | — | (c | ) | — | SECURITIZATION | ||||||||||
Fondo de Titulización Hipotecaria UCI 12 | Spain | — | (c | ) | — | SECURITIZATION | ||||||||||
Friedrichstrasse, S.L. | Spain | 0.00 | % | 35.00 | % | 35.00 | % | PROPERTY | ||||||||
Gire S.A. | Argentina | 0.00 | % | 57.92 | % | 58.33 | % | PAYMENT AND COLLECTION SERVICES | ||||||||
Granoller’s Broker, S.L. | Spain | 0.00 | % | 12.50 | % | 25.00 | % | FINANCE | ||||||||
Grupo Alimentario de Exclusivas, S.A. | Spain | 0.00 | % | 42.37 | % | 47.23 | % | FOOD | ||||||||
Grupo Konecta Centros Especiales de Empleo, S.L. | Spain | 0.00 | % | 48.25 | % | 48.25 | % | TELEMARKETING | ||||||||
| % of ownership held by the Bank | % of voting power (b) | |||||||||||||||||||||
Company | Location | Direct | Indirect | 2013 | 2012 | Line of business | Type of company | |||||||||||||||
JC Flowers AIV P L.P. | Canada | 0.00 | % | 7.67 | % | 4.99 | % | 4.99 | % | HOLDING COMPANY | — | |||||||||||
JCF BIN II-A | Mauritania | 0.00 | % | 69.52 | % | 4.43 | % | 4.43 | % | HOLDING COMPANY | — | |||||||||||
JCF II-A AIV K L.P. | Canada | 0.00 | % | 69.52 | % | 0.00 | % | 0.00 | % | HOLDING COMPANY | — | |||||||||||
JCF II-A Special AIV K L.P. | Canada | 0.00 | % | 72.29 | % | 4.99 | % | 4.99 | % | HOLDING COMPANY | — | |||||||||||
Jupiter III C.V. | The Netherlands | 0.00 | % | 72.75 | % | 4.99 | % | 4.99 | % | HOLDING COMPANY | — | |||||||||||
Jupiter JCF AIV II-A C.V. | The Netherlands | 0.00 | % | 69.41 | % | 4.99 | % | 4.99 | % | HOLDING COMPANY | — | |||||||||||
Kassadesign 2005, S.L. | Spain | 0.00 | % | 50.00 | % | 50.00 | % | 50.00 | % | PROPERTY | Jointly controlled entity | |||||||||||
Konesticial, S.L. | Spain | 0.00 | % | 50.00 | % | 50.00 | % | — | HOLDING COMPANY | Jointly controlled entity | ||||||||||||
Krynicki Recykling S.A. | Poland | 0.00 | % | 15.62 | % | 22.32 | % | 24.54 | % | WASTE MANAGEMENT | Associate | |||||||||||
Luri 3, S.A. | Spain | 10.00 | % | 0.00 | % | 10.00 | % | 10.00 | % | PROPERTY | Jointly controlled entity | |||||||||||
Metrohouse S.A. | Poland | 0.00 | % | 14.86 | % | 21.23 | % | 21.23 | % | PROPERTY | Associate | |||||||||||
Metrovacesa, S.A. (consolidado) | Spain | 36.82 | % | 0.00 | % | 36.82 | % | 34.87 | % | PROPERTY | Associate | |||||||||||
Nevis Power Limited | United Kingdom | 0.00 | % | 50.00 | % | 50.00 | % | 50.00 | % | ELECTRICITY PRODUCTION | Jointly controlled entity | |||||||||||
New PEL S.a.r.l. | Luxembourg | 0.00 | % | 7.67 | % | 0.00 | % | 0.00 | % | HOLDING COMPANY | — | |||||||||||
NIB Special Investors IV-A LP | Canada | 0.00 | % | 99.70 | % | 4.99 | % | 4.99 | % | HOLDING COMPANY | — | |||||||||||
NIB Special Investors IV-B LP | Canada | 0.00 | % | 95.80 | % | 4.99 | % | 4.99 | % | HOLDING COMPANY | — | |||||||||||
Norchem Holdings e Negócios S.A. | Brazil | 0.00 | % | 16.37 | % | 29.00 | % | 29.00 | % | HOLDING COMPANY | Associate | |||||||||||
Norchem Participações e Consultoria S.A. | Brazil | 0.00 | % | 37.63 | % | 50.00 | % | 50.00 | % | SECURITIES COMPANY | Jointly controlled entity | |||||||||||
Nowotna Farma Wiatrowa Sp. z o.o | Poland | 0.00 | % | 12.26 | % | 21.60 | % | — | ELECTRICITY PRODUCTION | — | ||||||||||||
NPG Wealth Management S.àr.l (consolidado) | Luxembourg | 0.00 | % | 7.63 | % | 0.00 | % | 0.00 | % | HOLDING COMPANY | — | |||||||||||
Olivant Investments Switzerland S.A. | Luxembourg | 0.00 | % | 35.18 | % | 35.18 | % | 35.18 | % | HOLDING COMPANY | Associate | |||||||||||
Olivant Limited (consolidado) | Guernsey | 0.00 | % | 10.39 | % | 10.39 | % | 10.39 | % | HOLDING COMPANY | — | |||||||||||
Omega Financial Services GmbH | Germany | 0.00 | % | 50.00 | % | 50.00 | % | 50.00 | % | SERVICES | Jointly controlled entity | |||||||||||
Operadora de Activos Alfa, S.A. De C.V. | Mexico | 0.00 | % | 49.98 | % | 49.98 | % | 49.98 | % | FINANCE | Associate | |||||||||||
Operadora de Activos Beta, S.A. de C.V. | Mexico | 0.00 | % | 49.99 | % | 49.99 | % | 49.99 | % | FINANCE | Associate | |||||||||||
Operadora de Tarjetas de Crédito Nexus S.A. | Chile | 0.00 | % | 8.65 | % | 12.90 | % | — | CARDS | Associate | ||||||||||||
Parque Eólico Dominica, S.A.P.I. de C.V. | Mexico | 0.00 | % | 41.07 | % | 41.07 | % | 50.00 | % | ELECTRICITY PRODUCTION | Jointly controlled entity | |||||||||||
Parque Eólico el Mezquite, S.A.P.I. de C.V. | Mexico | 0.00 | % | 41.07 | % | 41.07 | % | 50.00 | % | ELECTRICITY PRODUCTION | Jointly controlled entity | |||||||||||
Parque Eólico la Carabina I, S.A.P.I. de C.V. | Mexico | 0.00 | % | 41.07 | % | 41.07 | % | 50.00 | % | ELECTRICITY PRODUCTION | Jointly controlled entity | |||||||||||
Parque Eólico la Carabina II, S.A.P.I. de C.V. | Mexico | 0.00 | % | 41.07 | % | 41.07 | % | 50.00 | % | ELECTRICITY PRODUCTION | Jointly controlled entity | |||||||||||
Parque Solar Afortunado, S.L. | Spain | 98.00 | % | 0.00 | % | 25.00 | % | 25.00 | % | ELECTRICITY PRODUCTION | Jointly controlled entity | |||||||||||
Parque Solar la Robla, S.L. | Spain | 95.00 | % | 0.00 | % | 25.00 | % | 25.00 | % | ELECTRICITY PRODUCTION | — | |||||||||||
Parque Solar Páramo, S.L. | Spain | 92.00 | % | 0.00 | % | 25.00 | % | 25.00 | % | ELECTRICITY PRODUCTION | Jointly controlled entity | |||||||||||
Parque Solar Saelices, S.L. | Spain | 95.00 | % | 0.00 | % | 25.00 | % | 25.00 | % | ELECTRICITY PRODUCTION | — | |||||||||||
Partang, SGPS, S.A. | Portugal | 0.00 | % | 48.90 | % | 49.00 | % | 49.00 | % | HOLDING COMPANY | Associate | |||||||||||
Company Location Line of business Persano Energy 2 S.r.l. Persano Energy S.r.l. POLFUND - Fundusz Poręczeń Kredytowych S.A. Ponte Albanito S.r.l. Prodesur Mediterráneo, S.L. Proinsur Mediterráneo, S.L. PSA Finance PLC Q 205 Real Estate GmbH Queenford, S.L. Redbanc S.A. Redbanc, S.A. Redsys Servicios de Procesamiento, S.L.U. Retama Real Estate, S.A. Rio Alto Gestão de Créditos e Participações, S.A. SAM Brasil Participações Ltda. SAM Finance Lux S.à.r.l SAM Investment Holdings Limited SAM Puerto Rico Holdings, Inc. Santander Ahorro Inmobiliario 1, S.I.I., S.A. Santander Asset Management Luxembourg, S.A. Santander Asset Management S.A. Administradora General de Fondos Santander Asset Management UK Holdings Limited Santander Asset Management UK Limited Santander Asset Management USA, LLC Santander Asset Management, LLC Santander Asset Management, S.A., S.G.I.I.C. Santander Brasil Asset Management Distribuidora de Títulos e Valores Mobiliários S.A. Santander Brasil Gestão de Recursos Ltda. % of ownership
held by the Bank % of voting power
(b) Direct Indirect 2013 2012 Type of company Italy 0.00 % 20.00 % 20.00 % — ELECTRICITY PRODUCTION Jointly
controlled entity Italy 0.00 % 20.00 % 20.00 % — ELECTRICITY PRODUCTION Jointly
controlled entity Poland 0.00 % 35.00 % 50.00 % 50.00 % MANAGEMENT COMPANY Associate Italy 0.00 % 30.00 % 30.00 % — ELECTRICITY PRODUCTION Jointly
controlled entity Spain 0.00 % 50.23 % 50.23 % 50.00 % PROPERTY Jointly
controlled entity Spain 0.00 % 50.00 % 50.00 % 50.00 % PROPERTY Jointly
controlled entity United Kingdom 0.00 % 50.00 % 50.00 % 50.00 % LEASING Associate Germany 0.00 % 17.50 % 17.50 % 17.50 % PROPERTY — Spain 0.00 % 49.00 % 49.00 % 49.00 % PROPERTY Associate Chile 0.00 % 22.40 % 33.43 % 33.43 % SERVICES Associate Uruguay 0.00 % 20.00 % 20.00 % 20.00 % SERVICES — Spain 16.97 % 0.00 % 16.97 % 16.29 % CARDS Associate Spain 0.00 % 50.00 % 50.00 % 50.00 % SERVICES Jointly
controlled entity Brazil 0.00 % 37.63 % 50.00 % — COLLECTION AND PAYMENT SERVICES — Brazil 0.00 % 50.00 % 50.00 % — HOLDING COMPANY Jointly
controlled entity Luxembourg 0.00 % 50.00 % 50.00 % — MANAGEMENT COMPANY Jointly
controlled entity Jersey 0.00 % 50.00 % 50.00 % — HOLDING COMPANY Jointly
controlled entity Puerto Rico 0.00 % 50.00 % 50.00 % — HOLDING COMPANY Jointly
controlled entity Spain 30.94 % 0.01 % 30.95 % 28.77 % PROPERTY Associate Luxembourg 0.00 % 50.00 % 50.00 % 100.00 % FUND MANAGEMENT COMPANY Jointly
controlled entity Chile 0.00 % 49.99 % 49.99 % 100.00 % FUND MANAGEMENT COMPANY Jointly
controlled entity United Kingdom 0.00 % 50.00 % 50.00 % 100.00 % HOLDING COMPANY Jointly
controlled entity United Kingdom 0.00 % 50.00 % 50.00 % 100.00 % FUND AND PORTFOLIO MANAGER Jointly
controlled entity United States 0.00 % 50.00 % 50.00 % — FUND AND ASSET MANAGEMENT COMPANY Jointly
controlled entity Puerto Rico 0.00 % 50.00 % 50.00 % 100.00 % MANAGEMENT COMPANY Jointly
controlled entity Spain 0.00 % 50.00 % 50.00 % 100.00 % FUND MANAGEMENT COMPANY Jointly
controlled entity Brazil 0.00 % 50.00 % 50.00 % 100.00 % MANAGEMENT COMPANY Jointly
controlled entity Brazil 0.00 % 50.00 % 50.00 % — PROPERTY Jointly
controlled entity
Company Location Line of business Santander Consumer USA Inc. (consolidado) Santander Elavon Merchant Services Entidad de Pago, S.L. Santander ISA Managers Limited Santander Pensiones, S.A., E.G.F.P. Santander Portfolio Management UK Limited Santander Río Asset Management Gerente de Fondos Comunes de Inversión S.A. Santander Seguros, S.A. Santander Unit Trust Managers UK Limited Saturn Japan II Sub C.V. Saturn Japan III Sub C.V. Saudi Hollandi Bank (consolidado) Servicios de Infraestructura de Mercado OTC S.A Sociedad de Gestión de Activos Procedentes de la Reestructuración Bancaria, S.A. Sociedad Interbancaria de Depósitos de Valores S.A. Sociedad Promotora Bilbao Plaza Financiera, S.A. Solar Energy Capital Europe S.à.r.l. (consolidado) Tecnologia Bancária S.A. Teka Industrial, S.A. (consolidado) The HSH AIV 4 Trust The JCF HRE AIV II-A Trust (a) Tonopah Solar Energy Holdings I, LLC Trabajando.com Chile S.A. Transbank S.A. Transolver Finance EFC, S.A. U.C.I., S.A. UCI Holding Brasil Ltda UCI Mediação de Seguros Unipessoal, Lda. Unicre-Instituição Financeira de Crédito, S.A. Unión de Créditos Inmobiliarios, S.A., EFC Vector Software Factory, S.L. (consolidado) Viking Consortium Holdings Limited (consolidado) Webmotors S.A.F-280 % of ownership
held by the Bank % of voting power
(b) Direct Indirect 2013 2012 Type of company United States 0.00 % 64.97 % 64.97 % 64.97 % FINANCE Jointly
controlled entity Spain 49.00 % 0.00 % 49.00 % — PAYMENT SERVICES Jointly
controlled entity United Kingdom 0.00 % 50.00 % 50.00 % 100.00 % FUND AND PORTFOLIO MANAGER Jointly
controlled entity Spain 0.00 % 50.00 % 50.00 % 100.00 % PENSION FUND MANAGEMENT COMPANY Jointly
controlled entity United Kingdom 0.00 % 50.00 % 50.00 % 100.00 % FINANCE Jointly
controlled entity Argentina 0.00 % 50.00 % 50.00 % 100.00 % FUND MANAGEMENT COMPANY Jointly
controlled entity Uruguay 0.00 % 49.00 % 49.00 % 49.00 % INSURANCE Associate United Kingdom 0.00 % 50.00 % 50.00 % 100.00 % FUND AND PORTFOLIO MANAGER Jointly
controlled entity The Netherlands 0.00 % 69.30 % 0.00 % 0.00 % HOLDING COMPANY — The Netherlands 0.00 % 72.71 % 0.00 % 0.00 % HOLDING COMPANY — Saudi Arabia 0.00 % 11.16 % �� 11.16 % 11.16 % BANKING — Chile 0.00 % 7.45 % 11.11 % — SERVICES Associate Spain 17.28 % 0.00 % 17.28 % 17.15 % FINANCIAL SERVICES — Chile 0.00 % 19.63 % 29.29 % 29.29 % SECURITIES DEPOSITORY SERVICES Associate Spain 19.04 % 14.86 % 33.90 % 33.90 % ADVISORY SERVICES — Luxembourg 0.00 % 33.33 % 33.33 % 33.33 % HOLDING COMPANY Jointly
controlled entity Brazil 0.00 % 17.70 % 20.82 % 20.82 % ATMs Associate Spain 0.00 % 9.42 % 9.42 % 9.42 % DOMESTIC APPLIANCES — United States 0.00 % 69.19 % 4.99 % 4.99 % HOLDING COMPANY — United States 0.00 % 73.70 % 4.99 % 4.99 % HOLDING COMPANY — United States 0.00 % 26.80 % 26.80 % — HOLDING COMPANY Associate Chile 0.00 % 33.33 % 33.33 % 33.33 % SERVICES Associate Chile 0.00 % 16.75 % 25.00 % 25.00 % CARDS Associate Spain 0.00 % 50.00 % 50.00 % 50.00 % LEASING Jointly
controlled entity Spain 50.00 % 0.00 % 50.00 % 50.00 % HOLDING COMPANY Jointly
controlled entity Brazil 0.00 % 50.00 % 50.00 % 50.00 % HOLDING COMPANY Jointly
controlled entity Portugal 0.00 % 50.00 % 50.00 % 50.00 % INSURANCE BROKER Jointly
controlled entity Portugal 0.00 % 21.45 % 21.50 % 21.50 % FINANCE Associate Spain 0.00 % 50.00 % 50.00 % 50.00 % MORTGAGE LOAN COMPANY Jointly
controlled entity Spain 0.00 % 45.00 % 45.00 % 45.00 % IT Associate United Kingdom 0.00 % 24.99 % 24.99 % 24.99 % HOLDING COMPANY — Brazil 0.00 % 59.49 % 70.00 % 100.00 % SERVICES Jointly
controlled entity
| % of ownership held by the Bank | % of voting | |||||||||||||||
Company | Location | Direct | Indirect | power (a) | Line of business | |||||||||||
Grupo Konecta Maroc S.A.R.L. à associé unique | Morocco | 0.00 | % | 48.25 | % | 48.25 | % | TELEMARKETING | ||||||||
Grupo Konecta UK Limited | United Kingdom | 0.00 | % | 48.25 | % | 48.25 | % | FINANCE | ||||||||
Grupo Konectanet México, S.A. de C.V. | Mexico | 0.00 | % | 48.25 | % | 48.25 | % | TELEMARKETING | ||||||||
Grupo Konectanet, S.L. | Spain | 0.00 | % | 48.25 | % | 48.25 | % | HOLDING COMPANY | ||||||||
Helican Desarrollo Eólico, S.L. | Spain | 0.00 | % | 46.00 | % | 46.00 | % | ELECTRICITY PRODUCTION | ||||||||
HLC – Centrais de Cogeração, S.A. | Portugal | 0.00 | % | 24.46 | % | 24.49 | % | ELECTRICITY PRODUCTION | ||||||||
Holicon Group S.A. | Poland | 0.00 | % | 45.32 | % | 47.09 | % | SERVICES | ||||||||
Home Services On Line Solutions, S.L. | Spain | 0.00 | % | 48.25 | % | 48.25 | % | SERVICES | ||||||||
Hyundai Capital Germany GmbH | Germany | 0.00 | % | 49.99 | % | 49.99 | % | SERVICES | ||||||||
Imperial Holding S.C.A. | Luxembourg | 0.00 | % | 37.00 | % | 37.00 | % | SECURITIES INVESTMENT | ||||||||
Indice Iberoamericano de Investigación y Conocimiento, A.I.E. | Spain | 0.00 | % | 51.00 | % | 51.00 | % | INFORMATION SYSTEM | ||||||||
Inmo Alemania Gestión de Activos Inmobiliarios, S.A. | Spain | 0.00 | % | 19.46 | % | 19.46 | % | HOLDING COMPANY | ||||||||
Inversiones ZS América Dos Ltda | Chile | 0.00 | % | 49.00 | % | 49.00 | % | SECURITIES AND REAL ESTATE INVESTMENT | ||||||||
Inversiones ZS América SpA | Chile | 0.00 | % | 49.00 | % | 49.00 | % | SECURITIES AND REAL ESTATE INVESTMENT | ||||||||
Inversiones ZS América Tres SpA | Chile | 0.00 | % | 49.00 | % | 49.00 | % | SECURITIES AND REAL ESTATE INVESTMENT | ||||||||
J.C. Flowers I L.P. | United States | 10.91 | % | 0.00 | % | 4.99 | % | HOLDING COMPANY | ||||||||
JC Flowers AIV P L.P. | Canada | 0.00 | % | 6.92 | % | 4.99 | % | HOLDING COMPANY | ||||||||
Kassadesign 2005, S.L. | Spain | 0.00 | % | 44.85 | % | 50.00 | % | PROPERTY | ||||||||
Konecta Activos Inmobiliarios, S.L. | Spain | 0.00 | % | 49.08 | % | 49.08 | % | PROPERTY | ||||||||
Konecta Brazil Outsourcing Ltda. | Brazil | 0.00 | % | 48.24 | % | 48.24 | % | SERVICES | ||||||||
Konecta Broker, S.L. | Spain | 0.00 | % | 48.25 | % | 48.25 | % | SERVICES | ||||||||
Konecta Bto, S.L. | Spain | 0.00 | % | 48.25 | % | 48.25 | % | TELECOMMUNICATIONS | ||||||||
Konecta Catalunya, S.L. | Spain | 0.00 | % | 48.25 | % | 48.25 | % | SERVICES | ||||||||
Konecta Chile Limitada | Chile | 0.00 | % | 48.25 | % | 48.25 | % | SERVICES | ||||||||
Konecta Colombia Grupo Konecta Colombia Ltda | Colombia | 0.00 | % | 48.25 | % | 48.25 | % | TELEMARKETING | ||||||||
Konecta Field Marketing, S.A. | Spain | 0.00 | % | 48.25 | % | 48.25 | % | MARKETING | ||||||||
Konecta Perú S.A.C. | Peru | 0.00 | % | 48.25 | % | 48.25 | % | SERVICES | ||||||||
Konecta Portugal, Lda. | Portugal | 0.00 | % | 48.25 | % | 48.25 | % | MARKETING | ||||||||
Konecta Servicios Administrativos y Tecnológicos, S.L. | Spain | 0.00 | % | 48.25 | % | 48.25 | % | SERVICES | ||||||||
Konectanet Andalucía, S.L. | Spain | 0.00 | % | 48.25 | % | 48.25 | % | SERVICES | ||||||||
Konectanet Comercialización, S.L. | Spain | 0.00 | % | 48.25 | % | 48.25 | % | MARKETING | ||||||||
Kontacta Comunicaciones, S.A. | Spain | 0.00 | % | 36.19 | % | 36.19 | % | SERVICES | ||||||||
Kontacta Top Ten, S.L. | Spain | 0.00 | % | 36.19 | % | 36.19 | % | SERVICES | ||||||||
F-281
| % of ownership held by the Bank | % of voting | |||||||||||||||
Company | Location | Direct | Indirect | power (a) | Line of business | |||||||||||
Krynicki Recykling S.A. | Poland | 0.00 | % | 23.62 | % | 24.54 | % | WASTE MANAGEMENT | ||||||||
Luri 3, S.A. | Spain | 0.00 | % | 9.63 | % | 10.00 | % | PROPERTY | ||||||||
Maxamcorp Holding, S.L. (consolidated) | Spain | 0.00 | % | 22.62 | % | 22.62 | % | HOLDING COMPANY | ||||||||
Metrohouse & Partnerzy S.A. | Poland | 0.00 | % | 20.43 | % | 21.23 | % | PROPERTY | ||||||||
Metrovacesa, S.A. (consolidated) | Spain | 22.60 | % | 11.01 | % | 34.87 | % | PROPERTY | ||||||||
Neoen, SGPS, S.A. | Portugal | 0.00 | % | 50.00 | % | 50.00 | % | ELECTRICITY PRODUCTION | ||||||||
Nevis Power Limited | United Kingdom | 0.00 | % | 50.00 | % | 50.00 | % | ELECTRICITY PRODUCTION | ||||||||
New PEL S.a.r.l. | Luxembourg | 0.00 | % | 6.92 | % | 0.00 | % | HOLDING COMPANY | ||||||||
Norchem Holdings e Negócios S.A. | Brazil | 0.00 | % | 17.73 | % | 21.75 | % | HOLDING COMPANY | ||||||||
Norchem Participações e Consultoria S.A. | Brazil | 0.00 | % | 40.76 | % | 50.00 | % | SECURITIES BROKER | ||||||||
NPG Wealth Management S.à.r.l (consolidated) | Luxembourg | 0.00 | % | 5.85 | % | 0.00 | % | HOLDING COMPANY | ||||||||
Olivant Investments Switzerland S.A. | Luxembourg | 0.00 | % | 34.97 | % | 34.97 | % | HOLDING COMPANY | ||||||||
Olivant Limited (consolidated) | Guernsey | 0.00 | % | 9.00 | % | 9.00 | % | HOLDING COMPANY | ||||||||
Omega Financial Services GmbH | Germany | 0.00 | % | 50.00 | % | 50.00 | % | SERVICES | ||||||||
Operadora de Activos Alfa, S.A. de C.V. | Mexico | 0.00 | % | 49.98 | % | 49.98 | % | FINANCE | ||||||||
Operadora de Activos Beta, S.A. de C.V. | Mexico | 0.00 | % | 49.99 | % | 49.99 | % | FINANCE | ||||||||
Parque Eólico Dominica, S.A.P.I. de C.V. | Mexico | 0.00 | % | 24.99 | % | 24.99 | % | ELECTRICITY PRODUCTION | ||||||||
Parque Eólico el Mezquite, S.A.P.I. de C.V. | Mexico | 0.00 | % | 24.99 | % | 24.99 | % | ELECTRICITY PRODUCTION | ||||||||
Parque Eólico la Carabina I, S.A.P.I. de C.V. | Mexico | 0.00 | % | 24.99 | % | 24.99 | % | ELECTRICITY PRODUCTION | ||||||||
Parque Eólico la Carabina II, S.A.P.I. de C.V. | Mexico | 0.00 | % | 24.99 | % | 24.99 | % | ELECTRICITY PRODUCTION | ||||||||
Parque Solar la Robla, S.L. | Spain | 0.00 | % | 85.22 | % | 25.00 | % | ELECTRICITY PRODUCTION | ||||||||
Parque Solar Páramo, S.L. | Spain | 0.00 | % | 82.53 | % | 25.00 | % | ELECTRICITY PRODUCTION | ||||||||
Parque Solar Saelices, S.L. | Spain | 0.00 | % | 85.22 | % | 25.00 | % | ELECTRICITY PRODUCTION | ||||||||
Partang, SGPS, S.A. | Portugal | 0.00 | % | 48.88 | % | 49.00 | % | HOLDING COMPANY | ||||||||
POLFUND—Fundusz Poręczeń Kredytowych S.A. | Poland | 0.00 | % | 48.12 | % | 50.00 | % | MANAGEMENT COMPANY | ||||||||
Pragma Trade S.A. | Poland | 0.00 | % | 20.30 | % | 12.21 | % | COMMERCE | ||||||||
Prodesur Mediterráneo, S.L. | Spain | 0.00 | % | 44.85 | % | 50.00 | % | PROPERTY | ||||||||
Programa Multi Sponsor PMS, S.A. | Spain | 24.75 | % | 24.75 | % | 49.50 | % | ADVERTISING | ||||||||
Proinsur Mediterráneo, S.L. | Spain | 0.00 | % | 44.85 | % | 50.00 | % | PROPERTY | ||||||||
Promoreras Desarrollo de Activos, S.L. | Spain | 0.00 | % | 31.40 | % | 35.00 | % | PROPERTY | ||||||||
F-282
| % of ownership held by the Bank | % of voting | |||||||||||||||
Company | Location | Direct | Indirect | power (a) | Line of business | |||||||||||
PSA Finance PLC | United Kingdom | 0.00 | % | 50.00 | % | 50.00 | % | LEASING | ||||||||
Puntoform, S.L. | Spain | 0.00 | % | 48.25 | % | 48.25 | % | TRAINING | ||||||||
Q 205 Real Estate GmbH | Germany | 0.00 | % | 17.50 | % | 17.50 | % | PROPERTY | ||||||||
Queenford, S.L. | Spain | 0.00 | % | 43.96 | % | 49.00 | % | PROPERTY | ||||||||
Real Seguros Vida e Previdência S.A. (d) | Brazil | 0.00 | % | 0.00 | % | 0.00 | % | INSURANCE | ||||||||
Redbanc S.A. | Chile | 0.00 | % | 22.40 | % | 33.43 | % | SERVICES | ||||||||
Redbanc, S.A. | Uruguay | 0.00 | % | 20.00 | % | 20.00 | % | SERVICES | ||||||||
Redsys Servicios de Procesamiento, S.L.U. | Spain | 12.62 | % | 3.19 | % | 16.17 | % | CARDS | ||||||||
Renova Energia S.A. | Brazil | 0.00 | % | 7.19 | % | 8.82 | % | ELECTRICITY PRODUCTION | ||||||||
Retama Real Estate, S.L. | Spain | 0.00 | % | 50.00 | % | 50.00 | % | SERVICES | ||||||||
Santander Ahorro Inmobiliario 1, S.I.I., S.A. | Spain | 24.01 | % | 0.01 | % | 24.02 | % | PROPERTY | ||||||||
Santander Brasil Seguros S.A. | Brazil | 0.00 | % | 49.00 | % | 49.00 | % | INSURANCE | ||||||||
Santander Consumer USA Inc. (consolidated) | United States | 0.00 | % | 65.00 | % | 65.00 | % | FINANCE | ||||||||
Santander Río Seguros S.A. | Argentina | 0.00 | % | 49.00 | % | 49.00 | % | INSURANCE | ||||||||
Santander Seguros de Vida S.A. | Chile | 0.00 | % | 49.00 | % | 49.00 | % | INSURANCE | ||||||||
Santander Seguros Generales S.A. | Chile | 0.00 | % | 49.00 | % | 49.00 | % | INSURANCE | ||||||||
Santander Seguros S.A. | Brazil | 0.00 | % | 49.00 | % | 49.00 | % | INSURANCE | ||||||||
Santander Seguros, S.A. | Uruguay | 0.00 | % | 49.00 | % | 49.00 | % | INSURANCE | ||||||||
Saudi Hollandi Bank (consolidated) | Saudi Arabia | 0.00 | % | 11.16 | % | 11.16 | % | BANKING | ||||||||
SC Littleton HH LLC | United States | 0.00 | % | 24.10 | % | 24.10 | % | PROPERTY | ||||||||
Seguros Santander, S.A., Grupo Financiero Santander | Mexico | 0.00 | % | 49.00 | % | 49.00 | % | INSURANCE | ||||||||
Shinsei Bank, Ltd. (consolidated) (f) | Japan | 0.00 | % | 4.97 | % | 1.37 | % | BANKING | ||||||||
Sociedad de Generación Eólica Manchega, S.L. | Spain | 0.00 | % | 24.92 | % | 24.92 | % | ELECTRICITY PRODUCTION | ||||||||
Sociedad Interbancaria de Depósitos de Valores S.A. | Chile | 0.00 | % | 19.63 | % | 29.29 | % | SECURITIES DEPOSITORY SERVICES | ||||||||
Sociedad Promotora Bilbao Plaza Financiera, S.A. | Spain | 7.74 | % | 25.00 | % | 33.90 | % | ADVISORY SERVICES | ||||||||
Solar Energy Capital Europe S.à.r.l. | Luxembourg | 0.00 | % | 33.33 | % | 33.33 | % | HOLDING COMPANY | ||||||||
Tecnologia Bancária S.A. | Brazil | 0.00 | % | 20.82 | % | 20.82 | % | ATMs | ||||||||
Teka Industrial, S.A. (consolidated) | Spain | 0.00 | % | 9.42 | % | 9.42 | % | DOMESTIC APPLIANCES | ||||||||
Torre de Miguel Solar, S.L. | Spain | 0.00 | % | 50.00 | % | 50.00 | % | ELECTRICITY PRODUCTION | ||||||||
Trabajando.com Chile S.A. | Chile | 0.00 | % | 33.33 | % | 33.33 | % | SERVICES | ||||||||
Transbank S.A. | Chile | 0.00 | % | 21.92 | % | 32.71 | % | CARDS | ||||||||
Transolver Finance EFC, S.A. | Spain | 0.00 | % | 50.00 | % | 50.00 | % | LEASING | ||||||||
Turyocio Viajes y Fidelización, S.A. | Spain | 0.00 | % | 32.21 | % | 32.21 | % | TRAVEL | ||||||||
U.C.I., S.A. | Spain | 50.00 | % | 0.00 | % | 50.00 | % | HOLDING COMPANY | ||||||||
UCI Mediação de Seguros Unipessoal, Lda. | Portugal | 0.00 | % | 50.00 | % | 50.00 | % | INSURANCE BROKER | ||||||||
F-283
| % of ownership held by the Bank | % of voting | |||||||||||||||
Company | Location | Direct | Indirect | power (a) | Line of business | |||||||||||
Unicre-Instituição Financeira de Crédito, S.A. | Portugal | 0.00 | % | 21.45 | % | 21.50 | % | FINANCE | ||||||||
Unión de Créditos Inmobiliarios, S.A., EFC | Spain | 0.00 | % | 50.00 | % | 50.00 | % | MORTGAGE LOAN COMPANY | ||||||||
Vector Software Factory, S.L. | Spain | 0.00 | % | 21.60 | % | 21.60 | % | IT | ||||||||
Viking Consortium Holdings Limited (consolidated) | United Kingdom | 0.00 | % | 24.99 | % | 24.99 | % | HOLDING COMPANY | ||||||||
Wtorre Empreendimentos Imobiliários S.A. (consolidated) | Brazil | 0.00 | % | 4.27 | % | 5.24 | % | PROPERTY | ||||||||
ZS Insurance América, S.L. | Spain | 49.00 | % | 0.00 | % | 49.00 | % | COMPANY MANAGEMENT | ||||||||
| % of ownership held by the Bank | % of voting power (b) | |||||||||||||||||||||
Company | Location | Direct | Indirect | 2013 | 2012 | Line of business | Type of company | |||||||||||||||
Zakłady Przemysłu Jedwabniczego DOLWIS S.A. w upadłości likwidacyjnej (a) | Poland | 0.00 | % | 30.80 | % | 44.00 | % | — | TEXTILE MANUFACTURING | — | ||||||||||||
Zurich Santander Brasil Seguros e Previdência S.A. | Brazil | 0.00 | % | 48.79 | % | 48.79 | % | 49.00 | % | INSURANCE | Associate | |||||||||||
Zurich Santander Brasil Seguros S.A. | Brazil | 0.00 | % | 48.79 | % | 48.79 | % | 49.00 | % | INSURANCE | Associate | |||||||||||
Zurich Santander Holding (Spain), S.L. | Spain | 0.00 | % | 49.00 | % | 49.00 | % | 49.00 | % | HOLDING COMPANY | Associate | |||||||||||
Zurich Santander Holding Dos (Spain), S.L. | Spain | 0.00 | % | 49.00 | % | 49.00 | % | 49.00 | % | HOLDING COMPANY | Associate | |||||||||||
Zurich Santander Insurance América, S.L. | Spain | 49.00 | % | 0.00 | % | 49.00 | % | 49.00 | % | HOLDING COMPANY | Associate | |||||||||||
Zurich Santander Seguros Argentina S.A. | Argentina | 0.00 | % | 49.00 | % | 49.00 | % | 49.00 | % | INSURANCE | Associate | |||||||||||
Zurich Santander Seguros de Vida Chile S.A. | Chile | 0.00 | % | 49.00 | % | 49.00 | % | 49.00 | % | INSURANCE | Associate | |||||||||||
Zurich Santander Seguros Generales Chile S.A. | Chile | 0.00 | % | 49.00 | % | 49.00 | % | 49.00 | % | INSURANCE | Associate | |||||||||||
Zurich Santander Seguros México, S.A. | Mexico | 0.00 | % | 49.00 | % | 49.00 | % | 49.00 | % | INSURANCE | Associate | |||||||||||
| (a) | Company in liquidation at December 31, 2013. |
| (b) | Pursuant to Article 3 of Royal Decree 1159/2010, of September 17, approving the rules for the preparation of consolidated financial statements, in order to determine voting power, the voting power relating to subsidiaries or to other persons acting in their own name but on behalf of Group companies was added to the voting power directly held by the Parent. For these purposes, the number of votes corresponding to the Parent in relation to companies over which it exercises indirect control is the number corresponding to each subsidiary holding a direct ownership interest in such companies. |
| Excluding the Group companies listed in Appendix I and those of negligible interest with respect to the fair presentation that the consolidated financial statements must express (pursuant to Article 48 of the Spanish Commercial Code and Article 260 of the Spanish Limited Liability Companies |
| Companies over which the non-subsidiary investee of the Group maintains effective control is exercised. |
Exhibit III
Preference share issuer subsidiaries
| % of ownership held by the Bank | ||||||||||||
Company | Location | Direct | Indirect | Line of business | ||||||||
Banesto Holdings, Ltd. (a) | Guernsey | 99.99 | % | 0.00 | % | INACTIVE | ||||||
Emisora Santander España, S.A. Sole-Shareholder Company | Spain | 100.00 | % | 0.00 | % | FINANCE | ||||||
Santander Emisora 150, S.A. Sole-Shareholder Company | Spain | 100.00 | % | 0.00 | % | FINANCE | ||||||
Santander Finance Capital, S.A., Sole-Shareholder Company | Spain | 100.00 | % | 0.00 | % | FINANCE | ||||||
Santander Finance Preferred, S.A., Sole-Shareholder Company | Spain | 100.00 | % | 0.00 | % | FINANCE | ||||||
Santander International Preferred, S.A. Sole-Shareholder Company | Spain | 100.00 | % | 0.00 | % | FINANCE | ||||||
Sovereign Real Estate Investment Trust | United States | 0.00 | % | 100.00 | % | FINANCE | ||||||
Totta & Açores Financing, Limited | Cayman Islands | 0.00 | % | 99.79 | % | FINANCE | ||||||
| Company in liquidation at December 31, |
F-284
Exhibit III
Preference share issuer subsidiaries
| % of ownership held by the Bank | ||||||||||||
Company | Location | Direct | Indirect | Line of business | ||||||||
Abbey National Capital Trust I | United States | — | (a | ) | FINANCE | |||||||
Banesto Holdings, Ltd. | Guernsey | 0.00 | % | 89.71 | % | SECURITIES INVESTMENT | ||||||
Santander Emisora 150, S.A. Sole-Shareholder Company | Spain | 100.00 | % | 0.00 | % | FINANCE | ||||||
Santander Finance Capital, S.A. Sole-Shareholder Company | Spain | 100.00 | % | 0.00 | % | FINANCE | ||||||
Santander Finance Preferred, S.A. Sole-Shareholder Company | Spain | 100.00 | % | 0.00 | % | FINANCE | ||||||
Santander International Preferred, S.A. Sole-Shareholder Company | Spain | 100.00 | % | 0.00 | % | FINANCE | ||||||
Santander PR Capital Trust I | Puerto Rico | 0.00 | % | 100.00 | % | FINANCE | ||||||
Sovereign Real Estate Investment Trust | United States | 0.00 | % | 100.00 | % | FINANCE | ||||||
Totta & Açores Financing, Limited | Cayman Islands | 0.00 | % | 99.75 | % | FINANCE | ||||||
F-285
Exhibit IV
Notifications of acquisitions and disposals of investments in 20112013
(Article 155 of the Spanish Limited Liability Companies Law and Article 53 of Securities Market Law 24/1998):.
On FebruaryMay 7, 2011,2013, the CNMV registered a notification from Banco Santander S.A. which disclosed that Santander Group’s ownership interest in BANESTOOBRASCON HUARTE LAIN, S.A. had fallen below 90%exceeded 3% on January 28, 2011.April 26, 2013.
On July 11, 2011,May 7, 2013, the CNMV registered a notification from Banco Santander S.A. which disclosed that Santander Group’s ownership interest in BANKINTER,OBRASCON HUARTE LAIN, S.A. had exceededfallen below 3% on July 1, 2011.May 3, 2013.
On July 11, 2011,May 9, 2013, the CNMV registered a notification from Banco Santander S.A. which disclosed that Santander Group’s ownership interest in BANKINTER,METROVACESA, S.A. had fallen below 3%30% on July 1, 2011.May 3, 2013. (The reason for the notification was the change from indirect to direct ownership of the shares of METROVACESA, S.A held by BANESTO as a result of the merger by absorption of BANESTO into BANCO SANTANDER.)
On July 28, 2011,May 16, 2013, the CNMV registered a notification from Banco Santander S.A. which disclosed that Santander Group’s ownership interest in FERROVIAL,OBRASCON HUARTE LAIN, S.A. had fallen belowexceeded 3% on July 20, 2011.May 8, 2013.
On August 4, 2011,May 16, 2013, the CNMV registered a notification from Banco Santander which disclosed that Santander Group’s ownership interest in OBRASCON HUARTE LAIN, S.A. had fallen below 3% on May 13, 2013.
On May 21, 2013, the CNMV registered a notification from Banco Santander which disclosed that Santander Group’s ownership interest in METROVACESA, S.A. had exceeded 30%35% on August 2, 2011.May 16, 2013.
On November 14, 2011,December 16, 2013, the CNMV registered a notification from Banco Santander S.A. which disclosed that Santander Group’s ownership interest in FERROVIAL,BOLSAS Y MERCADOS ESPAÑOLES, SDAD HOLDING DE MDOS Y SMAS FIN., S.A. had exceeded 3% on November 7, 2011.December 6, 2013.
On December 18, 2013, the CNMV registered a notification from Banco Santander which disclosed that Santander Group’s ownership interest in BOLSAS Y MERCADOS ESPAÑOLES, SDAD HOLDING DE MDOS Y SMAS FIN., S.A. had fallen below 3% on December 16, 2013.
F-286
Exhibit V
Other information on the share capital of the Group’s banks
| A) | Following is certain information on the share capital of the Group’s main banks based on their total assets. |
| 1. | Santander UK plc |
a) Number of financial equity instruments held by the Group
The Group holds ordinary shares amounting to GBP 3,105,176,886.60 through Banco Santander, S.A. (24,117,268,865 shares with a par value of GBP 0.10 each), Cántabro Catalana de Inversiones, S.A. (1 share with a par value of GBP 0.10) and Santusa Holding, S.L. (6,934,500,000 shares with a par value of GBP 0.10 each).
On October 23, 1995 and February 13, 1996, Santander UK plc issued subordinated bonds, for a total of GBP 200 million, which are convertible into non-cumulative preference shares with a par value of GBP 1 each. The exchange may be performed on any interest payment date provided that shareholders receive between 30 and 60 days’ notice. The Group holds 63,913,355 securities through Santander Financial Exchanges Limited.
In addition, on June 9, 1997, Santander UK plc also issued subordinated bonds, for a total of GBP 125 million, which are convertible into non-cumulative preference shares with a par value of GBP 1 each. At the discretion of the issuer, the exchange may be performed on any interest payment date, provided that holders receive between 30 and 60 days’ notice. The Group holds 100,487,938 securities through Santander Financial Exchanges Limited.
On April 28, 2010, Santander UK plc issued 300 million preference shares with a par value of GBP 1 each to replace, pursuant to current legislation, a previous issue launched by Alliance & Leicester Limited under the same terms and conditions. As part of this new issue, the Group holds 107.3 million shares through Banco Santander, S.A. and 155.7 million shares through Santander Financial Exchanges Limited.
b) Capital increases in progress
No approved capital increases are in progress.
c) Repurchases of share capital authorized by the shareholders at the general meeting
The shareholders at the annual general meeting held on April 24, 2013 resolved to unconditionally authorize the company to carry out the following repurchases of share capital.
1. The repurchase of its own 8.625% yield preference shares, subject to the following conditions:
| (a) | The company may repurchase up to 125,000,000 of the 8.625% yield preference shares; |
| (b) | The lowest price that the company may pay for the 8.625% yield preference shares will be 75% of the average market price of the preference shares for the five days prior to the purchase; and |
| (c) | The highest price (excluding costs) that the company may pay for each 8.625% yield preference share will be 125% of the average market price of the preference shares for the five days prior to the purchase. |
The authorization will expire at the date of the next annual general meeting of the company unless it is renewed, amended or revoked by the company. However, prior to such expiry, the company may enter into an agreement on the share capitalrepurchase of its 8.625% yield preference shares even if the purchase is finalized after this authorization expires.
2. The repurchase of its own 10.375% yield preference shares, subject to the following conditions:
| (a) | The company may repurchase up to 200,000,000 of the 10.375% yield preference shares; |
| (b) | The lowest price that the company may pay for the 10.375% yield preference shares will be 75% of the average market price of the preference shares for the five days prior to the purchase; and |
| (c) | The highest price (excluding costs) that the company may pay for each 10.375% yield preference share will be 125% of the average market price of the preference shares for the five days prior to the purchase. |
The authorization will expire at the date of the Group’s banks.company’s next annual general meeting unless it is renewed, amended or revoked by the company. However, prior to such expiry, the company may enter into an agreement on the repurchase of its 10.375% yield preference shares even if the purchase is finalized after this authorization expires.
1) Banco3. The repurchase of its own fixed/floating rate series A non-cumulative preference shares subject to the following conditions:
| (a) | The company may repurchase up to 300,002 redeemable fixed/floating rate series A non-cumulative preference shares; |
| (b) | The lowest price that the company may pay for the redeemable fixed/floating rate series A non-cumulative preference shares will be 75% of the average market price of the preference shares for the five days prior to the purchase; and |
| (c) | The highest price (excluding costs) that the company may pay for each redeemable fixed/floating rate series A non-cumulative preference shares will be 125% of the average market price of the preference shares for the five days prior to the purchase. |
The authorization will expire at the date of the company’s next annual general meeting unless it is renewed, amended or revoked by the company. However, prior to such expiry, the company may enter into an agreement on the repurchase of its redeemable fixed/floating rate series A non-cumulative preference shares even if the purchase is finalized after this authorization expires.
However, prior to such expiry, the Company may submit bids or adopt resolutions that could require the allocation of shares and the directors may allocate shares in accordance with any bid or resolution, notwithstanding the expiry of the authorization granted in this resolution.
In accordance with this resolution, any previous authorizations granted to the directors and not exercised for the allocation of shares are hereby revoked and substituted, notwithstanding any allocation of shares or grant of rights already completed, offered or agreed.
d) Rights on founder’s shares, “rights” bonds, convertible debentures and similar securities or rights
Not applicable.
e) Specific circumstances that restrict the availability of reserves
Not applicable.
f) Non-Group entities which hold, directly or through subsidiaries, 10% or more of equity
Not applicable.
g) Quoted equity instruments
Not applicable.
| 2. | Abbey National Treasury Services plc |
a) Number of financial equity instruments held by the Group
The Group holds ordinary shares amounting to GBP 2,549,000,000 through Santander (Brasil) S.A.UK plc (2,584,999,999 shares with a par value of GBP 1 each) and Abbey National Nominees Limited (1 share with a par value of GBP 1).
The Group also holds 1,000 tracker shares (shares without voting rights but with preferential dividend rights) amounting to GBP 1,000 and 1,000 B tracker shares amounting to GBP 1,000 through Santander UK plc, both with a par value of GBP 1 each.
b) Capital increases in progress
No approved capital increases are in progress.
c)Capital authorized by the shareholders at the general meeting
Not applicable.
d) Rights on founder’s shares, “rights” bonds, convertible debentures and similar securities or rights
Not applicable.
e) Specific circumstances that restrict the availability of reserves
Not applicable.
f) Entities which hold, directly or through subsidiaries, 10% or more of equity
Not applicable.
g)Quoted equity instruments
Not applicable.
| 3. | Banco Santander (Brasil) S.A. |
a) Number of equity instruments held by the Group
The Group holds 174,700,972,307161,084,696,502 ordinary shares and 150,024,316,265137,645,883,715 preference shares through Banco Santander S.A. and its subsidiaries Sterrebeeck B.V., Grupo Empresarial Santander, S.L. and Santander Insurance Holding, S.L.
The shares composing the share capital of Banco Santander (Brasil) S.A. have no par value and there are no capital payments payable. At 20112013 year-end the bank’s treasury shares consisted of 391,253,5001,021,459,175 ordinary shares and 355,685,000928,599,250 preference shares, with a total of 1,950,058,425 shares.
In accordance with current Bylaws (Article 5.7) the preference shares do not confer voting rights on their holders, except under the following circumstances:
a) In the event of the transformation, merger, consolidation or spin-off of the company.
b) In the event of approval of agreements between the company and the shareholders, either directly, through third parties or other companies in which the shareholders hold a stake, provided that, due to legal or bylaw provisions, they are submitted to a general meeting.
c) In the event of an assessment of the assets used to increase the company’s share capital.
d) The selection of a specialisedspecialized entity or company to determine the economic value of the company.
e) Amendments and repeals of bylaw provisions that change any of the requirements stipulated in point 4.1 of the Level 2 Best Practices on Corporate Governance of the Brazilian Securities Commodities and Futures Exchange (BM&FBOVESPA), although these voting rights will prevail upon the entry into force of the Agreement for the Adoption of the Level 2 Best Practices on Corporate Governance.
The General Assembly may, at any moment, decide to convert the preference shares into ordinary shares, establishing a reason for the conversion.
However, the preference shares do have the following advantages (Article 5.6):
a) Their dividends are 10% higher than those on ordinary shares.
b) Priority in the distribution of dividends.
c) Participation, on the same terms as ordinary shares, in capital increases resulting from the capitalisationcapitalization of reserves and profits and in the distribution of bonus shares arising from the capitalisationcapitalization of retained earnings, reserves or any other funds.
d) Priority in the reimbursement of capital in the event of the dissolution of the company.
F-287
e) In the event of a public offering due to a change in control of the company, the holders of preference shares are guaranteed the right to sell the shares at the same price paid for the block of shares that changed hands as part of the change of control, i.e. they are treated the same as shareholders with voting rights.
b) Capital increases in progress
No approved capital increases are in progress.
c) Capital authorized by the shareholders at the general meeting
The company is authorized to increase share capital, subject to approval by the board of directors, up to a limit of 500,000,000,000 ordinary shares or preference shares, and without the need to maintain any ratio between any of the different classes of shares, provided they remain within the limits of the maximum number of preference shares established by Law.
At present the share capital consists of 399,044,116,905 shares (212,841,731,754 ordinary shares and 186,202,385,151 preference shares).
d)d) Rights on founder’s shares, “rights” bonds, convertible debentures and similar securities or rights
Not applicable.
e) Specific circumstances that restrict the availability of reserves
The only restriction on the availability of Banco Santander (Brasil) S.A.’s reserves relates to the legal reserve (restricted reserves), which can only be used to offset losses or to increase capital.
The legal reserve is provided for in Article 196 of the Spanish Public Limited Liability Companies Law, which establishes that before being allocated to any other purpose, 5% of profits must be transferred to the legal reserve, which must not exceed 20% of share capital.
f) Non-Group entities which hold, directly or through subsidiaries, 10% or more of equity
Not applicable.
g) Quoted equity instruments
All the shares are listed on the Brazilian Securities, Commodities and Futures Exchange (BM&FBOVESPA) and the share deposit certificates (units) are listed on the New York Stock Exchange (NYSE).
2) Banco Español de Crédito, S.A. (Banesto)
| 4. | Santander Bank, National Association |
a) Number of financial equity instruments held by the Group
The share capital of Banco Español de Crédito, S.A. consists of 687,386,798 fully subscribed and paid shares of EUR 0.79 par value each, all with identical voting and dividend rights.
At December 31, 2011,2013, the ParentGroup held 520,307,043 ordinary shares which carry the same voting and its subsidiaries held 89.03%dividend acquisition rights on Santander Holdings USA, Inc. This holding company and Independence Community Bank Corp. hold 1,237 ordinary shares with a par value of USD 1 each and the same voting rights, representing the entire share capital (612,007,016 ordinary shares), of which Banco Santander S.A. held 606,345,555 shares (88.21%) and Cantabro Catalana de Inversiones, S.A. held 5,661,461 shares (0.82%). At that date the Banesto Group held 5,160,868 treasury shares previously acquired under authorisation of the general meeting, within the limits set forth in Articles 144 et seq of the Spanish Limited Liability Companies Law.
F-288
b) Capital increases in progress
No approved capital increases are in progress.
c) Capital authorized by the shareholders at the general meeting
The annual general meeting of Banco Español de Crédito,Santander, S.A. held at first call on February 26, 2008 authorizedis the board of directors to increase capital at one or several times and at any time, within five years from the date of the annual general meeting, by an amount (par value) of up to half the share capital of the Bank at the date of the meeting, through the issuance of new shares, with or without share premium and with or without voting rights; the consideration for the new shares to be issued will be monetary contributions, and the Board may set the terms and conditions of the capital increase. Also, the Board was empowered to disapply preemptive subscription rights, fully or partially, in accordance with Article 506 of the Spanish Limited Liability Companies Law.sole shareholder.
d) Rights on founder’s shares, “rights” bonds, convertible debentures and similar securities or rights
At December 31, 2011, no securities with these characteristics had been issued.Not applicable.
e) Specific circumstances that restrict the availability of reserves
The legal reserve can be used to increase capital provided that the remaining reserve balance does not fall below 10% of the increased share capital amount (10% of any net profit reported each year must be transferred to the legal reserve until the balance of this reserve reaches 20% of share capital). Pursuant to the Spanish Limited Liability Companies Law, a restricted reserve has been recorded for an amount equal to the carrying amount of the Banesto shares owned by subsidiaries.Not applicable.
The revaluation reserve recorded pursuant to Royal Decree-Law 7/1996, of June 7, can be used to increase capital. On February 26, 2008, the shareholders at the general meeting resolved to reduce capital with a charge to voluntary reserves and the corresponding amount was deducted from the restricted reserve to which Article 148.c of the Spanish Limited Liability Companies Law refers and a reserve for retired capital of EUR 5,485,207 (the same amount as the par value of the retired shares) was recorded. This reserve will be unrestricted under the same conditions as for the share capital reduction, in accordance with Article 335.c of the Spanish Limited Liability Companies Law.
f) Non-Group entities which hold, directly or through subsidiaries, 10% or more of equity
Not applicable.
g) Quoted equity instruments
All theClass C preference shares are listed on the SpanishNew York Stock Exchanges.Exchange (NYSE).
3) Banco Santander Totta, S.A. (Totta)
| 5. | Banco Santander (México), S.A., Institución de Banca Múltiple, Grupo Financiero Santander México |
a) Number of equity instruments held by the Group
The Group holds 655,961,865 ordinary sharesa 75% ownership interest in the subsidiary in Mexico through its subsidiaries: Santander Totta, SGPS, S.A. with 641,269,620 shares, Taxagest Sociedade Gestora de Participações Sociais, S.A. with 14,593,315 shares, and Banco Santander Totta, S.A. with 98,930 treasury shares, all of which have a par value of EUR 1 each and identical voting and dividend rights and are subscribed and paid in full.
F-289
b) Capital increases in progress
No approved capital increases are in progress.
c) Capital authorized by the shareholders at the general meeting
Not applicable.
d)Rights on founder’s shares, “rights” bonds, convertible debentures and similar securities or rights
At December 31, 2011, no securities with these characteristics had been issued.
e) Specific circumstances that restrict the availability of reserves
Under Article 296 of the Portuguese Companies’ Code, the legal and merger reserves can only be used to offset losses or to increase capital.
Non-current asset revaluation reserves are regulated by Decree-Law 31/1998, under which losses can be offset or capital increased by the amounts for which the underlying asset is depreciated, amortised or sold.
f) Non-Group entities which hold, directly or through subsidiaries, 10% or more of equity
Not applicable.
g) Quoted equity instruments
Totta’s shares are not listed.
4) Banco Santander- Chile
a) Number of equity instruments held by the Group
The Group holds 126,593,017,845 ordinary shares through its subsidiaries: Santander Chile Holding S.A. with 66,822,519,695 ordinary shares, Teatinos Siglo XXI Inversiones Limitada with 59,770,481,573 ordinary shares and Santander Inversiones Limitada with 16,577 ordinary shares, all of which have no par value, are fully subscribed and paid and carry the same voting and dividend rights.
b) Capital increases in progress
No approved capital increases are in progress.
c) Capital authorized by the shareholders at the general meeting
Share capital amounted to CLP 891,302,881,691 at December 31, 2011. However, each year the annual general meeting must approve the balance sheet at December 31 of the previous year and, therefore, approve the share capital amount.
d) Rights on founder’s shares, “rights” bonds, convertible debentures and similar securities or rights
At December 31, 2011, no securities with these characteristics had been issued.
F-290
e) Specific circumstances that restrict the availability of reserves
Remittances to foreign investors in relation to investments made under the Statute of Foreign Investment (Decree-Law 600/1974) and the amendments thereto require the prior authorisation of the foreign investment committee.
f) Non-Group entities which hold, directly or through subsidiaries, 10% or more of equity
Not applicable.
g) Quoted equity instruments
All the shares are listed on the Chilean Stock Exchanges and, through American Depositary Receipts (ADRs), on the New York Stock Exchange (NYSE).
5) Banco Santander (México), S.A., Institución de Banca Múltiple,holding company Grupo Financiero Santander
a) Number of equity instruments held by the Group
At December 31, 2011, the Group held 78,284,373,735 ordinary shares through Grupo Financiero Santander, México, S.A. B de C.V. This holding company and Santander Global Facilities, S.A. de C.V. (México), held 80,848,258,165 ordinary shares representing 99.99% of the share capital of Banco Santander (México), S.A., Institución de Banca Múltiple, Grupo Financiero Santander.Santander México at December 31, 2013.
b) Capital increases in progress
NoAt December 31, 2013 there were no approved capital increases are in progress.
c) Capital authorized by the shareholders at the general meeting
The shareholders at the extraordinary and annual general meeting held on August 18, 2008February 22, 2012 resolved to setincrease the authorized share capital of Banco Santander (México), S.A., Institución de Banca Múltiple, Grupo Financiero Santander atto MXN 7,829,149,572.60,8,085,540,380.30, represented by a total of 78,291,495,72680,855,403,803 fully subscribed and paid shares of MXN 0.10 par value each.
d) Rights on founder’s shares, “rights” bonds or debt issues, convertible debentures and similar securities or rights
(i) At the board of directors meeting held on October 17, 2013 the directors ratified the limits approved at the board meeting held on October 26, 2011 relating to the issue of senior or subordinated debt for a maximum term of 15 years. They also approved including debt instruments that qualify as capital under current legislation and resolved that such issue may be instrumented individually or through various issue programs. On December 13, 2013, the shareholders at the general meeting approved that the Bank, pursuant to such limits, issue capitalization instruments qualifying as Tier 2 capital amounting to approximately USD 1,000,000.
On December 19, 2013, Banco Santander (Mexico) issued a total of USD 1,300,000,000 in subordinated notes that meet the capital requirements established by Basel III for Tier 2 capital at a rate of 6.125% and maturing in 2023. The Parent of Santander México, Banco Santander, S.A. Spain, resolved to purchase USD 975,000,000, i.e. 75% of the total amount of the notes.
These notes were offered through a private placement to qualified institutional buyers only in accordance with Rule 144A under the US Securities Act of 1933 and subsequent amendments thereto. Outside the US, they were offered in accordance with Regulation S of the Securities Act.
The issue was approved with a view to increasing the efficiency of the Bank’s capital structure, adapting the Bank’s profile with regard to capitalization to that of its competitors and obtaining a greater performance of capital with the same strength of capital and capacity for growth of risk-weighted assets.
(ii) The shareholders at the general meeting held on May 14, 2012 ratified the resolution adopted by the shareholders at the extraordinary general meeting held on March 17, 2009, resolved to approvewhich approved the arrangement of a groupcollective loan of USD 1,100,000,000 from the shareholders for USD 1,000,000,000 through the placement of unsecured subordinated non-preferentialnon-preference debentures which are not convertible into shares. It should be noted that thisThis issue had not yet been launched at the reporting date.
(iii) At the board of directors meeting held on January 27, 2011 the directors approved the general terms and conditions for the issue of senior debt in international markets. This issue of USD 500 and USD 1,000 million at a five to ten year term was authorized on October 18, 2012. The issue was approved in order to obtain resources to finance the increase of business assets and the management of the Bank’s liquidity. As a result of these resolutions adopted by the board of directors, on November 9, 2012, debt amounting to USD 1,000 million was issued.
e) Specific circumstances that restrict the availability of reserves
Pursuant to the Mexican Credit Institutions Law and the general provisions applicable to credit institutions, the Mexican Companies Law and the institutions’ own Bylaws, universal banking institutions are required to constitute or increase capital reserves for the purposes of ensuring solvency and protecting payment systems and savers.
The bank increases its legal reserve annually directly from the profit obtained in the year. The legal reserve can be used for any purpose, but the balance must be replenished.
F-291
The Bankbank must recogniserecognize the various reserves as stipulated in the legal provisions applicable to credit institutions. Credit loss reserves are calculated on the basis of the credit rating assigned to each loan and are released when the rating of the related loan improves or when the loan is settled.
f) Non-Group entities which hold, directly or through subsidiaries, 10% or more of equity
Not applicable.
g) Quoted equity instruments
The company does not have any equity instruments quoted on a stock exchange.
6) Santander UK plc
a) Number of equity instruments held by the Group6. Banco Santander Totta, S.A.
The Group holds 656,112,362 ordinary shares amounting to GBP 3,105,176,886.60 through its subsidiaries: Santander Totta, SGPS, S.A. with 641,269,620 shares, Taxagest Sociedade Gestora de Participações Sociais, S.A. with 14,593,315 shares, and Banco Santander Totta, S.A. (24,117,268,865with 249,427 treasury shares, with a par valueall of GBP 0.10 each), Cántabro Catalana de Inversiones, S.A. (1 share withwhich have a par value of EUR 0.1) and Santusa Holding S.L. (6,934,500,000 shares with a par value of GBP 0.10 each).
On October 23, 1995 and February 13, 1996, Santander UK plc issued subordinated bonds, for a total of GBP 200 million, which are convertible into non-cumulative preference shares with a par value of GBP 1 each. At the discretion of the issuer, the exchange may be performed on any interest payment date provided that holders receive between 30 and 60 days’ notice. The Group holds 63,913,355 securities through Santander Financial Exchanges Limited.
On June 9, 1997, Santander UK plc also issued subordinated bonds, for a total of GBP 125 million, which are convertible into non-cumulative preference shares with a par value of GBP 1 each. At the discretion of the issuer, the exchange may be performed on any interest payment date, provided that holders receive between 30 and 60 days’ notice. The Group holds 100,487,938 securities through Santander Financial Exchanges Limited.
On April 28, 2010, Santander UK plc issued 300 million preference shares with a par value of GBP 1 each to replace, pursuant to current legislation, a previous issue launched by Alliance & Leicester plc under the same terms and conditions. As part of this new issue, the Group holds 107.3 million shares through Banco Santander, S.A.identical voting and 155.7 million shares through Santander Financial Exchanges Limited.dividend rights and are subscribed and paid in full.
b) Capital increases in progress
No approved capital increases are in progress.
| c) Capital authorized by the |
The shareholders at the annual general meeting held on June 16, 2011 resolved to unconditionally authorise the company to carry out the following repurchases of share capital.
1. The repurchase of its own 8.625% yield preference shares, subject to the following conditions:Not applicable.
F-292
It is hereby stated that this authorisation will expire at the date of the next annual general meeting of the company unless it is renewed, amended or revoked by the company. However, prior to such expiry, the company may enter into an agreement on the repurchase of its 8.625% yield preference shares even if the purchase is finalised after this authorisation expires.
2. The repurchase of its own 10.375% preference shares, subject to the following conditions:
It is hereby stated that this authorisation will expire at the date of the next annual general meeting of the company unless it is renewed, amended or revoked by the company. However, prior to such expiry, the company may enter into an agreement on the repurchase of its 10.375% yield preference shares even if the purchase is finalised after this authorisation expires.
3. The repurchase of its own fixed/floating rate series A non-cumulative preference shares subject to the following conditions:
It is hereby stated that this authorisation will expire at the date of the next annual general meeting of the company unless it is renewed, amended or revoked by the company. However, prior to such expiry, the company may enter into an agreement on the repurchase of its redeemable fixed/floating rate series A non-cumulative preference shares even if the purchase is finalised after this authorisation expires.
However, prior to such expiry, the company may make offers or enter into agreements which could require the allocation of shares, and the directors may allocate shares pursuant to any offer or agreement, irrespective of the expiry of the authorisation granted by this resolution.
Pursuant to this resolution, any previously unexercised authorisations granted to directors to allocate shares are revoked and replaced without prejudice to any allocation of shares or grant of rights already performed, offered or agreed.
d) Rights on founder’s shares, “rights” bonds, convertible debentures and similar securities or rights
Not applicable.
F-293
e) Specific circumstances that restrict the availability of reserves
Not applicable.Under Article 296 of the Portuguese Companies’ Code, the legal and merger reserves can only be used to offset losses or to increase capital.
Non-current asset revaluation reserves are regulated by Decree-Law 31/1998, under which losses can be offset or capital increased by the amounts for which the underlying asset is depreciated, amortized or sold.
f) Non-Group entities which hold, directly or through subsidiaries, 10% or more of equity
Not applicable.
g) Quoted equity instruments
The shares of Banco Santander Totta, S.A. are not listed.
| 7. | Santander Consumer Bank AG |
a) Number of financial equity instruments held by the Group
At December 31, 2013, through Santander Consumer Holding GmbH, the Group held 30,002 ordinary shares with a par value of EUR 1,000 each, all of which carry the same voting rights.
b) Capital increases in progress
At December 20, 2013, by means of a decision by the sole shareholder, Santander Consumer Finance, S. A., a capital increase was approved at Santander Consumer Holding Gmbh for EUR 3,660,000,000, thereby improving the capital ratios of the holding company of Santander Consumer Bank AG.
c)Capital authorized by the shareholders at the general meeting
Not applicable.
7) Santander Holdings USA, Inc.d) Rights on founder’s shares, “rights” bonds, convertible debentures and similar securities or rights
Not applicable.
e) Specific circumstances that restrict the availability of reserves
Not applicable.
f) Entities which hold, directly or through subsidiaries, 10% or more of equity
Not applicable.
g) Quoted equity instruments
Not applicable.
| 8. | Banco Santander- Chile |
a) Number of equity instruments held by the Group
At December 31, 2011,The Group holds a 67% ownership interest in its subsidiary in Chile corresponding to 126,593,017,845 ordinary shares of Banco Santander – Chile through its subsidiaries: Santander Chile Holding S.A. held 520,307,043with 66,822,519,695 ordinary shares, all of whichTeatinos Siglo XXI Inversiones Limitada, now known as Teatinos Siglo XXI Inversiones S. A., with 59,770,481,573 ordinary shares and Santander Inversiones Limitada with 16,577 fully subscribed and paid ordinary shares that carry the same voting and dividend rights.
b) Capital increases in progress
No approved capital increases are in progress.
On December 15, 2011, the board of directors authorized a capital increase of USD 1,000,000,000, which was approved by Banco Santander, S.A. This capital increase was carried out through the sale of 3,200,000 ordinary shares at a price of USD 250 each, increasing share capital by USD 800 million. In addition, Santander Holdings USA, Inc. paid Banco Santander, S.A. a dividend of USD 800 million, thereby reducing reserves by this amount. As a result of this transaction, total share capital remained the same.
c) Capital authorized by the shareholders at the general meeting
Banco Santander, S.A. is the sole shareholder.Share capital at December 31, 2013 amounted to CLP 891,302,881,691.
d) Rights on founder’s shares, “rights” bonds, convertible debentures and similar securities or rights
Not applicable.At December 31, 2013, no securities with these characteristics had been issued.
e) Specific circumstances that restrict the availability of reserves
Not applicable.Remittances to foreign investors in relation to investments made under the Statute of Foreign Investment (Decree-Law 600/1974) and the amendments thereto require the prior authorization of the foreign investment committee.
f) Non-Group entities which hold, directly or through subsidiaries, 10% or more of equity
Not applicable.
g) Quoted equity instruments
Class C preferenceAll the shares are listed on the Chilean Stock Exchanges and, through American Depositary Receipts (ADRs), on the New York Stock Exchange (NYSE).
| 9. | Banco Zachodni WBK S.A. |
F-294
8) Bank Zachodni WBK S.A.
a) Number of financial equity instruments held by the Group
At December 31, 2011,2013, Banco Santander, S.A. held 70,334,51265,481,563 ordinary shares with a par value of PLN 10 each, all of which carry the same voting rights.
b)b) Capital increases in progress
No approvedThere were no capital increases are in progress.progress at the end of 2013. On July 30, 2012, the shareholders at the extraordinary general meeting approved the merger with Kredyt Bank S.A., thereby resolving to increase the share capital by PLN 189,074,580 (the increase was made effective January 4, 2013).
c)c) Capital authorized by the shareholders at the general meeting
Not applicable.
d) Rights on founder’s shares, “rights” bonds, convertible debentures and similar securities or rights
At the annual general meeting held on April 20, 2011, the shareholders resolved to approve the so-called “Incentive“Incentive Scheme IV”IV” as an initiative to attract, motivate and retain the bank’s employees. Delivery of the shares is tied to the achievement of certain targets in the years from 2011 to 2013. The bank considers that the exercise of these rights might give rise to the issuance of up tomore than 400,000 shares.
e) Specific circumstances that restrict the availability of reserves
Not applicable.
f) Non-Group entitiesEntities which hold, directly or through subsidiaries, 10% or more of equity
Not applicable.
g) Quoted equity instruments
All the shares of Bank Zachodni WBK, S.A. are listed on the localWarsaw stock exchange in Warsaw, namely the Giełda Papierów Wartościowych S.A.
9) Banco Santander Río S.A.
a) Number of equity instruments held by the Group
At December 31, 2011, Banco Santander, S.A. held 141,911,008 class A shares, 293,971,417 class B shares and 635,447,536 preference shares of Banco Santander Río S.A., representing 99.30% of the share capital, through Administración de Bancos Latinoamericanos Santander S.L., BRS Investment S.A. and Santander Overseas Bank, Inc.
b) Capital increases in progress
At the annual and extraordinary general meeting of the bank held on March 16, 2011, the shareholders resolved to approve a capital increase for public subscription in the sum of up to ARP 145,000,000 through the issue of up to 145,000,000 registered class B ordinary shares with a par value of ARP 1 each, with one voting right per share and with dividend rights from the year after that in which they are subscribed.
| B) | The restrictions on the ability to access or use the assets and also to settle the Group’s liabilities, as required under paragraph 13 of IFRS 12, are described below. |
F-295
The shareholders also approved the right to convert preference shares into class B ordinary shares with a par value of ARP 1 each, with one voting right per share, at a ratio of one preference share for each class B ordinary share.
c) Capital authorized by the shareholders at the general meeting
The authorized share capital of Banco Santander Río S.A. amounts to ARP 1,078,875,015, represented by a total of 1,078,875,015 fully subscribed and paid shares with a par value of ARP 1 each.
d) RightsIn certain jurisdictions, restrictions have been established on founder’s shares, “rights” bonds, convertible debentures and similar securities or rights
Not applicable.
e) Specific circumstances that restrict the availability of reserves
Financial institutions must recognise the legal reserve required by Article 33 of Argentine Law 21,526.
The reserve must be recognized by transferring 20% of net profit for each year, including the adjustments to prior years’ results recognized in the year and any accumulated loss recognized at the previous year-end.
This proportion must be applied irrespective of the ratio of the legal reserve balance to the company’s share capital.
With respect to the distribution of profit,dividends on the Central Bankbasis of the Republicnew, much more stringent capital adequacy regulations. However, there is currently no evidence of Argentina (BCRA) has ruled thatany practical or legal impediment to the total minimumtransfer of funds by Group subsidiaries to the Parent in the form of dividends, loans, advances, repatriation of capital of companies wishing to distribute dividends must not be lower than the sum of the capital requirements for credit risk, interest rate risk, market risk and operational risk, increased by 75%.or any other means.
Also, the distribution of profit must be expressly authorized by the Argentine Financial and Exchange Institutions Authority, which must check that the procedures required by legislation for the distribution of profits have been complied with.
Exhibit VI
f) Non-Group entities which hold, directly or through subsidiaries, 10% or more of equity
Not applicable.
g) Quoted equity instruments
The shares have been listed on the Buenos Aires Stock Exchange (BCBA) since 1997, and on Latibex (the market for Latin-American stocks in euros) in Spain since 1999.
| (Millions of Euros) | Year end December 31, | |||||||||||||||||||||||||||||||||||||||
| 2013 | 2012 | 2011 | 2010 | 2009 | ||||||||||||||||||||||||||||||||||||
IFRS: | Including interest on deposits | Excluding interest on deposits | Including interest on deposits | Excluding interest on deposits | Including interest on deposits | Excluding interest on deposits | Including interest on deposits | Excluding interest on deposits | Including interest on deposits | Excluding interest on deposits | ||||||||||||||||||||||||||||||
FIXED CHARGES: | ||||||||||||||||||||||||||||||||||||||||
Fixed charges and preferred stock dividends | 25,162 | 10,499 | 28,466 | 11,903 | 29,624 | 12,590 | 23,197 | 9,476 | 26,392 | 10,540 | ||||||||||||||||||||||||||||||
Preferred dividends | 112 | 112 | 132 | 132 | 99 | 99 | 61 | 61 | 92 | 92 | ||||||||||||||||||||||||||||||
Fixed charges | 25,050 | 10,387 | 28,334 | 11,771 | 29,525 | 12,491 | 23,136 | 9,415 | 26,300 | 10,448 | ||||||||||||||||||||||||||||||
EARNINGS: | ||||||||||||||||||||||||||||||||||||||||
Income from continuing operations before taxes and extraordinary items | 7,652 | 7,652 | 3,583 | 3,583 | 7,858 | 7,858 | 12,010 | 12,010 | 10,633 | 10,633 | ||||||||||||||||||||||||||||||
Less: Earnings from associated companies | 197 | 197 | 427 | 427 | 57 | 57 | 17 | 17 | (6 | ) | (6 | ) | ||||||||||||||||||||||||||||
Fixed charges | 25,050 | 10,387 | 28,334 | 11,771 | 29,525 | 12,491 | 23,136 | 9,415 | 26,300 | 10,448 | ||||||||||||||||||||||||||||||
|
|
|
|
|
|
|
|
|
|
|
|
|
|
|
|
|
|
|
| |||||||||||||||||||||
Total earnings | 32,505 | 17,842 | 31,490 | 14,927 | 37,326 | 20,292 | 35,129 | 21,408 | 36,939 | 21,087 | ||||||||||||||||||||||||||||||
Ratio of earnings to fixed charges | 1.30 | 1.72 | 1.11 | 1.27 | 1.26 | 1.62 | 1.52 | 2.27 | 1.40 | 2.02 | ||||||||||||||||||||||||||||||
Ratio of earnings to combined fixed charges and preferred stock dividends | 1.29 | 1.70 | 1.11 | 1.25 | 1.26 | 1.61 | 1.51 | 2.26 | 1.40 | 2.01 | ||||||||||||||||||||||||||||||
F-296F-349
Exhibit VI
| Year end December 31, | ||||||||||||||||||||||||||||||||||||||||
| 2011 | 2010 | 2009 | 2008 | 2007 | ||||||||||||||||||||||||||||||||||||
| Including | Excluding | Including | Excluding | Including | Excluding | Including | Excluding | Including | Excluding | |||||||||||||||||||||||||||||||
| interest on | interest on | interest on | interest on | interest on | interest on | interest on | interest on | interest on | interest on | |||||||||||||||||||||||||||||||
| deposits | deposits | deposits | deposits | deposits | deposits | deposits | deposits | deposits | deposits | |||||||||||||||||||||||||||||||
IFRS: | ||||||||||||||||||||||||||||||||||||||||
FIXED CHARGES: | ||||||||||||||||||||||||||||||||||||||||
Fixed charges and preferred stock dividends | 29,636,004 | 12,590,540 | 23,208,389 | 9,475,888 | 26,392,227 | 10,540,180 | 37,041,015 | 17,756,819 | 30,569,963 | 15,980,396 | ||||||||||||||||||||||||||||||
Preferred dividends | 99,031 | 99,031 | 60,689 | 60,689 | 92,294 | 92,294 | 37,374 | 37,374 | 47,290 | 47,290 | ||||||||||||||||||||||||||||||
Fixed charges | 29,536,973 | 12,491,509 | 23,147,699 | 9,415,198 | 26,299,933 | 10,447,886 | 37,003,641 | 17,719,445 | 30,522,673 | 15,933,106 | ||||||||||||||||||||||||||||||
EARNINGS: | ||||||||||||||||||||||||||||||||||||||||
Income from continuing operations before taxes and extraordinary items | 7,939,346 | 7,939,346 | 12,051,873 | 12,051,873 | 10,587,800 | 10,587,800 | 10,849,325 | 10,849,325 | 10,970,494 | 10,970,494 | ||||||||||||||||||||||||||||||
Less: Earnings from associated companies | 56,696 | 56,696 | 16,910 | 16,910 | (5,870 | ) | (5,870 | ) | 695,880 | 695,880 | 291,401 | 291,401 | ||||||||||||||||||||||||||||
Fixed charges | 29,536,973 | 12,491,509 | 23,147,699 | 9,415,198 | 26,299,933 | 10,447,886 | 37,003,641 | 17,719,445 | 30,522,673 | 15,933,106 | ||||||||||||||||||||||||||||||
|
|
|
|
|
|
|
|
|
|
|
|
|
|
|
|
|
|
|
| |||||||||||||||||||||
Total earnings | 37,419,623 | 20,374,159 | 35,182,662 | 21,450,161 | 36,893,603 | 21,041,556 | 47,157,086 | 27,872,890 | 41,201,766 | 26,612,199 | ||||||||||||||||||||||||||||||
Ratio of earnings to fixed charges | 1.27 | 1.63 | 1.52 | 2.28 | 1.40 | 2.01 | 1.27 | 1.57 | 1.35 | 1.67 | ||||||||||||||||||||||||||||||
Ratio of earnings to combined fixed charges and preferred stock dividends | 1.26 | 1.62 | 1.52 | 2.26 | 1.40 | 2.01 | 1.27 | 1.57 | 1.35 | 1.67 | ||||||||||||||||||||||||||||||
F-297