As filed with the Securities and Exchange Commission on April 30, 201229, 2014
UNITED STATES
SECURITIES AND EXCHANGE COMMISSION
WASHINGTON, D.C. 20549
FORM 20-F
(Mark One)
| ¨ | REGISTRATION STATEMENT PURSUANT TO SECTION 12(b) OR (g) OF THE SECURITIES EXCHANGE ACT OF 1934 |
OR
| x | ANNUAL REPORT PURSUANT TO SECTION 13 OR 15(d) OF THE SECURITIES EXCHANGE ACT OF 1934 |
For the fiscal year ended December 31, 20112013
OR
| ¨ | TRANSITION REPORT PURSUANT TO SECTION 13 OR 15(d) OF THE SECURITIES EXCHANGE ACT OF 1934 |
For the transition period from to .
OR
| ¨ | SHELL COMPANY REPORT PURSUANT TO SECTION 13 OR 15(d) OF THE SECURITIES EXCHANGE ACT OF 1934 |
Date of event requiring this shell company report.
Commission file number 000-53445
KB Financial Group Inc.
(Exact name of Registrant as specified in its charter)
KB Financial Group Inc.
(Translation of Registrant’s name into English)
The Republic of Korea
(Jurisdiction of incorporation or organization)
9-1, 2-ga,84, Namdaemoon-ro, Jung-gu, Seoul 100-703, Korea
(Address of principal executive offices)
Kyu Sul Choi
9-1, 2-ga,84, Namdaemoon-ro, Jung-gu, Seoul 100-703, Korea
Telephone No.: +82-2-2073-2846+82-2-2073-2844
Facsimile No.: +82-2-2073-2848
(Name, telephone, e-mail and/or facsimile number and address of company contact person)
Securities registered or to be registered pursuant to Section 12(b) of the Act.
Title of each class | Name of each exchange on which registered | |
| American Depositary Shares, each representing one share of Common Stock | New York Stock Exchange | |
| Common Stock, par value | New York Stock Exchange* |
Securities registered or to be registered pursuant to Section 12(g) of the Act.
None
Securities for which there is a reporting obligation pursuant to Section 15(d) of the Act.
None
Indicate the number of outstanding shares of each of the issuer’s classes of capital or common stock as of the close of the period covered by the annual report.
343,028,989386,351,693 shares of Common Stock, par value(Won)₩5,000 per share
Indicate by check mark if the registrant is a well-known seasoned issuer, as defined in Rule 405 of the Securities Act. x Yes ¨ No
If this report is an annual or transition report, indicate by check mark if the registrant is not required to file reports pursuant to Section 13 or 15(d) of the Securities Exchange Act of 1934. ¨ Yes x No
Indicate by check mark whether the registrant (1) has filed all reports required to be filed by Section 13 or 15(d) of the Securities Exchange Act of 1934 during the preceding 12 months (or for such shorter period that the registrant was required to file such reports), and (2) has been subject to such filing requirements for the past 90 days. x Yes ¨ No
Indicate by check mark whether the registrant has submitted electronically and posted on its Web site, if any, every Interactive Data File required to be submitted and posted pursuant to Rule 405 of Regulation S-T (§232.405 of this chapter) during the preceding 12 months (or for such shorter period that the registrant was required to submit and post such files).x¨ Yes¨ No
Indicate by check mark whether the registrant is a large accelerated filer, an accelerated filer, or a non-accelerated filer. See definition of “accelerated filer and large accelerated filer” in Rule 12b-2 of the Exchange Act. (Check one):
x Large accelerated filer ¨ Accelerated filer ¨ Non-accelerated filer
Indicate by check mark which basis of accounting the registrant has used to prepare the financial statements included in this filing:
¨ U.S. GAAP | x International Financial Reporting Standards as issued by the International Accounting Standards Board | ¨ | Other | |||||
If “Other” has been checked in response to the previous question, indicate by check mark which financial statement item the registrant has elected to follow. ¨ Item 17 ¨ Item 18
If this is an annual report, indicate by check mark whether the registrant is a shell company (as defined in Rule 12b-2 of the Exchange Act). ¨ Yes x No
(APPLICABLE ONLY TO ISSUERS INVOLVED IN BANKRUPTCY PROCEEDINGS DURING THE PAST FIVE YEARS)
Indicate by check mark whether the registrant has filed all documents and reports required to be filed by Sections 12, 13 or 15(d) of the Securities Exchange Act of 1934 subsequent to the distribution of securities under a plan confirmed by a court. ¨ Yes ¨ No
| * | Not for trading, but only in connection with the registration of the American Depositary Shares. |
i
ii
PRESENTATION OF FINANCIAL AND OTHER INFORMATION
The financial statements included in this annual report are prepared in accordance with International Financial Reporting Standards, or IFRS, as issued by the International Accounting Standards Board, or IASB. As such, we make an explicit and unreserved statement of compliance with IFRS as issued by the IASB with respect to our consolidated financial statements as of January 1, 2012, December 31, 2012 and 2013 and for the years ended December 31, 20102011, 2012 and 20112013 included in this annual report. Unless indicated otherwise, the financial information in this annual report (i) as of and for the years ended December 31, 2010, 2011, 2012 and 20112013 has been prepared in accordance with IFRS as issued by the IASB, and (ii) as of and for the yearsyear ended December 31, 2007, 2008 and 2009 has been prepared in accordance with generally accepted accounting principles in the United States, or U.S. GAAP, which is not comparable to information prepared in accordance with IFRS. For an explanation of how the transition to IFRS has affected our consolidated financial statements, see Note 46 of the notes to our consolidated financial statements.
In accordance with rule amendments adopted by the U.S. Securities and Exchange Commission which became effective on March 4, 2008, we are not required to provide a reconciliation to U.S. GAAP. Furthermore, pursuant to the transitional relief granted by the U.S. Securities and Exchange Commission in respect of the first-time application of IFRS, no audited financial statements and financial information prepared under IFRS for the year ended December 31, 2009 have been included in this annual report.
Unless expressly stated otherwise, all financial data included in this annual report are presented on a consolidated basis.
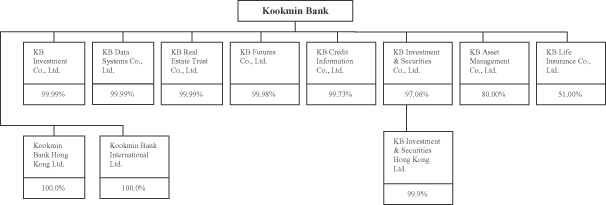
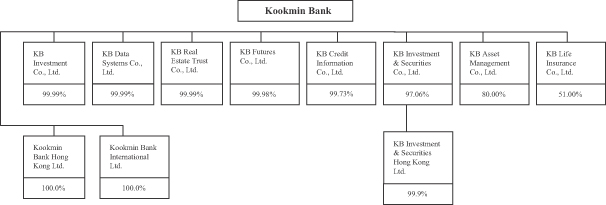
We were established on September 29, 2008 pursuant to a “comprehensive stock transfer” under Korean law, whereby holders of the common stock of Kookmin Bank and certain of its subsidiaries transferred all of their shares to us, a new financial holding company, and in return received shares of our common stock. See “Item 4A. History and Development of the Company—The Establishment of KB Financial Group.” The consolidated financial data included in this annual report are, as of dates and for periods prior to the date of the stock transfer, for Kookmin Bank and its subsidiaries, and as of dates and for periods from and after the date of the stock transfer, for us and our subsidiaries, including Kookmin Bank.
In this annual report:
references to “we,” “us” or “KB Financial Group” are to KB Financial Group Inc. and, unless the context otherwise requires, its subsidiaries and, for periods of time prior to the establishment of KB Financial Group on September 29, 2008, Kookmin Bank and, unless the context otherwise requires, its subsidiaries as of such periods;subsidiaries;
references to “Korea” are to the Republic of Korea;
references to the “government” are to the government of the Republic of Korea;
references to “Won” or “(Won)“₩” are to the currency of Korea; and
references to “U.S. dollars,” “$” or “US$” are to United States dollars.
Discrepancies between totals and the sums of the amounts contained in any table may be a result of rounding.
For your convenience, this annual report contains translations of Won amounts into U.S. dollars at the noon buying rate of the Federal Reserve Bank of New York for Won in effect on December 30, 2011,31, 2013, which was (Won)1,158.5₩1,055.3 = US$1.00.
The U.S. Securities and Exchange Commission encourages companies to disclose forward-looking information so that investors can better understand a company’s future prospects and make informed investment decisions. This annual report contains forward-looking statements.
Words and phrases such as “aim,” “anticipate,” “assume,” “believe,” “contemplate,” “continue,” “estimate,” “expect,” “future,” “goal,” “intend,” “may,” “objective,” “plan,” “positioned,” “predict,” “project,” “risk,” “seek to,” “shall,” “should,” “will likely result,” “will pursue,” “plan” and words and terms of similar substance used in connection with any discussion of future operating or financial performance or our expectations, plans, projections or business prospects identify forward-looking statements. In particular, the statements under the headings “Item 3D.3.D. Risk Factors,” “Item 5. Operating and Financial Review and Prospects” and “Item 4B.4.B. Business Overview” regarding our financial condition and other future events or prospects are forward-looking statements. All forward-looking statements are management’s present expectations of future events and are subject to a number of factors and uncertainties that could cause actual results to differ materially from those described in the forward-looking statements.
In addition to the risks related to our business discussed under “Item 3D.3.D. Risk Factors,” other factors could cause actual results to differ materially from those described in the forward-looking statements. These factors include, but are not limited to:
our ability to successfully implement our strategy;
future levels of non-performing loans;
our growth and expansion;
the adequacy of allowances for credit and investment losses;
technological changes;
interest rates;
investment income;
availability of funding and liquidity;
cash flow projections;
our exposure to market risks; and
adverse market and regulatory conditions.
By their nature, certain disclosures relating to these and other risks are only estimates and could be materially different from what actually occurs in the future. As a result, actual future gains, losses or impact on our income or results of operations could materially differ from those that have been estimated. For example, revenues could decrease, costs could increase, capital costs could increase, capital investment could be delayed and anticipated improvements in performance might not be fully realized.
In addition, other factors that could cause actual results to differ materially from those estimated by the forward-looking statements contained in this annual report could include, but are not limited to:
general economic and political conditions in Korea or other countries that have an impact on our business activities or investments;
the monetary and interest rate policies of Korea;
inflation or deflation;
unanticipated volatility in interest rates;
foreign exchange rates;
prices and yields of equity and debt securities;
the performance of the financial markets in Korea and globally;
changes in domestic and foreign laws, regulations and taxes;
changes in competition and the pricing environments in Korea; and
regional or general changes in asset valuations.
For further discussion of the factors that could cause actual results to differ, see the discussion under “Item 3D.3.D. Risk Factors” contained in this annual report. We caution you not to place undue reliance on the forward-looking statements, which speak only as of the date of this annual report. Except as required by law, we are not under any obligation, and expressly disclaim any obligation, to update or alter any forward-looking statements, whether as a result of new information, future events or otherwise.
All subsequent forward-looking statements attributable to us or any person acting on our behalf are expressly qualified in their entirety by the cautionary statements contained or referred to in this annual report.
| Item 1. | IDENTITY OF DIRECTORS, SENIOR MANAGEMENT AND ADVISERS |
Not applicableapplicable.
| Item 2. | OFFER STATISTICS AND EXPECTED TIMETABLE |
Not applicableapplicable.
| Item 3. | KEY INFORMATION |
| Item | Selected Financial Data |
The selected consolidated financial and operating data set forth below as of and for the years ended December 31, 2010, 2011, 2012 and 20112013 have been derived from our audited consolidated financial statements, which have been prepared in accordance with IFRS as issued by the IASB. Our consolidated financial statements as of and for the years ended December 31, 2010, 2011, 2012 and 20112013 have been audited by independent registered public accounting firm Samil PricewaterhouseCoopers.
Pursuant to the transitional relief granted by the U.S. Securities and Exchange Commission in respect of the first-time application of IFRS, financial and operating data as of and for the three years ended December 31, 2007, 2008 and 2009 derived from our consolidated financial statements prepared in accordance with U.S. GAAP have not been included below.
You should read the following data together with the more detailed information contained in “Item 5. Operating and Financial Review and Prospects” and our consolidated financial statements included elsewhere in this annual report. Historical results do not necessarily predict future results.
Consolidated statements of comprehensive income data
| Year Ended December 31, | Year Ended December 31, | |||||||||||||||||||||||||||||||
| 2010 | 2011 | 2011 (1) | 2010(1) | 2011(1) | 2012(1) (2) | 2013(1) (2) | 2013(3) | |||||||||||||||||||||||||
| (in billions of Won, except common share data) | (in millions of US$, except common share data) | (in billions of Won, except common share data) | (in millions of US$, except common share data) | |||||||||||||||||||||||||||||
Interest income | (Won) | 13,052 | (Won) | 13,956 | US$ | 12,047 | ₩ | 13,052 | ₩ | 13,956 | ₩ | 14,210 | ₩ | 12,357 | US$ | 11,710 | ||||||||||||||||
Interest expense | (6,878 | ) | (6,852 | ) | (5,914 | ) | (6,878 | ) | (6,852 | ) | (7,172 | ) | (5,834 | ) | (5,529 | ) | ||||||||||||||||
|
|
|
|
|
|
|
| |||||||||||||||||||||||||
Net interest income | 6,174 | 7,104 | 6,133 | 6,174 | 7,104 | 7,038 | 6,523 | 6,181 | ||||||||||||||||||||||||
|
|
|
|
|
|
|
| |||||||||||||||||||||||||
Fee and commission income | 2,482 | 2,830 | 2,443 | 2,482 | 2,830 | 2,754 | 2,657 | 2,518 | ||||||||||||||||||||||||
Fee and commission expense | (777 | ) | (1,035 | ) | (894 | ) | (777 | ) | (1,035 | ) | (1,187 | ) | (1,178 | ) | (1,116 | ) | ||||||||||||||||
|
|
|
|
|
|
|
| |||||||||||||||||||||||||
Net fee and commission income | 1,705 | 1,795 | 1,549 | 1,705 | 1,795 | 1,567 | 1,479 | 1,402 | ||||||||||||||||||||||||
|
|
|
|
|
|
|
| |||||||||||||||||||||||||
Net gains on financial assets and liabilities at fair value through profit and loss | 815 | 1,036 | 894 | |||||||||||||||||||||||||||||
Net gains on financial assets and liabilities at fair value through profit or loss | 815 | 1,036 | 812 | 757 | 717 | |||||||||||||||||||||||||||
|
|
|
|
|
|
|
| |||||||||||||||||||||||||
Net other operating income (expenses) | (1,068 | ) | (1,092 | ) | (943 | ) | (1,068 | ) | (1,092 | ) | (1,532 | ) | (1,305 | ) | (1,236 | ) | ||||||||||||||||
|
|
| ||||||||||||||||||||||||||||||
Employee compensation and benefits | (2,407 | ) | (1,871 | ) | (1,615 | ) | ||||||||||||||||||||||||||
Depreciation and amortization | (348 | ) | (343 | ) | (296 | ) | ||||||||||||||||||||||||||
Other general and administrative expenses | (1,612 | ) | (1,718 | ) | (1,483 | ) | ||||||||||||||||||||||||||
|
|
|
|
|
|
|
| |||||||||||||||||||||||||
General and administrative expenses | (4,367 | ) | (3,932 | ) | (3,394 | ) | (4,380 | ) | (3,887 | ) | (3,846 | ) | (3,984 | ) | (3,775 | ) | ||||||||||||||||
|
|
|
|
|
|
|
| |||||||||||||||||||||||||
Operating profit before provision for credit losses | 3,259 | 4,911 | 4,239 | 3,246 | 4,956 | 4,039 | 3,470 | 3,289 | ||||||||||||||||||||||||
|
|
|
|
|
|
|
| |||||||||||||||||||||||||
Provision for credit losses | (2,871 | ) | (1,513 | ) | (1,306 | ) | (2,871 | ) | (1,513 | ) | (1,607 | ) | (1,443 | ) | (1,368 | ) | ||||||||||||||||
|
|
|
|
|
|
|
| |||||||||||||||||||||||||
Net operating profit | 388 | 3,398 | 2,933 | 375 | 3,443 | 2,432 | 2,027 | 1,921 | ||||||||||||||||||||||||
|
|
|
|
|
|
|
| |||||||||||||||||||||||||
Share of profit of associates and joint ventures | (211 | ) | 5 | 4 | ||||||||||||||||||||||||||||
Share of profit (loss) of associates and joint ventures | (211 | ) | 5 | (15 | ) | (199 | ) | (189 | ) | |||||||||||||||||||||||
|
|
|
|
| ||||||||||||||||||||||||||||
Net other non-operating income (expense) | (28 | ) | (142 | ) | (123 | ) | (28 | ) | (142 | ) | (118 | ) | (12 | ) | (12 | ) | ||||||||||||||||
|
|
|
|
| ||||||||||||||||||||||||||||
Net non-operating profit (loss) | (239 | ) | (137 | ) | (133 | ) | (211 | ) | (201 | ) | ||||||||||||||||||||||
|
|
|
|
|
|
|
| |||||||||||||||||||||||||
Profit before income tax | 149 | 3,261 | 2,814 | 136 | 3,306 | 2,299 | 1,816 | 1,720 | ||||||||||||||||||||||||
|
|
|
|
|
|
|
| |||||||||||||||||||||||||
Tax income (expense) | 71 | (832 | ) | (718 | ) | 75 | (845 | ) | (559 | ) | (552 | ) | (522 | ) | ||||||||||||||||||
|
|
|
|
|
|
|
| |||||||||||||||||||||||||
Profit for the year | 220 | 2,429 | 2,096 | ₩ | 211 | ₩ | 2,461 | ₩ | 1,740 | ₩ | 1,264 | US$ | 1,198 | |||||||||||||||||||
|
|
|
|
|
|
|
| |||||||||||||||||||||||||
Items that will not be reclassified to profit or loss: | ||||||||||||||||||||||||||||||||
Actuarial gains (losses) on post defined benefit pension plans | 9 | (32 | ) | (30 | ) | 41 | 39 | |||||||||||||||||||||||||
Items that may be reclassified subsequently to profit or loss: | ||||||||||||||||||||||||||||||||
Exchange differences on translating foreign operations | (7 | ) | 6 | 6 | (7 | ) | 6 | (26 | ) | (2 | ) | (2 | ) | |||||||||||||||||||
Change in value of financial investments | 108 | (240 | ) | (207 | ) | 108 | (240 | ) | 246 | (4 | ) | (4 | ) | |||||||||||||||||||
Shares of other comprehensive income of associates and joint ventures | (2 | ) | (1 | ) | (1 | ) | ||||||||||||||||||||||||||
Shares of other comprehensive loss of associates and joint ventures | (2 | ) | (1 | ) | (44 | ) | (10 | ) | (9 | ) | ||||||||||||||||||||||
Cash flow hedges | — | (1 | ) | (1 | ) | — | (1 | ) | (1 | ) | 2 | 1 | ||||||||||||||||||||
|
|
|
|
|
|
|
| |||||||||||||||||||||||||
Other comprehensive income (loss) for the year, net of tax | 99 | (236 | ) | (203 | ) | 108 | (268 | ) | 145 | 27 | 25 | |||||||||||||||||||||
|
|
|
|
|
|
|
| |||||||||||||||||||||||||
Total comprehensive income for the year | (Won) | 319 | (Won) | 2,193 | US$ | 1,893 | ₩ | 319 | ₩ | 2,193 | ₩ | 1,885 | ₩ | 1,291 | US$ | 1,223 | ||||||||||||||||
|
|
|
|
|
|
|
| |||||||||||||||||||||||||
Profit attributable to: | ||||||||||||||||||||||||||||||||
Stockholders | (Won) | 147 | (Won) | 2,373 | US$ | 2,048 | ₩ | 138 | ₩ | 2,406 | ₩ | 1,731 | ₩ | 1,261 | US$ | 1,195 | ||||||||||||||||
Non-controlling interests | 73 | 56 | 48 | 73 | 55 | 9 | 3 | 3 | ||||||||||||||||||||||||
|
|
|
|
|
|
|
| |||||||||||||||||||||||||
| (Won) | 220 | (Won) | 2,429 | US$ | 2,096 | ₩ | 211 | ₩ | 2,461 | ₩ | 1,740 | ₩ | 1,264 | US$ | 1,198 | |||||||||||||||||
|
|
|
|
|
|
|
| |||||||||||||||||||||||||
Total comprehensive income attributable to: | ||||||||||||||||||||||||||||||||
Stockholders | (Won) | 226 | (Won) | 2,134 | US$ | 1,842 | ₩ | 226 | ₩ | 2,134 | ₩ | 1,865 | ₩ | 1,302 | US$ | 1,233 | ||||||||||||||||
Non-controlling interests | 93 | 59 | 51 | 93 | 59 | 20 | (11 | ) | (10 | ) | ||||||||||||||||||||||
|
|
|
|
|
|
|
| |||||||||||||||||||||||||
| (Won) | 319 | (Won) | 2,193 | US$ | 1,893 | ₩ | 319 | ₩ | 2,193 | ₩ | 1,885 | ₩ | 1,291 | US$ | 1,223 | |||||||||||||||||
|
|
|
|
|
|
|
| |||||||||||||||||||||||||
Earnings per share | ||||||||||||||||||||||||||||||||
Basic earnings per share | (Won) | 427 | (Won) | 6,461 | US$ | 5.58 | ₩ | 401 | ₩ | 6,548 | ₩ | 4,480 | ₩ | 3,263 | US$ | 3.09 | ||||||||||||||||
Diluted earnings per share | 427 | 6,445 | 5.56 | 401 | 6,533 | 4,467 | 3,249 | 3.08 | ||||||||||||||||||||||||
| (1) | Pursuant to amendments to International Accounting Standards 19, or IAS 19,Employee Benefits, which are effective beginning in 2013, our consolidated financial statements as of and for the year ended December 31, 2013 reflect changes in the methodology for recognition and measurement of actuarial gains and losses and expected returns and service costs relating to our employee pension plans. Our consolidated financial statements as of and for the years ended December 31, 2011 and 2012 have been restated to retroactively apply such changes. See Note 2.1 of the notes to our consolidated financial statements included elsewhere in this annual report. Amounts for 2011 and 2012 reflect such restatement, and amounts for 2010 have been correspondingly restated. |
| (2) | Pursuant to the adoption of IFRS 10,Consolidated Financial Statements, which is effective beginning in 2013, our consolidated financial statements as of and for the year ended December 31, 2013 include trust accounts for which we guarantee only the repayment of principal, as well as certain other entities, which were not previously subject to consolidation, while excluding certain other entities that were previously consolidated. Our consolidated financial statements as of and for the year ended December 31, 2012 (but not as of and for the year ended December 31, 2011) have been restated to retroactively apply this change. See Note 2.1 of the notes to our consolidated financial statements included elsewhere in this annual report. Amounts for 2012 reflect such restatement, while amounts for 2010 and 2011 have not been correspondingly restated. |
| (3) | Won amounts are expressed in U.S. dollars at the rate of |
Consolidated statements of financial position data
| Year Ended December 31, | Year Ended December 31, | |||||||||||||||||||||||||||||||
| 2010 | 2011 | 2011 (1) | 2010(1) | 2011(1) | 2012(1) (2) | 2013(1) (2) | 2013(3) | |||||||||||||||||||||||||
| (in billions of Won) | (in millions of US$) | (in billions of Won) | (in millions of US$) | |||||||||||||||||||||||||||||
Assets | ||||||||||||||||||||||||||||||||
Cash and due from financial institutions | (Won) | 6,830 | (Won) | 9,178 | US$ | 7,922 | ₩ | 6,830 | ₩ | 9,178 | ₩ | 10,593 | ₩ | 14,793 | US$ | 14,018 | ||||||||||||||||
Financial assets at fair value through profit and loss | 4,014 | 6,326 | 5,461 | |||||||||||||||||||||||||||||
Financial assets at fair value through profit or loss | 4,014 | 6,326 | 9,560 | 9,329 | 8,840 | |||||||||||||||||||||||||||
Derivative financial assets | 2,595 | 2,449 | 2,114 | 2,595 | 2,449 | 2,091 | 1,819 | 1,724 | ||||||||||||||||||||||||
Loans | 197,621 | 212,107 | 183,088 | 197,621 | 212,107 | 213,645 | 219,001 | 207,535 | ||||||||||||||||||||||||
Financial investments | 36,190 | 35,432 | 30,585 | 36,190 | 35,432 | 36,467 | 34,849 | 33,024 | ||||||||||||||||||||||||
Investments in associates and joint ventures | 723 | 892 | 770 | 723 | 892 | 935 | 755 | 716 | ||||||||||||||||||||||||
Property and equipment | 3,150 | 3,186 | 2,750 | 3,150 | 3,186 | 3,100 | 3,061 | 2,901 | ||||||||||||||||||||||||
Investment property | 53 | 52 | 44 | 53 | 52 | 53 | 166 | 158 | ||||||||||||||||||||||||
Intangible assets | 505 | 468 | 404 | 505 | 468 | 493 | 443 | 420 | ||||||||||||||||||||||||
Deferred income tax assets | 4 | 22 | 19 | 4 | 22 | 18 | 16 | 15 | ||||||||||||||||||||||||
Assets held for sale | 9 | 10 | 9 | 9 | 10 | 35 | 38 | 36 | ||||||||||||||||||||||||
Other assets | 7,077 | 7,479 | 6,455 | 7,077 | 7,479 | 8,761 | 7,568 | 7,172 | ||||||||||||||||||||||||
|
|
|
|
|
|
|
| |||||||||||||||||||||||||
Total assets | (Won) | 258,771 | (Won) | 277,601 | US$ | 239,621 | ₩ | 258,771 | ₩ | 277,601 | ₩ | 285,751 | ₩ | 291,838 | US$ | 276,559 | ||||||||||||||||
|
|
|
|
|
|
|
| |||||||||||||||||||||||||
Liabilities | ||||||||||||||||||||||||||||||||
Financial liabilities at fair value through profit and loss | (Won) | 1,295 | (Won) | 1,388 | US$ | 1,198 | ||||||||||||||||||||||||||
Financial liabilities at fair value through profit or loss | ₩ | 1,295 | ₩ | 1,388 | ₩ | 1,851 | ₩ | 1,115 | US$ | 1,057 | ||||||||||||||||||||||
Derivative financial liabilities | 2,236 | 2,059 | 2,055 | 1,795 | 1,701 | |||||||||||||||||||||||||||
Deposits | 179,862 | 190,337 | 164,297 | 179,862 | 190,337 | 197,346 | 200,882 | 190,364 | ||||||||||||||||||||||||
Debts | 11,745 | 16,824 | 14,522 | 11,745 | 16,824 | 15,965 | 14,101 | 13,363 | ||||||||||||||||||||||||
Derivative financial liabilities | 2,236 | 2,059 | 1,778 | |||||||||||||||||||||||||||||
Debentures | 29,107 | 27,070 | 23,366 | 29,107 | 27,070 | 24,270 | 27,040 | 25,624 | ||||||||||||||||||||||||
Provisions | 1,020 | 798 | 689 | 1,020 | 798 | 670 | 678 | 643 | ||||||||||||||||||||||||
Defined benefit liabilities | 125 | 128 | 84 | 64 | 61 | |||||||||||||||||||||||||||
Current income tax liabilities | 30 | 589 | 508 | 30 | 589 | 265 | 211 | 200 | ||||||||||||||||||||||||
Deferred income tax liabilities | 284 | 221 | 191 | 284 | 221 | 154 | 62 | 59 | ||||||||||||||||||||||||
Other liabilities | 13,526 | 15,215 | 13,133 | 13,401 | 15,087 | 18,328 | 20,237 | 19,177 | ||||||||||||||||||||||||
|
|
|
|
|
|
|
| |||||||||||||||||||||||||
Total liabilities | (Won) | 239,105 | (Won) | 254,501 | US$ | 219,682 | ₩ | 239,105 | ₩ | 254,501 | ₩ | 260,988 | ₩ | 266,185 | US$ | 252,249 | ||||||||||||||||
|
|
|
|
|
|
|
| |||||||||||||||||||||||||
Total Equity | ||||||||||||||||||||||||||||||||
Capital stock | (Won) | 1,932 | (Won) | 1,932 | US$ | 1,667 | ||||||||||||||||||||||||||
Capital surplus | 15,990 | 15,842 | 13,675 | |||||||||||||||||||||||||||||
Accumulated other comprehensive income | 431 | 191 | 165 | |||||||||||||||||||||||||||||
Retained earnings | 2,621 | 4,953 | 4,275 | |||||||||||||||||||||||||||||
Treasury shares | (2,477 | ) | — | — | ||||||||||||||||||||||||||||
|
|
| ||||||||||||||||||||||||||||||
Equity attributable to stockholders | 18,497 | 22,918 | 19,782 | |||||||||||||||||||||||||||||
Non-controlling interests | 1,169 | 182 | 157 | |||||||||||||||||||||||||||||
|
|
| ||||||||||||||||||||||||||||||
Total equity | (Won) | 19,666 | (Won) | 23,100 | US$ | 19,939 | ||||||||||||||||||||||||||
|
|
| ||||||||||||||||||||||||||||||
Total liabilities and equity | (Won) | 258,771 | (Won) | 277,601 | US$ | 239,621 | ||||||||||||||||||||||||||
|
|
| ||||||||||||||||||||||||||||||
Total Equity Capital stock Capital surplus Accumulated other comprehensive income Retained earnings Treasury shares Equity attributable to stockholders Non-controlling interests Total equity Total liabilities and equity Year Ended December 31, 2010(1) 2011(1) 2012(1) (2) 2013(1) (2) 2013(3) (in billions of Won) (in millions of US$) ₩ 1,932 ₩ 1,932 ₩ 1,932 ₩ 1,932 US$ 1,831 15,990 15,842 15,840 15,855 15,024 440 168 295 336 319 2,612 4,976 6,501 7,530 7,136 (2,477 ) — — — — 18,497 22,918 24,568 25,653 24,310 1,169 182 195 — — ₩ 19,666 ₩ 23,100 ₩ 24,763 ₩ 25,653 US$ 24,310 ₩ 258,771 ₩ 277,601 ₩ 285,751 ₩ 291,838 US$ 276,559
| (1) | Pursuant to amendments to International Accounting Standards 19, or IAS 19,Employee Benefits, which are effective beginning in 2013, our consolidated financial statements as of and for the year ended December 31, 2013 reflect changes in the methodology for recognition and measurement of actuarial gains and losses and expected returns and service costs relating to our employee pension plans. Our consolidated financial statements as of and for the years ended December 31, 2011 and 2012 have been restated to retroactively apply such changes. See Note 2.1 of the notes to our consolidated financial statements included elsewhere in this annual report. Amounts as of December 31, 2011 and 2012 reflect such restatement, and amounts as of December 31, 2010 have been correspondingly restated. |
| (2) | Pursuant to the adoption of IFRS 10,Consolidated Financial Statements, which is effective beginning in 2013, our consolidated financial statements as of and for the year ended December 31, 2013 include trust accounts for which we guarantee only the repayment of principal, as well as certain other entities, which were not previously subject to consolidation, while excluding certain other entities that were previously consolidated. Our consolidated financial statements as of and for the year ended December 31, 2012 (but not as of and for the year ended December 31, 2011) have been restated to retroactively apply this change. See Note 2.1 of the notes to our consolidated financial statements included elsewhere in this annual report. Amounts as of December 31, 2012 reflect such restatement, while amounts as of December 31, 2010 and 2011 have not been correspondingly restated. |
| (3) | Won amounts are expressed in U.S. dollars at the rate of |
Profitability ratios and other data
| Year Ended December 31, | ||||||||
| 2010 | 2011 | |||||||
| (Percentages) | ||||||||
Profit (loss) attributable to stockholders as a percentage of: | ||||||||
Average total assets(1) | 0.05 | % | 0.86 | % | ||||
Average stockholders’ equity(1) | 0.76 | 10.07 | ||||||
Dividend payout ratio(2) | 28.08 | 11.72 | ||||||
Net interest spread(3) | 2.37 | 2.64 | ||||||
Net interest margin(4) | 2.58 | 2.88 | ||||||
Efficiency ratio(5) | 57.26 | 44.46 | ||||||
Cost-to-average assets ratio(6) | 1.63 | 1.43 | ||||||
Won loans (gross) as a percentage of Won deposits | 107.56 | 107.97 | ||||||
Total loans (gross) as a percentage of total deposits | 111.96 | 113.25 | ||||||
| As of or for the year Ended December 31, | ||||||||||||||||
| 2010 | 2011 | 2012 | 2013 | |||||||||||||
| (Percentages) | ||||||||||||||||
Profit (loss) attributable to stockholders as a percentage of: | ||||||||||||||||
Average total assets (1) | 0.05 | % | 0.88 | % | 0.60 | % | 0.44 | % | ||||||||
Average stockholders’ equity (1) | 0.71 | 10.21 | 7.13 | 4.96 | ||||||||||||
Dividend payout ratio (2) | 29.71 | 11.55 | 13.40 | 15.31 | ||||||||||||
Net interest spread (3) | 2.37 | 2.64 | 2.48 | 2.31 | ||||||||||||
Net interest margin (4) | 2.58 | 2.88 | 2.71 | 2.51 | ||||||||||||
Efficiency ratio (5) | 57.44 | 43.96 | 48.78 | 53.45 | ||||||||||||
Cost-to-average assets ratio (6) | 1.64 | 1.41 | 1.33 | 1.37 | ||||||||||||
Won loans (gross) as a percentage of Won deposits | 107.56 | 107.97 | 106.37 | 107.12 | ||||||||||||
Total loans (gross) as a percentage of total deposits | 111.96 | 113.25 | 109.92 | 110.44 | ||||||||||||
| (1) | Average balances are based on daily balances for our banking, credit card and investment and securities operations and monthly or quarterly balances for our other operations. |
| (2) | Represents the ratio of total dividends declared on common stock as a percentage of profit attributable to stockholders. |
| (3) | Represents the difference between the yield on average interest earning assets and cost of average interest bearing liabilities. |
| (4) | Represents the ratio of net interest income to average interest earning assets. |
| (5) | Represents the ratio of general and administrative expenses to the sum of net interest income, net fee and commission income, net gain on financial assets and liabilities at fair value through profit |
| (6) | Represents the ratio of general and administrative expenses to average total assets. |
Capital ratios
| ||||
| ||||
| ||||
| ||||
| ||||
| As of or for the year Ended December 31, | ||||||||||||
| 2011(1) | 2012(1) | 2013 | ||||||||||
| (Percentages) | ||||||||||||
Consolidated capital adequacy ratio of KB Financial Group (2) | 13.00 | % | 13.90 | % | 15.38 | % | ||||||
Capital adequacy ratios of Kookmin Bank | ||||||||||||
Tier I capital adequacy ratio (3) | 10.30 | % | 10.87 | % | 12.61 | % | ||||||
Tier I common equity capital adequacy ratio (3) | — | — | 12.61 | |||||||||
Tier II capital adequacy ratio (3) | 3.25 | 3.53 | 2.81 | |||||||||
Average stockholders’ equity as a percentage of average total assets | 8.58 | 8.37 | 8.77 | |||||||||
| (1) | With effect from December 1, 2013, the Financial Services Commission adopted amended guidelines that implemented capital adequacy requirements in Korea based on Basel III. Capital adequacy ratios as of December 31, 2011 and 2012 were computed in accordance with previously applicable guidelines based on Basel I (for KB Financial Group) and Basel II (for Kookmin Bank) and therefore are not directly comparable to corresponding ratios as of December 31, 2013. |
| (2) | Under applicable guidelines of the Financial Services Commission, we, as a bank holding company, are required to maintain a minimum consolidated capital adequacy ratio of 8%. See “Item |
Kookmin Bank’s capital adequacy ratios are computed in accordance with the guidelines issued by the Financial Services Commission. See “Item |
Credit portfolio ratios and other data
| As of December 31, | As of December 31, | |||||||||||||||||||||||
| 2010 | 2011 | 2010 | 2011 | 2012 | 2013 | |||||||||||||||||||
| (in billions of Won, except percentages) | (in billions of Won, except percentages) | |||||||||||||||||||||||
Total loans | (Won) | 201,377 | (Won) | 215,555 | ₩ | 201,377 | ₩ | 215,555 | ₩ | 216,914 | ₩ | 221,862 | ||||||||||||
Total non-performing loans | 1,516 | 1,117 | 1,612 | 1,180 | 1,606 | 1,421 | ||||||||||||||||||
Other impaired loans not included in non-performing loans | 2,300 | 2,348 | 2,204 | 2,285 | 2,086 | 2,669 | ||||||||||||||||||
Total of non-performing loans and other impaired loans | 3,816 | 3,465 | 3,816 | 3,465 | 3,692 | 4,090 | ||||||||||||||||||
Total allowances for loan losses | 3,756 | 3,448 | 3,756 | 3,448 | 3,269 | 2,861 | ||||||||||||||||||
Non-performing loans as a percentage of total loans | 0.75 | % | 0.52 | % | 0.80 | % | 0.55 | % | 0.74 | % | 0.64 | % | ||||||||||||
Non-performing loans as a percentage of total assets | 0.59 | 0.40 | 0.62 | 0.43 | 0.56 | 0.49 | ||||||||||||||||||
Total of non-performing loans and other impaired loans as a percentage of total loans | 1.89 | 1.61 | 1.89 | 1.61 | 1.70 | 1.84 | ||||||||||||||||||
Allowances for loan losses as a percentage of total loans | 1.87 | 1.60 | 1.87 | 1.60 | 1.51 | 1.29 | ||||||||||||||||||
| (1) | Before deduction of allowances for loan losses. |
| (2) | Non-performing loans are defined as those loans, including corporate, retail and other loans, which are past due by 90 days or more. |
Selected Statistical Information
Average Balance Sheets and Related Interest
The following table shows our average balances and interest rates for the past twothree years:
| Year Ended December 31, | Year Ended December 31, | |||||||||||||||||||||||||||||||||||||||||||||||||||||||||||
| 2010 | 2011 | 2011 | 2012 | 2013 | ||||||||||||||||||||||||||||||||||||||||||||||||||||||||
| Average Balance (1) | Interest Income (2)(3) | Average Yield | Average Balance (1) | Interest Income (2)(3) | Average Yield | Average Balance (1) | Interest Income (2)(3) | Average Yield | Average Balance (1) | Interest Income (2)(3) | Average Yield | Average Balance (1) | Interest Income (2)(3) | Average Yield | ||||||||||||||||||||||||||||||||||||||||||||||
| (in billions of Won, except percentages) | (in billions of Won, except percentages) | |||||||||||||||||||||||||||||||||||||||||||||||||||||||||||
Assets | ||||||||||||||||||||||||||||||||||||||||||||||||||||||||||||
Cash and interest earning deposits in other banks | (Won) | 1,879 | (Won) | 38 | 2.02 | % | (Won) | 2,299 | (Won) | 75 | 3.26 | % | ₩ | 2,299 | ₩ | 75 | 3.26 | % | ₩ | 4,808 | ₩ | 160 | 3.33 | % | ₩ | 5,905 | ₩ | 146 | 2.47 | % | ||||||||||||||||||||||||||||||
Financial investment (debt securities) (4) | 32,449 | 1,502 | 4.63 | 32,655 | 1,469 | 4.50 | ||||||||||||||||||||||||||||||||||||||||||||||||||||||
Financial investment (debt securities) (4) | 32,655 | 1,469 | 4.50 | 33,382 | 1,426 | 4.27 | 33,339 | 1,269 | 3.81 | |||||||||||||||||||||||||||||||||||||||||||||||||||
Loans: | ||||||||||||||||||||||||||||||||||||||||||||||||||||||||||||
Corporate | 92,018 | 4,938 | 5.37 | 94,486 | 5,132 | 5.43 | 94,486 | 5,132 | 5.43 | 102,773 | 5,328 | 5.18 | 100,614 | 4,526 | 4.50 | |||||||||||||||||||||||||||||||||||||||||||||
Mortgage | 44,322 | 1,958 | 4.42 | 43,790 | 2,172 | 4.96 | 43,790 | 2,172 | 4.96 | 44,444 | 2,161 | 4.86 | 44,514 | 1,826 | 4.10 | |||||||||||||||||||||||||||||||||||||||||||||
Home equity | 26,524 | 1,258 | 4.74 | 29,399 | 1,513 | 5.15 | 29,399 | 1,513 | 5.15 | 30,170 | 1,535 | 5.09 | 30,275 | 1,287 | 4.25 | |||||||||||||||||||||||||||||||||||||||||||||
Other consumer | 28,075 | 1,996 | 7.11 | 29,179 | 2,176 | 7.46 | 29,179 | 2,176 | 7.46 | 29,721 | 2,163 | 7.28 | 30,536 | 1,974 | 6.46 | |||||||||||||||||||||||||||||||||||||||||||||
Credit cards (5) | 11,924 | 1,293 | 10.84 | 12,378 | 1,342 | 10.84 | 12,378 | 1,342 | 10.84 | 12,078 | 1,345 | 11.14 | 11,611 | 1,242 | 10.70 | |||||||||||||||||||||||||||||||||||||||||||||
Foreign | 2,082 | 69 | 3.31 | 2,441 | 77 | 3.15 | 2,441 | 77 | 3.15 | 2,744 | 92 | 3.35 | 2,851 | 87 | 3.05 | |||||||||||||||||||||||||||||||||||||||||||||
|
|
|
|
|
|
|
|
|
| |||||||||||||||||||||||||||||||||||||||||||||||||||
Loans (total) | 204,945 | 11,512 | 5.62 | 211,673 | 12,412 | 5.86 | 211,673 | 12,412 | 5.86 | 221,930 | 12,624 | 5.69 | 220,401 | 10,942 | 4.96 | |||||||||||||||||||||||||||||||||||||||||||||
|
|
|
|
|
|
|
|
|
| |||||||||||||||||||||||||||||||||||||||||||||||||||
Total average interest earning assets | (Won) | 239,273 | (Won) | 13,052 | 5.45 | % | (Won) | 246,627 | (Won) | 13,956 | 5.66 | % | ₩ | 246,627 | ₩ | 13,956 | 5.66 | % | ₩ | 260,120 | ₩ | 14,210 | 5.46 | % | ₩ | 259,645 | ₩ | 12,357 | 4.76 | % | ||||||||||||||||||||||||||||||
|
|
|
|
|
|
|
|
|
| |||||||||||||||||||||||||||||||||||||||||||||||||||
Cash and due from banks | 6,731 | — | — | 7,267 | — | — | 7,267 | — | — | 7,622 | — | — | 7,688 | — | — | |||||||||||||||||||||||||||||||||||||||||||||
Financial assets at fair value through profit and loss: | ||||||||||||||||||||||||||||||||||||||||||||||||||||||||||||
Financial assets at fair value through profit or loss: | ||||||||||||||||||||||||||||||||||||||||||||||||||||||||||||
Debt securities | 6,891 | — | — | 5,056 | — | — | 5,056 | — | — | 8,744 | — | — | 8,091 | — | — | |||||||||||||||||||||||||||||||||||||||||||||
Equity securities | 369 | — | — | 674 | — | — | 674 | — | — | 1,026 | — | — | 1,280 | — | — | |||||||||||||||||||||||||||||||||||||||||||||
Other | 20 | — | — | 20 | — | — | 20 | — | — | 36 | — | — | 42 | — | — | |||||||||||||||||||||||||||||||||||||||||||||
|
|
|
|
|
|
|
|
|
| |||||||||||||||||||||||||||||||||||||||||||||||||||
Financial assets at fair value through profit and loss (total) | 7,280 | — | — | 5,750 | — | — | ||||||||||||||||||||||||||||||||||||||||||||||||||||||
Financial assets at fair value through profit or loss (total) | 5,750 | — | — | 9,806 | — | — | 9,413 | — | — | |||||||||||||||||||||||||||||||||||||||||||||||||||
Financial investment (equity securities) | 3,138 | — | — | 3,687 | — | — | 3,687 | — | — | 2,444 | — | — | 2,671 | — | — | |||||||||||||||||||||||||||||||||||||||||||||
Investment in associates | 744 | — | — | 764 | — | — | 764 | — | — | 934 | — | — | 882 | — | — | |||||||||||||||||||||||||||||||||||||||||||||
Derivative financial assets | 3,061 | — | — | 2,420 | — | — | 2,420 | — | — | 2,040 | — | — | 1,760 | — | — | |||||||||||||||||||||||||||||||||||||||||||||
Premises and equipment | 3,267 | — | — | 3,224 | — | — | 3,224 | — | — | 3,212 | — | — | 3,191 | — | — | |||||||||||||||||||||||||||||||||||||||||||||
Intangible assets | 454 | — | — | 477 | — | — | 477 | — | — | 539 | — | — | 475 | — | — | |||||||||||||||||||||||||||||||||||||||||||||
Allowances for loan losses | (4,449 | ) | — | — | (4,227 | ) | — | — | (4,227 | ) | — | — | (4,159 | ) | — | — | (4,108 | ) | — | — | ||||||||||||||||||||||||||||||||||||||||
Other non-interest earning assets | 8,167 | — | — | 8,712 | — | — | 8,712 | — | — | 7,173 | — | — | 8,230 | — | — | |||||||||||||||||||||||||||||||||||||||||||||
|
|
|
|
|
|
|
|
|
| |||||||||||||||||||||||||||||||||||||||||||||||||||
Total average non-interest earning assets | 28,393 | — | — | 28,074 | — | — | 28,074 | — | — | 29,611 | — | — | 30,202 | — | — | |||||||||||||||||||||||||||||||||||||||||||||
|
|
|
|
|
|
|
|
|
| |||||||||||||||||||||||||||||||||||||||||||||||||||
Total average assets | (Won) | 267,666 | (Won) | 13,052 | 4.88 | % | (Won) | 274,701 | (Won) | 13,956 | 5.08 | % | ₩ | 274,701 | ₩ | 13,956 | 5.08 | % | ₩ | 289,731 | ₩ | 14,210 | 4.90 | % | ₩ | 289,847 | ₩ | 12,357 | 4.26 | % | ||||||||||||||||||||||||||||||
|
|
|
|
|
|
|
|
|
| |||||||||||||||||||||||||||||||||||||||||||||||||||
| Year Ended December 31, | Year Ended December 31, | |||||||||||||||||||||||||||||||||||||||||||||||||||||||||||
| 2010 | 2011 | 2011 | 2012 | 2013 | ||||||||||||||||||||||||||||||||||||||||||||||||||||||||
| Average Balance(1) | Interest Expense | Average Cost | Average Balance(1) | Interest Expense | Average Cost | Average Balance (1) | Interest Expense | Average Cost | Average Balance (1) | Interest Expense | Average Cost | Average Balance (1) | Interest Expense | Average Cost | ||||||||||||||||||||||||||||||||||||||||||||||
| (in billions of Won, except percentages) | (in billions of Won, except percentages) | |||||||||||||||||||||||||||||||||||||||||||||||||||||||||||
Liabilities | ||||||||||||||||||||||||||||||||||||||||||||||||||||||||||||
Deposits: | ||||||||||||||||||||||||||||||||||||||||||||||||||||||||||||
Demand deposits | (Won) | 48,919 | (Won) | 212 | 0.43 | % | (Won) | 53,824 | (Won) | 314 | 0.58 | % | ₩ | 53,824 | ₩ | 314 | 0.58 | % | ₩ | 56,154 | ₩ | 336 | 0.60 | % | ₩ | 60,894 | ₩ | 285 | 0.47 | % | ||||||||||||||||||||||||||||||
Time deposits | 112,621 | 4,055 | 3.60 | 124,713 | 4,563 | 3.66 | 124,713 | 4,563 | 3.66 | 136,617 | 5,047 | 3.69 | 130,286 | 3,940 | 3.02 | |||||||||||||||||||||||||||||||||||||||||||||
Certificates of deposit | 11,044 | 442 | 4.00 | 1,746 | 68 | 3.89 | 1,746 | 68 | 3.89 | 1,735 | 67 | 3.86 | 1,780 | 54 | 3.03 | |||||||||||||||||||||||||||||||||||||||||||||
|
|
|
|
|
|
|
|
|
| |||||||||||||||||||||||||||||||||||||||||||||||||||
Deposits (total) | 172,584 | 4,709 | 2.73 | 180,283 | 4,945 | 2.74 | 180,283 | 4,945 | 2.74 | 194,506 | 5,450 | 2.80 | 192,960 | 4,279 | 2.22 | |||||||||||||||||||||||||||||||||||||||||||||
Debts | 15,494 | 306 | 1.97 | 18,475 | 399 | 2.16 | 18,475 | 399 | 2.16 | 21,773 | 460 | 2.11 | 20,173 | 365 | 1.81 | |||||||||||||||||||||||||||||||||||||||||||||
Debentures | 35,426 | 1,863 | 5.26 | 28,400 | 1,508 | 5.31 | 28,400 | 1,508 | 5.31 | 24,552 | 1,262 | 5.14 | 25,319 | 1,190 | 4.70 | |||||||||||||||||||||||||||||||||||||||||||||
|
|
|
|
|
|
|
|
|
| |||||||||||||||||||||||||||||||||||||||||||||||||||
Total average interest bearing liabilities | (Won) | 223,504 | (Won) | 6,878 | 3.08 | % | (Won) | 227,158 | (Won) | 6,852 | 3.02 | % | ₩ | 227,158 | ₩ | 6,852 | 3.02 | % | ₩ | 240,831 | ₩ | 7,172 | 2.98 | % | ₩ | 238,452 | ₩ | 5,834 | 2.45 | % | ||||||||||||||||||||||||||||||
|
|
|
|
|
|
|
|
|
| |||||||||||||||||||||||||||||||||||||||||||||||||||
Non-interest bearing demand deposits | 3,348 | — | — | 3,249 | — | — | 3,249 | — | — | 3,075 | — | — | 3,252 | — | — | |||||||||||||||||||||||||||||||||||||||||||||
Derivative financial liabilities | 2,591 | — | — | 2,064 | — | — | 2,064 | — | — | 1,899 | — | — | 1,789 | — | — | |||||||||||||||||||||||||||||||||||||||||||||
Financial liabilities at fair value through profit and loss | 1,783 | — | — | 1,847 | — | — | ||||||||||||||||||||||||||||||||||||||||||||||||||||||
Financial liabilities at fair value through profit or loss | 1,847 | — | — | 1,724 | — | — | 1,697 | — | — | |||||||||||||||||||||||||||||||||||||||||||||||||||
Other non-interest bearing liabilities | 15,938 | — | — | 16,093 | — | — | 16,093 | — | — | 17,770 | — | — | 19,157 | — | — | |||||||||||||||||||||||||||||||||||||||||||||
|
|
|
|
|
|
|
|
|
| |||||||||||||||||||||||||||||||||||||||||||||||||||
Total average non-interest bearing liabilities | 23,660 | — | — | 23,253 | — | — | 23,253 | — | — | 24,468 | — | — | 25,895 | — | — | |||||||||||||||||||||||||||||||||||||||||||||
|
|
|
|
|
|
|
|
|
| |||||||||||||||||||||||||||||||||||||||||||||||||||
Total average liabilities | 247,164 | 6,878 | 2.78 | 250,411 | 6,852 | 2.74 | 250,411 | 6,852 | 2.74 | 265,299 | 7,172 | 2.70 | 264,347 | 5,834 | 2.21 | |||||||||||||||||||||||||||||||||||||||||||||
|
|
|
|
|
|
|
|
|
| |||||||||||||||||||||||||||||||||||||||||||||||||||
Total equity | 20,502 | — | — | 24,290 | — | — | 24,290 | — | — | 24,432 | — | — | 25,500 | — | — | |||||||||||||||||||||||||||||||||||||||||||||
|
|
|
|
|
|
|
|
|
| |||||||||||||||||||||||||||||||||||||||||||||||||||
Total average liabilities and equity | (Won) | 267,666 | (Won) | 6,878 | 2.57 | % | (Won) | 274,701 | (Won) | 6,852 | 2.49 | % | ₩ | 274,701 | ₩ | 6,852 | 2.49 | % | ₩ | 289,731 | ₩ | 7,172 | 2.48 | % | ₩ | 289,847 | ₩ | 5,834 | 2.01 | % | ||||||||||||||||||||||||||||||
|
|
|
|
|
|
|
|
|
| |||||||||||||||||||||||||||||||||||||||||||||||||||
| (1) | Average balances are based on daily balances for our banking, credit card and investment and securities operations and monthly or quarterly balances for our other operations. |
We do not invest in any tax-exempt securities. |
| (3) | Excludes interest income from debt securities at fair value through profit or loss. |
Information related to investment securities classified as available-for-sale has been computed using amortized cost, and therefore does not give effect to changes in fair value that are reflected as a component of total equity. |
Interest income from credit cards includes principally cash advance fees of |
The following table presents our net interest spread, net interest margin, and asset liability ratio for the past twothree years:
| Year Ended December 31, | ||||||||
| 2010 | 2011 | |||||||
| (percentages) | ||||||||
Net interest spread(1) | 2.37 | % | 2.64 | % | ||||
Net interest margin(2) | 2.58 | 2.88 | ||||||
Average asset liability ratio(3) | 107.06 | 108.57 | ||||||
| Year Ended December 31, | ||||||||||||
| 2011 | 2012 | 2013 | ||||||||||
| (percentages) | ||||||||||||
Net interest spread (1) | 2.64 | % | 2.48 | % | 2.31 | % | ||||||
Net interest margin (2) | 2.88 | 2.71 | 2.51 | |||||||||
Average asset liability ratio (3) | 108.57 | 108.01 | 108.89 | |||||||||
| (1) | The difference between the average rate of interest earned on interest earning assets and the average rate of interest paid on interest bearing liabilities. |
| (2) | The ratio of net interest income to average interest earning assets. |
| (3) | The ratio of average interest earning assets to average interest bearing liabilities. |
Analysis of Changes in Net Interest Income—Volume and Rate Analysis
The following table provides an analysis of changes in interest income, interest expense and net interest income based on changes in volume and changes in rate for 20102011 compared to 2011.2012 and 2012 compared to 2013. Information is provided with respect to: (1) effects attributable to changes in volume (changes in volume multiplied by prior rate) and (2) effects attributable to changes in rate (changes in rate multiplied by prior volume). Changes attributable to the combined impact of changes in rate and volume have been allocated proportionately to the changes due to volume changes and changes due to rate changes.
| 2011 vs. 2010 Increase/(Decrease) Due to Change in | 2012 vs. 2011 Increase/(Decrease) Due to Change in | 2013 vs. 2012 Increase/(Decrease) Due to Change in | ||||||||||||||||||||||||||||||||||
| Volume | Rate | Total | Volume | Rate | Total | Volume | Rate | Total | ||||||||||||||||||||||||||||
| (in billions of Won) | (in billions of Won) | |||||||||||||||||||||||||||||||||||
Interest earning assets | ||||||||||||||||||||||||||||||||||||
Cash and interest earning deposits in other banks | (Won) | 10 | (Won) | 27 | (Won) | 37 | ₩ | 83 | ₩ | 2 | ₩ | 85 | ₩ | 32 | ₩ | (46 | ) | ₩ | (14 | ) | ||||||||||||||||
Financial investment (debt securities) | 9 | (42 | ) | (33 | ) | 33 | (76 | ) | (43 | ) | (2 | ) | (155 | ) | (157 | ) | ||||||||||||||||||||
Loans: | ||||||||||||||||||||||||||||||||||||
Corporate | 137 | 57 | 194 | 438 | (242 | ) | 196 | (110 | ) | (692 | ) | (802 | ) | |||||||||||||||||||||||
Mortgage | (24 | ) | 238 | 214 | 33 | (44 | ) | (11 | ) | 3 | (338 | ) | (335 | ) | ||||||||||||||||||||||
Home equity | 142 | 113 | 255 | 40 | (18 | ) | 22 | 5 | (253 | ) | (248 | ) | ||||||||||||||||||||||||
Other consumer | 80 | 100 | 180 | 40 | (53 | ) | (13 | ) | 58 | (247 | ) | (189 | ) | |||||||||||||||||||||||
Credit cards | 49 | — | 49 | (33 | ) | 36 | 3 | (51 | ) | (52 | ) | (103 | ) | |||||||||||||||||||||||
Foreign | 11 | (3 | ) | 8 | 10 | 5 | 15 | 3 | (8 | ) | (5 | ) | ||||||||||||||||||||||||
|
|
|
|
|
|
|
|
| ||||||||||||||||||||||||||||
Total interest income | (Won) | 414 | (Won) | 490 | (Won) | 904 | ₩ | 644 | ₩ | (390 | ) | ₩ | 254 | ₩ | (62 | ) | ₩ | (1,791 | ) | ₩ | (1,853 | ) | ||||||||||||||
|
|
|
|
|
|
|
|
| ||||||||||||||||||||||||||||
| 2011 vs. 2010 Increase/(Decrease) Due to Change in | 2012 vs. 2011 Increase/(Decrease) Due to Change in | 2013 vs. 2012 Increase/(Decrease) Due to Change in | ||||||||||||||||||||||||||||||||||
| Volume | Rate | Total | Volume | Rate | Total | Volume | Rate | Total | ||||||||||||||||||||||||||||
| (in billions of Won) | (in billions of Won) | |||||||||||||||||||||||||||||||||||
Interest bearing liabilities | ||||||||||||||||||||||||||||||||||||
Deposits: | ||||||||||||||||||||||||||||||||||||
Demand deposits | (Won) | 23 | (Won) | 79 | (Won) | 102 | ₩ | 12 | ₩ | 10 | ₩ | 22 | ₩ | 27 | ₩ | (78 | ) | ₩ | (51 | ) | ||||||||||||||||
Time deposits | 440 | 68 | 508 | 446 | 38 | 484 | (225 | ) | (882 | ) | (1,107 | ) | ||||||||||||||||||||||||
Certificates of deposit | (362 | ) | (12 | ) | (374 | ) | — | (1 | ) | (1 | ) | 2 | (15 | ) | (13 | ) | ||||||||||||||||||||
Debts | 62 | 31 | 93 | 70 | (9 | ) | 61 | (32 | ) | (63 | ) | (95 | ) | |||||||||||||||||||||||
Debentures | (373 | ) | 18 | (355 | ) | (199 | ) | (47 | ) | (246 | ) | 39 | (111 | ) | (72 | ) | ||||||||||||||||||||
|
|
|
|
|
|
|
|
| ||||||||||||||||||||||||||||
Total interest expense | (210 | ) | 184 | (26 | ) | 329 | (9 | ) | 320 | (189 | ) | (1,149 | ) | (1,338 | ) | |||||||||||||||||||||
|
|
|
|
|
|
|
|
| ||||||||||||||||||||||||||||
Total net interest income | (Won) | 624 | (Won) | 306 | (Won) | 930 | ₩ | 315 | ₩ | (381 | ) | ₩ | (66 | ) | ₩ | 127 | ₩ | (642 | ) | ₩ | (515 | ) | ||||||||||||||
|
|
|
|
|
|
|
|
| ||||||||||||||||||||||||||||
Exchange Rates
The table below sets forth, for the periods and dates indicated, information concerning the noon buying rate for Won, expressed in Won per one U.S. dollar. The “noon buying rate” is the rate in New York City for cable transfers in foreign currencies as certified for customs purposes by the Federal Reserve Bank of New York. Unless otherwise stated, translations of Won amounts into U.S. dollars in this annual report were made at the noon buying rate in effect on December 30, 2011,31, 2013, which was (Won)1,158.5₩1,055.3 to US$1.00. We do not intend to imply that the Won or U.S. dollar amounts referred to herein could have been or could be converted into U.S. dollars or Won, as the case may be, at any particular rate, or at all. On April 20, 2012,25, 2014, the noon buying rate was (Won)1,138.1₩1,041.0 = US$1.00.
| Won per U.S. dollar (noon buying rate) | Won per U.S. dollar (noon buying rate) | |||||||||||||||||||||||||||||||
| Low | High | Average (1) | Period-End | Low | High | Average (1) | Period-End | |||||||||||||||||||||||||
2006 | 913.7 | 1,002.9 | 954.3 | 930.0 | ||||||||||||||||||||||||||||
2007 | 903.2 | 950.2 | 929.0 | 935.8 | ||||||||||||||||||||||||||||
2008 | 935.2 | 1,507.9 | 1,098.7 | 1,262.0 | ||||||||||||||||||||||||||||
2009 | 1,149.0 | 1,570.1 | 1,274.6 | 1,163.7 | 1,149.0 | 1,570.1 | 1,274.6 | 1,163.7 | ||||||||||||||||||||||||
2010 | 1,104.0 | 1,253.2 | 1,155.7 | 1,130.6 | 1,104.0 | 1,253.2 | 1,155.7 | 1,130.6 | ||||||||||||||||||||||||
2011 | 1,049.2 | 1,197.5 | 1,106.9 | 1,158.5 | 1,049.2 | 1,197.5 | 1,106.9 | 1,158.5 | ||||||||||||||||||||||||
2012 | 1,063.2 | 1,185.0 | 1,126.2 | 1,063.2 | ||||||||||||||||||||||||||||
2013 | 1,050.1 | 1,161.3 | 1,094.7 | 1,055.3 | ||||||||||||||||||||||||||||
October | 1,102.5 | 1,197.5 | 1,150.7 | 1,112.1 | 1,057.5 | 1,075.5 | 1,065.9 | 1,060.8 | ||||||||||||||||||||||||
November | 1,110.6 | 1,162.0 | 1,133.5 | 1,140.1 | 1,054.8 | 1,072.7 | 1,061.6 | 1,057.8 | ||||||||||||||||||||||||
December | 1,124.5 | 1,175.5 | 1,148.1 | 1,158.5 | 1,050.1 | 1,061.4 | 1,055.6 | 1,055.3 | ||||||||||||||||||||||||
2012(through April 20) | 1,115.7 | 1,160.0 | 1,130.6 | 1,138.1 | ||||||||||||||||||||||||||||
2014 (through April 25) | 1,035.4 | 1,084.3 | 1,063.6 | 1,041.0 | ||||||||||||||||||||||||||||
January | 1,120.1 | 1,160.0 | 1,140.3 | 1,125.7 | 1,050.3 | 1,083.7 | 1,067.1 | 1,080.4 | ||||||||||||||||||||||||
February | 1,115.7 | 1,128.9 | 1,122.7 | 1,117.1 | 1,062.1 | 1,084.3 | 1,071.3 | 1,066.0 | ||||||||||||||||||||||||
March | 1,116.0 | 1,139.8 | 1,126.2 | 1,131.4 | 1,064.1 | 1,079.6 | 1,070.5 | 1,064.7 | ||||||||||||||||||||||||
April (through April 20) | 1,122.4 | 1,143.4 | 1,134.8 | 1,138.1 | ||||||||||||||||||||||||||||
April (through April 25) | 1,035.4 | 1,058.3 | 1,044.2 | 1,041.0 | ||||||||||||||||||||||||||||
Source: Federal Reserve Bank of New York.
| (1) | The average of the daily noon buying rates of the Federal Reserve Bank in effect during the relevant period (or portion thereof). |
| Item 3.B. |
Not Applicableapplicable.
| Item 3.C. |
Not Applicableapplicable.
| Item 3.D. |
Risks relating to our retail credit portfolio
Future changes in market conditions as well as other factors may lead to increases in delinquency levels of our retail loan portfolio.
InFor most of the recent years,past, consumer debt has increased rapidlysignificantly in Korea. Our portfolio of retail loans, including mortgage and home equity loans, amounted to (Won)98,996grew from ₩98,996 billion as of December 31, 2010 and (Won)103,855to ₩103,855 billion as of December 31, 2011.2011, although it decreased slightly to ₩103,432 billion as of December 31, 2012 but increased to ₩107,644 billion as of December 31, 2013. As of December 31, 2011,2013, our retail loans represented 48.2%48.5% of our total lending. Within our retail loan portfolio, the outstanding balance of other consumer loans, which unlike mortgage or home equity loans are often unsecured and therefore tend to carry a higher credit risk, has increased in recent years and amounted to (Won)27,281from ₩27,281 billion as of December 31, 2010 and (Won)28,275to ₩28,275 billion as of December 31, 2011;2011, ₩28,969 billion as of December 31, 2012 and ₩29,675 billion as of December 31, 2013; as a percentage of total
outstanding retail loans, such balance washas remained relatively stable at 27.6% as of December 31, 2010, and 27.2% as of December 31, 2011.2011, 28.0% as of December 31, 2012 and 27.6% as of December 31, 2013. The growth of our retail lending business, which generally offers higher margins than other lending activities, contributed significantly to our interest income and profitability in recent years.
The growth of our retail loan portfolio, together with adverse economic conditions in Korea and globally in recent years, may lead to further increases in delinquency levels and a deterioration in asset quality. While theThe amount of our non-performing retail loans (defined as those that are past due by 90 days or more), which was (Won)641 billion as of December 31, 2010 and (Won)642 increased from ₩642 billion as of December 31, 2011 has remained relatively stable in recent years due to the stabilization₩762 billion as of delinquency levels, our non-performing retail loans may increase inDecember 31, 2012 and in the future.but decreased to ₩546 billion as of December 31, 2013. Higher delinquencies in our retail loan portfolio will require us to increase our loan loss provisions and charge-offs, which in turn will adversely affect our financial condition and results of operations.
Our large exposure to consumer debt means that we are exposed to changes in economic conditions affecting Korean consumers. Accordingly, a rise in unemployment, an increase in interest rates, deterioration of the real estate market or difficulties in the Korean economy may have an adverse effect on Korean consumers, which could result in reduced growth and further deterioration in the credit quality of our retail loan portfolio. See “Risks relating to Korea—Unfavorable financial and economic developments in Korea may have an adverse effect on us.” In order to minimize our risk as a result of such exposure, we are continuing to strengthen our risk management processes, including further improving the retail lending process, upgrading our retail credit rating system, as well as strengthening the overall management of our portfolio. Despite our efforts, however, there is no assurance that we will be able to prevent significant credit quality deterioration in our retail loan portfolio.
In light of adverse conditions in the Korean economy affecting consumers, in March 2009, the Financial Services Commission requested Korean banks, including us, to establish a “pre-workout program,” including a credit counseling and recovery service, for retail borrowers with outstanding short-term debt. TheUnder the pre-workout program, which has been in operation since April 2009, and, following extensions by the Korean government, is expected to continue until April 2013. Under the pre-workout program, maturity extensions and/or interest reductions are provided for retail borrowers with total loans of ₩1.5 billion or less (consisting of no more than (Won)500₩500 million of unsecured loans and ₩1 billion of secured loans) who are in arrears on their payments for more than 30 days but less than 90 days.days or for retail borrowers with an annual income of ₩40 million or less who have been in arrears on their payments for more than 30 days on an aggregate basis for the 12 months prior to their application. While we believe that our participation in such pre-workout program has not had a material impact on the overall credit quality of our retail loan and credit card portfolio or on our results of operations and financial condition to date, our future participation in such government-led initiatives to provide financial support to retail borrowers may lead us to offer credit terms for such borrowers that we would not otherwise offer, in the absence of such initiatives, which may have an adverse effect on our results of operations and financial condition.
Our credit card operations may generate losses in the future, which could hurt our financial condition and results of operations.
With respect to our credit card portfolio, our delinquency ratio (which represents the ratio of amounts that are overdue by 30 days or more to total outstanding balances) wasincreased from 1.0% as of December 31, 2010 andto 1.5% as of December 31, 2011.2011, then decreased to 1.3% as of December 31, 2012 but increased to 1.7% as of December 31, 2013. In line with industry practice, we have restructured a portion of delinquent credit card account balances (defined as balances overdue by 30 days or more) as loans. As of December 31, 2011,2013, these restructured loans outstanding amounted to (Won)28₩50 billion. Because these loans are not treated as being delinquent at the time of conversion or for a period of time thereafter, our delinquency ratios may not fully reflect all delinquent amounts relating to our outstanding loans. Including all restructured loans, outstanding balances overdue by 30 days or more accounted for 1.7%2.1% of our credit card receivables (including credit card loans) as of December 31, 2011.2013. Delinquencies may increase further in 20122014 and in the future as a result of, among other things, adverse economic conditions in Korea and the inability of Korean consumers to manage increased household debt.
Despite our continuing efforts to sustain and improve our credit card asset quality and performance, we may experience increased delinquencies or deterioration of the asset quality of our credit card portfolio, which would require us to increase our loan loss provisions and charge-offs and adversely affect our overall financial condition and results of operations.
In addition, as a part of our strategy to promotein February 2014, the growthFinancial Services Commission suspended the new credit card issuance and other related activities of our credit card operations and enhance its synergies with our other businesses, in March 2011, we effected a horizontal spin-off of the credit card business from Kookmin Bank. As a result, our credit card business is operated by a newly established wholly-owned
subsidiary, KB Kookmin Card Co., Ltd.However, we may not be ableLtd., for three months from February to realizeMay 2014, in response to an incident involving the anticipated benefitsmisappropriation of this spin-off due to various factors, including increased expenses arising from the operationpersonal information of a separatelarge number of its customers by an employee of an external credit information company in the first half of 2013. Specifically, during such suspension period, KB Kookmin Card will be prohibited from engaging in the following activities:
adding new subscribers for credit cards, prepaid cards and debit cards or issuing such types of cards (except as permitted by the chairman of the Financial Services Commission for public policy purposes);
providing new or additional credit lines to credit card company, unexpectedcustomers; and
providing new services through mail order or telemarketing channels or related to travel or insurance products.
Furthermore, in connection with the misappropriation incident, a number of customers have filed lawsuits against KB Kookmin Card seeking damages, and it could become subject to additional litigation and regulatory sanctions. See “Item 8A. Consolidated Statements and Other Financial Information—Legal Proceedings.” KB Kookmin Card may also incur significant costs relating to the issuance of replacement cards for customers and the compensation of customers for losses incurred as a result of the fraudulent use of the misappropriated personal information. Accordingly, the misappropriation incident and the resulting regulatory sanctions (including the three-month suspension of KB Kookmin Card’s new business disruptions, difficulties in reorganizing personnelactivities), customer claims and administrative functionscosts could have a material adverse effect on our business, reputation, results of operations and potential loss of customers.financial condition.
Risks relating to our small- and medium-sized enterprise loan portfolio
We have significant exposure to small- and medium-sized enterprises, and any financial difficulties experienced by these customers may result in a deterioration of our asset quality and have an adverse impact on us.
One of our core businesses is lending to small- and medium-sized enterprises (as defined under “Item 4B.4.B. Business Overview—Corporate Banking—Small- and Medium-sized Enterprise Banking”). Our loans to small- and medium-sized enterprises amounted to (Won)65,132increased from ₩65,132 billion as of December 31, 2010 and (Won)68,730to ₩71,045 billion as of December 31, 2011.2013. During that period, non-performing loans (defined as those loans that are past due by 90 days or more) to small- and medium-sized enterprises decreased from (Won)686₩686 billion as of December 31, 2010 to (Won)373₩373 billion as of December 31, 2011 but increased to ₩568 as of December 31, 2013, and the non-performing loan ratio for such loans decreased from 1.1% as of December 31, 2010 to 0.5% as of December 31, 2011 but increased to 0.8% as of December 31, 2013, and may further increase in 2012.2014. According to data compiled by the Financial Supervisory Service, the delinquency ratio for Won-currency loans by Korean commercial banks to small- and medium-sized enterprises was 1.4% as of December 31, 2011.2013. The delinquency ratio for loans to small- and medium-sized enterprise is calculated as the ratio of (1) the outstanding balance of such loans in respect of which either principal or interest payments are overdue by one month or more to (2) the aggregate outstanding balance of such loans. Our delinquency ratio for such Won currency loans decreased slightly fromhas remained relatively stable at 1.1% as of December 31, 2010, to 1.0% as of December 31, 2011, 1.1% as of December 31, 2012, and 0.9% as of December 31, 2013, but may increase in 2012.2014. In recent years, we have taken measures which sought to stem rising delinquencies in our loans to small- and medium-sized enterprises, including through strengthening
the review of loan applications and closer monitoring of the post-loan performance of small- and medium-sized enterprise borrowers in industry sectors that are relatively more sensitive to downturns in the economy and have shown higher delinquency ratios, such as construction, hotels,lodging, retail and wholesale, restaurants and real estate. Despite such efforts, however, there is no assurance that delinquency levels for our loans to small- and medium-sized enterprises will not rise in the future. In particular, financial difficulties experienced by small- and medium-sized enterprises as a result of, among other things, adverse economic conditions in Korea and globally in recent years may lead to a deterioration in the asset quality of our loans to this segment. Any such deterioration would result in increased charge-offs and higher provisioning and reduced interest and fee income from this segment, which could have a material adverse impact on our financial condition and results of operations.
In addition, many small- and medium-sized enterprises have close business relationships with the largest Korean commercial conglomerates, known as “chaebols,” primarily as suppliers. Any difficulties encountered by thosechaebols would likely hurt the liquidity and financial condition of related small- and medium-sized enterprises, including those to which we have exposure, also resulting in an impairment of their ability to repay loans.
A substantial part of our small- and medium-sized enterprise lending comprises loans to “small office/home office” customers, or SOHOs. SOHOs, which we currently define to include sole proprietorships and individual business interests, are usually dependent on a limited number of suppliers or customers. SOHOs tend to be affected to a greater extent than larger corporate borrowers by fluctuations in the Korean economy. In addition, SOHOs often maintain less sophisticated financial records than other corporate borrowers. Although we continue to make efforts to improve our internally developed credit rating systems to rate potential borrowers, particularly with respect to SOHOs, and intend to manage our exposure to these borrowers closely in order to prevent any deterioration in the asset quality of our loans to this segment, we may not be able to do so as intended.
In light of the deteriorating financial condition and liquidity position of small- and medium-sized enterprises in Korea since the global financial crisis commencing in the second half of 2008, the Korean government introduced policies and initiatives intended to encourage Korean banks to provide financial support to small- and medium-sized enterprises. For example, in November 2008, we entered into a memorandum of understanding
with the Financial Supervisory Service under which we were required to improve the liquidity position of small- and medium-sized enterprises and exporters by providing them with adequate financing and to endeavor to alleviate burdens on low-income debtors by extending maturity dates or by delaying interest payments on loans owed to us. In addition, in October 2008, the Financial Supervisory Service requested Korean banks, including us, to establish a “fast track” program to provide liquidity assistance to small- and medium-sized enterprises on an expedited basis. Under the fast track program we established, which is effective throughhas been extended until December 31, 2012,2014, we provide liquidity assistance to qualified small- and medium-sized enterprise borrowers applying for such assistance, in the form of new loans or maturity extensions or interest rate adjustments with respect to existing loans, after expedited credit review and approval by us. The overall prospects for the Korean economy in 20122014 and beyond remain uncertain, and the Korean government may extend or renew existing or past policies and initiatives or introduce new policies or initiatives to encourage Korean banks to provide financial support to small- and medium-sized enterprises. Our participation in such government-led initiatives may lead us to extend credit to small- and medium-sized enterprise borrowers that we would not otherwise extend, or offer terms for such credit that we would not otherwise offer, in the absence of such initiatives. Furthermore, there is no guarantee that the financial condition and liquidity position of our small- and medium-sized enterprise borrowers benefiting from such initiatives will improve sufficiently for them to service their debt on a timely basis, or at all. Accordingly, increases in our exposure to small- and medium-sized enterprise borrowers resulting from such government-led initiatives may have a material adverse effect on our financial condition and results of operations.
We have exposure to Korean construction and shipbuilding companies, and financial difficulties of these companies may have an adverse impact on us.
As of December 31, 2011,2013, we had loans outstanding to construction companies and shipbuilding companies (many of which are small- and medium-sized enterprises) in the amount of (Won)5,631₩4,297 billion and (Won)1,177₩714 billion, or 2.6%1.9% and 0.5%0.3% of our total loans, respectively. We also have other exposures to Korean construction and shipbuilding companies, including in the form of guarantees extended for the benefiton behalf of such companies (which included ₩485 billion of confirmed guarantees for construction companies and ₩1,987 billion of confirmed guarantees for shipbuilding companies as of December 31, 2013) and debt and equity securities of such companies held by us. In the case of construction companies, such exposures include guarantees provided to us by general contractors with respect to financing extended by us for residential and commercial real estate development projects. In the case of shipbuilding companies, such exposures include refund guarantees extended by us on behalf of shipbuilding companies to cover their obligation to return a portion of the ship order contract amount to customers in the event of performance delays or defaults under shipbuilding contracts.
The construction industry in Korea has experienced a downturn in recent years, due to excessive investment in residential property development projects, stagnation of real property prices and reduced demand for residential property, especially in areas outside of Seoul, including as a result of the deterioration of the Korean economy commencing in the second half of 2008. In October 2008, the Korean government implemented a (Won)9 trillion support package for the benefit of the Korean construction industry, including a program to buy unsold housing units and land from construction companies.economy. The shipbuilding industry in Korea has also experienced a severe downturn in recent years due to a significant decrease in ship orders, primarily due to adverse conditions in the global economy and the resulting slowdown in global trade. In response to the deteriorating financial condition and liquidity position of borrowers in the construction and shipbuilding industries, which were disproportionately impacted by adverse economic developments in Korea and globally, the Korean government implemented a program in 2009 to promote expedited restructuring of such borrowers by their Korean creditor financial institutions, under the supervision of major commercial banks. In accordance with such program, 24 construction companies and five shipbuilding companies became subject to workout in 2009, following review by their creditor financial institutions (including us) and the Korean government. In addition, in June 2010, the Financial Services Commission and the Financial Supervisory Service announced that, following credit risk evaluations conducted by creditor financial institutions (including us) of companies in Korea with outstanding debt of (Won)50₩50 billion or more, 65 companies had been selected by such financial institutions for restructuring in the form of workout, liquidation or court receivership. Of such 65 companies, 16 were construction companies and three were shipbuilding companies. In July 2013, the Financial Services Commission and the Financial Supervisory Service announced the results of subsequent credit risk evaluations conducted by creditor financial institutions (including us) of companies in Korea, in which 40 companies with outstanding debt of ₩50 billion or more (20 of which were construction companies and three of which were shipbuilding and shipping companies) were selected by such financial institutions for restructuring in the form of workout, liquidation or court receivership. However, there is no assurance that these measures will be successful in stabilizing the Korean construction and shipbuilding industries.
The allowances that we have established against our credit exposures to Korean construction and shipbuilding companies may not be sufficient to cover all future losses arising from these and other exposures. If the credit quality of our exposures to Korean construction and shipbuilding companies declines further, we may be required to take substantial additional provisions (including in connection with restructurings of such companies), which could adversely impact our results of operations and financial condition. Furthermore, although a portion of our credit exposures to construction and shipbuilding companies are secured by collateral, such collateral may not be sufficient to cover uncollectible amounts in respect of such credit exposures. See “—Other risks relating to our business—A decline in the value of the collateral securing our loans and our inability to realize full collateral value may adversely affect our credit portfolio.”
We also have construction-related credit exposures under our project financing loans for real estate development projects in Korea. In light of the general deterioration in the asset quality of real estate project financing loans in Korea in recent years, Korean banks, including Kookmin Bank, implemented a uniform set of guidelines regarding the evaluation of real estate development projects and asset quality classification of project financing loans for such projects in September 2010. Under these guidelines, which became effective from the third quarter of 2010, Korean banks are generally required to apply more stringent criteria in evaluating the asset quality of real estate project financing loans. As a result, we may be required to establish additional allowances with respect to our outstanding real estate project financing loans, which could adversely affect our financial condition and results of operations.
Risks relating to our financial holding company structure and strategy
We have a limited operating history as a financial holding company, and we may not succeed in implementing our strategy to take advantage of, or fail to realize the anticipated benefits of, our financial holding company structure.
We were established as a new financial holding company in September 2008 pursuant to a “comprehensive stock transfer” under Korean law, following the completion of which Kookmin Bank, KB Investment & Securities Co., Ltd., KB Asset Management Co., Ltd., KB Real Estate Trust Co., Ltd., KB Investment Co., Ltd., KB Futures Co., Ltd., KB Credit Information Co., Ltd., and KB Data Systems Co., Ltd. became our wholly-owned subsidiaries. See “Item 4A.4.A. History and Development of the Company—The Establishment of KB Financial Group.” In addition, as a part of our strategy to promote the growth of our credit card operations and enhance its synergies with our other businesses, we effected a horizontal spin-off of Kookmin Bank’s credit card business in March 2011. As a result, our credit card business is operated by a newly establishedseparate wholly-owned subsidiary, KB Kookmin Card Co., Ltd.
One of our principal strategies is to take advantage of our financial holding company structure to become a comprehensive financial services provider capable of offering a full range of products and services to our large existing base of retail and corporate banking customers. The continued implementation of these plans may require additional investments of capital, infrastructure, human resources and management attention. This strategy entails certain risks, including the possibility that we may face significant competition from other financial holding companies and more specialized financial institutions in particular segments. If our strategy does not succeed, we may incur losses on our investments and our results of operations and financial condition may suffer.
Furthermore, our success under a financial holding company structure depends on our ability to realize the anticipated synergies, growth opportunities and cost savings from coordinating the businesses of our various subsidiaries. Although we arehave been integrating certain aspects of our subsidiaries’ operations into our financial holding company structure, our subsidiaries will generally continue to operate as independent entities with separate management and staff. As a result,staff and our ability to direct our subsidiaries’ day-to-day operations may be limited. For example, we may not be able to realize the anticipated benefits of the 2011 horizontal spin-off of the credit card business from Kookmin Bank into a new wholly-owned subsidiary, KB Kookmin Card Co., Ltd., due to various factors, including increased expenses arising from the operation of a separate credit card company, unexpected business disruptions, difficulties in reorganizing personnel and administrative functions and potential loss of customers.
In addition, one of the intended benefits of our financial holding company structure is that it enhances our ability to engage in mergers and acquisitions which we decide to pursue in the future as part of our strategy. For example,
we may consider acquiring or merging with a non-bank financial institution in Korea, including one of the government-controlled financial institutions that becomes privatized in the future, or overseas.to achieve balanced growth and diversify our revenue base. The integration of our subsidiaries’ separate businesses and operations, as well as those of any companies we may acquire or merge with in the future, under our financial holding company structure could require a significant amount of time, financial resources and management attention. Moreover, that process could disrupt our operations (including our risk management operations) or information technology systems, reduce employee morale, produce unintended inconsistencies in our standards, controls, procedures or policies, and affect our relationships with customers and our ability to retain key personnel. The realization of the anticipated benefits of our financial holding company structure and any mergers or acquisitions we decide to pursue may be blocked, delayed or reduced as a result of many factors, some of which may be outside our control. These factors include:
difficulties in integrating the diverse activities and operations of our subsidiaries or any companies we may merge with or acquire, including risk management operations and information technology systems, personnel, policies and procedures;
difficulties in reorganizing or reducing overlapping personnel, branches, networks and administrative functions;
restrictions under the Financial Holding Company Act and other regulations on transactions between a financial holding company and, or among, its subsidiaries;
unforeseen contingent risks, including lack of required capital resources, increased tax liabilities or restrictions in our overseas operations, relating to our financial holding company structure;
unexpected business disruptions;
failure to attract, develop and retain personnel with necessary expertise;
loss of customers; and
labor unrest.
Accordingly, we may not be able to realize the anticipated benefits of our financial holding company structure, and our business, results of operations and financial condition may suffer as a result.
We depend on limited forms of funding to fund our operations at the holding company level.
We are a financial holding company with no significant assets other than the shares of our subsidiaries. Our primary sources of funding and liquidity are dividends from our subsidiaries, direct borrowings and issuances of equity or debt securities at the holding company level. In addition, as a financial holding company, we are required to meet certain minimum financial ratios under Korean law, including with respect to liquidity, leverage and capital adequacy. Our ability to meet our obligations to our direct creditors and employees and our other liquidity needs and regulatory requirements at the holding company level depends on timely and adequate distributions from our subsidiaries and our ability to sell our securities or obtain credit from our lenders.
The ability of our subsidiaries to pay dividends to us depends on their financial condition and operating results. In the future, our subsidiaries may enter into agreements, such as credit agreements with lenders or indentures relating to high-yield or subordinated debt instruments, that impose restrictions on their ability to make distributions to us, and the terms of future obligations and the operation of Korean law could prevent our subsidiaries from making sufficient distributions to us to allow us to make payments on our outstanding obligations. See “—As a financial holding company, we depend on receiving dividends from our subsidiaries to pay dividends on our common stock.” Any delay in receipt of or shortfall in payments to us from our subsidiaries could result in our inability to meet our liquidity needs and regulatory requirements, including minimum liquidity and capital adequacy ratios, and may disrupt our operations at the holding company level.
In addition, creditors of our subsidiaries will generally have claims that are prior to any claims of our creditors with respect to their assets. Furthermore, our inability to sell our securities or obtain funds from our lenders on favorable terms, or at all, could also result in our inability to meet our liquidity needs and regulatory requirements and may disrupt our operations at the holding company level.
As a financial holding company, we depend on receiving dividends from our subsidiaries to pay dividends on our common stock.
Since our principal assets at the holding company level are the shares of our subsidiaries, our ability to pay dividends on our common stock largely depends on dividend payments from those subsidiaries. Those dividend payments are subject to the Korean Commercial Code, the Bank Act and regulatory limitations, generally based on capital levels and retained earnings, imposed by the various regulatory agencies with authority over those entities. For example:
under the Korean Commercial Code, dividends may only be paid out of distributable income, an amount which is calculated by subtracting the aggregate amount of a company’s paid-in capital and certain mandatory legal reserves as well as certain unrealized profits from its net assets, in each case as of the end of the prior fiscal period;
under the Bank Act, a bank also must credit at least 10% of its net profit to a legal reserve each time it pays dividends on distributable income until that reserve equals the amount of its total paid-in capital; and
under the Bank Act and the requirements of the Financial Services Commission, if a bank fails to meet its required capital adequacy ratio or otherwise becomes subject to management improvement measures imposed by the Financial Services Commission, then the Financial Services Commission may restrict the declaration and payment of dividends by that bank.
Our subsidiaries may not continue to meet the applicable legal and regulatory requirements for the payment of dividends in the future. If they fail to do so, they may stop paying or reduce the amount of the dividends they pay to us, which would have an adverse effect on our ability to pay dividends on our common stock.
Although increasing our fee income is an important part of our strategy, we may not be able to do so.
We have historically relied on interest income as our primary revenue source. While we have developed new sources of fee income as part of our business strategy, our ability to increase our fee income and thereby reduce our dependence on interest income will be affected by the extent to which our customers generally accept the concept of fee-based services. Historically, customers in Korea have generally been reluctant to pay fees in return for value-added financial services, and their continued reluctance to do so will adversely affect the implementation of our strategy to increase our fee income. Furthermore, the fees that we charge to customers are subject to regulation by Korean financial regulatory authorities, which may seek to implement regulations or measures that may also have an adverse impact on our ability to achieve this aspect of our strategy.
We may suffer customer attrition or our net interest margin may decrease as a result of our competition strategy.
We have been pursuing, and intend to continue to pursue, a strategy of maintaining or enhancing our margins where possible and avoid, to the extent possible, entering into price competition. In order to execute this strategy, we will need to maintain relatively low interest rates on our deposit products while charging relatively higher rates on loans. If other banks and financial institutions adopt a strategy of expanding market share through interest rate competition, we may suffer customer attrition due to rate sensitivity. In addition, we may in the future decide to compete to a greater extent based on interest rates, which could lead to a decrease in our net interest margins. Any future decline in our customer base or our net interest margins as a result of our future competition strategy could have an adverse effect on our results of operations and financial condition.
Risks relating to competition
Competition in the Korean financial industry is intense, and we may lose market share and experience declining margins as a result.
Competition in the Korean financial industry has been and is likely to remain intense. Some of the financial institutions that we compete with have longer operating histories as financial holding companies, greater financial resources or more specialized capabilities than us and our subsidiaries. In the retail and small- and medium-sized enterprise lending business, which has been our traditional core business, competition has increased significantly and is expected to increase further. Most Korean banks have been focusing on retail customers and small- and medium-sized enterprises in recent years, although they have begun to generally increase their exposure to large corporate borrowers. In addition, the profitability of our retail and credit card operations may decline as a result of growing market saturation in the retail lending and credit card segments, increased interest rate competition, pressure to lower the fee rates applicable to our credit cards (particularly merchant fee rates) and higher marketing expenses. Intense and increasing competition has made and continues to make it more difficult for us to secure retail, credit card and small- and medium-sized customers with the credit quality and on credit terms necessary to achieve our business objectives in a commercially acceptable manner.
In addition, we believe that regulatory reforms and the general modernization of business practices in Korea will lead to increased competition among financial institutions in Korea. We also believe that foreign financial institutions, many of which have greater experience and resources than we do, will seek to compete with us in providing financial products and services either by themselves or in partnership with existing Korean financial institutions. Furthermore, a number of significant mergers and acquisitions in the industry have taken place in Korea over the past decade, including the acquisition of Koram Bank by an affiliate of Citibank in 2004, Standard Chartered Bank’s acquisition of Korea First Bank in 2005, Chohung Bank’s merger with Shinhan Bank in April 2006 and Hana Financial Group’s acquisition of a controlling interest in Korea Exchange Bank in February 2012. We expect that consolidation in the financial industry will continue. In particular, the Korean government has announced that it plans to privatizeis in the Korea Development Bank and to disposeprocess of disposing of or reducereducing its controlling interest in Woori Finance Holdings Co., Ltd. (the financial holding company of Woori Bank)., which involves, in part, sales of its subsidiaries. Other financial institutions may seek to acquire or merge with such entities, and the financial institutions resulting from this consolidation may, by virtue of their increased size and business scope, provide significantly greater competition for us. Increased competition and continuing consolidation may lead to decreased margins, resulting in a material adverse impact on our future profitability. Accordingly our results of operations and financial condition may suffer as a result of increasing competition in the Korean financial industry.
Risks relating to our large corporate loan portfolio
We have exposure to chaebols, and, as a result, financial difficulties of chaebols may have an adverse impact on us.
Of our 20 largest corporate exposures (including loans, debt and equity securities and guarantees and acceptances and other exposures)acceptances) as of December 31, 2011, 132013, 12 were to companies that were members of the 3730 largestchaebols in Korea designated as such by the Financial Supervisory Service based on their outstanding exposures. As of that date, the total amount of our exposures to such 3730chaebols was (Won)22,777₩19,063 billion, or 8.5%6.9% of our total exposures. If the credit quality of our exposures tochaebols declines, we could require substantial additional loan loss provisions, which would hurt our results of operations and financial condition. See “Item 4B.4.B. Business Overview—Assets and Liabilities—Loan Portfolio—Exposure to Chaebols.”
We cannot assure you that the allowances we have established against these exposures will be sufficient to cover all future losses arising from these exposures. In addition, with respect to those companies that are in or in the future enter into workout or liquidation proceedings, we may not be able to make any recoveries against such companies. We may, therefore, experience future losses with respect to those loans.
We have exposure to companies that are currently or may in the future be put in restructuring, and we may suffer losses as a result of additional loan loss provisions required and/or the adoption of restructuring plans with which we do not agree.
As of December 31, 2011,2013, our loans and guarantees to companies that were in workout, restructuring or rehabilitation amounted to (Won)1,152₩1,026 billion or 0.5%0.4% of our total loans and guarantees, most of which was classified as impaired. As of the same date, our allowances for credit losses on these loans and guarantees amounted to (Won)755₩593 billion, or 65.5%57.8% of these loans and guarantees. These allowances may not be sufficient to cover all future losses arising from our exposure to these companies. Furthermore, we have other exposure to such companies, in the form of debt and equity securities of such companies held by us (including equity securities we acquired as a result of debt-to-equity conversions). Our exposures as of December 31, 20112013 with respect to such securities of companies in workout, restructuring or rehabilitation amounted to (Won)119₩148 billion, or less than 0.3% of our total exposures,debt securities and equity securities, but may increase in the future. Infuture.In addition, in the case of borrowers that are or become subject to workout, we may be forced to restructure our credits pursuant to restructuring plans approved by other creditor financial institutions of the borrower, or to dispose of our credits to other creditors on unfavorable terms.
We have exposure to member companies of the Kumho Asiana Group, and financial difficulties of these companies may adversely impact us.
Several member companies of the Kumho Asiana Group, one of Korea’s largestchaebols, have been experiencing financial difficulties, including as a result of their heavily leveraged acquisition of Daewoo Engineering & Construction Co., Ltd. in 2006 and the subsequent global financial crisis commencing in the second half of 2008. In January 2010, Kumho Tires Co., Inc. and Kumho Industrial Co., Ltd. agreed with their creditors, including us, to begin an out-of-court debt restructuring program under the Corporate Restructuring Promotion Act. In addition, Kumho Petrochemical Co., Ltd. and Asiana Airlines announced that they would undergo a voluntary restructuring, in return for which their creditors, including us, agreed to a suspension of payments on the two companies’ debt until the end of 2010. These four companies are member companies of the Kumho Asiana Group. In 2010, we converted an aggregate of ₩38 billion of our loans to Kumho Tires and ₩9 billion of our loans to Kumho Industrial into equity interests in connection with their restructuring programs. As of December 31, 2011,2013, our aggregate loans and guarantees to Kumho Tires, Kumho Industrial, Kumho Petrochemical and Asiana Airlines amounted to (Won)424₩288 billion, ₩81 billion of which (Won)2 billion was classified as impaired. As of December 31, 2011,2013, our allowances for credit losses with respect to such loans and guarantees amounted to (Won)145₩68 billion. Moreover, in 2011, we extended additional loans to Kumho Tires in the aggregate amount of approximately US$3 million to provide additional liquidity in connection with its restructuring program. In 2010, we also converted an aggregate of (Won)38 billion of our loans to Kumho Tires and (Won)9 billion of our loans to Kumho Industrial into equity interests in connection with their restructuring programs. Our allowances may not be sufficient to cover all future losses arising from our exposures to these companies. Furthermore, in the event that the financial condition of these companies deteriorates further in the future, we may be required to record additional provisions for credit losses, as well as charge-offs and valuation or impairment losses or losses on disposal, which may have a material adverse effect on our financial condition and results of operations.
A large portion of our credit exposure is concentrated in a relatively small number of large corporate borrowers which increases the risk of our corporate credit portfolio.
As of December 31, 2011,2013, our loans and guarantees to our 20 largest borrowers totaled (Won)9,701₩8,517 billion and accounted for 4.3%3.7% of our total loans and guarantees. As of that date, our single largest corporate credit exposure was to Hyundai Heavy Industries Co., Ltd., to which we had outstanding credit exposures (most of which was in the form of guarantees and acceptances) of (Won)1,761₩1,552 billion, representing 0.8%0.7% of our total loans and guarantees. Any further deterioration in the financial condition of our large corporate borrowers may require us to record substantial additional provisions and may have a material adverse impact on our results of operations and financial condition.
Other risks relating to our business
Difficult conditions in the global financial markets could adversely affect our results of operations and financial condition.
During the second and third quarter of 2007, credit markets in the United States started to experience difficult conditions and volatility that in turn affected worldwide financial markets. In particular, in late July and early August 2007, market uncertainty in the U.S. sub-prime mortgage sector increased dramatically and further expanded to other markets such as those for leveraged finance, collateralized debt obligations and other structured products. In September and October 2008, liquidity and credit concerns and volatility in the global financial markets increased significantly with the bankruptcy or acquisition of, and government assistance to, several major U.S. and European financial institutions. These developments resulted in reduced liquidity, greater volatility, widening of credit spreads and a lack of price transparency in the United States and global financial markets. In response to such developments, legislators and financial regulators in the United States and other jurisdictions, including Korea, implemented a number of policy measures designed to add stability to the financial markets, including the provision of direct and indirect assistance to distressed financial institutions. In addition, in line with similar actions taken by monetary authorities in other countries, from the third quarter of 2008 to the first quarter of 2009, the Bank of Korea decreased its policy rate by a total of 325 basis points in order to address financial market instability and to help combat the slowdown of the domestic economy. However, whileWhile the rate of deterioration of the global economy has slowed since the second halfcommencement of 2009,the global financial crisis in 2008 has slowed, with some signs of stabilization and improvement, the overall prospects for the Korean and global economy in 2012the remainder of 2014 and beyond remain uncertain. For example, commencingStarting in the second half of 2011, the global financial markets have experienced significant volatility as a result of, among other things, the downgrading by Standard & Poor’s Rating Services of the long-term sovereign credit rating of the United States to “AA+” from “AAA” in August 2011 and the financial difficulties affecting many other governments worldwide, in particular in Cyprus, Greece, Spain, Italy and other countriesPortugal, and the slowdown of economic growth in Europe.major emerging market economies, as well as concerns regarding the potential economic impact of the recently commenced scale-down by the U.S. Federal Reserve Board of its “quantitative easing” stimulus program. In addition, measurescontinuing negotiations regarding Iran’s nuclear program and sanctions adopted by the international community to sanction Iran for its nuclear weapons program,in response, as well as political and social instability in various countries in the Middle East and Northern Africa, including in Syria, Egypt Tunisia,and Libya, Syria and Yemen, have resulted in volatility and uncertainty in the global energy markets. These or other developments could potentially trigger another financial and economic crisis. Furthermore, while many governments worldwide are implementing “exit strategies,” in the form of reduced government spending or otherwise, with respect to the economic stimulus measures adopted in response to China’s slowing gross domestic product growth rates that began in 2011, the global financial crisis,Chinese government has implemented stimulus measures but the overall impact of such strategies may, for reasons related to timing, magnitude or other factors, have the unintended consequence of prolonging or worsening global economic and financial difficulties.measures remains uncertain. In light of the high level of interdependence of the global economy, any of the foregoing developments could have a material adverse effect on the Korean economy and financial markets, and in turn on our business, financial condition and results of operations.
We are also exposed to adverse changes and volatility in global and Korean financial markets as a result of our liabilities and assets denominated in foreign currencies and our holdings of trading and investment securities, including structured products. Since the second half of 2008, theThe value of the Won relative to major foreign currencies in general and the U.S. dollar in particular has fluctuated widely.widely in recent years. See “Item 3A.3.A. Selected Financial Data—Exchange Rates.” A depreciation of the Won will increase our cost in Won of servicing our foreign currency-denominated debt, while continued exchange rate volatility may also result in foreign exchange losses for us. Furthermore, as a result of adverse global and Korean economic conditions, there has been significant volatility in securities prices, including the stock prices of Korean and foreign companies in which we hold an interest. Such volatility has resulted in and may lead to further trading and valuation losses on our trading and investment securities portfolio as well as impairment losses on our investments accounted for under the equity method, including our noncontrolling equity stake in JSC Bank CenterCredit, a Kazakhstan bank, the initial stake in which we acquired in 2008. See “Item 4B.4.B. Business Overview—Capital Markets Activities and International Banking—International Banking.”
Our business may be materially and adversely affected by legal claims and regulatory actions against us.
We are subject to the risk of legal claims and regulatory actions in the ordinary course of our business, which may expose us to substantial monetary damages and legal costs, injunctive relief, criminal and civil penalties, sanctions against our management and employees and regulatory restrictions on our operations, as well as significant reputational harm. SeeIn particular, commencing in November 2013, Kookmin Bank has been subject to a number of investigations by the Financial Supervisory Service and other governmental authorities concerning alleged issues with Kookmin Bank’s internal controls and possible legal violations by Kookmin Bank and its employees.
In November 2013, Kookmin Bank filed a complaint against the former head and two former employees of its Tokyo Branch for allegedly extending illegal loans under borrowed names. The Financial Supervisory Service and the Financial Services Agency of Japan have each launched an investigation into the allegations.
The Financial Supervisory Service launched an investigation into alleged embezzlement of funds by employees at Kookmin Bank’s headquarters, who have since been suspended, through the presentation for payment of forged Korean government housing bonds.
At the request of the Financial Supervisory Service, the Seoul Central District Prosecutors’ Office commenced investigations into such alleged illegalities at Kookmin Bank.
Kookmin Bank is cooperating with the ongoing investigations by the Financial Supervisory Service and other government authorities. Further investigations may be launched by governmental authorities or civil claims may be filed against Kookmin Bank with respect to the alleged legal violations by Kookmin Bank and its employees.
Furthermore, in February 2014, the Financial Services Commission suspended the new credit card issuance and other related activities of KB Kookmin Card for three months from February to May 2014, in response to an incident involving the misappropriation of the personal information of a large number of its customers by an employee of the Korea Credit Bureau in the first half of 2013. In connection with the incident, a number of customers have filed lawsuits against KB Kookmin Card seeking damages, and it could become subject to additional litigation and regulatory sanctions.
In addition, in connection with certain amendments to standard loan policy conditions for mortgage loan agreements that were instituted by the Korea Fair Trade Commission in January 2008 (which require banks to be responsible for the payment of mortgage registration expenses when issuing mortgage loans and which were upheld by the Supreme Court of Korea in August 2010), a number of Kookmin Bank’s customers have filed lawsuits in recent years seeking the return of mortgage registration expenses paid by such customers.See “Item 8A. Consolidated Statements and Other Financial Information—Legal Proceedings.” The
We are unable to predict the outcome of these and other investigations, lawsuits and regulatory actions, and the scope of investigations or the total amount in dispute in these matters may increase. Furthermore, adverse final determinations, decisions or resolutions in such matters could encourage other parties to bring related claims and actions against us. Accordingly, the outcome of current and future investigations, legal claims and regulatory actions, particularly those for which we cannot predictit is difficult to assess the maximum potential exposure or the ultimate adverse impact with any degree of certainty, may materially and adversely impact our business, if such claimsreputation, results of operations and actions are determined against us.financial condition.
Our risk management system may not be effective in mitigating risk and loss.
We seek to monitor and manage our risk exposure through a group-wide risk management platform, encompassing a multi-layered risk management governance structure, reporting and monitoring systems, early warning systems, a centralized credit risk management system for our banking operations and other risk management infrastructure, using a variety of risk management strategies and techniques. See “Item 11. Quantitative and Qualitative Disclosures about Market Risk.” However, such risk management strategies and techniques employed by us and the judgments that accompany their application cannot anticipate the economic and financial outcome in all market environments, and many of our risk management strategies and techniques have a basis in historic market behavior that may limit the effectiveness of such strategies and techniques in times of significant market stress or other unforeseen circumstances. Furthermore, our risk management strategies may not be effective in a difficult or less liquid market environment, as other market participants may be attempting to use the same or similar strategies as us to deal with such market conditions. In such circumstances, it may be difficult for us to reduce our risk positions due to the activity of such other market participants.
We are generally subject to Korean corporate governance and disclosure standards, which may differ from those in other countries.
Companies in Korea, including us, are subject to corporate governance standards applicable to Korean public companies which may differ in some respects from standards applicable in other countries, including the United States. As a reporting company registered with the U.S. Securities and Exchange Commission and listed on the New York Stock Exchange, we are subject to certain corporate governance standards as mandated by the Sarbanes-Oxley Act of 2002. However, foreign private issuers, including us, are exempt from certain corporate governance requirements under the Sarbanes-Oxley Act or under the rules of the New York Stock Exchange. There may also be less publicly available information about Korean companies, such as us, than is regularly made available by public or non-public companies in other countries. Such differences in corporate governance standards and less public information could result in corporate governance practices or disclosures that are perceived as less than satisfactory by investors in certain countries.
A decline in the value of the collateral securing our loans and our inability to realize full collateral value may adversely affect our credit portfolio.
A substantial portion of our loans is secured by real estate, the values of which have fluctuated significantly in recent years. Although it is our general policy to lend up to 40% to 80% of the appraised value of collateral (except in areas of high speculation designated by the government where we generally limit our lending to between 40% to 60% of the appraised value of collateral) and to periodically re-appraise our collateral, the downturn in the real estate market in Korea in recent years has resulted in declines in the value of the collateral securing our mortgage and home equity loans.Ifloans. If collateral values decline further in the future, they may not be sufficient to cover uncollectible amounts in respect of our secured loans. Any future declines in the value of the real estate or other collateral securing our loans, or our inability to obtain additional collateral in the event of such declines, could result in a deterioration in our asset quality and may require us to take additional loan loss provisions.
In Korea, foreclosure on collateral generally requires a written petition to a court. An application, when made, may be subject to delays and administrative requirements that may result in a decrease in the value realized with respect to such collateral. We cannot guarantee that we will be able to realize the full value on our collateral as a result of, among other factors, delays in foreclosure proceedings and defects in the perfection of our security interest in collateral. Our failure to recover the expected value of collateral could expose us to losses.
The secondary market for corporate bonds in Korea is not fully developed, and, as a result, we may not be able to realize the full “marked-to-market” value of debt securities we hold at the time of any sale of such securities.
As of December 31, 2011,2013, we held debt securities issued by Korean companies and financial institutions (other than those issued by government-owned or -controlled enterprises or financial institutions, which include Korea Electric Power Corporation, the Bank of Korea, Korea Development Bank, Korea Finance Corporation and Industrial Bank of Korea) with a total carrying amount of (Won)18,389₩18,596 billion in our trading and investment securities portfolio. The market value of these securities could decline significantly due to various factors, including future increases in interest rates or a deterioration in the financial and economic condition of any particular issuer or of Korea in general. Any of these factors individually or a combination of these factors would require us to write down the fair value of these debt securities, resulting in impairment losses. Because the secondary market for corporate bonds in Korea is not fully developed, the market value of many of these securities as reflected on our statements of financial position is determined by references to suggested prices posted by Korean rating agencies or the Korea Securities Dealers Association. These valuations, however, may differ significantly from the actual value that we could realize in the event we elect to sell these securities. As a result, we may not be able to realize the full “marked-to-market” value at the time of any such sale of these securities and thus may incur losses.
We may be required to make transfers from our general banking operations to cover shortfalls in our guaranteed trust accounts, which could have an adverse effect on our results of operations.
We manage a number of money trust accounts through Kookmin Bank, our banking subsidiary. Under Korean law, trust account assets of a bank are required to be segregated from the assets of that bank’s general banking operations. Those assets are not available to satisfy the claims of a bank’s depositors or other creditors of its general banking operations. For some of the trust accounts we manage, we have guaranteed either the principal amount of the investor’s investment or the principal and a fixed rate of interest.
If, at any time, the income from our guaranteed trust accounts is not sufficient to pay any guaranteed amount, we will have to cover the shortfall first from the special reserves maintained in these trust accounts, then from our fees from such trust accounts and finally from funds transferred from our general banking operations. As of December 31, 2011,2013, we had (Won)87₩93 billion as special reserves in trust account assets for which we provided guarantees of principal. There was no transfer from general banking operations to cover deficiencies in guaranteed trust accounts in 20102011, 2012 and 2011.2013. However, we may be required to make transfers from our general banking operations to cover shortfalls, if any, in our guaranteed trust accounts in the future. Such transfers may adversely impact our results of operations.
Our activities are subject to cybersecurity risk.
Our activities have been, and will continue to be, subject to an increasing risk of cyber attacks, the nature of which is continually evolving. Cybersecurity risks include unauthorized access to privileged and sensitive customer information, including passwords and account information of our retail and corporate customers. For example, many of our customers increasingly rely on our Internet banking services as well as our mobile and smartphone banking services for various types of transactions and, while such transactions are protected by encryption and other security programs, they are not free from security breaches. We have made substantial and continuous investments to build systems and defenses to address threats from cyber attacks and we are not aware of any significantour monitoring and protection systems have been able to detect and respond to such breaches to our systems from such attacks to date. However, we may experience security breaches or unexpected disruptions in connection with our services in the future, which may result in liability to our customers and third parties and have an adverse effect on our business, reputation and results of operations.
We may experience disruptions, delays and other difficulties from our information technology systems.
We rely on our information technology systems for our daily operations including customer service, transactions, billing and record keeping. We may experience disruptions, delays or other difficulties from our information technology systems, which may have an adverse effect on our business and adversely impact our customers’ confidence in us.
Risks relating to liquidity and capital management
A considerable increase in interest rates could decrease the value of our debt securities portfolio and raise our funding costs while reducing loan demand and the repayment ability of our borrowers, which, as a result, could adversely affect us.
Interest rates in Korea have been subject to significant fluctuations in recent years. In late 2008 and early 2009, the Bank of Korea reduced its policy rate by a total of 325 basis points to support Korea’s economy amid the global financial crisis, and left such rate unchanged at 2%2.00% throughout 2009. In an effort to stem inflation amid improved growth prospects, the Bank of Korea gradually increased its policy rate in 2010 and 2011. However, the Bank of Korea reduced its policy rate to 3.00% in July 2012 and 2.75% in October 2012 and further reduced such rate to 2.50% in May 2013 to support Korea’s economy in light of the recent slowdown in Korea’s growth and uncertain global economic prospects. All else being equal, an increase in interest rates leads to a decline in the value of our portfolio of debt securities, which generally pay interest based on a fixed rate. A sustained increase in interest rates will also raise our funding costs, while reducing loan demand, especially among consumers. Rising interest rates may therefore require us to re-balance our asset portfolio and our liabilities in order to minimize the risk of potential mismatches and maintain our profitability.
In addition, rising interest rate levels may adversely affect the Korean economy and the financial condition of our corporate and retail borrowers, including holders of our credit cards, which in turn may lead to a deterioration in our credit portfolio. Since most of our retail and corporate loans bear interest at rates that adjust periodically based on prevailing market rates, a sustained increase in interest rate levels will increase the interest costs of our retail and corporate borrowers and could adversely affect their ability to make payments on their outstanding loans.
Our funding is highly dependent on short-term deposits, which dependence may adversely affect our operations.
We meet a significant amount of our funding requirements through short-term funding sources, which consist primarily of customer deposits. As of December 31, 2011,2013, approximately 95.9%94.9% of our deposits had maturities of one year or less or were payable on demand. In the past, a substantial proportion of our customer deposits have been rolled over upon maturity. We cannot guarantee, however, that depositors will continue to roll over their deposits in the future. In the event that a substantial number of our short-term deposit customers withdraw their funds or fail to roll over their deposits as higher-yielding investment opportunities emerge, our liquidity position could be adversely affected. We may also be required to seek more expensive sources of short-term and long-term funding to finance our operations. See “Item 5B.5.B. Liquidity and Capital Resources—Financial Condition—Liquidity.”
We may be required to raise additional capital to maintainif our capital adequacy ratios, whichratio deteriorates or the applicable capital requirements change in the future, but we may not be able to do so on favorable terms or at all.
Under the capital adequacy requirements of the Financial Services Commission, both we as a bank holding company, are required to maintain a minimum consolidated capital adequacy ratio, which is the ratio of equity capital as a percentage of risk-weighted assets on a consolidated basis, of 8.0%. In addition, pursuant to the capital adequacy requirements of the Financial Services Commission,and Kookmin Bank, our banking subsidiary, isare required to maintain a minimum Tier I common equity capital adequacy ratio of 4.0%, Tier I capital adequacy ratio of 5.5% and a combined Tier I and Tier II capital adequacy ratio of 8.0%, on a consolidated basis.basis from, January 1, 2014. As of December 31, 2013, our Tier III common equity capital, is included in calculating theTier I capital and combined Tier I and Tier II capital adequacy ratio up to 100% of Tier I capital. As of December 31, 2011, our consolidated capital adequacy ratio was 13.09%ratios were 12.78%, 12.78% and 15.38%, respectively,
and Kookmin Bank’s Tier I common equity capital, adequacyTier I capital and its combined Tier I and Tier II
capital adequacy ratio was 10.30%ratios were 12.61%, 12.61% and 13.55%15.42%, respectively, all of which exceeded the minimum levels required by the Financial Services Commission. However, our capital base and capital adequacy ratios may deteriorate in the future if our results of operations or financial condition deteriorates for any reason, including as a result of a deterioration in the asset quality of our retail loans (including credit card balances) and loans to small- and medium-sized enterprises, or if we are not able to deploy our funding into suitably low-risk assets.
If our capital adequacy ratios deteriorate, we may be required to obtain additional capital in order to remain in compliance with the applicable capital adequacy requirements. We may not be able to obtain additional capital on favorable terms, or at all. Our ability to obtain additional capital at any time may be constrained to the extent that banks or other financial institutions in Korea or from other Asian countries are seeking to raise capital at the same time. To the extent that we fail to maintain our capital adequacy ratios in the future, Korean regulatory authorities may impose penalties on us ranging from a warning to suspension or revocation of our banking license. For a description of the capital adequacy requirements of the Financial Services Commission, see “Item 4B. Business Overview—Supervision and Regulation—Principal Regulations Applicable to Financial Holding Companies—Capital Adequacy” and “Item 5B. Liquidity and Capital Resources—Financial Condition—Capital Adequacy.”
We may face increased capital requirements under the new Basel Capital Accord.
Beginning on January 1, 2008, the Financial Supervisory Service implemented the new Basel Capital Accord, referred to as Basel II, in Korea, which has substantially affected the way risk is measured among Korean financial institutions, including Kookmin Bank. Building upon the initial Basel Capital Accord of 1988, which focused primarily on credit risk and market risk and on capital adequacy and asset soundness as measures of risk, Basel II expands this approach to contemplate additional areas of risk such as operational risk.
In addition, under Basel II, banks are permitted to follow either a standardized approach or an internal ratings-based approach with respect to calculating credit risk capital requirements. Kookmin Bank has voluntarily chosen to establish and follow an internal ratings-based approach, which is more risk-sensitive in assessing its credit risk capital requirements. For regulatory reporting purposes, Kookmin Bank has implemented its internal ratings-based approach for credit risk with respect to retail and small and medium-sized enterprise loans and asset-backed securities from January 2008, large corporate loans from June 2008 and retail SOHO loans from December 2008. Kookmin Bank plans to further implement its internal ratings-based approach to other classes of credit risk exposure on a phased rollout basis by the end of 2012 based on consultations with the Financial Supervisory Service and to implement its “Advanced Internal Ratings-based Approach” for credit risk for regulatory reporting purposes in the near future. A standardized approach is used in measuring credit risk for those classes of exposure for which Kookmin Bank’s internal ratings-based approach has not yet been implemented, as well as for certain classes of exposure (including those to the government, public institutions and other banks) for which the internal ratings-based approach will not be applied. With respect to operational risk, Kookmin Bank implemented an “Advanced Measurement Approach” for regulatory reporting purposes beginning in January 2009.
While the implementation of Kookmin Bank’s internal ratings-based approach in 2008 increased its capital adequacy ratio and led to a decrease in its credit risk-related capital requirements as compared to those under its previous approach under the initial Basel Capital Accord of 1988, there can be no assurance that such internal ratings-based approach under Basel II will not require an increase in Kookmin Bank’s credit risk capital requirements in the future, which may require Kookmin Bank to either improve its asset quality or raise additional capital.
In December 2009, the Basel Committee on Banking Supervision introduced a new set of measures to supplement Basel II which include, among others, a requirement for higher minimum capital, introduction of a leverage ratio as a supplementary measure to the capital adequacy ratio and flexible capital requirements for different phases of the economic cycle. Additional details regarding such new measures, including an additional
capital conservation buffer and countercyclicalcounter-cyclical capital buffer, liquidity coverage ratio and other supplemental measures, were announced by the Group of Governors and Heads of Supervision of the Basel Committee on Banking Supervision in September 2010. After further impact assessment and observation periods, the Basel Committee on Banking Supervision is expected to begin implementingbegan phasing in the new set of measures, referred to as Basel III, starting from 2013. In Korea,May 2013, the Financial Services Commission announced that major Asian countries have already implemented Basel III is expectedin the first quarter of 2013 and that the proposed Basel III measures relating to stricter minimum capital ratio requirements will be implemented in Korea starting from December 1, 2013. In July 2013 and September 2013, the Financial Services Commission promulgated amended regulations implementing Basel III, pursuant to which Korean banks and bank holding companies were required to maintain a minimum ratio of Tier I common equity capital (which principally includes equity capital, capital surplus and retained earnings less reserve for credit losses) to risk-weighted assets of 3.5% and Tier I capital to risk-weighted assets of 4.5% from December 1, 2013, which minimum ratios increased to 4.0% and 5.5%, respectively, from January 1, 2014 and will increase further to 4.5% and 6.0%, respectively, from January 1, 2015. Such requirements are in addition to the pre-existing requirement for a minimum ratio of Tier I and Tier II capital (less any capital deductions) to risk-weighted assets of 8.0%, which remains unchanged. The amended regulations also contemplate an additional capital conservation buffer of 0.625% starting in 2016, with such buffer to increase in stages from 2013 to 2.5% by 2019. The implementation of Basel III in Korea may have a significant effect on the capital requirements of Korean financial institutions, including us.
See “Item 5A. Operating Results—4.B. Business Overview—New Basel Supervision and Regulation—Principal Regulations Applicable to Financial Holding Companies—Capital Accord”Adequacy” and “Item 5B. Liquidity and Capital Resources—Financial Condition—“—Principal Regulations Applicable to Banks—Capital Adequacy.”
We may be required to obtain additional capital in the future in order to remain in compliance with more stringent capital adequacy and other regulatory requirements. However, we may not be able to obtain additional capital on favorable terms, or at all. Our ability to obtain additional capital at any time may be constrained to the extent that banks or other financial institutions in Korea or from other Asian countries are seeking to raise capital at the same time. To the extent that we fail to comply with applicable capital adequacy ratio or other regulatory requirements in the future, Korean regulatory authorities may impose penalties on us ranging from a warning to suspension or revocation of our banking license.
Risks relating to government regulation and policy
The Korean government may promote lending and financial support by the Korean financial industry to certain types of borrowers as a matter of policy, which financial institutions, including us, may decide to follow.
Through its policies and recommendations, the Korean government has promoted and, as a matter of policy, may continue to attempt to promote lending by the Korean financial industry to particular types of borrowers. For example, the Korean government has in the past provided and may continue to provide policy loans, which encourage lending to particular types of borrowers. It has generally done this by identifying sectors of the economy it wishes to promote and making low-interest funding available to financial institutions that may voluntarily choose to lend to these sectors. The government has in this manner provided policy loans intended to
promote mortgage lending to low-income individuals and lending to small- and medium-sized enterprises. All loans or credits we choose to make pursuant to these policy loans would be subject to review in accordance with our credit approval procedures. However, the availability of policy loans may influence us to lend to certain sectors or in a manner in which we otherwise would not in the absence of such loans from the government.
In the past, the Korean government has also announced policies under which financial institutions in Korea are encouraged to provide financial support to particular sectors. For example, in light of the deteriorating financial condition and liquidity position of small- and medium-sized enterprises in Korea as a result of the global financial crisis commencing in the second half of 2008 and adverse conditions in the Korean economy affecting consumers, the Korean government introduced measures intended to encourage Korean banks to provide financial support to small- and medium-sized enterprise and retail borrowers. See “—Risks relating to our small- and medium-sized enterprise loan portfolio—We have significant exposure to small- andmedium-sized enterprises, and any financial difficulties experienced by these customers may result in a deterioration of our asset quality and have an adverse impact on us.” and “—Risks relating to our retail credit portfolio—Future changes in market conditions as well as other factors may lead to increases in delinquency levels of our retail loan portfolio.” The Korean government may in the future request financial institutions in Korea, including us, to make investments in or provide other forms of financial support to particular sectors of the Korean economy as a matter of policy, which financial institutions, including us, may decide to accept. We may incur costs or losses as a result of providing such financial support.
The Financial Services Commission may impose burdensome measures on us if it deems us or one of our subsidiaries to be financially unsound.
If the Financial Services Commission deems our financial condition or the financial condition of our subsidiaries to be unsound, or if we or our subsidiaries fail to meet applicable regulatory standards, such as minimum capital adequacy and liquidity ratios, the Financial Services Commission may order or recommend, among other things:
capital increases or reductions;
stock cancellations or consolidations;
transfers of business;
sales of assets;
closures of subsidiaries or branch offices;
mergers with other financial institutions; and
suspensions of a part or all of our business operations.
If any of these measures are imposed on us by the Financial Services Commission, they could hurt our business, results of operations and financial condition. In addition, if the Financial Services Commission orders us to partially or completely reduce our capital, you may lose part or all of your investment.
Risks relating to Korea
Escalations in tensions with North Korea could have an adverse effect on us and the market price of our ADSs.
Relations between Korea and North Korea have been tense throughout Korea’s modern history. The level of tension between the two Koreas has fluctuated and may increase abruptly as a result of current and future events.
In particular, since the death of the North Korean ruler Kim Jong-il in December 2011, there has been increased uncertainty with respect to the future of North Korea’s political leadership and concern regarding its implications for political and economic stability in the region. Before his death,Although Kim Jong-il designated hisJong-il’s third son, Kim Jong-eun, has assumed power as his father’s designated successor, and named him as the vice chairman of the Central Military Commission and a general of the North Korean army. In April 2012, Kim Jong-eun also became the chairman of the National Defense Commission. However, the eventuallong-term outcome of such leadership transition remains uncertain. Furthermore, only limited information is available outside of North Korea about Kim Jong-eun, who is reported to be in his late twenties, and it is unclear which individuals or factions, if any, will share political power with Kim Jong-eun or assume the leadership if the transition is not successful. Accordingly,
In addition, there is significant uncertainty regarding the policies, actions and initiatives that North Korea might pursue in the future.
In recent years, there have also been heightened security concerns in recent years stemming from North Korea’s nuclear weaponsweapon and long-range missile programs and increased uncertainty regarding North Korea’sas well as its hostile military actions and possible responses fromagainst Korea. Some of the international community.significant incidents in recent years include the following:
In March 2013, North Korea announced in October 2006stated that it had successfullyentered “a state of war” with Korea, declaring the 1953 armistice invalid, and put its artillery at the highest level of combat readiness to protest the Korea-United States allies’ military drills and additional sanctions imposed on North Korea for its missile and nuclear tests.
North Korea renounced its obligations under the Nuclear Non-Proliferation Treaty in January 2003 and conducted athree rounds of nuclear test,tests between October 2006 to February 2013, which increased tensions in the region and elicited strong objections worldwide. In May 2009, North Korea announced that it had successfully conducted a second nuclear test. In response, the United Nations Security Council unanimously passed a resolutionresolutions that condemned North Korea for the nuclear testtests and decided to expand and tightenexpanded sanctions against North Korea. Korea, most recently in March 2013.
In December 2012, North Korea launched a satellite into orbit using a long-range rocket, despite concerns in the international community that such a launch would be in violation of the agreement with the United States as well as United Nations Security Council resolutions that prohibit North Korea from conducting launches that use ballistic missile technology.
In March 2010, a Korean warshipnaval vessel was destroyed by an underwater explosion, killing many of the crewmen on board. The Korean government formally accused North Korea of causing the sinking, while North Korea denied responsibility and threatened retaliation for any attempt to punish it over the incident. Inresponsibility. Moreover, in November 2010, North Korea reportedly fired more than one hundred artillery shells that hit Korea’s Yeonpyeong Island near the Northern Limit Line, which acts as the de facto maritime borderboundary between Korea and North Korea on the west coast of Korea, killing twothe Korean soldierspeninsula, causing casualties and two civilians, wounding many others and causing significant property damage. Korea responded by firing artillery shells back and putting the military on its highest level of alert. The Korean government condemned North Korea for the actattack and vowed stern retaliation should there be further provocation. In April 2012, North Korea attempted to launch a long-range missile, which it characterized as a satellite launch. In response, the United Nations Security Council unanimously issued a presidential statement that condemned North Korea for the attempted launch and decided to further expand and tighten sanctions against North Korea.
North Korea’s economy also faces severe challenges. For example, in November 2009, the North Korean government redenominated its currency at a ratio of 100 to 1 as part of a currency reform undertaken in an attempt to control inflation and reduce income gaps. In tandem with the currency redenomination, the North Korean government banned the use or possession of foreign currency by its residents and closed down privately run markets, which led to severe inflation and food shortages. Such developments may further aggravate social and political tensions within North Korea.
There can be no assurance that the level of tension on the Korean peninsula will not escalate in the future. Any further increase in tensions, which may occur, for example, if North Korea experiences a leadership crisis, high-level contacts between Korea and North Korea break down or military hostilities occur, could have a material adverse effect on the Korean economy and on our business, financial condition and results of operations and the market value of our common stock and ADSs.
Unfavorable financial and economic developments in Korea may have an adverse effect on us.
We are incorporated in Korea, and substantially all of our operations are located in Korea. As a result, we are subject to political, economic, legal and regulatory risks specific to Korea. The economic indicators in Korea in recent years have shown mixed signs of growth and uncertainty, and future growth of the economy is subject to many factors beyond our control.
In recent years, adverse conditions and volatility in the worldwide financial markets, fluctuations in oil and commodity prices and the general weakness of the U.S. and global economy have contributed to the uncertainty of global economic prospects in general and have adversely affected, and may continue to adversely affect, the Korean economy. See “Other risks relating to our business — business—Difficult conditions in the global financial markets could adversely affect our results of operations and financial condition.” Since the second half of 2008, theThe value of the Won relative to major foreign currencies in general and the U.S. dollar in particular has also fluctuated widely. See “Item 3A.3.A. Selected Financial Data—Exchange Rates.” A depreciation of the Won increases the cost of imported goods and services and the Won revenue needed by Korean companies to service foreign currency-denominated debt. An appreciation of the Won, on the other hand, causes export products of Korean companies to be less competitive by raising their prices in terms of the relevant foreign currency and reduces the Won value of such export sales. Furthermore, as a result of adverse global and Korean economic conditions, there has been significant volatility in the stock prices of Korean companies. Thecompanies in recent years. Future declines in the Korea Composite Stock Price Index (known as the “KOSPI”) declined from 1,897.1 on December 31, 2007 to 938.8 on October 24, 2008. While the KOSPI recovered to a significant extent since 2008, there has been significant volatility in the KOSPI commencing in the second half of 2011, particularly following the downgrading by Standard & Poor’s Rating Services of the long-term sovereign credit rating of the United States to “AA+” from “AAA” in August 2011 and in light of the financial difficulties affecting many other governments worldwide, in particular Greece, Spain, Italy and other countries in Europe. There is no guarantee that the stock prices of Korean companies will not decline again in the future. Future declines in the KOSPI and large amounts of sales of Korean securities
by foreign investors and subsequent repatriation of the proceeds of such sales may adversely affect the value of the Won, the foreign currency reserves held by financial institutions in Korea, and the ability of Korean companies to raise capital. Any future deterioration of the Korean or global economy could adversely affect our business, financial condition and results of operations.
Developments that could hurt Korea’s economy in the future include:
difficulties in the housing and financial sectors in the United StatesEurope and elsewhere and increased sovereign default risks in select countries and the resulting adverse effects on the global financial markets;
adverse changes or volatility in foreign currency reserve levels, commodity prices (including oil prices), exchange rates (including fluctuation of the U.S. dollar, the euro or the Japanese yen exchange rates or revaluation of the Chinese renminbi), interest rates, andinflation rates or stock markets;
continuing adverse conditions in the economies of countries and regions that are important export markets for Korea, such as the United States, Europe, Japan and China, or in emerging market economies in Asia or elsewhere;
substantialfurther decreases in the market prices of Korean real estate;
increasing delinquencies and credit defaults by retail andor small- and medium-sized enterprise borrowers;
declines in consumer confidence and a slowdown in consumer spending;
increasing levels of household debt;
difficulties in the financial sector in Korea, including the savings bank sector;
the continued emergence of the Chinese economy, to the extent its benefits (such as increased exports to China) are outweighed by its costs (such as competition in export markets or for foreign investment and the relocation of the manufacturing base from Korea to China);
social and labor unrest;
a decrease in tax revenues and a substantial increase in the Korean government’s expenditures for fiscal stimulus measures, unemployment compensation and other economic and social programs that, together, would lead to an increased government budget deficit;
| • | financial problems or lack of progress in the restructuring ofchaebols, other large troubled companies, their suppliers or the financial sector; |
| • | loss of investor confidence arising from corporate accounting irregularities and corporate governance issues |
increases in social expenditures to support an aging population in Korea or decreases in economic productivity due to the declining population size in Korea;
the economic impact of any pending or future free trade agreements;
geo-political uncertainty and risk of further attacks by terrorist groups around the world;
natural disasters that have a significant adverse economic or other impact on Korea or its major trading partners, such as the earthquake and tsunami that occurred in the northeast part of Japan in March 2011 and any resulting releases of radiation from damaged nuclear power plants in the area;partners;
the recurrenceoccurrence of severe acute respiratory syndrome,health epidemics in Korea or SARS, or an outbreak of swine or avian flu or foot-and-mouth disease in Asia and other parts of the world;
deterioration in economic or diplomatic relations between Korea and its trading partners or allies, including deterioration resulting from territorial or trade disputes or disagreements in foreign policy;
political uncertainty or increasing strife among or within political parties in Korea;
hostilities or civil unrestpolitical or social tensions involving oil producing countries in the Middle East and NorthernNorth Africa and any material disruption in the global supply of oil or increase in the price of oil;
an increase in the level of tensions or an outbreak of hostilities between North Korea and Korea or the United States; and
changes in financial regulations in Korea.
Labor unrest in Korea may adversely affect our operations.
Economic difficulties in Korea or increases in corporate reorganizations and bankruptcies could result in layoffs and higher unemployment. Such developments could lead to social unrest and substantially increase government expenditures for unemployment compensation and other costs for social programs. According to statistics from the Korea National Statistical Office, the unemployment rate was 3.6%3.4% in 2009, increased to 3.7% in 2010 but2011, decreased to 3.4%3.2% in 2011.2012 and decreased further to 3.1% in 2013. Future increases in unemployment and any resulting labor unrest in the future could adversely affect our operations, as well as the operations of many of our customers and their ability to repay their loans, and could adversely affect the financial condition of Korean companies in general, depressing the price of their securities. These developments would likely have an adverse effect on our financial condition and results of operations.
Risks relating to our common stock and ADSs
We or our major stockholders may sell shares of our common stock or ADSs in the future, and these and other sales may adversely affect the market price of our common stock and ADSs and may dilute your investment and relative ownership in us.
In September 2009, we issued 30,000,000 new shares of our common stock (including 2,775,585 new shares in the form of ADSs) at a subscription price of (Won)37,250₩37,250 per share (and US$29.95 per ADS), pursuant to a rights offering to our existing shareholders. In July 2011, Kookmin Bank, our wholly-owned subsidiary, sold 34,966,962 shares of our common stock in a block sale. We have no current plans for any subsequent public offerings of our common stock, ADSs or securities exchangeable for or convertible into such securities. However, it is possible that we may decide to offer or sell such securities in the future. In addition, our major stockholders,stockholder, the Korean National Pension Service, and ING Bank N.V. held approximately 6.86% and 5.02%, respectively,9.96% of our total issued common stock as of December 31, 2011,2013, which theyit may sell at any time.
Any future offerings or sales by us of our common stock or ADSs or securities exchangeable for or convertible into such securities, significant sales of our common stock by a major stockholder, or the public perception that an offering or sales may occur, could have an adverse effect on the market price of our common stock and ADSs. Furthermore, any offerings by us in the future of any such securities could have a dilutive impact on your investment and relative ownership interest in us.
Ownership of our common stock is restricted under Korean law.
Under the Financial Holding Company Act, a single stockholder, together with its affiliates, is generally prohibited from owning more than 10.0% of the issued and outstanding shares of voting stock of a bank holding company such as us that controls a nationwide bank, with the exception of certain stockholders that are non-financial business group companies, whose applicable limit ishas been reduced from 9.0%. to 4.0% pursuant to an amendment of the Financial Holding Company Act which became effective from February 14, 2014. To the extent that the total number of shares of our common stock (including those represented by ADSs) that a holder and its affiliates own together exceeds the applicable limits, that holder will not be entitled to exercise the voting rights for the excess shares, and the Financial Services Commission may order that holder to dispose of the excess shares within a period of up to six months. Non-financial business group companies are required to obtain approval from the Financial Services Commission in order to (i) become the largest shareholder of a bank holding company or (ii) acquire 4% or more of the issued and outstanding shares of voting stock of a bank holding company and participate in the management of such company in the manner prescribed in the Enforcement Decree of the Financial Holding Company Act. If non-financial business group companies hold voting stock of a bank holding company in excess of the foregoing limits as a result of unavoidable circumstances, such as sales by other stockholders’ of their shareholding, such non-financial business group companies are required to obtain approval from the Financial Services Commission to hold the portion of shares that exceeds the limit, dispose of such portion or take measures so that they no longer fall under the definition of “non-financial business group companies” under the Financial Holding Company Act. Non-compliance with such requirement will prohibit non-financial business group companies from exercising their voting rights of the shares that exceed the limit and prompt the issuance of an order by the Financial Services Commission directing such non-financial business group companies to dispose of their shares that exceed the limit. Failure to comply with such an order would result in an administrative fine of up to 0.03% of the carrying amountbook value of such shares per day until the date of disposal. Non-financial business group companies can no longer acquire more than 4.0% of the issued and outstanding shares of voting stock of a bank holding company pursuant to the amended Financial Holding Company Act, which grants an exception for non-financial business group companies which, at the time of the enactment of the amended provisions, held more
than 4.0% of the shares thereof with the approval of the Financial Services Commission before the amendment. See “Item 4B.4.B. Business Overview—Supervision and Regulation—Principal Regulations Applicable to Financial Holding Companies—Restrictions on Ownership of a Financial Holding Company.”
A holder of our ADSs may not be able to exercise dissent and appraisal rights unless it has withdrawn the underlying shares of our common stock and become our direct stockholder.
In some limited circumstances, including the transfer of the whole or any significant part of our business and the merger or consolidation of us with another company, dissenting stockholders have the right to require us to purchase their shares under Korean law. However, holders of our ADSs will not be able to exercise such
dissent and appraisal rights if the depositary refuses to do so on their behalf. Our deposit agreement does not require the depositary to take any action in respect of exercising dissent and appraisal rights. In such a situation, holders of our ADSs must withdraw the underlying common stock from the ADS facility (and incur charges relating to that withdrawal) and become our direct stockholder prior to the record date of the stockholders’ meeting at which the relevant transaction is to be approved, in order to exercise dissent and appraisal rights.
A holder of our ADSs may be limited in its ability to deposit or withdraw common stock.
Under the terms of our deposit agreement, holders of common stock may deposit such stock with the depositary’s custodian in Korea and obtain ADSs, and holders of ADSs may surrender ADSs to the depositary and receive common stock. However, to the extent that a deposit of common stock exceeds the difference between:
| (1) | the aggregate number of common shares we have deposited or we have consented to allow to be deposited for the issuance of ADSs (including deposits in connection with offerings of ADSs and stock dividends or other distributions relating to ADSs); and |
| (2) | the number of shares of common stock on deposit with the custodian for the benefit of the depositary at the time of such proposed deposit, |
such common stock will not be accepted for deposit unless
| (A) | our consent with respect to such deposit has been obtained; or |
| (B) | such consent is no longer required under Korean laws and regulations. |
Under the terms of the deposit agreement, no consent is required if the shares of common stock are obtained through a dividend, free distribution, rights offering or reclassification of such stock. We have consented, under the terms of the deposit agreement, to any deposit to the extent that, after the deposit, the number of deposited shares does not exceed such number of shares as we determine from time to time (which number shall at no time be less than 100,000,000 shares), unless the deposit would be prohibited by applicable laws or violate our articles of incorporation. We might not consent to the deposit of any additional common stock. As a result, if a holder surrenders ADSs and withdraws common stock, it may not be able to deposit the stock again to obtain ADSs.
A holder of our ADSs will not have preemptive rights in some circumstances.
The Korean Commercial Code of 1962, as amended, and our articles of incorporation require us, with some exceptions, to offer stockholders the right to subscribe for new shares of our common stock in proportion to their existing shareholding ratio whenever new shares are issued. If we offer any rights to subscribe for additional shares of our common stock or any rights of any other nature, the depositary, after consultation with us, may make the rights available to holders of our ADSs or use reasonable efforts to dispose of the rights on behalf of such holders and make the net proceeds available to such holders. The depositary, however, is not required to make available to holders any rights to purchase any additional shares of our common stock unless it deems that doing so is lawful and feasible and:
a registration statement filed by us under the U.S. Securities Act of 1933, as amended, is in effect with respect to those shares; or
the offering and sale of those shares is exempt from or is not subject to the registration requirements of the Securities Act.
Similarly, holders of our common stock located in the United States may not exercise any such rights they receive absent registration or an exemption from the registration requirements under the Securities Act.
We are under no obligation to file any registration statement with the U.S. Securities and Exchange Commission or to endeavor to cause such a registration statement to be declared effective. Moreover, we may not be able to establish an exemption from registration under the Securities Act. Accordingly, a holder of our ADSs may be unable to participate in our rights offerings and may experience dilution in its holdings. If a registration statement is required for a holder of our ADSs to exercise preemptive rights but is not filed by us or is not
declared effective, the holder will not be able to exercise its preemptive rights for additional ADSs and it will suffer dilution of its equity interest in us. If the depositary is unable to sell rights that are not exercised or not distributed or if the sale is not lawful or feasible, it will allow the rights to lapse, in which case the holder will receive no value for these rights.
Dividend payments and the amount a holder of our ADSs may realize upon a sale of its ADSs will be affected by fluctuations in the exchange rate between the U.S. dollar and the Won.
Our common stock is listed on the KRX KOSPI Market and quoted and traded in Won. Cash dividends, if any, in respect of the shares represented by the ADSs will be paid to the depositary in Won and then converted by the depositary into U.S. dollars, subject to certain conditions. Accordingly, fluctuations in the exchange rate between the Won and the U.S. dollar will affect, among other things, the amounts a holder of our ADSs will receive from the depositary in respect of dividends, the U.S. dollar value of the proceeds that it would receive upon sale in Korea of the shares of our common stock obtained upon surrender of ADSs and the secondary market price of ADSs. Such fluctuations will also affect the U.S. dollar value of dividends and sales proceeds received by holders of our common stock.
The market value of an investment in our ADSs may fluctuate due to the volatility of the Korean securities market.
Our common stock is listed on the KRX KOSPI Market, which has a smaller market capitalization and is more volatile than the securities markets in the United States and many European countries. The market value of ADSs may fluctuate in response to the fluctuation of the trading price of shares of our common stock on the KRX KOSPI Market. The KRX KOSPI Market has experienced substantial fluctuations in the prices and volumes of sales of listed securities and the KRX KOSPI Market has prescribed a fixed range in which share prices are permitted to move on a daily basis.Thebasis. The KOSPI declined from 1,897.1 on December 31, 2007 to 938.8 on October 24, 2008. The KOSPI was 1,975.41,969.3 on April 27, 2012.There28, 2014. There is no guarantee that the stock prices of Korean companies will not decline again in the future. Like other securities markets, including those in developed markets, the Korean securities market has experienced problems including market manipulation, insider trading and settlement failures. The recurrence of these or similar problems could have a material adverse effect on the market price and liquidity of the securities of Korean companies, including our common stock and ADSs, in both the domestic and the international markets.
The Korean government has the potential ability to exert substantial influence over many aspects of the private sector business community, and in the past has exerted that influence from time to time. For example, the Korean government has promoted mergers to reduce what it considers excess capacity in a particular industry and has also encouraged private companies to publicly offer their securities. Similar actions in the future could have the effect of depressing or boosting the Korean securities market, whether or not intended to do so. Accordingly, actions by the government, or the perception that such actions are taking place, may take place or has ceased, may cause sudden movements in the market prices of the securities of Korean companies in the future, which may affect the market price and liquidity of our common stock and ADSs.
If the Korean government deems that emergency circumstances are likely to occur, it may restrict holders of our ADSs and the depositary from converting and remitting dividends and other amounts in U.S. dollars.
If the Korean government deems that certain emergency circumstances, including, but not limited to, severe and sudden changes in domestic or overseas economic circumstances, extreme difficulty in stabilizing the balance of payments or implementing currency exchange rate and other macroeconomic policies, have occurred or are likely to occur, it may impose certain restrictions provided for under the Foreign Exchange Transaction Law, including the suspension of payments or requiring prior approval from governmental authorities for any transaction. See “Item 10D.10.D. Exchange Controls—General.”
A holder of our ADSs may not be able to enforce a judgment of a foreign court against us.
We are a corporation with limited liability organized under the laws of Korea. Substantially all of our directors and officers and other persons named in this document reside in Korea, and all or a significant portion of the assets of our directors and officers and other persons named in this document and substantially all of our assets are located in Korea. As a result, it may not be possible for holders of our ADSs to effect service of process within the United States, or to enforce against them or us in the United States judgments obtained in United States courts based on the civil liability provisions of the federal securities laws of the United States. There is doubt as to the enforceability in Korea, either in original actions or in actions for enforcement of judgments of United States courts, of civil liabilities predicated on the United States federal securities laws.
| Item 4. | INFORMATION ON THE COMPANY |
| Item 4.A.History | and Development of the Company |
Item 4A. History and Development of the Company
Overview
We were established as a new financial holding company on September 29, 2008 pursuant to a “comprehensive stock transfer” under Korean law, whereby holders of the common stock of Kookmin Bank and certain of its subsidiaries transferred all of their shares to us in return for shares of our common stock. We were established pursuant to the Financial Holding Company Act, which was enacted in October 2000 and which, together with associated regulations and a related presidential decree, has enabled banks and other financial institutions, including insurance companies, investment trust companies, credit card companies and securities companies, to be organized and managed under the auspices of a single financial holding company.
Our legal and commercial name is KB Financial Group Inc. Our registered office and principal executive offices are located at 9-1, 2-ga,84, Namdaemoon-ro, Jung-gu, Seoul, Korea 100-703. Our telephone number is822-2073-7114. Our agent in the United States, Kookmin Bank, New York Branch, is located at 565 Fifth Avenue, 24th Floor, New York, NY 10017. Its telephone number is (212) 697-6100.
History of the Former Kookmin Bank
The former Kookmin Bank was established by the Korean government in 1963 under its original name of Citizens National Bank under the Citizens National Bank Act of Korea with majority government ownership. Under this Act, we were limited to providing banking services to the general public and to small- and medium-sized enterprises. In September 1994, we completed our initial public offering in Korea and listed our shares on the KRX KOSPI Market.
In January 1995, the Citizens National Bank Act of Korea was repealed and replaced by the Repeal Act of the Citizens National Bank Act. Our status was changed from a specialized bank to a nationwide commercial bank and in February 1995, we changed our name to Kookmin Bank. The Repeal Act allowed us to engage in lending to large businesses.
History of H&CB
H&CB was established by the Korean government in 1967 under the name Korea Housing Finance Corporation. In 1969, Korea Housing Finance Corporation became the Korea Housing Bank pursuant to the Korea Housing Bank Act. H&CB was originally established to provide low and middle income households with long-term, low-interest mortgages in order to help them purchase their own homes, and to promote the increase of housing supply in Korea by providing low-interest housing loans to construction companies. Under the Korea Housing Bank Act, up to 20% of H&CB’s lending (excluding lending pursuant to government programs) could be non-mortgage lending. Until 1997 when the Korea Housing Bank Act was repealed, H&CB was the only entity in Korea allowed to provide mortgage loans with a term of longer than ten years. H&CB also had the exclusive ability to offer housing-related deposit accounts offering preferential rights to subscribe for newly-built apartments.
In July 1999, H&CB entered into an investment agreement with certain affiliates of the ING Groep N.V., a leading global financial services group. Through ING Insurance International B.V. and ING International Financial Holdings, ING Groep N.V. invested (Won)332₩332 billion to acquire 9,914,777 new common shares of H&CB representing 9.99999% of H&CB’s outstanding common shares. As of December 31, 2011,2012, ING Groep N.V. beneficially owned, through its consolidated subsidiary ING Bank N.V., 5.02% of our issued common stock. For more details regardingIn February 2013, ING Bank N.V. sold all of its stake in our relationship with ING Groep N.V., see “Item 4B. Business Overview—Other Businesses—Bancassurance,” “Item 7B. Related Party Transactions” and “Item 10C. Material Contracts.”company in a block trade.
The Merger of the Former Kookmin Bank and H&CB
Effective November 1, 2001, the former Kookmin Bank and H&CB merged into a new entity named Kookmin Bank. This merger resulted in Kookmin Bank becoming the largest commercial bank in Korea. Kookmin Bank’s ADSs were listed on the New York Stock Exchange on November 1, 2001 and its common shares were listed on the KRX KOSPI Market on November 9, 2001. As of October 31, 2001, H&CB’s total assets were (Won)67,399₩67,399 billion, its total deposits were (Won)51,456₩51,456 billion, its total liabilities were (Won)64,537₩64,537 billion and it had stockholders’ equity of (Won)2,849₩2,849 billion. As required by U.S. GAAP, we recognized H&CB’s total assets and liabilities at their estimated fair values of (Won)68,329₩68,329 billion and (Won)64,840₩64,840 billion, respectively. These amounts reflect the recognition of (Won)562₩562 billion of negative goodwill, which was allocated to the fixed assets, core deposit intangible assets and credit card relationship intangible assets assumed.
The Establishment of KB Financial Group
We were established on September 29, 2008 pursuant to a “comprehensive stock transfer” under Article 360-15 of the Korean Commercial Code, whereby holders of the common stock of Kookmin Bank and certain of its subsidiaries transferred all of their shares to us, a new financial holding company, and in return received shares of our common stock. In the stock transfer, each holder of one share of Kookmin Bank common stock received one share of our common stock, par value (Won)5,000₩5,000 per share. Holders of Kookmin Bank ADSs and global depositary shares, each of which represented one share of Kookmin Bank common stock, received one of our ADSs for every ADS or global depositary share they owned. In addition, holders of the common stock of KB Investment & Securities Co., Ltd., KB Asset Management Co., Ltd., KB Real Estate Trust Co., Ltd., KB Investment Co., Ltd., KB Futures Co., Ltd., KB Credit Information Co., Ltd., and KB Data Systems Co., Ltd., all of which were Kookmin Bank’s subsidiaries, transferred all of their shares to us and, as consideration for such transferred shares, received shares of our common stock in accordance with the specified stock transfer ratio applicable to each such subsidiary. Following the completion of the stock transfer, Kookmin Bank, KB Investment & Securities Co., Ltd., KB Asset Management Co., Ltd., KB Real Estate Trust Co., Ltd., KB Investment Co., Ltd., KB Futures Co., Ltd., KB Credit Information Co., Ltd., and KB Data Systems Co., Ltd. became our wholly-owned subsidiaries. The stock transfer was accounted for under U.S. GAAP as a transaction between entities under common control and, with respect to the transfer by noncontrolling stockholders of Kookmin Bank’s subsidiaries included in the stock transfer, the acquisition by us of such noncontrolling interests of such subsidiaries was accounted for using the purchase method. Accordingly, the consolidated financial data included in this annual report are, as of dates and for periods prior to the date of the stock transfer, for Kookmin Bank and its subsidiaries, and as of dates and for periods from and after the date of the stock transfer, for us and our subsidiaries, including Kookmin Bank.
The following chart illustrates the organizational structure of Kookmin Bank prior to the completion of the stock transfer:
The following chart illustrates our organizational structure after the completion of the stock transfer:
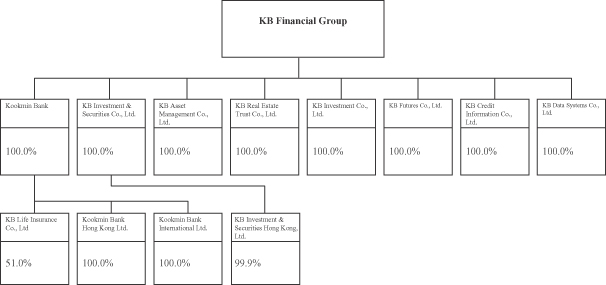
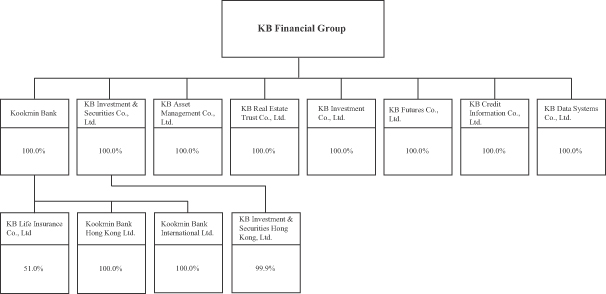
The purpose of the stock transfer and our establishment as a financial holding company was to reorganize the different businesses of Kookmin Bank and its subsidiaries under a holding company structure, the adoption of which we believe will:
assist us in creating an integrated system that facilitates the sharing of customer information and the development of integrated products and services by the different businesses within our subsidiaries;
assist us in expanding our business scope to include new types of business with higher profit margins;
enhance our ability to pursue strategic investments or reorganizations by way of mergers, acquisitions, spin-offs or other means;
maximize our management efficiency; and
further enhance our capacity to expand our overseas operations.
Following the stock transfer, our common stock was listed on the KRX KOSPI Market on October 10, 2008 and our ADSs were listed on the New York Stock Exchange on September 29, 2008.
In connection with the stock transfer, Kookmin Bank common stockholders who opposed the stock transfer were entitled to exercise appraisal rights and require Kookmin Bank to repurchase their shares in the event the stock transfer was completed. The purchase price for shares in respect of which appraisal rights were exercised was set at (Won)63,293₩63,293 per share. Kookmin Bank repurchased 38,263,249 shares of its common stock as a result of the exercise of appraisal rights by dissenting stockholders. In addition, prior to the stock transfer, Kookmin Bank executed a share buy back program, pursuant to which it repurchased 16,840,000 shares of its common stock. Accordingly, as a result of the transfer by Kookmin Bank of such treasury shares and the shares it held in its subsidiaries to us, Kookmin Bank received 73,607,601 shares of our common stock in the stock transfer, all of which it subsequently sold.
Item 4B. 4.B.Business Overview
Business
We are one of the largest financial holding companies in Korea, in terms of consolidated total assets, and our operations include Kookmin Bank, the largest commercial bank in Korea in terms of total assets (including loans). Our subsidiaries collectively engage in a broad range of businesses, including commercial banking, credit cards, asset management, life insurance, capital markets activities and international banking. As of December 31, 2011,2013, we had consolidated total assets of (Won)278₩292 trillion, consolidated total deposits of (Won)190₩201 trillion and consolidated stockholders’ equity of (Won)23₩26 trillion.
We were established as a financial holding company in September 2008, pursuant to a “comprehensive stock transfer” under Korean law. See “Item 4A.4.A. History and Development of the Company—The Establishment of KB Financial Group.”
On the asset side, we provide credit and related financial services to individuals and small- and medium-sized enterprises and, to a lesser extent, to large corporate customers. On the deposit side, we provide a full range of deposit products and related services to both individuals and enterprises of all sizes. We provide these services predominantly through Kookmin Bank.
By their nature, our core consumer and small- and medium-sized enterprise operations place a high premium on customer access and convenience. Our combined banking network of 1,1651,207 branches as of December 31, 2011,2013, one of the most extensive in Korea, provides a solid foundation for our business and is a major source of our competitive strength. This network provides us with a large, stable and cost effective funding source, enables us to provide our customers convenient access and gives us the ability to provide the customer attention and service essential to conducting our business, particularly in an increasingly competitive environment. Our branch network is further enhanced by automated banking machines and fixed-line, mobile telephone and Internet banking. As of December 31, 2011,2013, we had a customer base of approximately 29.330.5 million retail customers, which represented over one-half of the Korean population.
The following table sets forth the principal components of our lending business as of the dates indicated. As of December 31, 20112013, retail loans and credit card loans and receivables accounted for 54.0%53.8% of our total loan portfolio:
| As of December 31, | ||||||||||||||||
| 2010 | 2011 | |||||||||||||||
| (in billions of Won, except percentages) | ||||||||||||||||
Retail | ||||||||||||||||
Mortgage and home equity (1) | (Won) | 71,715 | 35.7 | % | (Won) | 75,580 | 35.1 | % | ||||||||
Other consumer(2) | 27,281 | 13.5 | 28,275 | 13.1 | ||||||||||||
Total retail | 98,996 | 49.2 | 103,855 | 48.2 | ||||||||||||
Credit card | 12,413 | 6.2 | 12,421 | 5.8 | ||||||||||||
Corporate | 88,275 | 43.8 | 97,239 | 45.1 | ||||||||||||
Foreign | 1,693 | 0.8 | 2,040 | 0.9 | ||||||||||||
|
|
|
|
|
|
|
| |||||||||
Total loans | (Won) | 201,377 | 100.0 | % | (Won) | 215,555 | 100.0 | % | ||||||||
|
|
|
|
|
|
|
| |||||||||
Retail Mortgage and home equity (1) Other consumer (2) Total retail Credit card Corporate Foreign Total loans As of December 31, 2011 2012 2013 (in billions of Won, except percentages) ₩ 75,580 35.1 % ₩ 74,463 34.3 % ₩ 77,969 35.1 % 28,275 13.1 28,969 13.4 29,675 13.4 103,855 48.2 103,432 47.7 107,644 48.5 12,421 5.8 11,874 5.5 11,784 5.3 97,239 45.1 99,683 45.9 100,534 45.3 2,040 0.9 1,925 0.9 1,900 0.9 ₩ 215,555 100.0 % ₩ 216,914 100.0 % ₩ 221,862 100.0 %
| (1) | Includes |
| (2) | Includes |
We provide a full range of personal lending products and retail banking services to individual customers, including mortgage loans. We are the largest private sector mortgage lender in Korea.
Lending to small- and medium-sized enterprises is the single largest component of our non-retail credit portfolio and represents a widely diversified exposure to a broad spectrum of the Korean corporate community, both by type of lending and type of customer, with one of the categories being collateralized loans to SOHO customers that are among the smallest of the small- and medium-sized enterprises. The volume of our loans to small- and medium-sized enterprises requires a customer-oriented approach that is facilitated by our large and geographically diverse branch network.
With respect to large corporate customers, we continue to seek to maintain and expand quality relationships by providing them with an increasing range of fee-related services.
Since the former Kookmin Bank initiated the issuance of domestic credit cards in 1980, we have seen our credit card business grow rapidly in recent yearsover the past decade as the nationwide trend towards credit card use accelerated. In March 2011, we effected a horizontal spin-off of the credit card business from Kookmin Bank. As a result, our credit card business is operated by a newly establishedseparate wholly-owned subsidiary, KB Kookmin Card Co., Ltd. As of December 31, 2011,2013, we had approximately 10.818.8 million holders of check cards or credit cards issued by KB Kookmin Card.
Strategy
Our strategic focus is to become a world-class financial group that ranks among the leaders of the financial industry in Asia and globally. We plan to continue to solidify our market position as Korea’s leading bank, enhance our ability to provide comprehensive financial services to our retail and corporate customers and strengthen our overseas operating platform and network. We believe our strong market position in the commercial banking area in Korea is an important competitive advantage, which will enable us to compete more effectively based on convenient delivery, product breadth and differentiation, and service quality while focusing on our profitability.
The key elements of our strategy are as follows:
Providing comprehensive financial services and maximizing synergies among our subsidiaries through our financial holding company structure
We believe the Korean financial services market has been undergoing and will continue to undergo significant change, and that the resulting trend toward consolidation and convergence, as well as the growing presence of foreign financial institutionsfrom, among other things, fluctuations in the Korean financial marketand global economy and the expansionevolving social landscape in Korea, including the acceleration of population aging in Korea, the overseas presenceprevalence of smartphone usage, developments in digital and operations of Korean financial institutions, may provide significantly greater competition for usmobile technologies and the ensuing trend toward high-tech “smart banking” in the future.banking sector. In the context of such changes, we plan to become a comprehensive financial services provider capable of offering a full range of products and services to our large existing base of retail and corporate banking customers, as well as a global firm that can effectively compete with leading international financial institutions. To that end, we are continuing to implement specific initiatives including the enhancement of our group-wide integrated customer relationship management system to facilitate the sharing of customer information and the integration of various customer loyalty programs among our subsidiaries.
We believe our financial holding company structure gives us a competitive advantage over commercial banks and unaffiliated financial services providers by:
allowing us to offer a more extensive range of financial products and services;
enabling us to share customer information, which is not permitted outside a financial holding company structure, thereby enhancing our risk management and cross-selling capabilities;
enhancing our ability to reduce costs in areas such as back-office processing and procurement; and
enabling us to raise and manage capital on a centralized basis.
Identifying, targeting and marketing to attractive customer segments and providing superior customer value and service to such segments
In recent years, rather than focusing on developing products and services to satisfy the overall needs of the general population, we have increasingly targeted specific market segments in Korea that we expect to generate superior growth and profitability. We will continue to implement a targeted marketing approach that seeks to identify the most attractive customer segments and to develop strategies to build market share in those segments. In particular, we intend to increase our “wallet share” of superior existing customers by using our advanced customer relationship management technology to better identify and meet the needs of our most creditworthy and high net worth customers, on whom we intend to concentrate our marketing efforts.
As For example, as part of this strategy, we operate a “priority customer” program called KB Star Club through four of our subsidiaries: Kookmin Bank, KB Investment & Securities, KB Life Insurance and KB Kookmin Card. We select and classify KB Star Club customers based on their transaction history with the four subsidiaries and provide such customers with preferential treatment in various areas, including interest rates and transaction fees, depending upon how they are classified. We also provide private banking services, including personal wealth management services through our exclusive brand “Gold & Wise,” to increase our share of the priority customer market and in turn increase our profitability and strengthen our position in retail banking.
We are also focusing on attracting and retaining creditworthy customers by offering more differentiated fee-based products and services that are tailored to meet their specific needs. The development and marketing of our products and services are, in part, driven by customer segmentation to ensure we meet the needs of each customer segment. For instance, we continue to develop hybrid financial products with enhanced features, including various deposit products and investment products, for which consumer demand has increased in recent years. We are also focusing on addressing the needs of our customers by providing the highest-quality products and services and developing an open-architecture strategy, which allows us to sell such products through one of the largest branch networks in Korea. In short, we aim to offer our customers a convenient one-stop financial services destination where they can meet their traditional retail and corporate banking requirements, as well as
find a broad array of fee-based products and services tailored to address more specific financial needs, including in investment banking, insurance and wealth management. We believe such differentiated, comprehensive services and cross-selling will not only enhance customer loyalty but also increase profitability.
One of our key customer-related strategies continues to be creating greater value and better service for our customers. We intend to continue improving our customer service, including through:
| • | Improved customer relationship management technology. Management has devoted substantial resources toward development of our customer relationship management system, which is designed to provide our employees with the needed information to continually improve the level of service and incentives offered to our preferred customers. Our system is based on an integrated customer database, which allows for better customer management and streamlines our customer reward system. We have also developed state-of-the-art call centers and online Internet capabilities to provide shorter response times to customers seeking information or to execute transactions. Our goals are to continually focus on improving customer service to satisfy our customer’s needs through continuing efforts to deliver new and improved services and to upgrade our customer relationship management system to provide the best possible service to our customers in the future. |
| • | Enhanced distribution channels. We also believe we can improve customer retention and usage rates by increasing the range of products and services we offer and by developing a differentiated, multi-channel distribution network, including branches, ATMs, call centers, mobile-banking and Internet banking. We believe that our leading market position in the commercial banking area in Korea gives us a competitive advantage in developing and enhancing our distribution capabilities. |
Focusing on expanding and improving credit quality in our corporate lending business and increasing market share in the corporate financial services market
We plan to focus on corporate lending as one of our core businesses through attracting top-tier corporate customers and providing customized and distinctive products and services to build our position as a leading service provider in the Korean corporate financial market. To increase our market share in providing financial services to the corporate market, we intend to:
promote a more balanced and strengthened portfolio with respect to our corporate business by developing our large corporate customer base and utilizing our improved credit management operations to better evaluate new large corporate and small- and medium-sized enterprise customers;
develop and sell more varied corporate financial products, consisting of transactional banking products which provide higher margin and less risk;
generate more fee income from large corporate customers through business-to-business transactions, foreign exchange transactions and derivative and other investment products, as well as investment banking services;
strengthen our marketing system based on our accumulated expertise in order to attract top-tier corporate customers;
focus on enhancing our channel network in order to provide the best service by strengthening our corporate customer management; and
further develop and train our core professionals with respect to this market, including through programs such as the “Career Development Path.”
Strengthening internal risk management capabilities
We believe that ensuring strong asset quality through effective credit risk management is critical to maintaining stable growth and profitability and risk management will continue to be one of our key focus areas. One of our highest priorities is to improve our asset quality and more effectively price our lending products to take into account inherent credit risk in our portfolio. Our goal is to maintain the soundness of our credit
portfolio, profitability and capital base. To this end, we intend to continue to strengthen our internal risk management capabilities by tightening our underwriting and management policies and improving our internal compliance policies. To accomplish this objective, we have undertaken the following initiatives:
| • | Strengthening underwriting procedures with advanced credit scoring techniques. We have centralized our credit management operations into our |
| • | Improving our internal compliance policy and ensuring strict application in our daily operations. We have improved our monitoring capabilities with respect to our internal compliance by providing training and educational programs to our management and employees. We have also implemented strict compliance policies to maintain the integrity of our risk management system. |
Cultivating a performance-based, customer-oriented culture that emphasizes market best practices
We believe a strong and dedicated workforce is critical to our ability to offer our customers the highest quality financial services and is integral to our goal of maintaining our position as one of Korea’s leading financial services providers. In the past, we have dedicated significant resources to develop and train our core professionals, and we intend to continue to enhance the productivity of our employees, including by regularly sponsoring in-house training and educational programs. We have also been seeking to cultivate a performance-based culture to create a work environment where members of our staff are incentivized to maximize their potential and in which our employees are directly rewarded for superior performance. We intend to maintain a professional workforce whose high quality of customer service reflects our goal to achieve and maintain global best practice standards in all areas of operations.
Retail Banking
Due to Kookmin Bank’s history and development as a retail bank and the know-how and expertise we have acquired from our activities in that market, retail banking has been and will continue to remain one of our core businesses. Our retail banking activities consist primarily of lending and deposit-taking.
Lending Activities
We offer various loan products that target different segments of the population, with features tailored to each segment’s financial profile and other characteristics. The following table sets forth the balances and the percentage of our total retail lending represented by the categories of our retail loans as of the dates indicated:
| As of December 31, | As of December 31, | |||||||||||||||||||||||||||||||||||||||
| 2010 | 2011 | 2011 | 2012 | 2013 | ||||||||||||||||||||||||||||||||||||
| (in billions of Won, except percentages) | (in billions of Won, except percentages) | |||||||||||||||||||||||||||||||||||||||
Retail: | ||||||||||||||||||||||||||||||||||||||||
Mortgage and home equity loans | (Won) | 71,715 | 72.4 | % | (Won) | 75,580 | 72.8 | % | ₩ | 75,580 | 72.8 | % | ₩ | 74,463 | 72.0 | % | ₩ | 77,969 | 72.4 | % | ||||||||||||||||||||
Other consumer loans(1) | 27,281 | 27.6 | 28,275 | 27.2 | 28,275 | 27.2 | 28,969 | 28.0 | 29,675 | 27.6 | ||||||||||||||||||||||||||||||
|
|
|
|
|
|
|
|
|
| |||||||||||||||||||||||||||||||
Total | (Won) | 98,996 | 100.0 | % | (Won) | 103,855 | 100.0 | % | ₩ | 103,855 | 100.0 | % | ₩ | 103,432 | 100.0 | % | ₩ | 107,644 | 100.0 | % | ||||||||||||||||||||
|
|
|
|
|
|
|
|
|
| |||||||||||||||||||||||||||||||
| (1) | Excludes credit card loans, but includes overdraft loans. |
Our retail loans consist of:
| • | Mortgage loans, which are loans made to customers to finance home purchases, construction, improvements or rentals; and home equity loans, which are loans made to our customers secured by their homes to ensure loan repayment. We also provide overdraft loans in connection with our home equity loans. |
| • | Other consumer loans, which are loans made to customers for any purpose (other than mortgage and home equity loans). These include overdraft loans, which are loans extended to customers to cover insufficient funds when they withdraw funds from their demand deposit accounts with us in excess of the amount in such accounts up to a limit established by us. |
For secured loans, including mortgage and home equity loans, our policy is to lend up to 100% of the adjusted collateral value (except in areas of high speculation designated by the government where we generally limit our lending to between 40% to 60% of the appraised value of collateral) minus the value of any lien or other security interests that are prior to our security interest. In calculating the adjusted collateral value for real estate, we use the appraisal value of the collateral multiplied by a factor, generally between 40% to 80% (40% to 60% in the case of mortgage and home equity loans). This factor varies depending upon the location and use of the real estate and is established in part by taking into account court-supervised auction prices for nearby properties.
A borrower’s eligibility for our mortgage loans depends on the value of the mortgage property, the appropriateness of the use of proceeds and the borrower’s creditworthiness. A borrower’s eligibility for home equity loans is determined by the borrower’s credit and the value of the property, while the borrower’s eligibility for other consumer loans is primarily determined by the borrower’s credit. If the borrower’s credit deteriorates, it may be difficult for us to recover the loan. As a result, we review the borrower’s creditworthiness, collateral value, credit scoring and third party guarantees when evaluating a borrower. In addition, to reduce the interest rate of a loan or to qualify for a loan, a borrower may provide collateral, deposits or guarantees from third parties.
Mortgage and Home Equity Lending
The housing finance market in Korea is divided into public sector and private sector lending. In the public sector, two government entities, the National Housing Fund and the National Agricultural Cooperative Federation, are responsible for most of the mortgage lending.
Private sector mortgage and home equity lending in Korea has expanded substantially in recent years. We provide customers with a number of mortgage and home equity loan products that have flexible features, including terms, repayment schedules, amounts and eligibility for loans, and we offer interest rates on a commercial basis. The maximum term of mortgage loans is 35 years and the majority of our mortgage loans have long-term maturities, which may be renewed. Non-amortizing home equity loans have an initial maturity of one year, which may be extended on an annual basis for a maximum of five years. Home equity loans subject to amortization of principal may have a maximum term of up to 35 years. As of December 31, 2011,2013, we had (Won)23,064₩25,794 billion of amortizing home equity loans, representing 76.7%81.9% of our total home equity loans, and (Won)6,996₩5,690 billion of non-amortizing home equity loans, representing 23.3%18.1% of our total home equity loans. Any customer is eligible for a mortgage or an individual home equity loan regardless of whether it participates in one of our housing related savings programs and so long as that customer is not barred by regulation from obtaining a loan because of bad credit history. However, customers with whom we frequently transact business and provide us with significant revenue receive preferential interest rates on loans.
As of December 31, 2011, 74.9%2013, 72.8% of our mortgage loans were secured by residential property which is the subject of the loan, 11.3%18.3% of our mortgage loans were guaranteed by the Housing Finance Credit Guarantee Fund, a government housing-related entity, and the remaining 13.8%8.9% of our mortgage loans, contrary to general practices in the United States, were unsecured (although the use of proceeds from these loans are restricted for the purpose of financing home purchases and some of these loans were guaranteed by a third party). One reason that a relatively high percentage of our mortgage loans are unsecured is that we, along with other Korean banks,
provide advance loans to borrowers for the down payment of new housing (particularly apartments) that is in the process of being built. Once construction is completed, which may take several years, these mortgage loans become secured by the new housing purchased by these borrowers. For the year ended December 31, 2011,2013, the average initial loan-to-value ratio of our mortgage loans, which is a measure of the amount of loan exposure to the appraised value of the security collateralizing the loan, was approximately 46%47.7%. There are three reasons that our loan-to-value ratio is relatively lower (as is the case with other Korean banks) compared to similar ratios in other countries, such as the United States. The first reason is that housing prices are high in Korea relative to average income, so most people cannot afford to borrow an amount equal to the entire value of their collateral and make interest payments on such an amount. The second reason relates to the “jeonsae” system, through which people provide a key money deposit while residing in the property prior to its purchase. At the time of purchase, most people use the key money deposit as part of their payment and borrow the remaining amount from Korean banks, which results in a loan that will be for an amount smaller than the appraised value of the property for collateral and assessment purposes. The third reason is that Korean banks discount the appraised value of the borrower’s property for collateral and assessment purposes so that a portion of the appraised value is reserved in order to provide recourse to a renter who lives at the borrower’s property. This is in the event that the borrower’s property is seized by a creditor, and the renter is no longer able to reside at that property. See “Item 3D.3.D. Risk Factors—Other risks relating to our business—A decline in the value of the collateral securing our loans and our inability to realize full collateral value may adversely affect our credit portfolio.” As a resultIn response to the implementation in recent years of various government initiatives designed to curtail extension of new or refinanced loans secured by housing (as described in “—Supervision and Regulation—Principal Regulations Applicable to Banks—Recent Regulations Relating to Retail Household Loans”), we have also tightened our mortgage loan guidelines.guidelines, principally by decreasing our maximum loan-to-value ratios and borrower debt-to-income ratios in accordance with the revised limits set forth in the related regulations.
The following table sets forth our unsecured and secured mortgage loans and home equity loans as of December 31, 20102011, 2012 and 2011,2013, based on their loan classification categories under IFRS and our internal guidelines:credit ratings for loans (which are described in Note 4.2.4 of the notes to our consolidated financial statements):
| As of December 31, 2010 | As of December 31, 2011 | |||||||||||||||||||||||||||||||||||||||||||||||||||||||||||||||||||||||
| Non-impaired | Impaired | Total | Non-impaired | Impaired | Total | |||||||||||||||||||||||||||||||||||||||||||||||||||||||||||||||||||
| Not past due | Past due | Not Past Due | Past Due | |||||||||||||||||||||||||||||||||||||||||||||||||||||||||||||||||||||
| Outstanding | Good | Below normal | Past due up to 89 days | Past due 90 days to 179 days | Past due 180 days or more | Grade 1 | Grade 2 | Grade 3 | Grade 4 | Grade 5 | Past Due Up to 89 Days | Past Due 90 Days to 179 Days | Past Due 180 Days or More | |||||||||||||||||||||||||||||||||||||||||||||||||||||||||||
| (In billions of Won) | (in billions of Won) | |||||||||||||||||||||||||||||||||||||||||||||||||||||||||||||||||||||||
Mortgage | ||||||||||||||||||||||||||||||||||||||||||||||||||||||||||||||||||||||||
Mortgage: | ||||||||||||||||||||||||||||||||||||||||||||||||||||||||||||||||||||||||
Secured (1) | (Won) | 28,944 | (Won) | 4,249 | (Won) | 1,031 | (Won) | 424 | (Won) | 87 | (Won) | 35 | (Won) | 40 | (Won) | 34,810 | ₩ | 33,606 | ₩ | 4,205 | ₩ | 440 | ₩ | 136 | ₩ | 87 | ₩ | 650 | ₩ | 57 | ₩ | 30 | ₩ | 40 | ₩ | 39,251 | ||||||||||||||||||||||||||||||||||||
Unsecured | 4,309 | 3,056 | 536 | 249 | 19 | 102 | 242 | 8,513 | 4,297 | 1,108 | 105 | 75 | 85 | 188 | 12 | 74 | 325 | 6,269 | ||||||||||||||||||||||||||||||||||||||||||||||||||||||
Home Equity | ||||||||||||||||||||||||||||||||||||||||||||||||||||||||||||||||||||||||
Home Equity: | ||||||||||||||||||||||||||||||||||||||||||||||||||||||||||||||||||||||||
Secured | 23,349 | 3,827 | 816 | 275 | 67 | 29 | 29 | 28,392 | 25,420 | 3,478 | 429 | 107 | 87 | 450 | 48 | 20 | 21 | 30,060 | ||||||||||||||||||||||||||||||||||||||||||||||||||||||
Unsecured | — | — | — | — | — | — | — | — | — | — | — | — | — | — | — | — | — | — | ||||||||||||||||||||||||||||||||||||||||||||||||||||||
|
|
|
|
|
|
|
|
|
|
|
|
|
|
|
|
|
| |||||||||||||||||||||||||||||||||||||||||||||||||||||||
Total | (Won) | 56,602 | (Won) | 11,132 | (Won) | 2,383 | (Won) | 948 | (Won) | 173 | (Won) | 166 | (Won) | 311 | (Won) | 71,715 | ₩ | 63,323 | ₩ | 8,791 | ₩ | 974 | ₩ | 318 | ₩ | 259 | ₩ | 1,288 | ₩ | 117 | ₩ | 124 | ₩ | 386 | ₩ | 75,580 | ||||||||||||||||||||||||||||||||||||
|
|
|
|
|
|
|
|
|
|
|
|
|
|
|
|
|
| |||||||||||||||||||||||||||||||||||||||||||||||||||||||
| As of December 31, 2012 | ||||||||||||||||||||||||||||||||||||||||||||||||||||||||||||||||||||||||
| Non-impaired | Impaired | Total | ||||||||||||||||||||||||||||||||||||||||||||||||||||||||||||||||||||||
| Not Past Due | Past Due | |||||||||||||||||||||||||||||||||||||||||||||||||||||||||||||||||||||||
| Grade 1 | Grade 2 | Grade 3 | Grade 4 | Grade 5 | Past Due Up to 89 Days | Past Due 90 Days to 179 Days | Past Due 180 Days or More | |||||||||||||||||||||||||||||||||||||||||||||||||||||||||||||||||
| (in billions of Won) | ||||||||||||||||||||||||||||||||||||||||||||||||||||||||||||||||||||||||
Mortgage: | ||||||||||||||||||||||||||||||||||||||||||||||||||||||||||||||||||||||||
Secured (1) | ₩ | 33,783 | ₩ | 4,271 | ₩ | 478 | ₩ | 141 | ₩ | 98 | ₩ | 665 | ₩ | 45 | ₩ | 70 | ₩ | 55 | ₩ | 39,606 | ||||||||||||||||||||||||||||||||||||||||||||||||||||
Unsecured | 3,441 | 989 | 135 | 72 | 95 | 94 | 5 | 53 | 387 | 5,271 | ||||||||||||||||||||||||||||||||||||||||||||||||||||||||||||||
Home Equity: | ||||||||||||||||||||||||||||||||||||||||||||||||||||||||||||||||||||||||
Secured | 25,081 | 3,269 | 472 | 106 | 102 | 452 | 44 | 30 | 30 | 29,586 | ||||||||||||||||||||||||||||||||||||||||||||||||||||||||||||||
Unsecured | — | — | — | — | — | — | — | — | — | — | ||||||||||||||||||||||||||||||||||||||||||||||||||||||||||||||
|
|
|
|
|
|
|
|
|
| |||||||||||||||||||||||||||||||||||||||||||||||||||||||||||||||
Total | ₩ | 62,305 | ₩ | 8,529 | ₩ | 1,085 | ₩ | 319 | ₩ | 295 | ₩ | 1,211 | ₩ | 94 | ₩ | 153 | ₩ | 472 | ₩ | 74,463 | ||||||||||||||||||||||||||||||||||||||||||||||||||||
|
|
|
|
|
|
|
|
|
| |||||||||||||||||||||||||||||||||||||||||||||||||||||||||||||||
| As of December 31, 2011 | As of December 31, 2013 | |||||||||||||||||||||||||||||||||||||||||||||||||||||||||||||||||||||||
| Non-impaired | Impaired | Total | Non-impaired | Impaired | Total | |||||||||||||||||||||||||||||||||||||||||||||||||||||||||||||||||||
| Not past due | Past due | Not Past Due | Past Due | |||||||||||||||||||||||||||||||||||||||||||||||||||||||||||||||||||||
| Outstanding | Good | Below normal | Past due up to 89 days | Past due 90 days to 179 days | Past due 180 days or more | Grade 1 | Grade 2 | Grade 3 | Grade 4 | Grade 5 | Past Due Up to 89 Days | Past Due 90 Days to 179 Days | Past Due 180 Days or More | |||||||||||||||||||||||||||||||||||||||||||||||||||||||||||
| (In billions of Won) | (in billions of Won) | |||||||||||||||||||||||||||||||||||||||||||||||||||||||||||||||||||||||
Mortgage | ||||||||||||||||||||||||||||||||||||||||||||||||||||||||||||||||||||||||
Mortgage: | ||||||||||||||||||||||||||||||||||||||||||||||||||||||||||||||||||||||||
Secured (1) | (Won) | 33,606 | (Won) | 4,205 | (Won) | 663 | (Won) | 650 | (Won) | 57 | (Won) | 30 | (Won) | 40 | (Won) | 39,251 | ₩ | 37,642 | ₩ | 4,171 | ₩ | 361 | ₩ | 116 | ₩ | 78 | ₩ | 808 | ₩ | 74 | ₩ | 44 | ₩ | 76 | ₩ | 43,370 | ||||||||||||||||||||||||||||||||||||
Unsecured | 4,297 | 1,108 | 265 | 188 | 12 | 74 | 325 | 6,269 | 2,131 | 531 | 74 | 24 | 11 | 119 | 9 | 28 | 188 | 3,115 | ||||||||||||||||||||||||||||||||||||||||||||||||||||||
Home Equity | ||||||||||||||||||||||||||||||||||||||||||||||||||||||||||||||||||||||||
Home Equity: | ||||||||||||||||||||||||||||||||||||||||||||||||||||||||||||||||||||||||
Secured | 25,420 | 3,478 | 623 | 450 | 48 | 20 | 21 | 30,060 | 27,512 | 2,767 | 356 | 98 | 89 | 541 | 63 | 26 | 32 | 31,484 | ||||||||||||||||||||||||||||||||||||||||||||||||||||||
Unsecured | — | — | — | — | — | — | — | — | — | — | — | — | — | — | — | — | — | — | ||||||||||||||||||||||||||||||||||||||||||||||||||||||
|
|
|
|
|
|
|
|
|
|
|
|
|
|
|
|
|
| |||||||||||||||||||||||||||||||||||||||||||||||||||||||
Total | (Won) | 63,323 | (Won) | 8,791 | (Won) | 1,551 | (Won) | 1,288 | (Won) | 117 | (Won) | 124 | (Won) | 386 | (Won) | 75,580 | ₩ | 67,285 | ₩ | 7,469 | ₩ | 791 | ₩ | 238 | ₩ | 178 | ₩ | 1,468 | ₩ | 146 | ₩ | 98 | ₩ | 296 | ₩ | 77,969 | ||||||||||||||||||||||||||||||||||||
|
|
|
|
|
|
|
|
|
|
|
|
|
|
|
|
|
| |||||||||||||||||||||||||||||||||||||||||||||||||||||||
| (1) | Includes advance loans guaranteed by the Housing Finance Credit Guarantee Fund to borrowers for the down payment of new housing that is in the process of being built. |
Our home equity loan portfolio includes loans that are in a second lien position. In addition to the underwriting procedures we perform when we issue home equity loans in general, we perform additional underwriting procedures with respect to home equity loans secured by a second lien to assess and confirm the value and status of any loans secured by security interests on the collateral which would be prior to our security interest under the second lien home equity loan. Under regulations implemented by the Financial Supervisory Service, our home equity loans are subject to maximum loan-to-value ratios (i.e., the ratio of the aggregate principal amount of loans, including first and second lien loans, secured by a particular item of collateral to the appraised value of such collateral) of between 40% and 60%. As such, for home equity loans, we do not lend more than an amount equal to the adjusted collateral value (i.e., the collateral value as discounted by the required loan-to-value ratio) minus the value of any loans secured by security interests on the collateral that are prior to our security interest. Accordingly, in order to ascertain the value of loans secured by security interests on the collateral which would be prior to our security interest and to confirm the status of such loans, we perform additional underwriting procedures including a review of the relevant title and security interest registration documents and bank documents and certificates regarding such loans. In addition, for purposes of calculating debt-to-income ratios applicable to loans secured by certain types of housing under regulations implemented by the Financial Supervisory Service (see “—Supervision and Regulation—Principal Regulations Applicable to Banks—Recent Regulations Relating to Retail Household Loans”), which we apply on a nationwide basis for our home equity loans, we perform additional adjustments in our debt-to-income ratio calculations with respect to second lien home equity loans to account for the value of loans secured by security interests on the collateral that are prior to our security interest.
Following the issuance of a home equity loan, we make use of the Korea Federation of Bank’s database of delinquent borrowers to generally monitor the compliance of our borrowers with their other loan obligations, including the compliance of our second lien borrowers with their first lien loans. If a borrower in Korea is past due on payments of interest or principal for more than three months on any of its outstanding loans to Korean financial institutions (including mortgage, home equity, other consumer and credit card loans), such borrower is registered on the Korea Federation of Banks’ database of delinquent borrowers, which we monitor on a daily basis. The information disclosed by such database, which includes the outstanding loan amount which is past due, the identity of the delinquent borrower and the name of the applicable lending institution for such loan, provides an early warning about such borrower to our loan officers at the branch level, who then closely monitor our outstanding loans to such delinquent borrower and take appropriate preventive and remedial measures (including requiring such borrower to provide additional collateral) as necessary. Upon the occurrence of a default in the first lien position, we treat the second lien home equity loan as part of our potential problem loans or non-performing loans. More specifically, upon learning of the occurrence of a default in the first lien position, we examine our second lien home equity loan to determine whether the loan should be re-classified as “precautionary,
“precautionary,” “substandard” or “doubtful” according to the asset classification guidelines of the Financial Services Commission. Assuming that such second lien home equity loan is not delinquent, if the outstanding principal amount of the relevant first lien loan is less than (Won)15₩15 million, we classify the entire amount of the second lien home equity loan as “precautionary” and closely monitor it as a loan that may potentially become problematic. If the outstanding principal amount of the relevant first lien loan is (Won)15₩15 million or above or the borrower is undergoing, or preparing to undergo, foreclosure proceedings with respect to the underlying collateral, we classify the estimated recoverable amount of the second lien home equity loan as “substandard” and the rest of such loan amount as “doubtful.”
Pricing. The interest rates on our retail mortgage loans are generally based on a periodic floating rate (which is based on a base rate determined for three-month, six-month or twelve-month periods derived using our Market Opportunity Rate system, which reflects our internal cost of funding, further adjusted to account for our expenses related to lending). Our interest rates also incorporate a margin based among other things on the type of security, the credit score of the borrower and the estimated loss on the security. We can adjust the price to reflect the borrower’s current and/or expected future contribution to us. The applicable interest rate is determined at the time of the loan. If a loan is terminated prior to its maturity, the borrower is obligated to pay us an early termination fee of approximately 0.7% to 1.4% of the loan amount in addition to the accrued interest.
The interest rates on our home equity loans are determined on the same basis as our retail mortgage loans.
As of December 31, 2011,2013, our three-month, six-month and twelve-month base rates were 3.55%2.65%, 3.62%2.73% and 3.63%2.79%, respectively.
As of December 31, 2011, 93%2013, 82% of our outstanding mortgage and home equity loans were priced based on a floating rate.
Other Consumer Loans
Other consumer loans are primarily unsecured. However, such loans may be secured by real estate, deposits or securities. As of December 31, 2011,2013, approximately (Won)17,224₩15,854 billion, or 60.9%53.4% of our consumer loans (other than mortgage and home equity loans) were unsecured loans (although some of these loans were guaranteed by a third party). Overdraft loans are also classified as other consumer loans, are primarily unsecured and generally have an initial maturity of one year, which is typically extended automatically on an annual basis and may be extended up to a maximum of five years. The amount of overdraft loans as of December 31, 20112013 was approximately (Won)8,622₩7,181 billion.
In January 2012, we established KB Savings Bank to provide small-loan finance services to retail customers. KB Savings Bank was established in connection with our purchase of the assets of Jeil Savings Bank and assumption of its liabilities pursuant to a purchase and assumption agreement among Jeil Savings Bank, the Korea Deposit Insurance Corporation and us. In connection with such purchase and assumption, we recognized an acquisition of (Won)2,546 billion of assets and an assumption of (Won)2,654 billion of liabilities and also (Won)108 billion of
goodwill. Under the purchase and assumption agreement, we have the right to transfer to the Korea Deposit Insurance Corporation a portion of the assets we purchased and related liabilities we assumed, subject to certain conditions, by May 2012. See Note 44 of the notes to our consolidated financial statements included elsewhere in this annual report.
Pricing. The interest rates on our other consumer loans (including overdraft loans) are determined on the same basis as on our mortgage and home equity loans, except that, for unsecured loans, the borrower’s credit score as determined during our loan approval process is also taken into account. See “Item 11. Quantitative and Qualitative Disclosures about Market Risk—Credit Risk Management.”
As of December 31, 2011, 99%2013, 98% of our other consumer loans had interest rates that were not fixed but were variable in reference to our base rate, which is based on the Market Opportunity Rate.
Deposit-taking Activities
Due to our extensive nationwide network of branches, together with our long history of development and our resulting know-how and expertise, as of December 31, 2011,2013, we had the largest number of retail customers and retail deposits among Korean commercial banks. The balance of our deposits from retail customers was (Won)111,484₩119,707 billion, ₩126,581 billion and (Won)119,707₩132,733 billion as of December 31, 20102011, 2012 and 2011,2013, respectively, which constituted 62.0%62.9%, 64.1% and 62.9%66.1%, respectively, of the balance of our total deposits.
We offer many deposit products that target different segments of our retail customer base, with features tailored to each segment’s financial profile, characteristics and needs, including:
| • | Demand deposits, which either do not accrue interest or accrue interest at a lower rate than time deposits. Demand deposits allow the customer to deposit and withdraw funds at any time and, if they |
are interest bearing, accrue interest at a variable rate depending on the amount of deposit. Retail and corporate demand deposits constituted |
| • | Time deposits, which generally require the customer to maintain a deposit for a fixed term, during which the deposit accrues interest at a fixed rate or a variable rate based on the KOSPI, or to deposit specified amounts on an installment basis. If the amount of the deposit is withdrawn prior to the end of the fixed term, the customer will be paid a lower interest rate than that originally offered. The term for time deposits typically ranges from one month to five years, and the term for installment savings deposits ranges from six months to ten years. Retail and corporate time deposits constituted |
| • | Certificates of deposit, the maturities of which typically range from 30 days to 730 days with a required minimum deposit of |
| • | Foreign currency deposits, which accrue interest at an adjustable rate and are available to Korean residents, non-residents and overseas immigrants. We offer foreign currency time deposits and checking and passbook accounts in ten currencies. |
We offer varying interest rates on our deposit products depending upon average funding costs, the rate of return on our interest earning assets and the interest rates offered by other commercial banks.
We also offer deposits that provide the holder with preferential rights to housing subscriptions and eligibility for mortgage loans. These products include:
| • | Housing subscription time deposits, which are special purpose time deposit accounts providing the holder with a preferential right to subscribe for new private apartment units under the Housing Law. This law is the basic law setting forth various measures supporting the purchase of houses and the |
supply of such houses by construction companies. These products accrue interest at a fixed rate for one year, and at an adjustable rate after one year. Deposit amounts per account range from |
| • | Housing subscription installment savings deposits, which are monthly installment savings programs providing the holder with a preferential subscription right for new private apartment units under the Housing Law. Account holders are also eligible for our mortgage loans. These deposits require monthly installments of |
We operate a “priority customer” program called KB Star Club through four of our subsidiaries: Kookmin Bank, KB Investment & Securities, KB Life Insurance and KB Kookmin Card. We select and classify KB Star Club customers based on their transaction history with the four subsidiaries and provide such customers with preferential treatment in various areas, including interest rates and transaction fees, depending upon how they are classified. As of December 31, 2011, we had over 4.7 million KB Star Club customers, representing approximately 16% of our total retail customer base of approximately 29.3 million retail customers. In 2011, on an average balance basis, our KB Star Club customers held approximately 90% of our total retail customer deposits.
In 2002, after significant research and planning, we launched private banking operations at Kookmin Bank’s headquarters. Shortly thereafter, we launched a comprehensive strategy with respect to customers with higher net worth, which included staffing appropriate representatives, marketing aggressively, establishing IT systems, selecting appropriate branch locations and readying such branches with the necessary facilities to service such customers. As of JanuaryDecember 31, 2012,2013, we operated 23 private banking centers through Kookmin Bank. We believe that by offering high quality personal wealth management services to these customers, including through our exclusive brand “Gold & Wise”, we can increase our share of the priority customer market, which will increase our profitability and our position in the retail banking market.
The Monetary Policy Committee of the Bank of Korea (the “Monetary Policy Committee”) imposes a reserve requirement on Won currency deposits of commercial banks based generally on the type of deposit instrument. The reserve requirement is currently up to 7%. See “—Supervision and Regulation—Principal Regulations Applicable to Banks—Liquidity.”
The Depositor Protection Act provides for a deposit insurance system where the Korea Deposit Insurance Corporation guarantees to depositors the repayment of their eligible bank deposits. The deposit insurance system insures up to a total of (Won)50₩50 million per depositor per bank. See “—Supervision and Regulation—Principal Regulations Applicable to Banks—Deposit Insurance System.” We pay apaid ₩303 billion of premium rate of 0.02% of our average deposits for each quarter and we paid (Won)122 billion for 2011.2013.
Credit Cards
Credit cards are another of our core retail products. We issue most of our credit cards under the “KB Kookmin Card” brand. In March 2011, we effected a horizontal spin-off of the credit card business from Kookmin Bank. As a result, our credit card business is operated by a newly establishedseparate wholly-owned subsidiary, KB Kookmin Card Co., Ltd.
The following table sets forth certain data relating to our credit card operations, on a non-consolidated basis, as of the dates and for the periods indicated:
| As of and for the Year Ended December 31, | As of and for the Year Ended December 31, | |||||||||||||||||||
| 2010 | 2011 | 2011 | 2012 | 2013 | ||||||||||||||||
(in billions of Won, except number of holders, accounts and percentages) | (in billions of Won, except number of holders, accounts and percentages) | |||||||||||||||||||
Number of credit cardholders (at year end) (thousands) | ||||||||||||||||||||
General accounts | 10,169 | 10,364 | 10,364 | 10,112 | 8,987 | |||||||||||||||
Corporate accounts | 341 | 407 | 407 | 424 | 435 | |||||||||||||||
|
|
|
|
| ||||||||||||||||
Total | 10,510 | 10,771 | 10,771 | 10,536 | 9,422 | |||||||||||||||
|
|
|
|
| ||||||||||||||||
Number of merchants (at year end) (thousands) | 2,114 | 2,265 | 2,265 | 2,024 | 2,058 | |||||||||||||||
Active ratio (at year end)(1) | 74.0 | % | 77.4 | % | 77.4 | % | 81.0 | % | 88.6 | % | ||||||||||
Credit card fees | ||||||||||||||||||||
Merchant fees (2) | (Won) | 1,306 | (Won) | 1,441 | ₩ | 1,441 | ₩ | 1,484 | ₩ | 1,480 | ||||||||||
Installment and cash advance fees | 629 | 648 | 648 | 683 | 578 | |||||||||||||||
Annual membership fees | 51 | 51 | 51 | 66 | 68 | |||||||||||||||
Other fees | 519 | 566 | 566 | 542 | 539 | |||||||||||||||
|
|
|
|
| ||||||||||||||||
Total | (Won) | 2,505 | (Won) | 2,706 | ₩ | 2,706 | ₩ | 2,775 | ₩ | 2,665 | ||||||||||
|
|
|
|
| ||||||||||||||||
Charge volume(3) | ||||||||||||||||||||
General purchase | (Won) | 48,527 | (Won) | 46,771 | ₩ | 46,771 | ₩ | 45,768 | ₩ | 46,735 | ||||||||||
Installment purchase | 10,790 | 11,644 | 11,644 | 12,153 | 10,852 | |||||||||||||||
Cash advance | 12,262 | 12,220 | 12,220 | 11,606 | 10,516 | |||||||||||||||
Card loan (4) | 4,535 | 4,306 | 4,306 | 3,800 | 4,688 | |||||||||||||||
|
|
|
|
| ||||||||||||||||
Total | (Won) | 76,114 | (Won) | 74,941 | ₩ | 74,941 | ₩ | 73,327 | ₩ | 72,791 | ||||||||||
|
|
|
|
| ||||||||||||||||
Outstanding balance (at year end) | ||||||||||||||||||||
General purchase | (Won) | 4,684 | (Won) | 4,410 | ₩ | 4,410 | ₩ | 4,533 | ₩ | 4,716 | ||||||||||
Installment purchase | 2,581 | 2,770 | 2,770 | 2,679 | 2,600 | |||||||||||||||
Cash advance | 2,224 | 2,276 | 2,276 | 2,032 | 1,525 | |||||||||||||||
Card loan(4) | 2,926 | 2,982 | 2,982 | 2,647 | 2,959 | |||||||||||||||
|
|
|
|
| ||||||||||||||||
Total | (Won) | 12,415 | (Won) | 12,438 | ₩ | 12,438 | ₩ | 11,891 | ₩ | 11,800 | ||||||||||
|
|
|
|
| ||||||||||||||||
Average outstanding balances | ||||||||||||||||||||
General purchase | (Won) | 4,512 | (Won) | 4,569 | ₩ | 4,569 | ₩ | 4,461 | ₩ | 4,601 | ||||||||||
Installment purchase | 2,457 | 2,579 | 2,579 | 2,728 | 2,474 | |||||||||||||||
Cash advance | 2,192 | 2,238 | 2,238 | 2,134 | 1,717 | |||||||||||||||
Card loan(4) | 2,756 | 2,996 | 2,996 | 2,759 | 2,829 | |||||||||||||||
|
|
|
|
| ||||||||||||||||
Total | (Won) | 11,917 | (Won) | 12,382 | ₩ | 12,382 | ₩ | 12,082 | ₩ | 11,621 | ||||||||||
|
|
|
|
| ||||||||||||||||
Delinquency ratios (at year end) (5) | ||||||||||||||||||||
From 1 month to 3 months | 0.73 | 1.00 | 1.00 | % | 0.94 | % | 0.81 | % | ||||||||||||
From 3 months to 6 months | 0.11 | 0.34 | 0.34 | 0.25 | 0.83 | |||||||||||||||
Over 6 months | 0.18 | 0.17 | 0.17 | 0.13 | 0.07 | |||||||||||||||
|
|
|
|
| ||||||||||||||||
Total | 1.02 | % | 1.51 | % | 1.51 | % | 1.32 | % | 1.71 | % | ||||||||||
|
|
|
|
| ||||||||||||||||
Non-performing loan ratio | 0.31 | % | 0.50 | % | 0.50 | % | 0.40 | % | 0.91 | % | ||||||||||
Write-offs (gross) | (Won) | 389 | (Won) | 413 | ₩ | 413 | ₩ | 541 | ₩ | 404 | ||||||||||
Recoveries(6) | 245 | 204 | ||||||||||||||||||
Recoveries (6) | 204 | 185 | 141 | |||||||||||||||||
|
|
|
|
| ||||||||||||||||
Net write-offs | (Won) | 144 | (Won) | 209 | ₩ | 209 | ₩ | 356 | ₩ | 263 | ||||||||||
|
|
|
|
| ||||||||||||||||
Gross write-off ratio (7) | 3.26 | % | 3.34 | % | 3.34 | % | 4.48 | % | 2.93 | % | ||||||||||
Net write-off ratio(8) | 1.21 | % | 1.69 | % | 1.69 | % | 2.95 | % | 1.91 | % | ||||||||||
| (1) | The active ratio represents the ratio of accounts used at least once within the last six months to total accounts as of year end. |
| (2) | Merchant fees consist of maintenance fees and costs associated with prepayment by us (on behalf of customers) of sales proceeds to merchants, processing fees relating to sales and membership applications, costs relating to the management of delinquencies and recoveries, provision for loan losses, general variable expenses and other fixed costs that are charged to our member merchants. We typically charge our member merchants fees that range from 1.5% to |
| (3) | Represents the aggregate cumulative amount charged during the year. |
| (4) | Card loans consist of loans that are provided on |
Represents ratio of credit card balances overdue by one month or more to outstanding balance. In line with industry practice, we have restructured a portion of delinquent credit card account balances as loans. As of December 31, |
Does not include proceeds that we received from sales of our non-performing loans that were written off. |
Represents the ratio of gross write-offs for the year to average outstanding balance for the year. Our charge-off policy is generally to write off balances which have been overdue for four payment cycles or more or which have been classified as expected loss. |
Represents the ratio of net write-offs for the year to average outstanding balances for the year. Our charge-off policy is generally to write off balances which have been overdue for four payment cycles or more or which have been classified as expected loss. |
In contrast to the system in the United States and many other countries, where most credit cards are revolving cards that allow outstanding amounts to be rolled over from month to month so long as a required minimum percentage is repaid, credit cardholders in Korea are generally required to pay for their purchases within approximately 14 to 44 days of purchase depending on their payment cycle. However, we also offer revolving cardspayment plans to individuals that allow outstanding amounts to be rolled over to subsequent payment periods. Delinquent accounts (defined as amounts overdue for one day or more) are charged penalty interest and closely monitored. For installment purchases, we charge interest on unpaid installments at rates that vary according to the termsindividual cardholder’s membership level, which is based on, among others, transaction history, the length of repayment.the cardholder’s relationship with us and contribution to our profitability.
We are committed to continuing to enhance our credit card business by strengthening our risk management and maximizing our operational efficiency. In addition, we believe that our extensive branch network, brand recognition and overall size will enable us to cross-sell products such as credit cards to our existing and new customers.
To promote our credit card business, we offer services targeted to various financial profiles and customer requirements and are concentrating on:on:
strengthening cross-sales to existing customers and offering integrated financial services;
offering cards that provide additional benefits such as frequent flyer miles and reward program points that can be redeemed by the customer for complementary services, prizes and cash;
offering platinum cards, VVIP cards and other prime members’ cards, which have a higher credit limit and provide additional services in return for a higher fee;
acquiring new customers through strategic alliances and cross-marketing with retailers;
encouraging increased use of credit cards by existing customers through special offers for frequent users;
introducing new features such as revolving credit cards as well as travel services and insurance through alliance partners; and
developing fraud detection and security systems to prevent the misuse of credit cards.
As of December 31, 2011,2013, we had approximately 10.89.4 million credit cardholders. Of the credit cards outstanding, approximately 77.4%88.6% were active, meaning that they had been used at least once during the previous six months.
Our card revenues consist principally of cash advance fees, merchant fees, credit card installment fees, interest income from credit card loans, annual fees paid by cardholders, interest and fees on late payments and, with respect to revolving cardspayment plans we offer, interest and fees relating to revolving balances. Cardholders are generally required to pay for their purchases within 14 to 44 days after the date of purchase, depending on their payment cycle. Except in the case of installment purchases, accounts which remain unpaid after this period are deemed to be delinquent.
We generate other fees through a processing charge on merchants, which ranges from 1.5% to 4.5%2.7%.
Under non-exclusive license agreements with MasterCard International Incorporated and Visa International Service Association,overseas financial services corporations, we also issue MasterCard, Visa, American Express, JCB and VisaChina UnionPay credit cards.
We also issue debit cards and charge merchants commissions that range from 1.0% to 2.0% of the amounts purchased using a debit card. We also issue “check cards,” which are similar to debit cards except that “check cards” are accepted by all merchants that accept credit cards, and charge merchants commissions that range from 1.0% to 1.9%1.7%. Much like debit cards, “check card”check card purchases are also debited directly from customers’ accounts with us.
In the second half of 2012, we (through KB Kookmin Card) commenced accounts receivable factoring activities in partnership with SK Telecom Co., Ltd., a leading Korean mobile telecommunications company, pursuant to which we purchase accounts receivable arising from SK Telecom’s installment sale of mobile handsets to its customers. The outstanding balance of factored receivables amounted to ₩2,771 billion as of December 31, 2013.
In February 2014, the Financial Services Commission suspended the new credit card issuance and other related activities of KB Kookmin Card for three months from February to May 2014, in response to an incident involving the misappropriation of the personal information of a large number of its customers by an employee of an external credit information company in the first half of 2013. See “Item 8A. Consolidated Statements and Other Financial Information—Legal Proceedings.”
Corporate Banking
We lend to and take deposits from small- and medium-sized enterprises and, to a lesser extent, large corporate customers. As of December 31, 2010 and 2011, weWe had 227,860 and 234,565over 230,000 small- and medium-sized enterprise borrowers as of December 31, 2011 and 9932012 and over 220,000 small- and medium-sized enterprise borrowers as of December 31, 2013, for Won-currency loans. As of December 31, 2011, 2012 and 2013, we had 1,210, 1,486 and 1,654 large corporate borrowers, respectively, for Won-currency loans. For 20102011, 2012 and 2011,2013, we received fee revenue from cash management services offered to corporate customers, which include “firm-banking” services such as inter-account transfers, transfers of funds from various branches and agencies of a company (such as insurance premium payments) to the account of the headquarters of such company and transfers of funds from various customers of a company to the main account of such company, in the amount of (Won)112₩117 billion, ₩115 billion and (Won)117₩117 billion, respectively. Of our branch network as of December 31, 2011,2013, we had eight branches that primarily handled large corporate banking.
The following table sets forth the balances and the percentage of our total corporate lending represented by our small- and medium-sized enterprise business loans and our large corporate business loans as of the dates indicated, estimated based on our internal classifications of corporate borrowers:
| As of December 31, | As of December 31, | |||||||||||||||||||||||||||||||||||||||
| 2010 | 2011 | 2011 | 2012 | 2013 | ||||||||||||||||||||||||||||||||||||
| (in billions of Won, except percentages) | (in billions of Won, except percentages) | |||||||||||||||||||||||||||||||||||||||
Corporate: | ||||||||||||||||||||||||||||||||||||||||
Small- and medium-sized enterprise loans | (Won) | 65,132 | 73.8 | % | (Won) | 68,730 | 70.7 | % | ₩ | 68,730 | 70.7 | % | ₩ | 70,471 | 70.7 | % | ₩ | 71,045 | 70.7 | % | ||||||||||||||||||||
Large corporate loans | 23,143 | 26.2 | 28,509 | 29.3 | 28,509 | 29.3 | 29,212 | 29.3 | 29,489 | 29.3 | ||||||||||||||||||||||||||||||
|
|
|
|
|
|
|
|
|
| |||||||||||||||||||||||||||||||
Total | (Won) | 88,275 | 100.0 | % | (Won) | 97,239 | 100.0 | % | ₩ | 97,239 | 100.0 | % | ₩ | 99,683 | 100.0 | % | ₩ | 100,534 | 100.0 | % | ||||||||||||||||||||
|
|
|
|
|
|
|
|
|
| |||||||||||||||||||||||||||||||
On the deposit-taking side, we currently offer our corporate customers several types of corporate deposits. Our corporate deposit products can be divided into two general categories: (1) demand deposits that have no restrictions on deposits or withdrawals, but which offer a relatively low interest rate; and (2) deposits from which withdrawals are restricted for a period of time, but offer higher interest rates. We also offer installment savings deposits, certificates of deposit and repurchase instruments. We offer varying interest rates on deposit products depending upon the rate of return on our income-earning assets, average funding costs and interest rates offered by other nationwide commercial banks.
The total amount of deposits from our corporate customers amounted to (Won)61,325₩62,449 billion as of December 31, 2011,2013, or 32.2%31.1% of our total deposits.
Small- and Medium-sized Enterprise Banking
Our small- and medium-sized enterprise banking business has traditionally been and will remain one of our core businesses because of both our historical development and our accumulated expertise. We believe that we possess the necessary elements to succeed in the small- and medium-sized enterprise market, including our extensive branch network, our credit rating system for credit approval, our marketing capabilities (which we believe have provided us with significant brand loyalty) and our ability to take advantage of economies of scale.
We use the term “small- and medium-sized enterprises” as defined in the Small and Medium Industry Basic Act and related regulations. Under the Small and Medium Industry Basic Act and related regulations, an enterprise must meet each of the following criteria in order to meet the definition of a small- and medium-sized enterprise: (i) the number of regular employees must be fewer than 1,000, (ii) total assets at the end of the immediately preceding fiscal year must be less than (Won)500₩500 billion, (iii) paid-in capital at the end of the immediately preceding fiscal year must be less than (Won)100₩100 billion, (iv) average annual sales revenue for the most recent three fiscal years must be less than (Won)150₩150 billion, (v) the standards as prescribed by the Presidential Decree that are applicable to the enterprise’s primary business must be met and (vi) the standards of management independence as prescribed by the Presidential Decree must be met.Further,met. Further, beginning in January 2012, a non-profit enterprise with no more than 300 regular employees and annual sales revenue of less than (Won)30₩30 billion that satisfies the requirements prescribed in the Small and Medium Industry Basic Act may also qualify as a small- and medium-sized enterprise.
Industry-wide delinquency ratios for Won-denominated loans to small- and medium-sized enterprises increased in 2011 and further increased in the first quarter of 2012.slightly from 2012 to 2013. Our delinquency ratio for loans to small- and medium-sized enterprises may increase further in the future as a result of, among other things, adverse economic conditions in Korea and globally. See “Item 3D.3.D. Risk Factors—Other risks relating to our business—Difficult conditions in the global financial markets could adversely affect our results of operations and financial condition”condition.” In addition, in light of the deteriorating financial condition and “—liquidity position of small- and medium-sized enterprises in Korea, the Korean government has in recent years introduced measures intended to encourage Korean banks to provide financial support to small- and medium-sized enterprise borrowers. See “Item 3.D. Risk Factors—Risks relating to our small- and medium-sized enterprise loan portfolio—We have significant exposure to small- and medium-sized enterprises, and any financial difficulties experienced by these customers may result in a deterioration of our asset quality and have an adverse impact on us.”
Lending Activities
Our principal loan products for our small- and medium-sized enterprise customers are working capital loans and facilities loans. Working capital loans are provided to finance working capital requirements and include notes discounted and trade financing. Facilities loans are provided to finance the purchase of equipment and the establishment of manufacturing assembly plants. As of December 31, 2011,2013, working capital loans and facilities loans accounted for 67.1%59.9% and 32.9%40.1%, respectively, of our total small- and medium-sized enterprise loans. As of December 31, 2011,2013, we had over 234,500220,000 small- and medium-sized enterprise customers on the lending side.
Loans to small- and medium-sized enterprises may be secured by real estate or deposits or may be unsecured. As of December 31, 2011,2013, secured loans and guaranteed loans accounted for, in the aggregate, 75.3%84.4% of our small- and medium-sized enterprise loans. Among the secured loans, 92.3%95.4% were secured by real estate and 7.7%4.6% were secured by deposits or securities. Working capital loans generally have a maturity of one year, but may be extended on an annual basisfor additional terms of up to one year in length for an aggregate term of five years. Facilities loans have a maximum maturity of 15 years.
When evaluating the extension of working capital loans, we review the corporate customer’s creditworthiness and capability to generate cash. Furthermore, we take personal guarantees and credit guaranty letters from other financial institutions and use time deposits that the borrower has with us as collateral, and may require additional collateral. We receive fees in relation to certain services provided in connection with a loan extension.
The value of any collateral is defined using a formula that takes into account the appraised value of the property, any prior liens or other claims against the property and an adjustment factor based on a number of considerations including, with respect to property, the value of any nearby property sold in a court-supervised auction during the previous five years. We revalue any collateral on a periodic basis (generally every year) or if a trigger event occurs with respect to the loan in question.
We also offer mortgage loans to home builders or developers who build or sell single- or multi-family housing units, principally apartment buildings. Many of these builders and developers are categorized as small- and medium-sized enterprises. We offer a variety of such mortgage loans, including loans to purchase property or finance the construction of housing units and loans to contractors used for working capital purposes. Such mortgage loans subject us to the risk that the housing units will not be sold. As a result, we review the probability of the sale of the housing unit when evaluating the extension of a loan. We also review the borrower’s creditworthiness and the adequacy of the intended use of proceeds. Furthermore, we take a lien on the land on which the housing unit is to be constructed as collateral. If the collateral is not sufficient to cover the loan, we also take a guarantee from the Housing Finance Credit Guarantee Fund as security.
A substantial number of our small- and medium-sized enterprise customers are SOHOs, which we currently define to include sole proprietorships and individual business interests. With respect to SOHOs, we apply credit risk evaluation models, which not only use quantitative analysis related to a customer’s accounts, personal credit and financial information and due amounts but also require our credit officers to perform a qualitative analysis of each potential SOHO customer. With respect to SOHO loans in excess of (Won)1₩1 billion, our credit risk evaluation model also includes a quantitative analysis of the financial statements of the underlying business. We generally lend to SOHOs on a secured basis, although a small portion of our SOHO exposures are unsecured.
Pricing
We establish the price for our corporate loan products based principally on transaction risk, our cost of funding and market considerations. Transaction risk is measured by such factors as the credit rating assigned to a particular borrower, the size of the borrower and the value and type of collateral. Our loans are priced based on the Market Opportunity Rate system, which is a periodic floating rate system that takes into account the current market interest rate. As of December 31, 2011,2013, the Market Opportunity Rate was 3.55%2.65% for three months, 3.62%2.73% for six months and 3.63%2.79% for one year.
While we generally utilize the Market Opportunity Rate system, depending on the price and other terms set by competing banks for similar borrowers, we may adjust the interest rate we charge to compete more effectively with other banks.
Large Corporate Banking
Large corporate customers include all companies that are not small- and medium-sized enterprise customers. Kookmin Bank’s articles of incorporation provide that financial services to large corporate customers must be no
more than 40% of the total amount of our Won-denominated loans. Our business focus with respect to large corporate banking is to selectively increase the proportion of high quality large corporate customers. Specifically, we are carrying out various initiatives to improve our customer relationship with large corporate customers and have been seeking to expand our service offerings to this segment.
Lending Activities
Our principal loan products for our large corporate customers are working capital loans and facilities loans. As of December 31, 2011,2013, working capital loans and facilities loans accounted for 81.2%80.0% and 18.8%20.0%, respectively, of our total large corporate loans. We also offer mortgage loans to large corporate clients who build or sell single- or multi-family housing units, as described above under “—Small- and Medium-sized Enterprise Banking—Lending Activities.”
As of December 31, 2011,2013, secured loans and guaranteed loans accounted for, in the aggregate, 10.0%14.8% of our large corporate loans. Among the secured loans, 73.4%83.4% were secured by real estate and 26.6%16.6% were secured by deposits or securities. Working capital loans generally have a maturity of one year, but aremay be extended on an annual basisfor additional terms ranging from three months to one year in length for an aggregate term of five years. Facilities loans have a maximum maturity of 15 years.
We evaluate creditworthiness and collateral forIn our unsecured lending to large corporate customers, a critical consideration in our policy regarding the extension of such unsecured loans in essentiallyis the same wayborrower’s creditworthiness. We assign each borrower a credit rating based on the judgment of our experts or scores calculated using the appropriate credit rating system, taking into account both financial factors and non-financial factors (such as we do forour perception of a borrower’s reliability, management and operational risk and risk relating to the borrower’s industry). The credit ratings, along with such factors, are key determinants that inform our lending to large corporate customers. Large corporate customers generally have higher credit ratings due to their higher repayment capability compared to other types of borrowers, such as small- and medium-sized enterprise loans. See “—Small-borrowers. In addition, large corporate borrowers generally are affected to a lesser extent than small- and Medium-sized Enterprise Banking—Lending Activities” above.medium-sized enterprise borrowers by fluctuations in the Korean economy and also maintain more sophisticated financial records. As of December 31, 2013, 82.7% of our large corporate customers had credit ratings or BBB- or above according to the internal credit rating system of Kookmin Bank, compared to 38.7% of our small- and medium-sized enterprise customers. A credit rating of BBB- is assigned to customers whose ability to repay the principal and interest on their outstanding loans is determined by us to be generally satisfactory but nonetheless subject to adverse effects under unfavorable economic conditions or during downturns in the business environment. Based on our internal analysis of historical data, we believe that the probability of default for loans extended to large corporate customers with a credit rating of BBB- or above is between 0.00% and 2.26%.
We monitor the credit status of large corporate borrowers and collect information to adjust our ratings appropriately. We also manage and monitor our large corporate customers through a dedicated Corporate Banking Branch and Kookmin Bank’s Large Corporate Business Department. In addition, Kookmin Bank’s Credit Risk Department manages the exposures to each large corporate customer and conducts in-depth analysis of various economic and industry-related risks that are relevant to large corporate customers.
As of December 31, 2011,2013, in terms of our outstanding loan balance, 36.2%32.4% of our large corporate loans was extended to borrowers in the manufacturingfinancial institutions industry, 22.5%29.3% was extended to borrowers in the servicemanufacturing industry and 18.2%20.8% was extended to borrowers in the financial institutionsservice industry.
Pricing
We determine pricing of our large corporate loans in the same way as we determine the pricing of our small- and medium-sized enterprise loans. See “—Small- and Medium-sized Enterprise Banking—Pricing” above. As of December 31, 2011,2013, the Market Opportunity Rate, which is utilized in pricing loans offered by us, was the same for our large corporate loans as for our small- and medium-sized enterprise loans.
Capital Markets Activities and International Banking
Through our capital markets operations, we invest and trade in debt and equity securities and, to a lesser extent, engage in derivatives and asset securitization transactions and make call loans. We also provide investment banking services to corporate customers.
Securities Investment and Trading
We invest in and trade securities for our own account in order to maintain adequate sources of liquidity and to generate interest and dividend income and capital gains. As of December 31, 20102011, 2012 and 2011,2013, our investment portfolio, which consists primarily of held-to-maturity financial assets and available-for-sale financial assets, and our trading portfolio had a combined total carrying amount of (Won)40,926₩42,650 billion, ₩46,962 billion and (Won)42,650₩44,933 billion and represented 15.8%15.4%, 16.4% and 15.4% of our total assets, respectively.
Our trading and investment portfolios consist primarily of Korean treasury securities and debt securities issued by Korean government agencies, local governments or certain government-invested enterprises and debt securities issued by financial institutions. As of December 31, 20102011, 2012 and 2011,2013, we held debt securities with a total carrying amount of (Won)36,571₩37,966 billion, ₩42,285 billion and (Won)37,966₩39,776 billion, respectively, of which:
held-to-maturity debt securities accounted for (Won)13,908₩13,055 billion, ₩12,256 billion and (Won)13,055₩13,017 billion, or 38.0%34.4%, 29.0% and 34.4%32.7%, respectively;
available-for-sale debt securities accounted for (Won)19,126₩19,734 billion, ₩21,737 billion and (Won)19,734₩18,933 billion, or 52.3%52.0%, 51.4% and 52.0%47.6%, respectively; and
debt securities at fair value through profit or loss accounted for (Won)3,537₩5,177 billion, ₩8,292 billion and (Won)5,177₩7,826 billion, or 9.7%13.6%, 19.6% and 13.6%19.7%, respectively.
Of these amounts, debt securities issued by the Korean government and government agencies as of December 31, 20102011, 2012 and 20112013 amounted to:
(Won)6,340₩5,436 billion, ₩4,449 billion and (Won)5,436₩4,357 billion, or 45.6%41.6%, 36.3% and 41.6%33.5%, respectively, of our held-to-maturity debt securities;
(Won)6,741₩5,989 billion, ₩6,256 billion and (Won)5,989₩6,926 billion, or 35.2%30.3%, 28.8% and 30.3%36.6%, respectively, of our available-for-sale debt securities; and
(Won)743₩1,508 billion, ₩2,376 billion and (Won)1,508₩2,085 billion, or 21.0%29.1%, 28.7% and 29.1%26.6%, respectively, of our debt securities at fair value through profit or loss.
From time to time we also purchase equity securities for our securities portfolios. Our equity securities consist primarily of marketable beneficiary certificates and equities listed on the KRX KOSPI Market or the KRX KOSDAQ Market. As of December 31, 20102011, 2012 and 2011:2013:
equity securities in our available-for-sale portfolio had a carrying amount of (Won)3,156₩2,643 billion, ₩2,474 billion and (Won)2,643₩2,899 billion, or 14.2%11.8%, 10.2% and 11.8%13.3% of our available-for-sale portfolio, respectively; and
equity securities in our trading portfolio had a carrying amount of (Won)461₩546 billion, ₩1,035 billion and (Won)546₩1,217 billion, or 11.5%8.6%, 10.8% and 8.6%13.0% of our debt and equity trading portfolio, respectively.
Our trading portfolio also includes derivative instruments. See “—Derivatives Trading.”
The following tables show, as of the dates indicated, the gross unrealized gains and losses on available-for-sale and held-to-maturity financial assets within our investment portfolio, and the amortized cost and fair value of the portfolio by type of financial asset:
| As of December 31, 2010 | As of December 31, 2011 | |||||||||||||||||||||||||||||||
| Amortized Cost | Gross Unrealized Gain | Gross Unrealized Loss | Fair Value | Amortized Cost | Gross Unrealized Gain | Gross Unrealized Loss | Fair Value | |||||||||||||||||||||||||
| (in billions of Won) | (in billions of Won) | |||||||||||||||||||||||||||||||
Available-for-sale financial assets: | ||||||||||||||||||||||||||||||||
Debt securities | ||||||||||||||||||||||||||||||||
Korean treasury securities and government agencies | (Won) | 6,649 | (Won) | 96 | (Won) | 4 | (Won) | 6,741 | ₩ | 5,928 | ₩ | 62 | ₩ | 1 | ₩ | 5,989 | ||||||||||||||||
Financial institutions(1) | 5,735 | 29 | 5 | 5,759 | ||||||||||||||||||||||||||||
Corporate(2) | 4,501 | 90 | 5 | 4,586 | ||||||||||||||||||||||||||||
Financial institutions (1) | 6,413 | 20 | 1 | 6,432 | ||||||||||||||||||||||||||||
Corporate (2) | 5,277 | 99 | 1 | 5,375 | ||||||||||||||||||||||||||||
Asset-backed securities | 1,822 | 9 | — | 1,831 | 1,762 | 1 | 6 | 1,757 | ||||||||||||||||||||||||
Others | 208 | 1 | — | 209 | 180 | 1 | — | 181 | ||||||||||||||||||||||||
|
|
|
|
|
|
|
| |||||||||||||||||||||||||
Subtotal | 18,915 | 225 | 14 | 19,126 | 19,560 | 183 | 9 | 19,734 | ||||||||||||||||||||||||
Equity securities | 2,254 | 904 | 2 | �� | 3,156 | 2,193 | 616 | 166 | 2,643 | |||||||||||||||||||||||
|
|
|
|
|
|
|
| |||||||||||||||||||||||||
Total available-for-sale financial assets | (Won) | 21,169 | (Won) | 1,129 | (Won) | 16 | (Won) | 22,282 | ₩ | 21,753 | ₩ | 799 | ₩ | 175 | ₩ | 22,377 | ||||||||||||||||
|
|
|
|
|
|
|
| |||||||||||||||||||||||||
Held-to-maturity financial assets: | ||||||||||||||||||||||||||||||||
Korean treasury securities and government agencies | (Won) | 6,340 | (Won) | 191 | (Won) | 4 | (Won) | 6,527 | ₩ | 5,436 | ₩ | 240 | ₩ | — | ₩ | 5,676 | ||||||||||||||||
Financial institutions(3) | 1,216 | 45 | — | 1,261 | ||||||||||||||||||||||||||||
Corporate(4) | 5,960 | 200 | 5 | 6,155 | ||||||||||||||||||||||||||||
Financial institutions (3) | 1,125 | 30 | — | 1,155 | ||||||||||||||||||||||||||||
Corporate (4) | 6,155 | 235 | — | 6,390 | ||||||||||||||||||||||||||||
Asset-backed securities | 392 | 6 | 1 | 397 | 339 | 2 | — | 341 | ||||||||||||||||||||||||
|
|
|
|
|
|
|
| |||||||||||||||||||||||||
Total held-to-maturity financial assets | (Won) | 13,908 | (Won) | 442 | (Won) | 10 | (Won) | 14,340 | ₩ | 13,055 | ₩ | 507 | ₩ | — | ₩ | 13,562 | ||||||||||||||||
|
|
|
|
|
|
|
| |||||||||||||||||||||||||
| As of December 31, 2012 | ||||||||||||||||
| Amortized Cost | Gross Unrealized Gain | Gross Unrealized Loss | Fair Value | |||||||||||||
| (in billions of Won) | ||||||||||||||||
Available-for-sale financial assets: | ||||||||||||||||
Debt securities | ||||||||||||||||
Korean treasury securities and government agencies | ₩ | 6,171 | ₩ | 87 | ₩ | 2 | ₩ | 6,256 | ||||||||
Financial institutions (1) | 7,436 | 40 | — | 7,476 | ||||||||||||
Corporate (2) | 6,470 | 139 | 3 | 6,606 | ||||||||||||
Asset-backed securities | 1,396 | 4 | 1 | 1,399 | ||||||||||||
Others | — | — | — | — | ||||||||||||
|
|
|
|
|
|
|
| |||||||||
Subtotal | 21,473 | 270 | 6 | 21,737 | ||||||||||||
Equity securities | 1,825 | 659 | 10 | 2,474 | ||||||||||||
|
|
|
|
|
|
|
| |||||||||
Total available-for-sale financial assets | ₩ | 23,298 | ₩ | 929 | ₩ | 16 | ₩ | 24,211 | ||||||||
|
|
|
|
|
|
|
| |||||||||
Held-to-maturity financial assets: | ||||||||||||||||
Korean treasury securities and government agencies | ₩ | 4,449 | ₩ | 272 | ₩ | 1 | ₩ | 4,720 | ||||||||
Financial institutions (3) | 1,316 | 22 | — | 1,338 | ||||||||||||
Corporate (4) | 6,213 | 285 | — | 6,498 | ||||||||||||
Asset-backed securities | 278 | 3 | — | 281 | ||||||||||||
|
|
|
|
|
|
|
| |||||||||
Total held-to-maturity financial assets | ₩ | 12,256 | ₩ | 582 | ₩ | 1 | ₩ | 12,837 | ||||||||
|
|
|
|
|
|
|
| |||||||||
| As of December 31, 2011 | As of December 31, 2013 | |||||||||||||||||||||||||||||||
| Amortized Cost | Gross Unrealized Gain | Gross Unrealized Loss | Fair Value | Amortized Cost | Gross Unrealized Gain | Gross Unrealized Loss | Fair Value | |||||||||||||||||||||||||
| (in billions of Won) | (in billions of Won) | |||||||||||||||||||||||||||||||
Available-for-sale financial assets: | ||||||||||||||||||||||||||||||||
Debt securities | ||||||||||||||||||||||||||||||||
Korean treasury securities and government agencies | (Won) | 5,928 | (Won) | 62 | (Won) | 1 | (Won) | 5,989 | ₩ | 6,910 | ₩ | 30 | ₩ | 14 | ₩ | 6,926 | ||||||||||||||||
Financial institutions(1) | 6,413 | 20 | 1 | 6,432 | ||||||||||||||||||||||||||||
Corporate(2) | 5,277 | 99 | 1 | 5,375 | ||||||||||||||||||||||||||||
Financial institutions (1) | 5,771 | 15 | 4 | 5,782 | ||||||||||||||||||||||||||||
Corporate (2) | 4,948 | 57 | 7 | 4,998 | ||||||||||||||||||||||||||||
Asset-backed securities | 1,762 | 1 | 6 | 1,757 | 1,208 | 2 | 2 | 1,208 | ||||||||||||||||||||||||
Others | 180 | 1 | — | 181 | 19 | — | — | 19 | ||||||||||||||||||||||||
|
|
|
|
|
|
|
| |||||||||||||||||||||||||
Subtotal | 19,560 | 183 | 9 | 19,734 | 18,856 | 104 | 27 | 18,933 | ||||||||||||||||||||||||
Equity securities | 2,193 | 616 | 166 | 2,643 | 2,092 | 823 | 16 | 2,899 | ||||||||||||||||||||||||
|
|
|
|
|
|
|
| |||||||||||||||||||||||||
Total available-for-sale financial assets | (Won) | 21,753 | (Won) | 799 | (Won) | 175 | (Won) | 22,377 | ₩ | 20,948 | ₩ | 927 | ₩ | 43 | ₩ | 21,832 | ||||||||||||||||
|
|
|
|
|
|
|
| |||||||||||||||||||||||||
Held-to-maturity financial assets: | ||||||||||||||||||||||||||||||||
Korean treasury securities and government agencies | (Won) | 5,436 | (Won) | 240 | (Won) | — | (Won) | 5,676 | ₩ | 4,357 | ₩ | 180 | ₩ | — | ₩ | 4,537 | ||||||||||||||||
Financial institutions(3) | 1,125 | 30 | — | 1,155 | ||||||||||||||||||||||||||||
Corporate(4) | 6,155 | 235 | — | 6,390 | ||||||||||||||||||||||||||||
Financial institutions (3) | 893 | 9 | — | 902 | ||||||||||||||||||||||||||||
Corporate (4) | 7,400 | 180 | — | 7,580 | ||||||||||||||||||||||||||||
Asset-backed securities | 339 | 2 | — | 341 | 367 | 1 | — | 368 | ||||||||||||||||||||||||
|
|
|
|
|
|
|
| |||||||||||||||||||||||||
Total held-to-maturity financial assets | (Won) | 13,055 | (Won) | 507 | (Won) | — | (Won) | 13,562 | ₩ | 13,017 | ₩ | 370 | ₩ | — | ₩ | 13,387 | ||||||||||||||||
|
|
|
|
|
|
|
| |||||||||||||||||||||||||
| (1) | Includes debt securities issued by the Bank of Korea, Korea Development Bank, Korea Finance Corporation and Industrial Bank of Korea in the aggregate amount of |
| (2) | Includes debt securities issued by Korea Electric Power Corporation, which is controlled by the Korean government, in the amount of |
| (3) | Includes debt securities issued by the Bank of Korea, Korea Development Bank, Korea Finance Corporation and Industrial Bank of Korea in the aggregate amount of |
| (4) | Includes debt securities issued by Korea Electric Power Corporation, which is controlled by the Korean government, in the amount of |
Derivatives Trading
Until the full-scale launch of our derivatives operations in mid-1999, we had been engaged in limited volumes of derivatives trading, mostly on behalf of our customers. Since then, our trading volume significantly increased to (Won)163,959₩174,358 billion in 20102011 and to (Won)174,358₩195,879 billion in 2011.2012 but decreased slightly to ₩194,307 billion in 2013. Our net trading revenue from derivatives for the year ended December 31, 20102011, 2012 and 20112013 was (Won)570₩906 billion, ₩456 billion and (Won)906₩544 billion, respectively.
We provide and trade a range of derivatives products, including:
Won interest rate swaps, relating to Won interest rate risks;
cross-currency swaps, forwards and options relating to foreign exchange risks; and
stock price index options linked to the KOSPI index.
Our derivatives operations focus on addressing the needs of our corporate clients to hedge their risk exposure and the need to hedge our risk exposure that results from such client contracts. We also engage in derivatives trading activities to hedge the interest rate and foreign currency risk exposures that arise from our own assets and liabilities. In addition, we engage in proprietary trading of derivatives within our regulated open position limits.
The following shows the estimated fair value of our derivatives as of December 31, 20102011, 2012 and 2011:2013:
| As of December 31, | As of December 31, | |||||||||||||||||||||||||||||||||||||||
| 2010 | 2011 | 2011 | 2012 | 2013 | ||||||||||||||||||||||||||||||||||||
| Estimated Fair Value Assets | Estimated Fair Value Liabilities | Estimated Fair Value Assets | Estimated Fair Value Liabilities | Estimated Fair Value Assets | Estimated Fair Value Liabilities | Estimated Fair Value Assets | Estimated Fair Value Liabilities | Estimated Fair Value Assets | Estimated Fair Value Liabilities | |||||||||||||||||||||||||||||||
| (in billions of Won) | (in billions of Won) | |||||||||||||||||||||||||||||||||||||||
Foreign exchange derivatives(1) | (Won) | 1,821 | (Won) | 1,330 | (Won) | 1,450 | (Won) | 1,087 | ₩ | 1,450 | ₩ | 1,087 | ₩ | 846 | ₩ | 943 | ₩ | 938 | ₩ | 996 | ||||||||||||||||||||
Interest rate derivatives (1) | 726 | 735 | 796 | 737 | 796 | 737 | 1,100 | 1,040 | 766 | 731 | ||||||||||||||||||||||||||||||
Equity derivatives | 43 | 143 | 200 | 220 | 200 | 220 | 74 | 68 | 47 | 50 | ||||||||||||||||||||||||||||||
Credit derivatives | 2 | — | — | — | — | — | — | — | — | — | ||||||||||||||||||||||||||||||
Commodity derivatives | — | — | 1 | — | 1 | — | — | — | — | — | ||||||||||||||||||||||||||||||
Others(1) | 3 | 28 | 2 | 15 | 2 | 15 | 71 | 4 | 68 | 18 | ||||||||||||||||||||||||||||||
|
|
|
|
|
|
|
|
|
| |||||||||||||||||||||||||||||||
Total | (Won) | 2,595 | (Won) | 2,236 | (Won) | 2,449 | (Won) | 2,059 | ₩ | 2,449 | ₩ | 2,059 | ₩ | 2,091 | ₩ | 2,055 | ₩ | 1,819 | ₩ | 1,795 | ||||||||||||||||||||
|
|
|
|
|
|
|
|
|
| |||||||||||||||||||||||||||||||
| (1) | Includes those for trading purposes and hedging purposes. |
The following table shows certain information related to our derivatives designated atas fair value hedges for the years ended December 31, 20102011, 2012 and 2011:2013:
| Year Ended December 31, | Year Ended December 31, | |||||||||||||||||||||||||||||||||||||||||||||||||||||||||||
| 2010 | 2011 | 2011 | 2012 | 2013 | ||||||||||||||||||||||||||||||||||||||||||||||||||||||||
| Derivatives | Hedged Items | Hedge Ineffectiveness | Derivatives | Hedged Items | Hedge Ineffectiveness | Derivatives | Hedged Items | Hedge Ineffectiveness | Derivatives | Hedged Items | Hedge Ineffectiveness | Derivatives | Hedged Items | Hedge Ineffectiveness | ||||||||||||||||||||||||||||||||||||||||||||||
| (in billions of Won) | (in billions of Won) | |||||||||||||||||||||||||||||||||||||||||||||||||||||||||||
Foreign exchange derivatives | (Won) | (26 | ) | (Won) | 28 | (Won) | 2 | (Won) | 67 | (Won) | (48 | ) | (Won) | 19 | ₩ | 67 | ₩ | (48 | ) | ₩ | 19 | ₩ | (58 | ) | ₩ | 74 | ₩ | 16 | ₩ | (11 | ) | ₩ | 36 | ₩ | 25 | |||||||||||||||||||||||||
Interest rate derivatives | 121 | (107 | ) | 14 | 23 | (19 | ) | 4 | 23 | (19 | ) | 4 | 32 | (25 | ) | 7 | (29 | ) | 37 | 8 | ||||||||||||||||||||||||||||||||||||||||
Other derivatives | 8 | (8 | ) | — | 19 | (18 | ) | 1 | 19 | (18 | ) | 1 | 11 | (11 | ) | — | (8 | ) | 8 | — | ||||||||||||||||||||||||||||||||||||||||
|
|
|
|
|
|
|
|
|
|
|
|
|
|
| ||||||||||||||||||||||||||||||||||||||||||||||
Total | (Won) | 103 | (Won) | (87 | ) | (Won) | 16 | (Won) | 109 | (Won) | (85 | ) | (Won) | 24 | ₩ | 109 | ₩ | (85 | ) | ₩ | 24 | ₩ | (15 | ) | ₩ | 38 | ₩ | 23 | ₩ | (48 | ) | ₩ | 81 | ₩ | 33 | |||||||||||||||||||||||||
|
|
|
|
|
|
|
|
|
|
|
|
|
|
| ||||||||||||||||||||||||||||||||||||||||||||||
| The following table shows certain information related to our derivatives designated at cash flow hedges for the years ended December 31, 2010 and 2011: | ||||||||||||||||||||||||||||||||||||||||||||||||||||||||||||
| Year Ended December 31, | ||||||||||||||||||||||||||||||||||||||||||||||||||||||||||||
| 2010 | 2011 | |||||||||||||||||||||||||||||||||||||||||||||||||||||||||||
| Derivatives | Effective Portion | Ineffective Portion | Derivatives | Effective Portion | Ineffective Portion | |||||||||||||||||||||||||||||||||||||||||||||||||||||||
| (in billions of Won) | ||||||||||||||||||||||||||||||||||||||||||||||||||||||||||||
Foreign exchange derivatives | (Won) | — | (Won) | — | (Won) | — | (Won) | 23 | (Won) | 23 | (Won) | — | ||||||||||||||||||||||||||||||||||||||||||||||||
Interest rate derivatives | — | — | — | (1 | ) | (1 | ) | — | ||||||||||||||||||||||||||||||||||||||||||||||||||||
|
|
|
|
|
| |||||||||||||||||||||||||||||||||||||||||||||||||||||||
Total | (Won) | — | (Won) | — | (Won) | — | (Won) | 22 | (Won) | 22 | (Won) | — | ||||||||||||||||||||||||||||||||||||||||||||||||
|
|
|
|
|
| |||||||||||||||||||||||||||||||||||||||||||||||||||||||
The following table shows certain information related to our derivatives designated as cash flow hedges for the years ended December 31, 2011, 2012 and 2013:
| Year Ended December 31, | ||||||||||||||||||||||||||||||||||||
| 2011 | 2012 | 2013 | ||||||||||||||||||||||||||||||||||
| Derivatives | Effective Portion | Ineffective Portion | Derivatives | Effective Portion | Ineffective Portion | Derivatives | Effective Portion | Ineffective Portion | ||||||||||||||||||||||||||||
| (in billions of Won) | ||||||||||||||||||||||||||||||||||||
Foreign exchange derivatives | ₩ | 23 | ₩ | 23 | ₩ | — | ₩ | (22 | ) | ₩ | (22 | ) | ₩ | — | ₩ | (5 | ) | ₩ | (5 | ) | ₩ | — | ||||||||||||||
Interest rate derivatives | (1 | ) | (1 | ) | — | (5 | ) | (5 | ) | — | 2 | 2 | — | |||||||||||||||||||||||
|
|
|
|
|
|
|
|
|
|
|
|
|
|
|
|
|
| |||||||||||||||||||
Total | ₩ | 22 | ₩ | 22 | ₩ | — | ₩ | (27 | ) | ₩ | (27 | ) | ₩ | — | ₩ | (3 | ) | ₩ | (3 | ) | ₩ | — | ||||||||||||||
|
|
|
|
|
|
|
|
|
|
|
|
|
|
|
|
|
| |||||||||||||||||||
Asset Securitization Transactions
We are active in the Korean asset-backed securities market. Based on our diverse experience with respect to product development and management capabilities relating to asset securitization, we offer customers a wide
range of financial products and participate in various asset securitization transactions, including through our subsidiary KB Investment & Securities, to reinforce our position as a leading financial services provider with respect to the asset securitization market. We were involved in asset securitization transactions with an initial aggregate issue amount of (Won)1,858₩1,380 billion in 2010 and (Won)1,3802011, ₩5,040 billion in 2011,2012 and ₩7,296 billion in 2013, all of which were public offerings of asset-backed securities. Most of these securities were sold to institutional investors through Korean securities houses.
Call Loans
We make call loans and borrow call money in the short-term money market. Call loans are defined as short-term lending among banks and financial institutions either in Won or in foreign currencies with maturities of 90 days or less. Typically, call loans have maturities of one day. As of December 31, 2011,2013, we had made call loans of (Won)3,682₩3,206 billion and borrowed call money of (Won)1,141₩2,648 billion, compared to (Won)921₩2,534 billion and (Won)605₩2,597 billion, respectively, as of December 31, 2010.2012, and ₩3,682 billion and ₩1,141 billion, respectively, as of December 31, 2011.
Investment Banking
We have focused on selectively expanding our investment banking activities in order to increase our fee income and diversify our revenue base. The main focus of our investment banking operations is project finance and financial advisory services. Our principal investment banking services include:
project finance and financial advisory services for social overhead capital projects such as highway, port, power, water and sewage projects;
financing and financial advisory services for real estate development projects;
structured finance; and
financing for mergers and acquisitions.
In 2011,2013, we generated investment banking revenue of (Won)578₩151 billion, consisting of (Won)49₩24 billion of interest income and (Won)529₩127 billion of fee income.
In March 2008, we acquired 95.8% of the issued and outstanding common stock of Hannuri Investment & Securities Co., Ltd. for (Won)266.3 billion, which was renamed KB Investment & Securities Co., Ltd. and became our subsidiary. We believe that the acquisition of KB Investment & Securities has provided us with opportunities to leverage our existing base of small- and medium-sized enterprise and large corporate customers to cross-sell investment banking services, particularly under our financial holding company structure, and we are continuing our efforts to increase our fee income and diversify our investment banking operations by utilizing such opportunities.
International Banking
We engage in various international banking activities, including foreign exchange services and derivatives dealing, import and export-related services, offshore lending, syndicated loans and foreign currency securities investment. These services are provided primarily to our domestic customers and overseas subsidiaries and affiliates of Korean corporations. We also raise foreign currency funds through our international banking operations.
The table below sets forth certain information regarding our foreign currency assets and borrowings:
| As of December 31, | As of December 31, | |||||||||||||||||||
| 2010 | 2011 | 2011 | 2012 | 2013 | ||||||||||||||||
| (in millions of US$) | (in millions of US$) | |||||||||||||||||||
Total foreign currency assets | US$ | 13,185 | US$ | 16,539 | US$ | 16,539 | US$ | 14,459 | US$ | 14,989 | ||||||||||
Foreign currency borrowings: | ||||||||||||||||||||
Debts | 5,874 | 8,307 | 8,307 | 7,087 | 6,637 | |||||||||||||||
Debentures | 3,439 | 3,409 | 3,409 | 2,974 | 3,123 | |||||||||||||||
|
|
|
|
| ||||||||||||||||
Total borrowings | US$ | 9,313 | US$ | 11,716 | US$ | 11,716 | US$ | 10,061 | US$ | 9,760 | ||||||||||
|
|
|
|
| ||||||||||||||||
The table below sets forth our overseas subsidiaries, branches and representative office currently in operation as of December 31, 2011:2013:
Business Unit(1) | Location | |
Subsidiaries | ||
Kookmin Bank Cambodia PLC | Cambodia | |
Kookmin Bank (China) Ltd. | China | |
Kookmin Bank Hong Kong Ltd. | Hong Kong | |
Kookmin Bank International Ltd. | United Kingdom | |
| ||
Branches | ||
Kookmin Bank (China) Ltd., Beijing Branch | China | |
Kookmin Bank (China) Ltd., Guangzhou Branch | China | |
Kookmin Bank (China) Ltd., Harbin Branch | China | |
Kookmin Bank (China) Ltd., Suzhou Branch | China | |
Kookmin Bank, Osaka Branch | Japan | |
Kookmin Bank, Tokyo Branch | Japan | |
Kookmin Bank, Auckland Branch | New Zealand | |
Kookmin Bank, New York Branch | United States | |
Kookmin Bank, | ||
Kookmin Bank | ||
| ||
| ||
Representative Office | ||
Kookmin Bank, Mumbai Representative Office | India | |
Kookmin Bank, Yangon Representative Office | Myanmar | |
Kookmin Bank, Hanoi Representative Office | Vietnam |
| (1) | Does not include subsidiaries and branches in liquidation or dissolution. |
Our overseas branches and subsidiaries principally provide Korean companies and nationals in overseas markets with trade financing, local currency funding and foreign exchange services, in conjunction with the operations of our headquarters.
In March 2008, we entered into agreements to acquire shares of JSC Bank CenterCredit, a Kazakhstan bank, and acquired an initial equity stake of 29,972,840 common shares (equal to 23.0% of the then-outstanding voting shares) for approximately (Won)528₩528 billion in August 2008. Pursuant to the terms of such agreements, we acquired an aggregate of 14,163,836 additional common shares of JSC Bank CenterCredit in November and December 2008. In addition, in September 2009, we entered into agreements with International Finance Corporation and certain shareholders of JSC Bank CenterCredit pursuant to which we acquired 3,886,574 additional common shares and 36,561,465 non-voting convertible preferred shares of JSC Bank CenterCredit in January and February 2010. As of December 31, 2011,2013, we held 29.6% of the outstanding common shares of JSC Bank CenterCredit. Our investment in JSC Bank CenterCredit is accounted for under the equity method from the initial acquisition date and we applied the purchase method to account for each acquisition.
In May 2009, we acquired 132,600 common shares of Khmer Union Bank, a Cambodian bank, for approximately (Won)10₩10 billion. As a result, we acquired 51% of the voting rights in Khmer Union Bank, which was renamed Kookmin Bank Cambodia PLC. In December 2010, July 2012 and June 2013, we acquired an additional 37,602 common shares, 125,592 common shares and 24,206 common shares of Kookmin Bank Cambodia PLC.PLC, respectively. As of December 31, 2011,2013, we held 53.2%100.0% of the outstanding common shares of Kookmin Bank Cambodia PLC. We applied the purchase method to account for the initial acquisition of Kookmin Bank Cambodia PLC in May 2009. The subsequent acquisitionacquisitions in December 2010, wasJuly 2012 and June 2013 were accounted for as an equity transaction.transactions.
Trustee and Custodian Services Relating to Investment Trusts and Other Functions
We act as a trustee for 5864 financial investment companies with a collective investment license, which invest in investment assets using funds raised by the sale of beneficiary certificates of investment trusts to investors. We also act as custodian for 125155 financial institutions and as fund administrator for 6246 financial institutions with respect to various investments, as well as acting as settlement agent in connection with such services. We receive a fee for acting in these capacities and generally perform the following functions:
holding assets for the benefit of the investment trusts or institutional investors;
receiving and making payments in respect of such investments;
acting as settlement agent in respect of such investments on behalf of the investment trust or institutional investors, in the domestic and overseas markets;
providing reports on assets held in custody;
providing certain foreign exchange services for overseas investment and foreign investors; and
providing fund-related administration and accounting services.
For the year ended December 31, 2011,2013, our fee income from our trustee and custodian services was (Won)24₩23 billion and revenue collected as a result of administration of the underlying investments was (Won)5₩6 billion.
Other Businesses
Trust Account Management Services
Money Trust Management Services
We provide trust account management services for both specified money trusts and unspecified money trusts, which are trusts the assets of which we generally have broad discretion in investing.trusts. We receive fees for our trust account management services consisting of basic fees that are based upon a percentage of either the net asset value of the assets or the principal under management and, for certain types of trust account operations, performance fees that are based upon the performance of the trust account operations. In 2011,2013, our basic fees ranged from 0.1% to 2.0% of total assets under management depending on the type of trust account. We also charge performance fees with respect to certain types of trust account products. We receive penalty payments when customers terminate their trust accounts prior to the original contract maturity.
We currently provide trust account management services for 20 types of money trusts. The money trusts we manage are generally trusts with a fixed maturity. Approximately 10%7.4% of our money trusts also provide periodic payments of dividends which are added to the assets held in such trusts and not distributed.
Under Korean law, the assets of our trust accounts are segregated from our banking account assets and are not available to satisfy the claims of any of our potential creditors. We are, however, permitted to deposit surplus funds generated by trust assets into our banking accounts.
As of December 31, 2011,2013, the total balance of our money trusts was (Won)18,196₩23,912 billion (as calculated in accordance with Statement of Korea Accounting Standard No. 5004,Trust Accounts, and the Enforcement Regulations of Financial Investment Services under the Financial Investment Services and Capital Markets Act, which we refer to as an “SKAS basis”). As for unspecified money trust accounts, we have investment discretion over all money trusts, which are pooled and managed jointly for each type of trust account. Specified money trust accounts are established on behalf of individual customers who direct our investment of trust assets.
The following table shows the balances of our money trusts by type as of the dates indicated. Under IFRS, commencing in 2013, we consolidate trust accounts for which we guarantee both the repayment of the principal amount and a fixed rate of interest while we do not consolidate thoseas well as trust accounts for which we guarantee only the repayment of the principal amount.
| As of December 31, | As of December 31, | |||||||||||||||||||
| 2010 | 2011 | 2011 | 2012 | 2013 | ||||||||||||||||
| (in billions of Won) | (in billions of Won) | |||||||||||||||||||
Principal and interest guaranteed trusts (1) | (Won) | 0.2 | (Won) | 0.2 | ₩ | 0.2 | ₩ | 0.2 | ₩ | 0.2 | ||||||||||
Principal guaranteed trusts (1) | 2,954 | 2,892 | 2,892 | 2,919 | 3,070 | |||||||||||||||
Performance trusts (1)(2) | 10,571 | 15,304 | 15,304 | 18,066 | 20,842 | |||||||||||||||
|
|
|
|
| ||||||||||||||||
Total | (Won) | 13,525 | (Won) | 18,196 | ₩ | 18,196 | ₩ | 20,985 | ₩ | 23,912 | ||||||||||
|
|
|
|
| ||||||||||||||||
| (1) | Calculated on an SKAS basis. |
| (2) | Trusts which are primarily non-guaranteed. |
The balance of our money trusts increased 34.5%31.4% between December 31, 20102011 and December 31, 2011.2013. As of December 31, 2011,2013, the trust assets we managed consisted principally of securities investments and loans from the trust accounts. As of December 31, 2011,2013, on an SKAS basis, our trust accounts had invested in securities in the aggregate amount of (Won)11,123₩11,686 billion, of which (Won)9,554₩10,119 billion was debt securities and derivative-linked securities. Securities investments consist of government-related debt securities, corporate debt securities, including bonds and commercial paper, equity securities, derivative-linked securities and other securities. Loans made by our trust account operations are similar in type to the loans made by our bank account operations. As of December 31, 2011,2013, on an SKAS basis, our trust accounts had made loans in the principal amount of (Won)216₩160 billion (excluding loans from the trust accounts to our banking accounts of (Won)870₩1,396 billion), which accounted for 1.1%0.7% of our money trust assets. Loans by our money trusts are subject to the same credit approval process as loans from our banking accounts. As of December 31, 2011,2013, substantially all loans from our money trust accounts were collateralized or guaranteed.
Our money trust accounts also invest, to a lesser extent, in equity securities, including beneficiary certificates issued by financial investment companies with a collective investment license. On an SKAS basis, as of December 31, 2011,2013, equity securities in our money trust accounts amounted to (Won)1,569₩1,567 billion, which accounted for 8.4%6.4% of our total money trust assets. Of this amount, (Won)1,530₩1,522 billion was from specified money trusts and (Won)39₩45 billion was from unspecified money trusts.
We continue to offer pension-type money trusts that provide a guarantee of the principal amount of the investment. On an SKAS basis, as of December 31, 2011,2013, the balance of the money trusts for which we guaranteed the principal was (Won)2,892₩3,070 billion.
If the income from a money trust for which we provide a guarantee is less than the amount of the payments we have guaranteed, we will need to pay the amount of the shortfall with funds from special reserves maintained with respect to trust accounts followed by basic fees from that money trust and funds from our general banking operations. In 20102011, 2012 and 2011,2013, we made no payment from our banking accounts to cover shortfalls in our guaranteed trusts. On an SKAS basis, we derived trust fees with regard to trust account management services (including those fees related to property trust management services) of (Won)103₩126 billion in 2010 and (Won)1222011, ₩136 billion in 2011.2012 and ₩131 billion in 2013.
Property Trust Management Services
We also offer property trust management services, where we manage non-cash assets in return for a fee. Non-cash assets include mostly securities, but can also include other liquid receivables and real estate. Under these arrangements, we render custodial services for the property in question and collect fee income in return.
In 2011,2013, our property trust fees ranged from 0.001% to 0.3% of total assets under management depending on the type of trust accounts. On an SKAS basis, as of December 31, 2011,2013, the aggregate balance of our property trusts decreasedincreased to (Won)1,292₩1,377 billion, compared to (Won)2,646₩1,171 billion as of December 2012 and ₩1,354 billion as of December 31, 2010.2011.
Under IFRS, the property trusts are not consolidated within our financial statements.
Investment Trust Management
Through KB Asset Management, we offer investment trust products to customers and manage the funds invested by them in investment trusts. In September 2008, in connection with the “comprehensive stock transfer” under Korean law pursuant to which we were established, ING Insurance International B.V., which previously held a 20% equity interest in KB Asset Management, transferred all of its shares of KB Asset Management common stock to us and in return received shares of our common stock. Following such stock transfer, KB Asset Management became our wholly-owned subsidiary. As of December 31, 2011,2013, KB Asset Management had (Won)20,736₩25,805 billion of assets under management.
Management of the National Housing Fund
Until February 2008, we acted as one of the managers of the National Housing Fund. The National Housing Fund is a government fund that provides financial support to low-income households in Korea by providing mortgage financing and construction loans for projects to build small-sized housing. The operations of the National Housing Fund include providing and managing National Housing Fund loans, issuing National Housing Fund bonds and collecting subscription savings deposits.
In February 2008,2013, the Ministry of Land, Infrastructure and Transport (formerly the Ministry of Land, Transport and Maritime Affairs (formerlyAffairs) designated us as one of the Ministrymanagers of Construction and Transportation) designated several financial institutions to manage the National Housing Fund, butFund. During the five years preceding such designation, we chose not to participate in the bidding process due to the low fees involved. As a result, we are no longerbecome a designated manager of the National Housing Fund and currently only managemanaged pre-existing Fund accounts.Inaccounts. In return for managing such pre-existing Fund accounts, we receivereceived quarterly fund management fees, calculated based on activity levels for the relevant quarter. In 2011,2013, we received total fees of (Won)172₩28 billion for managing the National Housing Fund, compared to ₩28 billion in 2012 and ₩172 billion in 2011 (of which (Won)137₩137 billion related to accrued but previously unpaid fees for the period from January 2007 to June 2010), compared to (Won)42 billion in 2010..
The financial accounting for the National Housing Fund is entirely separate from our financial accounting, and the non-performing loans and loan losses of the National Housing Fund, in general, do not impact our financial condition. Regulations and guidelines for managing the National Housing Fund are issued by the Minister of Land, TransportInfrastructure and Maritime AffairsTransport pursuant to the Housing Act.
Bancassurance
The Korean government’s liberalization of the bancassurance market in Korea has allowed us to offer insurance products of other institutions since September 2003. We currently market a wide range of bancassurance products and hope to develop additional fee-based revenues by expanding our offering of these products.
Currently, our bancassurance business has alliances with 1617 life insurance companies (including our subsidiary, KB Life Insurance) and nine non-life insurance companies and offers 6166 different products through our branch network. These products are composed of 3943 types of life insurance policies such as annuities, savings insurance and variable life insurance, and 2223 types of non-life insurance products. In 2011,2013, our commission income from our bancassurance business amounted to (Won)163₩135 billion.
Distribution Channels
Banking Branch Network
As of December 31, 2011,2013, Kookmin Bank operated a network of 1,1651,207 branches and sub-branches in Korea, which was one of the largest branch networks among Korean commercial banks. An extensive branch network is
important to attracting and maintaining retail customers, who use branches extensively and value convenience. We believe that our extensive branch network in Korea and retail customer base provide us with a source of stable and relatively low cost funding. Approximately 37%36.7% of our branches and sub-branches are located in Seoul, and approximately 24%23.4% of our branches are located in the six next largest cities. The following table presents the geographical distribution of our branch network in Korea as of December 31, 2011:2013:
Area | Number of Branches | Percentage | ||||||
Seoul | 436 | 37.4 | % | |||||
Six largest cities (other than Seoul) | 274 | 23.5 | ||||||
Other | 455 | 39.1 | ||||||
|
|
|
| |||||
Total | 1,165 | 100.0 | % | |||||
|
|
|
| |||||
Area Seoul Six largest cities (other than Seoul) Other Total Number of
Branches Percentage 443 36.7 % 283 23.4 481 39.9 1,207 100.0 %
In addition, we have continued to implement the specialization of our branch functions. Of our branch network as of December 31, 2011,2013, we had eight branches that primarily handled large corporate banking.
In order to support our branch network, we have established an extensive network of ATMs, which are located in branches and in unmanned outlets known as “autobanks.” As of December 31, 2011,2013, we had 9,5139,490 ATMs.
We have actively promoted the use of these distribution outlets in order to provide convenient service to customers, as well as to maximize the marketing and sales functions at the branch level, reduce employee costs and improve profitability. The following table sets forth information, for the periods indicated, regarding the number of transactions and the fee revenue of our ATMs:
| For the Year Ended December 31, | For the Year Ended December 31, | |||||||||||||||||||
| 2010 | 2011 | 2011 | 2012 | 2013 | ||||||||||||||||
Number of transactions (millions) | 611 | 688 | 688 | 640 | 606 | |||||||||||||||
Fee revenue (in billions of Won) | (Won) | 76 | (Won) | 74 | ₩ | 74 | ₩ | 58 | ₩ | 56 | ||||||||||
Other Distribution Channels
The following table sets forth information, for the periods indicated, on the number of users and transactions and the fee revenue of the other distribution channels for our retail and corporate banking customers, which are discussed below:
| For the Year Ended December 31, | For the Year Ended December 31, | |||||||||||||||||||
| 2010 | 2011 | 2011 | 2012 | 2013 | ||||||||||||||||
Internet banking: | ||||||||||||||||||||
Number of users (1) | 10,924,849 | 12,262,689 | 12,262,689 | 14,049,444 | 15,634,113 | |||||||||||||||
Number of transaction (thousands) | 3,061,468 | 3,517,163 | 3,517,163 | 4,117,653 | 5,024,132 | |||||||||||||||
Fee revenue (in millions of Won) | (Won) | 23,287 | (Won) | 27,715 | ₩ | 27,715 | ₩ | 28,374 | ₩ | 28,538 | ||||||||||
Phone banking: | ||||||||||||||||||||
Number of users (2) | 4,353,808 | 4,607,803 | 4,607,803 | 4,766,251 | 4,870,204 | |||||||||||||||
Number of transaction (thousands) | 299,163 | 250,265 | 250,265 | 213,941 | 183,434 | |||||||||||||||
Fee revenue (in millions of Won) | (Won) | 11,605 | (Won) | 12,284 | ₩ | 12,284 | ₩ | 13,297 | ₩ | 13,817 | ||||||||||
| (1) | Number of users is defined as the total cumulative number of persons who have registered through our branch offices to use our Internet banking services. |
| (2) | Number of users is defined as the total cumulative number of persons who have registered through our branch offices to use our phone banking services. |
Internet Banking
Our goal is to consolidate our position as a market leader in on-line banking. Our Internet banking services currently include:
basic banking services, including fund transfers, balance and transaction inquiries, credit card transaction inquiries, pre-set automatic transfers, product inquiries, and on-line bill payments;payments and foreign exchange services;
investment services, including opening deposit accounts and investing in funds;
processing of loan applications, which allows us to quickly process and approve on-line loan applications; and
electronic certification services, which permit our Internet banking service users to authenticate transactions on a confidential basis through digital signatures.signatures; and
wealth management and advisory services, including financial planning and real estate information services.
Phone Banking
We offer a variety of phone banking services, including inter-account fund transfers, balance and transaction inquiries, credit card transaction inquiries, customer service inquiries and bill payments. We also have call centers, which we primarily use to:
advise clients with respect to deposits, loans and credit cards and to provide our customers a way to report any emergencies with respect to their accounts;
allow our customers to conduct transactions with respect to their accounts, such as balance and transfer inquiries, transfers or payments, opening or closing accounts, processing loans through automated systems and conducting credit card transactions;
conduct telemarketing to our customers or potential customers to advertise products or services through phone, fax or text messaging; and
provide automated banking services, mobile services or other services relating to affinity programs.
Mobile & Smartphone Banking
MobileOur mobile and smartphone banking services allow customers to use mobile phones and devices, such as smartphones, to make inter-account transfersconduct a number of financial transactions, including basic banking and balance and other transaction inquiries.investment activities. There are currently three major mobile phone service providers in Korea, SK Telecom, KT and LG U+, and we provide our services in association with all three. Our mobile and smartphone banking services currently include:
|
basic banking services, including fund transfers, balance and transaction inquiries, credit card transaction inquiries, bill payments and foreign exchange services;
|
investment services, including investing in savings deposits that are designed specifically for and offered only to smartphone banking customers;
processing of loan applications and bancassurance services; and
mobile stock trading, through which mobile banking customers can use their devices to trade stocks.
Other Channels
We provide cash management services, which include automatic transfers, connection services to other financial institutions, real-time firm banking, automatic fund concentration and transmittal of trading information. We have continued to develop our firm banking services and, as of December 31, 2011, we provided cash management services to over 1,650 large corporations and small- and medium-sized enterprises.
Competition
We compete principally with other financial institutions in Korea, including other financial holding companies and nationwide commercial banks, as well as regional banks, development banks, specialized banks and branches of foreign banks operating in Korea and installment finance corporations for mortgage loan products. We also compete for customer funds with other types of financial service institutions, including savings institutions (such as mutual savings and finance companies and credit unions and credit cooperatives), investment institutions (such as merchant banking corporations), life insurance companies and financial investment companies. Competition in the domestic banking industry is generally based on the types and quality of the products and services offered, including the size and location of retail networks, the level of automation and interest rates charged and paid.
Competition has increased significantly in our traditional core businesses, retail banking, small- and medium-sized enterprise banking and credit card lending, contributing to some extent to the asset quality deterioration in retail and small- and medium-sized loans. As a result, our margins on lending activities may decrease in the future.
In addition, general regulatory reforms in the Korean financial industry have increased competition among banks and financial institutions in Korea. As the reform of the financial sector continues, foreign financial institutions, some with greater resources than us, have entered, and may continue to enter, the Korean market either by themselves or in partnership with existing Korean financial institutions and compete with us in providing financial and related services.
In addition, the Korean financial industry is undergoing significant consolidation. A number of significant mergers and acquisitions in the industry have taken place in Korea during the last five years, including the establishment of financial holding companies, which have reduced the number of nationwide commercial banks
in Korea from 16 as of December 31, 1997, to seven banks and six financial holding companies as of December 31, 2011.2013. Furthermore, a number of significant mergers and acquisitions in the industry have taken place in Korea over the past decade, including the acquisition of Koram Bank by an affiliate of Citibank in 2004, Standard Chartered Bank’s acquisition of Korea First Bank in April 2005, Chohung Bank’s merger with Shinhan Bank in April 2006 and Hana Financial Group’s acquisition of a controlling interest in Korea Exchange Bank in February 2012. We expect that consolidation in the financial industry will continue. In particular, the Korean government has announced that it plans to privatizeis in the Korea Development Bank and to disposeprocess of disposing of or reducereducing its controlling interest in Woori Finance Holdings Co., Ltd. (the financial holding company of Woori Bank)., which involves sales of its subsidiaries. Other financial institutions may seek to acquire or merge with such entities, and the financial institutions resulting from this consolidation may, by virtue of their increased size and business scope, provide significantly greater competition for us. We intend to review potential acquisition opportunities as they arise. We cannot guarantee that we will not be involved in any future mergers or acquisitions.
For additional information, you should read the section entitled “Item 3D.3.D. Risk Factors—Risks relating to competition.”
Information Technology
Pursuant to our establishment as a financial holding company, we are implementing various IT system-related initiatives and upgrades at the group and subsidiary level. We believe that continuous improvement of our IT systems is crucial in supporting our operations and management and providing high-quality customer service. Accordingly, we continue to upgrade and improve our systems through various activities, including projects to develop next generation banking systems for Kookmin Bank, further strengthen system security and timely develop and implement various new IT systems and services (including group-wide software) that support our business operations and risk management activities.
Our mainframe-based banking and credit card IT systems are designed to ensure continuity of services even where there is a failure of the host data center due to a natural disaster or other accidents by utilizing backup systems in disaster recovery data centers. In addition, through the implementation of Parallel Sysplex, a “multi-CPU“multi-CPU system,” our bank and credit card systems are designed and operated to be able to process transactions without material interruption in the event of CPU failure. In 2010, we launched a next-generation banking and credit card IT system that is designed to ensure greater reliability in financial transactions and allow more efficient development of new financial products. We also launched a new disaster recovery system to ensure continuity of operations. In addition, we implemented new technologies, including Multi Channel Integration and Enterprise Application Integration systems, to standardize our IT system and better manage IT system operational risk.
In 2011, we launched a mobile weblink to provide online banking services for smartphone users. In addition, we implemented virtual storage technology for our server systems to achieve a more flexible andcost-effective information storage capability.
The integrity of our IT systems, and their ability to withstand potential catastrophic events (such as natural calamities and internal system failures), are crucial to our continuing operations. We currently test our disaster recovery systems on a quarterly basis. For additional information, see “Item 11. Quantitative and Qualitative Disclosures about Market Risk—Operational Risk Management.”
In 2011,2013, we spent approximately (Won)399₩412 billion for our IT systems, including expenses related to the construction of new IT systems, implementation of hardware and software technologies and other new systems. As of December 31, 2011,2013, we employed a total of approximately 774879 full-time employees in our IT operations.
Assets and Liabilities
The tables below set out selected financial highlights regarding our banking operations and individual assets and liabilities. Except as otherwise indicated, (i) amounts as of and for the years ended December 31, 2010, 2011, 2012 and
2011 2013 are presented on a consolidated basis under IFRS, and (ii) amounts as of and for the yearsyear ended December 31, 2007, 2008 and 2009 are presented on a consolidated basis under U.S. GAAP and are not comparable to information prepared in accordance with IFRS.
Loan Portfolio
As of December 31, 2011,2013, our total loan portfolio was (Won)215,555₩221,862 billion compared to (Won)201,377₩216,914 billion atas of December 31, 2010.2012 and ₩215,555 billion as of December 31, 2011. As of December 31, 2011, 93.2%2013, 94.6% of our total loans were Won-denominated loans.loans compared to 94.4% as of December 31, 2012 and 93.2% as of December 31, 2011.
Loan Types
The following table presents loans by type as of the dates indicated under IFRS. Except where we specify otherwise, all loan amounts stated below are before deduction of allowances for loan losses. Total loans reflect our loan portfolio, including past due amounts.
| As of December 31, | As of December 31, | |||||||||||||||||||||||
| 2010 | 2011 | 2010 | 2011 | 2012 | 2013 | |||||||||||||||||||
| (in billions of Won) | (in billions of Won) | |||||||||||||||||||||||
Domestic: | ||||||||||||||||||||||||
Corporate | ||||||||||||||||||||||||
Small- and medium-sized enterprise | (Won) | 65,132 | (Won) | 68,730 | ₩ | 65,132 | ₩ | 68,730 | ₩ | 70,471 | ₩ | 71,045 | ||||||||||||
Large corporate (1) | 23,143 | 28,509 | 23,143 | 28,509 | 29,212 | 29,489 | ||||||||||||||||||
Retail | ||||||||||||||||||||||||
Mortgage and home equity | 71,715 | 75,580 | 71,715 | 75,580 | 74,463 | 77,969 | ||||||||||||||||||
Other consumer | 27,281 | 28,275 | 27,281 | 28,275 | 28,969 | 29,675 | ||||||||||||||||||
Credit cards | 12,413 | 12,421 | 12,413 | 12,421 | 11,874 | 11,784 | ||||||||||||||||||
|
|
|
|
|
| |||||||||||||||||||
Total domestic | 199,684 | 213,515 | 199,684 | 213,515 | 214,989 | 219,962 | ||||||||||||||||||
Foreign: | 1,693 | 2,040 | ||||||||||||||||||||||
Foreign | 1,693 | 2,040 | 1,925 | 1,900 | ||||||||||||||||||||
|
|
|
|
|
| |||||||||||||||||||
Total gross loans | (Won) | 201,377 | (Won) | 215,555 | ₩ | 201,377 | ₩ | 215,555 | ₩ | 216,914 | ₩ | 221,862 | ||||||||||||
|
|
|
|
|
| |||||||||||||||||||
| (1) | Large corporate loans include |
The following table presents loans by type as of the datesdate indicated under U.S. GAAP. Except where we specify otherwise, all loan amounts stated below are before deduction of allowances for loan losses. Total loans reflect our loan portfolio, including past due amounts.
| As of December 31, | ||||||||||||
| 2007 | 2008 | 2009 | ||||||||||
| (in billions of Won) | ||||||||||||
Domestic: | ||||||||||||
Corporate | ||||||||||||
Commercial and industrial (1) | (Won) | 60,945 | (Won) | 75,140 | (Won) | 74,611 | ||||||
Construction | 8,843 | 10,052 | 8,097 | |||||||||
Other corporate | 1,797 | 2,951 | 2,178 | |||||||||
Retail | ||||||||||||
Mortgage and home equity | 65,819 | 69,924 | 70,678 | |||||||||
Other consumer | 23,020 | 27,592 | 26,949 | |||||||||
Credit cards | 10,429 | 11,523 | 11,368 | |||||||||
|
|
|
|
|
| |||||||
Total domestic | 170,853 | 197,182 | 193,881 | |||||||||
Foreign: | 1,336 | 2,455 | 2,344 | |||||||||
|
|
|
|
|
| |||||||
Total gross loans | (Won) | 172,189 | (Won) | 199,637 | (Won) | 196,225 | ||||||
|
|
|
|
|
| |||||||
| As of December 31, | ||||
| 2009 | ||||
| (in billions of Won) | ||||
Domestic: | ||||
Corporate | ||||
Commercial and industrial (1) | ₩ | 74,611 | ||
Construction | 8,097 | |||
Other corporate | 2,178 | |||
Retail | ||||
Mortgage and home equity | 70,678 | |||
Other consumer | 26,949 | |||
Credit cards | 11,368 | |||
Total domestic | 193,881 | |||
Foreign: | 2,344 | |||
Total gross loans | ₩ | 196,225 | ||
| (1) | Commercial and industrial loans include |
Loan Concentrations
On a consolidated basis, our exposure to any single borrower or any singlechaebol is limited by law to 20% and 25%, respectively, of our “net aggregate equity capital,” as defined under the Enforcement Decree of the
Financial Holding Company Act. See “—Supervision and Regulation—Principal Regulations Applicable to Financial Holding Companies—Financial Exposure to Any Individual Customer and Major Shareholder.” In addition, Kookmin Bank’s exposure to any single borrower or any singlechaebolis limited by the Bank Act to 20% and 25%, respectively, of its total Tier I and Tier II capital.
20 Largest Exposures by Borrower
As of December 31, 2011,2013, our 20 largest exposures totaled (Won)13,059₩11,351 billion and accounted for 4.9%4.1% of our total exposures. The following table sets forth, as of December 31, 2011,2013, our total exposures to these top 20 borrowers or issuers:
| Loans | Guarantees and Acceptances | Amounts Classified As Impaired Loans | ||||||||||||||||||||||||||
Company (1) | Won Currency | Foreign Currency | Equity Securities | Debt Securities | Total Exposures | |||||||||||||||||||||||
| (in billions of Won) | ||||||||||||||||||||||||||||
Hyundai Heavy Industries | (Won) | — | (Won) | 82 | (Won) | 2 | (Won) | 10 | (Won) | 1,679 | (Won) | 1,773 | (Won) | — | ||||||||||||||
Samsung Heavy Industries | 100 | — | — | — | 1,347 | 1,447 | — | |||||||||||||||||||||
Hyundai Steel Company | 381 | 373 | — | 51 | 58 | 863 | — | |||||||||||||||||||||
POSCO | — | 21 | 613 | 155 | — | 789 | — | |||||||||||||||||||||
Woori Bank | 70 | 145 | — | 499 | — | 714 | — | |||||||||||||||||||||
GS-Caltex Corporation | — | 468 | — | 110 | 108 | 686 | — | |||||||||||||||||||||
LG Electronics | 533 | 11 | 2 | 138 | — | 684 | — | |||||||||||||||||||||
Daewoo International Corporation | — | 302 | — | 20 | 260 | 582 | — | |||||||||||||||||||||
SPP Shipbuilding | 75 | — | — | — | 471 | 546 | — | |||||||||||||||||||||
Shinhan Bank | — | 17 | — | 520 | — | 537 | — | |||||||||||||||||||||
Shinhan Financial Group | — | — | — | 532 | — | 532 | — | |||||||||||||||||||||
Daewoo Shipbuilding & Marine Engineering | — | 82 | — | — | 423 | 505 | — | |||||||||||||||||||||
Korea Exchange Bank | — | 306 | 3 | 168 | — | 477 | — | |||||||||||||||||||||
Bank of China | — | 450 | — | — | — | 450 | — | |||||||||||||||||||||
Hyundai Capital Services | 390 | — | — | 57 | — | 447 | — | |||||||||||||||||||||
Hyundai Motors | — | 440 | 5 | — | — | 445 | — | |||||||||||||||||||||
SK Networks | 265 | 97 | — | — | 73 | 435 | — | |||||||||||||||||||||
Korea Securities Corporation | — | 300 | 18 | 90 | — | 408 | — | |||||||||||||||||||||
LS-Nikko Copper | — | 174 | — | — | 200 | 374 | — | |||||||||||||||||||||
Bank Center Credit | — | — | 365 | — | — | 365 | — | |||||||||||||||||||||
|
|
|
|
|
|
|
|
|
|
|
|
|
| |||||||||||||||
Total | (Won) | 1,814 | (Won) | 3,268 | (Won) | 1,008 | (Won) | 2,350 | (Won) | 4,619 | (Won) | 13,059 | (Won) | — | ||||||||||||||
|
|
|
|
|
|
|
|
|
|
|
|
|
| |||||||||||||||
| Loans | Guarantees and Acceptances | Amounts Classified as Impaired Loans | ||||||||||||||||||||||||||
Company (1) | Won Currency | Foreign Currency | Equity Securities | Debt Securities | Total Exposures | |||||||||||||||||||||||
| (in billions of Won) | ||||||||||||||||||||||||||||
Hyundai Heavy Industries Co., Ltd. | ₩ | — | ₩ | 59 | ₩ | 10 | ₩ | — | ₩ | 1,493 | ₩ | 1,562 | ₩ | — | ||||||||||||||
POSCO | — | 124 | 570 | 235 | — | 929 | — | |||||||||||||||||||||
Daewoo Shipbuilding & Marine Engineering Co., Ltd. | — | 184 | 1 | 10 | 722 | 917 | — | |||||||||||||||||||||
Hyundai Steel Company | 408 | 300 | 2 | 31 | 42 | 783 | — | |||||||||||||||||||||
Mizuho Bank, Ltd. | — | 739 | — | — | — | 739 | — | |||||||||||||||||||||
National Agricultural Cooperative Federation | — | — | — | 671 | — | 671 | — | |||||||||||||||||||||
Hyundai Capital Services Inc. | 340 | — | — | 223 | — | 563 | — | |||||||||||||||||||||
GS Caltex Corporation | — | 55 | — | 131 | 325 | 511 | — | |||||||||||||||||||||
Daewoo International Corporation | — | 199 | — | 21 | 239 | 459 | — | |||||||||||||||||||||
Samsung Heavy Industries Co., Ltd. | — | — | — | 10 | 443 | 453 | — | |||||||||||||||||||||
Woori Bank | — | 222 | 6 | 224 | — | 452 | — | |||||||||||||||||||||
Hyundai Securities Co., Ltd. | — | 400 | 36 | — | — | 436 | — | |||||||||||||||||||||
Samsung Everland Inc. | 373 | — | — | 29 | — | 402 | — | |||||||||||||||||||||
Industrial and Commercial Bank of China Ltd. | — | 372 | — | — | — | 372 | — | |||||||||||||||||||||
Korean Air Lines Co., Ltd. | — | 80 | 5 | 23 | 263 | 371 | — | |||||||||||||||||||||
LG Electronics Inc. | 340 | — | 4 | 16 | — | 360 | — | |||||||||||||||||||||
Bank of Communications Ltd. | — | 359 | — | — | — | 359 | — | |||||||||||||||||||||
Korea Exchange Bank | — | 148 | — | 193 | — | 341 | — | |||||||||||||||||||||
SK Energy Co., Ltd. | — | 182 | — | 50 | 106 | 338 | — | |||||||||||||||||||||
SH Corporation | — | — | — | 333 | — | 333 | — | |||||||||||||||||||||
|
|
|
|
|
|
|
|
|
|
|
|
|
| |||||||||||||||
Total | ₩ | 1,461 | ₩ | 3,423 | ₩ | 634 | ₩ | 2,200 | ₩ | 3,633 | ₩ | 11,351 | ₩ | — | ||||||||||||||
|
|
|
|
|
|
|
|
|
|
|
|
|
| |||||||||||||||
| (1) | Excludes exposures to government-owned or -controlled enterprises or financial institutions, including Bank of Korea, Korea Housing Finance Corporation, Korea Land & Housing Corporation, Korea Deposit Insurance Corporation and Korea Development Bank. |
As of December 31, 2011, 132013, 12 of these top 20 borrowers or issuers were companies belonging to the 3730 largestchaebols in Korea designated as such by the Financial Supervisory Service based on their outstanding exposures.
Exposure to Chaebols
As of December 31, 2011, 8.5%2013, 6.9% of our total exposure was to the 3730 largestchaebols in Korea designated as such by the Financial Supervisory Service based on their outstanding exposures. The following table shows, as of December 31, 2011,2013, our total exposures to the tenchaebolgroups to which we have the largest exposure:
| Loans | Equity Securities(1) | Debt Securities | Guarantees and Acceptances | Total Exposures | Amounts Classified as Impaired Loans | |||||||||||||||||||||||
Chaebol | Won Currency | Foreign Currency | ||||||||||||||||||||||||||
| (in billions of Won) | ||||||||||||||||||||||||||||
Samsung(1) | (Won) | 618 | (Won) | 417 | (Won) | 106 | (Won) | 296 | (Won) | 1,592 | (Won) | 3,029 | (Won) | — | ||||||||||||||
Hyundai Motors(2) | 964 | 1,388 | 6 | 108 | 340 | 2,806 | — | |||||||||||||||||||||
Hyundai Heavy Industries (3) | — | 235 | 104 | 20 | 1,917 | 2,276 | — | |||||||||||||||||||||
LG(4) | 1,144 | 443 | 9 | 270 | 50 | 1,916 | — | |||||||||||||||||||||
SK(5) | 430 | 438 | 243 | 173 | 285 | 1,569 | — | |||||||||||||||||||||
POSCO(6) | 99 | 344 | 613 | 214 | 262 | 1,532 | — | |||||||||||||||||||||
GS(7) | 106 | 520 | — | 58 | 329 | 1,013 | — | |||||||||||||||||||||
Lotte(8) | 327 | 59 | — | 361 | 138 | 885 | — | |||||||||||||||||||||
Hanhwa(9) | 624 | 48 | 103 | 26 | 17 | 818 | — | |||||||||||||||||||||
LS(10) | 33 | 258 | — | 141 | 351 | 783 | — | |||||||||||||||||||||
|
|
|
|
|
|
|
|
|
|
|
|
|
| |||||||||||||||
Total | (Won) | 4,345 | (Won) | 4,150 | (Won) | 1,184 | (Won) | 1,667 | (Won) | 5,281 | (Won) | 16,627 | (Won) | — | ||||||||||||||
|
|
|
|
|
|
|
|
|
|
|
|
|
| |||||||||||||||
| Loans | Equity Securities | Debt Securities | Guarantees and Acceptances | Total Exposures | Amounts Classified as Impaired Loans | |||||||||||||||||||||||
Chaebol | Won Currency | Foreign Currency | ||||||||||||||||||||||||||
| (in billions of Won) | ||||||||||||||||||||||||||||
Hyundai Motors (1) | ₩ | 867 | ₩ | 440 | ₩ | 13 | ₩ | 517 | ₩ | 538 | ₩ | 2,375 | ₩ | — | ||||||||||||||
Samsung (2) | 648 | 256 | 41 | 381 | 781 | 2,107 | — | |||||||||||||||||||||
Hyundai Heavy Industries (3) | 17 | 97 | 70 | 10 | 1,866 | 2,060 | — | |||||||||||||||||||||
POSCO (4) | 161 | 336 | 637 | 276 | 437 | 1,847 | — | |||||||||||||||||||||
SK (5) | 215 | 584 | 284 | 369 | 329 | 1,781 | — | |||||||||||||||||||||
LG (6) | 742 | 293 | 19 | 55 | 13 | 1,122 | — | |||||||||||||||||||||
GS (7) | 126 | 128 | 4 | 197 | 534 | 989 | — | |||||||||||||||||||||
Daewoo Shipbuilding & Marine Engineering (8) | 38 | 184 | 1 | 10 | 723 | 956 | — | |||||||||||||||||||||
Hanwha (9) | 578 | 50 | 10 | 12 | 59 | 709 | — | |||||||||||||||||||||
Lotte (10) | 233 | 44 | 25 | 320 | 44 | 666 | — | |||||||||||||||||||||
|
|
|
|
|
|
|
|
|
|
|
|
|
| |||||||||||||||
Total | ₩ | 3,625 | ₩ | 2,412 | ₩ | 1,104 | ₩ | 2,147 | ₩ | 5,324 | ₩ | 14,612 | ₩ | — | ||||||||||||||
|
|
|
|
|
|
|
|
|
|
|
|
|
| |||||||||||||||
| (1) | Includes principally |
| (2) | Includes principally |
| (3) | Includes principally Hyundai Heavy Industries Co., Ltd., Hyundai |
| (4) | Includes principally |
| (5) | Includes principally SK |
| (6) | Includes principally |
| (7) | Includes principally GS Caltex Corporation, GS Engineering & Construction Corporation and GS |
| (8) | Includes principally |
| (9) | Includes principally Hanwha Engineering & Construction |
| (10) | Includes principally |
Loan Concentration by Industry
The following table showspresents the aggregate balance of our domestic and foreign corporate loans, by industry concentration, as of December 31, 2011:2011, 2012 and 2013:
| As of December 31, | ||||||||||||||||||||||||||||||||
| 2011 | 2012 | 2013 | ||||||||||||||||||||||||||||||
Industry | Aggregate Loan Balance | Percentage of Total Loan Balance | Amount | % | Amount | % | Amount | % | ||||||||||||||||||||||||
| (in billions of Won) | (in billions of Won, except percentages) | |||||||||||||||||||||||||||||||
Services | ₩ | 36,306 | 36.6 | % | ₩ | 38,650 | 38.1 | % | ₩ | 38,375 | 37.5 | % | ||||||||||||||||||||
Manufacturing | 31,763 | 32.0 | 31,320 | 30.8 | 31,161 | 30.5 | ||||||||||||||||||||||||||
Wholesale and retail | 15,639 | 15.8 | 15,124 | 14.9 | 13,874 | 13.6 | ||||||||||||||||||||||||||
Financial institutions | (Won) | 5,839 | 5.9 | % | 5,839 | 5.9 | 7,291 | 7.2 | 10,524 | 10.3 | ||||||||||||||||||||||
Manufacturing | 31,763 | 32.0 | ||||||||||||||||||||||||||||||
Service | 36,306 | 36.6 | ||||||||||||||||||||||||||||||
Construction | 5,675 | 5.7 | 4,689 | 4.6 | 4,428 | 4.3 | ||||||||||||||||||||||||||
Public sector | 311 | 0.3 | 311 | 0.3 | 520 | 0.5 | 655 | 0.6 | ||||||||||||||||||||||||
Others | 24,989 | 25.2 | 3,675 | 3.7 | 3,941 | 3.9 | 3,318 | 3.2 | ||||||||||||||||||||||||
|
|
|
|
|
|
|
| |||||||||||||||||||||||||
Total | (Won) | 99,208 | 100.0 | % | ₩ | 99,208 | 100.0 | % | ₩ | 101,535 | 100.0 | % | ₩ | 102,335 | 100.0 | % | ||||||||||||||||
|
|
|
|
|
|
|
| |||||||||||||||||||||||||
Maturity Analysis
We typically roll over our working capital loans and consumer loans (other than those payable in installments) after we conduct our normal loan review in accordance with our loan review procedures. Working capital loans may generally be extended on an annual basis for an aggregate term of five years and consumer loans may generally be extended for another term of up to 12 months for an aggregate term of 10 years.
The following table sets out the scheduled maturities (time remaining until maturity) of our loan portfolio as of December 31, 2011.2013. The amounts disclosed are before deduction of allowances for loan losses:
| 1 Year or Less | Over 1 year But Not More Than 5 Years | Over 5 Years | Total | 1 Year or Less | Over 1 Year But Not More Than 5 Years | Over 5 Years | Total | |||||||||||||||||||||||||
| (in billions of Won) | (in billions of Won) | |||||||||||||||||||||||||||||||
Domestic: | ||||||||||||||||||||||||||||||||
Corporate | ||||||||||||||||||||||||||||||||
Small- and medium-sized enterprises | (Won) | 53,051 | (Won) | 11,718 | (Won) | 3,961 | (Won) | 68,730 | ₩ | 53,215 | ₩ | 12,406 | ₩ | 5,424 | ₩ | 71,045 | ||||||||||||||||
Large corporate | 19,860 | 6,500 | 2,149 | 28,509 | 21,170 | 5,471 | 2,848 | 29,489 | ||||||||||||||||||||||||
|
|
|
|
|
|
|
| |||||||||||||||||||||||||
Total corporate | 72,911 | 18,218 | 6,110 | 97,239 | 74,385 | 17,877 | 8,272 | 100,534 | ||||||||||||||||||||||||
Retail | ||||||||||||||||||||||||||||||||
Mortgage and home equity | 9,539 | 7,875 | 58,166 | 75,580 | 7,675 | 6,108 | 64,186 | 77,969 | ||||||||||||||||||||||||
Other consumer | 19,914 | 6,005 | 2,356 | 28,275 | 18,778 | 7,427 | 3,470 | 29,675 | ||||||||||||||||||||||||
|
|
|
|
|
|
|
| |||||||||||||||||||||||||
Total retail | 29,453 | 13,880 | 60,522 | 103,855 | 26,453 | 13,535 | 67,656 | 107,644 | ||||||||||||||||||||||||
Credit cards | 11,168 | 1,145 | 108 | 12,421 | 10,568 | 1,000 | 216 | 11,784 | ||||||||||||||||||||||||
|
|
|
|
|
|
|
| |||||||||||||||||||||||||
Total domestic | 113,532 | 33,243 | 66,740 | 213,515 | 111,406 | 32,412 | 76,144 | 219,962 | ||||||||||||||||||||||||
Foreign: | 1,385 | 565 | 90 | 2,040 | 1,417 | 414 | 69 | 1,900 | ||||||||||||||||||||||||
|
|
|
|
|
|
|
| |||||||||||||||||||||||||
Total gross loans | (Won) | 114,917 | (Won) | 33,808 | (Won) | 66,830 | (Won) | 215,555 | ₩ | 112,823 | ₩ | 32,826 | ₩ | 76,213 | ₩ | 221,862 | ||||||||||||||||
|
|
|
|
|
|
|
| |||||||||||||||||||||||||
Interest Rate Sensitivity
The following table shows, as of December 31, 2011,2013, the total amount of loans due after one year, which have fixed interest rates and variable or adjustable interest rates:
| As of December 31, | ||||
| (in billions of Won) | ||||
Fixed rate(1) | ||||
Variable or adjustable rates(2) | ||||
|
| |||
Total gross loans | ||||
|
| |||
| (1) | Fixed rate loans are loans for which the interest rate is fixed for the entire term. |
| (2) | Variable or adjustable rate loans are loans for which the interest rate is not fixed for the entire term. |
For additional information regarding our management of interest rate risk, see “Item 11. Quantitative and Qualitative Disclosures about Market Risk—Market Risk Management—Market Risk Management for Non-Trading Activities.”
Credit Exposures to Companies in Workout, Restructuring or Rehabilitation
Workout is a voluntary procedure through which we, together with the borrower and other creditors, restructure arestore the borrower’s credit terms.financial stability and viability. Previously, workouts were regulated under the prior Corporate Restructuring Promotion Act, which was enacted in 2007 and expired on December 31, 2010.2013. In April 2011,December 2013, the National Assembly of Korea adopted a newanother Corporate Restructuring Promotion Act, or the New Corporate Restructuring
Promotion Act, which became effective on May 19, 2011.January 1, 2014. Workouts that had been initiated under the Corporate Restructuring Promotion Act are also governed by the New Corporate Restructuring Promotion Act effective from May 19, 2011.January 1, 2014. Under the New Corporate Restructuring Promotion Act, which is similar to the Corporate Restructuring Promotion Act, all creditor financial institutions of a financially troubled borrower are required to participate in a creditors’ committee which is authorized to prohibit such creditor financial institutions from exercising their rights against the borrower, commencing workout procedures or approving a reorganization plan
prepared by the borrower. Any decision of the creditors’ committee requires the approval of creditor financial institutions holding not less than 75% of the total debt outstanding of a borrower. An additional approval of creditor financial institutions holding not less than 75% of the secured debt is required with respect to the borrower’s debt restructuring. Oncerestructuring.Once approved, any decision made by the creditors’ committee is binding on all the creditor financial institutions of the borrower. Creditor financial institutions that voted against commencement of workout, debt restructuring or granting of new credit have the right to request the creditor financial institutions that voted in favor of such matters to purchase their claims at a mutually agreed price. In the event that the parties are not able to agree on the terms of purchase, a coordination committee consisting of experts would determine the terms. The creditor financial institutions that oppose a decision made by the coordination committee may request a court to change such decision. The New Corporate Restructuring Promotion Act is scheduled to expire on December 31, 2013.2015.
Upon approval of the workout plan, a credit exposure is initially classified as precautionary or lower and thereafter cannot be classified higher than precautionary with limited exceptions. If a corporate borrower is in workout, restructuring or rehabilitation, we take the status of the borrower into account in valuing our loans to and collateral from that borrower for purposes of establishing our allowances for credit losses.
Korean law also provides for corporate rehabilitation proceedings, which are court-supervised procedures to rehabilitate an insolvent company. Under these procedures, a restructuring plan is adopted at a meeting of interested parties, including creditors of the company. Such restructuring plan is subject to court approval.
A portion of our loans to and debt securities of corporate customers are currently in workout, restructuring or rehabilitation. As of December 31, 2011, (Won)1,0872013, ₩916 billion or 0.4% of our total loans and debt securities were in workout, restructuring or rehabilitation. This included (Won)597₩487 billion of loans to and debt securities of large corporate borrowers and (Won)490₩429 billion of loans to and debt securities of small- and medium-sized enterprises.
The following table shows, as of December 31, 2011,2013, our ten largest exposures that were in workout, restructuring or rehabilitation:
| Loans | Equity Securities | Debt Securities | Guarantees And Acceptances | Total Exposures | Amounts Classified As Impaired Loans | Loans | Guarantees and Acceptances | Amounts Classified as Impaired Loans | ||||||||||||||||||||||||||||||||||||||||||||||||
Company | Won Currency | Foreign Currency | Won Currency | Foreign Currency | Equity Securities | Debt Securities | Total Exposures | |||||||||||||||||||||||||||||||||||||||||||||||||
| (in billions of Won) | (in billions of Won) | |||||||||||||||||||||||||||||||||||||||||||||||||||||||
Kumho Tire Co., Inc. | ₩ | 23 | ₩ | 27 | ₩ | 95 | ₩ | — | ₩ | 8 | ₩ | 153 | ₩ | — | ||||||||||||||||||||||||||||||||||||||||||
Orient Shipyard Co., Ltd. | 87 | 2 | — | — | 62 | 151 | 89 | |||||||||||||||||||||||||||||||||||||||||||||||||
Kumho Industrial Co., Ltd. | (Won) | 127 | (Won) | — | (Won) | 32 | (Won) | — | (Won) | 9 | (Won) | 168 | (Won) | 2 | 58 | — | 8 | — | 24 | 90 | 58 | |||||||||||||||||||||||||||||||||||
Kumho Tire Co., Inc | 40 | 42 | 66 | — | 2 | 150 | — | |||||||||||||||||||||||||||||||||||||||||||||||||
Dongmoon Construction Co., Ltd. | 66 | — | — | — | — | 66 | 66 | 66 | — | — | — | — | 66 | 66 | ||||||||||||||||||||||||||||||||||||||||||
Shinil Engineering Co., Ltd. | 57 | — | — | — | — | 57 | 57 | |||||||||||||||||||||||||||||||||||||||||||||||||
Hanil Engineering&Construction Co., Ltd. | 28 | — | 2 | — | 23 | 53 | 28 | |||||||||||||||||||||||||||||||||||||||||||||||||
Ssangyong Engineering & Construction Co., Ltd. | 47 | — | — | — | — | 47 | 47 | |||||||||||||||||||||||||||||||||||||||||||||||||
Samho International Co., Ltd. | 33 | — | 6 | 6 | — | 45 | 33 | |||||||||||||||||||||||||||||||||||||||||||||||||
Dongil Construction Co., Ltd. | 45 | — | — | — | — | 45 | 45 | 42 | — | — | — | — | 42 | 42 | ||||||||||||||||||||||||||||||||||||||||||
Samho international Co., Ltd. | 40 | — | — | — | — | 40 | 40 | |||||||||||||||||||||||||||||||||||||||||||||||||
Hyundai Cement Co., Ltd. | 26 | 3 | — | — | — | 29 | 28 | 24 | 2 | — | — | — | 26 | 26 | ||||||||||||||||||||||||||||||||||||||||||
Woorim Co., Ltd. | 26 | — | — | — | 2 | 28 | 26 | |||||||||||||||||||||||||||||||||||||||||||||||||
Shindo Engineering Co., Ltd. | 26 | — | — | — | — | 26 | 26 | |||||||||||||||||||||||||||||||||||||||||||||||||
Oriental Precision & Engineering Co., Ltd. | 2 | — | 18 | — | — | 20 | 2 | |||||||||||||||||||||||||||||||||||||||||||||||||
Chinhung International Inc. | 17 | — | — | — | — | 17 | 17 | |||||||||||||||||||||||||||||||||||||||||||||||||
|
|
|
|
|
|
|
|
|
|
|
|
|
| |||||||||||||||||||||||||||||||||||||||||||
Total | (Won) | 481 | (Won) | 45 | (Won) | 100 | (Won) | — | (Won) | 36 | (Won) | 662 | (Won) | 318 | ₩ | 399 | ₩ | 31 | ₩ | 127 | ₩ | 6 | ₩ | 94 | ₩ | 657 | ₩ | 380 | ||||||||||||||||||||||||||||
|
|
|
|
|
|
|
|
|
|
|
|
|
| |||||||||||||||||||||||||||||||||||||||||||
Provisioning Policy
Under IFRS, we establish allowances for loan losses with respect to loans to absorb such losses. We assess individually significant loans on a case-by-case basis and other loans on a collective basis. In addition, if we determine that no objective evidence of impairment exists for a loan, we include such loan in a group of loans with similar credit risk characteristics and assess them collectively for impairment regardless of whether such
loan is significant. For individually significant loans, allowances for loan losses are recorded if objective evidence of impairment exists as a result of one or more events that occurred after initial recognition. For collectively assessed loans, we base the level of allowances for loan losses on our evaluation of the risk characteristics of such loans, taking into account such factors as historical loss experience, the financial condition of the borrowers and current economic conditions. If additions or changes to the allowances for loan losses are required, then we record a provision for loan losses, which is included in impairment losses on credit loss and treated as a charge against current income. Credit exposures that we deem to be uncollectible, including actual loan losses, net of recoveries of previously charged-off amounts, are charged directly against the allowances for loan losses. See “Item 5A.5.A. Operating Results—Critical Accounting Policies—Impairment of Loans and Allowances for Loan Losses.”
We generally consider the following loans to be impaired loans:
loans that are past due by 90 days or more;
loans that are subject to legal proceedings related to collection;
loans to a borrower that has received a warning from the Korea Federation of Banks indicating that such borrower has exhibited difficulties in making timely payments of principal and interest;
loans to corporate borrowers that are rated C or D according to Kookmin Bank’s internal credit ratings for large companies or small-and medium-sized enterprises;
loans to corporate borrowers that are rated CC or below according to Kookmin Bank’s internalfor which account-specific provisions have been made resulting from a significant perceived decline in credit ratings for large companies or small-and medium-sized enterprises as a result of being subject to workout, court receivership, court mediation or similar proceedings;quality; and
restructured loans.loans with respect to which the amount of principal and interest payable has been materially decreased due to restructuring.
Under U.S. GAAP, we established loan loss allowances for corporate loans based on whether a particular loan was identified as impaired or not. Loan loss allowances were established for impaired loans, in general, by discounting the estimated future cash flow (both principal and interest) we expected to receive on such loans. Where the entire impaired loan or a portion of the impaired loan was secured by collateral or a guarantee, the fair value of the collateral or the guarantee payment was considered in establishing the level of the allowance. Alternatively, for impaired loans that were considered collateral-dependent, the amount of impairment was determined by reference to the fair value of the collateral. In addition, for certain foreign corporate loans that were considered impaired, the fair value was determined by reference to observable market prices, when available. We also established allowances for losses for corporate loans that had not been individually identified as impaired. These allowances were based on historical migration and loss information.
In the case of consumer loans, we established loan loss allowances under U.S. GAAP based on historical performance, previous loan loss history and charge-off information. Additional factors that management considered when establishing reserves for homogeneous pools of consumer loans included, but were not limited to, economic events, delinquencies and changes in underwriting and credit monitoring policies.
The actual amount of incurred loan losses may vary from loss estimates due to changing economic conditions or changes in industry or geographic concentrations. We have procedures in place to monitor differences between estimated and actual incurred loan losses, which include detailed periodic assessments by senior management of both individual loans and loan portfolios and the use of models to estimate incurred loan losses in those portfolios.
We regularly evaluate the adequacy of the overall allowances for loan losses and we believe that the allowances for loan losses reflect our best estimate of probable loan losses as of each balance sheet date.
Loan Aging Schedule
The following table shows our loan aging schedule (excluding accrued interest) as of the dates indicated under IFRS:
As of December 31, | Normal Amount | % | Amount Past Due 1-3 Months | % | Amount Past Due 3-6 Months | % | Amount Past Due more Than 6 Months | % | Total Amount | |||||||||||||||||||||||||||
| (in billions of Won, except percentages) | ||||||||||||||||||||||||||||||||||||
2010 | (Won) | 199,044 | 98.8 | % | (Won) | 721 | 0.4 | % | (Won) | 608 | 0.3 | % | (Won) | 1,004 | 0.5 | % | (Won) | 201,377 | ||||||||||||||||||
2011 | 213,548 | 99.1 | 827 | 0.4 | 333 | 0.1 | 847 | 0.4 | 215,555 | |||||||||||||||||||||||||||
The following table shows our loan aging schedule (excluding accrued interest) as of December 31, 2009 under U.S. GAAP:
As of December 31, | Normal Amount | % | Amount Past Due 1-3 Months | % | Amount Past Due 3-6 Months | % | Amount Past Due more Than 6 Months | % | Total Amount | Normal Amount | % | Amount Past Due 1-3 Months | % | Amount Past Due 3-6 Months | % | Amount Past Due 6 Months or More | % | Total Amount | ||||||||||||||||||||||||||||||||||||||||||||||||||||||
| (in billions of Won, except percentages) | (in billions of Won, except percentages) | |||||||||||||||||||||||||||||||||||||||||||||||||||||||||||||||||||||||
2009 | (Won) | 194,371 | 99.1 | % | (Won) | 488 | 0.2 | % | (Won) | 315 | 0.2 | % | (Won) | 1,051 | 0.5 | % | (Won) | 196,225 | ||||||||||||||||||||||||||||||||||||||||||||||||||||||
2010 | ₩ | 199,013 | 98.8 | % | ₩ | 752 | 0.4 | % | ₩ | 608 | 0.3 | % | ₩ | 1,004 | 0.5 | % | ₩ | 201,377 | ||||||||||||||||||||||||||||||||||||||||||||||||||||||
2011 | 213,515 | 99.0 | 860 | 0.4 | 327 | 0.2 | 853 | 0.4 | 215,555 | |||||||||||||||||||||||||||||||||||||||||||||||||||||||||||||||
2012 | 214,489 | 98.9 | 819 | 0.4 | 532 | 0.2 | 1,074 | 0.5 | 216,914 | |||||||||||||||||||||||||||||||||||||||||||||||||||||||||||||||
2013 | 219,777 | 99.1 | 664 | 0.3 | 426 | 0.2 | 995 | 0.4 | 221,862 | |||||||||||||||||||||||||||||||||||||||||||||||||||||||||||||||
Non-Accrual Loans and Past Due Accruing Loans
We generally placeconsider impaired loans onto be non-accrual loans. However, we exclude from non-accrual status when payments ofand continue to accrue interest and/on loans that are fully secured by cash on deposit or principal become past due by 90 days. on which there are financial guarantees from the government, Korea Deposit Insurance Corporation or certain financial institutions.
We no longer recognize interest on thesenon-accrual loans from the date the loan is placed on non-accrual status. We reclassify loans as accruing when interest and principal payments are up-to-date and future payments of principal and interest are reasonably assured. We generally do not recognize interest income on non-accrual loans unless collected.
Interest foregone is the interest due on non-accrual loans that has not been accrued in our books of account. For the year ended December 31, 2011,2013, we would have recorded gross interest income of (Won)336₩332 billion compared to (Won)328₩309 billion for the year ended December 31, 2012, ₩336 billion for the year ended December 31, 2011 and ₩328 billion for the year ended December 31, 2010, in each case under IFRS, on loans accounted for on a non-accrual basis throughout the year, or since origination for loans held for part of the year, had we not foregone interest on those loans. The amount of interest income on those loans that was included in our profit for the years ended December 31, 2010, 2011, 2012 and 20112013 under IFRS was (Won)194₩194 billion, ₩192 billion, ₩187 billion and (Won)192₩206 billion, respectively.
The category “accruing but past due 90 days” includes loans which are still accruing interest but on which principal or interest payments are contractually past due 90 days or more. We continue to accrue interest on loans that are fully secured by cash on deposit or on which there are financial guarantees from the government, Korea Deposit Insurance Corporation or certain financial institutions.
The following table shows, as of the dates indicated, the amount of loans that were placed on a non-accrual basis and accruing loans under IFRS which were past due 90 days or more:more. The category “accruing but past due 90 days” includes loans which are still accruing interest but on which principal or interest payments are contractually past due 90 days or more.
| As of December 31, | As of December 31, | |||||||||||||||||||||||
| 2010 | 2011 | 2010 | 2011 | 2012 | 2013 | |||||||||||||||||||
| (in billions of Won) | (in billions of Won) | |||||||||||||||||||||||
Loans accounted for on a non-accrual basis | ||||||||||||||||||||||||
Corporate | (Won) | 2,466 | (Won) | 2,021 | ₩ | 2,466 | ₩ | 2,021 | ₩ | 1,851 | ₩ | 2,220 | ||||||||||||
Consumer | 1,012 | 1,200 | 1,012 | 1,200 | 1,290 | 1,253 | ||||||||||||||||||
|
|
|
|
|
| |||||||||||||||||||
Sub-total | 3,478 | 3,221 | 3,478 | 3,221 | 3,141 | 3,473 | ||||||||||||||||||
|
|
|
|
|
| |||||||||||||||||||
Accruing loans which are contractually past due 90 days or more as to principal or interest | ||||||||||||||||||||||||
Corporate | 5 | 4 | 5 | 4 | 84 | 98 | ||||||||||||||||||
Consumer | 28 | 45 | 28 | 45 | 97 | 116 | ||||||||||||||||||
|
|
|
|
|
| |||||||||||||||||||
Sub-total | 33 | 49 | 33 | 49 | 181 | 214 | ||||||||||||||||||
|
|
|
|
|
| |||||||||||||||||||
Total | (Won) | 3,511 | (Won) | 3,270 | ₩ | 3,511 | ₩ | 3,270 | ₩ | 3,322 | ₩ | 3,687 | ||||||||||||
|
|
|
|
|
| |||||||||||||||||||
Under U.S. GAAP, we generally placed loans on non-accrual status when payments of interest and/or principal became past due by one day. For the year ended December 31, 2009, we would have recorded gross interest income of (Won)278₩278 billion on loans accounted for on a non-accrual basis under U.S. GAAP in accordance with the foregoing throughout the year, or since origination for loans held for part of the year, had we not foregone interest on those loans. Under U.S. GAAP, the amount of interest income on those loans that was included in our net income for the year ended December 31, 2009 was (Won)193₩193 billion.
The following table shows, as of the datesdate indicated, the amount of loans that were placed on a non-accrual basis and accruing loans under U.S. GAAP which were past due one day or more:
| As of December 31, | ||||||||||||
| 2007 | 2008 | 2009 | ||||||||||
| (in billions of Won) | ||||||||||||
Loans accounted for on a non-accrual basis | ||||||||||||
Corporate | (Won) | 1,319 | (Won) | 1,986 | (Won) | 2,243 | ||||||
Consumer | 3,557 | 3,669 | 2,124 | |||||||||
|
|
|
|
|
| |||||||
Sub-total | 4,876 | 5,655 | 4,367 | |||||||||
|
|
|
|
|
| |||||||
Accruing loans which are contractually past due one day or more as to principal or interest | ||||||||||||
Corporate (1) | 51 | 313 | 125 | |||||||||
Consumer | 281 | 226 | 124 | |||||||||
|
|
|
|
|
| |||||||
Sub-total | 332 | 539 | 249 | |||||||||
|
|
|
|
|
| |||||||
Total | (Won) | 5,208 | (Won) | 6,194 | (Won) | 4,616 | ||||||
|
|
|
|
|
| |||||||
| As of December 31, | ||||
| 2009 | ||||
| (in billions of Won) | ||||
Loans accounted for on a non-accrual basis | ||||
Corporate | ₩ | 2,243 | ||
Consumer | 2,124 | |||
Sub-total | 4,367 | |||
Accruing loans which are contractually past due one day or more as to principal or interest | ||||
Corporate (1) | 125 | |||
Consumer | 124 | |||
Sub-total | 249 | |||
Total | ₩ | 4,616 | ||
| (1) | Includes accruing corporate loans which are contractually past due 90 days or more in the amount of |
Troubled Debt Restructurings
The following table presents, as of the dates indicated, our loans whichthat are “troubled debt restructurings” as defined in Accounting Standards Codification 310-40.for which we, for economic or legal reasons relating to the debtor’s financial difficulties, grant a concession to the debtor that we would not otherwise consider. These loans consist principally of corporate loans that have been restructured (through the process of workout, court receivership or composition) and which are accruing interest at rates lower than the original contractual terms as a result of a variation of terms upon restructuring.
| As of December 31, | ||||||||||||||||||||
| 2007 | 2008 | 2009 | 2010 | 2011 | ||||||||||||||||
| (in billions of Won) | ||||||||||||||||||||
Loans classified as “troubled debt restructurings” | (Won) | 271 | (Won) | 187 | (Won) | 116 | (Won) | 573 | (Won) | 412 | ||||||||||
| As of December 31, | ||||||||||||||||||||
| 2009 | 2010 | 2011 | 2012 | 2013 | ||||||||||||||||
| (in billions of Won) | ||||||||||||||||||||
Loans classified as “troubled debt restructurings” | ₩ | 116 | ₩ | 573 | ₩ | 412 | ₩ | 465 | ₩ | 269 | ||||||||||
For 2011,2013, interest income that would have been recorded under the original contract terms of restructured loans amounted to (Won)48₩36 billion, out of which (Won)31₩19 billion was reflected as interest income during 2011.2013.
Potential Problem Loans
AsWe classify potential problem loans as loans that are designated as “early warning loans” and reported to the Financial Services Commission. “Early warning loans” are loans extended to borrowers that have been (i) identified by our early warning system as exhibiting signs of December 31, 2011,credit risk based on the relevant borrower’s financial data, credit information and/or transactions with banks and, following such identification and (ii) designated by our loan officers as potential problem borrowers based on their evaluation of known information about such borrowers’ possible credit problems. Such loans are required to be reported on a quarterly basis to the Financial Services Commission. If a borrower’s loans are designated as “early warning loans” pursuant to the process described above and included in our quarterly report to the Financial Services Commission, we had (Won)3,833 billion of loans which were current asconsider such borrowers to payment of principal and interest but where there existedhave serious doubt as to thetheir ability of the borrower to comply with repayment terms in the near future.
As of December 31, 2013, we had ₩2,776 billion of potential problem loans.
Other Problematic Interest Earning Assets
We have certain other interest earning assets received in connection with troubled debt restructurings that, if they were loans, would be required to be disclosed as part of the non-accrual, past due or restructuring or potential problem loan disclosures provided above. As of December 31, 2007, 2008, 2009, 2010, 2011, 2012 and 2011,2013, we did not have any debt securities received in connection with troubled debt restructurings on which interest was past due.
Non-Performing Loans
Non-performing loans are defined as loans that are past due by 90 days or more. These loans are generally classified as “substandard” or below. For further information on the classification of non-performing loans under Korean regulatory requirements, see “—Regulatory Reserve for Credit Losses” below.
The following table shows, as of the dates indicated, certain details of our total non-performing loan portfolio under IFRS:
| As of December 31, | As of December 31, | |||||||||||||||||||||||
| 2010 | 2011 | 2010 | 2011 | 2012 | 2013 | |||||||||||||||||||
| (in billions of Won, except percentages) | (in billions of Won, except percentages) | |||||||||||||||||||||||
Total non-performing loans | (Won) | 1,516 | (Won) | 1,117 | ₩ | 1,612 | ₩ | 1,180 | ₩ | 1,606 | ₩ | 1,421 | ||||||||||||
As a percentage of total loans | 0.8 | % | 0.5 | % | 0.8 | % | 0.5 | % | 0.7 | % | 0.6 | % | ||||||||||||
The following table shows, as of the datesdate indicated, certain details of our total non-performing loan portfolio under U.S. GAAP:
| As of December 31, | ||||||||||||
| 2007 | 2008 | 2009 | ||||||||||
| (in billions of Won, except percentages) | ||||||||||||
Total non-performing loans | (Won) | 1,339 | (Won) | 1,068 | (Won) | 1,365 | ||||||
As a percentage of total loans | 0.8 | % | 0.5 | % | 0.7 | % | ||||||
We have also issued securities backed by
| As of December 31, | ||||
| 2009 | ||||
| (in billions of Won, except percentages) | ||||
Total non-performing loans | ₩ | 1,365 | ||
As a percentage of total loans | 0.7 | % | ||
Analysis of Non-Performing Loans
The following table sets forth, as of the dates indicated, our total non-performing loans by type of borrower under IFRS:
| As of December 31, | As of December 31, | |||||||||||||||||||||||||||||||||||||||||||||||
| 2010 | 2011 | 2010 | 2011 | 2012 | 2013 | |||||||||||||||||||||||||||||||||||||||||||
| Amount | % | Amount | % | Amount | % | Amount | % | Amount | % | Amount | % | |||||||||||||||||||||||||||||||||||||
| (in billions of Won, except percentages) | (in billions of Won, except percentages) | |||||||||||||||||||||||||||||||||||||||||||||||
Domestic: | ||||||||||||||||||||||||||||||||||||||||||||||||
Corporate | ||||||||||||||||||||||||||||||||||||||||||||||||
Small- and medium sized enterprise | (Won) | 686 | 45.2 | % | (Won) | 373 | 33.4 | % | ||||||||||||||||||||||||||||||||||||||||
Small- and medium-sized enterprise | ₩ | 686 | 42.5 | % | ₩ | 373 | 31.6 | % | ₩ | 680 | 42.4 | % | ₩ | 568 | 40.0 | % | ||||||||||||||||||||||||||||||||
Large corporate | 145 | 9.6 | 21 | 1.9 | 241 | 15.0 | 84 | 7.1 | 97 | 6.0 | 158 | 11.1 | ||||||||||||||||||||||||||||||||||||
|
|
|
|
|
|
|
|
|
|
|
| |||||||||||||||||||||||||||||||||||||
Total corporate | 831 | 54.8 | 394 | 35.3 | 927 | 57.5 | 457 | 38.7 | 777 | 48.4 | 726 | 51.1 | ||||||||||||||||||||||||||||||||||||
Retail | ||||||||||||||||||||||||||||||||||||||||||||||||
Mortgage and home equity | 478 | 31.5 | 510 | 45.7 | 478 | 29.7 | 510 | 43.2 | 625 | 38.9 | 394 | 27.7 | ||||||||||||||||||||||||||||||||||||
Other consumer | 163 | 10.8 | 132 | 11.8 | 163 | 10.1 | 132 | 11.2 | 137 | 8.5 | 152 | 10.7 | ||||||||||||||||||||||||||||||||||||
|
|
|
|
|
|
|
|
|
|
|
| |||||||||||||||||||||||||||||||||||||
Total retail | 641 | 42.3 | 642 | 57.5 | 641 | 39.8 | 642 | 54.4 | 762 | 47.4 | 546 | 38.4 | ||||||||||||||||||||||||||||||||||||
Credit cards | 39 | 2.6 | 62 | 5.6 | 39 | 2.4 | 62 | 5.3 | 47 | 2.9 | 107 | 7.5 | ||||||||||||||||||||||||||||||||||||
|
|
|
| |||||||||||||||||||||||||||||||||||||||||||||
Total domestic | 1,511 | 99.7 | 1,098 | 98.4 | 1,607 | 99.7 | 1,161 | 98.4 | 1,586 | 98.7 | 1,379 | 97.0 | ||||||||||||||||||||||||||||||||||||
Foreign: | 5 | 0.3 | 19 | 1.6 | 5 | 0.3 | 19 | 1.6 | 20 | 1.3 | 42 | 3.0 | ||||||||||||||||||||||||||||||||||||
|
|
|
|
|
|
|
|
|
|
|
| |||||||||||||||||||||||||||||||||||||
Total non-performing loans | (Won) | 1,516 | 100.0 | % | (Won) | 1,117 | 100.0 | % | ₩ | 1,612 | 100.0 | % | ₩ | 1,180 | 100.0 | % | ₩ | 1,606 | 100.0 | % | ₩ | 1,421 | 100.0 | % | ||||||||||||||||||||||||
|
|
|
|
|
|
|
|
|
|
|
| |||||||||||||||||||||||||||||||||||||
The following table sets forth, as of the datesdate indicated, our total non-performing loans by type of borrower under U.S. GAAP:
| As of December 31, | As of December 31, | |||||||||||||||||||||||||||||||
| 2007 | 2008 | 2009 | 2009 | |||||||||||||||||||||||||||||
| Amount | % | Amount | % | Amount | % | Amount | % | |||||||||||||||||||||||||
| (in billions of Won, except percentages) | (in billions of Won, except percentages) | |||||||||||||||||||||||||||||||
Domestic: | ||||||||||||||||||||||||||||||||
Corporate | ||||||||||||||||||||||||||||||||
Commercial and industrial | (Won) | 822 | 61.4 | % | (Won) | 556 | 52.1 | % | (Won) | 899 | 65.8 | % | ₩ | 899 | 65.8 | % | ||||||||||||||||
Construction | 88 | 6.6 | 161 | 15.1 | 125 | 9.2 | 125 | 9.2 | ||||||||||||||||||||||||
Lease financing | — | — | — | — | — | — | — | — | ||||||||||||||||||||||||
Other corporate | 3 | 0.2 | 1 | 0.1 | 2 | 0.2 | 2 | 0.2 | ||||||||||||||||||||||||
|
|
|
|
|
|
|
| |||||||||||||||||||||||||
Total corporate | 913 | 68.2 | 718 | 67.3 | 1,026 | 75.2 | 1,026 | 75.2 | ||||||||||||||||||||||||
Retail | ||||||||||||||||||||||||||||||||
Mortgage and home equity | 297 | 22.2 | 216 | 20.2 | 211 | 15.4 | 211 | 15.4 | ||||||||||||||||||||||||
Other consumer | 101 | 7.5 | 86 | 8.0 | 79 | 5.8 | 79 | 5.8 | ||||||||||||||||||||||||
|
|
|
|
|
|
|
| |||||||||||||||||||||||||
Total retail | 398 | 29.7 | 302 | 28.2 | 290 | 21.2 | 290 | 21.2 | ||||||||||||||||||||||||
Credit cards | 27 | 2.0 | 29 | 2.7 | 23 | 1.7 | 23 | 1.7 | ||||||||||||||||||||||||
|
|
|
|
|
| |||||||||||||||||||||||||||
Total domestic | 1,338 | 99.9 | 1,049 | 98.2 | 1,339 | 98.1 | 1,339 | 98.1 | ||||||||||||||||||||||||
Foreign: | 1 | 0.1 | 19 | 1.8 | 26 | 1.9 | 26 | 1.9 | ||||||||||||||||||||||||
|
|
|
|
|
|
|
| |||||||||||||||||||||||||
Total non-performing loans | (Won) | 1,339 | 100.0 | % | (Won) | 1,068 | 100.0 | % | (Won) | 1,365 | 100.0 | % | ₩ | 1,365 | 100.0 | % | ||||||||||||||||
|
|
|
|
|
|
|
| |||||||||||||||||||||||||
Top 20 Non-Performing Loans
As of December 31, 2011,2013, our 20 largest non-performing loans accounted for 16.8%27.8% of our total non-performing loan portfolio. The following table shows, as of December 31, 2011,2013, certain information regarding our 20 largest non-performing loans:
| Industry | Gross Principal Outstanding | Allowances for Loan Losses | ||||||||
| (in billions of Won) | ||||||||||
Borrower A | Service | (Won) | 29 | (Won) | 7 | |||||
Borrower B | Service | 20 | 2 | |||||||
Borrower C | Other | 18 | 4 | |||||||
Borrower D | Service | 13 | 13 | |||||||
Borrower E | Other | 12 | — | |||||||
Borrower F | Manufacturing | 10 | — | |||||||
Borrower G | Other | 8 | 6 | |||||||
Borrower H | Service | 8 | 5 | |||||||
Borrower I | Manufacturing | 8 | 1 | |||||||
Borrower J | Service | 8 | 2 | |||||||
Borrower K | Manufacturing | 8 | 1 | |||||||
Borrower L | Service | 7 | 4 | |||||||
Borrower M | Manufacturing | 6 | 6 | |||||||
Borrower N | Manufacturing | 6 | 1 | |||||||
Borrower O | Financial institutions | 6 | 3 | |||||||
Borrower P | Other | 5 | — | |||||||
Borrower Q | Manufacturing | 4 | — | |||||||
Borrower R | Manufacturing | 4 | 2 | |||||||
Borrower S | Manufacturing | 4 | 3 | |||||||
Borrower T | Other | 4 | 4 | |||||||
|
|
|
| |||||||
Total | (Won) | 188 | (Won) | 64 | ||||||
|
|
|
| |||||||
Most of our loans to companies in workout or restructuring were not classified as non-performing as of December 31, 2011 because such loans had been rescheduled and payments on such rescheduled loans were not past due by more than 90 days.
| Industry | Gross Principal Outstanding | Allowances for Loan Losses | ||||||||
| (in billions of Won) | ||||||||||
Borrower A | Manufacturing | ₩ | 55 | ₩ | 6 | |||||
Borrower B | Construction | 38 | 22 | |||||||
Borrower C | Manufacturing | 29 | 5 | |||||||
Borrower D | Manufacturing | 29 | 9 | |||||||
Borrower E | Manufacturing | 28 | 28 | |||||||
Borrower F | Services | 23 | 1 | |||||||
Borrower G | Financial institutions | 22 | 1 | |||||||
Borrower H | Construction | 17 | 4 | |||||||
Borrower I | Construction | 17 | 3 | |||||||
Borrower J | Services | 15 | 1 | |||||||
Borrower K | Others | 15 | 1 | |||||||
Borrower L | Construction | 15 | 3 | |||||||
Borrower M | Services | 14 | 1 | |||||||
Borrower N | Services | 13 | 1 | |||||||
Borrower O | Manufacturing | 13 | 13 | |||||||
Borrower P | Construction | 12 | 1 | |||||||
Borrower Q | Construction | 11 | 1 | |||||||
Borrower R | Services | 11 | 11 | |||||||
Borrower S | Others | 9 | — | |||||||
Borrower T | Construction | 9 | 6 | |||||||
|
|
|
| |||||||
Total | ₩ | 395 | ₩ | 118 | ||||||
|
|
|
| |||||||
Non-Performing Loan Strategy
One of our primary objectives is to prevent our loans from becoming non-performing. Through our corporate credit rating systems, we believe that we have reduced our risks relating to future non-performing loans. Our credit rating systems are designed to prevent our loan officers from extending new loans to borrowers with high credit risks based on the borrower’s credit rating. Our early warning system is designed to bring any sudden increase in a borrower’s credit risk to the attention of our loan officers, who then closely monitor such loans. See “Item 11. Quantitative and Qualitative Disclosures about Market Risk—Credit Risk Management—Credit Review and Monitoring.”
Notwithstanding the above, if a loan becomes non-performing, an officer at the branch level responsible for monitoring non-performing loans will commence a due diligence review of the borrower’s assets, send a notice either demanding payment or stating that we will take legal action and prepare for legal action.
At the same time, we also initiate our non-performing loan management process, which begins with:
identifying loans subject to a proposed sale by assessing the estimated losses from such sale based on the estimated recovery value of collateral, if any, for such non-performing loans;
identifying loans subject to charge-off based on the estimated recovery value of collateral, if any, for such non-performing loans and the estimated rate of recovery of unsecured loans; and
on a limited basis, identifying corporate loans subject to normalization efforts based on the cash-flow situation of the borrower.
Once the details of a non-performing loan are identified, we pursue early solutions for recovery. While the overall process is the responsibility of Kookmin Bank’s Credit Analysis Group, actual recovery efforts on non-performing loans are handled at the operating branch level.
In addition, we use the services of our wholly-owned loan collection subsidiary, KB Credit Information Co., Ltd., which receives payments from recoveries made on charged-off loans and certain loans that are overdue for over three months (35(28 days on average in the case of credit card loans). KB Credit Information has over 570140 employees, including legal experts and management employees. The fees that it receives are based on the amounts of non-performing and charged off loans that are recovered. In 2009, under U.S. GAAP,2011, 2012 and 2013, the amount recovered was (Won)426 billion. In 2010 and 2011, under IFRS, the amount recovered was (Won)329₩468 billion, ₩589 billion and (Won)468₩473 billion, respectively.
Methods for resolving non-performing loans include the following:
non-performing loans are managed by the operating branches of Kookmin Bank until such loans are charged off;
a demand note is dispatched by mail if payment is generally one month past due;
calls and visits are made by Kookmin Bank’s operating branches to customers encouraging them to make payments;
borrowers who are past due on payments of interest and principal are registered on the Korea Federation of Banks’ database of non-performing loans;
for unsecured loans other than credit card loans, the loans are transferred to KB Credit Information for collection on a case-by-case basis;
for secured loans, actions to enforce or protect the security interests (including foreclosure and auction of the collateral) are commenced within four months of such loans becoming past due; and
charged off loans are given to KB Credit Information for collection, except for loans where the cost of collection exceeds the possible recovery or where the statute of limitations for collection has expired.
In addition, credit card loans that are in arrears for over 3028 days on average are transferred to KB Credit Information for collection.
If a loan becomes non-performing, it is managed by an operating branch of Kookmin Bank until such loan is charged off. However, in order to promote speedy recovery on loans subject to foreclosures and litigation, our policy is to permit the branch responsible for handling these loans to request one of Kookmin Bank’s regional head offices for assistance with litigation proceedings and proceedings related to foreclosure and auction of the collateral.
In addition to making efforts to collect on these non-performing loans, we also undertake measures to reduce the level of our non-performing loans, which include:
selling our non-performing loans to third parties, including the Korea Asset Management Corporation;Corporation and Woori F&I Co., Ltd.; and
entering into asset securitization transactions with respect to our non-performing loans.
We generally expect to suffer a partial loss on loans that we sell or securitize, to the extent such sales and securitizations are recognized under IFRS as sale transactions.
Pursuant to a memorandum of understanding among the Financial Supervisory Service and seven banks, including Kookmin Bank, a private equity fund was established in June 2011 to acquire approximately (Won)1.2₩1.2 trillion of non-performing bank loans to construction companies in workout, restructuring or rehabilitation. The
general partner of the fund is United Asset Management Corp. and the limited partners consist of the seven banks and other investors. The fund purchases non-performing bank loans at market price and the funds required to purchase such loans are contributed or lent by the same banks that sell such loans to the fund. In June 2011, we agreed to make a capital commitment of (Won)148₩148 billion and provide a (Won)109₩109 billion revolving loan facility to the fund. From June to December 2011, we contributed the entire amount of our capital commitment to the fund in connection with its purchase of (Won)148₩148 billion of non-performing loans from us. In September 2012, we agreed to increase our capital commitment to ₩241 billion. From September to December 2012, we contributed ₩44 billion to the fund. In December 2013, our revolving loan facility to the fund was decreased to ₩55 billion. We have made no additional capital commitments to the fund in 2013.
Allocation and Analysis of Allowances for Loan Losses under IFRS
The following table presents, as of the dates indicated, the allocation of our allowances for loan losses by loan type under IFRS. The ratio represents the percentage of allowances for loan losses in each category to total allowances for loan losses.
| As of December 31, | As of December 31, | |||||||||||||||||||||||||||||||||||||||||||||||
| 2010 | 2011 | 2010 | 2011 | 2012 | 2013 | |||||||||||||||||||||||||||||||||||||||||||
| Amount | % | Amount | % | Amount | % | Amount | % | Amount | % | Amount | % | |||||||||||||||||||||||||||||||||||||
| (in billions of Won, except percentages) | (in billions of Won, except percentages) | |||||||||||||||||||||||||||||||||||||||||||||||
Domestic | ||||||||||||||||||||||||||||||||||||||||||||||||
Corporate | ||||||||||||||||||||||||||||||||||||||||||||||||
Small- and medium-sized enterprise | (Won) | 2,028 | 54.0 | % | (Won) | 1,533 | 44.4 | % | ₩ | 2,028 | 54.0 | % | ₩ | 1,533 | 44.4 | % | ₩ | 1,234 | 37.7 | % | ₩ | 1,023 | 35.8 | % | ||||||||||||||||||||||||
Large corporate | 863 | 23.0 | 910 | 26.4 | 863 | 23.0 | 910 | 26.4 | 999 | 30.6 | 785 | 27.4 | ||||||||||||||||||||||||||||||||||||
|
|
|
|
|
|
|
|
|
|
|
| |||||||||||||||||||||||||||||||||||||
Total corporate | 2,891 | 77.0 | 2,443 | 70.8 | 2,891 | 77.0 | 2,443 | 70.8 | 2,233 | 68.3 | 1,808 | 63.2 | ||||||||||||||||||||||||||||||||||||
|
|
|
|
|
|
|
|
|
|
|
| |||||||||||||||||||||||||||||||||||||
Retail | ||||||||||||||||||||||||||||||||||||||||||||||||
Mortgage and home equity | 88 | 2.3 | 111 | 3.2 | 88 | 2.3 | 111 | 3.2 | 123 | 3.8 | 93 | 3.3 | ||||||||||||||||||||||||||||||||||||
Other consumer | 432 | 11.5 | 524 | 15.2 | 432 | 11.5 | 524 | 15.2 | 565 | 17.2 | 486 | 17.0 | ||||||||||||||||||||||||||||||||||||
|
|
|
|
|
|
|
|
|
|
|
| |||||||||||||||||||||||||||||||||||||
Total retail | 520 | 13.8 | 635 | 18.4 | 520 | 13.8 | 635 | 18.4 | 688 | 21.0 | 579 | 20.3 | ||||||||||||||||||||||||||||||||||||
|
|
|
|
|
|
|
|
|
|
|
| |||||||||||||||||||||||||||||||||||||
Credit cards | 328 | 8.7 | 350 | 10.2 | 328 | 8.7 | 350 | 10.2 | 329 | 10.1 | 410 | 14.3 | ||||||||||||||||||||||||||||||||||||
Foreign(1) | 17 | 0.5 | 20 | 0.6 | 17 | 0.5 | 20 | 0.6 | 19 | 0.6 | 64 | 2.2 | ||||||||||||||||||||||||||||||||||||
|
|
|
|
|
|
|
|
|
|
|
| |||||||||||||||||||||||||||||||||||||
Total allowances for loan losses | (Won) | 3,756 | 100.0 | % | (Won) | 3,448 | 100.0 | % | ₩ | 3,756 | 100.0 | % | ₩ | 3,448 | 100.0 | % | ₩ | 3,269 | 100.0 | % | ₩ | 2,861 | 100.0 | % | ||||||||||||||||||||||||
|
|
|
|
|
|
|
|
|
|
|
| |||||||||||||||||||||||||||||||||||||
| (1) | Consists primarily of loans to corporations. |
Our total allowances for loan losses were (Won)3,756₩3,756 billion as of December 31, 2010. During 2011, total allowances for loan losses decreased by (Won)308₩308 billion, or 8.2%, to (Won)3,448₩3,448 billion as of December 31, 2011. During 2012, total allowances for loan losses decreased by ₩179 billion, or 5.2%, to ₩3,269 billion as of December 31, 2012. During 2013, total allowances for loan losses decreased by ₩408 billion, or 12.5%, to ₩2,861 billion as of December 31, 2013.
The following table analyzes our allowances for loan losses and loan loss experience under IFRS for each of the years indicated:
| Year Ended December 31, | Year Ended December 31, | |||||||||||||||||||||||
| 2010 | 2011 | 2010 | 2011 | 2012 | 2013 | |||||||||||||||||||
| (in billions of Won, except percentages) | (in billions of Won, except percentages) | |||||||||||||||||||||||
Balance at the beginning of the period | (Won) | 3,269 | (Won) | 3,756 | ₩ | 3,269 | ₩ | 3,756 | ₩ | 3,448 | ₩ | 3,269 | ||||||||||||
Changes in accounting policy (1) | — | — | — | — | ||||||||||||||||||||
Restated balance at the beginning of the period | 3,269 | 3,756 | 3,448 | 3,269 | ||||||||||||||||||||
Amounts charged against income | 2,464 | 1,645 | 2,464 | 1,645 | 1,653 | 1,427 | ||||||||||||||||||
Sale | (193 | ) | (240 | ) | (193 | ) | (240 | ) | (105 | ) | (84 | ) | ||||||||||||
Gross charge-offs: | ||||||||||||||||||||||||
Domestic: | ||||||||||||||||||||||||
Corporate | ||||||||||||||||||||||||
Small- and medium-sized enterprise | 1,541 | 1,274 | 1,541 | 1,274 | 943 | 691 | ||||||||||||||||||
Large corporate | 55 | 204 | 55 | 204 | 260 | 454 | ||||||||||||||||||
Retail | ||||||||||||||||||||||||
Mortgage and home equity | 37 | 20 | 37 | 20 | 62 | 134 | ||||||||||||||||||
Other consumer | 237 | 267 | 237 | 267 | �� | 391 | 447 | |||||||||||||||||
Credit cards | 389 | 413 | 389 | 413 | 541 | 404 | ||||||||||||||||||
Foreign: | 20 | 3 | 20 | 3 | — | 2 | ||||||||||||||||||
|
|
|
|
|
| |||||||||||||||||||
Total gross charge-offs | (2,279 | ) | (2,181 | ) | (2,279 | ) | (2,181 | ) | (2,197 | ) | (2,132 | ) | ||||||||||||
|
|
|
|
|
| |||||||||||||||||||
Recoveries: | ||||||||||||||||||||||||
Domestic: | ||||||||||||||||||||||||
Corporate | ||||||||||||||||||||||||
Small-and medium-sized enterprise | 133 | 162 | 133 | 162 | 149 | 145 | ||||||||||||||||||
Large corporate | 1 | 6 | 1 | 6 | 9 | — | ||||||||||||||||||
Retail | ||||||||||||||||||||||||
Mortgage and home equity | 14 | 13 | 14 | 13 | 7 | 22 | ||||||||||||||||||
Other consumer | 114 | 104 | 114 | 104 | 97 | 105 | ||||||||||||||||||
Credit cards | 246 | 204 | 246 | 204 | 185 | 141 | ||||||||||||||||||
Foreign: | 4 | 1 | 4 | 1 | 3 | 2 | ||||||||||||||||||
|
|
|
|
|
| |||||||||||||||||||
Total recoveries | 512 | 490 | 512 | 490 | 450 | 415 | ||||||||||||||||||
|
|
|
|
|
| |||||||||||||||||||
Net charge-offs | (1,767 | ) | (1,691 | ) | (1,767 | ) | (1,691 | ) | (1,747 | ) | (1,717 | ) | ||||||||||||
Other charges | (17 | ) | (22 | ) | (17 | ) | (22 | ) | 20 | (34 | ) | |||||||||||||
|
|
|
|
|
| |||||||||||||||||||
Balance, at the end of the period | (Won) | 3,756 | (Won) | 3,448 | ₩ | 3,756 | ₩ | 3,448 | ₩ | 3,269 | ₩ | 2,861 | ||||||||||||
|
|
|
|
|
| |||||||||||||||||||
Ratio of net charge-offs during the period to average loans outstanding during the period | 0.9 | % | 0.8 | % | 0.9 | % | 0.8 | % | 0.8 | % | 0.8 | % | ||||||||||||
| (1) | The amounts for 2013 reflect a change in our accounting policies pursuant to the adoption of IFRS 10,Consolidated Financial Statements, which is effective beginning in 2013. Corresponding amounts for 2012 (but not for 2011 or 2010) have been restated to retroactively apply such change. See “—Overview—Changes in Accounting Policies.” |
Allocation and Analysis of Allowances for Loan Losses under U.S. GAAP
The following table presents, as of the datesdate indicated, the allocation of our allowances for loan losses by loan type under U.S. GAAP. The ratio represents the percentage of allowances for loan losses in each category to total allowances for loan losses.
| As of December 31, | As of December 31, | |||||||||||||||||||||||||||||||
| 2007 | 2008 | 2009 | 2009 | |||||||||||||||||||||||||||||
| Amount | % | Amount | % | Amount | % | Amount | % | |||||||||||||||||||||||||
| (in billions of Won, except percentages) | (in billions of Won, except percentages) | |||||||||||||||||||||||||||||||
Domestic | ||||||||||||||||||||||||||||||||
Corporate | ||||||||||||||||||||||||||||||||
Commercial and industrial | (Won) | 1,071 | 35.5 | % | (Won) | 1,707 | 37.7 | % | (Won) | 2,165 | 38.1 | % | ₩ | 2,165 | 38.1 | % | ||||||||||||||||
Construction | 175 | 5.1 | 674 | 5.0 | 457 | 4.1 | 457 | 4.1 | ||||||||||||||||||||||||
Other corporate | 14 | 1.0 | 26 | 1.5 | 25 | 1.1 | 25 | 1.1 | ||||||||||||||||||||||||
|
|
|
|
|
|
|
| |||||||||||||||||||||||||
Total corporate | 1,260 | 41.6 | 2,407 | 44.2 | 2,647 | 43.3 | 2,647 | 43.3 | ||||||||||||||||||||||||
Retail | ||||||||||||||||||||||||||||||||
Mortgage and home equity | 114 | 38.2 | 107 | 35.0 | 125 | 36.0 | 125 | 36.0 | ||||||||||||||||||||||||
Other consumer | 314 | 13.3 | 271 | 13.8 | 336 | 13.7 | 336 | 13.7 | ||||||||||||||||||||||||
|
|
|
|
|
|
|
| |||||||||||||||||||||||||
Total retail | 428 | 51.5 | 378 | 48.8 | 461 | 49.7 | 461 | 49.7 | ||||||||||||||||||||||||
Credit cards | 165 | 6.1 | 213 | 5.8 | 202 | 5.8 | 202 | 5.8 | ||||||||||||||||||||||||
Foreign(1) | 11 | 0.8 | 45 | 1.2 | 31 | 1.2 | 31 | 1.2 | ||||||||||||||||||||||||
|
|
|
|
|
|
|
| |||||||||||||||||||||||||
Total allowances for loan losses | (Won) | 1,864 | 100.0 | % | (Won) | 3,043 | 100.0 | % | (Won) | 3,341 | 100.0 | % | ₩ | 3,341 | 100.0 | % | ||||||||||||||||
|
|
|
|
|
|
|
| |||||||||||||||||||||||||
| (1) | Consists primarily of loans to corporations. |
The following table analyzes our allowances for loan losses and loan loss experience under U.S. GAAP for each of the yearsyear indicated:
| Year Ended December 31, | ||||||||||||
| 2007 | 2008 | 2009 | ||||||||||
| (in billions of Won, except percentages) | ||||||||||||
Balance at the beginning of the period | (Won) | 2,468 | (Won) | 1,864 | (Won) | 3,043 | ||||||
Amounts charged against income | 109 | 2,142 | 2,216 | |||||||||
Allowance relating to loans repurchased | 1 | 3 | 7 | |||||||||
Gross charge-offs: | ||||||||||||
Domestic: | ||||||||||||
Corporate | ||||||||||||
Commercial and industrial | 580 | 703 | 975 | |||||||||
Construction | 108 | 140 | 460 | |||||||||
Other corporate | 4 | 5 | 15 | |||||||||
Retail | ||||||||||||
Mortgage and home equity | 49 | 63 | 33 | |||||||||
Other consumer | 275 | 279 | 329 | |||||||||
Credit cards | 331 | 375 | 571 | |||||||||
Foreign: | — | — | — | |||||||||
|
|
|
|
|
| |||||||
Total gross charge-offs | (1,347 | ) | (1,565 | ) | (2,383 | ) | ||||||
|
|
|
|
|
| |||||||
Recoveries: | ||||||||||||
Domestic: | ||||||||||||
Corporate | ||||||||||||
Commercial and industrial | 98 | 98 | 54 | |||||||||
Construction | 21 | 13 | 10 | |||||||||
Other corporate | 1 | 2 | 1 | |||||||||
Retail | ||||||||||||
Mortgage and home equity | 16 | 32 | 12 | |||||||||
Other consumer | 196 | 177 | 125 | |||||||||
Credit cards | 301 | 277 | 256 | |||||||||
Foreign: | — | — | — | |||||||||
|
|
|
|
|
| |||||||
Total recoveries | 633 | 599 | 458 | |||||||||
|
|
|
|
|
| |||||||
Net charge-offs | (714 | ) | (966 | ) | (1,925 | ) | ||||||
|
|
|
|
|
| |||||||
Balance, at the end of the period | (Won) | 1,864 | (Won) | 3,043 | (Won) | 3,341 | ||||||
|
|
|
|
|
| |||||||
Ratio of net charge-offs during the period to average loans outstanding during the period | 0.4 | % | 0.5 | % | 1.0 | % | ||||||
| Year Ended December 31, | ||||
| 2009 | ||||
| (in billions of Won, except percentages) | ||||
Balance at the beginning of the period | ₩ | 3,043 | ||
Amounts charged against income | 2,216 | |||
Allowance relating to loans repurchased | 7 | |||
Gross charge-offs: | ||||
Domestic: | ||||
Corporate | ||||
Commercial and industrial | 975 | |||
Construction | 460 | |||
Other corporate | 15 | |||
Retail | ||||
Mortgage and home equity | 33 | |||
Other consumer | 329 | |||
Credit cards | 571 | |||
Foreign: | — | |||
Total gross charge-offs | (2,383 | ) | ||
Recoveries: | ||||
Domestic: | ||||
Corporate | ||||
Commercial and industrial | 54 | |||
Construction | 10 | |||
Other corporate | 1 | |||
Retail | ||||
Mortgage and home equity | 12 | |||
Other consumer | 125 | |||
Credit cards | 256 | |||
Foreign: | — | |||
Total recoveries | 458 | |||
Net charge-offs | (1,925 | ) | ||
Balance at the end of the period | ₩ | 3,341 | ||
Ratio of net charge-offs during the period to average loans outstanding during the period | 1.0 | % | ||
Regulatory Reserve for Credit Losses
If our allowances for credit losses isare deemed insufficient for regulatory purposes, we are required to compensate for the difference by recording a regulatory reserve for credit losses, which is segregated within our retained earnings. The level of regulatory reserve for credit losses required to be recorded is equal to the amount by which our allowances for credit losses under IFRS are less than the greater of (x) the amount of expected loss calculated using the internal ratings-based approach under Basel II and as approved by the Financial Supervisory Service and (y) the required amount of credit loss reserve calculated based on guidelines prescribed by the Financial Services Commission. As of December 31, 2011,2013, our regulatory reserve for credit losses was (Won)1,816₩2,280 billion. See Note 25 of the notes to our consolidated financial statements included elsewhere in this annual report.
The following tables set forth the Financial Services Commission’s guidelines for the classification of loans and the minimum percentages of the outstanding principal amount of the relevant loans or balances that the credit loss reserve must cover:
Loan | Loan Characteristics | |
| Normal | Loans made to customers whose financial position, future cash flows and nature of business are deemed financially sound. No problems in recoverability are expected. | |
| Precautionary | Loans made to customers whose financial position, future cash flows and nature of business show potential weakness, although there is no immediate risk of non-repayment. | |
| Substandard | Loans to customers whose adverse financial position, future cash flows and nature of business have a direct effect on the repayment of the loan. | |
| Doubtful | Loans to customers whose financial position, future cash flows and nature of business are so weak that significant risk exists in the recoverability of the loan to the extent the outstanding amount exceeds any collateral pledged. | |
| Estimated loss | Loans where write-off is unavoidable. | |
Loan classifications | Corporate | Consumer | Credit card balances (1) | Credit card loans (2) | ||||||||||||||||||||||||||||
Loan Classifications | Corporate | Consumer | Credit Card Balances (1) | Credit Card Loans (2) | ||||||||||||||||||||||||||||
Normal | 0.85% or above | 1% or above | 1.1% or above | 2.5% or above | 0.85% or above | 1% or above | 1.1% or above | 2.5% or above | ||||||||||||||||||||||||
Precautionary | 7% or above | 10% or above | 40% or above | 50% or above | 7% or above | 10% or above | 40% or above | 50% or above | ||||||||||||||||||||||||
Substandard | 20% or above | 20% or above | 60% or above | 65% or above | 20% or above | 20% or above | 60% or above | 65% or above | ||||||||||||||||||||||||
Doubtful | 50% or above | 55% or above | 75% or above | 75% or above | 50% or above | 55% or above | 75% or above | 75% or above | ||||||||||||||||||||||||
Estimated loss | 100% | 100% | 100% | 100% | 100% | 100% | 100% | 100% | ||||||||||||||||||||||||
| (1) | Applicable for credit card balances from general purchases. |
| (2) | Applicable for cash advances, card loans and revolving credit card assets. |
Loan Charge-Offs
Basic Principles
We attempt to minimize loans to be charged off by adhering to a sound credit approval process based on credit risk analysis prior to extending loans and a systematic management of outstanding loans. However, if charge-offs are necessary, we charge off loans subject to our charge-off policy at an early stage in order to maximize accounting transparency, to minimize any waste of resources in managing loans which have a low probability of being collected and to reduce our non-performing loan ratio.
Loans To Be Charged Off
Loans are charged off if they are deemed to be uncollectible by falling under any of the following categories:
loans for which collection is not foreseeable due to insolvency, bankruptcy, compulsory execution, disorganization, dissolution or the shutting down of the business of the debtor;
loans for which collection is not foreseeable due to the death or disappearance of the debtor;
loans for which expenses of collection exceed the collectable amount;
loans on which collection is not possible through legal or any other means;
payments in arrears in respect of credit cards that have been overdue for four payment cyclesa period of six months or more and have been classified as expected loss (excluding instances where there has been partial payment of the overdue balance, where a related balance is not overdue or where a charge off is not possible due to Korean regulations); and
|
the portion of loans classified as “estimated loss,” net of any recovery from collateral, which is deemed to be uncollectible.
Procedure for Charge-off Approval
In order to charge off corporate loans, an application for a charge-off must be submitted to Kookmin Bank’s Credit Management Department promptly after the corporate loan is classified as estimated loss or deemed uncollectible. The Credit Management Department refers the charge-off application to Kookmin Bank’s Branch Audit Department for their review to ensure compliance with our internal procedures for charge-offs. Then, the Credit Management Department, after reviewing the application to confirm that it meets relevant requirements, seeks an approval from the Financial Supervisory Service for our charge-offs, which is typically granted. Once we receive approval from the Financial Supervisory Service, we must also obtain approval from our senior management to charge off those loans. For accounting purposes, we recognize charge-offs of corporate loans under IFRS prior to approval from the Financial Supervisory Service.
With respect to credit card balances and unsecured retail loans, we follow a different process to determine which credit card balances and unsecured retail loans should be charged off, based on the length of time those loans or balances are past due. We charge off unsecured retail loans deemed to be uncollectible and credit card balances which have been overdue for four payment cyclesa period of six months or more or which have been deemed to be uncollectible under IFRS.
Treatment of Loans Charged Off
Once loans are charged off, we classify them as charged-off loans and remove them from our balance sheet. These loans are managed based on a different set of procedures. We continue our collection efforts in respect of these loans, including through our subsidiary, KB Credit Information, although loans may be charged off before we begin collection efforts in some circumstances.
If a collateralized loan is overdue, we will, typically within one year from the time that such loan became overdue (or after a longer period in certain circumstances), petition a court to foreclose and sell the collateral through a court-supervised auction. If a debtor ultimately fails to repay and the court grants its approval for foreclosure, we will sell the collateral, net of expenses incurred from the auction.
Credit Rehabilitation Programs for Delinquent Consumer and Small- and Medium-sized Enterprise Borrowers
In light of the rapid increase in delinquencies in credit card and other consumer credit in recent years, and concerns regarding potential social issues posed by the growing number of individuals with bad credit, the Korean government has implemented a number of measures intended to support the rehabilitation of the credit of delinquent consumer borrowers. These measures may affect the amount and timing of our collections and recoveries on our delinquent consumer credits.
In 2002, the Financial Services Commission established the Credit Counseling and Recovery Service based upon an agreement among approximately 160 financial institutionsFor example, in Korea. Upon application to the Credit Counseling and Recovery Service and approval of a majority of unsecured and two-thirds of secured creditor financial institutions, a qualified “credit delinquent person” with outstanding debts to two or more financial institutions in an aggregate amount not exceeding (Won)500 million may participate in an individual work-out program designed to restructure such person’s debt and rehabilitate such person’s credit.
On April 1, 2006, the Law Concerning Credit Restoration and Bankruptcy took effect and replaced the Individual Debtor Rehabilitation Law. Under the Law Concerning Credit Restoration and Bankruptcy, a qualified individual debtor with outstanding debts in an aggregate amount not exceeding threshold amounts of (Won)500 million of unsecured debt and/or (Won)1 billion of secured debt may restructure his or her debts through a court-supervised debt restructuring that is binding on creditors.
On September 2, 2008, to support consumer borrowers with low credit scores, the Financial Services Commission established the Credit Rehabilitation Fund to purchase from creditors the loans of such borrowers that are in default and to provide guarantees so that such loans may be refinanced at lower rates. The Credit Rehabilitation Fund provides support to (i) individuals with low credit scores who are in default on loans not exceeding (Won)50 million in principal amount in the aggregate (which requirement will be waived for individuals who are “basic living welfare recipients”) for a period of three months or more and (ii) individuals with low credit scores ranging from category 6 to 10 who are in default on loans not exceeding (Won)30 million in principal amount in the aggregate (which requirement will be waived for individuals who are basic living welfare recipients) and the interest rate of which is 30% or more.
In October 2008, the Financial Supervisory Service requested Korean banks, including us, to establish a “fast track” program to provide liquidity assistance to small- and medium-sized enterprises on an expedited basis. Under the fast track program we established, which is effective through December 31, 2012, we provide liquidity assistance to small- and medium-sized enterprise borrowers applying for such assistance, in the form of new loans or maturity extensions or interest rate adjustments with respect to existing loans, after expedited credit review and approval by us.
In March 2009, the Financial Services Commission requested Korean banks, including us, to establish a “pre-workout program,” including a credit counseling and recovery service, for retail borrowers with outstanding short-term debt. TheUnder the pre-workout program, which has been in operation since April 2009, and, following extensions by the Korean government, is expected to continue until April 2013. Under the pre-workout program, maturity extensions and/or interest rate adjustmentsreductions are provided for retail borrowers with total loans of ₩1.5 billion or less (consisting of no more than (Won)500₩500 million of unsecured loans and ₩1 billion of secured loans) who are in arrears on their payments for more than 30 days but less than 90 days.days or for retail borrowers with an annual income of ₩40 million or less who have been in arrears on their payments for more than 30 days on an aggregate basis for the 12 months prior to their application.
In March 2013, in order to support low income consumer borrowers experiencing difficulty in repaying their unsecured long-term debt, the Financial Services Commission announced the establishment of a “National Happiness Fund” to provide one-time relief to such borrowers by:
purchasing from creditors unsecured loans of individual borrowers not exceeding ₩100 million in principal amount in the aggregate, which loans have been in arrears for a period of six months or more as of February 28, 2013 and, if requested by the borrower, reducing the balance of such loans by up to
50% and/or extending the maturity of such loans to up to ten years based on the borrower’s expected ability to repay; |
purchasing from certain creditors student loans of individual borrowers, which loans have been in arrears for a period of six months or more as of February 28, 2013 and, if requested by the borrower, restructuring the balance and/or extending the maturity of such loans based on the borrower’s expected ability to repay or extending the maturity of such loans until the borrower is employed; and
for individuals with annual income of ₩40 million or less with loans of a principal amount not exceeding ₩30 million in the aggregate and with an interest rate of 20% or higher, facilitating the refinancing of such loans at lower interest rates, provided that such loans have not been in default during the six months prior to the application for relief.
Over 3,800 Korean financial institutions and private lenders, including our subsidiaries, Kookmin Bank, KB Savings Bank and KB Kookmin Card, have signed a memorandum of understanding with the National Happiness Fund to sell eligible loans to the fund. The price and volume of such loans to be sold are subject to further negotiations between the National Happiness Fund and such financial institutions and lenders. The National Happiness Fund accepted applications from individual borrowers to participate in such relief programs until October 2013 and until January 2014 for individual borrowers of student loans from the Korea Student Aid Foundation.
Investment Portfolio
Investment Policy
We invest in and trade Won-denominated and, to a lesser extent, foreign currency-denominated securities for our own account to:
maintain the stability and diversification of our assets;
maintain adequate sources of back-up liquidity to match our funding requirements; and
supplement income from our core lending activities.
In making securities investments, we take into account a number of factors, including macroeconomic trends, industry analysis and credit evaluation in determining whether to make particular investments in securities.
Our investments in securities are also subject to a number of guidelines, including limitations prescribed under the Financial Holding Company Act and the Bank Act. Under these regulations, a bank holding company may not own (i) more than 5% of the total issued and outstanding shares of another finance-related company, (ii) any shares of its affiliates, other than its direct or indirect subsidiaries or (iii) any shares of a non-finance-related company. In addition, Kookmin Bank must limit its investments in equity securities and bonds with a maturity in excess of three years (other than monetary stabilization bonds issued by the Bank of Korea and national government bonds) to 60.0% of its total Tier I and Tier II capital amount (less any capital deductions). Generally, Kookmin Bank is also prohibited from acquiring more than 15.0% of the shares with voting rights
issued by any other corporation subject to certain exceptions. Pursuant to the Bank Act, a bank and its trust accounts are prohibited from acquiring the shares of a major shareholder (for the definition of “major shareholder,” see “—Supervision and Regulation—Principal Regulations Applicable to Banks—Financial Exposure to Any Individual Customer and Major Shareholders”) of that bank in excess of an amount equal to 1% of the sum of the bank’s Tier I and Tier II capital (less any capital deductions). Further information on the regulatory environment governing our investment activities is set out in “—Supervision and Regulation—Principal Regulations Applicable to Financial Holding Companies—Liquidity,” “—Supervision and Regulation—Principal Regulations Applicable to Financial Holding Companies—Restrictions on Shareholdings
in Other Companies,” “—Supervision and Regulation—Principal Regulations Applicable to Banks—Liquidity” and “—Supervision and Regulation—Principal Regulations Applicable to Banks—Restrictions on Shareholdings in Other Companies.”
The following table sets out the definitions of the four categories of securities we hold:
Category | Classification | |
| Financial assets held for trading | Financial assets bought and held for trading. | |
| Financial assets designated at fair value through profit | Financial assets which were not bought and held for trading but are otherwise designated as at fair value through profit | |
| Available-for-sale financial | Non-derivative financial assets not classified as held-to-maturity, at fair value through profit | |
| Held-to-maturity financial | ||
See “Item 5A.5.A. Operating Results—Critical Accounting Policies—Valuation of Securities and Financial Instruments.”
The following table sets out the definitions of the primary categories of securities we held as of December 31, 2009 under U.S. GAAP:
|
| |
| ||
| ||
| ||
We also hold limited balances of venture capital securities, non-marketable and restricted equity securities and derivative instruments.
Carrying Amount and Market Value
The following table sets out the carrying amount and market value of securities in our securities portfolio as of the dates indicated under IFRS:indicated:
| As of December 31, | ||||||||||||||||
| 2010 | 2011 | |||||||||||||||
| Carrying Amount | Market Value | Carrying Amount | Market Value | |||||||||||||
| (in billions of Won) | ||||||||||||||||
Available-for-sale financial assets: | ||||||||||||||||
Equity securities | (Won) | 3,156 | (Won) | 3,156 | (Won) | 2,643 | (Won) | 2,643 | ||||||||
Debt securities | ||||||||||||||||
Korean treasury securities and government agency securities | 6,741 | 6,741 | 5,989 | 5,989 | ||||||||||||
Debt securities issued by financial institutions | 5,759 | 5,759 | 6,432 | 6,432 | ||||||||||||
Corporate debt securities | 4,586 | 4,586 | 5,375 | 5,375 | ||||||||||||
Asset-backed securities | 1,831 | 1,831 | 1,757 | 1,757 | ||||||||||||
Others | 209 | 209 | 181 | 181 | ||||||||||||
|
|
|
|
|
|
|
| |||||||||
Total available-for-sale | 22,282 | 22,282 | 22,377 | 22,377 | ||||||||||||
|
|
|
|
|
|
|
| |||||||||
Held-to-maturity financial assets: | ||||||||||||||||
Debt securities | ||||||||||||||||
Korean treasury securities and government agency securities | 6,340 | 6,527 | 5,436 | 5,676 | ||||||||||||
Debt securities issued by financial institutions | 1,216 | 1,261 | 1,125 | 1,155 | ||||||||||||
Corporate debt securities | 5,960 | 6,155 | 6,155 | 6,390 | ||||||||||||
Asset-backed securities | 392 | 397 | 339 | 341 | ||||||||||||
|
|
|
|
|
|
|
| |||||||||
Total held-to-maturity | 13,908 | 14,340 | 13,055 | 13,562 | ||||||||||||
|
|
|
|
|
|
|
| |||||||||
Financial assets at fair value through profit or loss: | ||||||||||||||||
Financial assets held for trading | ||||||||||||||||
Equity securities | 416 | 416 | 412 | 412 | ||||||||||||
Debt securities | ||||||||||||||||
Korean treasury securities and government agency securities | 743 | 743 | 1,508 | 1,508 | ||||||||||||
Debt securities issued by financial institutions | 2,107 | 2,107 | 2,837 | 2,837 | ||||||||||||
Corporate debt securities | 459 | 459 | 586 | 586 | ||||||||||||
Asset-backed securities | 172 | 172 | 135 | 135 | ||||||||||||
Others | 56 | 56 | 111 | 111 | ||||||||||||
Others | 15 | 15 | 28 | 28 | ||||||||||||
|
|
|
|
|
|
|
| |||||||||
Sub-total | 3,968 | 3,968 | 5,617 | 5,617 | ||||||||||||
|
|
|
|
|
|
|
| |||||||||
Financial assets designated at fair value through profit or loss | ||||||||||||||||
Equity securities | 46 | 46 | 134 | 134 | ||||||||||||
Debt securities | — | — | — | — | ||||||||||||
Derivative-linked securities | — | — | 575 | 575 | ||||||||||||
|
|
|
|
|
|
|
| |||||||||
Sub-total | 46 | 46 | 709 | 709 | ||||||||||||
|
|
|
|
|
|
|
| |||||||||
Total financial assets at fair value through profit or loss | 4,014 | 4,014 | 6,326 | 6,326 | ||||||||||||
|
|
|
|
|
|
|
| |||||||||
Total financial assets | (Won) | 40,204 | (Won) | 40,636 | (Won) | 41,758 | (Won) | 42,265 | ||||||||
|
|
|
|
|
|
|
| |||||||||
The following table sets out the carrying amount and market value of securities in our securities portfolio as of December 31, 2009 under U.S. GAAP:
| As of December 31, 2009 | As of December 31, | |||||||||||||||||||||||||||||||
| Carrying Amount | Market Value | 2011 | 2012 | 2013 | ||||||||||||||||||||||||||||
| (in billions of Won) | Carrying Amount | Market Value | Carrying Amount | Market Value | Carrying Amount | Market Value | ||||||||||||||||||||||||||
Available-for-sale securities: | ||||||||||||||||||||||||||||||||
| (in billions of Won) | ||||||||||||||||||||||||||||||||
Available-for-sale financial assets: | ||||||||||||||||||||||||||||||||
Equity securities | (Won) | 1,135 | (Won) | 1,135 | ₩ | 2,643 | ₩ | 2,643 | ₩ | 2,474 | ₩ | 2,474 | ₩ | 2,899 | ₩ | 2,899 | ||||||||||||||||
Debt securities | ||||||||||||||||||||||||||||||||
Korean treasury securities and government agency securities | 7,892 | 7,892 | 5,989 | 5,989 | 6,256 | 6,256 | 6,926 | 6,926 | ||||||||||||||||||||||||
Debt securities issued by financial institutions | 6,405 | 6,405 | 6,432 | 6,432 | 7,476 | 7,476 | 5,782 | 5,782 | ||||||||||||||||||||||||
Corporate debt securities | 1,281 | 1,281 | 5,375 | 5,375 | 6,606 | 6,606 | 4,998 | 4,998 | ||||||||||||||||||||||||
Asset-backed securities | 1,998 | 1,998 | 1,757 | 1,757 | 1,399 | 1,399 | 1,208 | 1,208 | ||||||||||||||||||||||||
Others | 181 | 181 | — | — | 19 | 19 | ||||||||||||||||||||||||||
|
|
|
|
|
|
|
| |||||||||||||||||||||||||
Total available-for-sale | 18,711 | 18,711 | 22,377 | 22,377 | 24,211 | 24,211 | 21,832 | 21,832 | ||||||||||||||||||||||||
|
|
|
|
|
|
|
| |||||||||||||||||||||||||
Held-to-maturity securities: | ||||||||||||||||||||||||||||||||
Held-to-maturity financial assets: | ||||||||||||||||||||||||||||||||
Debt securities | ||||||||||||||||||||||||||||||||
Korean treasury securities and government agency securities | 8,992 | 9,064 | 5,436 | 5,676 | 4,449 | 4,720 | 4,357 | 4,537 | ||||||||||||||||||||||||
Debt securities issued by financial institutions | 2,995 | 3,040 | 1,125 | 1,155 | 1,316 | 1,338 | 893 | 902 | ||||||||||||||||||||||||
Corporate debt securities | 380 | 382 | 6,155 | 6,390 | 6,213 | 6,498 | 7,400 | 7,580 | ||||||||||||||||||||||||
Asset-backed securities | 243 | 246 | 339 | 341 | 278 | 281 | 367 | 368 | ||||||||||||||||||||||||
|
|
|
|
|
|
|
| |||||||||||||||||||||||||
Total held-to-maturity | 12,610 | 12,732 | 13,055 | 13,562 | 12,256 | 12,837 | 13,017 | 13,387 | ||||||||||||||||||||||||
|
|
|
|
|
|
|
| |||||||||||||||||||||||||
Trading securities: | ||||||||||||||||||||||||||||||||
Financial assets at fair value through profit or loss: | ||||||||||||||||||||||||||||||||
Financial assets held for trading | ||||||||||||||||||||||||||||||||
Equity securities | 254 | 254 | 412 | 412 | 876 | 876 | 1,101 | 1,101 | ||||||||||||||||||||||||
Debt securities | ||||||||||||||||||||||||||||||||
Korean treasury securities and government agency securities | 1,359 | 1,359 | 1,508 | 1,508 | 2,376 | 2,376 | 2,085 | 2,085 | ||||||||||||||||||||||||
Debt securities issued by financial institutions | 2,699 | 2,699 | 2,837 | 2,837 | 4,018 | 4,018 | 3,266 | 3,266 | ||||||||||||||||||||||||
Corporate debt securities | 31 | 31 | 586 | 586 | 1,679 | 1,679 | 1,760 | 1,760 | ||||||||||||||||||||||||
Asset-backed securities | 117 | 117 | 135 | 135 | 105 | 105 | 510 | 510 | ||||||||||||||||||||||||
Others | 111 | 111 | 114 | 114 | 205 | 205 | ||||||||||||||||||||||||||
Others | 28 | 28 | 40 | 40 | 40 | 40 | ||||||||||||||||||||||||||
|
|
|
|
|
|
|
| |||||||||||||||||||||||||
Total trading | 4,460 | 4,460 | ||||||||||||||||||||||||||||||
Sub-total | 5,617 | 5,617 | 9,208 | 9,208 | 8,967 | 8,967 | ||||||||||||||||||||||||||
|
|
|
|
|
| |||||||||||||||||||||||||||
Financial assets designated at fair value through profit or loss | ||||||||||||||||||||||||||||||||
Equity securities | 134 | 134 | 159 | 159 | 116 | 116 | ||||||||||||||||||||||||||
Debt securities | — | — | — | — | — | — | ||||||||||||||||||||||||||
Derivative-linked securities | 575 | 575 | 193 | 193 | 246 | 246 | ||||||||||||||||||||||||||
|
|
|
|
|
| |||||||||||||||||||||||||||
Sub-total | 709 | 709 | 352 | 352 | 362 | 362 | ||||||||||||||||||||||||||
|
|
|
|
|
| |||||||||||||||||||||||||||
Total financial assets at fair value through profit or loss | 6,326 | 6,326 | 9,560 | 9,560 | 9,329 | 9,329 | ||||||||||||||||||||||||||
|
|
|
|
|
|
|
| |||||||||||||||||||||||||
Total securities | (Won) | 35,781 | (Won) | 35,903 | ₩ | 41,758 | ₩ | 42,265 | ₩ | 46,027 | ₩ | 46,608 | ₩ | 44,178 | ₩ | 44,548 | ||||||||||||||||
|
|
|
|
|
|
|
| |||||||||||||||||||||||||
Maturity Analysis
The following table categorizes our debt securities by maturity and weighted average yield as of December 31, 2011:2013:
| Within 1 Year | Weighted Average Yield (1) | Over 1 But within 5 Years | Weighted Average Yield (1) | Over 5 But within 10 Years | Weighted Average Yield (1) | Over 10 Years | Weighted Average Yield (1) | Total | Weighted Average Yield (1) | Within 1 Year | Weighted Average Yield (1) | Over 1 But within 5 Years | Weighted Average Yield (1) | Over 5 But within 10 Years | Weighted Average Yield (1) | Over 10 Years | Weighted Average Yield (1) | Total | Weighted Average Yield (1) | |||||||||||||||||||||||||||||||||||||||||||||||||||||||||||||
| (in billions of Won, except percentages) | (in billions of Won, except percentages) | |||||||||||||||||||||||||||||||||||||||||||||||||||||||||||||||||||||||||||||||
Available-for-sale financial assets: | ||||||||||||||||||||||||||||||||||||||||||||||||||||||||||||||||||||||||||||||||
Korean treasury securities and government agencies | (Won) | 1,237 | 4.53 | % | (Won) | 4,139 | 4.39 | % | (Won) | 541 | 4.39 | % | (Won) | 72 | 4.76 | % | (Won) | 5,989 | 4.42 | % | ₩ | 1,570 | 3.89 | % | ₩ | 5,119 | 3.56 | % | ₩ | 228 | 3.90 | % | ₩ | 9 | 4.35 | % | ₩ | 6,926 | 3.64 | % | ||||||||||||||||||||||||||||||||||||||||
Debt securities issued by financial institutions | 4,577 | 3.80 | 1,760 | 4.35 | 95 | 5.96 | — | — | 6,432 | 3.98 | 3,166 | 2.88 | 2,520 | 3.35 | 96 | 4.49 | — | — | 5,782 | 3.11 | ||||||||||||||||||||||||||||||||||||||||||||||||||||||||||||
Corporate debt securities | 1,929 | 4.62 | 2,752 | 4.77 | 641 | 5.02 | 53 | 5.43 | 5,375 | 4.75 | 1,236 | 4.17 | 3,497 | 3.80 | 234 | 5.05 | 31 | 4.02 | 4,998 | 3.95 | ||||||||||||||||||||||||||||||||||||||||||||||||||||||||||||
Asset-backed securities | 295 | 4.08 | 286 | 4.03 | — | — | 1,176 | 4.20 | 1,757 | 4.15 | 231 | 3.50 | 370 | 2.98 | — | — | 607 | 3.75 | 1,208 | 3.47 | ||||||||||||||||||||||||||||||||||||||||||||||||||||||||||||
Others | — | 0.05 | 181 | 7.00 | — | — | — | — | 181 | 7.00 | 19 | 3.50 | — | — | — | — | — | — | 19 | 3.50 | ||||||||||||||||||||||||||||||||||||||||||||||||||||||||||||
|
|
|
|
|
|
|
|
|
| |||||||||||||||||||||||||||||||||||||||||||||||||||||||||||||||||||||||
Total | (Won) | 8,038 | 4.12 | (Won) | 9,118 | 4.54 | (Won) | 1,277 | 4.82 | (Won) | 1,301 | 4.28 | (Won) | 19,734 | 4.37 | ₩ | 6,222 | 3.42 | % | ₩ | 11,506 | 3.57 | % | ₩ | 558 | 4.48 | % | ₩ | 647 | 3.77 | % | ₩ | 18,933 | 3.55 | % | |||||||||||||||||||||||||||||||||||||||||||||
|
|
|
|
|
|
|
|
|
| |||||||||||||||||||||||||||||||||||||||||||||||||||||||||||||||||||||||
Held-to-maturity financial assets: | ||||||||||||||||||||||||||||||||||||||||||||||||||||||||||||||||||||||||||||||||
Korean treasury securities and government agencies | (Won) | 1,278 | 3.92 | % | (Won) | 2,660 | 4.36 | % | (Won) | 1,385 | 5.40 | % | (Won) | 113 | 5.38 | % | (Won) | 5,436 | 4.54 | % | ₩ | 1,166 | 4.10 | % | ₩ | 2,946 | 4.68 | % | ₩ | 133 | 4.20 | % | ₩ | 112 | 5.38 | % | ₩ | 4,357 | 4.53 | % | ||||||||||||||||||||||||||||||||||||||||
Debt securities issued by financial institutions | 365 | 5.72 | 720 | 5.49 | 40 | 4.84 | — | — | 1,125 | 5.54 | 440 | 5.04 | 402 | 3.81 | 51 | 4.06 | — | — | 893 | 4.43 | ||||||||||||||||||||||||||||||||||||||||||||||||||||||||||||
Corporate debt securities | 744 | 5.43 | 4,442 | 5.04 | 929 | 5.29 | 40 | 4.96 | 6,155 | 5.12 | 1,845 | 4.64 | 4,772 | 4.52 | 735 | 4.66 | 48 | 3.45 | 7,400 | 4.56 | ||||||||||||||||||||||||||||||||||||||||||||||||||||||||||||
Asset-backed securities | 23 | 4.00 | 306 | 4.43 | 10 | 4.37 | — | — | 339 | 4.40 | 183 | 3.57 | 184 | 3.06 | — | — | — | — | 367 | 3.31 | ||||||||||||||||||||||||||||||||||||||||||||||||||||||||||||
|
|
|
|
|
|
|
|
|
| |||||||||||||||||||||||||||||||||||||||||||||||||||||||||||||||||||||||
Total | (Won) | 2,410 | 4.66 | (Won) | 8,128 | 4.83 | (Won) | 2,364 | 5.34 | (Won) | 153 | 5.26 | (Won) | 13,055 | 4.90 | ₩ | 3,634 | 4.46 | % | ₩ | 8,304 | 4.51 | % | ₩ | 919 | 4.56 | % | ₩ | 160 | 4.80 | % | ₩ | 13,017 | 4.50 | % | |||||||||||||||||||||||||||||||||||||||||||||
|
|
|
|
|
|
|
|
|
| |||||||||||||||||||||||||||||||||||||||||||||||||||||||||||||||||||||||
Financial assets at fair value through profit or loss: | ||||||||||||||||||||||||||||||||||||||||||||||||||||||||||||||||||||||||||||||||
Financial assets held for trading: | ||||||||||||||||||||||||||||||||||||||||||||||||||||||||||||||||||||||||||||||||
Korean treasury securities and government agency securities | (Won) | 454 | 4.37 | % | (Won) | 783 | 3.62 | % | (Won) | 220 | 4.42 | % | (Won) | 51 | 4.02 | % | (Won) | 1,508 | 3.97 | % | ₩ | 763 | 4.29 | % | ₩ | 1,044 | 3.35 | % | ₩ | 242 | 4.24 | % | ₩ | 36 | 3.17 | % | ₩ | 2,085 | 3.79 | % | ||||||||||||||||||||||||||||||||||||||||
Debt securities issued by financial institutions | 1,660 | 3.94 | 1,177 | 3.69 | — | — | — | — | 2,837 | 3.84 | 1,646 | 3.15 | 1,549 | 3.30 | 71 | 4.13 | — | — | 3,266 | 3.24 | ||||||||||||||||||||||||||||||||||||||||||||||||||||||||||||
Corporate debt securities | 445 | 4.88 | 131 | 4.43 | 10 | 4.07 | — | — | 586 | 4.76 | 636 | 4.28 | 1,055 | 3.92 | 69 | 4.40 | — | — | 1,760 | 4.07 | ||||||||||||||||||||||||||||||||||||||||||||||||||||||||||||
Asset-backed securities | 81 | 5.09 | 54 | 4.99 | — | — | — | — | 135 | 5.05 | 306 | 3.57 | 194 | 3.82 | 10 | 3.71 | — | — | 510 | 3.67 | ||||||||||||||||||||||||||||||||||||||||||||||||||||||||||||
Others | 111 | 3.57 | — | — | — | — | — | — | 111 | 3.57 | 190 | 3.31 | 15 | 3.55 | — | — | — | — | 205 | 3.32 | ||||||||||||||||||||||||||||||||||||||||||||||||||||||||||||
|
|
|
|
|
|
|
|
|
| |||||||||||||||||||||||||||||||||||||||||||||||||||||||||||||||||||||||
Sub-total | (Won) | 2,751 | 4.18 | (Won) | 2,145 | 3.74 | (Won) | 230 | 4.41 | (Won) | 51 | 4.02 | (Won) | 5,177 | 4.01 | ₩ | 3,541 | 3.64 | % | ₩ | 3,857 | 3.51 | % | ₩ | 392 | 4.23 | % | ₩ | 36 | 3.17 | % | ₩ | 7,826 | 3.60 | % | |||||||||||||||||||||||||||||||||||||||||||||
Financial assets designated at fair value through profit or loss | (Won) | — | — | (Won) | — | — | (Won) | — | — | (Won) | — | — | (Won) | — | — | |||||||||||||||||||||||||||||||||||||||||||||||||||||||||||||||||
|
|
|
|
| ||||||||||||||||||||||||||||||||||||||||||||||||||||||||||||||||||||||||||||
Financial assets designated at fair value through profit or loss: | ₩ | — | — | ₩ | — | — | ₩ | — | — | ₩ | — | — | ₩ | — | — | |||||||||||||||||||||||||||||||||||||||||||||||||||||||||||||||||
|
|
|
|
|
|
|
|
|
| |||||||||||||||||||||||||||||||||||||||||||||||||||||||||||||||||||||||
Total | (Won) | 2,751 | 4.18 | (Won) | 2,145 | 3.74 | (Won) | 230 | 4.41 | (Won) | 51 | 4.02 | (Won) | 5,177 | 4.01 | ₩ | 3,541 | 3.64 | % | ₩ | 3,857 | 3.51 | % | ₩ | 392 | 4.23 | % | ₩ | 36 | 3.17 | % | ₩ | 7,826 | 3.60 | % | |||||||||||||||||||||||||||||||||||||||||||||
|
|
|
|
|
|
|
|
|
| |||||||||||||||||||||||||||||||||||||||||||||||||||||||||||||||||||||||
| (1) | The weighted average yield for the portfolio represents the yield to maturity for each individual security, weighted using its carrying amount (which is the amortized cost in the case of held-to-maturity financial assets and the fair value in the case of available-for-sale financial assets and financial assets at fair value through profit or loss). |
Concentrations of Risk
As of December 31, 2011,2013, we held the following securities of individual issuers where the aggregate carrying amount of those securities exceeded 10% of our stockholders’ equity at such date, which was (Won)22,918₩25,653 billion:
| Carrying Amount | Market Value | |||||||
| (in billions of Won) | ||||||||
Name of issuer: | ||||||||
Korean government | (Won) | 11,889 | (Won) | 12,112 | ||||
Bank of Korea | 3,453 | 3,453 | ||||||
|
|
|
| |||||
Total | (Won) | 15,342 | (Won) | 15,565 | ||||
|
|
|
| |||||
Name of issuer: Korean government Bank of Korea Korea Deposit Insurance Corporation Total Carrying
Amount Market
Value (in billions of Won) ₩ 12,408 ₩ 12,571 4,224 4,224 2,667 2,689 ₩ 19,299 ₩ 19,484
The Bank of Korea and the Korea Housing FinanceDeposit Insurance Corporation are controlled by the Korean government.
Funding
We obtain funding for our lending activities from a variety of sources, both domestic and foreign. Our principal source of funding is customer deposits. In addition, we acquire funding through long-term borrowings (comprising debentures and debts), short-term borrowings, including borrowings from the Bank of Korea, and call money.
Our primary funding strategy has been to achieve low-cost funding by increasing the average balances of low-cost retail deposits, in particular demand deposits and time deposits. We also have focused our marketing efforts on higher net worth individuals, who account for a significant portion of the assets in our retail deposit base. Customer deposits accounted for 81.5% of total funding as of December 31, 2010 and 81.3% of total funding as of December 31, 2011, in each case under IFRS. As83.1% of total funding as of December 31, 2009, customer deposits accounted for 75.9%2012 and 83.0% of our total funding under U.S. GAAP.as of December 31, 2013.
Our borrowings consist of issuances of debentures and debt from financial institutions, the Korean government and government-affiliated funds. The majority of our debt is long-term, with maturities ranging from one year to 2730 years.
Deposits
Although the majority of our deposits are short-term, it has been our experience that the majority of our depositors generally roll over their deposits at maturity, providing us with a stable source of funding.
The following table shows the average balances of our deposits and the average rates paid on our deposits under IFRS for the periods indicated:
| 2010 | 2011 | 2011 | 2012 | 2013 | ||||||||||||||||||||||||||||||||||||
| Average Balance(1) | Average Rate Paid | Average Balance (1) | Average Rate Paid | Average Balance (1) | Average Rate Paid | Average Balance (1) | Average Rate Paid | Average Balance (1) | Average Rate Paid | |||||||||||||||||||||||||||||||
| (in billions of Won, except percentages) | (in billions of Won, except percentages) | |||||||||||||||||||||||||||||||||||||||
Demand deposits: | ||||||||||||||||||||||||||||||||||||||||
Non-interest bearing | (Won) | 3,348 | — | (Won) | 3,249 | — | ₩ | 3,249 | — | ₩ | 3,075 | — | ₩ | 3,252 | — | |||||||||||||||||||||||||
Interest bearing | 48,919 | 0.43 | % | 53,824 | 0.58 | % | 53,824 | 0.58 | % | 56,154 | 0.60 | % | 60,894 | 0.47 | % | |||||||||||||||||||||||||
Time deposits | 112,621 | 3.60 | 124,713 | 3.66 | 124,713 | 3.66 | 136,617 | 3.69 | 130,286 | 3.02 | ||||||||||||||||||||||||||||||
Certificates of deposit | 11,044 | 4.00 | 1,746 | 3.89 | 1,746 | 3.89 | 1,735 | 3.86 | 1,780 | 3.03 | ||||||||||||||||||||||||||||||
|
|
|
|
|
|
|
|
|
| |||||||||||||||||||||||||||||||
Average total deposits | (Won) | 175,932 | 2.68 | % | (Won) | 183,532 | 2.69 | % | ₩ | 183,532 | 2.69 | % | ₩ | 197,581 | 2.76 | % | ₩ | 196,212 | 2.18 | % | ||||||||||||||||||||
|
|
|
|
|
|
|
|
|
| |||||||||||||||||||||||||||||||
| (1) | Average balances are based on daily balances for our banking, credit card and investment and securities operations and monthly or quarterly balances for our other operations. |
The following table shows the average balances of our deposits and the average rates paid on our deposits under U.S. GAAP for 2009:
| 2009 | ||||||||
| Average Balance (1) | Average Rate Paid | |||||||
| (in billions of Won, except percentages) | ||||||||
Demand deposits: | ||||||||
Non-interest bearing | (Won) | 2,936 | — | |||||
Interest bearing | 846 | 1.18 | % | |||||
Time deposits: | ||||||||
Certificates | 26,423 | 4.50 | ||||||
Other time deposits | 87,721 | 4.45 | ||||||
Savings deposits | 46,277 | 0.49 | ||||||
Mutual installment deposits (2) | 3,915 | 2.99 | ||||||
|
|
|
| |||||
Average total deposits | (Won) | 168,118 | 3.24 | % | ||||
|
|
|
| |||||
|
|
For a description of our retail deposit products, see “—Business—Retail Banking—Lending Activities—Mortgage and Home Equity Lending” and “—Business—Retail Banking—Deposit-Taking Activities.”
Time Deposits and Certificates of Deposit
The following table presents the remaining maturities of our time deposits and certificates of deposit which had a fixed maturity in excess of (Won)100₩100 million as of December 31, 2011:2013:
| Time Deposits | Certificates of Deposit | Total | Time Deposits | Certificates of Deposit | Total | |||||||||||||||||||
| (in billions of Won) | (in billions of Won) | |||||||||||||||||||||||
Maturing within three months | (Won) | 32,048 | (Won) | 844 | (Won) | 32,892 | ₩ | 25,829 | ₩ | 617 | ₩ | 26,446 | ||||||||||||
After three but within six months | 13,402 | 124 | 13,526 | 16,177 | 368 | 16,545 | ||||||||||||||||||
After six but within 12 months | 25,494 | 406 | 25,900 | 19,827 | 588 | 20,415 | ||||||||||||||||||
After 12 months | 1,714 | 89 | 1,803 | 1,947 | — | 1,947 | ||||||||||||||||||
|
|
|
|
|
| |||||||||||||||||||
Total | (Won) | 72,658 | (Won) | 1,463 | (Won) | 74,121 | ₩ | 63,780 | ₩ | 1,573 | ₩ | 65,353 | ||||||||||||
|
|
|
|
|
| |||||||||||||||||||
Long-term borrowings
The aggregate amount of contractual maturities of all long-term borrowings (comprising debentures and debt) as of December 31, 20112013 was as follows:
| As of December 31, | ||||
| (in billions of Won) | ||||
Due in | ||||
| ||||
| ₩ | |||
Due in 2015 | ||||
Due in 2016 | ||||
Due in 2017 | 2,607 | |||
Due in 2018 | 1,454 | |||
Thereafter | ||||
|
| |||
Gross long-term borrowings | ||||
Fair value adjustments | ) | |||
Deferred financing costs | (3 | ) | ||
Discount | ( | ) | ||
|
| |||
Total long-term borrowings, net | ||||
|
| |||
Short-term borrowings
The following table presents information regarding our short-term borrowings (borrowings with an original maturity of one year or less) for the periods indicated under IFRS :indicated:
| As of and for the Year Ended December 31, | As of and for the Year Ended December 31, | |||||||||||||||||||
| 2010 | 2011 | 2011 | 2012 | 2013 | ||||||||||||||||
| (in billions of Won, except percentages) | (in billions of Won, except percentages) | |||||||||||||||||||
Call money: | ||||||||||||||||||||
Year-end balance | (Won) | 605 | (Won) | 1,141 | ₩ | 1,141 | ₩ | 2,597 | ₩ | 2,648 | ||||||||||
Average balance (1) | 1,810 | 2,676 | 2,676 | 4,788 | 4,679 | |||||||||||||||
Maximum balance(2) | 1,959 | 2,491 | 2,491 | 5,043 | 5,835 | |||||||||||||||
Average interest rate (3) | 1.38 | % | 2.29 | % | ||||||||||||||||
Average interest rate(3) | 2.29 | % | 2.38 | % | 2.12 | % | ||||||||||||||
Year-end interest rate | 0.40-3.20 | % | 0.15-4.48 | % | 0.15-4.48 | % | 0.15-2.72 | % | 0.17-5.23 | % | ||||||||||
Borrowings from the Bank of Korea: (4) | ||||||||||||||||||||
Borrowings from the Bank of Korea:(4) | ||||||||||||||||||||
Year-end balance | (Won) | 931 | (Won) | 651 | ₩ | 651 | ₩ | 782 | ₩ | 558 | ||||||||||
Average balance (1) | 982 | 777 | 777 | 745 | 649 | |||||||||||||||
Maximum balance(2) | 1,189 | 920 | 920 | 953 | 917 | |||||||||||||||
Average interest rate (3) | 1.22 | % | 1.44 | % | ||||||||||||||||
Average interest rate(3) | 1.44 | % | 1.48 | % | 1.08 | % | ||||||||||||||
Year-end interest rate | 1.25 | % | 1.50 | % | 1.50 | % | 1.25 | % | 0.50-1.00 | % | ||||||||||
Other short-term borrowings: (5) | ||||||||||||||||||||
Other short-term borrowings:(5) | ||||||||||||||||||||
Year-end balance | (Won) | 7,856 | (Won) | 12,051 | ₩ | 12,051 | ₩ | 7,382 | ₩ | 4,963 | ||||||||||
Average balance (1) | 9,025 | 10,565 | 10,565 | 9,766 | 6,166 | |||||||||||||||
Maximum balance(2) | 9,210 | 12,120 | 12,120 | 12,340 | 7,064 | |||||||||||||||
Average interest rate (3) | 2.01 | % | 2.00 | % | ||||||||||||||||
Average interest rate(3) | 2.00 | % | 2.11 | % | 1.25 | % | ||||||||||||||
Year-end interest rate | 0.45-7.55 | % | 0.53-5.96 | % | 0.53-5.96 | % | 0.24-5.47 | % | 0.00-4.81 | % | ||||||||||
| (1) | Average balances are based on daily balances for our banking, credit card and investment and securities |
|
|
|
|
The following table presents information regarding our short-term borrowings (borrowings with an original maturity of one year or less) as of and for the year ended December 31, 2009 under the U.S. GAAP:
| ||||
| ||||
| ||||
| ||||
| ||||
| ||||
| ||||
| ||||
| ||||
| ||||
| ||||
| ||||
| ||||
| ||||
| ||||
| ||||
| ||||
| ||||
|
| (2) | Maximum balances are based on month-end balances. |
| (3) | Average interest rates for the year are calculated by dividing the total interest expense by the average amount borrowed. |
| (4) | Borrowings from the Bank of Korea generally mature within one month for borrowings in Won and six months for borrowings in foreign currencies. These short-term borrowings were secured by securities totaling ₩610 billion as of December 31, 2013. |
| (5) | Other short-term borrowings include |
Supervision and Regulation
Principal Regulations Applicable to Financial Holding Companies
General
The Financial Holding Company Act, last amended on June 8, 2010,August 13, 2013, regulates Korean financial holding companies and their subsidiaries. The entities that regulate and supervise Korean financial holding companies and their subsidiaries are the Financial Services Commission and the Financial Supervisory Service.
The Financial Services Commission exerts direct control over financial holding companies pursuant to the Financial Holding Company Act. Among other things, the Financial Services Commission approves the establishment of financial holding companies, issues regulations on the capital adequacy of financial holding companies and their subsidiaries, and drafts regulations relating to the supervision of financial holding companies.
Following the instructions and directives of the Financial Services Commission, the Financial Supervisory Service supervises and examines financial holding companies and their subsidiaries. In particular, the Financial Supervisory Service sets requirements relating to Korean financial holding companies’ liquidity and capital
adequacy ratios and establishes reporting requirements within the authority delegated under the Financial Services Commission regulations. Financial holding companies must submit quarterly reports to the Financial Supervisory Service discussing business performance, financial status and other matters identified in the Enforcement Decree of the Financial Holding Company Act.
Under the Financial Holding Company Act, a financial holding company is a company which primarily engages in controlling its subsidiaries by holding equity stakes in them equal in aggregate to at least 50% of the financial holding company’s aggregate assets based on its balance sheet as of the end of the immediately preceding fiscal year. A company is required to obtain approval from the Financial Services Commission to become a financial holding company.
A financial holding company may engage only in controlling the management of its subsidiaries, as well as certain ancillary activities including:
financially supporting its direct and indirect subsidiaries;
raising capital necessary for investment in its subsidiaries or providing financial support to its direct and indirect subsidiaries;
supporting the business of its direct and indirect subsidiaries for the joint development and marketing of new products;
supporting the operations of its direct and indirect subsidiaries by providing access to data processing, legal and accounting resources; and
any other businesses exempted from authorization, permission or approval under the applicable laws and regulations.
The Financial Holding Company Act requires every financial holding company (other than a financial holding company that is controlled by another financial holding company) and its subsidiaries to obtain prior approval from the Financial Services Commission before acquiring control of another company or to file a report with the Financial Services Commission within 30 days thereafter in certain cases (including acquiring control of another company whose assets are less than (Won)100₩100 billion as of the end of the immediately preceding fiscal year). In addition, the Financial Services Commission must grant permission to liquidate or to merge with any other company before the liquidation or merger. A financial holding company must report to the Financial Services Commission when certain events, including the following, occur:
when its officers or largest shareholder changes;
in the case of a bank holding company, when a major shareholder changes;
when the shareholding of the controlling shareholder (i.e., the “largest shareholder” or a “principal shareholder,” each as defined in the Financial Holding Company Act) or a person who has a “special relationship” with such controlling shareholder (as defined in the Enforcement Decree of the Financial Holding Company Act) changes by 1% or more of the total issued and outstanding voting shares of the financial holding company;
when it changes its corporate name;
when there is a cause for its dissolution; and
when it or its subsidiaries cease to control any of their respective direct or indirect subsidiaries by disposing of their shares of such direct or indirect subsidiary.
Capital Adequacy
The Financial Holding Company Act does not provide for a minimum paid-in capital requirement related to financial holding companies. However, all financial holding companies are required to maintain a specified level
of solvency. In addition, with respect to the allocation of net profit earned in a fiscal term, a financial holding company must set aside in its legal reserve an amount equal to at least 10% of its net income after tax each time it pays dividends on its net profits earned until its legal reserve reaches at least the aggregate amount of its paid-in capital.
Beginning on January 1, 2007, aA bank holding company, which is a financial holding company controlling banks or other financial institutions conducting banking business as prescribed in the Financial Holding Company Act, is required to maintain a minimum consolidated capital adequacy ratio of 8.0%. “Consolidated capital adequacy ratio” is defined as the ratio of equity capital as a percentage of risk-weighted assets on a consolidated basis, determined in accordance with the Financial Services Commission requirements that have been formulated based on Bank of International Settlements (“BIS”) standards. “Equity capital,” as applicable to bank holding companies, is defined as the sum of Tier I common equity capital, other Tier III capital and Tier IIIII capital less any deductible items, each as defined under the Regulation on the Supervision of Financial Holding Companies. “Risk-weighted assets” is defined as the sum of credit risk-weighted assets and market risk-weighted assets.
Pursuant to the amended regulations promulgated by the Financial Services Commission in 2013 to implement Basel III, Korean bank holding companies were required to maintain a minimum ratio of Tier I common equity capital to risk-weighted assets of 3.5% and Tier I capital to risk-weighted assets of 4.5% from December 1, 2013, which minimum ratios increased to 4.0% and 5.5%, respectively, from January 1, 2014 and will increase further to 4.5% and 6.0%, respectively, from January 1, 2015. Such requirements are in addition to the pre-existing requirement for a minimum ratio of Tier I and Tier II capital (less any capital deductions) to risk-weighted assets of 8.0%, which remains unchanged. The amended regulations also contemplate an additional capital conservation buffer of 0.625% starting in 2016, with such buffer to increase in stages to 2.5% by 2019.
Liquidity
All financial holding companies are required to match the maturities of their assets and liabilities on a non-consolidated basis in accordance with the Financial Holding Company Act in order to ensure liquidity. Financial holding companies must:
maintain a Won liquidity ratio (defined as Won assets due within one month, including marketable securities, divided by Won liabilities due within one month) of not less than 100% on a non-consolidated basis;
maintain a foreign currency liquidity ratio (defined as foreign currency liquid assets due within three months divided by foreign currency liabilities due within three months) of not less than 80% on a non-consolidated basis (except that such requirement is not applicable to a financial holding company whose foreign currency liabilities constitute less than 1% of its total assets);
maintain a ratio of foreign currency liquid assets due within seven days less foreign currency liabilities due within seven days as a percentage of total foreign currency assets of not less than 0% on a non-consolidated basis (except that such requirement is not applicable to a financial holding company whose foreign currency liabilities constitute less than 1% of its total assets);
maintain a ratio of foreign currency liquid assets due within a month less foreign currency liabilities due within a month as a percentage of total foreign currency assets of not less than negative 10% on a non-consolidated basis (except that such requirement is not applicable to a financial holding company whose foreign currency liabilities constitute less than 1% of its total assets); and
|
make quarterly reports regarding their Won liquidity and foreign currency liquidity to the Financial Supervisory Service.
Financial Exposure to Any Individual Customer and Major Shareholder
Subject to certain exceptions, the aggregate credit (as defined in the Financial Holding Company Act, the Bank Act, the Financial Investment Services and Capital Markets Act, the Insurance Business Act, the Mutual
Savings Bank Act and the Specialized Credit Financial Business Act, respectively) of a financial holding company and its direct and indirect subsidiaries that are banks, merchant banks, financial investment companies, insurance companies, savings banks or specialized credit financial business companies (which we refer to as “Financial Holding Company Total Credit”) to a single group of companies that belong to the same conglomerate as defined in the Monopoly Regulations and Fair Trade Act will not be permitted to exceed 25% of net aggregate equity capital (as defined below).
“Net aggregate equity capital” is defined under the Enforcement Decree of the Financial Holding Company Act as the sum of:
(1) in case of a financial holding company, the capital amount as defined in Article 24-3(7), Item 2 of the Enforcement Decree of the Financial Holding Company Act;
(2) in case of a bank, the capital amount as defined in Article 2(1), Item 5 of the Bank Act;
(3) in case of a merchant bank, the capital amount as defined in Article 342(1) of the Financial Investment Services and Capital Markets Act; and
(4) in case of a financial investment company, the capital amount as defined in Article 37(3) of the Enforcement Decree of the Financial Holding Company Act;
(5) in case of an insurance company, the capital amount as defined in Article 2, Item 15 of the Insurance Business Act;
(6) in case of a savings bank, the capital amount as defined in Article 2, Item 4 of the Mutual Savings Bank Act; and
(7) in case of a specialized credit financial business company, the capital amount as defined in Article 2, Item 19 of the Specialized Credit Financial Business Act;
less the sum of:
(1) the amount of shares of direct and indirect subsidiaries held by the financial holding company;
(2) the amount of shares that are cross-held by each direct and indirect subsidiary that is a bank, merchant bank, financial investment company, insurance company, savings bank or specialized credit financial business company; and
(3) the amount of shares of a financial holding company held by such direct and indirect subsidiaries that are banks, merchant banks, financial investment companies, insurance companies, savings banks or specialized credit financial business companies.
The Financial Holding Company Total Credit to a single individual or judicial person may not exceed 20% of the net aggregate equity capital. In addition, the Financial Holding Company Total Credit to a shareholder holding (together with the persons who have a “special relationship” with the shareholder, as defined in the Enforcement Decree of the Financial Holding Company Act) in aggregate more than 10% of the total issued and outstanding voting shares of a financial holding company generally may not exceed the lesser of (x) 25% of the net aggregate equity capital and (y) the amount of the equity capital of the financial holding company multiplied by the shareholding ratio of the shareholder (together with the persons who have a special relationship with the shareholder).
Further, the total sum of credits (as defined in the Financial Holding Company Act, the Bank Act, the Financial Investment Services and Capital Markets Act, the Insurance Business Act, the Mutual Savings Bank Act and the Specialized Credit Financial Business Act, respectively) of a bank holding company and its direct and indirect subsidiaries that are banks, merchant banks, financial investment companies, insurance companies, savings banks or specialized credit financial business companies as applicable (“Bank Holding Company Total Credit”) extended to a “major shareholder” (as defined below) (together with the persons who have a special
relationship with that major shareholder) will not be permitted to exceed the lesser of (x) 25% of the net aggregate equity capital and (y) the amount of the equity capital of the bank holding company multiplied by the shareholding ratio of the major shareholder, except for certain cases.
“Major shareholder” is defined as:
a shareholder holding (together with persons who have a special relationship with that shareholder), in excess of 10% (or in the case of a bank holding company controlling regional banks only, 15%) in the aggregate of the bank holding company’s total issued and outstanding voting shares; or
a shareholder holding (together with persons who have a special relationship with that shareholder), more than 4% in the aggregate of the total issued and outstanding voting shares of the bank holding company controlling nationwide banks, (excluding shares subject to the shareholding restrictions on non-financial business group companies as described below), where the shareholder is the largest shareholder or has actual control over the major business affairs of the bank holding company through, for example, appointment and dismissal of the officers pursuant to the Enforcement Decree of the Financial Holding Company Act.
In addition, the total sum of the Bank Holding Company Total Credit granted to all of a bank holding company’s major shareholders must not exceed 25% of the bank holding company’s net aggregate equity capital. Furthermore, any bank holding company that, together with its direct and indirect subsidiaries, intends to extend credit to the bank holding company’s major shareholder in an amount equal to or exceeding the lesser of (x) the amount equivalent to 0.1% of the net aggregate equity capital and (y) (Won)5₩5 billion, in any single transaction, must obtain prior unanimous board resolutions and then, immediately after providing the credit, must file a report to the Financial Services Commission and publicly disclose the filing of the report.
Restrictions on Transactions Among Direct and Indirect Subsidiaries and Financial Holding Company
Generally, a direct or indirect subsidiary of a financial holding company may not extend credits (excluding the amount of corporate credit card payments issued by a direct or indirect subsidiary of a financial holding company that is engaged in the banking business) to that financial holding company. In addition, a direct or indirect subsidiary of a financial holding company may not extend credits (excluding the amount of corporate credit card payments issued by a direct or indirect subsidiary of a financial holding company that is engaged in the banking business) to other direct or indirect subsidiaries of the financial holding company in excess of 10% of its capital amount on an individual basis or to those subsidiaries in excess of 20% of its capital amount on an aggregate basis. The subsidiary extending the credit must also obtain an adequate level of collateral depending on the type of such collateral from the other subsidiaries unless the credit is otherwise approved by the Financial Services Commission. The adequate level of collateral for each type of collateral is as follows:
(1) for deposits and installment savings, obligations of the Korean government or the Bank of Korea, obligations guaranteed by the Korean government or the Bank of Korea, obligations secured by securities issued or guaranteed by the Korean government or the Bank of Korea, 100% of the credit extended;
(2) for obligations of municipal governments under the Local Autonomy Act, local public enterprise under the Local Public Enterprises Act and investment institutions and other quasi-investment institutions under the Basic Act on the Management of Government-Invested Institution or for obligations guaranteed by, or secured by the securities issued or guaranteed by, the aforementioned entities pursuant to the relevant regulations, 110% of the credit extended; and
(3) for any property other than those set forth in paragraphs (1) and (2) above, 130% of the credit extended.
Subject to certain exceptions, a direct or indirect subsidiary of a financial holding company is prohibited from owning the shares of any other direct or indirect subsidiaries (other than those directly controlled by that direct or indirect subsidiary) under the common control of the financial holding company.
Subject to certain exceptions, a direct or indirect subsidiary of a financial holding company is also prohibited from owning the shares of the financial holding company controlling that direct or indirect subsidiary. The transfer of certain assets classified as precautionary or below between a financial holding company and its direct or indirect subsidiary or between the direct and indirect subsidiaries of a financial holding company is prohibited except for:
(1) transfers to a special purpose company, or entrustment with a trust company, for an asset-backed securitization transaction under the Asset-Backed Securitization Act;
(2) transfers to a mortgage-backed securities issuance company for a mortgage securitization transaction;
(3) transfers or in-kind contributions to a corporate restructuring vehicle under the Corporate Restructuring Investment Companies Act; and
(4) transfers to a corporate restructuring company under the Industry Promotion Act.
Disclosure of Management Performance
For the purpose of protecting the depositors and investors in the subsidiaries of financial holding companies, the Financial Services Commission requires financial holding companies to disclose certain material matters including:
(1) financial condition and profit and loss of the financial holding company and its direct and indirect subsidiaries;
(2) fund-raising by the financial holding company and its direct and indirect subsidiaries and the appropriation of such funds;
(3) any sanctions levied on the financial holding company and its direct and indirect subsidiaries under the Financial Holding Company Act or any corrective measures or sanctions under the Law on Improvement of Structure of Financial Industry; and
(4) occurrence of any non-performing assets or financial incident that may have a material adverse effect, or any other event as prescribed in the applicable regulations.
Restrictions on Shareholdings in Other Companies
Generally, a financial holding company may not own (i) more than 5% of the total issued and outstanding shares of another finance-related company, (ii) any shares of its affiliates, other than its direct or indirect subsidiaries or (iii) any shares of a non-finance-related company.
Restrictions on Shareholdings by Direct and Indirect Subsidiaries
Generally, a direct subsidiary of a financial holding company may not control any other company other than, as an indirect subsidiary of the financial holding company:
financial institutions established in foreign jurisdictions;
certain financial institutions which are engaged in any business that the direct subsidiary may conduct without any licenses or permits;
certain financial institutions whose business is related to the business of the direct subsidiary as described by the Enforcement Decree of the Financial Holding Company Act (for example, a bank subsidiary may control only credit information companies, credit card companies and financial investment companies with a dealing, brokerage, collective investment, investment advice, discretionary investment management and/or trust license);
certain financial institutions whose business is related to the financial business as prescribed by the regulations of the Ministry of Strategy and Finance; and
certain companies which are not financial institutions but whose business is related to the financial business of the financial holding company as prescribed by the Enforcement Decree of the Financial Holding Company Act (for example, a finance-related research company or a finance-related information technology company).
Acquisition of such indirect subsidiaries by direct subsidiaries of a financial holding company requires prior permission from the Financial Services Commission or the submission of a report to the Financial Services Commission, depending on the types of the indirect subsidiaries and the amount of total assets of the indirect subsidiaries.
Subject to certain exceptions, an indirect subsidiary of a financial holding company may not control any other company. If an indirect subsidiary of a financial holding company had control over another company at the time it became such an indirect subsidiary, the indirect subsidiary is required to dispose of its interest in the other company within two years from such time.
Restrictions on Transactions between a Bank Holding Company and its Major Shareholder
A bank holding company and its direct and indirect subsidiaries may not acquire (including through their respective trust accounts) shares issued by the bank holding company’s major shareholder in excess of 1% of the net aggregate equity capital (as defined above). In addition, if those entities intend to acquire shares issued by that major shareholder in any single transaction equal to or exceeding the lesser of (x) the amount equivalent to 0.1% of the net aggregate equity capital and (y) (Won)5₩5 billion, that entity must obtain prior unanimous board resolutions and then, immediately after the acquisition, file a report to the Financial Services Commission and publicly disclose the filing of the report.
Restriction on Ownership of a Financial Holding Company
Under the Financial Holding Company Act, a financial institution generally may not control a financial holding company. In addition, any single shareholder and persons who have a special relationship with that shareholder may acquire beneficial ownership of up to 10% of the total issued and outstanding shares with voting rights of a bank holding company that controls nationwide banks or 15% of the total issued and outstanding shares with voting rights of a bank holding company that controls only regional banks, subject to certain exceptions. Among others, the Korean government and the Korea Deposit Insurance Corporation are not subject to this limit. “Non-financial business group companies” (as defined below), however, may not acquire the beneficial ownership of shares of a bank holding company controlling nationwide banks in excess of 9%4% of that bank holding company’s outstanding voting shares unless they obtain the approval of the Financial Services Commission and agree not to exercise voting rights in respect of shares in excess of the 9%4% limit, in which case they may acquire beneficial ownership of up to 10%. Any other person (whether a Korean national or a foreign investor) may acquire no more than 10% of total voting shares issued and outstanding of a bank holding company controlling nationwide banks unless they obtain approval from the Financial Services Commission in each instance where the total holding will exceed 10% (or 15% in the case of a bank holding company controlling only regional banks), 25% or 33% of the total voting shares issued and outstanding of that bank holding company controlling nationwide banks.
Non-financial business group companies are required to obtain approval from the Financial Services Commission in order to (i) become the largest shareholder of a bank holding company or (ii) acquire 4% or more of the issued and outstanding shares of voting stock of a bank holding company and participate in the management of such company in the manner prescribed in the Enforcement Decree of the Financial Holding Company Act. If non-financial business group companies hold voting stock of a bank holding company in excess of the foregoing limits as a result of unavoidable circumstances, such as sales by other stockholders’ of their shareholding, such non-financial business group companies are required to obtain approval from the Financial Services Commission to hold the portion of shares that exceeds the limit, dispose of such portion or take measures so that they no longer fall under the definition of “non-financial business group companies” under the Financial Holding Company Act. Non-compliance with such requirement will prohibit non-financial business group companies from exercising their voting rights of the shares that exceed the limit and prompt the issuance of an order by the Financial Services Commission directing such non-financial business group companies to dispose of their shares that exceed the limit.
Furthermore, in the case where a person (including Korean and foreign investors, but excluding certain persons prescribed under the Enforcement Decree of the Financial Holding Company Act) (i) acquires in excess of 4% of the total issued and outstanding voting shares of any financial holding company (other than a financial holding company controlling only regional banks), (ii) becomes the largest shareholder of such financial holding company in which such person has acquired in excess of 4% of the total issued and outstanding voting shares, or
(iii) changes its shareholding in such financial holding company, in which it has acquired in excess of 4% of the total issued and outstanding voting shares, by 1% or more of the total issued and outstanding voting shares of such financial holding company, such person must file a report on such change with the Financial Services Commission within five days thereafter.
“Non-financial business group companies” as defined under the Financial Holding Company Act include:
(1) any same shareholder group where the aggregate net assets of all non-financial business companies belonging to that group equals or exceeds 25% of the aggregate net assets of all members of that group;
(2) any same shareholder group where the aggregate assets of all non-financial business companies belonging to that group equals or exceeds (Won)2₩2 trillion; or
(3) any mutual fund where a same shareholder group identified in (1) or (2) above beneficially owns and/or exercises the voting rights of more than 9%4% of the total issued and outstanding voting shares of that mutual fund.fund;
(4) any private equity fund (a) where a person falling under any of items (1) through (3) above is a limited partner holding not less than 10% of the total amount of contributions to the private equity fund, or (b) where a person falling under any of items (1) through (3) above is a general partner, or (c) where the total equity of the private equity fund acquired by each affiliate belonging to several enterprise groups subject to the limitation on mutual investment is 30% or more of the total amount of contributions to the private equity fund; or
(5) the investment purpose company concerned, where a private equity fund falling under item (4) above acquires or holds stocks in excess of 4% of the stock or equity of such company or exercisesde factocontrol over significant managerial matters of such company through appointment or dismissal of executives or in any other manner.
Sharing of Customer Information among Financial Holding Company and its Subsidiaries
Under the Act on Use and Protection of Credit Information, any individual customer’s credit information must be disclosed or otherwise used by financial institutions only to determine, establish or maintain existing commercial transactions with them and only after obtaining written consent to use that information. Under the Financial Holding Company Act, a financial holding company and its direct and indirect subsidiaries, however, may share certain credit information of individual customers among themselves for business purposes without the customers’ written consent. A subsidiary financial investment company with a dealing and/or brokerage license of a financial holding company may provide that financial holding company and its other direct and indirect subsidiaries information relating to the aggregate amount of cash or securities that a customer of the financial investment company with a dealing and/or brokerage license has deposited for business purposes.
Principal Regulations Applicable to Banks
The banking system in Korea is governed by the Bank Act of 1950, as amended (the “Bank Act”) and the Bank of Korea Act of 1950, as amended (the “Bank of Korea Act”). In addition, Korean banks come under the regulations and supervision of the Bank of Korea, the Monetary Policy Committee, the Financial Services Commission and its executive body, the Financial Supervisory Service.
The Bank of Korea, established in June 1950 under the Bank of Korea Act, performs the customary functions of a central bank. It seeks to contribute to the sound development of the national economy by price stabilization through establishing and implementing efficient monetary and credit policies. The Bank of Korea acts under instructions of the Monetary Policy Committee, the supreme policy-making body of the Bank of Korea.
Under the Bank of Korea Act, the Monetary Policy Committee’s primary responsibilities are to formulate monetary and credit policies and to determine the operations, management and administration of the Bank of Korea.
The Financial Services Commission, established on April 1, 1998, regulates commercial banks pursuant to the Bank Act, including establishing guidelines on capital adequacy of commercial banks, and prepares regulations relating to supervision of banks. Furthermore, pursuant to the Amendment to the Government Organization Act and the Bank Act on May 24, 1999, the Financial Services Commission, instead of the Ministry of Strategy and Finance, now regulates market entry into the banking business.
The Financial Supervisory Service was established on January 2, 1999 as a unified body of the former Bank Supervisory Authority (the successor to the Office of Bank Supervision), the Securities Supervisory Board, the Insurance Supervisory Board and the Credit Management Fund. The Financial Supervisory Service is subject to the instructions and directives of the Financial Services Commission and carries out supervision and examination of commercial banks. In particular, the Financial Supervisory Service sets requirements both for prudent control of liquidity and for capital adequacy and establishes reporting requirements within the authority delegated to it under the Financial Services Commission regulations, pursuant to which banks are required to submit annual reports on financial performance and shareholdings, regular reports on management strategy and non-performing loans, including write-offs, and management of problem companies and plans for the settlement of bad loans.
Under the Bank Act, permission to commence a commercial banking business or a long-term financing business must be obtained from the Financial Services Commission. Commercial banking business is defined as the lending of funds acquired predominantly from the acceptance of deposits for a period not exceeding one year or subject to the limitation established by the Financial Services Commission, for a period between one year and three years. Long-term financing business is defined as the lending, for periods in excess of one year, of funds acquired predominantly from paid-in capital, reserves or other retained earnings, the acceptance of deposits with maturities of at least one year, or the issuance of bonds or other securities. A bank wishing to enter into any business other than commercial banking and long-term financing businesses, such as the financial investment business with a trust license, must obtain permission from the Financial Services Commission. Permission to merge with any other banking institution, to liquidate, to spin off, to close a banking business or to transfer all or a part of a business must also be obtained from the Financial Services Commission.
If the Korean government deems our financial condition to be unsound or if we fail to meet the applicable capital adequacy ratio set forth under Korean law, the government may order:
capital increases or reductions;
stock cancellations or consolidations;
transfers of business;
sales of assets;
closures of branch offices;
mergers with other financial institutions;
suspensions of a part or all of business operation; or
assignments of contractual rights and obligations relating to financial transactions.
Capital Adequacy
The Bank Act requires nationwide banks, such as us, to maintain a minimum paid-in capital of (Won)100₩100 billion and regional banks to maintain a minimum paid-in capital of (Won)25₩25 billion. All banks, including foreign bank branches in Korea, are also required to maintain a prescribed solvency position. A bank must also set aside in its
legal reserve an amount equal to at least 10% of the net income after tax each time it pays dividends on net profits earned until its legal reserve reaches at least the aggregate amount of its paid-in capital.
Under the Enforcement Detailed Rules on the Supervision of Banking Business, the capital of a bank is divided into two categories, Tier I and Tier II capital. Tier I capital (core capital) consists of among other things, shareholders’(i) Tier I common equity capital, including paid-in capital, capital surplus and retained earnings related to common equity and accumulated other comprehensive gains and losses, and (ii) other Tier I capital, including paid-in capital and capital surplus related to hybrid Tier I capital instruments.instruments that, among other things, qualify as contingent capital and are subordinated to subordinated debt. Tier II capital (supplementary capital) consists of, among other things, revaluation reserves, gains on valuation of investment securities (uppaid-in capital and capital surplus related to certain limits),Tier II capital instruments, allowances for loan losses set aside for loans classified as normal or precautionary (up to certain limits), perpetual subordinated debt, cumulative preferred shares and certain other subordinated debt.
All banks must meet minimum ratios of Tier I and Tier II capital (less any capital deductions) to risk-weighted assets, determined in accordance with Financial Services Commission requirements that have been formulated based on BIS standards. These standardsrequirements were adopted and became effective in 1996, and were amended effective January 1, 2008 upon the implementation by the Financial Supervisory Service of Basel II. AllUnder such requirements, all domestic banks and foreign bank branches must meet a minimum ratio of Tier I and Tier II capital (less any capital deductions) to risk-weighted assets of 8%. In July and September 2013, the Financial Services Commission promulgated amended regulations implementing Basel III in Korea, pursuant to which Korean banks and bank holding companies were required to maintain a minimum ratio of Tier I common equity capital to risk-weighted assets of 3.5% and Tier I capital to risk-weighted assets of 4.5% from December 1, 2013, which minimum ratios increased to 4.0% and 5.5%, respectively, from January 1, 2014 and will increase further to 4.5% and 6.0%, respectively, from January 1, 2015. Such requirements are in addition to the pre-existing requirement for a minimum ratio of Tier I and Tier II capital (less any capital deductions) to risk-weighted assets of 8.0%, which remains unchanged. The amended regulations also contemplate an additional capital conservation buffer of 0.625% starting in 2016, with such buffer to increase in stages to 2.5% by 2019.
In November 2002, the Financial Services Commission amended the Enforcement Detailed Rules on the Supervision of the Banking Business to include a more conservative risk-weighting system for certain newly extended home mortgage loans, which set the risk-weighted ratios of Korean banks in respect of home mortgage loans between 50% and 70% depending on the borrower’s debt ratio and whether the home mortgage loans are overdue. OnIn June 28, 2007 and in February 2012, the Financial Services Commission further amended the Enforcement Detailed Rules on the Supervision of the Banking Business and, as a result, the following risk-weight ratios must be applied by Korean banks in respect of home mortgage loans from January 1, 2008:loans:
| (1) | for those banks which adopted a standardized approach for calculating credit risk capital requirements, a risk-weight ratio of 35% and, with respect to high-risk home mortgage loans, 50%; and |
| (2) | for those banks which adopted an internal ratings-based approach for calculating credit risk capital requirements, a risk-weight ratio calculated with reference to the probability of default, loss given default and exposure at default, each as defined under the Enforcement Detailed Rules on the Supervision of the Banking Business. |
Liquidity
All banks are required to ensure adequate liquidity by matching the maturities of their assets and liabilities in accordance with the Rules on the Supervision of the Banking Business. Banks may not invest an amount exceeding 60% of their Tier I and Tier II capital (less any capital deductions) in stocks and other securities with a maturity of over three years. This stipulation does not apply to Korean government bonds or to Monetary Stabilization Bonds issued by the Bank of Korea. The Financial Services Commission also requires each Korean bank to:
maintain a Won liquidity ratio (defined as Won assets due within one month, including marketable securities, divided by Won liabilities due within one month) of not less than 100% and to make monthly reports to the Financial Supervisory Service;
maintain a foreign currency liquidity ratio (defined as foreign currency liquid assets due within three months divided by foreign currency liabilities due within three months) of not less than 85%;
maintain a ratio of foreign currency liquid assets due within seven days less foreign currency liabilities due within seven days, divided by total foreign currency assets, of not less than negative 3%;
maintain a ratio of foreign currency liquid assets due within a month less foreign currency liabilities due within a month, divided by total foreign currency assets, of not less than negative 10%; and
submit monthly reports with respect to the maintenance of these ratios.
The Monetary Policy Committee of the Bank of Korea is empowered to fix and alter minimum reserve requirements that banks must maintain against their deposit liabilities. The current minimum reserve ratio is:
7% of average balances for Won currency demand deposits outstanding;
0% of average balances for Won currency employee asset establishment savings deposits, employee long-term savings deposits, employee house purchase savings deposits, long-term house purchase savings deposits, household long-term savings deposits and employee preferential savings deposits outstanding; and
2% of average balances for Won currency time and savings deposits, mutual installments, housing installments and certificates of deposit outstanding.
For foreign currency deposit liabilities, a 2% minimum reserve ratio is applied to time deposits with a maturity of one month or longer, certificates of deposit with a maturity of 30 days or longer and savings deposits with a maturity of six months or longer and a 7% minimum reserve ratio is applied to demand deposits and other deposits. A 1% minimum reserve ratio applies to deposits in offshore accounts, immigrant accounts and resident accounts opened by foreign exchange banks as well as foreign currency certificates of deposit held by account holders of such offshore accounts, immigrant accounts and resident accounts opened by foreign exchange banks.
Furthermore, pursuant to the Regulation on Supervision of Banking Business, foreign exchange agencies, including our subsidiary, Kookmin Bank, are required to hold “foreign currency safe assets” in an aggregate amount that is not less than the lower of (i) the product of (x) its total foreign currency-denominated debt maturing in one year or less multiplied by 2/12 and (y) an amount equal to one minus the “lowest rollover ratio” and (ii) 2% of its total foreign currency-denominated assets as shown in the balance sheet for the immediately preceding quarter. The “lowest rollover ratio” of a foreign exchange agency means the ratio of (A) its total debt with a maturity of one year or less (excluding overnight money) incurred in a particular month to (B) its total debt with maturity of one year or less (excluding overnight money) payable in that particular month, and is calculated by taking the lowest three month average from a period to be designated by the governor of the Financial Supervisory Service. Under the regulation, foreign currencycurrency-denominated debt maturing in one year or less includes financial bonds, borrowings, call monies and repurchase selling denominated in foreign currencies and such other similar debt instruments denominated in a foreign currency as designated by the governor of the Financial Supervisory Service. “Foreign currency safe assets” are defined as cash denominated in foreign currency, deposits denominated in foreign currency with a central bank or financial institutions rated A or above, bonds issued or guaranteed by a government or central bank rated A or above or corporate bonds issued or guaranteed by corporations rated A or above. Under the regulation, Kookmin Bank is also required to maintain a minimum “mid- to long-term foreign exchange funding ratio” of 100%. “Mid-to long term foreign exchange funding ratio” refers to the ratio of (1) the total outstanding amount of foreign exchange borrowing with a maturity of more than one year to (2) the total outstanding amount of foreign exchange lending with a maturity of one year or more.
Financial Exposure to Any Individual Customer and Major Shareholder
Under the Bank Act, the sum of large exposures by a bank—in other words, the total sum of its credits to single individuals, juridical persons or business groups that exceed 10% of the sum of Tier I and Tier II capital (less
(less any capital deductions)—generally must not exceed five times the sum of Tier I and Tier II capital (less any capital deductions). In addition, banks generally may not extend credit (including loans, guarantees, purchases of securities (only in the nature of a credit) and any other transactions that directly or indirectly create credit risk) in excess of 20% of the sum of Tier I and Tier II capital (less any capital deductions) to a single individual or juridical person, or grant credit in excess of 25% of the sum of Tier I and Tier II capital (less any capital deductions) to a single group of companies as defined in the Monopoly Regulations and Fair Trade Act.
Amendments to the Bank Act which became effective on July 28, 2002 strengthened restrictions on extending credits to a major shareholder. A “major shareholder” is defined as:
a shareholder holding (together with persons who have a special relationship with that shareholder) in excess of 10%; (or 15% in the case of regional banks) in the aggregate of the bank’s total issued voting shares; or
a shareholder holding (together with persons who have a special relationship with that shareholder) in excess of 4% in the aggregate of the bank’s (excluding regional banks) total issued voting shares (excluding shares subject to the shareholding restrictions on “non-financial business group companies” as described below), where the shareholder is the largest shareholder or has actual control over the major business affairs of the bank through, for example, appointment and dismissal of the officers pursuant to the Enforcement Decree of the Bank Act. Non-financial business group companies primarily consist of: (i) any single shareholding group whose non-financial company assets comprise no less than 25% of its aggregate net assets; (ii) any single shareholding group whose non-financial company assets comprise no less than (Won)2₩2 trillion in aggregate; or (iii) any mutual fund of which any single shareholding group identified in (i) or (ii) above, owns more than 9% of the total issued and outstanding shares.
Under these amendments, banks may not extend credits to a major shareholder (together with persons who have a special relationship with that shareholder) in an amount greater than the lesser of (x) 25% of the sum of the bank’s Tier I and Tier II capital (less any capital deductions) and (y) the relevant major shareholders’ shareholding ratio multiplied by the sum of the bank’s Tier I and Tier II capital (less any capital deductions). In addition, the total sum of credits granted to all major shareholders must not exceed 25% of the bank’s Tier I and Tier II capital (less any capital deductions).
Interest Rates
Korean banks generally depend on deposits as their primary funding source. Under the Act on Registration of Credit Business and Protection of Finance Users, interest rates on loans made by registered banks in Korea may not exceed 39% per annum. Historically, interest rates on deposits and lending rates were regulated by the Monetary Policy Committee. Controls on deposit interest rates in Korea have been gradually reduced and, in February 2004, the Korean government removed restrictions on all interest rates, except for the prohibition on interest payments on current account deposits. This deregulation process has increased competition for deposits based on interest rates offered and, therefore, may increase a bank’s interest expense.
Lending to Small- and Medium-sized Enterprises
In order to obtain funding from the Bank of Korea at concessionary rates for their small- and medium-sized enterprise loans, banks are required to allocate a certain minimum percentage of any quarterly increase in their Won currency lending to small- and medium-sized enterprises. Currently, this minimum percentage is 45% in the case of nationwide banks and 60% in the case of regional banks. If a bank does not comply with this requirement, the Bank of Korea may:
require the bank to prepay all or a portion of funds provided to that bank in support of loans to small- and medium-sized enterprises; or
lower the bank’s credit limit.
Disclosure of Management Performance
For the purpose of protecting depositors and investors in commercial banks, the Financial Services Commission requires commercial banks to publicly disclose certain material matters, including:
financial condition and profit and loss of the bank and its subsidiaries;
fund raising by the bank and the appropriation of such funds;
any sanctions levied on the bank under the Bank Act or any corrective measures or sanctions under the Law on Improvement of Structure of Financial Industry; and
except as may otherwise have been disclosed by a bank or its financial holding company listed on the KRX KOSPI Market in accordance with the Financial Investment Services and Capital Markets Act, occurrence of any of the following events listed below or any other event as prescribed by the applicable regulations:
| (i) | loans bearing no profit made to a single business group in an amount exceeding 10% of the sum of the bank’s Tier I and Tier II capital (less any capital deductions) as of the end of the previous month (where the loan exposure to that borrower is calculated as the sum of substandard credits, doubtful credits and estimated loss credits), unless the loan exposure to that group is not more than |
| (ii) | the occurrence of any financial incident involving embezzlement, malfeasance or misappropriation of funds in an amount exceeding 1% of the sum of the bank’s Tier I and Tier II capital (less any capital deductions) |
| (iii) | any loss due to court judgments or similar decisions in civil proceedings in an amount exceeding 1% of the sum of the bank’s Tier I and Tier II capital (less any capital deductions) as of the end of the previous month, unless the loss is not more than |
Restrictions on Lending
Pursuant to the Bank Act, commercial banks may not provide:
loans directly or indirectly secured by a pledge of a bank’s own shares;
loans directly or indirectly to enable a natural or juridical person to buy the bank’s own shares;
loans to any of the bank’s officers or employees, other than petty loans of up to (Won)20₩20 million in the case of a general loan, (Won)50₩50 million in the case of a general loan plus a housing loan or (Won)60₩60 million in the aggregate for general loans, housing loans and loans to pay damages arising from wrongful acts of employees in financial transactions;
credit (including loans) secured by a pledge of shares of a subsidiary corporation of the bank or to enable a natural or juridical person to buy shares of a subsidiary corporation of the bank; or
loans to any officers or employees of a subsidiary corporation of the bank, other than general loans of up to (Won)20₩20 million or general and housing loans of up to (Won)50₩50 million in the aggregate.
Recent Regulations Relating to Retail Household Loans
The Financial Services Commission implemented a number of changes in recent years to the mechanisms by which a bank evaluates and report its retail household loan balances and has proposed implementing further changes. Due to a rapid increase in the number of loans secured by homes and other forms of housing, the Financial Services Commission and the Financial Supervisory Service implemented regulations designed to curtail extension of new or refinanced loans secured by housing, including the following:
as to loans secured by a collateral of housing located nationwide, the loan-to-value ratio (the aggregate principal amount of loans secured by such collateral over the appraised value of the collateral) should not exceed 60%;
as to loans secured by collateral of housing located in areas of excessive investment as designated by the government, (i) the loan-to-value ratio for loans with a maturity of not more than three years should not exceed 50% and (ii) the loan-to-value ratio for loans with a maturity of more than three years should not exceed 60%;
as to loans secured by collateral of housing located outside of Seoul, Incheon and Gyeong-gi province, which housing was offered for sale on or before June 10, 2008 and with respect to which a sale contract is executed and earnest money deposit paid during the period between June 11, 2008 and June 30, 2009, the loan-to-value ratio should not exceed 70%;
as to loans secured by apartments located in areas of high speculation as designated by the government, (i) the loan-to-value ratio for loans with a maturity of not more than ten years should not exceed 40%; and (ii) the loan-to-value ratio for loans with a maturity of more than ten years should not exceed (a) 40%, if the price of such apartment is over (Won)600₩600 million, and (b) 60%, if the price of such apartment is (Won)600₩600 million or lower;
as to loans secured by apartments with appraisal value of more than (Won)600₩600 million in areas of high speculation as designated by the government or certain metropolitan areas designated as areas of excessive investment by the government, the borrower’s debt-to-income ratio (calculated as (i) the aggregate annual total payment amount of (x) the principal of and interest on loans secured by such apartment(s) and (y) the interest on other debts of the borrower over (ii) the borrower’s annual income) should not exceed 40%;
as to apartments located in areas of high speculation as designated by the government, a borrower is permitted to have only one new loan secured by such apartment;
where a borrower has two or more loans secured by apartments located in areas of high speculation as designated by the government, the loan with the earliest maturity date must be repaid first and the number of loans must be eventually reduced to one; and
in the case of a borrower (i) whose spouse already has a loan secured by housing or (ii) who is single and under 30 years old, the debt-to-income ratio of the borrower in respect of loans secured by apartment(s) located in areas of high speculation as designated by the government should not exceed 40%.
See “Item 3D. Risk Factors—Risks relating to government regulation and policy—Government regulation of retail lending, particularly mortgage and home equity lending, has recently become more stringent, which may adversely affect our retail banking operations.”
Restrictions on Investments in Property
A bank may not invest in securities set forth below in excess of 60% of the sum of the bank’s Tier I and Tier II capital (less any capital deductions):
debt securities (within the meaning of paragraph (3) of Article 4 of the Financial Investment Services and Capital Markets Act) the maturity of which exceeds three years, but excluding government bonds, monetary stabilization bonds issued by the Bank of Korea and bonds within the meaning of item 2, paragraph (6) of Article 11 of the Law on the Improvement of the Structure of the Financial Industry;
equity securities, but excluding securities within the meaning of item 1, paragraph (6) of Article 11 of the Law on the Improvement of the Structure of the Financial Industry;
derivatives linked securities (within the meaning of paragraph (7) of Article 4 of the Financial Investment Services and Capital Markets Act) the maturity of which exceeds three years; and
beneficiary certificates, investment contracts and depositary receipts (within the meaning of paragraph (2) of Article 4 of the Financial Investment Services and Capital Markets Act) the maturity of which exceeds three years.
A bank may possess real estate property only to the extent necessary for the conduct of its business, unless the aggregate value of that property does not exceed 60% of the sum of the bank’s Tier I and Tier II capital (less any capital deductions). Any property that a bank acquires by exercising its rights as a secured party, or which a bank is prohibited from acquiring under the Bank Act, must be disposed of within one year.
Restrictions on Shareholdings in Other Companies
Under the Bank Act, a bank may not own more than 15% of shares outstanding with voting rights of another corporation, except where, among other reasons:
that corporation engages in a category of financial businesses set forth by the Financial Services Commission; or
the acquisition is necessary for the corporate restructuring of the corporation and is approved by the Financial Services Commission.
In the above exceptional cases, the total investment in corporations in which the bank owns more than 15% of the outstanding shares with voting rights may not exceed 15% of the sum of Tier I and Tier II capital (less any capital deductions), or 30% of the sum of Tier I and Tier II capital (less any capital deductions) if the bank meets certain management conditions as set forth in the applicable rules adopted by the Financial Services Commission.
The Bank Act provides that a bank using its bank accounts and its trust accounts may not acquire the shares of another corporation that is a major shareholder of the bank in excess of an amount equal to 1% of the sum of Tier I and Tier II capital (less any capital deductions).
Restrictions on Bank Ownership
Under the Bank Act, a single shareholder and persons who have a special relationship with that shareholder generally may acquire beneficial ownership of no more than 10% of a nationwide bank’s total issued and outstanding shares with voting rights and no more than 15% of a regional bank’s total issued and outstanding shares with voting rights. The Korean government, the Korea Deposit Insurance Corporation and bank holding companies qualifying under the Financial Holding Company Act are not subject to this limit. However, non-financial business group companies may not acquire beneficial ownership of shares of a nationwide bank in excess of 9%4% of that bank’s outstanding voting shares, unless they obtain the approval of the Financial Services Commission and agree not to exercise voting rights in respect of shares in excess of the 9%4% limit, in which case they may acquire beneficial ownership of up to 10% of a nationwide bank’s outstanding voting shares.
Non-financial business group companies are required to obtain approval from the Financial Services Commission in order to (i) become the largest shareholder of a bank or (ii)can no longer acquire 4% or more than 4.0% of the issued and outstanding shares of voting stock of a bank and participate in the management of a bank in the manner prescribed in the Enforcement Decreepursuant to an amendment of the Bank Act. IfFinancial Holding Company Act that became effective from February 14, 2014, which grants an exception for non-financial business group companies hold voting stockwhich, at the time of the enactment of the amended provisions, held more than 4.0% of the shares of a bank in excesswith the approval of the foregoing limits as a result of unavoidable circumstances, such as sales by other stockholders’ of their shareholding, such non-financial business group companies are required to obtain approval from the Financial Services Commission to holdbefore the portion of shares of the bank that exceeds the limit, dispose of such portion or take measures so that they no longer fall under the definition of “non-financial business group companies” under the Bank Act. Non-compliance with such requirement will prohibit non-financial business group companies from exercising their voting rights of the shares that exceed the limit and prompt the issuance of an order by the Financial Services Commission directing such non-financial business group companies to dispose of their shares that exceed the limit.amendment.
In addition, if a foreign investor, as defined in the Foreign Investment Promotion Act, owns in excess of 4% of a nationwide bank’s outstanding voting shares, non-financial business group companies may acquire beneficial ownership of up to 10% of that bank’s outstanding voting shares, and in excess of 10%, 25% or 33% of that bank’s outstanding voting shares with the approval of the Financial Services Commission in each instance, up to the number of shares owned by the foreign investor. Any other person (whether a Korean national or a foreign investor), with the exception of non-financial business group companies described above, may acquire no more than 10% of a nationwide bank’s total voting shares issued and outstanding, unless they obtain approval from the Financial Services Commission in each instance where the total holding will exceed 10% (or
15% in the case of regional banks), 25% or 33% of the bank’s total voting shares issued and outstanding provided that, in addition to the foregoing threshold shareholding ratios, the Financial Services Commission may, at its discretion, designate a separate and additional threshold shareholding ratio.
Deposit Insurance System
The Depositor Protection Act provides insurance for certain deposits of banks in Korea through a deposit insurance system. Under the Depositor Protection Act, all banks governed by the Bank Act are required to pay an insurance premium to the Korea Deposit Insurance Corporation on a quarterly basis. Thebasis and the rate is determined under the Enforcement Decree to the Depositor Protection Act, and may not exceed 0.5% of the bank’s insurable deposits in any given year. The current insurance premium is 0.02% of insurable deposits for each quarter.Act. If the Korea Deposit Insurance Corporation makes a payment on an insured amount, it will acquire the depositors’ claims with respect to that payment amount. The Korea Deposit Insurance Corporation insures a maximum of (Won)50₩50 million for deposits and interest, regardless of when the deposits were made and the size of the deposits.
Laws and Regulations Governing Other Business Activities
A bank must register with the Ministry of Strategy and Finance to enter the foreign exchange business, which is governed by the Foreign Exchange Transaction Law. A bank must obtain the permission of the Financial Services Commission to enter the securities business, which is governed by regulations under the Financial Investment Services and Capital Markets Act. Under these laws, a bank may engage in the foreign exchange business, securities repurchase business, governmental/public bond underwriting business and governmental bond dealing business.
Trust Business
A bank must obtain approval from the Financial Services Commission to engage in trust businesses. The Trust Act and the Financial Investment Services and Capital Markets Act govern the trust activities of banks, and they are subject to various legal and accounting procedures and requirements, including the following:
under the Trust Act, assets accepted in trust by a bank in Korea must be segregated from other assets in the accounts of that bank; and
depositors and other general creditors cannot obtain or assert claims against the assets comprising the trust accounts in the event the bank is liquidated or wound-up.
The bank must make a special reserve of 25% or more of fees from each unspecified money trust account for which a bank guarantees the principal amount and a fixed rate of interest until the total reserve for that account equals 5% of the trust amount. Since January 1999, the Korean government has prohibited Korean banks from offering new guaranteed fixed rate trust account products whose principal and interest are guaranteed.
Under the Financial Investment Services and Capital Markets Act, which became effective in February 2009, a bank with a trust business license (such as Kookmin Bank) is permitted to offer both specified money trust account products and unspecified money trust account products. Previously, banks were not permitted to offer unspecified money trust account products pursuant to the Indirect Investment Asset Management Act, which is no longer in effect following the effectiveness of the Financial Investment Services and Capital Markets Act.
Credit Card Business
General
In order to enter the credit card business, a company must register with the Financial Services Commission. Credit card businesses are governed by the Specialized Credit Financial Business Act, enacted on August 28, 1997 and last amended on October 8, 2011,March 22, 2013, which sets forth specific requirements with respect to the credit card business as well as generally prohibiting unsound business practices relating to the credit card business which
may infringe on the rights of credit card holders or negatively affect the soundness of the credit card industry. Credit card companies, including our wholly-owned subsidiary, KB Kookmin Card Co., Ltd., are regulated by the Financial Services Commission and the Financial Supervisory Service.
Disclosure and Reports
Under the Specialized Credit Financial Business Act and the regulations thereunder, a credit card company is required to disclose on a periodic and on-going basis certain material matters and events. In addition, a credit card company must submit its business reports with respect to its results of operations to the Governor of the Financial Supervisory Service within one month from the end of each quarter.
Restrictions on Funding
Under the Specialized Credit Financial Business Act and the regulations thereunder, a credit card company must ensure that its total assets do not exceed an amount equal to six times its equity capital. However, if a credit card company is unable to comply with such limit upon the occurrence of unavoidable events, such as drastic changes in the domestic and global financial markets, such limit may be adjusted through a resolution of the Financial Services Commission.
Risk of Loss Due to Lost, Stolen, Forged or Altered Credit Cards
Under the Specialized Credit Financial Business Act, a credit card company is liable for any loss arising from the unauthorized use of credit cards or debit cards after it has received notice from the holder of the loss or theft of the card. A credit card company is also responsible for any losses resulting from the use of forged or altered credit cards, debit cards and pre-paid cards. A credit card company may, however, transfer all or part of this latter risk of loss to holders of credit card in the event of willful misconduct or gross negligence by holders of credit card if the terms and conditions of the agreement entered between the credit card company and members of such cards specifically provide for that transfer.
For these purposes, disclosure of a customer’s password that is made intentionally or through gross negligence, or the transfer of or giving as collateral of the credit card or debit card, is considered willful misconduct or gross negligence. However, a disclosure of a cardholder’s password that is made under irresistible force or threat to cardholder or his/her relatives’ life or health will not be deemed as willful misconduct or negligence of the cardholder.
Each credit card company must institute appropriate measures to fulfill these obligations, such as establishing provisions, purchasing insurance or joining a cooperative association.
Pursuant to the Enforcement Decree to Specialized Credit Financial Business Act, a credit card company will be liable for any losses arising from loss or theft of a credit card (which was not from the holder’s willful misconduct or negligence) during the period beginning 60 days before the notice by the holder to the credit card company.
Pursuant to the Specialized Credit Financial Business Act, the Financial Services Commission may either restrict the limit or take other necessary measures against the credit card company with respect to such matters as the maximum limits on the amount per credit card, details of credit card terms and conditions, management of credit card merchants and collection of claims, including the following:
maximum limits for cash advances on credit cards;
use restrictions on debit cards with respect to per day or per transaction usage;
aggregate issuance limits and maximum limits on the amount per card on pre-paid cards; and
other matters prescribed by the Enforcement Decree to the Specialized Credit Financial Business Act.
Lending Ratio in Ancillary Business
Pursuant to the Enforcement Decree to the Specialized Credit Financial Business Act issued in December 2003, a credit card company must maintain an aggregate quarterly average outstanding lending balance to credit
cardholders (including cash advances and credit card loans, but excluding restructured loans) no greater than the sum of (i) its aggregate quarterly average outstanding credit card balance arising from the purchase of goods and services and (ii) the aggregate quarterly debit card transaction volume.
Issuance of New Cards and Solicitation of New Cardholders
The Enforcement Decree to the Specialized Credit Financial Business Act establishes the conditions under which a credit card company may issue new cards and solicit new members. New credit cards may be issued only to the following persons:
persons who are at least 1819 years old when they apply for a credit card;
persons whose capability to pay bills as they come due has been verified using standards established by the credit card company; and
in the case of minors who are at least 18 years and younger than 20 years,old, persons who submit a guardian’s consent along with documents evidencing income,employment as of the date of the credit card application, such as an employment certificate, or persons for whom the issuance of a tax certificate.credit card is necessitated by governmental policies, such as financial aid.
In addition, a credit card company may not solicit credit card members by:
providing economic benefits or promising to provide economic benefits in excess of 10% of the annual credit card fee (in the case of credit cards with annual fees that are less than the average of the annual fees charged by the major credit cards in Korea, the annual fee will be deemed to be equal to such average annual fee) in connection with issuing a credit card;
soliciting applicants on roads, public places or along corridors used by the general public;
soliciting applicants through visits, except those visits made upon prior consent and visits to a business area;
soliciting applicants through the Internet without verifying whether the applicant is who he or she purports to be, by means of a certified digital signature under the Digital Signature Act; and
soliciting applicants through pyramid sales methods.
Compliance Rules on Collection of Receivable Claims
Pursuant to Supervisory Regulation on the Specialized Credit Financial Business, a credit card company may not:
exert violence or threaten violence;
inform a related party (a guarantor of the debtor, blood relative or fiancée of the debtor, a person living in the same household as the debtor or a person working in the same workplace as the debtor) of the debtor’s obligations without just cause;
provide false information relating to the debtor’s obligation to the debtor or his or her related parties;
threaten to sue or sue the debtor for fraud despite lack of affirmative evidence to establish that the debtor has submitted forged or false documentation with respect to his/her capacity to make payment;
visit or telephone the debtor during late evening hours (between the hours of 9:00 p.m. and 8:00 a.m.); and
utilize other uncustomary methods to collect the receivables that interfere with the privacy or the peace in the workplace of the debtor or his or her related parties.
Regulations on Class Actions Regarding Securities
The Law on Class Actions Regarding Securities was enacted as of January 20, 2004 and last amended on March 31, 2010.May 28, 2013. The Law on Class Actions Regarding Securities governs class actions suits instituted by one or more representative plaintiff(s) on behalf of 50 or more persons who claim to have been damaged in a capital markets transaction involving securities issued by a listed company in Korea.
Applicable causes of action with respect to such suits include:
claims for damages caused by misleading information contained in a securities statement;
claims for damages caused by the filing of a misleading business report, semi-annual report, or quarterly report;
claims for damages caused by insider trading or market manipulation; and
claims instituted against auditors for damages caused by accounting irregularities.
Any such class action may be instituted upon approval from the presiding court and the outcome of such class action will have a binding effect on all potential plaintiffs who have not joined the action, with the exception of those who have filed an opt out notice with such court.
Financial Investment Services and Capital Markets Act
On July 3, 2007, the National Assembly of Korea passed the Financial Investment Services and Capital Markets Act, a new law consolidating six laws regulating capital markets. The Financial Investment Services and Capital Markets Act became effective in February 2009. Prior to the effective date, certain procedural matters were initiated from July 2008, as discussed further below.
The following is a summary of the major changes introduced under the Financial Investment Services and Capital Markets Act.
Consolidation of Capital Markets-Related Laws
Prior to the effectiveness of the Financial Investment Services and Capital Markets Act, there were separate laws regulating various types of financial institutions depending on the type of financial institution (for example, securities companies, futures companies, trust business companies and asset management companies) and subjecting financial institutions to different licensing and ongoing regulatory requirements (for example, the Securities and Exchange Act, the Futures Business Act and the Indirect Investment Asset Management Business Act). By applying one uniform set of rules to the same financial business having the same economic function, the Financial Investment Services and Capital Markets Act attempts to improve and address issues caused by the current regulatory system under which the same economic function relating to capital markets-related businesses are governed by multiple regulations. To this end, the Financial Investment Services and Capital Markets Act categorizes capital markets-related businesses into six different functions, as follows:
dealing (trading and underwriting of “financial investment products” (as defined below)),
brokerage (brokerage of financial investment products),
collective investment (establishment of collective investment schemes and the management thereof),
investment advice,
discretionary investment management, and
trusts (together with the five businesses set forth above, the “Financial Investment Businesses”).
Therefore, all financial businesses relating to financial investment products have been reclassified as one or more of the Financial Investment Businesses described above, and financial institutions are subject to the regulations applicable to their relevant Financial Investment Business(es), irrespective of the type of the financial institution (for example, in principle, derivative businesses conducted by former securities companies and futures companies are subject to the same regulations under the Financial Investment Services and Capital Markets Act).
The banking business and insurance business are not subject to the Financial Investment Services and Capital Markets Act and continue to be regulated under separate laws. However, they may become subject to the Financial Investment Services and Capital Markets Act if their activities involve any financial investment businesses requiring a license pursuant to the Financial Investment Services and Capital Markets Act.
Comprehensive Definition of Financial Investment Products
In an effort to encompass the various types of securities and derivative products available in the capital markets, the Financial Investment Services and Capital Markets Act sets forth a comprehensive term “financial investment products,” defined to mean all financial products with a risk of loss in the invested amount (in contrast to “deposits,” which are financial products for which the invested amount is protected or preserved). Financial investment products are classified into two major categories: (i) “securities” (relating to financial investment products where the risk of loss is limited to the invested amount) and (ii) “derivatives” (relating to financial investment products where the risk of loss may exceed the invested amount). As a result of the general and open-ended manner in which financial investment products are defined, any future financial product could potentially come within the scope of the definition of financial investment products, thereby enabling Financial Investment Companies (as defined below) to handle a broader range of financial products. Under the Financial Investment Services and Capital Markets Act, securities companies, asset management companies, futures companies and other entities engaging in any Financial Investment Business are classified as “Financial Investment Companies.”
New License System and the Conversion of Existing Licenses
Under the Financial Investment Services and Capital Markets Act, Financial Investment Companies are able to choose what Financial Investment Business to engage in (via a “check the box” method set forth in the relevant license application), by specifying the desired (i) Financial Investment Business, (ii) financial investment product and (iii) target customers to which financial investment products may be sold or dealt to (i.e., general investors or professional investors). Licenses will be issued under the specific business sub-categories described in the foregoing sentence. For example, it would be possible for a Financial Investment Company to obtain a license to engage in the Financial Investment Business of (i) dealing (ii) over the counter derivatives products (iii) only with sophisticated investors.
Financial institutions that engage in business activities constituting a Financial Investment Business are required to take certain steps, such as renewal of their license or registration, in order to continue engaging in such business activities. Financial institutions that are not licensed Financial Investment Companies are not permitted to engage in any Financial Investment Business, subject to the following exceptions: (i) banks and insurance companies are permitted to engage in certain categories of Financial Investment Business; and (ii) other financial institutions that engaged in any Financial Investment Business prior to the effective date of the Financial Investment Services and Capital Markets Act (whether in the form of a concurrent business or an incidental business) are permitted to continue such Financial Investment Business for a period not exceeding six months commencing on the effective date of the Financial Investment Services and Capital Markets Act.
Expanded Business Scope of Financial Investment Companies
Under the previous regulatory system in Korea, it was difficult for a financial institution to explore a new line of business or expand upon its existing line of business. For example, a financial institution licensed as a
securities company generally was not permitted to engage in the asset management business. In contrast, under the Financial Investment Services and Capital Markets Act, pursuant to the integration of its current businesses involving financial investment products into a single Financial Investment Business, a licensed Financial Investment Company is permitted to engage in all types of Financial Investment Businesses, subject to satisfying relevant regulations (for example, maintaining an adequate “Chinese Wall,” to the extent required). As to incidental businesses (i.e., a financial related business which is not a Financial Investment Business), the
Financial Investment Services and Capital Markets Act generally allows a Financial Investment Company to freely engage in such incidental businesses by shifting away from the previous positive-list system towards a more comprehensive system. In addition, a Financial Investment Company is permitted to outsource marketing activities by contracting “introducing brokers” that are individuals but not employees of the Financial Investment Company. Financial Investment Companies are permitted (i) to engage in foreign exchange businesses related to their Financial Investment Business and (ii) to participate in the settlement network, pursuant to an agreement among the settlement network participants.
Improvement in Investor Protection Mechanism
While the Financial Investment Services and Capital Markets Act widens the scope of financial businesses in which financial institutions are permitted to engage, a more rigorous investor-protection mechanism is also imposed upon Financial Investment Companies dealing in financial investment products. The Financial Investment Services and Capital Markets Act distinguishes general investors from sophisticated investors and provides new or enhanced protections to general investors. For instance, the Financial Investment Services and Capital Markets Act expressly provides for a strict know-your-customer rule for general investors and imposes an obligation that Financial Investment Companies should market financial investment products suitable to each general investor, using written explanatory materials. Under the Financial Investment Services and Capital Markets Act, a Financial Investment Company could be liable if a general investor proves (i) damage or losses relating to such general investor’s investment in financial investment products solicited by such Financial Investment Company and (ii) the absence of the requisite written explanatory materials, without having to prove fault or causation. With respect to conflicts of interest between Financial Investment Companies and investors, the Financial Investment Services and Capital Markets Act expressly requires (i) disclosure of any conflict of interest to investors and (ii) mitigation of conflicts of interest to a comfortable level or abstention from the relevant transaction.
Other Changes of Securities/Fund Regulations
The Financial Investment Services and Capital Markets Act also affected various securities regulations including those relating to public disclosure, insider trading and proxy contests, which were previously governed by the Securities and Exchange Act. For example, the 5% and 10% reporting obligations under the Securities and Exchange Act has become more stringent. The Indirect Investment and Asset Management Business Act strictly limited the kind of vehicles that could be utilized under a collective investment scheme, restricting the range of potential vehicles to trusts and corporations, and the type of funds that can be used for investments. However, under the Financial Investment Services and Capital Markets Act, these restrictions have been significantly liberalized, permitting all vehicles that may be created under Korean law, such as limited liability companies or partnerships, to be used for the purpose of collective investments and allowing investment funds to be much more flexible as to their investments.
| Item | Organizational Structure |
The following chart provides an overview of our structure, including our significant subsidiaries and our ownership of such subsidiaries as of the date of this annual report:
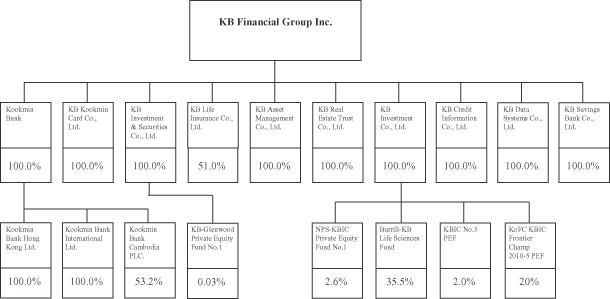
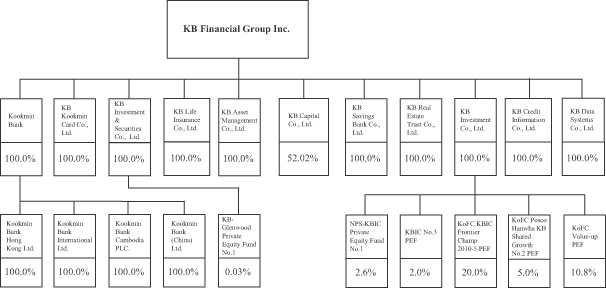
Our largest subsidiary is Kookmin Bank, the assets of which represented approximately 92.4%90.9% of our total assets as of December 31, 2011.2013. The following table provides summary information for our operating subsidiaries that are consolidated in our consolidated financial statements as of and for the year ended December 31, 2011,2013, including their consolidated total assets, operating revenue, profit (loss) and total equity:
Subsidiary | Total Assets | Operating Revenue | Profit (Loss) | Total Equity | ||||||||||||||||||||||||||||
Subsidiaries(1) | Total Assets | Operating Revenue | Profit (Loss) | Total Equity | ||||||||||||||||||||||||||||
| (in millions of Won) | (in millions of Won) | |||||||||||||||||||||||||||||||
Kookmin Bank | (Won) | 256,512,260 | (Won) | 22,274,350 | (Won) | 2,047,881 | (Won) | 19,068,405 | ₩ | 265,258,942 | ₩ | 17,461,406 | ₩ | 819,719 | ₩ | 20,617,314 | ||||||||||||||||
KB Kookmin Card Co., Ltd. | 13,349,351 | 2,426,030 | 319,794 | 2,782,210 | 15,854,992 | 2,990,037 | 384,411 | 3,469,861 | ||||||||||||||||||||||||
KB Investment & Securities Co., Ltd. | 3,314,875 | 787,354 | 28,169 | 522,519 | 2,525,070 | 577,649 | 11,856 | 551,182 | ||||||||||||||||||||||||
KB Life Insurance Co., Ltd. | 4,515,809 | 1,220,799 | 18,572 | 354,688 | 6,945,605 | 1,457,365 | 9,098 | 549,128 | ||||||||||||||||||||||||
KB Asset Management Co., Ltd. | 177,691 | 83,855 | (5,655 | ) | 120,079 | 237,907 | 103,401 | 74,685 | 201,572 | |||||||||||||||||||||||
KB Real Estate Trust Co., Ltd. | 251,228 | 51,564 | 15,405 | 144,644 | 182,657 | 46,524 | 2,110 | 169,045 | ||||||||||||||||||||||||
KB Investment Co., Ltd. | 498,506 | 61,574 | 9,322 | 116,062 | 241,227 | 34,497 | 6,078 | 130,587 | ||||||||||||||||||||||||
KB Credit Information Co., Ltd. | 30,529 | 54,874 | (2,391 | ) | 22,460 | 30,142 | 43,627 | (336 | ) | 22,455 | ||||||||||||||||||||||
KB Data Systems Co., Ltd. | 30,590 | 117,467 | 2,148 | 16,220 | 21,753 | 50,440 | 19 | 14,873 | ||||||||||||||||||||||||
KB Savings Bank Co., Ltd. | 584,025 | 47,865 | (301 | ) | 134,938 | |||||||||||||||||||||||||||
Yehansoul Savings Bank(2) | 189,243 | 4,791 | (5,331 | ) | 25,159 | |||||||||||||||||||||||||||
| (1) | KB Capital Co., Ltd. (formerly named Woori Financial Co., Ltd.) was added as a subsidiary in March 2014 as a result of our purchase of 52.02% of its shares. |
| (2) | Yehansoul Savings Bank, which we acquired in September 2013, was merged with KB Savings Bank in January 2014, with KB Savings Bank as the surviving entity. |
Further information regarding our subsidiaries is provided below:
| • | Kookmin Bank was established in Korea in 2001 as a result of the merger of the former Kookmin Bank (established in 1963) and H&CB (established in 1967). Kookmin Bank provides a wide range of banking and other financial services to individuals, small- and medium-sized enterprises and large corporations in Korea. As of December 31, |
banks in Korea based upon total assets (including loans) and deposits. As of December 31, |
| • | KB Kookmin Card Co., Ltd. was established in March 2011 as a separate entity upon the completion of a horizontal spin-off of Kookmin Bank’s credit card business, to provide credit card services. |
| • | KB Investment & Securities Co., Ltd. |
| • | KB Life Insurance Co., Ltd. |
| • | KB Asset Management Co., Ltd. was established in Korea in April 1988 as a subsidiary of Citizens Investment Trust Company to provide investment advisory services. |
| • | KB Capital Co., Ltd., which provides leasing services and installment finance services, was formerly known as Woori Financial Co., Ltd. and was acquired by us on March 20, 2014. |
| • | KB Savings Bank Co., Ltd.was established in Korea in January 2012 to provide small-loan finance services. KB Savings Bank was established in connection with our purchase of assets and assumption of liabilities of Jeil Savings Bank in January 2012. |
| • | Yehansoul Savings Bank, which provided small-loan finance services, was acquired by us in September 2013. In January 2014, Yehansoul Savings Bank was merged with KB Savings Bank, with KB Savings Bank as the surviving entity. |
| • | KB Real Estate Trust Co., Ltd. was established in Korea in December 1996 to provide real estate development and brokerage services by managing trusts related to the real estate industry. |
| • | KB Investment Co., Ltd. was established in Korea in March 1990 to invest in and finance small- and medium-sized enterprises. |
| • | KB Credit Information Co., Ltd. was established in Korea in October 1999 to collect delinquent loans and to check credit history. |
| • | KB Data Systems Co., Ltd.was established in Korea in September 1991 to provide software services to us and other financial institutions. |
|
| Item | Property, Plants and Equipment |
Our registered office and corporate headquarters are located at 9-1, 2-ga,84, Namdaemoon-ro, Jung-gu,Seoul 100-703, Korea. The following table presents information regarding certain of our properties in Korea:
Type of facility/building | Location | Area (square meters) | ||||
Registered office and corporate headquarters |
Jung-gu, Seoul 100-703 | 1,749 | ||||
Kookmin Bank headquarters building |
| 5,354 | ||||
KB Kookmin | Jongro-gu, Seoul | |||||
Kookmin Bank Training institute | Ilsan | 207,659 | ||||
Kookmin Bank Training institute | Daecheon | 4,158 | ||||
Kookmin Bank Training institute | Sokcho | 15,584 | ||||
Kookmin Bank Training institute | Cheonan | 196,649 | ||||
Kookmin Bank IT center | Gangseo-gu, Seoul | 13,116 | ||||
Kookmin Bank IT center | Yeouido, Seoul | 5,928 | ||||
Kookmin Bank IT center | Yeouido, Seoul | 2,006 | ||||
Kookmin Bank IT center | Seongbuk-gu, Seoul | 4,748 | ||||
As of December 31, 2011,2013, we had a countrywide network of 1,1651,207 banking branches and sub-branches, as well as 58115 branches for our other operations including credit information, real estate,card, investment banking and insurance-related businesses. Approximately one-quarter of these facilities are housed in buildings owned by us, while the remaining branches are leased properties. Lease terms are generally from two to three years and seldom exceed five years. We also have subsidiaries in Cambodia, China, Hong Kong Cambodia and the United Kingdom and branches of Kookmin Bank in Osaka and Tokyo in Japan, Auckland in New Zealand, New York in the United States Guangzhou, Harbin and Suzhou in China and Ho Chi Minh City in Vietnam, as well as a representative officebranch of Kookmin Bank Cambodia PLC in Phnom Penh and branches of Kookmin Bank (China) Ltd. in Beijing, Guangzhou, Harbin and Suzhou in China. We also have representative offices of Kookmin Bank in Mumbai in India, Yangon in Myanmar and Hanoi in Vietnam. We do not own any material properties outside of Korea.
The net carrying amount of all the properties owned by us at December 31, 20112013 was (Won)2,919₩2,856 billion.
| Item | UNRESOLVED STAFF COMMENTS |
We do not have any unresolved comments from the U.S. Securities and Exchange Commission staff regarding our periodic reports under the Securities Exchange Act of 1934, as amended, or the Exchange Act.
| Item 5. | OPERATING AND FINANCIAL REVIEW AND PROSPECTS |
| Item | Operating Results |
Overview
The following discussion is based on our consolidated financial statements, which have been prepared in accordance with IFRS as issued by the IASB. The consolidated financial statements include the accounts of subsidiaries over which substantive control is exercised through majority ownership of voting stock and/or other means. Investments in jointly controlled entities and associates (companies over which we have the ability to exercise significant influence) are accounted for by the equity method of accounting.
Trends in the Korean Economy
Our financial position and results of operations have been and will continue to be significantly affected by financial and economic conditions in Korea. Substantial growth in lending in Korea to small- and medium-sized
enterprises in recent years, and financial difficulties experienced by such enterprises as a result of, among other things, adverse economic conditions in Korea and globally, from the second half of 2008, have generally led to increasing delinquencies and a deterioration in overall asset quality in the credit exposures of Korean banks to small- and medium-sized enterprises. In 2011,2013, we recorded charge-offs of (Won)1,274₩691 billion in respect of our loans to small- and medium-sized enterprises, compared to charge-offs of (Won)1,541₩943 billion in 2010.2012 and charge-offs of ₩1,274 billion in 2011. In light of the difficult financial condition and liquidity position of small- and medium-sized enterprises in Korea since the second half of 2008, the Korean government introduced measures intended to encourage Korean banks to provide financial support to small- and medium-sized enterprise borrowers. See “Item 3D.3.D. Risk Factors—Risks relating to our small- and medium-sized enterprise loan portfolio—We have significant exposure to small- and medium-sized enterprises, and any financial difficulties experienced by these customers may result in a deterioration of our asset quality and have an adverse impact on us.”
In recent years, commercial banks, consumer finance companies and other financial institutions in Korea have also made significant investments and engaged in aggressive marketing in retail lending (including mortgage and home equity loans), leading to substantially increased competition in this segment. The rapid growth in retail lending, together with adverse economic conditions since the second half of 2008,in recent years, have generally led to increasing delinquencies and a deterioration in asset quality. In 2011,2013, we recorded charge-offs of (Won)287₩581 billion and provision for loan losses of (Won)296₩361 billion in respect of our retail loan portfolio, compared to charge-offs of (Won)274₩453 billion and provision for loan losses of (Won)265₩402 billion in 2010.In June 2011, the Korean
government announced a set2012 and charge-offs of policy objectives to curtail the rapid growth₩287 billion and provision for loan losses of consumer lending by commercial banks, consumer finance companies and other financial institutions, as well as measures to encourage the increased use of fixed interest rates₩296 billion in consumer lending and to strengthen the protection of retail borrowers.2011. See “Item 3D.3.D. Risk Factors—Risks relating to our retail credit portfolio.”
The Korean economy is closely tied to, and is affected by developments in, the global economy. During the second and third quarter of 2007, credit markets in the United States started to experience difficult conditions and volatility that in turn affected worldwide financial markets. In particular, in late July and early August 2007, market uncertainty in the U.S. sub-prime mortgage sector increased dramatically and further expanded to other markets such as those for leveraged finance, collateralized debt obligations and other structured products. In September and October 2008, liquidity and credit concerns and volatility in the global financial markets increased significantly with the bankruptcy or acquisition of, and government assistance to, several major U.S. and European financial institutions. These developments resulted in reduced liquidity, greater volatility, widening of credit spreads and a lack of price transparency in the United States and global financial markets. In response to such developments, legislators and financial regulators in the United States and other jurisdictions, including Korea, implemented a number of policy measures designed to add stability to the financial markets, including the provision of direct and indirect assistance to distressed financial institutions. In addition, in line with similar actions taken by monetary authorities in other countries, from the third quarter of 2008 to the first quarter of 2009, the Bank of Korea decreased its policy rate by a total of 325 basis points in order to address financial market instability and to help combat the slowdown of the domestic economy.However, whileWhile the rate of deterioration of the global economy has slowed since the second halfcommencement of 2009,the global financial crisis in 2008 has slowed, with some signs of stabilization and improvement, the overall prospects for the Korean and global economy in 2012the remainder of 2014 and beyond remain uncertain. For example, commencingStarting in the second half of 2011, the global financial markets have experienced significant volatility as a result of, among other things, the downgrading by Standard & Poor’s Rating Services of the long-term sovereign credit rating of the United States to “AA+” from “AAA” in August 2011 and the financial difficulties affecting many other governments worldwide, in particular in Cyprus, Greece, Spain, Italy and other countriesPortugal, and the slowdown of economic growth in Europe.major emerging market economies, as well as concerns regarding the potential economic impact of the recently commenced scale-down by the U.S. Federal Reserve Board of its “quantitative easing” stimulus program. In addition, measurescontinuing negotiations regarding Iran’s nuclear program and sanctions adopted by the international community to sanction Iran for its nuclear weapons program,in response, as well as political and social instability in various countries in the Middle East and Northern Africa, including in Syria, Egypt Tunisia,and Libya, Syria and Yemen, have resulted in volatility and uncertainty in the global energy markets. These or other developments could potentially trigger another financial and economic crisis. Furthermore, while many governments worldwide are implementing “exit strategies,” in the form of reduced government spending or otherwise, with respect to the economic stimulus measures adopted in response to China’s slowing gross domestic product growth rates that began in 2011, the global financial crisis,Chinese government has implemented stimulus measures but the overall impact of such strategies may, for reasons related to timing, magnitude or other factors, have the unintended consequence of prolonging or worsening global economic and financial difficulties.measures remains uncertain. In light of the high level of interdependence of the global economy, any of the foregoing developments could have a material adverse effect on the Korean economy and financial markets, and in turn on our business, financial condition and results of operations.
We are also exposed to adverse changes and volatility in global and Korean financial markets as a result of our liabilities and assets denominated in foreign currencies and our holdings of trading and investment securities, including structured products. Since the second half of 2008, theThe value of the Won relative to major foreign currencies in general and the U.S. dollar in particular has fluctuated widely.widely in recent years. See “Item 3A.3.A. Selected Financial Data—Exchange Rates.” A depreciation of the Won will increase our cost in Won of servicing our foreign currency-denominated debt, while continued exchange rate volatility may also result in foreign exchange losses for us. Furthermore, as a result of adverse global and Korean economic conditions, there has been significant volatility in securities prices, including the stock prices of Korean and foreign companies in which we hold an interest. Such volatility has resulted in and may lead to further trading and valuation losses on our trading and investment securities portfolio as well as impairment losses on our investments accounted for under the equity method, including our noncontrolling equity stake in JSC Bank CenterCredit, a Kazakhstan bank, the initial stake in which we acquired in 2008. See “Item 4B.4.B. Business Overview—Capital Markets Activities and International Banking—International Banking.”
As a result of volatile conditions and weakness in the Korean and global economies, as well as factors such as the uncertainty surrounding the global financial markets, fluctuations in oil and commodity prices, interest and exchange rate fluctuations, higher unemployment, lower consumer confidence, increases in inflation rates, potential tightening of fiscal and monetary policies and continued tensions with North Korea, the economic outlook for the financial services sector in Korea in 20122014 and for the foreseeable future remains uncertain.
Acquisitions
In January 2012, we established KB Savings Bank to provide small-loan finance services to retail customers. KB Savings Bank was established in connection with our purchase of the assets of Jeil Savings Bank and assumption of its liabilities pursuant to a purchase and assumption agreement among Jeil Savings Bank, the Korea Deposit Insurance Corporation and us. In connection with such purchase and assumption, we recognized an acquisition of (Won)2,546 billion of assets and an assumption of (Won)2,654 billion of liabilities and also (Won)108 billion of goodwill. UnderMay 2012, pursuant to the purchase and assumption agreement, we have the right to transfertransferred to the Korea Deposit Insurance Corporation a portion of the assets we purchased and related liabilities we assumed, subjectassumed. In connection with such purchase and assumption (and after giving effect to certain conditions, by May 2012.the transfer to the Korea Deposit Insurance Corporation), we recognized an acquisition of ₩2,546 billion of assets and an assumption of ₩2,654 billion of liabilities and also ₩108 billion of goodwill.
In June 2013, we purchased ING Insurance International II B.V.’s 49% interest in KB Life Insurance Co., Ltd. for ₩167 billion, as a result of which KB Life Insurance Co., Ltd. became our wholly-owned subsidiary.
In September 2013, we purchased 100% of the shares of Yehansoul Savings Bank from the Korea Deposit Insurance Corporation for ₩38 billion. In connection with such purchase, we recognized an acquisition of ₩470 billion of assets and an assumption of ₩439 billion of liabilities and also ₩7 billion of goodwill. See Note 44 of the notes to our consolidated financial statements included elsewhere in this annual report. In January 2014, KB Savings Bank merged with Yehansoul Savings Bank, with KB Savings Bank as the surviving entity.
In addition, in March 2014, we acquired 52.02% of the outstanding shares of Woori Financial Co., Ltd. from Woori Finance Holdings Co., Ltd. for ₩280 billion.
New Basel Capital AccordChanges in Accounting Policies
BeginningPursuant to the adoption of IFRS 10,Consolidated Financial Statements, which is effective beginning in 2008,2013, our consolidated financial statements as of and for the Financial Supervisory Service implemented Basel IIyear ended December 31, 2013 include trust accounts for which we guarantee only the repayment of principal, as well as certain other entities, which were not previously subject to consolidation, while excluding certain other entities that were previously consolidated. Our consolidated financial statements as of and for the year ended December 31, 2012 (but not as of and for the year ended December 31, 2011) have been restated to retroactively apply this change.
In addition, pursuant to the amendments to IAS 19,Employee Benefits, which are effective beginning in Korea, which has substantially affected2013, our consolidated financial statements as of and for the way risk is measured among Korean financial institutions, including Kookmin Bank. Building upon the initial Basel Capital Accord of 1988, which focused primarily on credit risk and market risk and on capital adequacy and asset soundness as measures of risk, Basel II expands this approach to contemplate additional areas of risk such as operational risk when calculating risk-weighted assets. While the implementation of Kookmin Bank’s internal ratings-based approach in 2008 increased its capital adequacy ratio and led to a decrease in its credit risk-related capital requirements as compared to those under its previous approach under the initial Basel Capital Accord of 1988, there can be no assurance that such internal ratings-based approach under Basel II will not require an increase in Kookmin Bank’s credit risk capital requirementsyear ended December 31, 2013 reflect changes in the future, which may require Kookmin Bankmethodology for recognition and measurement of actuarial gains and losses and expected returns and service costs relating to either improve its asset quality or raise additional capital. See “Item 5B. Liquidityour employee pension plans. Our consolidated financial statements as of and Capital Resources—Financial Condition—Capital Adequacy.”for the years ended December 31, 2011 and 2012 have been restated to retroactively apply such changes.
In December 2009, the Basel CommitteeFor further information regarding these and other changes to our accounting policies and their effect on Banking Supervision introduced a new set of measures to supplement Basel II which include, among others, a requirement for higher minimum capital, introduction of a leverage ratio as a supplementary measure to the capital adequacy ratio and flexible capital requirements for different phasesour consolidated financial statements, see Note 2.1 of the economic cycle. Additional details regarding such new measures, including an additional capital conservation buffer and countercyclical capital buffer, liquidity coverage ratio and other supplemental measures, were announced by the Group of Governors and Heads of Supervision of the Basel Committee on Banking Supervisionnotes to our consolidated financial statements included elsewhere in September 2010. After further impact assessment and observation periods, the Basel Committee on Banking Supervision is expected to begin implementing the new set of measures, referred to as Basel III, from 2013. In Korea, Basel III is expected to be implemented in stages from 2013 to 2019. The implementation of Basel III in Korea may have a significant effect on the capital requirements of Korean financial institutions, including us.this annual report.
Changes in Securities Values, Exchange Rates and Interest Rates
Fluctuations of exchange rates, interest rates and stock prices affect, among other things, the demand for our products and services, the value of and rate of return on our assets, the availability and cost of funding and the financial condition of our customers. The following table shows, for the dates indicated, the stock price index of all equities listed on the KRX KOSPI Market as published in the KOSPI, the Won to U.S. dollar exchange rates and benchmark Won borrowing interest rates.
| June 29, 2007 | Dec. 31, 2007 | June 30, 2008 | Dec. 30, 2008 | June 30, 2009 | Dec. 30, 2009 | June 30, 2010 | Dec. 30, 2010 | June 30, 2011 | Dec. 29, 2011 | June 30, 2009 | Dec. 30, 2009 | June 30, 2010 | Dec. 30, 2010 | June 30, 2011 | Dec. 29, 2011 | June 29, 2012 | Dec. 31, 2012 | June 28, 2013 | Dec. 31, 2013 | |||||||||||||||||||||||||||||||||||||||||||||||||||||||||||||
KOSPI | 1,743.60 | 1,897.13 | 1,674.92 | 1,124.47 | 1,390.07 | 1,682.77 | 1,698.29 | 2,051.0 | 2,100.69 | 1,825.74 | 1,390.07 | 1,682.77 | 1,698.29 | 2,051.00 | 2,100.69 | 1,825.74 | 1,854.01 | 1,997.05 | (4) | 1,863.32 | 2,011.34 | (5) | ||||||||||||||||||||||||||||||||||||||||||||||||||||||||||
(Won)/US$ exchange rates (1) | (Won) | 922.6 | (Won) | 935.8 | (Won) | 1,046.8 | (Won) | 1,262.00 | (Won) | 1,273.5 | (Won) | 1,163.7 | (Won) | 1,273.5 | (Won) | 1,163.7 | (Won) | 1,066.3 | (Won) | 1,158.5 | ||||||||||||||||||||||||||||||||||||||||||||||||||||||||||||
₩/US$ exchange rates (1) | ₩ | 1,273.5 | ₩ | 1,163.7 | ₩ | 1,220.9 | ₩ | 1,130.6 | ₩ | 1,066.3 | ₩ | 1,158.5 | ₩ | 1,141.2 | ₩ | 1,063.2 | ₩ | 1,141.5 | ₩ | 1,055.3 | ||||||||||||||||||||||||||||||||||||||||||||||||||||||||||||
Corporate bond rates (2) | 5.64 | % | 6.94 | % | 6.88 | % | 8.12 | % | 5.61 | % | 5.70 | % | 4.96 | % | 4.30 | % | 4.49 | % | 4.22 | % | 5.61 | % | 5.70 | % | 4.96 | % | 4.30 | % | 4.49 | % | 4.22 | % | 3.94 | % | 3.44 | % | 3.54 | % | 3.64 | % | ||||||||||||||||||||||||||||||||||||||||
Treasury bond rates (3) | 5.26 | % | 5.74 | % | 5.90 | % | 3.41 | % | 4.16 | % | 4.41 | % | 3.86 | % | 3.38 | % | 3.76 | % | 3.34 | % | 4.16 | % | 4.41 | % | 3.86 | % | 3.38 | % | 3.76 | % | 3.34 | % | 3.30 | % | 2.82 | % | 2.88 | % | 2.86 | % | ||||||||||||||||||||||||||||||||||||||||
| (1) | Represents the noon buying rate on the dates indicated. |
| (2) | Measured by the yield on three-year Korean corporate bonds rated as A+ by the Korean credit rating agencies. |
| (3) | Measured by the yield on three-year treasury bonds issued by the Ministry of Strategy and Finance of Korea. |
| (4) | As of December 28, 2012, the last day of trading for the KRX KOSPI Market in 2012. |
| (5) | As of December 30, 2013, the last day of trading for the KRX KOSPI Market in 2013. |
Critical Accounting Policies
The notes to our consolidated financial statements contain a summary of our significant accounting policies, including a discussion of recently issued accounting pronouncements. Certain of these policies are critical to the portrayal of our financial condition, since they require management to make difficult, complex or subjective judgments, some of which may relate to matters that are inherently uncertain. We discuss these critical accounting policies below.
Impairment of Loans and Allowances for Loan Losses
We evaluate our loan portfolio for impairment on an ongoing basis. We have established allowances for loan losses, which are available to absorb probable losses that have been incurred in our loan portfolio as of the balance sheet date. If we believe that additions or changes to the allowances for loan losses are required, we record a provision for loan losses (as part of our provision for credit losses), which is treated as a charge against current income. Loan exposures that we deem to be uncollectible, including actual loan losses, net of recoveries of previously written-off amounts, are charged directly against the allowances for loan losses.
Our accounting policies for losses arising from the impairment of loans and allowances for loan losses are described in Note 3.6 of the notes to our consolidated financial statements. We base the level of our allowances for loan losses on an evaluation of the risk characteristics of our loan portfolio. The evaluation considers factors such as historical loss experience, the financial condition of our borrowers and current economic conditions.
Allowances represent our management’s best estimate of losses incurred in the loan portfolio as of the balance sheet date. Our management is required to exercise judgment in making assumptions and estimates when calculating loan allowances on both individually and collectively assessed loans.
The determination of the allowances required for loans which are deemed to be individually significant often requires the use of considerable management judgment concerning such matters as economic conditions, the financial performance of the counterparty and the value of any collateral held for which there may not be a readily accessible market. Once we have identified loans as impaired, we generally value them either based on the present value of expected future cash flows discounted at the loan’s effective interest rate or, as a practical expedient, at a loan’s observable market price or the fair value of the collateral if a loan is collateral dependent.
The actual amount of the future cash flows and their timing may differ from the estimates used by our management and consequently may cause actual losses to differ from the reported allowances.
The allowances for portfolios of smaller-balance homogenous loans, such as those to individuals and small business customers, and for those loans which are individually significant but for which no objective evidence of impairment exists, are determined on a collective basis. The collective allowances are calculated on a portfolio basis using statistical models which incorporate numerous estimates and judgments. We perform a regular review of the models and underlying data and assumptions.
Our consolidated financial statements for the year ended December 31, 20112013 included total allowances for loan losses of (Won)3,448₩2,861 billion as of that date. Our total loan charge-offs, net of recoveries, amounted to (Won)1,691₩1,717 billion and we recorded a provision for loan losses (which forms a part of the provision for credit losses, together with provisions for unused loan commitments, acceptances and guarantees, financial guarantee contracts and other financial assets) of (Won)1,645₩1,427 billion in 2011.2013.
We believe that the accounting estimates related to our impairment of loans and allowances for loan losses are a “critical accounting policy” because: (1) they are highly susceptible to change from period to period because they require us to make assumptions about future default rates and losses relating to our loan portfolio; and (2) any significant difference between our estimated loan losses (as reflected in our allowances for loan losses) and actual loan losses could require us to take an additional provision which, if significant, could have a material impact on our profit. Our assumptions about estimated losses require significant judgment because actual losses have fluctuated in the past and are expected to continue to do so, based on a variety of factors.
Valuation of Financial Instruments
Our accounting policy for determining the fair value of financial instruments is described in Notes 3.3 and 6 of the notes to our consolidated financial statements.
The best evidence of fair value is a quoted price in an actively traded market. In the event that the market for a financial instrument is not active, a valuation technique is used. The majority of valuation techniques employ only observable market data and, as such, the reliability of the fair value measurement is high. However, certain financial instruments are valued on the basis of valuation techniques that feature one or more significant market inputs that are unobservable. Valuation techniques that rely to a greater extent on unobservable inputs require a higher level of management judgment to calculate a fair value than those based wholly on observable inputs.
Valuation techniques used to calculate fair values are discussed in Note 6.26.1 of the notes to our consolidated financial statements. The main assumptions and estimates which our management considers when applying a model with valuation techniques are:
The likelihood and expected timing of future cash flows on the instrument. These cash flows are usually governed by the terms of the instrument, although judgment may be required when the ability of the counterparty to service the instrument in accordance with the contractual terms is in doubt. Future cash flows may be sensitive to changes in market rates.
Selecting an appropriate discount rate for the instrument. The determination of this rate is based on an assessment of what a market participant would regard as the appropriate spread of the rate for the instrument over the appropriate risk-free rate.
Judgment to determine what model to use to calculate fair value in areas where the choice of valuation model is particularly subjective (for example, valuation of complex derivative products).
The financial instruments carried at fair value have been categorized under the three levels of the IFRS fair value hierarchy as follows:
|
Level 1: Quoted prices in active markets for identical assets or liabilities.
Level 2: Observable inputs other than Level 1 prices, such as quoted prices for similar assets or liabilities.
Level 3: Unobservable inputs that are supported by little or no market activity and that are significant to the fair value of the assets or liabilities. |
|
The fair value hierarchy requires an entity to maximize the use of observable inputs and minimize the use of unobservable inputs when measuring fair value. Fair value is a market-based measure considered from the perspective of a market participant. As such, even when market assumptions are not readily available, our own assumptions are intended to reflect those that market participants would use in pricing the asset or liability at the measurement date.
For financial instruments traded in the over-the-counter market, we measure the fair value of such instruments as the arithmetic mean of prices obtained from Korea Asset Pricing (an affiliate of Fitch Ratings), KIS Pricing (an affiliate of Moody’s Investors Service) and NICE Pricing Service, all three of which are recognized as major qualified independent pricing services in Korea. There are extremely rare cases where we do not receive price quotes from all three of the pricing services described above. In such cases, we contact the pricing service which did not submit a price quote to discuss the reason why it cannot provide a price and, following such discussion, we use the arithmetic mean of only the prices obtained from the other pricing services so long as there is no reason to believe that the prices that have been submitted are inadequate. We generally do not adjust the prices we obtain from these independent pricing services, as the variance among such prices is insignificant in most cases (primarily because most of the financial instruments we hold consist of government bonds and highly-rated corporate bonds, there is a high volume of transactions in the over-the-counter market and actual transaction prices are monitored and referenced by the pricing services).
Our consolidated financial statements for the year ended December 31, 20112013 included financial assets measured at fair value using a valuation technique of (Won)17,614₩18,712 billion, representing 56.5%56.7% of total financial assets measured at fair value, and financial liabilities measured at fair value using a valuation technique of (Won)2,739₩2,674 billion, representing 79.4%91.9% of total financial liabilities measured at fair value. As used herein, the fair value using a valuation technique means the fair value at Level 2 and Level 3 in the fair value hierarchy.
We believe that the accounting estimates related to the determination of the fair value of financial instruments are a ��critical“critical accounting policy” because: (1) they may be highly susceptible to change from period to period based on factors beyond our control; and (2) any significant difference between our estimate of the fair value of these financial instruments on any particular date and either their estimated fair value on a different date or the actual proceeds that we receive upon sale of these financial instruments could result in valuation losses or losses on disposal which may have a material impact on our profit. Our assumptions about the fair value of financial instruments we hold require significant judgment because actual valuations have fluctuated in the past and are expected to continue to do so, based on a variety of factors.
Deferred Income Tax Assets
Our accounting policy for the recognition of deferred income tax assets is described in Notes 3.21 and 16 of the notes to our consolidated financial statements. The recognition of deferred income tax assets relies on an assessment of the probability and sufficiency of future taxable profits, future reversals of existing taxable temporary differences and ongoing tax planning strategies.
We recognize deferred income tax assets and liabilities for the future tax consequences attributable to temporary differences between the financial statement carrying amounts of existing assets and liabilities and their respective tax bases, unused tax losses and unused tax credits. Deferred income tax assets are recognized only to the extent it is probable that sufficient taxable profit will be available against which those deductible temporary differences, unused tax losses or unused tax credits can be utilized. This assessment requires significant
management judgment and assumptions. In determining the amount of deferred income tax assets, we use historical tax capacity and profitability information and, if relevant, forecasted operating results, based upon approved business plans, including a review of the eligible carry-forward periods, available tax planning opportunities and other relevant considerations.
Our consolidated financial statements for the year ended December 31, 20112013 included deferred income tax assets and liabilities of (Won)22₩15 billion and (Won)221₩62 billion, respectively, as of that date, after offsetting of (Won)1,111₩1,080 billion of deferred income tax liabilities and assets.
We believe that the estimates related to our recognition and measurement of deferred income tax assets are a “critical accounting policy” because: (1) they may be highly susceptible to change from period to period based on our assumptions regarding our future profitability; and (2) any significant difference between our estimates of future profits on any particular date and estimates of such future profits on a different date could result in an income tax expense or benefit which may have a material impact on our profit from period to period. Our assumptions about our future profitability require significant judgment and are inherently subjective.
Results of Operations
Comparison of 2011 to 2010
Net Interest Income
The following table shows, for the periods indicated, the principal components of our net interest income:
| Year Ended December 31, | Percentage change | Year Ended December 31, | Percentage Change | |||||||||||||||||||||||||||||
| 2010 | 2011 | 2011 | 2012 (1) | 2013 (1) | 2012/2011 | 2013/2012 | ||||||||||||||||||||||||||
| (in billions of Won) | (%) | (in billions of Won, except percentages) | (%) | |||||||||||||||||||||||||||||
Interest income | ||||||||||||||||||||||||||||||||
Cash and interest earning deposits in other banks | (Won) | 38 | (Won) | 75 | 97.4 | % | ₩ | 75 | ₩ | 160 | ₩ | 146 | 113.3 | % | (8.8 | )% | ||||||||||||||||
Loans | 11,512 | 12,412 | 7.8 | 12,412 | 12,624 | 10,942 | 1.7 | (13.3 | ) | |||||||||||||||||||||||
Financial investments (debt securities) | 1,502 | 1,469 | (2.2 | ) | 1,469 | 1,426 | 1,269 | (2.9 | ) | (11.0 | ) | |||||||||||||||||||||
|
|
|
|
| ||||||||||||||||||||||||||||
Total interest income | 13,052 | 13,956 | 6.9 | 13,956 | 14,210 | 12,357 | 1.8 | (13.0 | ) | |||||||||||||||||||||||
|
|
|
|
| ||||||||||||||||||||||||||||
Interest expense | ||||||||||||||||||||||||||||||||
Deposits | 4,709 | 4,945 | 5.0 | 4,945 | 5,450 | 4,279 | 10.2 | (21.5 | ) | |||||||||||||||||||||||
Debts | 306 | 399 | 30.4 | 399 | 460 | 365 | 15.3 | (20.7 | ) | |||||||||||||||||||||||
Debentures | 1,863 | 1,508 | (19.1 | ) | 1,508 | 1,262 | 1,190 | (16.3 | ) | (5.7 | ) | |||||||||||||||||||||
|
|
|
|
| ||||||||||||||||||||||||||||
Total interest expense | 6,878 | 6,852 | (0.4 | ) | 6,852 | 7,172 | 5,834 | 4.7 | (18.7 | ) | ||||||||||||||||||||||
|
|
|
|
| ||||||||||||||||||||||||||||
Net interest income | (Won) | 6,174 | (Won) | 7,104 | 15.1 | ₩ | 7,104 | ₩ | 7,038 | ₩ | 6,523 | (0.9 | )% | (7.3 | )% | |||||||||||||||||
|
|
|
|
| ||||||||||||||||||||||||||||
Net interest margin | 2.58 | % | 2.88 | % | 2.88 | % | 2.71 | % | 2.51 | % | ||||||||||||||||||||||
Notes:
| (1) | The amounts for 2013 reflect a change in our accounting policies pursuant to the adoption of IFRS 10,Consolidated Financial Statements, which is effective beginning in 2013. Corresponding amounts for 2012 (but not for 2011) have been restated to retroactively apply such change. See “—Overview—Changes in Accounting Policies.” |
| (2) | Consists of debt securities in our available-for-sale and held-to-maturity financial asset portfolios. |
The ratio of net interest income to average interest earning assets. See “Item |
Comparison of 2013 to 2012
Interest income.Interest income increased 6.9%decreased 13.0% from (Won)13,052₩14,210 billion in 20102012 to (Won)13,956₩12,357 billion in 2011,2013, primarily as a result of a 7.8% increase13.3% decrease in interest on loans. The average balance of our interest earning assets increased 3.1%decreased 0.2% from (Won)239,273₩260,120 billion in 20102012 to (Won)246,627₩259,645 billion in 2011,2013, principally due to the growtha decrease in our loan portfolio. This increaseThe effect of this decrease was enhanced by a 2170 basis point increasedecrease in average yields on our interest earning assets from 5.45%5.46% in 20102012 to 5.66%4.76% in 2011,2013, which reflected an increasea decrease in the general level of interest rates in Korea in 2011.2013.
The 7.8% increase13.3% decrease in interest on loans from (Won)11,512₩12,624 billion in 20102012 to (Won)12,412₩10,942 billion in 20112013 was primarily the result of:
a 10.8% increase68 basis point decrease in the average volume of home equityyields on corporate loans from (Won)26,524 billion5.18% in 20102012 to (Won)29,399 billion4.50% in 2011,2013, which was enhanced by a 41 basis point increase in average yields on such loans from 4.74% in 2010 to 5.15% in 2011;
a 54 basis point increase in average yields on mortgage loans from 4.42% in 2010 to 4.96% in 2011, which was partially offset by a 1.2%2.1% decrease in the average volume of such loans from (Won)44,322₩102,773 billion in 20102012 to (Won)43,790₩100,614 billion in 2011;2013;
a 2.7% increase82 basis point decrease in the average volume of corporate loans from (Won)92,018 billion in 2010 to (Won)94,486 billion in 2011, which was enhanced by a 6 basis point increase in average yields on such loans from 5.37% in 2010 to 5.43% in 2011; and
a 35 basis point increase in average yields on other consumer loans from 7.11%7.28% in 20102012 to 7.46%6.46% in 2011,2013, which was enhancedpartially offset by a 3.9%2.7% increase in the average volume of such loans from (Won)28,075₩29,721 billion in 20102012 to (Won)29,179₩30,536 billion in 2011.2013;
a 76 basis point decrease in the average yields on mortgage loans from 4.86% in 2012 to 4.10% in 2013, which was partially offset by a 0.2% increase in the average volume of such loans from ₩44,444 billion in 2012 to ₩44,514 billion in 2013; and
an 84 basis point decrease in the average yields on home equity loans from 5.09% in 2012 to 4.25% in 2013, which was partially offset by a 0.3% increase in the average volume of such loans from ₩30,170 billion in 2012 to ₩30,275 billion in 2013.
The average yields for corporate loans, other consumer loans, mortgage loans and home equity loans mortgage loans, corporate loans and other consumer loans increaseddecreased mainly as a result of the increasedecrease in the general level of interest rates in Korea applicable to such loans from 20102012 to 2011.2013. The increase in the average volume of home equity loans mainly reflected higher demand for such loans in Korea. The decrease in the average volume of mortgage loans was primarily a result of initiatives by the Korean government to reduce household debt by tightening rules on mortgage lending in 2011. The increase in the average volume of corporate loans was primarily due to our increased marketing efforts as well as increased demand for suchto improve the asset quality of our corporate loans in anticipationby applying more stringent standards to the origination of higher funding costs duenew loans and renewal of existing loans to growing adverse conditions in the global financial markets beginning in the second half of 2011.corporate customers. The increase in the average volume of other consumer loans was principally due to higher demand for such loans in Korea. The increase in the average volume of mortgage loans was primarily a result of an increase in loans relating to key money deposits. The increase in the average volume of home equity loans mainly reflected higher demand for such loans in Korea.
Overall, the average volume of our loans increased 3.3%decreased 0.7%, from (Won)204,945₩221,930 billion in 20102012 to (Won)211,673₩220,401 billion in 2011, and2013, while the average yields on our loans increaseddecreased by 2473 basis points, from 5.62%5.69% in 20102012 to 5.86%4.96% in 2011.2013.
Debt securities in our financial investments portfolio consistsconsist of available-for-sale debt securities and held-to-maturity debt securities, including debt securities issued by government-owned or -controlled enterprises or financial institutions and debt securities issued by Korean banks and other financial institutions. The 2.2% decrease in interestInterest on debtsdebt securities in our financial investments portfolio decreased 11.0% from (Won)1,502₩1,426 billion in 20102012 to (Won)1,469₩1,269 billion in 2011 was the2013 primarily as a result of a 1346 basis point decrease in average yields on such debt securities from 4.63%4.27% in 20102012 to 4.50%3.81% in 2011, as2013, which was enhanced by a 0.1% decrease in the average volume of such debt securities remained relatively steady at (Won)32,655from ₩33,382 billion in 2011 compared2012 to (Won)32,449₩33,339 billion in 2010.2013. The decrease in average yields on such debt securities was primarily due to an increasethe decrease in the proportiongeneral level of monetary stabilization bondsinterest rates in our financial investments portfolio, which typically feature relatively lower yields compared to other types ofKorea for debt securities in our financial investments portfolio.from 2012 to 2013.
Interest Expense.expense.Interest expense decreased 0.4%18.7% from (Won)6,878₩7,172 billion in 20102012 to (Won)6,852₩5,834 billion in 2011,2013 primarily due mainly to a 19.1%21.5% decrease in interest expense on debentures. Such decreasedeposits, which was substantially offsetenhanced by a 5.0% increase in interest expense on deposits and a 30.4% increase20.7% decrease in interest expense on debts. The average volume of interest bearing liabilities increased 1.6%decreased 1.0% from (Won)223,504₩240,831 billion in 20102012 to (Won)227,158₩238,452 billion in 2011, principally due to an increase2013, which mainly reflected a decrease in the average volume of deposits. The effect of this increasedecrease was partially offsetenhanced by a decrease of 653 basis points in the average cost of interest bearing liabilities from 3.08%2.98% in 20102012 to 3.02%2.45% in 2011,2013, which was driven mainly by an increase in the proportion of deposits and debts, which typically feature relatively lower interest rates compared to debentures, in our funding portfolio.
The 19.1% decrease in interest expense on debentures from (Won)1,863 billion in 2010 to (Won)1,508 billion in 2011 resulted primarily from a 21.5% decrease in the average volume of long-term debentures from (Won)32,313 billion in 2010 to (Won)25,352 billion in 2011. The effect of such decrease was partially offset by a 7 basis point increase in the average cost of long-term debentures from 5.50% in 2010 to 5.57% in 2011. The decrease in the average volume of long-term debentures mainly reflected decreased use of long-term debentures to meet our funding needs, while the increase in the average cost of such debentures was primarily attributable to the general increase in market interest ratesrate environment in Korea including for such debentures.in 2013.
The 5.0% increase21.5% decrease in interest expense on deposits from (Won)4,709₩5,450 billion in 20102012 to (Won)4,945₩4,279 billion in 20112013 was primarily due to:
to a 10.7% increase67 basis point decrease in the average volumecost of time deposits from (Won)112,621 billion3.69% in 20102012 to (Won)124,713 billion3.02% in 2011,2013, which was enhanced by a 6 basis point increase in the average cost of such deposits from 3.60% in 2010 to 3.66% in 2011; and
a 15 basis point increase in the average cost of demand deposits from 0.43% in 2010 to 0.58% in 2011, which was enhanced by a 10.0% increase4.6% decrease in the average volume of such deposits from (Won)48,919₩136,617 billion in 20102012 to (Won)53,824₩130,286 billion in 2011.
2013. The effect of such increases was partially offset by an 84.2% decrease in the average volume of certificates of deposit from (Won)11,044 billion in 2010 to (Won)1,746 billion in 2011, which was enhanced by an 11 basis point decrease in the average cost of such deposits from 4.00% in 2010 to 3.89% in 2011.
The increase in the average volume of time deposits and demand deposits mainly reflected higher demand in Korea for lower-risk financial products as well as deposit products from larger commercial banks as opposed to smaller and higher-risk savings banks, in light of continued financial market volatility in 2011.the
The increase in the average cost of demand deposits and time deposits was principally due to the increase
decrease in the general level of interest rates in Korea in 2011.from 2012 to 2013. The decrease in the average volume of certificates of deposit resulted primarily from our continuing effortstime deposits was principally due to convert our certificates of deposit into other depositsa decrease in order to comply with new loan-to-deposit ratio requirements set by the Financial Supervisory Service, which exclude certificates of deposit from the calculation of totaltime deposits for purposescorporate customers. Overall, the average cost of determining compliance with such ratio requirements.our deposits decreased by 58 basis points from 2.80% in 2012 to 2.22% in 2013, while the average volume of our deposits decreased by 0.8% from ₩194,506 billion in 2012 to ₩192,960 billion in 2013.
The 20.7% decrease in interest expense on debts from ₩460 billion in 2012 to ₩365 billion in 2013 resulted from a 30 basis point decrease in the average cost of debts from 2.11% in 2012 to 1.81% in 2013, which was enhanced by a 7.3% decrease in the average volume of debts from ₩21,773 billion in 2012 to ₩20,173 billion in 2013. The decrease in the average cost of certificates of deposit mainly reflected our decreased emphasisdebts was primarily attributable to the general decrease in marketing certificates of deposit, which resultedmarket interest rates in lower pricing of such deposits.
Overall,Korea, including for short-term borrowings and call money, in 2013, while the decrease in the average volume of debts mainly reflected a decrease in the use of short-term borrowings to meet our deposits increased by 4.5% from (Won)172,584 billion in 2010 to (Won)180,283 billion in 2011, while the average cost of our deposits remained relatively steady at 2.74% in 2011 compared to 2.73% in 2010.funding needs.
Net interest margin.Net interest margin represents the ratio of net interest income to average interest earning assets. Our overall net interest margin increaseddecreased from 2.58%2.71% in 20102012 to 2.88%2.51% in 2011,2013, as a 15.1% increase7.3% decrease in our net interest income from (Won)6,174₩7,038 billion in 20102012 to (Won)7,104₩6,523 billion in 20112013 outpaced a 3.1% increase0.2% decrease in the average volume of our interest earning assets from (Won)239,273₩260,120 billion in 20102012 to (Won)246,627₩259,645 billion in 2011.2013. The growthdecrease in average interest earning assets was outpaced by a 1.6% increase1.0% decrease in average interest bearing liabilities from (Won)223,504₩240,831 billion in 20102012 to (Won)227,158₩238,452 billion in 2011,2013, while the increasedecrease in interest expense was more than offset by a decrease in interest income, more than offset the increase in interest expense, resulting in an increasea decrease in net interest income. The magnitude of this increase was enhanced by an increase in ourOur net interest spread, which represents the difference between the average yield on our interest earning assets and the average cost of our interest bearing liabilities, declined from 2.37%2.48% in 20102012 to 2.64%2.31% in 2011.2013. The increasedecline in our net interest spread reflected an increasea larger decrease in the average yield of our interest earning assets, relative to the decrease in the average cost of our interest bearing liabilities, primarily due to the earlier adjustment of interest rates on interest earning assets compared to interest rates on interest bearing liabilities in the context of the lower interest rate environment, as well as the continuing rate-based competition in the Korean banking industry for the marketing of loan products.
Comparison of 2012 to 2011
Interest income.Interest income increased 1.8% from ₩13,956 billion in 2011 to ₩14,210 billion in 2012, primarily as a result of a 1.7% increase in interest on loans. The average balance of our interest earning assets increased 5.5% from ₩246,627 billion in 2011 to ₩260,120 billion in 2012, principally due to the growth in our loan portfolio. The effect of this increase was offset in part by a 20 basis point decrease in average yields on our interest earning assets from 5.66% in 2011 to 5.46% in 2012, which reflected an increasea decrease in the general level of interest rates in Korea in 2012.
The 1.7% increase in interest on loans from ₩12,412 billion in 2011 coupled withto ₩12,624 billion in 2012 was primarily the result of an 8.8% increase in the average volume of corporate loans from ₩94,486 billion in 2011 to ₩102,773 billion in 2012, which was partially offset by a 25 basis point decrease in average yields on such loans from 5.43% in 2011 to 5.18% in 2012. The increase in the average volume of corporate loans was principally due to an increase in loans to SOHO customers which reflected our focus on marketing to this segment in 2012, while the average yields for corporate loans decreased mainly as a result of the decrease in the general level of interest rates in Korea applicable to such loans from 2011 to 2012.
Overall, the average volume of our loans increased 4.8%, from ₩211,673 billion in 2011 to ₩221,930 billion in 2012, while the average yields on our loans decreased by 17 basis points, from 5.86% in 2011 to 5.69% in 2012.
Interest on debt securities in our financial investments portfolio decreased 2.9% from ₩1,469 billion in 2011 to ₩1,426 billion in 2012 as a result of a 23 basis point decrease in average yields on such debt securities from 4.50% in 2011 to 4.27% in 2012, which was partially offset by a 2.2% increase in the average volume of
such debt securities from ₩32,655 billion in 2011 to ₩33,382 billion in 2012. The decrease in average yields on such debt securities was primarily due to the decrease in the general level of interest rates in Korea for debt securities, while the increase in the average volume of such debt securities mainly reflected our increased purchases of Korean treasury securities and debt securities issued by government agencies and financial institutions.
Interest expense.Interest expense increased 4.7% from ₩6,852 billion in 2011 to ₩7,172 billion in 2012 primarily due to a 10.2% increase in interest expense on deposits, which was partially offset by a 16.3% decrease in interest expense on debentures. The average volume of interest bearing liabilities increased 6.0% from ₩227,158 billion in 2011 to ₩240,831 billion in 2012, which mainly reflected an increase in the average volume of deposits. The effect of this increase was partially offset by a decrease of 4 basis points in the average cost of interest bearing liabilities from 3.02% in 2011 to 2.98% in 2012, which was driven mainly by the lower interest rate environment in Korea in 2012.
The 10.2% increase in interest expense on deposits from ₩4,945 billion in 2011 to ₩5,450 billion in 2012 was primarily due to a 9.5% increase in the average volume of time deposits from ₩124,713 billion in 2011 to ₩136,617 billion in 2012, while the average cost of such deposits increased by 3 basis points from 3.66% in 2011 to 3.69% in 2012. The increase in the average volume of time deposits mainly reflected continuing demand for lower-risk financial products from our customers. Overall, the average volume of our deposits increased by 7.9% from ₩180,283 billion in 2011 to ₩194,506 billion in 2012, while the average cost of our deposits increased by 6 basis points from 2.74% in 2011 to 2.80% in 2012 as the relative proportion of higher interest rate deposit products in our total deposit portfolio increased in light of the continuing rate-based competition in the Korean banking industry for deposits.
The 16.3% decrease in interest expense on debentures from ₩1,508 billion in 2011 to ₩1,262 billion in 2012 resulted from a 15.5% decrease in the average volume of long-term debentures from ₩25,352 billion in 2011 to ₩21,424 billion in 2012 as well as a 16 basis point decrease in the average cost of long-term debentures from 5.57% in 2011 to 5.41% in 2012. The decrease in the average volume of long-term debentures mainly reflected our decreased use of long-term debentures to meet our funding needs, while the decrease in the average cost of such debentures was primarily attributable to the general decrease in market interest rates in Korea, including for such debentures, in 2012.
Net interest margin.Our overall net interest margin decreased from 2.88% in 2011 to 2.71% in 2012, as the effect of a 0.9% decrease in our net interest income from ₩7,104 billion in 2011 to ₩7,038 billion in 2012 was enhanced by a 5.5% increase in the average volume of our interest earning assets from ₩246,627 billion in 2011 to ₩260,120 billion in 2012. The growth in average interest earning assets was outpaced by a 6.0% increase in average interest bearing liabilities from ₩227,158 billion in 2011 to ₩240,831 billion in 2012, while the increase in interest income was more than offset by the increase in interest expense, resulting in a decrease in net interest income. Our net interest spread declined from 2.64% in 2011 to 2.48% in 2012. The decline in our net interest spread reflected a larger decrease in the average yield of our interest earning assets, relative to the decrease in the average cost of our interest bearing liabilities, from 2010primarily due to 2011, which was driven mainly by an increasethe earlier adjustment of interest rates on interest earning assets compared to interest rates on interest bearing liabilities in the proportioncontext of deposits and debts, which typically feature relativelythe lower interest rates compared to debentures,rate environment, as well as the continuing rate-based competition in our funding portfolio.the Korean banking industry for the marketing of loan products.
Provision for Credit Losses
Provision for credit losses includes provision for loan losses, provision for unused loan commitments, provision for acceptances and guarantees, provision for financial guarantee contracts and provision for other financial assets, in each case net of reversal of provisions.Our provision for credit losses decreased 47.3% from (Won)2,871 billion in 2010 to (Won)1,513 billion in 2011, primarily due to a decrease in provision for loan losses in respect of our corporate loans. Such decrease resulted mainly from an improvement in the overall asset quality of our corporate loans.Forprovisions.For a discussion of our loan loss provisioning policy, see “Item 4B.4.B. Business Overview—Assets and Liabilities—Loan Portfolio—Provisioning Policy.”
In accordance with the guidelines of the Financial Supervisory Service, if our provision for loan losses areis deemed insufficient for regulatory purposes, we compensate for the difference by recording a regulatory reserve
for credit losses, which is segregated within retained earnings. See “Item 4B.4.B. Business Overview—Assets and Liabilities—Loan Portfolio—Regulatory Reserve for Credit Losses” and Note 2526 of the notes to our consolidated financial statements included elsewhere in this annual report.
Comparison of 2013 to 2012
Our provision for credit losses decreased 10.2% from ₩1,607 billion in 2012 to ₩1,443 billion in 2013, primarily due to an improvement in the overall asset quality of our loans reflecting a decrease in delinquency rates.
Our loan write-offs, net of recoveries, decreased 4.3%1.7% from (Won)1,767₩1,747 billion in 20102012 to (Won)1,691₩1,717 billion in 2011,2013, primarily due to a decrease in write-offs of loans to corporate borrowers.credit card loans.
Our reversal of provision for acceptances and guarantees and unused loan commitments changeddecreased from a provision of (Won)318₩91 billion in 20102012 to a reversal of provision of (Won)130₩8 billion in 2011,2013, due primarily to a decrease in reversal of provision for refund guarantees issued on behalf of shipbuilding companies.
Comparison of 2012 to 2011
Our provision for credit losses increased 6.2% from ₩1,513 billion in 2011 to ₩1,607 billion in 2012, primarily due to an increase in provision for loan losses in respect of our retail loans in light of higher delinquencies in our retail loan portfolio, reflecting adverse economic conditions in Korea. Our loan write-offs, net of recoveries, increased 3.3% from ₩1,691 billion in 2011 to ₩1,747 billion in 2012, primarily due to an increase in write-offs of unsecured loans made to retail borrowers.
Our reversal of provision for acceptances and guarantees and unused loan commitments decreased from reversal of provision of ₩130 billion in 2011 to a reversal of provision of ₩91 billion in 2012, due primarily to a decrease in reversal of provision for refund guarantees issued on behalf of shipbuilding companies.
Allowances for Loan Losses
Under IFRS, we establish allowances for loan losses with respect to loans to absorb such losses. We assess individually significant loans on a case-by-case basis and other loans on a collective basis. In addition, if we determine that no objective evidence of impairment exists for a loan, we include such loan in a group of loans with similar credit risk characteristics and assess them collectively for impairment regardless of whether such loan is significant. For further information on allowances for loan losses, see “—Critical Accounting Policies—Impairment of Loans and Allowances for Loan Losses” and “Item 4B.4.B. Business Overview—Assets and Liabilities—Loan Portfolio—Allocation and Analysis of Allowances for Loan Losses under IFRS.”
Corporate Loans.The following table shows, for the periods indicated, certain information regarding our impaired corporate loans:
| As of December 31, | As of December 31, | |||||||||||||||||||
| 2010 | 2011 | 2011 | 2012 (1) | 2013 (1) | ||||||||||||||||
Impaired corporate loans as a percentage of total corporate loans | 3.0 | % | 2.3 | % | 2.3 | % | 2.3 | % | 2.8 | % | ||||||||||
Allowances for loan losses for corporate loans as a percentage of total corporate loans | 3.2 | 2.5 | 2.5 | 2.2 | 1.8 | |||||||||||||||
Allowances for loan losses for corporate loans as a percentage of impaired corporate loans | 106.8 | 107.3 | 107.3 | 94.5 | 65.5 | |||||||||||||||
Net charge-offs of corporate loans as a percentage of total corporate loans | 1.6 | 1.3 | 1.3 | 1.0 | 1.0 | |||||||||||||||
| (1) | The amounts as of December 31, 2013 reflect a change in our accounting policies pursuant to the adoption of IFRS 10,Consolidated Financial Statements, which is effective beginning in 2013. Corresponding amounts as of December 31, 2012 (but not as of December 31, 2011) have been restated to retroactively apply such change. See “—Overview—Changes in Accounting Policies.” |
During 2013, impaired corporate loans as a percentage of total corporate loans increased due to a reclassification of impaired corporate loans to include all loans for which account-specific provisions have been made, while allowances for loan losses for corporate loans as a percentage of total corporate loans decreased primarily as a result of an improvement in the overall asset quality of our corporate loans, resulting in a decrease in allowance for loan losses for corporate loans as a percentage of impaired corporate loans.
During 2012, impaired corporate loans as a percentage of total corporate loans remained relatively constant. Allowances for loan losses for corporate loans, as a percentage of total corporate loans and as a percentage of impaired corporate loans, respectively, decreased during 2012 primarily as a result of a decrease in our allowances for loan losses for such loans, which mainly reflected an increase in the relative proportion of such loan amounts that are secured by collateral.
During 2011, impaired corporate loans and allowances for loan losses for corporate loans, each as a percentage of total corporate loans, decreased due to decreases in our impaired corporate loans and allowances for loan losses for such loans. However, allowances for loan losses for corporate loans as a percentage of impaired corporate loans increased during 2011 as a result of the deterioration in the asset quality of loans to the construction and shipbuilding sectors, which led to a worse overall mix of impaired corporate loans.
Retail Loans.The following table shows, for the periods indicated, certain information regarding our impaired retail loans:
| As of December 31, | As of December 31, | |||||||||||||||||||
| 2010 | 2011 | 2011 | 2012 (1) | 2013 (1) | ||||||||||||||||
Impaired retail loans as a percentage of total retail loans | 1.0 | % | 1.0 | % | 1.0 | % | 1.1 | % | 1.0 | % | ||||||||||
Allowances for loan losses for retail loans as a percentage of total retail loans | 0.5 | 0.6 | 0.6 | 0.7 | 0.5 | |||||||||||||||
Allowances for loan losses for retail loans as a percentage of impaired retail loans | 51.4 | 59.9 | 59.9 | 58.1 | 56.7 | |||||||||||||||
Net charge-offs of retail loans as a percentage of total retail loans | 0.1 | 0.2 | 0.2 | 0.3 | 0.4 | |||||||||||||||
| (1) | The amounts as of December 31, 2013 reflect a change in our accounting policies pursuant to the adoption of IFRS 10,Consolidated Financial Statements, which is effective beginning in 2013. Corresponding amounts as of December 31, 2012 (but not as of December 31, 2011) have been restated to retroactively apply such change. See “—Overview—Changes in Accounting Policies.” |
During 2013, impaired retail loans as a percentage of total retail loans remained relatively constant. However, an improvement in the asset quality of our existing impaired retail loans led to a better overall mix of impaired loans, which caused the level of allowances for loan losses as a percentage of both total retail loans and impaired retail loans to decrease.
During 2012, impaired retail loans as a percentage of total retail loans increased as the effect of an increase in our impaired retail loans, which reflected a deterioration in the asset quality of our retail loan portfolio due to adverse economic conditions in Korea in 2012, was enhanced by a slight decrease in the amount of our total retail loans. Allowances for loan losses for retail loans as a percentage of total retail loans similarly increased during 2012 as the effect of an increase in allowances for retail loans, reflecting the deterioration in the asset quality of our retail loan portfolio, was enhanced by the decrease in the amount of our total retail loans. However, an improvement in the asset quality of our existing impaired retail loans reflecting our increased charge-offs of such loans in 2012 led to a better overall mix of impaired retail loans, which caused the level of allowances for loan losses for retail loans as a percentage of impaired retail loans to decrease.
During 2011, impaired retail loans as a percentage of total retail loans remained relatively constant. However, a deterioration in the asset quality of our existing impaired retail loans led to a worse overall mix of impaired retail loans, which caused the level of allowances for loan losses as a percentage of both total retail loans and impaired retail loans to increase.
Credit Card Balances.The following table shows, for the periods indicated, certain information regarding our impaired credit card balances:
| As of December 31, | As of December 31, | |||||||||||||||||||
| 2010 | 2011 | 2011 | 2012 (1) | 2013 (1) | ||||||||||||||||
Impaired credit card balances as a percentage of total credit card balances | 0.6 | % | 0.9 | % | 0.9 | % | 1.0 | % | 1.8 | % | ||||||||||
Allowances for loan losses for credit card balances as a percentage of total credit card balances | 2.6 | 2.8 | 2.8 | 2.8 | 3.5 | |||||||||||||||
Allowances for loan losses for credit card balances as a percentage of impaired credit card balances | 418.3 | 327.9 | 327.9 | 272.9 | 196.4 | |||||||||||||||
Net charge-offs as a percentage of total credit card balances | 1.1 | 1.7 | 1.7 | 3.0 | 2.2 | |||||||||||||||
| (1) | The amounts as of December 31, 2013 reflect a change in our accounting policies pursuant to the adoption of IFRS 10,Consolidated Financial Statements, which is effective beginning in 2013. Corresponding amounts as of December 31, 2012 (but not as of December 31, 2011) have been restated to retroactively apply such change. See “—Overview—Changes in Accounting Policies.” |
During 2013, impaired credit card balances as a percentage of total credit card balances increased primarily due to an increase in impaired credit card balances, which mainly reflected a decrease in charge-off of such balances due to a change in our charge-off policy in 2013 which increased the delinquency period for credit card balances before charge-off from three months to six months. Allowances for loan losses for credit card balances as a percentage of total credit card balances increased during 2013 mainly as a result of an increase in impaired credit card balances. Allowance for loan losses for credit card balances as a percentage of impaired credit card balances decreased during 2013 as the increase in impaired credit card balances outpaced the increase in allowance for loans losses for credit card balances.
During 2012, impaired credit card balances as a percentage of total credit card balances increased slightly primarily due to the effect of a decrease in our total credit card balances while the amount of our impaired credit card balances remained relatively steady. Allowances for loan losses for credit card balances, which decreased during 2012 mainly as a result of a decrease in our total credit card balances as well as increased charge-offs (which, in turn, principally reflected increased delinquencies in our credit card portfolio from the second half of 2011 becoming subject to charge off in 2012), remained relatively constant as a percentage of total credit card balances and decreased as a percentage of impaired credit card balances.
During 2011, impaired credit card balances and allowances for loan losses for credit card balances, each as a percentage of total credit card balances, increased due to growth in our impaired credit card balances and allowances for loan losses for credit card balances. However, the increase in our impaired credit card balances outpaced the increase in our allowances for loan losses for credit card balances, resulting in a decrease in the level of allowances for loan losses for credit card balances as a percentage of impaired credit card balances.
Net Fee and Commission Income
The following table shows, for the periods indicated, the components of our net fee and commission income:
| Year Ended December 31, | Percentage change | Year Ended December 31, | Percentage Change | |||||||||||||||||||||||||||||
| 2010 | 2011 | 2011 | 2012 (1) | 2013 (1) | 2012/2011 | 2013/2012 | ||||||||||||||||||||||||||
| (in billions of Won) | (%) | (in billions of Won) | (%) | |||||||||||||||||||||||||||||
Fee and commission income | (Won) | 2,482 | (Won) | 2,830 | 14.0 | % | ₩ | 2,830 | ₩ | 2,754 | ₩ | 2,657 | (2.7 | )% | (3.5 | )% | ||||||||||||||||
Fee and commission expense | (777 | ) | (1,035 | ) | 33.2 | (1,035 | ) | (1,187 | ) | (1,178 | ) | 14.7 | (0.8 | ) | ||||||||||||||||||
|
|
|
|
| ||||||||||||||||||||||||||||
Net fee and commission income | (Won) | 1,705 | (Won) | 1,795 | 5.3 | ₩ | 1,795 | ₩ | 1,567 | ₩ | 1,479 | (12.7 | )% | (5.6 | )% | |||||||||||||||||
|
|
|
|
| ||||||||||||||||||||||||||||
| (1) | The amounts for 2013 reflect a change in our accounting policies pursuant to the adoption of IFRS 10,Consolidated Financial Statements, which is effective beginning in 2013. Corresponding amounts for 2012 (but not for 2011) have been restated to retroactively apply such change. See “—Overview—Changes in Accounting Policies.” |
Comparison of 2013 to 2012
Our net fee and commission income increased 5.3%decreased 5.6% from (Won)1,705₩1,567 billion in 20102012 to (Won)1,795₩1,479 billion in 2011, as2013, primarily due to a 14.0% increase3.5% decrease in fee and commission income from (Won)2,482₩2,754 billion in 20102012 to (Won)2,830₩2,657 billion in 2011 outpaced2013, which was partially offset by a 33.2% increase0.8% decrease in fee and commission expense from (Won)777₩1,187 billion in 20102012 to (Won)1,035₩1,178 billion in 2011.2013. The 14.0% increase3.5% decrease in fee and commission income was mainly the result of decreases in agent activity fees, mostly related to bancassurance activities, from ₩285 billion in 2012 to ₩207 billion in 2013 and in credit card related fees and commissions received from ₩1,180 billion in 2012 to ₩1,127 billion in 2013, which mainly reflected the impact of the new government initiative to encourage the use of check cards instead of credit cards. Check card related fees and commissions increased from ₩218 billion in 2012 to ₩256 billion in 2013.
The 0.8% decrease in fee and commission expense was primarily due to a decrease in credit card related fees and commissions paid from ₩997 billion in 2012 to ₩934 billion in 2013. The effect of such decrease was partially offset by a 62.3% increase in other fee and commission expenses from ₩77 billion in 2012 to ₩125 billion in 2013, mainly resulting from an increase in fee and commission expenses from factored receivables.
Comparison of 2012 to 2011
Our net fee and commission income decreased 12.7% from ₩1,795 billion in 2011 to ₩1,567 billion in 2012, as a 2.7% decrease in fee and commission income from ₩2,830 billion in 2011 to ₩2,754 billion in 2012 was enhanced by a 14.7% increase in fee and commission expense from ₩1,035 billion in 2011 to ₩1,187 billion in 2012. The 2.7% decrease in fee and commission income was mainly the result of a decrease in other business account commission on consignment from (Won)44 billion in 2010 to (Won)174₩174 billion in 2011 and an increase in agent activity fees from (Won)136to ₩30 billion in 2010 to (Won)238 billion in 2011. The almost three-fold increase in other business account commission on consignment mainly resulted from2012, which principally reflected our receipt in 2011 of (Won)137₩137 billion in accrued but unpaid fees from the Ministry of Land, Infrastructure and Transport and Maritime Affairs relating(relating to our management of the National Housing Fund from January 2007 to June 2010.The 75.0% increase2010) which was not repeated in agent activity fees was principally due to an increase in our commission income from our bancassurance business.2012.
The 33.2%14.7% increase in fee and commission expense was primarily due to an increase in credit card related fees and commissions paid from (Won)541₩842 billion in 20102011 to (Won)839₩997 billion in 2011,2012, which was partially offset by a 9.4%3.3% increase in credit card related fees and commissions received from (Won)1,044₩1,142 billion in 20102011 to (Won)1,142₩1,180 billion in 2011,2012, which is recorded as part of fee and commission income. The 55.1%18.4% increase in credit card related fees and commissions paid resulted mainly from increases in benefits and rewards provided to our credit card users and marketing expenses.
For further information regarding our net fee and commission income, see Note 2728 of the notes to our consolidated financial statements included elsewhere in this annual report.
Net Gain on Financial Assets and Liabilities at Fair Value through Profit andor Loss
The following table shows, for the periods indicated, the components of our net gain on financial assets and liabilities at fair value through profit andor loss:
| Year Ended December 31, | Percentage change | Year Ended December 31, | Percentage Change | |||||||||||||||||||||||||||||
| 2010 | 2011 | 2011 | 2012 (1) | 2013 (1) | 2012/2011 | 2013/2012 | ||||||||||||||||||||||||||
| (in billions of Won) | (%) | (in billions of Won) | (%) | |||||||||||||||||||||||||||||
Net gain on financial assets held-for-trading | (Won) | 361 | (Won) | 181 | (49.9 | )% | ₩ | 181 | ₩ | 437 | ₩ | 250 | 141.4 | % | (42.8 | )% | ||||||||||||||||
Net gain on derivatives held-for-trading | 570 | 907 | 59.1 | 907 | 456 | 544 | (49.7 | ) | 19.3 | |||||||||||||||||||||||
Net loss on financial liabilities held-for-trading | (117 | ) | (59 | ) | (49.6 | ) | (59 | ) | (44 | ) | (15 | ) | (25.4 | ) | (65.9 | ) | ||||||||||||||||
Net gain on financial instruments designated at fair value through profit | 1 | 7 | 600.0 | 7 | (37 | ) | (22 | ) | N/M | (2) | (40.5 | ) | ||||||||||||||||||||
|
|
|
|
| ||||||||||||||||||||||||||||
Net gain on financial assets and liabilities at fair value through profit or loss | (Won) | 815 | (Won) | 1,036 | 27.1 | ₩ | 1,036 | ₩ | 812 | ₩ | 757 | (21.6 | )% | (6.8 | )% | |||||||||||||||||
|
|
|
|
| ||||||||||||||||||||||||||||
| (1) | The amounts for 2013 reflect a change in our accounting policies pursuant to the adoption of IFRS 10,Consolidated Financial Statements, which is effective beginning in 2013. Corresponding amounts for 2012 (but not for 2011) have been restated to retroactively apply such change. See “—Overview—Changes in Accounting Policies.” |
| (2) | “N/M” means not meaningful. |
Comparison of 2013 to 2012
Our net gain on financial assets and liabilities at fair value through profit or loss increased 27.1%decreased 6.8% from (Won)815₩812 billion in 20102012 to (Won)1,036₩757 billion in 2011,2013, primarily as a result of a 59.1% increase in net gain on derivatives held-for-trading from (Won)570 billion in 2010 to (Won)907 billion in 2011, which was offset in part by a 49.9%42.8% decrease in net gain on financial assets held-for-trading from (Won)361₩437 billion in 20102012 to (Won)181₩250 billion in 2011.2013, which was offset in part by a 19.3% increase in net gain on derivatives held-for-trading from ₩456 billion in 2012 to ₩544 billion in 2013. The decrease in net gain on financial assets held-for-trading was principally due to a 43.1% decrease in net gain on debt securities held-for-trading from ₩390 billion in 2012 to ₩222 billion in 2013. The increase in net gain on derivatives held-for-trading mainly reflected a 16.4% increase in net gain on currency derivatives held-for-trading from ₩444 billion in 2012 to ₩517 billion in 2013.
Comparison of 2012 to 2011
Our net gain on financial assets and liabilities at fair value through profit or loss decreased 21.6% from ₩1,036 billion in 2011 to ₩812 billion in 2012, primarily as a result of a 49.7% decrease in net gain on derivatives held-for-trading from ₩907 billion in 2011 to ₩456 billion in 2012, which was offset in part by a 141.4% increase in net gain on financial assets held-for-trading from ₩181 billion in 2011 to ₩437 billion in 2012. The decrease in net gain on derivatives held-for-trading was principally due to a 25.1% increase49.9% decrease in net gain on currency derivatives held-for-trading from (Won)708₩886 billion in 20102011 to (Won)886₩444 billion in 2011.2012. The decreaseincrease in net gain on financial assets held-for-trading mainly reflected a 35.0% decrease87.5% increase in net gain on debt securities held-for-trading from (Won)320₩208 billion in 20102011 to (Won)208₩390 billion in 2011. 2012.
For further information regarding our net gain on financial assets and liabilities at fair value through profit or loss, see Note 2829 of the notes to our consolidated financial statements included elsewhere in this annual report.
General and Administrative Expenses
The following table shows, for the periods indicated, the components of our general and administrative expenses:
| Year Ended December 31, | Percentage change | Year Ended December 31, | Percentage Change | |||||||||||||||||||||||||||||
| 2010 | 2011 | 2011 (1) | 2012 (1) (2) | 2013 (1) (2) | 2012/2011 | 2013/2012 | ||||||||||||||||||||||||||
| (in billions of Won) | (%) | (in billions of Won) | (%) | |||||||||||||||||||||||||||||
Employee compensation and benefits | (Won) | 2,407 | (Won) | 1,871 | (22.3 | )% | ₩ | 2,348 | ₩ | 2,442 | ₩ | 2,534 | 4.0 | % | 3.8 | % | ||||||||||||||||
Depreciation and amortization | 348 | 343 | (1.4 | ) | 342 | 328 | 287 | (4.1 | ) | (12.5 | ) | |||||||||||||||||||||
Other general and administrative expenses | 1,612 | 1,718 | 6.6 | 1,197 | 1,076 | 1,163 | (10.1 | ) | 8.1 | |||||||||||||||||||||||
|
|
|
|
| ||||||||||||||||||||||||||||
General and administrative expenses | (Won) | 4,367 | (Won) | 3,932 | (10.0 | ) | ₩ | 3,887 | ₩ | 3,846 | ₩ | 3,984 | (1.1 | )% | 3.6 | % | ||||||||||||||||
|
|
|
|
| ||||||||||||||||||||||||||||
| (1) | The amounts for 2013 reflect a change in our accounting policies pursuant to the amendments to IAS 19,Employee Benefits, which are effective beginning in 2013. Corresponding amounts for 2011 and 2012 have been restated to retroactively apply such change. See “—Overview—Changes in Accounting Policies.” |
| (2) | The amounts for 2013 reflect a change in our accounting policies pursuant to the adoption of IFRS 10,Consolidated Financial Statements, which is effective beginning in 2013. Corresponding amounts for 2012 (but not for 2011) have been restated to retroactively apply such change. See “—Overview—Changes in Accounting Policies.” |
Comparison of 2013 to 2012
Our general and administrative expenses decreased 10.0%increased 3.6% from (Won)4,367₩3,846 billion in 20102012 to (Won)3,932₩3,984 billion in 2011,2013, primarily as a result of a 22.3% decrease3.8% increase in employee compensation and benefits from (Won)2,407₩2,442 billion in 2010
2012 to (Won)1,871₩2,534 billion in 2011. Such decrease2013, which was enhanced by an 8.1% increase in other general and administrative expenses from ₩1,076 billion in 2012 to ₩1,163 billion in 2013. The increase in employee compensation and benefits was principally due to a 98.2% decrease2.7% increase in terminationsalaries and short-term employee benefits from (Won)654₩1,598 billion in 20102012 to (Won)12₩1,641 billion in 2013, which mainly reflected an increase in the average wage of our employees. The 8.1% increase in other general and administrative expenses was principally due to a 95.8% increase in tax and dues from ₩72 billion in 2012 to ₩141 billion in 2013, which primarily reflected refunds of previously levied education taxes in 2012 as a result of claims filed by Kookmin Bank which were not repeated in 2013.
Comparison of 2012 to 2011
Our general and administrative expenses decreased 1.1% from ₩3,887 billion in 2011 to ₩3,846 billion in 2012, primarily as a result of a 10.1% decrease in other general and administrative expenses from ₩1,197 billion in 2011 to ₩1,076 billion in 2012, which was partially offset by a 4.0% increase in employee compensation and benefits from ₩2,348 billion in 2011 to ₩2,442 billion in 2012. The decrease in other general and administrative expenses was principally the result of a 50.3% decrease in tax and dues from ₩145 billion in 2011 to ₩72 billion in 2012, which reflected refunds of previously levied education taxes as a result of claims filed by Kookmin Bank. The increase in employee compensation and benefits was principally due to a 25.9% increase in other salaries and short-term employee benefits from ₩522 billion in 2011 to ₩657 billion in 2012, which mainly reflected special termination benefits paidan increase in the fourth quarter of 2010 in connection with our voluntary early retirement program, which was not repeated in 2011.contributions to internal funds for employee welfare.
Net Other Operating Expenses
The following table shows, for the periods indicated, the components of our net other operating expenses:
| Year Ended December 31, | Percentage change | Year Ended December 31, | Percentage Change | |||||||||||||||||||||||||||||
| 2010 | 2011 | 2011 | 2012 (1) | 2013 (1) | 2012/2011 | 2013/2012 | ||||||||||||||||||||||||||
| (in billions of Won) | (%) | (in billions of Won) | (%) | |||||||||||||||||||||||||||||
Other operating income | (Won) | 3,773 | (Won) | 3,684 | (2.4 | )% | ₩ | 3,684 | ₩ | 3,286 | ₩ | 3,137 | (10.8 | )% | (4.5 | )% | ||||||||||||||||
Other operating expenses | (4,841 | ) | (4,776 | ) | (1.3 | ) | (4,776 | ) | (4,818 | ) | (4,442 | ) | 0.9 | (7.8 | ) | |||||||||||||||||
|
|
|
|
| ||||||||||||||||||||||||||||
Net other operating expenses | (Won) | (1,068 | ) | (Won) | (1,092 | ) | 2.2 | ₩ | (1,092 | ) | ₩ | (1,532 | ) | ₩ | (1,305 | ) | 40.3 | % | (14.8 | )% | ||||||||||||
|
|
|
|
| ||||||||||||||||||||||||||||
| (1) | The amounts for 2013 reflect a change in our accounting policies pursuant to the adoption of IFRS 10,Consolidated Financial Statements, which is effective beginning in 2013. Corresponding amounts for 2012 (but not for 2011) have been restated to retroactively apply such change. See “—Overview—Changes in Accounting Policies.” |
Comparison of 2013 to 2012
Our net other operating expenses increased 2.2%decreased 14.8% from (Won)1,068₩1,532 billion in 20102012 to (Won)1,092₩1,305 billion in 2011,2013, as a 2.4%7.8% decrease in other operating expenses from ₩4,818 billion in 2012 to ₩4,442 billion in 2013 outpaced a 4.5% decrease in other operating income from (Won)3,773₩3,286 billion in 20102012 to (Won)3,684₩3,137 billion in 2011 outpaced a 1.3% decrease in other operating expenses from (Won)4,841 billion in 2010 to (Won)4,776 billion in 2011.2013.
Other operating income includes principally gain on foreign exchange transactions, income related to insurance, revenue related togain on sale of available-for-sale financial assets and other income. The 2.4%4.5% decrease in other operating income was attributable mainly to a 21.1%28.7% decrease in gain on foreign exchange transactionsincome related to insurance from (Won)1,981₩1,730 billion in 20102012 to (Won)1,563₩1,234 billion in 2011,2013, the effect of which was partially offset by a 206.7%26.8% increase in gains on foreign exchange transaction from ₩1,094 billion in 2012 to ₩1,387 billion in 2013. The decrease in income related to insurance was mainly the result of a decrease in demand for insurance products in 2013, which was substantially offset by a corresponding decrease in expense related to insurance, which is recorded as part of other operating expenses. On a net basis, our net expense related to insurance increased 35.9% from ₩92 billion in 2012 to ₩125 billion in 2013. The increase in gain on foreign exchange transactions, which was mainly the result of increased exchange rate volatility, was more than offset by a corresponding increase in loss on foreign exchange transactions, which is recorded as part of other operating expenses.
Other operating expenses include principally loss on foreign exchange transactions, expenses related to insurance, loss on sale of available-for-sale financial assets and other expenses. The 7.8% decrease in other operating expenses was primarily the result of a 25.4% decrease in expense related to insurance from ₩1,822 billion in 2012 to ₩1,359 billion in 2013, which was enhanced by a 36.6% decrease in expense related to available-for-sale financial assets from ₩298 billion in 2012 to ₩189 billion in 2013. The decrease in expense related to insurance reflected a decrease in policy reserves due to a decrease in insurance products sold. The decrease in expense related to available-for-sale financial assets, which was principally due to a decrease in impairment on available-for-sale financials assets, was partially offset by an increase in revenue related to available-for-sale financial assets, which is recorded as part of other operating income.
Comparison of 2012 to 2011
Our net other operating expenses increased 40.3% from ₩1,092 billion in 2011 to ₩1,532 billion in 2012, as an 10.8% decrease in other operating income from ₩3,684 billion in 2011 to ₩3,286 billion in 2012 was enhanced by a 0.9% increase in other operating expenses from ₩4,776 billion in 2011 to ₩4,818 billion in 2012.
The 10.8% decrease in other operating income was attributable mainly to a 30.0% decrease in gain on foreign exchange transactions from ₩1,563 billion in 2011 to ₩1,094 billion in 2012 and a 72.8% decrease in gain on sale of available-for-sale financial assets from (Won)180₩552 billion in 20102011 to (Won)552₩150 billion in 2011.2012, the effect of which was partially offset by a 71.1% increase in income related to insurance from ₩1,011 billion in 2011 to ₩1,730 billion in 2012. The decrease in gain on foreign exchange transactions, which was principally due tomainly the result of reduced exchange rate volatility and a decrease in the relative proportion of foreign currency-denominated assets and liabilities on our balance sheet, was partiallymore than offset by a corresponding decrease in loss on foreign exchange transactions, which is recorded as part of other operating expenses. On a net basis, our net loss on foreign exchange transactions increased 61.3%decreased 50.9% from (Won)400₩645 billion in 20102011 to (Won)645₩317 billion in 2011.2012. The increasedecrease in gain on sale of available-for-sale financial assets was principally due toprimarily reflected gains from the disposal of our shares of Hyundai Engineering and Construction Co., Ltd. in 2011.
Other operating expenses include principally loss on foreign exchange transactions, expenses2011 not being repeated in 2012. The increase in income related to insurance, expenseswhich was principally due to premiums and reinsurance income generated in 2012, was more than offset by a corresponding increase in expense related to available-for-sale financial assets andinsurance, which is recorded as part of other operating expenses.
The 1.3% decrease0.9% increase in other operating expenses was primarily the result of a 7.3%67.5% increase in expense related to insurance from ₩1,088 billion in 2011 to ₩1,822 billion in 2012, and was partially offset by a 36.1% decrease in loss on foreign exchange transactions from
(Won)2,381 billion in 2010 to (Won)2,208 ₩2,208 billion in 2011 the effect of which was partially offset by a 9.2%to ₩1,411 billion in 2012. The increase in other expenses from (Won)1,300 billionexpense related to insurance reflected an increase in 2010 to (Won)1,419 billion in 2011.policy reserves during 2012. The decrease in loss on foreign exchange transactions, which reflectedwas principally due to reduced exchange rate volatility and a decrease in the relative proportion of foreign currency-denominated assets and liabilities on our balance sheet, was more thanpartially offset by a corresponding decrease in gain on foreign exchange transactions, which is recorded as part of other operating income as discussed above. The increase in other expenses was principally due to an increase in provision for derivatives.
Expenses related to available-for-sale financial assets include impairment loss on such assets, which increased 6.0% from (Won)48 billion in 2010 to (Won)51 billion in 2011. Unrealized gains and losses (other than impairment losses) on available-for-sale and held-to-maturity financial assets are recorded in our consolidated statements of financial position as part of accumulated other comprehensive income, under total equity. In 2011, we recorded a net decrease in the value of such financial investments of (Won)243 billion as part of other accumulated other comprehensive income (loss), principally as a result of a decrease in unrealized gain on our shares of Hyundai Engineering and Construction following our disposal of such shares in 2011 and realization of a gain, which was recorded as part of other operating income as discussed above.
For further information regarding our net other operating expenses, see Note 2930 of the notes to our consolidated financial statements included elsewhere in this annual report.
Income Tax Expense (Benefit)
Our income tax expense is calculated by adding or subtracting changes in deferred income tax liabilities and assets to income tax amounts payable for the period. Deferred income tax assets are recognized for deductible temporary differences, unused tax losses and unused tax credits, while deferred income tax liabilities are recognized for taxable temporary differences. Temporary differences are those between the carrying values of assets and liabilities for financial reporting purposes and their respective tax bases. Deferred income tax assets, including unused tax losses and credits, are recognized only to the extent it is probable that sufficient taxable profit will be available against which such deferred income tax assets can be utilized.See “—Critical Accounting Policies—Deferred Income Tax Assets.”
Comparison of 2013 to 2012
Income tax expense changeddecreased by 1.3% from an income tax benefit of (Won)71₩559 billion in 20102012 to an income tax expense of (Won)832₩552 billion in 2011, mainly as2013, primarily due to a result of an increasedecrease in our profit before income tax, as well aswhich was partially offset by an increase in adjustments recognized in 20102013 for current tax of prior years, which reduced our tax payable by (Won)172 billion in 2010.years. The statutory tax rate was 24.2% in 20102012 and 2011.2013. Our effective tax rate was 25.5%30.4% in 2013 compared to 24.3% in 2012.
Comparison of 2012 to 2011
Income tax expense decreased by 33.8% from ₩845 billion in 2011 to ₩559 billion in 2012, primarily due to a decrease in our profit before income tax. The statutory tax rate was 24.2% in 2011 and 2012. Our effective tax rate was 24.3% in 2012 compared to an effective tax benefit rate of 47.2%25.6% in 2010. 2011.
See Note 3233 of the notes to our consolidated financial statements included elsewhere in this annual report.
Profit for the Year
As a result of the above, our profit for the year increased to (Won)2,429was ₩1,264 billion in 2011 from (Won)2202013, compared to ₩1,740 billion in 2010.2012 and ₩2,461 billion in 2011.
Results by Principal Business Segment
We compile and analyze financial information for our business segments based upon segment information used by our management for the purposes of resource allocation and performance evaluation. We are organized into six major business segments: retail banking operations, corporate banking operations, other banking operations, credit card operations, investment and securities operations and life insurance operations.
The following table shows, for the periods indicated, our results of operations by segment:
| Profit (Loss) (1) for the Year Ended December 31, | Total Operating Revenue (2) for the Year Ended December 31, | |||||||||||||||
| 2010 | 2011 | 2010 | 2011 | |||||||||||||
| (in billions of Won) | ||||||||||||||||
Retail banking operations | (Won) | 372 | (Won) | 878 | (Won) | 2,994 | (Won) | 3,267 | ||||||||
Corporate banking operations | (567 | ) | 461 | 2,363 | 2,287 | |||||||||||
Other banking operations | (418 | ) | 588 | 637 | 1,634 | |||||||||||
Credit card operations | 764 | 441 | 1,361 | 1,402 | ||||||||||||
Investment and securities operations | 40 | 28 | 138 | 163 | ||||||||||||
Life insurance operations | 18 | 19 | 116 | 115 | ||||||||||||
Other | 80 | (45 | ) | 17 | (25 | ) | ||||||||||
|
|
|
|
|
|
|
| |||||||||
Total (3) | (Won) | 289 | (Won) | 2,370 | (Won) | 7,626 | (Won) | 8,843 | ||||||||
|
|
|
|
|
|
|
| |||||||||
| Profit (Loss) (1) for the Year Ended December 31, | Total Operating Revenue (2) for the Year Ended December 31, | |||||||||||||||||||||||
| 2011 (3) | 2012 (3) (4) | 2013 (3) (4) | 2011 (3) | 2012 (3) (4) | 2013 (3) (4) | |||||||||||||||||||
| (in billions of Won) | ||||||||||||||||||||||||
Retail banking operations | ₩ | 909 | ₩ | 686 | ₩ | 178 | ₩ | 3,267 | ₩ | 3,041 | ₩ | 2,454 | ||||||||||||
Corporate banking operations | 465 | 238 | 157 | 2,287 | 1,953 | 1,732 | ||||||||||||||||||
Other banking operations | 581 | 516 | 485 | 1,634 | 1,297 | 1,486 | ||||||||||||||||||
Credit card operations | 445 | 291 | 384 | 1,402 | 1,287 | 1,421 | ||||||||||||||||||
Investment and securities operations | 26 | 18 | 12 | 163 | 143 | 115 | ||||||||||||||||||
Life insurance operations | 19 | 17 | 9 | 115 | 131 | 102 | ||||||||||||||||||
Other | (45 | ) | 48 | 61 | (25 | ) | 33 | 144 | ||||||||||||||||
|
|
|
|
|
|
|
|
|
|
|
| |||||||||||||
Total (5) | ₩ | 2,400 | ₩ | 1,814 | ₩ | 1,286 | ₩ | 8,843 | ₩ | 7,885 | ₩ | 7,454 | ||||||||||||
|
|
|
|
|
|
|
|
|
|
|
| |||||||||||||
| (1) | After deduction of income tax allocated to each segment. |
| (2) | Represents operating revenue from external customers. See Note 5 of the notes to our consolidated financial statements. |
| (3) | The amounts for 2013 reflect a change in our accounting policies pursuant to the amendments to IAS 19,Employee Benefits, which are effective beginning in 2013. Corresponding amounts for 2011 and 2012 have been restated to retroactively apply such change. See “—Overview—Changes in Accounting Policies.” |
| (4) | The amounts for 2013 reflect a change in our accounting policies pursuant to the adoption of IFRS 10,Consolidated Financial Statements, which is effective beginning in 2013. Corresponding amounts for 2012 (but not for 2011) have been restated to retroactively apply such change. See “—Overview—Changes in Accounting Policies.” |
| (5) | Prior to adjustments for consolidation, inter-segment transactions and certain differences in classification under our management reporting system. |
Comparison of 2011 to 2010
Retail Banking Operations
This segment consists of retail banking services provided by Kookmin Bank. The following table shows, for the periods indicated, our income statement data for this segment:
| Year Ended December 31, | Percentage change | |||||||||||
| 2010 | 2011 | 2011/2010 | ||||||||||
| (in billions of Won) | (%) | |||||||||||
Income statement data | ||||||||||||
Interest income | (Won) | 5,050 | (Won) | 5,723 | 13.3 | % | ||||||
Interest expense | (2,696 | ) | (2,944 | ) | 9.2 | |||||||
Net fee and commission income | 647 | 635 | (1.9 | ) | ||||||||
Net gain (loss) from financial assets and liabilities at fair value through profit or loss | (104 | ) | (2 | ) | (98.1 | ) | ||||||
Net other operating income (expense) | 98 | (200 | ) | N/M | (1) | |||||||
Provision for credit losses | (264 | ) | (302 | ) | 14.4 | |||||||
Depreciation and amortization | (147 | ) | (112 | ) | (23.8 | ) | ||||||
Others | (2,002 | ) | (1,613 | ) | (19.4 | ) | ||||||
|
|
|
| |||||||||
Profit (loss) before income tax | 582 | 1,185 | 103.6 | |||||||||
Tax income (expense) (2) | (210 | ) | (307 | ) | 46.2 | |||||||
|
|
|
| |||||||||
Profit for the year | (Won) | 372 | (Won) | 878 | 136.0 | % | ||||||
|
|
|
| |||||||||
| Year Ended December 31, | Percentage Change | |||||||||||||||||||
| 2011 (1) | 2012 (1) | 2013 (1) | 2012/2011 | 2013/2012 | ||||||||||||||||
| (in billions of Won) | (%) | |||||||||||||||||||
Income statement data | ||||||||||||||||||||
Interest income | ₩ | 5,723 | ₩ | 5,682 | ₩ | 4,786 | (0.7 | )% | (15.8 | )% | ||||||||||
Interest expense | (2,944 | ) | (3,158 | ) | (2,773 | ) | 7.3 | (12.2 | ) | |||||||||||
Net fee and commission income | 635 | 696 | 612 | 9.6 | (12.1 | ) | ||||||||||||||
Net gain (loss) from financial assets and liabilities at fair value through profit or loss | (2 | ) | (15 | ) | (2 | ) | 650.0 | (86.7 | ) | |||||||||||
Net other operating income (expense) | (200 | ) | (235 | ) | (261 | ) | 17.5 | 11.1 | ||||||||||||
General and administrative expenses | (1,758 | ) | (1,673 | ) | (1,740 | ) | (4.8 | ) | 4.0 | |||||||||||
Provision for credit losses | (302 | ) | (392 | ) | (358 | ) | 29.8 | (8.7 | ) | |||||||||||
Net other non-operating revenue (expense) | 33 | — | — | (100.0 | ) | — | ||||||||||||||
|
|
|
|
|
| |||||||||||||||
Profit (loss) before income tax | 1,185 | 905 | 264 | (23.6 | ) | (70.8 | ) | |||||||||||||
Tax income (expense) (2) | (276 | ) | (219 | ) | (86 | ) | (20.7 | ) | (60.7 | ) | ||||||||||
|
|
|
|
|
| |||||||||||||||
Profit for the year | ₩ | 909 | ₩ | 686 | ₩ | 178 | (24.5 | )% | (74.1 | )% | ||||||||||
|
|
|
|
|
| |||||||||||||||
| (1) |
|
| (2) |
|
Comparison of 2013 to 2012
Our profit before income tax for this segment increased 103.6%decreased 70.8% from (Won)582₩905 billion in 20102012 to (Won)1,185₩264 billion in 2011.2013.
Interest income from our retail banking operations increased 13.3%decreased 15.8% from (Won)5,050₩5,682 billion in 20102012 to (Won)5,723₩4,786 billion in 2011.2013. This increasedecrease was principally due to an increasea decrease in the average yields on mortgage, home equity and other consumer loans, mainly reflecting the increasea decrease in the general level of interest rates in Korea applicable to such loans from 2010 to 2011, and an increase in the average volume of home equity and other consumer loans primarily due to an increase in demand for such loans.2013.
Our largest and most important funding source is deposits from retail customers, which represent more than half of our total deposits. Interest expense for this segment increased 9.2%decreased 12.2% from (Won)2,696₩3,158 billion in 20102012 to (Won)2,944₩2,773 billion in 2011.2013. This increasedecrease was principallyprimarily due to an increasea decrease in the average volumecost of time deposits held by retail customers, which mainly reflecting higher demand in Korea for lower-risk financial products as well as deposit products from larger commercial banks as opposed to smaller and higher-risk savings banks, in light of continued financial market volatility in 2011. Such increase was enhanced by an increase in the average cost of time deposits and demand deposits held by retail customers, which was principally due to the increasereflected a decrease in the general level of interest rates in Korea in 2011.2013.
Net fee and commission income attributable to this segment remained relatively constant at (Won)635decreased 12.1% from ₩696 billion in 2011 compared2012 to (Won)647₩612 billion in 2010.2013, mainly due to a decrease in fee and commission income from bancassurance operations.
Net loss from financial assets and liabilities at fair value through profit or loss attributable to this segment decreased 98.1%86.7% from (Won)104₩15 billion in 20102012 to (Won)2₩2 billion in 2011,2013, principally as a result of a decrease in valuation loss on derivatives.
Net other operating incomeexpense attributable to this segment changedincreased 11.1% from an income of (Won)98₩235 billion in 20102012 to an expense of (Won)200₩261 billion in 2011,2013, mainly as a result of an increase in expenses related to inter-segment borrowings.
General and administrative expenses attributable to this segment increased 4.0% from ₩1,673 billion in 2012 to ₩1,740 billion in 2013, principally due to an increase in salary expense.
Provision for credit losses decreased 8.7% from ₩392 billion in 2012 to ₩358 billion in 2013, due mainly to an improvement in the asset quality of retail loans reflecting a decrease in delinquency rates for retail loans.
Comparison of 2012 to 2011
Our profit before income tax for this segment decreased 23.6% from ₩1,185 billion in 2011 to ₩905 billion in 2012.
Interest income from our retail banking operations decreased 0.7% from ₩5,723 billion in 2011 to ₩5,682 billion in 2012. This decrease was principally due to a decrease in the average yields on mortgage, home equity and other consumer loans, mainly reflecting a decrease in the general level of interest rates in Korea in 2012.
Interest expense for this segment increased 7.3% from ₩2,944 billion in 2011 to ₩3,158 billion in 2012. This increase was primarily due to an increase in the average volume of time deposits held by retail customers, which mainly reflected continuing demand in Korea for lower-risk financial products.
Net fee and commission income attributable to this segment increased 9.6% from ₩635 billion in 2011 to ₩696 billion in 2012, mainly due to an increase in fee and commission income from bancassurance operations.
Net loss from financial assets and liabilities at fair value through profit or loss attributable to this segment increased more than six-fold from ₩2 billion in 2011 to ₩15 billion in 2012, principally as a result of an increase in valuation loss on derivatives.
Net other operating expense attributable to this segment increased 17.5% from ₩200 billion in 2011 to ₩235 billion in 2012, mainly as a result of an increase in expenses related to inter-segment borrowings.
General and administrative expenses attributable to this segment decreased 4.8% from ₩1,758 billion in 2011 to ₩1,673 billion in 2012, principally due to a decrease in employee benefit expenses, which reflected lower performance-based payments.
Provision for credit losses increased 14.4%29.8% from (Won)264₩302 billion in 20102011 to (Won)302₩392 billion in 2011,2012, mainly reflecting a deterioration in the asset quality of retail loans and an increase in charge-offs of such loans.2012 due to adverse economic conditions in Korea.
Depreciation and amortizationNet other non-operating revenue attributable to this segment decreased 23.8%changed from (Won)147 billion in 2010 to (Won)112 billion in 2011.
Other expenses attributable to this segment decreased 19.4% from (Won)2,002 billion in 2010 to (Won)1,613revenue of ₩33 billion in 2011 principally due to none in 2012, as the recognition of other non-operating revenue in 2011 from the liquidation of certain retail loan-related special termination benefits paid in the fourth quarter of 2010 in connection with Kookmin Bank’s voluntary early retirement program, whichpurpose vehicles was not repeated in 2011.2012.
Corporate Banking Operations
This segment consists of corporate banking services provided by Kookmin Bank. The following table shows, for the periods indicated, our income statement data for this segment:
| Year Ended December 31, | Percentage change | |||||||||||
| 2010 | 2011 | 2011/2010 | ||||||||||
| (in billions of Won) | (%) | |||||||||||
Income statement data | ||||||||||||
Interest income | (Won) | 4,906 | (Won) | 5,107 | 4.1 | % | ||||||
Interest expense | (2,354 | ) | (2,548 | ) | 8.2 | |||||||
Net fee and commission income | 280 | 243 | (13.2 | ) | ||||||||
Net gain (loss) from financial assets and liabilities at fair value through profit or loss | (4 | ) | (2 | ) | (50.0 | ) | ||||||
Net other operating income (expense) | (473 | ) | (555 | ) | 17.3 | |||||||
Provision for credit losses | (2,393 | ) | (1,007 | ) | (57.9 | ) | ||||||
Depreciation and amortization | (52 | ) | (38 | ) | (26.9 | ) | ||||||
Others | (798 | ) | (577 | ) | (27.7 | ) | ||||||
|
|
|
| |||||||||
Profit (loss) before income tax | (888 | ) | 623 | N/M | (1) | |||||||
Tax income (expense) (2) | 321 | (162 | ) | N/M | (1) | |||||||
|
|
|
| |||||||||
Profit for the year | (Won) | (567 | ) | (Won) | 461 | N/M | (1) | |||||
|
|
|
| |||||||||
| Year Ended December 31, | Percentage Change | |||||||||||||||||||
| 2011 (1) | 2012 (1) | 2013 (1) | 2012/2011 | 2013/2012 | ||||||||||||||||
| (in billions of Won) | (%) | |||||||||||||||||||
Income statement data | ||||||||||||||||||||
Interest income | ₩ | 5,107 | ₩ | 5,190 | ₩ | 4,391 | 1.6 | % | (15.4 | )% | ||||||||||
Interest expense | (2,548 | ) | (2,597 | ) | (1,840 | ) | 1.9 | (29.1 | ) | |||||||||||
Net fee and commission income | 243 | 233 | 241 | (4.1 | ) | 3.4 | ||||||||||||||
Net gain (loss) from financial assets and liabilities at fair value through profit or loss | (2 | ) | (1 | ) | — | (50.0 | ) | (100.0 | ) | |||||||||||
Net other operating income (expense) | (555 | ) | (871 | ) | (1,055 | ) | 56.9 | 21.1 | ||||||||||||
General and administrative expenses | (729 | ) | (792 | ) | (822 | ) | 8.6 | 3.8 | ||||||||||||
Provision for credit losses | (1,007 | ) | (853 | ) | (706 | ) | (15.3 | ) | (17.2 | ) | ||||||||||
Net other non-operating revenue (expense) | 114 | 6 | 1 | (94.7 | ) | (83.3 | ) | |||||||||||||
|
|
|
|
|
| |||||||||||||||
Profit (loss) before income tax | 623 | 315 | 210 | (49.4 | ) | (33.3 | ) | |||||||||||||
Tax income (expense)(2) | (158 | ) | (77 | ) | (53 | ) | (51.3 | ) | (31.2 | ) | ||||||||||
|
|
|
|
|
| |||||||||||||||
Profit (loss) for the year | ₩ | 465 | ₩ | 238 | ₩ | 157 | (48.8 | )% | (34.0 | )% | ||||||||||
|
|
|
|
|
| |||||||||||||||
| (1) |
|
| (2) |
|
Comparison of 2013 to 2012
Our profit before income tax for this segment changeddecreased 33.3% from a loss of (Won)888₩315 billion in 20102012 to ₩210 billion in 2013.
Interest income from our corporate banking operations decreased 15.4% from ₩5,190 billion in 2012 to ₩4,391 billion in 2013. This decrease was principally due to a profitdecrease in the average yields on corporate loans, mainly reflecting the lower interest rate environment in Korea in 2013, which was enhanced by a decrease in the average volume of (Won)623such loans.
Interest expense for this segment decreased 29.1% from ₩2,597 billion in 2011.2012 to ₩1,840 billion in 2013. This decrease was principally due to a decrease in the average cost of time deposits held by corporate customers, which mainly reflected a decrease in the general level of interest rates in Korea in 2013.
Net fee and commission income attributable to this segment increased 3.4% from ₩233 billion in 2012 to ₩241 billion in 2013, due primarily to an increase in commissions on management of retirement annuity pensions.
Net loss from financial assets and liabilities at fair value through profit or loss attributable to this segment decreased by ₩1 billion from 2012 to 2013.
Net other operating expense attributable to this segment increased 21.1% from ₩871 billion in 2012 to ₩1,055 billion in 2013, mainly as a result of an increase in expenses related to inter-segment borrowings.
General and administrative expenses attributable to this segment increased 3.8% from ₩792 billion in 2012 to ₩822 billion in 2013, principally due to an increase in the average wages of our employees in this segment.
Provision for credit losses decreased 17.2% from ₩853 billion in 2012 to ₩706 billion in 2013, due mainly to an overall improvement in the asset quality of corporate loans reflecting a decrease in delinquency rates for corporate loans.
Net other non-operating revenue attributable to this segment decreased 83.3% from ₩6 billion in 2012 to ₩1 billion in 2013, primarily due to a decrease in net other non-operating revenue from Kookmin Bank (China) Ltd., a subsidiary of Kookmin Bank.
Comparison of 2012 to 2011
Our profit before income tax for this segment decreased 49.4% from ₩623 billion in 2011 to ₩315 billion in 2012.
Interest income from our corporate banking operations increased 4.1%1.6% from (Won)4,906₩5,107 billion in 20102011 to (Won)5,107₩5,190 billion in 2011.2012. This increase was principally due to an increase in the average volume of corporate loans, mainly reflecting our increased marketing efforts as well as increased demand forto SOHO customers. The effect of such loans in anticipation of higher funding costs due to growing adverse conditions in the global financial markets beginning in the second half of 2011. Such increase was enhancedoffset in part by an increasea decrease in the average yield on corporate loans, mainly reflecting the increase in the general level oflower interest ratesrate environment in Korea applicable to such loans from 2010 to 2011.in 2012.
Interest expense for this segment increased 8.2%1.9% from (Won)2,354₩2,548 billion in 20102011 to (Won)2,548₩2,597 billion in 2011.2012. This increase was principally due to an increase in the average volume of time deposits held by corporate customers, mainly reflecting highercontinuing demand in Korea for such deposits. Such increase was enhanced by an increasedeposits in the average cost of time deposits held by corporate customers, which was principally due to the increase in the general level of interest rates in Korea in 2011.Korea.
Net fee and commission income attributable to this segment decreased 13.2%4.1% from (Won)280₩243 billion in 20102011 to (Won)243₩233 billion in 2011,2012, due primarily to a decrease in miscellaneous corporate banking fee and commission income from project financing operations.income.
Net gainloss from financial assets and liabilities at fair value through profit or loss attributable to this segment decreased by (Won)2 billion from (Won)4₩2 billion in 20102011 to (Won)2₩1 billion in 2011.2012.
Net other operating expense attributable to this segment increased 17.3%56.9% from (Won)473₩555 billion in 20102011 to (Won)555₩871 billion in 2011,2012, mainly as a result of an increase in expenses related to inter-segment borrowings.
General and administrative expenses attributable to this segment increased 8.6% from ₩729 billion in 2011 to ₩792 billion in 2012, principally due to increases in rental expenses and service fees.
Provision for credit losses decreased 57.9%15.3% from (Won)2,393 billion in 2010 to (Won)1,007₩1,007 billion in 2011 to ₩853 billion in 2012, mainly reflecting an overall improvementincrease in the asset qualityrelative proportion of corporate loans.loan amounts that are secured by collateral.
Depreciation and amortizationNet other non-operating revenue attributable to this segment decreased 26.9%94.7% from (Won)52 billion in 2010 to (Won)38 billion in 2011.
Other expenses attributable to this segment decreased 27.7% from (Won)798 billion in 2010 to (Won)577₩114 billion in 2011 mainly reflectingto ₩6 billion in 2012, as the recognition of other non-operating revenue in 2011 from the liquidation of corporate loan-related special termination benefits paid in the fourth quarter of 2010 in connection with Kookmin Bank’s voluntary early retirement program, whichpurpose vehicles was not repeated in 2011.2012.
Other Banking Operations
This segment primarily consists of Kookmin Bank’s banking operations other than retail and corporate banking operations, including treasury activities and Kookmin Bank’s “back office” administrative operations. The following table shows, for the periods indicated, our income statement data for this segment:
| Year Ended December 31, | Percentage change | |||||||||||
| 2010 | 2011 | 2011/2010 | ||||||||||
| (in billions of Won) | (%) | |||||||||||
Income statement data | ||||||||||||
Interest income | (Won) | 1,582 | (Won) | 1,529 | (3.4 | )% | ||||||
Interest expense | (1,305 | ) | (854 | ) | (34.6 | ) | ||||||
Net fee and commission income | 73 | 503 | 589.0 | |||||||||
Net gain (loss) from financial assets and liabilities at fair value through profit or loss | 846 | 994 | 17.5 | |||||||||
Net other operating income (expense) | (597 | ) | (318 | ) | (46.7 | ) | ||||||
Provision (reversal of provision) for credit losses | (66 | ) | 17 | N/M | (1) | |||||||
Depreciation and amortization | (122 | ) | (146 | ) | 19.7 | |||||||
Share of profit of associates and joint ventures | (209 | ) | 1 | N/M | (1) | |||||||
Others | (857 | ) | (933 | ) | 8.9 | |||||||
|
|
|
| |||||||||
Profit (loss) before income tax | (655 | ) | 793 | N/M | (1) | |||||||
Tax income (expense) (2) | 237 | �� | (205 | ) | N/M | (1) | ||||||
|
|
|
| |||||||||
Profit for the year | (Won) | (418 | ) | (Won) | 588 | N/M | (1) | |||||
|
|
|
| |||||||||
| Year Ended December 31, | Percentage Change | |||||||||||||||||||
| 2011 (1) | 2012 (1) (2) | 2013 (1) (2) | 2012/2011 | 2013/2012 | ||||||||||||||||
| (in billions of Won) | (%) | |||||||||||||||||||
Income statement data | ||||||||||||||||||||
Interest income | ₩ | 1,529 | ₩ | 1,623 | ₩ | 1,418 | 6.1 | % | (12.6 | )% | ||||||||||
Interest expense | (854 | ) | (961 | ) | (822 | ) | 12.5 | (14.5 | ) | |||||||||||
Net fee and commission income | 503 | 324 | 252 | (35.6 | ) | (22.2 | ) | |||||||||||||
Net gain (loss) from financial assets and liabilities at fair value through profit or loss | 994 | 757 | 693 | (23.8 | ) | (8.5 | ) | |||||||||||||
Net other operating income (expense) | (318 | ) | (144 | ) | 261 | (54.7 | ) | N/M | (3) | |||||||||||
General and administrative expenses | (848 | ) | (811 | ) | (835 | ) | (4.4 | ) | 3.0 | |||||||||||
Provision (reversal of provision) for credit losses | 17 | (49 | ) | (1 | ) | N/M | (3) | (98.0 | ) | |||||||||||
Share of profit (loss) of associates | 1 | (6 | ) | (203 | ) | N/M | (3) | 3,283.3 | ||||||||||||
Net other non-operating revenue (expense) | (193 | ) | (71 | ) | (25 | ) | (63.2 | ) | (64.8 | ) | ||||||||||
|
|
|
|
|
| |||||||||||||||
Profit (loss) before income tax | 831 | 662 | 738 | (20.3 | ) | 11.5 | ||||||||||||||
Tax income (expense)(4) | (250 | ) | (146 | ) | (253 | ) | (41.6 | ) | 73.3 | |||||||||||
|
|
|
|
|
| |||||||||||||||
Profit (loss) for the year | ₩ | 581 | ₩ | 516 | ₩ | 485 | (11.2 | )% | (6.0 | )% | ||||||||||
|
|
|
|
|
| |||||||||||||||
| (1) | The amounts for 2013 reflect a change in our accounting policies pursuant to the amendments to IAS 19,Employee Benefits, which are effective beginning in 2013. Corresponding amounts for 2011 and 2012 have been restated to retroactively apply such change. See “—Overview—Changes in Accounting Policies.” |
| (2) | The amounts for 2013 reflect a change in our accounting policies pursuant to the adoption of IFRS 10,Consolidated Financial Statements, which is effective beginning in 2013. Corresponding amounts for 2012 (but not for 2011) have been restated to retroactively apply such change. See “—Overview—Changes in Accounting Policies.” |
| (3) | “N/M” means not meaningful. |
|
Comparison of 2013 to 2012
Our profit before income tax for this segment changedincreased 11.5% from a loss of (Won)655₩662 billion in 20102012 to a profit of (Won)793₩738 billion in 2011.2013.
Interest income from our other banking operations decreased 3.4%12.6% from (Won)1,582₩1,623 billion in 20102012 to (Won)1,529₩1,418 billion in 2011.2013. This decrease was attributable primarily to a decrease in the average yields on debt securities in Kookmin Bank’s financial investments portfolio, due mainly to an increasethe lower interest rate environment in the proportion of monetary stabilization bondsKorea in such portfolio, which typically feature relatively lower yields compared to other types of debt securities in such portfolio.2013.
Interest expense for this segment decreased 34.6%14.5% from (Won)1,305₩961 billion in 20102012 to (Won)854₩822 billion in 2011.2013. This decrease was principally due to a decrease in the average volumecost of long-term debentures, which mainly reflected decreased use of long-term debentures to meet Kookmin Bank’s funding needs. Suchthe decrease was partially offset by an increase in the average costgeneral level of such debentures, which was primarily attributable to the general increase in market interest rates in Korea including for such debentures.in 2013.
Net fee and commission income attributable to this segment increased almost six-folddecreased 22.2% from (Won)73₩324 billion in 20102012 to (Won)503₩252 billion in 2011,2013, mainly due primarily to increasesdecreases in commission income received from KB Kookmin Card, which was spun-off from Kookmin Bank in March 2011,brokerage fees and management fees received from the National Housing Fund.participation fees.
Net gain from financial assets and liabilities at fair value through profit or loss attributable to this segment increased 17.5%decreased 8.5% from (Won)846₩757 billion in 20102012 to (Won)994₩693 billion in 2011,2013, principally as a result of a decrease in net gains on financial instruments held-for-trading.
Net other operating income (expense) changed from a net expense of ₩144 billion in 2012 to a net income of ₩261 billion in 2013, mainly as a result of an increase in income from inter-segment lending.
General and administrative expenses attributable to this segment increased 3.0% from ₩811 billion in 2012 to ₩835 billion in 2013, principally due to an increase in special termination benefits in connection with Kookmin Bank’s voluntary early retirement program, as well as an increase in salary expense.
Provision for credit losses decreased by ₩48 billion from ₩49 billion in 2012 to ₩1 billion in 2013, mainly reflecting a decrease in provision for receivables from derivative transactions.
Share of loss of associates increased by ₩197 billion from ₩6 billion in 2012 to ₩203 billion in 2013, principally as a result of an increase in loss on equity method investments from Kookmin Bank’s investment in JSC Bank CenterCredit.
Net other non-operating expense attributable to this segment decreased 64.8% from ₩71 billion in 2012 to ₩25 billion in 2013, primarily due to an increase in net other non-operating income, including income from employment insurance support and interest on delinquent leasehold deposits.
Comparison of 2012 to 2011
Our profit before income tax for this segment decreased 20.3% from ₩831 billion in 2011 to ₩662 billion in 2012.
Interest income from our other banking operations increased 6.1% from ₩1,529 billion in 2011 to ₩1,623 billion in 2012. This increase was attributable primarily to an increase in the average volume of debt securities in Kookmin Bank’s financial investments portfolio, which mainly reflected increased purchases of low-risk debt securities such as Korean treasury securities and debt securities issued by government agencies and financial institutions.
Interest expense for this segment increased 12.5% from ₩854 billion in 2011 to ₩961 billion in 2012. This increase was principally due to the inclusion in 2012 of interest expense related to trust accounts for which we guarantee only the repayment of principal as a result of our adoption of IFRS 10, which was retroactively applied for 2012 but not 2011. See “—Overview—Changes in Accounting Policies.”
Net fee and commission income attributable to this segment decreased 35.6% from ₩503 billion in 2011 to ₩324 billion in 2012, mainly because of a one-time increase in management fees received from the National Housing Fund in 2011, which was due to the payment of unpaid management fees from prior years claimed by Kookmin Bank, was not repeated in 2012.
Net gain from financial assets and liabilities at fair value through profit or loss attributable to this segment decreased 23.8% from ₩994 billion in 2011 to ₩757 billion in 2012, principally as a result of a decrease in net gain on derivatives held-for-trading.
Net other operating expense attributable to this segment decreased 46.7%54.7% from (Won)597₩318 billion in 20102011 to (Won)318₩144 billion in 2011,2012, mainly as a result of an increase in income from inter-segment lending.
General and administrative expenses attributable to this segment decreased 4.4% from ₩848 billion in 2011 to ₩811 billion in 2012, principally due to a decrease in employee benefit expenses, which reflected lower performance-based payments.
Provision for credit losses changed from a provision of (Won)66 billion in 2010 to a reversal of provision of (Won)17₩17 billion in 2011 to a provision of ₩49 billion in 2012, mainly reflecting a decreasean increase in provisionprovisions for receivables from derivatives transactions.
Depreciation and amortization attributable to this segment increased 19.7% from (Won)122 billion in 2010 to (Won)146 billion in 2011.
Share of profit of associates and joint ventures changed from a loss of (Won)209 billion in 2010 to a profit of (Won)1₩1 billion in 2011 to a loss of ₩6 billion in 2012, principally as a result of a decrease inrecognition of additional impairment losslosses on Kookmin Bank’s investment in JSC Bank CenterCredit as well as a decrease in loss on investments in2012.
Net other associates.
Other expensesnon-operating expense attributable to this segment increased 8.9%decreased 63.2% from (Won)857 billion in 2010 to (Won)933₩193 billion in 2011 to ₩71 billion in 2012, primarily as a result ofdue to an increase in charitable donations made by Kookmin Bank.gains on sales of tangible assets.
Credit Card Operations
This segment consists of credit card activities, which were conducted by Kookmin Bank in 2010 and January and February of 2011. In March 2011, Kookmin Bank’s credit card business was spun-off to KB Kookmin Card, a newly established company. As such, since March 2011, our credit card activities have been conducted by KB Kookmin Card. The following table shows, for the periods indicated, our income statement data for this segment:
| Year Ended December 31, | Percentage change | |||||||||||
| 2010 | 2011 | 2011/2010 | ||||||||||
| (in billions of Won) | (%) | |||||||||||
Income statement data | ||||||||||||
Interest income | (Won) | 1,318 | (Won) | 1,381 | 4.8 | % | ||||||
Interest expense | (477 | ) | (480 | ) | 0.6 | |||||||
Net fee and commission income (expense) | 589 | 242 | (58.9 | ) | ||||||||
Net other operating income (expense) | (68 | ) | (18 | ) | (73.5 | ) | ||||||
Provision for credit losses | (129 | ) | (207 | ) | 60.5 | |||||||
Depreciation and amortization | (12 | ) | (36 | ) | 200.0 | |||||||
Others | (211 | ) | (311 | ) | 47.4 | |||||||
|
|
|
| |||||||||
Profit before income tax | 1,010 | 571 | (43.5 | ) | ||||||||
Tax income (expense) (1) | (246 | ) | (130 | ) | (47.2 | ) | ||||||
|
|
|
| |||||||||
Profit for the year | (Won) | 764 | (Won) | 441 | (42.3 | )% | ||||||
|
|
|
| |||||||||
| Year Ended December 31, | Percentage Change | |||||||||||||||||||
| 2011 (1) | 2012 (1) (2) | 2013 (1) (2) | 2012/2011 | 2013/2012 | ||||||||||||||||
| (in billions of Won) | (%) | |||||||||||||||||||
Income statement data | ||||||||||||||||||||
Interest income | ₩ | 1,381 | ₩ | 1,388 | ₩ | 1,436 | 0.5 | % | 3.5 | % | ||||||||||
Interest expense | (480 | ) | (414 | ) | (379 | ) | (13.8 | ) | (8.5 | ) | ||||||||||
Net fee and commission income | 242 | 158 | 185 | (34.7 | ) | 17.1 | ||||||||||||||
Net other operating income (expense) | (18 | ) | (83 | ) | (39 | ) | 361.1 | (53.0 | ) | |||||||||||
General and administrative expenses | (340 | ) | (349 | ) | (354 | ) | 2.6 | 1.4 | ||||||||||||
Provision for credit losses | (207 | ) | (315 | ) | (345 | ) | 52.2 | 9.5 | ||||||||||||
Net other non-operating revenue (expense) | (1 | ) | (4 | ) | (2 | ) | 300.0 | (50.0 | ) | |||||||||||
|
|
|
|
|
| |||||||||||||||
Profit before income tax | 577 | 381 | 502 | (34.0 | ) | 31.8 | ||||||||||||||
Tax income (expense)(3) | (132 | ) | (90 | ) | (118 | ) | (31.8 | ) | 31.1 | |||||||||||
|
|
|
|
|
| |||||||||||||||
Profit for the year | ₩ | 445 | ₩ | 291 | ₩ | 384 | (34.6 | )% | 32.0 | % | ||||||||||
|
|
|
|
|
| |||||||||||||||
| (1) | The amounts for 2013 reflect a change in our accounting policies pursuant to the amendments to IAS 19,Employee Benefits, which are effective beginning in 2013. Corresponding amounts for 2011 and 2012 have been restated to retroactively apply such change. See “—Overview—Changes in Accounting Policies.” |
| (2) | The amounts for 2013 reflect a change in our accounting policies pursuant to the adoption of IFRS 10,Consolidated Financial Statements, which is effective beginning in 2013. Corresponding amounts for 2012 (but not for 2011) have been restated to retroactively apply such change. See “—Overview—Changes in Accounting Policies.” |
| (3) | Represents the portion of Kookmin Bank’s income tax for |
Comparison of 2013 to 2012
Our profit before income tax for this segment increased by 31.8% from ₩381 billion in 2012 to ₩502 billion in 2013.
Interest income from our credit card operations increased by 3.5% from ₩1,388 billion in 2012 to ₩1,436 billion in 2013. This increase was primarily due to an increase in interest income from factored receivables, reflecting an increase in the average volume of such receivables.
Interest expense for this segment decreased 8.5% from ₩414 billion in 2012 to ₩379 billion in 2013. This decrease was primarily due to decreased funding costs for this segment in light of the lower interest rate environment in Korea in 2013.
Net fee and commission income attributable to this segment increased 17.1% from ₩158 billion in 2012 to ₩185 billion in 2013, which resulted mainly from an increase in fee and commission income from check cards.
Net other operating expense attributable to this segment decreased 53.0% from ₩83 billion in 2012 to ₩39 billion in 2013, primarily due to an increase in other operating income resulting from proceeds from sales of written-off credit card loans to the National Happiness Fund.
General and administrative expenses attributable to this segment increased 1.4% from ₩349 billion in 2012 to ₩354 billion in 2013, mainly due to an increase in salary expense.
Provision for credit losses increased 9.5% from ₩315 billion in 2012 to ₩345 billion in 2013, mainly reflecting a decrease in reversal of provisions primarily due to our sale of written-off credit card loans to the National Happiness Fund and an increase in impaired credit card balances due to a change in our charge-off policy in 2013 which increased the delinquency period for credit card balances before charge-off from three months to six months.
Net other non-operating expense attributable to this segment decreased 50.0% from ₩4 billion in 2012 to ₩2 billion in 2013, primarily due to a decrease in charitable donations by KB Kookmin Card.
Comparison of 2012 to 2011
Our profit before income tax for this segment decreased by 43.5%34.0% from (Won)1,010₩577 billion in 20102011 to (Won)571₩381 billion in 2011.2012.
Interest income from our credit card operations increased 4.8% from (Won)1,318remained relatively constant at ₩1,388 billion in 20102012 compared to (Won)1,381₩1,381 billion in 2011. This increase was primarily due to an increase in the average volume of credit card loans, which mainly reflected an increase in demand for such loans.
Interest expense for this segment remained relatively constant at (Won)480decreased 13.8% from ₩480 billion in 2011 compared to (Won)477₩414 billion in 2010.2012. This decrease was primarily due to decreased funding costs for this segment in light of the lower interest rate environment in Korea in 2012.
Net fee and commission income attributable to this segment decreased 58.9%34.7% from (Won)589 billion in 2010 to (Won)242₩242 billion in 2011 due primarily to ₩158 billion in 2012, which resulted mainly from an increase in credit card-related fee and commission expense paid to Kookmin Bank by KB Kookmin Card for, among other things, assisting with certain credit card operations and recruiting new credit card members through Kookmin Bank’s branch network after the spin-off of Kookmin Bank’s credit card business and the establishment of KB Kookmin Cardexpenses, principally reflecting increased marketing activities in March 2011.2012.
Net other operating expense attributable to this segment decreased 73.5%increased more than four-fold from (Won)68 billion in 2010 to (Won)18₩18 billion in 2011 mainlyto ₩83 billion in 2012, primarily as a result of an increasea decrease in income from salesales of written-offcharged-off credit card loans and receivables.
General and administrative expenses attributable to this segment increased 2.6% from ₩340 billion in 2011 to ₩349 billion in 2012, primarily due to an increase in salary expense.
Provision for credit losses increased 60.5%52.2% from (Won)129 billion in 2010 to (Won)207₩207 billion in 2011 to ₩315 billion in 2012, mainly reflecting decreases in the asset quality of certain corporate purchasing card accounts and inincreased delinquencies as well as decreased recoveries on charged-off credit card loans and receivables.
Depreciation and amortizationNet other non-operating expense attributable to this segment increased by (Won)24 billionfour-fold from (Won)12 billion in 2010 to (Won)36 billion in 2011.
Other expenses attributable to this segment increased 47.4% from (Won)211 billion in 2010 to (Won)311₩1 billion in 2011 to ₩4 billion in 2012, primarily reflecting increasesdue to an increase in employee benefits and other administrative expenses.
Investment and Securities Operations
This segment consists primarily of securities brokerage, investment banking, securities investment and trading and other capital markets services conducted by KB Investment & Securities. In March 2011, KB Investment & Securities was merged with KB Futures, with KB Investment & Securities as the surviving entity.
Accordingly, the income statement data for this segment for 2011 reflect the results of operations of KB Futures for the period in 2011 following the merger. The following table shows, for the periods indicated, our income statement data for this segment:
| Year Ended December 31, | Percentage change | |||||||||||
| 2010 | 2011 | 2011/2010 | ||||||||||
| (in billions of Won) | (%) | |||||||||||
Income statement data | ||||||||||||
Interest income | (Won) | 33 | (Won) | 42 | 27.3 | % | ||||||
Interest expense | (29 | ) | (29 | ) | 0.0 | |||||||
Net fee and commission income | 52 | 83 | 59.6 | |||||||||
Net gain (loss) from financial assets and liabilities at fair value through profit or loss | 72 | 50 | (30.6 | ) | ||||||||
Net other operating income (expense) | 7 | 14 | 100.0 | |||||||||
Provision for credit losses | 2 | (6 | ) | N/M | (1) | |||||||
Depreciation and amortization | (6 | ) | (6 | ) | 0.0 | |||||||
Others | (78 | ) | (111 | ) | 42.3 | |||||||
|
|
|
| |||||||||
Profit before income tax | 53 | 37 | (30.2 | ) | ||||||||
Tax income (expense) (2) | (13 | ) | (9 | ) | (30.8 | ) | ||||||
|
|
|
| |||||||||
Profit for the year | (Won) | 40 | (Won) | 28 | (30.0 | )% | ||||||
|
|
|
| |||||||||
| Year Ended December 31, | Percentage Change | |||||||||||||||||||
| 2011 (1) | 2012 (1) (2) | 2013 (1) (2) | 2012/2011 | 2013/2012 | ||||||||||||||||
| (in billions of Won) | (%) | |||||||||||||||||||
Income statement data | ||||||||||||||||||||
Interest income | ₩ | 42 | ₩ | 38 | ₩ | 41 | (9.5 | )% | 7.9 | % | ||||||||||
Interest expense | (29 | ) | (19 | ) | (17 | ) | (34.5 | ) | (10.5 | ) | ||||||||||
Net fee and commission income | 83 | 86 | 76 | 3.6 | (11.6 | ) | ||||||||||||||
Net gain (loss) from financial assets and liabilities at fair value through profit or loss | 50 | 39 | 19 | (22.0 | ) | (51.3 | ) | |||||||||||||
Net other operating income (expense) | 14 | 5 | 1 | (64.3 | ) | (80.0 | ) | |||||||||||||
General and administrative expenses | (118 | ) | (118 | ) | (96 | ) | — | (18.6 | ) | |||||||||||
Provision (reversal of provision) for credit losses | (6 | ) | (4 | ) | (5 | ) | (33.3 | ) | 25.0 | |||||||||||
Net other non-operating revenue (expense) | (2 | ) | (3 | ) | (2 | ) | 50.0 | (33.3 | ) | |||||||||||
|
|
|
|
|
| |||||||||||||||
Profit before income tax | 34 | 24 | 17 | (29.4 | ) | (29.2 | ) | |||||||||||||
Tax income (expense)(3) | (8 | ) | (6 | ) | (5 | ) | (25.0 | ) | (16.7 | ) | ||||||||||
|
|
|
|
|
| |||||||||||||||
Profit for the year | ₩ | 26 | ₩ | 18 | ₩ | 12 | (30.8 | )% | (33.3 | )% | ||||||||||
|
|
|
|
|
| |||||||||||||||
| (1) |
|
| (2) | The amounts for 2013 reflect a change in our accounting policies pursuant to the adoption of IFRS 10,Consolidated Financial Statements, which is effective beginning in 2013. Corresponding amounts for 2012 (but not for 2011) have been restated to retroactively apply such change. See “—Overview—Changes in Accounting Policies.” |
| (3) | Represents income tax attributable to KB Investment & Securities. |
Comparison of 2013 to 2012
Our profit before income tax for this segment decreased 30.2%29.2% from (Won)53₩24 billion in 20102012 to (Won)37₩17 billion in 2011.2013.
Interest income from this segment increased 27.3%7.9% from (Won)33₩38 billion in 20102012 to (Won)42₩41 billion in 2011.2013. This increase was primarily due to an increase in the average volume of reserves for claims of customers’ deposits and deposits for exchange-traded derivatives, principally as a result of KB Investment & Securities’ merger with KB Futures in March 2011, which was enhanced by an increase in the average interest rates in respect of such reserves and deposits.available-for-sale financial assets.
Interest expense for this segment remained relatively constant at (Won)29decreased 10.5% from ₩19 billion in 20102012 to ₩17 billion in 2013, which mainly reflected a general decrease in the average cost of our debts in light of the lower interest rate environment in Korea, which was enhanced by a decrease in the average volume of call money and 2011.customers’ deposits.
Net fee and commission income attributable to this segment increased 59.6%decreased 11.6% from (Won)52₩86 billion in 20102012 to (Won)83₩76 billion in 2011,2013, principally as a result of an increasea decrease in brokerage commissions which mainly resulted from KB Investment & Securities’ merger with KB Futures in March 2011.relating to securities underwriting activities.
Net gain from financial assets and liabilities at fair value through profit or loss attributable to this segment decreased 30.6%51.3% from (Won)72₩39 billion in 20102012 to (Won)50₩19 billion in 2011,2013, principally as a result of an increasea decrease in net lossgain on financial assets held-for-trading and derivatives held-for-trading.
Net other operating income attributable to this segment increased 100.0%decreased 80.0% from (Won)7₩5 billion in 20102012 to (Won)14₩1 billion in 2011.2013, primarily as a result of a reversal of provisions for litigation in 2012 that was not repeated in 2013.
General and administrative expenses attributable to this segment decreased by 18.6% from ₩118 billion in 2012 to ₩96 billion and 2013, principally due to a decrease in performance-based salary expense.
Provision for credit losses decreasedincreased 25.0% from a reversal of provision of (Won)2₩4 billion in 20102012 to ₩5 billion in 2013.
Net other non-operating expense attributable to this segment decreased 33.3% from ₩3 billion in 2012 to ₩2 billion in 2012.
Comparison of 2012 to 2011
Our profit before income tax for this segment decreased 29.4% from ₩34 billion in 2011 to ₩24 billion in 2012.
Interest income from this segment decreased 9.5% from ₩42 billion in 2011 to ₩38 billion in 2012. This decrease was primarily due to a provisiondecrease in the average volume of (Won)6bonds purchased under repurchase agreements.
Interest expense for this segment decreased 34.5% from ₩29 billion in 2011.
DepreciationNet fee and amortizationcommission income attributable to this segment increased 3.6% from ₩83 billion in 2011 to ₩86 billion in 2012, principally as a result of an increase in commissions relating to securities repurchase agreement activities.
Net gain from financial assets and liabilities at fair value through profit or loss attributable to this segment decreased 22.0% from ₩50 billion in 2011 to ₩39 billion in 2012, principally as a result of a decrease in net gains on securities and derivatives held-for-trading.
Net other operating income attributable to this segment decreased 64.3% from ₩14 billion in 2011 to ₩5 billion in 2012, primarily as a result of a decrease in other operating income from certain non-financial operations that were consolidated in 2011 but not in 2012.
General and administrative expenses attributable to this segment remained relatively constant at (Won)6₩118 billion in 20102011 and 2011.2012.
Other expensesProvision for credit losses decreased 33.3% from ₩6 billion in 2011 to ₩4 billion in 2012, mainly reflecting an increase in reversal of provisions relating to loans purchased.
Net other non-operating expense attributable to this segment increased 42.3% from (Won)78 billion in 2010 to (Won)111₩2 billion in 2011 primarily due to increases₩3 billion in bonus payments to employees and advertising expenses.2012.
Life Insurance Operations
This segment consists of life insurance and wealth management services provided by KB Life Insurance. We currently hold a 51.0%100.0% voting interest in KB Life Insurance, which is accounted for as a consolidated subsidiary under IFRS as issued by the IASB. The following table shows, for the periods indicated, our income statement data for this segment:
| Year Ended December 31, | Percentage change | |||||||||||
| 2010 | 2011 | 2011/2010 | ||||||||||
| (in billions of Won) | (%) | |||||||||||
Income statement data | ||||||||||||
Interest income | (Won) | 128 | (Won) | 162 | 26.6 | % | ||||||
Interest expense | — | — | — | |||||||||
Net gain (loss) from financial assets and liabilities at fair value through profit or loss | 3 | — | N/M | (1) | ||||||||
Net other operating income (expense) | (71 | ) | (95 | ) | 33.8 | |||||||
Provision for credit losses | — | (1 | ) | N/M | (1) | |||||||
Depreciation and amortization | (4 | ) | (4 | ) | 0.0 | |||||||
Others | (33 | ) | (38 | ) | 15.2 | |||||||
|
|
|
| |||||||||
Profit before income tax | 23 | 24 | 4.3 | |||||||||
Tax income (expense) (2) | (5 | ) | (5 | ) | 0.0 | |||||||
|
|
|
| |||||||||
Profit for the year | (Won) | 18 | (Won) | 19 | 5.6 | |||||||
|
|
|
| |||||||||
| Year Ended December 31, | Percentage Change | |||||||||||||||||||
| 2011 (1) | 2012 (1) | 2013 (1) | 2012/2011 | 2013/2012 | ||||||||||||||||
| (in billions of Won) | (%) | |||||||||||||||||||
Income statement data | ||||||||||||||||||||
Interest income | ₩ | 162 | ₩ | 192 | ₩ | 200 | 18.5 | % | 4.2 | % | ||||||||||
Interest expense | — | — | — | — | — | |||||||||||||||
Net gain (loss) from financial assets and liabilities at fair value through profit or loss | — | 8 | 18 | N/M | (2) | 125.0 | ||||||||||||||
Net other operating income (expense) | (95 | ) | (132 | ) | (154 | ) | 38.9 | 16.7 | ||||||||||||
General and administrative expenses | (42 | ) | (45 | ) | (51 | ) | 7.1 | 13.3 | ||||||||||||
Provision (reversal of provision) for credit losses | (1 | ) | — | (1 | ) | (100.0 | ) | N/M | (2) | |||||||||||
Net other non-operating revenue (expense) | — | (1 | ) | — | N/M | (2) | (100.0 | ) | ||||||||||||
|
|
|
|
|
| |||||||||||||||
Profit before income tax | 24 | 22 | 12 | (8.3 | ) | (45.5 | ) | |||||||||||||
Tax income (expense)(3) | (5 | ) | (5 | ) | (3 | ) | — | (40.0 | ) | |||||||||||
|
|
|
|
|
| |||||||||||||||
Profit for the year | ₩ | 19 | ₩ | 17 | ₩ | 9 | (10.5 | )% | (47.1 | )% | ||||||||||
|
|
|
|
|
| |||||||||||||||
| (1) | The amounts for 2013 reflect a change in our accounting policies pursuant to the amendments to IAS 19,Employee Benefits, which are effective beginning in 2013. Corresponding amounts for 2011 and 2012 have been restated to retroactively apply such change. See “—Overview—Changes in Accounting Policies.” |
| (2) | “N/M” means not meaningful. |
Represents income tax attributable to KB Life Insurance. |
Comparison of 2013 to 2012
Our profit before income tax for this segment remained relatively steady at (Won)24decreased 45.5% from ₩22 billion in 2011 compared2012 to (Won)23₩12 billion in 2010.2013.
Interest income for this segment increased 26.6%4.2% from (Won)128₩192 billion in 20102012 to (Won)162₩200 billion in 2011,2013, primarily due to an increase in the average volume of available-for-saleheld-to-maturity debt securities held by KB Life Insurance, which was partially offset by a decrease in the average yield on suchparticularly government agency debt securities.
Net gain from financial assets and liabilities at fair value through profit or loss attributable to this segment decreased by (Won)3increased 125.0% from ₩8 billion from 2010in 2012 to 2011.₩18 billion in 2013, which mainly reflected an increase in gains on sales of beneficiary certificates.
Net other operating expense attributable to this segment increased 33.8%16.7% from (Won)71₩132 billion in 20102012 to (Won)95₩154 billion in 2011,2013, principally due to a decreasean increase in premium income from individual life insurance products.the amortization expense of deferred acquisition costs.
Provision for credit losses increased by (Won)1 billion from 2010 to 2011.
DepreciationGeneral and amortization attributable to this segment remained relatively constant at (Won)4 billion in 2010 and 2011.
Otheradministrative expenses attributable to this segment increased 15.2%13.3% from (Won)33₩45 billion in 20102012 to (Won)38₩51 billion in 2011.2013, primarily due to an increase in expenses relating to tax and dues.
Provision for credit losses changed from nil in 2012 to ₩1 billion in 2013.
Net other non-operating expense attributable to this segment decreased from ₩1 billion in 2012 to nil in 2013.
Comparison of 2012 to 2011
Our profit before income tax for this segment decreased 8.3% from ₩24 billion in 2011 to ₩22 billion in 2012.
Interest income for this segment increased 18.5% from ₩162 billion in 2011 to ₩192 billion in 2012, primarily due to an increase in the average volume of available-for-sale debt securities held by KB Life Insurance, particularly corporate debt securities and Korean treasury securities and government agency debt securities.
Net gain from financial assets and liabilities at fair value through profit or loss attributable to this segment changed from a gain of less than ₩1 billion in 2011 to a gain of ₩8 billion in 2012, which mainly reflected an increase in gains on sales of beneficiary certificates.
Net other operating expense attributable to this segment increased 38.9% from ₩95 billion in 2011 to ₩132 billion in 2012, principally due to increases in policy reserves relating to single premium life insurance products sold in 2012.
General and administrative expenses attributable to this segment increased 7.1% from ₩42 billion in 2011 to ₩45 billion in 2012, primarily due to increased salaries and overhead expenses resulting from the opening of new branch offices in 2012.
Provision for credit losses changed from provisions of ₩1 billion in 2011 to less than ₩1 billion in 2012.
Net other non-operating expense attributable to this segment increased from less than ₩1 billion in 2011 to ₩1 billion in 2012.
Other
“Other” includes the operations of our holding company and all of our subsidiaries that were consolidated under IFRS as issued by the IASB as of December 31, 20112013 except Kookmin Bank, KB Kookmin Card, KB Investment & Securities and KB Life Insurance, including principally KB Asset Management, KB Real Estate Trust, KB Investment, KB Credit Information, and KB Data System.System, KB Savings Bank (commencing in 2012) and Yehansoul Mutual Savings Bank (commencing in 2013). See “—Overview—Acquisitions.” The following table shows, for the periods indicated, our income statement data for this segment:
| Year Ended December 31, | Percentage change | Year Ended December 31, | Percentage Change | |||||||||||||||||||||||||||||
| 2010 | 2011 | 2011/2010 | 2011 (1) | 2012 (1) (2) | 2013 (1) (2) | 2012/2011 | 2013/2012 | |||||||||||||||||||||||||
| (in billions of Won) | (%) | (in billions of Won) | (%) | |||||||||||||||||||||||||||||
Income statement data | ||||||||||||||||||||||||||||||||
Interest income | (Won) | 80 | (Won) | 66 | (17.5 | )% | ₩ | 66 | ₩ | 123 | ₩ | 106 | 86.4 | % | (13.8 | )% | ||||||||||||||||
Interest expense | (61 | ) | (49 | ) | (19.7 | ) | (49 | ) | (47 | ) | (25 | ) | (4.1 | ) | (46.8 | ) | ||||||||||||||||
Net fee and commission income | 92 | 96 | 4.3 | 96 | 97 | 118 | 1.0 | 21.6 | ||||||||||||||||||||||||
Net gain (loss) from financial assets and liabilities at fair value through profit or loss | 2 | (4 | ) | N/M | (1) | (4 | ) | 25 | 29 | N/M | (3) | 16.0 | ||||||||||||||||||||
Net other operating income | 30 | 54 | 80.0 | 54 | 37 | 40 | (31.5 | ) | 8.1 | |||||||||||||||||||||||
Provision for credit losses | (21 | ) | (8 | ) | (61.9 | ) | ||||||||||||||||||||||||||
Depreciation and amortization | (5 | ) | (3 | ) | (40.0 | ) | ||||||||||||||||||||||||||
Share of profit of associates and joint ventures | — | 2 | N/M | (1) | ||||||||||||||||||||||||||||
Others | (25 | ) | (197 | ) | 688.0 | |||||||||||||||||||||||||||
General and administrative expenses | (113 | ) | (133 | ) | (142 | ) | 17.7 | 6.8 | ||||||||||||||||||||||||
Provision (reversal of provision) for credit losses | (8 | ) | 6 | (28 | ) | N/M | (3) | N/M | (3) | |||||||||||||||||||||||
Share of profit of associates | 2 | — | (38 | ) | (100.0 | ) | N/M | (3) | ||||||||||||||||||||||||
Net non-operating revenue (expense) | (85 | ) | (45 | ) | 31 | (47.1 | ) | N/M | (3) | |||||||||||||||||||||||
|
|
|
|
| ||||||||||||||||||||||||||||
Profit before income tax | 92 | (43 | ) | N/M | (1) | |||||||||||||||||||||||||||
Profit (loss) before income tax | (41 | ) | 63 | 91 | N/M | (3) | 44.4 | |||||||||||||||||||||||||
Tax income (expense) | (12 | ) | (2 | ) | (83.3 | ) | (4 | ) | (15 | ) | (30 | ) | 275.0 | 100.0 | ||||||||||||||||||
|
|
|
|
| ||||||||||||||||||||||||||||
Profit (loss) for the year | (Won) | 80 | (Won) | (45 | ) | N/M | (1) | ₩ | (45 | ) | ₩ | 48 | ₩ | 61 | N/M | (3) | 27.1 | % | ||||||||||||||
|
|
|
|
| ||||||||||||||||||||||||||||
| (1) | The amounts for 2013 reflect a change in our accounting policies pursuant to the amendments to IAS 19,Employee Benefits, which are effective beginning in 2013. Corresponding amounts for 2011 and 2012 have been restated to retroactively apply such change. See “—Overview—Changes in Accounting Policies.” |
| (2) | The amounts for 2013 reflect a change in our accounting policies pursuant to the adoption of IFRS 10,Consolidated Financial Statements, which is effective beginning in 2013. Corresponding amounts for 2012 (but not for 2011) have been restated to retroactively apply such change. See “—Overview—Changes in Accounting Policies.” |
| (3) | “N/M” means not meaningful. |
Represents income tax attributable to our holding company and all of our subsidiaries that were consolidated under IFRS as issued by the IASB except Kookmin Bank, KB Kookmin Card, KB Investment & Securities and KB Life Insurance. |
Comparison of 2013 to 2012
Our profit before income tax for this segment changedincreased 44.4% from a profit of (Won)92₩63 billion in 20102012 to a loss of (Won)43₩91 billion in 2011.2013.
Interest income attributable to this segment decreased 17.5%13.8% from (Won)80₩123 billion in 20102012 to (Won)66₩106 billion in 2011.2013. This decrease was primarily due to a decrease in the average volume of due from banks held by our holding company, which mainly resulted from a decrease in deposits held by the holding company at Kookmin Bank, which the holding company used in 2011attributable to repay (Won)750 billion of its outstanding debentures.KB Savings Bank.
Interest expense attributable to this segment decreased 19.7%46.8% from (Won)61₩47 billion in 20102012 to (Won)49₩25 billion in 2011, due mainly to2013, principally reflecting a decrease in the average volume of debentures issued by our holding company, which reflected its repayment of (Won)750 billion of its outstanding debentures in 2011.time deposits attributable to KB Savings Bank.
Net fee and commission income attributable to this segment increased 4.3%21.6% from (Won)92₩97 billion in 20102012 to (Won)96₩118 billion in 2013, mainly as the result of an increase in fees received by KB Asset Management.
Net gain from financial assets and liabilities at fair value through profit or loss attributable to this segment increased 16.0% from ₩25 billion in 2012 to ₩29 billion in 2013, principally due to an increase in gain on valuation of derivatives held by KB Mezzanine Private Securities Fund 1.
Net other operating income attributable to this segment increased 8.1% from ₩37 billion in 2012 to ₩40 billion in 2013, primarily as a result of an increase in other operating income from sales of non-performing loans held by KB Savings Bank.
General and administrative expenses attributable to this segment increased 6.8% from ₩133 billion in 2012 to ₩142 billion in 2013, which mainly reflected an increase in salary expense for KB Asset Management and the inclusion of Yehansoul Savings Bank in this segment in 2013.
Provision for credit losses attributable to this segment changed from a reversal of provision of ₩6 billion in 2012 to a provision of ₩28 billion in 2013, principally due to an increase in provision for credit losses relating to the trust account lending activities of KB Real Estate Trust.
Share of profit of associates attributable to this segment changed from nil in 2012 to a loss of ₩38 billion in 2013, primarily due to an increase in impairment losses attributable to this segment.
Net other non-operating revenue (expense) attributable to this segment changed from an expense of ₩45 billion in 2012 to a revenue of ₩31 billion in 2013, primarily due to an increase in other non-operating revenue from KB Asset Management.
Comparison of 2012 to 2011
Our profit before income tax for this segment was ₩63 billion in 2012 compared to a loss before income tax of ₩41 billion in 2011.
Interest income attributable to this segment increased 86.4% from ₩66 billion in 2011 to ₩123 billion in 2012. This increase was primarily due to the inclusion of KB Savings Bank in this segment from 2012.
Interest expense attributable to this segment decreased 4.1% from ₩49 billion in 2011 to ₩47 billion in 2012, principally reflecting a decrease in interest expense at our holding company level resulting from the repayment of outstanding debentures and borrowings by our holding company in 2012, the effect of which was offset in part by the inclusion of KB Savings Bank in this segment from 2012.
Net fee and commission income attributable to this segment remained relatively constant at ₩97 billion in 2012 compared to ₩96 billion in 2011.
Net gain from financial assets and liabilities at fair value through profit or loss attributable to this segment changed from a net gainloss of (Won)2₩4 billion in 20102011 to a net lossgain of (Won)4₩25 billion in 2011.2012, which mainly reflected the inclusion of KB Mezzanine Private Securities Fund 1 in this segment from 2012.
Net other operating income attributable to this segment increased 80.0%decreased 31.5% from (Won)30₩54 billion in 20102011 to (Won)54₩37 billion in 2011,2012, primarily as a result of an increasea decrease in gain on disposal of available-for-sale equity securities held by KB Investment.
General and administrative expenses attributable to this segment increased 17.7% from ₩113 billion in 2011 to ₩133 billion in 2012, which mainly reflected the inclusion of KB Savings Bank in this segment from 2012.
Provision for credit losses attributable to this segment decreased 61.9%changed from (Won)21 billion in 2010 to (Won)8a provision of ₩8 billion in 2011 mainly reflectingto a decreasereversal of provision of ₩6 billion in 2012, principally due to an increase in reversal of KB Real Estate Trust’s provision for credit losses resulting from both an improvementcontinuing improvements in the asset quality of trust accounts held by KB Real Estate Trust, and a decreaseas well as reversal of provision for credit losses relating to KB Savings Bank which reflected collections made on KB Savings Bank’s non-performing loans in the average volume of such trust accounts.
Depreciation and amortization attributable to this segment remained relatively constant at (Won)3 billion in 2011 compared to (Won)5 billion 2010.2012.
Share of profit of associates and joint ventures attributable to this segment increaseddecreased by (Won)2₩2 billion from 20102011 to 2011.2012.
OtherNet other non-operating expense attributable to this segment increased almost seven-folddecreased 47.1% from (Won)25 billion in 2010 to (Won)197₩85 billion in 2011 to ₩45 billion in 2012, primarily as a resultdue to the recognition of a decreasesignificant impairment losses in dividends received2011 on membership interests held by our holding company from our subsidiaries.which was not repeated in 2012.
| Item | Liquidity and Capital Resources |
Financial Condition
Assets
The following table sets forth, as of the dates indicated, the principal components of our assets:
| As of December 31, | Percentage change | As of December 31, | Percentage Change | |||||||||||||||||||||||||||||
| 2010 | 2011 | 2011 | 2012 (1) | 2013 (1) | 2012/2011 | 2013/2012 | ||||||||||||||||||||||||||
| (in billions of Won) | (%) | (in billions of Won) | (%) | |||||||||||||||||||||||||||||
Cash and due from financial institutions | (Won) | 6,830 | (Won) | 9,178 | 34.4 | % | ₩ | 9,178 | ₩ | 10,593 | ₩ | 14,793 | 15.4 | % | 39.6 | % | ||||||||||||||||
Financial assets at fair value through profit or loss | 4,014 | 6,326 | 57.6 | 6,326 | 9,560 | 9,329 | 51.1 | (2.4 | ) | |||||||||||||||||||||||
Derivative financial assets | 2,595 | 2,449 | (5. 6 | ) | 2,449 | 2,091 | 1,819 | (14.6 | ) | (13.0 | ) | |||||||||||||||||||||
Financial investments | 36,190 | 35,432 | (2.1 | ) | 35,432 | 36,467 | 34,849 | 2.9 | (4.4 | ) | ||||||||||||||||||||||
Loans: | ||||||||||||||||||||||||||||||||
Loans to banks | 2,819 | 3,988 | 41.5 | 3,988 | 4,398 | 6,335 | 10.3 | 44.0 | ||||||||||||||||||||||||
|
|
|
|
| ||||||||||||||||||||||||||||
Loans to customers other than banks: | ||||||||||||||||||||||||||||||||
Loans in Won | 173,245 | 184,211 | 6.3 | 184,211 | 185,889 | 189,516 | 0.9 | 2.0 | ||||||||||||||||||||||||
Loans in foreign currencies | 4,381 | 4,141 | (5.5 | ) | 4,141 | 3,538 | 3,055 | (14.6 | ) | (13.7 | ) | |||||||||||||||||||||
Domestic import usance bills | 2,611 | 4,278 | 63.8 | 4,278 | 3,595 | 2,978 | (16.0 | ) | (17.2 | ) | ||||||||||||||||||||||
Off-shore funding loans | 962 | 893 | (7.2 | ) | 893 | 754 | 670 | (15.6 | ) | (11.1 | ) | |||||||||||||||||||||
Call loans | 143 | 1,093 | 664.3 | 1,093 | 1,193 | 697 | 9.1 | (41.6 | ) | |||||||||||||||||||||||
Bills bought in Won | 22 | 104 | 372.7 | 104 | 30 | 14 | (71.2 | ) | (53.3 | ) | ||||||||||||||||||||||
Bills bought in foreign currencies | 2,227 | 2,723 | 22.3 | 2,723 | 2,522 | 1,588 | (7.4 | ) | (37.0 | ) | ||||||||||||||||||||||
Guarantee payments under payment guarantee | 191 | 57 | (70.2 | ) | 57 | 45 | 38 | (21.1 | ) | (15.6 | ) | |||||||||||||||||||||
Credit card receivables in Won | 12,410 | 12,420 | 0.1 | 12,420 | 11,871 | 11,782 | (4.4 | ) | (0.7 | ) | ||||||||||||||||||||||
Credit card receivables in foreign currencies | 1 | 1 | 0.0 | 1 | 3 | 2 | 200.0 | (33.3 | ) | |||||||||||||||||||||||
Bonds purchased under repurchase agreements | 230 | 830 | (260.9 | ) | 830 | 1,251 | 1,683 | 50.7 | 34.5 | |||||||||||||||||||||||
Privately placed bonds | 2,135 | 816 | (61.8 | ) | 816 | 604 | 733 | (26.0 | ) | 21.4 | ||||||||||||||||||||||
Factored receivables | — | 1,221 | 2,771 | N/M | (2) | 126.9 | ||||||||||||||||||||||||||
|
|
|
|
| ||||||||||||||||||||||||||||
Total loans to customers other than banks | 198,558 | 211,567 | 7.0 | 211,567 | 212,516 | 215,527 | 0.4 | 1.4 | ||||||||||||||||||||||||
Less: | ||||||||||||||||||||||||||||||||
Allowances for loan losses | (3,756 | ) | (3,448 | ) | (8.2 | ) | (3,448 | ) | (3,269 | ) | (2,861 | ) | (5.2 | ) | (12.5 | ) | ||||||||||||||||
|
|
|
|
| ||||||||||||||||||||||||||||
Total loans, net | 197,621 | 212,107 | 7.3 | 212,107 | 213,645 | 219,001 | 0.7 | 2.5 | ||||||||||||||||||||||||
Property and equipment | 3,150 | 3,186 | 1.1 | 3,186 | 3,100 | 3,061 | (2.7 | ) | (1.3 | ) | ||||||||||||||||||||||
Other assets (1) | 8,371 | 8,923 | 6.6 | |||||||||||||||||||||||||||||
Other assets(3) | 8,923 | 10,295 | 8,986 | 15.4 | (12.7 | ) | ||||||||||||||||||||||||||
|
|
|
|
| ||||||||||||||||||||||||||||
Total assets | (Won) | 258,771 | (Won) | 277,601 | 7.3 | % | ₩ | 277,601 | ₩ | 285,751 | ₩ | 291,838 | 2.9 | % | 2.1 | % | ||||||||||||||||
|
|
|
|
| ||||||||||||||||||||||||||||
| (1) | The amounts as of December 31, 2013 reflect a change in our accounting policies pursuant to the adoption of IFRS 10,Consolidated Financial Statements, which is effective beginning in 2013. Corresponding amounts as of December 31, 2012 (but not as of December 31, 2011) have been restated to retroactively apply such change. See “—Overview—Changes in Accounting Policies.” |
| (2) | “N/M” means not meaningful. |
| (3) | Includes investments in associates and joint ventures, investment properties, intangible assets, deferred income tax assets, assets held for sale and other assets. |
For further information on our assets, see “Item 4B.4.B. Business Overview—Assets and Liabilities.”
Comparison of 20112013 to 20102012
Our total assets increased 7.3%2.1% from (Won)258,771₩285,751 billion as of December 31, 20102012 to (Won)277,601₩291,838 billion as of December 31, 2011,2013, principally due to a 6.3%2.5% increase in loans in Won from (Won)173,245₩213,645 billion as of December 31, 20102012 to (Won)184,211₩219,001 billion as of December 31, 2011,2013 and a 34.4%39.6% increase in cash and due from financial institutions from (Won)6,830₩10,593 billion as of December 31, 20102012 to (Won)9,178₩14,793 billion as of December 31, 2011 and a 57.6% increase in financial assets at fair value through profit and loss from (Won)4,014 billion as of December 31, 2010 to (Won)6,326 billion as of December 31, 2011.2013. The effect of these increases was partially offset by a 61.8%4.4% decrease in privately placed bondsfinancial investments from (Won)2,135₩36,467 billion as of December 31, 20102012 to (Won)816₩34,849 billion as of December 31, 2013 and a 12.7% decrease in other assets from ₩10,295 billion as of December 31, 2012 to ₩8,986 billion as of December 31, 2013.
Comparison of 2012 to 2011
Our total assets increased 2.9% from ₩277,601 billion as of December 31, 2011 and a 2.1% decrease in financial investments from (Won)36,190to ₩285,751 billion as of December 31, 20102012, principally due to (Won)35,432a 51.1% increase in financial assets at fair value through profit or loss from ₩6,326 billion as of December 31, 2011.2011 to ₩9,560 billion as of December 31, 2012, a 0.7% increase in loans from ₩212,107 billion as of December 31, 2011 to ₩213,645 billion as of December 31, 2012, a 15.4% increase in cash and due from financial institutions from ₩9,178 billion as of December 31, 2011 to ₩10,593 billion as of December 31, 2012 and a 15.4% increase in other assets from ₩8,923 billion as of December 31, 2011 to ₩10,295 billion as of December 31, 2012. The effect of these increases was partially offset by a 14.6% decrease in derivative financial assets from ₩2,449 billion as of December 31, 2011 to ₩2,091 billion as of December 31, 2012.
Liabilities and Equity
The following table sets forth, as of the dates indicated, the principal components of our liabilities and our equity:
| As of December 31, | Percentage change | As of December 31, | Percentage Change | |||||||||||||||||||||||||||||
| 2010 | 2011 | 2011(1) | 2012 (1) (2) | 2013 (1) (2) | 2012/2011 | 2013/2012 | ||||||||||||||||||||||||||
| (in billions of Won) | (%) | (in billions of Won) | (%) | |||||||||||||||||||||||||||||
Liabilities: | ||||||||||||||||||||||||||||||||
Financial liabilities at fair value through profit or loss | (Won) | 1,295 | (Won) | 1,388 | 7.2 | % | ₩ | 1,388 | ₩ | 1,851 | ₩ | 1,115 | 33.4 | % | (39.8 | )% | ||||||||||||||||
Deposits | 179,862 | 190,337 | 5.8 | 190,337 | 197,346 | 200,882 | 3.7 | 1.8 | ||||||||||||||||||||||||
Debts | 11,745 | 16,824 | 43.2 | 16,824 | 15,965 | 14,101 | (5.1 | ) | (11.7 | ) | ||||||||||||||||||||||
Debentures | 29,107 | 27,070 | (7.0 | ) | 27,070 | 24,270 | 27,040 | (10.3 | ) | 11.4 | ||||||||||||||||||||||
Provisions | 1,020 | 798 | (21.8 | ) | 798 | 670 | 678 | (16.0 | ) | 1.2 | ||||||||||||||||||||||
Other liabilities | 16,076 | 18,084 | 12.5 | 18,084 | 20,886 | 22,369 | 15.5 | 7.1 | ||||||||||||||||||||||||
|
|
|
|
| ||||||||||||||||||||||||||||
Total liabilities | 239,105 | 254,501 | 6.4 | 254,501 | 260,988 | 266,185 | 2.5 | 2.0 | ||||||||||||||||||||||||
|
|
|
|
| ||||||||||||||||||||||||||||
Equity: | ||||||||||||||||||||||||||||||||
Capital stock | 1,932 | 1,932 | — | 1,932 | 1,932 | 1,932 | 0.0 | 0.0 | ||||||||||||||||||||||||
Capital surplus | 15,990 | 15,842 | (0.9 | ) | 15,842 | 15,840 | 15,855 | (0.0 | ) | 0.1 | ||||||||||||||||||||||
Accumulated other comprehensive income | 431 | 191 | (55.7 | ) | 168 | 295 | 336 | 75.6 | 13.9 | |||||||||||||||||||||||
Retained earnings | 2,621 | 4,953 | 89.0 | 4,976 | 6,501 | 7,530 | 30.6 | 15.8 | ||||||||||||||||||||||||
Treasury shares | (2,477 | ) | — | N/M | (2) | |||||||||||||||||||||||||||
|
|
|
|
| ||||||||||||||||||||||||||||
Equity attributable to stockholders | 18,497 | 22,918 | 23.9 | 22,918 | 24,568 | 25,653 | 7.2 | 4.4 | ||||||||||||||||||||||||
Non-controlling interests | 1,169 | 182 | (84.4 | ) | 182 | 195 | — | 7.1 | (100.0 | ) | ||||||||||||||||||||||
|
|
|
|
| ||||||||||||||||||||||||||||
Total equity | 19,666 | 23,100 | 17.5 | 23,100 | 24,763 | 25,653 | 7.2 | 3.6 | ||||||||||||||||||||||||
|
|
|
|
| ||||||||||||||||||||||||||||
Total liabilities and equity | (Won) | 258,771 | (Won) | 277,601 | 7.3 | % | ₩ | 277,601 | ₩ | 285,751 | ₩ | 291,838 | 2.9 | % | 2.1 | % | ||||||||||||||||
|
|
|
|
| ||||||||||||||||||||||||||||
| (1) | The amounts as of December 31, 2013 reflect a change in our accounting policies pursuant to the amendments to IAS 19,Employee Benefits, which are effective beginning in 2013. Corresponding amounts as of December 31, 2011 and 2012 have been restated to retroactively apply such change. See “—Overview—Changes in Accounting Policies.” |
| (2) | The amounts as of December 31, 2013 reflect a change in our accounting policies pursuant to the adoption of IFRS 10,Consolidated Financial Statements, which is effective beginning in 2013. Corresponding amounts as of December 31, 2012 (but not as of December 31, 2011) have been restated to retroactively apply such change. See “—Overview—Changes in Accounting Policies.” |
| (3) | Includes derivative financial liabilities, current income tax liabilities, deferred income tax liabilities, defined benefit liabilities and other liabilities. |
|
Comparison of 20112013 to 20102012
Our total liabilities increased 6.4%2.0% from (Won)239,105₩260,988 billion as of December 31, 20102012 to (Won)254,501₩266,185 billion as of December 31, 2011.2013. The increase was primarily due to increases in deposits and debts.debentures. Our deposits increased 5.8%1.8% from (Won)179,862₩197,346 billion as of December 31, 20102012 to (Won)190,337₩200,882 billion as of December 31, 2011,2013, mainly as a result of an increase in time deposits in Won.demand deposits. Our debtsdebentures increased 43.2%11.4% from (Won)11,745₩24,270 billion as of December 31, 20102012 to (Won)16,824₩27,040 billion as of December 31, 2011,2013, principally due to an increase in borrowings.our debentures in Won and an increase in discount or premium on debentures in Won.
Our total equity increased by 17.5%3.6% from (Won)19,666₩24,763 billion as of December 31, 20102012 to (Won)23,100₩25,653 billion as of December 31, 2011.2013. This increase resulted principally from our sale of approximately 43.3 million treasury shares (with a carrying value of (Won)2,477 billion) in 2011, as well as an increase in our retained earnings, which was attributable to the profit we generated in 2011.2013.
Comparison of 2012 to 2011
Our total liabilities increased 2.5% from ₩254,501 billion as of December 31, 2011 to ₩260,988 billion as of December 31, 2012. The increase was primarily due to increases in deposits and other liabilities. Our deposits increased 3.7% from ₩190,337 billion as of December 31, 2011 to ₩197,346 billion as of December 31, 2012, mainly as a result of an increase in demand deposits. Our other liabilities increased 15.5% from ₩18,084 billion as of December 31, 2011 to ₩20,886 billion as of December 31, 2012, principally due to an increase in liabilities related to our life insurance business (mainly policy reserves).
Our total equity increased by 7.2% from ₩23,100 billion as of December 31, 2011 to ₩24,763 billion as of December 31, 2012. This increase resulted principally from an increase in our retained earnings, which was attributable to the profit we generated in 2012.
Liquidity
Our primary source of funding has historically been and continues to be deposits. Deposits amounted to (Won)179,862₩190,337 billion, ₩197,346 billion and (Won)190,337₩200,882 billion as of December 31, 20102011, 2012 and 2011,2013, which represented approximately 81.5%81.3%, 83.1% and 81.3%83.0% of our total funding, respectively. We have been able to use customer deposits to finance our operations generally, including meeting a portion of our liquidity requirements. Although the majority of deposits are short-term, it has been our experience that the majority of our depositors generally roll over their deposits at maturity, thus providing us with a stable source of funding. However, in the event that a substantial number of our depositors do not roll over their deposits or otherwise decide to withdraw their deposited funds, we would need to place increased reliance on alternative sources of funding, some of which may be more expensive than customer deposits, in order to finance our operations. See “Item 3D.3.D. Risk Factors—Risks relating to liquidity and capital management—Our funding is highly dependent on short-term deposits, which dependence may adversely affect our operations.” In particular, we may increase our utilization of alternative funding sources such as short-term borrowings and cash and cash equivalents (including funds from maturing loans), as well as liquidating our positions in financial assets and using the proceeds to fund parts of our operations, as necessary.
We also obtain funding through debentures and debts to meet our liquidity needs. Debentures represented 13.2%11.6%, 10.2% and 11.6%11.2% of our total funding as of December 31, 20102011, 2012 and 2011,2013, respectively. Debts represented 5.3%7.2%, 6.7% and 7.2%5.8% of our total funding as of December 31, 20102011, 2012 and 2011,2013, respectively. For further information on our sources of funding, see “Item 4B.4.B. Business Overview—Assets and Liabilities—Funding.”
The Financial Services Commission of Korea requires each financial holding company and bank in Korea to maintain specific Won and foreign currency liquidity ratios. These ratios require us and Kookmin Bank to keep the ratio of liquid assets to liquid liabilities above certain minimum levels. For a description of these requirements, see “Item 4B.4.B. Business Overview—Supervision and Regulation—Principal Regulations Applicable to Financial Holding Companies—Liquidity” and “Item 4B.4.B. Business Overview—Supervision and Regulation—Principal Regulations Applicable to Banks—Liquidity.”
We are exposed to liquidity risk arising from withdrawals of deposits and maturities of our debentures and debts, as well as the need to fund our lending, trading and investment activities and the management of our trading positions. The goal of liquidity management is for us to be able, even under adverse conditions, to meet all of our liability repayments on time and fund all investment opportunities. For an explanation of how we manage our liquidity risk, see “Item 11. Quantitative and Qualitative Disclosures about Market Risk—Liquidity Risk Management.”
We are a financial holding company, and substantially all of our operations are in our subsidiaries. Accordingly, we rely on distributions from our subsidiaries, direct borrowings and issuances of debt and equity securities to fund our liquidity obligations. We received aggregate dividends of (Won)95nil, ₩688 billion and ₩282 billion from our subsidiaries in 2010 but did not receive any dividends from our subsidiaries in 2011.2011, 2012 and 2013, respectively. See “Item 3D.3.D. Risk Factors—Risks relating to our financial holding company structure and strategy.”
Contractual Cash Obligations
The following table sets forth our contractual cash obligations (excluding short-term borrowings) as of December 31, 2011.2013.
| Payments Due by Period | ||||||||||||||||||||
| Total | 1 Year or Less | 1-3 Years | 3-5 Years | More Than 5 Years | ||||||||||||||||
| (in billions of Won) | ||||||||||||||||||||
Long-term borrowing obligations(1) (2) | (Won) | 34,984 | (Won) | 11,487 | (Won) | 14,141 | (Won) | 4,013 | (Won) | 5,343 | ||||||||||
Operating lease obligations(3) | 185 | 104 | 66 | 14 | 1 | |||||||||||||||
Capital lease obligations | 2 | 1 | 1 | — | — | |||||||||||||||
Pension obligations | 104 | 104 | — | — | — | |||||||||||||||
Deposits(4) (5) | 136,684 | 127,220 | 7,620 | 1,334 | 510 | |||||||||||||||
|
|
|
|
|
|
|
|
|
| |||||||||||
Total | (Won) | 171,959 | (Won) | 138,916 | (Won) | 21,828 | (Won) | 5,361 | (Won) | 5,854 | ||||||||||
|
|
|
|
|
|
|
|
|
| |||||||||||
| Payments Due by Period | ||||||||||||||||||||
| Total | 1 Year or Less | 1-3 Years | 3-5 Years | More Than 5 Years | ||||||||||||||||
| (in billions of Won) | ||||||||||||||||||||
Long-term borrowing obligations (1) (2) | ₩ | 37,357 | ₩ | 14,843 | ₩ | 12,830 | ₩ | 4,605 | ₩ | 5,079 | ||||||||||
Operating lease obligations (3) | 230 | 121 | 88 | 21 | — | |||||||||||||||
Capital lease obligations | 2 | 2 | — | — | — | |||||||||||||||
Pension obligations | 181 | 181 | — | — | — | |||||||||||||||
Deposits (2) (4) | 138,590 | 127,309 | 7,558 | 1,045 | 2,678 | |||||||||||||||
|
|
|
|
|
|
|
|
|
| |||||||||||
Total | ₩ | 176,360 | ₩ | 142,456 | ₩ | 20,476 | ₩ | 5,671 | ₩ | 7,757 | ||||||||||
|
|
|
|
|
|
|
|
|
| |||||||||||
| (1) | Includes debt and debentures with original maturities of |
| (2) | Includes estimated future interest payments, which have been estimated using contractual interest rates and scheduled contractual maturities of the outstanding debt obligations and borrowings as of December 31, |
| (3) | This line item is not included within our consolidated statements of financial position. |
| (4) | Excluding demand deposits. |
|
Commitments and Guarantees
The following table sets forth our commitments and guarantees as of December 31, 2011.2013. These commitments apart from certain financialand guarantees are not included within our consolidated statements of financial position. Financial guarantees are initially recognized at their fair value and thereafter measured at the greater of (x) the amount determined in accordance with International Accounting Standard 37 (Provisions, Contingent Liabilities and Contingent Assets) and (y) the initial amount recognized minus (when appropriate) cumulative amortization recognized in accordance with International Accounting Standard 18 (Revenue).
| Payments Due by Period | ||||||||||||||||||||
| Total | 1 Year or Less | 1-3 Years | 3-5 Years | More Than 5 Years | ||||||||||||||||
| (in billions of Won) | ||||||||||||||||||||
Financial guarantees (1) | (Won) | 945 | (Won) | 468 | (Won) | 455 | (Won) | 22 | (Won) | — | ||||||||||
Confirmed acceptances and guarantees | 5,847 | 4,357 | 1,331 | 158 | 1 | |||||||||||||||
Commitments | 91,744 | 90,825 | 718 | 198 | 3 | |||||||||||||||
Trust fund guarantees | 2,892 | 653 | 391 | 333 | 1,515 | |||||||||||||||
|
|
|
|
|
|
|
|
|
| |||||||||||
Total | (Won) | 101,428 | (Won) | 96,303 | (Won) | 2,895 | (Won) | 711 | (Won) | 1,519 | ||||||||||
|
|
|
|
|
|
|
|
|
| |||||||||||
| Payments Due by Period | ||||||||||||||||||||
| Total | 1 Year or Less | 1-3 Years | 3-5 Years | More Than 5 Years | ||||||||||||||||
| (in billions of Won) | ||||||||||||||||||||
Financial guarantees (1) | ₩ | 3,097 | ₩ | 767 | ₩ | 2,206 | ₩ | 124 | ₩ | — | ||||||||||
Confirmed acceptances and guarantees | 5,764 | 4,290 | 1,018 | 262 | 194 | |||||||||||||||
Commitments | 95,422 | 94,176 | 848 | 284 | 114 | |||||||||||||||
|
|
|
|
|
|
|
|
|
| |||||||||||
Total | ₩ | 104,283 | ₩ | 99,233 | ₩ | 4,072 | ₩ | 670 | ₩ | 308 | ||||||||||
|
|
|
|
|
|
|
|
|
| |||||||||||
| (1) | Includes |
Capital Adequacy
Kookmin Bank is subject to capital adequacy requirements of the Financial Services Commission capital adequacy requirements applicable to Korean banks, which have beenbanks. The requirements applicable prior to December 2013 were formulated based on and are consistent in all material respects with, the “International Convergence of Capital Measurement and Capital Standards, a Revised Framework,” also known as Basel II, which was first published by the Basel Committee ofon Banking Supervision, Bank for International Settlements in 2004 and implemented2004. The requirements applicable commencing in December 2013 pursuant to amended Financial Services Commission regulations promulgated in July 2013 were formulated based on Basel III, which was first introduced by the Basel Committee on Banking Supervision, Bank for International Settlements in December 2009. Under the amended Financial Services Commission regulations, all banks in Korea beginning in 2008. Kookmin Bank isare required to maintain acertain minimum ratioratios of Tier I common equity capital, total Tier I capital and total Tier I and Tier II capital to risk-weighted assets, as determined by a specified formula, of 8.0%.assets. See “Item 4B.4.B. Business Overview—Supervision and Regulation—Principal Regulations Applicable to Banks—Capital Adequacy and Allowances.Adequacy.”
As of December 31, 2011,2013, Kookmin Bank’s total Tier I and Tier II capital adequacy ratio was 13.55%15.42%.
The following table sets forth a summary of Kookmin Bank’s capital and capital adequacy ratios as of December 31, 2011.2011 and 2012 based on Basel II and as of December 31, 2013 based on Basel III.
| ||||
| ||||
| ||||
| ||||
| ||||
| ||||
| ||||
| ||||
| ||||
| ||||
| ||||
| ||||
| ||||
| ||||
| ||||
| ||||
| ||||
| ||||
| ||||
| ||||
| ||||
| ||||
| ||||
| As of December 31, | ||||||||||||
| 2011 (1) | 2012 (1) | 2013 | ||||||||||
(in billions of Won, except percentages) | ||||||||||||
Tier I capital: | ₩ | 14,954 | ₩ | 16,141 | ₩ | 18,502 | ||||||
Tier I common equity capital | — | — | 18,502 | |||||||||
Paid-in capital | 2,022 | 2,022 | 2,022 | |||||||||
Capital reserves | 5,043 | 5,042 | 5,220 | |||||||||
Retained earnings | 8,542 | 9,622 | 11,237 | |||||||||
Non-controlling interests in consolidated subsidiaries | 8 | 1 | — | |||||||||
Others | (661 | ) | (546 | ) | 23 | |||||||
Additional Tier I capital | — | — | — | |||||||||
Tier II capital: | 4,714 | 5,250 | 4,122 | |||||||||
Revaluation reserves | 177 | 177 | — | |||||||||
Allowances for credit losses (2) | 1,092 | 987 | 843 | |||||||||
Hybrid debt | 136 | 73 | 43 | |||||||||
Subordinated debt | 2,943 | (3) | 3,611 | (3) | 3,236 | |||||||
Valuation gain on investment securities | 66 | 83 | — | |||||||||
Others | 300 | 319 | — | |||||||||
Total core and supplementary capital | 19,668 | 21,391 | 22,624 | |||||||||
Risk-weighted assets | 145,185 | 148,544 | 146,743 | |||||||||
Credit risk: | ||||||||||||
On-balance sheet | 127,489 | 127,462 | 125,044 | |||||||||
Off-balance sheet | 5,340 | 6,622 | 6,787 | |||||||||
Market risk | 2,193 | 4,693 | 4,012 | |||||||||
Operational risk | 10,163 | 9,767 | 10,900 | |||||||||
Total Tier I and Tier II capital adequacy ratio | 13.55 | % | 14.40 | % | 15.42 | % | ||||||
Tier I capital adequacy ratio | 10.30 | 10.87 | 12.61 | |||||||||
Tier I common equity capital adequacy ratio | — | — | 12.61 | |||||||||
Tier II capital adequacy ratio | 3.25 | 3.53 | 2.81 | |||||||||
| (1) |
|
| (2) | Under the standardized approach, allowances for credit losses in respect of credits classified as normal or precautionary are used to calculate Tier II capital only to the extent they represent up to 1.25% of credit risk-weighted assets. Under the internal ratings-based approach, allowances for credit losses, less estimated losses, are used to calculate Tier II capital only to the extent they represent up to 0.6% of credit risk-weighted assets. |
Subordinated debt up to an amount equal to 50% of Tier I capital may be used in the calculation of Tier II capital. |
Under Basel II, banks are permitted to follow either a standardized approach or an internal ratings-based approach with respect to calculating credit risk capital requirements. Kookmin Bank has voluntarily chosen to establish and follow an internal ratings-based approach, which is more risk-sensitive in assessing its credit risk capital requirements. For regulatory reporting purposes, Kookmin Bank has implemented its internal ratings-based approach for credit risk with respect to retail and small and medium-sized enterprise loans and asset-backed securities from January 2008, large corporate loans from June 2008 and retail SOHO loans from
December 2008. Kookmin Bank plans to further implement its internal ratings-based approach to other classes of credit risk exposure on a phased rollout basis by the end of 2012 based on consultations with the Financial Supervisory Service and to implement its “Advanced Internal Ratings-based Approach” for credit risk for regulatory reporting purposes in the near future. A standardized approach is used in measuring credit risk for those classes of exposure for which Kookmin Bank’s internal ratings-based approach has not yet been implemented, as well as for certain classes of exposure (including those to the government, public institutions and other banks) for which the internal ratings-based approach will not be applied. With respect to operational risk, Kookmin Bank implemented an “Advanced Measurement Approach” for regulatory reporting purposes beginning in January 2009.
While the implementation of Kookmin Bank’s internal ratings-based approach in 2008 increased its capital adequacy ratio and led to a decrease in its credit risk-related capital requirements as compared to those under its previous approach under the initial Basel Capital Accord of 1988, there can be no assurance that such internal ratings-based approach under Basel II will not require an increase in Kookmin Bank’s credit risk capital requirements in the future, which may require Kookmin Bank to either improve its asset quality or raise additional capital.
In December 2009, the Basel Committee on Banking Supervision introduced a new set of measures to supplement Basel II which include, among others, a requirement for higher minimum capital, introduction of a leverage ratio as a supplementary measure to the capital adequacy ratio and flexible capital requirements for different phases of the economic cycle. Additional details regarding such new measures, including an additional capital conservation buffer and countercyclical capital buffer, liquidity coverage ratio and other supplemental measures, were announced by the Group of Governors and Heads of Supervision of the Basel Committee on Banking Supervision in September 2010. After further impact assessment and observation periods, the Basel Committee on Banking Supervision is expected to begin implementing the new set of measures, referred to as Basel III, from 2013. In Korea, Basel III is expected to be implemented in stages from 2013 to 2019. The implementation of Basel III in Korea may have a significant effect on the capital requirements of Korean financial institutions, including us.
In addition, we, as a bank holding company, are required under theto maintain certain minimum capital adequacy requirementsratios pursuant to applicable regulations of the Financial Services CommissionCommission. See “Item 4.B. Business Overview—Supervision and Regulation—Principal Regulations Applicable to maintain a minimum consolidated capital adequacy ratio of 8.0%. “Consolidated capital adequacy ratio” is defined as the ratio of equity capital as a percentage of risk-weighted assets on a consolidated basis, determined in accordance with the Financial Services Commission requirements that have been formulated based on Bank of International Settlements standards. “Equity capital,” as applicable to bank holding companies, is defined as the sum of Tier I capital, Tier II capital and Tier III capital less any deductible items (each as defined under the Regulation on the Supervision of Financial Holding Companies). “Risk-weighted assets” is defined as the sum of credit risk-weighted assets and market risk-weighted assets.Companies—Capital Adequacy.”
The following table sets forth a summary of our consolidated capital adequacy ratio as of December 31, 2011,2013, based on applicable IFRS and applicable regulatory reporting standards:
| As of December 31, | ||||
| 2013 | ||||
| (in billions of Won, | ||||
Tier I capital | ||||
Tier I common equity capital | ₩ | 22,694 | ||
Additional Tier I capital | — | |||
Total Tier I capital | ₩ | 22,694 | ||
Tier II capital | ₩ | 4,603 | ||
Risk-weighted assets | ||||
| ||||
| % | |||
Tier I capital adequacy ratio | 12.78 | % | ||
Tier I common equity capital adequacy ratio | 12.78 | % | ||
Tier II capital adequacy ratio | 2.60 | % | ||
Recent Accounting Pronouncements
See Note 2 of the notes to our consolidated financial statements included elsewhere in this annual report for a description of recent accounting pronouncements under IFRS as issued by the IASB that have been issued but are not yet effective.
| Item | Research and Development, Patents and Licenses, etc. |
Not Applicable.applicable.
| Item | Trend Information |
These matters are discussed under Item 5A5.A. and Item 5B5.B. above where relevant.
| Item | Off-Balance Sheet Arrangements |
See “Item 5B. Liquidity and Capital Resources—Financial Condition—Contractual Cash Obligations” and “Item 5B. Liquidity and Capital Resources—Financial Condition—Commitments and Guarantees.”
| Item | Tabular Disclosure of Contractual Obligations |
See “Item 5B. Liquidity and Capital Resources—Financial Condition—Contractual Cash Obligations.”
| Item 5.G. | Safe Harbor |
See “Forward-Looking Statements.”
| Item 6. | DIRECTORS, SENIOR MANAGEMENT AND EMPLOYEES |
| Item | Directors and Senior Management |
Board of Directors
Our board of directors, currently consisting of twoone executive directors, two non-standing directorsdirector and nine non-executive directors, has the ultimate responsibility for the management of our affairs.
Our articles of incorporation provide that:
we may have no more than 30 directors;
the number of executive directors must be less than 50% of the total number of directors; and
we have five or more non-executive directors.
The term of office for each director is renewable and is subject to the Korean Commercial Code, the Financial Holding Company Act and related regulations.
Our board of directors meets on a regular basis to discuss and resolve material corporate matters. Additional extraordinary meetings may also be convened at the request of any director or any committee that serves under the board of directors.
The names and positions of our directors are set forth below. The business address of all of the directors is our registered office at 9-1, 2-ga,84, Namdaemoon-ro, Jung-gu, Seoul 100-703, Korea.
Executive DirectorsDirector
The table below identifies our executive directorsdirector as of the date of this annual report:
Name | Date of Birth | Position | Director Since | End of Term | ||||||||
| Chairman and Chief Executive Officer | |||||||||||
| March 25, 2011 | July 12, | ||||||||||
Our executive directors dodirector does not have any significant activities outside KB Financial Group.
Yoon-Dae EuhYoung-Rok Limis our chairman and chief executive officer. Previously, he was the chairman of the Presidential Council on Nation Branding, the chairman of the steering committee of Korea Investment Corporation, president of Korea University, a member of the Public Fund Oversight Commission and a monetary board member of the Bank of Korea. Dr. Euh received a B.A. in business administration from Korea University, an M.B.A. from Korea University, an M.B.A. from the Asian Institute of Management and a Ph.D. in international finance from the University of Michigan at Ann Arbor.
Young Rok Limis our president. He previously served as our president, the vice minister and deputy minister of the former Ministry of Finance and Economy and the director-general of the Financial Policy Bureau at the former MinistryofMinistry of Finance and Economy. He received a B.A. in literature and an M.A. in public administration from Seoul National University, and an M.A. in economics from Vanderbilt University and a Ph.D. in economics from Hanyang University.
Non-standing Directors
The table below identifies our non-standing directors as of the date of this annual report:
|
| |||||||
| ||||||||
| ||||||||
|
Byong Deok Min has been a non-standing director since March 2011. He has also served as the president and chief executive officer of Kookmin Bank since 2010. He previously served as a senior executive vice president of the Consumer Banking Group at Kookmin Bank. He received a B.A. in business administration from Dongguk University.
Vaughn Richtorhas been a non-standing director since March 2011. He has also served as the chief executive officer of ING Banking Asia since 2009. He previously served as a managing director and the chief executive officer of ING Vysya Bank, India, and the chief executive officer of ING Bank (Australia) Limited. He received a B.A. in business studies from Southbank London.
Non-executive Directors
Our non-executive directors are selected based on the candidates’ talents and skills in diverse areas, such as law, finance, economy, management and accounting. All eightnine non-executive directors below were nominated by our Non-executive Director Nominating Committee and approved by our shareholders.
The table below identifies our non-executive directors as of the date of this annual report:
Name | Date of Birth | Position | Director Since | Year Term Ends (1) | ||||
Kyung Jae Lee | January 30, 1939 | Non-executive Director | March 26, 2010 | |||||
| ||||||||
Young Jin Kim | December 11, 1949 | Non-executive Director | March 25, 2011 | |||||
Kun Ho Hwang | January 23, 1951 | Non-executive Director | March 23, | |||||
Jong Cheon Lee | February 3, 1951 | Non-executive Director | March 25, 2011 | |||||
| Non-executive Director | |||||||
Seung Hee Koh | June 26, 1955 | Non-executive Director | March 26, 2010 | |||||
Young | Non-executive Director | March | ||||||
| Non-executive Director | March | ||||||
Sung Hwan Shin | February 17, 1963 | Non-executive Director | March 28, 2014 | 2016 |
| (1) | The date on which each term will end will be the date of the general stockholders’ meeting in the relevant year unless otherwise specified. |
Kyung Jae Leehas been a non-executive director and the chairman of our board of directors since March 2010. He previously served as the chief executive officer of the Industrial Bank of Korea, the chief executive officer of the Korea Financial Telecommunications & Clearings Institute and director and statutory auditor of the Bank of Korea. He received a B.A. in economics from Seoul National University, an M.A. in economics from New York University and a Ph.D. in economics from Kookmin University.
Jae Wook Bae has been a non-executive director since March 2011. He is currently a lawyer at Baejaewook Legal Office. He previously served as the presidential secretary for the Board of Audit and Inspection, a director of the Central Investigation Division of the Supreme Prosecutors’ Office and a chief prosecutor at the Geochang Branch of the Changwon District Prosecutors’ Office. He received a B.A. in law from Seoul National University and an M.A. in comparative law from the University of Michigan.
Young Jin Kim has been a non-executive director since March 2011. He is currently a professor at Seoul National University. He previously served as an outside director of Samsung Asset Management, director of the Korea Exchange and the president of the Korea Finance Association. He received a B.A. in business administration from Seoul National University, an M.B.A. from Columbia University and a D.B.A. in finance from Indiana Graduate School of Business.
Jong Cheon Lee has been a non-executive director since March 2011. He is currently a professor at Soongsil University and the chairman of the Korea Accounting Association. He was previously a non-standing director of Korea Gas Corporation and an advisory member at the former Ministry of Finance and Economy. He received a B.A. and an M.A. in business administration from Seoul National University and a Ph.D. in accounting from the University of Illinois.
Kun Ho Hwang has been a non-executive director since March 2012. He is currently an advisor at the Korea Financial Investment Association. He was previously the chairman of the Korea Financial Investment Association, the chief executive officer of Meritz Securities Co., Ltd. and the deputy president of Daewoo Securities Co., Ltd. He received a B.A. in business administration from Seoul National University and an M.A. in economics from Rutgers University.
Sang Moon HahmJong Cheon Lee has been a non-executive director since 2008.March 2011. He is currently a professor at KDI School of Public Policy and Management.Soongsil University. He was previously the chairman of the Korea Accounting Association, a chief researchernon-standing director of Korea Gas Corporation and an advisory member at the Korea Instituteformer Ministry of Finance and Economy. He received a B.A. and an assistanceM.A. in business administration from Seoul National University and a Ph.D. in accounting from the University of Illinois.
Jae Ho Chohas been a non-executive director since March 2014. He is currently a professor at Virginia Tech.Seoul National University and a director of Kyung Hee Foundation. He was previously the chair of the capital markets division of the Committee for Financial Development of Korea and an outside director of SK Telecom Co., Ltd. He received a B.A. in economicsbusiness administration from GeorgetownSeoul National University and an M.A.M.B.A. and a Ph.D. in economicsfinance from the Wharton School, University of Chicago.Pennsylvania.
Seung Hee Kohhas been a non-executive director since March 2010. He is currently a professor at Sookmyung Women’s University. He was previouslyUniversity and an advisor at the Fair Trade Commission of Korea. He was previously the vice president of the Management Accounting Association of Korea and the chairmana non-executive director of the Finance Accounting Department at the Korea Accounting Association.United Asset Management Company. He received a B.A. in
business administration from Seoul National University, an M.B.A. from Indiana University and a Ph.D. in business administration from the University of Oklahoma.
Young Nam Leehas been a non-executive director since March 2010. She is currently the chief executive officer of EZ Digital Co., Ltd. She previously served as the chairman of Korea Venture Business Women’s Association and the chief executive officer of Seohyun Electronics Co., Ltd. She received a diploma in management from Dong Busan University and completed courses in business administration at Ajou University and the Korea Advanced Institute of Science and Technology.
Jae Mok ChoKwa Kim has been a non-executive director since March 2009.2013. He previously served as the president and chief executive officer of the Korea Securities Finance Corporation, the commissioner of the Financial Intelligence Unit at the Financial Services Commission and the director general of the Economic Cooperation Bureau at the Ministry of Finance and Economy. He received a B.A. in economics from Seoul National University and a Ph.D. in economics from the University of Hawaii.
Myung Jig Kim has been a non-executive director since March 2014. He is currently the Chief Executive Office of Ace Research Center Co., Ltd. in Seoul and Daegu. He was a memberdean of the Seoul Advisory Committeecollege of economics and an adjunctfinance and a professor ofat Hanyang University. He was previously the vice president of the Korean Finance Association, the president of the Korean Securities Association and a non-executive director of Meritz Financial Group, Inc. He received a B.A., in economics from Hanyang University and an M.A. and a Ph.D. in psychologyeconomics from Keimyung University.the University of Washington.
Sung Hwan Shin has been a non-executive director since March 2014. He is currently a professor at Hongik University and a senior advisor at the Korea Fixed Income Research Institute and the head of fund evaluation at the Ministry of Strategy and Finance. He was previously the president of the Korea Pension Association. He received a B.A. in economics from Seoul National University and an M.B.A. and a Ph.D. in finance from the Sloan School of Management, Massachusetts Institute of Technology.
Any director having an interest in a transaction that is subject to approval by the board of directors may not vote at the meeting during which the board approves the transaction.
Executive Officers
The table below identifies our senior executive officers who are not executive directors as of the date of this annual report:report:
Name | Date of Birth | Position | ||
| February | |||
| Deputy President; Chief Financial Officer | |||
| Deputy President; Chief Public Relations Officer | |||
| ||||
Jae Youl Kim | October 16, 1969 | Senior Managing Director; Chief Information Officer | ||
| ||||
| ||||
| Managing Director; Chief Human Resources Officer | |||
| Managing Director; Chief | |||
| ||||
Kyu Sul Choi | August 16, 1960 | Managing Director; Head of Investor Relations | ||
Kyung Yup Cho | September 9, 1961 | Managing Director; Head of KB Research |
None of the executive officers has any significant activities outside KB Financial Group.
Dong Chang Parkis a deputy president and the chief strategy officer. He previously served as the president of Korea Global Banking Research Institute, a global strategy advisor at Hana Financial Group, a visiting fellow at Korea Institute of Finance, an executive vice president of LG Investment & Securities and the president and chief executive officer of LG Petro Bank in Poland. He received a B.A. in law from Seoul National University, an M.B.A. from Korea University and a Ph.D. in economics from Hankuk University of Foreign Studies.
Jong KyooWoong-Won Yoonis a deputy president and the chief financial officer. He currently also serves as an outside director of Kookmin Bank and KB Kookmin Card. He previously served as a senior advisor at Kimgeneral manager of our Financial Planning & Chang law firm, a senior executive vice president, chief financial officer, chief strategy officerManagement Department and retail bankingStrategic Planning Department and as the head officerof the Financial Management Division of Kookmin Bank and a senior partner and financial service leader of Samil PricewaterhouseCoopers.Bank. He received a B.A., M.A. and a Ph.D. in business administration from Sungkyungkwan University and an M.A. in business administration from Seoul NationalHanyang University.
Wang KyYong Soo Kimis a deputy president and the chief public relations officer. He previously served as an assistant ministera senior managing director at Daewoo Securities Co., Ltd. and spokesman for the Prime Minister of Korea,KDB Asset Management Co., Ltd. and as a member of the Deliberation Committee for National Audit Requestlecturer at the BoardKorea Advanced Institute of AuditScience and Inspection of Korea, an executive director of International Herald Tribune—Joongang Daily and a reporter at Joongang Ilbo.Technology. He received a B.A. in journalismlaw from Korea University, and an M.B.A. in strategic managementinternational finance from Hankuk University of informationForeign Studies and telecommunicationsa Ph.D. in communications from AjouSungkyunkwan University.
Seok Heung RyuKi-Bum Lee is a senior managing director and the chief risk officer. He previously served as the head of Kookmin Bank’s audit department, chief compliance officer of Kookmin Bank and the head of Gyeongseo and Bucheon regional offices of Kookmin Bank. He received a B.A. in German language and literature from Sogang University.
Jae Youl Kimis a deputy presidentsenior managing director and the chief information officer. He also serves as a senior executive vice president of Kookmin Bank and head of its Information Technology Group. He previously served as a general managerthe deputy director of Kookmin Bank’s IT Developmentthe Government Reform Department of the Ministry of Planning and Budget and the head of Kookmin Bank’s Development Management Department and Infra-development Department.green financial division. He received a B.A. in electronic engineeringgraduated from Hongik University.Sunchon High School.
Min Ho LeeMinkyu Chung is a deputy presidentmanaging director and the chief compliance officer. He previously served as a standing senior legal advisor andvice chief public prosecutor at the general managerSupreme Prosecutors’ Office of the legal department of Kookmin BankKorea and a senior attorneymanaging partner at Kim & Changthe law firm.firm of The Firm. He received a B.A. in economics and an M.B.A.law from Seoul National University and an LL.M. from Columbia Law School.
Won Keun Yangis a senior managing director and the head of KB Research. He previously served as a management advisor at Daewoo Securities, a standing audit committee member at Woori Bank, an executive director of the Korea Deposit Insurance Corporation and the head of research and a research fellow at Korea Institute of Finance. He received a B.A. in economics from Korea University and a Ph.D. in finance from Georgia State University.
Yong Jin ChoSang-Hwan Kimis a managing director and the chief human resources officer. He previously served as a general manager of the Management Support Office and the Human Resources Department and the head of Kookmin Bank’s SeojamsilTaebaek branch, Wonjudangu branch and Nakseongdae branches.Youngtong branch. He received a B.A. in publicbusiness administration from Korea University and an M.A. in human resources management from Sungshin Woman’s University Graduate School.Gangwon University.
Kyung Sub HanJong-Hee Yang is a managing director, and the chief risk officer. He previously served as the head of Kookmin Bank’s Risk Management Department. He received a B.A. in mechanics from Inha University and an M.B.A. in financial engineering from Korea Advanced Institute of Science and Technology (KAIST).
Dong Cheol Leeis a managing directorinformation security officer and the head of the Strategic Planning Department. He previously served as a branch manager of Kookmin Bank, department head of our Office of the Board of Directors and the head of theour Financial Planning and Management Department, the head of Kookmin Bank’s Taepyoungro branch and the general manager of Kookmin Bank’s Strategic Planning Department.& Management. He received a B.A. in lawKorean history from Korea University and an LL.M. from Tulane University Law School.Seoul National University.
Kyu Sul Choi is a managing director and the head of the Investor Relations Department.Relations. He previously served as the head of Kookmin Bank’s Investor Relations Department and Asset and Liability Management Department and the head of Korea First Bank’s treasury department. He received a B.A. in business administration from Yonsei University.
Kyung Yup Chois a managing director and the head of KB Research. He previously served as a senior editor at MaeKyung Media Group and the head of financial news, political news, social affairs and international news at Maeil Business Newspaper. He received a B.A. in business administration and a Ph.D. in business administration from Yonsei University.
| Item | Compensation |
The aggregate remuneration paid and benefits-in-kind granted by us to our chairman and chief executive officer, our other executive and non-standing directors, our non-executive directors and our executive officers for the year ended December 31, 20112013 was (Won)3,554₩5,599 million. In addition, for the year ended December 31, 2011,2013, we paid ₩445 million in termination benefits and set aside (Won)535₩82 million for allowances for severance and retirement benefits for our chairman and chief executive officer, the other executive directors and our executive officers.
The compensation of our directors who received total annual compensation exceeding ₩500 million in 2013 was as follows:
Name | Position | Total Compensation in 2013 (1) | Long-term Incentive Compensation for | |||||
| (In millions of Won) | ||||||||
Young-Rok Lim | Chairman and Chief Executive Officer | ₩ | 362 | Grant of 10,968 long-term incentive performance shares | ||||
| Former President | 833 | Grant of 8,187 long-term incentive performance shares | ||||||
Yoon-Dae Euh | Former Chairman and Chief Executive Officer | 991 | Grant of 9,792 long-term incentive performance shares | |||||
| (1) | Includes earned income, other income and retirement income according to the Income Tax Act of Korea, as well as performance based short-term incentive payments made in the first quarter of 2013 with respect to services performed in 2012. |
| (2) | Based on performance during term of office in 2013. The amount of disbursement, if any, of the long-term incentive performance shares (or the equivalent monetary amount based on the market value of such shares at the time of disbursement) will be determined at a later date. |
We do not have service contracts with any of our directors or officers providing for benefits upon termination of their employment with us.
Kookmin Bank granted stock options to its president and chief executive officer, other directors and executive officers, as well as employees. In connection with the comprehensive stock transfer in September 2008 pursuant to which we were established, such stock options were converted into stock options with respect to our common stock. See “Item 6E.6.E. Share Ownership—Stock Options.” For all of the options granted, upon their exercise, we are required to pay in cash the difference between the exercise price and the market price of our
common stock at the date of exercise. Generally, upon vesting, options may be exercised from after three years from the grant date up to eight years after such date, once restrictions on the exercise of options, including continued employment for at least two years from the grant date, lapse.
In 2011,2013, we recognized a reversal of compensation expense of (Won)14,502₩9 million for the stock options granted under our stock option plan. For additional information regarding our compensation expense in connection with our stock option plan, see Note 3031 to our consolidated financial statements.statements included elsewhere in this annual report.
In 2008, we also established a stock grant plan. Pursuant to this plan, we have entered into performance share agreements with certain of our directors, executive officers and other senior management, whereby we may grant shares of our common stock (or the equivalent monetary amount based on the market value of such shares at the time of the grant) within specified periods as long-term incentive performance shares in accordance with pre-determined performance targets.Seetargets. See “Item 6E.6.E. Share Ownership—Performance Share Agreements.” In 2011,2013, we recognized (Won)6,893₩17,298 million as compensation expense for the disbursements made under such agreements.
| Item | Board Practices |
See “Item 6A.6.A. Directors and Senior Management” above for information concerning the terms of office and contractual employment arrangements with our directors and executive officers.
Committees of the Board of Directors
We currently have the following committees that serve under the board:
the Audit Committee;
the Board Steering Committee;
the Management Strategy Committee;
the Group Risk Management Committee;
the Evaluation and& Compensation Committee;
the Non-executive Director Nominating Committee; and
the Audit Committee Member Nominating Committee; and
the Chairman and CEO Nominating Committee.
Each committee member is appointed by the board of directors, except for members of the Audit Committee, who are elected at the general meeting of stockholders.
Audit Committee
The committee currently consists of five non-executive directors, Kun Ho Hwang,Kyung Jae Lee, Young Jin Kim, Young Nam Lee, Jae Wook Bae and Jong Cheon Lee.Lee, Seung Hee Koh and Sung Hwan Shin. The chairperson of the Audit Committee is Jong Cheon Lee.Young Jin Kim. The committee oversees our financial reporting and approves the appointment of our independent registered public accounting firm. The committee also reviews our financial information, auditor’s examinations, key financial statement issues, the plans and evaluation of internal control and the administration of our financial affairs by the board of directors. In connection with the general meetings of stockholders, the committee examines the agenda for, and financial statements and other reports to be submitted by, the board of directors to each general meeting of stockholders. The committee holds regular meetings every quarter.
Board Steering Committee
The committee currently consists of five non-executive directors, Kyung Jae Lee, Jae Wook Bae, Seung Hee Koh,Young Jin Kim, Kun Ho Hwang, Jong Cheon Lee and Young JinKwa Kim, together with our chairman and chief executive officer, Yoon-Dae Euh.Young- Rok Lim. The chairperson of the Board Steering Committee is Kyung Jae Lee. The committee is responsible for ensuring the efficient operation of the board and the facilitation of the board’s functions. The committee is also responsible for discussion and review of overall matters with respect to the governance of us and our subsidiaries, promoting the efficiency and active function of the board and each committee. The committee holds regular meetings every quarter.
Management Strategy Committee
The committee currently consists of two non-standingfour non-executive directors, Byong Deok Min and Vaughn Richtor, three non-executive directors,Kun Ho Hwang, Young Kwa Kim, Seung Hee Koh Young Nam Lee and Jae Mok Cho,Sung Hwan Shin, and our chairman and chief executive officer, Yoon-Dae Euh.Young-Rok Lim. The chairperson of the committee is Seung Hee Koh.Young Kwa Kim. The committee reviews vision and mid-long term management strategy, the annual business plan, the annual budget plan, new strategic businesses, major financial strategy and major issues with respect to our management. The committee holds regular meetings every quarter.
Group Risk Management Committee
The committee currently consists of one executive director, Young Rok Lim, and fourfive non-executive directors, Kyung Jae Lee, Young Jin Kim, KyungKun Ho Hwang, Jae Lee, Sang Moon HahmHo Cho and Seung Hee Koh.Myung Jig Kim. The chairperson of the Group Risk Management Committee is Young Jin Kim.Kun Ho Hwang. The Group Risk Management Committee oversees and makes determinations on all issues relating to our comprehensive risk management function. In order to ensure our stable financial condition and to maximize our profits, the committee monitors our overall risk exposure and reviews our compliance with risk policies and risk limits. In addition, the committee reviews risk and control strategies and policies, evaluates whether each risk is at an adequate level, establishes or abolishes risk management divisions and reviews risk-based capital allocations. The committee holds regular meetings every quarter.
Evaluation and& Compensation Committee
The committee currently consists of five non-executive directors, Jae Wook Bae, Kun Ho Hwang, Jong Cheon Lee, Sang Moon HahmJae Ho Cho, Seung Hee Koh, Young Kwa Kim and Jae Mok Cho.Myung Jig Kim. The chairperson of the committee is Jae Wook Bae.Jong Cheon Lee. The Evaluation and Compensation Committee reviews compensation schemes and compensation levels of us and our subsidiaries. The committee is also responsible for deliberating and deciding the compensation of directors, evaluating management’s performance and implementing management training programs, as well as deciding and supervising the performance-based annual salary of the president and the executive officers of us and our subsidiaries. The committee holds regular meetings every quarter.
Non-executive Director Nominating Committee
The committee currently has no members. The last meeting of the committee was on March 2, 2012February 21, 2014 to nominate KunJae Ho HwangCho, Myung Jig Kim and Sung Hwan Shin as a new non-executive directordirectors and Kyung Jae Lee, Sang Moon Hahm,Young Jin Kim, Kun Ho Hwang, Jong Cheon Lee and Seung Hee Koh Young Nam Lee and Jae Mok Cho for re-appointment as non-executive directors. The committee oversees the selection of non-executive director candidates and recommends them annually sometime prior to the general stockholders meeting. The term of office of its members is from the first meeting of the committee held to nominate the non-executive directors until the nominated non-executive directors are appointed.
Audit Committee Member Nominating Committee
The committee currently has no members.Themembers. The last meeting of the committee was on March 2, 2012February 21, 2014 to nominate Kyung Jae Lee, Young Jin Kim, Kun Ho HwangJong Cheon Lee, Seung Hee Koh and Young Nam LeeSung Hwan Shin as new Audit Committee members. The committee oversees the selection of Audit Committee member candidates and recommends them annually sometime prior to the general stockholders meeting. The term of office of its members is from the first meeting of the committee held to nominate the Audit Committee members until the Audit Committee members are appointed.
Chairman and CEO Nominating Committee
The committee currently has no members. The last meeting of the committee was on June 17, 2010 to recommend to our board of directors to nominate Yoon-Dae Euh as an executive director to be appointed as our new chairman and chief executive officer. The committee oversees the selection of candidates to serve as our chairman and chief executive officer and recommends them to our board of directors. The term of the office of its members is from the first meeting of the committee held to nominate the chairman and chief executive officer until the nominated chairman and chief executive officer is appointed.
| Item | Employees |
As of December 31, 2011,2013, we had a total of 148151 full-time employees, excluding 10nine executive officers, at our financial holding company. The following table sets forth information regarding our employees at both our financial holding company and our subsidiaries as of the dates indicated:
| As of December 31, | As of December 31, | |||||||||||||||||||||||||||
| 2009 | 2010 | 2011 | 2011 | 2012 | 2013 | |||||||||||||||||||||||
KB Financial Group | Full-time employees(1) | 100 | 155 | 148 | Full-time employees (1) | 148 | 157 | 151 | ||||||||||||||||||||
| Contractual employees | — | — | — | Contractual employees | — | — | — | |||||||||||||||||||||
| Managerial employees | 81 | 124 | 121 | Managerial employees | 121 | 127 | 116 | |||||||||||||||||||||
| Members of Korea Financial Industry Union | — | — | — | Members of Korea Financial Industry Union | — | — | — | |||||||||||||||||||||
Kookmin Bank | Full-time employees(1) | 18,299 | 16,615 | 16,080 | Full-time employees (1) | 16,080 | 16,358 | 16,617 | ||||||||||||||||||||
| Contractual employees | 7,687 | 6,017 | 5,769 | Contractual employees | 6,175 | 5,713 | 5,136 | |||||||||||||||||||||
| Managerial employees | 11,929 | 11,647 | 11,278 | Managerial employees | 11,278 | 11,383 | 11,539 | |||||||||||||||||||||
| Members of Korea Financial Industry Union | 21,256 | 18,728 | 17,389 | Members of Korea Financial Industry Union | 17,389 | 17,149 | 17,123 | |||||||||||||||||||||
Other subsidiaries | Full-time employees(1) | 1,129 | 1,113 | 2,508 | Full-time employees (1) | 2,508 | 2,724 | 2,786 | ||||||||||||||||||||
| Contractual employees | 105 | 190 | 542 | Contractual employees | 542 | 541 | 137 | |||||||||||||||||||||
| Managerial employees | 660 | 662 | 1,450 | Managerial employees | 1,450 | 1,554 | 1,554 | |||||||||||||||||||||
| Members of Korea Financial Industry Union | 100 | 97 | 1,334 | Members of Korea Financial Industry Union | 1,334 | 1,370 | 1,509 | |||||||||||||||||||||
| (1) | Excluding executive officers. |
We consider our relations with our employees to be satisfactory. We and our subsidiaries each have a joint labor-management council which serves as a forum for ongoing discussions between our management and employees. At threefour of our subsidiaries, Kookmin Bank, KB Kookmin Card, and KB Real Estate Trust and KB Credit Information, our employees have a labor union. Every year, the unions at Kookmin Bank, KB Kookmin Card, and KB Real Estate Trust and KB Credit Information and their respective managements negotiate and enter into new collective bargaining agreements and negotiate annual wage adjustments.
Our compensation packages consist of base salary and base bonuses. We also provide performance-based compensation to employees and management officers, including those of our subsidiaries, depending on level of responsibility of the employee or officer and business of the relevant subsidiary. Typically, executive officers, heads of regional headquarters and employees in positions that require professional skills, such as fund managers and dealers, are compensated depending on their individual annual performance evaluation. Also, Kookmin Bank
has implemented a profit-sharing system in order to enhance the performance of Kookmin Bank’s employees. Under this system, Kookmin Bank pays bonuses to its employees, in addition to the base salary and depending on Kookmin Bank’s annual performance.
We provide a wide range of benefits to our employees, including our executive directors. Specific benefits provided may vary for each of our subsidiaries but generally include medical insurance, employment insurance, workers compensation, employee and spouse life insurance, free medical examinations, child tuition and fee reimbursement, disabled child financial assistance and reimbursement for medical expenses, and other benefits may be provided depending on the subsidiary.
Pursuant to the Korean National Pension Law, we prepay a portion of our accrued severance liabilities toIn accordance with the National Pension Corporation at the rate ofAct, we contribute an amount equal to 4.5% of employee wages, and each employee contributes 4.5% of his or her wages, into each employee’s annual wages. Our employeespersonal pension account. In addition, in accordance with the Guarantee of Worker’s Retirement Benefits Act, we have adopted a retirement pension plan for our employees. Contributions under the retirement pension plan are also responsible for payment to the National Pension Corporation of 4.5% of their wages. Our employees are entitleddeposited annually into a financial institution, and an employee may elect to receive an annuity froma monthly pension or a lump-sum amount upon retirement. Our retirement pension plans are provided in the National Pension Corporation following theirform of a defined benefit plan and a defined contribution plan. The defined benefit plan guarantees a certain payout at retirement, commencing at the age of 60.
Upon termination, our employees are entitledaccording to receive severance payments pursuant to the Labor Standards Act of Korea. The amount received by any employee equals the amount equivalent to (1) 30 days’ salary, calculated by averaginga fixed formula based on the employee’s dailyaverage salary for the three months prior to the date of the employee’s departure, multiplied by (2)and the number of continuous years duringfor which the employee worked. For information regarding our severance payments, see Note 30has been a plan
member. The defined contribution plan, in which the employer’s contribution is determined in advance based on one twelfth of an employee’s total annual pay, is managed directly by the notes to our consolidated financial statements.employees. Under Korean law, we may not terminate the employment of full-time employees except under certain limited circumstances.
In June 2009, we established an employee stock ownership plan. All of our employees are eligible to participate in this plan. We are not required to, and do not, make cash contributions to this plan. Members of our employee stock ownership association have pre-emptive rights to acquire up to 20% of our shares issued in public offerings by us pursuant to the Financial Investment Services and Capital Markets Act. In August 2009, we offered to members of our employee stock ownership association 6,000,000 of the 30,000,000 new shares of common stock to be issued in our rights offering to our existing shareholders, and the entire amount was subscribed by members of our employee stock ownership association. The employee stock ownership association held 3,404,8342,885,075 shares of our common stock as of December 31, 2011.2013.
Employees of Kookmin Bank have been eligible to participate in its employee stock ownership plan, which will be terminated once all of our common stock held by the plan (which the plan received following the transfer of Kookmin Bank shares held by it as a result of the comprehensive stock transfer pursuant to which we were established) have been distributed to the relevant Kookmin Bank employees at the requests of such employees following the expiration of the required holding periods. As of December 31, 2011,2013, Kookmin Bank’s employee stock ownership association held 974,722878,590 shares of our common stock.
In order to develop our next generation of leaders and enhance the operational capability of our employees at each of our subsidiaries, we operate various employee training programs. These programs, which are aimed at cultivating financial specialists with higher levels of management and business skills, developing regional experts for increased global capabilities and enhancing employee loyalty, comprise a number of customized programs such as training courses for employees of different positions, domestic and foreign MBA courses and intensive human resources development programs for high performers to cultivate future leaders. For example, Kookmin Bank offers training programs at its employees’ worksites to facilitate access to training, as well as a foreign regional expert training program and a global language training course. In 2008, Kookmin Bank established a “KB MBA in Finance” program to train and develop next generation leaders. We also provide financial and other support for our employees to develop their finance-related knowledge and skills by enrolling in training courses or engaging in self-study programs. The broad spectrum of training programs, combined with the state-of-the-art technologies such as cyber training, satellite broadcasting and mobile-learning, maximizes the level of exposure of the trainees to the contents of the programs. We also believe that our training scheme based on classified training courses and a development evaluation system has facilitated systemic development of employee skills and a spontaneous learning environment.
| Item | Share Ownership |
Common Stock
As of March 30, 2012,31, 2014, the persons who are currently our directors or executive officers, as a group, held an aggregate of 52,73113,724 shares of our common stock, representing approximately 0.014%0.004% of the issued shares of our common stock as of such date. None of these persons individually held more than 1% of the outstanding shares of our common stock as of such date. The following table presents information regarding our directors and executive officers who beneficially owned our shares as of March 30, 2012.31, 2014.
Name of Executive Officer or Director | Number of Shares of Common Stock | |||
| ||||
| ||||
| ||||
| ||||
| ||||
| ||||
| ||||
| ||||
| ||||
| ||||
| ||||
| ||||
| ||||
| ||||
Kyu Sul Choi | ||||
Woong-Won Yoon | 1,300 | |||
Jong-Hee Yang | 914 | |||
Jae Youl Kim | 904 | |||
Ki-Bum Lee | 600 | |||
Kyung Yup Cho | 500 | |||
|
| |||
Total | ||||
|
| |||
Stock Options
We have not, following our establishment pursuant to a comprehensive stock transfer in September 2008, granted any stock options with respect to our capital stock to our directors, executive officers and employees. Prior to our establishment, Kookmin Bank granted stock options with respect to its common stock to its directors, executive officers and employees. In connection with the comprehensive stock transfer, in September 2008, such stock options with respect to Kookmin Bank common stock were converted into stock options with respect to our common stock. For all of the options granted, upon their exercise, we are required to pay in cash the difference between the exercise price and the market price of our common stock at the date of exercise. The following table is the breakdown of such stock options granted to Kookmin Bank’s directors, executive officers and employees. It describes the grant date, position, exercise period and price and the number of options as of March 30, 2012,31, 2014, not including previously issued options which are no longer exercisable as of such date.
Grant Date Position When Granted 18-Mar-05 Chief Audit Executive 18-Mar-05 9 Non-executive Directors 18-Mar-05 14 Senior Executive Vice Presidents 18-Mar-05 22 Employees 22-Jul-05 Senior Executive Vice President 23-Aug-05 Employee 24-Mar-06 Chief Audit Executive 24-Mar-06 8 Non-executive Directors 24-Mar-06 5 Senior Executive Vice Presidents 24-Mar-06 15 Employees 28-Apr-06 Employee 27-Oct-06 Employee 8-Feb-07 4 Senior Executive Vice Presidents 8-Feb-07 27 Employees 23-Mar-07 Non-executive Director Grant Date Position When Granted 28-Apr-06 Employee 27-Oct-06 Employee 8-Feb-07 4 Senior Executive Vice Presidents 8-Feb-07 26 Employees 23-Mar-07 Non-executive Director Exercise Period Exercise
Price Number
of
Granted
Options (1) Number of
Exercised
Options Number of
Exercisable
Options From To 19-Mar-08 18-Mar-13 51,600 30,000 0 30,000 19-Mar-08 18-Mar-13 55,618 (2) 95,362 0 95,362 19-Mar-08 18-Mar-13 46,800 246,003 38,330 207,673 19-Mar-08 18-Mar-13 46,800 233,255 0 233,255 23-Jul-08 22-Jul-13 49,200 29,441 0 29,441 24-Aug-08 23-Aug-13 53,000 7,212 0 7,212 25-Mar-09 24-Mar-14 77,900 19,917 0 19,917 25-Mar-09 24-Mar-14 77,779 (2) 126,710 0 126,710 25-Mar-09 24-Mar-14 76,623 (2) 260,448 0 260,448 25-Mar-09 24-Mar-14 77,072 (2) 344,576 0 344,576 29-Apr-09 28-Apr-14 81,900 25,613 0 25,613 28-Oct-09 27-Oct-14 76,600 18,987 0 18,987 9-Feb-10 8-Feb-15 77,100 55,594 0 55,594 9-Feb-10 8-Feb-15 77,100 601,904 0 601,904 24-Mar-10 23-Mar-15 84,500 15,246 0 15,246 2,110,268 38,330 2,071,938 Exercise Period Exercise
Price Number
of
Granted
Options (1) Number of
Exercised
Options Number of
Exercisable
Options From To 29-Apr-09 28-Apr-14 81,900 25,613 0 25,613 28-Oct-09 27-Oct-14 76,600 18,987 0 18,987 9-Feb-10 8-Feb-15 77,100 55,594 0 55,594 9-Feb-10 8-Feb-15 77,100 601,904 0 601,904 24-Mar-10 23-Mar-15 84,500 15,246 0 15,246 717,344 0 717,344
| (1) | Some numbers of the granted options have been adjusted due to the merger and the early retirement of the grantees. |
|
Performance Share Agreements
In March 2009, our shareholders approved at the annual general meeting of shareholders the disbursement of a maximum of 250,000 shares of our common stock (or the equivalent monetary amount based on the market value of such shares at the time of disbursement), between September 29, 2008 and September 28, 2011, to our directors as long-term incentive performance shares over the term of their office in accordance with the performance targets set forth in the performance share agreements between us and such directors. In June 2009, we paid (Won)24₩24 million, the equivalent monetary amount for 733 shares of our common stock, to our former non-executive director, Kee Young Chung. In March 2010, our shareholders approved at the annual general meeting of shareholders the disbursement of a maximum of 250,000 shares of our common stock (or the equivalent monetary amount based on the market value of such shares at the time of disbursement), between September 29, 2009 and September 28, 2012, to our directors as long-term incentive performance shares over the term of their office in accordance with the performance targets set forth in the performance share agreements between us and such directors. In April 2010, we paid an aggregate of (Won)184₩184 million, the equivalent monetary amount for 3,563 shares of our common stock, to our former non-executive directors, Dam Cho and Bo Kyung Byun. In November 2010, we paid (Won)110₩110 million, the equivalent monetary amount for 2,149 shares of our common stock, to our former non-executive director, Chee Joong Kim. In January 2011, we paid (Won)133₩133 million, the equivalent monetary amount for 2,323 shares of our common stock, to our former non-executive director, Chan Soo Kang. In April 2011, we paid an aggregate of (Won)229₩229 million, the equivalent monetary amount for 4,056 shares of our common stock, to our former non-executive directors, Suk Sig Lim and Jacques Kemp. In April 2013, we paid an aggregate of ₩96 million, the equivalent monetary amount for 2,543 shares of our common stock, to our former non-executive director, Sang Moon Ham. Future disbursements of such shares or equivalent monetary amount will be made to oursuch directors upon the completion of their terms based on their performance. In accordance with the best practice guidelines for outside directors of banking institutions announced by the Korea Federation of Banks in January 2010, we have since not entered into any performance share agreements with our non-executive directors.
We have also entered into performance share agreements with certain of our executive officers and senior management who are not directors, pursuant to which we may grant shares of our common stock (or the equivalent monetary amount based on the market value of such shares at the time of the grant) within specified periods as long-term incentive performance shares in accordance with pre-determined performance targets.
We expect that further actual disbursements under the performance share agreements with our directors and senior management and directors other than non-executive directors will generally be in the form of cash disbursements of equivalent monetary amounts based on the market value of our shares at such time.
| Item 7. | MAJOR |
| Item | Major |
The following table presents information regarding the beneficial ownership of our shares at December 31, 20112013 by each person or entity known to us to own beneficially more than 5% of our issued and outstanding shares.
Except as otherwise indicated, each stockholder identified by name has:
sole voting and investment power with respect to its shares; and
record and beneficial ownership with respect to its shares.
Beneficial Owner | Number of Shares of Common Stock | Percentage of Total Outstanding Shares of Common Stock (%) (1) | ||||||
Citibank N.A. (2) | 33,653,277 | 8.71 | % | |||||
Korean National Pension Service (3) | 26,510,171 | 6.86 | % | |||||
ING Bank N.V. | 19,401,044 | 5.02 | % | |||||
Beneficial Owner | Number of Shares of Common Stock | Percentage of Total Outstanding Shares of Common Stock (%) (1) | ||||||
Korean National Pension Service | 38,476,974 | 9.96 | % | |||||
Bank of New York Mellon (2) | 32,327,550 | 8.37 | % | |||||
| (1) | Calculated based on 386,351,693 shares of our common stock outstanding as of December 31, |
| (2) | As depositary bank. |
|
Other than as set forth above, no other person or entity known by us to be acting in concert, directly or indirectly, jointly or separately, owned 5.0% or more of the issued shares of our common stock or exercised control or could exercise control over us as of December 31, 2011.2013. None of our major stockholders has different voting rights from our other stockholders.
| Item | Related Party Transactions |
As of December 31, 2011,2013, we had an aggregate of (Won)5,936₩4,771 million in loans outstanding to our executive officers and directors and Kookmin Bank’s executive officers and directors. In addition, as of such date, we had loans outstanding to various companies whose directors or executive officers were serving concurrently as our directors or executive officers. See Note 4243 of the notes to our consolidated financial statements.statements included elsewhere in this annual report. All of these loans were made in the ordinary course of business, on substantially the same terms, including interest rate and collateral, as those prevailing at the time for comparable transactions with other persons and did not involve more than the normal risk of collectibility or present other unfavorable features.
None of our directors or officers have or had any interest in any transactions effected by us that are or were unusual in their nature or conditions or significant to our business which were effected during the current or immediately preceding year or were effected during an earlier year and remain in any respect outstanding or unperformed.
In December 2002, we formally extended our strategic alliance agreement with ING Bank N.V., replacing its prior investment agreement with H&CB. In August 2003, our board approved and ratified an amended and restated strategic alliance agreement with ING Bank N.V. As a result:
we are required to cause one nominee of ING Bank N.V. to be appointed as a non-executive director so long as ING Groep N.V. and its subsidiaries maintain a minimum shareholding in us as defined in the
|
the exclusive alliance with respect to our bancassurance business was revised to a non-exclusive, commercial relationship-based alliance;
ING Groep N.V. is required to maintain beneficial ownership of no less than 12,716,691 shares of our common stock, subject to adjustment for any share consolidations or share splits or, in the event of a merger with another entity, as adjusted accordingly pursuant to the merger ratio for the merger; and
each of the parties agreed to maintain its level of investment in ING Life Insurance Company, Korea Ltd. (which was 20% owned by us and 80% owned by ING Insurance International B.V.) and KB Asset Management Co., Ltd. (which was 80% owned by us and 20% by ING Insurance International B.V.) until August 29, 2006.
In August 2003, we amended and restated our joint venture agreement with ING Insurance International B.V. and ING Life Insurance Company, Korea, Ltd. This agreement established the terms of the joint venture between us and ING Insurance International with respect to ING Life Insurance Company, Korea. In December 2008, we sold all of our remaining stake in ING Life Insurance Company, Korea and our joint venture agreement with ING Insurance International and ING Life Insurance Company, Korea was terminated.
In August 2003, we also amended certain provisions in our joint venture agreement with ING Insurance International B.V. and KB Asset Management Co., Ltd. This agreement expanded and established the terms of the joint venture between us and ING Insurance International with respect to KB Asset Management.
In April 2004, we established a new wholly-owned insurance subsidiary, KB Life Insurance Co., Ltd., to which we contributed the acquired assets and liabilities of Hanil Life Insurance. KB Life focuses on bancassurance, and offers life insurance and wealth management products primarily through our branch network. ING Insurance International B.V. purchased a 49% interest in KB Life in January 2005 and subsequently assigned such interest to its affiliate, ING Insurance International II B.V., in December 2011.
In April 2008, Kookmin Bank and KB Asset Management Co., Ltd. entered into an agreement with ING Bank N.V. and ING Insurance International B.V. related to the planned establishment of KB Financial Group through a comprehensive stock transfer. Pursuant to this agreement and subject to certain conditions, ING Bank and ING Insurance International approved and agreed to support the stock transfer. The parties also agreed, among others, that the stock transfer shall not constitute a change of control or termination event for purposes of various agreements in effect between the parties and that Kookmin Bank and ING Bank agree to effect an assignment of Kookmin Bank’s rights and obligations under the amended and restated strategic alliance agreement to KB Financial Group. Such assignment was effected in September 2008 pursuant to an assignment and assumption agreement among Kookmin Bank, ING Bank and KB Financial Group.
In connection with the “comprehensive stock transfer” under Korean law pursuant to which we were established, ING Insurance International B.V., which previously held a 20% equity interest in KB Asset Management Co., Ltd. transferred all of its shares of KB Asset Management common stock to us in September 2008 and in return received 1,290,815 shares of our common stock in accordance with a specified stock transfer ratio.
| Item | Interests of Experts and Counsel |
Not Applicable
| Item 8. | FINANCIAL INFORMATION |
| Item | Consolidated Statements and Other Financial Information |
See “Item 18. Financial Statements” and pages F-1 through F-186.F-182.
Legal Proceedings
Excluding the legal proceedings discussed below, we and our subsidiaries are not a party to any legal or administrative proceedings and no proceedings are known by any of us or our subsidiaries to be contemplated by governmental authorities or third parties, which, if adversely determined, may have a material adverse effect on our consolidated financial condition or results of operations.
In August 2006, the Korean government filed a lawsuit seeking (Won)321 billion in damages for excessive fees paid for lottery operations against Kookmin Bank, Ernst & Young Han Young, Korea Lottery Service Inc. and Kookmin Bank’s and their relevant employees. In April 2009, the Seoul Central District Court dismissed the government’s claim. In May 2009, the government appealed the case to the Seoul High Court, which dismissed the appeal in September 2010. In October 2010, the government appealed the case to the Supreme Court of Korea, where it is currently pending.
In April 2004, the Lottery Commission of the Korean government revised the fee rate for fees payable to Korea Lottery Service Inc. by reducing it from 9.523% to 3.144%. Korea Lottery Service Inc. filed a lawsuit with the Seoul Central District Court claiming that such reduction by the Lottery Commission was invalid and demanding the payment of approximately (Won)20 billion of unpaid fees by Kookmin Bank, which is the difference between the fees payable by Kookmin Bank under the previous rate and the revised rate in respect of fees incurred in May 2004. In December 2006, the Seoul Central District Court ruled in favor of Korea Lottery Service Inc., and Kookmin Bank appealed to the Seoul High Court in January 2007. In May 2008, the Seoul High Court ruled in favor of Korea Lottery Service Inc. in part but reduced the amount of damages to (Won)4.5 billion. In June 2008, both Kookmin Bank and Korea Lottery Service Inc. appealed the case to the Supreme Court of Korea, which dismissed both appeals in June 2011.
In addition, in January 2007, Korea Lottery Service Inc. filed another lawsuit with the Seoul Central District Court seeking payment of unpaid fees in the aggregate amount of (Won)446 billion, which is the difference between the fees payable by Kookmin Bank under the previous rate and the revised rate, for fees incurred from June 2004 to December 2006. In July 2008, the Seoul Central District Court ruled in favor of Korea Lottery Service Inc. in part but reduced the amount of damages to (Won)123 billion. In August 2008, both Kookmin Bank and Korea Lottery Service Inc. appealed the case to the Seoul High Court, which dismissed both appeals in October 2011. Neither side appealed the case.
Furthermore, in June 2008, Korea Lottery Service Inc. filed another lawsuit with the Seoul Central District Court seeking payment of unpaid fees in the aggregate amount of (Won)134 billion, which is the difference between the fees payable by Kookmin Bank under the previous rate and the revised rate, for fees incurred from January to December 2007.In August 2011, the court ruled in favor of Korea Lottery Service Inc. in part but reduced the amount of damages to (Won)37 billion. Neither side appealed the case.
In April 2008, the Korea Fair Trade Commission ordered Kookmin Bank to stop alleged price-fixing practices in connection with direct deposit fees, and to pay administrative fines in the amount of (Won)537 million for such activities. In July 2008, Kookmin Bank appealed the Korea Fair Trade Commission’s decision to the Seoul High Court, which dismissed Kookmin Bank’s appeal in May 2009. In June 2009, Kookmin Bank appealed this case to the Supreme Court of Korea, which ruled in favor of Kookmin Bank in July 2011.
During the first half of 2007, the National Tax Service of Korea completed a tax audit in respect of Kookmin Bank for the fiscal years 2002, 2003, 2004 and 2005, as a result of which Kookmin Bank was assessed
(Won)190 ₩190 billion (including residence tax) for tax deficiencies. In addition, during the second half of 2007, the National Tax Service of Korea assessed additional income taxes for prior years amounting to (Won)292₩292 billion (including residence tax) for tax deficiencies. Kookmin Bank paid the entire amount of such additional assessments in 2007, but filed an appeal with the National Tax Tribunal with respect to tax assessments made in 2007 amounting to (Won)482₩482 billion (including residence tax), which dismissed the appeal in March 2010. In June 2010, Kookmin Bank filed an appeal with the Seoul Administrative Court, which ruled in favor of Kookmin Bank on April 1, 2011. On April 19, 2011, the National Tax Service of Korea appealed this case to the Seoul High Court, which ruled in favor of Kookmin Bank on January 12, 2012. On January 30, 2012, the National Tax Service of Korea appealed this case to the Supreme Court, where it is currently pending.
Since November 2008, certain of Kookmin Bank’s customers have filed lawsuits against it in connection with its sales of foreign currency derivatives products known as “KIKO” (which stands for “knock-in knock-out”), which are intended to operate as hedging instruments against fluctuations in the exchange rate between the Won and the U.S. dollar. Due to the significant depreciation of the Won against the U.S. dollar in 2008 and 2009, customers who have purchased KIKO products from Kookmin Bank are required to make large payments to it. SevenThirteen companies filed six lawsuits against Kookmin Bank alleging that the contracts under which the relevant KIKO products were sold should be invalidated and that Kookmin Bank should return payments received thereunder. FourFive of the lawsuits were dismissed and not appealed. In two of the lawsuits, rulings were issued in favor of Kookmin Bank by the Seoul High Court in February 2013 and January 2014. The aggregate amount of the twosix remaining claims, as of January 31, 2012,February 28, 2014, was approximately (Won)6,545 million and may increase in the event of future depreciation of the Won against U.S. dollar.₩13.4 billion. Additional lawsuits, as well as motions for preliminary injunctions, may be filed against Kookmin Bank with respect to KIKO products, and the final outcome of such litigation remains uncertain.
Since November 2008, a number of Kookmin Bank’s customers have filed 11 lawsuits against it in connection with its sales of offshore funds and currency future contracts. The customers alleged that the losses were caused by Kookmin Bank’s negligence in inadequately explaining the risks of such investment to its customers and in structuring funds with inappropriate currency future hedging features. Nine of the lawsuits in which the plaintiffs claimed damages of (Won)6,294 million in aggregate were dismissed and not appealed. One of the lawsuits in which the plaintiffs claimed damages of (Won)221 million in aggregate was dismissed by the Seoul Central District Court in July 2009 and the plaintiffs appealed to the Seoul High Court in August 2009. However, the parties were ordered to undergo mediation and the case was settled with the amount of damages reduced to (Won)44 million.The one remaining lawsuit in which the plaintiffs claimed damages of (Won)199 million in aggregate was ruled in favor of Kookmin Bank in part by the Seoul Central District Court in June 2011 and both Kookmin Bank and the plaintiffs appealed this case to the Seoul High Court. In February 2012, the Seoul High Court ruled in favor of Kookmin Bank in part but neither side appealed the case. Additional lawsuits may be filed against Kookmin Bank with respect to its sales of such products, and the final outcome of such litigation remains uncertain.
In August 2009, six purchasers that had entered into shipbuilding contracts with a Korean shipbuilding company filed a lawsuit in the United Kingdom against Kookmin Bank demanding repayment of US$46.6 million of pre-delivery installments paid by the purchasers to the shipbuilding company under such contracts. In connection with such contracts, in August 2007, Kookmin Bank had issued to each of the six purchasers advance payment bonds, which effectively operate as refund guarantees on behalf of the shipbuilding company to cover its obligations to return pre-delivery installments paid by such purchasers in the event of, among other things, defaults by such shipbuilding company under the shipbuilding contracts. In January 2009, the shipbuilding company became subject to a debt workout procedure under the Corporate Restructuring Promotion Act. The six purchasers claimed that such an event constituted a default under each of the shipbuilding contracts and demanded repayment under the terms of the advance payment bonds of the installments paid to the shipbuilding company. In October 2009, the High Court of Justice, Queen’s Bench Division, Commercial Court ruled in favor of the six purchasers. Kookmin Bank appealed to the Court of Appeal, Queen’s Bench Division, Commercial Court, which overturned the lower court’s ruling in May 2010. The six purchasers appealed to the Supreme Court of the United Kingdom, which ruled in favor of the six purchasers in November 2011.
In July 2010, the Korean government filed four lawsuits against Kookmin Bank in connection with its management of the National Housing Fund, claiming damages of (Won)120 billion in aggregate. The government alleged that certain loan losses incurred by the National Housing Fund were due to Kookmin Bank’s breach of its duty of care as a manager of the National Housing Fund. In August and November 2011, three of the lawsuits were dismissed by the Seoul Central District Court and not appealed. In the one remaining lawsuit, the Seoul Central District Court ruled in favor of the Korean government in part but reduced the amount of damages from (Won)689 million to (Won)22 million. Neither side appealed the case.
In January 2008, the Korea Fair Trade Commission instituted certain amendments to standard loan policy conditions for mortgage loan agreements to require banks to be responsible for the payment of mortgage registration expenses when issuing mortgage loans. Subsequently, the Korea Federation of Banks and 16 banks, including Kookmin Bank, filed a lawsuit against the Korea Fair Trade Commission to prevent the implementation of such amendments. In August 2010, the Supreme Court ruled in favor of the Korea Fair Trade Commission. Since such ruling in August 2010, a numbercertain of Kookmin Bank’s customers have filed 14132 lawsuits against Kookmin Bank, as of February 28, 2014, alleging that it should return the mortgage registration expenses paid by such customers under mortgage loan agreements that did not reflect the amendments instituted by the Korea Fair Trade Commission in January 2008. As of February 28, 2014, 84 such lawsuits had been concluded, 33 lawsuits were pending in the relevant trial courts and 15 lawsuits were appealed and pending in the appellate
court. The aggregate amount of claimed damages in the 1448 remaining lawsuits, is (Won)681 million.as of February 28, 2014, was approximately ₩5 billion. Additional lawsuits may be filed against Kookmin Bank with respect to its mortgage loans, and the final outcome of such litigation remains uncertain.
In July 2010, Fairfield Sentry Limited, or Fairfield, which is currently in liquidation and whose assets were directly or indirectly invested with Bernard L. Madoff Investment Securities LLC, or BLMIS, filed a lawsuit in the Supreme Court of the State of New York against Kookmin Bank, which acted as a nominee for its clients who invested in Fairfield. Fairfield seeks restitution of approximately US$42 million paid to Kookmin Bank in connection with share redemptions on the ground that such payments were made by mistake, based on inflated values resulting from BLMIS’ fraud. The case is currently pending at such court. Fairfield has filed similar actions against numerous other fund investors to seek recovery of redemption payments.
In May 2012, the trustee appointed for the liquidation of BLMIS filed a lawsuit against Kookmin Bank in the United States Bankruptcy Court for the Southern District of New York. The trustee seeks recovery of approximately US$42 million, which amount is alleged to be equal to the amount of funds that were redeemed from Fairfield between June 2004 and January 2006 by Kookmin Bank. The trustee alleges that Fairfield was a “feeder fund” that invested in BLMIS and redemptions from such BLMIS feeder fund are avoidable and recoverable under the U.S. Bankruptcy Code and New York law. The case is currently pending at such court. The trustee has filed similar clawback actions against numerous other institutions.
In November 2012, Kookmin Bank filed a lawsuit against the Export-Import Bank of Korea and other creditor financial institutions comprising the creditors’ committee of a Korean shipbuilding company which is a borrower of Kookmin Bank and is currently in workout. Kookmin Bank voted against extending new credit to such borrower and exercised its appraisal rights. Kookmin Bank is seeking ₩103 billion as compensation for damages and payment of the purchase price of debt held by Kookmin Bank. In November 2012, the Export-Import Bank of Korea and other creditor financial institutions of the borrower filed a counter lawsuit against Kookmin Bank seeking ₩46 billion in damages in connection with the borrower’s debt restructuring plan. The case is currently pending at the Seoul Central District Court.
Commencing in November 2013, Kookmin Bank has been subject to a number of investigations by the Financial Supervisory Service and other governmental authorities concerning alleged issues with Kookmin Bank’s internal controls and possible legal violations by Kookmin Bank and its employees.
In November 2013, Kookmin Bank filed a complaint against the former head and two former employees of its Tokyo Branch for allegedly extending illegal loans under borrowed names. The Financial Supervisory Service and the Financial Services Agency of Japan have each launched an investigation into the allegations.
The Financial Supervisory Service launched an investigation into alleged embezzlement of funds by employees at Kookmin Bank’s headquarters, who have since been suspended, through the presentation for payment of forged Korean government housing bonds.
At the request of the Financial Supervisory Service, the Seoul Central District Prosecutors’ Office commenced investigations into such alleged illegalities at Kookmin Bank.
Kookmin Bank is cooperating with the ongoing investigations by the Financial Supervisory Service and other government authorities. Each of these investigations is in its early stages and we cannot predict the outcome of such investigations. Further investigations may be launched by governmental authorities or civil claims may be filed against Kookmin Bank with respect to the alleged legal violations by Kookmin Bank and its employees.
In February 2014, the Financial Services Commission suspended the new credit card issuance and other related activities of KB Kookmin Card for three months from February to May 2014, in response to an incident
involving the misappropriation of the personal information of a large number of its customers by an employee of the Korea Credit Bureau in the first half of 2013. Specifically, during such suspension period, KB Kookmin Card will be prohibited from engaging in the following activities:
adding new subscribers for credit cards, prepaid cards and debit cards or issuing such types of cards (except as permitted by the chairman of the Financial Services Commission for public policy purposes);
providing new or additional credit lines to credit card customers; and
providing new services through mail order or telemarketing channels or related to travel or insurance products.
In connection with the misappropriation incident, as of March 31, 2014, certain of KB Kookmin Card’s customers have filed 42 lawsuits against KB Kookmin Card with the aggregate amount of claimed damages amounting to approximately ₩35 billion. The final outcome of such lawsuits remains uncertain. In addition, KB Kookmin Card could become subject to additional litigation and regulatory sanctions, and may also incur significant costs relating to the issuance of replacement cards for customers and the compensation of customers for losses incurred as a result of the fraudulent use of the misappropriated personal information.
Dividends
Dividends must be approved by the stockholders at the annual general meeting of stockholders. Cash dividends may be paid out of retained earnings that have not been appropriated to statutory reserves. See “Item 10B.10.B. Memorandum and Articles of Association—Description of Capital Stock—Dividends and Other Distributions.”
The table below sets forth, for the periods indicated, the dividend per share of common stock and the total amount of dividends declared and paid by us in respect of the years ended December 31, 2010, 2011, 2012 and 2011.2013. The dividends set out for each of the years below were paid within 30 days after our annual stockholders meeting, which is held no later than March of the following year.
Fiscal Year | Dividends per Common share (1) | Dividends per Preferred Share | Total Amount of Cash Dividends Paid | Dividends per Common Share (1) | Dividends per Preferred Share | Total Amount of Cash Dividends Paid | ||||||||||||||||||||||||||||||||||
| (in millions of Won) | (in millions of Won) | |||||||||||||||||||||||||||||||||||||||
2010 (2) | (Won) | 120 | US$ | 0.11 | — | — | (Won) | 41,163 | ₩ | 120 | US$ | 0.11 | — | — | ₩ | 41,163 | ||||||||||||||||||||||||
2011 (3) | 720 | 0.62 | — | — | 278,173 | 720 | 0.62 | — | — | 278,173 | ||||||||||||||||||||||||||||||
2012 (4) | 600 | 0.56 | — | — | 231,811 | |||||||||||||||||||||||||||||||||||
2013 (5) | 500 | 0.47 | — | — | 193,176 | |||||||||||||||||||||||||||||||||||
| (1) | Won amounts are expressed in U.S. dollars at the noon buying rate in effect at the end of the relevant periods as quoted by the Federal Reserve Bank of New York in the United States. |
On February 10, 2011, our board of directors passed a board resolution recommending a cash dividend of |
On February 9, 2012, our board of directors passed a board resolution recommending a cash dividend of |
| (4) | On February 7, 2013, our board of directors passed a board resolution recommending a cash dividend of ₩600 per common share (before dividend tax), representing 12.0% of the par value of each share, for the fiscal year ended December 31, 2012. This resolution was approved and ratified by our stockholders on March 22, 2013. |
| (5) | On February 7, 2014, our board of directors passed a board resolution recommending a cash dividend of ₩500 per common share (before dividend tax), representing 10.0% of the par value of each share, for the fiscal year ended December 31, 2013. This resolution was approved and ratified by our stockholders on March 28, 2014. |
Future dividends will depend upon our revenues, cash flow, financial condition and other factors. As an owner of ADSs, you will be entitled to receive dividends payable in respect of the shares of common stock represented by such ADSs.
For a description of the tax consequences of dividends paid to our stockholders, see “Item 10E.10.E. Taxation—United States Taxation” and “—Korean Taxation—Taxation of Dividends.”
| Item | Significant Changes |
Not Applicable.
| Item 9. | THE OFFER AND LISTING |
| Item | Offering and Listing Details |
Market Price Information
The principal trading market for our common stock is the KRX KOSPI Market. Our common stock has been listed on the KRX KOSPI Market since October 10, 2008, and the ADSs have been listed on the New York Stock Exchange under the symbol “KB” since September 29, 2008. The ADSs are identified by the CUSIP number 48241A105.
Kookmin Bank’s common stock was listed on the KRX KOSPI Market on November 9, 2001, and was suspended from trading from September 25, 2008 and de-listed on October 10, 2008 in connection with the comprehensive stock transfer pursuant to which we were established. Kookmin Bank ADSs were listed on the New York Stock Exchange from November 1, 2001 to September 26, 2008. The Kookmin Bank ADSs were identified by the CUSIP number 50049M109.
The table below sets forth, for the periods indicated, the high and low closing prices and the average daily volume of trading activity on the KRX KOSPI Market for Kookmin Bank common stock with respect to the periods up to and including the third quarter of 2008 and for our common stock with respect to the subsequent periods, and the high and low closing prices and the average daily volume of trading activity on the New York Stock Exchange for Kookmin Bank ADSs with respect to the periods up to and including the third quarter of 2008 and for our ADSs with respect to the subsequent periods.
| KRX KOSPI Market(1) | New York Stock Exchange(2) | KRX KOSPI Market(1) | New York Stock Exchange(2) | |||||||||||||||||||||||||||||||||||||||||||||
| Closing Price Per Common Stock | Average Daily Trading Volume (in thousands of shares) | Closing Price Per ADS | Average Daily Trading Volume (in thousands of shares) | Closing Price Per Common Stock | Average Daily Trading Volume (in thousands of shares) | Closing Price Per ADS | Average Daily Trading Volume (in thousands of shares) | |||||||||||||||||||||||||||||||||||||||||
| High | Low | High | Low | High | Low | High | Low | |||||||||||||||||||||||||||||||||||||||||
2007 | (Won) | 89,500 | (Won) | 61,600 | 1,527.1 | US$ | 96.57 | US$ | 64.27 | 523.8 | ||||||||||||||||||||||||||||||||||||||
2008 | 71,500 | 22,800 | 2,902.4 | 71.26 | 14.70 | 780.0 | ||||||||||||||||||||||||||||||||||||||||||
2009 | 63,200 | 26,850 | 2,390.1 | 55.07 | 16.82 | 533.3 | ₩ | 63,200 | ₩ | 26,850 | 2,390.1 | US$ | 55.07 | US$ | 16.82 | 533.3 | ||||||||||||||||||||||||||||||||
2010 | 60,400 | 45,900 | 1,921.9 | 52.89 | 37.81 | 326.8 | 60,400 | 45,900 | 1,921.9 | 52.89 | 37.81 | 326.8 | ||||||||||||||||||||||||||||||||||||
2011 | 62,100 | 34,600 | 2,385.3 | 55.00 | 29.64 | 202.3 | ||||||||||||||||||||||||||||||||||||||||||
2012 | 45,000 | 33,000 | 1,342.3 | 40.63 | 28.84 | 150.1 | ||||||||||||||||||||||||||||||||||||||||||
First Quarter | 59,400 | 45,900 | 1,755.2 | 52.62 | 38.69 | 343.6 | 45,000 | 35,750 | 1,734.4 | 40.63 | 30.98 | 179.9 | ||||||||||||||||||||||||||||||||||||
Second Quarter | 57,500 | 46,750 | 2,004.3 | 51.88 | 37.81 | 388.1 | 43,500 | 35,300 | 1,296.3 | 38.21 | 29.90 | 143.6 | ||||||||||||||||||||||||||||||||||||
Third Quarter | 52,500 | 46,550 | 1,993.3 | 45.46 | 38.11 | 320.4 | 41,650 | 33,000 | 1,284.2 | 37.07 | 28.84 | 131.0 | ||||||||||||||||||||||||||||||||||||
Fourth Quarter | 60,400 | 49,950 | 1,930.4 | 52.89 | 43.04 | 256.7 | 39,250 | 34,350 | 1,050.8 | 36.09 | 31.87 | 145.5 | ||||||||||||||||||||||||||||||||||||
2011 | 62,100 | 34,600 | 2,385.3 | 55.00 | 29.64 | 202.3 | ||||||||||||||||||||||||||||||||||||||||||
2013 | 43,950 | 32,600 | 1,236.0 | 41.26 | 28.85 | 144.3 | ||||||||||||||||||||||||||||||||||||||||||
First Quarter | 62,100 | 54,000 | 2,055.1 | 55.00 | 48.02 | 212.5 | 40,750 | 36,150 | 1,629.3 | 37.45 | 32.16 | 188.4 | ||||||||||||||||||||||||||||||||||||
Second Quarter | 58,500 | 48,400 | 2,093.5 | 53.72 | 44.92 | 151.3 | 37,600 | 33,650 | 1,093.7 | 33.46 | 29.17 | 147.7 | ||||||||||||||||||||||||||||||||||||
Third Quarter | 54,600 | 34,600 | 3,459.7 | 51.87 | 29.98 | 246.9 | 38,800 | 32,600 | 1,155.2 | 35.72 | 28.85 | 124.0 | ||||||||||||||||||||||||||||||||||||
Fourth Quarter | 45,000 | 35,650 | 1,912.8 | 41.28 | 29.64 | 197.9 | 43,950 | 37,700 | 1,072.2 | 41.26 | 35.38 | 122.0 | ||||||||||||||||||||||||||||||||||||
October | 45,000 | 38,600 | 2,261.4 | 41.28 | 31.38 | 200.0 | 43,950 | 37,700 | 1,466.0 | 41.26 | 35.38 | 110.1 | ||||||||||||||||||||||||||||||||||||
November | 42,700 | 36,150 | 1,795.0 | 38.12 | 31.23 | 209.7 | 41,150 | 38,400 | 894.1 | 38.65 | 36.21 | 137.5 | ||||||||||||||||||||||||||||||||||||
December | 39,900 | 35,650 | 1,704.1 | 34.92 | 29.64 | 183.9 | 42,250 | 38,800 | 845.9 | 40.51 | 36.79 | 120.3 | ||||||||||||||||||||||||||||||||||||
2012 (through April 27) | 45,000 | 35,750 | 1,670.1 | 40.63 | 30.98 | 169.9 | ||||||||||||||||||||||||||||||||||||||||||
January | 42,800 | 35,750 | 1,859.9 | 38.08 | 30.98 | 188.4 | ||||||||||||||||||||||||||||||||||||||||||
February | 45,000 | 40,650 | 1,757.5 | 40.63 | 36.01 | 202.6 | ||||||||||||||||||||||||||||||||||||||||||
March | 44,100 | 40,350 | 1,591.7 | 38.90 | 35.30 | 146.0 | ||||||||||||||||||||||||||||||||||||||||||
April (through April 27) | 43,500 | 40,000 | 1,460.5 | 38.21 | 35.25 | 143.7 | ||||||||||||||||||||||||||||||||||||||||||
2014 (through April 28) First Quarter January February March April (through April 28) KRX KOSPI Market(1) New York Stock Exchange(2) Closing Price Per
Common Stock Average Daily
Trading
Volume (in
thousands of
shares) Closing Price Per ADS Average Daily
Trading
Volume (in
thousands of
shares) High Low High Low 42,100 35,050 1,157.4 39.33 32.34 130.7 42,100 35,900 1,215.4 39.33 32.34 143.7 42,100 35,900 1,257.4 39.33 33.01 171.2 39,900 36,050 1,238.7 36.90 32.34 161.1 40,350 36,000 1,153.1 37.86 33.50 100.5 37,800 35,050 980.6 36.26 34.02 88.9
Source: Global Stock Information Financial Network and KRX KOSPI Market
| (1) | Trading of Kookmin Bank common shares on the KRX KOSPI Market commenced on November 9, 2001 and ended on September 24, 2008. Trading of our common shares on the KRX KOSPI Market commenced on October 10, 2008. |
| (2) | Trading of Kookmin Bank ADSs on the New York Stock Exchange commenced on November 1, 2001 and ended on September 26, 2008. Trading of our ADSs on the New York Stock Exchange commenced on September 29, 2008. Each ADS represents the right to receive one share. |
| Item | Plan of Distribution |
Not Applicable.applicable.
| Item | Markets |
The KRX KOSPI Market
The KRX KOSPI Market (formerly known as the Stock Market Division of the Korea Exchange) began its operations in 1956. It has a single trading floor located in Seoul. The KRX KOSPI Market is a membership organization consisting of most of the Korean financial investment companies with a dealing and/or brokerage license and some Korean branches of foreign financial investment companies with such license.
As of December 31, 2011,2013, the aggregate market value of equity securities listed on the KRX KOSPI Market was approximately (Won)1,042₩1,186 trillion. The average daily trading volume of equity securities for 20112013 was approximately 354328 million shares with anand the average daily transaction value of (Won)6,863was ₩3,993 billion.
The KRX KOSPI Market has the power in some circumstances to suspend trading in the shares of a given company or to de-list a security pursuant to the Listing Regulation of the KRX KOSPI Market. The KRX KOSPI Market also restricts share price movements. All listed companies are required to file accounting reports annually, semiannually and quarterly and to release immediately all information that may affect trading in a security.
The KRX KOSPI Market publishes the KOSPI, which is an index of all equity securities listed on the KRX KOSPI Market, every ten seconds. On January 1, 1983, the method of computing KOSPI was changed from the Dow Jones method to the aggregate value method. In the new method, the market capitalizations of all listed companies are aggregated, subject to certain adjustments, and this aggregate is expressed as a percentage of the aggregate market capitalization of all listed companies as of the base date, January 4, 1980.
The following table sets out movements in KOSPI:
| Opening | High | Low | Closing | Opening | High | Low | Closing | |||||||||||||||||||||||||
1982 | 123.60 | 134.48 | 105.99 | 128.99 | ||||||||||||||||||||||||||||
1983 | 122.52 | 134.46 | 115.59 | 121.21 | ||||||||||||||||||||||||||||
1984 | 115.25 | 142.46 | 115.25 | 142.46 | 115.25 | 142.46 | 115.25 | 142.46 | ||||||||||||||||||||||||
1985 | 139.53 | 163.37 | 131.40 | 163.37 | 139.53 | 163.37 | 131.40 | 163.37 | ||||||||||||||||||||||||
1986 | 161.40 | 279.67 | 153.85 | 272.61 | 161.40 | 279.67 | 153.85 | 272.61 | ||||||||||||||||||||||||
1987 | 264.82 | 525.11 | 264.82 | 525.11 | 264.82 | 525.11 | 264.82 | 525.11 | ||||||||||||||||||||||||
1988 | 532.04 | 922.56 | 527.89 | 907.20 | 532.04 | 922.56 | 527.89 | 907.20 | ||||||||||||||||||||||||
1989 | 919.61 | 1,007.77 | 844.75 | 909.72 | 919.61 | 1,007.77 | 844.75 | 909.72 | ||||||||||||||||||||||||
1990 | 908.59 | 928.82 | 566.27 | 696.11 | 908.59 | 928.82 | 566.27 | 696.11 | ||||||||||||||||||||||||
1991 | 679.75 | 763.10 | 586.51 | 610.92 | 679.75 | 763.10 | 586.51 | 610.92 | ||||||||||||||||||||||||
1992 | 624.23 | 691.48 | 459.07 | 678.44 | 624.23 | 691.48 | 459.07 | 678.44 | ||||||||||||||||||||||||
1993 | 697.41 | 874.10 | 605.93 | 866.18 | 697.41 | 874.10 | 605.93 | 866.18 | ||||||||||||||||||||||||
1994 | 879.32 | 1,138.75 | 855.37 | 1,027.37 | 879.32 | 1,138.75 | 855.37 | 1,027.37 | ||||||||||||||||||||||||
1995 | 1,013.57 | 1,016.77 | 847.09 | 882.94 | 1,013.57 | 1,016.77 | 847.09 | 882.94 | ||||||||||||||||||||||||
1996 | 888.85 | 986.84 | 651.22 | 651.22 | 888.85 | 986.84 | 651.22 | 651.22 | ||||||||||||||||||||||||
1997 | 653.79 | 792.29 | 350.68 | 376.31 | 653.79 | 792.29 | 350.68 | 376.31 | ||||||||||||||||||||||||
1998 | 385.49 | 579.86 | 280.00 | 562.46 | 385.49 | 579.86 | 280.00 | 562.46 | ||||||||||||||||||||||||
1999 | 587.57 | 1,028.07 | 498.42 | 1,028.07 | 587.57 | 1,028.07 | 498.42 | 1,028.07 | ||||||||||||||||||||||||
2000 | 1,059.04 | 1,059.04 | 500.60 | 504.62 | 1,059.04 | 1,059.04 | 500.60 | 504.62 | ||||||||||||||||||||||||
2001 | 520.95 | 704.50 | 468.76 | 693.70 | 520.95 | 704.50 | 468.76 | 693.70 | ||||||||||||||||||||||||
2002 | 724.95 | 937.61 | 584.04 | 627.55 | 724.95 | 937.61 | 584.04 | 627.55 | ||||||||||||||||||||||||
2003 | 635.17 | 822.16 | 515.24 | 810.71 | 635.17 | 822.16 | 515.24 | 810.71 | ||||||||||||||||||||||||
2004 | 821.26 | 936.06 | 719.59 | 895.92 | 821.26 | 936.06 | 719.59 | 895.92 | ||||||||||||||||||||||||
2005 | 893.71 | 1,379.37 | 870.84 | 1,379.37 | 893.71 | 1,379.37 | 870.84 | 1,379.37 | ||||||||||||||||||||||||
2006 | 1,389.27 | 1,464.70 | 1,203.86 | 1,434.46 | 1,389.27 | 1,464.70 | 1,203.86 | 1,434.46 | ||||||||||||||||||||||||
2007 | 1,435.26 | 2,064.85 | 1,355.79 | 1,897.13 | 1,435.26 | 2,064.85 | 1,355.79 | 1,897.13 | ||||||||||||||||||||||||
2008 | 1,853.45 | 1,888.88 | 938.75 | 1,124.47 | 1,853.45 | 1,888.88 | 938.75 | 1,124.47 | ||||||||||||||||||||||||
2009 | 1,157.40 | 1,723.17 | 992.69 | 1,682.77 | 1,157.40 | 1,723.17 | 992.69 | 1,682.77 | ||||||||||||||||||||||||
2010 | 1,696.14 | 2,052.97 | 1,548.78 | 2,051.00 | 1,696.14 | 2,052.97 | 1,548.78 | 2,051.00 | ||||||||||||||||||||||||
2011 | 2,070.08 | 2,231.74 | 1,644.11 | 1,825.74 | 2,070.08 | 2,228.96 | 1,652.71 | 1,825.74 | ||||||||||||||||||||||||
2012 (through April 27) | 1,826.37 | 2,049.28 | 1,826.37 | 1,975.35 | ||||||||||||||||||||||||||||
2012 | 1,826.37 | 2,049.28 | 1,769.31 | 1,997.05 | ||||||||||||||||||||||||||||
2013 | 2,031.10 | 2,059.58 | 1,780.63 | 2,011.34 | ||||||||||||||||||||||||||||
2014 (through April 28) | 1,967.19 | 2,008.61 | 1,886.85 | 1,969.26 | ||||||||||||||||||||||||||||
Source: The KRX KOSPI Market
Shares are quoted “ex-dividend” on the first trading day of the relevant company’s accounting period. Since the calendar year is the accounting period for the majority of listed companies, this may account for the drop in KOSPI between its closing level at the end of one calendar year and its opening level at the beginning of the following calendar year.
With certain exceptions, principally to take account of a share being quoted “ex-dividend” and “ex-rights,” permitted upward and downward movements in share prices of any category of shares on any day are limited under the rules of the KRX KOSPI Market to 15% of the previous day’s closing price of the shares, rounded down as set out below:
Previous day’s closing price | Rounded Down to | |||
Less than 5,000 | 5 | |||
5,000 to less than 10,000 | 10 | |||
10,000 to less than 50,000 | 50 | |||
50,000 to less than 100,000 | 100 | |||
100,000 to less than 500,000 | 500 | |||
500,000 or more | 1,000 | |||
As a consequence, if a particular closing price is the same as the price set by the fluctuation limit, the closing price may not reflect the price at which persons would have been prepared, or would be prepared to continue, if so permitted, to buy and sell shares. Orders are executed on an auction system with priority rules to deal with competing bids and offers.
Due to the deregulation of restrictions on brokerage commission rates, the brokerage commission rate on equity securities transactions may be determined by the parties, subject to commission schedules being filed with the KRX KOSPI Market by the financial investment companies with a brokerage license. In addition, a securities transaction tax will generally be imposed on the transfer of shares or certain securities representing rights to subscribe for shares. An agriculture and fishery special surtax of 0.15% of the sales prices will also be imposed on transfer of these shares and securities on the KRX KOSPI Market. See “Item 10E.10.E. Taxation—Korean Taxation.”
The following table sets forth the number of companies listed on the KRX KOSPI Market, the corresponding total market capitalization at the end of the periods indicated and the average daily trading volume for those periods:
| Market Capitalization on the Last Day of Each Period | Average Daily Trading Volume, Value | Market Capitalization on the Last Day of Each Period | Average Daily Trading Volume, Value | |||||||||||||||||||||||||||||||||||||||||||||
Year | Number of Listed Companies | (Billions of Won) | (Millions of US$) (1) | Thousands of shares | (Millions of Won) | (Thousands of US$) (1) | Number of Listed Companies | (Billions of Won) | (Millions of US$) (1) | Thousands of shares | (Millions of Won) | (Thousands of US$) (1) | ||||||||||||||||||||||||||||||||||||
1982 | 334 | (Won) | 3,001 | US$ | 4,279 | 9,704 | (Won) | 6,667 | US$ | 9,507 | ||||||||||||||||||||||||||||||||||||||
1983 | 328 | 3,490 | 4,666 | 9,325 | 5,941 | 7,944 | ||||||||||||||||||||||||||||||||||||||||||
1984 | 336 | 5,149 | 6,434 | 14,847 | 10,642 | 13,301 | 336 | ₩ | 5,149 | US$ | 6,434 | 14,847 | ₩ | 10,642 | US$ | 13,301 | ||||||||||||||||||||||||||||||||
1985 | 342 | 6,570 | 7,921 | 18,925 | 12,315 | 14,846 | 342 | 6,570 | 7,921 | 18,925 | 12,315 | 14,846 | ||||||||||||||||||||||||||||||||||||
1986 | 355 | 11,994 | 13,439 | 31,755 | 32,870 | 36,830 | 355 | 11,994 | 13,439 | 31,755 | 32,870 | 36,830 | ||||||||||||||||||||||||||||||||||||
1987 | 389 | 26,172 | 30,250 | 20,353 | 70,185 | 81,120 | 389 | 26,172 | 30,250 | 20,353 | 70,185 | 81,120 | ||||||||||||||||||||||||||||||||||||
1988 | 502 | 64,544 | 81,177 | 10,367 | 198,364 | 249,483 | 502 | 64,544 | 81,177 | 10,367 | 198,364 | 249,483 | ||||||||||||||||||||||||||||||||||||
1989 | 626 | 95,477 | 138,997 | 11,757 | 280,967 | 409,037 | 626 | 95,477 | 138,997 | 11,757 | 280,967 | 409,037 | ||||||||||||||||||||||||||||||||||||
1990 | 669 | 79,020 | 115,610 | 10,866 | 183,692 | 268,753 | 669 | 79,020 | 115,610 | 10,866 | 183,692 | 268,753 | ||||||||||||||||||||||||||||||||||||
1991 | 686 | 73,118 | 101,623 | 14,022 | 214,263 | 297,795 | 686 | 73,118 | 101,623 | 14,022 | 214,263 | 297,795 | ||||||||||||||||||||||||||||||||||||
1992 | 688 | 84,712 | 110,691 | 24,028 | 308,246 | 402,779 | 688 | 84,712 | 110,691 | 24,028 | 308,246 | 402,779 | ||||||||||||||||||||||||||||||||||||
1993 | 693 | 112,665 | 142,668 | 35,130 | 574,048 | 726,919 | 693 | 112,665 | 142,668 | 35,130 | 574,048 | 726,919 | ||||||||||||||||||||||||||||||||||||
1994 | 699 | 151,217 | 185,657 | 36,862 | 776,257 | 953,047 | 699 | 151,217 | 185,657 | 36,862 | 776,257 | 953,047 | ||||||||||||||||||||||||||||||||||||
1995 | 721 | 141,151 | 178,266 | 26,130 | 487,762 | 616,016 | 721 | 141,151 | 178,266 | 26,130 | 487,762 | 616,016 | ||||||||||||||||||||||||||||||||||||
1996 | 760 | 117,370 | 151,289 | 26,571 | 486,834 | 627,525 | 760 | 117,370 | 151,289 | 26,571 | 486,834 | 627,525 | ||||||||||||||||||||||||||||||||||||
1997 | 776 | 70,989 | 82,786 | 41,525 | 555,759 | 648,115 | 776 | 70,989 | 82,786 | 41,525 | 555,759 | 648,115 | ||||||||||||||||||||||||||||||||||||
1998 | 748 | 137,799 | 81,297 | 97,716 | 660,429 | 389,634 | 748 | 137,799 | 81,297 | 97,716 | 660,429 | 389,634 | ||||||||||||||||||||||||||||||||||||
1999 | 725 | 349,504 | 294,319 | 278,551 | 3,481,620 | 2,931,891 | 725 | 349,504 | 294,319 | 278,551 | 3,481,620 | 2,931,891 | ||||||||||||||||||||||||||||||||||||
2000 | 704 | 188,042 | 166,703 | 306,163 | 2,602,211 | 2,306,925 | 704 | 188,042 | 166,703 | 306,163 | 2,602,211 | 2,306,925 | ||||||||||||||||||||||||||||||||||||
2001 | 689 | 255,850 | 200,039 | 473,241 | 1,997,420 | 1,561,705 | 689 | 255,850 | 200,039 | 473,241 | 1,997,420 | 1,561,705 | ||||||||||||||||||||||||||||||||||||
2002 | 683 | 258,681 | 217,379 | 857,245 | 3,041,598 | 2,308,789 | 683 | 258,681 | 217,379 | 857,245 | 3,041,598 | 2,308,789 | ||||||||||||||||||||||||||||||||||||
2003 | 684 | 355,363 | 298,123 | 542,010 | 2,216,636 | 1,859,594 | 684 | 355,363 | 298,123 | 542,010 | 2,216,636 | 1,859,594 | ||||||||||||||||||||||||||||||||||||
2004 | 683 | 412,588 | 398,597 | 372,895 | 2,232,108 | 2,156,418 | 683 | 412,588 | 398,597 | 372,895 | 2,232,108 | 2,156,418 | ||||||||||||||||||||||||||||||||||||
2005 | 702 | 655,075 | 648,589 | 467,629 | 3,157,662 | 3,126,398 | 702 | 655,075 | 648,589 | 467,629 | 3,157,662 | 3,126,398 | ||||||||||||||||||||||||||||||||||||
2006 | 731 | 704,588 | 757,621 | 279,096 | 3,435,180 | 3,693,742 | 731 | 704,588 | 757,621 | 279,096 | 3,435,180 | 3,693,742 | ||||||||||||||||||||||||||||||||||||
2007 | 745 | 951,900 | 1,017,205 | 363,732 | 5,539,588 | 5,919,628 | 745 | 951,900 | 1,017,205 | 363,732 | 5,539,588 | 5,919,628 | ||||||||||||||||||||||||||||||||||||
2008 | 763 | 592,635 | 469,600 | 355,205 | 5,189,643 | 4,112,238 | 763 | 592,635 | 469,600 | 355,205 | 5,189,643 | 4,112,238 | ||||||||||||||||||||||||||||||||||||
2009 | 770 | 887,935 | 763,027 | 485,657 | 5,795,426 | 4,980,172 | 770 | 887,935 | 763,027 | 485,657 | 5,795,426 | 4,980,172 | ||||||||||||||||||||||||||||||||||||
2010 | 777 | 1,141,885 | 1,009,981 | 380,859 | 5,619,768 | 4,970,607 | 777 | 1,141,885 | 1,009,981 | 380,859 | 5,619,768 | 4,970,607 | ||||||||||||||||||||||||||||||||||||
2011 | 791 | 1,041,999 | 899,438 | 353,759 | 6,863,146 | 5,924,166 | 791 | 1,041,999 | 899,438 | 353,759 | 6,863,146 | 5,924,166 | ||||||||||||||||||||||||||||||||||||
2012 (through | 789 | 1,135,853 | 998,025 | 513,848 | 5,702,784 | 5,010,793 | ||||||||||||||||||||||||||||||||||||||||||
2012 | 784 | 1,154,294 | 1,085,638 | 486,480 | 4,823,643 | 4,536,739 | ||||||||||||||||||||||||||||||||||||||||||
2013 | 777 | 1,185,974 | 1,123,879 | 328,325 | 3,993,422 | 3,784,337 | ||||||||||||||||||||||||||||||||||||||||||
2014 (through April 28) | 770 | 1,173,236 | 1,127,028 | 232,494 | 3,710,220 | 3,564,092 | ||||||||||||||||||||||||||||||||||||||||||
Source: The KRX KOSPI Market
| (1) | Converted at the noon buying rate of the Federal Reserve Bank of New York in effect on the last business day of the period indicated. |
The Korean securities markets are principally regulated by the Financial Services Commission and the Financial Investment Services and Capital Markets Act, which replaced the Korean Securities and Exchange Act in February 2009. The Financial Investment Services and Capital Markets Act imposes restrictions on insider trading, price manipulation and deceptive action (including unfair trading), requires specified information to be made available by listed companies to investors and establishes rules regarding margin trading, proxy solicitation, takeover bids, acquisition of treasury shares and reporting requirements for stockholders holding substantial interests.
Protection of Customer’s Interest in Case of Insolvency of Financial Investment Companies with a Brokerage License
Under Korean law, the relationship between a customer and a financial investment company with a brokerage license in connection with a securities sell or buy order is deemed to be consignment and the securities acquired by a consignment agent (i.e., the financial investment company with a brokerage license) through such sell or buy order are regarded as belonging to the customer in so far as the customer and the consignment agent’s creditors are concerned. Therefore, in the event of a bankruptcy or reorganization procedure involving a financial investment company with a brokerage license, the customer of such financial investment company is entitled to the proceeds of the securities sold by such financial investment company.
When a customer places a sell order with a financial investment company with a brokerage license which is not a member of the KRX KOSPI Market, and that financial investment company places a sell order with another financial investment company with a brokerage license, which is a member of the KRX KOSPI Market, the customer is still entitled to the proceeds of the securities sold and received by the non-member company from the member company regardless of the bankruptcy or reorganization of the non-member company.
Under the Financial Investment Services and Capital Markets Act, the KRX KOSPI Market is obliged to indemnify any loss or damage incurred by a counterparty as a result of a breach by its members. If a financial investment company with a brokerage license which is a member of the KRX KOSPI Market breaches its obligation in connection with a buy order, the KRX KOSPI Market is obliged to pay the purchase price on behalf of the breaching member. Therefore, the customer can acquire the securities that have been ordered to be purchased by the breaching member.
When a customer places a buy order with a non-member company and the non-member company places a buy order with a member company, the customer has the legal right to the securities received by the non-member company from the member company because the purchased securities are regarded as belonging to the customer in so far as the customer and the non-member company’s creditors are concerned.
As the cash deposited with a financial investment company with a brokerage license is regarded as belonging to such financial investment company, which is liable to return the same at the request of its customer, the customer cannot take back deposited cash from such financial investment company if a bankruptcy or reorganization procedure is instituted against such financial investment company and, therefore, can suffer from loss or damage as a result. However, the Depositor Protection Act provides that the Korea Deposit Insurance Corporation will, upon the request of the investors, pay investors an amount equal to the full amount of cash deposited with a financial investment company with a brokerage license prior to August 1, 1998 in case of such financial investment company’s bankruptcy, liquidation, cancellation of securities business license or other insolvency events. However, this indemnification was available only until the end of 2000. From 2001, the maximum amount to be paid to each customer is limited to (Won)50₩50 million. Pursuant to the Financial Investment Services and Capital Markets Act, financial investment companies with a dealing and/or brokerage license are required to deposit the cash received from its customers to the extent the amount is not covered by the insurance with the Korea Securities Finance Corporation, a special entity established pursuant to the Financial Investment Services and Capital Markets Act. Set-off or attachment of cash deposits by such financial investment companies is prohibited. The premiums related to this insurance are paid by such financial investment companies.
Reporting Requirements for Holders of Substantial Interests
Any person whose direct or beneficial ownership of our common stock with voting rights, whether in the form of shares of common stock or ADSs, certificates representing the rights to subscribe for shares or equity-related debt securities including convertible bonds and bonds with warrants (which we refer to collectively as “Equity Securities”), together with the Equity Securities beneficially owned by certain related persons or by any person acting in concert with the person, accounts for 5% or more of the total issued and outstanding shares (plus Equity Securities of us held by such persons) is required to report the status and purpose (in terms of whether the
purpose of the shareholding is to exercise control over our management) of the holdings to the Financial Services Commission and the KRX KOSPI Market within five business days after reaching the 5% ownership interest. In addition, any change in (i) the ownership interest subsequent to the report that equals or exceeds 1% of the total issued and outstanding Equity Securities of us or (ii) the purpose of the shareholding is required to be reported to the Financial Services Commission and the KRX KOSPI Market within five business days from the date of the change.
Violation of these reporting requirements may subject a person to criminal sanctions such as fines or imprisonment, an administrative fine of up to 0.001% of the aggregate market value of the total issued and outstanding stock or ₩500 million, whichever is lower, and/or a loss of voting rights with respect to the ownership of Equity Securities exceeding 5% of the total issued and outstanding Equity Securities with respect to which the reporting requirements were violated. Furthermore, the Financial Services Commission may order the disposal of the unreported Equity Securities.
In addition to the reporting requirements described above, any person whose direct or beneficial ownership of our stock accounts for 10% or more of the total issued and outstanding stock (which we refer to as a “major stockholder”) must report the status of his/her shareholding to the Korea Securities and Futures Commission and the KRX KOSPI Market within five days after he/she becomes a major stockholder. In addition, any change in the ownership interest subsequent to the report must be reported to the Korea Securities and Futures Commission and the KRX KOSPI Market within the 5th day of the occurrence of the change. Violation of these reporting requirements may subject a person to criminal sanctions such as fines or imprisonment.
Any single stockholder and persons who stand in a special relationship with that stockholder that acquire more than 4% of the voting stock of a nationwide Korean bank pursuant to the Bank Act will be subject to reporting requirements. In addition, any single stockholder and persons who stand in a special relationship with that stockholder that acquire in excess of 10% of a nationwide bank’s total issued and outstanding shares with voting rights must receive approval from the Financial Services Commission to acquire shares in each instance where the total shareholding would exceed 10%, 25% or 33%, respectively, of the bank’s total issued and outstanding shares with voting rights. See “Item 4B.4.B. Business Overview—Supervision and Regulation—Principal Regulations Applicable to Banks—Restrictions on Bank Ownership.”
Restrictions Applicable to ADSs
No Korean governmental approval is necessary for the sale and purchase of our ADSs in the secondary market outside Korea or for the withdrawal of shares of our common stock underlying the ADSs and the delivery inside Korea of shares in connection with the withdrawal, provided that a foreigner who intends to acquire the shares must obtain an investment registration card from the Financial Supervisory Service as described below. The acquisition of the shares by a foreigner must be immediately reported to the governor of the Financial Supervisory Service, either by the foreigner or by his standing proxy in Korea.
Persons who have acquired shares of our common stock as a result of the withdrawal of shares underlying our ADSs may exercise their preemptive rights for new shares, participate in free distributions and receive dividends on shares without any further Korean governmental approval.
Under current Korean laws and regulations, the depositary is required to obtain the prior consent of us for the number of shares of our common stock to be deposited in any given proposed deposit that exceeds the difference between:
| (1) | the aggregate number of shares of our common stock deposited by us for the issuance of our ADSs (including deposits in connection with the initial issuance and all subsequent offerings of our ADSs and stock dividends or other distributions related to these ADSs); and |
| (2) | the number of shares of our common stock on deposit with the depositary at the time of such proposed deposit. |
We have agreed to grant such consent to the extent that the total number of shares on deposit with the depositary would not exceed 116,583,985 at any time.
Restrictions Applicable to Shares
As a result of amendments to the Foreign Exchange Transaction Laws and Financial Services Commission regulations (which we refer to collectively as the “Investment Rules”) adopted in connection with the stock market opening from January 1992 and after that date, foreigners may invest, with limited exceptions and subject to procedural requirements, in all shares of Korean companies, whether listed on the KRX KOSPI Market or on the KRX KOSDAQ Market, unless prohibited by specific laws. Foreign investors may trade shares listed on the KRX KOSPI Market or on the KRX KOSDAQ Market only through the KRX KOSPI Market or the KRX KOSDAQ Market, except in limited circumstances, including:
odd-lot trading of shares;
acquisition of shares (which we refer to as “Converted Shares”) by exercise of warrants, conversion rights or exchange rights under bonds with warrants, convertible bonds or exchangeable bonds or withdrawal rights under depositary receipts issued outside of Korea by a Korean company;
acquisition of shares as a result of inheritance, donation, bequest or exercise of stockholders’ rights, including preemptive rights or rights to participate in free distributions and receive dividends;
over-the-counter transactions between foreigners of a class of shares for which the ceiling on aggregate acquisition by foreigners, as explained below, has been reached or exceeded subject to certain exceptions; and
sale and purchase of shares at fair value between foreigners who are part of an investor group comprised of foreign companies investing under the control of a common investment manager pursuant to applicable laws or contract.
For over-the-counter transactions of shares between foreigners outside the KRX KOSPI Market or the KRX KOSDAQ Market for shares with respect to which the limit on aggregate foreign ownership has been reached or exceeded, a financial investment company with a brokerage license in Korea must act as an intermediary. Odd-lot trading of shares outside the KRX KOSPI Market or the KRX KOSDAQ Market must involve a financial investment company with a dealing license as the other party. Foreign investors are prohibited from engaging in margin transactions by borrowing shares from a financial investment company with a dealing and/or brokerage license with respect to shares that are subject to a foreign ownership limit.
The Investment Rules require a foreign investor who wishes to invest in shares on the KRX KOSPI Market or the KRX KOSDAQ Market (including Converted Shares and shares being issued for initial listing on the KRX KOSPI Market or on KRX KOSDAQ Market) to register its identity with the Financial Supervisory Service prior to making any such investment. The registration requirement does not, however, apply to foreign investors who acquire Converted Shares with the intention of selling such Converted Shares within three months from the date of acquisition. Upon registration, the Financial Supervisory Service will issue to the foreign investor an investment registration card, which must be presented each time the foreign investor opens a brokerage account
with a financial investment company with a brokerage license. Foreigners eligible to obtain an investment registration card include foreign nationals who have not been residing in Korea for a consecutive period of six months or more, foreign governments, foreign municipal authorities, foreign public institutions, international financial institutions or similar international organizations, corporations incorporated under foreign laws and any person in any additional category designated by decree of the Ministry of Strategy and Finance under the Financial Investment Services and Capital Markets Act. All Korean offices of a foreign corporation as a group are treated as a separate foreigner from the offices of the corporation outside Korea for the purpose of investment registration. However, a foreign corporation or depositary issuing depositary receipts may obtain one or more investment registration cards in its name in certain circumstances as described in the relevant regulations.
Upon a foreign investor’s purchase of shares through the KRX KOSPI Market or the KRX KOSDAQ Market, no separate report by the investor is required because the investment registration card system is designed to control and oversee foreign investment through a computer system. However, a foreign investor’s acquisition or sale of shares outside the KRX KOSPI Market or the KRX KOSDAQ Market (as discussed above) must be
reported by the foreign investor or his standing proxy to the governor of the Financial Supervisory Service at the time of each such acquisition or sale. In addition, if a foreign investor acquires or sells his shares in connection with a tender offer, odd-lot trading of shares or trades of a class of shares for which the aggregate foreign ownership limit has been reached or exceeded, such foreign investor or his standing proxy must ensure that the financial investment company that was engaged to facilitate the transaction reports such transaction to the governor of the Financial Supervisory Service. A foreign investor may appoint a standing proxy from among the Korea Securities Depository, foreign exchange banks (including domestic branches of foreign banks), financial investment companies with a dealing and/or brokerage license (including domestic branches of foreign financial investment companies with such license), financial investment companies with a collective investment license (including domestic branches of foreign financial investment companies with such license) and internationally recognized custodians which will act as a standing proxy to exercise stockholders’ rights or perform any matters related to the foregoing activities if the foreign investor does not perform these activities himself. Generally, a foreign investor may not permit any person, other than its standing proxy, to exercise rights relating to his shares or perform any tasks related thereto on his behalf. However, a foreign investor may be exempted from complying with these standing proxy rules with the approval of the governor of the Financial Supervisory Service in cases deemed inevitable by reason of conflict between laws of Korea and the home country of the foreign investor.
Certificates evidencing shares of Korean companies must be kept in the custody of an eligible custodian in Korea. The same entities eligible to act as a standing proxy are eligible to act as a custodian of shares for a non-resident or foreign investor. A foreign investor must ensure that its custodian deposits its shares with the Korea Securities Depository. A foreign investor may be exempted from complying with this deposit requirement with the approval of the governor of the Financial Supervisory Service in circumstances where compliance with that requirement is made impracticable, including cases where compliance would contravene the laws of the foreign investors’ home country.
Under the Investment Rules, with certain exceptions, foreign investors may acquire shares of a Korean company without being subject to any foreign investment ceiling. As one such exception, designated public corporations are subject to a 40% ceiling on the acquisition of shares by foreigners in the aggregate. Designated public corporations may set a ceiling on the acquisition of shares by a single person in their articles of incorporation. Currently, Korea Electric Power Corporation is the only designated public corporation that has set such a ceiling. Furthermore, an investment by a foreign investor in 10% or more of the issued and outstanding shares with voting rights of a Korean company is defined as a foreign direct investment under the Foreign Investment Promotion Act of Korea. Generally, a foreign direct investment must be reported to the Ministry of Knowledge Economy of Korea. The acquisition of shares of a Korean company by a foreign investor may also be subject to certain foreign or other shareholding restrictions in the event that the restrictions are prescribed in a specific law that regulates the business of the Korean company. For a description of such restrictions applicable to Korean banks, see “Item 4B.4.B. Business Overview—Supervision and Regulation—Principal Regulations Applicable to Banks—Restrictions on Bank Ownership.”
| Item | Selling Shareholders |
Not Applicable.applicable.
| Item | Dilution |
Not Applicable.applicable.
| Item | Expenses of the Issue |
Not Applicable.
| Item 10. | ADDITIONAL INFORMATION |
| Item | Share Capital |
Not Applicable.applicable.
| Item | Memorandum and Articles of Association |
Description of Capital Stock
Set forth below is information relating to our capital stock, including brief summaries of certain provisions of our articles of incorporation, the Korean Commercial Code, Financial Investment Services and Capital Markets Act and certain related laws of Korea, all as currently in effect. The following summaries do not purport to be complete and are subject to the articles of incorporation and the applicable provisions of the Financial Investment Services and Capital Markets Act, the Korean Commercial Code, and certain other related laws of Korea.
As of December 31, 2011,2013, our authorized share capital is 1,000,000,000 shares. Pursuant to our articles of incorporation, we are authorized to issue shares with preferred dividend, non-voting shares, class shares with conversion rights, class shares with redemption rights and shares with a combination of all or any of the foregoing characteristics (collectively, “Class Shares”), as well as common shares. Subject to applicable laws and regulations, we are authorized to issue Class Shares up to one-half of all of our issued and outstanding shares.
Under our articles of incorporation, dividends on non-voting shares with preferred dividend are required to be at least 1% per annum of the par value and the board of directors must determine at the time of issuance of such shares the dividend rate, type of distributable properties, method of determining the value of distributable properties and conditions on payment of dividends. Also, we may, pursuant to a resolution of the board of directors, issue such non-voting shares with preferred dividend as redeemable shares that may be redeemed with profits at the relevant shareholder’s or our discretion, up to one-half of all of our issued and outstanding shares.
In addition, pursuant to a resolution of the board of directors, we may issue shares that are convertible into common shares or Class Shares at the request of the relevant shareholders, up to 20% of all of our issued and outstanding shares. The period during which a relevant shareholder may make a request for conversion may be determined by a resolution of the board of directors and must be a period between one and ten years from the issue date.
Furthermore, through an amendment of the articles of incorporation, we may create new classes of shares, which may be common shares or Class Shares having additional features as prescribed under the Korean Commercial Code. See “—Voting Rights.”
As of the date of this annual report, 386,351,693 shares of common stock were issued and 386,351,693 shares of common stock were outstanding. No Class Shares are currently outstanding. All of the issued and outstanding shares are fully-paid and non-assessable, and are in registered form. Our authorized but unissued share capital consists of 613,648,307 shares. We may issue the unissued shares without further stockholder approval, subject to a board resolution as provided in the articles of incorporation. See “—Preemptive Rights and Issuances of Additional Shares” and “—Dividends and Other Distributions—Distribution of Free Shares.”
Our articles of incorporation provide that our stockholders may, by special resolution, grant to our and our subsidiaries’ officers, directors and employees stock options exercisable for up to 15% of the total number of our issued and outstanding shares. Our board of directors may also grant stock options to non-director officers and employees exercisable for up to 1% of our issued and outstanding shares, provided that such grant must be approved by a resolution of the subsequent general meeting of stockholders. As of March 30, 2012,31, 2014, our officers, directors and employees held options to purchase 2,071,938717,344 shares of our common stock. Upon their exercise of such stock options, we are required to pay in cash the difference between the exercise price and the market price of our common stock at the date of exercise. See “Item 6E.6.E. Share Ownership—Stock Options.”
Share certificates are issued in denominations of one, five, ten, 50, 100, 500, 1,000 and 10,000 shares.
Organization and Register
We are a financial holding company established under the Financial Holding Company Act. We are registered with the commercial registry office of Seoul Central District Court.
Dividends and Other Distributions
Dividends
Dividends are distributed to stockholders in proportion to the number of shares of the relevant class of capital stock owned by each stockholder following approval by the stockholders at an annual general meeting of stockholders. Subject to the requirements of the Korean Commercial Code and other applicable laws and regulations, we expect to pay full annual dividends on newly issued shares for the year in which the new shares are issued.
We declare our dividend annually at the annual general meeting of stockholders, which are held within three months after the end of each fiscal year. Once declared, the annual dividend must be paid to the stockholders of record as of the end of the preceding fiscal year within one month after the annual general meeting unless otherwise resolved thereby. Annual dividends may be distributed either in cash or in shares provided that shares must be distributed at par value and, if the market price of the shares is less than their par value, dividends in shares may not exceed one-half of the total annual dividend (including dividends in shares).
Under the Korean Commercial Code and our articles of incorporation, we do not have an obligation to pay any annual dividend unclaimed for five years from the payment date.
The Financial Holding Company Act and related regulations require that each time a Korean financial holding company pays an annual dividend, it must set aside in its legal reserve to stated capital an amount equal to at least one-tenth of its net income after tax until the amount set aside reaches at least the aggregate amount of its stated capital. Unless it sets aside this amount, a Korean financial holding company may not pay an annual dividend. We intend to set aside allowances for loan losses and reserves for severance pay in addition to this legal reserve.
For information regarding Korean taxes on dividends, see “Item 10E.10.E. Taxation—Korean Taxation.”
Distribution of Free Shares
In addition to permitting dividends in the form of shares to be paid out of retained or current earnings, the Korean Commercial Code permits a company to distribute to its stockholders, in the form of free shares, an amount transferred from the capital surplus or legal reserve to stated capital. These free shares must be distributed pro rata to all stockholders. Our articles of incorporation provide that the types of shares to be distributed to the holders of non-voting shares with preferred dividend will be the same type of non-voting shares with preferred dividend held by such holders.
Preemptive Rights and Issuances of Additional Shares
Unless otherwise provided in the Korean Commercial Code, a company may issue authorized but unissued shares at such times and upon such terms as the board of directors of the company may determine. The company must offer the new shares on uniform terms to all stockholders who have preemptive rights and who are listed on the stockholders’ register as of the applicable record date. Our stockholders will be entitled to subscribe for any
newly issued shares in proportion to their existing shareholdings. However, as provided in our articles of incorporation, new shares may be issued to persons other than existing stockholders if such shares are:
(1) publicly offered pursuant to the Financial Investment Services and Capital Markets Act, (2) issued to an employee stock ownership association, (3) issued upon exercise of stock options pursuant to the Financial Investment Services and Capital Markets Act, (4) issued for the issuance of our depositary receipts, (5) issued to certain foreign or domestic financial institutions or institutional investors to raise funds to meet urgent needs for our management or operations or (6) issued primarily to a third party who has contributed to the management of our business, including by providing financing, credit, advanced financing technique, know-how or entering into close business alliances, except that, in the case of issuances of new shares under (1), (4), (5) and (6) above, the number of new shares issued to persons other than existing stockholders may not exceed 50% of our total issued and outstanding capital stock.
Public notice of the preemptive rights to new shares and the transferability thereof must be given not less than two weeks (excluding the period during which the stockholders’ register is closed) prior to the record date. We will notify the stockholders or persons other than existing stockholders, who are entitled to subscribe for newly issued shares of the deadline for subscription at least two weeks prior to the deadline. If such stockholders or persons fail to subscribe on or before such deadline, their preemptive rights will lapse. Our board of directors may determine how to distribute shares in respect of which preemptive rights have not been exercised or where fractions of shares occur.
Under the Financial Investment Services and Capital Markets Act, members of a company’s employee stock ownership association, whether or not they are stockholders, will have a preemptive right, subject to certain exceptions, to subscribe for up to 20% of the shares publicly offered pursuant to the Financial Investment Services and Capital Markets Act. This right is exercisable only to the extent that the total number of shares so acquired and held by such members does not exceed 20% of the total number of shares then issued and outstanding.
Voting Rights
Each outstanding share of our common stock is entitled to one vote per share. However, voting rights with respect to shares of common stock that we or any of our subsidiaries holds may not be exercised. Unless stated otherwise in a company’s articles of incorporation, the Korean Commercial Code permits holders of an aggregate of 1% or more of the issued and outstanding shares with voting rights to request cumulative voting when electing two or more directors. Our articles of incorporation do not prohibit cumulative voting. The Korean Commercial Code and our articles of incorporation provide that an ordinary resolution may be adopted if approval is obtained from the holders of at least a majority of those shares of common stock present or represented at such meeting
and such majority also represents at least one-fourth of the total of our issued and outstanding voting shares. Holders of non-voting shares (other than enfranchised non-voting shares) will not be entitled to vote on any resolution or to receive notice of any general meeting of stockholders unless the agenda of the meeting includes consideration of a resolution on which such holders are entitled to vote. If our annual general stockholders’ meeting resolves not to pay to holders of non-voting shares with preferred dividend the annual dividend as determined by the board of directors at the time of issuance of such shares, the holders of non-voting shares with preferred dividend will be entitled to exercise voting rights from the general stockholders’ meeting following the meeting adopting such resolution to the end of a meeting to declare to pay such dividend with respect to the non-voting shares with preferred dividend. Holders of such enfranchised non-voting shares with preferred dividend will have the same rights as holders of common stock to request, receive notice of, attend and vote at a general meeting of stockholders.
The Korean Commercial Code provides that to amend the articles of incorporation, which is also required for any change to the authorized share capital of the company, and in certain other instances, including removal
of a director of a company, dissolution, merger or consolidation of a company, transfer of the whole or a significant part of the business of a company, acquisition of all of the business of any other company, acquisition of a part of the business of any other company having a material effect on the business of the company or issuance of new shares at a price lower than their par value, a special resolution must be adopted by the approval of the holders of at least two-thirds of those shares present or represented at such meeting and such special majority also represents at least one-third of the total issued and outstanding shares with voting rights of the company.
In addition, in the case of amendments to the articles of incorporation or any merger or consolidation of a company or in certain other cases, where the rights or interest of the holders of Class Shares are adversely affected, a resolution must be adopted by a separate meeting of holders of Class Shares. Such a resolution may be adopted if the approval is obtained from stockholders of at least two-thirds of the Class Shares present or represented at such meeting and such shares also represent at least one-third of the total issued and outstanding Class Shares of the company.
A stockholder may exercise his voting rights by proxy given to another stockholder. The proxy must present the power of attorney prior to the start of a meeting of stockholders.
Liquidation Rights
In the event we are liquidated, the assets remaining after the payment of all debts, liquidation expenses and taxes will first be distributed to holders of Class Shares which have a preference right in respect of the distribution of residual properties as determined by our board of directors at the time of their issuance, and the residue thereafter will be distributed to the other stockholders in proportion to the number of shares held by them.
General Meetings of Stockholders
There are two types of general meetings of stockholders: annual general meetings and extraordinary general meetings. We will be required to convene our annual general meeting within three months after the end of each fiscal year. Subject to a board resolution or court approval, an extraordinary general meeting of stockholders may be held when necessary or at the request of the holders of an aggregate of 3% or more of our issued and outstanding shares, or the holders of an aggregate of 1.5% or more of our issued and outstanding stock with voting rights, who have held those shares at least for six months. Under the Korean Commercial Code, an extraordinary general meeting of stockholders may also be convened at the request of our Audit Committee, subject to a board resolution or court approval. Holders of non-voting shares may be entitled to request a general meeting of stockholders only to the extent the non-voting shares have become enfranchised as described under the section entitled “—Voting Rights” above, hereinafter referred to as “enfranchised non-voting shares.” Meeting agendas will be determined by the board of directors or proposed by holders of an aggregate of 3% or
more of the issued and outstanding shares with voting rights, or by holders of an aggregate of 0.5% or more of our issued and outstanding shares with voting rights, who have held those shares for at least six months, by way of a written proposal to the board of directors at least six weeks prior to the meeting. Written notices or e-mail notices stating the date, place and agenda of the meeting must be given to the stockholders at least two weeks prior to the date of the general meeting of stockholders. Notice may, however, be given to holders of 1% or less of the total number of issued and outstanding shares which are entitled to vote, either by placing at least two public notices at least two weeks in advance of the meeting in at least two daily newspapers or by placing a notice through the electronic disclosure system operated by the Financial Supervisory Service or the Korea Exchange. Stockholders who are not on the stockholders’ register as of the record date will not be entitled to receive notice of the general meeting of stockholders, and they will not be entitled to attend or vote at such meeting. Holders of enfranchised non-voting shares who are on the stockholders’ register as of the record date will be entitled to receive notice of the general meeting of stockholders and they will be entitled to attend and vote at such meeting. Otherwise, holders of non-voting shares will not be entitled to receive notice of or vote at general meetings of stockholders.
The general meeting of stockholders will be held at our head office, which is our registered head office, or, if necessary, may be held anywhere in the vicinity of our head office.
Rights of Dissenting Stockholders
Pursuant to the Financial Investment Services and Capital Markets Act and the Law on the Improvement of the Structure of the Financial Industry, in certain limited circumstances (including, without limitation, if we transfer all or any significant part of our business, if we acquire a part of the business of any other company and such acquisition has a material effect on our business or if we merge or consolidate with another company), dissenting holders of shares of our common stock and our preferred stock who acquired such shares prior to the announcement of the relevant resolution of the board of directors (or up to one day after such announcement in the event that such resolution is made by the board of directors pursuant to a presidential decree) will have the right to require us to purchase their shares by providing written notice to us. To exercise such a right, stockholders must submit to us a written notice of their intention to dissent prior to the general meeting of stockholders. Within 20 days (10 days in the case of a merger or consolidation under the Law on Improvement of the Structure of the Financial Industry) after the date on which the relevant resolution is passed at such meeting, such dissenting stockholders must request in writing that we purchase their shares. We are obligated to purchase the shares from dissenting stockholders within one month after the end of such request period (within two months after the receipt of such request in the case of a merger or consolidation under the Law on Improvement of the Structure of Financial Industry) at a price to be determined by negotiation between the stockholder and us. If we cannot agree on a price with the stockholder through such negotiations, the purchase price will be the arithmetic mean of:
the weighted average of the daily stock prices on the KRX KOSPI Market for the two-month period prior to the date of the adoption of the relevant board of directors’ resolution;
the weighted average of the daily stock prices on the KRX KOSPI Market for the one-month period prior to the date of the adoption of the relevant board of directors’ resolution; and
the weighted average of the daily stock prices on the KRX KOSPI Market for the one-week period prior to the date of the adoption of the relevant board of directors’ resolution.
However, any dissenting stockholder who wishes to contest the purchase price may bring a claim in court.
Required Disclosure of Ownership
Under Korean law, stockholders who beneficially hold more than a certain percentage of our common stock, or who are related to or are acting in concert with other holders of certain percentages of our common stock or
our other equity securities, must report the status of their holdings to the Financial Services Commission and other relevant governmental authorities. For a description of such required disclosure of ownership, see “Item 4B.4.B. Business Overview—Supervision and Regulation—Principal Regulations Applicable to Financial Holding Companies—Restrictions on Ownership of a Financial Holding Company” and “Item 9C.9.C. Markets—Reporting Requirements for Holders of Substantial Interests.”
Other Provisions
Register of Stockholders and Record Dates
We maintain the register of our stockholders at our principal office in Seoul, Korea. We register transfers of shares on the register of stockholders upon presentation of the share certificates.
The record date for annual dividends is December 31. For the purpose of determining the holders of shares entitled to annual dividends, the register of stockholders may be closed for the period beginning from January 1 and ending on January 31. Further, the Korean Commercial Code and our articles of incorporation permit us
upon at least two weeks’ public notice to set a record date and/or close the register of stockholders for not more than three months for the purpose of determining the stockholders entitled to certain rights pertaining to the shares. However, in the event that the register of stockholders is closed for the period beginning from January 1 and ending on January 31 for the purpose of determining the holders of shares entitled to attend the annual general meeting of stockholders, the Korean Commercial Code and our articles of incorporation waive the requirement to provide at least two weeks’ public notice. The trading of shares and the delivery of certificates in respect thereof may continue while the register of stockholders is closed. Also, we may distribute dividends to stockholders on a quarterly basis, and the record dates for these quarterly dividends are the end of March, June and September of each year.
Annual Reports
At least one week before the annual general meeting of stockholders, we must make our management report to shareholders and audited financial statements available for inspection at our head office and at all of our branch offices. Copies of this report, the audited financial statements and any resolutions adopted at the general meeting of stockholders are available to our stockholders.
Under the Financial Investment Services and Capital Markets Act, we must file with the Korean Financial Services Commission and the KRX KOSPI Market an annual business report within 90 days after the end of each fiscal year, a half-year business report within 45 days after the end of the first six months of each fiscal year and quarterly business reports within 45 days after the end of the first three months and nine months of each fiscal year, respectively. Copies of such business reports will be available for public inspection at the Korean Financial Services Commission and the KRX KOSPI Market.
Transfer of Shares
Under the Korean Commercial Code, the transfer of shares is effected by the delivery of share certificates. The Financial Investment Services and Capital Markets Act provides, however, that in case of a company listed on the KRX KOSPI Market such as us, share transfers can be effected by the book-entry method. In order to assert stockholders’ rights against us, the transferee must have his name and address registered on the register of stockholders. For this purpose, stockholders are required to file with us their name, address and seal. Non-resident stockholders must notify us of the name of their proxy in Korea to which our notice can be sent.
Under current Korean regulations, the following entities may act as agents and provide related services for foreign stockholders:
the Korea Securities Depository;
internationally recognized foreign custodians;
financial investment companies with a dealing license (including domestic branches of foreign financial investment companies with such license);
financial investment companies with a brokerage license (including domestic branches of foreign financial investment companies with such license);
foreign exchange banks (including domestic branches of foreign banks); and
financial investment companies with a collective investment license (including domestic branches of foreign financial investment companies with such license).
In addition, foreign stockholders may appoint a standing proxy among the foregoing and generally may not allow any person other than the standing proxy to exercise rights to the acquired shares or perform any tasks related thereto on their behalf. Certain foreign exchange controls and securities regulations apply to the transfer of shares by non-residents or non-Koreans. See “Item 9C.9.C. Markets” and “Item 10D.10.D. Exchange Controls.” Except
as provided in the Financial Holding Company, the ceiling on the aggregate shareholdings of a single stockholder and persons who stand in a special relationship with such stockholder is 10% of our issued and outstanding voting shares. See “Item 4B.4.B. Business Overview—Supervision and Regulation—Principal Regulations Applicable to Financial Holding Companies—Restrictions on Ownership of a Financial Holding Company.”
Acquisition of Our Shares
Under the Korean Commercial Code, we may acquire our own shares upon a resolution of a general meeting of shareholders by either (i) purchasing them on a stock exchange or (ii) purchasing a number of shares, other than the redeemable shares as set forth in Article 345, Paragraph (1) of the Korean Commercial Code, from each shareholder in proportion to their existing shareholding ratio through the methods set forth in the Presidential Decree, provided that the total purchase price does not exceed the amount of our profit that may be distributed as dividends in respect of the immediately preceding fiscal year.
Additionally, pursuant to the Financial Investment Services and Capital Markets Act and regulations under the Financial Holding Company Act and after submission of certain reports to the Korean Financial Services Commission, we may purchase our own shares on the KRX KOSPI Market or through a tender offer, subject to the restrictions that:
the aggregate purchase price of such shares may not exceed the total amount available for distribution of dividends at the end of the preceding fiscal year; and
the purchase of such shares shall meet the risk-adjusted capital ratio requirements prescribed in the regulations under the Financial Holding Company Act based on Bank for International Settlements standards.
Subject to certain limited exceptions, our subsidiaries will not be permitted to acquire our shares pursuant to the Financial Holding Company Act.
| Item | Material Contracts |
In December 2002, we formally extended our strategic alliance agreement with ING Bank N.V., pursuant to which we agreed to replace the prior investment agreement entered into with the affiliates of ING Bank and H&CB with this agreement and to enter into joint venture agreements with its affiliates relating to the bancassurance business and KB Asset Management. In August 2003, our board approved and ratified an amended and restated strategic alliance agreement with ING Bank N.V. As a result:
we are required to cause one nominee of ING Bank N.V. to be appointed as a non-executive director so long as ING Groep N.V. and its subsidiaries maintain a minimum shareholding in us as defined in the strategic alliance agreement, and to cause another nominee of ING Bank N.V. to be appointed as an executive director so long as ING Groep N.V. and its subsidiaries hold 6% or more of our issued and outstanding common shares;
the exclusive alliance with respect to our bancassurance business was revised to a non-exclusive, commercial relationship-based alliance; and
ING Groep N.V. is required to maintain beneficial ownership of no less than 12,716,691 shares of our common stock, subject to adjustment for any share consolidations or share splits or, in the event of a merger with another entity, as adjusted accordingly pursuant to the merger ratio for the merger.
In April 2008, Kookmin Bank and KB Asset Management Co., Ltd. entered into an agreement with ING Bank N.V. and ING Insurance International B.V. related to the planned establishment of KB Financial Group through a comprehensive stock transfer. Pursuant to this agreement and subject to certain conditions, ING Bank and ING Insurance International approved and agreed to support the stock transfer. The parties also agreed, among others, that the stock transfer shall not constitute a change of control or termination event for
purposes of various agreements in effect between the parties and that Kookmin Bank and ING Bank agree to effect an assignment of Kookmin Bank’s rights and obligations under the amended and restated strategic alliance agreement to KB Financial Group.
In connection with the “comprehensive stock transfer” under Korean law pursuant to which we were established, ING Insurance International B.V., which previously held a 20% equity interest in KB Asset Management Co., Ltd. transferred all of its shares of KB Asset Management common stock to us in September 2008 and in return received 1,290,815 shares of our common stock in accordance with a specified stock transfer ratio.
For more details regarding our relationship with ING Groep N.V., see “Item 4A. History and Development of the Company—History of H&CB,” “Item 4B. Business Overview—Other Businesses—Bancassurance,” and “Item 7B. Related Party Transactions.”None.
| Item | Exchange Controls |
General
The Foreign Exchange Transaction Act of Korea and the Presidential Decree and regulations under that Act and Decree, which we refer to collectively as the “Foreign Exchange Transaction Laws,” regulate investment in
Korean securities by non-residents and issuance of securities outside Korea by Korean companies. Non-residents may invest in Korean securities pursuant to the Foreign Exchange Transaction Laws. The Financial Services Commission has also adopted, pursuant to its authority under the Financial Investment Services and Capital Markets Act, regulations that restrict investment by foreigners in Korean securities and regulate issuance of securities outside Korea by Korean companies.
Under the Foreign Exchange Transaction Laws, (1) if the Korean government deems that it is inevitable due to the outbreak of natural calamities, wars, conflict of arms or grave and sudden changes in domestic or foreign economic circumstances or other situations equivalent thereto, the Ministry of Strategy and Finance may temporarily suspend payment, receipt or the whole or part of transactions to which the Foreign Exchange Transaction Laws apply, or impose an obligation to safe-keep, deposit or sell means of payment in or to certain Korean governmental agencies or financial institutions; and (2) if the Korean government deems that international balance of payments and international finance are confronted or are likely to be confronted with serious difficulty or the movement of capital between Korea and abroad brings or is likely to bring about serious obstacles in carrying out its currency policies, exchange rate policies and other macroeconomic policies, the Ministry of Strategy and Finance may take measures to require any person who intends to perform capital transactions to obtain permission or to require any person who performs capital transactions to deposit part of the payments received in such transactions at certain Korean governmental agencies or financial institutions, in each case subject to certain limitations.
Restrictions Applicable to Shares
Under the Foreign Exchange Transaction Laws, a foreign investor who intends to acquire shares must designate a foreign exchange bank at which he must open a foreign currency account and a Won account exclusively for stock investments. No approval is required for remittance into Korea and deposit of foreign currency funds in the foreign currency account. Foreign currency funds may be transferred from the foreign currency account at the time required to place a deposit for, or settle the purchase price of, a stock purchase transaction to a Won account opened at a financial investment company with a dealing and/or brokerage license. Funds in the foreign currency account may be remitted abroad without any Korean governmental approval.
Dividends on shares of Korean companies are paid in Won. No Korean governmental approval is required for foreign investors to receive dividends on, or the Won proceeds of the sale of, any shares to be paid, received
and retained in Korea. Dividends paid on, and the Won proceeds of the sale of, any shares held by a non-resident of Korea must be deposited either in a Won account with the investor’s financial investment company with a dealing and/or brokerage license or in his Won account. Funds in the investor’s Won account may be transferred to his foreign currency account or withdrawn for local living expenses up to certain limitations. Funds in the Won account may also be used for future investment in shares or for payment of the subscription price of new shares obtained through the exercise of preemptive rights.
Financial investment companies with dealing and/or brokerage licenses are allowed to open foreign currency accounts with foreign exchange banks exclusively for accommodating foreign investors’ stock investments in Korea. Through these accounts, such financial investment companies may enter into foreign exchange transactions on a limited basis, such as conversion of foreign currency funds and Won funds, either as a counterparty to or on behalf of foreign investors, without the investors having to open their own accounts with foreign exchange banks.
| Item | Taxation |
United States Taxation
This summary describes certain material U.S. federal income tax consequences for a U.S. holder (as defined below) of acquiring, owning, and disposing of common shares or ADSs. This summary applies to you only if you
hold the common shares or ADSs as capital assets for tax purposes. This summary does not apply to you if you are a member of a class of holders subject to special rules, such as:
a dealer in securities or currencies;
a trader in securities that elects to use a mark-to-market method of accounting for securities holdings;
a bank;
a life insurance company;
a tax-exempt organization;
a person that holds common shares or ADSs that are a hedge or that are hedged against interest rate or currency risks;
a person that holds common shares or ADSs as part of a straddle or conversion transaction for tax purposes;
a person whose functional currency for tax purposes is not the U.S. dollar; or
a person that owns or is deemed to own 5% or more of any class of our stock.
This summary is based on the Internal Revenue Code of 1986, as amended, its legislative history, existing and proposed regulations promulgated thereunder, and published rulings and court decisions, all as currently in effect. These laws are subject to change, possibly on a retroactive basis.
Please consult your own tax advisers concerning the U.S. federal, state, local, and other tax consequences of purchasing, owning, and disposing of common shares or ADSs in your particular circumstances.
For purposes of this summary, you are a “U.S. holder” if you are the beneficial owner of a common share or an ADS and are:
a citizen or resident of the United States;
a U.S. domestic corporation; or
otherwise subject to U.S. federal income tax on a net income basis with respect to income from the common share or ADS.
In general, if you are the beneficial owner of ADSs, you will be treated as the beneficial owner of the common shares represented by those ADSs for U.S. federal income tax purposes, and no gain or loss will be recognized if you exchange an ADS for the common share represented by that ADS.
Dividends
The gross amount of cash dividends that you receive (prior to deduction of Korean taxes) generally will be subject to U.S. federal income taxation as foreign source dividend income and will not be eligible for the dividends received deduction. Dividends paid in Won will be included in your income in a U.S. dollar amount calculated by reference to the exchange rate in effect on the date of your receipt of the dividend, in the case of common shares, or the depositary’s receipt, in the case of ADSs, regardless of whether the payment is in fact converted into U.S. dollars. If such a dividend is converted into U.S. dollars on the date of receipt, you generally should not be required to recognize foreign currency gain or loss in respect of the dividend income.
Subject to certain exceptions for short-term and hedged positions, the U.S. dollar amount of dividends received by an individual prior to January 1, 2013 with respect to the ADSs will be subject to taxation at a maximum rate of 15%reduced rates if the dividends are “qualified dividends.” Dividends paid on the ADSs will be treated as qualified dividends if (i) the ADSs are readily tradable on an established securities market in the United States and (ii) we were not, in the year prior to
the year in which the dividend was paid, and are not, in the year in which the dividend is paid, a passive foreign investment company as defined for U.S. federal income tax purposes (“PFIC”). The ADSs are listed on the New York Stock Exchange, and will qualify as readily tradable on an established securities market in the United States so long as they are so listed. Based on our audited financial statements, we believe that we were not a PFIC in our 20102012 or 20112013 taxable year. In addition, based on our audited financial statements and current expectations regarding our income, assets and activities, we do not anticipate becoming a PFIC for our 20122014 taxable year.
Distributions of additional shares in respect of common shares or ADSs that are made as part of a pro-rata distribution to all of our stockholders generally will not be subject to U.S. federal income tax.
Sale or Other Disposition
For U.S. federal income tax purposes, gain or loss you realize on a sale or other disposition of common shares or ADSs generally will be treated as U.S. source capital gain or loss, and will be long-term capital gain or loss if the common shares or ADSs were held for more than one year. Your ability to offset capital losses against ordinary income is limited. Long-term capital gain recognized by an individual U.S. holder generally is subject to taxation at reduced rates.
Foreign Tax Credit Considerations
You should consult your own tax advisers to determine whether you are subject to any special rules that limit your ability to make effective use of foreign tax credits, including the possible adverse impact of failing to take advantage of benefits under the income tax treaty between the United States and Korea. If no such rules apply, you may claim a credit against your U.S. federal income tax liability for Korean taxes withheld from dividends on the common shares or ADSs, so long as you have owned the common shares or ADSs (and not entered into specified kinds of hedging transactions) for at least a 16-day period that includes the ex-dividend date. Instead of claiming a credit, you may, if you so elect, deduct such Korean taxes in computing your taxable income, subject to generally applicable limitations under U.S. tax law. Korean taxes withheld from a distribution of additional shares that is not subject to U.S. tax may be treated for U.S. federal income tax purposes as imposed on “general limitation”category” income. Such treatment could affect your ability to utilize any available foreign tax credit in respect of such taxes.
Any Korean securities transaction tax or agriculture and fishery special surtax that you pay will not be creditable for foreign tax credit purposes.
Foreign tax credits will not be allowed for withholding taxes imposed in respect of certain short-term or hedged positions in securities and may not be allowed in respect of arrangements in which a U.S. holder’s expected economic profit is insubstantial.
The calculation of foreign tax credits and, in the case of a U.S. holder that elects to deduct foreign taxes, the availability of deductions involve the application of complex rules that depend on a U.S. holder’s particular circumstances. You should consult your own tax advisers regarding the creditability or deductibility of such taxes.
U.S. Information Reporting and Backup Withholding Rules
Payments of dividends and sales proceeds that are made within the United States or through certain U.S.-related financial intermediaries are subject to information reporting and may be subject to backup withholding unless the holder (i) is a corporation or other exempt recipient and demonstrates this when required or (ii) provides a taxpayer identification number and certifies that no loss of exemption from backup withholding has occurred. Holders that are not U.S. persons generally are not subject to information reporting or backup withholding. However, such a holder may be required to provide a certification of its non-U.S. status in connection with payments received within the United States or through a U.S.-related financial intermediary.
Korean Taxation
The following summary of Korean tax considerations applies to you so long as you are not:
a resident of Korea;
a corporation with its head office, principal place of business or place of effective management in Korea; or
engaged in a trade or business in Korea through a permanent establishment or a fixed base to which the relevant income is attributable or with which the relevant income is effectively connected.
Taxation of Dividends on Common Shares or ADSs
We will deduct Korean withholding tax from dividends paid to you (whether payable in cash or in shares) at a rate of 22.0% (inclusive of local income surtax). If you are a beneficial owner of the dividends in a country that has entered into a tax treaty with Korea, you may qualify for a reduced rate of Korean withholding tax. See “—Tax Treaties” below for a discussion on treaty benefits. If we distribute to you shares representing a transfer of earning surplus or certain capital reserves into paid-in capital, that distribution may be subject to Korean withholding tax.
In order to obtain a reduced rate of withholding tax pursuant to an applicable tax treaty, you must submit to us, prior to the dividend payment date, such evidence of tax residence as the Korean tax authorities may require in order to establish your entitlement to the benefits of the applicable tax treaty (which will include a certificate of your tax residency issued by a competent authority of your country of tax residence).
If you hold ADSs, evidence of tax residence may be submitted to us through the depositary.
Taxation of Capital Gains From Transfer of Common Shares or ADSs
As a general rule, capital gains earned by non-residents upon transfer of our common shares or ADSs are subject to Korean withholding tax at the lower of (1) 11% (inclusive of local income surtax) of the gross proceeds realized or (2) subject to the production of satisfactory evidence of acquisition costs and certain direct transaction costs of the common shares or ADSs, 22.0% (inclusive of local income surtax) of the net realized gain, unless exempt from Korean income taxation under the applicable Korean tax treaty with the non-resident’s
country of tax residence. See “—Tax Treaties” below for a discussion on treaty benefits. Even if you do not qualify for an exemption under a tax treaty, you will not be subject to the foregoing withholding tax on capital gains if you qualify under the relevant Korean domestic tax law exemptions discussed in the following paragraphs.
In regards to the transfer of our common shares through the Korea Exchange, you will not be subject to the withholding tax on capital gains (as described in the preceding paragraph) if you (1) have no permanent establishment in Korea and (2) did not own or have not owned (together with any shares owned by any person with which you have a certain special relationship) 25% or more of the total issued and outstanding shares, which may include the common shares represented by the ADSs, at any time during the calendar year in which the sale occurs and during the five calendar years prior to the calendar year in which the sale occurs.
Under Korean tax law, ADSs are viewed as shares of common stock for capital gains tax purposes. Accordingly, capital gains from the sale or disposition of ADSs are taxed (if such sale or disposition constitutes a taxable event) as if such gains are from the sale or disposition of the underlying common shares. Capital gains that you earn (regardless of whether you have a permanent establishment in Korea) from a transfer of ADSs outside of Korea will generally be exempt from Korean income taxation by virtue of the Special Tax Treatment Control Law of Korea, or the STTCL, provided that the issuance of the ADSs is deemed to be an overseas issuance under the STTCL. However, if you transfer ADSs after having converted the underlying common shares, such exemption under the STTCL will not apply and you will be required to file a corporate income tax return and pay tax in Korea with respect to any capital gains derived from such transfer unless the purchaser or a financial investment company with a brokerage license, as applicable, withholds and pays such tax.
If you are subject to tax on capital gains with respect to the sale of ADSs, or of our common shares you acquired as a result of a withdrawal, the purchaser or, in the case of the sale of the common shares on the Korea
Exchange or through a financial investment company with a brokerage license in Korea, such financial investment company is required to withhold Korean tax from the sales price in an amount equal to the lower of (1) 11% (inclusive of local income surtax) of the gross realization proceeds or (2) subject to the production of satisfactory evidence of acquisition costs and certain direct transaction costs of the common shares or ADSs, 22.0% (inclusive of local income surtax) of the net realized gain, and to make payment of these amounts to the Korean tax authority, unless you establish your entitlement to an exemption under an applicable tax treaty or domestic tax law. To obtain the benefit of an exemption from tax pursuant to an applicable tax treaty, you must submit to the purchaser or the financial investment company, or through the ADS depositary, as the case may be, prior to or at the time of payment, such evidence of your tax residence as the Korean tax authorities may require in support of your claim for treaty benefits. See the discussion under “—Tax Treaties” below for an additional explanation on claiming treaty benefits.
Tax Treaties
Korea has entered into a number of income tax treaties with other countries (including the United States), which would reduce or exempt Korean withholding tax on dividends on, and capital gains on transfer of, the common shares or ADSs. For example, under the Korea-United States income tax treaty, reduced rates of Korean withholding tax of 16.5% or 11.0% (depending on your shareholding ratio and inclusive of resident surtax) on dividends and an exemption from Korean withholding tax on capital gains are available to residents of the United States that are beneficial owners of the relevant dividend income or capital gains, subject to certain exceptions. However, under Article 17 (Investment or Holding Companies) of the Korea-United States income tax treaty, such reduced rates and exemption do not apply if (i) you are a United States corporation, (ii) by reason of any special measures, the tax imposed on you by the United States with respect to such dividend income or capital gains is substantially less than the tax generally imposed by the United States on corporate profits and (iii) 25% or more of your capital is held of record or is otherwise determined, after consultation between competent authorities of the United States and Korea, to be owned directly or indirectly by one or more persons who are not individual residents of the United States. Also, under Article 16 (Capital Gains) of the Korea-United States
income tax treaty, the exemption on capital gains does not apply if you are an individual and (a) you maintain a fixed base in Korea for an aggregate of 183 days or more during a given taxable year and your ADSs or common shares giving rise to capital gains are effectively connected with such fixed base or (b) you are present in Korea for an aggregate of 183 days or more during a given taxable year.
You should inquire for yourself whether you are entitled to the benefit of a tax treaty between Korea and the country where you are a resident. It is the responsibility of the party claiming the benefits of an income tax treaty in respect of dividend payments or capital gains to submit to us, the purchaser or the financial investment company, as applicable, a certificate as to his tax residence. In the absence of sufficient proof, we, the purchaser or the financial investment company, as applicable, must withhold tax at the normal rates. Furthermore, in order for you to obtainclaim the benefit of a tax rate reduction or tax exemption on certain Korean source income (such as dividends or capital gains) under an applicable tax treaty, Korean tax law requires you (or your agent) to submit an application (for reduced withholding tax rate, “application for entitlement to reduced tax rate,” and in the case of exemptions from withholding tax, “application for tax exemption,” along with a certificate of your tax residency issued by a competent authority of your country of tax residence, subject to certain exceptions.exceptions) as the beneficial owner of such Korean source income (“BO application”). Such application should be submitted to the withholding agent prior to the payment date of the relevant income. Subject to certain exceptions, where the relevant income is paid to an overseas investment vehicle (which is not the beneficial owner of such income) (“OIV”), a beneficial owner claiming the benefit of an applicable tax treaty with respect to such income must submit its BO application to such OIV, which must submit an OIV report and a schedule of beneficial owners to the withholding agent prior to the payment date of such income. In the case of a tax exemption application, the withholding agent is required to submit such application (together with the applicable OIV report in the case of income paid to an OIV) to the relevant district tax office by the ninth day of the month following the date of the first payment of such income.
Inheritance Tax and Gift Tax
If you die while holding an ADS or donate an ADS, it is unclear whether, for Korean inheritance and gift tax purposes, you will be treated as the owner of the common shares underlying the ADSs. If the tax authority
interprets depositary receipts as the underlying share certificates, you may be treated as the owner of the common shares and your heir or the donee (or in certain circumstances, you as the donor) will be subject to Korean inheritance or gift tax presently at the rate of 10% to 50%, provided that the value of the ADSs or the common shares is greater than a specified amount.
If you die while holding a common share or donate a common share, your heir or donee (or in certain circumstances, you as the donor) will be subject to Korean inheritance or gift tax at the same rate as indicated above.
At present, Korea has not entered into any tax treaty relating to inheritance or gift taxes.
Securities Transaction Tax
If you transfer our common shares on the Korea Exchange, you will be subject to securities transaction tax at the rate of 0.15% and an agriculture and fishery special surtax at the rate of 0.15% of the sale price of the common shares. If your transfer of the common shares is not made on the Korea Exchange, subject to certain exceptions, you will be subject to securities transaction tax at the rate of 0.5% and will not be subject to an agriculture and fishery special surtax.
Under the Securities Transaction Tax Law, depositary receipts (such as American depositary receipts) constitute share certificates subject to the securities transaction tax. However, the transfer of depositary receipts listed on the New York Stock Exchange, the Nasdaq Global Market, or other qualified foreign exchanges is exempt from the securities transaction tax.
In principle, the securities transaction tax, if applicable, must be paid by the transferor of the common shares or ADSs. When the transfer is effected through a securities settlement company, such settlement company is generally required to withhold and pay the tax to the tax authorities. When such transfer is made through a financial investment company only, such financial investment company is required to withhold and pay the tax. Where the transfer is effected by a non-resident without a permanent establishment in Korea, other than through a securities settlement company or a financial investment company, the transferee is required to withhold the securities transaction tax.
Non-reporting or under-reporting of securities transaction tax will generally result in penalties equal to 20% to 40% of the non-reported tax amount or 10% to 40% of under-reported tax amount. Also, a failure to timely pay securities transaction tax will result in a penalty equal to 10.95% per annum of the due but unpaid tax amount. The penalties are imposed on the party responsible for paying the securities transaction tax or, if such tax is required to be withheld, on the party that has the obligation to withhold.
| Item | Dividends and Paying Agents |
Not Applicable.applicable.
| Item | Statements by Experts |
Not Applicable.applicable.
| Item | Documents on Display |
We are subject to the information requirements of the U.S. Securities Exchange Act of 1934, as amended, and, in accordance therewith, are required to file reports, including annual reports on Form 20-F, and other information with the U.S. Securities and Exchange Commission. These materials, including this annual report and the exhibits thereto, may be inspected and copied at the Commission’s public reference rooms in
Washington, D.C., New York, New York and Chicago, Illinois. Please call the Commission at 1-800-SEC-0330 for further information on the public reference rooms. As a foreign private issuer, we are also required to make filings with the Commission by electronic means. Any filings we make electronically will be available to the public over the Internet at the Commission’s web site at http://www.sec.gov.
| Item | Subsidiary Information |
Not Applicable.applicable.
| Item 11. | QUANTITATIVE AND QUALITATIVE DISCLOSURES ABOUT MARKET RISK |
Overview
As a financial services provider, we are exposed to various risks related to our lending and trading businesses, our funding activities and our operating environment, principally through Kookmin Bank, our banking subsidiary. Our goal in risk management is to ensure that we identify, measure, monitor and control the various risks that arise, and that our organization adheres strictly to the policies and procedures which we establish to address these risks. Under our internal regulations pertaining to our consolidated capital adequacy ratio and internal standards for risk appetite and economic capital under Basel II,III, we identify the following eight separate categories of risk inherent in our business activities: credit risk, market risk, operational risk, interest rate risk, liquidity risk, credit concentration risk, reputation risk and strategic risk. Of these, the principal risks to which we are exposed are credit risk, market risk, liquidity risk and operational risk, and we strive to manage these and other risks within acceptable limits.
Organization
We have a multi-tiered risk management governance structure. Our Group Risk Management Committee is ultimately responsible for group-wide risk management, and directs our various subordinate risk management entities. The Group Risk Management Council reports directly to the Group Risk Management Committee and coordinates the implementation of directives set forth by the Group Risk Management Committee with the relevant risk management units of our subsidiaries. The Subsidiary Risk Management Committee of each of our subsidiaries, based on the Group Risk Management Committee’s directives, determines risk management
strategies and implements risk management policies and guidelines for such subsidiary and directs the activities of the subsidiary’s risk management units within the risk guidelines set at the group level. Each Subsidiary Risk Management Committees generally receive inputs from the respective risk management units of such subsidiary, who also report directly to the Group Risk Management Committee.
The following chart sets out our risk management governance structure as of the date of this annual report:
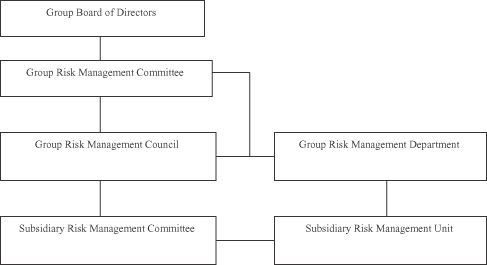
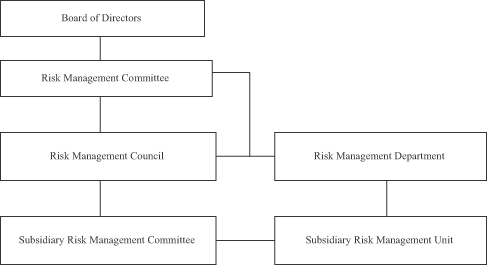
Group Risk Management Committee
Our Group Risk Management Committee is a board-level committee that is responsible for overseeing all risks and advising the board of directors with respect to risk management-related issues. The committee consists of one executive director, one non-standing director and four non-executive directors (one of whom serves as the chairman of the committee), and its major roles include:
establishing risk management strategies in accordance with the directives of the board of directors;
determining our target risk appetite;
reviewing the level of risks we are exposed to and the appropriateness of our risk management policies, systems and operations; and
allocating risk capital to each subsidiary and approving our subsidiaries’ risk limits.
Group Risk Management Council
Our Group Risk Management Council is responsible for coordinating with the risk management units of our subsidiaries to ensure that they implement the policies, guidelines and limits established by the Group Risk Management Committee. Its responsibilities include:
analyzing our risk status by using information provided by our subsidiary-level risk management units;
adjusting the integrated risk capital allocation plan and risk limits for each of our subsidiaries; and
coordinating issues relating to the group-wide integration of our risk management functions.
The Group Risk Management Council is comprised of our chief risk management officer and the chief risk management officers of all of our subsidiaries. It operates independently from all business units, and reports directly the Group Risk Management Committee. Our Group Risk Management Council convenes on a quarterly basis.
Subsidiary Risk Management Committees
Each of our subsidiaries has delegated risk management authority to its Subsidiary Risk Management Committee. Each Subsidiary Risk Management Committee measures and monitors the various risks faced by the
relevant subsidiary and reports to that subsidiary’s board of directors regarding decisions that it makes on risk management issues. It also makes certain strategic risk-related decisions regarding the operations of the relevant subsidiary, such as allocating credit risk limits, setting total exposure limits and market risk-related limits and determining which market risk derivatives instruments the subsidiary can trade. The major activities of each Subsidiary Risk Management Committee include:
determining and monitoring risk policies, guidelines, limits and tolerance levels and the level of subsidiary risk in accordance with group policy;
reviewing and analyzing the subsidiary’s risk profile;
setting limits for and adjusting the risk capital allocation plan and risk levels for each business unit within the subsidiary; and
monitoring compliance with our group-wide risk management policies and practices at the business unit and subsidiary level.
Each Subsidiary Risk Management Committee is comprised of the subsidiary’s chief executive officer, the non-executive directors on its board of directors and the director of its risk management unit.
Credit Risk Management
Credit risk is the risk of expected and unexpected losses in the event of borrower or counterparty defaults. Credit risk management aims to improve asset quality and generate stable profits while reducing risk through diversified and balanced loan portfolios. We determine the creditworthiness of each type of borrower or counterparty through reviews conducted by our credit experts and through our credit rating systems, and we set a credit limit for each borrower or counterparty.
We assess and manage all credit exposures. We measure expected losses and economic capital on assets (whether on- or off-balance sheet) that are subject to credit risk management and use expected losses and economic capital as management indicators. We manage credit risk by allocating credit risk economic capital limits. In addition, we control credit concentration risk exposure by applying and managing total exposure limits to prevent excessive risk concentration to particular industries or borrowers. Credit exposures that we assess and manage include loans to borrowers and counterparties, investments in securities, letters of credit, bankers’ acceptances, derivatives and commitments. Our risk appetite, which is the ratio of our required economic capital to our estimated available book capital, is approved by the Group Risk Management Committee once a year. Thereafter, Kookmin Bank calculates economic capital every month for its business groups and bank-wide based on attributed economic capital in accordance with the risk appetite as approved by the Group Risk Management Committee, and measures and reports profiles of credit risk on a bank-wide level and by business group regularly to its relevant business groups and senior management.management, including Kookmin Bank’s Risk Management Council and Risk Management Committee.
We use expected default rates and recovery rates to determine the expected loss rate of a borrower or counterparty. We use the expected loss rate to make credit related decisions, including pricing, loan approval and establishment of standards to be followed at each level of decision making. These rates are calculated using information gathered from our internal database. With respect to large corporate borrowers, we also use information provided by external credit rating services to calculate default rates and recovery rates.
Our credit risk management processes include:
establishing credit policy;
credit evaluation and approval;
industry assessment;
total exposure management;
collateral evaluation and monitoring;
credit risk assessment;
early warning and credit review; and
post-credit extension monitoring.
Credit Evaluation
Kookmin Bank evaluates the ability of all loan applicants to repay their debts before it approves any loans, except for loans fully guaranteed by letters of guarantee issued by the Credit Guarantee Fund and the Korea Technology Credit Guarantee Fund, and for loans fully secured by deposits.deposits and for other loans similarly guaranteed or secured. Kookmin Bank assigns each borrower or guarantor a credit rating based on the judgment of its experts or scores calculated using the appropriate credit rating system. Factors that Kookmin Bank considers in assigning credit ratings include both financial factors and non-financial factors, such as its perception of a borrower’s reliability, management and operational risk and risk relating to the borrower’s industry. The credit rating process differs according to the type, size and characteristics of a borrower.
Kookmin Bank uses its internally developed credit rating systems to rate potential borrowers. As the characteristics of each customer segment differ, Kookmin Bank uses several credit rating systems for its customers. The nature of the credit rating system used for a particular borrower depends on whether the borrower is an individual, a “small office/home office” customer, a small- and medium-sized enterprise or a large company. For large companies, Kookmin Bank has 17 credit ratings, ranging from AAA to D. For small- and medium-sized enterprises, it has 15 credit ratings ranging from AA to D. For retail customers, it has 13 credit ratings ranging from grade 1 to grade 13.
Based on the credit rating of a borrower, Kookmin Bank applies different credit policies, which affect factors such as credit limit, loan period, loan pricing, loan classification and provisioning. Kookmin Bank also uses these credit ratings in evaluating its bank-wide risk management strategy. Factors Kookmin Bank considers in making this evaluation include the profitability of each company or transaction, performance of each business unit and portfolio management. Kookmin Bank monitors the credit status of borrowers and collect information to adjust its ratings appropriately. If Kookmin Bank changes a borrower’s credit rating, it will also change the credit policies relating to that borrower and may also change the policies underlying its loan portfolio.
Retail Loan Approval Process
Mortgage Loans and Secured Retail Loans. Kookmin Bank’s processing center staff reviews mortgage loans and retail loans secured by real estate or guarantees. Branch staff employees of Kookmin Bank forward loan applications to processing centers. However, in the case of loans secured by deposits with Kookmin Bank, its branch staff approves such loans. Kookmin Bank makes lending decisions based on its assessment of the value of the collateral, debt service capability and the borrower’s score generated from its credit scoring systems.
For mortgage loans and loans secured by real estate, Kookmin Bank evaluates the value of the real estate offered as collateral using a database it has developed that contains information about real estate values throughout Korea. Kookmin Bank also uses information from a third party provider about the real estate market in Korea, which gives it up-to-date market value information for Korean real estate. In addition, Kookmin Bank’s processing center staff employees review the value of real estate provided by the evaluation system to ensure there are no significant discrepancies. Kookmin Bank bases decisions regarding the approval of such loans primarily on the results of its credit scoring systems.
For loans secured by deposits, Kookmin Bank will generally grant loans up to 95% of the deposit amount if it holds the deposit.
With respect to mortgage loans and secured retail loans, Kookmin Bank screens customers based on various items on its checklist that indicate whether the customer may have deteriorating credit using internal information and rating information from credit bureaus. Kookmin Bank also evaluates debt service capability for eligible customers pursuant to certain checklist items, such as type of residence, profession, family information, annual income, age, credit card overdue information, transaction history (with both it and other financial institutions) and other relevant credit information.
Kookmin Bank generally decides whether to evaluate a loan application within three to five days after recording the relevant information in its credit scoring systems.
Unsecured Retail Loans. Kookmin Bank reviews applications for unsecured retail loans in accordance with its credit scoring systems. These automated systems evaluate loan applications and determine an appropriate pricing for the loan. The major benefits of using a credit scoring system are that it yields uniform results regardless of the user, that it can be used effectively by employees who do not necessarily have extensive experience in credit evaluation and that it can be updated easily to reflect changing market conditions by adjusting how each factor is weighted. The staff of Kookmin Bank’s processing centers reviews the results of the credit scoring system based on information input by its branch staff and, if approved, issues the loan.
Kookmin Bank’s credit scoring systems take into account factors including borrower’s income, assets, profession, age, transaction history (with both it and other financial institutions) and other relevant credit information. The systems rank each borrower in an appropriate grade, and that grade is used as a factor in deciding whether to approve loans as well as to determine loan amounts.
Kookmin Bank generally bases its decisions on the results of its credit scoring systems to evaluate applications. However, a credit officer may overturn the results of the credit scoring systems, in certain circumstances.
Corporate Loan Approval Process
We approve corporate loans at different levels of our organization depending on the size and type of the loan, the credit risk level assessed by the credit rating system, whether the loan is secured by collateral and, if secured, the value of the collateral. The lowest level of authority is the branch staff employee of Kookmin Bank, who can approve small loans and loans that have the lowest range of credit risk. Larger loans and loans with higher credit risk are approved by higher levels of authority depending on where they fall in a matrix of loan size and credit risk. Depending on the size and terms of any particular loan or the credit risk relating to a particular borrower, more than one entity may review the application, although generally loan applications are reviewed only by the entity having corresponding authority to approve the loan.
Kookmin Bank evaluates all of its corporate borrowers by using credit rating systems, except for applicants whose borrowings are fully secured by deposits or applicants who have obtained third-party guarantees from the government or certain other very highly rated guarantors. See “—Credit Evaluation.”
For owner-operated enterprises (which we refer to as SOHOs) with total outstanding loans of ₩1 billion or less, than (Won)1 billion, Kookmin Bank has put in place a retail SOHO credit rating system, which adopts simplified credit evaluation modeling procedures. This system consists of a scoring model, a qualitative credit assessment (or QCA) model and a preliminary examination checklist. The scoring model analyzes information with respect to the customer’s personal information and bank transaction history. The QCA model analyzes information about business capability, operating capability, management capability, transaction reliability, documentary reliability and financial stability.
The preliminary examination checklist is based on information regarding the customer’s credit delinquencies, loans and outstanding credit card debt. This system classifies customers into 13 possible credit ratings.
For SOHOs with total outstanding loans of (Won)1more than ₩1 billion, or more, Kookmin Bank has put in place a separate credit rating system known as “SOHO CRS.” For other small- and medium-sized enterprises, Kookmin Bank has put in place a similar credit rating system known as CRS. For large corporations, Kookmin Bank has put in place a similar credit rating system known as LCRS. For financial institutions, certain non-profit organizations and public institutions, Kookmin Bank has put in place a similar credit rating system known as FNP CRS. The SOHO CRS, the CRS, the LCRS and the FNP CRS models consist of the following three parts:
| • | Financial Model.The financial model uses the borrower’s current status and trend of financial ratios calculated using its financial statements. The financial model classifies potential borrowers into one of three size categories and one of five types of industry. This model incorporates logistic regression and statistical methods, which use financial ratios such as stability ratio, cash flow ratio, profitability ratio and turnover ratio to make credit determinations. |
| • | QCA Model.The QCA model uses various qualitative factors, such as future repayment capability, market prospects, management capability and business capability, to evaluate borrowers. The factors that are evaluated and the weighting given to each factor vary by type of industry and size of company. |
| • | Default Signal Check Model.The default signal check model checks the consistency of the preliminary rating. This model checks various factors, including financial ratios with low scores, any non-quantitative factors that may cause a corporate default and any information arising from past experience, to determine the likelihood of a future default. The results of the default signal check model may be used to cap a borrower’s credit grade. |
In addition to the three parts outlined above, the SOHO CRS also includes a “CEO Evaluation Model,” which analyzes information with respect to personal information and bank transaction history of the individual owner of such SOHO.
We often refer to corporate information gathered or ratings assigned by external credit rating agencies, such as Korea Information Service, National Information & Credit Evaluation Inc. and Korea Management Consulting & Credit Rating Corporation, in order to improve the accuracy of our credit ratings.
Credit Card Approval Process
We make decisions on all credit card approvals based on the Financial Supervisory Service standard of review for payment ability (such as the occupation and income of the applicant), as well as a combination of KB Kookmin Card’s internal application scoring system and a credit scoring system developed by independent credit bureaus.
KB Kookmin Card’s application scoring system reflects various credit information, including basic customer information (such as credit history), transaction history with it, if any, delinquency and transaction history with other card companies and financial institutions and credit information provided by the Korea Federation of Banks and other credit bureaus. KB Kookmin Card also considers repayment ability, total assets, total outstanding debts and the length of the applicant’s relationship, if any, and past contribution to our profitability, if any.
The credit scoring system developed by credit bureaus, reflects various sources of information regarding the credit risk of customers, including delinquency and transaction history with other credit card companies and financial institutions.
On the basis of the standard of review for payment ability and the combination of the scores from our application scoring system and the credit scoring system developed by independent credit bureaus, KB Kookmin Card establishes, among other things, the term of any new approvals, initial limits and differentiation of fee rates with respect to its credit cards. KB Kookmin Card’s systems allow it to differentiate applicants into groups that receive immediate credit card approval or rejection, or that may require it to further investigate that applicant’s
credit qualifications. The initial limits of new applicants are based on their estimated monthlydisposable income, which is
based on their occupation and the value of their personal assets. KB Kookmin Card applies its fee rates to applicants differently according to risk premium and profitability.
Total Exposure Management
We establish and manage total exposure limits for corporations,chaebols and industries, as well as certain small- and medium-sized enterprises, in order to optimize the use of credit availability and avoid excessive risk concentration. We establish total exposure limits for large corporations to which we have exposures (in the form of securities or loans) of over (Won)30₩30 billion, small- and medium-sized enterprises to which we have exposures (in the form of securities or loans) of over (Won)20₩20 billion andchaebols designated by the Financial Supervisory Service or by Kookmin Bank, by reviewing factors such as their industry, size, cash flows, financial ratios and credit ratings, while establishing exposure limits for industries by peer group, as defined by us, by reviewing the sales growth rate and risk concentration for each industry. The guidelines used to set these total exposure limits are approved by Kookmin Bank’s Risk Management Council after review by the Credit Risk Management Subcommittee.
Kookmin Bank’s maximum exposure limit is within 25% of its Tier I and Tier II capital for a singlechaebol, and within 10% of its Tier I and Tier II capital for an individual large corporation.
We manage and control exposure limits on a daily basis. The principal system that we use for this purpose is the Total Exposure Management System. This system allows us to monitor and control our total exposure to large corporations,chaebols and industries. We monitor our exposure to large corporations to which we have an exposure of (Won)30₩30 billion or more, individual corporations to which we have an exposure of more than (Won)20₩20 billion, and also our exposure to the 54chaebols, which are comprised of the 3730 largestchaebols in Korea designated as such by the Financial Supervisory Service based on their outstanding exposures as well as 1724 chaebolsselected for monitoring by the Senior Executive Vice President of Kookmin Bank’s Risk Management Division. We also monitor our exposure to industries by peer groups. Our Total Exposure Management System integrates all of our credit-related risk including credit extended by our overseas branches and affiliates. The assets subject to the system include all Won-denominated and foreign currency-denominated loans, all assets in trust accounts except specified money trusts, guarantees, trade-related credits, commercial paper, corporate bonds and other securities and derivatives.
Collateral Evaluation and Monitoring System
Kookmin Bank uses the Collateral Evaluation and Monitoring System to manage the liquidation value of collateral it holds. The Collateral Evaluation and Monitoring System is a computerized collateral management system that can be accessed from Kookmin Bank’s headquarters and its branches. Using this system, Kookmin Bank can more accurately assess the actual liquidation value of collateral, determine the recovery rate on its loans and use this information in setting its credit risk management and loan policies. Kookmin Bank can monitor the value of all the collateral a borrower provides and the value of that collateral based on its liquidation value. When appraising the value of real estate collateral, which makes up the largest part of Kookmin Bank’s collateral, Kookmin Bank consults a regularly updated database provided by a third party that tracks the prices at which various types of real estate in various regions of Korea are sold. Kookmin Bank appraises the value of collateral when it makes a loan, when the loan is due for renewal and when events occur that may change the value of the collateral.
Credit Risk Management and Monitoring
Kookmin Bank’s Credit Risk Department manages and regulates our loan portfolio policies. It also analyzes and monitors our loan portfolios and monitors our compliance with the applicable limits for credit risk. Moreover, it separately manages high-risk products, such as real estate project financing loans and cross-market derivative products, by setting appropriate limits.
Credit Review
Kookmin Bank’s credit review function is independent of the business groups which manage our assets. Its Credit Review Department:
reviews internal credit regulations, policies and systems;
analyzes the credit status of selected loan assets and verifies the appropriateness of the credit evaluations/approvals made by branches and headquarters; and
evaluates the corporate credit risk of potentially insolvent companies.
More specifically, Kookmin Bank’s Credit Review Department continuously reviews the financial condition of selected borrowers with respect to their current debt, collateral, business, transactions with related parties and debt service capability. Based on such review, Kookmin Bank may adjust the borrower’s credit rating, lending policy or asset quality classification of the loan provided to the borrower, depending on the applicable circumstances. Kookmin Bank also regularly reviews other aspects of the lending process, including industries and regions in which its borrowers operate and the quality of its domestic and overseas assets. Kookmin Bank’s industry reviews focus on growth, stability, competition and ability to adapt to a changing environment. Based on the results of a particular industry review, Kookmin Bank may revise the total exposure limit assigned to that industry and lending policy for each company within that industry. When a review takes place, Kookmin Bank may adjust not only credit ratings of its borrowers based on a variety of factors, but also asset quality classification, credit limits and applied interest rates or its credit policies. Credit review results are reported to Kookmin Bank’s chief risk officer and its Risk Management Committee on a quarterly basis.
Kookmin Bank’s Credit Review Department also conducts on-site reviews of selected branches and related credit analysis centers which are experiencing increasing delinquency ratios and bad debts. During these visits Kookmin Bank examines the loan processes and recommend improvement plans and appropriate follow-up measures.
Also, based on guidelines provided by the Financial Supervisory Service to all Korean banks, Kookmin Bank operates a corporate credit risk assessment program to facilitate the identification of weak companies and possible commencement of corporate restructuring. Through this program, Kookmin Bank, together with other banks, is able to detect symptoms of financially troubled companies at an early stage, assess related credit risk and support the normalization of companies that are likely to turnaround through a workout process, or seek to liquidate those companies that are not likely to recover.
Kookmin Bank’s Credit Review Department also analyzes issues related to credit risk and provides information necessary for the formulation of effective credit policies and strategies and for effective credit risk management.
Market Risk Management
The major risk to which we are exposed is interest rate risk on debt instruments and interest bearing securities and, to a lesser extent, stock price risk and foreign exchange risk. The financial instruments that expose us to these risks are securities and financial derivatives. We are not exposed to significant commodity risk, the other recognized form of market risk, as we allow only back-to-back transactions with respect to commodities.currently do not engage in commodities trading. We are also exposed to interest rate risk and liquidity risk in Kookmin Bank’s banking book. We divide market risk into risks arising from trading activities and risks arising from non-trading activities.
Kookmin Bank’s Risk Management Council establishes overall market risk management principles. It has delegated the responsibility for the market risk management for trading activities to the Market Risk Management Subcommittee of Kookmin Bank, which is chaired by Kookmin Bank’s chief risk officer. This subcommittee meets on a regular basis each month and as required to respond to developments in the market and
the economy. Based on the policies approved by Kookmin Bank’s Risk Management Council, the Market Risk Management Subcommittee reviews and approves reports as required that include trading profits and losses, position reports, limit utilization, sensitivity analysis and VaR results for our trading activities.
Kookmin Bank’s Asset Liability Management Committee is responsible for day-to-day interest rate and liquidity risk management for its non-trading activities. The committee meets on a regular basis and as required to respond to developments in the market and the economy. Members of the Asset Liability Management Committee, acting through Kookmin Bank’s Financial ManagementPlanning Department, review Kookmin Bank’s interest rate and liquidity gap position monthly, formulate a view on interest rates, establishing strategies with respect to deposit and lending rates and review the business profile and its impact on asset and liability management.
To ensure adequate interest rate and liquidity risk management, we have assigned the responsibilities for our asset and liability management risk control to Kookmin Bank’s Risk Management Department in Kookmin Bank’s Risk Management Division, which monitors and reviews the asset and liability management risk procedures and activities of Kookmin Bank’s Financial ManagementPlanning Department, and independently reports to the management on the related issues.
Market Risk Management for Trading Activities
Our trading activities consist of:
trading activities for our own account to realize short-term trading profits in Won-denominated debt and equities markets and foreign exchange markets based on our short-term forecast of changes in the market situation; and
trading activities involving derivatives, such as swaps, forwards, futures and option transactions, to realize profits primarily from arbitrage transactions and, to a lesser extent, from selling derivative products to our customers and to hedge market risk incurred from those activities. In addition, certain derivative products that we use to hedge our own market risk are classified as trading activities as they do not qualify for hedge accounting treatment under IFRS. We believe, however, that certain of these products are effective as economic hedges.
We use derivative instruments to hedge our market risk and, to a limited extent, to make profits by trading derivative products within acceptable risk limits. The principal objective of our hedging strategy is to manage our market risk within established limits. We use the following hedging instruments to manage relevant risks:
to hedge interest rate risk arising from its trading activities, the Trading Department of Kookmin Bank occasionally uses interest rate futures (Korea Treasury Bond Futures) and interest rate swaps;
to hedge stock price risk arising from its trading activities, the Trading Department of Kookmin Bank selectively uses stock index futures;
to hedge interest rate risk and foreign exchange risk arising from our foreign currency-denominated asset and liability positions as well as our trading activities, the Trading Department and the Fund Management Department and Investment Banking Department of Kookmin Bank use interest rate swaps, cross-currency interest rate swaps, foreign exchange forwards and futures, Euro-dollar futures and currency options; and
to change the interest rate characteristics of certain assets and liabilities after the original investment or funding, we use swaps. For example, depending on the market situation, we may choose to obtain fixed rate funding instead of floating rate funding if we believe that the terms are more favorable, which we can achieve by entering into interest rate swaps.
We generally manage our market risk at the portfolio level. To control our exposure to market risk, we use EC limits set by Kookmin Bank’s Risk Management Council for Kookmin Bank and at the group and department levelslevel within Kookmin Bank, VaR, position and stop loss limits set by Kookmin Bank’s Risk Management Council for
Council for Kookmin Bank and at the group level within Kookmin Bank, and VaR, position, stop loss and sensitivity limits (PVBP, Delta, Gamma, Vega) set by Kookmin Bank’s Market Risk Management Subcommittee at the department level within Kookmin Bank. We prepared our risk control and management guidelines for derivative trading based on the regulations and guidelines promulgated by the Financial Supervisory Service.
In addition, we have implemented internal processes which include a number of key controls designed to ensure that fair value is measured appropriately, particularly where a fair value model is internally developed and used to price a significant product. See “Item 5A.5.A. Operating Results—Critical Accounting Policies—Valuation of Financial Instruments” and Notes 3.3 and 6 of the notes to our consolidated financial statements. For example, each year, Kookmin Bank’s Risk Management Department reviews the existing pricing and valuation models, with a focus on their underlying modeling assumptions and restrictions, to assess the appropriateness of their continued use. In consultation with Kookmin Bank’s Trading Department, the Risk Management Department recommends potential valuation models to Kookmin Bank’s Fair Value Evaluation Committee. Upon approval by Kookmin Bank’s Fair Value Evaluation Committee, the selected valuation models are reported to its Market Risk Management Subcommittee.
We monitor market risk arising from trading activities of our business groups and departments. The market risk measurement model we use for both our Won-denominated trading operations and foreign currency-denominated trading operations is implemented through our integrated market risk management system called Adaptiv, which enables us to generate consistent VaR numbers for all trading activities.
Value at Risk analysis.We use daily VaR to measure market risk. Our daily VaR is a statistically estimated maximum amount of loss that could occur in one day under normal distributionover a given period of financial variables. We usetime at a 99% single tail confidencegiven level to measure our daily VaR, which means the actual amount of loss may exceed the VaR, on average, once out of 100 business days.
confidence. VaR is a commonly used market risk management technique. However, this approach does have some shortcomings. VaR estimates possible losses over a certain period at a particular confidence level using past market movement data. Past market movement, however, is not necessarily a good indicator of future events, as there may be conditions and circumstances in the future that the model does not anticipate. As a result, the timing and magnitude of the actual losses can be different depending on the assumptions made at the time of calculation. In addition, the time periods used for the model, generally one or ten days, are assumed to be a sufficient holding period before liquidating the relevant underlying positions. If these holding periods are not sufficient, or too long, the VaR results may understate or overstate the potential loss. Different VaR methodologies and distributional assumptions could produce a materially different VaR. VaR is most appropriate as a risk measure for trading positions in liquid capital markets and will understate the risk associated with severe events, such as a period of extreme illiquidity.
In orderWe use a 99% single tail confidence level to measure VaR, which means the actual amount of loss may exceed the VaR, on average, once out of 100 business days. Until 2011, we useused the “variance-covariance method,”method” or parametric VaR (“PVaR”) methodology to measure our daily VaR, which takestook into account the diversification effects among different risk categories as well as within the same risk category. DifferentIn 2012, we received authorization from the Financial Services Commission to use a historical simulation VaR methodologies(“HSVaR”) methodology, which we believe to be more accurate and distributional assumptions could produceresponsive in reflecting market volatilities, to measure market risk. Our ten-day HSVaR method, which is computed using a materially different VaR.full valuation and is computationally intensive, uses an archive of historic price data and the VaR for a portfolio is estimated by creating a hypothetical time series of returns on that portfolio, obtained by running the portfolio through actual ten-day historical data and computing the changes that would have occurred in each ten-day period.
The following table shows Kookmin Bank’s daily VaRs as of December 31, 2010 and 2011, atten-day HSVaRs (at a 99% confidence level for a one-dayten-day holding period,period) as of December 31, 2011, 2012 and 2013 for interest risk, stock price risk and foreign exchange risk relating to its trading activities. The following figures were calculated on a non-consolidatedconsolidated basis.
| As of December 31, | ||||||||
| 2010 | 2011 | |||||||
| (in billions of Won) | ||||||||
Risk categories: | ||||||||
Interest risk | (Won) | 3.6 | (Won) | 1.9 | ||||
Stock price risk | 0.1 | 1.2 | ||||||
Foreign exchange risk | 5.2 | 4.9 | ||||||
Less: diversification | (3.3 | ) | (3.2 | ) | ||||
|
|
|
| |||||
Diversified VaR for overall trading activities | (Won) | 5.6 | (Won) | 4.8 | ||||
|
|
|
| |||||
Risk categories: Interest risk Stock price risk Foreign exchange risk Less: diversification Diversified VaR for overall trading activities As of December 31, 2011 2012 2013 (in billions of Won) ₩ 18.8 ₩ 8.3 ₩ 17.0 25.3 4.9 1.1 36.2 11.2 5.3 (62.6 ) (12.7 ) (7.0 ) ₩ 17.7 ₩ 11.7 ₩ 16.4
In 2011,2013, the average, high, low and ending amounts of daily VaRten-day HSVaR (at a 99% confidence level for a ten-day holding period) for Kookmin Bank relating to its trading activities were as follows.
| Trading activities VaR for 2013 | ||||||||||||||||
| Average | Minimum | Maximum | As of December 31, 2013 | |||||||||||||
| (in billions of Won) | ||||||||||||||||
Interest risk | ₩ | 16.3 | ₩ | 7.4 | ₩ | 24.9 | ₩ | 17.0 | ||||||||
Stock price risk | 3.5 | 0.9 | 7.1 | 1.1 | ||||||||||||
Foreign exchange risk | 9.3 | 5.3 | 13.6 | 5.3 | ||||||||||||
Less: diversification | (7.0 | ) | ||||||||||||||
|
| |||||||||||||||
Diversified VaR for overall trading activities | 17.3 | 10.9 | 22.2 | ₩ | 16.4 | |||||||||||
|
| |||||||||||||||
In 2012, the average, high, low and ending amounts of ten-day HSVaR (at a 99% confidence level for a one-dayten-day holding period) for Kookmin Bank relating to its trading activities were as follows:follows.
| Trading activities VaR for 2011 | Trading activities VaR for 2012 | |||||||||||||||||||||||||||||||
| Average | Minimum | Maximum | As of December 31, 2011 | Average | Minimum | Maximum | As of December 31, 2012 | |||||||||||||||||||||||||
| (in millions of Won) | (in billions of Won) | |||||||||||||||||||||||||||||||
Interest risk | (Won) | 2,537 | (Won) | 1,430 | (Won) | 4,019 | (Won) | 1,866 | ₩ | 20.1 | ₩ | 8.3 | ₩ | 29.3 | ₩ | 8.3 | ||||||||||||||||
Stock price risk | 725 | 86 | 2,569 | 1,161 | 4.2 | 0.5 | 8.7 | 4.9 | ||||||||||||||||||||||||
Foreign exchange risk | 6,464 | 4,187 | 12,610 | 4,882 | 26.6 | 9.6 | 39.2 | 11.2 | ||||||||||||||||||||||||
Less: diversification | (3,141 | ) | (12.7 | ) | ||||||||||||||||||||||||||||
|
| |||||||||||||||||||||||||||||||
Diversified VaR for overall trading activities | 6,206 | 4,000 | 11,992 | (Won) | 4,768 | 20.6 | 10.6 | 28.7 | ₩ | 11.7 | ||||||||||||||||||||||
|
| |||||||||||||||||||||||||||||||
In 2011, the average, high and low amounts of ten-day HSVaR (at a 99% confidence level for a ten-day holding period) measured as of the end of each quarter, as well as the year end amounts of ten-day HSVaR, for Kookmin Bank relating to its trading activities were as follows.
| Trading activities VaR for 2011 | ||||||||||||||||
| Average (1) | Minimum (2) | Maximum (3) | As of December 31, 2011 | |||||||||||||
| (in billions of Won) | ||||||||||||||||
Interest risk | ₩ | 17.6 | ₩ | 13.7 | ₩ | 23.2 | ₩ | 18.8 | ||||||||
Stock price risk | 22.0 | 1.6 | 57.2 | 25.3 | ||||||||||||
Foreign exchange risk | 21.7 | 12.8 | 36.2 | 36.2 | ||||||||||||
Less: diversification | (62.6 | ) | ||||||||||||||
|
| |||||||||||||||
Diversified VaR for overall trading activities | 19.7 | 8.2 | 39.5 | ₩ | 17.7 | |||||||||||
|
| |||||||||||||||
| (1) | The average of the amounts measured as of the end of each quarter in 2011. |
| (2) | The lowest of the amounts measured as of the end of each quarter in 2011. |
| (3) | The highest of the amounts measured as of the end of each quarter in 2011. |
Standardized Method. Market risk for positions not measured by VaR are measured using the standardized method for measuring market risk-based required equity capital specified by the Financial Supervisory Service, which takes into account certain risk factors. Under the standardized method, the required equity capital is measured using the risk-weighted values for each risk factor. The method used to measure the market risk-based required equity capital for each risk factor is as follows:
Interest rate risk:
General market risk: General market risk relates to the risk of losses from macroscopic events which could have an impact on interest rates, stock prices, exchange rates, and market prices of general commodities. General market interest rate risk of a debt security is calculated on its net position, taking into consideration the remaining maturity and coupon rate.
Specific risk: Specific risk relates to the risk of loss from changes in credit risk of issuers of debt securities or equities, excluding changes in general market prices. Specific interest rate risk of a debt security is measured by multiplying the interest rate position appraised based on the market price of such security by the risk-weighted value applicable to the type of debt security, credit rating and the remaining maturity.
Equity risk: General and specific equity risk are calculated by multiplying the bought or sold position by the relevant risk-weighted values.
Foreign exchange risk: Foreign exchange risk is measured by multiplying the larger of the absolute values among the net bought or sold positions of each currency by the relevant risk-weighted values.
Option risk: Option risk is measured using the delta, gamma and vega of the option.
The standardized method is used to measure the market risk of the positions for which the Financial Supervisory Service has not approved the use of the VaR method. In addition, we use the standardized method for positions which are held by subsidiaries or for which measuring VaR is difficult due to the lack of daily position data. See Note 4.4.2 of the notes to our consolidated financial statements included elsewhere in this annual report.
Starting from January 1, 2012, the market risks of trading positions held by bond-type private equity funds that are consolidated in our financial statements are measured using VaR, whereas the standardized method was used to measure such market risks up to December 31, 2011. Accordingly, the required equity capital measured
using the standardized method included the market risks of trading positions held by bond-type private equity funds prior to 2012 but no longer includes such market risks of bond-type private equity funds from 2012 onwards. The following table shows Kookmin Bank’s required equity capital measured using the standardized method as of December 31, 2011, 2012 and 2013, in each case excluding the market risks of trading positions held by bond-type private equity funds in accordance with the new methodology adopted in 2012.
| As of December 31, | ||||||||||||
| 2011 | 2012 | 2013 | ||||||||||
| (in millions of Won) | ||||||||||||
Risk categories: | ||||||||||||
Interest risk | ₩ | 886 | ₩ | 1,673 | ₩ | 921 | ||||||
Stock price risk | 3,781 | 4,567 | 2 | |||||||||
Foreign exchange risk | 9,561 | 9,081 | 9,214 | |||||||||
|
|
|
|
|
| |||||||
Total | ₩ | 14,228 | ₩ | 15,321 | ₩ | 10,137 | ||||||
|
|
|
|
|
| |||||||
Back-Testing. We conduct back testing on a daily basis to validate the adequacy of our market risk model. In back testing, we compare both the actual and hypothetical profit and loss with the VaR calculations and analyze any results that fall outside our predetermined confidence interval of 99%.
Stress testing. In addition to VaR, which assumes normal market situations, we use stress testing to assess our market risk exposure to abnormal market fluctuations. Abnormal market fluctuations include significant declines in the stock market and significant increases in the general level of interest rates. This is an important way to supplement VaR, as VaR is a statistical expression of possible loss under a given confidence level and holding period. It does not cover potential loss if the market moves in a manner that is outside our normal expectations. Stress testing projects the anticipated change in value of holding positions under certain scenarios assuming that no action is taken during a stress event to change the risk profile of a portfolio. According to Kookmin Bank’s stress testing, we estimate that as of December 31, 2011,2013, Kookmin Bank’s trading securities portfolio which represents most of our trading risk, could have lost (Won)328₩185 billion for an assumed short-term extreme decline of approximately 25% in the equity market and an approximate 10387 basis point increase in interest rates under an abnormal stress environment.
We monitor the impact of market turmoil or any abnormality by conducting stress tests and confirming that the results are within our market risk limits. If the impact is large, Kookmin Bank’s chief risk officer may request that our portfolio be restructured or other appropriate action be taken.
Interest Risk
Interest risk from trading activities arises mainly from our trading of Won-denominated debt securities. Our trading strategy is to benefit from short-term movements in the prices of debt securities arising from changes in interest rates. As our trading accounts are marked-to-market daily, we manage the interest risk related to our trading accounts using market value-based tools such as VaR and sensitivity analysis. As of December 31, 2011,2013, the VaR of Kookmin Bank’s interest risk from trading was (Won)2₩8.5 billion and the weighted average duration, or weighted average maturity, of its Won-denominated debt securities at fair value through profit or loss was approximately 2.31.18 years.
Foreign Exchange Risk
Foreign exchange risk arises because we have assets and liabilities that are denominated in currencies other than Won, as well as off-balance sheet items such as foreign exchange forwards and currency swaps.
Prior to August 2010, assets and liabilities denominated in U.S. dollars, Japanese yen, and Euro typically accounted for the majority of our foreign currency assets and liabilities. Beginning in August 2010, the
Kazakhstan tenge has accounted for the majority of our foreign currency assets and liabilities. Until August 2010, our investment in JSC Bank CenterCredit, a Kazakhstan Bank, was fully hedged against currency risk. See “Item
4B. 4.B. Business Overview—Capital Markets Activities and International Banking—International Banking.”
However, in August 2010, we decided to discontinue such currency hedge as the value of the Won had remained relatively stable against the Kazakhstan tenge for a prolonged period of time.
The difference between our foreign currency assets and liabilities is offset against forward foreign exchange positions, currency options and currency swaps to obtain our net foreign currency open position. Kookmin Bank’s Risk Management Council and Market Risk Management Subcommittee oversee Kookmin Bank’s foreign exchange exposure for both trading and non-trading purposes by establishing a limit for this net foreign currency open position, together with stop loss limits. VaR limits are established on a combined basis for our domestic operations and foreign branches.
The following table shows Kookmin Bank’s non-consolidated net open positions at the end of 20102011, 2012 and 2011.2013. Positive amounts represent long positions and negative amounts represent short positions. The net open positions held by subsidiaries other than Kookmin Bank are not significant.
| As of December 31, (1) | As of December 31, (1) | |||||||||||||||||||
| 2010 | 2011 | 2011 | 2012 | 2013 | ||||||||||||||||
| (in millions of US$) | (in millions of US$) | |||||||||||||||||||
Currency: | ||||||||||||||||||||
U.S. dollars | US$ | (30.3 | ) | US$ | (83.7 | ) | US$ | (83.7 | ) | US$ | (72.0 | ) | US$ | (135.0 | ) | |||||
Japanese yen | (6.9 | ) | (15.1 | ) | (15.1 | ) | (8.3 | ) | (17.3 | ) | ||||||||||
Euro | 1.8 | (3.3 | ) | (3.3 | ) | (4.8 | ) | (5.5 | ) | |||||||||||
Kazakhstan tenge | 296.5 | 338.3 | 338.3 | 314.5 | 82.5 | |||||||||||||||
Others | 12.9 | (20.2 | ) | (20.2 | ) | 25.4 | 22.9 | |||||||||||||
|
|
|
|
| ||||||||||||||||
Total | US$ | 274.0 | US$ | 216.0 | US$ | 216.0 | US$ | 254.8 | US$ | (52.4 | ) | |||||||||
|
|
|
|
| ||||||||||||||||
| (1) | Amounts prepared on a non-consolidated basis. |
Equity Price Risk
Equity price risk results from our equity derivatives trading portfolio in Won since we do not have any trading exposure to shares denominated in foreign currencies.currencies other than foreign equity index futures.
The equity derivatives trading portfolio in Won consists of exchange-traded stocks and nearest month or second nearest month futures contractsequity derivatives under strict limits on diversification as well as position limits and stop loss limits.
Kookmin Bank’s Risk Management Council and Market Risk Management Subcommittee set annual and monthly stop loss limits that are monitored by Kookmin Bank’s Risk Management Department. In order to ensure timely action, the stop loss limit of individual securities is monitored by the relevant middle office.
As of December 31, 2011,2013, Kookmin Bank’s equity trading position was (Won)39₩66.7 billion.
Derivative Market Risk
Our derivative trading includes interest rate and cross-currency swaps, foreign exchange forwards, stock index and interest rate futures and currency options. These activities consist primarily of the following:
arbitrage transactions to make profit from short-term discrepancies between the spot and forward derivative markets or within the derivative markets;
sales of tailor-made derivative products that meet various needs of our corporate customers and related transactions to reduce our exposure resulting from those sales;
taking positions in limited cases when we expect short-swing profits based on our market forecasts; and
trading to hedge our interest rate and foreign currency risk exposure as described above.
Market risk from trading derivatives is not significant since our derivative trading activities are primarily driven by arbitrage and customer deals with very limited open trading positions.
Market Risk Management for Non-Trading Activities
Interest Rate Risk
Our principal market risk from non-trading activities is interest rate risk. Interest rate risk arises due to mismatches in the maturities or re-pricing periods of these rate-sensitive assets and liabilities. We measure interest rate risk for Won and foreign currency assets and liabilities in our bank accounts (including derivatives) and our principal guaranteed trust accounts. Most of our interest earning assets and interest bearing liabilities are denominated in Won and our foreign currency-denominated assets and liabilities are mostly denominated in U.S. dollars.
Our principal interest rate risk management objectives are to generate stable net interest revenues and to protect our asset value against interest rate fluctuations. We principally manage this risk for our non-trading activities by analyzing and managing maturity and duration gaps between our interest earning assets and interest bearing liabilities. Although we have used hedging instruments only on a limited basis for interest rate risk management for our non-trading assets and liabilities, to date the Korean financial market has not been sufficiently developed for this purpose. We expect to increase our use of derivatives to hedge this risk in the near future as the Korean financial market becomes more sophisticated.
Interest rate gap analysis measures expected changes in net interest revenues by calculating the difference in the amounts of interest earning assets and interest bearing liabilities at each maturity and interest resetting date. We perform interest rate gap analysis for Won-denominated and foreign currency-denominated assets and trust assets on a monthly basis or more frequently when deemed necessary.
Interest Rate Gap Analysis.We perform interest rate gap analysis based on interest rate repricing maturities of assets and liabilities. However, for some of our assets and liabilities with either no maturities or unique characteristics, we use or assume certain maturities, including the following examples:
With respect to asset maturities, we assume remaining maturities of prime rate-linked loans with remaining maturities of over one year to be one year and use the actual maturities for prime rate-linked loans with remaining maturities of less than one year.
With respect to liability maturities, adapting the regression analysis using last 36 months’ average balance, we assume “non-core” and “ rate“rate sensitive core” demand deposits to have remaining maturities of three months or less; and we assume “rate insensitive core” demand deposits to have remaining maturities between one year and four years.
The following table shows Kookmin Bank’s interest rate gap for Won-denominated accounts and foreign currency-denominated accounts as of December 31, 2011.2013.
| As of December 31, 2011 (1) | ||||||||||||||||||||||||
| 0-3 Months | 3-6 Months | 6-12 Months | 1-3 Years | Over 3 Years | Total | |||||||||||||||||||
| (in billions of Won, except percentages) | ||||||||||||||||||||||||
Won-denominated Interest earning assets: | ||||||||||||||||||||||||
Loans | (Won) | 99,078 | (Won) | 50,673 | (Won) | 23,202 | (Won) | 5,403 | (Won) | 2,468 | (Won) | 180,824 | ||||||||||||
Securities | 5,646 | 2,408 | 2,985 | 11,058 | 6,824 | 28,921 | ||||||||||||||||||
Others | 5,045 | 184 | 106 | 159 | 17 | 5,511 | ||||||||||||||||||
|
|
|
|
|
|
|
|
|
|
|
| |||||||||||||
Total | (Won) | 109,769 | (Won) | 53,265 | (Won) | 26,293 | (Won) | 16,620 | (Won) | 9,309 | (Won) | 215,256 | ||||||||||||
|
|
|
|
|
|
|
|
|
|
|
| |||||||||||||
Interest bearing liabilities: | ||||||||||||||||||||||||
Deposits | (Won) | 78,235 | (Won) | 29,975 | (Won) | 52,299 | (Won) | 15,625 | (Won) | 11,562 | (Won) | 187,696 | ||||||||||||
Borrowings | 3,779 | — | — | — | — | 3,779 | ||||||||||||||||||
Others | 9,455 | 512 | 1,802 | 5,243 | 1,608 | 18,620 | ||||||||||||||||||
|
|
|
|
|
|
|
|
|
|
|
| |||||||||||||
Total | (Won) | 91,469 | (Won) | 30,487 | (Won) | 54,101 | (Won) | 20,868 | (Won) | 13,170 | (Won) | 210,095 | ||||||||||||
|
|
|
|
|
|
|
|
|
|
|
| |||||||||||||
Sensitivity gap | 18,300 | 22,778 | (27,808 | ) | (4,248 | ) | (3,861 | ) | 5,161 | |||||||||||||||
Cumulative gap | 18,300 | 41,078 | 13,270 | 9,022 | 5,161 | |||||||||||||||||||
% of total assets | 8.5 | % | 19.1 | % | 6.2 | % | 4.2 | % | 2.4 | % | ||||||||||||||
Foreign currency-denominated Interest earning assets: | ||||||||||||||||||||||||
Due from banks | (Won) | 325 | (Won) | — | (Won) | 35 | (Won) | — | (Won) | — | (Won) | 360 | ||||||||||||
Loans | 7,270 | 464 | 582 | 504 | 16 | 8,836 | ||||||||||||||||||
Securities | 456 | 49 | 38 | 330 | 124 | 997 | ||||||||||||||||||
Others | 4,958 | 1,569 | 361 | 65 | — | 6,953 | ||||||||||||||||||
|
|
|
|
|
|
|
|
|
|
|
| |||||||||||||
Total | (Won) | 13,009 | (Won) | 2,082 | (Won) | 1,016 | (Won) | 899 | (Won) | 140 | (Won) | 17,146 | ||||||||||||
|
|
|
|
|
|
|
|
|
|
|
| |||||||||||||
Interest bearing liabilities: | ||||||||||||||||||||||||
Deposits | (Won) | 2,301 | (Won) | 1,684 | (Won) | 315 | (Won) | 77 | (Won) | — | (Won) | 4,377 | ||||||||||||
Borrowings | 6,299 | 1,842 | 1,563 | 65 | 46 | 9,815 | ||||||||||||||||||
Others | 2,646 | 346 | 273 | 64 | — | 3,329 | ||||||||||||||||||
|
|
|
|
|
|
|
|
|
|
|
| |||||||||||||
Total | (Won) | 11,246 | (Won) | 3,872 | (Won) | 2,151 | (Won) | 206 | (Won) | 46 | (Won) | 17,521 | ||||||||||||
|
|
|
|
|
|
|
|
|
|
|
| |||||||||||||
Sensitivity gap | 1,763 | (1,790 | ) | (1,135 | ) | 693 | 94 | (375 | ) | |||||||||||||||
Cumulative gap | 1,763 | (27 | ) | (1,162 | ) | (469 | ) | (375 | ) | |||||||||||||||
% of total assets | 10.3 | % | (0.2 | )% | (6.8 | )% | (2.7 | )% | (2.2 | )% | ||||||||||||||
|
| As of December 31, 2013 | ||||||||||||||||||||||||
| 0-3 Months | 3-6 Months | 6-12 Months | 1-3 Years | Over 3 Years | Total | |||||||||||||||||||
| (in billions of Won, except percentages) | ||||||||||||||||||||||||
Won-denominated Interest earning assets: | ||||||||||||||||||||||||
Loans | ₩ | 72,002 | ₩ | 53,136 | ₩ | 41,279 | ₩ | 8,007 | ₩ | 10,032 | ₩ | 184,456 | ||||||||||||
Securities | 3,149 | 1,416 | 5,477 | 13,296 | 4,226 | 27,564 | ||||||||||||||||||
Others | 8,785 | 37 | 77 | 305 | 39 | 9,243 | ||||||||||||||||||
|
|
|
|
|
|
|
|
|
|
|
| |||||||||||||
Total | ₩ | 83,935 | ₩ | 54,589 | ₩ | 46,833 | ₩ | 21,608 | ₩ | 14,297 | ₩ | 221,263 | ||||||||||||
|
|
|
|
|
|
|
|
|
|
|
| |||||||||||||
Interest bearing liabilities: | ||||||||||||||||||||||||
Deposits | ₩ | 78,496 | ₩ | 35,612 | ₩ | 49,147 | ₩ | 18,659 | ₩ | 14,277 | ₩ | 196,191 | ||||||||||||
Borrowings | 4,660 | — | — | — | 30 | 4,690 | ||||||||||||||||||
Others | 8,350 | 2,355 | 1,501 | 2,290 | 3,938 | 18,433 | ||||||||||||||||||
|
|
|
|
|
|
|
|
|
|
|
| |||||||||||||
Total | ₩ | 91,506 | ₩ | 37,967 | ₩ | 50,648 | ₩ | 20,949 | ₩ | 18,245 | ₩ | 219,314 | ||||||||||||
|
|
|
|
|
|
|
|
|
|
|
| |||||||||||||
Sensitivity gap | (7,570 | ) | 16,623 | (3,815 | ) | 660 | (3,948 | ) | 1,949 | |||||||||||||||
Cumulative gap | (7,570 | ) | 9,052 | 5,237 | 5,897 | 1,949 | ||||||||||||||||||
% of total assets | (3.4 | %) | 4.1 | % | 2.4 | % | 2.7 | % | 0.9 | % | ||||||||||||||
Foreign currency-denominated Interest earning assets: | ||||||||||||||||||||||||
Due from banks | ₩ | 549 | ₩ | 210 | ₩ | 35 | ₩ | — | ₩ | — | ₩ | 794 | ||||||||||||
Loans | 9,340 | 1,653 | 540 | 170 | 8 | 11,711 | ||||||||||||||||||
Securities | 223 | 26 | 32 | 226 | 249 | 758 | ||||||||||||||||||
|
|
|
|
|
|
|
|
|
|
|
| |||||||||||||
Total | ₩ | 10,113 | ₩ | 1,889 | ₩ | 607 | ₩ | 397 | ₩ | 257 | ₩ | 13,263 | ||||||||||||
|
|
|
|
|
|
|
|
|
|
|
| |||||||||||||
Interest bearing liabilities: | ||||||||||||||||||||||||
Deposits | ₩ | 2,404 | ₩ | 1,519 | ₩ | 786 | ₩ | 129 | ₩ | 45 | ₩ | 4,884 | ||||||||||||
Borrowings | 4,285 | 851 | 614 | 25 | 79 | 5,854 | ||||||||||||||||||
Others | 2,811 | 261 | 127 | 72 | 3,271 | |||||||||||||||||||
|
|
|
|
|
|
|
|
|
|
|
| |||||||||||||
Total | ₩ | 9,501 | ₩ | 2,631 | ₩ | 1,527 | ₩ | 225 | ₩ | 124 | ₩ | 14,009 | ||||||||||||
|
|
|
|
|
|
|
|
|
|
|
| |||||||||||||
Sensitivity gap | 612 | (743 | ) | (920 | ) | 171 | 133 | (746 | ) | |||||||||||||||
Cumulative gap | 612 | (130 | ) | (1,050 | ) | (879 | ) | (746 | ) | |||||||||||||||
% of total assets | 4.6 | % | (1.0 | %) | (7.9 | %) | (6.6 | %) | (5.6 | %) | ||||||||||||||
Duration Gap Analysis. We also perform duration gap analysis to measure and manage interest rate risk. Duration gap analysis is a more long-term risk indicator than interest rate gap analysis, as interest rate gap analysis focuses more on accounting income as opposed to the market value of the assets and liabilities. We emphasize duration gap analysis because, in the long run, our principal concern with respect to interest rate fluctuations is the net asset value rather than net interest revenue changes. In 2011,2013, our asset and liability duration gap was negative and it moved between (-)0.0900.002 years and (-)0.2890.023 years. Accordingly, our net asset value would have declined between (Won)197₩4 billion and (Won)607₩51 billion if interest rates had decreased by one percentage point.
For duration gap analysis we use or assume the same maturities for different assets and liabilities that we use or assume for our interest rate gap analysis.
The following table shows duration gaps and net asset value changes when interest rates decrease by one percentage point as of the specified dates on a non-consolidated basis.
| Won denominated | Asset duration | Liability duration | Duration gap | Net asset value change | Asset Duration | Liability Duration | Duration Gap | Net Asset Value Change | ||||||||||||||||||||||||
Date | (in years) | (in years) | (in years) | (in billions of Won) | (in years) | (in years) | (in years) | (in billions of Won) | ||||||||||||||||||||||||
June 30, 2011 | 0.533 | 0.821 | (0.268 | ) | (571 | ) | ||||||||||||||||||||||||||
December 31, 2011 | 0.600 | 0.714 | (0.103 | ) | (224 | ) | ||||||||||||||||||||||||||
June 30, 2013 | 0.792 | 0.809 | (0.002 | ) | 4 | |||||||||||||||||||||||||||
December 31, 2013 | 0.792 | 0.821 | (0.023 | ) | 51 | |||||||||||||||||||||||||||
| Foreign-currency denominated | Asset duration | Liability duration | Duration gap | Net asset value change | Asset Duration | Liability Duration | Duration Gap | Net Asset Value Change | ||||||||||||||||||||||||
Date | (in years) | (in years) | (in years) | (in billions of Won) | (in years) | (in years) | (in years) | (in billions of Won) | ||||||||||||||||||||||||
June 30, 2011 | 0.402 | 0.300 | 0.115 | (16 | ) | |||||||||||||||||||||||||||
December 31, 2011 | 0.320 | 0.274 | 0.046 | (7 | ) | |||||||||||||||||||||||||||
June 30, 2013 | 0.345 | 0.286 | 0.050 | (7 | ) | |||||||||||||||||||||||||||
December 31, 2013 | 0.352 | 0.276 | 0.073 | (9 | ) | |||||||||||||||||||||||||||
We set interest rate risk limits using historical interest rate volatility of financial bonds and duration gaps with respect to expected asset and liability positions based on our annual business plans. The Financial ManagementPlanning Department in Kookmin Bank’s Strategy and FinanceFinancial Management Group submits interest rate gap analysis reports, duration gap analysis reports, sensitivity reports and interest rate risk limit compliance reports monthly to Kookmin Bank’s Asset Liability Management Committee and quarterly to Kookmin Bank’s Risk Management Committee.
The following table summarizes Kookmin Bank’s interest rate risk, taking into account asset and liability durations as of December 31, 2011.2013.
| As of December 31, 2011 | As of December 31, 2013 | |||||||||||||||||||||||||||||||||||||||||||||||
| 3 Months or Less | 3-6 Months | 6-12 Months | 1-3 Years | Over 3 Years | Total | 3 Months or Less | 3-6 Months | 6-12 Months | 1-3 Years | Over 3 Years | Total | |||||||||||||||||||||||||||||||||||||
| (in billions of Won, except percentages and maturities in years) | (in billions of Won, except percentages and maturities in years) | |||||||||||||||||||||||||||||||||||||||||||||||
Won-denominated: | ||||||||||||||||||||||||||||||||||||||||||||||||
Asset position | (Won) | 109,769 | (Won) | 53,265 | (Won) | 26,293 | (Won) | 16,620 | (Won) | 9,309 | (Won) | 215,256 | ₩ | 83,935 | ₩ | 54,589 | ₩ | 46,833 | ₩ | 21,608 | ₩ | 14,297 | ₩ | 221,263 | ||||||||||||||||||||||||
Liability position | 91,469 | 30,487 | 54,101 | 20,868 | 13,170 | 210,095 | 91,506 | 37,967 | 50,648 | 20,949 | 18,245 | 219,314 | ||||||||||||||||||||||||||||||||||||
Gap | 18,300 | 22,778 | (27,807 | ) | (4,248 | ) | (3,861 | ) | 5,161 | (7,570 | ) | 16,623 | (3,815 | ) | 660 | (3,948 | ) | 1,949 | ||||||||||||||||||||||||||||||
Average maturity | 0.275 | 0.361 | 0.718 | 2.156 | 3.070 | 0.242 | 0.482 | 0.954 | 2.708 | 4.890 | ||||||||||||||||||||||||||||||||||||||
Interest rate volatility | 1.59 | % | 2.48 | % | 2.93 | % | 2.50 | % | 2.55 | % | (0.13 | )% | (0.44 | )% | (0.76 | )% | (1.08 | )% | (1.14 | )% | ||||||||||||||||||||||||||||
Amount at risk | 80 | 204 | (586 | ) | (229 | ) | (302 | ) | (832 | ) | (4 | ) | (24 | ) | 22 | (4 | ) | 206 | 195 | |||||||||||||||||||||||||||||
Foreign currency-denominated: | ||||||||||||||||||||||||||||||||||||||||||||||||
Asset position | (Won) | 13,009 | (Won) | 2,082 | (Won) | 1,016 | (Won) | 899 | (Won) | 140 | (Won) | 17,146 | ₩ | 10,113 | ₩ | 1,889 | ₩ | 607 | ₩ | 397 | ₩ | 257 | ₩ | 13,263 | ||||||||||||||||||||||||
Liability position | 11,246 | 3,872 | 2,151 | 206 | 46 | 17,520 | 9,501 | 2,631 | 1,527 | 225 | 124 | 14,009 | ||||||||||||||||||||||||||||||||||||
Gap | 1,763 | (1,790 | ) | (1,135 | ) | 694 | 94 | (375 | ) | 612 | (743 | ) | (920 | ) | 171 | 133 | (746 | ) | ||||||||||||||||||||||||||||||
Average maturity | 0.243 | 0.481 | 0.791 | 1.859 | 3.900 | 0.25 | 0.49 | 0.97 | 2.75 | 5.01 | ||||||||||||||||||||||||||||||||||||||
Interest rate volatility | 1.66 | % | 1.65 | % | 1.61 | % | 2.18 | % | 2.47 | % | (0.23 | )% | (0.35 | )% | (0.73 | )% | (0.83 | )% | (0.96 | )% | ||||||||||||||||||||||||||||
Amount at risk | (7 | ) | 14 | 14 | (28 | ) | (9 | ) | (16 | ) | — | (2 | ) | (2 | ) | 4 | 8 | 8 | ||||||||||||||||||||||||||||||
Interest Rate VaR Analysis. Interest rate VaR is the estimated maximum possible loss on net non-trading assets due to unfavorable changes in interest rates. We calculate interest rate VaR based on interest earning assets and interest bearing liabilities, excluding trading positions, at a 99.94% confidence level. In 2012, we changed our method of calculating the interest rate impact from the previous internal simulation method of applying probable interest rate scenarios to a historical simulation method which uses actual historical price, volatility and yield changes in comparison with the current position to generate hypothetical portfolios and calculate a distribution of position and portfolio market value changes. The previous internal simulation method used extreme values in applying hypothetical interest rates to each maturity period, which we believe may result in
exaggerated interest rate VaR values. Accordingly, we believe that the change in our interest rate VaR methodology to a historical simulation method will allow us to benefit from more sophisticated risk measurements using practical scenarios. Using the historical simulation method, Kookmin Bank’s interest rate VaR was ₩179 billion as of December 31, 2012 and ₩203 billion as of December 31, 2013, respectively. See Note 4.4.3 of the notes to our consolidated financial statements included elsewhere in this annual report.
Foreign Exchange Risk
We manage foreign exchange rate risk arising from our non-trading operations together with such risks arising from our trading operations. See “—Market Risk Management for Trading Activities—Foreign Exchange Risk” above.
Liquidity Risk Management
Liquidity risk is the risk of insolvency or loss due to a disparity between the inflow and outflow of funds resulting from, for example, maturity mismatches, obtaining funds at a high price or disposing of securities at an unfavorable price due to lack of available funds. We manage our liquidity in order to meet our financial liabilities from withdrawals of deposits, redemption of matured debentures and repayments at maturity of borrowed funds. We also require sufficient liquidity to fund loans, to extend other credits and to invest in securities. Our liquidity management goal is to meet all our liability repayments on time and fund all investment opportunities even under adverse conditions. To date, we have not experienced significant liquidity risk.
We maintain liquidity by holding sufficient quantities of assets that can be liquidated to meet actual or potential demands for funds from depositors and others. We also manage liquidity by ensuring that the excess of maturing liabilities over maturing assets in any period is kept to manageable levels relative to the amount of funds we believe we could raise by issuing securities. We seek to minimize our liquidity costs by managing our liquidity position on a daily basis and by limiting the amount of cash at any time that is not invested in interest earning assets or securities.
We maintain diverse sources of liquidity to facilitate flexibility in meeting our funding requirements. We fund our operations principally by accepting deposits from retail and corporate depositors, accessing the call loan market (a short-term market for loans with maturities of less than 90 days), issuing debentures and borrowing from the Bank of Korea. We use the majority of funds we raise to extend loans or purchase securities. Generally, deposits are of shorter average maturity than loans or investments.
For Won-denominated assets and liabilities, we manage liquidity using a cash flow structure based on holding short-term liabilities and long-term assets. Generally, the average initial contract maturity of our new Won-denominated time deposits was about 11 months, while during the same period most of our new loans and securities had maturities over one year.
We manage liquidity risk within the limits set on Won and foreign currency accounts in accordance with the regulations of the Financial Services Commission. The Financial Services Commission requires Korean banks, including Kookmin Bank, to maintain a Won liquidity ratio of at least 100.0% and a foreign liquidity ratio of at least 85.0%. The Financial Services Commission defines the Won liquidity ratio as Won liquid assets (including marketable securities) due within one month divided by Won liabilities due within one month. The Won liquid assets and Won liabilities included in the calculation of Won liquidity ratio are determined in accordance with the “Standards for Calculation of Liquidity Ratio of Korean Won Currency” under the “Detailed Regulations on Supervision of Banking Business.”
Kookmin Bank’s Fund Management Department is responsible for daily liquidity risk management of its Won and foreign currency exposure. It reports monthly plans for funding and operations to the Asset Liability Management Committee of Kookmin Bank, which discusses factors such as interest rate movements and maturity structures of its deposits, loans and securities.
The following table shows Kookmin Bank’s liquidity status and limits for Won and foreign currency accounts as of December 31, 20112013 in accordance with Financial Services Commission regulations:
Won accounts: | 1 Month or Less | |||
| (in billions of Won, except percentages) | ||||
Assets (A) | ||||
Liabilities (B) | ||||
Liquidity gap | ||||
Liquidity ratio (A/B) | % | |||
Limit | 100 | % | ||
| 7 Days or Less | 1 Month or Less | 3 Months or Less | 7 Days or Less | 1 Month or Less | 3 Months or Less | |||||||||||||||||||
| (in millions of US$, except percentages) | (in millions of US$, except percentages) | |||||||||||||||||||||||
Foreign currency assets | US$ | 4,464 | US$ | 9,900 | US$ | 17,624 | US$ | 5,716 | US$ | 10,072 | US$ | 16,352 | ||||||||||||
Foreign currency liabilities | 2,839 | 8,095 | 16,747 | 4,510 | 9,133 | 14,572 | ||||||||||||||||||
Maturity gap | 1,625 | 1,804 | 877 | 1,206 | 939 | 1,780 | ||||||||||||||||||
Cumulative gap (A) | 1,625 | 1,804 | 877 | 1,206 | 939 | 1,780 | ||||||||||||||||||
Total assets (B) | 38,683 | 38,683 | 38,697 | 36,736 | 36,736 | 36,736 | ||||||||||||||||||
Liquidity gap ratio (A/B) | 4.20 | % | 4.66 | % | 105.23 | % (1) | 3.28 | % | 2.56 | % | 112.22 | % (1) | ||||||||||||
Limits | (3.00 | )% | (10.00 | )% | 85.00 | % | (3 | )% | (10 | )% | 85 | % | ||||||||||||
| (1) | Liquidity ratio. |
The Financial ManagementPlanning Department in Kookmin Bank’s Strategy and FinanceFinancial Management Group reports whether we are complying with these limits monthly to Kookmin Bank’s Asset Liability Management Committee and quarterly to Kookmin Bank’s Risk Management Committee.
Operational Risk Management
Overall Status
Basel II currently defines operational risk as the “risk of loss resulting from inadequate or failed internal processes, people and systems or from external events.” However, there is still no complete consensus on the definition of operational risk in the banking industry. We define operational risk broadly to include all financial and non-financial risks, other than credit risk, market risk, interest rate risk and liquidity risk, that may arise from our operations that could negatively impact our capital, including the risk of loss resulting from inadequate or failed internal processes, people and systems or from external events as defined under Basel II. Our operational risk management objectives include not only satisfying regulatory requirements, but also providing internal support through the growth of a strong risk management culture, reinforcement of internal controls, improvement of work processes and provision of timely feedback to management members and staff throughout the bank.
We manage our operational risk primarily through Kookmin Bank, our banking subsidiary. Kookmin Bank uses an operational risk management framework meeting the Basel II Advanced Measurement Approach, or AMA, under which Kookmin Bank:
calculates its operational risk VaR on a quarterly basis using the “loss distribution approach VaR” and “scenario based VaR” methodology, and monitors operational risk in terms of Key Risk Indicators, or KRI, using tolerance levels for each indicator;
executes integrated compliance and operational risk Control Self Assessments, or CSAs, that enhance the effect on internal controls, which Kookmin Bank employees are able to access and use for process improvement;
collects and analyzes internal and external loss data;
conducts scenario analyses to evaluate exposure to high-severity events;
manages certain insurance-related activities relating to insurance strategies established to mitigate operational risk;
examines operational risks arising in connection with the development of, changes in or discontinuance of products, policies or systems;
uses a detailed business continuity plan covering all of its operations and locations to prepare against unexpected events, including an alternate back-up site for use in disaster events as well as annual full-scale testing of such site.
refines bank-wide operational risk policies and procedures;
provides appropriate training and support to business line operational risk managers; and
reports overall operational risk status to our senior management.
Each of Kookmin Bank’s relevant business units has primary responsibility for the management of its own operational risk. In addition, the Operational Risk Unit, which is part of Kookmin Bank’s Risk Management Department, monitors bank-wide operational risk. Kookmin Bank also has internal control managers in all of its subsidiaries, departments and branches who periodically conduct CSAs and monitor KRIs. Through this method, Kookmin Bank is able to ensure proper monitoring and measurement of operational risk in each of its business groups.
Internal Control
To monitor and control operational risks, we maintain a system of comprehensive policies and have put in place a control framework designed to provide a stable and well-managed operational environment throughout our organization. Each of our subsidiaries establishes its own internal control system in accordance with the group-level internal control principles. Our Audit Committee, Audit Department and Compliance Supporting Department areis responsible for monitoring and advising our subsidiaries regarding their internal control systems. Our Audit Committee, which consists of five non-executive directors, is an independent authority that evaluates the effectiveness and efficiency of our group-wide internal control systems and business processes and monitors our subsidiaries’ compliance with such systems and processes, as well as reviews the reliability of our financial statements to secure the transparency and stability of our management (including through the activities of our independent auditors). In particular, we have established group-wide internal guidelines with respect to our subsidiaries’ reporting requirements. Our subsidiaries review their operations and their level of compliance with internal control systems and business processes on a periodic basis and, as part of this process, they are required to report any problems discovered and any remedial actions taken to our chief compliance officer, who is responsible for reporting to our Audit Committee. Based on the results of these reports, or on an ad hoc basis in response to any problem or potential problem that it identifies, the Audit Committee may direct a subsidiary to conduct an audit of its operations or, if it chooses to do so, conduct its own audit of those operations. The Audit Committee interacts on a regular basis with our Audit Department, Compliance Supporting Department and our independent auditors. In carrying out these duties, the Audit Committee ultimately protects our property for the benefit of our shareholders, investors and customers by independently monitoring our management.
Our Audit Department supports our Audit Committee in monitoring our accounting and business operations and overseeing the management of our subsidiaries’ internal control systems by performing the following activities:
general audits, which include full-scale audits of the overall operations performed according to an annual audit plan, and sectional audits of selected operations; and
special audits of troubled or weak operations, which are performed when our Audit Committee or executive officer responsible for audits deems it necessary or pursuant to requests by our board, executive officers or supervisory authorities, such as the Financial Supervisory Service.
The Financial Supervisory Service periodically conducts a general examination of our operations. It also performs specific audits on particular aspects of our operations, such as risk management, credit monitoring and liquidity, as the need arises.
Kookmin Bank’s audit division consists of two departments, the Channel Audit Department and the Management Audit Department, and they are the execution bodies for its audit committee and support Kookmin Bank’s management objectives by auditing the operations of its branches using a risk analysis system and reviewing the operations of its headquarters and subsidiaries through the use of “risk-based audit” in accordance
with the “business measurement process” audit methodology, which requires that its Management Audit Department evaluate the risk and process of its business units and concentrate their audit capacity with respect to high risk areas.
As a result of recent regulatory trends, Kookmin Bank’s audit division is continuing its efforts to establish an advanced audit system and value-added internal audit by introducing risk-based audit techniques.
Our Compliance Supporting Department operates a compliance system to ensure that all of our employees comply with the relevant laws and regulations. This system’s main function is to establish and manage our compliance program, educate employees and management and improve our internal control process.
Legal Risk
We consider legal risk as a part of our operational risk. The uncertainty of the enforceability of the obligations of our customers and counterparties creates legal risk. Changes in laws and regulations could also adversely affect us. Legal risk is higher in new areas of business where the law is often untested in the courts, although legal risk can also increase in our traditional business to the extent that the legal and regulatory landscape in Korea is changing and many new laws and regulations governing the financial industry remain untested. Our Compliance Supporting Department seeks to minimize legal risk by using stringent legal documentation, employing procedures designed to ensure that transactions are properly authorized and consulting legal advisers.
IT System Operational Risk
The integrity of our IT systems, and their ability to withstand potential catastrophic events, are crucial to our continuing operations. Accordingly, we are continuing to strengthen our disaster recovery capabilities. In order to minimize operational risks relating to our IT systems, we have implemented a multi-CPU system that runs multiple CPUs simultaneously on-site and ensures system continuity in case any of the CPUs fails. This system backs up our data systems at an off-site location on a real-time basis to ensure that our operations can be carried out normally and without material interruption in the event of CPU failure. Also, in order to protect our Internet banking services from system failures and cyber attacks, we process our Internet transactions through three separate data processing centers.
We currently test our disaster recovery systems on a quarterly basis, with the comprehensive testing including our branches and the main IT center’s disaster recovery system. Our disaster recovery capabilities involve a number of operations other than our core banking operations, including credit card and call center transactions. Internally, our IT Service Operations Department monitors all of our computerized network processes and IT systems. This department monitors and reports on any unusual delays or irregularities reported by our branches. In addition, our IT PlanningInformation Security Department is responsible for the daily monitoring of our entire information security system. Our business operations, other than our core banking and credit card operations,
regularly conduct joint IT security assessments with respect to such operations and have implemented measures to identify and respond collectively to security breach attempts, such as hacking attempts.
In 2009, Kookmin Bank obtained ISO 27001 certification, which relates to information security. In 2011, Kookmin Bank also obtained ISO 20000 certification, which relates to IT service management, and BS 25999 certification, which relates to business continuity management. Kookmin Bank is the first Korean bank to have obtained all three such international certifications.
| Item 12. | DESCRIPTION OF SECURITIES OTHER THAN EQUITY SECURITIES |
Fees and Charges
Under the terms of the deposit agreement, as a holder of our ADSs, you are required to pay the following service fees to the depositary:
Services | Fees | |
Issuance of ADSs | Up to | |
| Up to | |
Distribution of cash dividends or other cash distributions | Up to $0.02 per ADS (or portion thereof) held | |
Distribution of ADSs pursuant to stock dividends, free stock distributions or exercise of rights. | Up to | |
Distribution of securities other than ADSs or rights to purchase additional ADSs | ||
Depositary Services | Up to $0.02 per ADS (or portion thereof) held on the applicable record date(s) established by the depositary | |
| ||
As a holder of our ADSs, you are also responsible for paying certain fees and expenses incurred by the depositary and certain taxes and governmental charges such as:
| • | Fees for the transfer and registration of shares charged by the registrar and transfer agent for the shares in Korea (i.e., upon deposit and withdrawal of shares). |
Expenses incurred for converting foreign currency into U.S. dollars.
Expenses for cable, telex and fax transmissions and for delivery of securities.
| • | Taxes and duties upon the transfer of securities (i.e., when shares are deposited or withdrawn from deposit). |
Fees and expenses incurred in connection with the delivery or servicing of shares on deposit.deposit or other deposited securities.
Depositary fees payable upon the issuance and cancellationsurrender of ADSs are typically paid to the depositary by the brokers (on behalf of their clients) receiving the newly issued ADSs from the depositary and by the brokers (on behalf of their clients) delivering the ADSs to the depositary for cancellation.surrender. The brokers in turn charge these fees to their clients. Depositary fees payable in connection with distributions of cash or securities to ADS holders and the depositary services fee are charged by the depositary to the holders of record of ADSs as of the applicable ADS record date.
The depositary fees payable for cash distributions are generally deducted from the cash being distributed. In the case of distributions other than cash (i.e., stock dividend, rights), the depositary charges the applicable fee to the ADS record date holders concurrent with the distribution. In the case of ADSs registered in the name of the investor (whether certificated or uncertificated in direct registration), the depositary sends invoices to the applicable record date ADS holders. In the case of ADSs held in brokerage and custodian accounts (via the Depository Trust Company, or DTC), the depositary generally collects its fees through the systems provided by DTC (whose nominee is the registered holder of the ADSs held in DTC) from the brokers and custodians holding ADSs in their DTC accounts. The brokers and custodians who hold their clients’ ADSs in DTC accounts in turn charge their clients’ accounts the amount of the fees paid to the depositary.
In the event of refusal to pay the depositary fees, the depositary may, under the terms of the deposit agreement, refuse the requested service until payment is received or may set off the amount of the depositary fees from any distribution to be made to such holder of ADSs.
Note that the fees and charges you may be required to pay may vary over time and may be changed by us and by the depositary. You will receive prior notice of such changes.
Fees and Payments from the Depositary to Us
In 2011,2013, we received the following payments from the depositary:
Reimbursement of listing fees: | $ | 38,000 | $ | 43,194 | ||||
Reimbursement of SEC filing fees: | $ | 40,587 | $ | 2,043 | ||||
Reimbursement of settlement infrastructure fees (including DTC fees): | $ | 60,776 | ||||||
Reimbursement of expenses related to proxy process (printing, postage and distribution) and ADS holders identification: | $ | 55,554 | $ | 128,042 | ||||
Reimbursement of legal fees: | $ | 340,305 | $ | 334,951 | ||||
Reimbursement of expenses related to our investor relations activities (investor conferences and investor relations agency fees, etc.): | $ | 361,997 | $ | 317,532 | ||||
In addition, as part of its service to us, the depositary waives its fees for the standard costs and operating expenses associated with the administration of the ADS facility.
| Item 13. | DEFAULTS, DIVIDEND ARREARAGES AND DELINQUENCIES |
Not Applicableapplicable.
| Item 14. | MATERIAL MODIFICATIONS TO THE RIGHTS OF SECURITY HOLDERS AND USE OF PROCEEDS |
Not Applicableapplicable.
| Item 15. | CONTROLS AND PROCEDURES |
Disclosure Controls and Procedures
We have evaluated, with the participation of our chief executive officer and chief financial officer, the effectiveness of our disclosure controls and procedures as of December 31, 2011.2013. There are inherent limitations to the effectiveness of any system of disclosure controls and procedures, including the possibility of human error and the circumvention or overriding of the controls and procedures. Accordingly, even effective disclosure controls and procedures can only provide reasonable assurance of achieving their control objectives. Based upon our evaluation, our chief executive officer and chief financial officer concluded that our disclosure controls and procedures as of December 31, 20112013 were effective to provide reasonable assurance that information required to
be disclosed by us in the reports that we file or submit under the Securities Exchange Act of 1934, as amended, is recorded, processed, summarized and reported, within the time periods specified in the applicable rules and forms, and that it is accumulated and communicated to our management, including our chief executive officer and chief financial officer, as appropriate to allow timely decisions regarding required disclosure.
Management’s Annual Report on Internal Control Over Financial Reporting
Our management is responsible for establishing and maintaining adequate internal control over financial reporting, as such term is defined in Rules 13a-15(f) and 15d-15(f) under the Exchange Act. Under the supervision and with the participation of our management, including our chief executive officer and chief financial officer, we conducted an evaluation of the effectiveness of our internal control over financial reporting based on the framework in Internal Control—Integrated Framework 1992 issued by the Committee of Sponsoring Organizations of the Treadway Commission. Our internal control over financial reporting is a process designed
to provide reasonable assurance regarding the reliability of financial reporting and the preparation of financial statements for external purposes in accordance with IFRS as issued by the IASB. Our internal control over financial reporting includes those policies and procedures that (1) pertain to the maintenance of records that, in reasonable detail, accurately and fairly reflect the transactions and dispositions of our assets; (2) provide reasonable assurance that transactions are recorded as necessary to permit preparation of financial statements in accordance with IFRS as issued by the IASB, and that our receipts and expenditures are being made only in accordance with authorizations of our management and directors; and (3) provide reasonable assurance regarding prevention or timely detection of unauthorized acquisition, use or disposition of our assets that could have a material effect on the financial statements. Because of its inherent limitations, internal control over financial reporting is not intended to provide absolute assurance that a misstatement of our financial statements would be prevented or detected. Also, projections of any evaluation of effectiveness to future periods are subject to the risk that controls may become inadequate because of changes in conditions, or that the degree of compliance with the policies or procedures may deteriorate. Based on our evaluation, our management concluded that our internal control over financial reporting was effective as of December 31, 2011.2013. The effectiveness of our internal control over financial reporting as of December 31, 20112013 has been audited by Samil PricewaterhouseCoopers, an independent registered public accounting firm, as stated in its report included herein which expressed an unqualified opinion on the effectiveness of our internal control over financial reporting as of December 31, 20112013.
Attestation Report of the Registered Public Accounting Firm
The attestation report of our independent registered public accounting firm is furnished in Item 18 of this Form 20-F.
Changes in Internal Control Over Financial Reporting
There has been no change in our internal control over financial reporting during 20112013 that has materially affected, or is reasonably likely to materially affect, our internal control over financial reporting.
| Item 16. |
| Item 16A. |
Our board of directors has determined that each of Young Jin Kim, and Jong Cheon Lee, Seung Hee Koh and Sung Hwan Shin, our non-executive directors and members of our Audit Committee, qualifies as an “audit committee financial expert” and is independent within the meaning of this Item 16A.
| Item 16B. |
We have adopted a code of ethics, as defined in Item 16B of Form 20-F under the Exchange Act. Our code of ethics applies to our chief executive officer and chief financial officer, as well as to our non-executive
directors, non-standing directors and other officers and employees. Our code of ethics is available on our website athttp://www.kbfng.comwww.kbfg.com. If we amend the provisions of our code of ethics that apply to our chief executive officer and chief financial officer and persons performing similar functions, or if we grant any waiver of such provisions, we will disclose such amendment or waiver on our website at the same address.
| Item 16C. |
Audit and Non-audit Fees
The following table sets forth the fees billed to us by independent registered public accounting firm Samil PricewaterhouseCoopers during the fiscal years ended December 31, 20102012 and 2011:2013:
| Year Ended December 31, | Year Ended December 31, | |||||||||||||||
| 2010 | 2011 | 2012 | 2013 | |||||||||||||
| (in millions of Won) | (in millions of Won) | |||||||||||||||
Audit fees | (Won) | 5,474 | (Won) | 5,018 | ₩ | 5,241 | ₩ | 5,524 | ||||||||
Audit-related fees | 3,062 | 93 | 22 | 35 | ||||||||||||
Tax fees | — | — | 2 | 16 | ||||||||||||
All other fees | — | — | ||||||||||||||
|
|
|
| |||||||||||||
Total fees | (Won) | 8,536 | (Won) | 5,111 | ₩ | 5,265 | ₩ | 5,575 | ||||||||
|
|
|
| |||||||||||||
Audit fees in the above table are the aggregate fees billed by Samil PricewaterhouseCoopers in connection with the audits of:
our annual financial statements and the review of our interim financial statements; and
our special purpose entities in connection with the Korean Securities and Exchange Act or the Financial Investment Services and Capital Markets Act.
Audit-related fees in the above table are fees billed by Samil PricewaterhouseCoopers in connection with attestation of our financial statements under IFRS and our financial debenture offering services. Tax fees in the above table are fees billed by Samil PricewaterhouseCoopers in connection with tax filing services for our subsidiaries.
Audit Committee Pre-Approval Policies and Procedures
Our Audit Committee pre-approves the engagement of our independent auditors for audit services with respect to our financial statements. Our Audit Committee has implemented a policy regarding pre-approval of certain other services provided by our independent auditors to our subsidiaries that the Audit Committee has deemed as not affecting their independence. Under this policy, pre-approvals for the following services to our subsidiaries have been granted by our Audit Committee to each of our subsidiaries’ audit committees: (i) services related to the audit of financial statements prepared in accordance with IFRS as adopted by Korea and internal controls under Korean laws and regulations; (ii) general tax advisory services; (iii) due diligence services; (iv) issuance of comfort letters in connection with offering of securities; and (v) educational services provided to employees.
Any other audit or permitted non-audit service must be pre-approved by the Audit Committee on a case-by-case basis. Our Audit Committee did not pre-approve any non-audit services under thede minimis exception of Rule 2.01(c)(7)(i)(C) of Regulation S-X as promulgated by the Securities and Exchange Commission.
| Item 16D. |
Not Applicableapplicable.
| Item 16E. |
Neither we nor any “affiliated purchaser,” as defined in Rule 10b-18(a)(3) of the Exchange Act, purchased any of our equity securities during the period covered by this annual report.
| Item 16F. |
Not Applicable
| Item 16G. |
Differences in Corporate Governance Practices
Pursuant to the rules of the New York Stock Exchange applicable to foreign private issuers like us that are listed on the New York Stock Exchange, we are required to disclose significant differences between the New York Stock Exchange’s corporate governance standards and those that we follow under Korean law and in accordance with our own internal procedures. The following is a summary of such significant differences:
NYSE Corporate Governance Standards | KB Financial Group | |
Director | ||
| Listed companies must have a majority of independent directors. | The majority of our board of directors is independent (as defined in accordance with the New York Stock Exchange’s standards), as | |
Executive Session
| ||
| Non-management directors must meet in regularly scheduled executive sessions without management. Independent directors should meet alone in an executive session at least once a year. | Our non-executive directors hold monthly executive sessions in accordance with the Regulation of the Board of Directors. | |
Nomination/Corporate Governance Committee
| ||
| A nomination/corporate governance committee of independent directors is required. The committee must have a | Our Non-executive Director Nominating Committee is generally composed of four non-executive directors and our chief executive officer. | |
Compensation Committee
| ||
| A compensation committee of independent directors is required. The committee must have a charter that addresses the purpose, responsibilities and annual performance evaluation of the committee. The charter must be made available on the company’s website. In addition, in accordance with the U.S. Securities and Exchange Commission rules adopted pursuant to Section 952 of the Dodd-Frank Act, the New York Stock Exchange listing standards were amended to expand the factors relevant in determining whether a committee member has a relationship with the company that will materially affect that member’s duties to the compensation | We maintain an Evaluation and Compensation Committee composed of five non-executive directors. | |
NYSE Corporate Governance Standards | KB Financial Group | |
Additionally, the committee may obtain or retain the advice of a compensation adviser only after taking into consideration all factors relevant to determining that adviser’s independence from management. | ||
| Audit Committee | ||
| Listed companies must have an audit committee that satisfies the independence and other requirements of Rule 10A-3 under the Exchange Act. All members must be independent. The committee must have a charter addressing the committee’s purpose, an annual performance evaluation of the committee, and the duties and responsibilities of the committee. The charter must be made available on the company’s website. | We maintain an Audit Committee composed of five non-executive directors. Accordingly, we are in compliance with Rule 10A-3 under the Exchange Act. | |
Audit Committee Additional Requirements | ||
| Listed companies must have an audit committee that is composed of | Our Audit Committee has five members, as described above. | |
Shareholder Approval of Equity Compensation Plan | ||
| Listed companies must allow its shareholders to exercise their voting rights with respect to any material revision to the company’s equity compensation plan. | We currently have three equity compensation plans: one providing for the grant of stock options to officers and directors; performance share agreements with certain of our directors; and an employee stock ownership plan, or ESOP. | |
| All material matters related to our stock option plan are provided in our Articles of Incorporation, and any amendments to the Articles of Incorporation are subject to shareholders’ approval. | ||
| Matters related to the performance share agreements or ESOP are not subject to shareholders’ approval under Korean law. | ||
Corporate Governance Guidelines | ||
| Listed companies must adopt and disclose corporate governance guidelines. | We have adopted, but have not disclosed, corporate governance guidelines. | |
| Item 16H. |
Not Applicableapplicable.
| Item 17. | FINANCIAL STATEMENTS |
Not ApplicableApplicable.
| Item 18. | FINANCIAL STATEMENTS |
Reference is made to Item 19(a) for a list of all financial statements filed as part of this annual report.
| Item 19. | EXHIBITS |
| (a) | List of Financial Statements: |
| Page | ||||
Audited consolidated financial statements of KB Financial Group Inc. and subsidiaries, prepared in accordance with IFRS as issued by the IASB | ||||
Report of Samil PricewaterhouseCoopers, independent registered public accounting firm | F-1 | |||
| F-2 | ||||
Consolidated statements of cash flows for the years ended December 31, | F-9 | |||
| F-11 | ||||
| (b) | Exhibits |
Pursuant to the rules and regulations of the U.S. Securities and Exchange Commission, KB Financial Group has filed certain agreements as exhibits to this Annual Report on Form 20-F. These agreements may contain representations and warranties made by the parties. These representations and warranties have been made solely for the benefit of the other party or parties to such agreements and (i) may be intended not as statements of fact, but rather as a way of allocating the risk to one of the parties to such agreements if those statements turn out to be inaccurate, (ii) may have been qualified by disclosures that were made to such other party or parties and that either have been reflected in the company’s filings or are not required to be disclosed in those filings, (iii) may apply materiality standards different from what may be viewed as material to investors and (iv) were made only as of the date of such agreements or such other date(s) as may be specified in such agreements and are subject to more recent developments. Accordingly, these representations and warranties may not describe KB Financial Group’s actual state of affairs at the date of this annual report.
Number | Description | |
| | Articles of Incorporation of KB Financial Group (translation in English). | |
| 2.1*** | Form of Share Certificate of KB Financial Group’s common stock, par value | |
| 2.2**** | Form of | |
| | ||
|
| |
| List of subsidiaries of KB Financial Group. | ||
| 11.1** | Code of Ethics. | |
| 12.1 | Section 302 certifications. | |
| 13.1 | Section 906 certifications. | |
| * | Incorporated by reference to the registrant’s filing on Form 20-F (No. 000-53445), filed on April 30, 2012. |
| ** | Incorporated by reference to the registrant’s filing on Form 20-F (No. 000-53445), filed on June 23, 2010. |
| *** | Incorporated by reference to the registrant’s filing on Form 20-F (No. 000-53445), filed on June 15, 2009. |
| **** | Incorporated by reference to the registrant’s filing on Form F-6 (No. |
| ***** | Incorporated by reference to Note 40 of the consolidated financial statements of the registrant included in this annual report. |
SIGNATURES
The registrant hereby certifies that it meets all of the requirements for filing on Form 20-F and that it has duly caused and authorized the undersigned to sign this annual report on its behalf.
| KB FINANCIAL GROUP INC. |
| (Registrant) |
| /s/ |
| (Signature) |
| Chairman and Chief Executive Officer |
| (Name and Title) |
Date: April 30 , 201229, 2014
REPORT OF INDEPENDENT REGISTERED PUBLIC ACCOUNTING FIRM
To the Board of Directors and Shareholders of KB Financial Group Inc.:
In our opinion, the accompanying consolidated statements of financial position and the related consolidated statements of comprehensive income, of changes in equity and of cash flows present fairly, in all material respects, the financial position of KB Financial Group Inc. (the “Company”) and subsidiaries as of December 31, 20112013 and 2010, and January 1, 2010,2012 and the results of their operations and their cash flows for each of the twothree years in the period ended December 31, 20112013 in conformity with International Financial Reporting Standards (IFRSs) as issued by the International Accounting Standards Board. Also in our opinion, the Company maintained, in all material respects, effective internal control over financial reporting as of December 31, 2011,2013, based on criteria established in Internal Control - Control—Integrated Framework 1992 issued by the Committee of Sponsoring Organizations of the Treadway Commission (COSO). The Company’s management is responsible for these financial statements, for maintaining effective internal control over financial reporting and for its assessment of the effectiveness of internal control over financial reporting, included in the accompanying “Management’s Annual Report on Internal Control over Financial Reporting.” Our responsibility is to express opinions on these financial statements and on the Company’s internal control over financial reporting based on our integrated audits.
We conducted our audits in accordance with the standards of the Public Company Accounting Oversight Board (United States). Those standards require that we plan and perform the audits to obtain reasonable assurance about whether the financial statements are free of material misstatement and whether effective internal control over financial reporting was maintained in all material respects. Our audits of the financial statements included examining, on a test basis, evidence supporting the amounts and disclosures in the financial statements, assessing the accounting principles used and significant estimates made by management, and evaluating the overall financial statement presentation. Our audit of internal control over financial reporting included obtaining an understanding of internal control over financial reporting, assessing the risk that a material weakness exists, and testing and evaluating the design and operating effectiveness of internal control based on the assessed risk. Our audits also included performing such other procedures as we considered necessary in the circumstances. We believe that our audits providesprovide a reasonable basis for our opinions.
A company’s internal control over financial reporting is a process designed to provide reasonable assurance regarding the reliability of financial reporting and the preparation of financial statements for external purposes in accordance with generally accepted accounting principles. A company’s internal control over financial reporting includes those policies and procedures that (i) pertain to the maintenance of records that, in reasonable detail, accurately and fairly reflect the transactions and dispositions of the assets of the company; (ii) provide reasonable assurance that transactions are recorded as necessary to permit preparation of financial statements in accordance with generally accepted accounting principles, and that receipts and expenditures of the company are being made only in accordance with authorizations of management and directors of the company; and (iii) provide reasonable assurance regarding prevention or timely detection of unauthorized acquisition, use, or disposition of the company’s assets that could have a material effect on the financial statements.
Because of its inherent limitations, internal control over financial reporting may not prevent or detect misstatements. Also, projections of any evaluation of effectiveness to future periods are subject to the risk that controls may become inadequate because of changes in conditions, or that the degree of compliance with the policies or procedures may deteriorate.
/s/ Samil PricewaterhouseCoopers
Seoul, Korea
April 27, 201229, 2014
KB FINANCIAL GROUP INC. AND SUBSIDIARIES
CONSOLIDATED STATEMENTS OF FINANCIAL POSITION
AS OF JANUARY 1, 2010 AND2012, DECEMBER 31, 20102012 AND 20112013
| 2010.01.01 | 2010.12.31 | 2011.12.31 | 2011.12.31 | |||||||||||||
| Translation into U.S. dollars (Note 3) | ||||||||||||||||
| (In millions of Korean won) | (In thousands) | |||||||||||||||
ASSETS | ||||||||||||||||
Cash and due from financial institutions | (Won) | 9,102,630 | (Won) | 6,829,828 | (Won) | 9,178,125 | US$ | 7,922,421 | ||||||||
Financial assets at fair value through profit and loss | 4,592,491 | 4,013,313 | 6,326,104 | 5,460,599 | ||||||||||||
Derivative financial assets | 3,392,391 | 2,595,121 | 2,448,455 | 2,113,470 | ||||||||||||
Loans | 196,686,844 | 197,621,004 | 212,107,027 | 183,087,636 | ||||||||||||
Financial investments | 35,036,710 | 36,189,650 | 35,432,182 | 30,584,534 | ||||||||||||
Investments in associates and joint ventures | 614,717 | 723,411 | 892,132 | 770,075 | ||||||||||||
Property and equipment | 3,257,911 | 3,150,260 | 3,186,020 | 2,750,125 | ||||||||||||
Investment property | 67,977 | 52,921 | 51,552 | 44,499 | ||||||||||||
Intangible assets | 402,577 | 504,920 | 468,441 | 404,351 | ||||||||||||
Deferred income tax assets | 16,504 | 4,045 | 22,329 | 19,275 | ||||||||||||
Assets held for sale | 20,160 | 9,353 | 9,931 | 8,572 | ||||||||||||
Other assets | 6,968,059 | 7,076,796 | 7,478,519 | 6,455,347 | ||||||||||||
|
|
|
|
|
|
|
| |||||||||
Total assets | (Won) | 260,158,971 | (Won) | 258,770,622 | (Won) | 277,600,817 | US$ | 239,620,904 | ||||||||
|
|
|
|
|
|
|
| |||||||||
LIABILITIES | ||||||||||||||||
Financial liabilities at fair value through profit and loss | (Won) | 1,364,223 | (Won) | 1,294,859 | (Won) | 1,388,079 | US$ | 1,198,169 | ||||||||
Deposits | 169,065,043 | 179,862,071 | 190,337,590 | 164,296,582 | ||||||||||||
Debts | 13,834,104 | 11,744,389 | 16,823,838 | 14,522,088 | ||||||||||||
Derivative financial liabilities | 3,138,394 | 2,236,359 | 2,059,573 | 1,777,793 | ||||||||||||
Debentures | 38,661,962 | 29,107,316 | 27,069,879 | 23,366,317 | ||||||||||||
Provisions | 576,154 | 1,020,070 | 797,739 | 688,597 | ||||||||||||
Current income tax liabilities | 99,752 | 29,641 | 588,825 | 508,265 | ||||||||||||
Deferred income tax liabilities | 404,639 | 283,575 | 220,842 | 190,628 | ||||||||||||
Other liabilities | 13,584,012 | 13,526,412 | 15,214,657 | 13,133,065 | ||||||||||||
|
|
|
|
|
|
|
| |||||||||
Total liabilities | (Won) | 240,728,283 | (Won) | 239,104,692 | (Won) | 254,501,022 | US$ | 219,681,504 | ||||||||
|
|
|
|
|
|
|
| |||||||||
(Continued)
KB FINANCIAL GROUP INC. AND SUBSIDIARIES
CONSOLIDATED STATEMENTS OF FINANCIAL POSITION (CONTINUED)
AS OF JANUARY 1, 2010 AND DECEMBER 31, 2010 AND 2011
| 2010.01.01 | 2010.12.31 | 2011.12.31 | 2011.12.31 | |||||||||||||
| Translation into U.S. dollars (Note 3) | ||||||||||||||||
| (In millions of Korean won) | (In thousands) | |||||||||||||||
TOTAL EQUITY | ||||||||||||||||
Capital stock | (Won) | 1,931,758 | (Won) | 1,931,758 | (Won) | 1,931,758 | US$ | 1,667,465 | ||||||||
Capital surplus | 15,990,618 | 15,990,278 | 15,841,824 | 13,674,427 | ||||||||||||
Accumulated other comprehensive income | 350,941 | 430,572 | 191,642 | 165,422 | ||||||||||||
Retained earnings | 2,553,185 | 2,620,888 | 4,952,751 | 4,275,141 | ||||||||||||
Treasury shares | (2,476,809 | ) | (2,476,809 | ) | — | — | ||||||||||
|
|
|
|
|
|
|
| |||||||||
Equity attributable to shareholders of the company | 18,349,693 | 18,496,687 | 22,917,975 | 19,782,455 | ||||||||||||
Non-controlling interests | 1,080,995 | 1,169,243 | 181,820 | 156,945 | ||||||||||||
|
|
|
|
|
|
|
| |||||||||
Total equity | 19,430,688 | 19,665,930 | 23,099,795 | 19,939,400 | ||||||||||||
|
|
|
|
|
|
|
| |||||||||
Total liabilities and equity | (Won) | 260,158,971 | (Won) | 258,770,622 | (Won) | 277,600,817 | US$ | 239,620,904 | ||||||||
|
|
|
|
|
|
|
| |||||||||
| Jan. 1, 2012 | Dec. 31, 2012 | Dec. 31, 2013 | 2013 | |||||||||||||
| Translation into U.S. dollars(Note 3) | ||||||||||||||||
| (In millions of Korean won) | (In thousands) | |||||||||||||||
ASSETS | ||||||||||||||||
Cash and due from financial institutions | ₩ | 9,186,557 | ₩ | 10,592,605 | ₩ | 14,792,654 | US$ | 14,018,151 | ||||||||
Financial assets at fair value through profit or loss | 9,169,102 | 9,559,719 | 9,328,742 | 8,840,314 | ||||||||||||
Derivative financial assets | 2,499,445 | 2,091,285 | 1,819,409 | 1,724,150 | ||||||||||||
Loans | 213,027,696 | 213,644,791 | 219,001,356 | 207,535,045 | ||||||||||||
Financial investments | 34,992,681 | 36,467,352 | 34,849,095 | 33,024,491 | ||||||||||||
Investments in associates | 793,602 | 934,641 | 755,390 | 715,840 | ||||||||||||
Property and equipment | 3,182,746 | 3,100,393 | 3,060,843 | 2,900,586 | ||||||||||||
Investment property | 51,552 | 52,974 | 166,259 | 157,554 | ||||||||||||
Intangible assets | 461,986 | 493,131 | 443,204 | 419,999 | ||||||||||||
Deferred income tax assets | 18,944 | 18,432 | 15,422 | 14,615 | ||||||||||||
Assets held for sale | 9,931 | 35,412 | 37,718 | 35,743 | ||||||||||||
Other assets | 7,475,865 | 8,760,319 | 7,568,063 | 7,171,821 | ||||||||||||
|
|
|
|
|
|
|
| |||||||||
Total assets | ₩ | 280,870,107 | ₩ | 285,751,054 | ₩ | 291,838,155 | US$ | 276,558,309 | ||||||||
|
|
|
|
|
|
|
| |||||||||
LIABILITIES | ||||||||||||||||
Financial liabilities at fair value through profit or loss | ₩ | 1,388,079 | ₩ | 1,851,135 | ₩ | 1,115,202 | US$ | 1,056,813 | ||||||||
Derivative financial liabilities | 2,037,793 | 2,054,742 | 1,795,339 | 1,701,340 | ||||||||||||
Deposits | 193,258,556 | 197,346,205 | 200,882,064 | 190,364,429 | ||||||||||||
Debts | 16,821,233 | 15,965,458 | 14,101,331 | 13,363,024 | ||||||||||||
Debentures | 27,170,879 | 24,270,212 | 27,039,534 | 25,623,818 | ||||||||||||
Provisions | 789,780 | 669,729 | 678,073 | 642,571 | ||||||||||||
Net defined benefit liabilities | 127,437 | 83,723 | 64,473 | 61,098 | ||||||||||||
Current income tax liabilities | 588,825 | 264,666 | 211,263 | 200,202 | ||||||||||||
Deferred income tax liabilities | 242,308 | 154,303 | 61,816 | 58,580 | ||||||||||||
Other liabilities | 15,280,218 | 18,327,740 | 20,236,229 | 19,176,715 | ||||||||||||
|
|
|
|
|
|
|
| |||||||||
Total liabilities | ₩ | 257,705,108 | ₩ | 260,987,913 | ₩ | 266,185,324 | US$ | 252,248,590 | ||||||||
|
|
|
|
|
|
|
| |||||||||
TOTAL EQUITY | ||||||||||||||||
Share capital | ₩ | 1,931,758 | ₩ | 1,931,758 | ₩ | 1,931,758 | US$ | 1,830,617 | ||||||||
Capital surplus | 15,841,824 | 15,840,300 | 15,854,605 | 15,024,501 | ||||||||||||
Accumulated other comprehensive income | 161,039 | 295,142 | 336,312 | 318,703 | ||||||||||||
Retained earnings | 5,048,558 | 6,501,419 | 7,530,156 | 7,135,898 | ||||||||||||
|
|
|
|
|
|
|
| |||||||||
Equity attributable to shareholders of the parent company | 22,983,179 | 24,568,619 | 25,652,831 | 24,309,719 | ||||||||||||
Non-controlling interests | 181,820 | 194,522 | — | — | ||||||||||||
|
|
|
|
|
|
|
| |||||||||
Total equity | 23,164,999 | 24,763,141 | 25,652,831 | 24,309,719 | ||||||||||||
|
|
|
|
|
|
|
| |||||||||
Total liabilities and equity | ₩ | 280,870,107 | ₩ | 285,751,054 | ₩ | 291,838,155 | US$ | 276,558,309 | ||||||||
|
|
|
|
|
|
|
| |||||||||
The accompanying notes are an integral part of these consolidated financial statements.
KB FINANCIAL GROUP INC. AND SUBSIDIARIES
CONSOLIDATED STATEMENTS OF COMPREHENSIVE INCOME
FOR THE YEARS ENDED DECEMBER 31, 20102011, 2012 and 20112013
| 2010 | 2011 | 2011 | 2011 | 2012 | 2013 | 2013 | ||||||||||||||||||||||
Translation into (Note 3) | Translation into (Note 3) | |||||||||||||||||||||||||||
| (In millions of Korean won, except per share amounts) | (In thousands, except per share amounts) | (In millions of Korean won, except per share amounts) | (In thousands, except per share amounts) | |||||||||||||||||||||||||
Interest income | (Won) | 13,051,936 | (Won) | 13,956,257 | US$ | 12,046,834 | ₩ | 13,956,257 | ₩ | 14,210,106 | ₩ | 12,356,930 | US$ | 11,709,955 | ||||||||||||||
Interest expense | (6,878,132 | ) | (6,851,745 | ) | (5,914,325 | ) | (6,851,745 | ) | (7,172,323 | ) | (5,834,098 | ) | (5,528,640 | ) | ||||||||||||||
|
|
|
|
|
|
| ||||||||||||||||||||||
Net interest income | 6,173,804 | 7,104,512 | 6,132,509 | 7,104,512 | 7,037,783 | 6,522,832 | 6,181,315 | |||||||||||||||||||||
|
|
|
|
|
|
| ||||||||||||||||||||||
Fee and commission income | 2,481,451 | 2,829,754 | 2,442,602 | 2,829,754 | 2,753,876 | 2,657,365 | 2,518,233 | |||||||||||||||||||||
Fee and commission expense | (776,737 | ) | (1,035,004 | ) | (893,401 | ) | (1,035,004 | ) | (1,187,170 | ) | (1,178,126 | ) | (1,116,443 | ) | ||||||||||||||
|
|
|
|
|
|
| ||||||||||||||||||||||
Net fee and commission income | 1,704,714 | 1,794,750 | 1,549,201 | 1,794,750 | 1,566,706 | 1,479,239 | 1,401,790 | |||||||||||||||||||||
|
|
|
|
|
|
| ||||||||||||||||||||||
Net gains (losses) on financial assets/liabilities at fair value through profit and loss | 814,808 | 1,035,867 | 894,145 | |||||||||||||||||||||||||
Net gains(losses) on financial assets/liabilities at fair value through profit or loss | 1,035,867 | 811,964 | 756,822 | 717,197 | ||||||||||||||||||||||||
|
|
|
|
|
|
| ||||||||||||||||||||||
Net other operating income (expenses) | (1,067,343 | ) | (1,092,009 | ) | (942,606 | ) | ||||||||||||||||||||||
|
|
| ||||||||||||||||||||||||||
Employee compensation and benefits | (2,406,852 | ) | (1,870,864 | ) | (1,614,901 | ) | ||||||||||||||||||||||
Depreciation and amortization | (347,692 | ) | (342,493 | ) | (295,634 | ) | ||||||||||||||||||||||
Other general and administrative expenses | (1,612,085 | ) | (1,718,451 | ) | (1,483,342 | ) | ||||||||||||||||||||||
Net other operating income(expense) | (1,092,199 | ) | (1,531,942 | ) | (1,304,765 | ) | (1,236,451 | ) | ||||||||||||||||||||
|
|
|
|
|
|
| ||||||||||||||||||||||
General and administrative expenses | (4,366,629 | ) | (3,931,808 | ) | (3,393,877 | ) | (3,887,131 | ) | (3,845,610 | ) | (3,983,564 | ) | (3,774,996 | ) | ||||||||||||||
|
|
|
|
|
|
| ||||||||||||||||||||||
Operating profit before provision for credit losses | 3,259,354 | 4,911,312 | 4,239,372 | 4,955,799 | 4,038,901 | 3,470,564 | 3,288,855 | |||||||||||||||||||||
|
|
|
|
|
|
| ||||||||||||||||||||||
Provision for credit losses | (2,871,417 | ) | (1,512,978 | ) | (1,305,980 | ) | (1,512,979 | ) | (1,606,703 | ) | (1,443,572 | ) | (1,367,991 | ) | ||||||||||||||
|
|
|
|
|
|
| ||||||||||||||||||||||
Net operating profit | 387,937 | 3,398,334 | 2,933,392 | 3,442,820 | 2,432,198 | 2,026,992 | 1,920,864 | |||||||||||||||||||||
|
|
|
|
|
|
| ||||||||||||||||||||||
Share of profit of associates and joint ventures | (210,594 | ) | 4,963 | 4,284 | ||||||||||||||||||||||||
Net other non-operating income (expense) | (27,975 | ) | (142,491 | ) | (122,996 | ) | ||||||||||||||||||||||
Share of profit(loss) of associates | 4,963 | (15,282 | ) | (199,392 | ) | (188,953 | ) | |||||||||||||||||||||
Net other non-operating income(expense) | (142,490 | ) | (118,272 | ) | (12,309 | ) | (11,664 | ) | ||||||||||||||||||||
|
|
|
| |||||||||||||||||||||||||
Net non-operating profit (loss) | (137,527 | ) | (133,554 | ) | (211,701 | ) | (200,617 | ) | ||||||||||||||||||||
|
|
|
|
|
|
| ||||||||||||||||||||||
Profit before income tax | 149,368 | 3,260,806 | 2,814,680 | 3,305,293 | 2,298,644 | 1,815,291 | 1,720,247 | |||||||||||||||||||||
|
|
|
|
|
|
| ||||||||||||||||||||||
Tax income (expense) | 70,541 | (832,234 | ) | (718,373 | ) | |||||||||||||||||||||||
Tax income(expense) | (844,572 | ) | (558,511 | ) | (551,586 | ) | (522,706 | ) | ||||||||||||||||||||
|
|
|
|
|
|
| ||||||||||||||||||||||
Profit for the year | (Won) | 219,909 | (Won) | 2,428,572 | US$ | 2,096,307 | ₩ | 2,460,721 | ₩ | 1,740,133 | ₩ | 1,263,705 | US$ | 1,197,541 | ||||||||||||||
|
|
|
|
|
|
| ||||||||||||||||||||||
(Continued)
KB FINANCIAL GROUP INC. AND SUBSIDIARIES
CONSOLIDATED STATEMENTS OF COMPREHENSIVE INCOME (CONTINUED)
FOR THE YEARS ENDED DECEMBER 31, 20102011, 2012 and 20112013
| 2010 | 2011 | 2011 | 2011 | 2012 | 2013 | 2013 | ||||||||||||||||||||||
Translation into U.S. dollars (Note 3) | Translation into (Note 3) | |||||||||||||||||||||||||||
| (In millions of Korean won, except per share amounts) | (In thousands, except per share amounts) | (In millions of Korean won, except per share amounts) | (In thousands, except per share amounts) | |||||||||||||||||||||||||
Remeasurements of net defined benefit liabilities | ₩ | (32,149 | ) | ₩ | (30,272 | ) | ₩ | 40,984 | US$ | 38,838 | ||||||||||||||||||
|
|
|
| |||||||||||||||||||||||||
Items that will not be reclassified to profit or loss | (32,149 | ) | (30,272 | ) | 40,984 | 38,838 | ||||||||||||||||||||||
|
|
|
| |||||||||||||||||||||||||
Exchange differences on translating foreign operations | (Won) | (7,127 | ) | (Won) | 5,602 | US$ | 4,836 | 5,602 | (25,690 | ) | (2,298 | ) | (2,178 | ) | ||||||||||||||
Change in value of financial investments | 108,461 | (239,596 | ) | (206,816 | ) | (239,596 | ) | 245,757 | (3,591 | ) | (3,404 | ) | ||||||||||||||||
Shares of other comprehensive income of associates and joint ventures | (2,005 | ) | (433 | ) | (374 | ) | ||||||||||||||||||||||
Shares of other comprehensive income of associates | (433 | ) | (44,263 | ) | (9,811 | ) | (9,297 | ) | ||||||||||||||||||||
Cash flow hedges | — | (1,321 | ) | (1,140 | ) | (1,321 | ) | (813 | ) | 1,618 | 1,533 | |||||||||||||||||
|
|
|
|
|
|
| ||||||||||||||||||||||
Other comprehensive income (loss) for the year, net of tax | 99,329 | (235,748 | ) | (203,494 | ) | |||||||||||||||||||||||
Items that may be reclassified subsequently to profit or loss | (235,748 | ) | 174,991 | (14,082 | ) | (13,346 | ) | |||||||||||||||||||||
|
|
|
| |||||||||||||||||||||||||
Other comprehensive income(loss) for the year, net of tax | (267,897 | ) | 144,719 | 26,902 | 25,492 | |||||||||||||||||||||||
|
|
|
|
|
|
| ||||||||||||||||||||||
Total comprehensive income for the year | (Won) | 319,238 | (Won) | 2,192,824 | US$ | 1,892,813 | ₩ | 2,192,824 | ₩ | 1,884,852 | ₩ | 1,290,607 | US$ | 1,223,033 | ||||||||||||||
|
|
|
|
|
|
| ||||||||||||||||||||||
Profit attributable to: | ||||||||||||||||||||||||||||
Shareholders of the parent entity | (Won) | 146,600 | (Won) | 2,373,026 | US$ | 2,048,361 | ||||||||||||||||||||||
Shareholders of the parent company | ₩ | 2,405,176 | ₩ | 1,731,034 | ₩ | 1,260,509 | US$ | 1,194,512 | ||||||||||||||||||||
Non-controlling interests | 73,309 | 55,546 | 47,946 | 55,545 | 9,099 | 3,196 | 3,028 | |||||||||||||||||||||
|
|
|
|
|
|
| ||||||||||||||||||||||
| (Won) | 219,909 | (Won) | 2,428,572 | US$ | 2,096,307 | ₩ | 2,460,721 | ₩ | 1,740,133 | ₩ | 1,263,705 | US$ | 1,197,541 | |||||||||||||||
|
|
|
|
|
|
| ||||||||||||||||||||||
Total comprehensive income attributable to: | ||||||||||||||||||||||||||||
Shareholders of the parent entity | (Won) | 226,231 | (Won) | 2,134,096 | US$ | 1,842,120 | ||||||||||||||||||||||
Total comprehensive income for the year attributable to: | ||||||||||||||||||||||||||||
Shareholders of the parent company | ₩ | 2,134,096 | ₩ | 1,865,137 | ₩ | 1,301,679 | US$ | 1,233,526 | ||||||||||||||||||||
Non-controlling interests | 93,007 | 58,728 | 50,693 | 58,728 | 19,715 | (11,072 | ) | (10,493 | ) | |||||||||||||||||||
|
|
|
|
|
|
| ||||||||||||||||||||||
| (Won) | 319,238 | (Won) | 2,192,824 | US$ | 1,892,813 | ₩ | 2,192,824 | ₩ | 1,884,852 | ₩ | 1,290,607 | US$ | 1,223,033 | |||||||||||||||
|
|
|
|
|
|
| ||||||||||||||||||||||
Earnings per share | ||||||||||||||||||||||||||||
Basic earnings per share | (Won) | 427 | (Won) | 6,461 | US$ | 5.58 | ₩ | 6,548 | ₩ | 4,480 | ₩ | 3,263 | US$ | 3.09 | ||||||||||||||
Diluted earnings per share | 427 | 6,445 | 5.56 | 6,533 | 4,467 | 3,249 | 3.08 | |||||||||||||||||||||
Note) The consolidated statement of comprehensive income for the year ended December 31, 2011 was not restated in accordance with IFRS 10 but prepared based on the previous accounting policies since it is not required to adjust any earlier periods presented than the immediately preceding period under transitional provision rule of IFRS 10. See Note 2.1.
The accompanying notes are an integral part of these consolidated financial statements.
KB FINANCIAL GROUP INC. AND SUBSIDIARIES
CONSOLIDATED STATEMENTS OF CHANGES IN EQUITY
FOR THE YEARS ENDED DECEMBER 31, 20102011, 2012 and 20112013
| Equity attributable to equity holders of the parent company | Equity attributable to shareholders of the parent company | |||||||||||||||||||||||||||||||||||||||||||||||||||||||
| Capital stock | Capital surplus | Accumulated other comprehensive income | Retained earnings | Treasury share | Non-controlling interest | Total equity | Share capital | Capital surplus | Accumulated other comprehensive income | Retained earnings | Treasury share | Non-controlling interest | Total equity | |||||||||||||||||||||||||||||||||||||||||||
| (In millions of Korean won) | (In millions of Korean won) | |||||||||||||||||||||||||||||||||||||||||||||||||||||||
Balance at January 1, 2010 | (Won) | 1,931,758 | (Won) | 15,990,618 | (Won) | 350,941 | (Won) | 2,553,185 | (Won) | (2,476,809 | ) | (Won) | 1,080,995 | (Won) | 19,430,688 | |||||||||||||||||||||||||||||||||||||||||
Balance at January 1, 2011 | ₩ | 1,931,758 | ₩ | 15,990,278 | ₩ | 430,572 | ₩ | 2,620,888 | ₩ | (2,476,809 | ) | ₩ | 1,169,243 | ₩ | 19,665,930 | |||||||||||||||||||||||||||||||||||||||||
Changes in accounting policy | — | — | 8,896 | (8,896 | ) | — | — | — | ||||||||||||||||||||||||||||||||||||||||||||||||
|
|
|
|
|
|
| ||||||||||||||||||||||||||||||||||||||||||||||||||
Restated balance | ₩ | 1,931,758 | ₩ | 15,990,278 | ₩ | 439,468 | ₩ | 2,611,992 | ₩ | (2,476,809 | ) | ₩ | 1,169,243 | ₩ | 19,665,930 | |||||||||||||||||||||||||||||||||||||||||
|
|
|
|
|
|
|
|
|
|
|
|
|
| |||||||||||||||||||||||||||||||||||||||||||
Comprehensive income | ||||||||||||||||||||||||||||||||||||||||||||||||||||||||
Profit for the year | — | — | — | 146,600 | — | 73,309 | 219,909 | — | — | — | 2,405,176 | — | 55,545 | 2,460,721 | ||||||||||||||||||||||||||||||||||||||||||
Remeasurements of net defined benefit liabilities | — | — | (32,150 | ) | — | — | 1 | (32,149 | ) | |||||||||||||||||||||||||||||||||||||||||||||||
Exchange differences on translating foreign operations | — | — | 5,492 | — | — | 110 | 5,602 | |||||||||||||||||||||||||||||||||||||||||||||||||
Change in value of financial investments | — | — | 88,593 | — | — | 19,868 | 108,461 | — | — | (242,668 | ) | — | — | 3,072 | (239,596 | ) | ||||||||||||||||||||||||||||||||||||||||
Shares of other comprehensive income of associates and joint ventures | — | — | (2,005 | ) | — | — | — | (2,005 | ) | |||||||||||||||||||||||||||||||||||||||||||||||
Exchange differences on translating foreign operations | — | — | (6,957 | ) | — | — | (170 | ) | (7,127 | ) | ||||||||||||||||||||||||||||||||||||||||||||||
Others | — | (340 | ) | — | — | — | 59,841 | 59,501 | ||||||||||||||||||||||||||||||||||||||||||||||||
Shares of other comprehensive income of associates | — | — | (433 | ) | — | — | — | (433 | ) | |||||||||||||||||||||||||||||||||||||||||||||||
Cash flow hedges | — | — | (1,321 | ) | — | — | — | (1,321 | ) | |||||||||||||||||||||||||||||||||||||||||||||||
|
|
|
|
|
|
|
|
|
|
|
|
|
| |||||||||||||||||||||||||||||||||||||||||||
Total comprehensive income (loss) | — | (340 | ) | 79,631 | 146,600 | — | 152,848 | 378,739 | ||||||||||||||||||||||||||||||||||||||||||||||||
Total comprehensive income(loss) | — | — | (271,080 | ) | 2,405,176 | — | 58,728 | 2,192,824 | ||||||||||||||||||||||||||||||||||||||||||||||||
Transactions with shareholders | ||||||||||||||||||||||||||||||||||||||||||||||||||||||||
Dividends paid to shareholders of the parent company | — | — | — | (78,897 | ) | — | — | (78,897 | ) | — | — | — | (41,163 | ) | — | — | (41,163 | ) | ||||||||||||||||||||||||||||||||||||||
Dividends paid to holders of hybrid capital instruments | — | — | — | — | — | (64,600 | ) | (64,600 | ) | — | — | — | — | — | (46,151 | ) | (46,151 | ) | ||||||||||||||||||||||||||||||||||||||
Redemption of hybrid capital instruments | — | — | — | — | — | (1,000,000 | ) | (1,000,000 | ) | |||||||||||||||||||||||||||||||||||||||||||||||
Disposal of treasury share | — | (148,060 | ) | — | — | 2,476,809 | — | 2,328,749 | ||||||||||||||||||||||||||||||||||||||||||||||||
Others | — | (394 | ) | — | — | — | — | (394 | ) | |||||||||||||||||||||||||||||||||||||||||||||||
|
|
|
|
|
|
|
|
|
|
|
|
|
| |||||||||||||||||||||||||||||||||||||||||||
Total transactions with shareholders | — | — | — | (78,897 | ) | — | (64,600 | ) | (143,497 | ) | — | (148,454 | ) | — | (41,163 | ) | 2,476,809 | (1,046,151 | ) | 1,241,041 | ||||||||||||||||||||||||||||||||||||
Balance at December 31, 2010 | (Won) | 1,931,758 | (Won) | 15,990,278 | (Won) | 430,572 | (Won) | 2,620,888 | (Won) | (2,476,809 | ) | (Won) | 1,169,243 | (Won) | 19,665,930 | |||||||||||||||||||||||||||||||||||||||||
Balance at December 31, 2011 | 1,931,758 | 15,841,824 | 168,388 | 4,976,005 | — | 181,820 | 23,099,795 | |||||||||||||||||||||||||||||||||||||||||||||||||
|
|
|
|
|
|
|
|
|
|
|
|
|
| |||||||||||||||||||||||||||||||||||||||||||
(Continued)
KB FINANCIAL GROUP INC. AND SUBSIDIARIES
CONSOLIDATED STATEMENTS OF CHANGES IN EQUITY (CONTINUED)
FOR THE YEARS ENDED DECEMBER 31, 20102011, 2012 and 20112013
| Equity attributable to equity holders of the parent company | ||||||||||||||||||||||||||||
| Capital stock | Capital surplus | Accumulated other comprehensive income | Retained earnings | Treasury share | Non-controlling interest | Total equity | ||||||||||||||||||||||
| (In millions of Korean won) | ||||||||||||||||||||||||||||
Balance at January 1, 2011 | (Won) | 1,931,758 | (Won) | 15,990,278 | (Won) | 430,572 | (Won) | 2,620,888 | (Won) | (2,476,809 | ) | (Won) | 1,169,243 | (Won) | 19,665,930 | |||||||||||||
|
|
|
|
|
|
|
|
|
|
|
|
|
| |||||||||||||||
Comprehensive income | ||||||||||||||||||||||||||||
Profit for the year | — | — | — | 2,373,026 | — | 55,546 | 2,428,572 | |||||||||||||||||||||
Change in value of financial investments | — | — | (242,668 | ) | — | — | 3,072 | (239,596 | ) | |||||||||||||||||||
Shares of other comprehensive income of associates and joint ventures | — | — | (433 | ) | — | — | — | (433 | ) | |||||||||||||||||||
Cash flow hedges | — | — | (1,321 | ) | — | — | — | (1,321 | ) | |||||||||||||||||||
Currency translation differences | — | — | 5,492 | — | — | 110 | 5,602 | |||||||||||||||||||||
Others | — | (394 | ) | — | — | — | — | (394 | ) | |||||||||||||||||||
|
|
|
|
|
|
|
|
|
|
|
|
|
| |||||||||||||||
Total comprehensive income (loss) | — | (394 | ) | (238,930 | ) | 2,373,026 | — | 58,728 | 2,192,430 | |||||||||||||||||||
Transactions with shareholders | ||||||||||||||||||||||||||||
Dividends paid to shareholders of the parent company | — | — | — | (41,163 | ) | — | — | (41,163 | ) | |||||||||||||||||||
Dividends paid to holders of hybrid capital instruments | — | — | — | — | — | (46,151 | ) | (46,151 | ) | |||||||||||||||||||
Disposal of hybrid capital instruments | — | — | — | — | — | (1,000,000 | ) | (1,000,000 | ) | |||||||||||||||||||
Disposal of treasury share and others | — | (148,060 | ) | — | — | 2,476,809 | — | 2,328,749 | ||||||||||||||||||||
|
|
|
|
|
|
|
|
|
|
|
|
|
| |||||||||||||||
Total transactions with shareholders | — | (148,060 | ) | — | (41,163 | ) | 2,476,809 | (1,046,151 | ) | 1,241,435 | ||||||||||||||||||
Balance at December 31, 2011 | (Won) | 1,931,758 | (Won) | 15,841,824 | (Won) | 191,642 | (Won) | 4,952,751 | (Won) | — | (Won) | 181,820 | (Won) | 23,099,795 | ||||||||||||||
|
|
|
|
|
|
|
|
|
|
|
|
|
| |||||||||||||||
| Equity attributable to shareholders of the parent company | ||||||||||||||||||||||||||||
| Share capital | Capital surplus | Accumulated other comprehensive income | Retained earnings | Treasury share | Non-controlling interest | Total equity | ||||||||||||||||||||||
| (In millions of Korean won) | ||||||||||||||||||||||||||||
Balance at January 1, 2012 | ₩ | 1,931,758 | ₩ | 15,841,824 | ₩ | 168,388 | ₩ | 4,976,005 | ₩ | — | ₩ | 181,820 | ₩ | 23,099,795 | ||||||||||||||
Changes in accounting policy | — | — | (7,349 | ) | 72,553 | — | 65,204 | |||||||||||||||||||||
|
|
|
|
|
|
|
|
|
|
|
|
|
| |||||||||||||||
Restated balance | ₩ | 1,931,758 | ₩ | 15,841,824 | ₩ | 161,039 | ₩ | 5,048,558 | ₩ | — | ₩ | 181,820 | ₩ | 23,164,999 | ||||||||||||||
|
|
|
|
|
|
|
|
|
|
|
|
|
| |||||||||||||||
Comprehensive income | ||||||||||||||||||||||||||||
Profit for the year | — | — | — | 1,731,034 | — | 9,099 | 1,740,133 | |||||||||||||||||||||
Remeasurements of net defined benefit liabilities | — | — | (30,253 | ) | — | — | (19 | ) | (30,272 | ) | ||||||||||||||||||
Exchange differences on translating foreign operations | — | — | (25,597 | ) | — | — | (93 | ) | (25,690 | ) | ||||||||||||||||||
Change in value of financial investments | — | — | 235,029 | — | — | 10,728 | 245,757 | |||||||||||||||||||||
Shares of other comprehensive income of associates | — | — | (44,263 | ) | — | — | — | (44,263 | ) | |||||||||||||||||||
Cash flow hedges | — | — | (813 | ) | — | — | — | (813 | ) | |||||||||||||||||||
|
|
|
|
|
|
|
|
|
|
|
|
|
| |||||||||||||||
Total comprehensive income | — | — | 134,103 | 1,731,034 | — | 19,715 | 1,884,852 | |||||||||||||||||||||
Transactions with shareholders | ||||||||||||||||||||||||||||
Dividends paid to shareholders of the parent company | — | — | — | (278,173 | ) | — | — | (278,173 | ) | |||||||||||||||||||
Changes in interest in subsidiaries | — | (1,524 | ) | — | — | — | (7,013 | ) | (8,537 | ) | ||||||||||||||||||
|
|
|
|
|
|
|
|
|
|
|
|
|
| |||||||||||||||
Total transactions with shareholders | — | (1,524 | ) | — | (278,173 | ) | — | (7,013 | ) | (286,710 | ) | |||||||||||||||||
Balance at December 31, 2012 | ₩ | 1,931,758 | ₩ | 15,840,300 | ₩ | 295,142 | ₩ | 6,501,419 | ₩— | ₩ | 194,522 | ₩ | 24,763,141 | |||||||||||||||
|
|
|
|
|
|
|
|
|
|
|
|
|
| |||||||||||||||
(Continued)
KB FINANCIAL GROUP INC. AND SUBSIDIARIES
CONSOLIDATED STATEMENTS OF CHANGES IN EQUITY (CONTINUED)
FOR THE YEARS ENDED DECEMBER 31, 20102011, 2012 and 20112013
| Equity attributable to equity holders of the parent company | ||||||||||||||||||||||||||||
| Capital Stock | Capital Surplus | Accumulated other comprehensive income | Retained earnings | Treasury share | Non-controlling Interest | Total equity | ||||||||||||||||||||||
| (Translation into U.S. dollars (Note 3) (In thousands) | ||||||||||||||||||||||||||||
Balance at January 1, 2011 | US$ | 1,667,465 | US$ | 13,802,571 | US$ | 371,663 | US$ | 2,262,312 | US$ | (2,137,945 | ) | US$ | 1,009,273 | US$ | 16,975,339 | |||||||||||||
|
|
|
|
|
|
|
|
|
|
|
|
|
| |||||||||||||||
Comprehensive income | ||||||||||||||||||||||||||||
Profit for the year | — | — | — | 2,048,361 | — | 47,946 | 2,096,307 | |||||||||||||||||||||
Change in value of financial investments | — | — | (209,468 | ) | — | — | 2,652 | (206,816 | ) | |||||||||||||||||||
Shares of other comprehensive income of associates and joint ventures | — | — | (374 | ) | — | — | — | (374 | ) | |||||||||||||||||||
Cash flow hedges | — | — | (1,140 | ) | — | — | — | (1,140 | ) | |||||||||||||||||||
Currency translation differences | — | — | 4,741 | — | — | 95 | 4,836 | |||||||||||||||||||||
Others | — | (340 | ) | — | — | — | — | (340 | ) | |||||||||||||||||||
|
|
|
| �� |
|
|
|
|
|
|
|
|
|
| ||||||||||||||
Total comprehensive income (loss) | — | (340 | ) | (206,241 | ) | 2,048,361 | — | 50,693 | 1,892,473 | |||||||||||||||||||
Transactions with shareholders | ||||||||||||||||||||||||||||
Dividends paid to shareholders of the parent company | — | — | — | (35,532 | ) | — | — | (35,532 | ) | |||||||||||||||||||
Dividends paid to holders of hybrid capital instruments | — | — | — | — | — | (39,837 | ) | (39,837 | ) | |||||||||||||||||||
Disposal of hybrid capital instruments | — | — | — | — | — | (863,184 | ) | (863,184 | ) | |||||||||||||||||||
Disposal of treasury share and others | — | (127,804 | ) | — | — | 2,137,945 | — | 2,010,141 | ||||||||||||||||||||
|
|
|
|
|
|
|
|
|
|
|
|
|
| |||||||||||||||
Total transactions with shareholders | — | (127,804 | ) | — | (35,532 | ) | 2,137,945 | (903,021 | ) | 1,071,588 | ||||||||||||||||||
Balance at December 31, 2011 | US$ | 1,667,465 | US$ | 13,674,427 | US$ | 165,422 | US$ | 4,275,141 | US$ | — | US$ | 156,945 | US$ | 19,939,400 | ||||||||||||||
|
|
|
|
|
|
|
|
|
|
|
|
|
| |||||||||||||||
| Equity attributable to shareholders of the parent company | ||||||||||||||||||||||||||||
| Share capital | Capital surplus | Accumulated other comprehensive income | Retained earnings | Treasury share | Non-controlling interest | Total equity | ||||||||||||||||||||||
| (In millions of Korean won) | ||||||||||||||||||||||||||||
Balance at January 1, 2013 | ₩ | 1,931,758 | ₩ | 15,840,300 | ₩ | 295,142 | ₩ | 6,501,419 | ₩ | — | ₩ | 194,522 | ₩ | 24,763,141 | ||||||||||||||
|
|
|
|
|
|
|
|
|
|
|
|
|
| |||||||||||||||
Comprehensive income | ||||||||||||||||||||||||||||
Profit for the year | — | — | — | 1,260,509 | — | 3,196 | 1,263,705 | |||||||||||||||||||||
Remeasurements of net defined benefit liabilities | — | — | 40,984 | — | — | — | 40,984 | |||||||||||||||||||||
Exchange differences on translating foreign operations | — | — | (2,372 | ) | — | — | 74 | (2,298 | ) | |||||||||||||||||||
Change in value of financial investments | — | — | 10,751 | — | — | (14,342 | ) | (3,591 | ) | |||||||||||||||||||
Shares of other comprehensive income of associates | — | — | (9,811 | ) | — | — | — | (9,811 | ) | |||||||||||||||||||
Cash flow hedges | — | — | 1,618 | — | — | — | 1,618 | |||||||||||||||||||||
|
|
|
|
|
|
|
|
|
|
|
|
|
| |||||||||||||||
Total comprehensive income | — | — | 41,170 | 1,260,509 | — | (11,072 | ) | 1,290,607 | ||||||||||||||||||||
Transactions with shareholders | ||||||||||||||||||||||||||||
Dividends paid to shareholders of the parent company | — | — | — | (231,811 | ) | — | — | (231,811 | ) | |||||||||||||||||||
Changes in interest in subsidiaries | — | 14,305 | — | 39 | — | (183,450 | ) | (169,106 | ) | |||||||||||||||||||
|
|
|
|
|
|
|
|
|
|
|
|
|
| |||||||||||||||
Total transactions with shareholders | — | 14,305 | — | (231,772 | ) | — | (183,450 | ) | (400,917 | ) | ||||||||||||||||||
Balance at December 31, 2013 | ₩ | 1,931,758 | ₩ | 15,854,605 | ₩ | 336,312 | ��� | 7,530,156 | ₩ | — | ₩ | — | ₩ | 25,652,831 | ||||||||||||||
|
|
|
|
|
|
|
|
|
|
|
|
|
| |||||||||||||||
(Continued)
KB FINANCIAL GROUP INC. AND SUBSIDIARIES
CONSOLIDATED STATEMENTS OF CHANGES IN EQUITY (CONTINUED)
FOR THE YEARS ENDED DECEMBER 31, 2011, 2012 and 2013
| Equity attributable to shareholders of the parent company | ||||||||||||||||||||||||||||
| Share capital | Capital surplus | Accumulated other comprehensive income | Retained earnings | Treasury share | Non-controlling interest | Total equity | ||||||||||||||||||||||
| (Translation into U.S. dollars(Note 3))(In thousands) | ||||||||||||||||||||||||||||
Balance at January 1, 2013 | US$ | 1,830,617 | US$ | 15,010,946 | US$ | 279,690 | US$ | 6,161,022 | US$ | — | US$ | 184,337 | US$ | 23,466,612 | ||||||||||||||
|
|
|
|
|
|
|
|
|
|
|
|
|
| |||||||||||||||
Comprehensive income | ||||||||||||||||||||||||||||
Profit for the year | — | — | — | 1,194,512 | — | 3,028 | 1,197,540 | |||||||||||||||||||||
Remeasurements of net defined benefit liabilities | — | — | 38,838 | — | — | — | 38,838 | |||||||||||||||||||||
Exchange differences on translating foreign operations | — | — | (2,249 | ) | — | — | 70 | (2,179 | ) | |||||||||||||||||||
Change in value of financial investments | — | — | 10,188 | — | — | (13,592 | ) | (3,404 | ) | |||||||||||||||||||
Shares of other comprehensive income of associates | — | — | (9,297 | ) | — | — | — | (9,297 | ) | |||||||||||||||||||
Cash flow hedges | — | — | 1,533 | — | — | — | 1,533 | |||||||||||||||||||||
|
|
|
|
|
|
|
|
|
|
|
|
|
| |||||||||||||||
Total comprehensive income | — | — | 39,013 | 1,194,512 | — | (10,494 | ) | 1,223,031 | ||||||||||||||||||||
Transactions with shareholders | ||||||||||||||||||||||||||||
Dividends paid to shareholders of the parent company | — | — | — | (219,674 | ) | — | — | (219,674 | ) | |||||||||||||||||||
Others | — | 13,555 | — | 38 | — | (173,843 | ) | (160,250 | ) | |||||||||||||||||||
|
|
|
|
|
|
|
|
|
|
|
|
|
| |||||||||||||||
Total transactions with shareholders | — | 13,555 | — | (219,636 | ) | — | (173,843 | ) | (379,924 | ) | ||||||||||||||||||
Balance at December 31, 2013 | US$ | 1,830,617 | US$ | 15,038,056 | US$ | 357,716 | US$ | 8,110,774 | US$ | — | US$ | (184,337 | ) | US$ | 25,152,826 | |||||||||||||
|
|
|
|
|
|
|
|
|
|
|
|
|
| |||||||||||||||
Note) The consolidated statement of changes in equity for the year ended December 31, 2011 was not restated in accordance with IFRS 10 but prepared based on the previous accounting policies since it is not required to adjust any earlier periods presented than the immediately preceding period under transitional provision rule of IFRS 10. See Note 2.1.
The accompanying notes are an integral part of these consolidated financial statements.
KB FINANCIAL GROUP INC. AND SUBSIDIARIES
CONSOLIDATED STATEMENTS OF CASH FLOWS
FOR THE YEARS ENDED DECEMBER 31, 20102011, 2012 and 20112013
| 2010 | 2011 | 2011 | 2011 | 2012 | 2013 | 2013 | ||||||||||||||||||||||
Translation into (Note 3) | Translation into (Note 3) | |||||||||||||||||||||||||||
| (In millions of Korean won) | (In thousands) | (In millions of Korean won) | (In thousands) | |||||||||||||||||||||||||
Cash flows from operating activities: | ||||||||||||||||||||||||||||
Profit for the year | (Won) | 219,909 | (Won) | 2,428,572 | US$ | 2,096,307 | ₩ | 2,460,721 | ₩ | 1,740,133 | ₩ | 1,263,705 | US$ | 1,197,541 | ||||||||||||||
|
|
|
|
|
|
| ||||||||||||||||||||||
Adjustment for non-cash items | ||||||||||||||||||||||||||||
Net gains losses (gains) on financial assets/liabilities at fair value through profit and loss | (409,245 | ) | (391,197 | ) | (337,675 | ) | ||||||||||||||||||||||
Net losses (gains) on derivative financial instruments for hedging purposes | (102,692 | ) | (107,371 | ) | (92,681 | ) | ||||||||||||||||||||||
Net loss(gain) on financial assets/liabilities at fair value through profit or loss | (391,197 | ) | (247,854 | ) | (110,425 | ) | (104,643 | ) | ||||||||||||||||||||
Net loss(gain) on derivative financial instruments for hedging purposes | (107,371 | ) | 15,165 | 48,787 | 46,233 | |||||||||||||||||||||||
Adjustment of fair value of derivative financial instruments | 32,466 | 207,522 | 179,130 | 207,522 | 42 | 699 | 662 | |||||||||||||||||||||
Provision for credit loss | 2,871,417 | 1,512,978 | 1,305,980 | 1,512,978 | 1,606,703 | 1,443,572 | 1,367,991 | |||||||||||||||||||||
Net gains on financial investments | (112,551 | ) | (481,459 | ) | (415,589 | ) | ||||||||||||||||||||||
Share of profit (loss) of associates and joint ventures | 210,594 | (4,963 | ) | (4,284 | ) | |||||||||||||||||||||||
Net loss(gain) on financial investments | (481,459 | ) | 148,211 | (1,191 | ) | (1,129 | ) | |||||||||||||||||||||
Share of loss (profit) of associates | (4,963 | ) | 15,282 | 199,392 | 188,953 | |||||||||||||||||||||||
Depreciation and amortization expense | 347,834 | 342,656 | 295,775 | 342,656 | 328,320 | 286,858 | 271,840 | |||||||||||||||||||||
Other net losses on property and equipment | 426 | 18,533 | 15,997 | |||||||||||||||||||||||||
Share-based payments (reversal) | (4,850 | ) | (7,609 | ) | (6,568 | ) | ||||||||||||||||||||||
Legal reserve appropriation | 811,483 | 673,259 | 581,147 | |||||||||||||||||||||||||
Changes in provision for accrued severance benefits | 151,343 | 204,337 | 176,381 | |||||||||||||||||||||||||
Net interest income | 17,943 | 84,470 | 72,913 | |||||||||||||||||||||||||
Losses (gains) on foreign currency translation | 666,451 | 273,971 | 236,488 | |||||||||||||||||||||||||
Other income (expenses) | 129,629 | 130,206 | 112,394 | |||||||||||||||||||||||||
Other net losses on property and equipment/intangible assets | 18,533 | 40,881 | 39,777 | 37,695 | ||||||||||||||||||||||||
Share-based payments(reversal) | (7,609 | ) | 13,871 | 17,289 | 16,384 | |||||||||||||||||||||||
Policy reserve appropriation | 673,259 | 1,305,730 | 761,877 | 721,987 | ||||||||||||||||||||||||
Post-employment benefits | 172,188 | 172,391 | 172,579 | 163,544 | ||||||||||||||||||||||||
Net interest expense | 84,470 | 229,691 | 314,866 | 298,381 | ||||||||||||||||||||||||
Loss(gains) on foreign currency translation | 273,971 | (148,877 | ) | 17,082 | 16,188 | |||||||||||||||||||||||
Net other expense(income) | 130,206 | 2,783 | (24,981 | ) | (23,676 | ) | ||||||||||||||||||||||
|
|
|
|
|
|
| ||||||||||||||||||||||
| 4,610,248 | 2,455,333 | 2,119,407 | 2,455,333 | 3,482,339 | 3,166,181 | 3,000,410 | ||||||||||||||||||||||
|
|
|
|
|
|
| ||||||||||||||||||||||
Changes in operating assets and liabilities | ||||||||||||||||||||||||||||
Financial asset at fair value through profit and loss | 606,154 | (2,370,999 | ) | (2,046,611 | ) | |||||||||||||||||||||||
Financial asset at fair value through profit or loss | (2,370,999 | ) | (3,102,488 | ) | 214,181 | 202,967 | ||||||||||||||||||||||
Derivative financial instruments | 421,458 | 481,502 | 415,625 | 481,502 | 193,373 | 116,660 | 110,552 | |||||||||||||||||||||
Loans | (3,774,205 | ) | (17,023,252 | ) | (14,694,219 | ) | (17,023,252 | ) | (2,964,229 | ) | (7,335,434 | ) | (6,951,371 | ) | ||||||||||||||
Deferred income tax assets | 19,145 | — | — | — | 3,211 | 1,349 | 1,278 | |||||||||||||||||||||
Other assets | 2,706,174 | (877,081 | ) | (757,083 | ) | (877,081 | ) | 2,201,280 | (5,078,285 | ) | (4,812,400 | ) | ||||||||||||||||
Financial liabilities at fair value through profit and loss | (126,847 | ) | 146,638 | 126,576 | ||||||||||||||||||||||||
Financial liabilities at fair value through profit or loss | 146,638 | 357,825 | (773,558 | ) | (733,056 | ) | ||||||||||||||||||||||
Deposits | 11,075,939 | 10,716,619 | 9,250,426 | 10,716,619 | 4,495,876 | 2,584,993 | 2,449,650 | |||||||||||||||||||||
Deferred income tax liabilities | (143,006 | ) | (13,150 | ) | (11,351 | ) | (13,150 | ) | (138,374 | ) | (74,463 | ) | (70,564 | ) | ||||||||||||||
Other liabilities | (954,691 | ) | 48,628 | 41,975 | 48,628 | 1,375,612 | (430,856 | ) | (408,297 | ) | ||||||||||||||||||
|
|
|
|
|
|
| ||||||||||||||||||||||
| 9,830,121 | (8,891,095 | ) | (7,674,662 | ) | (8,891,095 | ) | 2,422,086 | (10,775,413 | ) | (10,211,241 | ) | |||||||||||||||||
|
|
|
|
|
|
| ||||||||||||||||||||||
Net cash generated from operating activities | 14,660,278 | (4,007,190 | ) | (3,458,947 | ) | |||||||||||||||||||||||
Net cash generated from (used in) operating activities | (4,007,190 | ) | 7,644,558 | (6,345,527 | ) | (6,013,290 | ) | |||||||||||||||||||||
|
|
|
|
|
|
| ||||||||||||||||||||||
(Continued)
KB FINANCIAL GROUP INC. AND SUBSIDIARIES
CONSOLIDATED STATEMENTS OF CASH FLOWS (CONTINUED)
FOR THE YEARS ENDED DECEMBER 31, 20102011, 2012 and 20112013
| 2010 | 2011 | 2011 | 2011 | 2012 | 2013 | 2013 | ||||||||||||||||||||||
Translation into (Note 3) | Translation into (Note 3) | |||||||||||||||||||||||||||
| (In millions of Korean won) | (In thousands) | (In millions of Korean won) | (In thousands) | |||||||||||||||||||||||||
Cash flows from investing activities: | ||||||||||||||||||||||||||||
Disposal in financial investments | (Won) | 33,678,653 | (Won) | 22,875,143 | US$ | 19,745,484 | ||||||||||||||||||||||
Acquisition in financial investments | (34,569,523 | ) | (21,918,460 | ) | (18,919,689 | ) | ||||||||||||||||||||||
Disposal of financial investments | ₩ | 22,875,143 | ₩ | 24,805,560 | ₩ | 25,655,149 | US$ | 24,311,916 | ||||||||||||||||||||
Acquisition of financial investments | (21,918,460 | ) | (26,141,095 | ) | (23,020,912 | ) | (21,815,600 | ) | ||||||||||||||||||||
Decrease in investments in associates | 7,885 | 12,120 | 10,462 | 12,120 | 16,573 | 20,554 | 19,478 | |||||||||||||||||||||
Acquisition in investments in associates | (329,177 | ) | (176,105 | ) | (152,012 | ) | ||||||||||||||||||||||
Acquisition of investments in associates | (176,105 | ) | (217,081 | ) | (23,340 | ) | (22,118 | ) | ||||||||||||||||||||
Disposal of property and equipment | 2,148 | 859 | 741 | 859 | 16,912 | 1,070 | 1,014 | |||||||||||||||||||||
Acquisition of property and equipment | (120,779 | ) | (261,905 | ) | (226,073 | ) | (261,905 | ) | (143,139 | ) | (153,469 | ) | (145,434 | ) | ||||||||||||||
Acquisition of investment property | — | — | (114,609 | ) | (108,608 | ) | ||||||||||||||||||||||
Disposal of intangible assets | — | 10,353 | 8,936 | 10,353 | 10,176 | 5,072 | 4,807 | |||||||||||||||||||||
Acquisition of intangible assets | (193,123 | ) | (105,341 | ) | (90,928 | ) | (105,341 | ) | (81,899 | ) | (68,091 | ) | (64,526 | ) | ||||||||||||||
Acquisition of subsidiaries, net of cash acquired | 65,913 | — | — | |||||||||||||||||||||||||
Business combination, net of cash acquired | — | 40,575 | 322,641 | 305,749 | ||||||||||||||||||||||||
Others | (1,071,933 | ) | 251,888 | 217,427 | 251,888 | (838,816 | ) | 1,554,752 | 1,473,348 | |||||||||||||||||||
|
|
|
|
|
|
| ||||||||||||||||||||||
Net cash provided by (used in) investing activities | (2,529,936 | ) | 688,552 | 594,348 | 688,552 | (2,532,234 | ) | 4,178,817 | 3,960,026 | |||||||||||||||||||
|
|
|
|
|
|
| ||||||||||||||||||||||
Cash flows from financing activities: | ||||||||||||||||||||||||||||
Net cash flows from derivative financial instrument for hedging purposes | (27,658 | ) | 20,733 | 17,896 | 20,733 | 75,761 | 10,977 | 10,402 | ||||||||||||||||||||
Increase in debts | (1,979,461 | ) | 5,453,721 | 4,707,571 | ||||||||||||||||||||||||
Net increase (decrease) in debts | 5,453,721 | (796,842 | ) | (1,990,258 | ) | (1,886,053 | ) | |||||||||||||||||||||
Increase in debentures | 8,340,121 | 9,665,174 | 8,342,834 | 9,665,174 | 10,282,920 | 10,758,948 | 10,195,639 | |||||||||||||||||||||
Decrease in debentures | (18,047,460 | ) | (11,607,211 | ) | (10,019,172 | ) | (11,607,211 | ) | (12,945,650 | ) | (7,924,609 | ) | (7,509,698 | ) | ||||||||||||||
Disposal of treasury share | — | 2,281,524 | 1,969,378 | |||||||||||||||||||||||||
Increase in other payables to trust accounts | — | 456,449 | 414,279 | 392,589 | ||||||||||||||||||||||||
Disposal of treasury shares | 2,281,524 | — | — | — | ||||||||||||||||||||||||
Redemption of hybrid capital instruments | — | (1,000,000 | ) | (863,185 | ) | (1,000,000 | ) | — | — | — | ||||||||||||||||||
Dividends paid to holders of hybrid capital instruments | (64,600 | ) | (46,331 | ) | (39,992 | ) | (46,331 | ) | — | — | — | |||||||||||||||||
Dividends paid to shareholders of the parent company | (78,897 | ) | (41,163 | ) | (35,532 | ) | (41,163 | ) | (278,173 | ) | (231,811 | ) | (219,674 | ) | ||||||||||||||
Changes in interest in subsidiaries | — | (8,048 | ) | (168,293 | ) | (159,482 | ) | |||||||||||||||||||||
Others | 73,627 | 48,434 | 41,808 | 48,434 | (38,680 | ) | 837,906 | 794,035 | ||||||||||||||||||||
|
|
|
|
|
|
| ||||||||||||||||||||||
Net cash provided by (used in) financing activities | (11,784,328 | ) | 4,774,881 | 4,121,607 | 4,774,881 | (3,252,263 | ) | 1,707,139 | 1,617,758 | |||||||||||||||||||
|
|
|
|
|
|
| ||||||||||||||||||||||
Effect of exchange rate changes on cash and cash equivalents | 36,931 | 32,982 | 28,469 | 32,982 | (13,560 | ) | 41,452 | 39,279 | ||||||||||||||||||||
|
|
|
|
|
|
| ||||||||||||||||||||||
Net increase in cash and cash equivalents | 382,945 | 1,489,225 | 1,285,476 | |||||||||||||||||||||||||
Net increase (decrease) in cash and cash equivalents | 1,489,225 | 1,846,501 | (418,119 | ) | (396,227 | ) | ||||||||||||||||||||||
Cash and cash equivalents at the beginning of the year | 2,868,634 | 3,251,579 | 2,806,715 | 3,251,579 | 4,740,804 | 6,587,305 | 6,242,411 | |||||||||||||||||||||
|
|
|
|
|
|
| ||||||||||||||||||||||
Cash and cash equivalents at the end of the year | (Won) | 3,251,579 | (Won) | 4,740,804 | US$ | 4,092,191 | ₩ | 4,740,804 | ₩ | 6,587,305 | ₩ | 6,169,186 | US$ | 5,846,184 | ||||||||||||||
|
|
|
|
|
|
| ||||||||||||||||||||||
Note) The consolidated statement of cash flows for the year ended December 31, 2011 was not restated in accordance with IFRS 10 but prepared based on the previous accounting policies since it is not required to adjust any earlier periods presented than the immediately preceding period under transitional provision rule of IFRS 10. See Note 2.1.
The accompanying notes are an integral part of these consolidated financial statements.
KB FINANCIAL GROUP INC. AND SUBSIDIARIES
NOTES TO CONSOLIDATED FINANCIAL STATEMENTS
1. The Parent Company
KB Financial Group Inc. (the “Parent Company”) was incorporated on September 29, 2008, under the Financial Holding Companies Act of Korea. KB Financial Group Inc. and its subsidiaries (the “Group”) derive substantially all of their revenue and income from providing a broad range of banking and related financial services to consumers and corporations primarily in Korea and in selected international markets. The Parent Company’s principal business includes ownership and management of subsidiaries and associated companies that are engaged in financial services or activities. In 2011, Kookmin Bank spun off its credit card business segment and established a new separate credit card company, KB Kookmin Card Co., Ltd., and KB Investment & Securities Co., Ltd. merged with KB Futures Co., Ltd. The Group established KB Savings Bank Co., Ltd. in January 2012. The Group acquired Yehansoul Savings Bank Co., Ltd. in September 2013.
The Parent Company’s paid inshare capital as of December 31, 20112013, is (Won)1,931,758₩1,931,758 million. The Parent Company is authorized to issue up to 1,000 million1 billion shares. The Parent Company has been listed on the Korea Exchange (“KRX”) since October 10, 2008, and listed on the New York Stock Exchange (“NYSE”) for its American Depositary Shares (“ADS”) since September 29, 2008.
2. Basis of Preparation
2.1 Application of IFRS
The Group’s consolidated financial statements for the annual period beginning on January 1, 2011, have been prepared in accordance with the International Financial Reporting Standards (“IFRS”) as. IFRS are the standards and related interpretations issued by the International Accounting Standards Board (“IASB”) and the application of IFRS 1,First-time Adoption of International Financial Reporting Standards, is required for the consolidated financial statements.
Until December 31, 2010, the Group prepared its consolidated financial statements in accordance with both of the accounting principles generally accepted in the Republic of Korea (“K-GAAP”) and the accounting principles generally accepted in the U.S. (“U.S. GAAP”) for the SEC filings in the U.S. For the purposes of applying IFRS 1,First-time Adoption of International Financial Reporting Standards, the Group has determined the previous generally accepted accounting principles (“Previous GAAP”) to be K-GAAP. IFRS transition date and adoption date from previous GAAP were January 1, 2010 and January 1, 2011, respectively.
Exemptions from IFRS which the Group elected in accordance with IFRS 1 are as follows:
|
Deemed cost as fair value or revalued amount: The Group applies the revalued amount reported under K-GAAP as deemed cost for certain tangible assets (land and building). Accordingly, gains on revaluation of tangible assets calculated under K-GAAP are reclassified as retained earnings and there is no effect on the financial statements except for the reclassification.
Recovery and reserved liabilities included in cost of tangible assets: Changes in provisions associated with expected recovery or changes for tangible assets are not retroactively estimated from the time of initial acquisition. Changes in the amount of provisions are estimated only once at the transition date.
|
Cumulative translation difference: Cumulative translation differences for all foreign operations existing on the transition date are deemed to be zero.
Reconciliations and descriptions of the effects of the transition from K-GAAP to IFRS, and from U.S. GAAP to IFRS, on the Group’s equity as of January 1, 2010 and December 31, 2010, comprehensive income and cash flows for the year ended December 31, 2010, are described in Notes 46.
The preparation of consolidated financial statements requires the use of certain critical accounting estimates. It also requires management to exercise judgment in the process of applying the Group’s accounting policies. The areas involving a higher degree of judgment or complexity, or areas where assumptions and estimates are significant to the consolidated financial statements are disclosed in Note 2.4.
New standards, amendments and interpretations issued but not effective for the financial year beginning on January 1, 2011,2013, and not early adopted by the Group are as follows:
AmendmentsAmendment to IAS 32,Financial Instruments: Presentation
According to Amendment to IAS 32,Financial Instruments: Presentation, provides that the right to offset must not be contingent on a future event and must be legally enforceable in all of circumstances; and if an entity can settle amounts in a manner such that outcome is, in effect, equivalent to net settlement, the entity will meet the net settlement criterion. This amendment is effective for annual periods beginning on or after January 1, 2014, and the Group is assessing the impact of application of this amendment on its consolidated financial statements.
Amendment to IAS 39,Financial Instruments: Recognition and Measurement
Amendment to IAS 39,Financial Instruments: Recognition and Measurement, allows the continuation of hedge accounting for a derivative that has been designated as a hedging instrument in a circumstance in which that derivative is novated to a central counterparty (CCP) as a consequence of laws or regulations. This amendment is effective for annual periods beginning on or after January 1, 2014, with early adoption permitted. The Group is assessing the impact of application of this amendment on its consolidated financial statements.
Amendment to IFRS 10,Consolidated Financial Statements
Amendment to IFRS 10,Consolidated Financial Statements, provides that, if a parent company qualifies as an investment entity, it is required to measure its investments in subsidiaries at fair value through profit or loss instead of consolidating these subsidiaries in its consolidated financial statements. The amendment does not apply for a parent of an investment entity if the parent itself is not an investment entity. This amendment is effective for annual periods beginning on or after January 1, 2014, with early adoption permitted. The application of this amendment does not have an impact on its consolidated financial statements of the Group.
Enactment of IFRIC 21,Levies
IFRIC 21,Levies, is applied to a liability to pay a levy imposed by a government in accordance with the legislation. The interpretation requires that the liability to pay a levy is recognized when the activity that triggers the payment of the levy occurs, as identified by the legislation (the obligating event). This interpretation is effective for annual periods beginning on or after January 1, 2014, with early adoption permitted. The Group is assessing the impact of application of this interpretation on its consolidated financial statements.
New standards, amendments and interpretations adopted by the Group for the financial year beginning on January 1, 2013, are as follows:
Amendment to IAS 1,Presentation of Financial Statements: Presentation of Items of Other Comprehensive Income
IAS 1,Presentation of Financial Statements
According, was amended to the amendments to IAS 1, items ofrequire other comprehensive income are requireditems to be groupedclassified into thoseitems that will and will not subsequentlymight be reclassified to profit or loss with tax onin subsequent periods and items that would not be reclassified subsequently. The Group applies the presentation of items of other comprehensive income required to be allocatedin accordance with the enactment retrospectively, and restated consolidated statement of comprehensive income for the years ended December 31, 2011 and 2012. There is no effect on the same basis. This amendment is required to be applied on a full retrospective basis. This amendment is effectiveGroup’s total comprehensive income for the Group as of January 1, 2013. The Group is assessing the impact ofretrospective application of the amended IAS 1 on its consolidated financial statements.change in accounting policy.
Amendments to IAS 12,Income Taxes
According to the amendments to IAS 12, for the investment properties accounted for at fair value, the measurement of deferred tax liability and deferred tax asset should reflect the tax consequences of recovering the carrying amount of the investment property entirely through sale, unless there is evidence to the contrary. This amendment is effective for the Group as of January 1, 2012. The Group expects that the amendment does not affect the consolidated financial statements of the Group.
AmendmentsAmendment to IAS 19,Employee Benefits
According to the amendmentsamendment to IAS 19,Employee Benefits, the corridoruse of a ‘corridor’ approach foris no longer permitted, and therefore all actuarial gains and losses is not allowed anymore, Accordingly, the actuarial gains and lossesincurred are immediately recognized in other comprehensive income immediately. Pastincome. All past service costs incurred underfrom changes of plansin pension plan are immediately recognized, immediately, and the amendment replaces the interest costcosts and expected returns on theplan assets that used to be separately calculated are now changed to calculating net interest expense(income) by applying discount rate used in measuring defined benefit obligation and the expected return on plan assets with a net interest cost based on thein net defined benefit asset or liability. This amendment is effective forliabilities(assets). The Group applies the Groupaccounting policy retrospectively in accordance with the amended standards. The comparative consolidated statements of financial position and statements of comprehensive income are restated by reflecting adjustments resulting from the retrospective application.
The effect of these changes in accounting policy to financial position as of January 1, 2013. The2012 and December 31, 2012 and 2013, and to comprehensive income for the years ended December 31, 2011, 2012 and 2013, are as follows:
Effect on Consolidated Statements of Financial Position
| Jan. 1, 2012 | Dec. 31, 2012 | Dec. 31, 2013 | ||||||||||
| (In millions of Korean won) | ||||||||||||
Increase(decrease) in net defined benefit liabilities | ₩ | — | ₩ | 9,820 | ₩ | 9,103 | ||||||
Increase(decrease) in deferred income tax liabilities | — | (2,377 | ) | (2,203 | ) | |||||||
Increase(decrease) in accumulated other comprehensive income | (23,254 | ) | (53,507 | ) | (12,523 | ) | ||||||
Increase(decrease) in retained earnings | 23,254 | 46,064 | 5,623 | |||||||||
Effect on Consolidated Statements of Comprehensive Income
| 2011 | 2012 | 2013 | ||||||||||
| (In millions of Korean won) | ||||||||||||
Decrease(increase) in general and administrative expenses | ₩ | 44,677 | ₩ | 30,121 | ₩ | (53,389 | ) | |||||
Decrease(increase) in income tax | (10,812 | ) | (7,292 | ) | 12,920 | |||||||
Increase(decrease) in other comprehensive income | 32,149 | (30,271 | ) | 41,012 | ||||||||
| (In Korean won) | ||||||||||||
Increase(decrease) in earnings per share | 87 | 59 | (105 | ) | ||||||||
Increase(decrease) in diluted earnings per share | 88 | 59 | (104 | ) | ||||||||
Termination benefits are payable when employment is terminated by the Group is assessingbefore the impact of applicationnormal retirement date, or whenever an employee accepts voluntary redundancy in exchange for these benefits. An entity shall recognize a liability and expense for termination benefits at the earlier of the amendedfollowing dates: when the entity can no longer withdraw the offer of those benefits and when the entity recognizes costs for a restructuring that is within the scope of IAS 19 on its consolidated financial statements.
Amendments37 and involves the payment of termination benefits. Termination benefits are measured by considering the number of employees expected to IAS 32,Financial Instruments: Presentation
The amendments to IAS 32 in December 2011 address inconsistencies in current practice when applyingaccept the offsetting criteria in IAS 32. The amendments clarify the meaning of ‘currently has a legally enforceable right of set-off’, and that some gross settlement systems may be considered equivalent to net settlement. The amendments will be effective for the Group as of January 1, 2014. The Group is assessing the impact of application of the amended IAS 32 on its consolidated financial statements.
Amendments to IFRS 7,Financial Instruments: Disclosures
According to the amendment, an entity should provide the required disclosures of nature, carrying amount, risk and rewards associated with all transferred financial instruments that are not derecognized from an entity’s financial statements. In addition, an entity is required to disclose additional information related to transferred and derecognized financial instruments for any continuing involvement in transferred assets. This amendment is effective for the Group as of January 1, 2012. The Group is assessing the impact of application of the amended IFRS 7 on its consolidated financial statements.
An additional amendment to IFRS 7 introduces new disclosures that address certain inconsistenciesoffer in the applicationcase of a voluntary early retirement. Termination benefits over 12 months after the existing offsetting criteria. The disclosures would provide users with information that is useful in evaluating the effect or potential effect of netting arrangements on an entity’s financial position, and analyzing and comparing financial statements prepared in accordance with IFRSs and U.S. GAAP. This amendment is effective for the Group as of January 1, 2013.reporting period are discounted to present value. The Group expects that the application of this amendment willwould not have a material impact on theits consolidated financial statements of the Group.
Enactment of IFRS 9,Financial Instruments
IFRS 9,Financial Instruments addresses the classification, measurement and recognition of financial assets and financial liabilities. IFRS 9 was issued in November 2009 and October 2010. It replaces the parts of IAS 39 that relate to the classification and measurement of financial instruments. IFRS 9 requires financial assets to be classified into two measurement categories: those measured as at fair value and those measured at amortized cost. The determination is made at initial recognition. The classification depends on the Group’s business model for managing its financial instruments and the contractual cash flow characteristics of the instrument. For financial liabilities, the standard retains most of the IAS 39 requirements. The main change is that, in cases where the fair value option is taken for financial liabilities, the part of a fair value change due to an entity’s own credit risk is recorded in other comprehensive income rather than the income statement, unless this creates an accounting mismatch. IFRS 9 is effective for the Group as of January 1, 2015. The Group is assessing the impact of application of IFRS 9.statements.
Enactment of IFRS 10,Consolidated Financial Statements
IFRS 10 supersedes IAS 27,Consolidated and Separate Financial Statements and SIC 12,Consolidation: Special Purpose Entities.
IFRS 10, Consolidated Financial Statements, builds on existing principles by identifying the concept of control as the determining factor in whether an entity should be included withinin the consolidated financial statements of the parent company.Parent Company. An investor controls an investee when it is exposed, or has rights, to variable returns from its involvement with the investee and has the ability to affect those returns through its power over the investee. The standard provides additional guidance to assist in the determination of control where this is difficult to assess.
In accordance with transitional provision of IFRS 10, the financial statements for earlier comparative periods are restated, to ensure conformity with the conclusion of IFRS 10, unless it is effectiveimpracticable to do so. However the consolidated financial statements for the Group asyear ended December 31, 2011 was not restated in accordance with IFRS 10 but prepared based on the previous accounting policies since it is not required to adjust any earlier periods presented than the immediately preceding period under transitional provision rule of January 1, 2013. The GroupIFRS 10. At the date of initial application, a reporting entity that has no change in consolidation is assessingnot required to make adjustments to the previous accounting policy.
As a result of reviewing the impact of applicationthe enactment of IFRS 10, the Group decided to consolidate nine trusts, including personal pension trusts, twelve structured entities, including KH First Co., Ltd., and deconsolidate five companies, including KB-Glenwood Private Equity Fund 1.
In accordance with IFRS 10, the Group consolidated nine trusts, including personal pension trusts because it has power as a trustee, exposure to variable returns because the Group guarantees repayment of principal, if the trust property is less than the principal, and the ability to use power to affect its amount of variable returns. In addition, the Group consolidated twelve structured entities, including KH First Co., Ltd., because it has power over their activities, exposure to variable returns and the ability to use power to affect its amount of variable returns. And the Group decided to deconsolidate five companies, including KB Glenwood Private Equity Fund 1, because it is not exposed to variable returns, although it has power over the relevant activities.
Changes in subsidiaries by the adoption of IFRS 10 are as follows:
Investor | Investee | Ownership(%) | Location | Industry | ||||||||
Included | Kookmin Bank | Personal pension trusts and 8 other trusts | — | Korea | Trust | |||||||
Included | Kookmin Bank | KH First Co., Ltd. | — | Korea | Asset-backed securitization and others | |||||||
Included | Kookmin Bank | Samho Kyungwon Co., Ltd. | — | Korea | Asset-backed securitization and others | |||||||
Included | Kookmin Bank | Taejon Samho The First Co., Ltd | — | Korea | Asset-backed securitization and others | |||||||
Included | Kookmin Bank | Prince DCM Co., Ltd | — | Korea | Asset-backed securitization and others | |||||||
Included | Kookmin Bank, KB Life Insurance Co., Ltd. | KB Hope Sharing BTL Private Special Asset | 40.00 | Korea | Capital investment | |||||||
Included | Kookmin Bank | Hanbando BTL Private Special Asset Fund 1 | 39.74 | Korea | Capital investment | |||||||
Included | Kookmin Bank | Global Logistics Infra Private Fund 1 | 57.14 | Korea | Capital investment | |||||||
Included | Kookmin Bank | Global Logistics Infra Private Fund 2 | — | Korea | Capital investment | |||||||
Included | Kookmin Bank | KB Mezzanine Private Securities Fund 1 | 46.51 | Korea | Capital investment | |||||||
Included | Kookmin Bank | KB Private Real Estate Securities Fund 1(NPL) | 45.00 | Korea | Capital investment | |||||||
Included | Kookmin Bank | K Star KTB ETF(Bond) | 48.78 | Korea | Capital investment | |||||||
Included | KB Private Real Estate Securities Fund 1(NPL) | Woori KA First Asset Securitization | 55.00 | Korea | Asset-backed securitization and others | |||||||
Excluded | KB Investment & Securities Co., Ltd. | KB-Glenwood Private Equity Fund 1 | 0.03 | Korea | Capital investment | |||||||
Excluded | KB-Glenwood Private Equity Fund 1 | Chungkang Co., Ltd. | 100.00 | Korea | Capital investment | |||||||
Excluded | Chungkang Co., Ltd. | Powernet Technologies Co., Ltd. | 92.64 | Korea | Electronic product manufacturing | |||||||
Excluded | KB Investment Co., Ltd. | NPS KBIC Private Equity Fund No. 1 | 2.56 | Korea | Capital investment | |||||||
Excluded | KB Investment Co., Ltd. | KBIC Private Equity Fund No. 3 | 2.00 | Korea | Capital investment | |||||||
Effect on itsthe consolidated financial statements.statements by the adoption of IFRS 10:
Consolidated Statements of Financial Position
| Jan. 1, 2012 | ||||||||||||
| Before | Adjustment | After | ||||||||||
| (In millions of Korean won) | ||||||||||||
Assets | ||||||||||||
Cash and due from financial institutions | ₩ | 9,178,125 | ₩ | 8,432 | ₩ | 9,186,557 | ||||||
Financial assets at fair value through profit or loss | 6,326,104 | 2,842,998 | 9,169,102 | |||||||||
Derivative financial assets | 2,448,455 | 50,990 | 2,499,445 | |||||||||
Loans | 212,107,027 | 920,669 | 213,027,696 | |||||||||
Financial investments | 35,432,182 | (439,501 | ) | 34,992,681 | ||||||||
Investments in associates | 892,132 | (98,530 | ) | 793,602 | ||||||||
Property and equipment | 3,186,020 | (3,274 | ) | 3,182,746 | ||||||||
Investment property | 51,552 | — | 51,552 | |||||||||
Intangible assets | 468,441 | (6,455 | ) | 461,986 | ||||||||
Deferred income tax assets | 22,329 | (3,385 | ) | 18,944 | ||||||||
Assets held for sale | 9,931 | — | 9,931 | |||||||||
Other assets | 7,478,519 | (2,654 | ) | 7,475,865 | ||||||||
|
|
|
|
|
| |||||||
Total assets | ₩ | 277,600,817 | ₩ | 3,269,290 | ₩ | 280,870,107 | ||||||
|
|
|
|
|
| |||||||
Liabilities | ||||||||||||
Financial liabilities at fair value through profit or loss | ₩ | 1,388,079 | ₩ | — | ₩ | 1,388,079 | ||||||
Derivative financial liabilities | 2,059,573 | (21,780 | ) | 2,037,793 | ||||||||
Deposits | 190,337,590 | 2,920,966 | 193,258,556 | |||||||||
Debts | 16,823,838 | (2,605 | ) | 16,821,233 | ||||||||
Debentures | 27,069,879 | 101,000 | 27,170,879 | |||||||||
Provisions | 797,739 | (7,959 | ) | 789,780 | ||||||||
Net defined benefit liabilities | 128,488 | (1,051 | ) | 127,437 | ||||||||
Current income tax liabilities | 588,825 | — | 588,825 | |||||||||
Deferred income tax liabilities | 220,842 | 21,466 | 242,308 | |||||||||
Other liabilities | 15,086,169 | 194,049 | 15,280,218 | |||||||||
|
|
|
|
|
| |||||||
Total liabilities | 254,501,022 | 3,204,086 | 257,705,108 | |||||||||
|
|
|
|
|
| |||||||
Equity | ||||||||||||
Equity attributable to shareholders of the parent company | 22,917,975 | 65,204 | 22,983,179 | |||||||||
Non-controlling interests | 181,820 | — | 181,820 | |||||||||
|
|
|
|
|
| |||||||
Total equity | 23,099,795 | 65,204 | 23,164,999 | |||||||||
|
|
|
|
|
| |||||||
Total liabilities and equity | ₩ | 277,600,817 | ₩ | 3,269,290 | ₩ | 280,870,107 | ||||||
|
|
|
|
|
| |||||||
Assets Cash and due from financial institutions Financial assets at fair value through profit or loss Derivative financial assets Loans Financial investments Investments in associates Property and equipment Investment property Intangible assets Deferred income tax assets Assets held for sale Other assets Total assets Liabilities Financial liabilities at fair value through profit or loss Derivative financial liabilities Deposits Debts Debentures Provisions Net defined benefit liabilities Current income tax liabilities Deferred income tax liabilities Other liabilities Total liabilities Equity Equity attributable to shareholders of the parent company Non-controlling interests Total equity Total liabilities and equity Dec. 31, 2012 Before Adjustment After (In millions of Korean won) ₩ 10,568,350 ₩ 24,255 ₩ 10,592,605 6,299,194 3,260,525 9,559,719 2,024,784 66,501 2,091,285 212,716,251 928,540 213,644,791 36,897,139 (429,787 ) 36,467,352 1,035,205 (100,564 ) 934,641 3,103,597 (3,204 ) 3,100,393 52,974 — 52,974 500,023 (6,892 ) 493,131 18,432 — 18,432 35,412 — 35,412 8,755,217 5,102 8,760,319 ₩ 282,006,578 ₩ 3,744,476 ₩ 285,751,054 ₩ 1,851,135 ₩ — ₩ 1,851,135 2,068,813 (14,071 ) 2,054,742 194,403,279 2,942,926 197,346,205 15,969,522 (4,064 ) 15,965,458 24,131,770 138,442 24,270,212 669,729 — 669,729 84,977 (1,254 ) 83,723 264,666 — 264,666 127,592 26,711 154,303 17,738,498 589,242 18,327,740 257,309,981 3,677,932 260,987,913 24,502,075 66,544 24,568,619 194,522 — 194,522 24,696,597 66,544 24,763,141 ₩ 282,006,578 ₩ 3,744,476 ₩ 285,751,054
Consolidated Statements of Comprehensive Income
| 2012 | ||||||||||||
| Before | Adjustment | After | ||||||||||
| (In millions of Korean won) | ||||||||||||
Interest income | ₩ | 14,155,825 | ₩ | 54,281 | ₩ | 14,210,106 | ||||||
Interest expense | (7,039,912 | ) | (132,411 | ) | (7,172,323 | ) | ||||||
|
|
|
|
|
| |||||||
Net interest income | 7,115,913 | (78,130 | ) | 7,037,783 | ||||||||
|
|
|
|
|
| |||||||
Fee and commission income | 2,778,668 | (24,792 | ) | 2,753,876 | ||||||||
Fee and commission expense | (1,186,027 | ) | (1,143 | ) | (1,187,170 | ) | ||||||
|
|
|
|
|
| |||||||
Net fee and commission income | 1,592,641 | (25,935 | ) | 1,566,706 | ||||||||
|
|
|
|
|
| |||||||
Net gains(losses) on financial assets/liabilities at fair value through profit or loss | 651,203 | 160,761 | 811,964 | |||||||||
|
|
|
|
|
| |||||||
Net other operating income(loss) | (1,455,270 | ) | (76,672 | ) | (1,531,942 | ) | ||||||
|
|
|
|
|
| |||||||
General and administrative expenses | (3,855,164 | ) | 9,554 | (3,845,610 | ) | |||||||
|
|
|
|
|
| |||||||
Operating profit before provision for credit losses | 4,049,323 | (10,422 | ) | 4,038,901 | ||||||||
|
|
|
|
|
| |||||||
Provision for credit losses | (1,607,804 | ) | 1,101 | (1,606,703 | ) | |||||||
|
|
|
|
|
| |||||||
Net operating profit(loss) | 2,441,519 | (9,321 | ) | 2,432,198 | ||||||||
Share of profit of associates | (13,536 | ) | (1,746 | ) | (15,282 | ) | ||||||
Net other non-operating income(expense) | (136,534 | ) | 18,262 | (118,272 | ) | |||||||
|
|
|
|
|
| |||||||
Net non-operating profit(loss) | (150,070 | ) | 16,516 | (133,554 | ) | |||||||
|
|
|
|
|
| |||||||
Profit before income tax | 2,291,449 | 7,195 | 2,298,644 | |||||||||
|
|
|
|
|
| |||||||
Income tax expense | (556,632 | ) | (1,879 | ) | (558,511 | ) | ||||||
|
|
|
|
|
| |||||||
Profit for the year | 1,734,817 | 5,316 | 1,740,133 | |||||||||
|
|
|
|
|
| |||||||
Other comprehensive income(loss) for the year, net of tax | 148,696 | (3,977 | ) | 144,719 | ||||||||
|
|
|
|
|
| |||||||
Total comprehensive income for the year | ₩ | 1,883,513 | ₩ | 1,339 | ₩ | 1,884,852 | ||||||
|
|
|
|
|
| |||||||
Profit for the year attributable to: | ||||||||||||
Shareholders of the parent company | ₩ | 1,725,742 | ₩ | 5,292 | ₩ | 1,731,034 | ||||||
Non-controlling interests | 9,075 | 24 | 9,099 | |||||||||
|
|
|
|
|
| |||||||
| ₩ | 1,734,817 | ₩ | 5,316 | ₩ | 1,740,133 | |||||||
|
|
|
|
|
| |||||||
Total comprehensive income for the year attributable to: | ||||||||||||
Shareholders of the parent company | ₩ | 1,871,240 | ₩ | (6,103 | ) | ₩ | 1,865,137 | |||||
Non-controlling interests | 19,715 | — | 19,715 | |||||||||
|
|
|
|
|
| |||||||
| ₩ | 1,890,955 | ₩ | (6,103 | ) | ₩ | 1,884,852 | ||||||
|
|
|
|
|
| |||||||
Consolidated Statements of Cash Flows
| 2012 | ||||||||||||
| Before | Adjustment | After | ||||||||||
| (In millions of Korean won) | ||||||||||||
Cash flows from operating activities | ||||||||||||
Profit for the year | ₩ | 1,734,817 | ₩ | 5,316 | ₩ | 1,740,133 | ||||||
|
|
|
|
|
| |||||||
Adjustment for non-cash items | ||||||||||||
Net loss(gain) on financial assets/liabilities at fair value through profit or loss | (222,022 | ) | (25,832 | ) | (247,854 | ) | ||||||
Net loss(gain) on derivative financial instruments for hedging purposes | 15,165 | — | 15,165 | |||||||||
Adjustment of fair value of derivative financial instruments | 42 | — | 42 | |||||||||
Provision for credit loss | 1,607,804 | (1,101 | ) | 1,606,703 | ||||||||
Net loss(gain) on financial investments | 148,211 | — | 148,211 | |||||||||
Share of loss(profit) of associates | 13,536 | 1,746 | 15,282 | |||||||||
Depreciation and amortization expense | 328,642 | (322 | ) | 328,320 | ||||||||
Other net losses on property and equipment/intangible assets | 40,881 | — | 40,881 | |||||||||
Share-based payments | 13,871 | — | 13,871 | |||||||||
Policy reserve appropriation | 1,305,730 | — | 1,305,730 | |||||||||
Post-employment benefits | 172,743 | (352 | ) | 172,391 | ||||||||
Net interest expense | 229,691 | — | 229,691 | |||||||||
Loss(gains) on foreign currency translation | (148,877 | ) | — | (148,877 | ) | |||||||
Net other expense | 10,075 | (7,292 | ) | 2,783 | ||||||||
|
|
|
|
|
| |||||||
| 3,515,492 | (33,153 | ) | 3,482,339 | |||||||||
|
|
|
|
|
| |||||||
Changes in operating assets and liabilities | ||||||||||||
Financial assets at fair value through profit or loss | 132,205 | (3,234,693 | ) | (3,102,488 | ) | |||||||
Derivative financial instruments | 252,166 | (58,793 | ) | 193,373 | ||||||||
Loans | (2,226,547 | ) | (737,682 | ) | (2,964,229 | ) | ||||||
Deferred income tax assets | 3,211 | — | 3,211 | |||||||||
Other assets | 2,202,544 | (1,264 | ) | 2,201,280 | ||||||||
Financial liabilities at fair value through profit or loss | 357,825 | — | 357,825 | |||||||||
Deposits | 1,552,950 | 2,942,926 | 4,495,876 | |||||||||
Deferred income tax liabilities | (166,772 | ) | 28,398 | (138,374 | ) | |||||||
Other liabilities | 630,144 | 745,468 | 1,375,612 | |||||||||
|
|
|
|
|
| |||||||
| 2,737,726 | (315,640 | ) | 2,422,086 | |||||||||
|
|
|
|
|
| |||||||
Net cash generated from operating activities | 7,988,035 | (343,477 | ) | 7,644,558 | ||||||||
|
|
|
|
|
| |||||||
Cash flows from investing activities | ||||||||||||
Disposal of financial investments | 24,848,249 | (42,689 | ) | 24,805,560 | ||||||||
Acquisition of financial investments | (26,141,095 | ) | — | (26,141,095 | ) | |||||||
Decrease in investments in associates | 11,543 | 5,030 | 16,573 | |||||||||
Acquisition of investments in associates | (212,556 | ) | (4,525 | ) | (217,081 | ) | ||||||
Disposal of property and equipment | 8,740 | 8,172 | 16,912 | |||||||||
Acquisition of property and equipment | (143,327 | ) | 188 | (143,139 | ) | |||||||
Disposal of intangible assets | 3,785 | 6,391 | 10,176 | |||||||||
Acquisition of intangible assets | (82,400 | ) | 501 | (81,899 | ) | |||||||
Business combination, net of cash acquired | 40,575 | — | 40,575 | |||||||||
Others | (838,816 | ) | — | (838,816 | ) | |||||||
|
|
|
|
|
| |||||||
Net cash used in investing activities | (2,505,302 | ) | (26,932 | ) | (2,532,234 | ) | ||||||
|
|
|
|
|
| |||||||
Cash flows from financing activities Net cash flows from derivative financial instruments for hedging purposes Net increase in debts Increase in debentures Decrease in debentures Decrease in other payables to trust accounts Dividends paid to shareholders of the parent company Changes in interest in subsidiaries Others Net cash used in financing activities Effect of exchange rate changes on cash and cash equivalents Net increase in cash and cash equivalents Cash and cash equivalents at the beginning of the year Cash and cash equivalents at the end of the year 2012 Before Adjustment After (In millions of Korean won) 75,761 — 75,761 (792,778 ) (4,064 ) (796,842 ) 10,282,920 — 10,282,920 (13,084,093 ) 138,443 (12,945,650 ) — 456,449 456,449 (278,173 ) — (278,173 ) — (8,048 ) (8,048 ) 150,109 (188,789 ) (38,680 ) (3,646,254 ) 393,991 (3,252,263 ) (13,560 ) — (13,560 ) 1,822,919 23,582 1,846,501 4,740,804 — 4,740,804 ₩ 6,563,723 ₩ 23,582 ₩ 6,587,305
Enactment of IFRS 11,Joint Arrangements
IFRS 11,Joint Arrangements, aims to reflect the substance of joint arrangements by focusing on the contractual rights and obligations that each party to the arrangement has rather than its legal form. Joint arrangements are classified as either joint operations or joint ventures. A joint operation is when joint operators have rights to the assets and obligations for the liabilities, and account for the assets, liabilities, revenues and expenses, while parties to the joint venture have rights to the net assets of the arrangement. The adoption of IFRS 11 does not have a material impact on the consolidated financial statements of the Group.
Enactment of IFRS 12,Disclosures of InterestInterests in Other Entities
IFRS 12,Disclosures of Interests in Other Entities includes, provides the disclosure requirements for all forms of interests in other entities, including joint arrangements, associates, special purpose vehicles and other off balance sheet vehicles. IFRS 12 is effective for the Group as of January 1, 2013. The Group is assessing the impact of application of IFRS 12.
Enactment of IFRS 11,Joint Arrangements
IFRS 11,Joint Arrangements introduces a principles based approach to accounting for joint arrangements. The focus is no longer on the legal structure of joint arrangements, but rather on how rights and obligations are shared by the parties to the joint arrangement. Based on the assessment of rights and obligations,subsidiary, an associate, a joint arrangement will be classified as either a joint operation or a joint venture. Joint ventures are accounted for using the equity method, and the choice to proportionately consolidate will no longer be permitted. Parties to a joint operation will account their share of revenues, expenses, assets and liabilities in much the same way as under the previous standard. IFRS 11 also provides guidance for parties that participate in joint arrangements but do not share joint control. The Group’s investment in the joint venture partnership will be classified as a joint venture under the new rules. IFRS 11 is effective for the Group as of January 1, 2013. As the Group already applies the equity method in accounting for this investment, IFRS 11 will not have any impact on the amounts recognized in its financial statements.an unconsolidated structured entity.
Enactment of IFRS 13,Fair value measurement
IFRS 13Fair value measurement aims to improve consistency and reduce complexity by providing a precise definition of fair value and a single source of fair value measurement and disclosure requirements for use acrossall fair value measurements under IFRS. IFRS 13 does not extend the use of fair value accounting but provides guidance on how it should be applied where its use is already required or permitted by other standards within IFRS. IFRS 13 ishas been effective prospectively for the Group as ofannual periods beginning on or after January 1, 2013. The Group expects that the amendmentadoption of IFRS 13 does not affecthave a material impact on the consolidated financial statements of the Group.
2.2 Measurement Basis
The consolidated financial statements have been prepared under the historical cost convention unless otherwise specified.
2.3 Functional and Presentation Currency
Items included in the financial statements of each entity of the Group’s entitiesGroup are measured using the currency of the primary economic environment in which the entity operates (“the functional currency”). The consolidated financial statements are presented in Korean won, which is the Parent Company’s functional and presentation currency. Refer to NoteNotes 3.2.1 and 3.2.2.
2.4 Significant Estimates
The preparation of consolidated financial statements requires the application of accounting policies, certain critical accounting estimates and assumptions that may have a significant impact on the assets (liabilities) and income (expenses). Management’s estimates of outcomes may differ from actual outcomes if management’s estimates and assumptions based on management’s best judgment at the reporting date are different from the actual environment.
Estimates and assumptions are continually evaluated and any change in an accounting estimate is recognized prospectively by including it in profit or loss in the period of the change, if the change affects that period only. Alternatively if the change in accounting estimate affects both the period of change and future periods, that change is recognized in the profit or loss of all those periods.
Uncertainty in estimates and assumptions with significant risk that may result in material adjustment to the consolidated financial statements are as follows:
2.4.1 Deferred income taxes
The recognition of a deferred tax asset relies on an assessment of the probability and sufficiency of future taxable profits, future reversals of existing taxable temporary differences and ongoing tax planning strategies.
2.4.2 Fair value of financial instruments
The fair value of financial instruments where no active market exists or where quoted prices are not otherwise available is determined by using valuation techniques. Financial instruments, which are not actively traded in the market and those with less transparent market prices, will have less objective fair values and require broad judgment on liquidity, concentration, uncertainty in market factors and assumptions in price determination and other risks.
As described in the significant accounting policies in Note 3.3, ‘Recognition and Measurement of Financial Instruments’, diverse valuation techniques are used to determine the fair value of financial instruments, from generally accepted market valuation models to internally developed valuation models that incorporate various types of assumptions and variables.
2.4.3 Provisions for credit losses (allowances for loan losses, provisions for acceptances and guarantees, and unused loan commitments)
The Group determines and recognizes allowances for losses on loans through impairment testing and recognizes provisions for guarantees, and unused loan commitments. The accuracy of provisions for credit losses is determined by the methodology and assumptions used for estimating expected cash flows of the borrower for individually assessed allowances on individualof loans, and collectively assessingassessed allowances for groups of loans, guarantees and unused loan commitments.
2.4.4 DefinedNet defined benefit obligationliabilities
The present value of net defined benefit obligations is measured by independent actuariesliability depends on a number of factors that are determined on an actuarial basis using the Projected Unit Credit Method. It incorporates actuariala number of assumptions and variables such as future increases in salaries, rate(Note 24).
2.4.5 Estimated impairment of retirement, and discount rate amongst others.goodwill
The Group tests annually whether goodwill has suffered any impairment. The recoverable amounts of cash-generating units have been determined based on value-in-use calculations (Note 15).
3. Significant Accounting Policies
The significant accounting policies applied in the preparation of these consolidated financial statements are set out below. These policies have been consistently applied to all periodsyears presented, unless otherwise stated.
3.1 Consolidation
3.1.1 Subsidiaries
Subsidiaries are companies that are controlled by the Group. ControlThe Group controls an investee when it is the powerexposed, or has rights, to govern the financial and operating policies of an entity so as to obtain benefitsvariable returns from its activities.involvement with the investee and has the ability to affect those returns through its power over the investee. The existence and effects of potential voting rights that are currently exercisable or convertible are considered when assessing whether the Group controls another entity. Subsidiaries are fully consolidated from the date when control is transferred to the Group and de-consolidated from the date when control is lost.
If a subsidiary uses accounting policies other than those adopted in the consolidated financial statements for like transactions and events in similar circumstances, appropriate adjustments are made to itsmake the subsidiary’s accounting policies conform to those of the Group when the subsidiary’s financial statements are used by the Group in preparing the consolidated financial statements.
Profit or loss and each component of other comprehensive income are attributed to the owners of the parent and to the non-controlling interests, if any. Total comprehensive income is attributed to the owners of the parent and to the non-controlling interests even if this results in the non-controlling interests having a deficit balance.
Transactions with non-controlling interests that do not result in loss of control are accounted for as equity transactions; that is, as transactions with the owners in their capacity as owners. The Group has established various special purpose entities (“SPE”s). Such SPEs are consolidated whendifference between fair value of any consideration paid and the risks and rewards and substancerelevant share acquired of the relationship betweencarrying value of net assets of the subsidiary is recorded in equity. Gains or losses on disposals to non-controlling interests are also recorded in equity.
When the Group andceases to have control, any retained interest in the SPE indicatesentity is re-measured to its fair value at the date when control is lost, with the change in carrying amount recognized in profit or loss. The fair value is the initial carrying amount for the purposes of subsequently accounting for the retained interest as an associate, joint venture or financial asset. In addition, any amounts previously recognized in other comprehensive income in respect of that the SPE is controlled by the Group. These SPEs controlled byentity are accounted for as if the Group are established with predetermined activities, so that the Group has the rights to obtain the majorityhad directly disposed of the benefits of the activities of the SPEs andrelated assets or liabilities. This may be exposedmean that amounts previously recognized in other comprehensive income are reclassified to risks incident to the activities of the SPEs. The Group retains the majority of the residualprofit or ownership risks related to such SPE or its assets in order to obtain the benefits from its activities.loss.
3.1.2 Associates and joint ventures
Associates are entities over which the Group has significant influence in the financial and operating policy decisions. If the Group holds 20% or more of the voting power of the investee, it is presumed that the Group has significant influence.
A joint venture is a contractual arrangement whereby the Group and other venturers undertake an economic activity that is subject to joint control.
Under the equity method, investments in associates and joint ventures are initially recognized at cost and the carrying amount is increased or decreased to recognize the Group’s share of the profit or loss of the investee and changes in the investee’s equity after the date of acquisition. The Group’s share of the profit or loss of the investee is recognized
in the Group’s profit or loss. Distributions received from an investee reduce the carrying amount of the investment. Profit and losses resulting from ‘upstream’ and ‘downstream’ transactions between the Group and investeeassociates are eliminated to the extent of the Group’s interest in investee.associates.
If associates and joint ventures use accounting policies other than those adopted in the consolidated financial statements for like transactions and events in similar circumstances, appropriate adjustments are made to itsmake the associate’s accounting policies conform to those of the Group when the associate’s financial statements are used by the Group in preparing the consolidated financial statements.applying equity method.
After the carrying amount of the investment is reduced to zero, additional losses are provided for, and a liability is recognized, only to the extent that the Group has incurred legal or constructive obligations or made payments on behalf of the investee.
The Group determines at each reporting date whether there is any objective evidence that the investments in the associates and joint ventures are impaired. If this is the case, the Group calculates the amount of impairment as the difference between the recoverable amount of the associates and joint ventures and its carrying value and recognizes the amount as ‘Share‘share of profit or loss of associates and joint ventures’associates’ in the statements of comprehensive income.
3.1.3 Structured entity
A structured entity is an entity that has been designed so that voting or similar rights are not the dominant factor in deciding who controls the entity. When the Group decides whether it has power to the structured entities in which the Group has interests, it considers factors such as the purpose, the form, the practical ability to direct the relevant activities of a structured entity, the nature of its relationship with a structured entity and the amount of exposure to variable returns.
3.1.4 Trusts and funds
The Group provides management services for trust assets, collective investment and other funds. These trusts and funds are not consolidated in the Group’s consolidated financial statements, except for trusts and funds over which the Group has control.
3.1.43.1.5 Intra-group transactions
All intra-group balances and transactions, and any unrealized gains arising on intra-group transactions, are eliminated in preparing the consolidated financial statements. Unrealized losses are eliminated in the same way as unrealized gains except that they are only eliminated to the extent that there is no evidence of impairment.
3.2 Foreign Currency
3.2.1 Foreign currency transactions and balances
A foreign currency transaction is recorded, on initial recognition in the functional currency, by applying the spot exchange rate between the functional currency and the foreign currency at the date of the transaction. At the end of each reporting period foreign currency monetary items are translated using the closing rate which is the spot exchange rate at the end of the reporting period. Non-monetary items that are measured at fair value in a foreign currency are translated using the spot exchange rates at the date when the fair value was determined and non-monetary items that are measured in terms of historical cost in a foreign currency are translated using the spot exchange rate at the date of the transaction.
Exchange differences arising on the settlement of monetary items or on translating monetary items at rates different from those at which they were translated on initial recognition during the period or in previous financial
statements are recognized in profit or loss in the periodyear in which they arise. When gains or losses on a non-monetary item are recognized in other comprehensive income, any exchange component of those gains or losses are also recognized in other comprehensive income. Conversely, when gains or losses on a non-monetary item are recognized in profit or loss, any exchange component of those gains or losses are also recognized in profit or loss.
3.2.2 Foreign Operations
The financial performance and financial position of all foreign operations, whose functional currencies differ from the Group’s presentation currency, are translated into the Group’s presentation currency using the following procedures:
Assets and liabilities for each statement of financial position presented are translated at the closing rate at the dateend of that statement of financial position.the reporting period. Income and expenses in the statement of comprehensive income presented are translated at average exchange rates for the period. All resulting exchange differences are recognized in other comprehensive income.
Any goodwill arising from the acquisition of a foreign operation and any fair value adjustments to the carrying amounts of assets and liabilities arising from the acquisition of that foreign operation are treated as assets and liabilities of the foreign operation. Thus they are expressed in the functional currency of the foreign operation and are translated into the presentation currency at the closing rate.
On the disposal of a foreign operation, the cumulative amount of the exchange differences relating to that foreign operation, recognized in other comprehensive income and accumulated in the separate component of equity, are reclassified from equity to profit or loss (as a reclassification adjustment) when the gains or losses on disposal are recognized. On the partial disposal of a subsidiary that includes a foreign operation, the Groupre-attributes the proportionate share of the cumulative amount of the exchange differences recognized in other comprehensive income to the non-controlling interests in that foreign operation. In any other partial disposal of a foreign operation, the Group reclassifies to profit or loss only the proportionate share of the cumulative amount of the exchange differences recognized in other comprehensive income.
3.3 Recognition and Measurement of Financial Instruments
3.3.1 Initial recognition
The Group recognizes a financial asset or a financial liability in its statement of financial position when, the Group becomes a party to the contractual provisions of the instrument. A regular way purchase or sale of financial assets (a purchase or sale of a financial asset under a contract whose terms require delivery of the assetfinancial instruments within the time frame established generally by market regulation or practice) is recognized and derecognized using trade date accounting.
The Group classifies financial assets as financial assets at fair value through profit or loss, held-to-maturity investments,financial assets, available-for-sale financial assets, or loans and receivables. The Group classifies financial liabilities as financial liabilities at fair value through profit or loss or other financial liabilities. The classification depends on the nature and holding purpose of the financial instrument at initial recognition in the financial statements.
At initial recognition, a financial asset or financial liability is measured at its fair value plus or minus, in the case of a financial asset or financial liability not at fair value through profit or loss, transaction costs that are directly attributable to the acquisition or issue of the financial asset or financial liability. The fair value is defined as the amount for whichprice that would be received to sell an asset could be exchanged, or paid to transfer a liability settled, between knowledgeable, willing parties in an arm’s length transaction.orderly transaction between market participants. The fair value of a financial instrument on initial recognition is normally the transaction price (that is, the fair value of the consideration given or received). in an arm’s length transaction.
3.3.2 Subsequent measurement
After initial recognition, financial instruments are measured at amortized cost or fair value based on classification at initial recognition.
Amortized cost
The amortized cost of a financial asset or financial liability is the amount at which the financial asset or financial liability is measured at initial recognition and adjusted to reflect principal repayments, cumulative amortization using the effective interest method and any reduction (directly or through the use of an allowance account) for impairment or uncollectibility.
Fair value
Fair values, which the Group primarily uses for the measurement of financial instruments, are the published price quotations based on market prices or dealer price quotations of financial instruments traded in an active market where available. These are the best evidence of fair value. A financial instrument is regarded as quoted in an active market if quoted prices are readily and regularly available from an exchange, dealer, broker, an entity in the same industry, group, pricing service or regulatory agency, and those prices represent actual and regularly occurring market transactions on an arm’s length basis.
If the market for a financial instrument is not active, fair value is determined either by using a valuation technique or independent third-party valuation service. Valuation techniques include using recent arm’s length market transactions between knowledgeable, willing parties, if available, referencing to the current fair value of another instrument that is substantially the same, discounted cash flow analysis and option pricing models.
The Group uses valuation models that are commonly used by market participants and customized for the Group to determine fair values of common over-the-counter (OTC) derivatives such as options, interest rate swaps and currency swaps which are based on the inputs observable in markets. For more complex instruments, the Group uses internally developed models, which are usually based on valuation methods and techniques generally recognized as standard within the industry, or a value measured by an independent external valuation institution as the fair values if all or some of the inputs to the valuation models are not market observable and therefore it is necessary to estimate fair value based on certain assumptions.
The Group’s Fair Value Evaluation Committee, which consists of the risk management department, trading department and accounting department, reviews the appropriateness of internally developed valuation models, and approves the selection and changing of the external valuation institution and other considerations related to fair value measurement. The review results on the fair valuation models are reported to the Market Risk Management subcommittee by the Fair Value Evaluation Committee on a regular basis.
If the valuation technique does not reflect all factors which market participants would consider in setting a price, the fair value is adjusted to reflect those factors. These factors include counterparty credit risk, bid-ask spread, liquidity risk and others.
The chosen valuation technique makes maximum use of market inputs and relies as little as possible on entity-specific inputs. It incorporates all factors that market participants would consider in setting a price and is consistent with accepted economic methodologies for pricing financial instruments. Periodically, the Group calibrates the valuation technique and tests it for validity using prices from observable current market transactions of the same instrument or based on other relevant observable market data.
3.3.3 Derecognition
Derecognition is the removal of a previously recognized financial asset or financial liability from the statement of financial position. The Group derecognizes a financial asset or a financial liability when, and only when:
Derecognition of financial assets
Financial assets are derecognized when the contractual rights to the cash flows from the financial assets expire or the financial assets have been transferred and substantially all the risks and rewards of ownership of the financial assets are also transferred.transferred, or all the risks and rewards of ownership of the financial assets are neither substantially transferred nor retained and the Group has not retained control. If the Group neither transfers nor disposes of substantially all the risks and rewards of ownership of the financial assets, the Group continues to recognize the financial asset to the extent of its continuing involvement in the financial asset.
If the Group transfers the contractual rights to receive the cash flows of the financial asset, but retains substantially all the risks and rewards of ownership of the financial asset, the Group continues to recognize the transferred asset in its entirely and recognize a financial liability for the consideration received.
Derecognition of financial liabilities
Financial liabilities are derecognized from the statement of financial position when the obligation specified in the contract is discharged, cancelled or expires.
3.3.4 Offsetting
A financial asset and a financial liability are offset and the net amount presented in the statement of financial position when, and only when, the Group currently has a legally enforceable right to set offoffset the recognized amounts and intends either to settle on a net basis, or to realize the asset and settle the liability simultaneously.
3.4 Cash and cash equivalents
Cash and cash equivalents include cash on hand, foreign currency, and short-term, highly liquid investments with original maturities of three months or less that are readily convertible to known amounts of cash and which are subject to an insignificant risk of changes in value.
3.5 Non-derivative financial assets
3.5.1 Financial assets at fair value through profit or loss
This category comprises two sub-categories: financial assets classified as held for trading, and financial assets designated by the Group as at fair value through profit or loss upon initial recognition.
A non-derivative financial asset is classified as held for trading if either:
It is acquired for the purpose of selling in the near term, or
It is part of a portfolio of identified financial instruments that are managed together and for which there is evidence of a recent actual pattern of short-term profit-taking.
The Group may designate certain financial assets, other than held for trading, upon initial recognition as at fair value through profit or loss when one of the following conditions is met:
It eliminates or significantly reduces a measurement or recognition inconsistency (sometimes referred to as ‘an accounting mismatch’) that would otherwise arise from measuring assets or liabilities or recognizing the gains and losses on them on different bases.
A group of financial assets is managed and its performance is evaluated on a fair value basis, in accordance with a documented risk management or investment strategy, and information about the group is provided internally on that basis to the Group’s key management personnel.
| • | A contract contains one or more embedded derivatives; the Group may designate the entire hybrid (combined) contract as a financial asset at fair value through profit or loss if allowed by IAS 39,Financial Instruments: Recognition and measurement. |
After initial recognition, a financial asset at fair value through profit or loss is measured at fair value and gains or losses arising from a change in the fair value are recognized in profit or loss. Interest income, dividend income, and gains or losses from sale and repayment from financial assets at fair value through profit or loss are recognized in the statement of comprehensive income as net gains on financial instruments at fair value through profit or loss.
3.5.2 Financial Investments
Available-for-sale and held-to-maturity financial assets are presented as financial investments.
Available-for-sale financial assets
Profit or loss of financial assets classified as available for sale, except for impairment loss and foreign exchange gains and losses resulting from changes in amortized cost of debt securities, is recognized as other comprehensive income, and cumulative profit or loss is reclassified from equity to current profit or loss at the derecognition of the financial asset, and it is recognized as part of other operating profit or loss in the statement of comprehensive income.
However, interest revenue measured using the effective interest method is recognized in current profit or loss, and dividends of financial assets classified as available-for-sale are recognized when the right to receive payment is established.
Available-for-sale financial assets denominated in foreign currencies are translated at the closing rate. For available-for-sale debt securities denominated in foreign currency, exchange differences resulting from changes in amortized cost are recognized in profit or loss as part of other operating income and expenses. For available-for-sale equity securities denominated in foreign currency, the entire change in fair value including any exchange component is recognized in other comprehensive income.
Held-to-maturity financial assets
Held-to-maturity financial assets are non-derivative financial assets with fixed or determinable payments and fixed maturity that the Group’s management has the positive intention and ability to hold to maturity. Held-to-maturity financial assets are subsequently measured at amortized cost using the effective interest method after initial recognition and interest income is recognized using the effective interest method.
3.5.3 Loans and receivables
Non-derivative financial assets which meet the following conditions are classified as loans and receivables:
Those with fixed or determinable payments.
Those that are not quoted in an active market.
Those that the Group does not intend to sell immediately or in the near term.
Those that the Group, upon initial recognition, does not designate as available-for-sale or as at fair value through profit or loss.
After initial recognition, these are subsequently measured at amortized cost using the effective interest method.
If the financial asset is purchased under an agreement to resale the asset at a fixed price or at a price that provides a lender’s return on the purchase price, the consideration paid is recognized as loans and receivables.
3.6 Impairment of financial assets
The Group assesses at the end of each reporting period whether there is any objective evidence that a financial asset or group of financial assets except for financial assets at fair value through profit or loss is impaired. A financial asset or a group of financial assets is impaired and impairment losses are incurred, if and only if, there is objective evidence of impairment as a result of one or more events that occurred after the initial recognition of the asset (a ‘loss event’) and that loss event (or events) has an impact on the estimated future cash flows of the financial asset or group of financial assets that can be reliably estimated. However, losses expected as a result of future events, no matter how likely, are not recognized.
Objective evidence that a financial asset or group of assets is impaired includes observable data that comes to the attention of the holder of the asset about the following loss events:
Significant financial difficulty of the issuer or obligor.
A breach of contract, such as a default or delinquency in interest or principal payments.
The lender, for economic or legal reasons relating to the borrower’s financial difficulty, granting to the borrower a concession that the lender would not otherwise consider.
It becomes probable that the borrower will enterdeclare bankruptcy or otherundergo financial reorganization.
The disappearance of an active market for that financial asset because of financial difficulties.
Observable data indicating that there is a measurable decrease in the estimated future cash flows from a group of financial assets since the initial recognition of those assets, although the decrease cannot yet be identified with the individual financial assets in the portfolio.
In addition to the types of events in the preceding paragraphs, objective evidence of impairment for an investment in an equity instrument classified as an available-for-sale financial assetsasset includes a significant or prolonged decline in the fair value below its cost. Accordingly, the Group considers the decline in the fair value of over 30% against the original cost as a “significant decline” and a six-month decline in the fair value below its cost for an equity instrument as a “prolonged decline”.
If there is objective evidence that an impairment loss has been incurred, the amount of the loss is measured and recognized in profit or loss as either provisions for credit loss or other operating income and expenses.
3.6.1 Loans and receivables
If there is objective evidence that an impairment loss on loans and receivables carried at amortized cost has been incurred, the amount of the loss is measured as the difference between the asset’s carrying amount and the present value of estimated future cash flows (excluding future credit losses that have not been incurred) discounted at the financial asset’s original effective interest rate.
The Group first assesses whether objective evidence of impairment exists individually for financial assets that are individually significant (individual assessment of impairment), and individually or collectively for financial assets that are not individually significant. If the Group determines that no objective evidence of impairment exists for an individually assessed financial asset, whether significant or not, it includes the asset in a group of financial assets with similar credit risk characteristics and collectively assesses them for impairment (collective assessment of impairment).
Individual assessment of impairment
Individual assessment of impairment losses are calculated by discounting the expected future cash flows of a loan at its original effective interest rate and comparing the resultant present value with the loan’s current carrying amount. This process normally encompasses management’s best estimate, such as operating cash flow of the borrower and net realizable value of any collateral held.
Collective assessment of impairment
A methodology based on historical loss experience is used to estimate inherent incurred loss on groups of assets for collective assessment of impairment. Such methodology incorporates factors such as type of collateral, product and borrowers, credit rating, loss emergence period, recovery period and applies probability of default on a group of assets and loss given default by type of recovery method. Also, consistent assumptions are applied to form a formula-based model in estimating inherent loss and to determine factors on the basis of historical loss experience and current condition. The methodology and assumptions used for collective assessment of impairment are reviewed regularly to reduce any differences between loss estimates and actual loss experience.
Impairment loss on loans reduces the carrying amount of the asset through use of an allowance account, and when a loan becomes uncollectable, it is written off against the related allowance account. If, in a subsequent period, the amount of the impairment loss decreases and is objectively related to the subsequent event after recognition of impairment, the previously recognized impairment loss is reversed by adjusting the allowance account. The amount of the reversal is recognized in profit or loss.
3.6.2 Available-for-sale financial assets
When a decline in the fair value of an available-for-sale financial asset has been recognized in other comprehensive income and there is objective evidence that the asset is impaired, the cumulative loss (the difference between the acquisition cost and current fair value, less any impairment loss on that financial asset previously recognized in profit or loss) that had been recognized in other comprehensive income is reclassified from equity to profit or loss as part of other operating income and expenses.
If, in a subsequent period, the fair value of a debt instrument classified as available-for-sale increases and the increase can be objectively related to an event occurring after the impairment loss was recognized in profit or loss, a portion of the impairment loss is reversed up to but not exceeding the previously recorded impairment loss, with the amount of the reversal recognized in profit or loss as part of other operating income and expenses in the statement of comprehensive income. However, impairment losses recognized in profit or loss for an available-for-sale equity instrument classified as available for sale are not reversed through profit or loss.
3.6.3 Held-to-maturity financial assets
If there is objective evidence that an impairment loss on held-to-maturity financial assets carried at amortized cost has been incurred, the amount of the loss is measured as the difference between the asset’s carrying amount and the present value of estimated future cash flows discounted at the financial asset’s original effective interest rate. The impairment loss on held-to-maturity financial assets is directly deducted from the carrying amount. The amount of the loss is recognized in profit or loss as part of other operating income and expenses. The impairment loss on held-to-maturity financial assets is directly deducted from the carrying amount.
In the case of a financial asset classified as held to maturity, if, in a subsequent period, the amount of the impairment loss decreases and it is objectively related to an event occurring after the impairment is recognized, a portion of the previously recognized impairment loss is reversed up to but not exceeding the amortized cost at the date of recovery. The amount of reversal is recognized in profit or loss as part of other operating income and expenses in the statement of comprehensive income.
3.7 Derivative Financial Instruments
The Group enters into numerous derivative financial instrument contracts such as currency forwards, interest rate swaps, currency swaps and others for trading purposes or to manage its exposures to fluctuations in interest rates and currency exchange, amongst others. These derivative financial instruments are presented as derivative financial instruments within the financial statements irrespective of transaction purpose and subsequent measurement requirement.
The Group designates certain derivatives as hedging instruments to hedge the risk of changes in fair value of a recognized asset or liability or of an unrecognized firm commitmentscommitment (fair value hedge) and the risk of changes in cash flow (cash flow hedge).
At the inception of the hedge there is formal designation and documentation of the hedging relationship and the Group’s risk management objective and strategy for undertaking the hedge. That documentation includes identification of the hedging instrument, the hedged item or transaction, the nature of the risk being hedged and how the entity will assess the hedging instrument’s effectiveness in offsetting the exposure to changes in the hedged item’s fair value attributable to the hedged risk.
3.7.1 Derivative financial instruments held for trading
All derivative financial instruments, except for derivatives that are designated and qualify for hedge accounting, are classified as financial instruments held for trading and are measured at fair value. Gains or losses arising from a change in fair value are recognized in profit or loss as part of net gains or losses on financial instruments at fair value through profit or loss.
3.7.2 Fair value hedges
If derivatives qualify for a fair value hedge, the change in fair value of the hedging instrument and the change in fair value of the hedged item attributable to the hedged risk are recognized in profit or loss as part of other operating income and expenses. Fair value hedge accounting is discontinued prospectively if the hedging instrument expires or is sold, terminated or exercised, or the hedge no longer meets the criteria for hedge accounting or the Group revokes the designation. Once fair value hedge accounting is discontinued, the adjustment to the carrying amount of a hedged item is fully amortized to profit or loss by the maturity of the financial instrument using the effective interest method.
3.7.3 Cash flow hedges
The portion of the gain or loss on the hedging instrument that is determined to be an effective hedge is recognized directly in other comprehensive income and the ineffective portion of the gain or loss on the hedging instrument is recognized in profit or loss.
The associated gains or losses that were previously recognized in other comprehensive income are reclassified from equity to profit or loss as a reclassification adjustment in the same period or periods during which the hedged forecast cash flows affects profit or loss. Cash flow hedge accounting is discontinued prospectively if the hedging instrument expires or is sold, terminated or exercised, or the hedge no longer meets the criteria for hedge accounting or the Group revokes the designation. When the cash flow hedge accounting is
discontinued, the cumulative gains or losses on the hedging instrument that have been recognized in other comprehensive income are reclassified to profit or loss over the periodyear in which the forecast transaction occurs. If the forecast transaction is no longer expected to occur, the cumulative gains or losses that had been recognized in other comprehensive income are immediately reclassified to profit or loss.
3.7.4 Embedded derivatives
An embedded derivative is separated from the host contract and accounted for as a derivative if, and only if the economic characteristics and risks of the embedded derivative are not closely related to those of the host contract and a separate instrument with the same terms as the embedded derivative would meet the definition of a derivative and the hybrid (combined) instrument is not measured at fair value with changes in fair value recognized in profit or loss. Gains or losses arising from a change in the fair value of an embedded derivative separated from the host contract are recognized in profit or loss as part of net gains or losses on financial instruments at fair value through profit or loss.
3.7.5 Day one gain and loss
If the Group uses a valuation technique that incorporates data not obtained from observable markets for the fair value at initial recognition of the financial instrument, there may be a difference between the transaction price and the amount determined using that valuation technique. In these circumstances, the fair value of the financial instrumentdifference is deferred and not recognized as the transaction pricein profit or loss, and the difference is amortized by using the straight-line method over the life of the financial instrument. If the fair value of the financial instrument is subsequently determined using observable market inputs, the remaining deferred amount is recognized in profit or loss.loss as part of net gains or losses on financial instruments at fair value through profit or loss or other operating income and expenses.
3.8 Property and equipment
3.8.1 Recognition and Measurement
All property and equipment that qualify for recognition as an asset are measured at its cost and subsequently carried at its cost less any accumulated depreciation and any accumulated impairment losses.
The cost of property and equipment includes any costs directly attributable to bringing the asset to the location and condition necessary for it to be capable of operating in the manner intended by management and the initial estimate of the costs of dismantling and removing the item and restoring the site on which it is located.
Subsequent expenditures are capitalized only when they prolong the useful life or enhance values of the assets but the costs of the day-to-day servicing of the assets such as repair and maintenance costs are recognized in profit or loss as incurred. When part of an item of an asset has a useful life different from that of the entire asset, it is recognized as a separate asset.
3.8.2 Depreciation
Land is not depreciated, whereas other property and equipment are depreciated using the method that reflects the pattern in which the asset’s future economic benefits are expected to be consumed by the Group. The depreciable amount of an asset is determined after deducting its residual value. As for leased assets, if there is no reasonable certainty that the Group will obtain ownership by the end of the lease term, the asset is fully depreciated over the shorter of the lease term and its useful life.
Each part of an item of property and equipment with a cost that is significant in relation to the total cost of the item is depreciated separately.
The depreciation method and estimated useful lives of the assets are as follows:
Property and equipment | Depreciation method | Estimated useful lives | ||
Buildings and structures | Straight-line | 40 years | ||
Leasehold improvements | Declining-balance | 4 years | ||
Equipment and vehicles | Declining-balance |
The residual value, the useful life and the depreciation method applied to an asset are reviewed at least at each financial year end and, if expectations differ from previous estimates or if there has been a significant change in the expected pattern of consumption of the future economic benefits embodied in the asset, the changes are accounted for as a change in an accounting estimate.
3.9 Investment properties
3.9.1 Recognition and Measurement
Properties held to earn rentals or for capital appreciation or both are classified as investment properties. Investment properties are measured initially at their cost and subsequently the cost model is used.
3.9.2 Depreciation
Land is not depreciated, whereas other investment properties are depreciated using the method that reflects the pattern in which the asset’s future economic benefits are expected to be consumed by the Group. The depreciable amount of an asset is determined after deducting its residual value.
The depreciation method and estimated useful lives of the assets are as follows:
Property and equipment | Depreciation method | Estimated useful lives | ||
Buildings | Straight-line | 40 years |
The residual value, the useful life and the depreciation method applied to an asset are reviewed at least at each financial year end and, if expectations differ from previous estimates or if there has been a significant change in the expected pattern of consumption of the future economic benefits embodied in the asset, the changes are accounted for as a change in an accounting estimate.
3.10 Intangible assets
Intangible assets are measured initially at cost and subsequently carried at their cost less any accumulated amortization and any accumulated impairment losses.
Intangible assets, except for goodwill and membership rights, are amortized using the straight-line method with no residual value over their estimated useful economic life since the asset is available for use.
Intangible assets | Amortization method | Estimated useful lives | ||
Industrial property rights | Straight-line | 3~10 years | ||
Software | Straight-line | |||
Others | Straight-line | 4~30 years |
The amortization period and the amortization method for intangible assets with a finite useful life are reviewed at least at each financial year end. Where an intangible asset is not being amortized because its useful life is considered to be indefinite, the Group carries out a review in each accounting period to confirm whether or not events and circumstances still support the assumption of an indefinite useful life. If they do not, the change from the indefinite to finite useful life is accounted for as a change in an accounting estimate.
3.10.1 Goodwill
Recognition and measurement
Goodwill in the Group’s opening IFRS statement of financial positionacquired from business combinations before January 1, 2010 is stated at its carrying amount which was recognized under the Group’s previous accounting policy, prior to the date of transition under the previous K-GAAP.to IFRS.
Goodwill acquired infrom business combinations after the transition date is initially measured as the excess of the aggregate of the consideration transferred, fair value of non-controlling interest and the acquisition-date fair value of the acquirer’s previously held equity interest in the acquiree over the net identifiable assets acquired and liabilities assumed. If this consideration is lower than the fair value of the net assets of the business acquired, the difference is recognized in profit or loss.
For each business combination, the Group decides whether the non-controlling interest in the acquiree is initially measured at fair value or at the non-controlling interest’s proportionate share of the acquiree’s identifiable net assets at the acquisition date.
Acquisition-related costs incurred to effect a business combination are charged to expenses in the periods in which the costs are incurred and the services are received, except for the costs to issue debt or equity securities.
Additional acquisitions of non-controlling interest
Additional acquisitions of non-controlling interests are accounted for as equity transactions. Therefore, no additional goodwill is recognized.
Subsequent measurement
Goodwill is not depreciatedamortized and is stated at cost less accumulated impairment losses. However, goodwill that forms part of the carrying amount of an investment in associates and joint ventures is not separately recognized and an impairment loss recognized is not allocated to any asset, including goodwill, which forms part of the carrying amount of the investment in the associates and joint ventures.associates.
3.10.2 Subsequent expenditure
Subsequent expenditure is capitalized only when it enhances values of the assets. Internally generated intangible asset,assets, such as goodwill and trade name, isare not recognized as an assetassets but expensed as incurred.
3.11 Leases (as lessee)
3.11.1 Finance lease
A lease is classified as a finance lease if it transfers substantially all the risks and rewards incidental to ownership. At the commencement of the lease term, the Group recognizes finance leases as assets and liabilities in its statements of financial position at amounts equal to the fair value of the leased property or, if lower, the present value of the minimum lease payments, each determined at the inception of the lease. Any initial direct costs of the lessee are added to the amount recognized as an asset.
Minimum lease payments are apportioned between the finance charge and the reduction of the outstanding liability. The finance charge is allocated to each period during the lease term so as to produce a constant periodic rate of interest on the remaining balance of the liability. Contingent rents are charged as expenses in the periods in which they are incurred.
The depreciable amount of a leased asset is allocated to each accounting period during the period of expected use on a systematic basis consistent with the depreciation policy the Group adopts for depreciable assets that are owned. If there is reasonable certainty that the lessee will obtain ownership by the end of the lease term, the period of expected use is the useful life of the asset; otherwise, the asset is fully depreciated over the shorter of the lease term and its useful life.
3.11.2 Operating lease
A lease is classified as an operating lease if it does not transfer substantially all the risks and rewards incidental to ownership.
Leases in the financial statements of lessors
Lease income from operating leases are recognized in income on a straight-line basis over the lease term, unless another systematic basis is more representative of the time pattern in which use benefit derived from the leased asset is diminished. Initial direct costs incurred by lessors in negotiating and arranging an operating lease are added to the carrying amount of the leased asset and recognized as an expense over the lease term on the same basis as the lease income.
Leases in the financial statements of lessees
Lease payments under an operating lease (net of any incentives received from the lessor) are recognized as an expense on a straight-line basis over the lease term unless another systematic basis is more representative of the time pattern of the asset’s benefit.
3.12 Impairment of non-financial assets
The Group assesses at the end of each reporting period whether there is any indication that a non-financial asset, except for (i) deferred income tax assets, (ii) assets arising from employee benefits and (iii) non-current assets (or group of assets to be sold) classified as held for sale, may be impaired. If any such indication exists, the Group estimates the recoverable amount of the asset. However, irrespective of whether there is any indication of impairment, the Group tests (i) goodwill acquired in a business combination, (ii) intangible assets with an indefinite useful life and (iii) intangible assets not yet available for use for impairment annually by comparing their carrying amount with their recoverable amount.
The recoverable amount is estimated for the individual asset. If it is not possible to estimate the recoverable amount of the individual asset, the Group determines the recoverable amount of the cash-generating unit to which the asset belongs (the asset’s cash-generating unit). A cash-generating unit is the smallest identifiable group of assets that generates cash inflows that are largely independent of the cash inflows from other assets or groups of assets. The recoverable amount of an asset is the higher of its fair value less costs to sell and its value in use. Value in use is the present value of the future cash flows expected to be derived from an asset orcash-generating unit that are discounted by a pre-tax rate that reflects current market assessments of the time value of money and the risks specific to the asset for which the future cash flow estimates have not been adjusted.
If and only if, the recoverable amount of an asset is less than its carrying amount, the carrying amount of the asset is reduced to its recoverable amount. That reduction is an impairment loss and recognized immediately in profit or loss. For the purpose of impairment testing, goodwill acquired in a business combination is allocated to each of the cash-generating units that are expected to benefit from the synergies of the combination. The
impairment loss is allocated first to reduce the carrying amount of any goodwill allocated to the cash-generating unit and then to the other assets of the unit pro rata on the basis of the carrying amount of each asset in the unit.
An impairment loss recognized for goodwill is not reversed in a subsequent period. The Group assesses at the end of each reporting period whether there is any indication that an impairment loss recognized in prior periods for an asset, other than goodwill, may no longer exist or may have decreased, and an impairment loss recognized in prior periods for an asset other than goodwill shall be reversed if, and only if, there has been a change in the estimates used to determine the asset’s recoverable amount since the last impairment loss was recognized. The increased carrying amount of an asset other than goodwill attributable to a reversal of an impairment loss cannot exceed the carrying amount that would have been determined (net of amortization or depreciation) had no impairment loss been recognized for the asset in prior years.
3.13 Non-current assets held for sale
A non-current asset or disposal group is classified as held for sale if its carrying amount will be recovered principally through a sale transaction rather than through continuing use. For this to be the case, the asset (or disposal group) must be available for immediate sale in its present condition and its sale must be highly probable. A non-current asset (or disposal group) classified as held for sale is measured at the lower of its carrying amount and fair value less costs to sell which is measured in accordance with the applicable IFRS, immediately before the initial classification of the asset (or disposal group) as held for sale.
A non-current asset while it is classified as held for sale or while it is part of a disposal group classified as held for sale is not depreciated (or amortized).
Impairment loss is recognized for any initial or subsequent write-down of the asset (or disposal group) to fair value less costs to sell. Gains are recognized for any subsequent increase in fair value less costs to sell of an asset, but not in excess of the cumulative impairment loss that has been recognized.
3.14 Financial liabilities at fair value through profit or loss
Financial liabilities at fair value through profit or loss are financial liabilities held for trading. After initial recognition, financial liabilities at fair value through profit or loss are measured at fair value and gains or losses arising from changes in the fair value, and gains or losses from sale and repayment of financial liabilities at fair value through profit or loss are recognized as net gains on financial instruments at fair value through profit or loss in the statement of comprehensive income.
3.15 Insurance Contracts
KB Life Insurance Co., Ltd., one of the subsidiaries of the Group, issues insurance contracts.
Insurance contracts are defined as “a contract under which one party (the insurer) accepts significant insurance risk from another party by agreeing to compensate the policyholder if a specified uncertain future event adversely affects the policyholder”. A contract that qualifies as an insurance contract remains an insurance contract until all rights and obligations are extinguished or expire. Such a contract that does not contain significant insurance risk is classified as an investment contract and is within the scope of IAS 39,Financial Instruments: Recognition and measurement to the extent that it gives rise to a financial asset or financial liability, except if the investment contract contains a Discretionary Participation Features (DPF). If the contract has a DPF, the contract is subject to IFRS 4,Insurance Contracts. The Group recognizes assets (liabilities) and gains (losses) relating to insurance contracts as other assets (liabilities) in the statements of financial position, and as other operating income (expenses) in the statements of comprehensive income, respectively.
The following table lists numbers of currently available and discontinued insurance products as of December 31, 2011:2013:
Type | Available | Discontinued | Total | Available | Discontinued | Total | ||||||||||||||||||
Individual annuity | 1 | 8 | 9 | — | 9 | 9 | ||||||||||||||||||
General annuity | 7 | 20 | 27 | 8 | 23 | 31 | ||||||||||||||||||
Other pure endowment | — | 3 | 3 | — | 3 | 3 | ||||||||||||||||||
Pure protection insurance | 12 | 23 | 35 | 17 | 25 | 42 | ||||||||||||||||||
Other protection insurance | — | 28 | 28 | — | 28 | 28 | ||||||||||||||||||
Joint insurance | 6 | 33 | 39 | 9 | 36 | 45 | ||||||||||||||||||
Group protection insurance | 1 | 5 | 6 | 2 | 5 | 7 | ||||||||||||||||||
Group savings insurance | — | 1 | 1 | — | 1 | 1 | ||||||||||||||||||
|
|
|
|
|
| |||||||||||||||||||
Total | 27 | 121 | 148 | 36 | 130 | 166 | ||||||||||||||||||
|
|
|
|
|
| |||||||||||||||||||
3.15.1 Insurance premiums
The Group recognizes collected premiums as revenue when a due date of collection of premiums from insurance contracts comes and the collected premium which is unmatured at the end of the reporting period is recognized as unearned premium.
3.15.2 Insurance liabilities
The Group recognizes a liability for future claims, refunds, policyholders’ dividends and related expenses as follows:
Premium reserve
A premium reserve refers to an amount based on the net premium method for payment of future claims with respect to events covered by insurance policies which have not yet occurred as of the reporting date.
Reserve for outstanding claims
A reserve for outstanding claims refers to the amount not yet paid, out of an amount to be paid or expected to be paid with respect to the insured events which have arisen as of the end of each fiscal year.
Unearned premium reserve
Unearned premium refers to the portion of the premium that has been paid in advance for insurance that has not yet been provided. An unearned premium reserve refers to the amount maintained by the insurer to refund in the event of either party cancelling the contract.
Policyholders’ dividends reserve
Policyholders’ dividends reserve including an interest rate guarantee reserve, a mortality dividend reserve and an interest rate difference dividend reserve is recognized for the purpose of provisioning for policyholders’ dividends in the future in accordance with statutes or insurance terms and conditions.
3.15.23.15.3 Liability adequacy test
The Group assesses at each reporting date whether its insurance liabilities are adequate, using current estimates of all future contractual cash flows and related cash flow such as claims handling cost, as well as cash flows resulting from embedded options and guarantees under its insurance contracts in accordance with IFRS 4.
If the assessment shows that the carrying amount of its insurance liabilities is inadequate in light of the estimated future cash flows, the entire deficiency is recognized in profit or loss and reserved as insurance liabilities. Future cash flows from long-term insurance are discounted at a future rate of return on operating assets, whereas future cash flows from general insurance are not discounted to present value. For liability adequacy tests of premium and unearned premium reserves, the Group considers all cash flow factors such as future insurance premium,
deferred acquisition costs, operating expenses and operating premiums. In relation to the reserve for outstanding claims, the Group elects a model that best reflects the trend of paid claims among several statistical methods to perform the adequacy test.
3.15.33.15.4 Deferred acquisition costs
Acquisition cost is deferred in an amount actually spent for an insurance contract and equally amortized over the premium payment period or the period in which acquisition costs are charged for the relevant insurance contract. The amortization of acquisitionAcquisition costs shall be carried outare amortized over a periodthe shorter of seven years if theor premium payment period or the period are charged acquisition costs exceeds seven years;period; if there is any unamortized acquisition costs remaining as of the date of surrender or lapse, such remainder shall be amortized in the period in which the contract is surrendered or lapsed.
3.16 Provisions
Provisions are recognized when the Group has a present obligation (legal or constructive) as a result of a past event and it is probable that an outflow of resources embodying economic benefits will be required to settle the obligation and a reliable estimate can be made of the amount of the obligation. The risks and uncertainties that inevitably surround many events and circumstances are taken into account in reaching the best estimate of provisions, and where the effect of the time value of money is material, the amount of provisions are the present value of the expenditures expected to be required to settle the obligation.
Provisions on confirmed and unconfirmed acceptances and guarantees, unfunded commitments of credit cards and unused credit lines of consumer and corporate loans are recognized using a valuation model that applies the credit conversion factor, probability of default, and loss given default.
Provisions are reviewed at the end of each reporting period and adjusted to reflect the current best estimate. If it is no longer probable that an outflow of resources embodying economic benefits will be required to settle the obligation, the provisions are reversed.
If the Group has a contract that is onerous, the present obligation under the contract is recognized and measured as provisions. An onerous contract is a contract in which the unavoidable costs of meeting the obligations under the contract exceed the economic benefits expected to be received under it. The unavoidable costs under a contract reflect the minimum net cost to exit from the contract, which is the lower of the cost of fulfilling it and any compensation or penalties arising from failure to fulfill it.
3.17 Financial guarantee contracts
A financial guarantee contract is a contract that requires the issuer (the Group) to make specified payments to reimburse the holder for a loss it incurs because a specified debtor fails to make payments when due in accordance with the original or modified terms of a debt instrument.
Financial guarantee contracts are initially recognized at fair value. After initial recognition, financial guarantee contracts are measured at the higher of:
| • | The amount determined in accordance with IAS 37,Provisions, Contingent Liabilities and Contingent Assets and |
| • | The initial amount recognized, less, when appropriate, cumulative amortization recognized in accordance with IAS 18, |
3.18 Equity instrumentinstruments issued by the Group
An equity instrument is any contract or agreement that evidences a residual interest in the assets of an entity after deducting all of its liabilities.
3.18.1 Ordinary shares
Ordinary shares are classified as equity. Incremental costs directly attributable to the issue of new shares are deducted, net of tax, from the equity.
3.18.2 Hybrid capital instruments
The Group classifies issued financial instrument, or its component parts, on initial recognition as a financial liability or an equity instrument in accordance with the substance of the contractual arrangement and the definitions of a financial liability and an equity instrument. Hybrid capital instruments where the Group has an unconditional right to avoid delivering cash or another financial asset to settle a contractual obligation are classified as equity instruments and presented in equity.
3.18.3 Treasury shares
If entities of the Group reacquire the Parent Company’s equity instruments, those instruments (‘treasury shares’) are deducted from equity. No gains or losses are recognized in profit or loss on the purchase, sale, issue or cancellation of own equity instruments.
3.19 Revenue recognition
3.19.1 Interest income and expense
Interest income and expense are recognized using the effective interest method. The effective interest method is a method of calculating the amortized cost of a financial asset or a financial liability (or groups of financial assets or financial liabilities) and of allocating the interest income or interest expense over the relevant period.
The effective interest rate is the rate that exactly discounts estimated future cash receipts or payments through the expected life of the financial instrument or, where appropriate, a shorter period, to the net carrying amount of the financial asset or financial liability. When calculating the effective interest rate, the Group estimates cash flows considering all contractual terms of the financial instrument but does not consider future credit losses. The calculation includes all fees and points paid or received between parties to the contract that are an integral part of the effective interest rate, transaction costs, and all other premiums or discounts. In those rare cases when it is not possible to estimate reliably the cash flows or the expected life of a financial instrument (or group of financial instruments), the Group uses the contractual cash flows over the full contractual term of the financial instrument (or group of financial instruments).
Interest on impaired financial assets is recognized using the rate of interest used to discount the future cash flows for the purpose of measuring the impairment loss.
3.19.2 Fee and commission income
The Group recognizes financial service fees in accordance with the accounting standard of the financial instrument related to the fees earned.
Fees that are an integral part of the effective interest of a financial instrument
Such fees are generally treated as adjustments of effective interest. Such fees may include compensation for activities such as evaluating the borrower’s financial condition, evaluating and recording guarantees, collateral
and other security arrangements, negotiating the terms of the instrument, preparing and processing documents and closing the transaction and origination fees received on issuing financial liabilities measured at amortized cost. However, fees relating to the creation or acquisition of a financial instrument at fair value through profit or loss are recognized as revenue immediately.
Fees earned as services are provided
Such fees are recognized as revenue as the services are provided. The fees include fees charged for servicing a financial instrument and charged for managing investments.
Fees that are earned on the execution of a significant act
Such fees are recognized as revenue when the significant act has been completed.
Commission on the allotment of shares to a client is recognized as revenue when the shares have been allotted and placement fees for arranging a loan between a borrower and an investor is recognized as revenue when the loan has been arranged.
A syndication fee received by the Group that arranges a loan and retains no part of the loan package for itself (or retains a part at the same effective interest rate for comparable risk as other participants) is compensation for the service of syndication. Such a fee is recognized as revenue when the syndication has been completed.
3.19.3 Dividend income
Dividend income is recognized in profit or loss when the right to receive payment is established. Dividend income from financial assets at fair value through profit or loss and financial investment is recognized in profit or loss as part of net gains on financial assets at fair value through profit or loss and other operating income and expenses, respectively.
3.20 Employee compensation and benefits
3.20.1 Post-employment benefits:
Defined benefit plans
All post-employment benefits, other than defined contribution plans, are classified as defined benefit plans. The amount recognized as a defined benefit liability is the present value of the defined benefit obligation less the fair value of plan assets at the end of the reporting period.
The present value of the defined benefit obligation is calculated annually by independent actuaries using the Projected Unit Credit method. The rate used to discount post-employment benefit obligations is determined by reference to market yields at the end of the reporting period on high quality corporate bonds. The currency and term of the corporate bonds are consistent with the currency and estimated term of the post-employment benefit obligations. Actuarial gains and losses including experience adjustments and the effects of changes in actuarial assumptions are recognized in profit or loss.other comprehensive income(loss).
When the fair value of plan assets deducted from the total of the present value of the defined benefit obligation minus the fair value of plan assets results in an asset, it is recognized to the extent of any cumulative unrecognized past service cost and the present value of any economic benefits available in the form of refunds from the plan or reductions in future contributions to the plan.
Past service cost is the change in the present value of the defined benefit obligation, which arises when the Group introduces a defined benefit plan that attributes to past service or changes the benefits payable for past service underof an existing defined benefit plan. Such past service cost is
immediately recognized as an expense on a straight-line basis overfor the average period until the benefits become vested. To the extent that the benefits are already vested immediately following the introduction of, or changes to, a defined benefit plan, past service cost is recognized immediately.year.
Defined contribution plans
The contributions are recognized as employee benefit expense when they are due.
3.20.2 Short-term employee benefits
Short-term employee benefits are employee benefits (other than termination benefits) that are due to be settled within 12 months after the end of the period in which the employees render the related service. The undiscounted amount of short-term employee benefits expected to be paid in exchange for that service is recognized as a liability (accrued expense), after deducting any amount already paid.
The expected cost of profit-sharing and bonus payments are recognized as liabilities when the Group has a present legal or constructive obligation to make such payments as a result of past events rendered by employees and a reliable estimate of the obligation can be made.
3.20.3 Share-based payment
The Group operates share-based payment arrangements granting awards to directors and employees of the Group. The Group has a choice of whether to settle the awards in cash or by issuing equity instruments for a share-based payment transactionof the parent company at the date of settlement.
For a share-based payment transaction in which the terms of the arrangement provide the Group with the choice of whether to settle in cash or by issuing equity instruments, the Group determined that it has a present obligation to settle in cash because the Group has a past practice and a stated policy of settling in cash. Therefore, the Group accounts for the transaction in accordance with the requirements of cash-settled share-based payment transactions.
The Group measures the services acquired and the liability incurred at fair value. Until the liability is settled, the Group remeasures the fair value of the liability at the end of each reporting period and at the date of settlement, with any changes in fair value recognized in profit or loss for the period.year.
3.20.4 Termination benefits
Termination benefits are employee benefits payable as a result of eitherwhen employment is terminated by the Group’s decision to terminate an employee’s employmentGroup before the normal retirement date, or whenever an employee’s decision to acceptemployee accepts voluntary redundancy in exchange for thosethese benefits. The Group recognizes termination benefits asAn entity shall recognize a liability and an expense when, and onlyfor termination benefits at the earlier of the following dates: when the Groupentity can no longer withdraw the offer of those benefits and when the entity recognizes costs for a restructuring that is demonstrably committed to either terminatewithin the employmentscope of an employee or groupIAS 37 and involves the payment of termination benefits. Termination benefits are measured by considering the number of employees beforeexpected to accept the normal retirement date or provide terminationoffer in the case of a voluntary early retirement. Termination benefits as a result of an offer made in order to encourage voluntary redundancy. The Group is demonstrably committed to a termination when, and only when, the Group has a detailed formal plan for the termination and is without realistic possibility of withdrawal. Where termination benefits fall due more thanover 12 months after the end of the reporting period they are discounted using the appropriate discount rate.to present value.
3.21 Income tax expenses
Income tax expense (tax income) comprises current tax expense (current tax income) and deferred income tax expense (deferred income tax income). Current and deferred income tax are recognized as income or expense and included in profit or loss for the period,year, except to the extent that the tax arises from (a) a transaction or an
event which is recognized, in the same or a different period outside profit or loss, either in other comprehensive income or directly in equity and (b) a business combination.
3.21.1 Current income tax
Current income tax is the amount of income taxes payable (recoverable) in respect of the taxable profit (tax loss) for a period. A difference between the taxable profit and accounting profit may arise when income or expense is included in accounting profit in one period, but is included in taxable profit in a different period. Differences may also arise if there is revenue that is exempt from taxation, or expense that is not deductible in determining taxable profit (tax loss). Current income tax liabilities (assets) for the current and prior periods are measured at the amount expected to be paid to (recovered from) the taxation authorities, using the tax rates (and tax laws) that have been enacted or substantively enacted by the end of the reporting period.
The Group offsets current income tax assets and current income tax liabilities if, and only if, the Group (a) has a legally enforceable right to set offoffset the recognized amounts and (b) intends either to settle on a net basis, or to realize the asset and settle the liability simultaneously.
3.21.2 Deferred income tax
Deferred income tax is recognized, using the asset-liability method, on temporary differences arising between the tax based amount of assets and liabilities and their carrying amount in the financial statements. Deferred income tax liabilities are recognized for all taxable temporary differences and deferred income tax assets are recognized for all deductible temporary differences to the extent that it is probable that taxable profit will be available against which the deductible temporary difference can be utilized. However, deferred income tax liabilities are not recognized if they arise from the initial recognition of goodwill; deferred income tax is not accounted for if it arises from initial recognition of an asset or liability in a transaction other than a business combination that at the time of the transaction affects neither accounting nor taxable profit or loss.
Deferred income tax is provided on temporary differences arising on investments in subsidiaries associates and joint ventures,associates, except for deferred income tax liabilities for which the timing of the reversal of the temporary difference is controlled by the Group and it is probable that the temporary difference will not reverse in the foreseeable future.
The carrying amount of a deferred income tax asset is reviewed at the end of each reporting period. The Group reduces the carrying amount of a deferred income tax asset to the extent that it is no longer probable that sufficient taxable profit will be available to allow the benefit of part or all of that deferred income tax asset to be utilized.
Deferred income tax assets and liabilities are measured at the tax rates that are expected to apply to the period when the asset is realized or the liability is settled, based on tax rates (and tax laws) that have been enacted or substantively enacted by the end of the reporting period. The measurement of deferred income tax liabilities and deferred income tax assets reflects the tax consequences that would follow from the manner in which the Group expects, at the end of the reporting period, to recover or settle the carrying amount of its assets and liabilities.
The Group offsets deferred income tax assets and deferred income tax liabilities when the Group has a legally enforceable right to set offoffset current income tax assets against current income tax liabilities; and the deferred income tax assets and the deferred income tax liabilities relate to income taxes levied by the same taxation authority on either the same taxable entity; or different taxable entities which intend either to settle current income tax liabilities and assets on a net basis, or to realize the assets and settle the liabilities simultaneously, in each future period in which significant amounts of deferred income tax liabilities or assets are expected to be settled or recovered.
3.21.3 Uncertain tax positions
Uncertain tax positions arise from tax treatments applied by the Group which may be challenged by the tax authorities due to the complexity of the transaction or different interpretation of the tax laws, a claim for rectification brought by the Group, or an appeal for a refund claimed from the tax authorities related to additional assessments. The Group recognizes its uncertain tax positions in the financial statements based on the guidance in IAS 37. A liability related to an uncertain tax position is recognized as the best estimate of expenditure if the uncertain tax position is probable of resulting in additional payment to the tax authorities. Meanwhile assets related to uncertain tax positions, caused by a claim for rectification or an appeal for refund claimed from the tax authorities related to additional assessments, are treated as contingent assets under IAS 37. Therefore, tax expenses are recognized in the financial statements when the uncertain tax position is probable of resulting in additional payment to the tax authorities, while tax benefits are recognized only when the tax refund is virtually certain.
The Group classifies interest and penalties related to uncertain tax positions as a component of income tax expense.
3.22 Earnings per share
The Group calculates basic earnings per share amounts and diluted earnings per share amounts for profit or loss attributable to ordinary equity holders of the parent entity and presents them in the statement of comprehensive income. Basic earnings per share is calculated by dividing profit or loss attributable to ordinary equity holders of the Parent Company by the weighted average number of ordinary shares outstanding during the period. For the purpose of calculating diluted earnings per share, the Group adjusts profit or loss attributable to ordinary equity holders of the Parent Company and the weighted average number of shares outstanding for the effects of all dilutive potential ordinary shares including convertible bonds and share options.
3.23 Operating Segments
Operating segments are components of the Group about whichwhere separate financial information is available thatand is evaluated regularly by the chief operating decision maker in deciding how to allocate resources and in assessing performance. Each segment is a strategic business unit that offers different products and services and is managed separately because each business has different risks and opportunities requiring different technology and marketing strategies.
Segment information includes the items which are directly attributable and reasonably allocated to the segment.
3.24 United States dollar amounts
The Group operates primarily in Korea and its official accounting records are maintained in Korean won. The U.S. dollar amounts are provided herein as supplementary information solely for the convenience of the reader. Korean won amounts are expressed in U.S. dollars at the rate of (Won)1,158.50₩1,055.25 to U.S. $1.00, the U.S. Federal Reserve Bank of New York buying exchange rate in effect at noon, December 31, 2011.2013. Such convenience translation into US dollars should not be construed as representations that the Korean won amounts have been, could have been, or could in the future be, converted at this or any other rate of exchange.
4. Financial risk management
4.1 Summary
4.1.1 Overview of Financial Risk Management Policy
The financial risks that the Group is exposed to are credit risk, market risk, liquidity risk, operational risk and others.
The note regarding financial risk management provides information about the risks that the Group is exposed to, including the objectives, policies and processes for managing the risks, the methods used to measure the risks, and capital adequacy. Additional quantitative information is disclosed throughout the consolidated financial statements.
The Group’s risk management system focuses on increasing transparency, developing the risk management environment, preventing transmission of risk to other related subsidiaries, and the preemptive response to risk due to rapid changes in the financial environment to support the Group’s long-term strategy and business decisions efficiently. Credit risk, market risk, liquidity risk, and operational risk have been recognized as the Group’s key risks. These risks are measured in Economic Capital or VaR (Value at Risk) and are managed using a statistical method.
4.1.2 Risk Management Organization
Risk Management Committee
The Risk Management Committee establishes risk management strategies in accordance with the directives of the Board of Directors and determines the Group’s target risk appetite, approves significant risk matters and reviews the level of risks that the Group is exposed to and the appropriateness of the Group’s risk management operations as an ultimate decision-making authority.
Risk Management Council
The Risk Management Council is a consultative group which reviews and makes decisions on matters delegated by the Risk Management Committee and discusses the detailed issues relating to the Group’s risk management.
Risk Management Department
The Risk Management Department is responsible for monitoring and managing the Group’s economic capital limit and managing specific policies, procedures and work processes relating to the Group’s risk management.
4.2 Credit Risk
4.2.1 Overview of Credit Risk
Credit risk is the risk of possible losses in an asset portfolio in the event of a counterparty’s default, breach of contract and deterioration in the credit quality of the counterparty. For risk management reporting purposes, the individual borrower’s default risk, country risk, specific risks and other credit risk exposure components are considered as a whole.
4.2.2 Credit Risk Management
The Group measures expected losses and economic capital on assets that are subject to credit risk management whether on- or off- balance sheetoff-balance items and uses expected losses and economic capital as a management
indicator. The Group manages credit risk by allocating credit risk economic capital limit. limits.
In addition, the Group controls the credit concentration risk exposure by applying and managing total exposure limits to prevent an excessive risk concentration to each industry and borrowers.borrower.
The Group has organized a credit risk management team that focuses on credit risk management in accordance with the Group’s credit risk management policy.
For Kookmin Bank, which is the main subsidiary, its loan analysis department which is independent from the sales department is responsible for all of loan policy, loan limit, loan review, credit evaluation, restructuring and subsequent events. Kookmin Bank’s risk management group is also responsible for planning risk management policy, applying limits of credit line,lines, measuring the credit risk economic capital, adjusting credit limit,limits, reviewing credit and verifying credit evaluation models.
4.2.3 Maximum exposure to credit risk
The Group’s maximum exposures of financial instruments, excluding equity securities, to credit risk without consideration of collateral values as of January 1, 2010, and December 31, 20102012 and 2011,2013, are as follows:
| As of January 1, | As of December 31, | As of December 31, | ||||||||||||||||||
| 2010 | 2010 | 2011 | 2012 | 2013 | ||||||||||||||||
| (In millions of Korean won) | (In millions of Korean won) | |||||||||||||||||||
Financial assets | ||||||||||||||||||||
Due from financial institutions | (Won) | 6,743,951 | (Won) | 4,592,052 | (Won) | 6,556,027 | ₩ | 7,742,497 | ₩ | 12,094,103 | ||||||||||
Financial assets held for trading | 4,285,650 | 3,536,699 | 5,176,524 | |||||||||||||||||
Financial assets at fair value through profit or loss | ||||||||||||||||||||
Financial assets held for trading(1) | 8,331,454 | 7,866,037 | ||||||||||||||||||
Financial assets designated at fair value through profit or loss | 529 | 139 | 574,687 | 192,607 | 210,805 | |||||||||||||||
Derivatives | 2,091,285 | 1,819,409 | ||||||||||||||||||
Loans | 213,644,791 | 219,001,356 | ||||||||||||||||||
Financial investments | ||||||||||||||||||||
Available-for-sale financial assets | 18,869,560 | 19,125,724 | 19,734,531 | 21,737,240 | 18,933,288 | |||||||||||||||
Held-to-maturity financial assets | 13,215,287 | 13,908,102 | 13,055,158 | 12,255,806 | 13,016,991 | |||||||||||||||
Loans | 196,686,844 | 197,621,004 | 212,107,027 | |||||||||||||||||
Derivatives | 3,392,391 | 2,595,121 | 2,448,455 | |||||||||||||||||
Other financial assets | 6,281,664 | 6,186,227 | 6,409,905 | 7,569,596 | 6,251,679 | |||||||||||||||
|
| |||||||||||||||||||
Total financial assets | 273,565,276 | 279,193,668 | ||||||||||||||||||
|
| |||||||||||||||||||
Off-balance sheet items | ||||||||||||||||||||
Acceptances and guarantees contracts | 14,718,560 | 12,476,592 | 11,542,684 | 9,418,281 | 9,804,692 | |||||||||||||||
Financial guarantee contracts | 1,415,358 | 1,153,687 | 945,167 | 1,509,269 | 3,097,372 | |||||||||||||||
Commitments | 85,385,888 | 87,738,358 | 91,743,942 | 93,193,481 | 95,422,032 | |||||||||||||||
|
|
|
|
| ||||||||||||||||
Total off-balance items | 104,121,031 | 108,324,096 | ||||||||||||||||||
|
| |||||||||||||||||||
Total | (Won) | 350,995,682 | (Won) | 348,933,705 | (Won) | 370,294,107 | ₩ | 377,686,307 | ₩ | 387,517,764 | ||||||||||
|
|
|
|
| ||||||||||||||||
| (1) | Financial instruments indexed to the price of gold amounting to ₩39,839 million and ₩40,252 million as of December 31, 2012 and 2013, respectively, are included. |
4.2.4 Credit risk of loans
The Group maintains an allowance for loan losses associated with credit risk on loans to manage its credit risk.
The Group recognizes an impairment loss on loans carried at amortized cost when there is any objective indication of impairment. Under IFRS, an impairment loss is based on losses incurred at the end of the reporting period thereforeyear. Therefore, the Group does not recognize losses expected losses as a result of future events. The Group measuremeasures inherent incurred losses on loans and presents them in the financial statements through the use of an allowance account which is offset against the related loans.
Loans are categorizedclassified as follows:
| As of January 1, 2010 | 2012 | |||||||||||||||||||||||||||||||||||||||||||||||||||||||||||||||
| Retail | Corporate | Credit card | Total | Retail | Corporate | Credit card | Total | |||||||||||||||||||||||||||||||||||||||||||||||||||||||||
| Amount | % | Amount | % | Amount | % | Amount | % | Amount | % | Amount | % | Amount | % | Amount | % | |||||||||||||||||||||||||||||||||||||||||||||||||
| (In millions of Korean won) | (In millions of Korean won) | |||||||||||||||||||||||||||||||||||||||||||||||||||||||||||||||
Neither past due nor impaired | (Won) | 96,924,679 | 49.55 | (Won) | 87,689,932 | 44.82 | (Won) | 11,015,022 | 5.63 | (Won) | 195,629,633 | 100.00 | ₩ | 100,663,733 | 97.26 | ₩ | 98,673,368 | 97.18 | ₩ | 11,353,316 | 95.61 | ₩ | 210,690,417 | 97.13 | ||||||||||||||||||||||||||||||||||||||||
Past due but not impaired | 744,733 | 64.17 | 150,304 | 12.95 | 265,574 | 22.88 | 1,160,611 | 100.00 | 1,656,088 | 1.60 | 478,035 | 0.47 | 399,778 | 3.37 | 2,533,901 | 1.17 | ||||||||||||||||||||||||||||||||||||||||||||||||
Impaired | 700,777 | 22.14 | 2,379,561 | 75.17 | 85,016 | 2.69 | 3,165,354 | 100.00 | 1,184,820 | 1.14 | 2,383,555 | 2.35 | 120,757 | 1.02 | 3,689,132 | 1.70 | ||||||||||||||||||||||||||||||||||||||||||||||||
|
|
|
|
|
|
|
|
|
|
|
|
|
|
|
| |||||||||||||||||||||||||||||||||||||||||||||||||
Sub-total | 98,370,189 | 49.20 | 90,219,797 | 45.12 | 11,365,612 | 5.68 | 199,955,598 | 100.00 | 103,504,641 | 100.00 | 101,534,958 | 100.00 | 11,873,851 | 100.00 | 216,913,450 | 100.00 | ||||||||||||||||||||||||||||||||||||||||||||||||
|
|
|
|
|
|
|
|
|
|
|
|
|
|
|
| |||||||||||||||||||||||||||||||||||||||||||||||||
Allowances(1) | (415,340 | ) | 12.71 | (2,516,459 | ) | 76.98 | (336,955 | ) | 10.31 | (3,268,754 | ) | 100.00 | (687,851 | ) | 0.66 | (2,251,318 | ) | 2.22 | (329,490 | ) | 2.77 | (3,268,659 | ) | 1.51 | ||||||||||||||||||||||||||||||||||||||||
|
|
|
|
|
|
|
|
|
|
|
| |||||||||||||||||||||||||||||||||||||||||||||||||||||
Carrying amount | (Won) | 97,954,849 | 49.80 | (Won) | 87,703,338 | 44.59 | (Won) | 11,028,657 | 5.61 | (Won) | 196,686,844 | 100.00 | ₩ | 102,816,790 | ₩ | 99,283,640 | ₩ | 11,544,361 | ₩ | 213,644,791 | ||||||||||||||||||||||||||||||||||||||||||||
|
|
|
|
|
|
|
|
|
|
|
| |||||||||||||||||||||||||||||||||||||||||||||||||||||
| As of December 31, 2010 | ||||||||||||||||||||||||||||||||
| Retail | Corporate | Credit card | Total | |||||||||||||||||||||||||||||
| Amount | % | Amount | % | Amount | % | Amount | % | |||||||||||||||||||||||||
| (In millions of Korean won) | ||||||||||||||||||||||||||||||||
Neither past due nor impaired | (Won) | 96,773,875 | 49.43 | (Won) | 86,917,292 | 44.40 | (Won) | 12,089,127 | 6.17 | (Won) | 195,780,294 | 100.00 | ||||||||||||||||||||
Past due but not impaired | 1,274,435 | 71.53 | 261,493 | 14.68 | 245,600 | 13.79 | 1,781,528 | 100.00 | ||||||||||||||||||||||||
Impaired | 1,014,110 | 26.58 | 2,722,930 | 71.37 | 78,318 | 2.05 | 3,815,358 | 100.00 | ||||||||||||||||||||||||
|
|
|
|
|
|
|
|
|
|
|
|
|
|
|
| |||||||||||||||||
Sub-total | 99,062,420 | 49.19 | 89,901,715 | 44.64 | 12,413,045 | 6.17 | 201,377,180 | 100.00 | ||||||||||||||||||||||||
|
|
|
|
|
|
|
|
|
|
|
|
|
|
|
| |||||||||||||||||
Allowances(1) | (520,842 | ) | 13.87 | (2,907,747 | ) | 77.41 | (327,587 | ) | 8.72 | (3,756,176 | ) | 100.00 | ||||||||||||||||||||
|
|
|
|
|
|
|
|
|
|
|
|
|
|
|
| |||||||||||||||||
Carrying amount | (Won) | 98,541,578 | 49.86 | (Won) | 86,993,968 | 44.02 | (Won) | 12,085,458 | 6.12 | (Won) | 197,621,004 | 100.00 | ||||||||||||||||||||
|
|
|
|
|
|
|
|
|
|
|
|
|
|
|
| |||||||||||||||||
| As of December 31, 2011 | 2013 | |||||||||||||||||||||||||||||||||||||||||||||||||||||||||||||||
| Retail | Corporate | Credit card | Total | Retail | Corporate | Credit card | Total | |||||||||||||||||||||||||||||||||||||||||||||||||||||||||
| Amount | % | Amount | % | Amount | % | Amount | % | Amount | % | Amount | % | Amount | % | Amount | % | |||||||||||||||||||||||||||||||||||||||||||||||||
| (In millions of Korean won) | (In millions of Korean won) | |||||||||||||||||||||||||||||||||||||||||||||||||||||||||||||||
Neither past due nor impaired | (Won) | 101,217,550 | 48.26 | (Won) | 96,553,423 | 46.04 | (Won) | 11,945,631 | 5.70 | (Won) | 209,716,604 | 100.00 | ₩ | 104,751,607 | 97.22 | ₩ | 98,939,364 | 96.68 | ₩ | 11,253,836 | 95.50 | ₩ | 214,944,807 | 96.88 | ||||||||||||||||||||||||||||||||||||||||
Past due but not impaired | 1,646,070 | 69.33 | 359,554 | 15.14 | 368,791 | 15.53 | 2,374,415 | 100.00 | 1,967,127 | 1.83 | 538,571 | 0.53 | 321,978 | 2.73 | 2,827,676 | 1.27 | ||||||||||||||||||||||||||||||||||||||||||||||||
Impaired | 1,061,585 | 30.65 | 2,295,483 | 66.27 | 106,845 | 3.08 | 3,463,913 | 100.00 | 1,024,480 | 0.95 | 2,856,933 | 2.79 | 208,644 | 1.77 | 4,090,057 | 1.85 | ||||||||||||||||||||||||||||||||||||||||||||||||
|
|
|
|
|
|
|
|
|
|
|
|
|
|
|
| |||||||||||||||||||||||||||||||||||||||||||||||||
Sub-total | 103,925,205 | 48.22 | 99,208,460 | 46.02 | 12,421,267 | 5.76 | 215,554,932 | 100.00 | 107,743,214 | 100.00 | 102,334,868 | 100.00 | 11,784,458 | 100.00 | 221,862,540 | 100.00 | ||||||||||||||||||||||||||||||||||||||||||||||||
|
|
|
|
|
|
|
|
|
|
|
|
|
|
|
| |||||||||||||||||||||||||||||||||||||||||||||||||
Allowances(1) | (635,476 | ) | 18.43 | (2,462,047 | ) | 71.41 | (350,382 | ) | 10.16 | (3,447,905 | ) | 100.00 | (580,510 | ) | 0.54 | (1,870,874 | ) | 1.83 | (409,800 | ) | 3.48 | (2,861,184 | ) | 1.29 | ||||||||||||||||||||||||||||||||||||||||
|
|
|
|
|
|
|
|
|
|
|
| |||||||||||||||||||||||||||||||||||||||||||||||||||||
Carrying amount | (Won) | 103,289,729 | 48.70 | (Won) | 96,746,413 | 45.61 | (Won) | 12,070,885 | 5.69 | (Won) | 212,107,027 | 100.00 | ₩ | 107,162,704 | ₩ | 100,463,994 | ₩ | 11,374,658 | ₩ | 219,001,356 | ||||||||||||||||||||||||||||||||||||||||||||
|
|
|
|
|
|
|
|
|
|
|
| |||||||||||||||||||||||||||||||||||||||||||||||||||||
| (1) |
|
Credit quality of loans that are neither past due nor impaired are as follows:
| As of January 1, 2010 | ||||||||||||||||
| Retail | Corporate | Credit card | Total | |||||||||||||
| (In millions of Korean won) | ||||||||||||||||
Outstanding | (Won) | 71,827,375 | (Won) | 27,674,401 | (Won) | 3,055,303 | (Won) | 102,557,079 | ||||||||
Good | 21,290,100 | 33,965,256 | 4,261,980 | 59,517,336 | ||||||||||||
Below Normal | 3,807,204 | 26,050,275 | 3,697,739 | 33,555,218 | ||||||||||||
|
|
|
|
|
|
|
| |||||||||
Total | (Won) | 96,924,679 | (Won) | 87,689,932 | (Won) | 11,015,022 | (Won) | 195,629,633 | ||||||||
|
|
|
|
|
|
|
| |||||||||
Outstanding Good Below Normal Total Grade 1 Grade 2 Grade 3 Grade 4 Grade 5 Total As of December 31, 2010 Retail Corporate Credit card Total (In millions of Korean won) (Won) 73,679,761 (Won) 27,798,531 (Won) 4,045,467 (Won) 105,523,759 19,176,181 35,244,465 4,627,103 59,047,749 3,917,933 23,874,296 3,416,557 31,208,786 (Won) 96,773,875 (Won) 86,917,292 (Won) 12,089,127 (Won) 195,780,294 2012 Retail Corporate Credit card Total (In millions of Korean won) ₩ 83,028,229 ₩ 38,723,278 ₩ 5,674,508 ₩ 127,426,015 13,894,242 40,862,205 3,871,593 58,628,040 2,574,463 15,395,220 1,568,939 19,538,622 766,998 3,429,806 153,906 4,350,710 399,801 262,859 84,370 747,030 ₩ 100,663,733 ₩ 98,673,368 ₩ 11,353,316 ₩ 210,690,417
| As of December 31, 2011 | ||||||||||||||||
| Retail | Corporate | Credit card | Total | |||||||||||||
| (In millions of Korean won) | ||||||||||||||||
Outstanding | (Won) | 83,790,049 | (Won) | 35,746,858 | (Won) | 5,403,273 | (Won) | 124,940,180 | ||||||||
Good | 14,532,234 | 39,312,628 | 4,378,523 | 58,223,385 | ||||||||||||
Below Normal | 2,895,267 | 21,493,937 | 2,163,835 | 26,553,039 | ||||||||||||
|
|
|
|
|
|
|
| |||||||||
Total | (Won) | 101,217,550 | (Won) | 96,553,423 | (Won) | 11,945,631 | (Won) | 209,716,604 | ||||||||
|
|
|
|
|
|
|
| |||||||||
| 2013 | ||||||||||||||||
| Retail | Corporate | Credit card | Total | |||||||||||||
| (In millions of Korean won) | ||||||||||||||||
Grade 1 | ₩ | 88,331,532 | ₩ | 40,950,125 | ₩ | 5,670,689 | ₩ | 134,952,346 | ||||||||
Grade 2 | 12,320,960 | 43,497,358 | 3,806,194 | 59,624,512 | ||||||||||||
Grade 3 | 3,195,119 | 11,993,854 | 1,438,491 | 16,627,464 | ||||||||||||
Grade 4 | 637,556 | 2,237,288 | 184,110 | 3,058,954 | ||||||||||||
Grade 5 | 266,440 | 260,739 | 154,352 | 681,531 | ||||||||||||
|
|
|
|
|
|
|
| |||||||||
Total | ₩ | 104,751,607 | ₩ | 98,939,364 | ₩ | 11,253,836 | ₩ | 214,944,807 | ||||||||
|
|
|
|
|
|
|
| |||||||||
Credit quality of loans is classified as follows,graded according to the internal credit rating:ratings are as follows:
| Range of PD (%) (Probability of Default) | Retail | Corporate | ||||||||||
| 0.0 ~ 1.0 | 1 | AAA ~ BBB+ | |||||||||
| 1.0 ~ 5.0 | 6 ~ 8 grade | BBB ~ BB | |||||||||
| 5.0 ~ 15.0 | 9 ~ | BB- ~ | |||||||||
Grade 4 | 15.0 ~ 30.0 | 11 grade | B- ~ CCC | |||||||||
Grade 5 | 30.0 ~ | 12 grade or under | CC or under | |||||||||
Loans that are past due but not impaired are as follows:
| As of January 1, 2010 | 2012 | |||||||||||||||||||||||||||||||||||||||
| 1 ~ 29 days | 30 ~ 59 days | 60 ~ 89 days | over 90 days | Total | 1 ~ 29 days | 30 ~ 59 days | 60 ~ 89 days | 90 days or more | Total | |||||||||||||||||||||||||||||||
| (In millions of Korean won) | (In millions of Korean won) | |||||||||||||||||||||||||||||||||||||||
Retail | (Won) | 614,003 | (Won) | 81,673 | (Won) | 49,057 | (Won) | — | (Won) | 744,733 | ₩ | 1,344,412 | ₩ | 223,858 | ₩ | 87,736 | ₩ | 82 | ₩ | 1,656,088 | ||||||||||||||||||||
Corporate | 90,609 | 46,830 | 12,865 | — | 150,304 | 322,516 | 125,503 | 28,153 | 1,863 | 478,035 | ||||||||||||||||||||||||||||||
Credit card | 175,655 | 53,149 | 31,030 | 5,740 | 265,574 | 293,863 | 57,325 | 47,698 | 892 | 399,778 | ||||||||||||||||||||||||||||||
|
|
|
|
|
|
|
|
|
| |||||||||||||||||||||||||||||||
Total | (Won) | 880,267 | (Won) | 181,652 | (Won) | 92,952 | (Won) | 5,740 | (Won) | 1,160,611 | ₩ | 1,960,791 | ₩ | 406,686 | ₩ | 163,587 | ₩ | 2,837 | ₩ | 2,533,901 | ||||||||||||||||||||
|
|
|
|
|
|
|
|
|
| |||||||||||||||||||||||||||||||
| As of December 31, 2010 | ||||||||||||||||||||
| 1 ~ 29 days | 30 ~ 59 days | 60 ~ 89 days | over 90 days | Total | ||||||||||||||||
| (In millions of Korean won) | ||||||||||||||||||||
Retail | (Won) | 988,574 | (Won) | 188,504 | (Won) | 97,019 | (Won) | 338 | (Won) | 1,274,435 | ||||||||||
Corporate | 171,467 | 58,641 | 31,385 | — | 261,493 | |||||||||||||||
Credit card | 154,638 | 54,127 | 36,218 | 617 | 245,600 | |||||||||||||||
|
|
|
|
|
|
|
|
|
| |||||||||||
Total | (Won) | 1,314,679 | (Won) | 301,272 | (Won) | 164,622 | (Won) | 955 | (Won) | 1,781,528 | ||||||||||
|
|
|
|
|
|
|
|
|
| |||||||||||
| As of December 31, 2011 | ||||||||||||||||||||
| 1 ~ 29 days | 30 ~ 59 days | 60 ~ 89 days | over 90 days | Total | ||||||||||||||||
| (In millions of Korean won) | ||||||||||||||||||||
Retail | (Won) | 1,361,218 | (Won) | 181,343 | (Won) | 103,340 | (Won) | 169 | (Won) | 1,646,070 | ||||||||||
Corporate | 196,591 | 138,817 | 24,146 | — | 359,554 | |||||||||||||||
Credit card | 242,975 | 71,518 | 53,667 | 631 | 368,791 | |||||||||||||||
|
|
|
|
|
|
|
|
|
| |||||||||||
Total | (Won) | 1,800,784 | (Won) | 391,678 | (Won) | 181,153 | (Won) | 800 | (Won) | 2,374,415 | ||||||||||
|
|
|
|
|
|
|
|
|
| |||||||||||
Retail Corporate Credit card Total 2013 1 ~ 29 days 30 ~ 59 days 60 ~ 89 days 90 days or more Total (In millions of Korean won) ₩ 1,729,091 ₩ 169,341 ₩ 68,629 ₩ 66 ₩ 1,967,127 435,700 54,900 47,971 — 538,571 234,003 51,416 36,259 300 321,978 ₩ 2,398,794 ₩ 275,657 ₩ 152,859 ₩ 366 ₩ 2,827,676
Impaired loans are as follows:
| As of January 1, 2010 | 2012 | |||||||||||||||||||||||||||||||
| Retail | Corporate | Credit card | Total | Retail | Corporate | Credit card | Total | |||||||||||||||||||||||||
| (In millions of Korean won) | (In millions of Korean won) | |||||||||||||||||||||||||||||||
Loans | (Won) | 700,777 | (Won) | 2,379,561 | (Won) | 85,016 | (Won) | 3,165,354 | ₩ | 1,184,820 | ₩ | 2,383,555 | ₩ | 120,757 | ₩ | 3,689,132 | ||||||||||||||||
Allowances | (187,656 | ) | (1,124,846 | ) | (54,945 | ) | (1,367,447 | ) | ||||||||||||||||||||||||
Individual assessment | — | (761,563 | ) | — | (761,563 | ) | ||||||||||||||||||||||||||
Collective assessment | (451,891 | ) | (236,062 | ) | (72,373 | ) | (760,326 | ) | ||||||||||||||||||||||||
|
|
|
| |||||||||||||||||||||||||||||
Total allowances | (451,891 | ) | (997,625 | ) | (72,373 | ) | (1,521,889 | ) | ||||||||||||||||||||||||
|
|
|
|
|
|
|
| |||||||||||||||||||||||||
Carrying amount | (Won) | 513,121 | (Won) | 1,254,715 | (Won) | 30,071 | (Won) | 1,797,907 | ₩ | 732,929 | ₩ | 1,385,930 | ₩ | 48,384 | ₩ | 2,167,243 | ||||||||||||||||
|
|
|
|
|
|
|
| |||||||||||||||||||||||||
| As of December 31, 2010 | 2013 | |||||||||||||||||||||||||||||||
| Retail | Corporate | Credit card | Total | Retail | Corporate | Credit card | Total | |||||||||||||||||||||||||
| (In millions of Korean won) | (In millions of Korean won) | |||||||||||||||||||||||||||||||
Loans | (Won) | 1,014,110 | (Won) | 2,722,930 | (Won) | 78,318 | (Won) | 3,815,358 | ₩ | 1,024,480 | ₩ | 2,856,933 | ₩ | 208,644 | ₩ | 4,090,057 | ||||||||||||||||
Allowances | (256,049 | ) | (1,361,484 | ) | (50,725 | ) | (1,668,258 | ) | ||||||||||||||||||||||||
Individual assessment | (2 | ) | (1,126,249 | ) | — | (1,126,251 | ) | |||||||||||||||||||||||||
Collective assessment | (381,739 | ) | (229,058 | ) | (133,616 | ) | (744,413 | ) | ||||||||||||||||||||||||
|
|
|
| |||||||||||||||||||||||||||||
Total allowances | (381,741 | ) | (1,355,307 | ) | (133,616 | ) | (1,870,664 | ) | ||||||||||||||||||||||||
|
|
|
|
|
|
|
| |||||||||||||||||||||||||
Carrying amount | (Won) | 758,061 | (Won) | 1,361,446 | (Won) | 27,593 | (Won) | 2,147,100 | ₩ | 642,739 | ₩ | 1,501,626 | ₩ | 75,028 | ₩ | 2,219,393 | ||||||||||||||||
|
|
|
|
|
|
|
| |||||||||||||||||||||||||
| As of December 31, 2011 | ||||||||||||||||
| Retail | Corporate | Credit card | Total | |||||||||||||
| (In millions of Korean won) | ||||||||||||||||
Loans | (Won) | 1,061,585 | (Won) | 2,295,483 | (Won) | 106,845 | (Won) | 3,463,913 | ||||||||
Allowances | (397,623 | ) | (1,251,577 | ) | (68,513 | ) | (1,717,713 | ) | ||||||||
|
|
|
|
|
|
|
| |||||||||
Carrying amount | (Won) | 663,962 | (Won) | 1,043,906 | (Won) | 38,332 | (Won) | 1,746,200 | ||||||||
|
|
|
|
|
|
|
| |||||||||
A quantification of the extent to which collateral and other credit enhancements mitigate credit risk as of January 1, 2010, and December 31, 20102012 and 2011,2013, are as follows:
| As of January 1, 2010 | 2012 | |||||||||||||||||||||||||||||||||||||||
| Impaired Loans | Non-impaired Loans | Total | Impaired Loans | Non-impaired Loans | ||||||||||||||||||||||||||||||||||||
| Individual | Collective | Past due | Not past due | Individual | Collective | Past due | Not past due | Total | ||||||||||||||||||||||||||||||||
| (In millions of Korean won) | (In millions of Korean won) | |||||||||||||||||||||||||||||||||||||||
Guarantee | (Won) | 12,340 | (Won) | 153,074 | (Won) | 97,988 | (Won) | 12,484,706 | (Won) | 12,748,108 | ||||||||||||||||||||||||||||||
Guarantees | ₩ | 18,512 | ₩ | 181,979 | ₩ | 326,676 | ₩ | 25,175,205 | ₩ | 25,702,372 | ||||||||||||||||||||||||||||||
Deposits and savings | — | 8,250 | 1,029 | 2,993,531 | 3,002,810 | 200 | 19,867 | 62,484 | 2,690,164 | 2,772,715 | ||||||||||||||||||||||||||||||
Property and equipment | 24,853 | 2,470 | 336 | 702,028 | 729,687 | 18,776 | 4,816 | 883 | 1,427,940 | 1,452,415 | ||||||||||||||||||||||||||||||
Real estate | 279,443 | 718,383 | 428,917 | 89,607,659 | 91,034,402 | 329,743 | 478,800 | 1,201,141 | 109,197,591 | 111,207,275 | ||||||||||||||||||||||||||||||
|
|
|
|
|
|
|
|
|
| |||||||||||||||||||||||||||||||
Total | (Won) | 316,636 | �� | (Won) | 882,177 | (Won) | 528,270 | (Won) | 105,787,924 | (Won) | 107,515,007 | ₩ | 367,231 | ₩ | 685,462 | ₩ | 1,591,184 | ₩ | 138,490,900 | ₩ | 141,134,777 | |||||||||||||||||||
|
|
|
|
|
|
|
|
|
| |||||||||||||||||||||||||||||||
| As of December 31, 2010 | ||||||||||||||||||||
| Impaired Loans | Non-impaired Loans | Total | ||||||||||||||||||
| Individual | Collective | Past due | Not past due | |||||||||||||||||
| (In millions of Korean won) | ||||||||||||||||||||
Guarantee | (Won) | 46,019 | (Won) | 140,955 | (Won) | 159,609 | (Won) | 13,667,393 | (Won) | 14,013,976 | ||||||||||
Deposits and savings | — | 76,951 | 78,217 | 2,648,529 | 2,803,697 | |||||||||||||||
Property and equipment | 27,431 | 4,806 | 5,129 | 1,006,446 | 1,043,812 | |||||||||||||||
Real estate | 225,720 | 598,989 | 708,914 | 98,593,556 | 100,127,179 | |||||||||||||||
|
|
|
|
|
|
|
|
|
| |||||||||||
Total | (Won) | 299,170 | (Won) | 821,701 | (Won) | 951,869 | (Won) | 115,915,924 | (Won) | 117,988,664 | ||||||||||
|
|
|
|
|
|
|
|
|
| |||||||||||
| As of December 31, 2011 | 2013 | |||||||||||||||||||||||||||||||||||||||
| Impaired Loans | Non-impaired Loans | Total | Impaired Loans | Non-impaired Loans | ||||||||||||||||||||||||||||||||||||
| Individual | Collective | Past due | Not past due | Individual | Collective | Past due | Not past due | Total | ||||||||||||||||||||||||||||||||
| (In millions of Korean won) | (In millions of Korean won) | |||||||||||||||||||||||||||||||||||||||
Guarantee | (Won) | 21,210 | (Won) | 124,641 | (Won) | 173,708 | (Won) | 18,345,603 | (Won) | 18,665,162 | ||||||||||||||||||||||||||||||
Guarantees | ₩ | 29,929 | ₩ | 226,721 | ₩ | 382,997 | ₩ | 32,102,952 | ₩ | 32,742,599 | ||||||||||||||||||||||||||||||
Deposits and savings | — | 31,037 | 69,880 | 2,654,151 | 2,755,068 | 5,099 | 27,060 | 56,066 | 2,324,625 | 2,412,850 | ||||||||||||||||||||||||||||||
Property and equipment | 12,648 | 4,717 | 1,671 | 1,067,929 | 1,086,965 | 11,843 | 1,959 | 1,281 | 1,676,443 | 1,691,526 | ||||||||||||||||||||||||||||||
Real estate | 176,022 | 398,292 | 1,158,298 | 105,470,158 | 107,202,770 | 425,748 | 537,904 | 1,506,854 | 114,659,274 | 117,129,780 | ||||||||||||||||||||||||||||||
|
|
|
|
|
|
|
|
|
| |||||||||||||||||||||||||||||||
Total | (Won) | 209,880 | (Won) | 558,687 | (Won) | 1,403,557 | (Won) | 127,537,841 | (Won) | 129,709,965 | ₩ | 472,619 | ₩ | 793,644 | ₩ | 1,947,198 | ₩ | 150,763,294 | ₩ | 153,976,755 | ||||||||||||||||||||
|
|
|
|
|
|
|
|
|
| |||||||||||||||||||||||||||||||
4.2.5 Credit quality of securities
The financial assets at fair value through profit or loss and financial investments excluding equity securities that are exposed to credit risk are as follows:
| As of January 1, | As of December 31, | |||||||||||||||||||
| 2010 | 2010 | 2011 | 2012 | 2013 | ||||||||||||||||
| (In millions of Korean won) | (In millions of Korean won) | |||||||||||||||||||
Securities that are neither past due nor impaired | (Won) | 36,360,478 | (Won) | 36,557,475 | (Won) | 38,531,825 | ₩ | 42,464,823 | ₩ | 39,977,309 | ||||||||||
Impaired securities | 10,548 | 13,189 | 9,075 | 12,445 | 9,560 | |||||||||||||||
|
|
|
|
| ||||||||||||||||
Total | (Won) | 36,371,026 | (Won) | 36,570,664 | (Won) | 38,540,900 | ₩ | 42,477,268 | ₩ | 39,986,869 | ||||||||||
|
|
|
|
| ||||||||||||||||
The credit quality of securities (debt(excluding equity securities) that are neither past due nor impaired as of January 1, 2010, and December 31, 20102012 and 2011,2013, are as follows:
| As of January 1, 2010 | ||||||||||||||||||||||||
| Grade 1 | Grade 2 | Grade 3 | Grade 4 | Grade 5 | Total | |||||||||||||||||||
| (In millions of Korean won) | ||||||||||||||||||||||||
Financial assets held for trading | (Won) | 4,191,917 | (Won) | 93,732 | (Won) | — | (Won) | — | (Won) | 1 | (Won) | 4,285,650 | ||||||||||||
Available-for-sale financial assets | 18,101,961 | 735,526 | 13,276 | 424 | 9,187 | 18,860,374 | ||||||||||||||||||
Held-to-maturity financial assets | 13,214,454 | — | — | — | — | 13,214,454 | ||||||||||||||||||
|
|
|
|
|
|
|
|
|
|
|
| |||||||||||||
Total | (Won) | 35,508,332 | (Won) | 829,258 | (Won) | 13,276 | (Won) | 424 | (Won) | 9,188 | (Won) | 36,360,478 | ||||||||||||
|
|
|
|
|
|
|
|
|
|
|
| |||||||||||||
| As of December 31, 2010 | 2012 | |||||||||||||||||||||||||||||||||||||||||||||||
| Grade 1 | Grade 2 | Grade 3 | Grade 4 | Grade 5 | Total | Grade 1 | Grade 2 | Grade 3 | Grade 4 | Grade 5 | Total | |||||||||||||||||||||||||||||||||||||
| (In millions of Korean won) | (In millions of Korean won) | |||||||||||||||||||||||||||||||||||||||||||||||
Financial assets held for trading | (Won) | 3,481,884 | (Won) | 45,182 | (Won) | 9,633 | (Won) | — | (Won) | — | (Won) | 3,536,699 | ₩ | 7,590,634 | ₩ | 671,544 | ₩ | 29,437 | ₩ | — | ₩ | — | ₩ | 8,291,615 | ||||||||||||||||||||||||
Financial assets designated at fair value through profit or loss | — | — | — | — | 139 | 139 | 84,428 | 108,179 | — | — | — | 192,607 | ||||||||||||||||||||||||||||||||||||
Available-for-sale financial assets | 18,103,675 | 934,250 | 65,589 | 210 | 9,108 | 19,112,832 | 20,616,413 | 1,027,165 | 81,162 | 56 | — | 21,724,796 | ||||||||||||||||||||||||||||||||||||
Held-to-maturity financial assets | 13,907,805 | — | — | — | — | 13,907,805 | 12,255,805 | — | — | — | — | 12,255,805 | ||||||||||||||||||||||||||||||||||||
|
|
|
|
|
|
|
|
|
|
|
| |||||||||||||||||||||||||||||||||||||
Total | (Won) | 35,493,364 | (Won) | 979,432 | (Won) | 75,222 | (Won) | 210 | (Won) | 9,247 | (Won) | 36,557,475 | ₩ | 40,547,280 | ₩ | 1,806,888 | ₩ | 110,599 | ₩ | 56 | ₩ | — | ₩ | 42,464,823 | ||||||||||||||||||||||||
|
|
|
|
|
|
|
|
|
|
|
| |||||||||||||||||||||||||||||||||||||
| As of December 31, 2011 | 2013 | |||||||||||||||||||||||||||||||||||||||||||||||
| Grade 1 | Grade 2 | Grade 3 | Grade 4 | Grade 5 | Total | Grade 1 | Grade 2 | Grade 3 | Grade 4 | Grade 5 | Total | |||||||||||||||||||||||||||||||||||||
| (In millions of Korean won) | (In millions of Korean won) | |||||||||||||||||||||||||||||||||||||||||||||||
Financial assets held for trading | (Won) | 5,079,469 | (Won) | 88,144 | (Won) | 8,911 | (Won) | — | (Won) | — | (Won) | 5,176,524 | ₩ | 6,634,168 | ₩ | 1,172,476 | ₩ | 19,141 | ₩ | — | ₩ | — | ₩ | 7,825,785 | ||||||||||||||||||||||||
Financial assets designated at fair value through profit or loss | 238,085 | 336,602 | — | — | — | 574,687 | 89,527 | 119,489 | — | 1,789 | — | 210,805 | ||||||||||||||||||||||||||||||||||||
Available-for-sale financial assets | 18,458,778 | 1,224,835 | 41,911 | 90 | — | 19,725,614 | 18,078,177 | 785,216 | 60,335 | — | — | 18,923,728 | ||||||||||||||||||||||||||||||||||||
Held-to-maturity financial assets | 13,055,000 | — | — | — | — | 13,055,000 | 13,016,991 | — | — | — | — | 13,016,991 | ||||||||||||||||||||||||||||||||||||
|
|
|
|
|
|
|
|
|
|
|
| |||||||||||||||||||||||||||||||||||||
Total | (Won) | 36,831,332 | (Won) | 1,649,581 | (Won) | 50,822 | (Won) | 90 | (Won) | — | (Won) | 38,531,825 | ₩ | 37,818,863 | ₩ | 2,077,181 | ₩ | 79,476 | ₩ | 1,789 | ₩ | — | ₩ | 39,977,309 | ||||||||||||||||||||||||
|
|
|
|
|
|
|
|
|
|
|
| |||||||||||||||||||||||||||||||||||||
The credit qualities of securities (debt(excluding equity securities) according to the credit ratings by external rating agencies are as follows:
Domestic | Foreign | |||||||||||||||||||||||
Credit quality | KIS | KAP | NICE | S&P | Fitch-IBCA | Moody’s | ||||||||||||||||||
Grade 1 | AA0 to AAA | AA0 to AAA | AA0 to AAA | A- to AAA | A- to AAA | A3 to Aaa | ||||||||||||||||||
Grade 2 | A- to AA- | A- to AA- | A- to AA- | BBB- to BBB+ | BBB- to BBB+ | Baa3 to Baa1 | ||||||||||||||||||
Grade 3 | BBB0 to BBB+ | BBB0 to BBB+ | BBB0 to | BB to BB+ | BB to BB+ | Ba2 to Ba1 | ||||||||||||||||||
Grade 4 | BB0 to BBB- | BB0 to BBB- | BB0 to | B+ to BB- | B+ to BB- | B1 to Ba3 | ||||||||||||||||||
Grade 5 | BB- or under | B or under | B or under | B2 or under | ||||||||||||||||||||
Debt securities’ credit qualities denominated in Korean won are based on the lowest credit rating by the three domestic credit rating agencies above, and those denominated in foreign currencies are based on the lowest credit rating by the three foreign credit rating agencies above.
4.2.6 Credit risk mitigation of derivative financial instruments
A quantification of the extent to which collateral and other credit enhancements mitigate credit risk of derivative financial instruments as of December 31, 2012 and 2013, is as follows:
| 2012 | 2013 | |||||||
| (In millions of Korean won) | ||||||||
Deposits and savings, Securities and others | ₩ | 216,906 | ₩ | 271,380 | ||||
|
|
|
| |||||
Total | ₩ | 216,906 | ₩ | 271,380 | ||||
|
|
|
| |||||
4.2.7 Credit risk concentration analysis
The details of the Group’s loans by the country as of January 1, 2010, and December 31, 20102012 and 2011,2013, are as follows:
| As of January 1, 2010 | ||||||||||||||||||||||||||||
| Retail | Corporate | Credit card | Total | % | Allowances | Carrying amount | ||||||||||||||||||||||
| (In millions of Korean won) | ||||||||||||||||||||||||||||
Korea | (Won) | 98,315,503 | (Won) | 88,752,916 | (Won) | 11,364,815 | (Won) | 198,433,234 | 99.24 | (Won) | (3,241,199 | ) | (Won) | 195,192,035 | ||||||||||||||
Europe | 9 | 99,205 | 108 | 99,322 | 0.05 | (962 | ) | 98,360 | ||||||||||||||||||||
China | 1,713 | 300,509 | 22 | 302,244 | 0.15 | (1,749 | ) | 300,495 | ||||||||||||||||||||
Japan | 10,212 | 637,958 | 316 | 648,486 | 0.32 | (23,114 | ) | 625,372 | ||||||||||||||||||||
U.S | — | 310,913 | 170 | 311,083 | 0.16 | (464 | ) | 310,619 | ||||||||||||||||||||
Others | 42,752 | 118,296 | 181 | 161,229 | 0.08 | (1,266 | ) | 159,963 | ||||||||||||||||||||
|
|
|
|
|
|
|
|
|
|
|
|
|
| |||||||||||||||
Total | (Won) | 98,370,189 | (Won) | 90,219,797 | (Won) | 11,365,612 | (Won) | 199,955,598 | 100.00 | (Won) | (3,268,754 | ) | (Won) | 196,686,844 | ||||||||||||||
|
|
|
|
|
|
|
|
|
|
|
|
|
| |||||||||||||||
| As of December 31, 2010 | 2012 | |||||||||||||||||||||||||||||||||||||||||||||||||||||||
| Retail | Corporate | Credit card | Total | % | Allowances | Carrying amount | Retail | Corporate | Credit card | Total | % | Allowances | Carrying amount | |||||||||||||||||||||||||||||||||||||||||||
| (In millions of Korean won) | (In millions of Korean won) | |||||||||||||||||||||||||||||||||||||||||||||||||||||||
Korea | (Won) | 98,996,738 | (Won) | 88,282,185 | (Won) | 12,412,143 | (Won) | 199,691,066 | 99.16 | (Won) | (3,738,848 | ) | (Won) | 195,952,218 | ₩ | 103,432,668 | ₩ | 99,682,434 | ₩ | 11,871,321 | ₩ | 214,986,423 | 99.11 | ₩ | (3,249,850 | ) | ₩ | 211,736,573 | ||||||||||||||||||||||||||||
Europe | 9 | 46,297 | 135 | 46,441 | 0.02 | (1,132 | ) | 45,309 | 3 | 80,454 | 378 | 80,835 | 0.04 | (288 | ) | 80,547 | ||||||||||||||||||||||||||||||||||||||||
China | 728 | 247,776 | 54 | 248,558 | 0.12 | (2,448 | ) | 246,110 | 319 | 429,781 | 287 | 430,387 | 0.20 | (2,372 | ) | 428,015 | ||||||||||||||||||||||||||||||||||||||||
Japan | 12,299 | 868,930 | 283 | 881,512 | 0.44 | (10,832 | ) | 870,680 | 7,944 | 885,607 | 437 | 893,988 | 0.41 | (14,273 | ) | 879,715 | ||||||||||||||||||||||||||||||||||||||||
U.S | — | 368,748 | 241 | 368,989 | 0.18 | (1,532 | ) | 367,457 | — | 308,846 | 454 | 309,300 | 0.14 | (478 | ) | 308,822 | ||||||||||||||||||||||||||||||||||||||||
Others | 52,646 | 87,779 | 189 | 140,614 | 0.08 | (1,384 | ) | 139,230 | 63,707 | 147,836 | 974 | 212,517 | 0.10 | (1,398 | ) | 211,119 | ||||||||||||||||||||||||||||||||||||||||
|
|
|
|
|
|
|
|
|
|
|
|
|
| |||||||||||||||||||||||||||||||||||||||||||
Total | (Won) | 99,062,420 | (Won) | 89,901,715 | (Won) | 12,413,045 | (Won) | 201,377,180 | 100.00 | (Won) | (3,756,176 | ) | (Won) | 197,621,004 | ₩ | 103,504,641 | ₩ | 101,534,958 | ₩ | 11,873,851 | ₩ | 216,913,450 | 100.00 | ₩ | (3,268,659 | ) | ₩ | 213,644,791 | ||||||||||||||||||||||||||||
|
|
|
|
|
|
|
|
|
|
|
|
|
| |||||||||||||||||||||||||||||||||||||||||||
| As of December 31, 2011 | 2013 | |||||||||||||||||||||||||||||||||||||||||||||||||||||||
| Retail | Corporate | Credit card | Total | % | Allowances | Carrying amount | Retail | Corporate | Credit card | Total | % | Allowances | Carrying amount | |||||||||||||||||||||||||||||||||||||||||||
| (In millions of Korean won) | (In millions of Korean won) | |||||||||||||||||||||||||||||||||||||||||||||||||||||||
Korea | (Won) | 103,855,183 | (Won) | 97,298,342 | (Won) | 12,420,318 | (Won) | 213,573,843 | 99.08 | (Won) | (3,428,520 | ) | (Won) | 210,145,323 | ₩ | 107,644,600 | ₩ | 100,533,577 | ₩ | 11,782,169 | ₩ | 219,960,346 | 99.14 | ₩ | (2,797,651 | ) | ₩ | 217,162,695 | ||||||||||||||||||||||||||||
Europe | 11 | 69,004 | 110 | 69,125 | 0.03 | (555 | ) | 68,570 | 9 | 98,752 | 406 | 99,167 | 0.04 | (288 | ) | 98,879 | ||||||||||||||||||||||||||||||||||||||||
China | 434 | 315,375 | 37 | 315,846 | 0.15 | (1,961 | ) | 313,885 | 227 | 583,176 | 315 | 583,718 | 0.26 | (16,075 | ) | 567,643 | ||||||||||||||||||||||||||||||||||||||||
Japan | 11,914 | 1,014,607 | 301 | 1,026,822 | 0.48 | (14,976 | ) | 1,011,846 | 5,708 | 475,242 | 350 | 481,300 | 0.22 | (44,248 | ) | 437,052 | ||||||||||||||||||||||||||||||||||||||||
U.S | — | 412,669 | 272 | 412,941 | 0.19 | (432 | ) | 412,509 | — | 448,868 | 578 | 449,446 | 0.20 | (654 | ) | 448,792 | ||||||||||||||||||||||||||||||||||||||||
Others | 57,663 | 98,463 | 229 | 156,355 | 0.07 | (1,461 | ) | 154,894 | 92,670 | 195,253 | 640 | 288,563 | 0.14 | (2,268 | ) | 286,295 | ||||||||||||||||||||||||||||||||||||||||
|
|
|
|
|
|
|
|
|
|
|
|
|
| |||||||||||||||||||||||||||||||||||||||||||
Total | (Won) | 103,925,205 | (Won) | 99,208,460 | (Won) | 12,421,267 | (Won) | 215,554,932 | 100.00 | (Won) | (3,447,905 | ) | (Won) | 212,107,027 | ₩ | 107,743,214 | ₩ | 102,334,868 | ₩ | 11,784,458 | ₩ | 221,862,540 | 100.00 | ₩ | (2,861,184 | ) | ₩ | 219,001,356 | ||||||||||||||||||||||||||||
|
|
|
|
|
|
|
|
|
|
|
|
|
| |||||||||||||||||||||||||||||||||||||||||||
The details of the Group’s corporate loans by industry as of January 1, 2010, and December 31, 20102012 and 2011,2013, are as follows:
| As of January 1, 2010 | 2012 | |||||||||||||||||||||||||||||||
| Loans | % | Allowances | Carrying amount | Loans | % | Allowances | Carrying amount | |||||||||||||||||||||||||
| (In millions of Korean won) | (In millions of Korean won) | |||||||||||||||||||||||||||||||
Financial institutions | (Won) | 4,122,234 | 4.57 | (Won) | (35,365 | ) | (Won) | 4,086,869 | ₩ | 7,291,052 | 7.18 | ₩ | (11,139 | ) | ₩ | 7,279,913 | ||||||||||||||||
Manufacturing | 27,082,160 | 30.02 | (634,651 | ) | 26,447,509 | 31,319,746 | 30.85 | (931,442 | ) | 30,388,304 | ||||||||||||||||||||||
Service | 35,591,939 | 39.44 | (987,245 | ) | 34,604,694 | 38,649,492 | 38.07 | (477,560 | ) | 38,171,932 | ||||||||||||||||||||||
Wholesale & Retail | 15,124,459 | 14.90 | (230,865 | ) | 14,893,594 | |||||||||||||||||||||||||||
Construction | 4,688,691 | 4.62 | (528,284 | ) | 4,160,407 | |||||||||||||||||||||||||||
Public sector | 258,620 | 0.29 | (2,847 | ) | 255,773 | 520,422 | 0.51 | (7,076 | ) | 513,346 | ||||||||||||||||||||||
Others | 23,164,844 | 25.68 | (856,351 | ) | 22,308,493 | 3,941,096 | 3.87 | (64,952 | ) | 3,876,144 | ||||||||||||||||||||||
|
|
|
|
|
|
|
| |||||||||||||||||||||||||
Total | (Won) | 90,219,797 | 100.00 | (Won) | (2,516,459 | ) | (Won) | 87,703,338 | ₩ | 101,534,958 | 100.00 | ₩ | (2,251,318 | ) | ₩ | 99,283,640 | ||||||||||||||||
|
|
|
|
|
|
|
| |||||||||||||||||||||||||
| As of December 31, 2010 | ||||||||||||||||
| Loans | % | Allowances | Carrying amount | |||||||||||||
| (In millions of Korean won) | ||||||||||||||||
Financial institutions | (Won) | 4,374,231 | 4.87 | (Won) | (122,011 | ) | (Won) | 4,252,220 | ||||||||
Manufacturing | 28,216,439 | 31.39 | (848,039 | ) | 27,368,400 | |||||||||||
Service | 34,040,219 | 37.86 | (799,782 | ) | 33,240,437 | |||||||||||
Public sector | 337,670 | 0.38 | (6,611 | ) | 331,059 | |||||||||||
Others | 22,933,156 | 25.50 | (1,131,304 | ) | 21,801,852 | |||||||||||
|
|
|
|
|
|
|
| |||||||||
Total | (Won) | 89,901,715 | 100.00 | (Won) | (2,907,747 | ) | (Won) | 86,993,968 | ||||||||
|
|
|
|
|
|
|
| |||||||||
| As of December 31, 2011 | ||||||||||||||||
| Loans | % | Allowances | Carrying amount | |||||||||||||
| (In millions of Korean won) | ||||||||||||||||
Financial institutions | (Won) | 5,839,148 | 5.89 | (Won) | (57,335 | ) | (Won) | 5,781,813 | ||||||||
Manufacturing | 31,762,908 | 32.01 | (852,707 | ) | 30,910,201 | |||||||||||
Service | 36,305,778 | 36.60 | (547,148 | ) | 35,758,630 | |||||||||||
Public sector | 310,978 | 0.31 | (5,190 | ) | 305,788 | |||||||||||
Others | 24,989,648 | 25.19 | (999,667 | ) | 23,989,981 | |||||||||||
|
|
|
|
|
|
|
| |||||||||
Total | (Won) | 99,208,460 | 100.00 | (Won) | (2,462,047 | ) | (Won) | 96,746,413 | ||||||||
|
|
|
|
|
|
|
| |||||||||
Financial institutions Manufacturing Service Wholesale & Retail Construction Public sector Others Total 2013 Loans % Allowances Carrying
amount (In millions of Korean won) ₩ 10,524,203 10.28 ₩ (87,471 ) ₩ 10,436,732 31,160,890 30.45 (611,257 ) 30,549,633 38,375,826 37.50 (448,114 ) 37,927,712 13,873,681 13.56 (194,840 ) 13,678,841 4,427,615 4.33 (502,223 ) 3,925,392 654,998 0.64 (8,469 ) 646,529 3,317,655 3.24 (18,500 ) 3,299,155 ₩ 102,334,868 100.00 ₩ (1,870,874 ) ₩ 100,463,994
The details of the Group’s retail and credit card loans by type as of January 1, 2010, and December 31, 20102012 and 2011,2013, are as follows:
| As of January 1, 2010 | 2012 | |||||||||||||||||||||||||||||||
| Loans | % | Allowances | Carrying amount | Loans | % | Allowances | Carrying amount | |||||||||||||||||||||||||
| (In millions of Korean won) | (In millions of Korean won) | |||||||||||||||||||||||||||||||
Housing purpose | (Won) | 45,895,475 | 41.82 | (Won) | (50,254 | ) | (Won) | 45,845,221 | ₩ | 44,876,955 | 38.90 | ₩ | (109,490 | ) | ₩ | 44,767,465 | ||||||||||||||||
General purpose | 52,474,714 | 47.82 | (365,086 | ) | 52,109,628 | 58,627,686 | 50.81 | (578,361 | ) | 58,049,325 | ||||||||||||||||||||||
Credit card | 11,365,612 | 10.36 | (336,955 | ) | 11,028,657 | 11,873,851 | 10.29 | (329,490 | ) | 11,544,361 | ||||||||||||||||||||||
|
|
|
|
|
|
|
| |||||||||||||||||||||||||
Total | (Won) | 109,735,801 | 100.00 | (Won) | (752,295 | ) | (Won) | 108,983,506 | ₩ | 115,378,492 | 100.00 | ₩ | (1,017,341 | ) | ₩ | 114,361,151 | ||||||||||||||||
|
|
|
|
|
|
|
| |||||||||||||||||||||||||
| As of December 31, 2010 | ||||||||||||||||
| Loans | % | Allowances | Carrying amount | |||||||||||||
| (In millions of Korean won) | ||||||||||||||||
Housing purpose | (Won) | 43,323,149 | 38.86 | (Won) | (64,281 | ) | (Won) | 43,258,868 | ||||||||
General purpose | 55,739,271 | 50.00 | (456,561 | ) | 55,282,710 | |||||||||||
Credit card | 12,413,045 | 11.14 | (327,587 | ) | 12,085,458 | |||||||||||
|
|
|
|
|
|
|
| |||||||||
Total | (Won) | 111,475,465 | 100.00 | (Won) | (848,429 | ) | (Won) | 110,627,036 | ||||||||
|
|
|
|
|
|
|
| |||||||||
| As of December 31, 2011 | 2013 | |||||||||||||||||||||||||||||||
| Loans | % | Allowances | Carrying amount | Loans | % | Allowances | Carrying amount | |||||||||||||||||||||||||
| (In millions of Korean won) | (In millions of Korean won) | |||||||||||||||||||||||||||||||
Housing purpose | (Won) | 45,519,956 | 39.12 | (Won) | (96,963 | ) | (Won) | 45,422,993 | ₩ | 46,485,300 | 38.89 | ₩ | (77,985 | ) | ₩ | 46,407,315 | ||||||||||||||||
General purpose | 58,405,249 | 50.20 | (538,513 | ) | 57,866,736 | 61,257,914 | 51.25 | (502,525 | ) | 60,755,389 | ||||||||||||||||||||||
Credit card | 12,421,267 | 10.68 | (350,382 | ) | 12,070,885 | 11,784,458 | 9.86 | (409,800 | ) | 11,374,658 | ||||||||||||||||||||||
|
|
|
|
|
|
|
| |||||||||||||||||||||||||
Total | (Won) | 116,346,472 | 100.00 | (Won) | (985,858 | ) | (Won) | 115,360,614 | ₩ | 119,527,672 | 100.00 | ₩ | (990,310 | ) | ₩ | 118,537,362 | ||||||||||||||||
|
|
|
|
|
|
|
| |||||||||||||||||||||||||
The details of the Group’s securities (debt(excluding equity securities) and derivative financial instruments by industry as of January 1, 2010, and December 31, 20102012 and 2011,2013, are as follows:
| As of January 1, 2010 | 2012 | |||||||||||||||
| Amount | % | Amount | % | |||||||||||||
| (In millions of Korean won) | (In millions of Korean won) | |||||||||||||||
Financial assets held for trading | ||||||||||||||||
Government and government funded institutions | (Won) | 1,409,894 | 32.90 | ₩ | 3,225,970 | 38.91 | ||||||||||
Banking and Insurance | 2,597,359 | 60.60 | 4,038,097 | 48.70 | ||||||||||||
Others | 278,397 | 6.50 | 1,027,548 | 12.39 | ||||||||||||
|
|
|
| |||||||||||||
Total financial assets held for trading | 4,285,650 | 100.00 | 8,291,615 | 100.00 | ||||||||||||
|
|
|
| |||||||||||||
Financial assets designated at fair value through profit or loss | ||||||||||||||||
Banking and Insurance | 529 | 100.00 | 192,607 | 100.00 | ||||||||||||
|
|
|
| |||||||||||||
Total financial assets designated at fair value through profit or loss | 529 | 100.00 | 192,607 | 100.00 | ||||||||||||
|
| |||||||||||||||
Derivative financial assets | ||||||||||||||||
Government and government funded institutions | 29,236 | 1.40 | ||||||||||||||
Banking and Insurance | 1,857,366 | 88.81 | ||||||||||||||
Others | 204,683 | 9.79 | ||||||||||||||
|
| |||||||||||||||
Total derivative financial assets | 2,091,285 | 100.00 | ||||||||||||||
|
|
|
| |||||||||||||
Available-for-sale financial assets | ||||||||||||||||
Government and government funded institutions | 8,939,823 | 47.38 | 10,355,155 | 47.64 | ||||||||||||
Banking and Insurance | 7,930,954 | 42.03 | 8,879,741 | 40.85 | ||||||||||||
Others | 1,998,783 | 10.59 | 2,502,344 | 11.51 | ||||||||||||
|
|
|
| |||||||||||||
Total available-for-sale financial assets | 18,869,560 | 100.00 | 21,737,240 | 100.00 | ||||||||||||
|
|
|
| |||||||||||||
Held-to-maturity financial assets | ||||||||||||||||
Government and government funded institutions | 9,877,457 | 74.74 | 9,854,991 | 80.41 | ||||||||||||
Banking and Insurance | 2,964,768 | 22.43 | 1,593,713 | 13.00 | ||||||||||||
Others | 373,062 | 2.83 | 807,102 | 6.59 | ||||||||||||
|
|
|
| |||||||||||||
Total held-to-maturity financial assets | 13,215,287 | 100.00 | 12,255,806 | 100.00 | ||||||||||||
|
|
|
| |||||||||||||
Total | (Won) | 36,371,026 | ₩ | 44,568,553 | ||||||||||||
|
| |||||||||||||||
Financial assets held for trading Government and government funded institutions Banking and Insurance Others Total financial assets held for trading Financial assets designated at fair value through profit or loss Banking and Insurance Total financial assets designated at fair value through profit or loss Available-for-sale financial assets Government and government funded institutions Banking and Insurance Others Total available-for-sale financial assets Held-to-maturity financial assets Government and government funded institutions Banking and Insurance Others Total held-to-maturity financial assets Total As of December 31, 2010 Amount % (In millions of Korean won) (Won) 929,254 26.27 2,278,691 64.43 328,754 9.30 3,536,699 100.00 139 100.00 139 100.00 9,433,184 49.32 7,589,597 39.68 2,102,943 11.00 19,125,724 100.00 11,775,616 84.67 1,608,046 11.56 524,440 3.77 13,908,102 100.00 (Won) 36,570,664
| As of December 31, 2011 | 2013 | |||||||||||||||
| Amount | % | Amount | % | |||||||||||||
| (In millions of Korean won) | (In millions of Korean won) | |||||||||||||||
Financial assets held for trading | ||||||||||||||||
Government and government funded institutions | (Won) | 1,785,624 | 34.49 | ₩ | 3,057,633 | 39.07 | ||||||||||
Banking and Insurance | 2,972,087 | 57.41 | 3,776,119 | 48.25 | ||||||||||||
Others | 418,813 | 8.10 | 992,033 | 12.68 | ||||||||||||
|
|
|
| |||||||||||||
Total financial assets held for trading | 5,176,524 | 100.00 | 7,825,785 | 100.00 | ||||||||||||
|
|
|
| |||||||||||||
Financial assets designated at fair value through profit or loss | ||||||||||||||||
Banking and Insurance | 574,687 | 100.00 | 210,805 | 100.00 | ||||||||||||
|
|
|
| |||||||||||||
Total financial assets designated at fair value through profit or loss | 574,687 | 100.00 | 210,805 | 100.00 | ||||||||||||
|
| |||||||||||||||
Derivative financial assets | ||||||||||||||||
Government and government funded institutions | 18,248 | 1.00 | ||||||||||||||
Banking and Insurance | 1,606,285 | 88.29 | ||||||||||||||
Others | 194,876 | 10.71 | ||||||||||||||
|
| |||||||||||||||
Total derivative financial assets | 1,819,409 | 100.00 | ||||||||||||||
|
|
|
| |||||||||||||
Available-for-sale financial assets | ||||||||||||||||
Government and government funded institutions | 8,483,273 | 42.99 | 9,966,361 | 52.64 | ||||||||||||
Banking and Insurance | 8,189,563 | 41.50 | 6,986,895 | 36.90 | ||||||||||||
Others | 3,061,695 | 15.51 | 1,980,032 | 10.46 | ||||||||||||
|
|
|
| |||||||||||||
Total available-for-sale financial assets | 19,734,531 | 100.00 | 18,933,288 | 100.00 | ||||||||||||
|
|
|
| |||||||||||||
Held-to-maturity financial assets | ||||||||||||||||
Government and government funded institutions | 10,732,519 | 82.21 | 10,923,807 | 83.92 | ||||||||||||
Banking and Insurance | 1,463,937 | 11.21 | 1,259,282 | 9.67 | ||||||||||||
Others | 858,702 | 6.58 | 833,902 | 6.41 | ||||||||||||
|
|
|
| |||||||||||||
Total held-to-maturity financial assets | 13,055,158 | 100.00 | 13,016,991 | 100.00 | ||||||||||||
|
|
|
| |||||||||||||
Total | (Won) | 38,540,900 | ₩ | 41,806,278 | ||||||||||||
|
| |||||||||||||||
The details of the Group’s securities (debt(excluding equity securities) and derivative financial instruments by country, as of January 1, 2010, and December 31, 20102012 and 2011,2013, are as follows:
| As of January 1, 2010 | 2012 | |||||||||||||||
| Amount | % | Amount | % | |||||||||||||
| (In millions of Korean won) | (In millions of Korean won) | |||||||||||||||
Financial assets held for trading | ||||||||||||||||
Korea | (Won) | 4,285,650 | 100.00 | ₩ | 8,291,615 | 100.00 | ||||||||||
|
|
|
| |||||||||||||
Total financial assets held for trading | 4,285,650 | 100.00 | 8,291,615 | 100.00 | ||||||||||||
|
|
|
| |||||||||||||
Financial assets designated at fair value through profit or loss | ||||||||||||||||
United States | 529 | 100.00 | ||||||||||||||
Korea | 192,607 | 100.00 | ||||||||||||||
|
|
|
| |||||||||||||
Total financial assets designated at fair value through profit or loss | 529 | 100.00 | 192,607 | 100.00 | ||||||||||||
|
| |||||||||||||||
Derivative financial assets | ||||||||||||||||
Korea | 705,318 | 33.73 | ||||||||||||||
United States | 366,827 | 17.54 | ||||||||||||||
Others | 1,019,140 | 48.73 | ||||||||||||||
|
| |||||||||||||||
Total derivative financial assets | 2,091,285 | 100.00 | ||||||||||||||
|
|
|
| |||||||||||||
Available-for-sale financial assets | ||||||||||||||||
Korea | 18,645,402 | 98.81 | 21,560,009 | 99.18 | ||||||||||||
United States | 204,141 | 1.08 | 176,394 | 0.81 | ||||||||||||
Others | 20,017 | 0.11 | 837 | 0.01 | ||||||||||||
|
|
|
| |||||||||||||
Total available-for-sale financial assets | 18,869,560 | 100.00 | 21,737,240 | 100.00 | ||||||||||||
|
|
|
| |||||||||||||
Held-to-maturity financial assets | ||||||||||||||||
Korea | 13,214,454 | 99.99 | 12,255,805 | 100.00 | ||||||||||||
United States | 833 | 0.01 | 1 | 0.00 | ||||||||||||
|
|
|
| |||||||||||||
Total held-to-maturity financial assets | 13,215,287 | 100.00 | 12,255,806 | 100.00 | ||||||||||||
|
|
|
| |||||||||||||
Total | (Won) | 36,371,026 | ₩ | 44,568,553 | ||||||||||||
|
| |||||||||||||||
| As of December 31, 2010 | 2013 | |||||||||||||||
| Amount | % | Amount | % | |||||||||||||
| (In millions of Korean won) | (In millions of Korean won) | |||||||||||||||
Financial assets held for trading | ||||||||||||||||
Korea | (Won) | 3,536,699 | 100.00 | ₩ | 7,809,495 | 99.79 | ||||||||||
India | 3,194 | 0.04 | ||||||||||||||
Others | 13,096 | 0.17 | ||||||||||||||
|
|
|
| |||||||||||||
Total financial assets held for trading | 3,536,699 | 100.00 | 7,825,785 | 100.00 | ||||||||||||
|
|
|
| |||||||||||||
Financial assets designated at fair value through profit or loss | ||||||||||||||||
United States | 139 | 100.00 | ||||||||||||||
Korea | 205,512 | 97.49 | ||||||||||||||
Others | 5,293 | 2.51 | ||||||||||||||
|
|
|
| |||||||||||||
Total financial assets designated at fair value through profit or loss | 139 | 100.00 | 210,805 | 100.00 | ||||||||||||
|
|
|
| |||||||||||||
Derivative financial assets | ||||||||||||||||
Korea | 617,804 | 33.96 | ||||||||||||||
United States | 284,795 | 15.65 | ||||||||||||||
Others | 916,810 | 50.39 | ||||||||||||||
|
| |||||||||||||||
Total derivative financial assets | 1,819,409 | 100.00 | ||||||||||||||
|
| |||||||||||||||
Available-for-sale financial assets | ||||||||||||||||
Korea | 18,894,529 | 98.79 | 18,908,743 | 99.87 | ||||||||||||
United States | 208,756 | 1.09 | ||||||||||||||
Others | 22,439 | 0.12 | 24,545 | 0.13 | ||||||||||||
|
|
|
| |||||||||||||
Total available-for-sale financial assets | 19,125,724 | 100.00 | 18,933,288 | 100.00 | ||||||||||||
|
|
|
| |||||||||||||
Held-to-maturity financial assets | ||||||||||||||||
Korea | 13,907,805 | 100.00 | 13,016,991 | 100.00 | ||||||||||||
United States | 297 | 0.00 | ||||||||||||||
|
|
|
| |||||||||||||
Total held-to-maturity financial assets | 13,908,102 | 100.00 | 13,016,991 | 100.00 | ||||||||||||
|
|
|
| |||||||||||||
Total | (Won) | 36,570,664 | ₩ | 41,806,278 | ||||||||||||
|
| |||||||||||||||
Financial assets held for trading Korea Total financial assets held for trading Financial assets designated at fair value through profit or loss Korea Total financial assets designated at fair value through profit or loss Available-for-sale financial assets Korea United States Others Total available-for-sale financial assets Held-to-maturity financial assets Korea United States Total held-to-maturity financial assets Total As of December 31, 2011 Amount % (In millions of Korean won) (Won) 5,176,524 100.00 5,176,524 100.00 574,687 100.00 574,687 100.00 19,552,797 99.08 180,832 0.92 902 0.00 19,734,531 100.00 13,055,000 100.00 158 0.00 13,055,158 100.00 (Won) 38,540,900
The Group’s largest concentrationscounterparties to the financial assets under due from financial institutions and financial instruments indexed to the price of OTC derivatives businessgold within financial assets held for trading are in the financialbanking and insurance companies withindustries and have high credit rating.ratings.
4.3 Liquidity risk
4.3.1 Overview of liquidity risk
Liquidity risk is the risk of insolvency or loss due to a disparity between the inflow and out flowoutflow of funds, unexpected outflow of funds, and obtaining funds at a high price or disposing of securities at an unfavorable price due to lack of available funds. The Group manages its liquidity risk through analysis of the contractual maturity of all financial assets, liabilities and off-balance sheet items such as commitments and financial guarantee contracts. The Group discloses them by maturity groups: On demand, up to one month, between over one month and three months, between over three months and 12 months, between over one year and five years, and over five years.
Cash flows disclosed for the maturity analysis are undiscounted contractual principal and interest to be received (paid) and, thus, differ from the amount in the financial statements which are based on the present value of expected cash flows in some cases. The amount of interest to be received or paid on floating rate assets and liabilities is measured on the assumption that the current interest rate would be the same uponthrough maturity.
4.3.2. Liquidity risk management and indicator
The liquidity risk is managed by ALM (‘Assets-LiabilitiesAsset Liability Management’) and related guidelines which are applied to the risk management policies and procedures that address all the possible risks that arise from the overall business of the Group.
For the purpose of liquidity management, the liquidity ratio and accumulated liquidity gap ratio on all transactions affecting the in and outflows of funds and transactions of off balance sheetoff-balance items are measured, managed and reported to the Risk ManagementPlanning Council and Risk Management Committee on a regular basis.
As the main subsidiary, Kookmin Bank regularly reports the liquidity gap ratio, liquidity ratio, maturity gap ratio and the results of the stress testing related to liquidity risk to the Asset-Liability Management Committee (‘ALCO’) which establishes and monitors the liquidity risk management strategy.
4.3.3. Analysis onof remaining contractual maturity of financial assets and liabilities
The remaining contractual maturity of financial assets and liabilities, excluding derivatives held for cash flow hedging, as of January 1, 2010, and December 31, 20102012 and 2011,2013, are as follows:
| As of January 1, 2010 | 2012 | |||||||||||||||||||||||||||||||||||||||||||||||||||||||
| On demand | Up to 1 month | 1-3 months | 3-12 months | 1-5 years | Over 5 years | Total | On demand | Up to 1 month | 1-3 months | 3-12 months | 1-5 years | Over 5 years | Total | |||||||||||||||||||||||||||||||||||||||||||
| (In millions of Korean won) | (In millions of Korean won) | |||||||||||||||||||||||||||||||||||||||||||||||||||||||
Financial assets | ||||||||||||||||||||||||||||||||||||||||||||||||||||||||
Cash and due from financial institutions | (Won) | 2,546,135 | (Won) | 242,203 | (Won) | 133,496 | (Won) | 20,576 | (Won) | 21,072 | (Won) | 26,609 | (Won) | 2,990,091 | ₩ | 5,953,114 | ₩ | 586,856 | ₩ | 75,523 | ₩ | 187,260 | ₩ | — | ₩ | 136,584 | ₩ | 6,939,337 | ||||||||||||||||||||||||||||
Financial assets held for trading | 4,591,962 | — | — | — | — | — | 4,591,962 | 9,207,629 | — | — | — | — | — | 9,207,629 | ||||||||||||||||||||||||||||||||||||||||||
Financial assets designated at fair value through profit or loss | 529 | — | — | — | — | — | 529 | 352,090 | — | — | — | — | — | 352,090 | ||||||||||||||||||||||||||||||||||||||||||
Derivatives held for trading(1) | 3,276,856 | — | — | — | — | — | 3,276,856 | |||||||||||||||||||||||||||||||||||||||||||||||||
Derivatives held for fair value hedging(5) | — | 6,473 | 11,270 | 49,044 | 161,221 | 308,786 | 536,794 | |||||||||||||||||||||||||||||||||||||||||||||||||
Derivatives held for trading(2) | 1,907,774 | — | — | — | — | — | 1,907,774 | |||||||||||||||||||||||||||||||||||||||||||||||||
Derivatives held for fair value hedging(3) | — | 6,645 | 929 | 18,600 | 125,511 | 163,808 | 315,493 | |||||||||||||||||||||||||||||||||||||||||||||||||
Loans | — | 15,707,376 | 27,727,088 | 73,653,725 | 57,049,366 | 59,220,790 | 233,358,345 | 270,630 | 22,283,867 | 24,831,094 | 76,258,158 | 57,820,640 | 78,541,113 | 260,005,502 | ||||||||||||||||||||||||||||||||||||||||||
Available-for-sale financial assets | 2,563,446 | 1,449,530 | 1,951,579 | 4,463,298 | 10,878,429 | 4,385,169 | 25,691,451 | 1,614,088 | 1,144,862 | 1,657,669 | 4,867,428 | 13,426,354 | 3,246,902 | 25,957,303 | ||||||||||||||||||||||||||||||||||||||||||
Held-to-maturity financial assets | — | 71,544 | 272,627 | 3,217,797 | 8,848,430 | 3,183,318 | 15,593,716 | — | 142,902 | 362,905 | 2,525,112 | 8,753,186 | 2,192,044 | 13,976,149 | ||||||||||||||||||||||||||||||||||||||||||
Other financial assets | 118,175 | 3,823,242 | 29,652 | 1,569,283 | 11,275 | 16,061 | 5,567,688 | 22,856 | 5,522,950 | 14,040 | 1,560,953 | 5,843 | 1,853 | 7,128,495 | ||||||||||||||||||||||||||||||||||||||||||
|
|
|
|
|
|
|
|
|
|
|
|
|
| |||||||||||||||||||||||||||||||||||||||||||
Total | (Won) | 13,097,103 | (Won) | 21,300,368 | (Won) | 30,125,712 | (Won) | 82,973,723 | (Won) | 76,969,793 | (Won) | 67,140,733 | (Won) | 291,607,432 | ₩ | 19,328,181 | ₩ | 29,688,082 | ₩ | 26,942,160 | ₩ | 85,417,511 | ₩ | 80,131,534 | ₩ | 84,282,304 | ₩ | 325,789,772 | ||||||||||||||||||||||||||||
|
|
|
|
|
|
|
|
|
|
|
|
|
| |||||||||||||||||||||||||||||||||||||||||||
Financial liabilities | ||||||||||||||||||||||||||||||||||||||||||||||||||||||||
Financial liabilities held for trading | (Won) | 1,364,223 | (Won) | — | (Won) | — | (Won) | — | (Won) | — | (Won) | — | (Won) | 1,364,223 | ₩ | 1,381,997 | ₩ | — | ₩ | — | ₩ | — | ₩ | — | ₩ | — | ₩ | 1,381,997 | ||||||||||||||||||||||||||||
Derivatives held for trading(1) | 2,858,001 | — | — | — | — | — | 2,858,001 | |||||||||||||||||||||||||||||||||||||||||||||||||
Derivatives held for fair value hedging(5) | — | (1,876 | ) | 27,455 | 21,989 | 183,428 | 171,522 | 402,518 | ||||||||||||||||||||||||||||||||||||||||||||||||
Deposits(4) | 56,652,648 | 20,025,512 | 24,562,210 | 65,538,782 | 8,513,583 | 1,255,647 | 176,548,382 | |||||||||||||||||||||||||||||||||||||||||||||||||
Financial liabilities designated at fair value through profit or loss(2) | 469,138 | — | — | — | — | — | 469,138 | |||||||||||||||||||||||||||||||||||||||||||||||||
Derivatives held for trading(2) | 1,854,216 | — | — | — | — | — | 1,854,216 | |||||||||||||||||||||||||||||||||||||||||||||||||
Derivatives held for fair value hedging(3) | — | 26,041 | 3 | (1,456 | ) | 189,613 | 2,396 | 216,597 | ||||||||||||||||||||||||||||||||||||||||||||||||
Deposits(5) | 67,380,045 | 16,409,143 | 29,419,363 | 79,230,974 | 8,388,915 | 2,233,375 | 203,061,815 | |||||||||||||||||||||||||||||||||||||||||||||||||
Debts | 148,763 | 4,291,469 | 2,352,882 | 4,089,531 | 2,948,840 | 489,709 | 14,321,194 | 273,586 | 3,854,683 | 2,934,083 | 5,671,408 | 2,879,533 | 662,557 | 16,275,850 | ||||||||||||||||||||||||||||||||||||||||||
Debentures | 30,340 | 1,821,973 | 1,161,168 | 14,312,768 | 22,888,880 | 5,398,983 | 45,614,112 | 24,659 | 1,384,530 | 1,028,779 | 3,577,851 | 18,220,238 | 4,020,164 | 28,256,221 | ||||||||||||||||||||||||||||||||||||||||||
Other financial liabilities | (493 | ) | 6,119,637 | 27,853 | 37,576 | 272,697 | 4,445 | 6,461,715 | 14,374 | 7,056,273 | 8,624 | 75,325 | 8,831 | 22,041 | 7,185,468 | |||||||||||||||||||||||||||||||||||||||||
|
|
|
|
|
|
|
|
|
|
|
|
|
| |||||||||||||||||||||||||||||||||||||||||||
Total | (Won) | 61,053,482 | (Won) | 32,256,715 | (Won) | 28,131,568 | (Won) | 84,000,646 | (Won) | 34,807,428 | (Won) | 7,320,306 | (Won) | 247,570,145 | ₩ | 71,398,015 | ₩ | 28,730,670 | ₩ | 33,390,852 | ₩ | 88,554,102 | ₩ | 29,687,130 | ₩ | 6,940,533 | ₩ | 258,701,302 | ||||||||||||||||||||||||||||
|
|
|
|
|
|
|
|
|
|
|
|
|
| |||||||||||||||||||||||||||||||||||||||||||
Off-balance sheet items | ||||||||||||||||||||||||||||||||||||||||||||||||||||||||
Off- balance sheet items | ||||||||||||||||||||||||||||||||||||||||||||||||||||||||
Commitments(6) | (Won) | 84,589,688 | (Won) | — | (Won) | — | (Won) | 199,000 | (Won) | 597,200 | (Won) | — | (Won) | 85,385,888 | ₩ | 93,193,481 | ₩ | — | ₩ | — | ₩ | — | ₩ | — | ₩ | — | ₩ | 93,193,481 | ||||||||||||||||||||||||||||
Financial guarantee contracts(7) | 893,858 | — | 521,500 | — | — | — | 1,415,358 | 1,509,269 | — | — | — | — | — | 1,509,269 | ||||||||||||||||||||||||||||||||||||||||||
|
|
|
|
|
|
|
|
|
|
|
|
|
| |||||||||||||||||||||||||||||||||||||||||||
Total | (Won) | 85,483,546 | (Won) | — | (Won) | 521,500 | (Won) | 199,000 | (Won) | 597,200 | (Won) | — | (Won) | 86,801,246 | ₩ | 94,702,750 | ₩ | — | ₩ | — | ₩ | — | ₩ | — | ₩ | — | ₩ | 94,702,750 | ||||||||||||||||||||||||||||
|
|
|
|
|
|
|
|
|
|
|
|
|
| |||||||||||||||||||||||||||||||||||||||||||
Financial assets Cash and due from financial institutions(3) Financial assets held for trading(1) Financial assets designated at fair value through profit or loss Derivatives held for trading(1) Derivatives held for fair value hedging(5) Loans Available-for-sale financial assets(2) Held-to-maturity financial assets Other financial assets Total Financial liabilities Financial liabilities held for trading(1) Derivatives held for trading(1) Derivatives held for fair value hedging(5) Deposits(4) Debts Debentures Other financial liabilities Total Off-balance sheet items Commitments(6) Financial guarantee contracts(7) Total As of December 31, 2010 On demand Up to
1 month 1-3 months 3-12 months 1-5 years Over 5 years Total (In millions of Korean won) (Won) 2,998,097 (Won) 240,656 (Won) 82,606 (Won) 73,760 (Won) — (Won) 78,532 (Won) 3,473,651 3,967,762 — — — — — 3,967,762 45,551 — — — — — 45,551 2,389,891 — — — — — 2,389,891 — 9,165 4,301 66,925 224,174 337,262 641,827 11,423 16,797,877 27,686,564 76,657,226 50,411,935 66,620,433 238,185,458 2,927,213 623,348 1,188,703 4,601,559 11,454,171 4,351,690 25,146,684 — 316,676 619,535 1,416,788 10,592,067 3,667,992 16,613,058 111,976 3,681, 036 32,524 1,570, 164 20,175 15,576 5,431,451 (Won) 12,451,913 (Won) 21,668,758 (Won) 29,614,233 (Won) 84,386,422 (Won) 72,702,522 (Won) 75,071,485 (Won) 295,895,333 (Won) 1,294,859 (Won) — (Won) — (Won) — (Won) — (Won) — (Won) 1,294,859 1,996,621 — — — — — 1,996,621 — 25,955 279 (35,506 ) 49,263 (107,610 ) (67,619 ) 60,939,002 17,017,659 25,225,497 73,482,450 8,175,752 858,262 185,698,622 176,300 2,667,302 2,500,817 4,220,247 2,489,003 69,265 12,122,934 51,524 1,484,274 1,227,886 9,539,022 16,477,876 5,405,493 34,186,075 — 4,868,301 41,005 35,365 245,210 119,416 5,309,297 (Won) 64,458,306 (Won) 26,063,491 (Won) 28,995,484 (Won) 87,241,578 (Won) 27,437,104 (Won) 6,344,826 (Won) 240,540,789 (Won) 87,178,408 (Won) — (Won) 112,000 (Won) 267,000 (Won) 180,950 (Won) — (Won) 87,738,358 757,637 — 396,050 — — — 1,153,687 (Won) 87,936,045 (Won) — (Won) 508,050 (Won) 267,000 (Won) 180,950 (Won) — (Won) 88,892,045
| As of December 31, 2011 | 2013 | |||||||||||||||||||||||||||||||||||||||||||||||||||||||
| On demand | Up to 1 month | 1-3 months | 3-12 months | 1-5 years | Over 5 years | Total | On demand | Up to 1 month | 1-3 months | 3-12 months | 1-5 years | Over 5 years | Total | |||||||||||||||||||||||||||||||||||||||||||
| (In millions of Korean won) | (In millions of Korean won) | |||||||||||||||||||||||||||||||||||||||||||||||||||||||
Financial assets | ||||||||||||||||||||||||||||||||||||||||||||||||||||||||
Cash and due from financial institutions | (Won) | 4,453,019 | (Won) | 303,624 | (Won) | 76,508 | (Won) | 89,831 | (Won) | 4 | (Won) | 119,097 | (Won) | 5,042,083 | ₩ | 5,672,570 | ₩ | 501,100 | ₩ | 183,931 | ₩ | 586,696 | ₩ | 49,314 | ₩ | 160,826 | ₩ | 7,154,437 | ||||||||||||||||||||||||||||
Financial assets held for trading | 5,617,257 | — | — | — | — | — | 5,617,257 | 8,967,006 | — | — | — | — | — | 8,967,006 | ||||||||||||||||||||||||||||||||||||||||||
Financial assets designated at fair value through profit or loss | 134,160 | — | 1,989 | 89,395 | 483,303 | — | 708,847 | 326,583 | — | — | — | — | 35,153 | 361,736 | ||||||||||||||||||||||||||||||||||||||||||
Derivatives held for trading(1) | 2,220,314 | — | — | — | — | — | 2,220,314 | |||||||||||||||||||||||||||||||||||||||||||||||||
Derivatives held for fair value hedging(5) | — | 9,502 | (4,709 | ) | 28,399 | 148,990 | 346,779 | 528,961 | ||||||||||||||||||||||||||||||||||||||||||||||||
Derivatives held for trading(2) | 1,680,880 | — | — | — | — | — | 1,680,880 | |||||||||||||||||||||||||||||||||||||||||||||||||
Derivatives held for fair value hedging(3) | — | 10,944 | 1,617 | 16,036 | 124,794 | 123,782 | 277,173 | |||||||||||||||||||||||||||||||||||||||||||||||||
Loans | 97,595 | 22,337,365 | 27,042,768 | 76,893,033 | 56,899,525 | 79,060,029 | 262,330,315 | 112,484 | 22,354,010 | 23,245,138 | 77,032,831 | 57,284,561 | 82,239,530 | 262,268,554 | ||||||||||||||||||||||||||||||||||||||||||
Available-for-sale financial assets | 2,240,727 | 1,408,252 | 2,604,981 | 4,785,474 | 10,153,262 | 4,012,911 | 25,205,607 | 2,496,486 | 571,796 | 1,542,912 | 4,891,859 | 12,313,615 | 1,977,317 | 23,793,985 | ||||||||||||||||||||||||||||||||||||||||||
Held-to-maturity financial assets | — | 198,914 | 611,115 | 2,227,089 | 9,397,778 | 2,854,547 | 15,289,443 | — | 261,124 | 518,368 | 3,343,087 | 9,254,470 | 1,268,563 | 14,645,612 | ||||||||||||||||||||||||||||||||||||||||||
Other financial assets | 16,079 | 3,933,496 | 2,253 | 1,569,281 | 14,548 | 11,487 | 5,547,144 | 27,788 | 4,262,763 | 22,473 | 1,526,228 | 6,554 | 2,382 | 5,848,188 | ||||||||||||||||||||||||||||||||||||||||||
|
|
|
|
|
|
|
|
|
|
|
|
|
| |||||||||||||||||||||||||||||||||||||||||||
Total | (Won) | 14,779,151 | (Won) | 28,191,153 | (Won) | 30,334,905 | (Won) | 85,682,502 | (Won) | 77,097,410 | (Won) | 86,404,850 | (Won) | 322,489,971 | ₩ | 19,283,797 | ₩ | 27,961,737 | ₩ | 25,514,439 | ₩ | 87,396,737 | ₩ | 79,033,308 | ₩ | 85,807,553 | ₩ | 324,997,571 | ||||||||||||||||||||||||||||
|
|
|
|
|
|
|
|
|
|
|
|
|
| |||||||||||||||||||||||||||||||||||||||||||
Financial liabilities | Financial liabilities |
| ||||||||||||||||||||||||||||||||||||||||||||||||||||||
Financial liabilities held for trading | (Won) | 550,873 | (Won) | — | (Won) | — | (Won) | — | (Won) | — | (Won) | — | (Won) | 550,873 | ₩ | 236,637 | ₩ | — | ₩ | — | ₩ | — | ₩ | — | ₩ | — | ₩ | 236,637 | ||||||||||||||||||||||||||||
Financial liabilities designated at fair value through profit or loss | — | — | 99,894 | 148,688 | 588,624 | — | 837,206 | 878,565 | — | — | — | — | — | 878,565 | ||||||||||||||||||||||||||||||||||||||||||
Derivatives held for trading(1) | 1,905,343 | — | — | — | — | — | 1,905,343 | |||||||||||||||||||||||||||||||||||||||||||||||||
Derivatives held for fair value hedging(5) | — | (378 | ) | 28,613 | (1,427 | ) | 129,600 | 6,744 | 163,152 | |||||||||||||||||||||||||||||||||||||||||||||||
Derivatives held for trading(2) | 1,580,029 | — | — | — | — | — | 1,580,029 | |||||||||||||||||||||||||||||||||||||||||||||||||
Derivatives held for fair value hedging(3) | — | — | 25,411 | 179,000 | 8,959 | — | 213,370 | |||||||||||||||||||||||||||||||||||||||||||||||||
Deposits | 62,496,734 | 19,301,815 | 27,509,188 | 77,736,839 | 8,954,242 | 509,831 | 196,508,649 | 74,110,641 | 14,193,153 | 28,638,089 | 77,181,179 | 8,603,695 | 2,677,536 | 205,404,293 | ||||||||||||||||||||||||||||||||||||||||||
Debts | 365,944 | 2,433,558 | 3,377,097 | 7,222,927 | 3,278,067 | 605,826 | 17,283,419 | 270,987 | 3,279,051 | 1,711,622 | 4,733,173 | 4,038,514 | 356,424 | 14,389,771 | ||||||||||||||||||||||||||||||||||||||||||
Debentures | 24,260 | 4,098,529 | 1,516,938 | 6,220,672 | 15,047,649 | 4,737,050 | 31,645,098 | 17,917 | 1,237,666 | 2,039,452 | 9,489,594 | 13,576,339 | 4,722,857 | 31,083,825 | ||||||||||||||||||||||||||||||||||||||||||
Other financial liabilities | — | 5,488,548 | 20,474 | 24,245 | 187,882 | 122,718 | 5,843,867 | 141,041 | 8,372,426 | 13,101 | 63,409 | 198,068 | 509,412 | 9,297,457 | ||||||||||||||||||||||||||||||||||||||||||
|
|
|
|
|
|
|
|
|
|
|
|
|
| |||||||||||||||||||||||||||||||||||||||||||
Total | (Won) | 65,343,154 | (Won) | 31,322,072 | (Won) | 32,552,204 | (Won) | 91,351,944 | (Won) | 28,186,064 | (Won) | 5,982,169 | (Won) | 254,737,607 | ₩ | 77,235,817 | ₩ | 27,082,296 | ₩ | 32,427,675 | ₩ | 91,646,355 | ₩ | 26,425,575 | ₩ | 8,266,229 | ₩ | 263,083,947 | ||||||||||||||||||||||||||||
|
|
|
|
|
|
|
|
|
|
|
|
|
| |||||||||||||||||||||||||||||||||||||||||||
Off-balance sheet items | ||||||||||||||||||||||||||||||||||||||||||||||||||||||||
Off- balance sheet items | ||||||||||||||||||||||||||||||||||||||||||||||||||||||||
Commitments(6) | (Won) | 91,196,792 | (Won) | — | (Won) | 75,000 | (Won) | 267,000 | (Won) | 205,150 | (Won) | — | (Won) | 91,743,942 | ₩ | 95,422,032 | ₩ | — | ₩ | — | ₩ | — | ₩ | — | ₩ | — | ₩ | 95,422,032 | ||||||||||||||||||||||||||||
Financial guarantee contracts(7) | 794,167 | — | 151,000 | — | — | — | 945,167 | 3,097,372 | — | — | — | — | �� | — | 3,097,372 | |||||||||||||||||||||||||||||||||||||||||
|
|
|
|
|
|
|
|
|
|
|
|
|
| |||||||||||||||||||||||||||||||||||||||||||
Total | (Won) | 91,990,959 | (Won) | — | (Won) | 226,000 | (Won) | 267,000 | (Won) | 205,150 | (Won) | — | (Won) | 92,689,109 | ₩ | 98,519,404 | ₩ | — | ₩ | — | ₩ | — | ₩ | — | ₩ | — | ₩ | 98,519,404 | ||||||||||||||||||||||||||||
|
|
|
|
|
|
|
|
|
|
|
|
|
| |||||||||||||||||||||||||||||||||||||||||||
| (1) | The amounts of ₩3,647,285 million and ₩7,671,914 million which are restricted amounts due from the financial institutions as of December 31, 2012 and 2013, respectively, are excluded. |
| (2) | Financial instruments held for trading, financial instruments designated at fair value through profit or loss and derivatives held for trading are not managed by contractual maturity because they are |
|
| (4) | In the case of equity investments restricted for sale, they are |
|
Deposits that are contractually repayable on demand or on short notice are classified |
|
|
The financial guarantee contracts are included |
The contractual cash flows of derivatives held for cash flow hedging as of December 31, 2011,2012 and 2013, are as follows:
| As of December 31, 2011 | 2012 | |||||||||||||||||||||||||||||||||||||||||||||||
| Up to 1 month | 1-3 months | 3-12 months | 1-5 years | Over 5 years | Total | Up to 1 month | 1-3 months | 3-12 months | 1-5 years | Over 5 years | Total | |||||||||||||||||||||||||||||||||||||
| (In millions of Korean won) | (In millions of Korean won) | |||||||||||||||||||||||||||||||||||||||||||||||
To be received | (Won) | 1,139 | (Won) | 2,864 | (Won) | 11,690 | (Won) | 371,807 | (Won) | — | (Won) | 387,500 | ||||||||||||||||||||||||||||||||||||
To be received. | ₩ | 3,321 | ₩ | 4,931 | ₩ | 23,486 | ₩ | 357,927 | ₩ | — | ₩ | 389,665 | ||||||||||||||||||||||||||||||||||||
To be paid | 1,446 | 3,380 | 14,160 | 354,042 | — | 373,028 | (3,864 | ) | (6,277 | ) | (29,702 | ) | (366,291 | ) | — | (406,134 | ) | |||||||||||||||||||||||||||||||
Meanwhile, there were no derivatives designated as cash flow hedging instruments as of January 1, 2010, or December 31, 2010.
| 2013 | ||||||||||||||||||||||||
| Up to 1 month | 1-3 months | 3-12 months | 1-5 years | Over 5 years | Total | |||||||||||||||||||
| (In millions of Korean won) | ||||||||||||||||||||||||
To be received. | ₩ | 4,099 | ₩ | 5,962 | ₩ | 344,838 | ₩ | 56,186 | ₩ | — | ₩ | 411,085 | ||||||||||||
To be paid | (4,996 | ) | (7,872 | ) | (357,099 | ) | (54,974 | ) | — | (424,941 | ) | |||||||||||||
4.4 Market risk
4.4.1 Overview of market risk
Definition of market risk
Market risk is the risk of possible losses which arise from changes in market factors, such as interest rate, stock price, foreign exchange rate commodity value and other market factors that affect the fair value or future cash flows of financial instruments, such as securities and derivatives amongst others. The most significant risks associated with trading positions are interest rate risks, and other risks areinclude stock price risks and currency risks. In addition, the Group is exposed to interest rate risks associated with non-trading positions. The Group classifies exposures to market risk into either trading or non-trading positions. The Group measures and manages market risk separately for each subsidiary in the Group.
Market risk management group
The Group sets economic capital limits for market risk and interest rate risk and monitors the risks to manage the risk of trading and non-trading positions. The Group maintains risk management systems and procedures, such as trading policies and procedures, and market risk management guidelines for trading positions, and interest rate risk management guidelines for non-trading positions in order to manage market risk efficiently. The procedures mentioned are implemented with approval from the Risk Management Committee and Risk Management Council.
As the main subsidiary, Kookmin Bank establishes market risk management policy, sets position limits, loss limitlimits and VAR limits of each business group and approves newly developed derivative instruments, bythrough its Risk Management Council. The Risk Management Council has delegated the responsibility for market risk management of individual business departmentdepartments to the Market Risk Management Committee which is chaired by a CRO (ChiefChief Risk Officer)Officer (CRO). The Market Risk Management Committee sets VaR limits, position limits, loss limits, VaR limits, sensitivity limits and scenario loss limits and sensitivity limits for each department of divisions,division, at the level of each individual business department.
The ALCO of Kookmin Bank determines operational standards of interest and commission, revises ALM (AssetAsset Liability Management)Management (ALM) risk management guidelines, interest rate and commission guidelines and monitors the establishment and enforcement of ALM risk management policies. The interest rate risk limit is set based on the future assets/liabilities position and interest rate volatility estimated reflectingestimation reflects the annual work plan. The financial managementplanning department and risk management department measuremeasures and monitormonitors the interest risk status and limits on a regular basis. The status and limits of interest rate risks such as interest rate gap, duration gap and sensitivity are reported to the ALCO on a monthly basis and to the Risk Management Council on a quarterly basis. The responsibility offor ALM control is delegated to the Risk Management Department to ensure adequacy
on of interest rate and liquidity risk management. The Risk Management Department monitors and reviews risk management procedures and tasks conducted by the Financial ManagementPlanning Department, and reports related information to management independently.
4.4.2 Trading Position
Definition of a trading position
Trading positions subject to market risk management are defined under the Trading Policy and Guideline, and the basic requirements are as follows:
The trading position is not restricted for sale, is measured daily at fair value, and its significant inherent risks isare able to be hedged in the market.
The criteria for classification as a trading position are clearly defined in the Trading Policy and Guideline, and separately managed by the trading department.
The trading position is operated in accordance with the documented trading strategy and managed through position limits.
The operating department or professional dealers have an authority to enforce a deal on the trading position within predetermined limits without pre-approval.
The trading position is reported periodically to management for the purpose of the Group’s risk management.
Observation method on market risk arising from trading positions
The Group calculates VaR to measure the market risk by using market risk management systems on the entire trading portfolio. Generally, the Group manages market risk on the trading portfolio. In addition, the Group controls and manages the risk of derivative trading based on the regulations and guidelines formulated by the Financial Supervisory Service.
VaR (Value at Risk)
i. VaR (Value at Risk)
A keyThe Group uses the value-at-risk methodology to measure ofthe market risk isof trading positions. There have been changes in market risk measurement technique during the daily Value at Risk (VaR). year ended December 31, 2012, and the detailed descriptions are below.
Previous method:
The Group used a daily VaR measure, which is a statistically estimated maximum amount of loss that could occur in one day under normal distribution of financial variables. The Group calculated VaR using theequal-weighted average method based on historical changes in market rates, prices and volatilities over the previous 550 business days and measured VaR at a 99% single tail confidence level.
Current method:
The Group now uses the 10-day VaR, which estimates the maximum amount of loss that could occur in ten days under an historical simulation model which is considered to be a full valuation method. The distributions of portfolio’s value changes are estimated based on the data over the previous 250 business days, and ten-day VaR is calculated by subtracting net present market value from the value measured at a 99% confident level of portfolio’s value distribution results. However, the KB Investment & Securities Co., Ltd. calculates ten-day VaR using the equal-weighted average method based on historical changes in market rates, prices and volatilities over the previous 550250 business days and measures VaR at a 99% single tail confidence level. This means
These changes in market risk measurement technique are intended to reflect the actual amountvolatilities of loss may exceed the VaR, on average, once outmarket more accurately. The current method immediately reflects the scenario of 100 business days.a day when the financial market shows dramatic moves, and the market risk of financial instruments with complex risk attributes can be measured more appropriately than under the previous methodology.
VaR is a commonly used market risk measurement technique. However, the method has some shortcomings. VaR estimates possible losses over a certain period at a particular confidence level using past market movement data. Past market movement,movements are, however, is not necessarily a good indicator of future events, as there may be conditions and circumstances in the future that the model does not anticipate. As a result, the timing and magnitude of the actual losses can be differentmay vary depending on the assumptions made at the time of the calculation. In addition, the time periods used for the model, generally one or ten days, are assumed to be a sufficient holding period before liquidating the relevant underlying positions. If these holding periods are not sufficient, or too long, the VaR results may understate or overstate the potential loss.
The Group uses an internal model (VaR) to measure general risk, and a standard method to measure each individual risk. Also, general and individual risks in some positions included in the consolidated financial statements in adoption of IFRS, are measured using a standard method. Therefore, the market risk VaR may not reflect the market risk of each individual risksrisk and some specific positions.
ii. Back-Testing
Back-testing is conducted on a daily basis to validate the adequacy of the market risk model. Inback-testing, the Group compares both the actual and hypothetical profit and loss with the VaR calculations.
iii. Stress Testing
The stressStress testing is carried out to analyze the impact of abnormal market situations relating toon the trading and available-for-sale portfolio. It reflects changes in interest rate,rates, stock price,prices, foreign exchange rate,rates, implied volatilityvolatilities of derivatives and other risk factors that have significant influence on the value of the portfolio. The Group mainly uses an historical scenario tool and also uses a hypothetical scenario tool for the analysis of abnormal market situations. Stress testing is performed at least once every quarter.
VaR at a 99% confidence level of interest rate, stock price and foreign exchange rate risk for trading positions with a one-dayten-day holding period by a subsidiary as of January 1, 2010, and as of and for the years ended December 31, 20102012 and 2011,2013, are as follows:
Kookmin Bank
| As of January 1, 2010 | As of and for the Year Ended December 31, 2010 | 2012 | ||||||||||||||||||||||||||||||||||
| Beginning | Average | Minimum | Maximum | Ending | Average(1) | Minimum(1) | Maximum(1) | Ending | ||||||||||||||||||||||||||||
| (In millions of Korean won) | (In millions of Korean won) | |||||||||||||||||||||||||||||||||||
Interest rate risk | (Won) | 6,135 | (Won) | 4,249 | (Won) | 2,076 | (Won) | 6,317 | (Won) | 3,598 | ₩ | 20,173 | ₩ | 8,379 | ₩ | 29,329 | ₩ | 8,379 | ||||||||||||||||||
Stock price risk | 2,760 | 1,591 | 103 | 4,246 | 125 | 4,215 | 467 | 8,745 | 4,865 | |||||||||||||||||||||||||||
Foreign exchange rate risk | 5,835 | 5,276 | 441 | 13,391 | 5,200 | 26,565 | 9,590 | 39,185 | 11,201 | |||||||||||||||||||||||||||
Deduction of diversification effect | (7,555 | ) | (3,348 | ) | — | — | — | (12,710 | ) | |||||||||||||||||||||||||||
|
|
|
|
|
| |||||||||||||||||||||||||||||||
Total VaR | (Won) | 7,175 | (Won) | 6,411 | (Won) | 3,230 | (Won) | 12,480 | (Won) | 5,575 | ₩ | 20,685 | ₩ | 10,637 | ₩ | 28,717 | ₩ | 11,735 | ||||||||||||||||||
|
|
|
|
|
| |||||||||||||||||||||||||||||||
| As of and for the Year Ended December 31, 2011 | ||||||||||||||||
| Average | Minimum | Maximum | Ending | |||||||||||||
| (In millions of Korean won) | ||||||||||||||||
Interest rate risk | (Won) | 2,537 | (Won) | 1,430 | (Won) | 4,019 | (Won) | 1,866 | ||||||||
Stock price risk | 725 | 86 | 2,569 | 1,161 | ||||||||||||
Foreign exchange rate risk | 6,464 | 4,187 | 12,610 | 4,882 | ||||||||||||
Deduction of diversification effect | (3,141 | ) | ||||||||||||||
|
| |||||||||||||||
Total VaR | (Won) | 6,206 | (Won) | 4,000 | (Won) | 11,992 | (Won) | 4,768 | ||||||||
|
| |||||||||||||||
| (1) | Measurement technique was changed during the year ended December 31, 2012, and the average, minimum and maximum amounts are based on the data from the beginning of May to the end of the year. |
| 2013 | ||||||||||||||||
| Average | Minimum | Maximum | Ending | |||||||||||||
| (In millions of Korean won) | ||||||||||||||||
Interest rate risk | ₩ | 16,270 | ₩ | 7,428 | ₩ | 24,979 | ₩ | 16,967 | ||||||||
Stock price risk | 3,480 | 932 | 7,114 | 1,049 | ||||||||||||
Foreign exchange rate risk | 9,264 | 5,287 | 13,589 | 5,287 | ||||||||||||
Deduction of diversification effect | — | — | — | (6,928 | ) | |||||||||||
|
|
|
|
|
|
|
| |||||||||
Total VaR | ₩ | 17,316 | ₩ | 10,868 | ₩ | 22,249 | ₩ | 16,375 | ||||||||
|
|
|
|
|
|
|
| |||||||||
KB Investment & Securities Co., Ltd.
| As of January 1, 2010 | As of and for the Year Ended December 31, 2010 | 2012 | ||||||||||||||||||||||||||||||||||
| Beginning | Average | Minimum | Maximum | Ending | Average(1) | Minimum(1) | Maximum(1) | Ending | ||||||||||||||||||||||||||||
| (In millions of Korean won) | (In millions of Korean won) | |||||||||||||||||||||||||||||||||||
Interest rate risk | (Won) | 1,048 | (Won) | 980 | (Won) | 307 | (Won) | 2,152 | (Won) | 491 | ₩ | 1,805 | ₩ | 572 | ₩ | 5,054 | ₩ | 3,532 | ||||||||||||||||||
Stock price risk | 653 | 608 | 281 | 1,817 | 794 | 2,350 | 486 | 8,683 | 658 | |||||||||||||||||||||||||||
Foreign exchange rate risk | 80 | 64 | 2 | 208 | 2 | 309 | 18 | 1,329 | 224 | |||||||||||||||||||||||||||
Deduction of diversification effect | (511 | ) | (297 | ) | — | — | — | (763 | ) | |||||||||||||||||||||||||||
|
|
|
|
|
| |||||||||||||||||||||||||||||||
Total VaR | (Won) | 1,270 | (Won) | 1,174 | (Won) | 488 | (Won) | 2,172 | (Won) | 990 | ₩ | 3,119 | ₩ | 724 | ₩ | 8,752 | ₩ | 3,651 | ||||||||||||||||||
|
|
|
|
|
| |||||||||||||||||||||||||||||||
| (1) | Measurement technique was changed during the year ended December 31, 2012, and the average, minimum and maximum amounts are based on the data from the beginning of April to the end of the year. |
| As of and for the Year Ended December 31, 2011 | 2013 | |||||||||||||||||||||||||||||||
| Average | Minimum | Maximum | Ending | Average | Minimum | Maximum | Ending | |||||||||||||||||||||||||
| (In millions of Korean won) | (In millions of Korean won) | |||||||||||||||||||||||||||||||
Interest rate risk | (Won) | 410 | (Won) | 131 | (Won) | 1,046 | (Won) | 413 | ₩ | 2,503 | ₩ | 160 | ₩ | 6,825 | ₩ | 1,825 | ||||||||||||||||
Stock price risk | 659 | 350 | 1,643 | 444 | 1,920 | 507 | 6,244 | 1,139 | ||||||||||||||||||||||||
Foreign exchange rate risk | 161 | 15 | 586 | 57 | 527 | 24 | 1,311 | 53 | ||||||||||||||||||||||||
Deduction of diversification effect | (329 | ) | — | — | — | (698 | ) | |||||||||||||||||||||||||
|
|
|
|
| ||||||||||||||||||||||||||||
Total VaR | (Won) | 819 | (Won) | 381 | (Won) | 1,885 | (Won) | 585 | ₩ | 3,319 | ₩ | 589 | ₩ | 8,908 | ₩ | 2,318 | ||||||||||||||||
|
|
|
|
| ||||||||||||||||||||||||||||
KB Life Insurance Co., Ltd.
| As of January 1, 2010 | As of and for the Year Ended December 31, 2010 | 2012 | ||||||||||||||||||||||||||||||||||
| Beginning | Average | Minimum | Maximum | Ending | Average(1) | Minimum(1) | Maximum(1) | Ending | ||||||||||||||||||||||||||||
| (In millions of Korean won) | (In millions of Korean won) | |||||||||||||||||||||||||||||||||||
Interest rate risk | (Won) | 75 | (Won) | 21 | (Won) | 6 | (Won) | 77 | (Won) | 32 | ₩ | 111 | ₩ | 58 | ₩ | 152 | ₩ | 127 | ||||||||||||||||||
Deduction of diversification effect | (5 | ) | — | — | — | — | — | |||||||||||||||||||||||||||||
|
|
|
|
|
| |||||||||||||||||||||||||||||||
Total VaR | (Won) | 70 | (Won) | 21 | (Won) | 6 | (Won) | 72 | (Won) | 32 | ₩ | 111 | ₩ | 58 | ₩ | 152 | ₩ | 127 | ||||||||||||||||||
|
|
|
|
|
| |||||||||||||||||||||||||||||||
| As of and for the Year Ended December 31, 2011 | ||||||||||||||||
| Average | Minimum | Maximum | Ending | |||||||||||||
| (In millions of Korean won) | ||||||||||||||||
Interest rate risk | (Won) | 23 | (Won) | 10 | (Won) | 53 | (Won) | 12 | ||||||||
Deduction of diversification effect | — | |||||||||||||||
|
| |||||||||||||||
Total VaR | (Won) | 23 | (Won) | 10 | (Won) | 53 | (Won) | 12 | ||||||||
|
| |||||||||||||||
| (1) | Measurement technique was changed during the year ended December 31, 2012, and the average, minimum and maximum amounts are based on the data from the beginning of April to the end of the year. |
| 2013 | ||||||||||||||||
| Average | Minimum | Maximum | Ending | |||||||||||||
| (In millions of Korean won) | ||||||||||||||||
Interest rate risk | ₩ | 279 | ₩ | 157 | ₩ | 441 | ₩ | 329 | ||||||||
Deduction of diversification effect | — | — | — | — | ||||||||||||
|
|
|
|
|
|
|
| |||||||||
Total VaR | ₩ | 279 | ₩ | 157 | ₩ | 441 | ₩ | 329 | ||||||||
|
|
|
|
|
|
|
| |||||||||
KB Investment Co., Ltd.
| As of January 1, 2010 | As of and for the Year Ended December 31, 2010 | 2012 | ||||||||||||||||||||||||||||||||||
| Beginning | Average | Minimum | Maximum | Ending | Average(1) | Minimum(1) | Maximum(1) | Ending | ||||||||||||||||||||||||||||
| (In millions of Korean won) | (In millions of Korean won) | |||||||||||||||||||||||||||||||||||
Foreign exchange rate risk | (Won) | 65 | (Won) | 49 | (Won) | — | (Won) | 71 | (Won) | 29 | ₩ | 63 | ₩ | 39 | ₩ | 92 | ₩ | 41 | ||||||||||||||||||
Deduction of diversification effect | — | — | — | — | — | — | ||||||||||||||||||||||||||||||
|
|
|
|
|
| |||||||||||||||||||||||||||||||
Total VaR | (Won) | 65 | (Won) | 49 | (Won) | — | (Won) | 71 | (Won) | 29 | ₩ | 63 | ₩ | 39 | ₩ | 92 | ₩ | 41 | ||||||||||||||||||
|
|
|
|
|
| |||||||||||||||||||||||||||||||
| As of and for the Year Ended December 31, 2011 | ||||||||||||||||
| Average | Minimum | Maximum | Ending | |||||||||||||
| (In millions of Korean won) | ||||||||||||||||
Foreign exchange rate risk | (Won) | 31 | (Won) | 26 | (Won) | 52 | (Won) | 28 | ||||||||
Deduction of diversification effect | — | |||||||||||||||
|
| |||||||||||||||
Total VaR | (Won) | 31 | (Won) | 26 | (Won) | 52 | (Won) | 28 | ||||||||
|
| |||||||||||||||
| (1) | Measurement technique was changed during the year ended December 31, 2012, and the average, minimum and maximum amounts are based on the data from the beginning of April to the end of the year. |
Foreign exchange rate risk Deduction of diversification effect Total VaR 2013 Average Minimum Maximum Ending (In millions of Korean won) ₩ 40 ₩ 29 ₩ 53 ₩ 30 — — — — ₩ 40 ₩ 29 ₩ 53 ₩ 30
Meanwhile, the required equity capital using the standardized method related to the positions which are not measured by VaR as of January 1, 2010, and December 31, 20102012 and 2011, are2013, is as follows:
Kookmin Bank
| As of January 1, | As of December 31, | |||||||||||||||||||
| 2010 | 2010 | 2011 | 2012 | 2013 | ||||||||||||||||
| (In millions of Korean won) | (In millions of Korean won) | |||||||||||||||||||
Interest rate risk | (Won) | 1,789 | (Won) | 26,928 | (Won) | 23,602 | ₩ | 1,673 | ₩ | 921 | ||||||||||
Stock price risk | 163 | — | 21,220 | 4,567 | 2 | |||||||||||||||
Foreign exchange rate risk | 6,839 | 9,266 | 9,561 | 9,081 | 9,214 | |||||||||||||||
Commodity value risk | 697 | — | — | |||||||||||||||||
|
|
|
|
| ||||||||||||||||
Total | (Won) | 9,488 | (Won) | 36,194 | (Won) | 54,383 | ₩ | 15,321 | ₩ | 10,137 | ||||||||||
|
|
|
|
| ||||||||||||||||
KB Investment & Securities Co., Ltd.
| As of January 1, | As of December 31, | |||||||||||||||||||
| 2010 | 2010 | 2011 | 2012 | 2013 | ||||||||||||||||
| (In millions of Korean won) | (In millions of Korean won) | |||||||||||||||||||
Interest rate risk | (Won) | 5,775 | (Won) | 3,528 | (Won) | 3,911 | ₩ | 4,607 | ₩ | 5,081 | ||||||||||
Stock price risk | 4,533 | 9,353 | 10,212 | 3,224 | 3,602 | |||||||||||||||
|
|
|
|
| ||||||||||||||||
Total | (Won) | 10,308 | (Won) | 12,881 | (Won) | 14,123 | ₩ | 7,831 | ₩ | 8,683 | ||||||||||
|
|
|
|
| ||||||||||||||||
KB Life Insurance Co., Ltd.
| 2012 | 2013 | |||||||
| (In millions of Korean won) | ||||||||
Stock price risk | ₩ | 13 | ₩ | 106 | ||||
|
|
|
| |||||
Total | ₩ | 13 | ₩ | 106 | ||||
|
|
|
| |||||
KB Investment Co., Ltd.
| 2012 | 2013 | |||||||
| (In millions of Korean won) | ||||||||
Stock price risk | ₩ | 1,385 | ₩ | 1,424 | ||||
|
|
|
| |||||
Total | ₩ | 1,385 | ₩ | 1,424 | ||||
|
|
|
| |||||
Details of risk factors
i. Interest rate risk
Trading position interest rate risk usually arises from debt securities denominated in Korean won. The Group’s trading strategy is to benefit from short-term movements in the prices of debt securities arising from changes in interest rates. The Group manages interest rate risk on trading positions using market value-based tools such as VaR and sensitivity analysis (Price Value of a Basis Point: PVBP).
ii. Stock price risk
Stock price risk only arises from trading securities denominated in Korean won as the Group does not have any trading exposure to shares denominated in foreign currencies. The trading securities portfolio in Korean won are composed of exchange-traded stocks and derivative instruments linked to stock with strict limits on diversification.
iii. Foreign exchange rate risk
Foreign exchange rate risk arises from holding assets and liabilities denominated in foreign currency. Net foreign currency exposure mostly occurs from the foreign assets and liabilities which are denominated in US dollars and Kazakhstan Tenge, and the remainder in Japanese Yen or Euro. The Group sets both loss limits and net foreign currency exposure limits and manages comprehensive net foreign exchange exposures which consider both trading and non-trading portfolios.
iv. Commodity risk
The Group is exposed to other price risk (other than those arising from interest rate, stock price or currency risk) while holding commodity derivatives. Those underlying assets are metal and precious metal, and the Group makes back-to-back hedge contracts in order to mitigate changes in the price risks.
4.4.3 Non-trading position
Definition of non-trading position
The most critical market risk that arises in non-trading portfolios is interest rate risk. Interest rate risk occurs due to mismatches on maturities and interest rate change periods between interest sensitive assets and liabilities. The Group measures interest rate risk arising from assets and liabilities denominated in Korean won and foreign currencies including derivative financial instruments held for hedging. Most interest-bearing assets and interest-bearing liabilities are denominated in Korean won. Most foreign currency assets and liabilities are denominated in US Dollars and the remainder in Japanese Yen or Euro.
Observation method on market risk arising from non-trading position
The main objective of interest rate risk management is to generate stable net interest income and to protect asset values against interest rate fluctuations. The Group manages the risk through interest rate gap analysis on interest rate maturities between interest-bearing assets and interest-bearing liabilities and measuring interest rate VaR.
Disclosure of results from each observation method
i. Interest rate gap analysis
Interest rate gap analysis is based on the interest rates repricing maturities ofdates for interest-bearing assets and interest-bearing liabilities. It measures expected changes in net interest income by calculating the difference in the amounts of interest-bearing assets and interest-bearing liabilities atin each maturity.maturity bucket. The Group conducts interest gap analysis on assets denominated in Korean won and foreign currencies on a monthly basis. However, where there is no contractual maturity offor a particular instrument, then a maturity date is set according to internal liquidity risk management guidelines.guidelines, determined by ALM.
The results of the interest rate gap analysis by subsidiary as of January 1, 2010, and December 31, 20102012 and 2011,2013, are as follows:
Kookmin Bank
| As of January 1, 2010 | ||||||||||||||||||||||||
| Up to 3 months | 3~6 months | 6~12 months | 1~3 years | Over 3 years | Total | |||||||||||||||||||
| (In millions of Korean won) | ||||||||||||||||||||||||
Interest-bearing assets in Korean won | (Won) | 145,771,663 | (Won) | 34,801,525 | (Won) | 13,966,699 | (Won) | 13,185,559 | (Won) | 8,646,144 | (Won) | 216,371,590 | ||||||||||||
Interest-bearing liabilities in Korean won | 88,681,486 | 21,841,990 | 49,296,794 | 33,427,544 | 17,339,782 | 210,587,596 | ||||||||||||||||||
|
|
|
|
|
|
|
|
|
|
|
| |||||||||||||
Gap | (Won) | 57,090,177 | (Won) | 12,959,535 | (Won) | (35,330,095 | ) | (Won) | (20,241,985 | ) | (Won) | (8,693,638 | ) | (Won) | 5,783,994 | |||||||||
|
|
|
|
|
|
|
|
|
| |||||||||||||||
Accumulated gap | 57,090,177 | 70,049,712 | 34,719,617 | 14,477,632 | 5,783,994 | |||||||||||||||||||
|
|
|
|
|
|
|
|
|
| |||||||||||||||
Percentage (%) | 26.39 | 32.37 | 16.05 | 6.69 | 2.67 | |||||||||||||||||||
Interest-bearing assets in foreign currencies | (Won) | 9,992,036 | (Won) | 1,834,697 | (Won) | 429,739 | (Won) | 546,220 | (Won) | 295,567 | (Won) | 13,098,259 | ||||||||||||
Interest-bearing liabilities in foreign currencies | 10,537,990 | 3,397,664 | 778,358 | 146,509 | 11,485 | 14,872,006 | ||||||||||||||||||
|
|
|
|
|
|
|
|
|
|
|
| |||||||||||||
Gap | (Won) | (545,954 | ) | (Won) | (1,562,967 | ) | (Won) | (348,619 | ) | (Won) | 399,711 | (Won) | 284,082 | (Won) | (1,773,747 | ) | ||||||||
|
|
|
|
|
|
|
|
|
| |||||||||||||||
Accumulated gap | (545,954 | ) | (2,108,921 | ) | (2,457,540 | ) | (2,057,829 | ) | (1,773,747 | ) | ||||||||||||||
|
|
|
|
|
|
|
|
|
| |||||||||||||||
Percentage (%) | (4.17 | ) | (16.10 | ) | (18.76 | ) | (15.71 | ) | (13.54 | ) | ||||||||||||||
| As of December 31, 2010 | 2012 | |||||||||||||||||||||||||||||||||||||||||||||||
| Up to 3 months | 3~6 months | 6~12 months | 1~3 years | Over 3 years | Total | Up to 3 months | 3~6 months | 6~12 months | 1~3 years | Over 3 years | Total | |||||||||||||||||||||||||||||||||||||
| (In millions of Korean won) | (In millions of Korean won) | |||||||||||||||||||||||||||||||||||||||||||||||
Interest-bearing assets in Korean won | (Won) | 126,798,255 | (Won) | 47,423,485 | (Won) | 16,872,833 | (Won) | 16,985,016 | (Won) | 10,142,869 | (Won) | 218,222,458 | ₩ | 92,032,100 | ₩ | 50,782,044 | ₩ | 36,993,573 | ₩ | 23,435,855 | ₩ | 16,535,527 | ₩ | 219,779,099 | ||||||||||||||||||||||||
Interest-bearing liabilities in Korean won | 87,674,549 | 19,796,003 | 49,701,076 | 34,481,647 | 18,327,894 | 209,981,169 | 92,375,407 | 35,360,716 | 49,686,942 | 22,184,737 | 15,961,186 | 215,568,988 | ||||||||||||||||||||||||||||||||||||
|
|
|
|
|
|
|
|
|
|
|
| |||||||||||||||||||||||||||||||||||||
Gap | (Won) | 39,123,706 | (Won) | 27,627,482 | (Won) | (32,828,243 | ) | (Won) | (17,496,631 | ) | (Won) | (8,185,025 | ) | (Won) | 8,241,289 | ₩ | (343,307 | ) | ₩ | 15,421,328 | ₩ | (12,693,369 | ) | ₩ | 1,251,118 | ₩ | 574,341 | ₩ | 4,210,111 | |||||||||||||||||||
|
|
|
|
|
|
|
|
|
|
| ||||||||||||||||||||||||||||||||||||||
Accumulated gap | 39,123,706 | 66,751,188 | 33,922,945 | 16,426,314 | 8,241,289 | (343,307 | ) | 15,078,021 | 2,384,652 | 3,635,770 | 4,210,111 | |||||||||||||||||||||||||||||||||||||
|
|
|
|
|
|
|
|
|
| |||||||||||||||||||||||||||||||||||||||
Percentage (%) | 17.93 | 30.59 | 15.55 | 7.53 | 3.78 | (0.16 | ) | 6.86 | 1.09 | 1.65 | 1.92 | |||||||||||||||||||||||||||||||||||||
Interest-bearing assets in foreign currencies | (Won) | 9,667,247 | (Won) | 1,846,761 | (Won) | 696,691 | (Won) | 662,499 | (Won) | 395,968 | (Won) | 13,269,166 | ₩ | 10,105,090 | ₩ | 2,090,551 | ₩ | 718,802 | ₩ | 641,281 | ₩ | 121,700 | ₩ | 13,677,424 | ||||||||||||||||||||||||
Interest-bearing liabilities in foreign currencies | 8,077,254 | 2,985,220 | 934,304 | 1,099,965 | — | 13,096,743 | 8,218,370 | 3,533,356 | 1,964,078 | 513,647 | 117,821 | 14,347,272 | ||||||||||||||||||||||||||||||||||||
|
|
|
|
|
|
|
|
|
|
|
| |||||||||||||||||||||||||||||||||||||
Gap | (Won) | 1,589,993 | (Won) | (1,138,459 | ) | (Won) | (237,613 | ) | (Won) | (437,466 | ) | (Won) | 395,968 | (Won) | 172,423 | ₩ | 1,886,720 | ₩ | (1,442,805 | ) | ₩ | (1,245,276 | ) | ₩ | 127,634 | ₩ | 3,879 | ₩ | (669,848 | ) | ||||||||||||||||||
|
|
|
|
|
|
|
|
|
| |||||||||||||||||||||||||||||||||||||||
Accumulated gap | 1,589,993 | 451,534 | 213,921 | (223,545 | ) | 172,423 | 1,886,720 | 443,915 | (801,361 | ) | (673,727 | ) | (669,848 | ) | ||||||||||||||||||||||||||||||||||
|
|
|
|
|
|
|
|
|
| |||||||||||||||||||||||||||||||||||||||
Percentage (%) | 11.98 | 3.40 | 1.61 | (1.68 | ) | 1.30 | 13.79 | 3.25 | (5.86 | ) | (4.93 | ) | (4.90 | ) | ||||||||||||||||||||||||||||||||||
| As of December 31, 2011 | 2013 | |||||||||||||||||||||||||||||||||||||||||||||||
| Up to 3 months | 3~6 months | 6~12 months | 1~3 years | Over 3 years | Total | Up to 3 months | 3~6 months | 6~12 months | 1~3 years | Over 3 years | Total | |||||||||||||||||||||||||||||||||||||
| (In millions of Korean won) | (In millions of Korean won) | |||||||||||||||||||||||||||||||||||||||||||||||
Interest-bearing assets in Korean won | (Won) | 109,769,309 | (Won) | 53,264,820 | (Won) | 26,293,288 | (Won) | 16,619,523 | (Won) | 9,309,082 | (Won) | 215,256,022 | ₩ | 83,935,439 | ₩ | 54,589,446 | ₩ | 46,832,862 | ₩ | 21,608,336 | ₩ | 14,297,239 | ₩ | 221,263,322 | ||||||||||||||||||||||||
Interest-bearing liabilities in Korean won | 91,469,293 | 30,487,095 | 54,100,542 | 20,867,820 | 13,169,891 | 210,094,641 | 91,505,923 | 37,966,586 | 50,647,954 | 20,948,789 | 18,244,867 | 219,314,119 | ||||||||||||||||||||||||||||||||||||
|
|
|
|
|
|
|
|
|
|
|
| |||||||||||||||||||||||||||||||||||||
Gap | (Won) | 18,300,016 | (Won) | 22,777,725 | (Won) | (27,807,254 | ) | (Won) | (4,248,297 | ) | (Won) | (3,860,809 | ) | (Won) | 5,161,381 | ₩ | (7,570,484 | ) | ₩ | 16,622,860 | ₩ | (3,815,092 | ) | ₩ | 659,547 | ₩ | (3,947,628 | ) | ₩ | 1,949,203 | ||||||||||||||||||
|
|
|
|
|
|
|
|
|
| |||||||||||||||||||||||||||||||||||||||
Accumulated gap | 18,300,016 | 41,077,741 | 13,270,487 | 9,022,190 | 5,161,381 | (7,570,484 | ) | 9,052,376 | 5,237,284 | 5,896,831 | 1,949,203 | |||||||||||||||||||||||||||||||||||||
|
|
|
|
|
|
|
|
|
| |||||||||||||||||||||||||||||||||||||||
Percentage (%) | 8.50 | 19.08 | 6.16 | 4.19 | 2.40 | (3.42 | ) | 4.09 | 2.37 | 2.67 | 0.88 | |||||||||||||||||||||||||||||||||||||
Interest-bearing assets in foreign currencies | (Won) | 13,009,331 | (Won) | 2,081,836 | (Won) | 1,015,797 | (Won) | 899,201 | (Won) | 139,646 | (Won) | 17,145,811 | ₩ | 10,112,905 | ₩ | 1,888,724 | ₩ | 607,499 | ₩ | 396,714 | ₩ | 257,419 | ₩ | 13,263,261 | ||||||||||||||||||||||||
Interest-bearing liabilities in foreign currencies | 11,246,216 | 3,871,630 | 2,151,126 | 205,522 | 46,132 | 17,520,626 | 9,500,565 | 2,631,393 | 1,527,154 | 225,300 | 124,357 | 14,008,769 | ||||||||||||||||||||||||||||||||||||
|
|
|
|
|
|
|
|
|
|
|
| |||||||||||||||||||||||||||||||||||||
Gap | (Won) | 1,763,115 | (Won) | (1,789,794 | ) | (Won) | (1,135,329 | ) | (Won) | 693,679 | (Won) | 9 3,514 | (Won) | (374,815 | ) | ₩ | 612,340 | ₩ | (742,669 | ) | ₩ | (919,655 | ) | ₩ | 171,414 | ₩ | 133,062 | ₩ | (745,508 | ) | ||||||||||||||||||
|
|
|
|
|
|
|
|
|
| |||||||||||||||||||||||||||||||||||||||
Accumulated gap | 1,763,115 | (26,679 | ) | (1,162,008 | ) | (468,329 | ) | (374,815 | ) | 612,340 | (130,329 | ) | (1,049,984 | ) | (878,570 | ) | (745,508 | ) | ||||||||||||||||||||||||||||||
|
|
|
|
|
|
|
|
|
| |||||||||||||||||||||||||||||||||||||||
Percentage (%) | 10.28 | (0.16 | ) | (6.78 | ) | (2.73 | ) | (2.19 | ) | 4.62 | (0.98 | ) | (7.92 | ) | (6.62 | ) | (5.62 | ) | ||||||||||||||||||||||||||||||
KB Kookmin Card Co., Ltd.
| As of December 31, 2011 | 2012 | |||||||||||||||||||||||||||||||||||||||||||||||
| Up to 3 months | 3~6 months | 6~12 months | 1~3 years | Over 3 years | Total | Up to 3 months | 3~6 months | 6~12 months | 1~3 years | Over 3 years | Total | |||||||||||||||||||||||||||||||||||||
| (In millions of Korean won) | (In millions of Korean won) | |||||||||||||||||||||||||||||||||||||||||||||||
Interest-bearing assets in Korean won | (Won) | 3,057,388 | (Won) | 683,327 | (Won) | 884,063 | (Won) | 8,288,959 | (Won) | 7,125 | (Won) | 12,920,862 | ₩ | 2,743,651 | ₩ | 802,981 | ₩ | 1,100,429 | ₩ | 8,453,580 | ₩ | 9,765 | ₩ | 13,110,406 | ||||||||||||||||||||||||
Interest-bearing liabilities in Korean won | 1,811,500 | 860,000 | 2,530,000 | 3,052,800 | 1,170,000 | 9,424,300 | 1,370,000 | 260,000 | 1,310,000 | 3,921,800 | 2,221,000 | 9,082,800 | ||||||||||||||||||||||||||||||||||||
|
|
|
|
|
|
|
|
|
|
|
| |||||||||||||||||||||||||||||||||||||
Gap | (Won) | 1,245,888 | (Won) | (176,673 | ) | (Won) | (1,645,937 | ) | (Won) | 5,236,159 | (Won) | (1,162,875 | ) | (Won) | 3,496,562 | ₩ | 1,373,651 | ₩ | 542,981 | ₩ | (209,571 | ) | ₩ | 4,531,780 | ₩ | (2,211,235 | ) | ₩ | 4,027,606 | |||||||||||||||||||
|
|
|
|
|
|
|
|
|
| |||||||||||||||||||||||||||||||||||||||
Accumulated gap | 1,245,888 | 1,069,215 | (576,722 | ) | 4,659,437 | 3,496,562 | 1,373,651 | 1,916,632 | 1,707,061 | 6,238,841 | 4,027,606 | |||||||||||||||||||||||||||||||||||||
|
|
|
|
|
|
|
|
|
| |||||||||||||||||||||||||||||||||||||||
Percentage (%) | 9.64 | 8.28 | (4.46 | ) | 36.06 | 27.06 | 10.48 | 14.62 | 13.02 | 47.59 | 30.72 | |||||||||||||||||||||||||||||||||||||
Interest-bearing assets in Korean won Interest-bearing liabilities in Korean won Gap Accumulated gap Percentage (%) 2013 Up to
3 months 3~6
months 6~12
months 1~3
years Over
3 years Total (In millions of Korean won) ₩ 3,951,261 ₩ 1,212,736 ₩ 1,600,360 ₩ 5,010,999 ₩ 3,108,753 ₩ 14,884,109 940,000 782,765 1,868,825 4,704,000 2,190,000 10,485,590 ₩ 3,011,261 ₩ 429,971 ₩ (268,465 ) ₩ 306,999 ₩ 918,753 ₩ 4,398,519 3,011,261 3,441,232 3,172,767 3,479,766 4,398,519 20.23 23.12 21.32 23.38 29.55
KB Investment & Securities Co., Ltd.
| As of January 1, 2010 | ||||||||||||||||||||||||
| Up to 3 months | 3~6 months | 6~12 months | 1~3 years | Over 3 years | Total | |||||||||||||||||||
| (In millions of Korean won) | ||||||||||||||||||||||||
Interest-bearing assets in Korean won | (Won) | 304,088 | (Won) | 20,000 | (Won) | 33,016 | (Won) | 5,200 | (Won) | 987 | (Won) | 363,291 | ||||||||||||
Interest-bearing liabilities in Korean won | 276,598 | — | 20,000 | 99,276 | 100,000 | 495,874 | ||||||||||||||||||
|
|
|
|
|
|
|
|
|
|
|
| |||||||||||||
Gap | (Won) | 27,490 | (Won) | 20,000 | (Won) | 13,016 | (Won) | (94,076 | ) | (Won) | (99,013 | ) | (Won) | (132,583 | ) | |||||||||
|
|
|
|
|
|
|
|
|
| |||||||||||||||
Accumulated gap | 27,490 | 47,490 | 60,506 | (33,570 | ) | (132,583 | ) | |||||||||||||||||
|
|
|
|
|
|
|
|
|
| |||||||||||||||
Percentage (%) | 7.57 | 13.07 | 16.65 | (9.24 | ) | (36.49 | ) | |||||||||||||||||
Interest-bearing assets in foreign currencies | (Won) | 245 | (Won) | — | (Won) | — | (Won) | — | (Won) | — | (Won) | 245 | ||||||||||||
Interest-bearing liabilities in foreign currencies | — | — | — | — | — | — | ||||||||||||||||||
|
|
|
|
|
|
|
|
|
|
|
| |||||||||||||
Gap | (Won) | 245 | (Won) | — | (Won) | — | (Won) | — | (Won) | — | (Won) | 245 | ||||||||||||
|
|
|
|
|
|
|
|
|
| |||||||||||||||
Accumulated gap | 245 | 245 | 245 | 245 | 245 | |||||||||||||||||||
|
|
|
|
|
|
|
|
|
| |||||||||||||||
Percentage (%) | 100.00 | 100.00 | 100.00 | 100.00 | 100.00 | |||||||||||||||||||
| As of December 31, 2010 | ||||||||||||||||||||||||
| Up to 3 months | 3~6 months | 6~12 months | 1~3 years | Over 3 years | Total | |||||||||||||||||||
| (In millions of Korean won) | ||||||||||||||||||||||||
Interest-bearing assets in Korean won | (Won) | 477,433 | (Won) | 5,000 | (Won) | 20,000 | (Won) | — | (Won) | 1,234 | (Won) | 503,667 | ||||||||||||
Interest-bearing liabilities in Korean won | 400,069 | — | — | 99,276 | 100,000 | 599,345 | ||||||||||||||||||
|
|
|
|
|
|
|
|
|
|
|
| |||||||||||||
Gap | (Won) | 77,364 | (Won) | 5,000 | (Won) | 20,000 | (Won) | (99,276 | ) | (Won) | (98,766 | ) | (Won) | (95,678 | ) | |||||||||
|
|
|
|
|
|
|
|
|
| |||||||||||||||
Accumulated gap | 77,364 | 82,364 | 102,364 | 3,088 | (95,678 | ) | ||||||||||||||||||
|
|
|
|
|
|
|
|
|
| |||||||||||||||
Percentage (%) | 15.36 | 16.35 | 20.32 | 0.61 | (19.00 | ) | ||||||||||||||||||
| As of December 31, 2011 | 2012 | |||||||||||||||||||||||||||||||||||||||||||||||
| Up to 3 months | 3~6 months | 6~12 months | 1~3 years | Over 3 years | Total | Up to 3 months | 3~6 months | 6~12 months | 1~3 years | Over 3 years | Total | |||||||||||||||||||||||||||||||||||||
| (In millions of Korean won) | (In millions of Korean won) | |||||||||||||||||||||||||||||||||||||||||||||||
Interest-bearing assets in Korean won | (Won) | 599,877 | (Won) | 103,522 | (Won) | 108,031 | (Won) | 10,002 | (Won) | 2,517 | (Won) | 823,949 | ₩ | 342,543 | ₩ | 75,000 | ₩ | 66,032 | ₩ | 100,000 | ₩ | 2,291 | ₩ | 585,866 | ||||||||||||||||||||||||
Interest-bearing liabilities in Korean won | 482,001 | 70,000 | — | 49,470 | — | 601,471 | 339,444 | 30,000 | 100,000 | — | — | 469,444 | ||||||||||||||||||||||||||||||||||||
|
|
|
|
|
|
|
|
|
|
|
| |||||||||||||||||||||||||||||||||||||
Gap | (Won) | 117,876 | (Won) | 33,522 | (Won) | 108,031 | (Won) | (39,468 | ) | (Won) | 2,517 | (Won) | 222,478 | ₩ | 3,099 | ₩ | 45,000 | ₩ | (33,968 | ) | ₩ | 100,000 | ₩ | 2,291 | ₩ | 116,422 | ||||||||||||||||||||||
|
|
|
|
|
|
|
|
|
| |||||||||||||||||||||||||||||||||||||||
Accumulated gap | 117,876 | 151,398 | 259,429 | 219,961 | 222,478 | 3,099 | 48,099 | 14,131 | 114,131 | 116,422 | ||||||||||||||||||||||||||||||||||||||
|
|
|
|
|
|
|
|
|
| |||||||||||||||||||||||||||||||||||||||
Percentage (%) | 14.31 | 18.37 | 31.49 | 26.70 | 27.00 | 0.53 | 8.21 | 2.41 | 19.48 | 19.87 | ||||||||||||||||||||||||||||||||||||||
Interest-bearing assets in foreign | (Won) | 2,068 | (Won) | — | (Won) | — | (Won) | — | (Won) | — | (Won) | 2,068 | ₩ | 2,263 | ₩ | — | ₩ | — | ₩ | — | ₩ | — | ₩ | 2,263 | ||||||||||||||||||||||||
Interest-bearing liabilities in foreign currencies | — | — | — | — | — | — | — | — | — | — | — | — | ||||||||||||||||||||||||||||||||||||
|
|
|
|
|
|
|
|
|
|
|
| |||||||||||||||||||||||||||||||||||||
Gap | (Won) | 2,068 | (Won) | — | (Won) | — | (Won) | — | (Won) | — | (Won) | 2,068 | ₩ | 2,263 | ₩ | — | ₩ | — | ₩ | — | ₩ | — | ₩ | 2,263 | ||||||||||||||||||||||||
|
|
|
|
|
|
|
|
|
| |||||||||||||||||||||||||||||||||||||||
Accumulated gap | 2,068 | 2,068 | 2,068 | 2,068 | 2,068 | 2,263 | 2,263 | 2,263 | 2,263 | 2,263 | ||||||||||||||||||||||||||||||||||||||
|
|
|
|
|
|
|
|
|
| |||||||||||||||||||||||||||||||||||||||
Percentage (%) | 100.00 | 100.00 | 100.00 | 100.00 | 100.00 | 100.00 | 100.00 | 100.00 | 100.00 | 100.00 | ||||||||||||||||||||||||||||||||||||||
Interest-bearing assets in Korean won Interest-bearing liabilities in Korean won Gap Accumulated gap Percentage (%) Interest-bearing assets in foreign currencies Interest-bearing liabilities in foreign currencies Gap Accumulated gap Percentage (%) 2013 Up to
3 months 3~6
months 6~12
months 1~3
years Over
3 years Total (In millions of Korean won) ₩ 491,652 ₩ 14,000 ₩ 227,542 ₩ 169,990 ₩ 1,823 ₩ 905,007 516,734 160,000 10,000 32,000 — 718,734 ₩ (25,082 ) ₩ (146,000 ) ₩ 217,542 ₩ 137,990 ₩ 1,823 ₩ 186,273 (25,082 ) (171,082 ) 46,460 184,450 186,273 (2.77 ) (18.90 ) 5.13 20.38 20.58 ₩ 66,576 ₩ 6,162 ₩ 56,558 ₩ — ₩ — ₩ 129,296 — — — — — — ₩ 66,576 ₩ 6,162 ₩ 56,558 ₩ — ₩ — ₩ 129,296 66,576 72,738 129,296 129,296 129,296 51.49 56.26 100.00 100.00 100.00
KB Life Insurance Co., Ltd.
| As of January 1, 2010 | 2012 | |||||||||||||||||||||||||||||||||||||||||||||||
| Up to 3 months | 3~6 months | 6~12 months | 1~3 years | Over 3 years | Total | Up to 3 months | 3~6 months | 6~12 months | 1~3 years | Over 3 years | Total | |||||||||||||||||||||||||||||||||||||
| (In millions of Korean won) | (In millions of Korean won) | |||||||||||||||||||||||||||||||||||||||||||||||
Interest-bearing assets in Korean | (Won) | 72,732 | (Won) | 155,226 | (Won) | 152,597 | (Won) | 398,147 | (Won) | 1,234,801 | (Won) | 2,013,503 | ₩ | 133,084 | ₩ | 100,088 | ₩ | 640,829 | ₩ | 1,106,126 | ₩ | 2,482,444 | ₩ | 4,462,571 | ||||||||||||||||||||||||
Interest-bearing liabilities in Korean won | 39,080 | 1,418,690 | 29,671 | 41,572 | 518,502 | 2,047,515 | 24,616 | 67,092 | 4,131,620 | 20,525 | 531,472 | 4,775,325 | ||||||||||||||||||||||||||||||||||||
|
|
|
|
|
|
|
|
|
|
|
| |||||||||||||||||||||||||||||||||||||
Gap | (Won) | 33,652 | (Won) | (1,263,464 | ) | (Won) | 122,926 | (Won) | 356,575 | (Won) | 716,299 | (Won) | (34,012 | ) | ₩ | 108,468 | ₩ | 32,996 | ₩ | (3,490,791 | ) | ₩ | 1,085,601 | ₩ | 1,950,972 | ₩ | (312,754 | ) | ||||||||||||||||||||
|
|
|
|
|
|
|
|
|
| |||||||||||||||||||||||||||||||||||||||
Accumulated gap | 33,652 | (1,229,812 | ) | (1,106,886 | ) | (750,311 | ) | (34,012 | ) | 108,468 | 141,464 | (3,349,327 | ) | (2,263,726 | ) | (312,754 | ) | |||||||||||||||||||||||||||||||
|
|
|
|
|
|
|
|
|
| |||||||||||||||||||||||||||||||||||||||
Percentage (%) | 1.67 | (61.08 | ) | (54.97 | ) | (37.26 | ) | (1.69 | ) | 2.43 | 3.17 | (75.05 | ) | (50.73 | ) | (7.01 | ) | |||||||||||||||||||||||||||||||
| As of December 31, 2010 | ||||||||||||||||||||||||
| Up to 3 months | 3~6 months | 6~12 months | 1~3 years | Over 3 years | Total | |||||||||||||||||||
| (In millions of Korean won) | ||||||||||||||||||||||||
Interest-bearing assets in Korean won | (Won) | 10,320 | (Won) | 195,855 | (Won) | 267,798 | (Won) | 615,120 | (Won) | 1,702,990 | (Won) | 2,792,083 | ||||||||||||
Interest-bearing liabilities in Korean won | 39,000 | 542,800 | 1,663,500 | 39,700 | 571,500 | 2,856,500 | ||||||||||||||||||
|
|
|
|
|
|
|
|
|
|
|
| |||||||||||||
Gap | (Won) | (28,680 | ) | (Won) | (346,945 | ) | (Won) | (1,395,702 | ) | (Won) | 575,420 | (Won) | 1,131,490 | (Won) | (64,417 | ) | ||||||||
|
|
|
|
|
|
|
|
|
| |||||||||||||||
Accumulated gap | (28,680 | ) | (375,625 | ) | (1,771,327 | ) | (1,195,907 | ) | (64,417 | ) | ||||||||||||||
|
|
|
|
|
|
|
|
|
| |||||||||||||||
Percentage (%) | (1.03 | ) | (13.45 | ) | (63.44 | ) | (42.83 | ) | (2.31 | ) | ||||||||||||||
| As of December 31, 2011 | 2013 | |||||||||||||||||||||||||||||||||||||||||||||||
| Up to 3 months | 3~6 months | 6~12 months | 1~3 years | Over 3 years | Total | Up to 3 months | 3~6 months | 6~12 months | 1~3 years | Over 3 years | Total | |||||||||||||||||||||||||||||||||||||
| (In millions of Korean won) | (In millions of Korean won) | |||||||||||||||||||||||||||||||||||||||||||||||
Interest-bearing assets in Korean won | (Won) | 228,597 | (Won) | 137,620 | (Won) | 386,143 | (Won) | 820,641 | (Won) | 1,917,627 | (Won) | 3,490,628 | ₩ | 249,863 | ₩ | 187,377 | ₩ | 630,846 | ₩ | 1,314,773 | ₩ | 2,502,573 | ₩ | 4,885,432 | ||||||||||||||||||||||||
Interest-bearing liabilities in Korean won | 60,048 | 45,817 | 2,853,620 | 29,087 | 541,782 | 3,530,354 | 27,836 | 72,309 | 4,862,687 | 36,488 | 528,861 | 5,528,181 | ||||||||||||||||||||||||||||||||||||
|
|
|
|
|
|
|
|
|
|
|
| |||||||||||||||||||||||||||||||||||||
Gap | (Won) | 168,549 | (Won) | 91,803 | (Won) | (2,467,477 | ) | (Won) | 791,554 | (Won) | 1,375,845 | (Won) | (39,726 | ) | ₩ | 222,027 | ₩ | 115,068 | ₩ | (4,231,841 | ) | ₩ | 1,278,285 | ₩ | 1,973,712 | ₩ | (642,749 | ) | ||||||||||||||||||||
|
|
|
|
|
|
|
|
|
| |||||||||||||||||||||||||||||||||||||||
Accumulated gap | 168,549 | 260,352 | (2,207,125 | ) | (1,415,571 | ) | (39,726 | ) | 222,027 | 337,095 | (3,894,746 | ) | (2,616,461 | ) | (642,749 | ) | ||||||||||||||||||||||||||||||||
|
|
|
|
|
|
|
|
|
| |||||||||||||||||||||||||||||||||||||||
Percentage (%) | 4.83 | 7.46 | (63.23 | ) | (40.55 | ) | (1.14 | ) | 4.54 | 6.90 | (79.72 | ) | (53.56 | ) | (13.16 | ) | ||||||||||||||||||||||||||||||||
KB FuturesSavings Bank Co., Ltd.
| As of January 1, 2010 | 2012 | |||||||||||||||||||||||||||||||||||||||||||||||
| Up to 3 months | 3~6 months | 6~12 months | 1~3 years | Over 3 years | Total | Up to 3 months | 3~6 months | 6~12 months | 1~3 years | Over 3 years | Total | |||||||||||||||||||||||||||||||||||||
| (In millions of Korean won) | (In millions of Korean won) | |||||||||||||||||||||||||||||||||||||||||||||||
Interest-bearing assets in Korean won | (Won) | 171,903 | (Won) | 9,016 | (Won) | — | (Won) | 4,964 | (Won) | 2,878 | (Won) | 188,761 | ₩ | 251,570 | ₩ | 81,607 | ₩ | 90,543 | ₩ | 42,725 | ₩ | 180,729 | ₩ | 647,174 | ||||||||||||||||||||||||
Interest-bearing liabilities in Korean won | 161,634 | — | — | — | — | 161,634 | 90,061 | 96,665 | 280,717 | 26,750 | 2,788 | 496,981 | ||||||||||||||||||||||||||||||||||||
|
|
|
|
|
|
|
|
|
|
|
| |||||||||||||||||||||||||||||||||||||
Gap | (Won) | 10,269 | (Won) | 9,016 | (Won) | — | (Won) | 4,964 | (Won) | 2,878 | (Won) | 27,127 | ₩ | 161,509 | ₩ | (15,058 | ) | ₩ | (190,174 | ) | ₩ | 15,975 | ₩ | 177,941 | ₩ | 150,193 | ||||||||||||||||||||||
|
|
|
|
|
|
|
|
|
| |||||||||||||||||||||||||||||||||||||||
Accumulated gap | 10,269 | 19,285 | 19,285 | 24,249 | 27,127 | 161,509 | 146,451 | (43,723 | ) | (27,748 | ) | 150,193 | ||||||||||||||||||||||||||||||||||||
|
|
|
|
|
|
|
|
|
| |||||||||||||||||||||||||||||||||||||||
Percentage (%) | 5.44 | 10.22 | 10.22 | 12.85 | 14.37 | 24.96 | 22.63 | (6.76 | ) | (4.29 | ) | 23.21 | ||||||||||||||||||||||||||||||||||||
Interest-bearing assets in foreign | (Won) | 19,574 | (Won) | — | (Won) | — | (Won) | — | (Won) | — | (Won) | 19,574 | ||||||||||||||||||||||||||||||||||||
Interest-bearing liabilities in foreign currencies | 18,599 | — | — | — | — | 18,599 | ||||||||||||||||||||||||||||||||||||||||||
|
|
|
|
|
| |||||||||||||||||||||||||||||||||||||||||||
Gap | (Won) | 975 | (Won) | — | (Won) | — | (Won) | — | (Won) | — | (Won) | 975 | ||||||||||||||||||||||||||||||||||||
|
|
|
|
| ||||||||||||||||||||||||||||||||||||||||||||
Accumulated gap | 975 | 975 | 975 | 975 | 975 | |||||||||||||||||||||||||||||||||||||||||||
|
|
|
|
| ||||||||||||||||||||||||||||||||||||||||||||
Percentage (%) | 4.98 | 4.98 | 4.98 | 4.98 | 4.98 | |||||||||||||||||||||||||||||||||||||||||||
| As of December 31, 2010 | 2013 | |||||||||||||||||||||||||||||||||||||||||||||||
| Up to 3 months | 3~6 months | 6~12 months | 1~3 years | Over 3 years | Total | Up to 3 months | 3~6 months | 6~12 months | 1~3 years | Over 3 years | Total | |||||||||||||||||||||||||||||||||||||
| (In millions of Korean won) | (In millions of Korean won) | |||||||||||||||||||||||||||||||||||||||||||||||
Interest-bearing assets in Korean won | (Won) | 136,511 | (Won) | 9,944 | (Won) | — | (Won) | — | (Won) | 2,738 | (Won) | 149,193 | ₩ | 160,377 | ₩ | 64,008 | ₩ | 90,405 | ₩ | 71,477 | ₩ | 43,765 | ₩ | 430,032 | ||||||||||||||||||||||||
Interest-bearing liabilities in Korean won | 118,013 | — | — | — | — | 118,013 | 88,608 | 108,965 | 212,012 | 26,693 | 1,271 | 437,549 | ||||||||||||||||||||||||||||||||||||
|
|
|
|
|
|
|
|
|
|
|
| |||||||||||||||||||||||||||||||||||||
Gap | (Won) | 18,498 | (Won) | 9,944 | (Won) | — | (Won) | — | (Won) | 2,738 | (Won) | 31,180 | ₩ | 71,769 | ₩ | (44,957 | ) | ₩ | (121,607 | ) | ₩ | 44,784 | ₩ | 42,494 | ₩ | (7,517 | ) | |||||||||||||||||||||
|
|
|
|
|
|
|
|
|
| |||||||||||||||||||||||||||||||||||||||
Accumulated gap | 18,498 | 28,442 | 28,442 | 28,442 | 31,180 | 71,769 | 26,812 | (94,795 | ) | (50,011 | ) | (7,517 | ) | |||||||||||||||||||||||||||||||||||
|
|
|
|
|
|
|
|
|
| |||||||||||||||||||||||||||||||||||||||
Percentage (%) | 12.40 | 19.06 | 19.06 | 19.06 | 20.90 | 16.69 | 6.23 | (22.04 | ) | (11.63 | ) | (1.75 | ) | |||||||||||||||||||||||||||||||||||
Interest-bearing assets in foreign | (Won) | 14,025 | (Won) | — | (Won) | — | (Won) | — | (Won) | — | (Won) | 14,025 | ||||||||||||||||||||||||||||||||||||
Interest-bearing liabilities in foreign currencies | 12,904 | — | — | — | — | 12,904 | ||||||||||||||||||||||||||||||||||||||||||
|
|
|
|
|
| |||||||||||||||||||||||||||||||||||||||||||
Gap | (Won) | 1,121 | (Won) | — | (Won) | — | (Won) | — | (Won) | — | (Won) | 1,121 | ||||||||||||||||||||||||||||||||||||
|
|
|
|
| ||||||||||||||||||||||||||||||||||||||||||||
Accumulated gap | 1,121 | 1,121 | 1,121 | 1,121 | 1,121 | |||||||||||||||||||||||||||||||||||||||||||
|
|
|
|
| ||||||||||||||||||||||||||||||||||||||||||||
Percentage (%) | 7.99 | 7.99 | 7.99 | 7.99 | 7.99 | |||||||||||||||||||||||||||||||||||||||||||
Yehansoul Savings Bank Co., Ltd.
| 2013 | ||||||||||||||||||||||||
| Up to 3 months | 3~6 months | 6~12 months | 1~3 years | Over 3 years | Total | |||||||||||||||||||
| (In millions of Korean won) | ||||||||||||||||||||||||
Interest-bearing assets in Korean won | ₩ | 109,603 | ₩ | 11,149 | ₩ | 1,881 | ₩ | 4,515 | ₩ | 23,659 | ₩ | 150,807 | ||||||||||||
Interest-bearing liabilities in Korean won | 60,126 | 48,336 | 42,739 | 6,008 | 111 | 157,320 | ||||||||||||||||||
|
|
|
|
|
|
|
|
|
|
|
| |||||||||||||
Gap | ₩ | 49,477 | ₩ | (37,187 | ) | ₩ | (40,858 | ) | ₩ | (1,493 | ) | ₩ | 23,548 | ₩ | (6,513 | ) | ||||||||
|
|
|
|
|
|
|
|
|
| |||||||||||||||
Accumulated gap | 49,477 | 12,290 | (28,568 | ) | (30,061 | ) | (6,513 | ) | ||||||||||||||||
|
|
|
|
|
|
|
|
|
| |||||||||||||||
Percentage (%) | 32.81 | 8.15 | (18.94 | ) | (19.93 | ) | (4.32 | ) | ||||||||||||||||
ii. Interest Rate VaR
Interest rate VaR is the maximum possible loss due to interest rate risk under a normal distribution at a 99.94% confidence level. The measurement results of risk as of January 1, 2010, and December 31, 20102012 and 2011,2013, are as follows:
| As of January 1, | As of December 31, | |||||||||||
| 2010 | 2010 | 2011 | ||||||||||
| (In millions of Korean won) | ||||||||||||
Kookmin Bank | (Won) | 2,126,748 | (Won) | 1,867,038 | (Won) | 847,865 | ||||||
KB Kookmin Card Co., Ltd | — | — | 124,681 | |||||||||
KB Investment & Securities Co., Ltd | 3,461 | 2,555 | 8,213 | |||||||||
KB Life Insurance Co., Ltd | 68,779 | 107,350 | 127,328 | |||||||||
KB Futures Co., Ltd | 570 | 425 | — | |||||||||
| 2012 | 2013 | |||||||
| (In millions of Korean won) | ||||||||
Kookmin Bank | ₩ | 177,418 | ₩ | 203,503 | ||||
KB Kookmin Card Co., Ltd. | 41,867 | 73,135 | ||||||
KB Investment & Securities Co., Ltd. | 5,525 | 7,503 | ||||||
KB Life Insurance Co., Ltd. | 156,474 | 168,542 | ||||||
KB Savings Bank Co., Ltd. | 2,224 | 3,870 | ||||||
Yehansoul Savings Bank Co., Ltd. | — | 1,604 | ||||||
4.4.4 Financial instruments in foreign currencies
Financial instruments in foreign currencies as of January 1, 2010, and December 31, 20102012 and 2011,2013, are as follows:
| As of January 1, 2010 | 2012 | |||||||||||||||||||||||||||||||||||||||||||||||||||||||
| USD | JPY | EUR | GBP | CNY | Others | Total | USD | JPY | EUR | GBP | CNY | Others | Total | |||||||||||||||||||||||||||||||||||||||||||
| (In millions of Korean won) | (In millions of Korean won) | |||||||||||||||||||||||||||||||||||||||||||||||||||||||
Financial assets | ||||||||||||||||||||||||||||||||||||||||||||||||||||||||
Financial Assets | ||||||||||||||||||||||||||||||||||||||||||||||||||||||||
Cash and due from financial institutions | (Won) | 681,449 | (Won) | 83,973 | (Won) | 69,585 | (Won) | 7,794 | (Won) | 11,697 | (Won) | 52,932 | (Won) | 907,430 | ₩ | 867,448 | ₩ | 162,793 | ₩ | 89,429 | ₩ | 13,544 | ₩ | 20,625 | ₩ | 82,967 | ₩ | 1,236,806 | ||||||||||||||||||||||||||||
Financial assets designated at fair value through profit or loss | 529 | — | — | — | — | — | 529 | |||||||||||||||||||||||||||||||||||||||||||||||||
Derivatives held for trading | 67,428 | 294 | 664 | — | — | — | 68,386 | 106,215 | 150 | 1,267 | — | — | — | 107,632 | ||||||||||||||||||||||||||||||||||||||||||
Derivatives held for hedging | 976 | — | — | — | — | — | 976 | 21,794 | — | — | — | — | — | 21,794 | ||||||||||||||||||||||||||||||||||||||||||
Loans | 7,356,674 | 2,230,296 | 605,111 | 23,553 | — | 204,174 | 10,419,808 | 9,185,177 | 2,185,242 | 528,812 | 139,134 | 883 | 169,483 | 12,208,731 | ||||||||||||||||||||||||||||||||||||||||||
Available-for-sale financial assets | 1,405,998 | 106,489 | 99,310 | 1,470 | — | 1,630 | 1,614,897 | 628,941 | 21,313 | 17,315 | 1,109 | — | 1,504 | 670,182 | ||||||||||||||||||||||||||||||||||||||||||
Held-to-maturity financial assets | 6,672 | — | — | — | — | — | 6,672 | 1 | — | — | — | — | — | 1 | ||||||||||||||||||||||||||||||||||||||||||
Other financial assets | 1,440,547 | 296,447 | 151,593 | 3,004 | — | 47,082 | 1,938,673 | 528,529 | 51,020 | 100,883 | 1,388 | — | 109,452 | 791,272 | ||||||||||||||||||||||||||||||||||||||||||
|
|
|
|
|
|
|
|
|
|
|
|
|
| |||||||||||||||||||||||||||||||||||||||||||
Total financial assets | (Won) | 10,960,273 | (Won) | 2,717,499 | (Won) | 926,263 | (Won) | 35,821 | (Won) | 11,697 | (Won) | 305,818 | (Won) | 14,957,371 | ₩ | 11,338,105 | ₩ | 2,420,518 | ₩ | 737,706 | ₩ | 155,175 | ₩ | 21,508 | ₩ | 363,406 | ₩ | 15,036,418 | ||||||||||||||||||||||||||||
|
|
|
|
|
|
|
|
|
|
|
|
|
| |||||||||||||||||||||||||||||||||||||||||||
Financial liabilities | ||||||||||||||||||||||||||||||||||||||||||||||||||||||||
Derivatives held for trading | (Won) | 358,766 | (Won) | 259 | (Won) | 3,492 | (Won) | — | (Won) | — | (Won) | 43,085 | (Won) | 405,602 | ₩ | 180,324 | ₩ | 177 | ₩ | 1,753 | ₩ | — | ₩ | — | ₩ | — | ₩ | 182,254 | ||||||||||||||||||||||||||||
Deposits | 2,897,094 | 320,938 | 199,345 | 15,062 | — | 192,763 | 3,625,202 | 3,767,148 | 611,386 | 210,837 | 17,243 | 2,793 | 290,124 | 4,899,531 | ||||||||||||||||||||||||||||||||||||||||||
Debts | 3,233,778 | 1,288,261 | 2,053,269 | 73,832 | — | 344,988 | 6,994,128 | 5,033,696 | 1,765,338 | 513,294 | 32,745 | 48 | 189,897 | 7,535,018 | ||||||||||||||||||||||||||||||||||||||||||
Debentures | 3,098,025 | 901,185 | 599,116 | — | — | 109,347 | 4,707,673 | 2,006,660 | 550,037 | 249,668 | — | — | 355,381 | 3,161,746 | ||||||||||||||||||||||||||||||||||||||||||
Other financial liabilities | 1,210,332 | 129,000 | 183,954 | 56,395 | — | 35,252 | 1,614,933 | 1,187,766 | 59,927 | 26,234 | 109,670 | 39 | 30,135 | 1,413,771 | ||||||||||||||||||||||||||||||||||||||||||
|
|
|
|
|
|
|
|
|
|
|
|
|
| |||||||||||||||||||||||||||||||||||||||||||
Total financial liabilities | (Won) | 10,797,995 | (Won) | 2,639,643 | (Won) | 3,039,176 | (Won) | 145,289 | (Won) | — | (Won) | 725,435 | (Won) | 17,347,538 | ₩ | 12,175,594 | ₩ | 2,986,865 | ₩ | 1,001,786 | ₩ | 159,658 | ₩ | 2,880 | ₩ | 865,537 | ₩ | 17,192,320 | ||||||||||||||||||||||||||||
|
|
|
|
|
|
|
|
|
|
|
|
|
| |||||||||||||||||||||||||||||||||||||||||||
Off-balance sheet items | (Won) | 129,077,140 | (Won) | 2,973,309 | (Won) | 8,968,186 | (Won) | 503,821 | (Won) | 9,314 | (Won) | 2,259,499 | (Won) | 143,791,269 | ₩ | 15,818,548 | ₩ | 4,537 | ₩ | 5,566 | ₩ | 4,760 | ₩ | — | ₩ | 7,980 | ₩ | 15,841,391 | ||||||||||||||||||||||||||||
| 2013 | ||||||||||||||||||||||||||||
| USD | JPY | EUR | GBP | CNY | Others | Total | ||||||||||||||||||||||
| (In millions of Korean won) | ||||||||||||||||||||||||||||
Financial Assets | ||||||||||||||||||||||||||||
Cash and due from financial institutions | ₩ | 1,324,563 | ₩ | 123,527 | ₩ | 87,765 | ₩ | 5,495 | ₩ | 130,290 | ₩ | 216,250 | ₩ | 1,887,890 | ||||||||||||||
Financial assets held for trading | 16,290 | — | — | — | — | — | 16,290 | |||||||||||||||||||||
Financial assets designated at fair value through profit or loss | 5,293 | — | — | — | — | — | 5,293 | |||||||||||||||||||||
Derivatives held for trading | 94,664 | — | 946 | — | — | — | 95,610 | |||||||||||||||||||||
Derivatives held for hedging | 16,094 | — | — | — | — | — | 16,094 | |||||||||||||||||||||
Loans | 10,061,929 | 1,235,187 | 381,415 | 51,677 | 456 | 190,827 | 11,921,491 | |||||||||||||||||||||
Available-for-sale financial assets | 777,081 | 10,052 | — | — | — | 3,747 | 790,880 | |||||||||||||||||||||
Other financial assets | 512,717 | 314,632 | 76,016 | 1,332 | — | 91,405 | 996,102 | |||||||||||||||||||||
|
|
|
|
|
|
|
|
|
|
|
|
|
| |||||||||||||||
Total financial assets | ₩ | 12,808,631 | ₩ | 1,683,398 | ₩ | 546,142 | ₩ | 58,504 | ₩ | 130,746 | ₩ | 502,229 | ₩ | 15,729,650 | ||||||||||||||
|
|
|
|
|
|
|
|
|
|
|
|
|
| |||||||||||||||
| As of December 31, 2010 | 2013 | |||||||||||||||||||||||||||||||||||||||||||||||||||||||
| USD | JPY | EUR | GBP | CNY | Others | Total | USD | JPY | EUR | GBP | CNY | Others | Total | |||||||||||||||||||||||||||||||||||||||||||
| (In millions of Korean won) | (In millions of Korean won) | |||||||||||||||||||||||||||||||||||||||||||||||||||||||
Financial assets | ||||||||||||||||||||||||||||||||||||||||||||||||||||||||
Cash and due from financial institutions | (Won) | 615,441 | (Won) | 112,474 | (Won) | 63,029 | (Won) | 9,210 | (Won) | 13,647 | (Won) | 59,996 | (Won) | 873,797 | ||||||||||||||||||||||||||||||||||||||||||
Financial assets designated at fair value through profit or loss | 139 | — | — | — | — | — | 139 | |||||||||||||||||||||||||||||||||||||||||||||||||
Derivatives held for trading | 74,064 | — | 631 | — | — | — | 74,695 | |||||||||||||||||||||||||||||||||||||||||||||||||
Loans | 7,509,125 | 2,549,529 | 630,402 | 17,595 | — | 270,953 | 10,977,604 | |||||||||||||||||||||||||||||||||||||||||||||||||
Available-for-sale financial assets | 1,310,058 | 48,343 | 19,273 | 1,359 | — | 1,694 | 1,380,727 | |||||||||||||||||||||||||||||||||||||||||||||||||
Held-to-maturity financial assets | 297 | — | — | — | — | — | 297 | |||||||||||||||||||||||||||||||||||||||||||||||||
Other financial assets | 688,988 | 49,642 | 182,249 | 53,083 | — | 47,258 | 1,021,220 | |||||||||||||||||||||||||||||||||||||||||||||||||
|
|
|
|
|
|
| ||||||||||||||||||||||||||||||||||||||||||||||||||
Total financial assets | (Won) | 10,198,112 | (Won) | 2,759,988 | (Won) | 895,584 | (Won) | 81,247 | (Won) | 13,647 | (Won) | 379,901 | (Won) | 14,328,479 | ||||||||||||||||||||||||||||||||||||||||||
|
|
|
|
|
|
| ||||||||||||||||||||||||||||||||||||||||||||||||||
Financial liabilities | ||||||||||||||||||||||||||||||||||||||||||||||||||||||||
Financial liabilities designated at fair value through profit or loss | ₩ | 5,287 | ₩ | — | ₩ | — | ₩ | — | ₩ | — | ₩ | — | ₩ | 5,287 | ||||||||||||||||||||||||||||||||||||||||||
Derivatives held for trading | (Won) | 255,631 | (Won) | — | (Won) | 2,522 | (Won) | — | (Won) | — | (Won) | — | (Won) | 258,153 | 127,308 | — | 1,333 | — | 15 | — | 128,656 | |||||||||||||||||||||||||||||||||||
Deposits | 1,924,129 | 569,837 | 172,955 | 12,236 | 2 | 168,916 | 2,848,075 | 3,914,192 | 515,595 | 150,713 | 15,816 | 10,905 | 280,863 | 4,888,084 | ||||||||||||||||||||||||||||||||||||||||||
Debts | 4,027,395 | 1,331,826 | 1,066,213 | 67,447 | — | 147,947 | 6,640,828 | 5,830,466 | 574,307 | 318,748 | 4,382 | 100,464 | 174,898 | 7,003,265 | ||||||||||||||||||||||||||||||||||||||||||
Debentures | 2,583,656 | 766,464 | 423,379 | — | — | 114,765 | 3,888,264 | 2,717,876 | 236,020 | 193,062 | — | — | 148,687 | 3,295,645 | ||||||||||||||||||||||||||||||||||||||||||
Other financial liabilities | 879,186 | 113,992 | 38,907 | 2,203 | 28 | 130,954 | 1,165,270 | 1,475,826 | 59,820 | 150,815 | 51,678 | 913 | 42,241 | 1,781,293 | ||||||||||||||||||||||||||||||||||||||||||
|
|
|
|
|
|
|
|
|
|
|
|
|
| |||||||||||||||||||||||||||||||||||||||||||
Total financial liabilities | (Won) | 9,669,997 | (Won) | 2,782,119 | (Won) | 1,703,976 | (Won) | 81,886 | (Won) | 30 | (Won) | 562,582 | (Won) | 14,800,590 | ₩ | 14,070,955 | ₩ | 1,385,742 | ₩ | 814,671 | ₩ | 71,876 | ₩ | 112,297 | ₩ | 646,689 | ₩ | 17,102,230 | ||||||||||||||||||||||||||||
|
|
|
|
|
|
|
|
|
|
|
|
|
| |||||||||||||||||||||||||||||||||||||||||||
Off-balance sheet items | (Won) | 120,271,523 | (Won) | 2,290,339 | (Won) | 6,870,863 | (Won) | 441,330 | (Won) | 13,770 | (Won) | 1,231,799 | (Won) | 131,119,624 | ₩ | 16,574,161 | ₩ | 3,486 | ₩ | 4,878 | ₩ | 4,787 | ₩ | 9,958 | ₩ | 60,221 | ₩ | 16,657,491 | ||||||||||||||||||||||||||||
| As of December 31, 2011 | ||||||||||||||||||||||||||||||||||||||||||||||||||||||||
| USD | JPY | EUR | GBP | CNY | Others | Total | ||||||||||||||||||||||||||||||||||||||||||||||||||
| (In millions of Korean won) | ||||||||||||||||||||||||||||||||||||||||||||||||||||||||
Financial assets | ||||||||||||||||||||||||||||||||||||||||||||||||||||||||
Cash and due from financial institutions | (Won) | 600,886 | (Won) | 112,395 | (Won) | 73,159 | (Won) | 12,571 | (Won) | 25,088 | (Won) | 72,379 | (Won) | 896,478 | ||||||||||||||||||||||||||||||||||||||||||
Derivatives held for trading | 89,851 | — | 1,027 | — | — | — | 90,878 | |||||||||||||||||||||||||||||||||||||||||||||||||
Derivatives held for hedging | 37,669 | — | — | — | — | — | 37,669 | |||||||||||||||||||||||||||||||||||||||||||||||||
Loans | 11,129,173 | 2,589,314 | 753,075 | 46,149 | 215 | 220,212 | 14,738,138 | |||||||||||||||||||||||||||||||||||||||||||||||||
Available-for-sale financial assets | 1,101,434 | 59,900 | 18,546 | 782 | — | 1,595 | 1,182,257 | |||||||||||||||||||||||||||||||||||||||||||||||||
Held-to-maturity financial assets | 158 | — | — | — | — | — | 158 | |||||||||||||||||||||||||||||||||||||||||||||||||
Other financial assets | 1,178,711 | 227,508 | 147,019 | 3,732 | — | 105,358 | 1,662,328 | |||||||||||||||||||||||||||||||||||||||||||||||||
|
|
|
|
|
|
| ||||||||||||||||||||||||||||||||||||||||||||||||||
Total financial assets | (Won) | 14,137,882 | (Won) | 2,989,117 | (Won) | 992,826 | (Won) | 63,234 | (Won) | 25,303 | (Won) | 399,544 | (Won) | 18,607,906 | ||||||||||||||||||||||||||||||||||||||||||
|
|
|
|
|
|
| ||||||||||||||||||||||||||||||||||||||||||||||||||
Financial liabilities | ||||||||||||||||||||||||||||||||||||||||||||||||||||||||
Derivatives held for trading | (Won) | 221,135 | (Won) | — | (Won) | 1,695 | (Won) | — | (Won) | — | (Won) | — | (Won) | 222,830 | ||||||||||||||||||||||||||||||||||||||||||
Derivatives held for hedging | 34 | — | — | — | — | — | 34 | |||||||||||||||||||||||||||||||||||||||||||||||||
Deposits | 3,318,285 | 598,055 | 164,087 | 11,959 | 231 | 256,987 | 4,349,604 | |||||||||||||||||||||||||||||||||||||||||||||||||
Debts | 6,554,932 | 1,987,560 | 839,649 | 4,261 | 217 | 236,713 | 9,623,332 | |||||||||||||||||||||||||||||||||||||||||||||||||
Debentures | 2,728,700 | 816,320 | 335,169 | — | — | 68,843 | 3,949,032 | |||||||||||||||||||||||||||||||||||||||||||||||||
Other financial liabilities | 866,202 | 132,752 | 22,765 | 50,604 | 18 | 27,360 | 1,099,701 | |||||||||||||||||||||||||||||||||||||||||||||||||
|
|
|
|
|
|
| ||||||||||||||||||||||||||||||||||||||||||||||||||
Total financial liabilities | (Won) | 13,689,288 | (Won) | 3,534,687 | (Won) | 1,363,365 | (Won) | 66,824 | (Won) | 466 | (Won) | 589,903 | (Won) | 19,244,533 | ||||||||||||||||||||||||||||||||||||||||||
|
|
|
|
|
|
| ||||||||||||||||||||||||||||||||||||||||||||||||||
Off-balance sheet items | (Won) | 125,595,251 | (Won) | 2,715,680 | (Won) | 3,082,112 | (Won) | 41,120 | (Won) | 10,772 | (Won) | 225,063 | (Won) | 131,669,998 | ||||||||||||||||||||||||||||||||||||||||||
4.5 Operational Risk
4.5.1 Concept
The Group defines operational risk broadly to include all financial and non financialnon-financial risks that may arise from operating activities and could cause a negative effect on capital.
4.5.2 Risk management
The purpose of operational risk management is not only to comply with supervisory and regulatory requirements but also to promote a risk management culture, strengthen internal controls, innovate processes and provide timely feedback to management and employees. In addition, Kookmin Bank established Business Continuity Plans (BCP) to ensure critical business functions can be maintained, or restored, in the event of material disruptions arising from internal or external events. It has constructed replacement facilities as well as has carried out exercise drills for head office and IT departments to test its BCPs.
4.6. Capital Adequacy
The Group complies with the capital adequacy standard established by the Financial Services Commission. The capital adequacy standard is based on Basel III published by Basel Committee on Banking Supervision in Bank of International Settlements in June 2011, and was implemented in Korea in December 2013. The Group is required to maintain a minimum Common Equity Tier 1 ratio of at least 3.5%, a minimum Tier 1 ratio of 4.5% and a minimum Total Regulatory Capital of 8.0% in December 2013.
The Group’s equity capital is classified into three categories in accordance with the Supervisory Regulations and Detailed Supervisory Regulations on Financial Holding Companies. :
Common Equity Tier 1 Capital: Common equity Tier 1 Capital represents the issued capital that takes the first and proportionately greatest share of any losses and represents the most subordinated claim in liquidation of the Group, and not repaid outside of liquidation. It includes common shares issued, capital surplus, retained earnings, non-controlling interests of consolidated subsidiaries, accumulated other comprehensive income, other capital surplus and others.
Additional Tier 1 Capital: Additional Tier 1 Capital includes (i) perpetual instruments issued by the Group that meet the criteria for inclusion in Additional Tier 1 capital, and (ii) stock surplus resulting from the issue of instruments included in Additional Tier 1 capital and others.
Tier 2 Capital: Tier 2 Capital represents the capital that takes the proportionate share of losses in the liquidation of the Group. Tier 2 Capital includes a fund raised by issuing subordinated debentures maturing in not less than 5 years that meet the criteria for inclusion in Additional Tier 2 capital, and the allowance for loan losses which are accumulated for assets classified as normal or precautionary as a result of classification of asset soundness in accordance with Regulation on Supervision of Financial Holding Companies and others.
Risk weighted asset means the inherent risks in the total assets held by the Group. The Group calculates risk weighted asset by each risk (credit risk, market risk, and operational risk) based on the Supervisory Regulations and Detailed Supervisory Regulations on Financial Holding Companies and uses it for BIS ratio calculation.
The Group assesses and monitors its adequacy of capital by using the Internal Rating Based Approach (the ‘IRBA’).internal assessment and management policy of the capital adequacy. The assessment of the capital adequacy is conducted by comparing available capital (actual amount of available capital) and economic capital (amount of capital enough to cover all significant risks under the target credit rate set by the Group). The Group monitors the soundness of finance and provides a risk adjusted basis for performance review.review using the assessment of the capital adequacy.
Economic Capital is the necessaryamount of capital to prevent the inability of payment due to unexpected loss in the future. The Group measures, allocates and monitors economic capital by risk type and subsidiaries.
The Risk Management Council of the Group determines the Group’s risk appetite and allocates economic capital by risk type and subsidiaries.subsidiary. Each subsidiary efficiently operates its capital within a range of allocated economic capital. The Risk Management Department of the Group monitors the limit on economic capital and reports the results to management and the Risk Management Council. The Group maintains the adequacy of capital through proactive review and approval of the Risk Management Committee when the economic capital is expected to exceed the limits due to new business or business expansion.
The Group is a financial holding company under the Financial Holding Companies Act. It must maintain a consolidated BIS ratio above 8% based on Basel I in accordance with the Supervisory Regulations and Detailed Supervisory Regulations on Financial Holding Companies.
The details of the Group’s consolidated BIS ratiocapital adequacy calculation in line with Basel III requirements as of January 1, 2010, and December 31, 2010 and 2011,2013, are as follows:
| As of January 1, | As of December 31, | |||||||||||
| 2010(1) | 2010(1) | 2011 | ||||||||||
| (In millions of Korean won) | ||||||||||||
Equity Capital | (Won) | 24,360,262 | (Won) | 23,948,343 | (Won) | 25,239,906 | ||||||
Tier I Capital | 17,500,648 | 17,714,236 | 19,544,271 | |||||||||
Tier II Capital | 6,859,614 | 6,234,107 | 5,695,635 | |||||||||
Risk-weighted assets | 182,664,075 | 183,077,983 | 192,812,547 | |||||||||
Credit risk | 178,955,500 | 178,727,946 | 187,851,397 | |||||||||
Market risk | 3,708,575 | 4,350,037 | 4,961,150 | |||||||||
Capital adequacy ratio (%) | 13.34 | 13.08 | 13.09 | |||||||||
Tier I Capital (%) | 9.58 | 9.68 | 10.14 | |||||||||
Tier II Capital (%) | 3.76 | 3.40 | 2.95 | |||||||||
| 2013 | ||||
| (In millions of Korean won) | ||||
Equity Capital | ₩27,296,535 | |||
Tier 1 Capital | 22,693,836 | |||
Common Equity Tier 1 Capital | 22,693,836 | |||
Additional Tier 1 Capital | — | |||
Tier 2 Capital | 4,602,699 | |||
Risk-weighted assets | 177,514,060 | |||
Credit risk(1) | 157,040,868 | |||
Market risk(2) | 5,122,146 | |||
Operational risk(3) | 15,351,046 | |||
Equity Capital (%) | 15.38 | |||
Tier 1 Capital (%) | 12.78 | |||
Common Equity Tier 1 Capital (%) | 12.78 | |||
| (1) |
|
| (2) | Market-risk weighted assets are measured using Standardized Approach. |
| (3) | Operational risk weighted assets are measured using the Basic Indicator Approach. |
The details of the Group’s capital adequacy calculation in line with Basel I requirements as of December 31, 2012, are as follows:
| 2012 | ||||
| (In millions of Korean won) | ||||
Equity Capital | ₩26,907,004 | |||
Tier 1 Capital | 20,595,885 | |||
Tier 2 Capital | 6,311,119 | |||
Risk-weighted assets | 193,510,143 | |||
Credit risk | 187,465,230 | |||
Market risk | 6,044,913 | |||
Equity Capital (%) | 13.90 | |||
Tier 1 Capital (%) | 10.64 | |||
Tier 2 Capital (%) | 3.26 | |||
5. Segment Information
5.1 Overall Segment Information and Business Segments
Operating segments are reported in a manner consistent with the internal reporting provided to the chief operating decision maker. As of December 31, 2011, theThe Group is organized into six majorthe following business segments: Corporate Banking, Retail Banking, Other Banking Service, Credit Card, Investment & Securities and Life Insurance.segments. These business segmentsdivisions are determined based on the nature of the products and services provided, the type or class of customers,customer, and the Group’s management organization.
Banking business | Corporate Banking | The activities within this segment include | ||
| related financial services to large, small-and medium-sized enterprises and SOHOs. | ||||
Retail Banking | The | |||
Other Banking | The | |||
| supporting activities. | ||||
Credit Card business | The | |||
| other supporting activities. | ||||
Investment & Securities business | The | |||
| services and other supporting activities. | ||||
Life Insurance business | The | |||
Financial information by business segment for the year ended December 31, 2011(1), is as follows:
| Banking business | ||||||||||||||||||||||||||||||||||||||||
| Corporate Banking | Retail Banking | Other Banking Services | Sub-total | Credit Card | Investment & Securities | Life Insurance | Others | Intra-group Adjustments | Total | |||||||||||||||||||||||||||||||
| (In millions of Korean won) | ||||||||||||||||||||||||||||||||||||||||
Operating revenues from external customers | ₩ | 2,287,249 | ₩ | 3,266,610 | ₩ | 1,634,596 | ₩ | 7,188,455 | ₩ | 1,401,669 | ₩ | 162,835 | ₩ | 114,616 | ₩ | (24,645 | ) | ₩ | — | ₩ | 8,842,930 | |||||||||||||||||||
Segment operating revenues (expenses) | (42,943 | ) | (54,409 | ) | 219,044 | 121,692 | (276,340 | ) | (2,323 | ) | (47,350 | ) | 187,416 | 16,905 | — | |||||||||||||||||||||||||
|
|
|
|
|
|
|
|
|
|
|
|
|
|
|
|
|
|
|
| |||||||||||||||||||||
Sub-total | ₩ | 2,244,306 | ₩ | 3,212,201 | ₩ | 1,853,640 | ₩ | 7,310,147 | ₩ | 1,125,329 | ₩ | 160,512 | ₩ | 67,266 | ₩ | 162,771 | ₩ | 16,905 | ₩ | 8,842,930 | ||||||||||||||||||||
| Net interest income | 2,559,260 | 2,779,467 | 674,268 | 6,012,995 | 901,487 | 13,256 | 161,717 | 17,220 | (2,163 | ) | 7,104,512 | |||||||||||||||||||||||||||||
Interest income | 5,107,821 | 5,723,486 | 1,528,099 | 12,359,406 | 1,381,384 | 42,221 | 161,793 | 65,679 | (54,226 | ) | 13,956,257 | |||||||||||||||||||||||||||||
Interest expense | (2,548,561 | ) | (2,944,019 | ) | (853,831 | ) | (6,346,411 | ) | (479,897 | ) | (28,965 | ) | (76 | ) | (48,459 | ) | 52,063 | (6,851,745 | ) | |||||||||||||||||||||
| Net fee and commission income | 242,581 | 634,916 | 503,186 | 1,380,683 | 241,571 | 83,130 | 45 | 96,071 | (6,750 | ) | 1,794,750 | |||||||||||||||||||||||||||||
Fee and commission income | 277,579 | 736,098 | 545,509 | 1,559,186 | 1,351,103 | 99,803 | 45 | 109,296 | (289,679 | ) | 2,829,754 | |||||||||||||||||||||||||||||
Fee and commission expense | (34,998 | ) | (101,182 | ) | (42,323 | ) | (178,503 | ) | (1,109,532 | ) | (16,673 | ) | — | (13,225 | ) | 282,929 | (1,035,004 | ) | ||||||||||||||||||||||
Net gains(losses) on financial assets/ liabilities at fair value through profit or loss | (2,205 | ) | (1,832 | ) | 993,680 | 989,643 | — | 50,209 | 68 | (4,050 | ) | (3 | ) | 1,035,867 | ||||||||||||||||||||||||||
Net other operating income(loss) | (555,330 | ) | (200,350 | ) | (317,494 | ) | (1,073,174 | ) | (17,729 | ) | 13,917 | (94,564 | ) | 53,530 | 25,821 | (1,092,199 | ) | |||||||||||||||||||||||
General and administrative expenses | (728,735 | ) | (1,757,907 | ) | (849,122 | ) | (3,335,764 | ) | (340,235 | ) | (117,503 | ) | (41,561 | ) | (112,771 | ) | 60,703 | (3,887,131 | ) | |||||||||||||||||||||
Operating profit before provision for credit losses | 1,515,571 | 1,454,294 | 1,004,518 | 3,974,383 | 785,094 | 43,009 | 25,705 | 50,000 | 77,608 | 4,955,799 | ||||||||||||||||||||||||||||||
Provision(reversal) for credit losses | (1,006,656 | ) | (302,261 | ) | 17,384 | (1,291,533 | ) | (206,566 | ) | (5,919 | ) | (1,241 | ) | (7,765 | ) | 45 | (1,512,979 | ) | ||||||||||||||||||||||
Net operating profit | 508,915 | 1,152,033 | 1,021,902 | 2,682,850 | 578,528 | 37,090 | 24,464 | 42,235 | 77,653 | 3,442,820 | ||||||||||||||||||||||||||||||
Share of profit of associates | — | — | 1,352 | 1,352 | — | 242 | — | 2,436 | 933 | 4,963 | ||||||||||||||||||||||||||||||
Net other non-operating revenue (expense) | 114,011 | 32,782 | (192,701 | ) | (45,908 | ) | (1,748 | ) | (2,579 | ) | (614 | ) | (85,139 | ) | (6,502 | ) | (142,490 | ) | ||||||||||||||||||||||
Segment profits before income tax | 622,926 | 1,184,815 | 830,553 | 2,638,294 | 576,780 | 34,753 | 23,850 | (40,468 | ) | 72,084 | 3,305,293 | |||||||||||||||||||||||||||||
Income tax expense | (158,322 | ) | (275,747 | ) | (249,628 | ) | (683,697 | ) | (131,515 | ) | (8,469 | ) | (5,282 | ) | (4,209 | ) | (11,400 | ) | (844,572 | ) | ||||||||||||||||||||
Profit for the year | 464,604 | 909,068 | 580,925 | 1,954,597 | 445,265 | 26,284 | 18,568 | (44,677 | ) | 60,684 | 2,460,721 | |||||||||||||||||||||||||||||
Profit attributable to Shareholders of the parent company | 464,604 | 909,068 | 579,583 | 1,953,255 | 445,265 | 26,284 | 18,569 | (44,677 | ) | 6,480 | 2,405,176 | |||||||||||||||||||||||||||||
Profit attributable to Non-controlling interests | — | — | 1,342 | 1,342 | — | — | (1 | ) | — | 54,204 | 55,545 | |||||||||||||||||||||||||||||
Total assets(2) | 92,399,053 | 102,545,488 | 61,567,719 | 256,512,260 | 13,349,351 | 3,336,353 | 4,515,809 | 19,499,234 | (19,612,190 | ) | 277,600,817 | |||||||||||||||||||||||||||||
Total liabilities(2) | 87,160,301 | 112,167,430 | 38,116,124 | 237,443,855 | 10,567,141 | 2,812,128 | 4,161,121 | 1,363,489 | (1,846,712 | ) | 254,501,022 | |||||||||||||||||||||||||||||
| (1) | Operating revenues by business segment for the year ended December 31, 2011, have been restated due to a retrospective application of the accounting policy. |
| (2) | Amounts before intra-group transaction adjustment. |
Financial information by business segment for the year ended December 31, 2012(1), is as follows:
| Banking business | ||||||||||||||||||||||||||||||||||||||||
| Corporate Banking | Retail Banking | Other Banking Services | Sub-total | Credit Card | Investment & Securities | Life Insurance | Others | Intra-group Adjustments | Total | |||||||||||||||||||||||||||||||
| (In millions of Korean won) | ||||||||||||||||||||||||||||||||||||||||
Operating revenues from external customers | ₩ | 1,952,464 | ₩ | 3,041,135 | ₩ | 1,297,400 | ₩ | 6,290,999 | ₩ | 1,286,719 | ₩ | 142,617 | ₩ | 131,188 | ₩ | 32,988 | ₩ | — | ₩ | 7,884,511 | ||||||||||||||||||||
Segment operating revenues (expenses) | 2,289 | (70,422 | ) | 300,356 | 232,223 | (238,094 | ) | 5,971 | (62,774 | ) | 201,566 | (138,892 | ) | — | ||||||||||||||||||||||||||
|
|
|
|
|
|
|
|
|
|
|
|
|
|
|
|
|
|
|
| |||||||||||||||||||||
Sub-total | ₩ | 1,954,753 | ₩ | 2,970,713 | ₩ | 1,597,756 | ₩ | 6,523,222 | ₩ | 1,048,625 | ₩ | 148,588 | ₩ | 68,414 | ₩ | 234,554 | ₩ | (138,892 | ) | ₩ | 7,884,511 | |||||||||||||||||||
Net interest income | 2,593,646 | 2,524,163 | 661,666 | 5,779,475 | 974,419 | 19,059 | 192,011 | 75,971 | (3,152 | ) | 7,037,783 | |||||||||||||||||||||||||||||
Interest income | 5,190,403 | 5,681,723 | 1,622,918 | 12,495,044 | 1,387,987 | 38,206 | 191,907 | 123,096 | (26,134 | ) | 14,210,106 | |||||||||||||||||||||||||||||
Interest expense | (2,596,757 | ) | (3,157,560 | ) | (961,252 | ) | (6,715,569 | ) | (413,568 | ) | (19,147 | ) | 104 | (47,125 | ) | 22,982 | (7,172,323 | ) | ||||||||||||||||||||||
Net fee and commission income | 232,981 | 696,311 | 324,120 | 1,253,412 | 157,788 | 85,610 | 211 | 96,899 | (27,214 | ) | 1,566,706 | |||||||||||||||||||||||||||||
Fee and commission income | 274,794 | 760,802 | 401,892 | 1,437,488 | 1,427,271 | 96,247 | 211 | 117,008 | (324,349 | ) | 2,753,876 | |||||||||||||||||||||||||||||
Fee and commission expense | (41,813 | ) | (64,491 | ) | (77,772 | ) | (184,076 | ) | (1,269,483 | ) | (10,637 | ) | — | (20,109 | ) | 297,135 | (1,187,170 | ) | ||||||||||||||||||||||
Net gains(losses) on financial assets/ liabilities at fair value through profit or loss | (501 | ) | (15,102 | ) | 756,103 | 740,500 | — | 39,137 | 7,703 | 24,617 | 7 | 811,964 | ||||||||||||||||||||||||||||
Net other operating income(loss) | (871,373 | ) | (234,659 | ) | (144,133 | ) | (1,250,165 | ) | (83,582 | ) | 4,782 | (131,511 | ) | 37,067 | (108,533 | ) | (1,531,942 | ) | ||||||||||||||||||||||
General and administrative expenses | (792,533 | ) | (1,672,741 | ) | (811,714 | ) | (3,276,988 | ) | (348,243 | ) | (117,861 | ) | (45,166 | ) | (133,069 | ) | 75,717 | (3,845,610 | ) | |||||||||||||||||||||
Operating profit before provision for credit losses | 1,162,220 | 1,297,972 | 786,042 | 3,246,234 | 700,382 | 30,727 | 23,248 | 101,485 | (63,175 | ) | 4,038,901 | |||||||||||||||||||||||||||||
Provision(reversal) for credit losses | (852,964 | ) | (392,354 | ) | (48,712 | ) | (1,294,030 | ) | (314,843 | ) | (3,244 | ) | (479 | ) | 5,842 | 51 | (1,606,703 | ) | ||||||||||||||||||||||
Net operating profit | 309,256 | 905,618 | 737,330 | 1,952,204 | 385,539 | 27,483 | 22,769 | 107,327 | (63,124 | ) | 2,432,198 | |||||||||||||||||||||||||||||
Share of profit of associates | — | — | (5,712 | ) | (5,712 | ) | — | — | — | (185 | ) | (9,385 | ) | (15,282 | ) | |||||||||||||||||||||||||
Net other non-operating revenue (expense) | 5,522 | — | (69,537 | ) | (64,015 | ) | (4,334 | ) | (2,987 | ) | (856 | ) | (44,177 | ) | (1,903 | ) | (118,272 | ) | ||||||||||||||||||||||
Segment profits before income tax | 314,778 | 905,618 | 662,081 | 1,882,477 | 381,205 | 24,496 | 21,913 | 62,965 | (74,412 | ) | 2,298,644 | |||||||||||||||||||||||||||||
Income tax expense | (76,854 | ) | (219,173 | ) | (146,327 | ) | (442,354 | ) | (90,464 | ) | (6,604 | ) | (5,268 | ) | (14,894 | ) | 1,073 | (558,511 | ) | |||||||||||||||||||||
Profit for the year | 237,924 | 686,445 | 515,754 | 1,440,123 | 290,741 | 17,892 | 16,645 | 48,071 | (73,339 | ) | 1,740,133 | |||||||||||||||||||||||||||||
Profit attributable to Shareholders of the parent company | 237,924 | 686,445 | 515,385 | 1,439,754 | 290,741 | 17,892 | 16,645 | 48,071 | (82,069 | ) | 1,731,034 | |||||||||||||||||||||||||||||
Profit attributable to Non-controlling interests | — | — | 369 | 369 | — | — | — | — | 8,730 | 9,099 | ||||||||||||||||||||||||||||||
Total assets(2) | 93,143,686 | 100,591,642 | 67,311,525 | 261,046,853 | 14,046,174 | 3,314,907 | 5,987,928 | 21,072,698 | (19,717,506 | ) | 285,751,054 | |||||||||||||||||||||||||||||
Total liabilities(2) | 84,489,904 | 115,521,270 | 41,018,121 | 241,029,295 | 10,966,541 | 2,769,160 | 5,594,727 | 1,097,595 | (469,405 | ) | 260,987,913 | |||||||||||||||||||||||||||||
| (1) | Operating revenues by business segment for the year ended December 31, 2012, have been restated due to a retrospective application of the accounting policy. |
| (2) | Amounts before intra-group transaction adjustment. |
Financial information by business segment for the year ended December 31, 2010,2013, is as follows:
| Banking business | ||||||||||||||||||||||||||||||||||||
| Corporate Banking | Retail Banking | Other Banking Services | Credit Card | Investment & Securities | Life Insurance | Others(1) | Intra-group Adjustments | Total | ||||||||||||||||||||||||||||
| (In millions of Korean won) | ||||||||||||||||||||||||||||||||||||
Segment profits (losses) before income tax | (Won) | (888,123 | ) | (Won) | 582,190 | (Won) | (654,957 | ) | (Won) | 1,010,203 | (Won) | 52,558 | (Won) | 23,510 | (Won) | 92,519 | (Won) | (68,532 | ) | (Won) | 149,368 | |||||||||||||||
The following are included in the segment profits (losses): | ||||||||||||||||||||||||||||||||||||
Operating revenues from external customers | (Won) | 2,362,913 | (Won) | 2,994,303 | (Won) | 637,061 | (Won) | 1,361,255 | (Won) | 138,042 | (Won) | 116,110 | (Won) | 16,299 | (Won) | — | (Won) | 7,625,983 | ||||||||||||||||||
Inter-segment operating revenues | (8,539 | ) | — | (36,645 | ) | — | (2,459 | ) | (56,219 | ) | 126,250 | (22,388 | ) | — | ||||||||||||||||||||||
|
|
|
|
|
|
|
|
|
|
|
|
|
|
|
|
|
| |||||||||||||||||||
Sub-total | (Won) | 2,354,374 | (Won) | 2,994,303 | (Won) | 600,416 | (Won) | 1,361,255 | (Won) | 135,583 | (Won) | 59,891 | (Won) | 142,549 | (Won) | (22,388 | ) | (Won) | 7,625,983 | |||||||||||||||||
Net interest income | 2,551,563 | 2,353,548 | 277,809 | 840,583 | 4,376 | 127,535 | 19,393 | (1,003 | ) | 6,173,804 | ||||||||||||||||||||||||||
Net fee and commission income | 279,589 | 646,906 | 73,931 | 588,731 | 52,168 | 80 | 91,822 | (28,513 | ) | 1,704,714 | ||||||||||||||||||||||||||
Gains (losses) from financial assets at fair value through profit or loss | (3,678 | ) | (104,017 | ) | 845,477 | — | 72,442 | 2,987 | 1,597 | — | 814,808 | |||||||||||||||||||||||||
Net other operating income | (473,100 | ) | 97,866 | (596,801 | ) | (68,059 | ) | 6,597 | (70,711 | ) | 29,737 | 7,128 | (1,067,343 | ) | ||||||||||||||||||||||
Provision for credit losses | (2,393,092 | ) | (263,592 | ) | (66,357 | ) | (129,267 | ) | 2,183 | (308 | ) | (20,960 | ) | (24 | ) | (2,871,417 | ) | |||||||||||||||||||
Depreciation and amortization | (51,812 | ) | (146,939 | ) | (122,177 | ) | (12,380 | ) | (6,453 | ) | (3,950 | ) | (4,703 | ) | 722 | (347,692 | ) | |||||||||||||||||||
Share of profit of associates and joint ventures | — | — | (208,503 | ) | — | — | — | (260 | ) | (1,831 | ) | (210,594 | ) | |||||||||||||||||||||||
Financial information by business segment for the year ended December 31, 2011, follows:
| Banking business | ||||||||||||||||||||||||||||||||||||
| Corporate Banking | Retail Banking | Other Banking Services | Credit Card | Investment & Securities | Life Insurance | Others(1) | Intra-group Adjustments | Total | ||||||||||||||||||||||||||||
| (In millions of Korean won) | ||||||||||||||||||||||||||||||||||||
Segment profits (losses) before income tax | (Won) | 622,926 | (Won) | 1,184,815 | (Won) | 793,620 | (Won) | 571,250 | (Won) | 37,372 | (Won) | 23,855 | (Won) | (42,075 | ) | (Won) | 69,043 | (Won) | 3,260,806 | |||||||||||||||||
The following are included in the segment profits (losses): | ||||||||||||||||||||||||||||||||||||
Operating revenues from external customers | (Won) | 2,287,249 | (Won) | 3,266,610 | (Won) | 1,633,577 | (Won) | 1,402,352 | (Won) | 162,835 | (Won) | 114,616 | (Won) | (24,119 | ) | (Won) | — | (Won) | 8,843,120 | |||||||||||||||||
Inter-segment operating revenues | (42,943 | ) | (54,409 | ) | 220,063 | (277,024 | ) | (2,323 | ) | (47,350 | ) | 187,079 | 16,907 | — | ||||||||||||||||||||||
|
|
|
|
|
|
|
|
|
|
|
|
|
|
|
|
|
| |||||||||||||||||||
Sub-total | (Won) | 2,244,306 | (Won) | 3,212,201 | (Won) | 1,853,640 | (Won) | 1,125,328 | (Won) | 160,512 | (Won) | 67,266 | (Won) | 162,960 | (Won) | 16,907 | (Won) | 8,843,120 | ||||||||||||||||||
Net interest income | 2,559,260 | 2,779,467 | 674,268 | 901,486 | 13,256 | 161,717 | 17,221 | (2,163 | ) | 7,104,512 | ||||||||||||||||||||||||||
Net fee and commission income | 242,581 | 634,916 | 503,186 | 241,571 | 83,130 | 45 | 96,070 | (6,749 | ) | 1,794,750 | ||||||||||||||||||||||||||
Gains (losses) from financial assets at fair value through profit or loss | (2,205 | ) | (1,832 | ) | 993,680 | — | 50,209 | 68 | (4,050 | ) | (3 | ) | 1,035,867 | |||||||||||||||||||||||
Net other operating income | (555,330 | ) | (200,350 | ) | (317,494 | ) | (17,729 | ) | 13,917 | (94,564 | ) | 53,719 | 25,822 | (1,092,009 | ) | |||||||||||||||||||||
Provision for credit losses | (1,006,656 | ) | (302,261 | ) | 17,384 | (206,566 | ) | (5,919 | ) | (1,241 | ) | (7,766 | ) | 47 | (1,512,978 | ) | ||||||||||||||||||||
Depreciation and amortization | (38,017 | ) | (112,277 | ) | (145,340 | ) | (35,873 | ) | (6,055 | ) | (4,306 | ) | (3,478 | ) | 2,853 | (342,493 | ) | |||||||||||||||||||
Share of profit of associates and joint ventures | — | — | 1,352 | — | 242 | — | 2,436 | 933 | 4,963 | |||||||||||||||||||||||||||
| Banking business | ||||||||||||||||||||||||||||||||||||||||
| Corporate Banking | Retail Banking | Other Banking Services | Sub-total | Credit Card | Investment & Securities | Life Insurance | Others | Intra-group Adjustments | Total | |||||||||||||||||||||||||||||||
| (In millions of Korean won) | ||||||||||||||||||||||||||||||||||||||||
Operating revenues from external customers | ₩ | 1,731,770 | ₩ | 2,453,683 | ₩ | 1,486,647 | ₩ | 5,672,100 | ₩ | 1,420,937 | ₩ | 115,054 | ₩ | 102,226 | ₩ | 143,811 | ₩ | — | ₩ | 7,454,128 | ||||||||||||||||||||
Segment operating revenues (expenses) | 4,945 | (91,800 | ) | 314,854 | 227,999 | (218,231 | ) | 5,180 | (38,327 | ) | 124,281 | (100,902 | ) | — | ||||||||||||||||||||||||||
|
|
|
|
|
|
|
|
|
|
|
|
|
|
|
|
|
|
|
| |||||||||||||||||||||
Sub-total | ₩ | 1,736,715 | ₩ | 2,361,883 | ₩ | 1,801,501 | ₩ | 5,900,099 | ₩ | 1,202,706 | ₩ | 120,234 | ₩ | 63,899 | ₩ | 268,092 | ₩ | (100,902 | ) | ₩ | 7,454,128 | |||||||||||||||||||
Net interest income | 2,550,728 | 2,012,661 | 596,851 | 5,160,240 | 1,057,046 | 23,985 | 200,422 | 80,694 | 445 | 6,522,832 | ||||||||||||||||||||||||||||||
Interest income | 4,390,623 | 4,785,526 | 1,419,231 | 10,595,380 | 1,435,952 | 40,567 | 200,422 | 106,336 | (21,727 | ) | 12,356,930 | |||||||||||||||||||||||||||||
Interest expense | (1,839,895 | ) | (2,772,865 | ) | (822,380 | ) | (5,435,140 | ) | (378,906 | ) | (16,582 | ) | — | (25,642 | ) | 22,172 | (5,834,098 | ) | ||||||||||||||||||||||
Net fee and commission income | 240,698 | 612,165 | 251,881 | 1,104,744 | 184,679 | 75,796 | 109 | 118,136 | (4,225 | ) | 1,479,239 | |||||||||||||||||||||||||||||
Fee and commission income | 282,403 | 674,250 | 324,997 | 1,281,650 | 1,406,239 | 84,168 | 109 | 137,796 | (252,597 | ) | 2,657,365 | |||||||||||||||||||||||||||||
Fee and commission expense | (41,705 | ) | (62,085 | ) | (73,116 | ) | (176,906 | ) | (1,221,560 | ) | (8,372 | ) | — | (19,660 | ) | 248,372 | (1,178,126 | ) | ||||||||||||||||||||||
Net gains(losses) on financial assets/ liabilities at fair value through profit or loss | 184 | (1,804 | ) | 692,121 | 690,501 | — | 19,422 | 18,051 | 28,898 | (50 | ) | 756,822 | ||||||||||||||||||||||||||||
Net other operating income(loss) | (1,054,895 | ) | (261,139 | ) | 260,648 | (1,055,386 | ) | (39,019 | ) | 1,031 | (154,683 | ) | 40,364 | (97,072 | ) | (1,304,765 | ) | |||||||||||||||||||||||
General and administrative expenses | (821,503 | ) | (1,739,768 | ) | (835,517 | ) | (3,396,788 | ) | (354,392 | ) | (96,345 | ) | (50,692 | ) | (141,668 | ) | 56,321 | (3,983,564 | ) | |||||||||||||||||||||
Operating profit before provision for credit losses | 915,212 | 622,115 | 965,984 | 2,503,311 | 848,314 | 23,889 | 13,207 | 126,424 | (44,581 | ) | 3,470,564 | |||||||||||||||||||||||||||||
Provision(reversal) for credit losses | (706,464 | ) | (358,150 | ) | (575 | ) | (1,065,189 | ) | (344,555 | ) | (5,425 | ) | (526 | ) | (28,235 | ) | 358 | (1,443,572 | ) | |||||||||||||||||||||
Net operating profit | 208,748 | 263,965 | 965,409 | 1,438,122 | 503,759 | 18,464 | 12,681 | 98,189 | (44,223 | ) | 2,026,992 | |||||||||||||||||||||||||||||
Share of profit of associates | — | — | (202,880 | ) | (202,880 | ) | — | 7 | — | (38,134 | ) | 41,615 | (199,392 | ) | ||||||||||||||||||||||||||
Net other non-operating revenue (expense) | 1,662 | — | (25,293 | ) | (23,631 | ) | (1,652 | ) | (1,728 | ) | (791 | ) | 31,256 | (15,763 | ) | (12,309 | ) | |||||||||||||||||||||||
Segment profits before income tax | 210,410 | 263,965 | 737,236 | 1,211,611 | 502,107 | 16,743 | 11,890 | 91,311 | (18,371 | ) | 1,815,291 | |||||||||||||||||||||||||||||
Income tax expense | (53,195 | ) | (86,283 | ) | (252,414 | ) | (391,892 | ) | (117,696 | ) | (4,887 | ) | (2,792 | ) | (30,021 | ) | (4,298 | ) | (551,586 | ) | ||||||||||||||||||||
Profit for the year | 157,215 | 177,682 | 484,822 | 819,719 | 384,411 | 11,856 | 9,098 | 61,290 | (22,669 | ) | 1,263,705 | |||||||||||||||||||||||||||||
Profit attributable to Shareholders of the parent company | 157,215 | 177,682 | 484,738 | 819,635 | 384,411 | 11,856 | 9,098 | 61,290 | (25,781 | ) | 1,260,509 | |||||||||||||||||||||||||||||
Profit attributable to Non-controlling interests | — | — | 84 | 84 | — | — | — | — | 3,112 | 3,196 | ||||||||||||||||||||||||||||||
Total assets(1) | 92,498,513 | 103,202,391 | 69,558,038 | 265,258,942 | 15,854,992 | 2,525,070 | 6,945,605 | 21,504,989 | (20,251,443 | ) | 291,838,155 | |||||||||||||||||||||||||||||
Total liabilities(1) | 81,008,201 | 122,206,712 | 41,426,715 | 244,641,628 | 12,385,131 | 1,973,888 | 6,396,477 | 1,414,111 | (625,911 | ) | 266,185,324 | |||||||||||||||||||||||||||||
| (1) |
|
5.2 Product & Services and Geographical Segments
5.2.1 Product and Services information
Operating revenues from external customers by product and services for the years ended December 31, 20102011, 2012 and 2011,2013, are as follows:
| For the year ended December 31, | 2011 | 2012 | 2013 | |||||||||||||||||
| 2010 | 2011 | (In millions of Korean won) | ||||||||||||||||||
| (In millions of Korean won) | ||||||||||||||||||||
Corporate banking service | (Won) | 2,362,913 | (Won) | 2,287,249 | ||||||||||||||||
Retail banking service | 2,994,303 | 3,266,610 | ||||||||||||||||||
Banking service | ₩ | 7,188,455 | ₩ | 6,290,999 | ₩ | 5,672,100 | ||||||||||||||
Credit card service | 1,361,255 | 1,402,352 | 1,401,669 | 1,286,719 | 1,420,937 | |||||||||||||||
Investment & Securities service | 138,042 | 162,835 | ||||||||||||||||||
Investment & securities service | 162,835 | 142,617 | 115,054 | |||||||||||||||||
Life insurance service | 116,110 | 114,616 | 114,616 | 131,188 | 102,226 | |||||||||||||||
Other service | 653,360 | 1,609,458 | (24,645 | ) | 32,988 | 143,811 | ||||||||||||||
|
|
|
|
| ||||||||||||||||
Total | (Won) | 7,625,983 | (Won) | 8,843,120 | ₩ | 8,842,930 | ₩ | 7,884,511 | ₩ | 7,454,128 | ||||||||||
|
|
|
|
| ||||||||||||||||
5.2.2 Geographical information
OperatingGeographical operating revenues from external customers for the years ended December 31, 20102011,2012 and 2011,2013, and major non-current assets as of January 1, 2010, and December 31, 20102011, 2012 and 2011,2013, are as follows:
| As of January 1, 2010 | As of and for the Year Ended December 31, | |||||||||||||||||||||||||||||||||||||||||||
| �� | 2010 | 2011 | 2011 | 2012 | 2013 | |||||||||||||||||||||||||||||||||||||||
| Major non- current assets | Revenues from external customers | Major non- current assets | Revenues from external customers | Major non- current assets | Revenues from external customers | Major non-current assets | Revenues from external customers | Major non-current assets | Revenues from external customers | Major non-current assets | ||||||||||||||||||||||||||||||||||
| (In millions of Korean won) | (In millions of Korean won) | |||||||||||||||||||||||||||||||||||||||||||
Domestic | (Won) | 3,659,473 | (Won) | 7,540,673 | (Won) | 3,660,755 | (Won) | 8,751,005 | (Won) | 3,734,661 | ₩ | 8,750,815 | ₩ | 3,643,750 | ₩ | 7,785,586 | ₩ | 3,574,205 | ₩ | 7,399,906 | ₩ | 3,600,424 | ||||||||||||||||||||||
United States | 937 | 15,648 | 358 | 12,849 | 145 | 12,849 | 145 | 11,438 | 35 | 12,730 | 21 | |||||||||||||||||||||||||||||||||
New Zealand | 382 | 9,072 | 130 | 7,591 | 60 | 7,591 | 60 | 8,268 | 35 | 8,581 | 20 | |||||||||||||||||||||||||||||||||
China | 2,417 | 26,525 | 1,453 | 25,528 | 861 | 25,528 | 861 | 30,800 | 11,349 | 32,190 | 10,488 | |||||||||||||||||||||||||||||||||
Japan | 2,214 | 22,600 | 2,000 | 31,499 | 2,103 | 31,499 | 2,103 | 30,810 | 2,653 | (17,182 | ) | 1,722 | ||||||||||||||||||||||||||||||||
Argentina | — | (2 | ) | — | 7 | — | 7 | — | 10 | — | 6 | — | ||||||||||||||||||||||||||||||||
Vietnam | — | — | — | 65 | 481 | 65 | 481 | 1,172 | 429 | 3,268 | 316 | |||||||||||||||||||||||||||||||||
Cambodia | 2,078 | 2,082 | 952 | 2,929 | 557 | 2,929 | 557 | 4,151 | 546 | 5,741 | 898 | |||||||||||||||||||||||||||||||||
England | 109 | 9,385 | 83 | 11,647 | 42 | 11,647 | 42 | 12,276 | 16 | 8,888 | 9 | |||||||||||||||||||||||||||||||||
Intra-group adjustment | 60,855 | — | 42,370 | — | (32,897 | ) | — | 58,014 | — | 57,230 | — | 56,408 | ||||||||||||||||||||||||||||||||
|
|
|
|
|
|
|
|
|
|
| ||||||||||||||||||||||||||||||||||
Total | (Won) | 3,728,465 | (Won) | 7,625,983 | (Won) | 3,708,101 | (Won) | 8,843,120 | (Won) | 3,706,013 | ₩ | 8,842,930 | ₩ | 3,706,013 | ₩ | 7,884,511 | ₩ | 3,646,498 | ₩ | 7,454,128 | ₩ | 3,670,306 | ||||||||||||||||||||||
|
|
|
|
|
|
|
|
|
|
| ||||||||||||||||||||||||||||||||||
6. Financial Assets and Financial Liabilities
6.1 Carrying amounts of financial instruments
Financial assetsClassification and liabilities are measured at fair value or amortized cost.
Measurement policies for each class of financial assets and financial liabilities are disclosed in Note 3, ‘Significant accounting policies’.
The carrying amounts of financial assets and liabilities by category as of January 1, 2010, are as follows:
| Financial assets at fair value through profit or loss | ||||||||||||||||||||||||||||
| Held for trading | Designated at fair value through profit or loss | Loans and receivables | Available-for- sale financial assets | Held-to- maturity financial assets | Derivatives held for hedging | Total | ||||||||||||||||||||||
| (In millions of Korean won) | ||||||||||||||||||||||||||||
Financial assets | ||||||||||||||||||||||||||||
Cash and due from financial institutions | (Won) | — | (Won) | — | (Won) | 9,102,630 | (Won) | — | (Won) | — | (Won) | — | (Won) | 9,102,630 | ||||||||||||||
Financial assets at fair value through profit or loss | 4,591,962 | 529 | — | — | — | — | 4,592,491 | |||||||||||||||||||||
Derivatives | 3,276,856 | — | — | — | — | 115,535 | 3,392,391 | |||||||||||||||||||||
Loans | — | — | 196,686,844 | — | — | — | 196,686,844 | |||||||||||||||||||||
Financial investments | — | — | — | 21,821,423 | 13,215,287 | — | 35,036,710 | |||||||||||||||||||||
Other financial assets | — | — | 6,281,664 | — | — | — | 6,281,664 | |||||||||||||||||||||
|
|
|
|
|
|
|
|
|
|
|
|
|
| |||||||||||||||
Total | (Won) | 7,868,818 | (Won) | 529 | (Won) | 212,071,138 | (Won) | 21,821,423 | (Won) | 13,215,287 | (Won) | 115,535 | (Won) | 255,092,730 | ||||||||||||||
|
|
|
|
|
|
|
|
|
|
|
|
|
| |||||||||||||||
| Financial liabilities at fair value through profit or loss | Financial liability at amortized cost | Derivatives held for hedging | Total | |||||||||||||
| Held for trading | ||||||||||||||||
| (In millions of Korean won) | ||||||||||||||||
Financial liabilities | ||||||||||||||||
Financial liabilities at fair value through profit or loss | (Won) | 1,364,223 | (Won) | — | (Won) | — | (Won) | 1,364,223 | ||||||||
Derivatives | 2,858,001 | — | 280,393 | 3,138,394 | ||||||||||||
Deposits | — | 169,065,043 | — | 169,065,043 | ||||||||||||
Debts | — | 13,834,104 | — | 13,834,104 | ||||||||||||
Debentures | — | 38,661,962 | — | 38,661,962 | ||||||||||||
Other financial liabilities | — | 10,403,875 | — | 10,403,875 | ||||||||||||
|
|
|
|
|
|
|
| |||||||||
Total | (Won) | 4,222,224 | (Won) | 231,964,984 | (Won) | 280,393 | (Won) | 236,467,601 | ||||||||
|
|
|
|
|
|
|
| |||||||||
The carrying amounts of financial assets and liabilities by category as of December 31, 2010, are as follows:
| Financial assets at fair value through profit or loss | Loans and receivables | Available-for- sale financial assets | Held-to- maturity financial assets | Derivatives held for hedging | Total | |||||||||||||||||||||||
| Held for trading | Designated at fair value through profit or loss | |||||||||||||||||||||||||||
| (In millions of Korean won) | ||||||||||||||||||||||||||||
Financial assets | ||||||||||||||||||||||||||||
Cash and due from financial institutions | (Won) | — | (Won) | — | (Won) | 6,829,828 | (Won) | — | (Won) | — | (Won) | — | (Won) | 6,829,828 | ||||||||||||||
Financial assets at fair value through profit or loss | 3,967,762 | 45,551 | — | — | — | — | 4,013,313 | |||||||||||||||||||||
Derivatives | 2,389,891 | — | — | — | — | 205,230 | 2,595,121 | |||||||||||||||||||||
Loans | — | — | 197,621,004 | — | — | — | 197,621,004 | |||||||||||||||||||||
Financial investments | — | — | — | 22,281,548 | 13,908,102 | — | 36,189,650 | |||||||||||||||||||||
Other financial assets | — | — | 6,186,227 | — | — | — | 6,186,227 | |||||||||||||||||||||
|
|
|
|
|
|
|
|
|
|
|
|
|
| |||||||||||||||
Total | (Won) | 6,357,653 | (Won) | 45,551 | (Won) | 210,637,059 | (Won) | 22,281,548 | (Won) | 13,908,102 | (Won) | 205,230 | (Won) | 253,435,143 | ||||||||||||||
|
|
|
|
|
|
|
|
|
|
|
|
|
| |||||||||||||||
Financial liabilities Financial liabilities at fair value through profit or loss Derivatives Deposits Debts Debentures Other financial liabilities Total Financial liabilities at
fair value through
profit or loss Financial liability at
amortized cost Derivatives held for
hedging Total Held for trading (In millions of Korean won) (Won) 1,294,859 (Won) — (Won) — (Won) 1,279,869 1,996,621 — 239,738 2,236,359 — 179,862,071 — 179,862,071 — 11,744,389 — 11,744,389 — 29,107,316 — 29,107,316 — 9,274,727 — 9,274,727 (Won) 3,291,480 (Won) 229,988,503 (Won) 239,738 (Won) 233,519,721
The carrying amounts of financial assets and liabilities by category as of December 31, 2011, are as follows:
| Financial assets at fair value through profit or loss | ||||||||||||||||||||||||||||
| Held for trading | Designated at fair value through profit or loss | Loans and receivables | Available-for- sale financial assets | Held-to- maturity financial assets | Derivatives held for hedging | Total | ||||||||||||||||||||||
| (In millions of Korean won) | ||||||||||||||||||||||||||||
Financial assets | ||||||||||||||||||||||||||||
Cash and due from financial institutions | (Won) | — | (Won) | — | (Won) | 9,178,125 | (Won) | — | (Won) | — | (Won) | — | (Won) | 9,178,125 | ||||||||||||||
Financial assets at fair value through profit or loss | 5,617,257 | 708,847 | — | — | — | — | 6,326,104 | |||||||||||||||||||||
Derivatives | 2,220,314 | — | — | — | — | 228,141 | 2,448,455 | |||||||||||||||||||||
Loans | — | — | 212,107,027 | — | — | — | 212,107,027 | |||||||||||||||||||||
Financial investments | — | — | — | 22,377,024 | 13,055,158 | — | 35,432,182 | |||||||||||||||||||||
Other financial assets | — | — | 6,409,905 | — | — | — | 6,409,905 | |||||||||||||||||||||
|
|
|
|
|
|
|
|
|
|
|
|
|
| |||||||||||||||
Total | (Won) | 7,837,571 | (Won) | 708,847 | (Won) | 227,695,057 | (Won) | 22,377,024 | (Won) | 13,055,158 | (Won) | 228,141 | (Won) | 271,901,798 | ||||||||||||||
|
|
|
|
|
|
|
|
|
|
|
|
|
| |||||||||||||||
Financial liabilities Financial liabilities at fair value through profit or loss Derivatives Deposits Debts Debentures Other financial liabilities Total Financial liabilities at fair value
through profit or loss Held for trading Designated at fair
value through
profit or loss Financial liability
at amortized cost Derivatives held
for hedging Total (In millions of Korean won) (Won) 550,873 (Won) 837,206 (Won) — (Won) — (Won) 1,388,079 1,905,343 — — 154,230 2,059,573 — — 190,337,590 — 190,337,590 — — 16,823,838 — 16,823,838 — — 27,069,879 — 27,069,879 — — 9,962,105 — 9,962,105 (Won) 2,456,216 (Won) 837,206 (Won) 244,193,412 (Won) 154,230 (Won) 247,641,064
6.2 Fair value of financial instruments
FairCarrying amount and fair value of financial assets and liabilities as of December 31, 2012 and 2013, are as follows:
| 2012 | 2013 | |||||||||||||||
| Carrying amount | Fair value | Carrying amount | Fair value | |||||||||||||
| (In millions of Korean won) | ||||||||||||||||
Financial assets | ||||||||||||||||
Cash and due from financial institutions | ₩ | 10,592,605 | ₩ | 10,545,944 | ₩ | 14,792,654 | ₩ | 14,793,603 | ||||||||
Financial assets held for trading | 9,207,629 | 9,207,629 | 8,967,006 | 8,967,006 | ||||||||||||
Debt securities | 8,291,615 | 8,291,615 | 7,825,785 | 7,825,785 | ||||||||||||
Equity securities | 876,175 | 876,175 | 1,100,969 | 1,100,969 | ||||||||||||
Others | 39,839 | 39,839 | 40,252 | 40,252 | ||||||||||||
Financial assets designated at fair value through profit or loss | 352,090 | 352,090 | 361,736 | 361,736 | ||||||||||||
Equity securities | 159,483 | 159,483 | 115,778 | 115,778 | ||||||||||||
Derivative linked securities | 192,607 | 192,607 | 245,958 | 245,958 | ||||||||||||
Derivatives held for trading | 1,907,774 | 1,907,774 | 1,680,880 | 1,680,880 | ||||||||||||
Derivatives held for hedging | 183,511 | 183,511 | 138,529 | 138,529 | ||||||||||||
Loans | 213,644,791 | 214,665,080 | 219,001,356 | 219,319,406 | ||||||||||||
Available-for-sale financial assets | 24,211,546 | 24,211,546 | 21,832,104 | 21,832,104 | ||||||||||||
Debt securities | 21,737,240 | 21,737,240 | 18,933,288 | 18,933,288 | ||||||||||||
Equity securities | 2,474,306 | 2,474,306 | 2,898,816 | 2,898,816 | ||||||||||||
Held-to-maturity financial assets | 12,255,806 | 12,837,009 | 13,016,991 | 13,386,962 | ||||||||||||
Other financial assets | 7,569,596 | 7,569,596 | 6,251,679 | 6,251,679 | ||||||||||||
|
|
|
|
|
|
|
| |||||||||
Total financial assets | ₩ | 279,925,348 | ₩ | 281,480,179 | ₩ | 286,042,935 | ₩ | 286,731,905 | ||||||||
|
|
|
|
|
|
|
| |||||||||
Financial liabilities | ||||||||||||||||
Financial liabilities held for trading | ₩ | 1,381,997 | ₩ | 1,381,997 | ₩ | 236,637 | ₩ | 236,637 | ||||||||
Financial liabilities designated at fair value through profit or loss | 469,138 | 469,138 | 878,565 | 878,565 | ||||||||||||
Derivatives held for trading | 1,854,216 | 1,854,216 | 1,580,029 | 1,580,029 | ||||||||||||
Derivatives held for hedging | 200,526 | 200,526 | 215,310 | 215,310 | ||||||||||||
Deposits | 197,346,205 | 197,793,204 | 200,882,064 | 201,128,271 | ||||||||||||
Debts | 15,965,458 | 15,984,126 | 14,101,331 | 14,098,569 | ||||||||||||
Debentures | 24,270,212 | 25,762,049 | 27,039,534 | 28,221,196 | ||||||||||||
Other financial liabilities | 12,185,938 | 12,186,032 | 13,262,914 | 13,262,946 | ||||||||||||
|
|
|
|
|
|
|
| |||||||||
Total financial liabilities | ₩ | 253,673,690 | ₩ | 255,631,288 | ₩ | 258,196,384 | ₩ | 259,621,523 | ||||||||
|
|
|
|
|
|
|
| |||||||||
The fair value is defined as the amount for whichprice that would be received to sell an asset could be exchanged, or paid to transfer a liability could be settled, between knowledgeable, willing parties in an arm’s length transaction.orderly transaction between market participants. For each class of financial assets and financial liabilities, the Group discloses the fair value of that class of assets and liabilities in a way that permits it to be compared with its carrying amount at the end of each reporting period. The best evidence of fair value of financial instruments is a quoted price in an active market.
Methods of determining fair value for financial instruments are as follows:
Cash and due from financial institutions | The carrying amounts of cash and demand due from financial institutions and payment due from financial institutions are a reasonable approximation of fair values. These financial instruments do not have a fixed maturity and are receivable on demand. Fair value of ordinary due from financial institutions is measured using a DCF model. |
Investment securities | The fair value of financial instruments that are quoted in active markets is determined using the quoted prices. Fair value is determined | |
Loans | ||
Derivatives | For exchange traded derivatives, quoted price in an active market is used to determine fair value and for OTC derivatives, fair value is determined using valuation techniques. The Group uses internally developed valuation models that are widely used by market participants to determine fair values of plain vanilla OTC derivatives including options, interest rate swaps, and currency swaps, based on observable market parameters. However, some complex financial instruments are valued using appropriate models developed from generally accepted market valuation models including the Finite Difference Method and the Monte Carlo Simulation or independent third-party valuation service. | |
Deposits | Carrying amount of demand deposits is regarded as representative of fair value because they do not have a fixed maturity and are payable on demand. Fair value of time deposits is determined using a DCF model. Fair value is determined by discounting the expected cash | ||
Debts | Carrying amount of overdraft in foreign currency is regarded as representative of fair value because they do not have a fixed maturity and are payable on demand. Fair value of other debts is determined using a DCF model discounting contractual future cash flows at an appropriate discount rate. | ||
Debentures | Fair value is determined by using the valuations of independent third-party pricing services, which are calculated using market inputs. | ||
Other financial assets and liabilities | The carrying amounts are reasonable approximation of fair values. These financial instruments are temporary accounts used for other various transactions and their maturities are relatively short or not defined. However, fair value of finance lease liabilities is measured using a DCF model. | ||
Fair value hierarchy
The Group believes that valuation methods used for measuring the fair values of financial instruments are reasonable and that the fair values recognized in the statements of financial position are appropriate. However, the fair values of the financial instruments recognized in the statements of financial position may be different if other valuation methods or assumptions are used. Additionally, as there is a variety of valuation techniques and assumptions used in measuring fair value, it may be difficult to reasonably compare the fair value with that of other financial institutions.
Fair values of financial assets and liabilities measured at amortized cost as of January 1, 2010, and December 31, 2010 and 2011, are as follows:
| As of January 1, | As of December 31, | |||||||||||||||||||||||
| 2010 | 2010 | 2011 | ||||||||||||||||||||||
| Carrying amount | Fair value | Carrying amount | Fair value | Carrying amount | Fair value | |||||||||||||||||||
| (In millions of Korean won) | ||||||||||||||||||||||||
Financial assets | ||||||||||||||||||||||||
Cash and due from financial institution | (Won) | 9,102,630 | (Won) | 9,101,744 | (Won) | 6,829,828 | (Won) | 6,819,272 | (Won) | 9,178,125 | (Won) | 9,185,763 | ||||||||||||
Loans | 196,686,844 | 197,499,223 | 197,621,004 | 198,627,998 | 212,107,027 | 212,858,247 | ||||||||||||||||||
Held-to-maturity financial assets | 13,215,287 | 13,596,207 | 13,908,102 | 14,339,936 | 13,055,158 | 13,562,430 | ||||||||||||||||||
Other financial assets | 6,281,664 | 6,281,664 | 6,186,227 | 6,186,227 | 6,409,905 | 6,409,905 | ||||||||||||||||||
|
|
|
|
|
|
|
|
|
|
|
| |||||||||||||
Total financial assets | (Won) | 225,286,425 | (Won) | 226,478,838 | (Won) | 224,545,161 | (Won) | 225,973,433 | (Won) | 240,750,215 | (Won) | 242,016,345 | ||||||||||||
|
|
|
|
|
|
|
|
|
|
|
| |||||||||||||
Financial liabilities | ||||||||||||||||||||||||
Deposits | (Won) | 169,065,043 | (Won) | 169,183,026 | (Won) | 179,862,071 | (Won) | 180,177,676 | (Won) | 190,337,590 | (Won) | 190,560,759 | ||||||||||||
Debts | 13,834,104 | 13,826,825 | 11,744,389 | 11,776,282 | 16,823,838 | 16,826,152 | ||||||||||||||||||
Debentures | 38,661,962 | 40,171,652 | 29,107,316 | 30,764,365 | 27,069,879 | 28,636,722 | ||||||||||||||||||
Other financial liabilities | 10,403,875 | 10,404,170 | 9,274,727 | 9,274,762 | 9,962,105 | 9,983,449 | ||||||||||||||||||
|
|
|
|
|
|
|
|
|
|
|
| |||||||||||||
Total financial liabilities | (Won) | 231,964,984 | (Won) | 233,585,673 | (Won) | 229,988,503 | (Won) | 231,993,085 | (Won) | 244,193,412 | (Won) | 246,007,082 | ||||||||||||
|
|
|
|
|
|
|
|
|
|
|
| |||||||||||||
Fair value hierarchy
The Group classifies and discloses fair value of the financial instruments into the following three-level hierarchy:
Level 1: Financial instruments measured atThe fair values are based on quoted prices from(unadjusted) in active markets are classified as level 1. This level includes listed equity securities, exchange traded derivatives, government bonds and financial instruments indexed tofor identical assets or liabilities that the price of gold.entity can access at the measurement date.
Level 2: Financial instruments measured using valuation techniques where all significantThe fair values are based on inputs other than quoted prices included within Level 1 that are observable market data are classified as level 2. This level includesfor the majority of debt securities and general over-the-counter derivatives such as swaps, futures and options.asset or liability, either directly or indirectly.
Level 3: Financial instruments measured using valuation techniques where one or more significant inputsThe fair values are not based on observable market data are classified as level 3. This level includes unlisted equity securities, complex structured bonds, and complex over-the-counter derivatives.unobservable inputs for the asset or liability.
The level in the fair value hierarchy within which the fair value measurement is categorized in its entirety shall be determined on the basis of the lowest level input that is significant to the fair value measurement in its entirety. For this purpose, the significance of an input is assessed against the fair value measurement in its entirety. If a fair value measurement uses observable inputs that require significant adjustment based on unobservable inputs, that measurement is a Level 3 measurement.
Fair value hierarchy of financial assets and liabilities measured at fair value
The fair value hierarchy of financial assets and liabilities measured at fair value in the statements of financial position as of January 1, 2010, and December 31, 20102012 and 2011, are2013, is as follows:
| As of January 1, 2010 | 2012 | |||||||||||||||||||||||||||||||
| Fair value hierarchy | Total | Fair value hierarchy | ||||||||||||||||||||||||||||||
| Level 1 | Level 2 | Level 3 | Level 1 | Level 2 | Level 3 | Total | ||||||||||||||||||||||||||
| (In millions of Korean won) | (In millions of Korean won) | |||||||||||||||||||||||||||||||
Financial assets | ||||||||||||||||||||||||||||||||
Financial assets held for trading | (Won) | 2,300,519 | (Won) | 2,281,658 | (Won) | 9,785 | (Won) | 4,591,962 | ||||||||||||||||||||||||
Debt securities | ₩ | 3,945,101 | ₩ | 4,346,514 | ₩ | — | ₩ | 8,291,615 | ||||||||||||||||||||||||
Equity securities | 449,268 | 426,907 | — | 876,175 | ||||||||||||||||||||||||||||
Others | 39,839 | — | — | 39,839 | ||||||||||||||||||||||||||||
Financial assets designated at fair value through profit or loss | — | — | 529 | 529 | ||||||||||||||||||||||||||||
Equity securities | — | 159,483 | — | 159,483 | ||||||||||||||||||||||||||||
Derivative linked securities | — | 14,983 | 177,624 | 192,607 | ||||||||||||||||||||||||||||
Derivatives held for trading | 886 | 3,203,866 | 72,104 | 3,276,856 | 2,839 | 1,858,150 | 46,785 | 1,907,774 | ||||||||||||||||||||||||
Derivatives held for hedging | — | 115,250 | 285 | 115,535 | — | 180,746 | 2,765 | 183,511 | ||||||||||||||||||||||||
Available-for-sale financial assets(1) | 9,984,409 | 10,409,801 | 1,427,213 | 21,821,423 | ||||||||||||||||||||||||||||
Debt securities | 10,351,980 | 11,379,670 | 5,590 | 21,737,240 | ||||||||||||||||||||||||||||
Equity securities | 793,362 | 208,195 | 1,472,749 | 2,474,306 | ||||||||||||||||||||||||||||
|
|
|
|
|
|
|
| |||||||||||||||||||||||||
Total financial assets | (Won) | 12,285,814 | (Won) | 16,010,575 | (Won) | 1,509,916 | (Won) | 29,806,305 | ₩ | 15,582,389 | ₩ | 18,574,648 | ₩ | 1,705,513 | ₩ | 35,862,550 | ||||||||||||||||
|
|
|
|
|
|
|
| |||||||||||||||||||||||||
Financial liabilities | ||||||||||||||||||||||||||||||||
Financial liabilities held for trading | (Won) | 1,364,223 | (Won) | — | (Won) | — | (Won) | 1,364,223 | ₩ | 1,381,997 | ₩ | — | ₩ | — | ₩ | 1,381,997 | ||||||||||||||||
Financial liabilities designated at fair value through profit or loss | — | — | 469,138 | 469,138 | ||||||||||||||||||||||||||||
Derivatives held for trading | 398 | 2,580,933 | 276,670 | 2,858,001 | 2,560 | 1,803,713 | 47,943 | 1,854,216 | ||||||||||||||||||||||||
Derivatives held for hedging | — | 211,933 | 68,460 | 280,393 | — | 191,226 | 9,300 | 200,526 | ||||||||||||||||||||||||
|
|
|
|
|
|
|
| |||||||||||||||||||||||||
Total financial liabilities | (Won) | 1,364,621 | (Won) | 2,792,866 | (Won) | 345,130 | (Won) | 4,502,617 | ₩ | 1,384,557 | ₩ | 1,994,939 | ₩ | 526,381 | ₩ | 3,905,877 | ||||||||||||||||
|
|
|
|
|
|
|
| |||||||||||||||||||||||||
Financial assets Financial assets held for trading Financial assets designated at fair value through profit or loss Derivatives held for trading Derivatives held for hedging Available-for-sale financial assets(1) Total financial assets Financial liabilities Financial liabilities held for trading Derivatives held for trading Derivatives held for hedging Total financial liabilities As of December 31, 2010 Fair value hierarchy Total Level 1 Level 2 Level 3 (In millions of Korean won) (Won) 1,780,652 (Won) 2,177,303 (Won) 9,807 (Won) 3,967,762 — 45,412 139 45,551 809 2,369,659 19,423 2,389,891 — 198,924 6,306 205,230 9,642,649 11,115,157 1,523,742 22,281,548 (Won) 11,424,110 (Won) 15,906,455 (Won) 1,559,417 (Won) 28,889,982 (Won) 1,294,859 (Won) — (Won) — (Won) 1,294,859 7,576 1,898,169 90,876 1,996,621 — 204,022 35,716 239,738 (Won) 1,302,435 (Won) 2,102,191 (Won) 126,592 (Won) 3,531,218
| As of December 31, 2011 | 2013 | |||||||||||||||||||||||||||||||
| Fair value hierarchy | Fair value hierarchy | |||||||||||||||||||||||||||||||
| Level 1 | Level 2 | Level 3 | Total | Level 1 | Level 2 | Level 3 | Total | |||||||||||||||||||||||||
| (In millions of Korean won) | (In millions of Korean won) | |||||||||||||||||||||||||||||||
Financial assets | ||||||||||||||||||||||||||||||||
Financial assets held for trading | (Won) | 3,123,787 | (Won) | 2,482,644 | (Won) | 10,826 | (Won) | 5,617,257 | ||||||||||||||||||||||||
Debt securities | ₩ | 3,160,592 | ₩ | 4,665,193 | ₩ | — | ₩ | 7,825,785 | ||||||||||||||||||||||||
Equity securities | 327,260 | 773,709 | — | 1,100,969 | ||||||||||||||||||||||||||||
Others | 40,252 | — | — | 40,252 | ||||||||||||||||||||||||||||
Financial assets designated at fair value through profit or loss | — | 134,160 | 574,687 | 708,847 | ||||||||||||||||||||||||||||
Equity securities | — | 115,778 | — | 115,778 | ||||||||||||||||||||||||||||
Derivative linked securities | — | 12,030 | 233,928 | 245,958 | ||||||||||||||||||||||||||||
Derivatives held for trading | 158,649 | 2,020,623 | 41,042 | 2,220,314 | 744 | 1,630,940 | 49,196 | 1,680,880 | ||||||||||||||||||||||||
Derivatives held for hedging | — | 215,656 | 12,485 | 228,141 | — | 138,077 | 452 | 138,529 | ||||||||||||||||||||||||
Available-for-sale financial assets(1) | 10,254,897 | 10,790,661 | 1,331,466 | 22,377,024 | ||||||||||||||||||||||||||||
Debt securities | 9,754,737 | 9,175,742 | 2,809 | 18,933,288 | ||||||||||||||||||||||||||||
Equity securities | 985,108 | 254,464 | 1,659,244 | 2,898,816 | ||||||||||||||||||||||||||||
|
|
|
|
|
|
|
| |||||||||||||||||||||||||
Total financial assets | (Won) | 13,537,333 | (Won) | 15,643,744 | (Won) | 1,970,506 | (Won) | 31,151,583 | ₩ | 14,268,693 | ₩ | 16,765,933 | ₩ | 1,945,629 | ₩ | 32,980,255 | ||||||||||||||||
|
|
|
|
|
|
|
| |||||||||||||||||||||||||
Financial liabilities | ||||||||||||||||||||||||||||||||
Financial liabilities held for trading | (Won) | 550,873 | (Won) | — | (Won) | — | (Won) | 550,873 | ₩ | 236,637 | ₩ | — | ₩ | — | ₩ | 236,637 | ||||||||||||||||
Financial liabilities designated at fair value through profit or loss | — | — | 837,206 | 837,206 | — | — | 878,565 | 878,565 | ||||||||||||||||||||||||
Derivatives held for trading | 158,261 | 1,695,235 | 51,847 | 1,905,343 | 261 | 1,538,374 | 41,394 | 1,580,029 | ||||||||||||||||||||||||
Derivatives held for hedging | — | 132,135 | 22,095 | 154,230 | — | 206,468 | 8,842 | 215,310 | ||||||||||||||||||||||||
|
|
|
|
|
|
|
| |||||||||||||||||||||||||
Total financial liabilities | (Won) | 709,134 | (Won) | 1,827,370 | (Won) | 911,148 | (Won) | 3,447,652 | ₩ | 236,898 | ₩ | 1,744,842 | ₩ | 928,801 | ₩ | 2,910,541 | ||||||||||||||||
|
|
|
|
|
|
|
| |||||||||||||||||||||||||
The amounts of equity securities carried at cost in |
6.3Valuation techniques and the inputs used in the fair value measurement classified as Level 2
The financial assets and liabilities measured at fair value classified as Level 2 in the statements of financial position as of December 31, 2013 is as follows:
| Fair value | Valuation techniques | Inputs | ||||||
| (In millions of Korean won) | ||||||||
Financial assets | ||||||||
Financial assets held for trading | ||||||||
Debt securities | ₩ | 4,665,193 | DCF Model | Discount rate | ||||
Equity securities | 773,709 | DCF Model, Net Asset Value | Discount rate, Fair value of underlying asset | |||||
Sub-total | 5,438,902 | |||||||
Financial assets designated at fair value through profit or loss | ||||||||
Equity securities | 115,778 | DCF Model | Discount rate | |||||
Derivative linked securities | 12,030 | Monte Carlo Simulation | Price of the underlying asset, Interest rates, Volatility of the underlying asset, Correlation of the underlying assets | |||||
Sub-total | 127,808 | |||||||
Derivatives held for trading | 1,630,940 | DCF Model, Closed Form, FDM | Discount rate, Volatility, Foreign exchange rate, Stock price and others | |||||
Derivatives held for hedging | 138,077 | DCF Model, Closed Form, FDM | Discount rate, Volatility, Foreign exchange rate and others | |||||
Available-for-sale financial assets | ||||||||
Debt securities | 9,175,742 | DCF Model | Discount rate | |||||
Equity securities | 254,464 | DCF Model, Net Asset Value | Discount rate, Fair value of underlying asset | |||||
Sub-total | 9,430,206 | |||||||
Total financial assets | ₩ | 16,765,933 | ||||||
Financial liabilities | ||||||||
Derivatives held for trading | ₩ | 1,538,374 | DCF Model, Closed Form, FDM | Discount rate, Volatility, Foreign exchange rate, Stock price and others | ||||
Derivatives held for hedging | 206,468 | DCF Model, Closed Form, FDM | Discount rate, Volatility, Foreign exchange rate and others | |||||
Total financial liabilities | ₩ | 1,744,842 | ||||||
Fair value hierarchy of financial assets and liabilities whose the fair values are disclosed
The fair value hierarchy of financial assets and liabilities which the fair value is disclosed as of December 31, 2013 is as follows:
| 2013 | ||||||||||||||||
| Fair value hierarchy | ||||||||||||||||
| Level 1 | Level 2 | Level 3 | Total | |||||||||||||
| (In millions of Korean won) | ||||||||||||||||
Financial assets | ||||||||||||||||
Cash and due from financial institutions(1) | ₩ | 2,698,018 | ₩ | 10,555,993 | ₩ | 1,539,592 | ₩ | 14,793,603 | ||||||||
Loans | — | — | 219,319,406 | 219,319,406 | ||||||||||||
Held-to-maturity financial assets | 3,535,217 | 9,851,745 | — | 13,386,962 | ||||||||||||
Other financial assets(2) | — | — | 6,251,679 | 6,251,679 | ||||||||||||
|
|
|
|
|
|
|
| |||||||||
Total financial assets | ₩ | 6,233,235 | ₩ | 20,407,738 | ₩ | 227,110,677 | ₩ | 253,751,650 | ||||||||
|
|
|
|
|
|
|
| |||||||||
Financial liabilities | ||||||||||||||||
Deposits(1) | ₩ | — | ₩ | 72,839,365 | ₩ | 128,288,906 | ₩ | 201,128,271 | ||||||||
Debts(1) | — | 156,349 | 13,942,220 | 14,098,569 | ||||||||||||
Debentures | — | 27,752,493 | 468,703 | 28,221,196 | ||||||||||||
Other financial liabilities(2) | — | — | 13,262,946 | 13,262,946 | ||||||||||||
|
|
|
|
|
|
|
| |||||||||
Total financial liabilities | ₩ | — | ₩ | 100,748,207 | ₩ | 155,962,775 | ₩ | 256,710,982 | ||||||||
|
|
|
|
|
|
|
| |||||||||
| (1) | The amounts included in Level 2 are the carrying amounts which are reasonable approximation of the fair values. |
| (2) | The ₩6,251,679 million of other financial assets and ₩13,261,041 million of other financial liabilities included in Level 3 are the carrying amounts which are reasonable approximation of fair values. |
Valuation techniques and the inputs used in the fair value measurement
The valuation techniques and the inputs of financial assets and liabilities which are disclosed by the carrying amounts because it is a reasonable approximation of fair value are not subject to be disclosed.
The valuation techniques and the inputs of financial assets and liabilities whose the fair values are disclosed and classified as Level 2 as of December 31, 2013, are as follows:
| Fair value | Valuation technique | Inputs | ||||||
| (In millions of Korean won) | ||||||||
Financial assets | ||||||||
Held-to-maturity financial assets | ₩ | 9,851,745 | DCF Model | Discount rate | ||||
Financial liabilities | ||||||||
Debentures | ₩ | 27,752,493 | DCF Model | Discount rate | ||||
The valuation techniques and the inputs of financial assets and liabilities whose the fair values are disclosed and classified as Level 3 as of December 31, 2013, are as follows:
| Fair value | Valuation technique | Inputs | ||||||
| (In millions of Korean won) | ||||||||
Financial assets | ||||||||
Cash and due from financial institutions | ₩ | 1,539,592 | DCF Model | Credit spread, Other spread | ||||
Loans | 219,319,406 | DCF Model | Credit spread, Other spread, Prepayment rate | |||||
Total financial assets | ₩ | 220,858,998 | ||||||
Financial liabilities | ||||||||
Deposits | ₩ | 128,288,906 | DCF Model | Other spread, Prepayment rate | ||||
Debts | 13,942,220 | DCF Model | Other spread | |||||
Debentures | 468,703 | DCF Model | Other spread, Implied default probability | |||||
Other financial liabilities | 1,905 | DCF Model | Other spread | |||||
Total financial liabilities | ₩ | 142,701,734 | ||||||
6.2 Level 3 of the fair value hierarchy disclosure
6.3.16.2.1 Valuation policy and process of Level 3 Fair value
The Group uses the value of external, independent and qualified valuers or the value of internal valuation models to determine the fair value of the Group’s assets at the end of every financial year.
Where a reclassification between the levels of the fair value hierarchy occurs for a financial asset or liability, the Group’s policy is to recognize such transfers as having occurred at the beginning of the reporting period.
6.2.2 Changes in Level 3 of the fair value hierarchy used in the valuation techniques based on unobservable assumption in the market
Changes in levelLevel 3 of the fair value hierarchy for the yearyears ended December 31, 2010,2012 and 2013, are as follows:
| Financial assets at fair value through profit or loss | Financial investments | Net derivatives | ||||||||||||||||||
| Financial assets held for trading | Designated at fair value through profit or loss | Available-for-sale financial assets | Derivatives held for trading | Derivatives held for hedging | ||||||||||||||||
| (In millions of Korean won) | ||||||||||||||||||||
Beginning balance | (Won) | 9,785 | (Won) | 529 | (Won) | 1,427,213 | (Won) | (204,566 | ) | (Won) | (68,175 | ) | ||||||||
Total gains or losses | ||||||||||||||||||||
—Profit or loss | 22 | (390 | ) | 5,336 | (29,781 | ) | 41,899 | |||||||||||||
—Other comprehensive income | — | — | 99,626 | — | — | |||||||||||||||
Purchases | — | — | 180,737 | 2,040 | — | |||||||||||||||
Sales | — | — | (154,478 | ) | (317 | ) | — | |||||||||||||
Issues | — | — | — | (141,248 | ) | — | ||||||||||||||
Settlements | — | — | — | 302,419 | (3,134 | ) | ||||||||||||||
Transfers into level 3 | — | — | — | — | — | |||||||||||||||
Transfers out of level 3 | — | — | (34,692 | ) | — | — | ||||||||||||||
|
|
|
|
|
|
|
|
|
| |||||||||||
Ending balance | (Won) | 9,807 | (Won) | 139 | (Won) | 1,523,742 | (Won) | (71,453 | ) | (Won) | (29,410 | ) | ||||||||
|
|
|
|
|
|
|
|
|
| |||||||||||
Beginning balance Total gains or losses —Profit or loss —Other comprehensive income Purchases Sales Issues Settlements Transfers into Level 3 Transfers out of Level 3 Ending balance Changes in level 3 of the fair value hierarchy for the year ended December 31, 2011, are as follows: 2012 Financial assets at fair value
through profit or loss Financial
investments Financial
liabilities at fair
value through
profit or loss Net derivatives Financial assets
held for
trading Designated at
fair value
through profit
or loss Available-for-sale
financial assets Designated at
fair value
through profit
or loss Derivatives held
for trading Derivatives held
for hedging (In millions of Korean won) ₩ 10,826 ₩ 574,687 ₩ 1,150,633 ₩ (837,206 ) ₩ (10,805 ) ₩ (9,610 ) — 120,779 (96,194 ) (159,685 ) (8,246 ) 15,935 — — 152,368 — — — — 129,612 49,700 — 28,163 — (10,826 ) (647,454 ) (59,165 ) — (10,211 ) — — — — (673,006 ) (6,903 ) — — — — 1,200,759 6,844 (12,860 ) — — 282,498 — — — — — (1,501 ) — — — ₩ — ₩ 177,624 ₩ 1,478,339 ₩ (469,138 ) ₩ (1,158 ) ₩ (6,535 )
| Financial assets at fair value through profit or loss | Financial investments | Financial liabilities at fair value through profit or loss | Net derivatives | |||||||||||||||||||||
| Financial assets held for trading | Designated at fair value through profit or loss | Available-for-sale financial assets | Designated at fair value through profit or loss | Derivatives held for trading | Derivatives held for hedging | |||||||||||||||||||
| (In millions of Korean won) | ||||||||||||||||||||||||
Beginning balance | (Won) | 9,807 | (Won) | 139 | (Won) | 1,523,742 | (Won) | — | (Won) | (71,453 | ) | (Won) | (29,410 | ) | ||||||||||
Total gains or losses | ||||||||||||||||||||||||
—Profit or loss | 1,019 | (51,229 | ) | 373,980 | 57,963 | 52,463 | 32,420 | |||||||||||||||||
—Other comprehensive income | — | — | (140,112 | ) | — | 5,749 | — | |||||||||||||||||
Purchases | — | 636,126 | 136,582 | — | 14,733 | — | ||||||||||||||||||
Sales | — | (10,349 | ) | (554,022 | ) | — | (46 | ) | — | |||||||||||||||
Issues | — | — | — | (919,411 | ) | (36,214 | ) | — | ||||||||||||||||
Settlements | — | — | — | 24,242 | 23,963 | (12,620 | ) | |||||||||||||||||
Transfers into level 3 | — | — | — | — | — | — | ||||||||||||||||||
Transfers out of level 3 | — | — | (8,704 | ) | — | — | — | |||||||||||||||||
|
|
|
|
|
|
|
|
|
|
|
| |||||||||||||
Ending balance | (Won) | 10,826 | (Won) | 574,687 | (Won) | 1,331,466 | (Won) | (837,206 | ) | (Won) | (10,805 | ) | (Won) | (9,610 | ) | |||||||||
|
|
|
|
|
|
|
|
|
|
|
| |||||||||||||
Beginning balance Total gains or losses —Profit or loss —Other comprehensive income Purchases Sales Issues Settlements Transfers into Level 3 Transfers out of Level 3 Ending balance 2013 Financial assets at fair value
through profit or loss Financial
investments Financial
liabilities at
fair value
through profit
or loss Net derivatives Financial
assets held
for trading Designated at
fair value
through
profit or loss Available-for-sale
financial assets Designated at
fair value
through profit
or loss Derivatives
held for
trading Derivatives
held for
hedging (In millions of Korean won) ₩ — ₩ 177,624 ₩ 1,478,339 ₩ (469,138 ) ₩ (1,158 ) ₩ (6,535 ) — 7,138 (10,180 ) (31,379 ) (2,007 ) (1,229 ) — — 41,204 — — — — 415,876 519,140 — 96 — — (366,710 ) (85,191 ) — (2,058 ) — — — — (1,076,965 ) (4,080 ) — — — — 698,917 17,009 (626 ) — — 26,979 — — — — — (308,238 ) — — — ₩ — ₩ 233,928 ₩ 1,662,053 ₩ (878,565 ) ₩ 7,802 ₩ (8,390 )
In relation to changes in Level 3 of the fair value hierarchy, total gains or losses recognized in profit or loss for the period,year, and total gains or losses for the periodyear included in profit or loss for financial instruments held at the end of the reporting period in the statementstatements of comprehensive income for the years ended December 31, 20102011, 2012 and 2011,2013, are as follows:
| For the year Ended December 31, 2010 | ||||||||
| Net income from financial investments at fair value through profit or loss | Other operating income | |||||||
| (In millions of Korean won) | ||||||||
Total gains or losses included in profit or loss for the period | (Won) | (30,135 | ) | (Won) | 47,221 | |||
Total gains or losses for the period included in profit or loss for financial instruments held at the end of the reporting period | (5,066 | ) | (3,464 | ) | ||||
| 2011 | ||||||||
| Net income from financial investments at fair value through profit or loss | Other operating income | |||||||
| (In millions of Korean won) | ||||||||
Total gains or losses included in profit or loss for the year | ₩ | 60,227 | ₩ | 406,389 | ||||
Total gains or losses for the year included in profit or loss for financial instruments held at the end of the reporting period | 18,295 | (30,100 | ) | |||||
| For the year Ended December 31, 2011 | ||||||||
| Net income from financial investments at fair value through profit or loss | Other operating income | |||||||
| (In millions of Korean won) | ||||||||
Total gains or losses included in profit or loss for the period | (Won) | 60,227 | (Won) | 406,389 | ||||
Total gains or losses for the period included in profit or loss for financial instruments held at the end of the reporting period | 18,295 | (30,100 | ) | |||||
| 2012 | ||||||||
| Net income from financial investments at fair value through profit or loss | Other operating income | |||||||
| (In millions of Korean won) | ||||||||
Total gains or losses included in profit or loss for the year | ₩ | (47,152 | ) | ₩ | (80,259 | ) | ||
Total gains or losses for the year included in profit or loss for financial instruments held at the end of the reporting period | (18,063 | ) | (83,533 | ) | ||||
6.3.2
| 2013 | ||||||||
| Net income from financial investments at fair value through profit or loss | Other operating income | |||||||
| (In millions of Korean won) | ||||||||
Total gains or losses included in profit or loss for the year | ₩ | (26,248 | ) | ₩ | (11,409 | ) | ||
Total gains or losses for the year included in profit or loss for financial instruments held at the end of the reporting period | (3,285 | ) | (23,948 | ) | ||||
6.2.3 Sensitivity analysis of changes in unobservable inputs
Information about fair value measurements using unobservable inputs
| Fair value | Valuation | Inputs | Unobservable inputs | Range of unobservable inputs(%) | Relationship of unobservable inputs to | |||||||||
| (In millions of Korean won) | ||||||||||||||
Financial assets | ||||||||||||||
Financial assets designated at fair value through profit or loss | ||||||||||||||
Derivative linked securities | ₩ | 233,928 |
| Monte Carlo Simulation, Closed Form, Hull and White | Price of the underlying asset, Interest rates, Dividend yield, Volatility of the underlying asset, Correlation between underlying asset, Volatility of interest rate, Discount rate | Volatility of the underlying asset | 10.99~40.28 | The higher the volatility, the higher the fair value | ||||||
| Correlation between underlying asset | -3.28~57.89 | The higher the correlation between underlying asset, the higher the fair value | ||||||||||||
| Volatility of interest rate | 0.48 | The higher the volatility, the higher the fair value fluctuation | ||||||||||||
| Discount rate | 2.54~5.32 | The lower the discount rate, the higher the fair value | ||||||||||||
Derivatives held for trading | ||||||||||||||
Stock and index | 42,706 | DCF Model, Closed Form, FDM, Monte Carlo Simulation | Price of the underlying asset, Interest rates, Volatility of the underlying asset, Correlation of the underlying assets(index of stock prices), Dividend yield, Discount rate | Correlation of the indexes of stock prices | 11.43~79.26 | The higher the correlation, the higher the fair value fluctuation | ||||||||
| Volatility of the underlying asset | 7.1~45.64 | The higher the volatility, the higher the fair value fluctuation | ||||||||||||
| Discount rate | 3.46 | The lower the discount rate, the higher the fair value | ||||||||||||
Currency | 6,490 | DCF Model, | Interest rates, Foreign exchange rate, Loss given default | Loss given default | 88.24~94.12 | The higher the loss given default, the lower the fair value | ||||||||
Derivatives held for hedging | ||||||||||||||
Interest rate | 452 | DCF Model, Closed Form, FDM, Monte Carlo Simulation | Interest rates, Correlation of the underlying assets(Interest rates), Foreign exchange rate | Correlation between interest rates | 0.03 | The higher the correlation, the higher the fair value fluctuation | ||||||||
Available-for-sale financial assets | ||||||||||||||
Debt securities | 2,809 | DCF Model | Discount rate | Discount rate | 8.85 | The lower the discount rate, the higher the fair value | ||||||||
| Fair value | Valuation | Inputs | Unobservable inputs | Range of unobservable inputs(%) | Relationship of unobservable inputs to | |||||||||
| (In millions of Korean won) | ||||||||||||||
Equity securities | 1,659,244 | DCF Model, Comparable Company Analysis, Adjusted discount rate method, | Growth rate, Discount rate, Volatility of interest rate, Volatilities of real estate selling price, Liquidation value, Discount rate of cash flows from rent, Net asset value, Stock price index of the comparative company | Growth rate | 0.00~1.00 | The higher the growth rate, the higher the fair value | ||||||||
| Discount rate | 2.86~58.69 | The lower the discount rate, the higher the fair value | ||||||||||||
| Volatility of interest rate | 12.37~16.26 | The higher the volatility, the higher the fair value fluctuation | ||||||||||||
| Volatilities of real estate selling price | 0.74~0.96 | The higher the real estate selling price, the higher the fair value | ||||||||||||
| Liquidation value | 0.00 | The higher the liquidation value, the higher the fair value | ||||||||||||
| Discount rate of cash flows from rent | 6.43~12.83 | The lower the discount rate of cash flows, the higher the fair value | ||||||||||||
Total financial assets | ₩ | 1,945,629 | ||||||||||||
Financial liabilities | ||||||||||||||
Financial liabilities designated at fair value through profit or loss | ||||||||||||||
Derivative linked securities | ₩ | 878,565 | Closed Form, MonteCarlo Simulation | Price of the underlying asset, Interest rates, Volatility, Correlation, Dividend yield | Correlation of the indexes of stock prices | -3.28~58.28 | The higher the correlation between underlying asset, the higher the fair value | |||||||
| Volatility of the underlying asset | 10.99~44.71 | The higher the volatility, the higher the fair value fluctuation | ||||||||||||
Stock and index | 41,394 | DCF Model, Closed Form, FDM, Monte Carlo Simulation | Price of the underlying asset, Interest rates, Volatility of the underlying asset, Correlation of the underlying assets(index of stock prices), Dividend yield, Volatility of interest rate | Correlation of the indexes of stock prices | 16.20~79.26 | The higher the correlation, the higher the fair value fluctuation | ||||||||
| Volatility of the underlying asset | 10.99~45.64 | The higher the volatility, the higher the fair value fluctuation | ||||||||||||
| Volatility of interest rate | 12.37~16.26 | The higher the volatility, the higher the fair value fluctuation | ||||||||||||
Derivatives held for hedging | ||||||||||||||
Interest rate | 8,842 | DCF Model, Closed Form, FDM, Monte Carlo Simulation | Price of the underlying asset, Interest rates, Volatility of the underlying asset | Volatility of the underlying asset | 3.00~5.28 | The higher the volatility, the higher the fair value fluctuation | ||||||||
Total financial liabilities | ₩ | 928,801 | ||||||||||||
Sensitivity analysis of changes in unobservable inputs
Sensitivity analysis of financial instruments is performed, to measure favorable and unfavorable changes in the fair value of financial instruments which are affected by the unobservable parameters, using a statistical technique. When the fair value is affected by more than two input parameters, the amounts represent the most favorable or most unfavorable. Amongst Level 3 financial instruments subject to sensitivity analysis are equity-related derivatives, currency-related derivatives and interest rate-related derivatives whose fair value changes are recognized in profit and loss as well as debt securities and unlisted equity securities (including private equity funds) whose fair value changes are recognized in profit and loss or other comprehensive income and loss.
Sensitivity analyses by type of instrument as a result of varying input parameters are as follows:
| 2012 | ||||||||
| Recognition in profit and loss | ||||||||
| Favorable changes | Unfavorable changes | |||||||
| (In millions of Korean won) | ||||||||
Financial assets | ||||||||
Financial assets designated at fair value through profit or loss | ||||||||
Derivative linked securities(1) | ₩ | 953 | ₩ | (1,888 | ) | |||
Derivatives held for trading(2) | 8,047 | (9,451 | ) | |||||
Derivatives held for hedging(2) | 197 | (202 | ) | |||||
Available-for-sale financial assets | ||||||||
Debt securities(3) | 2,773 | (2,731 | ) | |||||
Equity securities(4) | 402,284 | (173,054 | ) | |||||
|
|
|
| |||||
Total financial assets | ₩ | 414,254 | ₩ | (187,326 | ) | |||
|
|
|
| |||||
Financial liabilities | ||||||||
Financial liabilities designated at fair value through profit or loss(1) | ₩ | 13,843 | ₩ | (7,752 | ) | |||
Derivatives held for trading(2) | 3,934 | (4,321 | ) | |||||
Derivatives held for hedging(2) | 176 | (169 | ) | |||||
|
|
|
| |||||
Total financial liabilities | ₩ | 17,953 | ₩ | (12,242 | ) | |||
|
|
|
| |||||
| 2013 | ||||||||
| Recognition in profit and loss | ||||||||
| Favorable changes | Unfavorable changes | |||||||
| (In millions of Korean won) | ||||||||
Financial assets | ||||||||
Financial assets designated at fair value through profit or loss | ||||||||
Derivative linked securities(1) | ₩ | 6,188 | ₩ | (8,834 | ) | |||
Derivatives held for trading(2) | 6,653 | (6,299 | ) | |||||
Derivatives held for hedging(2) | 0 | 0 | ||||||
Available-for-sale financial assets | ||||||||
Debt securities(3) | 61 | (58 | ) | |||||
Equity securities(4) | 322,444 | (121,192 | ) | |||||
|
|
|
| |||||
Total financial assets | ₩ | 335,346 | ₩ | (136,383 | ) | |||
|
|
|
| |||||
Financial liabilities | ||||||||
Financial liabilities designated at fair value through profit or loss(1) | ₩ | 15,467 | ₩ | (10,330 | ) | |||
Derivatives held for trading(2) | 4,596 | (4,968 | ) | |||||
Derivatives held for hedging(2) | 345 | (333 | ) | |||||
|
|
|
| |||||
Total financial liabilities | ₩ | 20,408 | ₩ | (15,631 | ) | |||
|
|
|
| |||||
| (1) | For financial assets designated at fair value through profit or loss, the changes in fair value are calculated by shifting principal unobservable input parameters such as stock price fluctuation range of underlying assets by +/- 10%. |
| (2) | For equity-related derivatives, the changes in fair value are calculated by shifting principal unobservable input parameters such as correlation between the stock price and volatility by +/- 10%. For currency-related derivatives, the changes in fair value are calculated by shifting principal unobservable input parameters such as loss given default by ± 1%. For interest rate-related derivatives, coefficient of correlation between long-term and short-term interest rates or the volatilities of the underlying assets are shifted by +/- 10% to calculate the fair value changes. |
| (3) | For debt securities,the changes in fair value are calculated by shifting principal unobservable input parameters such as discount rate by +/- 1%. |
| (4) | For equity securities, the changes in fair value are calculated by shifting principal unobservable input parameters such as correlation between growth rate (0~0.5%) and discount rate, or liquidation value(-1~1%) and discount rate. Sensitivity of fair values to unobservable parameters of private equity fund is practically impossible, but in the case of equity fund composed of real estate, the changes in fair value are calculated by shifting correlation between discount rate of cash flows from rent(-1~1%) and volatilities of real estate price(-1~1%). |
6.2.4 Day one gain or loss
If the Group uses a valuation technique that incorporates data not obtained from observable markets for the fair value at initial recognition of financial instruments, there could be a difference between the transaction price and the amount determined using that valuation technique. In these circumstances, the fair value of financial instruments is recognized as the transaction price and the difference is deferred and not recognized in profit or loss, and is amortized by using the straight linestraight-line method over the life of the financial instruments.instrument. If the fair value of the financial instruments is subsequently determined using observable market inputs, the remaining deferred amount is recognized in profit or loss.
The aggregate difference yet to be recognized in profit or loss at the beginning and end of the period and a reconciliation of changes in the balance of this difference, are as follows:
| For the year Ended December 31, | ||||||||
| 2010 | 2011 | |||||||
| (In millions of Korean won) | ||||||||
Balance at the beginning of the period (A) | (Won) | — | (Won) | 2,168 | ||||
New transactions (B) | 6,634 | 5,878 | ||||||
Amounts recognized in profit or loss during the period (C= a+b+c) | (4,466 | ) | (3,964 | ) | ||||
a. Amortization | (962 | ) | (1,314 | ) | ||||
b. Transaction matured | 3 | — | ||||||
c. Settlement | (3,507 | ) | (2,650 | ) | ||||
|
|
|
| |||||
Balance at the end of period (A+B+C) | (Won) | 2,168 | (Won) | 4,082 | ||||
|
|
|
| |||||
| 2012 | 2013 | |||||||
| (In millions of Korean won) | ||||||||
Balance at the beginning of the year (A) | ₩ | 4,082 | ₩ | 8,652 | ||||
New transactions (B) | 23,677 | 3,449 | ||||||
Amounts recognized in profit or loss during the year (C= a+b) | ||||||||
a. Amortization | (7,091 | ) | (3,484 | ) | ||||
b. Settlement | (12,016 | ) | (4,427 | ) | ||||
|
|
|
| |||||
Balance at the end of the year (A+B+C) | ₩ | 8,652 | ₩ | 4,190 | ||||
|
|
|
| |||||
6.3 Carrying amounts of financial instruments by category
Financial assets and liabilities are measured at fair value or amortized cost. Measurement policies for each class of financial assets and liabilities are disclosed in Note 3, ‘Significant accounting policies’.
7. Due fromThe carrying amounts of financial institutions
The details of due from financial institutionsassets and liabilities by category as of January 1, 2010, and December 31, 20102012 and 2011,2013, are as follows:
| As of January 1, | As of December 31, | |||||||||||||||||||
Financial | Interest rate(%) | 2010 | 2010 | 2011 | ||||||||||||||||
| (In millions of Korean won) | ||||||||||||||||||||
Due from financial institutions in Korean won | Due from Bank of Korea | Bank of Korea | 0.00~3.35 | (Won) | 5,597,119 | (Won) | 2,825,109 | (Won) | 3,757,108 | |||||||||||
Due from banking institutions | The Korea Exchange Bank and others | 0.01~7.15 | 136,728 | 296,732 | 371,225 | |||||||||||||||
Due from others | The Korea Exchange and others | 0.00~3.37 | 367,815 | 888,733 | 1,888,260 | |||||||||||||||
|
|
|
|
|
| |||||||||||||||
| 6,101,662 | 4,010,574 | 6,016,593 | ||||||||||||||||||
|
|
|
|
|
| |||||||||||||||
Due from financial institutions in foreign currencies | Due from banks in foreign currencies | Bank of Korea and others | 0.00~0.17 | 233,700 | 269,498 | 321,689 | ||||||||||||||
Time deposits in foreign currencies | Agricultural Bank of China TIANJIN and others | 0.17~6.05 | 383,518 | 286,242 | 187,294 | |||||||||||||||
Due from others | Sumitomo Mitsui Banking Corporation and others | 0.00~0.10 | 25,071 | 25,738 | 30,451 | |||||||||||||||
|
|
|
|
|
| |||||||||||||||
| 642,289 | 581,478 | 539,434 | ||||||||||||||||||
|
|
|
|
|
| |||||||||||||||
| (Won) | 6,743,951 | (Won) | 4,592,052 | (Won) | 6,556,027 | |||||||||||||||
|
|
|
|
|
| |||||||||||||||
| 2012 | ||||||||||||||||||||||||||||
| Financial assets at fair value through profit or loss | ||||||||||||||||||||||||||||
| Held for trading | Designated at fair value through profit or loss | Loans and receivables | Available- for-sale financial assets | Held-to- Maturity financial assets | Derivatives held for hedging | Total | ||||||||||||||||||||||
| (In millions of Korean won) | ||||||||||||||||||||||||||||
Financial assets | ||||||||||||||||||||||||||||
Cash and due from financial institutions | ₩ | — | ₩ | — | ₩ | 10,592,605 | ₩ | — | ₩ | — | ₩ | — | ₩ | 10,592,605 | ||||||||||||||
Financial assets at fair value through profit or loss | 9,207,629 | 352,090 | — | — | — | — | 9,559,719 | |||||||||||||||||||||
Derivatives | 1,907,774 | — | — | — | — | 183,511 | 2,091,285 | |||||||||||||||||||||
Loans | — | — | 213,644,791 | — | — | — | 213,644,791 | |||||||||||||||||||||
Financial investments. | — | — | — | 24,211,546 | 12,255,806 | — | 36,467,352 | |||||||||||||||||||||
Other financial assets | — | — | 7,569,596 | — | — | — | 7,569,596 | |||||||||||||||||||||
|
|
|
|
|
|
|
|
|
|
|
|
|
| |||||||||||||||
Total | ₩ | 11,115,403 | ₩ | 352,090 | ₩ | 231,806,992 | ₩ | 24,211,546 | ₩ | 12,255,806 | ₩ | 183,511 | ₩ | 279,925,348 | ||||||||||||||
|
|
|
|
|
|
|
|
|
|
|
|
|
| |||||||||||||||
Due from financial institutions, classified by type
| 2012 | ||||||||||||||||||||
| Financial liabilities at fair value through profit or loss | ||||||||||||||||||||
| Held for trading | Designated at fair value through profit or loss | Financial liabilities at amortized cost | Derivatives held for hedging | Total | ||||||||||||||||
| (In millions of Korean won) | ||||||||||||||||||||
Financial liabilities | ||||||||||||||||||||
Financial liabilities at fair value through profit or loss | ₩ | 1,381,997 | ₩ | 469,138 | ₩ | — | ₩ | — | ₩ | 1,851,135 | ||||||||||
Derivatives | 1,854,216 | — | — | 200,526 | 2,054,742 | |||||||||||||||
Deposits | — | — | 197,346,205 | — | 197,346,205 | |||||||||||||||
Debts | — | — | 15,965,458 | — | 15,965,458 | |||||||||||||||
Debentures | — | — | 24,270,212 | — | 24,270,212 | |||||||||||||||
Other financial liabilities | — | — | 12,185,938 | — | 12,185,938 | |||||||||||||||
|
|
|
|
|
|
|
|
|
| |||||||||||
Total | ₩ | 3,236,213 | ₩ | 469,138 | ₩ | 249,767,813 | ₩ | 200,526 | ₩ | 253,673,690 | ||||||||||
|
|
|
|
|
|
|
|
|
| |||||||||||
Financial assets Cash and due from financial institutions Financial assets at fair value through profit or loss Derivatives Loans Financial investments Other financial assets Total 2013 Financial assets at fair
value through profit or
loss Held for
trading Designated
at fair value
through
profit or loss Loans and
receivables Available-for-sale
financial assets Held-to-Maturity
financial assets Derivatives
held for
hedging Total (In millions of Korean won) ₩ — ₩ — ₩ 14,792,654 ₩ — ₩ — ₩ — ₩ 14,792,654 8,967,006 361,736 — — — — 9,328,742 1,680,880 — — — — 138,529 1,819,409 — — 219,001,356 — — — 219,001,356 — — — 21,832,104 13,016,991 — 34,849,095 — — 6,251,679 — — — 6,251,679 ₩ 10,647,886 ₩ 361,736 ₩ 240,045,689 ₩ 21,832,104 ₩ 13,016,991 ₩ 138,529 ₩ 286,042,935
| 2013 | ||||||||||||||||||||
| Financial liabilities at fair value through profit or loss | ||||||||||||||||||||
| Held for trading | Designated at fair value through profit or loss | Financial liabilities at amortized cost | Derivatives held for hedging | Total | ||||||||||||||||
| (In millions of Korean won) | ||||||||||||||||||||
Financial liabilities | ||||||||||||||||||||
Financial liabilities at fair value through profit or loss | ₩ | 236,637 | ₩ | 878,565 | ₩ | — | ₩ | — | ₩ | 1,115,202 | ||||||||||
Derivatives | 1,580,029 | — | — | 215,310 | 1,795,339 | |||||||||||||||
Deposits | — | — | 200,882,064 | — | 200,882,064 | |||||||||||||||
Debts | — | — | 14,101,331 | — | 14,101,331 | |||||||||||||||
Debentures | — | — | 27,039,534 | — | 27,039,534 | |||||||||||||||
Other financial liabilities | — | — | 13,262,914 | — | 13,262,914 | |||||||||||||||
|
|
|
|
|
|
|
|
|
| |||||||||||
Total | ₩ | 1,816,666 | ₩ | 878,565 | ₩ | 255,285,843 | ₩ | 215,310 | ₩ | 258,196,384 | ||||||||||
|
|
|
|
|
|
|
|
|
| |||||||||||
6.4 Transfer of financial institutionassets
Transferred financial assets that are derecognized in their entirety
The Group transferred loans and other financial assets that are derecognized in their entirety to SPEs, while the maximum exposure to loss (carrying amount) from its continuing involvement in the derecognized financial assets as of January 1, 2010, and December 31, 20102012 and 2011,2013, are as follows:
| As of January 1, 2010 | ||||||||||||
| In Korean won | In foreign currencies | Total | ||||||||||
| (In millions of Korean won) | ||||||||||||
Bank of Korea | (Won) | 5,597,119 | (Won) | 137,558 | (Won) | 5,734,677 | ||||||
Other banking institutions | 136,728 | 490,643 | 627,371 | |||||||||
Other financial institutions | 367,815 | 14,088 | 381,903 | |||||||||
|
|
|
|
|
| |||||||
Total | (Won) | 6,101,662 | (Won) | 642,289 | (Won) | 6,743,951 | ||||||
|
|
|
|
|
| |||||||
Bank of Korea Other banking institutions Other financial institutions Total As of December 31, 2010 In Korean won In foreign currencies Total (In millions of Korean won) (Won) 2,825,109 (Won) 147,439 (Won) 2,972,548 296,732 421,576 718,308 888,733 12,463 901,196 (Won) 4,010,574 (Won) 581,478 (Won) 4,592,052
| As of December 31, 2011 | ||||||||||||
| In Korean won | In foreign currencies | Total | ||||||||||
| (In millions of Korean won) | ||||||||||||
Bank of Korea | (Won) | 3,757,108 | (Won) | 185,050 | (Won) | 3,942,158 | ||||||
Other banking institutions | 371,225 | 337,784 | 709,009 | |||||||||
Other financial institutions | 1,888,260 | 16,600 | 1,904,860 | |||||||||
|
|
|
|
|
| |||||||
Total | (Won) | 6,016,593 | (Won) | 539,434 | (Won) | 6,556,027 | ||||||
|
|
|
|
|
| |||||||
Restricted due from financial institutions as of January 1, 2010 and December 31, 2010, and 2011, are as follows:
| As of January 1, | As of December 31, | |||||||||||||||||
Financial Institutions | 2010 | 2010 | 2011 | Reason for | ||||||||||||||
| (In millions of Korean won) | ||||||||||||||||||
Due from financial institutions in Korean won | Due from Bank of Korea | Bank of Korea | (Won) | 5,597,119 | (Won) | 2,825,109 | (Won) | 3,757,108 | Bank of Korea Act | |||||||||
Due from banking institutions | Woori Bank and others | 161 | 4,188 | 88,827 | Pledged as collateral for the overdraft facility and others | |||||||||||||
Due from others | The Korea Exchange and others | 336,064 | 334,002 | 69,437 | Market entry deposit and others | |||||||||||||
|
|
|
|
|
| |||||||||||||
| 5,933,344 | 3,163,299 | 3,915,372 | ||||||||||||||||
|
|
|
|
|
| |||||||||||||
Due from financial institutions in foreign currencies | Due from banks in foreign currencies | Bank of Korea and others | 140,127 | 151,403 | 189,859 | Bank of Korea Act and others | ||||||||||||
Time deposits in foreign currencies | China Merchants Bank Guangzhou and others |
| 19,266 |
|
| 28,814 |
|
| 48,810 |
| China’s New Foreign Bank Regulations and others | |||||||
Due from others | Eugene Investment & Futures Co., Ltd. and others |
| 20,890 |
|
| 16,537 |
|
| 17,172 |
| Derivatives margin account and others | |||||||
|
|
|
|
|
| |||||||||||||
| 180,283 | 196,754 | 255,841 | ||||||||||||||||
|
|
|
|
|
| |||||||||||||
| (Won) | 6,113,627 | (Won) | 3,360,053 | (Won) | 4,171,213 | |||||||||||||
|
|
|
|
|
| |||||||||||||
8. Assets pledged as collaterals
The details of assets pledged as collaterals as of January 1, 2010, and December 31, 2010 and 2011, are as follows:
| As of January 1, 2010 | ||||||||||||
Assets pledged | Pledgee | Carrying amount | Collateralized amount | Reason of pledge | ||||||||
| (In millions of Korean won) | ||||||||||||
Financial assets held for trading | Korea Securities Depository and others | (Won) | 117,883 | (Won) | 112,195 | Bonds sold under repurchase agreements | ||||||
Korea Securities Depository and others | 1,179,515 | 1,133,917 | Securities lending transactions | |||||||||
Samsung Futures Inc. and others | 41,940 | 38,145 | Derivatives transitions | |||||||||
|
|
|
| |||||||||
Sub-total | 1,339,338 | 1,284,257 | ||||||||||
|
|
|
| |||||||||
Available-for-sale financial assets | Korea Securities Depository and others | 325,747 | 318,531 | Bonds sold under repurchase agreements | ||||||||
Korea Securities Depository and others | 5,123 | 5,000 | Securities lending transactions | |||||||||
Bank of Korea | 18,197 | 20,000 | Borrowing from Bank of Korea | |||||||||
Samsung Futures Inc. and others | 255,044 | 234,328 | Derivatives transitions | |||||||||
Others | 631,668 | 623,123 | Other | |||||||||
|
|
|
| |||||||||
Sub-total | 1,235,779 | 1,200,982 | ||||||||||
|
|
|
| |||||||||
Held-to-maturity financial assets | Korea Securities Depository and others | 3,885,049 | 3,904,000 | Bonds sold under repurchase agreements | ||||||||
Korea Securities Depository and others | 126,621 | 135,000 | Securities lending transactions | |||||||||
Bank of Korea | 1,367,734 | 1,400,000 | Borrowings from Bank of Korea | |||||||||
Bank of Korea | 575,164 | 586,800 | Settlement risk of Bank of Korea | |||||||||
Samsung Futures Inc. and others | 575,900 | 577,070 | Derivatives transitions | |||||||||
Others | 350,474 | 350,000 | Other | |||||||||
|
|
|
| |||||||||
Sub-total | 6,880,942 | 6,952,870 | ||||||||||
|
|
|
| |||||||||
Credit card receivables | Others | 2,383,407 | 2,383,407 | Covered bond | ||||||||
Mortgage loans(1) | Others | 1,790,596 | 1,790,596 | Covered bond | ||||||||
|
|
|
| |||||||||
Total | (Won) | 13,630,062 | (Won) | 13,612,112 | ||||||||
|
|
|
| |||||||||
Assets pledged Pledgee Reason of pledge Due from financial institutions Others Securities lending transactions Sub-total Financial assets held for trading Korea Securities Depository and others Bonds sold under repurchase agreements Korea Securities Depository and others Securities lending transactions Samsung Futures Inc. and others Derivatives transitions Sub-total Available-for-sale financial assets Korea Securities Depository and others Bonds sold under repurchase agreements Korea Securities Depository and others Securities lending transactions Bank of Korea Borrowings from Bank of Korea Bank of Korea Settlement risk of Bank of Korea Samsung Futures Inc. and others Derivatives transitions Others Sub-total Held-to-maturity financial assets Korea Securities Depository and others Bonds sold under repurchase agreements Korea Securities Depository and others Securities lending transactions Bank of Korea Borrowings from Bank of Korea Bank of Korea Settlement risk of Bank of Korea Samsung Futures Inc. and others Derivatives transitions Others Other Sub-total Mortgage loans(1) Covered bond Total As of December 31, 2010 Carrying
amount Collateralized
amount (In millions of Korean won) (Won) 1,800 (Won) 1,800 1,800 1,800 72,693 69,669 1,199,627 1,144,320 24,583 21,771 1,296,903 1,235,760 228,609 220,000 5,425 5,000 19,392 20,000 706 700 21,316 20,869 619,975 600,000 Other 895,423 866,569 2,802,875 2,814,000 134,384 140,000 1,080,959 1,100,000 597,303 604,800 590,579 596,729 350,417 350,000 5,556,517 5,605,529 Others 1,565,649 1,565,649 (Won) 9,316,292 (Won) 9,275,307
Assets pledged Pledgee Reason of pledge Financial assets held for trading Korea Securities Depository and others Bonds sold under repurchase agreements Korea Securities Depository and others Securities lending transactions Samsung Futures Inc. and others Others Sub-total Available-for-sale financial assets Korea Securities Depository and others Bonds sold under repurchase agreements Samsung Futures Inc. and others Sub-total Held-to-maturity financial assets Korea Securities Depository and others Bonds sold under repurchase agreements Bank of Korea Borrowings from Bank of Korea Bank of Korea Settlement risk of Bank of Korea Samsung Futures Inc. and others Others Sub-total Mortgage loans(1) Total As of December 31, 2011 Carrying
amount Collateralized
amount (In millions of Korean won) (Won) 183,280 (Won) 178,171 647,363 602,299 105,457 95,956 Derivatives transitions 8,803 8,395 Other 944,903 884,821 29,393 29,986 5,976 5,766 Derivatives transitions 35,369 35,752 1,678,218 1,678,000 1,063,228 1,070,000 938,200 934,800 661,666 666,807 Derivatives transitions 1,224,998 1,200,300 Other 5,566,310 5,549,907 Others 1,282,791 1,282,791 Covered Bond (Won) 7,829,373 (Won) 7,753,271
|
The fair value of collateral available to sell or repledge as of January 1, 2010, and December 31, 2010 and 2011, is as follows:
| ||||||||||||
| Classification of financial | |||||||||||
| (In millions of Korean won) | ||||||||||||
| Loans and receivables | 21,288 | ||||||||||
Mezzanine/subordinate debt | Available-for-sale financial assets | 43,143 | ||||||||||
|
| |||||||||||
Total | ||||||||||||
|
| |||||||||||
| (1) | Recognized net loss from transferring loans to the SPEs amounts to ₩22,734 million. |
2013 | ||||||||||||
Type of continuing | Classification of financial | Carrying amount of continuing involvement in statement of financial position | Fair value of continuing involvement | |||||||||
| (In millions of Korean won) | ||||||||||||
KR ABS Co., Ltd. | Mezzanine/subordinate debt | Available-for-sale financial assets | ₩ | 11,434 |
| ₩ | 11,434 |
| ||||
KR ABS Second Co., Ltd.(1) | Senior debt | Loans and receivables | 26,065 | 26,227 | ||||||||
Subordinate debt | Available-for-sale financial assets |
| 33,017 |
|
| 33,017 |
| |||||
EAK ABS Co., Ltd.(2) | Subordinate debt | Available-for-sale financial assets |
| 35,020 |
|
| 35,020 |
| ||||
AP ABS First Co., Ltd.(3) | Senior debt | Loans and receivables | 67,326 | 67,353 | ||||||||
Subordinate debt | Available-for-sale financial assets |
| 16,669 |
|
| 16,669 |
| |||||
Discovery ABS First Co., Ltd.(4) | Senior debt | Loans and receivables | 23,494 | 23,547 | ||||||||
Subordinate debt | Available-for-sale financial assets |
| 21,454 |
|
| 21,454 |
| |||||
|
|
|
| |||||||||
Total | ₩ | 234,479 | ₩ | 234,721 | ||||||||
|
|
|
| |||||||||
| (1) | Recognized net loss from transferring loans to the SPEs amounts to ₩24,589 million. |
| (2) | Recognized net loss from transferring loans to the SPEs amounts to ₩2,480 million. |
| (3) | Recognized net loss from transferring loans to the SPEs amounts to ₩18,556 million. |
| (4) | Recognized net loss from transferring loans to the SPEs amounts to ₩37,975 million. |
| (5) | ||||||||
In addition to the above, there were gains from the transfer of non-performing loans to the National Happiness Fund (‘the Fund’) amounting to ₩ 57,826 million as of December 31, | ||||||||
| ||||||||
| ||||||||
| ||||||||
| ||||||||
Loaned securitiesTransferred financial assets that are not derecognized in their entirety
The Group securitized the loans and received the subordinated debts as part of consideration related to the securitization to provide credit enhancements to other senior debtors, and this transaction was recognized by the Group as collateralized debts. The liabilities and related securitized assets as of January 1, 2010, and December 31, 20102012 and 2011,2013, are as follows:
| As of January 1, | As of December 31, | Borrower | ||||||||||||
| 2010 | 2010 | 2011 | ||||||||||||
| (In millions of Korean won) | ||||||||||||||
Government and public bonds | (Won) | 239,362 | (Won) | 880,448 | (Won) | 170,279 | Korea Securities Finance Corp., Korea Securities Depository and others | |||||||
Stocks | 30,300 | 23,645 | 26,766 | Korea Securities Depository and others | ||||||||||
|
|
|
|
|
| |||||||||
Total | (Won) | 269,662 | (Won) | 904,093 | (Won) | 197,045 | ||||||||
|
|
|
|
|
| |||||||||
| 2012 | ||||||||||||||||||||
| Liabilities arising from asset-backed securities | ||||||||||||||||||||
| Carrying amount of assets (Underlying assets) | Carrying amount of the associated liabilities (Senior debentures) | Fair value of assets (Underlying assets) | Fair value of the associated liabilities (Senior debentures) | Net Position | ||||||||||||||||
| (In millions of Korean won) | ||||||||||||||||||||
KB Mortgage Loan First Securitization Specialty Co., Ltd | ₩ | 361,668 | ₩ | 249,668 | ₩ | 361,668 | ₩ | 250,835 | ₩ | 110,833 | ||||||||||
KAMCO Value Recreation Third Securitization Specialty Co., Ltd | 9,247 | 3,258 | 9,247 | 3,258 | 5,989 | |||||||||||||||
KH First Co., Ltd.(1) | 99,762 | 101,000 | — | — | — | |||||||||||||||
KB Kookmin Card First Securitization Co., Ltd.(1) | 601,924 | 319,664 | — | — | — | |||||||||||||||
Wise Mobile First Securitization Specialty(1) | 533,936 | 569,170 | — | — | — | |||||||||||||||
| 2013 | ||||||||||||||||||||
| Liabilities arising from asset-backed securities | ||||||||||||||||||||
| Carrying amount of assets (Underlying assets) | Carrying amount of the associated liabilities (Senior debentures) | Fair value of assets (Underlying assets) | Fair value of the associated liabilities (Senior debentures) | Net Position | ||||||||||||||||
| (In millions of Korean won) | ||||||||||||||||||||
KB Mortgage Loan First Securitization Specialty Co., Ltd | ₩ | 295,679 | ₩ | 193,062 | ₩ | 295,679 | ₩ | 192,972 | ₩ | 102,707 | ||||||||||
KAMCO Value Recreation Third Securitization Specialty Co., Ltd | 8,291 | 1,958 | 8,291 | 1,958 | 6,333 | |||||||||||||||
KH First Co., Ltd.(1) | 99,763 | 100,900 | — | — | — | |||||||||||||||
KB Kookmin Card First Securitization Co., Ltd.(1) | 568,916 | 315,845 | — | — | — | |||||||||||||||
Wise Mobile First Securitization Specialty (1) | 289,873 | 329,785 | — | — | — | |||||||||||||||
Wise Mobile Second Securitization Specialty(1) | 318,814 | 374,733 | — | — | — | |||||||||||||||
Wise Mobile Third Securitization Specialty (1) | 292,321 | 343,736 | — | — | — | |||||||||||||||
Wise Mobile Fourth Securitization Specialty (1) | 186,268 | 199,802 | — | — | — | |||||||||||||||
Wise Mobile Fifth Securitization Specialty (1) | 320,538 | 339,631 | — | — | — | |||||||||||||||
Wise Mobile Sixth Securitization Specialty (1) | 342,478 | 359,534 | — | — | — | |||||||||||||||
Wise Mobile Seventh Securitization Specialty (1) | 328,685 | 349,485 | — | — | — | |||||||||||||||
| (1) | According to purchase agreements with third-party investors, the Group provides purchase commitments to third-party investors over the associated liabilities. Furthermore, as the third-party investors also have right of recourse to the asset-backed security, the Group did not disclose the fair value of the above liabilities. |
Securities borrowedunder repurchase agreements and loaned securities
In contracts such as repurchase agreements and securities lending transactions, the Group continues to recognize the financial assets on the statements of financial position since it transfers the financial assets but those transactions are not qualified for derecognition. A financial asset is sold under a reverse repurchase agreement to repurchase the same asset at a fixed price, or loaned under a securities lending agreement to be returned the same asset. Thus, the Group retains substantially all the risks and rewards of ownership of the financial asset.
The transferred assets amount and related amount of liabilities as of January 1, 2010, and December 31, 20102012 and 2011,2013, are as follows:
| As of January 1, | As of December 31, | Borrower | ||||||||||||
| 2010 | 2010 | 2011 | ||||||||||||
| (In millions of Korean won) | ||||||||||||||
Government and public bonds | (Won) | 543,076 | (Won) | 656,243 | (Won) | 18,422 | Korea Securities Finance Corp., Korea Securities Depository | |||||||
Stocks | 8,101 | 33,622 | 52,075 | Korea Securities Depository and others | ||||||||||
|
|
|
|
|
| |||||||||
Total | (Won) | 551,177 | (Won) | 689,865 | (Won) | 70,497 | ||||||||
|
|
|
|
|
| |||||||||
| 2012 | ||||||||
| Carrying amount of transferred assets | Carrying amount of related liabilities | |||||||
| (In millions of Korean won) | ||||||||
Reverse repurchase, securities lending and similar agreements | ₩ | 1,068,690 | ₩ | 1,003,348 | ||||
Loaned securities | ||||||||
Government bond | 228,912 | — | ||||||
Stock | 43,543 | — | ||||||
|
|
|
| |||||
Total | ₩ | 1,341,145 | ₩ | 1,003,348 | ||||
|
|
|
| |||||
| 2013 | ||||||||
| Carrying amount of transferred assets | Carrying amount of related liabilities | |||||||
| (In millions of Korean won) | ||||||||
Reverse repurchase, securities lending and similar agreements | ₩ | 649,309 | ₩ | 608,156 | ||||
Loaned securities | ||||||||
Government bond | 527,427 | — | ||||||
Stock | 14,296 | — | ||||||
|
|
|
| |||||
Total | ₩ | 1,191,032 | ₩ | 608,156 | ||||
|
|
|
| |||||
6.5 Offsetting financial assets and financial liabilities
The Group enters into International Derivatives Swaps and Dealers Association (“ISDA”) master netting agreements and other arrangements with the Group’s derivative and spot exchange counterparties. Similar netting agreements are also entered into with the Group’s reverse repurchase, securities and others. Pursuant to these agreements, in the event of default by one party, contracts are to be terminated and receivables and payables are to be offset. Further, as the law allows for the right to offset, domestic uncollected receivables balances and domestic accrued liabilities balances are shown in its net settlement balance in the statement of consolidated financial position.
The details of the Group’s recognized financial assets subject to enforceable master netting arrangement or similar agreement by type as of December 31, 2012 and 2013, are as follows:
| 2012 | ||||||||||||||||||||||||
| Gross amounts of recognized financial assets | Gross amounts of recognized financial liabilities offset in the statement of financial position | Net amounts of financial assets presented in the statement of financial position | Non-offsetting amount | Net amount | ||||||||||||||||||||
| Financial instruments | Cash collateral received | |||||||||||||||||||||||
| (In millions of Korean won) | ||||||||||||||||||||||||
Derivatives held for trading | ₩ | 1,811,797 | ₩ | — | ₩ | 1,811,797 | ₩ | (1,364,967 | ) | ₩ | (28,624 | ) | ₩ | 418,206 | ||||||||||
Derivatives held for hedging | 183,511 | — | 183,511 | (32,716 | ) | — | 150,795 | |||||||||||||||||
Receivable spot exchange | 1,929,721 | — | 1,929,721 | (1,929,438 | ) | — | 283 | |||||||||||||||||
Reverse repurchase, securities borrowing and similar agreements(1) | 3,635,071 | — | 3,635,071 | (3,531,000 | ) | (104,071 | ) | — | ||||||||||||||||
Other financial instruments | 18,078,061 | (15,757,167 | ) | 2,320,894 | — | — | 2,320,894 | |||||||||||||||||
|
|
|
|
|
|
|
|
|
|
|
| |||||||||||||
Total | ₩ | 25,638,161 | ₩ | (15,757,167 | ) | ₩ | 9,880,994 | ₩ | (6,858,121 | ) | ₩ | (132,695 | ) | ₩ | 2,890,178 | |||||||||
|
|
|
|
|
|
|
|
|
|
|
| |||||||||||||
| 2013 | ||||||||||||||||||||||||
| Gross amounts of recognized financial assets | Gross amounts of recognized financial liabilities offset in the statement of financial position | Net amounts of financial assets presented in the statement of financial position | Non-offsetting amount | Net amount | ||||||||||||||||||||
| Financial instruments | Cash collateral received | |||||||||||||||||||||||
| (In millions of Korean won) | ||||||||||||||||||||||||
Derivatives held for trading | ₩ | 1,593,909 | ₩ | — | ₩ | 1,593,909 | ₩ | (1,190,301 | ) | ₩ | (1,850 | ) | ₩ | 401,758 | ||||||||||
Derivatives held for hedging | 138,028 | — | 138,028 | (36,133 | ) | — | 101,895 | |||||||||||||||||
Receivable spot exchange | 2,256,532 | — | 2,256,532 | (2,255,085 | ) | — | 1,447 | |||||||||||||||||
Reverse repurchase, securities borrowing and similar agreements(1) | 4,173,200 | — | 4,173,200 | (4,173,200 | ) | — | — | |||||||||||||||||
Other financial instruments | 16,475,869 | (15,637,526 | ) | 838,343 | — | — | 838,343 | |||||||||||||||||
|
|
|
|
|
|
|
|
|
|
|
| |||||||||||||
Total | ₩ | 24,637,538 | ₩ | (15,637,526 | ) | ₩ | 9,000,012 | ₩ | (7,654,719 | ) | ₩ | (1,850 | ) | ₩ | 1,343,443 | |||||||||
|
|
|
|
|
|
|
|
|
|
|
| |||||||||||||
| (1) | Includes a portion of the securities loaned. |
The details of the Group’s recognized financial liabilities subject to enforceable master netting arrangement or similar agreement by type as of December 31, 2012 and 2013, are as follows:
| 2012 | ||||||||||||||||||||||||
| Gross amounts of recognized financial liabilities | Gross amounts of recognized financial assets offset in the statement of financial position | Net amounts of financial liabilities presented in the statement of financial position | Non-offsetting amount | Net amount | ||||||||||||||||||||
| Financial instruments | Cash collateral received | |||||||||||||||||||||||
| (In millions of Korean won) | ||||||||||||||||||||||||
Derivatives held for trading | ₩ | 1,849,256 | ₩ | — | ₩ | 1,849,256 | ₩ | (1,278,931 | ) | ₩ | — | ₩ | 570,325 | |||||||||||
Derivatives held for hedging | 200,526 | — | 200,526 | (18,161 | ) | — | 182,365 | |||||||||||||||||
Payable spot exchange | 1,929,931 | — | 1,929,931 | (1,929,438 | ) | — | 493 | |||||||||||||||||
Reverse repurchase securities lending and similar agreements(1),(2) | 2,345,166 | — | 2,345,166 | (2,345,166 | ) | — | — | |||||||||||||||||
Other financial instruments | 16,029,986 | (15,757,167 | ) | 272,819 | (151,090 | ) | — | 121,729 | ||||||||||||||||
|
|
|
|
|
|
|
|
|
|
|
| |||||||||||||
Total | ₩ | 22,354,865 | ₩ | (15,757,167 | ) | ₩ | 6,597,698 | ₩ | (5,722,786 | ) | ₩ | — | ₩ | 874,912 | ||||||||||
|
|
|
|
|
|
|
|
|
|
|
| |||||||||||||
| 2013 | ||||||||||||||||||||||||
| Gross amounts of recognized financial liabilities | Gross amounts of recognized financial assets offset in the statement of financial position | Net amounts of financial liabilities presented in the statement of financial position | Non-offsetting amount | Net amount | ||||||||||||||||||||
| Financial instruments | Cash collateral received | |||||||||||||||||||||||
| (In millions of Korean won) | ||||||||||||||||||||||||
Derivatives held for trading | ₩ | 1,579,878 | ₩ | — | ₩ | 1,579,878 | ₩ | (992,164 | ) | ₩ | — | ₩ | 587,714 | |||||||||||
Derivatives held for hedging | 204,642 | — | 204,642 | (16,320 | ) | — | 188,322 | |||||||||||||||||
Payable spot exchange | 2,256,147 | — | 2,256,147 | (2,255,085 | ) | — | 1,062 | |||||||||||||||||
Reverse repurchase securities lending and similar agreements(1),(2) | 804,726 | — | 804,726 | (804,726 | ) | — | — | |||||||||||||||||
Other financial instruments | 16,754,401 | (15,637,526 | ) | 1,116,875 | (946,800 | ) | — | 170,075 | ||||||||||||||||
|
|
|
|
|
|
|
|
|
|
|
| |||||||||||||
Total | ₩ | 21,599,794 | ₩ | (15,637,526 | ) | ₩ | 5,962,268 | ₩ | (5,015,095 | ) | ₩ | — | ₩ | 947,173 | ||||||||||
|
|
|
|
|
|
|
|
|
|
|
| |||||||||||||
| (1) | Includes repurchase agreements sold to customers |
| (2) | Includes a portion of securities sold |
7. Due from financial institutions
The details of due from financial institutions as of December 31, 2012 and 2013, are as follows:
Financial Institutions | Interest rate(%) | 2012 | 2013 | |||||||||||||
| (In millions of Korean won) | ||||||||||||||||
Due from financial institutions in Korean won | Due from Bank of Korea | Bank of Korea | 0.00~2.77 | ₩ | 3,095,038 | ₩ | 6,717,697 | |||||||||
Due from banking institutions | Hana Bank and others | 0.00~7.15 | 577,045 | 636,837 | ||||||||||||
Due from others | Samsung Securities Co., Ltd. and others | 0.10~2.93 | 3,177,727 | 3,203,452 | ||||||||||||
|
|
|
| |||||||||||||
| 6,849,810 | 10,557,986 | |||||||||||||||
|
|
|
| |||||||||||||
Due from financial institutions in foreign currencies | Due from banks in foreign currencies | Bank of Korea and others | 0.00~0.15 | 385,798 | 855,388 | |||||||||||
Time deposits in foreign currencies | China Citi Bank and others | 0.15~3.87 | 448,349 | 657,408 | ||||||||||||
Due from others | Bank of Japan and others | — | 58,540 | 23,321 | ||||||||||||
|
|
|
| |||||||||||||
| 892,687 | 1,536,117 | |||||||||||||||
|
|
|
| |||||||||||||
| ₩ | 7,742,497 | ₩ | 12,094,103 | |||||||||||||
|
|
|
| |||||||||||||
Due from financial institutions, classified by type of financial institution as of December 31, 2012 and 2013, are as follows:
| 2012 | ||||||||||||
| In Korean won | In foreign currencies | Total | ||||||||||
| (In millions of Korean won) | ||||||||||||
Bank of Korea | ₩ | 3,095,038 | ₩ | 120,143 | ₩ | 3,215,181 | ||||||
Other banking institutions | 577,045 | 738,310 | 1,315,355 | |||||||||
Other financial institutions | 3,177,727 | 34,234 | 3,211,961 | |||||||||
|
|
|
|
|
| |||||||
Total | ₩ | 6,849,810 | ₩ | 892,687 | ₩ | 7,742,497 | ||||||
|
|
|
|
|
| |||||||
| 2013 | ||||||||||||
| In Korean won | In foreign currencies | Total | ||||||||||
| (In millions of Korean won) | ||||||||||||
Bank of Korea | ₩ | 6,717,697 | �� | ₩ | 410,328 | ₩ | 7,128,025 | |||||
Other banking institutions | 636,837 | 1,105,842 | 1,742,679 | |||||||||
Other financial institutions | 3,203,452 | 19,947 | 3,223,399 | |||||||||
|
|
|
|
|
| |||||||
Total | ₩ | 10,557,986 | ₩ | 1,536,117 | ₩ | 12,094,103 | ||||||
|
|
|
|
|
| |||||||
Restricted due from financial institutions as of December 31, 2012 and 2013, are as follows:
Financial Institutions | 2012 | 2013 | Reason for restriction | |||||||||||
| (In millions of Korean won) | ||||||||||||||
Due from financial institutions in Korean won | Due from Bank of Korea | Bank of Korea | ₩ | 3,095,038 | ₩ | 6,717,697 | Bank of Korea Act | |||||||
Due from Banking institution | Hana Bank and others | 248,603 | 342,469 | Agreement for allocation of deposit | ||||||||||
| Due from others | The Korea Exchange and others | 152,908 | 102,460 | Market entry deposit and others | ||||||||||
|
|
|
| |||||||||||
| ₩ | 3,496,549 | ₩ | 7,162,626 | |||||||||||
|
|
|
| |||||||||||
Due from financial institutions in foreign currencies | Due from banks in foreign currencies | Bank of Korea and others | ₩ | 128,811 | ₩ | 482,296 | Bank of Korea Act and others | |||||||
Time deposit in foreign currencies | Itau Unibanco S.A NY Branch | 6,962 | 10,553 | Bank Act of the State of New York | ||||||||||
| Due from others | Ong First Tradition Pte. and others | 11,065 | 10,428 | Derivatives margin account and others | ||||||||||
|
|
|
| |||||||||||
| 146,838 | 503,277 | |||||||||||||
|
|
|
| |||||||||||
| ₩ | 3,643,387 | ₩ | 7,665,903 | |||||||||||
|
|
|
| |||||||||||
8. Assets pledged as collaterals
The details of assets pledged as collaterals as of December 31, 2012 and 2013, are as follows:
| 2012 | ||||||||||||
Assets pledged | Pledgee | Carrying amount | Collateralized amount | Reason of pledge | ||||||||
| (In millions of Korean won) | ||||||||||||
Due from financial institutions | Korea Federation of Savings Banks and others | ₩ | 89,000 | ₩ | 89,000 | Borrowings from Bank and others | ||||||
|
|
|
| |||||||||
Financial assets held for trading | Korea Securities Depository and others | 321,454 | 306,194 | Reverse repurchase securities lending and similar agreements | ||||||||
Korea Securities Depository and others | 1,440,316 | 1,338,186 | Securities lending transactions | |||||||||
Samsung Futures Inc. and others | 80,583 | 72,801 | Derivatives transactions | |||||||||
Others | 18,917 | 17,945 | Others | |||||||||
|
|
|
| |||||||||
Sub-total | 1,861,270 | 1,735,126 | ||||||||||
|
|
|
| |||||||||
Available-for-sale financial assets | Samsung Futures Inc. and others | 3,447 | 3,213 | Derivatives transactions | ||||||||
| Others | 400 | 400 | Others | |||||||||
|
|
| �� | |||||||||
Sub-total | 3,847 | 3,613 | ||||||||||
|
|
|
| |||||||||
Held-to-maturity financial assets | Korea Securities Depository and others | 3,602,681 | 3,602,000 | Reverse repurchase securities lending and similar agreements | ||||||||
Bank of Korea | 965,072 | 960,000 | Borrowings from Bank of Korea | |||||||||
Bank of Korea | 781,389 | 776,800 | Settlement risk of Bank of Korea | |||||||||
Samsung Futures Inc. and others | 266,113 | 266,000 | Derivatives transactions | |||||||||
| Others | 1,249,441 | 1,220,500 | Others | |||||||||
|
|
|
| |||||||||
Sub-total | 6,864,696 | 6,825,300 | ||||||||||
|
|
|
| |||||||||
Mortgage loans | Others | 1,058,470 | 1,054,834 | Covered Bond | ||||||||
|
|
|
| |||||||||
Total | ₩ | 9,877,283 | ₩ | 9,707,873 | ||||||||
|
|
|
| |||||||||
Assets pledged Pledgee Reason of pledge Due from financial institutions Korea Federation of Savings Banks and others Financial assets held for trading Korea Securities Depository and others Reverse repurchase securities lending and similar agreements Korea Securities Depository and others Securities lending transactions Samsung Futures Inc. and others Sub-total Available-for-sale financial assets Korea Securities Depository and others Securities lending transactions Samsung Futures Inc. and others Derivatives transactions Sub-total Held-to-maturity financial assets Korea Securities Depository and others Reverse repurchase securities lending and similar agreements Bank of Korea Bank of Korea Samsung Futures Inc. and others Derivatives transactions Sub-total Mortgage loans Total 2013 Carrying
amount Collateralized
amount (In millions of Korean won) ₩ 238,901 ₩ 238,901 Borrowings from Bank and others 336,154
329,391 446,126 393,981 15,570 14,589 Derivatives transactions 797,850 737,961 45,771 45,145 33,317 31,746 Others 15,100 14,370 Others 94,188 91,261 3,577,052
3,572,000 617,250 610,000 Borrowings from Bank of Korea 956,284 946,800 Settlement risk of Bank of Korea 325,616 325,521 Others 258,615 258,500 Others 5,734,817 5,712,821 Others 846,000 843,127 Covered Bond ₩ 7,711,756 ₩ 7,624,071
The fair value of collateral available to sell or repledge, and collateral sold or repledged, regardless of debtor’s default, as of December 31, 2012 and 2013, are as follows:
| 2012 | ||||||||||||
| Fair value of collateral held | Fair value of collateral sold or repledged | Total | ||||||||||
| (In millions of Korean won) | ||||||||||||
Securities | ₩ | 3,609,354 | ₩ | — | ₩ | 3,609,354 | ||||||
|
|
|
|
|
| |||||||
Total | ₩ | 3,609,354 | ₩ | — | ₩ | 3,609,354 | ||||||
|
|
|
|
|
| |||||||
| 2013 | ||||||||||||
| Fair value of collateral held | Fair value of collateral sold or repledged | Total | ||||||||||
| (In millions of Korean won) | ||||||||||||
Securities | ₩ | 4,258,909 | ₩ | — | ₩ | 4,258,909 | ||||||
|
|
|
|
|
| |||||||
Total | ₩ | 4,258,909 | ₩ | — | ₩ | 4,258,909 | ||||||
|
|
|
|
|
| |||||||
9. Derivative financial instruments and hedge accounting
The Group’s derivative operations focus on addressing the needs of the Group’s corporate clients to hedge their risk exposure and to hedge the Group’s risk exposure that results from such client contracts. The Group also engages in derivative trading activities to hedge the interest rate and foreign currency risk exposures that arise from the Group’s own assets and liabilities. In addition, the Group engages in proprietary trading of derivatives within the Group’s regulated open position limits.
The Group provides and trades a range of derivatives products, including:
Interest rate swaps, relating to interest rate risks in Korean won;
Cross-currency swaps, forwards and options relating to foreign exchange rate risks,
Stock price index options linked with the KOSPI index.
In particular, the Group uses cross currency swaps, interest rate swaps and others to hedge the risk of changes in fair values and in cash flows due to changes in interest rates and foreign exchange rates of subordinated debts in Korean won, structured debts and financial debentures in foreign currencies.
The details of derivative financial instruments for trading as of January 1, 2010, are as follows:
| Notional amount | Assets | Liabilities | ||||||||||
| (In millions of Korean won) | ||||||||||||
Interest rate | ||||||||||||
Futures(1) | (Won) | 3,770,071 | (Won) | — | (Won) | — | ||||||
Swaps | 87,443,588 | 501,649 | 725,419 | |||||||||
Options | 7,053,481 | 23,222 | 21,390 | |||||||||
|
|
|
|
|
| |||||||
Sub-total | 98,267,140 | 524,871 | 746,809 | |||||||||
|
|
|
|
|
| |||||||
Currency | ||||||||||||
Forwards | 35,780,010 | 1,422,589 | 464,595 | |||||||||
Futures(1) | 1,674,176 | 39 | 24 | |||||||||
Swaps | 18,755,961 | 1,040,675 | 1,227,231 | |||||||||
Options | 3,264,266 | 187,884 | 88,832 | |||||||||
|
|
|
|
|
| |||||||
Sub-total | 59,474,413 | 2,651,187 | 1,780,682 | |||||||||
|
|
|
|
|
| |||||||
Stock and index | ||||||||||||
Futures(1) | 75,044 | — | — | |||||||||
Swaps | 171,400 | 11,330 | 45,438 | |||||||||
Options | 2,871,493 | 79,320 | 277,294 | |||||||||
|
|
|
|
|
| |||||||
Sub-total | 3,117,937 | 90,650 | 322,732 | |||||||||
|
|
|
|
|
| |||||||
Credit | ||||||||||||
Swaps | 200,000 | 2,128 | — | |||||||||
|
|
|
|
|
| |||||||
Sub-total | 200,000 | 2,128 | — | |||||||||
|
|
|
|
|
| |||||||
Product | ||||||||||||
Forwards | 41,727 | 2,412 | 2,388 | |||||||||
|
|
|
|
|
| |||||||
Sub-total | 41,727 | 2,412 | 2,388 | |||||||||
|
|
|
|
|
| |||||||
Other | 60,000 | 5,608 | 5,390 | |||||||||
|
|
|
|
|
| |||||||
Total | (Won) | 161,161,217 | (Won) | 3,276,856 | (Won) | 2,858,001 | ||||||
|
|
|
|
|
| |||||||
The details of derivative financial instruments for trading as of December 31, 2010,2012 and 2013, are as follows:
| 2012 | ||||||||||||||||||||||||
| Notional amount | Assets | Liabilities | Notional amount | Assets | Liabilities | |||||||||||||||||||
| (In millions of Korean won) | (In millions of Korean won) | |||||||||||||||||||||||
Interest rate | ||||||||||||||||||||||||
Futures(1) | (Won) | 1,067,923 | (Won) | — | (Won) | — | ₩ | 1,609,679 | ₩ | — | ₩ | — | ||||||||||||
Swaps | 94,605,711 | 472,076 | 666,254 | 147,924,098 | 838,454 | 948,697 | ||||||||||||||||||
Options | 10,401,894 | 48,480 | 47,202 | 10,715,347 | 79,942 | 78,149 | ||||||||||||||||||
|
|
|
|
|
| |||||||||||||||||||
Sub-total | 106,075,528 | 520,556 | 713,456 | 160,249,124 | 918,396 | 1,026,846 | ||||||||||||||||||
|
|
|
|
|
| |||||||||||||||||||
Currency | ||||||||||||||||||||||||
Forwards | 36,849,872 | 874,400 | 308,487 | 17,280,288 | 264,578 | 328,505 | ||||||||||||||||||
Futures(1) | 609,989 | — | — | 602,051 | 974 | 7 | ||||||||||||||||||
Swaps | 16,870,518 | 932,319 | 813,419 | 14,879,808 | 576,857 | 427,227 | ||||||||||||||||||
Options | 1,017,904 | 14,139 | 14,332 | 334,912 | 3,215 | 2,638 | ||||||||||||||||||
|
|
|
|
|
| |||||||||||||||||||
Sub-total | 55,348,283 | 1,820,858 | 1,136,238 | 33,097,059 | 845,624 | 758,377 | ||||||||||||||||||
|
|
|
|
|
| |||||||||||||||||||
Stock and index | ||||||||||||||||||||||||
Futures(1) | 168,621 | — | — | 174,997 | — | — | ||||||||||||||||||
Swaps | 7,638 | 2,114 | — | 355,995 | 18,056 | 6,879 | ||||||||||||||||||
Options | 2,099,162 | 40,663 | 143,359 | 1,938,069 | 56,376 | 60,952 | ||||||||||||||||||
|
|
|
|
|
| |||||||||||||||||||
Sub-total | 2,275,421 | 42,777 | 143,359 | 2,469,061 | 74,432 | 67,831 | ||||||||||||||||||
|
|
|
|
|
| |||||||||||||||||||
Credit | ||||||||||||||||||||||||
Swaps | 200,000 | 1,958 | — | |||||||||||||||||||||
Commodity | ||||||||||||||||||||||||
Futures(1) | 3,856 | 88 | 2 | |||||||||||||||||||||
|
|
|
|
|
| |||||||||||||||||||
Sub-total | 200,000 | 1,958 | — | 3,856 | 88 | 2 | ||||||||||||||||||
|
|
|
|
|
| |||||||||||||||||||
Other | 60,000 | 3,742 | 3,568 | 60,000 | 69,234 | 1,160 | ||||||||||||||||||
|
|
|
|
|
| |||||||||||||||||||
Total | (Won) | 163,959,232 | (Won) | 2,389,891 | (Won) | 1,996,621 | ₩ | 195,879,100 | ₩ | 1,907,774 | ₩ | 1,854,216 | ||||||||||||
|
|
|
|
|
| |||||||||||||||||||
The details of derivative financial instruments for trading as of December 31, 2011, are as follows:
| 2013 | ||||||||||||||||||||||||
| Notional amount | Assets | Liabilities | Notional amount | Assets | Liabilities | |||||||||||||||||||
| (In millions of Korean won) | (In millions of Korean won) | |||||||||||||||||||||||
Interest rate | ||||||||||||||||||||||||
Futures(1) | (Won) | 1,924,542 | (Won) | — | (Won) | — | ₩ | 928,684 | ₩ | — | ₩ | — | ||||||||||||
Swaps | 110,920,785 | 519,217 | 653,983 | 141,275,150 | 582,544 | 639,695 | ||||||||||||||||||
Options | 11,997,483 | 69,952 | 69,979 | 8,285,091 | 45,063 | 85,906 | ||||||||||||||||||
|
|
|
|
|
| |||||||||||||||||||
Sub-total | 124,842,810 | 589,169 | 723,962 | 150,488,925 | 627,607 | 725,601 | ||||||||||||||||||
|
|
|
|
|
| |||||||||||||||||||
Currency | ||||||||||||||||||||||||
Forwards | 31,316,223 | 916,479 | 405,570 | 23,055,704 | 241,804 | 289,629 | ||||||||||||||||||
Futures(1) | 212,052 | — | 125 | 415,560 | 219 | 15 | ||||||||||||||||||
Swaps | 16,341,586 | 509,085 | 551,918 | 17,414,405 | 693,116 | 503,663 | ||||||||||||||||||
Options | 348,643 | 3,151 | 1,401 | 273,745 | 2,428 | 1,492 | ||||||||||||||||||
|
|
|
|
|
| |||||||||||||||||||
Sub-total | 48,218,504 | 1,428,715 | 959,014 | 41,159,414 | 937,567 | 794,799 | ||||||||||||||||||
|
|
|
|
|
| |||||||||||||||||||
Stock and index | ||||||||||||||||||||||||
Futures(1) | 85,419 | — | — | 136,624 | — | 95 | ||||||||||||||||||
Swaps | 97,942 | 1,416 | 6,385 | 477,143 | 17,565 | 15,168 | ||||||||||||||||||
Options | 1,049,752 | 198,295 | 213,668 | 1,982,455 | 30,006 | 35,118 | ||||||||||||||||||
|
|
|
|
|
| |||||||||||||||||||
Sub-total | 1,233,113 | 199,711 | 220,053 | 2,596,222 | 47,571 | 50,381 | ||||||||||||||||||
|
|
|
|
|
| |||||||||||||||||||
Product | ||||||||||||||||||||||||
Forwards | 3,351 | 279 | — | |||||||||||||||||||||
Commodity | ||||||||||||||||||||||||
Futures(1) | 2,024 | 121 | — | |||||||||||||||||||||
|
|
|
|
|
| |||||||||||||||||||
Sub-total | 3,351 | 279 | — | 2,024 | 121 | — | ||||||||||||||||||
|
|
|
|
|
| |||||||||||||||||||
Other | 60,000 | 2,440 | 2,314 | 60,000 | 68,014 | 9,248 | ||||||||||||||||||
|
|
|
|
|
| |||||||||||||||||||
Total | (Won) | 174,357,778 | (Won) | 2,220,314 | (Won) | 1,905,343 | ₩ | 194,306,585 | ₩ | 1,680,880 | ₩ | 1,580,029 | ||||||||||||
|
|
|
|
|
| |||||||||||||||||||
| (1) | A gain or loss from daily |
Fair value hedge
The details of derivatives designated as fair value hedging instruments as of January 1, 2010,December 31, 2012 and 2013, are as follows:
| 2012 | ||||||||||||||||||||||||
| Notional amount | Assets | Liabilities | Notional amount | Assets | Liabilities | |||||||||||||||||||
| (In millions of Korean won) | (In millions of Korean won) | |||||||||||||||||||||||
Interest rate | ||||||||||||||||||||||||
Swaps | (Won) | 4,988,590 | (Won) | 115,535 | (Won) | 78,740 | ₩ | 1,921,251 | ₩ | 180,719 | ₩ | 6,642 | ||||||||||||
Currency | ||||||||||||||||||||||||
Swaps | 1,167,600 | — | 167,130 | 1,071,100 | — | 183,929 | ||||||||||||||||||
Other | 190,000 | — | 34,523 | 140,000 | 2,348 | 2,658 | ||||||||||||||||||
|
|
|
|
|
| |||||||||||||||||||
Total | (Won) | 6,346,190 | (Won) | 115,535 | (Won) | 280,393 | ₩ | 3,132,351 | ₩ | 183,067 | ₩ | 193,229 | ||||||||||||
|
|
|
|
|
| |||||||||||||||||||
The details of derivatives designated as fair value hedging instruments as of December 31, 2010, are as follows:
| Notional amount | Assets | Liabilities | ||||||||||
| (In millions of Korean won) | ||||||||||||
Interest rate | ||||||||||||
Swaps | (Won) | 4,440,700 | (Won) | 205,230 | (Won) | 21,205 | ||||||
Currency | ||||||||||||
Swaps | 1,138,900 | — | 193,376 | |||||||||
Other | 190,000 | — | 25,157 | |||||||||
|
|
|
|
|
| |||||||
Total | (Won) | 5,769,600 | (Won) | 205,230 | (Won) | 239,738 | ||||||
|
|
|
|
|
| |||||||
The details of derivatives designated as fair value hedging instruments as of December 31, 2011, are as follows:
| 2013 | ||||||||||||||||||||||||
| Notional amount | Assets | Liabilities | Notional amount | Assets | Liabilities | |||||||||||||||||||
| (In millions of Korean won) | (In millions of Korean won) | |||||||||||||||||||||||
Interest rate | ||||||||||||||||||||||||
Swaps | (Won) | 4,343,294 | (Won) | 206,560 | (Won) | 12,564 | ₩ | 1,951,013 | ₩ | 137,445 | ₩ | — | ||||||||||||
Currency | ||||||||||||||||||||||||
Futures | 42,048 | 502 | — | |||||||||||||||||||||
Swaps | 1,153,300 | — | 127,780 | 1,055,300 | — | 195,800 | ||||||||||||||||||
Other | 190,000 | — | 12,800 | 140,000 | — | 8,842 | ||||||||||||||||||
|
|
|
|
|
| |||||||||||||||||||
Total | (Won) | 5,686,594 | (Won) | 206,560 | (Won) | 153,144 | ₩ | 3,188,361 | ₩ | 137,947 | ₩ | 204,642 | ||||||||||||
|
|
|
|
|
| |||||||||||||||||||
Gains and losses from fair value hedging instruments and hedged items attributable to the hedged risk for the years ended December 31, 20102011, 2012 and 2011,2013, are as follows:
| For the year Ended December 31, | ||||||||
| 2010 | 2011 | |||||||
| (In millions of Korean won) | ||||||||
Gains (losses) on hedging instruments | (Won) | 102,691 | (Won) | 108,507 | ||||
Gains (losses) on the hedged item attributable to the hedged risk | (87,292 | ) | (84,914 | ) | ||||
|
|
|
| |||||
Total | (Won) | 15,399 | (Won) | 23,593 | ||||
|
|
|
| |||||
| 2011 | 2012 | 2013 | ||||||||||
| (In millions of Korean won) | ||||||||||||
Gains(losses) on hedging instruments | ₩ | 108,507 | ₩ | (14,654 | ) | ₩ | (48,545 | ) | ||||
Gains(losses) on the hedged item attributable to the hedged risk | (84,914 | ) | 37,641 | 81,428 | ||||||||
|
|
|
|
|
| |||||||
Total | ₩ | 23,593 | ₩ | 22,987 | ₩ | 32,883 | ||||||
|
|
|
|
|
| |||||||
Cash flow hedge
The details of derivatives designated as cash flow hedging instruments as of December 31, 2011,2012 and 2013, are as follows:
| 2012 | ||||||||||||||||||||||||
| Notional amount | Assets | Liabilities | Notional amount | Assets | Liabilities | |||||||||||||||||||
| (In millions of Korean won) | (In millions of Korean won) | |||||||||||||||||||||||
Interest rate | ||||||||||||||||||||||||
Swaps | (Won) | 350,000 | (Won) | — | (Won) | 1,086 | ₩ | 1,065,000 | ₩ | 444 | ₩ | 7,013 | ||||||||||||
Currency | ||||||||||||||||||||||||
Swaps | 345,990 | 21,581 | — | 321,330 | — | 284 | ||||||||||||||||||
|
|
|
|
|
| |||||||||||||||||||
Total | (Won) | 695,990 | (Won) | 21,581 | (Won) | 1,086 | ₩ | 1,386,330 | ₩ | 444 | ₩ | 7,297 | ||||||||||||
|
|
|
|
|
| |||||||||||||||||||
Meanwhile, there were no derivatives designated as cash flow hedging instruments as of January 1, 2010, or December 31, 2010.
| 2013 | ||||||||||||
| Notional amount | Assets | Liabilities | ||||||||||
| (In millions of Korean won) | ||||||||||||
Interest rate | ||||||||||||
Swaps | ₩ | 1,403,000 | ₩ | 582 | ₩ | 4,902 | ||||||
Currency | ||||||||||||
Swaps | 316,590 | — | 5,766 | |||||||||
|
|
|
|
|
| |||||||
Total | ₩ | 1,719,590 | ₩ | 582 | ₩ | 10,668 | ||||||
|
|
|
|
|
| |||||||
Gains and losses from cash flow hedging instruments and hedged items attributable to the hedged risk for the yearyears ended December 31, 2011, 2012 and 2013, are as follows:
| ||||
| ||||
| ||||
| 2011 | 2012 | 2013 | ||||||||||
| (In millions of Korean won) | ||||||||||||
Gains(losses) on hedging instruments | ₩ | 21,631 | ₩ | (27,006 | ) | ₩ | (3,068 | ) | ||||
Gains(losses) on the hedged item attributable to the hedged risk | 21,631 | (26,838 | ) | (2,990 | ) | |||||||
|
|
|
|
|
| |||||||
Ineffectiveness recognized in profit or loss | ₩ | — | ₩ | (168 | ) | ₩ | (78 | ) | ||||
|
|
|
|
|
| |||||||
Amounts recognized in other comprehensive income and reclassified from equity to profit or loss for the yearyears ended December 31, 2011, 2012 and 2013, are as follows:
| ||||
| ||||
| ||||
| ||||
| 2011 | 2012 | 2013 | ||||||||||
| (In millions of Korean won) | ||||||||||||
Amount recognized in other comprehensive income | ₩ | 21,631 | ₩ | (26,838 | ) | ₩ | (2,990 | ) | ||||
Amount reclassified from equity to profit or loss | (23,193 | ) | 25,000 | 5,227 | ||||||||
Tax effect | 241 | 1,025 | (619 | ) | ||||||||
|
|
|
|
|
| |||||||
Total | ₩ | (1,321 | ) | ₩ | (813 | ) | ₩ | 1,618 | ||||
|
|
|
|
|
| |||||||
10. Loans
Loans as of January 1, 2010, and December 31, 20102012 and 2011,2013, are as follows:
| As of January 1, | As of December 31, | |||||||||||||||||||
| 2010 | 2010 | 2011 | 2012 | 2013 | ||||||||||||||||
| (In millions of Korean won) | (In millions of Korean won) | |||||||||||||||||||
Loans | (Won) | 199,709,250 | (Won) | 201,065,468 | (Won) | 215,155,061 | ₩ | 216,487,114 | ₩ | 221,439,295 | ||||||||||
Deferred loan origination fees and costs | 246,348 | 311,712 | 399,871 | 426,336 | 423,245 | |||||||||||||||
Less: Allowances for loan losses | (3,268,754 | ) | (3,756,176 | ) | (3,447,905 | ) | (3,268,659 | ) | (2,861,184 | ) | ||||||||||
|
|
|
|
| ||||||||||||||||
Carrying amount | (Won) | 196,686,844 | (Won) | 197,621,004 | (Won) | 212,107,027 | ₩ | 213,644,791 | ₩ | 219,001,356 | ||||||||||
|
|
|
|
| ||||||||||||||||
Loans to banks as of January 1, 2010, and December 31, 20102012 and 2011,2013, are as follows:
| As of January 1, | As of December 31, | |||||||||||||||||||
| 2010 | 2010 | 2011 | 2012 | 2013 | ||||||||||||||||
| (In millions of Korean won) | (In millions of Korean won) | |||||||||||||||||||
Loans | (Won) | 2,158,108 | (Won) | 2,819,202 | (Won) | 3,987,658 | ₩ | 4,397,742 | ₩ | 6,335,056 | ||||||||||
Less: Allowances for loan losses | (1,665 | ) | (1,158 | ) | (334 | ) | (9 | ) | (25 | ) | ||||||||||
|
|
|
|
| ||||||||||||||||
Carrying amount | (Won) | 2,156,443 | (Won) | 2,818,044 | (Won) | 3,987,324 | ₩ | 4,397,733 | ₩ | 6,335,031 | ||||||||||
|
|
|
|
| ||||||||||||||||
Loans to customers other than banks as of January 1, 2010, and December 31, 20102012 and 2011,2013, consist of:
| As of January 1, 2010 | 2012 | |||||||||||||||||||||||||||||||
| Retail | Corporate | Credit card | Total | Retail | Corporate | Credit card | Total | |||||||||||||||||||||||||
| (In millions of Korean won) | (In millions of Korean won) | |||||||||||||||||||||||||||||||
Loans in Korean won | (Won) | 98,315,503 | (Won) | 74,534,415 | (Won) | — | (Won) | 172,849,918 | ₩ | 102,234,562 | ₩ | 83,653,562 | ₩ | — | ₩ | 185,888,124 | ||||||||||||||||
Loans in foreign currencies | 54,686 | 4,534,360 | — | 4,589,046 | 71,974 | 3,466,302 | — | 3,538,276 | ||||||||||||||||||||||||
Domestic import usance bills | — | 2,354,936 | — | 2,354,936 | — | 3,595,143 | — | 3,595,143 | ||||||||||||||||||||||||
Off-shore funding loans | — | 1,134,125 | — | 1,134,125 | — | 753,885 | — | 753,885 | ||||||||||||||||||||||||
Call loans | — | 119,627 | — | 119,627 | — | 1,193,334 | — | 1,193,334 | ||||||||||||||||||||||||
Bills bought in Korean won | — | 19,179 | — | 19,179 | — | 30,343 | — | 30,343 | ||||||||||||||||||||||||
Bills bought in foreign currencies | — | 2,059,861 | — | 2,059,861 | — | 2,522,110 | — | 2,522,110 | ||||||||||||||||||||||||
Guarantee payments under payment guarantee | — | 59,090 | — | 59,090 | — | 45,154 | — | 45,154 | ||||||||||||||||||||||||
Credit card receivables in won | — | — | 11,364,023 | 11,364,023 | ||||||||||||||||||||||||||||
Credit card receivables in Korean won | — | — | 11,871,313 | 11,871,313 | ||||||||||||||||||||||||||||
Credit card receivables in foreign currencies | — | — | 830 | 830 | — | — | 2,538 | 2,538 | ||||||||||||||||||||||||
Bonds purchased under repurchase agreements | — | 3,246,837 | — | 3,246,837 | ||||||||||||||||||||||||||||
Reverse repurchase agreements | — | 1,251,000 | — | 1,251,000 | ||||||||||||||||||||||||||||
Privately placed bonds | — | 18 | — | 18 | — | 603,667 | — | 603,667 | ||||||||||||||||||||||||
Factored receivables | 1,198,105 | 22,716 | — | 1,220,821 | ||||||||||||||||||||||||||||
|
|
|
|
|
|
|
| |||||||||||||||||||||||||
Sub-total | 98,370,189 | 88,062,448 | 11,364,853 | 197,797,490 | 103,504,641 | 97,137,216 | 11,873,851 | 212,515,708 | ||||||||||||||||||||||||
Proportion (%) | 48.70 | 45.71 | 5.59 | 100.00 | ||||||||||||||||||||||||||||
Allowances | (415,340 | ) | (2,514,803 | ) | (336,946 | ) | (3,267,089 | ) | (687,851 | ) | (2,251,309 | ) | (329,490 | ) | (3,268,650 | ) | ||||||||||||||||
|
|
|
|
|
|
|
| |||||||||||||||||||||||||
Total | (Won) | 97,954,849 | (Won) | 85,547,645 | (Won) | 11,027,907 | (Won) | 194,530,401 | ₩ | 102,816,790 | ₩ | 94,885,907 | ₩ | 11,544,361 | ₩ | 209,247,058 | ||||||||||||||||
|
|
|
|
|
|
|
| |||||||||||||||||||||||||
Proportion (%) | 49.73 | 44.52 | 5.75 | 100.00 | ||||||||||||||||||||||||||||
| As of December 31, 2010 | 2013 | |||||||||||||||||||||||||||||||
| Retail | Corporate | Credit card | Total | Retail | Corporate | Credit card | Total | |||||||||||||||||||||||||
| (In millions of Korean won) | (In millions of Korean won) | |||||||||||||||||||||||||||||||
Loans in Korean won | (Won) | 98,996,739 | (Won) | 74,248,496 | (Won) | — | (Won) | 173,245,235 | ₩ | 104,920,187 | ₩ | 84,596,181 | ₩ | — | ₩ | 189,516,368 | ||||||||||||||||
Loans in foreign currencies | 65,681 | 4,314,827 | — | 4,380,508 | 98,614 | 2,956,418 | — | 3,055,032 | ||||||||||||||||||||||||
Domestic import usance bills | — | 2,611,208 | — | 2,611,208 | — | 2,978,478 | — | 2,978,478 | ||||||||||||||||||||||||
Off-shore funding loans | — | 962,305 | — | 962,305 | — | 669,603 | — | 669,603 | ||||||||||||||||||||||||
Call loans | — | 143,213 | — | 143,213 | — | 696,929 | — | 696,929 | ||||||||||||||||||||||||
Bills bought in Korean won | — | 21,731 | — | 21,731 | — | 14,243 | — | 14,243 | ||||||||||||||||||||||||
Bills bought in foreign currencies | — | 2,226,960 | — | 2,226,960 | — | 1,588,066 | — | 1,588,066 | ||||||||||||||||||||||||
Guarantee payments under payment guarantee | — | 191,050 | — | 191,050 | — | 38,318 | — | 38,318 | ||||||||||||||||||||||||
Credit card receivables in won | — | — | 12,409,606 | 12,409,606 | ||||||||||||||||||||||||||||
Credit card receivables in Korean won | — | — | 11,782,005 | 11,782,005 | ||||||||||||||||||||||||||||
Credit card receivables in foreign currencies | — | — | 924 | 924 | — | — | 2,453 | 2,453 | ||||||||||||||||||||||||
Bonds purchased under repurchase agreements | — | 230,000 | — | 230,000 | ||||||||||||||||||||||||||||
Reverse repurchase agreements | — | 1,683,200 | — | 1,683,200 | ||||||||||||||||||||||||||||
Privately placed bonds | — | 2,135,238 | — | 2,135,238 | — | 731,706 | — | 731,706 | ||||||||||||||||||||||||
Factored receivables | 2,724,413 | 46,670 | — | 2,771,083 | ||||||||||||||||||||||||||||
|
|
|
|
|
|
|
| |||||||||||||||||||||||||
Sub-total | 99,062,420 | 87,085,028 | 12,410,530 | 198,557,978 | 107,743,214 | 95,999,812 | 11,784,458 | 215,527,484 | ||||||||||||||||||||||||
Proportion (%) | 49.99 | 44.54 | 5.47 | 100.00 | ||||||||||||||||||||||||||||
Allowances | (520,843 | ) | (2,906,610 | ) | (327,565 | ) | (3,755,018 | ) | (580,510 | ) | (1,870,849 | ) | (409,800 | ) | (2,861,159 | ) | ||||||||||||||||
|
|
|
|
|
|
|
| |||||||||||||||||||||||||
Total | (Won) | 98,541,577 | (Won) | 84,178,418 | (Won) | 12,082,965 | (Won) | 194,802,960 | ₩ | 107,162,704 | ₩ | 94,128,963 | ₩ | 11,374,658 | ₩ | 212,666,325 | ||||||||||||||||
|
|
|
|
|
|
|
| |||||||||||||||||||||||||
Proportion (%) | 49.89 | 43.86 | 6.25 | 100.00 | ||||||||||||||||||||||||||||
Loans in Korean won Loans in foreign currencies Domestic import usance bills Off-shore funding loans Call loans Bills bought in Korean won Bills bought in foreign currencies Guarantee payments under payment guarantee Credit card receivables in won Credit card receivables in foreign currencies Bonds purchased under repurchase agreements Privately placed bonds Sub-total Allowances Total Proportion (%) As of December 31, 2011 Retail Corporate Credit card Total (In millions of Korean won) (Won) 103,855,183 (Won) 80,355,474 (Won) — (Won) 184,210,657 70,022 4,071,464 — 4,141,486 — 4,277,672 — 4,277,672 — 893,289 — 893,289 — 1,092,895 — 1,092,895 — 104,487 — 104,487 — 2,723,066 — 2,723,066 — 56,511 — 56,511 — — 12,420,308 12,420,308 — — 959 959 — 829,500 — 829,500 — 816,444 — 816,444 103,925,205 95,220,802 12,421,267 211,567,274 (635,476 ) (2,461,713 ) (350,382 ) (3,447,571 ) (Won) 103,289,729 (Won) 92,759,089 (Won) 12,070,885 (Won) 208,119,703 49.12 45.01 5.87 100.00
The changes in deferred loan origination fees and costs for the years ended December 31, 20102012 and 2011,2013, are as follows:
| For the year Ended December 31, 2010 | 2012 | |||||||||||||||||||||||||||||||||||||||
| Beginning | Increase | Decrease | Other | Ending | Beginning | Increase | Decrease | Others | Ending | |||||||||||||||||||||||||||||||
| (In millions of Korean won) | (In millions of Korean won) | |||||||||||||||||||||||||||||||||||||||
Deferred loan origination costs | ||||||||||||||||||||||||||||||||||||||||
Loans in Korean won | (Won) | 326,475 | (Won) | 152,591 | (Won) | 113,292 | (Won) | — | (Won) | 365,774 | ₩ | 448,122 | ₩ | 321,090 | ₩ | 266,700 | ₩ | — | ₩ | 502,512 | ||||||||||||||||||||
Other origination costs | 201 | 430 | 287 | — | 344 | |||||||||||||||||||||||||||||||||||
|
|
|
|
|
|
|
|
|
| |||||||||||||||||||||||||||||||
Sub-total | 326,475 | 152,591 | 113,292 | — | 365,774 | 448,323 | 321,520 | 266,987 | — | 502,856 | ||||||||||||||||||||||||||||||
|
|
|
|
|
|
|
|
|
| |||||||||||||||||||||||||||||||
Deferred loan origination fees | ||||||||||||||||||||||||||||||||||||||||
Loans in Korean won | 55,334 | 17,052 | 26,141 | — | 46,245 | �� | 43,242 | 53,166 | 26,414 | — | 69,994 | |||||||||||||||||||||||||||||
Credit card | 17,249 | 5,661 | 20,472 | — | 2,438 | 106 | — | 106 | — | — | ||||||||||||||||||||||||||||||
Other origination fees | 7,544 | 1,749 | 3,912 | (2 | ) | 5,379 | 5,104 | 3,245 | 1,803 | (20 | ) | 6,526 | ||||||||||||||||||||||||||||
|
|
|
|
|
|
|
|
|
| |||||||||||||||||||||||||||||||
Sub-total | 80,127 | 24,462 | 50,525 | (2 | ) | 54,062 | 48,452 | 56,411 | 28,323 | (20 | ) | 76,520 | ||||||||||||||||||||||||||||
|
|
|
|
|
|
|
|
|
| |||||||||||||||||||||||||||||||
Total | (Won) | 246,348 | (Won) | 128,129 | (Won) | 62,767 | (Won) | 2 | (Won) | 311,712 | ₩ | 399,871 | ₩ | 265,109 | ₩ | 238,664 | ₩ | 20 | ₩ | 426,336 | ||||||||||||||||||||
|
|
|
|
|
|
|
|
|
| |||||||||||||||||||||||||||||||
| For the year Ended December 31, 2011 | 2013 | |||||||||||||||||||||||||||||||||||||||
| Beginning | Increase | Decrease | Other | Ending | Beginning | Increase | Decrease | Others | Ending | |||||||||||||||||||||||||||||||
| (In millions of Korean won) | (In millions of Korean won) | |||||||||||||||||||||||||||||||||||||||
Deferred loan origination costs | ||||||||||||||||||||||||||||||||||||||||
Loans in Korean won | (Won) | 365,774 | (Won) | 254,099 | (Won) | 171,751 | (Won) | — | (Won) | 448,122 | ₩ | 502,512 | ₩ | 330,202 | ₩ | 288,683 | ₩ | (33,130 | ) | ₩ | 510,901 | |||||||||||||||||||
Other origination costs | — | 263 | 62 | — | 201 | 344 | 635 | 602 | — | 377 | ||||||||||||||||||||||||||||||
|
|
|
|
|
|
|
|
|
| |||||||||||||||||||||||||||||||
Sub-total | 365,774 | 254,362 | 171,813 | — | 448,323 | 502,856 | 330,837 | 289,285 | (33,130 | ) | 511,278 | |||||||||||||||||||||||||||||
|
|
|
|
|
|
|
|
|
| |||||||||||||||||||||||||||||||
Deferred loan origination fees | ||||||||||||||||||||||||||||||||||||||||
Loans in Korean won | 46,245 | 17,723 | 20,726 | — | 43,242 | 69,994 | 72,822 | 62,383 | (70 | ) | 80,363 | |||||||||||||||||||||||||||||
Credit card | 2,438 | — | 2,332 | — | 106 | |||||||||||||||||||||||||||||||||||
Other origination fees | 5,379 | 2,211 | 2,487 | 1 | 5,104 | 6,526 | 3,872 | 2,709 | (19 | ) | 7,670 | |||||||||||||||||||||||||||||
|
|
|
|
|
|
|
|
|
| |||||||||||||||||||||||||||||||
Sub-total | 54,062 | 19,934 | 25,545 | 1 | 48,452 | 76,520 | 76,694 | 65,092 | (89 | ) | 88,033 | |||||||||||||||||||||||||||||
|
|
|
|
|
|
|
|
|
| |||||||||||||||||||||||||||||||
Total | (Won) | 311,712 | (Won) | 234,428 | (Won) | 146,268 | (Won) | (1 | ) | (Won) | 399,871 | ₩ | 426,336 | ₩ | 254,143 | ₩ | 224,193 | ₩ | (33,041 | ) | ₩ | 423,245 | ||||||||||||||||||
|
|
|
|
|
|
|
|
|
| |||||||||||||||||||||||||||||||
11. Allowances for Loan Losses
The changes in the allowances for loan losses for the years ended December 31, 20102012 and 2011,2013, are as follows:
| For the year Ended December 31, 2010 | 2012 | |||||||||||||||||||||||||||||||
| Retail | Corporate | Credit card | Total | Retail | Corporate | Credit card | Total | |||||||||||||||||||||||||
| (In millions of Korean won) | (In millions of Korean won) | |||||||||||||||||||||||||||||||
Beginning | (Won) | 415,340 | (Won) | 2,516,459 | (Won) | 336,955 | (Won) | 3,268,754 | ₩ | 635,512 | ₩ | 2,462,285 | ₩ | 350,382 | ₩ | 3,448,179 | ||||||||||||||||
Written-off | (274,179 | ) | (1,615,992 | ) | (388,759 | ) | (2,278,930 | ) | (452,639 | ) | (1,203,832 | ) | (540,664 | ) | (2,197,135 | ) | ||||||||||||||||
Recoveries from written-off loans | 129,864 | 136,447 | 246,138 | 512,449 | 103,363 | 161,334 | 185,027 | 449,724 | ||||||||||||||||||||||||
Sale | (16,217 | ) | (176,044 | ) | (1,103 | ) | (193,364 | ) | (6,082 | ) | (98,865 | ) | — | (104,947 | ) | |||||||||||||||||
Provision(Reversal)(1) | 264,966 | 2,065,676 | 133,224 | 2,463,866 | ||||||||||||||||||||||||||||
Provision(1) | 401,690 | 914,516 | 336,356 | 1,652,562 | ||||||||||||||||||||||||||||
Other changes | 1,068 | (18,799 | ) | 1,132 | (16,599 | ) | 6,007 | 15,880 | (1,611 | ) | 20,276 | |||||||||||||||||||||
|
|
|
|
|
|
|
| |||||||||||||||||||||||||
Ending | (Won) | 520,842 | (Won) | 2,907,747 | (Won) | 327,587 | (Won) | 3,756,176 | ₩ | 687,851 | ₩ | 2,251,318 | ₩ | 329,490 | ₩ | 3,268,659 | ||||||||||||||||
|
|
|
|
|
|
|
| |||||||||||||||||||||||||
| For the year Ended December 31, 2011 | 2013 | |||||||||||||||||||||||||||||||
| Retail | Corporate | Credit card | Total | Retail | Corporate | Credit card | Total | |||||||||||||||||||||||||
| (In millions of Korean won) | (In millions of Korean won) | |||||||||||||||||||||||||||||||
Beginning | (Won) | 520,842 | (Won) | 2,907,747 | (Won) | 327,587 | (Won) | 3,756,176 | ₩ | 687,851 | ₩ | 2,251,318 | ₩ | 329,490 | ₩ | 3,268,659 | ||||||||||||||||
Written-off | (286,895 | ) | (1,481,877 | ) | (412,642 | ) | (2,181,414 | ) | (581,100 | ) | (1,146,767 | ) | (404,199 | ) | (2,132,066 | ) | ||||||||||||||||
Recoveries from written-off loans | 119,925 | 166,696 | 203,658 | 490,279 | 126,651 | 147,110 | 141,452 | 415,213 | ||||||||||||||||||||||||
Sale | (17,947 | ) | (221,809 | ) | (94 | ) | (239,850 | ) | (8,483 | ) | (76,413 | ) | 435 | (84,461 | ) | |||||||||||||||||
Provision(Reversal)(1) | 295,871 | 1,115,831 | 232,932 | 1,644,634 | ||||||||||||||||||||||||||||
Provision(1) | 361,253 | 720,136 | 346,064 | 1,427,453 | ||||||||||||||||||||||||||||
Other changes | 3,680 | (24,541 | ) | (1,059 | ) | (21,920 | ) | (5,662 | ) | (24,510 | ) | (3,442 | ) | (33,614 | ) | |||||||||||||||||
|
|
|
|
|
|
|
| |||||||||||||||||||||||||
Ending | (Won) | 635,476 | (Won) | 2,462,047 | (Won) | 350,382 | (Won) | 3,447,905 | ₩ | 580,510 | ₩ | 1,870,874 | ₩ | 409,800 | ₩ | 2,861,184 | ||||||||||||||||
|
|
|
|
|
|
|
| |||||||||||||||||||||||||
| (1) | Provision for credit losses in statements of comprehensive income also include |
The amounts of written-off loans, over which the Group still has a right to claim against the borrowers and guarantors, are (Won)11,725,914 million, (Won)13,105,365₩15,105,173 million and (Won)14,118,853₩15,061,182 million, as of January 1, 2010, and December 31, 20102012 and 2011,2013, respectively.
The coverage ratio of allowances for loan losses as of January 1, 2010, and December 31, 20102012 and 2011, is2013, are as follows:
| As of January 1, | As of December 31, | |||||||||||||||||||
| 2010 | 2010 | 2011 | 2012 | 2013 | ||||||||||||||||
| (In millions of Korean won) | (In millions of Korean won) | |||||||||||||||||||
Loans | (Won) | 199,955,598 | (Won) | 201,377,180 | (Won) | 215,554,932 | ₩ | 216,913,450 | ₩ | 221,862,540 | ||||||||||
Allowances for loan losses | 3,268,754 | 3,756,176 | 3,447,905 | 3,268,659 | 2,861,184 | |||||||||||||||
Ratio (%) | 1.63 | 1.87 | 1.60 | 1.51 | 1.29 | |||||||||||||||
12. Financial assets at fair value through profit or loss and Financial investments
The details of financial assets at fair value through profit or loss and financial investments as of January 1, 2010, and December 31, 20102012 and 2011,2013, are as follows:
| As of January 1, | As of December 31, | |||||||||||||||||||
| 2010 | 2010 | 2011 | 2012 | 2013 | ||||||||||||||||
| (In millions of Korean won) | (In millions of Korean won) | |||||||||||||||||||
Financial assets held for trading | ||||||||||||||||||||
Debt securities: | ||||||||||||||||||||
Government and public bonds | (Won) | 1,167,056 | (Won) | 742,484 | (Won) | 1,507,503 | ₩ | 2,376,174 | ₩ | 2,085,450 | ||||||||||
Financial bonds | 2,480,909 | 2,106,979 | 2,837,144 | 4,018,092 | 3,265,960 | |||||||||||||||
Corporate bonds | 461,517 | 459,481 | 586,416 | 1,678,842 | 1,759,993 | |||||||||||||||
Asset-backed securities | 116,450 | 171,712 | 134,943 | 105,492 | 510,159 | |||||||||||||||
Others | 59,718 | 56,043 | 110,518 | 113,015 | 204,223 | |||||||||||||||
Equity securities: | ||||||||||||||||||||
Stocks | 143,400 | 57,933 | 187,181 | 218,227 | 145,163 | |||||||||||||||
Beneficiary certificates | 146,131 | 358,295 | 224,927 | 657,948 | 955,806 | |||||||||||||||
Others | 16,781 | 14,835 | 28,625 | 39,839 | 40,252 | |||||||||||||||
|
|
|
|
| ||||||||||||||||
Total financial assets held for trading | 4,591,962 | 3,967,762 | 5,617,257 | 9,207,629 | 8,967,006 | |||||||||||||||
|
|
|
|
| ||||||||||||||||
Financial assets designated at fair value through profit or loss | ||||||||||||||||||||
Debt securities: | ||||||||||||||||||||
Financial bond | 529 | 139 | — | |||||||||||||||||
Equity securities: | ||||||||||||||||||||
Beneficiary certificates | — | 45,412 | 134,160 | 159,483 | 115,778 | |||||||||||||||
Derivative linked securities | — | — | 574,687 | 192,607 | 245,958 | |||||||||||||||
|
|
|
|
| ||||||||||||||||
Total financial assets designated at fair value through profit or loss | 529 | 45,551 | 708,847 | 352,090 | 361,736 | |||||||||||||||
|
|
|
|
| ||||||||||||||||
Total financial assets at fair value through profit or loss | (Won) | 4,592,491 | (Won) | 4,013,313 | (Won) | 6,326,104 | ₩ | 9,559,719 | ₩ | 9,328,742 | ||||||||||
|
|
|
|
| ||||||||||||||||
Available-for-sale financial assets | ||||||||||||||||||||
Debt securities: | ||||||||||||||||||||
Government and public bonds | (Won) | 6,782,883 | (Won) | 6,741,084 | (Won) | 5,988,659 | ||||||||||||||
Financial bonds | 5,913,528 | 5,758,716 | 6,432,081 | |||||||||||||||||
Corporate bonds | 3,951,988 | 4,586,077 | 5,375,387 | |||||||||||||||||
Asset-backed securities | 2,017,426 | 1,830,881 | 1,757,482 | |||||||||||||||||
Others | 203,735 | 208,966 | 180,922 | |||||||||||||||||
Equity securities: | ||||||||||||||||||||
Stocks | 1,982,409 | 1,910,970 | 1,911,108 | |||||||||||||||||
Equity investments | 64,210 | 85,131 | 87,917 | |||||||||||||||||
Beneficiary certificates | 905,244 | 1,159,723 | 643,468 | |||||||||||||||||
|
|
| ||||||||||||||||||
Total available-for-sale financial assets | 21,821,423 | 22,281,548 | 22,377,024 | |||||||||||||||||
|
|
| ||||||||||||||||||
| As of January 1, | As of December 31, | 2012 | 2013 | |||||||||||||||||
| 2010 | 2010 | 2011 | (In millions of Korean won) | |||||||||||||||||
Available-for-sale financial assets | ||||||||||||||||||||
Debt securities: | ||||||||||||||||||||
Government and public bonds | ₩ | 6,256,380 | ₩ | 6,925,617 | ||||||||||||||||
Financial bonds | 7,476,233 | 5,782,234 | ||||||||||||||||||
Corporate bonds | 6,605,556 | 4,997,788 | ||||||||||||||||||
Asset-backed securities | 1,399,015 | 1,208,241 | ||||||||||||||||||
Others | 56 | 19,408 | ||||||||||||||||||
Equity securities: | ||||||||||||||||||||
Stocks | 2,142,442 | 2,366,887 | ||||||||||||||||||
Equity investments and others | 109,832 | 97,937 | ||||||||||||||||||
Beneficiary certificates | 222,032 | 433,992 | ||||||||||||||||||
|
| |||||||||||||||||||
Total available-for-sale financial assets | 24,211,546 | 21,832,104 | ||||||||||||||||||
| (In millions of Korean won) |
|
| ||||||||||||||||||
Held-to-maturity financial assets | ||||||||||||||||||||
Debts securities: | ||||||||||||||||||||
Government and public bonds | 5,753,518 | 6,339,677 | 5,435,754 | 4,449,243 | 4,357,623 | |||||||||||||||
Financial bonds | 2,722,770 | 1,215,746 | 1,125,326 | 1,315,417 | 892,509 | |||||||||||||||
Corporate bonds | 4,497,002 | 5,960,379 | 6,155,467 | 6,212,850 | 7,400,085 | |||||||||||||||
Asset-backed securities | 241,997 | 392,300 | 338,611 | 278,296 | 366,774 | |||||||||||||||
|
|
|
|
| ||||||||||||||||
Total held-to-maturity financial assets | 13,215,287 | 13,908,102 | 13,055,158 | 12,255,806 | 13,016,991 | |||||||||||||||
|
|
|
|
| ||||||||||||||||
Total financial investments | (Won) | 35,036,710 | (Won) | 36,189,650 | (Won) | 35,432,182 | ₩ | 36,467,352 | ₩ | 34,849,095 | ||||||||||
|
|
|
|
| ||||||||||||||||
The impairment losses and the reversal of impairment losses in financial investments for the years ended December 31, 20102011, 2012 and 2011,2013, are as follows:
| For the year Ended December 31, 2010 | 2011 | |||||||||||||||||||||||
| Impairment | Reversal | Net | Impairment | Reversal | Net | |||||||||||||||||||
| (In millions of Korean won) | (In millions of Korean won) | |||||||||||||||||||||||
Available-for-sale financial assets | (Won) | (48,184 | ) | (Won) | — | (Won) | (48,184 | ) | ₩ | (51,072 | ) | ₩ | — | ₩ | (51,072 | ) | ||||||||
Held-to-maturity financial assets | (523 | ) | 4 | (519 | ) | (150 | ) | 117 | (33 | ) | ||||||||||||||
|
|
|
|
|
| |||||||||||||||||||
Total | (Won) | (48,707 | ) | (Won) | 4 | (Won) | (48,703 | ) | ₩ | (51,222 | ) | ₩ | 117 | ₩ | (51,105 | ) | ||||||||
|
|
|
|
|
| |||||||||||||||||||
| For the year Ended December 31, 2011 | 2012 | |||||||||||||||||||||||
| Impairment | Reversal | Net | Impairment | Reversal | Net | |||||||||||||||||||
| (In millions of Korean won) | (In millions of Korean won) | |||||||||||||||||||||||
Available-for-sale financial assets | (Won) | (51,072 | ) | (Won) | — | (Won) | (51,072 | ) | ₩ | 280,610 | ₩ | — | ₩ | 280,610 | ||||||||||
Held-to-maturity financial assets | (150 | ) | 117 | (33 | ) | 154 | — | 154 | ||||||||||||||||
|
|
|
|
|
| |||||||||||||||||||
Total | (Won) | (51,222 | ) | (Won) | 117 | (Won) | (51,105 | ) | ₩ | 280,764 | ₩ | — | ₩ | 280,764 | ||||||||||
|
|
|
|
|
| |||||||||||||||||||
| 2013 | ||||||||||||
| Impairment | Reversal | Net | ||||||||||
| (In millions of Korean won) | ||||||||||||
Available-for-sale financial assets | ₩ | 163,464 | — | ₩ | 163,464 | |||||||
Held-to-maturity financial assets | 5 | — | 5 | |||||||||
|
|
|
|
|
| |||||||
Total | ₩ | 163,469 | — | ₩ | 163,469 | |||||||
|
|
|
|
|
| |||||||
13. Investments in associates and joint ventures
Investments in associates and joint ventures as of January 1, 2010, and December 31, 20102012 and 2011,2013, are as follows:
| As of January 1, 2010 | ||||||||||||||||||||
| Ownership | Acquisition cost | Share of net asset amount | Carrying amount | Industry | Location | |||||||||||||||
| (%) | (In millions of Korean won) | |||||||||||||||||||
Associates | ||||||||||||||||||||
Balhae Infrastructure Fund(1) | 12.61 | (Won) | 110,962 | (Won) | 114,623 | (Won) | 114,623 | Investment finance | Korea | |||||||||||
Korea Credit Bureau Co., Ltd.(1) | 9.00 | 4,500 | 2,769 | 2,769 | Credit Information | Korea | ||||||||||||||
UAMCO., Ltd.(1) | 17.50 | 12,250 | 11,992 | 11,992 | Other finance | Korea | ||||||||||||||
JSC Bank CenterCredit(2),(5) | 30.52 | 817,539 | 226,940 | 474,502 | Banking | Kazakhstan | ||||||||||||||
Powerrex Corporation Co., Ltd.(4) | 18.75 | 1,500 | 1,782 | 1,782 | Manufacture of machine | Korea | ||||||||||||||
Semiland Co., Ltd | 24.42 | 1,470 | 1,886 | 1,886 | Manufacture | Korea | ||||||||||||||
Seho Robo Ind. Co., Ltd | �� | 22.73 | 223 | 605 | 605 | Manufacture of machine | Korea | |||||||||||||
Serit Platform Co., Ltd | 21.72 | 1,500 | 1,500 | 1,500 | Manufacture of communication equipment | Korea | ||||||||||||||
Sehwa Electronics Co., Ltd | 20.95 | 3,508 | 3,508 | 3,508 | Manufacture of electronic components | Korea | ||||||||||||||
Testian Co., Ltd.(3) | 14.29 | 500 | 500 | 500 | Manufacture of semiconductor equipment | Korea | ||||||||||||||
Ray Co., Ltd.(1) | 10.88 | 1,050 | 1,050 | 1,050 | Manufacture of radiation equipment | Korea | ||||||||||||||
|
|
|
|
|
| |||||||||||||||
Sub-total | 955,002 | 367,155 | 614,717 | |||||||||||||||||
|
|
|
|
|
| |||||||||||||||
Joint venture | ||||||||||||||||||||
Burrill-KB Life Science Fund | — | — | — | — | New growth power biotech corporation investment | Korea | ||||||||||||||
|
|
|
|
|
| |||||||||||||||
Total | (Won) | 955,002 | (Won) | 367,155 | (Won) | 614,717 | ||||||||||||||
|
|
|
|
|
| |||||||||||||||
| 2012 | ||||||||||||||||||||
| Ownership | Acquisition cost | Share of net asset amount | Carrying amount | Industry | Location | |||||||||||||||
| (%) | (In millions of Korean won) | |||||||||||||||||||
Associates | ||||||||||||||||||||
Balhae Infrastructure Fund(1). | 12.61 | ₩ | 121,817 | ₩ | 125,004 | ₩ | 125,004 | Investment finance | Korea | |||||||||||
Korea Credit Bureau Co., Ltd.(1) | 9.00 | 4,500 | 3,790 | 3,790 | Credit Information | Korea | ||||||||||||||
UAMCO., Ltd.(1) | 17.50 | 85,050 | 120,916 | 139,760 | Other finance | Korea | ||||||||||||||
JSC Bank CenterCredit | ||||||||||||||||||||
Ordinary share(2),(4) | 29.56 | 954,104 | 257,996 | 281,889 | Banking | Kazakhstan | ||||||||||||||
Preference share(2) | 93.15 | |||||||||||||||||||
KoFC KBIC Frontier Champ 2010-5(PEF) | 50.00 | 32,150 | 28,761 | 25,539 | Investment finance | Korea | ||||||||||||||
KB Global Star Game & Apps | 0.23 | 20 | 48 | 48 | SPAC | Korea | ||||||||||||||
Semiland Co., Ltd | 21.32 | 1,470 | 2,513 | 2,513 | Manufacture | Korea | ||||||||||||||
Serit Platform Co., Ltd | 21.72 | 1,500 | 1,517 | 1,517 | Manufacture of communication equipment | Korea | ||||||||||||||
Sehwa Electronics Co., Ltd | 20.95 | 3,508 | 2,955 | 2,955 | Manufacture of electronic components | Korea | ||||||||||||||
Testian Co., Ltd | 47.09 | 1,018 | 1,041 | 1,041 | Manufacture of semiconductor equipment | Korea | ||||||||||||||
DS Plant Co., Ltd.(3) | — | — | — | — | Manufacture of machine | Korea | ||||||||||||||
Joam Housing Development Co., Ltd.(1) | 15.00 | 8 | (371 | ) | — | Housing | Korea | |||||||||||||
United PF 1st Recovery Private Equity Fund(1) | 17.72 | 191,617 | 201,182 | 195,425 | Other finance | Korea | ||||||||||||||
CH Engineering Co., Ltd | 41.73 | — | 107 | — | Architectural design and Service | Korea | ||||||||||||||
Evalley Co., Ltd | 46.24 | — | — | — | Software advisory, development and supply | Korea | ||||||||||||||
Shinla Construction Co., Ltd.(5) | 20.24 | — | — | — | Specialty construction | Korea | ||||||||||||||
PyungJeon Industries Co.,LTD.(5) | 15.65 | — | — | — | Specialty construction | Korea | ||||||||||||||
Kores Co., Ltd.(5) | 16.01 | 634 | 1,384 | 1,384 | Manufacture of automobile parts | Korea | ||||||||||||||
KB GwS Private Securities Investment Trust | 26.74 | 113,880 | 124,410 | 120,939 | Investment finance | Korea | ||||||||||||||
Incheon Bridge Co., Ltd.(1) | 14.99 | 24,677 | 1,630 | 1,630 | Operation of Highways and Related facilities | Korea | ||||||||||||||
KB Star office Private real estate Investment Trust No.1 | 21.05 | 20,000 | 20,311 | 19,898 | Investment finance | Korea | ||||||||||||||
KoFC POSCO HANHWA KB shared growth Private Equity Fund | 25.00 | 6,250 | 5,606 | 4,983 | Investment finance | Korea | ||||||||||||||
NPS KBIC Private Equity Fund No. 1(1) | 2.56 | 3,393 | 4,160 | 4,160 | Investment finance | Korea | ||||||||||||||
KBIC Private Equity Fund No. 3(1) | 2.00 | 2,050 | 2,156 | 2,156 | Investment finance | Korea | ||||||||||||||
KB-Glenwood Private Equity Fund 1(1) | 0.03 | 10 | 10 | 10 | Investment finance | Korea | ||||||||||||||
|
|
|
|
|
| |||||||||||||||
Total | ₩ | 1,567,656 | ₩ | 905,126 | ₩ | 934,641 | ||||||||||||||
|
|
|
|
|
| |||||||||||||||
Industry Associates Balhae Infrastructure Fund(1) Investment finance Korea Credit Bureau Co., Ltd.(1) Credit Information UAMCO., Ltd.(1) Other finance JSC Bank CenterCredit Ordinary share(2), (5) Banking Preference share(2) KoFC KBIC Frontier Champ 2010-5 (PEF) Investment finance KB Global Star Game & Apps SPAC(1), (5) SPAC Powerrex Corporation Co., Ltd.(4) Manufacture of machine Semiland Co., Ltd Manufacture Seho Robo Ind. Co., Ltd Manufacture of machine Serit Platform Co., Ltd Manufacture of communication equipment Sehwa Electronics Co., Ltd Manufacture of electronic components Testian Co., Ltd.(3) Manufacture of semiconductor equipment Solice Co., Ltd Manufacture of machine KT Wibro infrastructure Manufacture of electronic components Joam Housing Development Co., Ltd.(1) Housing Ilssan Elecom (Shenyang) Co., Ltd Manufacture of electronic components Sub-total Joint venture Burrill-KB Life Science Fund New growth power biotech corporation investment Total As of December 31, 2010 Ownership Acquisition
cost Share of net
asset amount Carrying
amount Location (%) (In millions of Korean won) 12.61 (Won) 116,534 (Won) 120,274 (Won) 120,274 Korea 9.00 4,500 3,194 3,194 Korea 17.50 85,050 85,622 85,622 Korea 29.56 954,104 268,387 390,157 Kazakhstan 93.15 50.00 10,500 10,469 10,438 Korea 3.23 1,031 1,034 1,034 Korea 18.75 1,500 1,951 1,951 Korea 21.32 1,470 2,095 2,095 Korea 22.73 223 820 820 Korea 21.72 1,500 1,438 1,438 Korea 20.95 3,508 3,385 3,385 Korea 20.40 820 857 857 Korea 20.30 2,007 2,007 2,007 Korea 40.34 100,000 100,139 100,139 Korea 15.00 8 — — Korea 100.00 2,140 (960 ) — China 1,284,895 600,712 723,411 35.53 372 — — Korea (Won) 1,285,267 (Won) 600,712 (Won) 723,411
Industry Associates Balhae Infrastructure Fund(1) Investment finance Korea Credit Bureau Co., Ltd.(1) Credit Information UAMCO., Ltd.(1) Other finance JSC Bank CenterCredit Ordinary share(2), (5) Banking Preference share(2) KoFC KBIC Frontier Champ 2010-5 (PEF) Investment finance KB Global Star Game & Apps SPAC(1), (5) SPAC Semiland Co., Ltd Manufacture Serit Platform Co., Ltd Manufacture of communication equipment Sehwa Electronics Co., Ltd Manufacture of electronic components Testian Co., Ltd.(3) Manufacture of semiconductor equipment DS Plant Co., Ltd.(3) Manufacture of machine KT Wibro infrastructure Manufacture of electronic components Joam Housing Development Co., Ltd.(1) Housing United PF 1st Recovery Private Equity Fund(1) Other finance Ilssan Elecom (Shenyang) Co., Ltd Manufacture of electronic components Qingdao Danam Electronics Co., Ltd Manufacture of electronic components Total Industry Associates Balhae Infrastructure Fund(1). Korea Credit Bureau Co., Ltd.(1) UAMCO., Ltd.(1) JSC Bank CenterCredit Ordinary share(2),(4) Preference share(2) KoFC KBIC Frontier Champ 2010-5(PEF) Semiland Co., Ltd United PF 1st Recovery Private Equity Fund(1) CH Engineering Co., Ltd Shinla Construction Co., Ltd Kores Co., Ltd.(5) KB GwS Private Securities Investment Trust Incheon Bridge Co., Ltd.(1) Operation of Highways and Related facilities Ssangyong Engineering & Construction Co., Ltd.(5) Office and Commercial Building Construction KB Star office Private real estate Investment Trust No.1 KoFC POSCO HANHWA KB shared growth Private Equity Fund NPS KBIC Private Equity Fund No. 1(1) KBIC Private Equity Fund No. 3(1) KB-Glenwood Private Equity Fund 1(1) Terra Co., Ltd Manufacture of Hand-Operated Kitchen Appliances and Metal Ware Total As of December 31, 2011 Ownership Acquisition
cost Share of net
asset amount Carrying
amount Location (%) (In millions of Korean won) 12.61 (Won) 125,597 (Won) 128,778 (Won) 128,778 Korea 9.00 4,500 3,766 3,766 Korea 17.50 85,050 103,617 109,531 Korea 29.56 954,104 271,941 365,059 Kazakhstan 93.15 50.00 28,850 28,840 28,831 Korea 0.23 20 48 48 Korea 21.32 1,470 2,247 2,247 Korea 21.72 1,500 1,451 1,451 Korea 20.95 3,508 3,454 3,454 Korea 19.90 820 789 789 Korea — — — — Korea 40.34 100,000 104,049 104,049 Korea 15.00 8 — — Korea 18.50 148,000 149,099 143,437 Korea 100.00 2,140 (1,270 ) — China 100.00 692 692 692 China (Won) 1,456,259 (Won) 797,501 (Won) 892,132 2013 Ownership Acquisition
cost Share of
net asset
amount Carrying
amount Location (%) (In millions of Korean won) 12.61 ₩ 121,817 ₩ 124,968 ₩ 124,968 Investment finance Korea 9.00 4,500 4,185 4,185 Credit Information Korea 17.50 85,050 139,286 150,826 Other finance Korea 29.56 93.15 954,104 51,989 68,110 Banking Kazakhstan 50.00 47,580 46,496 45,393 Investment finance Korea 21.32 1,470 2,639 2,639 Manufacture Korea 17.72 191,617 203,618 197,941 Other finance Korea 41.73 — 64 — Architectural design and Service Korea 20.24 — — — Specialty construction Korea 10.39 634 1,925 1,505 Manufacture of automobile parts Korea 26.74 113,880 126,556 123,085 Investment finance Korea 14.99 24,677 (429 ) — Korea 15.64 28,779 2,490 — Korea 21.05 20,000 20,347 19,934 Investment finance Korea 25.00 14,025 11,620 10,329 Investment finance Korea 2.56 3,393 4,238 4,238 Investment finance Korea 2.00 2,050 2,223 2,223 Investment finance Korea 0.03 10 10 10 Investment finance Korea 24.06 — 20 4 Korea ₩ 1,613,586 ₩ 742,245 ₩ 755,390
| (1) | As of |
| (2) | The Group determined that ordinary shares and convertible preference shares issued by JSC Bank CenterCredit are the same in economic substance except for the voting rights, and therefore, the equity method of accounting is applied on the basis of single ownership ratio of 41.93%, calculated based on ordinary and convertible preference shares held by the Group against the total outstanding ordinary and convertible preference shares issued by JSC Bank CenterCredit. |
The Group’s ownership in DS Plant Co., Ltd. |
|
Fair value of ordinary shares of JSC Bank CenterCredit, reflecting the published market price, as of |
| (5) | Where the Group has acquired shares of entities through debt-for-equity swaps, the Group is represented in the creditor council. Therefore, the Group has significant influence over the decision-making process relating to their financial and business policies. |
Summarized financial information on associates and joint ventures:associates:
| As of January 1, 2010 | 2012(1) | |||||||||||||||||||||||||||||||||||||||||||
| Total assets | Total liabilities | Capital stock | Equity | Total assets | Total liabilities | Share capital | Equity | Share of net asset amount | Unrealized gains | Consolidated carrying amount | ||||||||||||||||||||||||||||||||||
| (In millions of Korean won) | (In millions of Korean won) | |||||||||||||||||||||||||||||||||||||||||||
Associates | ||||||||||||||||||||||||||||||||||||||||||||
Balhae Infrastructure Fund | (Won) | 911,332 | (Won) | 1,985 | (Won) | 880,301 | (Won) | 909,347 | ₩ | 993,838 | ₩ | 2,138 | ₩ | 993,030 | ₩ | 991,700 | ₩ | 125,004 | ₩ | — | ₩ | 125,004 | ||||||||||||||||||||||
Korea Credit Bureau Co., Ltd | 36,807 | 6,040 | 10,000 | 30,767 | 55,944 | 13,834 | 10,000 | 42,110 | 3,790 | — | 3,790 | |||||||||||||||||||||||||||||||||
UAMCO., Ltd | 68,710 | 185 | 350 | 68,525 | 4,906,010 | 4,215,061 | 2,430 | 690,949 | 120,916 | 18,844 | 139,760 | |||||||||||||||||||||||||||||||||
JSC Bank CenterCredit | 9,114,674 | 8,371,096 | 414,001 | 743,578 | 7,824,619 | 7,142,759 | 546,794 | 681,860 | 257,996 | 23,893 | 281,889 | |||||||||||||||||||||||||||||||||
Powerrex Corporation Co., Ltd | 21,547 | 18,244 | 800 | 3,303 | ||||||||||||||||||||||||||||||||||||||||
KoFC KBIC Frontier Champ 2010-5(PEF). | 57,779 | 257 | 64,300 | 57,522 | 28,761 | (3,222 | ) | 25,539 | ||||||||||||||||||||||||||||||||||||
KB Global Star Game & Apps SPAC | 22,108 | 1,310 | 862 | 20,798 | 48 | — | 48 | |||||||||||||||||||||||||||||||||||||
Semiland Co., Ltd | 8,771 | 4,716 | 985 | 4,055 | 12,472 | 6,901 | 985 | 5,571 | 2,513 | — | 2,513 | |||||||||||||||||||||||||||||||||
Seho Robo Ind. Co., Ltd | 6,344 | 3,684 | 966 | 2,660 | ||||||||||||||||||||||||||||||||||||||||
Serit Platform Co., Ltd | 6,213 | 3,742 | 1,000 | 2,471 | 8,134 | 5,585 | 1,000 | 2,549 | 1,517 | — | 1,517 | |||||||||||||||||||||||||||||||||
Sehwa Electronics Co., Ltd | 29,891 | 13,750 | 1,050 | 16,141 | 23,255 | 9,744 | 1,050 | 13,511 | 2,955 | — | 2,955 | |||||||||||||||||||||||||||||||||
Testian Co., Ltd | 1,793 | 1,474 | 875 | 319 | 2,771 | 1,899 | 1,030 | 872 | 1,041 | — | 1,041 | |||||||||||||||||||||||||||||||||
Ray Co., Ltd | 1,795 | 2,021 | 965 | (226 | ) | |||||||||||||||||||||||||||||||||||||||
Joint venture | ||||||||||||||||||||||||||||||||||||||||||||
Burrill-KB Life Science Fund | — | 612 | — | (612 | ) | |||||||||||||||||||||||||||||||||||||||
DS Plant Co., Ltd | 10,253 | 7,530 | 600 | 2,723 | — | — | — | |||||||||||||||||||||||||||||||||||||
Joam Housing Development Co., Ltd | 117,159 | 119,632 | 50 | (2,473 | ) | (371 | ) | 371 | — | |||||||||||||||||||||||||||||||||||
United PF 1st Recovery Private Equity Fund | 1,153,268 | 17,886 | 1,081,400 | 1,135,382 | 201,182 | (5,757 | ) | 195,425 | ||||||||||||||||||||||||||||||||||||
CH Engineering Co., Ltd.(2) | 1,088 | 833 | 158 | 255 | 107 | (107 | ) | — | ||||||||||||||||||||||||||||||||||||
Kores Co., Ltd.(3) | 75,750 | 67,105 | 11,099 | 8,645 | 1,384 | — | 1,384 | |||||||||||||||||||||||||||||||||||||
KB GwS Private Securities Investment Trust | 465,690 | 503 | 425,814 | 465,187 | 124,410 | (3,471 | ) | 120,939 | ||||||||||||||||||||||||||||||||||||
Incheon Bridge Co., Ltd | 765,522 | 754,646 | 164,621 | 10,876 | 1,630 | — | 1,630 | |||||||||||||||||||||||||||||||||||||
KB Star office Private real estate Investment Trust No.1 | 217,732 | 121,256 | 95,000 | 96,476 | 20,311 | (413 | ) | 19,898 | ||||||||||||||||||||||||||||||||||||
KoFC POSCO HANHWA KB shared growth Private Equity Fund | 23,337 | 913 | 25,000 | 22,424 | 5,606 | (623 | ) | 4,983 | ||||||||||||||||||||||||||||||||||||
NPS KBIC Private Equity Fund No. 1 | 176,650 | 14,140 | 132,541 | 162,510 | 4,160 | — | 4,160 | |||||||||||||||||||||||||||||||||||||
KBIC Private Equity Fund No. 3 | 101,931 | 79 | 102,500 | 101,852 | 2,156 | — | 2,156 | |||||||||||||||||||||||||||||||||||||
KB-Glenwood Private Equity Fund 1 | 30,632 | 1,238 | 31,100 | 29,394 | 10 | — | 10 | |||||||||||||||||||||||||||||||||||||
|
|
| ||||||||||||||||||||||||||||||||||||||||||
Total | ₩ | 905,126 | ₩ | 29,515 | ₩ | 934,641 | ||||||||||||||||||||||||||||||||||||||
|
|
| ||||||||||||||||||||||||||||||||||||||||||
Associates Balhae Infrastructure Fund Korea Credit Bureau Co., Ltd UAMCO., Ltd JSC Bank CenterCredit KoFC KBIC Frontier Champ 2010-5(PEF) KB Global Star Game & Apps SPAC Semiland Co., Ltd Serit Platform Co., Ltd Sehwa Electronics Co., Ltd Testian Co., Ltd DS Plant Co., Ltd Joam Housing Development Co., Ltd United PF 1st Recovery Private Equity Fund CH Engineering Co., Ltd.(1) Kores Co., Ltd.(3) KB GwS Private Securities Investment Trust Incheon Bridge Co., Ltd KoFC POSCO HANHWA KB shared growth Private Equity Fund KB Star office Private real estate Investment Trust No.1 NPS KBIC Private Equity Fund No. 1 KBIC Private Equity Fund No. 3. KB-Glenwood Private Equity Fund 1 2012 Operating
income Profit
(loss) Other
comprehensive
income (loss) Total
comprehensive
income (loss) Dividends (In millions of Korean won) ₩ 67,825 ₩ 61,514 ₩ — ₩ 61,514 ₩ 7,747 47,660 5,019 — 5,019 — 599,570 95,828 — 95,828 — 269,586 (30,343 ) (62,892 ) (93,235 ) 3 1,870 (6,635 ) (124 ) (6,759 ) — — 280 — 280 — 10,552 774 — 774 10 9,998 304 — 304 — 14,059 (2,640 ) — (2,640 ) — 707 80 — 80 — 10,190 (194 ) — (194 ) — 953 (2,461 ) — (2,461 ) — 98,873 48,040 — 48,040 — 714 (42 ) — (42 ) — 72,622 190 — 190 — 39,881 39,373 — 39,373 — 68,711 (29,451 ) — (29,451 ) — 106 (1,900 ) (676 ) (2,576 ) — 2,865 1,476 — 1,476 — 12,772 11,780 (4,438 ) 7,342 106 1,982 1,665 — 1,665 — (173 ) (647 ) — (647 ) —
| As of and for the Year Ended December 31, 2010 | ||||||||||||||||||||||||
| Total assets | Total liabilities | Capital stock | Equity | Revenues | Profit(loss) | |||||||||||||||||||
| (In millions of Korean won) | ||||||||||||||||||||||||
Associates | ||||||||||||||||||||||||
Balhae Infrastructure Fund | (Won) | 956,234 | (Won) | 2,061 | (Won) | 903,305 | (Won) | 954,173 | (Won) | 66,474 | (Won) | 58,580 | ||||||||||||
Korea Credit Bureau Co., Ltd | 44,983 | 9,507 | 10,000 | 35,476 | 33,055 | 4,709 | ||||||||||||||||||
UAMCO., Ltd | 1,782,180 | 1,292,911 | 2,430 | 489,269 | 27,204 | 4,745 | ||||||||||||||||||
JSC Bank CenterCredit | 9,451,778 | 8,811,764 | 546,794 | 640,014 | 240,362 | (232,669 | ) | |||||||||||||||||
KoFC KBIC Frontier Champ 2010-5 (PEF) | 20,991 | 53 | 21,000 | 20,938 | — | (63 | ) | |||||||||||||||||
KB Global Star Game & Apps SPAC | 21,124 | 1,206 | 862 | 19,918 | — | (898 | ) | |||||||||||||||||
Powerrex Corporation Co., Ltd | 16,020 | 13,218 | 800 | 2,802 | 7,675 | (500 | ) | |||||||||||||||||
Semiland Co., Ltd | 9,660 | 5,072 | 985 | 4,588 | 5,902 | 550 | ||||||||||||||||||
Seho Robo Ind. Co., Ltd | 8,696 | 5,087 | 966 | 3,609 | 6,147 | 949 | ||||||||||||||||||
Serit Platform Co., Ltd | 6,646 | 4,460 | 1,000 | 2,186 | 3,185 | (284 | ) | |||||||||||||||||
Sehwa Electronics Co., Ltd | 31,511 | 15,955 | 1,050 | 15,556 | 21,903 | (532 | ) | |||||||||||||||||
Testian Co., Ltd | 2,442 | 1,549 | 1,005 | 893 | 274 | 54 | ||||||||||||||||||
Solice Co., Ltd | 15,231 | 9,823 | 2,291 | 5,408 | 13,673 | 286 | ||||||||||||||||||
KT Wibro infrastructure | 255,680 | 7,619 | 24,792 | 248,061 | — | 139 | ||||||||||||||||||
Joam Housing Development Co., Ltd | 68,763 | 71,707 | 50 | (2,944 | ) | 595 | (2,994 | ) | ||||||||||||||||
IlssanElecom (Shenyang) Co., Ltd | 1,895 | 2,855 | 2,140 | (960 | ) | 3,620 | 17 | |||||||||||||||||
Joint venture | ||||||||||||||||||||||||
Burrill-KB Life Science Fund | — | 1,612 | 1,048 | (1,612 | ) | 1 | (2,048 | ) | ||||||||||||||||
| (1) | The amounts included in the financial statements of the associates are adjusted to reflect adjustments made by the entity, such as fair value adjustments made at the time of acquisition and adjustments for differences in accounting policies. |
| (2) | As the financial statements as of December 31, 2012 are not available, the Group applied the equity method by using the financial statements as of November 30, 2012 and adjusted for the effects of significant transactions or events that occur between the date of those financial statements and the date of the consolidated financial statements. |
| (3) | As the financial statements as of December 31, 2012 are not available, the Group applied the equity method by using the financial statements as of September 30, 2012 and adjusted for the effects of significant transactions or events that occur between the date of those financial statements and the date of the consolidated financial statements. |
As Shinla Construction Co., Ltd. is impaired capital situation as of December 31, 2013, reliable financial information is not available. Therefore, financial information of these associates is not included in the summarized financial information.
Associates Balhae Infrastructure Fund Korea Credit Bureau Co., Ltd UAMCO., Ltd JSC Bank CenterCredit KoFC KBIC Frontier Champ 2010-5 (PEF) KB Global Star Game & Apps SPAC Semiland Co., Ltd Serit Platform Co., Ltd Sehwa Electronics Co., Ltd Testian Co., Ltd DS Plant Co., Ltd KT Wibro infrastructure Joam Housing Development Co., Ltd United PF 1st Recovery Private Equity Fund IlssanElecom (Shenyang) Co., Ltd Qingdao Danam Electronics Co., Ltd Associates Balhae Infrastructure Fund Korea Credit Bureau Co., Ltd UAMCO., Ltd JSC Bank CenterCredit. KoFC KBIC Frontier Champ 2010-5(PEF) Semiland Co., Ltd. United PF 1st Recovery Private Equity Fund CH Engineering Co., Ltd.(2) Kores Co., Ltd.(3) Terra Co., Ltd.(3) KB GwS Private Securities Investment Trust Incheon Bridge Co., Ltd Ssangyong Engineering & Construction Co., Ltd.(3) KB Star office Private real estate Investment Trust No.1 KoFC POSCO HANHWA KB shared growth Private Equity Fund NPS KBIC Private Equity Fund No. 1 KBIC Private Equity Fund No. 3 KB-Glenwood Private Equity Fund 1 Total As of and for the Year Ended December 31, 2011 Total assets Total liabilities Capital stock Equity Revenues Profit(loss) (In millions of Korean won) (Won) 1,023,825 (Won) 2,187 (Won) 971,835 (Won) 1,021,638 (Won) 63,530 (Won) 55,069 51,484 9,651 10,000 41,833 40,535 6,357 3,738,326 3,146,227 2,430 592,099 468,220 106,274 8,392,599 7,744,111 546,794 648,488 352,383 10,627 58,015 334 57,700 57,681 2,210 1,065 21,755 1,260 862 20,495 — 173 11,074 6,080 985 4,994 5,996 387 5,985 3,590 1,000 2,395 4,617 (203 ) 27,378 11,487 1,050 15,891 13,812 43 2,442 1,651 1,030 791 426 62 10,431 7,166 600 3,265 12,518 601 277,933 25,963 24,792 251,970 1,719 2,310 85,714 89,485 50 (3,771 ) 18,451 (828 ) 836,104 30,162 800,000 805,942 58,529 5,942 1,094 2,364 2,140 (1,270 ) 4,360 (205 ) 1,394 702 4,733 692 — — 2013(1) Total assets Total
liabilities Share capital Equity Share of
net asset
amount Unrealized
gains Consolidated
carrying
amount (In millions of Korean won) ₩ 993,571 ₩ 2,157 ₩ 993,030 ₩ 991,414 ₩ 124,968 ₩ — ₩ 124,968 63,043 16,542 10,000 46,501 4,185 — 4,185 4,365,097 3,567,972 2,430 797,125 139,286 11,540 150,826 7,083,662 6,903,416 546,794 180,246 51,989 16,121 68,110 93,367 375 95,160 92,992 46,496 (1,103 ) 45,393 20,753 14,608 1,970 6,145 2,639 — 2,639 1,159,220 10,092 1,081,400 1,149,128 203,618 (5,677 ) 197,941 917 763 158 154 64 (64 ) — 92,937 80,914 11,099 12,023 1,925 (420 ) 1,505 1,659 1,576 254 83 20 (16 ) 4 473,946 738 425,814 473,208 126,556 (3,471 ) 123,085 740,321 743,182 164,621 (2,861 ) (429 ) 429 — 1,359,658 1,343,734 73,045 15,924 2,490 (2,490 ) — 217,557 120,910 95,000 96,647 20,347 (413 ) 19,934 48,192 1,712 56,100 46,480 11,620 (1,291 ) 10,329 174,469 8,911 132,541 165,558 4,238 — 4,238 111,270 79 102,500 111,191 2,223 — 2,223 30,558 1,794 31,100 28,764 10 — 10 ₩ 742,245 ₩ 13,145 ₩ 755,390
Associates Balhae Infrastructure Fund Korea Credit Bureau Co., Ltd UAMCO., Ltd JSC Bank CenterCredit. KoFC KBIC Frontier Champ 2010-5(PEF) Semiland Co., Ltd United PF 1st Recovery Private Equity Fund CH Engineering Co., Ltd.(2) Kores Co., Ltd.(3) Terra Co., Ltd.(3) KB GwS Private Securities Investment Trust Incheon Bridge Co., Ltd Ssangyong Engineering & Construction Co., Ltd.(3) KB Star office Private real estate Investment Trust No.1 KoFC POSCO HANHWA KB shared growth Private Equity Fund NPS KBIC Private Equity Fund No. 1 KBIC Private Equity Fund No. 3 KB-Glenwood Private Equity Fund 1 2013 Operating
income Profit (loss) Other
comprehensive
income(loss) Total
comprehensive
income(loss) Dividends (In millions of Korean won) ₩ 57,754 ₩ 49,685 ₩ — ₩ 49,685 ₩ 6,299 51,571 4,909 — 4,909 — 708,035 105,085 — 105,085 — 532,768 (497,885 ) (5,732 ) (503,617 ) 3 3,368 (2,454 ) 7,064 4,610 — 11,513 649 — 649 11 152,315 13,769 — 13,769 — 681 (102 ) — (102 ) — 100,769 565 2,472 3,037 — 1,422 17 — 17 — 76,201 41,247 — 41,247 8,894 77,311 (13,533 ) — (13,533 ) — 1,724,742 (314,105 ) (8,615 ) (322,720 ) — 16,672 8,490 — 8,490 1,751 1,685 (8,803 ) 1,759 (7,044 ) — 10,206 9,301 (2,113 ) 7,188 106 3,702 3,385 — 3,385 — — (627 ) — (627 ) —
| (1) | The amounts included in the financial statements of the associates are adjusted to reflect adjustments made by the entity, such as fair value adjustments made at the time of acquisition and adjustments for differences in accounting policies. |
| (2) | As the financial statements as of December 31, 2013 are not available, the Group applied the equity method by using the financial statements as of November 30, 2013 and adjusted for the effects of significant transactions or events that occur between the date of those financial statements and the date of the consolidated financial statements. |
| (3) | As the financial statements as of December 31, 2013 are not available, the Group applied the equity method by using the financial statements as of September 30, 2013 and adjusted for the effects of significant transactions or events that occur between the date of those financial statements and the date of the consolidated financial statements. |
The changes in investments in associates and joint ventures for the years ended December 31, 20102012 and 2011,2013, are as follows:
| For the year Ended December 31, 2010 | 2012 | |||||||||||||||||||||||||||||||||||||||||||||||||||||||||||
| Beginning | Acquisition (disposal) | Dividends | Gains (losses) | Other compre- hensive income | Impairment loss | Ending | Beginning | Acquisition and others | Disposal | Dividends | Gains (losses) | Other compre- hensive income | Impairment | Ending | ||||||||||||||||||||||||||||||||||||||||||||||
| (In millions of Korean won) | (In millions of Korean won) | |||||||||||||||||||||||||||||||||||||||||||||||||||||||||||
Associates | ||||||||||||||||||||||||||||||||||||||||||||||||||||||||||||
Balhae Infrastructure Fund | (Won) | 114,623 | (Won) | 5,572 | (Won) | (7,305 | ) | (Won) | 7,384 | (Won) | — | (Won) | — | (Won) | 120,274 | ₩ | 128,778 | ₩ | 2,660 | ₩ | (6,440 | ) | ₩ | (7,747 | ) | ₩ | 7,753 | ₩ | — | ₩ | — | ₩ | 125,004 | |||||||||||||||||||||||||||
Korea Credit Bureau Co., Ltd | 2,769 | — | — | 425 | — | — | 3,194 | 3,766 | — | — | — | 354 | (330 | ) | — | 3,790 | ||||||||||||||||||||||||||||||||||||||||||||
UAMCO., Ltd | 11,992 | 72,800 | — | 830 | — | — | 85,622 | 109,531 | — | — | — | 30,229 | — | — | 139,760 | |||||||||||||||||||||||||||||||||||||||||||||
JSC Bank CenterCredit | 474,502 | 136,565 | (3 | ) | (92,136 | ) | (2,009 | ) | (126,762 | ) | 390,157 | 365,059 | — | — | (3 | ) | (6,257 | ) | (43,097 | ) | (33,813 | ) | 281,889 | |||||||||||||||||||||||||||||||||||||
KoFC KBIC Frontier Champ 2010-5 (PEF) | — | 10,500 | — | (62 | ) | — | — | 10,438 | ||||||||||||||||||||||||||||||||||||||||||||||||||||
KoFC KBIC Frontier Champ 2010-5(PEF) | 28,831 | 3,300 | — | — | (5,477 | ) | (1,115 | ) | — | 25,539 | ||||||||||||||||||||||||||||||||||||||||||||||||||
KB Global Star Game & Apps SPAC | — | 1,033 | — | (4 | ) | 5 | — | 1,034 | 48 | — | — | — | — | — | — | 48 | ||||||||||||||||||||||||||||||||||||||||||||
Powerrex Corporation Co., Ltd | 1,782 | — | — | 169 | — | — | 1,951 | |||||||||||||||||||||||||||||||||||||||||||||||||||||
Semiland Co., Ltd | 1,886 | — | (11 | ) | 220 | — | — | 2,095 | 2,247 | — | — | (10 | ) | 276 | — | — | 2,513 | |||||||||||||||||||||||||||||||||||||||||||
Seho Robo Ind. Co., Ltd | 605 | — | — | 215 | — | — | 820 | |||||||||||||||||||||||||||||||||||||||||||||||||||||
Serit Platform Co., Ltd | 1,500 | — | — | (62 | ) | — | — | 1,438 | 1,451 | — | — | — | 66 | — | — | 1,517 | ||||||||||||||||||||||||||||||||||||||||||||
Sehwa Electronics Co., Ltd | 3,508 | — | (11 | ) | (112 | ) | — | — | 3,385 | 3,454 | — | — | — | (553 | ) | 54 | — | 2,955 | ||||||||||||||||||||||||||||||||||||||||||
Testian Co., Ltd | 500 | 320 | — | 37 | — | — | 857 | 789 | 198 | — | — | 54 | — | — | 1,041 | |||||||||||||||||||||||||||||||||||||||||||||
Solice Co., Ltd | — | 2,007 | — | — | — | — | 2,007 | |||||||||||||||||||||||||||||||||||||||||||||||||||||
Ray Co., Ltd | 1,050 | (1,050 | ) | — | — | — | — | — | ||||||||||||||||||||||||||||||||||||||||||||||||||||
KT Wibro infrastructure | — | 100,000 | — | 139 | — | — | 100,139 | |||||||||||||||||||||||||||||||||||||||||||||||||||||
Joam Housing Development Co., Ltd. | — | 8 | — | (8 | ) | — | — | — | ||||||||||||||||||||||||||||||||||||||||||||||||||||
IlssanElecom(Shenyang) Co., Ltd | — | — | — | — | — | — | — | |||||||||||||||||||||||||||||||||||||||||||||||||||||
|
|
|
|
|
|
| ||||||||||||||||||||||||||||||||||||||||||||||||||||||
Sub-total | 614,717 | 327,755 | (7,330 | ) | (82,965 | ) | (2,004 | ) | (126,762 | ) | 723,411 | |||||||||||||||||||||||||||||||||||||||||||||||||
|
|
|
|
|
|
| ||||||||||||||||||||||||||||||||||||||||||||||||||||||
Joint venture | ||||||||||||||||||||||||||||||||||||||||||||||||||||||||||||
Burrill-KB Life Science Fund | — | 372 | — | (372 | ) | — | — | — | ||||||||||||||||||||||||||||||||||||||||||||||||||||
Joam Housing Development Co., Ltd | — | — | — | — | — | — | — | — | ||||||||||||||||||||||||||||||||||||||||||||||||||||
United PF 1st Recovery Private Equity Fund | 143,437 | 43,617 | (402 | ) | — | 8,773 | — | — | 195,425 | |||||||||||||||||||||||||||||||||||||||||||||||||||
Kores Co., Ltd | — | 634 | — | — | 273 | 477 | — | 1,384 | ||||||||||||||||||||||||||||||||||||||||||||||||||||
KB GwS Private Securities Investment Trust | — | 115,745 | (1,865 | ) | — | 7,059 | — | — | 120,939 | |||||||||||||||||||||||||||||||||||||||||||||||||||
Incheon Bridge Co., Ltd | — | 24,677 | — | — | (22,916 | ) | (131 | ) | — | 1,630 | ||||||||||||||||||||||||||||||||||||||||||||||||||
KB Star office Private real estate Investment Trust No.1 | — | 20,000 | — | — | (102 | ) | — | — | 19,898 | |||||||||||||||||||||||||||||||||||||||||||||||||||
KoFC POSCO HANHWA KB shared growth Private Equity Fund | — | 6,250 | — | — | (934 | ) | (333 | ) | — | 4,983 | ||||||||||||||||||||||||||||||||||||||||||||||||||
NPS KBIC Private Equity Fund No. 1 | 4,079 | — | — | (106 | ) | 302 | (114 | ) | — | 4,161 | ||||||||||||||||||||||||||||||||||||||||||||||||||
KBIC Private Equity Fund No. 3 | 2,122 | — | — | — | 33 | — | — | 2,155 | ||||||||||||||||||||||||||||||||||||||||||||||||||||
KB-Glenwood Private Equity Fund 1 | 10 | — | — | — | — | — | — | 10 | ||||||||||||||||||||||||||||||||||||||||||||||||||||
|
|
|
|
|
|
|
|
|
|
|
|
|
|
| ||||||||||||||||||||||||||||||||||||||||||||||
Total | (Won) | 614,717 | (Won) | 328,127 | (Won) | (7,330 | ) | (Won) | (83,337 | ) | (Won) | (2,004 | ) | (Won) | (126,762 | ) | (Won) | 723,411 | ₩ | 793,602 | ₩ | 217,081 | ₩ | (8,707 | ) | ₩ | (7,866 | ) | ₩ | 18,933 | ₩ | (44,589 | ) | ₩ | (33,813 | ) | ₩ | 934,641 | ||||||||||||||||||||||
|
|
|
|
|
|
|
|
|
|
|
|
|
|
| ||||||||||||||||||||||||||||||||||||||||||||||
| For the year Ended December 31, 2011 | 2013 | |||||||||||||||||||||||||||||||||||||||||||||||||||||||||||||||||||
| Beginning | Acquisition (disposal) | Dividends | Gains (losses) | Other compre- hensive income | Impair- ment loss | Others | Ending | Beginning | Acquisition | Disposal | Dividends | Gains (losses) | Other compre- hensive income | Impairment | Others | Ending | ||||||||||||||||||||||||||||||||||||||||||||||||||||
| (In millions of Korean won) | (In millions of Korean won) | |||||||||||||||||||||||||||||||||||||||||||||||||||||||||||||||||||
Associates | ||||||||||||||||||||||||||||||||||||||||||||||||||||||||||||||||||||
Balhae Infrastructure Fund | (Won) | 120,274 | (Won) | 9,063 | (Won) | (7,501 | ) | (Won) | 6,942 | (Won) | — | (Won) | — | (Won) | — | (Won) | 128,778 | ₩ | 125,004 | ₩ | — | ₩ | — | ₩ | (6,299 | ) | ₩ | 6,263 | ₩ | — | ₩ | — | ₩ | — | ₩ | 124,968 | ||||||||||||||||||||||||||||||||
Korea Credit Bureau Co., Ltd | 3,194 | — | — | 572 | — | — | — | 3,766 | 3,790 | — | — | — | 395 | — | — | — | 4,185 | |||||||||||||||||||||||||||||||||||||||||||||||||||
UAMCO., Ltd | 85,622 | — | — | 23,909 | — | — | — | 109,531 | 139,760 | — | — | — | 11,066 | — | — | — | 150,826 | |||||||||||||||||||||||||||||||||||||||||||||||||||
JSC Bank CenterCredit | 390,157 | — | (3 | ) | (4,652 | ) | 45 | (20,488 | ) | — | 365,059 | 281,889 | — | — | (3 | ) | (204,312 | ) | (9,464 | ) | — | — | 68,110 | |||||||||||||||||||||||||||||||||||||||||||||
KoFC KBIC Frontier Champ 2010-5 (PEF) | 10,438 | 18,350 | — | 554 | (511 | ) | — | — | 28,831 | |||||||||||||||||||||||||||||||||||||||||||||||||||||||||||
KoFC KBIC Frontier Champ 2010-5(PEF) | 25,539 | 15,565 | (135 | ) | — | 4,227 | 197 | — | — | 45,393 | ||||||||||||||||||||||||||||||||||||||||||||||||||||||||||
KB Global Star Game & Apps SPAC | 1,034 | (1,011 | ) | — | 17 | (6 | ) | — | 14 | 48 | 48 | — | — | — | 1 | — | — | (49 | ) | — | ||||||||||||||||||||||||||||||||||||||||||||||||
Powerrex Corporation Co., Ltd | 1,951 | — | — | (1,951 | ) | — | — | — | — | |||||||||||||||||||||||||||||||||||||||||||||||||||||||||||
Semiland Co., Ltd | 2,095 | — | (11 | ) | 163 | — | — | — | 2,247 | 2,513 | — | — | (11 | ) | 137 | — | — | — | 2,639 | |||||||||||||||||||||||||||||||||||||||||||||||||
Seho Robo Ind. Co., Ltd | 820 | (1,358 | ) | — | 538 | — | — | — | — | |||||||||||||||||||||||||||||||||||||||||||||||||||||||||||
Serit Platform Co., Ltd | 1,438 | — | — | 13 | — | — | — | 1,451 | 1,517 | — | (1,518 | ) | — | 1 | — | — | — | — | ||||||||||||||||||||||||||||||||||||||||||||||||||
Sehwa Electronics Co., Ltd | 3,385 | — | — | 53 | 16 | — | — | 3,454 | 2,955 | — | (1,577 | ) | — | (360 | ) | (71 | ) | — | (947 | ) | — | |||||||||||||||||||||||||||||||||||||||||||||||
Testian Co., Ltd | 857 | — | — | (68 | ) | — | — | — | 789 | 1,041 | — | (260 | ) | — | (587 | ) | — | — | (194 | ) | — | |||||||||||||||||||||||||||||||||||||||||||||||
Solice Co., Ltd | 2,007 | (2,007 | ) | — | — | — | — | — | — | |||||||||||||||||||||||||||||||||||||||||||||||||||||||||||
KT Wibro infrastructure | 100,139 | — | — | 3,910 | — | — | — | 104,049 | ||||||||||||||||||||||||||||||||||||||||||||||||||||||||||||
Joam Housing Development Co., Ltd. | — | — | — | — | — | — | — | — | ||||||||||||||||||||||||||||||||||||||||||||||||||||||||||||
Joam Housing Development Co., Ltd | — | — | — | — | — | — | — | — | — | |||||||||||||||||||||||||||||||||||||||||||||||||||||||||||
United PF 1st Recovery Private Equity Fund | — | 148,000 | — | (4,563 | ) | — | — | — | 143,437 | 195,425 | — | — | — | 2,516 | — | — | — | 197,941 | ||||||||||||||||||||||||||||||||||||||||||||||||||
IlssanElecom(Shenyang) Co., Ltd | — | — | — | — | — | — | — | — | ||||||||||||||||||||||||||||||||||||||||||||||||||||||||||||
Qingdao Danam Electronics Co., Ltd. | — | 692 | — | — | — | — | — | 692 | ||||||||||||||||||||||||||||||||||||||||||||||||||||||||||||
|
|
|
|
|
|
|
| |||||||||||||||||||||||||||||||||||||||||||||||||||||||||||||
Sub-total | 723,411 | 171,729 | (7,515 | ) | 25,437 | (456 | ) | (20,488 | ) | 14 | 892,132 | |||||||||||||||||||||||||||||||||||||||||||||||||||||||||
|
|
|
|
|
|
|
| |||||||||||||||||||||||||||||||||||||||||||||||||||||||||||||
Joint venture | ||||||||||||||||||||||||||||||||||||||||||||||||||||||||||||||||||||
Burrill-KB Life Science Fund | — | — | — | — | — | — | — | — | ||||||||||||||||||||||||||||||||||||||||||||||||||||||||||||
Kores Co., Ltd | 1,384 | — | — | — | 91 | 450 | (420 | ) | — | 1,505 | ||||||||||||||||||||||||||||||||||||||||||||||||||||||||||
KB GwS Private Securities Investment Trust. | 120,939 | — | — | (8,894 | ) | 11,040 | — | — | — | 123,085 | ||||||||||||||||||||||||||||||||||||||||||||||||||||||||||
Incheon Bridge Co., Ltd | 1,630 | — | — | — | (1,630 | ) | — | — | — | — | ||||||||||||||||||||||||||||||||||||||||||||||||||||||||||
Ssangyong Engineering & Construction Co., Ltd.(1) | — | 28,779 | — | — | (8,200 | ) | (1,176 | ) | (19,403 | ) | — | — | ||||||||||||||||||||||||||||||||||||||||||||||||||||||||
KB Star office Private real estate Investment Trust No.1 | 19,898 | — | — | (1,751 | ) | 1,787 | — | — | — | 19,934 | ||||||||||||||||||||||||||||||||||||||||||||||||||||||||||
KoFC POSCO HANHWA KB shared growth Private Equity Fund | 4,983 | 7,775 | — | — | (2,703 | ) | 274 | — | — | 10,329 | ||||||||||||||||||||||||||||||||||||||||||||||||||||||||||
NPS KBIC Private Equity Fund No. 1 | 4,160 | — | — | (106 | ) | 238 | (54 | ) | — | — | 4,238 | |||||||||||||||||||||||||||||||||||||||||||||||||||||||||
KBIC Private Equity Fund No. 3 | 2,156 | — | — | — | 67 | — | — | — | 2,223 | |||||||||||||||||||||||||||||||||||||||||||||||||||||||||||
KB-Glenwood Private Equity Fund 1 | 10 | — | — | — | — | — | — | — | 10 | |||||||||||||||||||||||||||||||||||||||||||||||||||||||||||
Terra Co., Ltd.(2) | — | — | — | — | 4 | — | — | — | 4 | |||||||||||||||||||||||||||||||||||||||||||||||||||||||||||
|
|
|
|
|
|
|
|
|
|
|
|
|
|
|
|
| ||||||||||||||||||||||||||||||||||||||||||||||||||||
Total | (Won) | 723,411 | (Won) | 171,729 | (Won) | (7,515 | ) | (Won) | 25,437 | (Won) | (456 | ) | (Won) | (20,488 | ) | (Won) | 14 | (Won) | 892,132 | ₩ | 934,641 | ₩ | 52,119 | ₩ | (3,490 | ) | ₩ | (17,064 | ) | ₩ | (179,959 | ) | ₩ | (9,844 | ) | ₩ | (19,823 | ) | ₩ | (1,190 | ) | ₩ | 755,390 | |||||||||||||||||||||||||
|
|
|
|
|
|
|
|
|
|
|
|
|
|
|
|
| ||||||||||||||||||||||||||||||||||||||||||||||||||||
| (1) | Impairment recognized on reorganization proceedings filed on December 30, 2013. |
| (2) | Soundness in the assets of Kazakhstan banks has been |
Accumulated unrecognized share of losses of an associate and joint venturein investments in associates due to discontinued recognitiondiscontinuation of Group’s share of lossesapplying the equity method as of December 31, 20102012 and 2011,2013, are as follows:
| ||||||||
| ||||||||
| ||||||||
| 2012 | ||||||||
| Unrecognized loss | Unrecognized change in equity | |||||||
| (In millions of Korean won) | ||||||||
CH Engineering Co., Ltd | ₩ | 51 | ₩ | 51 | ||||
Shinla Construction Co., Ltd | 60 | 60 | ||||||
Joam Housing Development Co., Ltd | — | 363 | ||||||
| As of December 31, 2011 | ||||||||
| Unrecognized loss | Unrecognized change in equity | |||||||
| (In millions of Korean won) | ||||||||
Joam Housing Development Co., Ltd.. | (Won) | (566 | ) | (Won) | — | |||
IlssanElecom(Shenyang) Co., Ltd | (1,165 | ) | (105 | ) | ||||
| 2013 | ||||||||
| Unrecognized loss | Unrecognized change in equity | |||||||
| (In millions of Korean won) | ||||||||
Incheon Bridge Co., Ltd | ₩ | 429 | ₩ | 429 | ||||
CH Engineering Co., Ltd | 43 | 94 | ||||||
Shinla Construction Co., Ltd | 41 | 101 | ||||||
14. Property and Equipment, and Investment Property
The details of property and equipment as of January 1, 2010, and December 31, 20102012 and 2011,2013, are as follows:
| As of January 1, 2010 | 2012 | |||||||||||||||||||||||||||||||
| Acquisition cost | Accumulated depreciation | Accumulated impairment losses | Carrying amount | Acquisition cost | Accumulated depreciation | Accumulated impairment losses | Carrying amount | |||||||||||||||||||||||||
| (In millions of Korean won) | (In millions of Korean won) | |||||||||||||||||||||||||||||||
Land | (Won) | 2,010,300 | (Won) | — | (Won) | (586 | ) | (Won) | 2,009,714 | ₩ | 2,012,846 | ₩ | — | ₩ | (581 | ) | ₩ | 2,012,265 | ||||||||||||||
Buildings | 1,138,390 | (245,309 | ) | (3,498 | ) | 889,583 | 1,209,909 | (327,370 | ) | (2,661 | ) | 879,878 | ||||||||||||||||||||
Leasehold improvements | 397,499 | (335,781 | ) | — | 61,718 | 523,039 | (467,381 | ) | — | 55,658 | ||||||||||||||||||||||
Equipment and vehicles | 1,781,709 | (1,507,631 | ) | — | 274,078 | 1,630,116 | (1,488,184 | ) | — | 141,932 | ||||||||||||||||||||||
Construction in-progress | 350 | — | — | 350 | 893 | — | — | 893 | ||||||||||||||||||||||||
Financial lease assets | 33,045 | (10,577 | ) | — | 22,468 | 55,908 | (46,141 | ) | — | 9,767 | ||||||||||||||||||||||
|
|
|
|
|
|
|
| |||||||||||||||||||||||||
Total | (Won) | 5,361,293 | (Won) | (2,099,298 | ) | (Won) | (4,084 | ) | (Won) | 3,257,911 | ₩ | 5,432,711 | ₩ | (2,329,076 | ) | ₩ | (3,242 | ) | ₩ | 3,100,393 | ||||||||||||
|
|
|
|
|
|
|
| |||||||||||||||||||||||||
| As of December 31, 2010 | ||||||||||||||||
| Acquisition cost | Accumulated depreciation | Accumulated impairment losses | Carrying amount | |||||||||||||
| (In millions of Korean won) | ||||||||||||||||
Land | (Won) | 2,023,447 | (Won) | — | (Won) | (583 | ) | (Won) | 2,022,864 | |||||||
Buildings | 1,168,155 | (274,267 | ) | (2,668 | ) | 891,220 | ||||||||||
Leasehold improvements | 429,790 | (379,156 | ) | — | 50,634 | |||||||||||
Equipment and vehicles | 1,640,867 | (1,466,049 | ) | — | 174,818 | |||||||||||
Construction in-progress | 119 | — | — | 119 | ||||||||||||
Financial lease assets | 33,045 | (22,440 | ) | — | 10,605 | |||||||||||
|
|
|
|
|
|
|
| |||||||||
Total | (Won) | 5,295,423 | (Won) | (2,141,912 | ) | (Won) | (3,251 | ) | (Won) | 3,150,260 | ||||||
|
|
|
|
|
|
|
| |||||||||
| As of December 31, 2011 | 2013 | |||||||||||||||||||||||||||||||
| Acquisition cost | Accumulated depreciation | Accumulated impairment losses | Carrying amount | Acquisition cost | Accumulated depreciation | Accumulated impairment losses | Carrying amount | |||||||||||||||||||||||||
| (In millions of Korean won) | (In millions of Korean won) | |||||||||||||||||||||||||||||||
Land | (Won) | 2,022,943 | (Won) | — | (Won) | (581 | ) | (Won) | 2,022,362 | ₩ | 1,991,831 | ₩ | — | ₩ | — | ₩ | 1,991,831 | |||||||||||||||
Buildings | 1,200,813 | (301,947 | ) | (2,661 | ) | 896,205 | 1,219,806 | (353,140 | ) | (2,117 | ) | 864,549 | ||||||||||||||||||||
Leasehold improvements | 484,328 | (424,742 | ) | — | 59,586 | 567,231 | (511,207 | ) | — | 56,024 | ||||||||||||||||||||||
Equipment and vehicles | 1,710,477 | (1,513,746 | ) | — | 196,731 | 1,642,796 | (1,503,257 | ) | — | 139,539 | ||||||||||||||||||||||
Construction in-progress | 1,075 | — | — | 1,075 | ||||||||||||||||||||||||||||
Financial lease assets | 43,756 | (33,695 | ) | — | 10,061 | 66,641 | (57,741 | ) | — | 8,900 | ||||||||||||||||||||||
|
|
|
|
|
|
|
| |||||||||||||||||||||||||
Total | (Won) | 5,463,392 | (Won) | (2,274,130 | ) | (Won) | (3,242 | ) | (Won) | 3,186,020 | ₩ | 5,488,305 | ₩ | (2,425,345 | ) | ₩ | (2,117 | ) | ₩ | 3,060,843 | ||||||||||||
|
|
|
|
|
|
|
| |||||||||||||||||||||||||
The changes in property and equipment for the years ended December 31, 20102012 and 2011,2013, are as follows:
Land Buildings Leasehold improvements Equipment and vehicles Construction in progress Financial lease assets Total 2012 Beginning Acquisition Transfers(1) Disposal Depreciation(2) Others Ending (In millions of Korean won) ₩ 2,020,681 ₩ 40 ₩ (6,505 ) ₩ (1,878 ) ₩ — ₩ (73 ) ₩ 2,012,265 895,460 1,806 14,344 (2,667 ) (28,820 ) (245 ) 879,878 59,586 4,574 32,591 (272 ) (44,007 ) 3,186 55,658 195,883 74,921 — (365 ) (128,411 ) (96 ) 141,932 1,075 49,646 (49,828 ) — — — 893 10,061 12,152 — — (12,446 ) — 9,767 ₩ 3,182,746 ₩ 143,139 ₩ (9,398 ) ₩ (5,182 ) ₩ (213,684 ) ₩ 2,772 ₩ 3,100,393
| For the year Ended December 31, 2010 | 2013 | |||||||||||||||||||||||||||||||||||||||||||||||||||||||
| Beginning | Acquisition | Transfers(1) | Disposal | Depreciation(2) | Others | Ending | Beginning | Acquisition | Transfers1 | Disposal | Depreciation2 | Others | Ending | |||||||||||||||||||||||||||||||||||||||||||
| (In millions of Korean won) | (In millions of Korean won) | |||||||||||||||||||||||||||||||||||||||||||||||||||||||
Land | (Won) | 2,009,714 | (Won) | — | (Won) | 12,475 | (Won) | (1,437 | ) | (Won) | — | (Won) | 2,112 | (Won) | 2,022,864 | ₩ | 2,012,265 | ₩ | 1,405 | ₩ | (21,551 | ) | ₩ | (214 | ) | ₩ | — | ₩ | (74 | ) | ₩ | 1,991,831 | ||||||||||||||||||||||||
Buildings | 889,583 | 40 | 28,622 | (1,022 | ) | (27,395 | ) | 1,392 | 891,220 | 879,878 | 3,234 | 11,056 | (281 | ) | (29,094 | ) | (244 | ) | 864,549 | |||||||||||||||||||||||||||||||||||||
Leasehold Improvements | 61,718 | 1,366 | 27,346 | (169 | ) | (44,887 | ) | 5,260 | 50,634 | |||||||||||||||||||||||||||||||||||||||||||||||
Leasehold improvements. | 55,658 | 2,687 | 33,001 | (332 | ) | (46,057 | ) | 11,067 | 56,024 | |||||||||||||||||||||||||||||||||||||||||||||||
Equipment and vehicles | 274,078 | 67,066 | — | (379 | ) | (166,011 | ) | 64 | 174,818 | 141,932 | 94,875 | 247 | (434 | ) | (97,119 | ) | 38 | 139,539 | ||||||||||||||||||||||||||||||||||||||
Construction in-progress | 350 | 52,307 | (52,538 | ) | — | — | — | 119 | ||||||||||||||||||||||||||||||||||||||||||||||||
Construction in progress | 893 | 51,268 | (52,161 | ) | — | — | — | — | ||||||||||||||||||||||||||||||||||||||||||||||||
Financial lease assets | 22,468 | — | — | — | (11,863 | ) | — | 10,605 | 9,767 | 10,734 | — | — | (11,601 | ) | — | 8,900 | ||||||||||||||||||||||||||||||||||||||||
|
|
|
|
|
|
|
|
|
|
|
|
|
| |||||||||||||||||||||||||||||||||||||||||||
Total | (Won) | 3,257,911 | (Won) | 120,779 | (Won) | 15,905 | (Won) | (3,007 | ) | (Won) | (250,156 | ) | (Won) | 8,828 | (Won) | 3,150,260 | ₩ | 3,100,393 | ₩ | 164,203 | ₩ | (29,408 | ) | ₩ | (1,261 | ) | ₩ | (183,871 | ) | ₩ | 10,787 | ₩ | 3,060,843 | |||||||||||||||||||||||
|
|
|
|
|
|
|
|
|
|
|
|
|
| |||||||||||||||||||||||||||||||||||||||||||
| (1) | Including transfers with investment property and assets held for sale. |
| (2) | Including |
| For the year Ended December 31, 2011 | ||||||||||||||||||||||||||||
| Beginning | Acquisition | Transfers(1) | Disposal | Depreciation(2) | Others | Ending | ||||||||||||||||||||||
| (In millions of Korean won) | ||||||||||||||||||||||||||||
Land | (Won) | 2,022,864 | (Won) | 195 | (Won) | (706 | ) | (Won) | (18 | ) | (Won) | — | (Won) | 27 | (Won) | 2,022,362 | ||||||||||||
Buildings | 891,220 | 3,019 | 30,207 | (26 | ) | (28,307 | ) | 92 | 896,205 | |||||||||||||||||||
Leasehold Improvements | 50,634 | 11,414 | 39,195 | (423 | ) | (47,447 | ) | 6,213 | 59,586 | |||||||||||||||||||
Equipment and vehicles | 174,818 | 160,319 | — | (847 | ) | (137,559 | ) | — | 196,731 | |||||||||||||||||||
Construction in-progress | 119 | 76,258 | (75,302 | ) | — | — | — | 1,075 | ||||||||||||||||||||
Financial lease assets | 10,605 | 10,700 | — | — | (11,244 | ) | — | 10,061 | ||||||||||||||||||||
|
|
|
|
|
|
|
|
|
|
|
|
|
| |||||||||||||||
Total | (Won) | 3,150,260 | (Won) | 261,905 | (Won) | (6,606 | ) | (Won) | (1,314 | ) | (Won) | (224,557 | ) | (Won) | 6,332 | (Won) | 3,186,020 | |||||||||||
|
|
|
|
|
|
|
|
|
|
|
|
|
| |||||||||||||||
|
|
The changes in accumulated impairment losses of property and equipment for the years ended December 31, 20102012 and 2011,2013, are as follows:
| For the year Ended December 31, 2010 | ||||||||||||||||||||||||||||||||||||
| 2012 | 2012 | |||||||||||||||||||||||||||||||||||
| Beginning | Beginning | Impairment | Reversal | Others | Ending | Beginning | Impairment | Reversal | Others | Ending | ||||||||||||||||||||||||||
| (In millions of Korean won) | (In millions of Korean won) | (In millions of Korean won) | ||||||||||||||||||||||||||||||||||
| (Won) | (4,084) | (Won) | — | (Won) | — | (Won) | 833 | (Won) | (3,251 | ) | ||||||||||||||||||||||||||
| ₩ | (3,242) | ₩ | — | ₩ | — | ₩ | — | ₩ | (3,242 | ) | ||||||||||||||||||||||||||
| For the year Ended December 31, 2011 | ||||||||||||||||||||||||||||||||||||
| 2013 | 2013 | |||||||||||||||||||||||||||||||||||
| Beginning | Beginning | Impairment | Reversal | Others | Ending | Beginning | Impairment | Reversal | Others | Ending | ||||||||||||||||||||||||||
| (In millions of Korean won) | (In millions of Korean won) | (In millions of Korean won) | ||||||||||||||||||||||||||||||||||
| (Won) | (3,251) | (Won) | — | (Won) | — | (Won) | 9 | (Won) | (3,242 | ) | ||||||||||||||||||||||||||
| ₩ | (3,242) | ₩ | — | ₩ | — | ₩ | 1,125 | ₩ | (2,117 | ) | ||||||||||||||||||||||||||
The details of investment property as of January 1, 2010, and December 31, 20102012 and 2011,2013, are as follows:
| As of January 1, 2010 | 2012 | |||||||||||||||||||||||
| Acquisition cost | Accumulated depreciation | Carrying amount | Acquisition cost | Accumulated depreciation | Carrying amount | |||||||||||||||||||
| (In millions of Korean won) | (In millions of Korean won) | |||||||||||||||||||||||
Land | (Won) | 50,037 | (Won) | — | (Won) | 50,037 | ₩ | 38,653 | ₩ | — | ₩ | 38,653 | ||||||||||||
Buildings | 23,524 | (5,584 | ) | 17,940 | 19,723 | (5,402 | ) | 14,321 | ||||||||||||||||
|
|
|
|
|
| |||||||||||||||||||
Total | (Won) | 73,561 | (Won) | (5,584 | ) | (Won) | 67,977 | ₩ | 58,376 | ₩ | (5,402 | ) | ₩ | 52,974 | ||||||||||
|
|
|
|
|
| |||||||||||||||||||
Land Buildings Total 2013 Acquisition
cost Accumulated
depreciation Carrying
amount (In millions of Korean won) ₩ 94,708 ₩ — ₩ 94,708 78,526 (6,975 ) 71,551 ₩ 173,234 ₩ (6,975 ) ₩ 166,259
The valuation technique and input variables that are used to measure the fair value of investment property as of December 31, 2013, are as follows:
| As of December 31, 2010 | ||||||||||||
| Acquisition cost | Accumulated depreciation | Carrying amount | ||||||||||
| (In millions of Korean won) | ||||||||||||
Land | (Won) | 38,633 | (Won) | — | (Won) | 38,633 | ||||||
Buildings | 18,941 | (4,653 | ) | 14,288 | ||||||||
|
|
|
|
|
| |||||||
Total | (Won) | 57,574 | (Won) | (4,653 | ) | (Won) | 52,921 | |||||
|
|
|
|
|
| |||||||
| As of December 31, 2011 | ||||||||||||
| Acquisition cost | Accumulated depreciation | Carrying amount | ||||||||||
| (In millions of Korean won) | ||||||||||||
Land | (Won) | 37,451 | (Won) | — | (Won) | 37,451 | ||||||
Buildings | 18,961 | (4,860 | ) | 14,101 | ||||||||
|
|
|
|
|
| |||||||
Total | (Won) | 56,412 | (Won) | (4,860 | ) | (Won) | 51,552 | |||||
|
|
|
|
|
| |||||||
| 2013 | ||||||||
| Fair value | Valuation technique | Inputs | ||||||
| (In millions of Korean won) | ||||||||
Land and buildings | ₩ | 189,534 | Cost Approach Method | - Price per square meter - Replacement cost | ||||
As of January 1, 2010 and December 31, 20102012 and 2011,2013, fair values of the investment properties amount to (Won) 67,471 million, (Won) 52,740₩51,142 million and (Won) 48,996₩189,534 million, respectively. The investment properties were valuedmeasured by qualified independent appraisers with experience in valuing similar properties in the same location.area. In addition, per the fair value hierarchy on Note 6.1, the fair value hierarchy of all investment properties has been categorized and classified as Level 3.
Rental income from the above investment properties for the years ended December 31, 20102012 and 2011,2013, amounts to (Won) 1,122₩675 million and (Won) 683₩4,889 million, respectively.
The changes in investment property for the yearyears ended December 31, 20102012 and 2011,2013, are as follows:
| For the year Ended December 31, 2010 | 2012 | |||||||||||||||||||||||||||||||
| Beginning | Transfers | Depreciation | Ending | Beginning | Transfers | Depreciation | Ending | |||||||||||||||||||||||||
| (In millions of Korean won) | (In millions of Korean won) | |||||||||||||||||||||||||||||||
Land | (Won) | 50,037 | (Won) | (11,404 | ) | (Won) | — | (Won) | 38,633 | ₩ | 37,451 | ₩ | 1,202 | ₩ | — | ₩ | 38,653 | |||||||||||||||
Buildings | 17,940 | (3,205 | ) | (447 | ) | 14,288 | 14,101 | 685 | (465 | ) | 14,321 | |||||||||||||||||||||
|
|
|
|
|
|
|
| |||||||||||||||||||||||||
Total | (Won) | 67,977 | (Won) | (14,609 | ) | (Won) | (447 | ) | (Won) | 52,921 | ₩ | 51,552 | ₩ | 1,887 | ₩ | (465 | ) | ₩ | 52,974 | |||||||||||||
|
|
|
|
|
|
|
| |||||||||||||||||||||||||
| For the year Ended December 31, 2011 | ||||||||||||||||
| Beginning | Transfers | Depreciation | Ending | |||||||||||||
| (In millions of Korean won) | ||||||||||||||||
Land | (Won) | 38,633 | (Won) | (1,182 | ) | (Won) | — | (Won) | 37,451 | |||||||
Buildings | 14,288 | 264 | (451 | ) | 14,101 | |||||||||||
|
|
|
|
|
|
|
| |||||||||
Total | (Won) | 52,921 | (Won) | (918 | ) | (Won) | (451 | ) | (Won) | 51,552 | ||||||
|
|
|
|
|
|
|
| |||||||||
Land Buildings Total 2013 Beginning Acquisition Transfers Depreciation Ending (In millions of Korean won) ₩ 38,653 ₩ 56,055 ₩ — ₩ — ₩ 94,708 14,321 58,554 257 (1,581 ) 71,551 ₩ 52,974 ₩ 114,609 ₩ 257 ₩ (1,581 ) ₩ 166,259
Property and equipment insured as of January 1, 2010, and December 31, 20102012 and 2011,2013, are as follows:
| Insurance coverage | Insurance coverage | Insurance company | ||||||||||||||||||||||||||
Type | Assets insured | As of January 1, | As of December 31, | Insurance company | Assets insured | 2012 | 2013 | |||||||||||||||||||||
| 2010 | 2010 | 2011 | ||||||||||||||||||||||||||
| (In millions of Korean won) | (In millions of Korean won) | |||||||||||||||||||||||||||
General property insurance | Buildings(1) | (Won) | 965,269 | (Won) | 986,576 | (Won) | 1,061,097 | Samsung Fire & Marine Insurance Co., Ltd. and others | ||||||||||||||||||||
Leasehold improvements | 172,467 | 144,267 | 134,595 | Buildings(1) | ₩ | 1,138,216 | ₩ | 1,027,420 | Samsung Fire & Marine Insurance Co., Ltd. and others | |||||||||||||||||||
Equipment and vehicles and others | 342,144 | 168,920 | 179,804 | Leasehold improvements | 117,600 | 121,188 | ||||||||||||||||||||||
|
|
| Equipment and vehicles and others | 142,828 | 139,544 | |||||||||||||||||||||||
Total | (Won) | 1,479,880 | (Won) | 1,299,763 | (Won) | 1,375,496 |
|
| ||||||||||||||||||||
Total | Total | ₩ | 1,398,644 | ₩ | 1,288,152 | |||||||||||||||||||||||
|
|
|
|
| ||||||||||||||||||||||||
| (1) | Buildings include office buildings, investment properties and assets held for sale. |
15. Intangible Assets
The details of intangible assets as of January 1, 2010, and December 31, 20102012 and 2011,2013, are as follows:
| As of January 1, 2010 | 2012 | |||||||||||||||||||||||||||
| Acquisition cost | Accumulated amortization | Carrying amount | Acquisition cost | Accumulated amortization | Accumulated impairment losses | Carrying Amount | ||||||||||||||||||||||
| (In millions of Korean won) | (In millions of Korean won) | |||||||||||||||||||||||||||
Goodwill | (Won) | 136,755 | (Won) | — | (Won) | 136,755 | ₩ | 244,755 | ₩ | — | ₩ | (35,157 | ) | ₩ | 209,598 | |||||||||||||
Other intangible assets | 471,955 | (206,133 | ) | 265,822 | 786,063 | (484,685 | ) | (17,845 | ) | 283,533 | ||||||||||||||||||
|
|
|
|
|
|
| ||||||||||||||||||||||
Total | (Won) | 608,710 | (Won) | (206,133 | ) | (Won) | 402,577 | ₩ | 1,030,818 | ₩ | (484,685 | ) | ₩ | (53,002 | ) | ₩ | 493,131 | |||||||||||
|
|
|
|
|
|
| ||||||||||||||||||||||
| As of December 31, 2010 | ||||||||||||
| Acquisition cost | Accumulated amortization | Carrying amount | ||||||||||
| (In millions of Korean won) | ||||||||||||
Goodwill | (Won) | 143,209 | (Won) | — | (Won) | 143,209 | ||||||
Other intangible assets | 670,899 | (309,188 | ) | 361,711 | ||||||||
|
|
|
|
|
| |||||||
Total | (Won) | 814,108 | (Won) | (309,188 | ) | (Won) | 504,920 | |||||
|
|
|
|
|
| |||||||
| As of December 31, 2011 | ||||||||||||||||
| Acquisition cost | Accumulated amortization | Accumulated impairment losses | Carrying amount | |||||||||||||
| (In millions of Korean won) | ||||||||||||||||
Goodwill | (Won) | 143,209 | (Won) | — | (Won) | — | (Won) | 143,209 | ||||||||
Other intangible assets | 760,538 | (421,380 | ) | (13,926 | ) | 325,232 | ||||||||||
|
|
|
|
|
|
|
| |||||||||
Total | (Won) | 903,747 | (Won) | (421,380 | ) | (Won) | (13,926 | ) | (Won) | 468,441 | ||||||
|
|
|
|
|
|
|
| |||||||||
Goodwill Other intangible assets Total 2013 Acquisition
cost Accumulated
amortization Accumulated
impairment
losses Carrying
Amount (In millions of Korean won) ₩ 252,098 ₩ — ₩ (46,533 ) ₩ 205,565 851,406 (590,550 ) (23,217 ) 237,639 ₩ 1,103,504 ₩ (590,550 ) ₩ (69,750 ) ₩ 443,204
The details of goodwill as of January 1, 2010, and December 31, 20102012 and 2011,2013, are as follows:
| As of January 1, | As of December 31, | |||||||||||||||||||||||||||||||||||||||
| 2010 | 2010 | 2011 | 2012 | 2013 | ||||||||||||||||||||||||||||||||||||
| Acquisition cost | Carrying amount | Acquisition cost | Carrying amount | Acquisition cost | Carrying amount | Acquisition cost | Carrying amount | Acquisition cost | Carrying amount | |||||||||||||||||||||||||||||||
| (In millions of Korean won) | (In millions of Korean won) | |||||||||||||||||||||||||||||||||||||||
Housing & Commercial Bank | (Won) | 65,288 | (Won) | 65,288 | (Won) | 65,288 | (Won) | 65,288 | (Won) | 65,288 | (Won) | 65,288 | ₩ | 65,288 | ₩ | 65,288 | ₩ | 65,288 | ₩ | 65,288 | ||||||||||||||||||||
KB Cambodia Bank | 1,202 | 1,202 | 1,202 | 1,202 | 1,202 | 1,202 | 1,202 | 1,202 | 1,202 | 1,202 | ||||||||||||||||||||||||||||||
KB Investment Securities | 70,265 | 70,265 | 70,265 | 70,265 | 70,265 | 70,265 | 70,265 | 70,265 | 70,265 | 58,889 | ||||||||||||||||||||||||||||||
Powernet Technologies Co., Ltd | — | — | 6,454 | 6,454 | 6,454 | 6,454 | ||||||||||||||||||||||||||||||||||
KB Savings Bank Co., Ltd | 108,000 | 72,843 | 108,000 | 72,843 | ||||||||||||||||||||||||||||||||||||
Yehansoul Savings Bank Co., Ltd | — | — | 7,343 | 7,343 | ||||||||||||||||||||||||||||||||||||
|
|
|
|
|
|
|
|
|
| |||||||||||||||||||||||||||||||
Total | (Won) | 136,755 | (Won) | 136,755 | (Won) | 143,209 | (Won) | 143,209 | (Won) | 143,209 | (Won) | 143,209 | ₩ | 244,755 | ₩ | 209,598 | ₩ | 252,098 | ₩ | 205,565 | ||||||||||||||||||||
|
|
|
|
|
|
|
|
|
| |||||||||||||||||||||||||||||||
The goodwill related to Housing & Commercial Bank (“H&CB”), KB Cambodia Bank and KB Investment Securities arose prior to the IFRS transition date, and the carrying amountchanges in accumulated impairment losses of goodwill for the years ended December 31, 2012 and 2013, are as of the IFRS transition date was its carrying amount in accordance with previous K-GAAP.follows:
| 2012 | ||||||||||||||
| Beginning | Impairment | Others | Ending | |||||||||||
| (In millions of Korean won) | ||||||||||||||
| ₩ | — | ₩ | 35,157 | ₩ | — | ₩ | 35,157 | |||||||
| 2013 | ||||||||||||||
| Beginning | Impairment | Others | Ending | |||||||||||
| (In millions of Korean won) | ||||||||||||||
| ₩ | 35,157 | ₩ | 11,376 | ₩ | — | ₩ | 46,533 | |||||||
The details of allocating goodwill to cash-generating units and related information for impairment testing as of December 31, 2011,2013, are as follows:
| Housing & Commercial Bank | Housing & Commercial Bank | |||||||||||||||||||||||||||||||||||||||||||||||
| Retail banking | Corporate banking | KB Cambodia Bank | KB Investment Securities | Powernet Technologies Co., Ltd. | Total | Retail Banking | Corporate Banking | KB Cambodia Bank | KB Investment Securities | KB Savings Bank Co., Ltd. and Yehansoul Savings Bank Co., Ltd. | Total | |||||||||||||||||||||||||||||||||||||
| (In millions of Korean won) | (In millions of Korean won) | |||||||||||||||||||||||||||||||||||||||||||||||
Carrying amounts | (Won) | 49,315 | (Won) | 15,973 | (Won) | 1,202 | (Won) | 70,265 | (Won) | 6,454 | (Won) | 143,209 | ₩ | 49,315 | ₩ | 15,973 | ₩ | 1,202 | ₩ | 58,889 | ₩ | 80,186 | ₩ | 205,565 | ||||||||||||||||||||||||
Recoverable amount exceeded carrying amount | 114,763 | 96,851 | 893 | 48,176 | 1,157 | 261,840 | 40,254 | 2,814,955 | 21,506 | — | 730 | 2,877,445 | ||||||||||||||||||||||||||||||||||||
Discount rate (%) | 16.0 | 15.0 | 18.9 | 16.4 | 15.5 | 13.27 | 13.04 | 26.25 | 14.65 | 13.94 | ||||||||||||||||||||||||||||||||||||||
Permanent growth rate (%) | 2.3 | 2.3 | 4.7 | 2.3 | 2.3 | 3.00 | 3.00 | 3.40 | 3.00 | 2.00 | ||||||||||||||||||||||||||||||||||||||
Goodwill is allocated to cash-generating units, based on management’s analysis, that are expected to benefit from the synergies of the combination for impairment testing, and cash-generating units consist of an operating segment or units which are not larger than an operating segment. The Group recognized the amount of (Won)65,288₩65,288 million related to goodwill acquired in the merger of Housing & Commercial Bank. Of those respective amounts, the amounts of (Won)49,315₩49,315 million and (Won)15,973₩15,973 million were allocated to the Retail Banking and Corporate Banking, respectively. Cash-generating units to which goodwill has been allocated is tested for impairment annually, and whenever there is an indication that the unit may be impaired, by comparing the carrying amount of the unit, including the goodwill, with the recoverable amount of the unit.
The recoverable amount of a cash-generating unit is measured at the higher of its fair value less costs to sell and its value in use. The fair value less costs to sell is the amount obtainable from the sale in an arm’s length transaction between knowledgeable, willing parties, less the costs of disposal. If it is difficult to measure the amount obtainable from the sale, the Group measures the fair value less costs to sell by adjusting the amount obtained from the sale of similar cash-generating units, reflecting the characteristics of the measured cash-generating unit. If it is not possible to obtain the reliable information to measure the fair value less costs to sell, the Group uses the asset’s value in use as its recoverable amount. Value in use is the present value of the future cash flows expected to be derived from an asset or cash-generating unit. The projections of the future cash flows
are based on the most recent financial budget approved by management and generally cover a maximum period of five years. The future cash flows after a maximumprojection period of five years are estimated on the assumption that the future cash flows will increase by 2.3%3% for Retail Banking, Corporate Banking, KB Investment Securities, and Powernet Technologies3.4% for KB Cambodia Bank and 2.0% for KB Savings Bank Co., Ltd. and 4.7%Yehansoul Savings Bank Co., Ltd. for KB Cambodia Bank every year. The key assumptions used for the estimation of the future cash flows are the market size and the Group’s market share. The discount rate is a pre-tax rate that reflects assumptions regarding risk-free interest rate, market risk premium and the risks specific to the asset for which the future cash flow estimates have not been adjusted.
The details of intangible assets, excluding goodwill, as of January 1, 2010, and December 31, 20102012 and 2011,2013, are as follows:
| As of January 1, 2010 | ||||||||||||
| Acquisition cost | Accumulated amortization | Carrying amount | ||||||||||
| (In millions of Korean won) | ||||||||||||
Industrial property rights | (Won) | 946 | (Won) | (832 | ) | (Won) | 114 | |||||
Software | 305,963 | (145,082 | ) | 160,881 | ||||||||
Other intangible assets | 151,390 | (57,753 | ) | 93,637 | ||||||||
Finance leases assets | 13,656 | (2,466 | ) | 11,190 | ||||||||
|
|
|
|
|
| |||||||
Total | (Won) | 471,955 | (Won) | (206,133 | ) | (Won) | 265,822 | |||||
|
|
|
|
|
| |||||||
| As of December 31, 2010 | ||||||||||||
| Acquisition cost | Accumulated amortization | Carrying amount | ||||||||||
| (In millions of Korean won) | ||||||||||||
Industrial property rights | (Won) | 955 | (Won) | (870 | ) | (Won) | 85 | |||||
Software | 495,715 | (238,178 | ) | 257,537 | ||||||||
Other intangible assets | 160,573 | (64,261 | ) | 96,312 | ||||||||
Finance leases assets | 13,656 | (5,879 | ) | 7,777 | ||||||||
|
|
|
|
|
| |||||||
Total | (Won) | 670,899 | (Won) | (309,188 | ) | (Won) | 361,711 | |||||
|
|
|
|
|
| |||||||
| As of December 31, 2011 | 2012 | |||||||||||||||||||||||||||||||
| Acquisition cost | Accumulated amortization | Accumulated impairment losses | Carrying amount | Acquisition cost | Accumulated amortization | Accumulated impairment losses | Carrying amount | |||||||||||||||||||||||||
| (In millions of Korean won) | (In millions of Korean won) | |||||||||||||||||||||||||||||||
Industrial property rights | (Won) | 1,025 | (Won) | (919 | ) | (Won) | — | (Won) | 106 | ₩ | 1,436 | ₩ | (1,018 | ) | ₩ | — | ₩ | 418 | ||||||||||||||
Software | 556,739 | (340,421 | ) | — | 216,318 | 576,056 | (408,024 | ) | — | 168,032 | ||||||||||||||||||||||
Other intangible assets | 183,714 | (69,396 | ) | (13,926 | ) | 100,392 | 185,158 | (59,319 | ) | (17,845 | ) | 107,994 | ||||||||||||||||||||
Finance leases assets | 19,060 | (10,644 | ) | — | 8,416 | 23,413 | (16,324 | ) | — | 7,089 | ||||||||||||||||||||||
|
|
|
|
|
|
|
| |||||||||||||||||||||||||
Total | (Won) | 760,538 | (Won) | (421,380 | ) | (Won) | (13,926 | ) | (Won) | 325,232 | ₩ | 786,063 | ₩ | (484,685 | ) | ₩ | (17,845 | ) | ₩ | 283,533 | ||||||||||||
|
|
|
|
|
|
|
| |||||||||||||||||||||||||
Industrial property rights Software Other intangible assets Finance leases assets Total 2013 Acquisition
cost Accumulated
amortization Accumulated
impairment
losses Carrying
amount (In millions of Korean won) ₩ 1,405 ₩ (936 ) ₩ — ₩ 469 614,124 (500,327 ) — 113,797 206,427 (67,892 ) (23,217 ) 115,318 29,450 (21,395 ) — 8,055 ₩ 851,406 ₩ (590,550 ) ₩ (23,217 ) ₩ 237,639
The changes in intangible assets, excluding goodwill, for the years ended December 31, 20102012 and 2011,2013, are as follows:
| For the Year Ended December 31, 2010 | 2012 | |||||||||||||||||||||||||||||||||||||||||||||||
| Beginning | Acquisition | Amortization(1) | Others | Ending | Beginning | Acquisition | Disposal | Transfer | Amortization(1) | Others | Ending | |||||||||||||||||||||||||||||||||||||
| (In millions of Korean won) | (In millions of Korean won) | |||||||||||||||||||||||||||||||||||||||||||||||
Industrial property rights | (Won) | 114 | (Won) | 9 | (Won) | (38 | ) | (Won) | — | (Won) | 85 | ₩ | 106 | ₩ | 429 | ₩ | — | ₩ | — | ₩ | (102 | ) | ₩ | (15 | ) | ₩ | 418 | |||||||||||||||||||||
Software | 160,881 | 184,293 | (87,637 | ) | — | 257,537 | 216,318 | 52,576 | (280 | ) | — | (100,578 | ) | (4 | ) | 168,032 | ||||||||||||||||||||||||||||||||
Other intangible assets | 93,637 | 8,821 | (6,143 | ) | (3 | ) | 96,312 | 100,392 | 24,541 | (3,946 | ) | — | (7,811 | ) | (5,182 | ) | 107,994 | |||||||||||||||||||||||||||||||
Finance leases assets | 11,190 | — | (3,413 | ) | — | 7,777 | 8,416 | 4,353 | — | — | (5,680 | ) | — | 7,089 | ||||||||||||||||||||||||||||||||||
|
|
|
|
|
|
|
|
|
|
|
| |||||||||||||||||||||||||||||||||||||
Total | (Won) | 265,822 | (Won) | 193,123 | (Won) | (97,231 | ) | (Won) | (3 | ) | (Won) | 361,711 | ₩ | 325,232 | ₩ | 81,899 | ₩ | (4,226 | ) | ₩ | — | ₩ | (114,171 | ) | ₩ | (5,201 | ) | ₩ | 283,533 | |||||||||||||||||||
|
|
|
|
|
|
|
|
|
|
|
| |||||||||||||||||||||||||||||||||||||
| 2013 | ||||||||||||||||||||||||||||
| Beginning | Acquisition | Disposal | Transfer | Amortization(1) | Others | Ending | ||||||||||||||||||||||
| (In millions of Korean won) | ||||||||||||||||||||||||||||
Industrial property rights | ₩ | 418 | ₩ | 190 | ₩ | — | ₩ | — | ₩ | (137 | ) | ₩ | (2 | ) | ₩ | 469 | ||||||||||||
Software | 168,032 | 33,649 | — | — | (87,078 | ) | (806 | ) | 113,797 | |||||||||||||||||||
Other intangible assets(2) | 107,994 | 34,252 | (5,177 | ) | 38 | (9,122 | ) | (12,667 | ) | 115,318 | ||||||||||||||||||
Finance leases assets | 7,089 | 6,036 | — | — | (5,070 | ) | — | 8,055 | ||||||||||||||||||||
|
|
|
|
|
|
|
|
|
|
|
|
|
| |||||||||||||||
Total | ₩ | 283,533 | ₩ | 74,127 | ₩ | (5,177 | ) | ₩ | 38 | ₩ | (101,407 | ) | ₩ | (13,475 | ) | ₩ | 237,639 | |||||||||||
|
|
|
|
|
|
|
|
|
|
|
|
|
| |||||||||||||||
| (1) | Including |
| For the Year Ended December 31, 2011 | ||||||||||||||||||||||||||||
| Beginning | �� | Acquisition | Disposal | Transfer | Amortization(1) | Others | Ending | |||||||||||||||||||||
| (In millions of Korean won) | ||||||||||||||||||||||||||||
Industrial property rights | (Won) | 85 | (Won) | 28 | (Won) | — | (Won) | — | (Won) | (42 | ) | (Won) | 35 | (Won) | 106 | |||||||||||||
Software | 257,537 | 64,826 | — | 435 | (106,480 | ) | — | 216,318 | ||||||||||||||||||||
Other intangible assets | 96,312 | 34,142 | (9,310 | ) | (435 | ) | (6,361 | ) | (13,956 | ) | 100,392 | |||||||||||||||||
Finance leases assets | 7,777 | 5,404 | — | — | (4,765 | ) | — | 8,416 | ||||||||||||||||||||
|
|
|
|
|
|
|
|
|
|
|
|
|
| |||||||||||||||
Total | (Won) | 361,711 | (Won) | 104,400 | (Won) | (9,310 | ) | (Won) | — | (Won) | (117,648 | ) | (Won) | (13,921 | ) | (Won) | 325,232 | |||||||||||
|
|
|
|
|
|
|
|
|
|
|
|
|
| |||||||||||||||
|
The changes in accumulated impairment losses on intangible assets, excluding goodwill, for the yearyears ended December 31, 2011,2012 and 2013, are as follows:
| Beginning(1) | Impairment | Reversal | Others | Ending | ||||||||||||||||
Accumulated impairment losses on intangible assets | (Won) | — | (Won) | (13,926 | ) | (Won) | — | (Won) | — | (Won) | (13,926 | ) | ||||||||
|
| 2012 | ||||||||||||||||||||
| Beginning | Impairment | Reversal | Disposal and others | Ending | ||||||||||||||||
| (In millions of Korean won) | ||||||||||||||||||||
Accumulated impairment losses on intangible assets | ₩ | (13,926 | ) | ₩ | (5,166 | ) | ₩ | 72 | ₩ | 1,175 | ₩ | (17,845 | ) | |||||||
| 2013 | ||||||||||||||||||||
| Beginning | Impairment | Reversal | Disposal and others | Ending | ||||||||||||||||
| (In millions of Korean won) | ||||||||||||||||||||
Accumulated impairment losses on intangible assets | ₩ | (17,845 | ) | ₩ | (5,763 | ) | ₩ | 24 | ₩ | 367 | ₩ | (23,217 | ) | |||||||
16. Deferred income tax assets and liabilities
The details of deferred income tax assets and liabilities as of January 1, 2010, and December 31, 20102012 and 2011,2013, are as follows:
| As of January 1, 2010 | 2012 | |||||||||||||||||||||||
| Assets | Liabilities | Net amount | Assets | Liabilities | Net amount | |||||||||||||||||||
| (In millions of Korean won) | (In millions of Korean won) | |||||||||||||||||||||||
Other provisions | (Won) | 186,852 | (Won) | (81,774 | ) | (Won) | 105,078 | ₩ | 139,412 | ₩ | (57 | ) | ₩ | 139,355 | ||||||||||
Allowances for loan losses | 2,926 | (128,378 | ) | (125,452 | ) | 1,144 | (2,578 | ) | (1,434 | ) | ||||||||||||||
Impairment losses on property and equipment | 2,097 | — | 2,097 | 2,111 | — | 2,111 | ||||||||||||||||||
Interest on equity index-linked deposits | 2,010 | — | 2,010 | 722 | — | 722 | ||||||||||||||||||
Share-based payments | 6,191 | — | 6,191 | |||||||||||||||||||||
Provisions for guarantees | 32,546 | (10,978 | ) | 21,568 | 50,398 | — | 50,398 | |||||||||||||||||
Losses(gains) from valuation on derivatives | 4,197 | (109,220 | ) | (105,023 | ) | |||||||||||||||||||
Losses(gains) from valuation on derivative financial instruments | 1,593 | (39,501 | ) | (37,908 | ) | |||||||||||||||||||
Present value discount | — | (6,642 | ) | (6,642 | ) | 2,337 | (7,081 | ) | (4,744 | ) | ||||||||||||||
Losses(gains) from fair value hedged item | — | (26,328 | ) | (26,328 | ) | 30,802 | — | 30,802 | ||||||||||||||||
Accrued interest | 181 | (21,343 | ) | (21,162 | ) | — | (80,459 | ) | (80,459 | ) | ||||||||||||||
Deferred loan origination fees and costs | 53 | (55,261 | ) | (55,208 | ) | 8,745 | (94,142 | ) | (85,397 | ) | ||||||||||||||
Advanced depreciation provisions | — | (111,542 | ) | (111,542 | ) | |||||||||||||||||||
Losses(gains) from revaluation | — | (251,629 | ) | (251,629 | ) | |||||||||||||||||||
Gains from revaluation | — | (276,421 | ) | (276,421 | ) | |||||||||||||||||||
Investments in subsidiaries and others | 46,701 | (2,583 | ) | 44,118 | 49,128 | (57,388 | ) | (8,260 | ) | |||||||||||||||
Derivative linked securities | 161,642 | (160,131 | ) | 1,511 | ||||||||||||||||||||
Others | 361,614 | (221,634 | ) | 139,980 | 464,989 | (337,327 | ) | 127,662 | ||||||||||||||||
|
|
|
|
|
| |||||||||||||||||||
Sub-total | 639,177 | (1,027,312 | ) | (388,135 | ) | 919,214 | (1,055,085 | ) | (135,871 | ) | ||||||||||||||
|
|
| ||||||||||||||||||||||
Off-setting of deferred income tax assets and liabilities | (622,673 | ) | 622,673 | — | ||||||||||||||||||||
Offsetting of deferred income tax assets and liabilities | (900,782 | ) | 900,782 | — | ||||||||||||||||||||
|
|
|
|
|
| |||||||||||||||||||
Total | (Won) | 16,504 | (Won) | (404,639 | ) | (Won) | (388,135 | ) | ₩ | 18,432 | ₩ | (154,303 | ) | ₩ | (135,871 | ) | ||||||||
|
|
|
|
|
| |||||||||||||||||||
| As of December 31, 2010 | 2013 | |||||||||||||||||||||||
| Assets | Liabilities | Net amount | Assets | Liabilities | Net amount | |||||||||||||||||||
| (In millions of Korean won) | (In millions of Korean won) | |||||||||||||||||||||||
Other provisions | (Won) | 130,669 | (Won) | (32 | ) | (Won) | 130,637 | ₩ | 113,685 | ₩ | — | ₩ | 113,685 | |||||||||||
Allowances for loan losses | 4,642 | (13,916 | ) | (9,274 | ) | 171 | (2,118 | ) | (1,947 | ) | ||||||||||||||
Impairment losses on property and equipment | 1,537 | — | 1,537 | 2,873 | — | 2,873 | ||||||||||||||||||
Interest on equity index-linked deposits | 2,514 | — | 2,514 | 340 | — | 340 | ||||||||||||||||||
Share-based payments | 3,176 | — | 3,176 | 8,512 | — | 8,512 | ||||||||||||||||||
Provisions for guarantees | 99,484 | — | 99,484 | 50,463 | — | 50,463 | ||||||||||||||||||
Losses(gains) from valuation on derivatives | 989 | (122,808 | ) | (121,819 | ) | |||||||||||||||||||
Losses(gains) from valuation on derivative financial instruments | 1,045 | (15,119 | ) | (14,074 | ) | |||||||||||||||||||
Present value discount | — | (16,147 | ) | (16,147 | ) | 2,554 | (6,812 | ) | (4,258 | ) | ||||||||||||||
Losses(gains) from fair value hedged item | 28,517 | — | 28,517 | 16,670 | (111 | ) | 16,559 | |||||||||||||||||
Accrued interest | — | (92,135 | ) | (92,135 | ) | — | (79,656 | ) | (79,656 | ) | ||||||||||||||
Deferred loan origination fees and costs | 41 | (69,773 | ) | (69,732 | ) | 13,263 | (97,532 | ) | (84,269 | ) | ||||||||||||||
Advanced depreciation provisions | — | (111,542 | ) | (111,542 | ) | |||||||||||||||||||
Losses(gains) from revaluation | — | (251,418 | ) | (251,418 | ) | |||||||||||||||||||
Dividends from SPEs | 564 | — | 564 | |||||||||||||||||||||
Gains from revaluation | — | (276,057 | ) | (276,057 | ) | |||||||||||||||||||
Investments in subsidiaries and others | 46,354 | (27,662 | ) | 18,692 | 74,324 | (63,407 | ) | 10,917 | ||||||||||||||||
Derivative linked securities | 265,477 | (264,024 | ) | 1,453 | ||||||||||||||||||||
Others | 323,185 | (215,769 | ) | 107,416 | 546,499 | (337,434 | ) | 209,065 | ||||||||||||||||
|
|
|
|
|
| |||||||||||||||||||
Sub-total | 641,672 | (921,202 | ) | (279,530 | ) | 1,095,876 | (1,142,270 | ) | (46,394 | ) | ||||||||||||||
|
|
| ||||||||||||||||||||||
Off-setting of deferred income tax assets and liabilities | (637,627 | ) | 637,627 | — | ||||||||||||||||||||
Offsetting of deferred income tax assets and liabilities | (1,080,454 | ) | 1,080,454 | — | ||||||||||||||||||||
|
|
|
|
|
| |||||||||||||||||||
Total | (Won) | 4,045 | (Won) | (283,575 | ) | (Won) | (279,530 | ) | ₩ | 15,422 | ₩ | (61,816 | ) | ₩ | (46,394 | ) | ||||||||
|
|
|
|
|
| |||||||||||||||||||
Other provisions Allowances for loan losses Impairment losses on property and equipment Interest on equity index-linked deposits Share-based payments Provisions for guarantees Losses(gains) from valuation on derivatives Present value discount Losses(gains) from fair value hedged item Accrued interest Deferred loan origination fees and costs Gains from revaluation Investments in subsidiaries and others Derivative linked securities Others Sub-total Off-setting of deferred income tax assets and liabilities Total As of December 31, 2011 Assets Liabilities Net amount (In millions of Korean won) (Won) 113,752 (Won) (115 ) (Won) 113,637 200 (2,574 ) (2,374 ) 3,065 — 3,065 1,785 — 1,785 4,069 — 4,069 75,326 — 75,326 1,584 (109,427 ) (107,843 ) 3,770 (12,603 ) (8,833 ) 26,522 — 26,522 — (91,147 ) (91,147 ) 49 (96,848 ) (96,799 ) — (276,505 ) (276,505 ) 24,943 (41,541 ) (16,598 ) 444,766 (446,837 ) (2,071 ) 433,962 (254,709 ) 179,253 1,133,793 (1,332,306 ) (198,513 ) (1,111,464 ) 1,111,464 — (Won) 22,329 (Won) (220,842 ) (Won) (198,513 )
Unrecognized deferred income tax assets
No deferred income tax assets have been recognized for the deductible temporary difference of ₩603,097 million associated with investments in subsidiaries and others as of December 31, 2013, because it is not probable that the temporary differences will be reversed in the foreseeable future.
No deferred income tax assets have been recognized for deductible temporary differences of ₩250 million, ₩80,204 million and ₩94,786 million associated with loss on other provisions, SPE repurchase and others, respectively, as of December 31, 2013, due to the uncertainty that these will be realized in the future.
Unrecognized deferred income tax liabilities
No deferred income tax liabilities have been recognized for the taxable temporary difference of (Won)47,625₩118,749 million associated with investment in subsidiaries and associates as of December 31, 2011,2013, due to the following reasons:
The Group is able to control the timing of the reversal of the temporary difference.
It is probable that the temporary difference will not reversebe reversed in the foreseeable future.
No deferred income tax liabilities have been recognized as of December 31, 2013, for the taxable temporary difference of (Won)65,288₩65,288 million arising from the initial recognition of goodwill asfrom the merger of December 31, 2011.
Unrecognized deferred income tax assets
No deferred income tax assets have been recognized for the deductible temporary difference of (Won)3,279,925 million associated with investments in subsidiariesHousing and others as of December 31, 2011, because it is not probable that the temporary differences will reverse in the foreseeable future.Commercial Bank.
No deferred income tax assets have been recognized for deductible temporary differences of (Won)2,546 million, (Won) 365 million, (Won) 80,204 million and (Won) 88,939 million associated with share-based payments, other provisions, loss on SPE repurchase and others, respectively, as of December 31, 2011, due to the uncertainty that these will be realized in the future.
The changes in cumulative temporary differences for the years ended December 31, 20102012 and 2011,2013, are as follows:
| For the Year Ended December 31, 2010 | 2012 | |||||||||||||||||||||||||||||||
| Beginning | Decrease | Increase | Ending | Beginning | Decrease | Increase | Ending | |||||||||||||||||||||||||
| (In millions of Korean won) | (In millions of Korean won) | |||||||||||||||||||||||||||||||
Deductible temporary differences | ||||||||||||||||||||||||||||||||
Gains (losses) from fair value hedged item | (Won) | — | (Won) | — | (Won) | 129,178 | (Won) | 129,178 | ||||||||||||||||||||||||
Losses(gains) from fair value hedged item | ₩ | 109,596 | ₩ | 109,596 | ₩ | 127,281 | ₩ | 127,281 | ||||||||||||||||||||||||
Other provisions | 477,776 | 479,693 | 586,916 | 584,999 | 470,507 | 430,917 | 537,409 | 576,999 | ||||||||||||||||||||||||
Accrued interest | 746 | 746 | — | — | ||||||||||||||||||||||||||||
Allowances for loan losses | 13,570 | 18,037 | 24,736 | 20,269 | 827 | 149 | 4,049 | 4,727 | ||||||||||||||||||||||||
Impairment losses on property and equipment | 9,468 | 9,468 | 6,904 | 6,904 | 12,666 | 12,666 | 8,723 | 8,723 | ||||||||||||||||||||||||
Deferred loan origination fees and costs | 217 | 217 | 171 | 171 | 204 | 204 | 36,136 | 36,136 | ||||||||||||||||||||||||
Interest on equity index-linked deposits | 8,306 | 8,306 | 10,388 | 10,388 | 7,378 | 7,378 | 2,985 | 2,985 | ||||||||||||||||||||||||
Share-based payments | 46,572 | 46,572 | 30,271 | 30,271 | 19,359 | 19,359 | 25,591 | 25,591 | ||||||||||||||||||||||||
Provisions for guarantees | 91,988 | 91,988 | 414,048 | 414,048 | 311,263 | 311,263 | 208,255 | 208,255 | ||||||||||||||||||||||||
Gains (losses) from valuation on derivatives | 4,312 | 4,312 | 4,468 | 4,468 | ||||||||||||||||||||||||||||
Dividends from SPEs | 185,602 | 183,039 | — | 2,563 | ||||||||||||||||||||||||||||
Gains(losses) from valuation on derivative financial instruments | 6,548 | 6,548 | 6,581 | 6,581 | ||||||||||||||||||||||||||||
Present value discount | 15,579 | 15,579 | 9,655 | 9,655 | ||||||||||||||||||||||||||||
Loss on SPE repurchase | 80,204 | — | — | 80,204 | 80,204 | — | — | 80,204 | ||||||||||||||||||||||||
Investments in subsidiaries and others | 3,361,305 | 109,029 | 231,000 | 3,483,276 | 3,401,419 | 917,955 | 204,158 | 2,687,622 | ||||||||||||||||||||||||
Derivative securities | 1,837,877 | 1,837,877 | 667,942 | 667,942 | ||||||||||||||||||||||||||||
Others | 1,309,930 | 313,391 | 397,462 | 1,394,001 | 1,826,081 | 1,120,250 | 1,298,705 | 2,004,536 | ||||||||||||||||||||||||
|
|
|
|
|
|
|
| |||||||||||||||||||||||||
Sub-total | 5,589,996 | 1,264,798 | 1,835,542 | 6,160,740 | 8,099,508 | 4,789,741 | 3,137,470 | 6,447,237 | ||||||||||||||||||||||||
|
|
|
|
|
|
|
| |||||||||||||||||||||||||
Unrecognized deferred income tax assets: | ||||||||||||||||||||||||||||||||
Share based payments | 46,572 | 15,834 | ||||||||||||||||||||||||||||||
Share-based payments | 2,546 | 10 | ||||||||||||||||||||||||||||||
Other provisions | 344 | 1,477 | 365 | 817 | ||||||||||||||||||||||||||||
Dividends from SPEs | 185,602 | — | ||||||||||||||||||||||||||||||
Loss on SPE repurchase | 80,204 | 80,204 | 80,204 | 80,204 | ||||||||||||||||||||||||||||
Investments in subsidiaries and others | 3,148,284 | 3,271,732 | 3,299,083 | 2,492,775 | ||||||||||||||||||||||||||||
Others | 90,928 | 92,307 | 88,939 | 87,342 | ||||||||||||||||||||||||||||
|
|
|
| |||||||||||||||||||||||||||||
Total | (Won) | 2,038,062 | (Won) | 2,699,186 | 4,628,371 | 3,786,089 | ||||||||||||||||||||||||||
Tax rate (%) | 24.2 | 24.2 | ||||||||||||||||||||||||||||||
|
|
|
| |||||||||||||||||||||||||||||
Tax rate (%)(1) | 24.2, 22.0 | 24.2, 22.0 | ||||||||||||||||||||||||||||||
Total deferred income tax assets from deductible temporary differences | ₩ | 1,128,914 | ₩ | 919,214 | ||||||||||||||||||||||||||||
|
|
|
| |||||||||||||||||||||||||||||
Deferred income tax assets from deductible temporary differences | (Won) | 639,177 | (Won) | 641,672 | ||||||||||||||||||||||||||||
|
| |||||||||||||||||||||||||||||||
| For the Year Ended December 31, 2010 | 2012 | |||||||||||||||||||||||||||||||
| Beginning | Decrease | Increase | Ending | Beginning | Decrease | Increase | Ending | |||||||||||||||||||||||||
| (In millions of Korean won) | (In millions of Korean won) | |||||||||||||||||||||||||||||||
Taxable temporary differences | ||||||||||||||||||||||||||||||||
Gains (losses) from fair value hedged item | (Won) | (120,437 | ) | (Won) | (120,437 | ) | (Won) | — | (Won) | — | ||||||||||||||||||||||
Accrued interest | (89,928 | ) | (25,776 | ) | (341,265 | ) | (405,417 | ) | ₩ | (381,276 | ) | ₩ | (287,013 | ) | ₩ | (244,863 | ) | ₩ | (339,126 | ) | ||||||||||||
Allowances for loans losses | (529,573 | ) | (528,693 | ) | (56,698 | ) | (57,578 | ) | (10,636 | ) | — | (18 | ) | (10,654 | ) | |||||||||||||||||
Deferred loan origination fees and costs | (246,565 | ) | (246,565 | ) | (312,168 | ) | (312,168 | ) | (400,199 | ) | (400,199 | ) | (389,017 | ) | (389,017 | ) | ||||||||||||||||
Advanced depreciation provisions | (460,918 | ) | — | — | (460,918 | ) | ||||||||||||||||||||||||||
Gains (losses) from valuation on derivatives | (476,513 | ) | (476,513 | ) | (502,897 | ) | (502,897 | ) | ||||||||||||||||||||||||
Gains(losses) from valuation on derivative financial instruments | (452,200 | ) | (452,200 | ) | (163,225 | ) | (163,225 | ) | ||||||||||||||||||||||||
Present value discount | (40,058 | ) | — | (30,936 | ) | (70,994 | ) | (57,287 | ) | (25,102 | ) | — | (32,185 | ) | ||||||||||||||||||
Goodwill | (65,288 | ) | — | — | (65,288 | ) | (65,288 | ) | — | — | (65,288 | ) | ||||||||||||||||||||
Gains on revaluation | (1,143,769 | ) | (960 | ) | — | (1,142,809 | ) | (1,142,581 | ) | (347 | ) | — | (1,142,234 | ) | ||||||||||||||||||
Investments in subsidiaries and others | (3,068,353 | ) | (3,484 | ) | (185,617 | ) | (3,250,486 | ) | (5,345,703 | ) | (562 | ) | (614,349 | ) | (5,959,490 | ) | ||||||||||||||||
Derivative securities | (1,846,433 | ) | (1,846,433 | ) | (661,700 | ) | (661,700 | ) | ||||||||||||||||||||||||
Others | (615,125 | ) | (124,787 | ) | (392,439 | ) | (882,777 | ) | (1,144,976 | ) | (187,505 | ) | (350,246 | ) | (1,307,717 | )�� | ||||||||||||||||
|
|
|
|
|
|
|
| |||||||||||||||||||||||||
Sub-total | (6,856,527 | ) | (1,527,215 | ) | (1,822,020 | ) | (7,151,332 | ) | (10,846,579 | ) | (3,199,361 | ) | (2,423,418 | ) | (10,070,636 | ) | ||||||||||||||||
|
|
|
|
|
|
|
| |||||||||||||||||||||||||
Unrecognized deferred income tax liabilities: | ||||||||||||||||||||||||||||||||
Unrecognized deferred income tax assets: | ||||||||||||||||||||||||||||||||
Goodwill | (65,288 | ) | (65,288 | ) | (65,288 | ) | (65,288 | ) | ||||||||||||||||||||||||
Investments in subsidiaries and others | (14,110 | ) | (15,196 | ) | (53,293 | ) | (83,745 | ) | ||||||||||||||||||||||||
|
|
|
| |||||||||||||||||||||||||||||
Total | (Won) | (6,777,129 | ) | (Won) | (7,070,848 | ) | (10,727,998 | ) | (9,921,603 | ) | ||||||||||||||||||||||
Tax rate (%) | 24.2 | 24.2 | ||||||||||||||||||||||||||||||
|
|
|
| |||||||||||||||||||||||||||||
Tax rate (%)(1) | 24.2, 22.0 | 24.2, 22.0 | ||||||||||||||||||||||||||||||
Total deferred income tax assets from deductible temporary differences | ₩ | (1,352,279 | ) | ₩ | (1,055,085 | ) | ||||||||||||||||||||||||||
|
|
|
| |||||||||||||||||||||||||||||
Deferred income tax liabilities from taxable temporary differences | (Won) | (1,027,312 | ) | (Won) | (921,202 | ) | ||||||||||||||||||||||||||
|
| |||||||||||||||||||||||||||||||
|
| 2013 | ||||||||||||||||
| Beginning | Decrease | Increase | Ending | |||||||||||||
| (In millions of Korean won) | ||||||||||||||||
Deductible temporary differences | ||||||||||||||||
Losses(gains) from fair value hedged item | ₩ | 127,281 | ₩ | 127,281 | ₩ | 68,884 | ₩ | 68,884 | ||||||||
Other provisions | 576,999 | 553,376 | 446,706 | 470,329 | ||||||||||||
Allowances for loan losses | 4,727 | 4,221 | 199 | 705 | ||||||||||||
Impairment losses on property and equipment | 8,723 | 8,723 | 11,873 | 11,873 | ||||||||||||
Deferred loan origination fees and costs | 36,136 | 35,720 | 54,200 | 54,616 | ||||||||||||
Interest on equity index-linked deposits | 2,985 | 2,985 | 1,407 | 1,407 | ||||||||||||
Share-based payments | 25,591 | 25,591 | 35,174 | 35,174 | ||||||||||||
Provisions for guarantees | 208,255 | 208,255 | 208,524 | 208,524 | ||||||||||||
Gains(losses) from valuation on derivative financial instruments | 6,581 | 6,581 | 4,319 | 4,319 | ||||||||||||
Present value discount | 9,655 | 9,658 | 10,558 | 10,555 | ||||||||||||
Loss on SPE repurchase | 80,204 | — | — | 80,204 | ||||||||||||
Investments in subsidiaries and others | 2,687,622 | 2,099,827 | 302,836 | 890,631 | ||||||||||||
Derivative linked securities | 667,942 | 667,942 | 1,097,012 | 1,097,012 | ||||||||||||
Others | 2,004,536 | 947,787 | 1,300,751 | 2,357,500 | ||||||||||||
|
|
|
|
|
|
|
| |||||||||
Sub-total | 6,447,237 | 4,697,947 | 3,542,443 | 5,291,733 | ||||||||||||
|
|
|
|
|
|
|
| |||||||||
Unrecognized deferred income tax assets: | ||||||||||||||||
Share-based payments | 10 | — | ||||||||||||||
Other provisions | 817 | 250 | ||||||||||||||
Loss on SPE repurchase | 80,204 | 80,204 | ||||||||||||||
Investments in subsidiaries and others | 2,492,775 | 603,097 | ||||||||||||||
Others | 87,342 | 94,786 | ||||||||||||||
|
|
|
| |||||||||||||
Total | 3,786,089 | 4,513,396 | ||||||||||||||
Tax rate (%) | 24.2 | 24.2 | ||||||||||||||
|
|
|
| |||||||||||||
Total deferred income tax assets from deductible temporary differences | ₩ | 919,214 | ₩ | 1,095,876 | ||||||||||||
|
|
|
| |||||||||||||
Deductible temporary differences Losses (gains) from fair value hedged item Other provisions Allowances for loan losses Impairment losses on property and equipment Deferred loan origination fees and costs Interest on equity index-linked deposits Share-based payments Provisions for guarantees Gains (losses) from valuation on derivatives Present value discount Dividends from SPEs Loss on SPE repurchase Investments in subsidiaries and others Derivative linked securities Others Sub-total Unrecognized deferred income tax assets: Share-based payments Other provisions Loss on SPE repurchase Investments in subsidiaries and others Others Total Tax rate (%)(1) Total deferred income tax assets from deductible temporary differences For the Year Ended December 31, 2011 Beginning Decrease Increase Ending (In millions of Korean won) (Won) 129,178 (Won) 129,178 (Won) 109,596 (Won) 109,596 584,999 894,311 779,819 470,507 20,269 35,642 16,200 827 6,904 6,904 12,666 12,666 171 486 519 204 10,388 10,388 7,378 7,378 30,271 30,271 19,359 19,359 414,048 428,288 325,503 311,263 4,468 4,451 6,531 6,548 — — 15,579 15,579 2,563 2,563 — — 80,204 — — 80,204 3,483,276 85,278 (336 ) 3,397,662 — — 1,837,877 1,837,877 1,394,001 1,352,107 1,805,161 1,847,055 6,160,740 2,979,867 4,935,852 8,116,725 15,834 2,546 1,477 365 80,204 80,204 3,271,732 3,279,925 92,307 88,939 (Won) 2,699,186 (Won) 4,664,746 24.2, 22.0 24.2 (Won) 641,672 (Won) 1,133,793
Taxable temporary differences Accrued interest Allowances for loans losses Deferred loan origination fees and costs Advanced depreciation provisions Gains (losses) from valuation on derivatives Present value discount Goodwill Gains on revaluation Investments in subsidiaries and others Derivative linked securities Others Sub-total Unrecognized deferred income tax liabilities: Goodwill Investments in subsidiaries and others Total Tax rate (%)(1) Total deferred income tax liabilities from taxable temporary differences For the Year Ended December 31, 2011 Beginning Decrease Increase Ending (In millions of Korean won) (Won) (405,417 ) (Won) (309,036 ) (Won) (284,895 ) (Won) (381,276 ) (57,578 ) (40,796 ) 6,146 (10,636 ) (312,168 ) (311,853 ) (399,884 ) (400,199 ) (460,918 ) (460,918 ) — — (502,897 ) (502,836 ) (452,139 ) (452,200 ) (70,994 ) (52,423 ) (38,716 ) (57,287 ) (65,288 ) — — (65,288 ) (1,142,809 ) (9,529 ) (9,301 ) (1,142,581 ) (3,250,486 ) (158 ) (2,084,081 ) (5,334,409 ) — — (1,846,433 ) (1,846,433 ) (882,777 ) (217,222 ) (414,493 ) (1,080,048 ) (7,151,332 ) (1,904,771 ) (5,523,796 ) (10,770,357 ) (65,288 ) (65,288 ) (15,196 ) (47,625 ) (Won) (7,070,848 ) (Won) (10,657,444 ) 24.2, 22.0 24.2 (Won) (921,202 ) (Won) (1,332,306 )
|
Taxable temporary differences Losses(gains) from fair value hedged item Accrued interest Allowances for loans losses Deferred loan origination fees and costs Gains(losses) from valuation on derivative financial instruments Present value discount Goodwill Gains on revaluation Investments in subsidiaries and others Derivative linked securities Others Sub-total Unrecognized deferred income tax assets: Goodwill Investments in subsidiaries and others Total Tax rate (%) Total deferred income tax assets from deductible temporary differences 2013 Beginning Decrease Increase Ending (In millions of Korean won) ₩ — ₩ — ₩ (502 ) ₩ (502 ) (339,126 ) (220,320 ) (217,970 ) (336,776 ) (10,654 ) (1,902 ) — (8,752 ) (389,017 ) (389,017 ) (403,026 ) (403,026 ) (163,225 ) (162,935 ) (62,287 ) (62,577 ) (32,185 ) (1,221 ) — (30,964 ) (65,288 ) — — (65,288 ) (1,142,234 ) (1,504 ) — (1,140,730 ) (5,959,490 ) (5,644,900 ) (53,127 ) (367,717 ) (661,700 ) (661,700 ) (1,091,009 ) (1,091,009 ) (1,307,717 ) (581,961 ) (660,956 ) (1,386,712 ) (10,070,636 ) (7,665,460 ) (2,488,877 ) (4,894,053 ) (65,288 ) (65,288 ) (83,745 ) (118,749 ) (9,921,603 ) (4,710,016 ) 24.2 24.2 ₩ (1,055,085 ) ₩ (1,142,270 )
17. Other Assets
The details of other assets as of January 1, 2010, and December 31, 2010 and 2011, are as follows:
| As of January 1, | As of December 31, | |||||||||||
| 2010 | 2010 | 2011 | ||||||||||
| (In millions of Korean won) | ||||||||||||
Other financial assets | ||||||||||||
Other receivables | (Won) | 3,238,762 | (Won) | 2,021,249 | (Won) | 2,470,405 | ||||||
Receivables from disposal of assets | 200 | 200 | — | |||||||||
Receivables in gold | 637 | — | 107 | |||||||||
Accrued income | 1,135,696 | 1,155,197 | 1,253,034 | |||||||||
Guarantee deposits | 1,328,859 | 1,318,003 | 1,333,370 | |||||||||
Domestic exchange settlement debits | 639,646 | 1,709,096 | 1,403,284 | |||||||||
Others | 323,266 | 347,467 | 304,694 | |||||||||
Allowances for loan losses | (384,624 | ) | (364,530 | ) | (353,905 | ) | ||||||
Present value discount | (778 | ) | (455 | ) | (1,084 | ) | ||||||
|
|
|
|
|
| |||||||
Sub-total | 6,281,664 | 6,186,227 | 6,409,905 | |||||||||
|
|
|
|
|
| |||||||
Other non-financial assets | ||||||||||||
Other receivables | 434 | 1,935 | 7,300 | |||||||||
Prepaid expenses | 196,262 | 333,360 | 307,742 | |||||||||
Guarantee deposits | 3,424 | 3,236 | 3,149 | |||||||||
Insurance assets | 39,386 | 72,097 | 127,368 | |||||||||
Separate account assets | 287,765 | 422,088 | 538,179 | |||||||||
Others | 189,511 | 82,063 | 93,215 | |||||||||
Allowances on other asset | (30,387 | ) | (24,210 | ) | (8,339 | ) | ||||||
|
|
|
|
|
| |||||||
Sub-total | 686,395 | 890,569 | 1,068,614 | |||||||||
|
|
|
|
|
| |||||||
Total | (Won) | 6,968,059 | (Won) | 7,076,796 | (Won) | 7,478,519 | ||||||
|
|
|
|
|
| |||||||
The changes in allowances for loan losses on other assets for the years ended December 31, 2010 and 2011, are as follows:
| For the Year Ended December 31, 2010 | ||||||||||||
| Other financial assets | Other non-financial assets | Total | ||||||||||
| (In millions of Korean won) | ||||||||||||
Beginning | (Won) | 384,624 | (Won) | 30,387 | (Won) | 415,011 | ||||||
Written-off | (124,956 | ) | (2,525 | ) | (127,481 | ) | ||||||
Provision (reversal) | 103,407 | (3,652 | ) | 99,755 | ||||||||
Others | 1,455 | — | 1,455 | |||||||||
|
|
|
|
|
| |||||||
Ending | (Won) | 364,530 | (Won) | 24,210 | (Won) | 388,740 | ||||||
|
|
|
|
|
| |||||||
| For the Year Ended December 31, 2011 | ||||||||||||
| Other financial assets | Other non-financial assets | Total | ||||||||||
| (In millions of Korean won) | ||||||||||||
Beginning | (Won) | 364,530 | (Won) | 24,210 | (Won) | 388,740 | ||||||
Written-off | (19,859 | ) | (19,800 | ) | (39,659 | ) | ||||||
Provision (reversal) | 9,505 | 3,678 | 13,183 | |||||||||
Others | (271 | ) | 251 | (20 | ) | |||||||
|
|
|
|
|
| |||||||
Ending | (Won) | 353,905 | (Won) | 8,339 | (Won) | 362,244 | ||||||
|
|
|
|
|
| |||||||
18. Assets held for sale
The details of assets held for sale as of January 1, 2010, and December 31, 20102012 and 2011,2013, are as follows:
| As of January 1, 2010 | 2012 | |||||||||||||||||||||||||||||||
| Acquisition cost(1) | Accumulated impairment | Carrying amount | Fair value less costs to sell | Acquisition cost(1) | Accumulated impairment | Carrying amount | Fair value less costs to sell | |||||||||||||||||||||||||
| (In millions of Korean won) | (In millions of Korean won) | |||||||||||||||||||||||||||||||
Buildings | (Won) | 10,058 | (Won) | (4,219 | ) | (Won) | 5,839 | (Won) | 5,878 | ₩ | 5,288 | ₩ | (2,613 | ) | ₩ | 2,675 | ₩ | 2,675 | ||||||||||||||
Land | 16,637 | (2,316 | ) | 14,321 | 14,850 | 35,883 | (3,146 | ) | 32,737 | 32,737 | ||||||||||||||||||||||
|
|
|
|
|
|
|
| |||||||||||||||||||||||||
Total | (Won) | 26,695 | (Won) | (6,535 | ) | (Won) | 20,160 | (Won) | 20,728 | ₩ | 41,171 | ₩ | (5,759 | ) | ₩ | 35,412 | ₩ | 35,412 | ||||||||||||||
|
|
|
|
|
|
|
| |||||||||||||||||||||||||
| As of December 31, 2010 | ||||||||||||||||
| Acquisition cost(1) | Accumulated impairment | Carrying amount | Fair value less costs to sell | |||||||||||||
| (In millions of Korean won) | ||||||||||||||||
Buildings | (Won) | 5,653 | (Won) | (2,251 | ) | (Won) | 3,402 | (Won) | 3,402 | |||||||
Land | 7,353 | (1,402 | ) | 5,951 | 5,951 | |||||||||||
|
|
|
|
|
|
|
| |||||||||
Total | (Won) | 13,006 | (Won) | (3,653 | ) | (Won) | 9,353 | (Won) | 9,353 | |||||||
|
|
|
|
|
|
|
| |||||||||
| As of December 31, 2011 | 2013 | |||||||||||||||||||||||||||||||
| Acquisition cost(1) | Accumulated impairment | Carrying amount | Fair value less costs to sell | Acquisition cost(1) | Accumulated impairment | Carrying amount | Fair value less costs to sell | |||||||||||||||||||||||||
| (In millions of Korean won) | (In millions of Korean won) | |||||||||||||||||||||||||||||||
Buildings | (Won) | 8,371 | (Won) | (3,746 | ) | (Won) | 4,625 | (Won) | 4,625 | ₩ | 39,777 | ₩ | (18,330 | ) | ₩ | 21,447 | ₩ | 21,447 | ||||||||||||||
Land | 7,807 | (2,501 | ) | 5,306 | 5,306 | 21,380 | (5,109 | ) | 16,271 | 16,271 | ||||||||||||||||||||||
|
|
|
|
|
|
|
| |||||||||||||||||||||||||
Total | (Won) | 16,178 | (Won) | (6,247 | ) | (Won) | 9,931 | (Won) | 9,931 | ₩ | 61,157 | ₩ | (23,439 | ) | ₩ | 37,718 | ₩ | 37,718 | ||||||||||||||
|
|
|
|
|
|
|
| |||||||||||||||||||||||||
| (1) | Acquisition cost of buildings held for sale is net of accumulated depreciation. |
The valuation technique and input variables that are used to measure the fair value of assets held for sale as of December 31, 2013, are as follows:
| 2013 | ||||||||||||
| Fair value | Valuation technique(1) | Unobservable input(2) | Range of unobservable inputs (%) | Relationship of inputs to fair value | ||||||||
| ₩ | 20,927 | Market comparison approach model | Adjustment index | -2.98~2.72 | Fair value increases as the adjustment index rises. | |||||||
| Adjustment ratio | -20~0 | Fair value decreases as the absolute value of adjustment index rises. | ||||||||||
Land and buildings | 16,791 | Market comparison approach model | Unit price per area | Unit price per area Time point Individual factor: | Fair value increases as the unit price per area of exclusive possess and others rise. | |||||||
Total | ₩ | 37,718 | ||||||||||
| (1) | The Group adjusted the appraisal value by the adjustment ratio in the event the public sale is unsuccessful. |
| (2) | Adjustment index is calculated using the real estate index or the producer price index, or land price volatility. |
The fair values of assets held for sale were measured by qualified independent appraisers with experience in valuing similar properties in the same area. In addition, per the fair value hierarchy on Note 6.1, the fair value hierarchy of all investment properties has been categorized and classified as Level 3.
The changes in accumulated impairment losses of assets held for sale for the years ended December 31, 20102012 and 2011,2013, are as follows:
| For the Year Ended December 31, 2010 | ||||||||||||||||||||||||||||||||||||
| 2012 | 2012 | |||||||||||||||||||||||||||||||||||
| Beginning | Beginning | Provision | Reversal | Others | Ending | Beginning | Provision | Reversal | Others | Ending | ||||||||||||||||||||||||||
| (In millions of Korean won) | (In millions of Korean won) | (In millions of Korean won) | ||||||||||||||||||||||||||||||||||
| (Won) | (6,535) | (Won) | (482 | ) | (Won) | 274 | (Won) | 3,090 | (Won) | (3,653 | ) | |||||||||||||||||||||||||
| ₩ | (6,247) | ₩ | (5,708 | ) | ₩ | — | ₩ | 6,196 | ₩ | (5,759 | ) | |||||||||||||||||||||||||
| For the Year Ended December 31, 2011 | ||||||||||||||||||||||||||||||||||||
| 2013 | 2013 | |||||||||||||||||||||||||||||||||||
| Beginning | Beginning | Provision | Reversal | Others | Ending | Beginning | Provision | Reversal | Others | Ending | ||||||||||||||||||||||||||
| (In millions of Korean won) | (In millions of Korean won) | (In millions of Korean won) | ||||||||||||||||||||||||||||||||||
| (Won) | (3,653) | (Won) | (3,931 | ) | (Won) | 312 | (Won) | 1,025 | (Won) | (6,247 | ) | |||||||||||||||||||||||||
| ₩ | (5,759) | ₩ | (22,365 | ) | ₩ | — | ₩ | 4,685 | ₩ | (23,439 | ) | |||||||||||||||||||||||||
As of December 31, 2011,2013, assets held for sale consist of teneleven real estates of closed offices and one real estate acquired through execution of security right, which the management of the Group was committed to a plan to sell, but not yet sold by December 31, 2011.2013. As of reporting date, twoDecember 31, 2013, three assets out of above assets held for sale are under negotiation for sale and the remaining nine assets are also being actively marketed.
18. Other Assets
The details of other assets as of December 31, 2012 and 2013, are as follows:
| 2012 | 2013 | |||||||
| (In millions of Korean won) | ||||||||
Other financial assets | ||||||||
Other receivables | ₩ | 3,234,195 | ₩ | 3,494,745 | ||||
Accrued income | 1,084,570 | 1,018,907 | ||||||
Guarantee deposits | 1,369,647 | 1,395,359 | ||||||
Domestic exchange settlement debits | 2,239,607 | 735,807 | ||||||
Others | 232,524 | 188,540 | ||||||
Allowances for loan losses | (590,110 | ) | (580,651 | ) | ||||
Present value discount | (837 | ) | (1,028 | ) | ||||
|
|
|
| |||||
Sub-total | 7,569,596 | 6,251,679 | ||||||
|
|
|
| |||||
Other non-financial assets | ||||||||
Other receivables | 32,396 | 663 | ||||||
Prepaid expenses | 266,727 | 397,321 | ||||||
Guarantee deposits | 4,189 | 3,941 | ||||||
Insurance assets | 155,676 | 157,154 | ||||||
Separate account assets | 655,040 | 696,909 | ||||||
Others | 84,683 | 76,798 | ||||||
Allowances on other asset | (7,988 | ) | (16,402 | ) | ||||
|
|
|
| |||||
Sub-total | 1,190,723 | 1,316,384 | ||||||
|
|
|
| |||||
Total | ₩ | 8,760,319 | ₩ | 7,568,063 | ||||
|
|
|
| |||||
The changes in allowances for loan losses on other assets for the years ended December 31, 2012 and 2013, are as follows:
| 2012 | ||||||||||||
| Other financial assets | Other non-financial assets | Total | ||||||||||
| (In millions of Korean won) | ||||||||||||
Beginning | ₩ | 353,422 | ₩ | 8,339 | ₩ | 361,761 | ||||||
Written-off | (30,604 | ) | (4,439 | ) | (35,043 | ) | ||||||
Provision | 46,125 | 4,088 | 50,213 | |||||||||
Others | 221,167 | — | 221,167 | |||||||||
|
|
|
|
|
| |||||||
Ending | ₩ | 590,110 | ₩ | 7,988 | ₩ | 598,098 | ||||||
|
|
|
|
|
| |||||||
| 2013 | ||||||||||||
| Other financial assets | Other non-financial assets | Total | ||||||||||
| (In millions of Korean won) | ||||||||||||
Beginning | ₩ | 590,110 | ₩ | 7,988 | ₩ | 598,098 | ||||||
Written-off | (37,382 | ) | (6,715 | ) | (44,097 | ) | ||||||
Provision | 29,229 | 15,129 | 44,358 | |||||||||
Others | (1,306 | ) | — | (1,306 | ) | |||||||
|
|
|
|
|
| |||||||
Ending | ₩ | 580,651 | ₩ | 16,402 | ₩ | 597,053 | ||||||
|
|
|
|
|
| |||||||
| 19. | Financial liabilities at fair value through profit or loss |
The details of financial liabilities at fair value through profit or loss as of January 1, 2010, and December 31, 20102012 and 2011,2013, are as follows:
| As of January 1, | As of December 31, | |||||||||||||||||||
| 2010 | 2010 | 2011 | 2012 | 2013 | ||||||||||||||||
| (In millions of Korean won) | (In millions of Korean won) | |||||||||||||||||||
Financial liabilities held for trading | ||||||||||||||||||||
Securities sold | (Won) | 1,347,668 | (Won) | 1,279,869 | (Won) | 522,112 | ₩ | 1,342,119 | ₩ | 196,570 | ||||||||||
Other | 16,555 | 14,990 | 28,761 | 39,878 | 40,067 | |||||||||||||||
|
|
|
|
| ||||||||||||||||
Sub-total | 1,364,223 | 1,294,859 | 550,873 | 1,381,997 | 236,637 | |||||||||||||||
|
|
|
|
| ||||||||||||||||
Financial liabilities designated at fair value through profit or loss | ||||||||||||||||||||
Derivative linked securities | — | — | 837,206 | 469,138 | 878,565 | |||||||||||||||
|
|
|
|
| ||||||||||||||||
Sub-total | — | — | 837,206 | 469,138 | 878,565 | |||||||||||||||
|
|
|
|
| ||||||||||||||||
Total financial liabilities at fair value through profit or loss | (Won) | 1,364,223 | (Won) | 1,294,859 | (Won) | 1,388,079 | ₩ | 1,851,135 | ₩ | 1,115,202 | ||||||||||
|
|
|
|
| ||||||||||||||||
The details of credit risk of financial liabilities designated at fair value through profit or loss as of December 31, 2011,2012 and 2013, are as follows:
| ||||
| ||||
| ||||
| ||||
Meanwhile, there were no financial liabilities designated at fair value through profit or loss as of January 1, 2010, or December 31, 2010.
| 2012 | 2013 | |||||||
| (In millions of Korean won) | ||||||||
Financial liabilities designated at fair value through profit or loss | ₩ | 469,138 | ₩ | 878,565 | ||||
Changes in fair value resulting from changes in the credit risk | 3,812 | (4,032 | ) | |||||
Accumulated changes in fair value resulting from changes in the credit risk | (5,630 | ) | (9,662 | ) | ||||
| 20. | Deposits |
Deposits as of January 1, 2010, and December 31, 20102012 and 2011,2013, are as follows:
| As of January 1, | As of December 31, | |||||||||||||||||||
| 2010 | 2010 | 2011 | 2012 | 2013 | ||||||||||||||||
| (In millions of Korean won) | (In millions of Korean won) | |||||||||||||||||||
Deposits | (Won) | 169,065,579 | (Won) | 179,862,500 | (Won) | 190,337,890 | ₩ | 197,346,208 | ₩ | 200,882,064 | ||||||||||
Deferred financing costs | (536) | (429) | (300) | (3 | ) | — | ||||||||||||||
|
|
|
|
| ||||||||||||||||
Total | (Won) | 169,065,043 | (Won) | 179,862,071 | (Won) | 190,337,590 | ₩ | 197,346,205 | ₩ | 200,882,064 | ||||||||||
|
|
|
|
| ||||||||||||||||
The details of deposits as of January 1, 2010, and December 31, 20102012 and 2011,2013, are as follows:
| As of January 1, | As of December 31, | 2012 | 2013 | |||||||||||||||||
| 2010 | 2010 | 2011 | ||||||||||||||||||
| (In millions of Korean won) | ||||||||||||||||||||
Demand deposits | ||||||||||||||||||||
Demand deposits in Korean won | ||||||||||||||||||||
Checking deposits | (Won) | 134,770 | (Won) | 113,852 | (Won) | 146,658 | ₩ | 116,417 | ₩ | 122,296 | ||||||||||
Household checking deposits | 403,602 | 460,228 | 434,134 | 434,814 | 467,229 | |||||||||||||||
Special deposits | 2,855,247 | 2,862,693 | 2,691,674 | 3,093,865 | 2,706,609 | |||||||||||||||
Ordinary deposits | 17,906,264 | 19,740,236 | 20,581,481 | 21,468,422 | 24,533,701 | |||||||||||||||
Public fund deposits | 158,275 | 125,094 | 85,895 | 68,600 | 75,127 | |||||||||||||||
Treasury deposits | 4,187 | 5,869 | 7,539 | 5,256 | 5,148 | |||||||||||||||
General savings deposits | 19,993,981 | 22,716,444 | 23,471,543 | 24,668,545 | 28,077,274 | |||||||||||||||
Corporate savings deposits | 8,646,379 | 10,197,986 | 10,209,575 | 10,504,790 | 10,715,746 | |||||||||||||||
Nonresident’s deposit in Korean won | 69,082 | 59,481 | 128,630 | 31,614 | 32,355 | |||||||||||||||
Nonresident’s free deposit in Korean won | 39,777 | 25,709 | 15,672 | 2,818 | 15,001 | |||||||||||||||
Others | 205,927 | 182,245 | 308,181 | 186,193 | 163,262 | |||||||||||||||
|
|
|
|
| ||||||||||||||||
Sub-total | 50,417,491 | 56,489,837 | 58,080,982 | 60,581,334 | 66,913,748 | |||||||||||||||
|
|
|
|
| ||||||||||||||||
Demand deposits in foreign currencies | ||||||||||||||||||||
Checking deposits | 79,445 | 83,650 | 71,838 | 98,478 | 251,072 | |||||||||||||||
Ordinary deposits | 1,360,546 | 1,379,023 | 1,661,358 | 1,809,712 | 2,461,685 | |||||||||||||||
Special deposits | 16,466 | 1,073 | 1,145 | 1,316 | 5,325 | |||||||||||||||
Others | 21,056 | 11,226 | 9,436 | 9,851 | 14,142 | |||||||||||||||
|
|
|
|
| ||||||||||||||||
Sub-total | 1,477,513 | 1,474,972 | 1,743,777 | 1,919,357 | 2,732,224 | |||||||||||||||
|
|
|
|
| ||||||||||||||||
Total demand deposits | 51,895,004 | 57,964,809 | 59,824,759 | 62,500,691 | 69,645,972 | |||||||||||||||
|
|
|
|
| ||||||||||||||||
Time deposits | ||||||||||||||||||||
Time deposits in Korean won | ||||||||||||||||||||
Time deposits | 78,690,444 | 105,029,253 | 114,868,739 | 114,496,449 | 108,216,861 | |||||||||||||||
Installment savings deposits | 5,411,923 | 5,625,204 | 5,454,573 | 7,088,988 | 11,097,205 | |||||||||||||||
Good-sum formation savings | 396 | 367 | 338 | 33,586 | 425,090 | |||||||||||||||
Nonresident’s deposit in Korean won | 222,586 | 186,966 | ||||||||||||||||||
Workers’ savings for housing | 2 | 2 | 2 | 1,692 | 1,543 | |||||||||||||||
Nonresident’s deposit in Korean won | 263,915 | 214,383 | 193,765 | |||||||||||||||||
Long-term savings deposits for workers | 2,304 | 2,035 | 1,862 | |||||||||||||||||
Nonresident’s free deposit in Korean won | 101,002 | 119,578 | 85,875 | 92,011 | 41,085 | |||||||||||||||
Long-term housing savings deposits | 3,789,456 | 3,758,140 | 3,309,833 | 3,083,602 | 2,061,129 | |||||||||||||||
Long-term savings for households | 523 | 371 | 247 | 206 | 190 | |||||||||||||||
Preferential savings deposits for workers | 2,535 | 998 | 489 | 323 | 245 | |||||||||||||||
Mutual installment deposits | 1,789,963 | 1,941,767 | 1,273,806 | 1,143,414 | 1,478,299 | |||||||||||||||
Mutual installment for housing | 1,900,618 | 1,485,336 | 1,173,404 | 1,005,752 | 853,392 | |||||||||||||||
Others | 238 | 226 | 196 | |||||||||||||||||
|
|
| ||||||||||||||||||
Sub-total | 91,953,319 | 118,177,660 | 126,363,129 | |||||||||||||||||
|
|
| ||||||||||||||||||
Losses (gains) on valuation of fair value hedged items (prior year portion) | (11,689 | ) | — | — | ||||||||||||||||
Trust deposits | 2,944,666 | 3,093,949 | ||||||||||||||||||
|
|
|
|
| ||||||||||||||||
Sub-total | 91,941,630 | 118,177,660 | 126,363,129 | 130,113,275 | 127,455,954 | |||||||||||||||
|
|
|
|
| ||||||||||||||||
Time deposits in foreign currencies | ||||||||||||||||||||
Time deposits | 2,142,133 | 1,372,689 | 2,604,603 | 2,954,348 | 2,082,865 | |||||||||||||||
Installment savings deposits | 480 | 391 | 1,201 | 2,131 | 4,035 | |||||||||||||||
Others | 5,076 | 23 | 23 | 23,693 | 68,960 | |||||||||||||||
|
|
|
|
| ||||||||||||||||
Sub-total | 2,147,689 | 1,373,103 | 2,605,827 | 2,980,172 | 2,155,860 | |||||||||||||||
|
|
|
|
| ||||||||||||||||
Total time deposits | 94,089,319 | 119,550,763 | 128,968,956 | 133,093,447 | 129,611,814 | |||||||||||||||
|
|
|
|
| ||||||||||||||||
Certificates of deposits | 23,081,256 | 2,346,928 | 1,544,175 | 1,752,067 | 1,624,278 | |||||||||||||||
|
|
|
|
| ||||||||||||||||
Total deposits | (Won) | 169,065,579 | (Won) | 179,862,500 | (Won) | 190,337,890 | ₩ | 197,346,205 | ₩ | 200,882,064 | ||||||||||
|
|
|
|
| ||||||||||||||||
21. Debts
The details of debts as of January 1, 2010, and December 31, 20102012 and 2011,2013, consist of:
| As of January 1, | As of December 31, | |||||||||||||||||||
| 2010 | 2010 | 2011 | 2012 | 2013 | ||||||||||||||||
| (In millions of Korean won) | (In millions of Korean won) | |||||||||||||||||||
Borrowings | (Won) | 9,800,638 | (Won) | 10,086,081 | (Won) | 14,091,973 | ₩ | 12,274,501 | ₩ | 10,767,737 | ||||||||||
Bonds sold under repurchase agreements and others | 2,670,401 | 1,053,543 | 1,590,400 | 1,094,031 | 685,626 | |||||||||||||||
Call money | 1,364,010 | 604,941 | 1,141,465 | 2,596,926 | 2,647,968 | |||||||||||||||
Deferred financing costs | (945 | ) | (176 | ) | — | |||||||||||||||
|
|
|
|
| ||||||||||||||||
Total | (Won) | 13,834,104 | (Won) | 11,744,389 | (Won) | 16,823,838 | ₩ | 15,965,458 | ₩ | 14,101,331 | ||||||||||
|
|
|
|
| ||||||||||||||||
The details of borrowings as of January 1, 2010, and December 31, 20102012 and 2011,2013, are as follows:
Lender | Annual interest rate (%) | 2012 | 2013 | |||||||||||||||||||||||||||||
| (In millions of Korean won) | ||||||||||||||||||||||||||||||||
Borrowings in Korean won | Borrowings from the Bank of Korea | Bank of Korea | 0.50~1.00 | ₩ | 781,787 | ₩ | 557,998 | |||||||||||||||||||||||||
| Borrowings from the government | KEMCO and others | 0.00~5.00 | 626,059 | 626,593 | ||||||||||||||||||||||||||||
Lender | Annual interest rate (%) | As of January 1, | As of December 31, | Borrowings from banking institutions | Industrial Bank of Korea and others | 2.12~3.50 | 103,398 | 61,877 | ||||||||||||||||||||||||
| 2010 | 2010 | 2011 | Borrowings from non-banking financial institutions | The Korea Development Bank and others | 1.17~2.70 | 268,491 | 142,511 | |||||||||||||||||||||||||
| (In millions of Korean won) | Other borrowings | The Korea Finance Corporation and others | 0.00~5.30 | 3,716,879 | 3,527,292 | |||||||||||||||||||||||||||
Borrowings in Korean won | Borrowings from the Bank of Korea | Bank of Korea | 1.50 | (Won) | 1,343,725 | (Won) | 930,653 | (Won) | 650,616 | |||||||||||||||||||||||
Borrowings from the government | KEMCO and others | 0.00~5.00 | 674,272 | 676,223 | 690,750 | |||||||||||||||||||||||||||
Borrowings from national housing fund | National Housing Fund | 3.00 | 2,430 | — | — | |||||||||||||||||||||||||||
Borrowings from banking institutions | Industrial Bank of Korea and others | 2.64~3.00 | 86,327 | 67,520 | 405,033 | |||||||||||||||||||||||||||
Borrowings from non-banking financial institutions | The Korea Development Bank | 1.69~2.80 | 47,406 | 56,252 | 91,254 | |||||||||||||||||||||||||||
Other borrowings | Small & Medium Business Corporation and others | 0.50~6.09 | 1,945,338 | 2,189,046 | 3,538,983 | |||||||||||||||||||||||||||
|
|
|
|
| ||||||||||||||||||||||||||||
Sub Total | 4,099,498 | 3,919,694 | 5,376,636 | Sub-total | 5,496,614 | 4,916,271 | ||||||||||||||||||||||||||
|
|
|
|
| ||||||||||||||||||||||||||||
Borrowings in foreign currencies | Due to banks | JP Morgan Chase Bank N.A. and others | — | 234,006 | 347,206 | 28,194 | ||||||||||||||||||||||||||
Borrowings from banking institutions | Sumitomo Mitsui Banking Corp. and others | 0.50~5.73 | 2,701,557 | 2,821,223 | 4,694,199 | �� | ||||||||||||||||||||||||||
Off-shore borrowings in foreign currencies | Centralbank Uzbekistan and others | 0.62~3.43 | 1,313,154 | 1,447,651 | 1,019,279 | |||||||||||||||||||||||||||
Other borrowings | JP Morgan Chase Bank N.A. and others | — | 1,452,423 | 1,550,307 | 2,973,665 | Due to banks | Deutsche Bank Trust Company America and others | 0.00~0.55 | 52,186 | 158,180 | ||||||||||||||||||||||
|
|
| Borrowings from banking institutions | Sumitomo Mitsui Banking Corp. and others | 0.27~4.45 | 4,312,614 | 3,831,929 | |||||||||||||||||||||||||
Sub Total | 5,701,140 | 6,166,387 | 8,715,337 | Other borrowings | The Korea Finance Corporation | 1.01~1.38 | 5,195 | 3,166 | ||||||||||||||||||||||||
|
|
| Other borrowings | JP Morgan Chase Bank N.A. and others | — | 2,407,892 | 1,858,191 | |||||||||||||||||||||||||
Total | (Won) | 9,800,638 | (Won) | 10,086,081 | (Won) | 14,091,973 |
|
| ||||||||||||||||||||||||
|
|
| Sub-total | 6,777,887 | 5,851,466 | |||||||||||||||||||||||||||
|
| |||||||||||||||||||||||||||||||
Total | ₩ | 12,274,501 | ₩ | 10,767,737 | ||||||||||||||||||||||||||||
|
| |||||||||||||||||||||||||||||||
The details of bonds sold under repurchase agreements and others as of January 1, 2010, and December 31, 20102012 and 2011,2013, are as follows:
Annual interest rate | As of January 1, | As of December 31, | ||||||||||||||||||||||||||||||
Lender | (%) | 2010 | 2010 | 2011 | Lenders | Annual interest rate (%) | 2012 | 2013 | ||||||||||||||||||||||||
| (In millions of Korean won) | (In millions of Korean won) | |||||||||||||||||||||||||||||||
Bonds sold under repurchase agreements | Individuals, Groups, Corporations | 2.40 ~ 4.64 | (Won) | 2,605,563 | (Won) | 977,957 | (Won) | 1,511,875 | Individuals, Groups, Corporations | 0.74~3.69 | ₩ | 1,003,348 | ₩ | 608,156 | ||||||||||||||||||
Bills sold | Counter sale | 1.97 ~ 3.78 | 64,838 | 75,586 | 78,525 | Counter sale | 1.60~2.70 | 90,683 | 77,470 | |||||||||||||||||||||||
|
|
|
|
| ||||||||||||||||||||||||||||
Total | Total | (Won) | 2,670,401 | (Won) | 1,053,543 | (Won) | 1,590,400 | Total | ₩ | 1,094,031 | ₩ | 685,626 | ||||||||||||||||||||
|
|
|
|
| ||||||||||||||||||||||||||||
The details of call money as of January 1, 2010, and December 31, 20102012 and 2011,2013, are as follows:
Annual interest rate | As of January 1, | As of December 31, | ||||||||||||||||||||||||||||||
Lenders | (%) | 2010 | 2010 | 2011 | Lenders | Annual interest rate (%) | 2012 | 2013 | ||||||||||||||||||||||||
| (In millions of Korean won) | (In millions of Korean won) | |||||||||||||||||||||||||||||||
Call money in Korean won | Woori Asset Management Co., Ltd. and others | 2.76 ~ 3.35 | (Won) | 217,100 | (Won) | 130,500 | (Won) | 314,200 | The Korea Development Bank and others | 2.32~2.62 | ₩ | 2,018,100 | ₩ | 1,649,400 | ||||||||||||||||||
Call money in foreign currencies | Centralbank Uzbekistan and others | 0.15 ~ 4.48 | 1,146,910 | 474,441 | 827,265 | Central bank Uzbekistan and others | 0.17~5.23 | 578,826 | 998,568 | |||||||||||||||||||||||
|
|
|
|
| ||||||||||||||||||||||||||||
Total | Total | (Won) | 1,364,010 | (Won) | 604,941 | (Won) | 1,141,465 | Total | ₩ | 2,596,926 | ₩ | 2,647,968 | ||||||||||||||||||||
|
|
|
|
| ||||||||||||||||||||||||||||
Call money and borrowings from financial institutions as of January 1, 2010, and December 31, 20102012 and 2011,2013, are as follows:
| As of January 1, 2010 | 2012 | |||||||||||||||||||||||||||||||
| Bank of Korea | Other Banks | Others | Total | Bank of Korea | Other Banks | Others | Total | |||||||||||||||||||||||||
| (In millions of Korean won) | (In millions of Korean won) | |||||||||||||||||||||||||||||||
Call money | (Won) | — | (Won) | 1,203,910 | (Won) | 160,100 | (Won) | 1,364,010 | ₩ | — | ₩ | 1,431,826 | ₩ | 1,165,100 | ₩ | 2,596,926 | ||||||||||||||||
Borrowings | 1,343,725 | 5,716,713 | 282,112 | 7,342,550 | 781,787 | 6,546,839 | 1,438,969 | 8,767,595 | ||||||||||||||||||||||||
|
|
|
|
|
|
|
| |||||||||||||||||||||||||
Total | (Won) | 1,343,725 | (Won) | 6,920,623 | (Won) | 442,212 | (Won) | 8,706,560 | ₩ | 781,787 | ₩ | 7,978,665 | ₩ | 2,604,069 | ₩ | 11,364,521 | ||||||||||||||||
|
|
|
|
|
|
|
| |||||||||||||||||||||||||
| As of December 31, 2010 | ||||||||||||||||
| Bank of Korea | Other Banks | Others | Total | |||||||||||||
| (In millions of Korean won) | ||||||||||||||||
Call money | (Won) | — | (Won) | 442,528 | (Won) | 162,413 | (Won) | 604,941 | ||||||||
Borrowings | 930,653 | 6,180,605 | 239,105 | 7,350,363 | ||||||||||||
|
|
|
|
|
|
|
| |||||||||
Total | (Won) | 930,653 | (Won) | 6,623,133 | (Won) | 401,518 | (Won) | 7,955,304 | ||||||||
|
|
|
|
|
|
|
| |||||||||
| As of December 31, 2011 | 2013 | |||||||||||||||||||||||||||||||
| Bank of Korea | Other Banks | Others | Total | Bank of Korea | Other Banks | Others | Total | |||||||||||||||||||||||||
| (In millions of Korean won) | (In millions of Korean won) | |||||||||||||||||||||||||||||||
Call money | (Won) | — | (Won) | 932,410 | (Won) | 209,055 | (Won) | 1,141,465 | ₩ | 1,001 | ₩ | 1,970,567 | ₩ | 676,400 | ₩ | 2,647,968 | ||||||||||||||||
Borrowings | 650,616 | 9,064,282 | 1,216,359 | 10,931,257 | 557,998 | 5,901,018 | 630,733 | 7,089,749 | ||||||||||||||||||||||||
|
|
|
|
|
|
|
| |||||||||||||||||||||||||
Total | (Won) | 650,616 | (Won) | 9,996,692 | (Won) | 1,425,414 | (Won) | 12,072,722 | ₩ | 558,999 | ₩ | 7,871,585 | ₩ | 1,307,133 | ₩ | 9,737,717 | ||||||||||||||||
|
|
|
|
|
|
|
| |||||||||||||||||||||||||
22. Debentures
The details of debentures as of January 1, 2010, and December 31, 20102012 and 2011,2013, are as follows:
Annual interest rate | As of January 1, | As of December 31, | ||||||||||||||||||||||
| (%) | 2010 | 2010 | 2011 | Annual interest rate (%) | 2012 | 2013 | ||||||||||||||||||
| (In millions of Korean won) | (In millions of Korean won) | |||||||||||||||||||||||
Debentures in Korean won | ||||||||||||||||||||||||
Hybrid capital instrument | 8.50 | (Won) | 100,000 | (Won) | 100,000 | (Won) | 100,000 | — | ₩ | 100,000 | ₩ | — | ||||||||||||
Structured debentures | 2.00~8.62 | 3,903,238 | 3,684,341 | 3,424,238 | 0.40~8.62 | 1,699,238 | 1,499,238 | |||||||||||||||||
Subordinated fixed rate debentures in Korean won | 4.27~7.70 | 7,972,273 | 7,323,268 | 7,995,571 | 3.08~7.70 | 7,921,510 | 8,648,474 | |||||||||||||||||
Fixed rate debentures in Korean won | 3.20~7.95 | 21,807,646 | 13,273,928 | 10,791,612 | 2.62~5.04 | 10,145,218 | 12,057,142 | |||||||||||||||||
Floating rate debentures in Korean won | 3.57~5.16 | 283,258 | 833,258 | 803,258 | 2.82~10.39 | 1,169,158 | 1,505,858 | |||||||||||||||||
|
|
|
|
| ||||||||||||||||||||
Sub Total | 34,066,415 | 25,214,795 | 23,114,679 | |||||||||||||||||||||
Sub-total | 21,035,124 | 23,710,712 | ||||||||||||||||||||||
|
|
|
|
| ||||||||||||||||||||
Fair value adjustments on fair value hedged financial debentures in Korean won | ||||||||||||||||||||||||
Fair value adjustments on valuation of fair value hedged items (current period portion) | — | 57,045 | 15,964 | 36,417 | (31,577 | ) | ||||||||||||||||||
Fair value adjustments on valuation of fair value hedged items (prior year portion) | (82,310 | ) | (35,515 | ) | 42,494 | 52,572 | 81,369 | |||||||||||||||||
|
|
|
|
| ||||||||||||||||||||
Sub Total | (82,310 | ) | 21,530 | 58,458 | ||||||||||||||||||||
Sub-total | 88,989 | 49,792 | ||||||||||||||||||||||
|
|
|
|
| ||||||||||||||||||||
Discount or premium on debentures in Korean won | ||||||||||||||||||||||||
Discount on debentures | (29,816 | ) | (17,273 | ) | (52,290 | ) | (15,647 | ) | (16,615 | ) | ||||||||||||||
|
|
|
|
| ||||||||||||||||||||
Sub Total | 33,954,289 | 25,219,052 | 23,120,847 | |||||||||||||||||||||
Sub-total | 21,108,466 | 23,743,889 | ||||||||||||||||||||||
|
|
|
|
| ||||||||||||||||||||
Debentures in foreign currencies | ||||||||||||||||||||||||
Floating rate debentures | 0.64~2.57 | 3,003,197 | 1,686,459 | 1,309,606 | ||||||||||||||||||||
Fixed rate debentures | 1.50~7.25 | 1,840,344 | 2,337,759 | 2,705,167 | ||||||||||||||||||||
|
|
| ||||||||||||||||||||||
Sub Total | 4,843,541 | 4,024,218 | 4,014,773 | |||||||||||||||||||||
|
|
| ||||||||||||||||||||||
Fair value adjustments on fair value hedged debentures in foreign currencies | ||||||||||||||||||||||||
Fair value adjustments on valuation of fair value hedged items (current period portion) | — | (27,816 | ) | 47,986 | ||||||||||||||||||||
Fair value adjustments on valuation of fair value hedged items (prior year portion) | (106,270 | ) | (83,832 | ) | (90,778 | ) | ||||||||||||||||||
|
|
| ||||||||||||||||||||||
Sub Total | (106,270 | ) | (111,648 | ) | (42,792 | ) | ||||||||||||||||||
|
|
| ||||||||||||||||||||||
Discount or premium on debentures in foreign currencies | ||||||||||||||||||||||||
Discount on debentures | (29,598 | ) | (24,306 | ) | (22,949 | ) | ||||||||||||||||||
|
|
| ||||||||||||||||||||||
Sub Total | 4,707,673 | 3,888,264 | 3,949,032 | |||||||||||||||||||||
|
|
| ||||||||||||||||||||||
Total | (Won) | 38,661,962 | (Won) | 29,107,316 | (Won) | 27,069,879 | ||||||||||||||||||
|
|
| ||||||||||||||||||||||
Debentures in foreign currencies | ||||||||||
Floating rate debentures | 1.11 ~ 1.64 | 759,783 | 1,143,360 | |||||||
Fixed rate debentures | 0.40 ~ 7.25 | 2,553,814 | 2,335,059 | |||||||
|
| �� |
|
| ||||||
Sub-total | 3,313,597 | 3,478,419 | ||||||||
|
|
|
| |||||||
Fair value adjustments on fair value hedged debentures in foreign currencies | ||||||||||
Fair value adjustments on valuation of fair value hedged items (current period portion) | (68,212 | ) | (42,195 | ) | ||||||
Fair value adjustments on valuation of fair value hedged items (prior year portion) | (69,060 | ) | (130,011 | ) | ||||||
|
|
|
| |||||||
Sub-total | (137,272 | ) | (172,206 | ) | ||||||
|
|
|
| |||||||
Discount or premium on debentures in foreign currencies | ||||||||||
Discount on debentures | (14,579 | ) | (10,568 | ) | ||||||
|
|
|
| |||||||
Sub-total | 3,161,746 | 3,295,645 | ||||||||
|
|
|
| |||||||
Total | ₩ | 24,270,212 | ₩ | 27,039,534 | ||||||
|
|
|
|
The changes in debentures based on face value for the years ended December 31, 20102012 and 2011,2013, are as follows:
| For the Year Ended December 31, 2010 | ||||||||||||||||||||
| Beginning | Issues | Repayments | Others | Ending | ||||||||||||||||
| (In millions of Korean won) | ||||||||||||||||||||
Debentures in Korean won | ||||||||||||||||||||
Hybrid capital instrument | (Won) | 100,000 | (Won) | — | (Won) | — | (Won) | — | (Won) | 100,000 | ||||||||||
Structured debentures | 3,903,238 | 1,030,103 | (1,249,000 | ) | — | 3,684,341 | ||||||||||||||
Subordinated fixed rate debentures in Korean won | 7,972,273 | 500,000 | (1,149,005 | ) | — | 7,323,268 | ||||||||||||||
Fixed rate debentures in Korean won | 21,807,646 | 5,238,300 | (13,772,018 | ) | — | 13,273,928 | ||||||||||||||
Floating rate debentures in Korean won | 283,258 | 830,000 | (280,000 | ) | — | 833,258 | ||||||||||||||
|
|
|
|
|
|
|
|
|
| |||||||||||
Sub Total | 34,066,415 | 7,598,403 | (16,450,023 | ) | — | 25,214,795 | ||||||||||||||
|
|
|
|
|
|
|
|
|
| |||||||||||
Debentures in foreign currencies | ||||||||||||||||||||
Floating rate debentures | 3,003,197 | 83,475 | (1,350,042 | ) | (50,171 | ) | 1,686,459 | |||||||||||||
Fixed rates debentures | 1,840,344 | 658,243 | (181,933 | ) | 21,105 | 2,337,759 | ||||||||||||||
|
|
|
|
|
|
|
|
|
| |||||||||||
Sub Total | 4,843,541 | 741,718 | (1,531,975 | ) | (29,066 | ) | 4,024,218 | |||||||||||||
|
|
|
|
|
|
|
|
|
| |||||||||||
Total | (Won) | 38,909,956 | (Won) | 8,340,121 | (Won) | (17,981,998 | ) | (Won) | (29,066 | ) | (Won) | 29,239,013 | ||||||||
|
|
|
|
|
|
|
|
|
| |||||||||||
| For the Year Ended December 31, 2011 | 2012 | |||||||||||||||||||||||||||||||||||||||
| Beginning | Issues | Repayments | Others | Ending | Beginning | Issues | Repayments | Others | Ending | |||||||||||||||||||||||||||||||
| (In millions of Korean won) | (In millions of Korean won) | |||||||||||||||||||||||||||||||||||||||
Debentures in Korean won | ||||||||||||||||||||||||||||||||||||||||
Hybrid capital instrument | (Won) | 100,000 | (Won) | — | (Won) | — | (Won) | — | (Won) | 100,000 | ₩ | 100,000 | ₩ | — | ₩ | — | ₩ | — | ₩ | 100,000 | ||||||||||||||||||||
Structured debentures | 3,684,341 | 500,000 | (760,103 | ) | — | 3,424,238 | 3,424,238 | 310,000 | (2,035,000 | ) | — | 1,699,238 | ||||||||||||||||||||||||||||
Subordinated fixed rate debentures in Korean won | 7,323,268 | 800,000 | (127,697 | ) | — | 7,995,571 | 7,995,571 | 1,824,730 | (1,898,791 | ) | — | 7,921,510 | ||||||||||||||||||||||||||||
Fixed rate debentures in Korean won | 13,273,928 | 6,940,000 | (9,422,316 | ) | — | 10,791,612 | 10,791,612 | 6,188,093 | (6,834,487 | ) | — | 10,145,218 | ||||||||||||||||||||||||||||
Floating rate debentures in Korean won | 833,258 | 690,000 | (720,000 | ) | — | 803,258 | 904,258 | 865,900 | (601,000 | ) | — | 1,169,158 | ||||||||||||||||||||||||||||
|
|
|
|
|
|
|
|
|
| |||||||||||||||||||||||||||||||
Sub Total | 25,214,795 | 8,930,000 | (11,030,116 | ) | — | 23,114,679 | ||||||||||||||||||||||||||||||||||
Sub-total | 23,215,679 | 9,188,723 | (11,369,278 | ) | — | 21,035,124 | ||||||||||||||||||||||||||||||||||
|
|
|
|
|
|
|
|
|
| |||||||||||||||||||||||||||||||
Debentures in foreign currencies | ||||||||||||||||||||||||||||||||||||||||
Floating rate debentures | 1,686,459 | 322,800 | (789,143 | ) | 89,490 | 1,309,606 | 1,309,606 | 198,478 | (682,622 | ) | (65,679 | ) | 759,783 | |||||||||||||||||||||||||||
Fixed rate debentures | 2,337,759 | 412,374 | (33,217 | ) | (11,749 | ) | 2,705,167 | 2,705,167 | 1,034,162 | (1,042,992 | ) | (142,523 | ) | 2,553,814 | ||||||||||||||||||||||||||
|
|
|
|
|
|
|
|
|
| |||||||||||||||||||||||||||||||
Sub Total | 4,024,218 | 735,174 | (822,360 | ) | 77,741 | 4,014,773 | ||||||||||||||||||||||||||||||||||
Sub-total | 4,014,773 | 1,232,640 | (1,725,614 | ) | (208,202 | ) | 3,313,597 | |||||||||||||||||||||||||||||||||
|
|
|
|
|
|
|
|
|
| |||||||||||||||||||||||||||||||
Total | (Won) | 29,239,013 | (Won) | 9,665,174 | (Won) | (11,852,476 | ) | (Won) | 77,741 | (Won) | 27,129,452 | ₩ | 27,230,452 | ₩ | 10,421,363 | ₩ | (13,094,892 | ) | ₩ | (208,202 | ) | ₩ | 24,348,721 | |||||||||||||||||
|
|
|
|
|
|
|
|
|
| |||||||||||||||||||||||||||||||
| 2013 | ||||||||||||||||||||||||||||||||||||||||
| Beginning | Issues | Repayments | Others | Ending | ||||||||||||||||||||||||||||||||||||
| (In millions of Korean won) | ||||||||||||||||||||||||||||||||||||||||
Debentures in Korean won | ||||||||||||||||||||||||||||||||||||||||
Hybrid capital instrument | ₩ | 100,000 | ₩ | — | ₩ | (100,000 | ) | ₩ | — | ₩ | — | |||||||||||||||||||||||||||||
Structured debentures | 1,699,238 | 100,000 | (300,000 | ) | — | 1,499,238 | ||||||||||||||||||||||||||||||||||
Subordinated fixed rate debentures in Korean won | 7,921,510 | 1,000,000 | (248,286 | ) | (24,750 | ) | 8,648,474 | |||||||||||||||||||||||||||||||||
Fixed rate debentures in Korean won | 10,145,218 | 7,716,400 | (5,791,683 | ) | (12,793 | ) | 12,057,142 | |||||||||||||||||||||||||||||||||
Floating rate debentures in Korean won | 1,169,158 | 760,600 | (423,900 | ) | — | 1,505,858 | ||||||||||||||||||||||||||||||||||
|
|
|
|
| ||||||||||||||||||||||||||||||||||||
Sub-total | 21,035,124 | 9,577,000 | (6,863,869 | ) | (37,543 | ) | 23,710,712 | |||||||||||||||||||||||||||||||||
|
|
|
|
| ||||||||||||||||||||||||||||||||||||
Debentures in foreign currencies | ||||||||||||||||||||||||||||||||||||||||
Floating rate debentures | 759,783 | 537,850 | (176,050 | ) | 21,777 | 1,143,360 | ||||||||||||||||||||||||||||||||||
Fixed rate debentures | 2,553,814 | 657,465 | (772,364 | ) | (103,856 | ) | 2,335,059 | |||||||||||||||||||||||||||||||||
|
|
|
|
| ||||||||||||||||||||||||||||||||||||
Sub-total | 3,313,597 | 1,195,315 | (948,414 | ) | (82,079 | ) | 3,478,419 | |||||||||||||||||||||||||||||||||
|
|
|
|
| ||||||||||||||||||||||||||||||||||||
Total | ₩ | 24,348,721 | ₩ | 10,772,315 | ₩ | (7,812,283 | ) | ₩ | (119,622 | ) | ₩ | 27,189,131 | ||||||||||||||||||||||||||||
|
|
|
|
| ||||||||||||||||||||||||||||||||||||
23. Provisions
The details of provisions as of January 1, 2010, and December 31, 20102012 and 2011,2013, are as follows:
| As of January 1, | As of December 31, | |||||||||||||||||||
| 2010 | 2010 | 2011 | 2012 | 2013 | ||||||||||||||||
| (In millions of Korean won) | (In millions of Korean won) | |||||||||||||||||||
Provisions for unused loan commitments | (Won) | 289,037 | (Won) | 284,667 | (Won) | 259,427 | ₩ | 236,026 | ₩ | 226,110 | ||||||||||
Provisions for acceptances and guarantees | 92,508 | 414,254 | 311,502 | 208,753 | 209,118 | |||||||||||||||
Provisions for financial guarantee contracts | 32,578 | 18,866 | 7,959 | 7,383 | 2,699 | |||||||||||||||
Provisions for asset retirement obligation | 43,070 | 49,461 | 60,059 | 65,226 | 76,608 | |||||||||||||||
Other | 118,961 | 252,822 | 158,792 | 152,341 | 163,538 | |||||||||||||||
|
|
|
|
| ||||||||||||||||
Total | (Won) | 576,154 | (Won) | 1,020,070 | (Won) | 797,739 | ₩ | 669,729 | ₩ | 678,073 | ||||||||||
|
|
|
|
| ||||||||||||||||
Provisions for unused loan commitments as of January 1, 2010, and December 31, 20102012 and 2011,2013, are as follows:
| As of January 1, 2010 | 2012 | |||||||||||||||||||||||
| Commitments outstanding | Provision | Ratio (%) | Commitments outstanding | Provision | Ratio (%) | |||||||||||||||||||
| (In millions of Korean won) | (In millions of Korean won) | |||||||||||||||||||||||
Corporate loan commitments | (Won) | 27,029,379 | (Won) | 114,296 | 0.42 | ₩ | 40,770,994 | ₩ | 106,025 | 0.26 | ||||||||||||||
Retail loan commitments | 13,268,454 | 37,175 | 0.28 | 14,348,821 | 41,273 | 0.29 | ||||||||||||||||||
Credit line on credit cards | 43,610,192 | 137,566 | 0.32 | 36,214,899 | 88,728 | 0.25 | ||||||||||||||||||
|
|
|
|
|
| |||||||||||||||||||
Total | (Won) | 83,908,025 | (Won) | 289,037 | 0.34 | ₩ | 91,334,714 | ₩ | 236,026 | 0.26 | ||||||||||||||
|
|
|
|
|
| |||||||||||||||||||
| As of December 31, 2010 | ||||||||||||
| Commitments outstanding | Provision | Ratio (%) | ||||||||||
| (In millions of Korean won) | ||||||||||||
Corporate loan commitments | (Won) | 27,644,011 | (Won) | 110,119 | 0.40 | |||||||
Retail loan commitments | 14,149,393 | 41,399 | 0.29 | |||||||||
Credit line on credit cards | 44,776,141 | 133,149 | 0.30 | |||||||||
|
|
|
|
|
| |||||||
Total | (Won) | 86,569,545 | (Won) | 284,667 | 0.33 | |||||||
|
|
|
|
|
| |||||||
| As of December 31, 2011 | ||||||||||||
| Commitments outstanding | Provision | Ratio (%) | ||||||||||
| (In millions of Korean won) | ||||||||||||
Corporate loan commitments | (Won) | 36,365,468 | (Won) | 102,301 | 0.28 | |||||||
Retail loan commitments | 14,632,998 | 44,499 | 0.30 | |||||||||
Credit line on credit cards | 39,070,550 | 112,627 | 0.29 | |||||||||
|
|
|
|
|
| |||||||
Total | (Won) | 90,069,016 | (Won) | 259,427 | 0.29 | |||||||
|
|
|
|
|
| |||||||
Corporate loan commitments Retail loan commitments Credit line on credit cards Total 2013 Commitments
outstanding Provision Ratio
(%) (In millions of Korean won) ₩ 42,446,365 ₩ 101,455 0.24 13,976,426 38,385 0.27 37,112,333 86,270 0.23 ₩ 93,535,124 ₩ 226,110 0.24
Provisions for acceptances and guarantees as of January 1, 2010, and December 31, 20102012 and 2011,2013, are as follows:
| As of January 1, 2010 | 2012 | |||||||||||||||||||||||
| Acceptances and guarantees | Provision | Ratio (%) | Acceptances and guarantees | Provision | Ratio (%) | |||||||||||||||||||
| (In millions of Korean won) | (In millions of Korean won) | |||||||||||||||||||||||
Confirmed acceptances and guarantees in Korean won | (Won) | 1,636,561 | (Won) | 19,892 | 1.22 | ₩ | 1,564,128 | ₩ | 33,554 | 2.15 | ||||||||||||||
Confirmed acceptances and guarantees in foreign currencies | 5,221,895 | 38,943 | 0.75 | 3,609,636 | 75,859 | 2.10 | ||||||||||||||||||
Unconfirmed acceptances and guarantees | 7,860,104 | 33,673 | 0.43 | 4,244,517 | 99,340 | 2.34 | ||||||||||||||||||
|
|
|
|
|
| |||||||||||||||||||
Total | (Won) | 14,718,560 | (Won) | 92,508 | 0.63 | ₩ | 9,418,281 | ₩ | 208,753 | 2.22 | ||||||||||||||
|
|
|
|
|
| |||||||||||||||||||
| As of December 31, 2010 | 2013 | |||||||||||||||||||||||
| Acceptances and guarantees | Provision | Ratio (%) | Acceptances and guarantees | Provision | Ratio (%) | |||||||||||||||||||
| (In millions of Korean won) | (In millions of Korean won) | |||||||||||||||||||||||
Confirmed acceptances and guarantees in Korean won | (Won) | 1,709,266 | (Won) | 48,069 | 2.81 | ₩ | 1,231,569 | ₩ | 42,604 | 3.46 | ||||||||||||||
Confirmed acceptances and guarantees in foreign currencies | 4,314,929 | 150,934 | 3.50 | 4,532,036 | 96,077 | 2.12 | ||||||||||||||||||
Unconfirmed acceptances and guarantees | 6,452,397 | 215,251 | 3.34 | 4,041,087 | 70,437 | 1.74 | ||||||||||||||||||
|
|
|
|
|
| |||||||||||||||||||
Total | (Won) | 12,476,592 | (Won) | 414,254 | 3.32 | ₩ | 9,804,692 | ₩ | 209,118 | 2.13 | ||||||||||||||
|
|
|
|
|
| |||||||||||||||||||
| As of December 31, 2011 | ||||||||||||
| Acceptances and guarantees | Provision | Ratio (%) | ||||||||||
| (In millions of Korean won) | ||||||||||||
Confirmed acceptances and guarantees in Korean won | (Won) | 1,605,167 | (Won) | 39,318 | 2.45 | |||||||
Confirmed acceptances and guarantees in foreign currencies | 4,242,061 | 119,548 | 2.82 | |||||||||
Unconfirmed acceptances and guarantees | 5,695,456 | 152,636 | 2.68 | |||||||||
|
|
|
|
|
| |||||||
Total | (Won) | 11,542,684 | (Won) | 311,502 | 2.70 | |||||||
|
|
|
|
|
| |||||||
The changes in provisions for unused loan commitments, acceptances and guarantees for the years ended December 31, 20102012 and 2011,2013, are as follows:
| For the Year Ended December 31, 2010 | 2012 | |||||||||||||||||||||||
| Provisions for acceptances and guarantees | Provisions for unused loan commitments | Total | Provisions for unused loan commitments | Provisions for acceptances and guarantees | Total | |||||||||||||||||||
| (In millions of Korean won) | (In millions of Korean won) | |||||||||||||||||||||||
Beginning | (Won) | 92,508 | (Won) | 289,037 | (Won) | 381,545 | ₩ | 259,427 | ₩ | 311,502 | ₩ | 570,929 | ||||||||||||
Effects of changes in foreign exchange rate | (270 | ) | (210 | ) | (480 | ) | (770 | ) | (10,219 | ) | (10,989 | ) | ||||||||||||
Provision(reversal) | 322,016 | (4,160 | ) | 317,856 | (22,631 | ) | (68,777 | ) | (91,408 | ) | ||||||||||||||
Others | — | (23,753 | ) | (23,753 | ) | |||||||||||||||||||
|
|
|
|
|
| |||||||||||||||||||
Ending | (Won) | 414,254 | (Won) | 284,667 | (Won) | 698,921 | ₩ | 236,026 | ₩ | 208,753 | ₩ | 444,779 | ||||||||||||
|
|
|
|
|
| |||||||||||||||||||
| For the Year Ended December 31, 2011 | 2013 | |||||||||||||||||||||||
| Provisions for acceptances and guarantees | Provisions for unused loan commitments | Total | Provisions for unused loan commitments | Provisions for acceptances and guarantees | Total | |||||||||||||||||||
| (In millions of Korean won) | (In millions of Korean won) | |||||||||||||||||||||||
Beginning | (Won) | 414,254 | (Won) | 284,667 | (Won) | 698,921 | ₩ | 236,026 | ₩ | 208,753 | ₩ | 444,779 | ||||||||||||
Effects of changes in foreign exchange rate | 2,130 | 132 | 2,262 | (164 | ) | (961 | ) | (1,125 | ) | |||||||||||||||
Provision (reversal) | (104,882 | ) | (25,372 | ) | (130,254 | ) | ||||||||||||||||||
Provision(reversal) | (9,752 | ) | 1,326 | (8,426 | ) | |||||||||||||||||||
|
|
|
|
|
| |||||||||||||||||||
Ending | (Won) | 311,502 | (Won) | 259,427 | (Won) | 570,929 | ₩ | 226,110 | ₩ | 209,118 | ₩ | 435,228 | ||||||||||||
|
|
|
|
|
| |||||||||||||||||||
The changes in provisions for financial guarantee contracts for the years ended December 31, 20102012 and 2011,2013, are as follows:
| For the Year Ended December 31, | ||||||||||||||||
| 2010 | 2011 | 2012 | 2013 | |||||||||||||
| (In millions of Korean won) | (In millions of Korean won) | |||||||||||||||
Beginning | (Won) | 32,578 | (Won) | 18,866 | ₩ | 7,959 | ₩ | 7,383 | ||||||||
Provision (reversal) | (13,712 | ) | (10,907 | ) | ||||||||||||
Provision(reversal) | (576 | ) | (4,684 | ) | ||||||||||||
|
|
|
| |||||||||||||
Ending | (Won) | 18,866 | (Won) | 7,959 | ₩ | 7,383 | ₩ | 2,699 | ||||||||
|
|
|
| |||||||||||||
The changes in provisions for asset retirement obligationobligations for the years ended December 31, 20102012 and 2011,2013, are as follows:
| For the Year Ended December 31, | ||||||||||||||||
| 2010 | 2011 | 2012 | 2013 | |||||||||||||
| (In millions of Korean won) | (In millions of Korean won) | |||||||||||||||
Beginning | (Won) | 43,070 | (Won) | 49,461 | ₩ | 60,059 | ₩ | 65,226 | ||||||||
Provision | 1,381 | 5,893 | 4,115 | 3,972 | ||||||||||||
Reversal | (47 | ) | (94 | ) | — | (226 | ) | |||||||||
Used | (1,505 | ) | (1,845 | ) | (1,296 | ) | (2,475 | ) | ||||||||
Unwinding of discount | 2,616 | 2,719 | 2,483 | 2,203 | ||||||||||||
Effects of changes in discount rate | 3,946 | 3,925 | (135 | ) | 7,908 | |||||||||||
|
|
|
| |||||||||||||
Ending | (Won) | 49,461 | (Won) | 60,059 | ₩ | 65,226 | ₩ | 76,608 | ||||||||
|
|
|
| |||||||||||||
Provisions for asset retirement obligationobligations are the present value of estimated costs to be incurred for the restoration of the leased properties. Actual expenses are expected to be incurred at the end of each lease contract. Three-year historical data of expired leases were used to estimate the average lease period. Also, the average restoration expense based on actual three-year historical data and the three-year historical average inflation rate were used to estimate the present value of estimated costs.
The details of other provisions as of January 1, 2010, and December 31, 20102012 and 2011,2013, are as follows:
| As of January 1, | As of December 31, | |||||||||||
| 2010 | 2010 | 2011 | ||||||||||
| (In millions of Korean won) | ||||||||||||
Provisions for membership rewards program | (Won) | 1,225 | (Won) | 12,437 | (Won) | 13,495 | ||||||
Dormant accounts | 10,155 | 9,773 | 11,292 | |||||||||
Provisions for litigations | 2,389 | 6,200 | 49,286 | |||||||||
Others | 105,192 | 224,412 | 84,719 | |||||||||
|
|
|
|
|
| |||||||
Total | (Won) | 118,961 | (Won) | 252,822 | (Won) | 158,792 | ||||||
|
|
|
|
|
| |||||||
Membership rewards program Dormant accounts Litigations Others Total 2012 2013 (In millions of Korean won) ₩ 11,108 ₩ 5,402 16,028 16,839 21,215 23,455 103,990 117,842 ₩ 152,341 ₩ 163,538
The changes in other provisions for the years ended December 31, 20102012 and 2011,2013, are as follows:
| For the Year Ended December 31, 2010 | 2012 | |||||||||||||||||||||||||||||||||||||||
| Provisions for membership rewards program | Dormant accounts | Provisions for litigations | Others | Total | Membership rewards program | Dormant accounts | Litigations | Others | Total | |||||||||||||||||||||||||||||||
| (In millions of Korean won) | (In millions of Korean won) | |||||||||||||||||||||||||||||||||||||||
Beginning | (Won) | 1,225 | (Won) | 10,155 | (Won) | 2,389 | (Won) | 105,192 | (Won) | 118,961 | ₩ | 13,495 | ₩ | 11,292 | ₩ | 49,286 | ₩ | 84,719 | ₩ | 158,792 | ||||||||||||||||||||
Increase | 22,621 | 6,838 | 3,857 | 19,621 | 52,937 | 15,958 | 13,998 | 18,073 | 51,799 | 99,828 | ||||||||||||||||||||||||||||||
Decrease | (11,409 | ) | (7,220 | ) | (46 | ) | 99,599 | 80,924 | (18,345 | ) | (9,262 | ) | (46,144 | ) | (32,528 | ) | (106,279 | ) | ||||||||||||||||||||||
|
|
|
|
|
|
|
|
|
| |||||||||||||||||||||||||||||||
Ending | (Won) | 12,437 | (Won) | 9,773 | (Won) | 6,200 | (Won) | 224,412 | (Won) | 252,822 | ₩ | 11,108 | ₩ | 16,028 | ₩ | 21,215 | ₩ | 103,990 | ₩ | 152,341 | ||||||||||||||||||||
|
|
|
|
|
|
|
|
|
| |||||||||||||||||||||||||||||||
| 2013 | ||||||||||||||||||||||||||||||||||||||||
| Membership rewards program | Dormant accounts | Litigations | Others | Total | ||||||||||||||||||||||||||||||||||||
| (In millions of Korean won) | ||||||||||||||||||||||||||||||||||||||||
Beginning | ₩ | 11,108 | ₩ | 16,028 | ₩ | 21,215 | ₩ | 103,990 | ₩ | 152,341 | ||||||||||||||||||||||||||||||
Increase | 13,473 | 10,596 | 4,800 | 18,026 | 46,895 | |||||||||||||||||||||||||||||||||||
Decrease | (19,179 | ) | (9,785 | ) | (2,560 | ) | (4,174 | ) | (35,698 | ) | ||||||||||||||||||||||||||||||
|
|
|
|
| ||||||||||||||||||||||||||||||||||||
Ending | ₩ | 5,402 | ₩ | 16,839 | ₩ | 23,455 | ₩ | 117,842 | ₩ | 163,538 | ||||||||||||||||||||||||||||||
|
|
|
|
| ||||||||||||||||||||||||||||||||||||
24. Net Defined benefit liabilities
| For the Year Ended December 31, 2011 | ||||||||||||||||||||
| Provisions for membership rewards program | Dormant accounts | Provisions for litigations | Others | Total | ||||||||||||||||
| (In millions of Korean won) | ||||||||||||||||||||
Beginning | (Won) | 12,437 | (Won) | 9,773 | (Won) | 6,200 | (Won) | 224,412 | (Won) | 252,822 | ||||||||||
Increase | 16,759 | 10,377 | 69,479 | 5,081 | 101,696 | |||||||||||||||
Decrease | (15,701 | ) | (8,858 | ) | (26,393 | ) | (144,774 | ) | (195,726 | ) | ||||||||||
|
|
|
|
|
|
|
|
|
| |||||||||||
Ending | (Won) | 13,495 | (Won) | 11,292 | (Won) | 49,286 | (Won) | 84,719 | (Won) | 158,792 | ||||||||||
|
|
|
|
|
|
|
|
|
| |||||||||||
Defined benefit plan
The Group operates defined benefit plans which have the following characteristics:
The Group has the obligation to pay the agreed benefits to all its current and former employees.
Actuarial risk (that benefits will cost more than expected) and investment risk fall, in substance, on the Group.
The defined benefit liability recognized in the statements of financial position is calculated annually by independent actuaries in accordance with actuarial valuation methods.
The defined benefit obligation is calculated using the Projected Unit Credit method (the ‘PUC’). Data used in the PUC such as interest rates, future salary increase rate, mortality rate and consumer price index and expected return on plan asset are based on observable market data and historical data which are updated annually.
Actuarial assumptions may differ from actual results, due to changes in the market, economic trends and mortality trends which may impact defined benefit liabilities and future payments. Actuarial gains and losses arising from changes in actuarial assumptions are recognized in the period incurred through profit or loss.other comprehensive income (loss).
The changes in the net defined benefit obligationliabilities for the years ended December 31, 20102012 and 2011,2013, are as follows:
| For the Year Ended December 31, | ||||||||
| 2010 | 2011 | |||||||
| (In millions of Korean won) | ||||||||
Present value of defined benefit obligation (beginning) | (Won) | 584,404 | (Won) | 491,989 | ||||
Current service cost | 142,930 | 145,397 | ||||||
Interest cost | 28,383 | 24,883 | ||||||
Actuarial gains(losses) | (24,906 | ) | 40,685 | |||||
Exchange difference on foreign plans | 35 | 29 | ||||||
Benefits paid | (255,795 | ) | (17,885 | ) | ||||
Past service cost(1) | — | 45,538 | ||||||
Effect of business combination | 915 | — | ||||||
Effects of curtailments | 18,362 | (827 | ) | |||||
Effects of settlements | (2,339 | ) | (925 | ) | ||||
|
|
|
| |||||
Present value of defined benefit obligation (ending) | (Won) | 491,989 | (Won) | 728,884 | ||||
|
|
|
| |||||
| 2012 | ||||||||||||
| Present value of defined benefit obligation | Fair value of plan assets | Net defined benefit liabilities | ||||||||||
| (In millions of Korean won) | ||||||||||||
Beginning | ₩ | 727,760 | ₩ | (600,323 | ) | ₩ | 127,437 | |||||
Current service cost | 154,552 | — | 154,552 | |||||||||
Interest cost (income) | 31,158 | (25,785 | ) | 5,373 | ||||||||
Past service cost | 12,855 | — | 12,855 | |||||||||
Any gain or loss on settlement | (389 | ) | — | (389 | ) | |||||||
Remeasurements | ||||||||||||
Actuarial gains and losses by changes in demographic assumptions | (30,879 | ) | — | (30,879 | ) | |||||||
Actuarial gains and losses by changes in financial assumptions | 51,321 | — | 51,321 | |||||||||
Actuarial gains and losses by experience adjustments | 20,741 | — | 20,741 | |||||||||
Return on plan assets (excluding amounts included in interest income) | — | (1,243 | ) | (1,243 | ) | |||||||
Contributions | — | (248,656 | ) | (248,656 | ) | |||||||
Payments from plans (settlement) | (541 | ) | 221 | (320 | ) | |||||||
Payments from plans (benefit payments) | (17,253 | ) | 17,253 | — | ||||||||
Payments from the Group | (6,907 | ) | — | (6,907 | ) | |||||||
Transfer in | 2,198 | (1,944 | ) | 254 | ||||||||
Transfers out | (2,198 | ) | 1,867 | (331 | ) | |||||||
Effect of exchange rate changes | (85 | ) | — | (85 | ) | |||||||
|
|
|
|
|
| |||||||
Ending | ₩ | 942,333 | ₩ | (858,610 | ) | ₩ | 83,723 | |||||
|
|
|
|
|
| |||||||
Beginning Current service cost Interest cost (income) Past service cost Any gain or loss on settlement Remeasurements Actuarial gains and losses by changes in demographic assumptions Actuarial gains and losses by changes in financial assumptions Actuarial gains and losses by experience adjustments Return on plan assets (excluding amounts included in interest income) Contributions Payments from plans (settlement) Payments from plans (benefit payments) Payments from the Group Transfer in Transfers out Effect of exchange rate changes Business combination Ending The details of the net defined benefit liabilities as of | ||||||||||||||||||||||||||||||||||||||||||||||||||||||||||||||||||||||||||||||||||||||||||||||||||||||||||||||||||||||||||||||||||||||||||||||||||||||||||||||||||||||||||||||||||||||||||||||||||||||||||||||||||||||||||||||||||||||||||||||||||||||||||||||||||||||||||||||||||||||||||||||||||||||||||||||||||||||||||||||||||||||
The changes in the fair value of plan assets for the years ended December 31, 20102012 and 2011,2013, are as follows:
| For the Year Ended December 31, | ||||||||
| 2010 | 2011 | |||||||
| (In millions of Korean won) | ||||||||
Fair value of plan assets (beginning) | (Won) | 417,017 | (Won) | 366,526 | ||||
Expected return on plan assets | 19,181 | 15,382 | ||||||
Actuarial gains (losses) | (6,966 | ) | 982 | |||||
Contributions | 195,781 | 235,736 | ||||||
Benefits paid | (256,224 | ) | (17,658 | ) | ||||
Effect of business combination | 76 | — | ||||||
Effects of settlements | (2,339 | ) | (572 | ) | ||||
|
|
|
| |||||
Fair value of plan assets (ending) | (Won) | 366,526 | (Won) | 600,396 | ||||
|
|
|
| |||||
The details of defined benefit liabilities as of January 1, 2010, and December 31, 2010 and 2011, are as follows:
| As of January 1, | As of December 31, | |||||||||||
| 2010 | 2010 | 2011 | ||||||||||
| (In millions of Korean won) | ||||||||||||
Present value of defined benefit obligation | (Won) | 584,404 | (Won) | 491,989 | (Won) | 728,884 | ||||||
Fair value of plan assets | (417,017 | ) | (366,526 | ) | (600,396 | ) | ||||||
|
|
|
|
|
| |||||||
Defined benefit liability | (Won) | 167,387 | (Won) | 125,463 | (Won) | 128,488 | ||||||
|
|
|
|
|
| |||||||
Present value of defined benefit obligation Fair value of plan assets Net Defined benefit liabilities 2012 2013 (In millions of Korean won) ₩ 942,333 ₩ 985,195 (858,610 ) (920,722 ) ₩ 83,723 ₩ 64,473
The details of post-employment benefits recognized in profit andor loss as employee compensation and benefits for the years ended December 31, 20102011, 2012 and 2011,2013, are as follows:
| For the Year Ended December 31, | ||||||||
| 2010 | 2011 | |||||||
| (In millions of Korean won) | ||||||||
Current service cost | (Won) | 142,930 | (Won) | 145,397 | ||||
Interest cost | 28,383 | 24,883 | ||||||
Expected return on plan assets | (19,181 | ) | (15,382 | ) | ||||
Actuarial losses (gains) | (17,940 | ) | 39,703 | |||||
Past service cost | — | 11,111 | ||||||
Effects of curtailments | 18,362 | (827 | ) | |||||
|
|
|
| |||||
Post-employment benefits(1) | (Won) | 152,554 | (Won) | 204,885 | ||||
|
|
|
| |||||
| 2011 | 2012 | 2013 | ||||||||||
| (In millions of Korean won) | ||||||||||||
Current service cost | ₩ | 145,397 | ₩ | 154,552 | ₩ | 172,857 | ||||||
Past service cost | 10,285 | 12,855 | 1,005 | |||||||||
Any gain or loss on settlement | — | (389 | ) | (4,244 | ) | |||||||
Net interest expenses of net defined benefit liabilities | 4,717 | 5,373 | 2,961 | �� | ||||||||
|
|
|
|
|
| |||||||
Post-employment benefits(1) | ₩ | 160,399 | ₩ | 172,391 | ₩ | 172,579 | ||||||
|
|
|
|
|
| |||||||
| (1) | Post-employment benefits amounting to |
The actual return on plan assets is (Won)12,215 million and (Won)16,364 millionRemeasurements of the net defined benefit liabilities recognized as other comprehensive income for the years ended December 31, 20102011, 2012 and 2011, respectively.
The details of plan assets as of January 1, 2010, and December 31, 2010 and 2011,2013, are as follows:
| As of January 1, | As of December 31, | |||||||||||
| 2010 | 2010 | 2011 | ||||||||||
| (In millions of Korean won) | ||||||||||||
Time deposits | (Won) | 417,017 | (Won) | 366,526 | (Won) | 600,396 | ||||||
| 2011 | 2012 | 2013 | ||||||||||
| (In millions of Korean won) | ||||||||||||
Remeasurements | ||||||||||||
Return on plan assets (excluding amounts included in interest income) | ₩ | (3,802 | ) | ₩ | 1,243 | ₩ | (1,096 | ) | ||||
Actuarial gains and losses | (40,685 | ) | (41,184 | ) | 55,165 | |||||||
Income tax effects | (12,338 | ) | 9,669 | (13,085 | ) | |||||||
|
|
|
|
|
| |||||||
Remeasurements after income tax | ₩ | (32,149 | ) | ₩ | (30,272 | ) | ₩ | 40,984 | ||||
|
|
|
|
|
| |||||||
Plan assets as of December 31, 2012 and 2013, are as follows:
| 2012 | ||||||||||||
| Assets quoted in an active market | Assets not quoted in an active market | Total | ||||||||||
| (In millions of Korean won) | ||||||||||||
Cash and due from financial institutions | ₩ | — | ₩ | 858,610 | ₩ | 858,610 | ||||||
| 2013 | ||||||||||||
| Assets quoted in an active market | Assets not quoted in an active market | Total | ||||||||||
| (In millions of Korean won) | ||||||||||||
Cash and due from financial institutions | ₩ | — | ₩ | 915,584 | ₩ | 915,584 | ||||||
Repurchase agreements | — | 5,138 | 5,138 | |||||||||
|
|
|
|
|
| |||||||
Total | ₩ | — | ₩ | 920,722 | ₩ | 920,722 | ||||||
|
|
|
|
|
| |||||||
Key actuarial assumptions used as of January 1, 2010, and December 31, 20102012 and 2011,2013, are as follows:
| Ratio (%) | ||||||
| As of January 1, | As of December 31, | |||||
| 2010 | 2010 | 2011 | ||||
Discount rate | 5.24 ~ 5.96 | 3.56 ~ 5.13 | 3.76 ~ 4.40 | |||
Expected return on plan assets | 4.67 ~ 5.39 | 3.71 ~ 3.91 | 3.20 ~ 4.19 | |||
Future salary increase rate | 0.00 ~ 10.00 | 0.00 ~ 10.00 | 0.00 ~ 8.25 | |||
| 2012 | 2013 | |||
| (In millions of Korean won) | ||||
Discount rate (%) | 3.00 ~ 3.64 | 2.90 ~ 4.00 | ||
Salary increase rate (%) | 0.00 ~ 8.90 | 0.00 ~ 8.90 | ||
Turnover (%) | 0.00 ~ 32.00 | 0.00 ~ 32.00 | ||
Mortality assumptions are based on the 20097th experience-based mortality table (retirement pension) of Korea standard mortality rates table.Insurance Development Institute of 2012.
The present valuesensitivity of the defined benefitsbenefit obligation fair value of plan assets and actuarial adjustments to each itemchanges in the weighted principal assumptions as of January 1, 2010, and December 31, 2010 and 2011, are2013, is as follows:
| As of January 1, | As of December 31, | |||||||||||
| 2010 | 2010 | 2011 | ||||||||||
| (In millions of Korean won) | ||||||||||||
Present value of defined benefits obligation | (Won) | 584,404 | (Won) | 491,989 | (Won) | 728,884 | ||||||
Fair value of plan assets | (417,017 | ) | (366,526 | ) | (600,396 | ) | ||||||
|
|
|
|
|
| |||||||
Total | 167,387 | 125,463 | 128,488 | |||||||||
|
|
|
|
|
| |||||||
Adjustments to defined benefits obligation | (Won) | — | (Won) | (24,906 | ) | (Won) | 40,685 | |||||
Adjustments to plan assets | — | 6,966 | (982 | ) | ||||||||
| Changes in principal assumption | Effect on net defined benefit obligation | |||||||
| Increase in principal assumption | Decrease in principal assumption | |||||||
Discount rate (%) | 0.5 | 5.02 decrease | 5.41 increase | |||||
Salary increase rate (%) | 0.5 | 5.05 increase | 4.81 decrease | |||||
Turnover (%) | 0.5 | 0.24 decrease | 0.18 increase | |||||
The Group’s best estimateabove sensitivity analyses are based on a change in an assumption while holding all other assumptions constant. In practice, this is unlikely to occur, and changes in some of contributions expectedthe assumptions may be correlated. The sensitivity of the defined benefit obligation to changes in principal actuarial assumptions is calculated using the projected unit credit method, the same method applied when calculating the defined benefit obligations recognized on the statement of financial position.
Expected maturity analysis of undiscounted pension benefits as of December 31, 2013, is as follows:
Less than 1 year | Between 1 and 2 years | Between 2 and 5 years | Between 5 and 10 years | Over 10 years | Total | |||||||||||||||||
| (In millions of Korean won) | ||||||||||||||||||||||
Pension benefits | ₩21,096 | ₩58,558 | ₩248,744 | ₩782,831 | ₩3,532,620 | ₩4,643,849 | ||||||||||||||||
The weighted average duration of the defined benefit obligation is 1 ~ 14.4 years.
Expected contribution to plan assets for period post-December 31, 2013, is estimated to be paid to plan during the annual period beginning after the reporting period amounts to (Won)103,958approximately ₩180,618 million.
24.225. Other liabilities
The details of other liabilities excluding defined benefits liabilities, as of January 1, 2010, and December 31, 20102012 and 2011,2013, are as follows:
| As of January 1, | As of December 31, | |||||||||||||||||||
| 2010 | 2010 | 2011 | 2012 | 2013 | ||||||||||||||||
| (In millions of Korean won) | (In millions of Korean won) | |||||||||||||||||||
Other financial liabilities | ||||||||||||||||||||
Other payables | (Won) | 3,437,238 | (Won) | 2,383,209 | (Won) | 3,000,703 | ₩ | 4,327,788 | ₩ | 4,582,344 | ||||||||||
Prepaid card and debit card | 17,580 | 18,263 | 20,151 | 18,165 | 18,527 | |||||||||||||||
Accrued expenses | 3,968,641 | 3,874,272 | 4,219,075 | 4,444,807 | 4,053,809 | |||||||||||||||
Financial guarantee liabilities | 10,030 | 5,267 | 7,217 | 7,153 | 11,797 | |||||||||||||||
Deposits for letter of guarantees and others | 142,265 | 143,632 | 154,542 | 114,171 | 108,786 | |||||||||||||||
Domestic exchange settlement credits | 391,571 | 189,041 | 133,568 | 167,842 | 998,928 | |||||||||||||||
Foreign exchanges settlement credits | 68,430 | 84,296 | 88,480 | 52,456 | 83,237 | |||||||||||||||
Borrowings from other business account | 46,809 | 3,011 | 11,827 | 34,367 | 7,911 | |||||||||||||||
Borrowings from Trust Accounts | 1,658,208 | 1,834,715 | 1,918,766 | |||||||||||||||||
Liability Incurred by Agency Relationship | 344,668 | 381,896 | 197,537 | |||||||||||||||||
Account for Agency Businesses | 218,415 | 268,675 | 134,256 | |||||||||||||||||
Other payables to trust accounts | 2,009,396 | 2,423,675 | ||||||||||||||||||
Liability Incurred by agency relationship | 499,249 | 532,157 | ||||||||||||||||||
Account for agency businesses | 402,290 | 384,921 | ||||||||||||||||||
Dividend payables | 489 | 485 | ||||||||||||||||||
Other payables from factored receivables | 78,025 | 42,924 | ||||||||||||||||||
Others | 100,020 | 88,450 | 75,983 | 29,740 | 13,413 | |||||||||||||||
|
|
|
|
| ||||||||||||||||
Sub Total | 10,403,875 | 9,274,727 | 9,962,105 | |||||||||||||||||
Sub-total | 12,185,938 | 13,262,914 | ||||||||||||||||||
|
|
|
|
| ||||||||||||||||
Other non-financial liabilities | ||||||||||||||||||||
Other payables | 22,718 | 20,138 | 126,666 | |||||||||||||||||
Unearned revenue | 134,049 | 113,370 | 125,190 | |||||||||||||||||
Accrued expenses | 156,777 | 137,329 | 184,412 | |||||||||||||||||
Deferred revenue on credit card points | 140,219 | 124,949 | 106,132 | |||||||||||||||||
Withholding Taxes | 99,069 | 101,053 | 154,478 | |||||||||||||||||
Insurance liabilities | 2,046,694 | 2,858,176 | 3,530,354 | |||||||||||||||||
Separate account liabilities | 291,611 | 426,548 | 543,819 | |||||||||||||||||
Others | 121,613 | 344,659 | 353,013 | |||||||||||||||||
|
|
| ||||||||||||||||||
Sub Total | 3,012,750 | 4,126,222 | 5,124,064 | |||||||||||||||||
|
|
| ||||||||||||||||||
Total | (Won) | 13,416,625 | (Won) | 13,400,949 | (Won) | 15,086,169 | ||||||||||||||
|
|
| ||||||||||||||||||
Other non-financial liabilities | ||||||||
Other payables | 28,712 | 44,982 | ||||||
Unearned revenue | 117,135 | 123,033 | ||||||
Accrued expenses | 222,920 | 191,513 | ||||||
Deferred revenue on credit card points | 111,838 | 117,659 | ||||||
Withholding taxes | 121,688 | 111,975 | ||||||
Insurance liabilities | 4,837,166 | 5,599,043 | ||||||
Separate account liabilities | 661,782 | 702,757 | ||||||
Others | 40,561 | 82,353 | ||||||
|
|
|
| |||||
Sub-total | 6,141,802 | 6,973,315 | ||||||
|
|
|
| |||||
Total | ₩ | 18,327,740 | ₩ | 20,236,229 | ||||
|
|
|
|
25.26. Equity
25.1 Capital Stock26.1 Share capital
The details of outstanding shares of the Parent Company as of January 1, 2010, and December 31, 20102012 and 2011,2013, are as follows:
| Ordinary shares | ||||||||||||||||||||
| As of January 1, | As of December 31, | Ordinary shares | ||||||||||||||||||
| 2010 | 2010 | 2011 | 2012 | 2013 | ||||||||||||||||
Number of shares authorized | 1,000,000,000 | 1,000,000,000 | 1,000,000,000 | 1,000,000,000 | 1,000,000,000 | |||||||||||||||
Number of shares | 386,351,693 | 386,351,693 | 386,351,693 | 386,351,693 | 386,351,693 | |||||||||||||||
Par Value per share | (Won) | 5,000 | (Won) | 5,000 | (Won) | 5,000 | ||||||||||||||
Capital(1) | (Won) | 1,931,758 | (Won) | 1,931,758 | (Won) | 1,931,758 | ||||||||||||||
Par value per share | ₩ | 5,000 | ₩ | 5,000 | ||||||||||||||||
Share capital stock(1) | ₩ | 1,931,758 | ₩ | 1,931,758 | ||||||||||||||||
| (1) | In millions of Korean won. |
25.226.2 Capital surplus
The details of capital surplus as of January 1, 2010, and December 31, 20102012 and 2011,2013, are as follows:
| As of January 1, | As of December 31, | |||||||||||
| 2010 | 2010 | 2011 | ||||||||||
| (In millions of Korean won) | ||||||||||||
Capital stock in excess of par value | (Won) | 12,226,596 | (Won) | 12,226,596 | (Won) | 12,226,596 | ||||||
Loss on sales of treasury shares | (420,484) | (420,484) | (568,544) | |||||||||
Other capital surplus | 4,184,506 | 4,184,166 | 4,183,772 | |||||||||
|
|
|
|
|
| |||||||
Total | (Won) | 15,990,618 | (Won) | 15,990,278 | (Won) | 15,841,824 | ||||||
|
|
|
|
|
| |||||||
The changes in the loss on sales of treasury shares for the years ended December 31, 2010 and 2011, are as follows:
| For the Year Ended December 31, 2010 | ||||||||||||||
| Beginning | Changes | Tax effect | Ending | |||||||||||
| (In millions of Korean won) | ||||||||||||||
| (Won) | (420,484) | (Won) | — | (Won) | — | (Won) | (420,484 | ) | ||||||
| For the Year Ended December 31, 2011 | ||||||||||||||
| Beginning | Changes | Tax effect | Ending | |||||||||||
| (In millions of Korean won) | ||||||||||||||
| (Won) | (420,484) | (Won) | (195,285 | ) | (Won) | 47,225 | (Won) | (568,544 | ) | |||||
| 2012 | 2013 | |||||||
| (In millions of Korean won) | ||||||||
Share premium | ₩ | 12,226,596 | ₩ | 12,226,596 | ||||
Loss on sale of treasury shares | (568,544 | ) | (568,544 | ) | ||||
Other capital surplus | 4,182,248 | 4,196,553 | ||||||
|
|
|
| |||||
Total | ₩ | 15,840,300 | ₩ | 15,854,605 | ||||
|
|
|
| |||||
25.3 Treasury shares
The changes in treasury shares for the years ended December 31, 2010 and 2011, are as follows:
| For the Year Ended December 31, 2010 | ||||||||||||||||||||
| Beginning | Purchase | Cancellation | Sales | Ending | ||||||||||||||||
| (In millions of Korean won) | ||||||||||||||||||||
Number of shares | 43,322,704 | — | — | — | 43,322,704 | |||||||||||||||
Carrying amount | (Won) | (2,476,809) | (Won) | — | (Won) | — | (Won) | — | (Won) | (2,476,809) | ||||||||||
| For the Year Ended December 31, 2011 | ||||||||||||||||||||
| Beginning | Purchase | Cancellation | Sales | Ending | ||||||||||||||||
| (In millions of Korean won) | ||||||||||||||||||||
Number of shares | 43,322,704 | — | — | (43,322,704) | — | |||||||||||||||
Carrying amount | (Won) | (2,476,809) | (Won) | — | (Won) | — | (Won) | 2,476,809 | (Won) | — | ||||||||||
25.426.3 Accumulated other comprehensive income
The details of accumulated other comprehensive income as of January 1, 2010, and December 31, 20102012 and 2011,2013, are as follows:
| As of January 1, | As of December 31, | 2012 | 2013 | |||||||||||||||||
| 2010 | 2010 | 2011 | (In millions of Korean won) | |||||||||||||||||
| (In millions of Korean won) | ||||||||||||||||||||
Remeasurements of net defined benefit liabilities | ₩ | (53,507 | ) | ₩ | (12,523 | ) | ||||||||||||||
Exchange differences on translating foreign operations | (27,061 | ) | (29,433 | ) | ||||||||||||||||
Change in value of available-for-sale financial assets | (Won) | 355,312 | (Won) | 443,389 | (Won) | 200,275 | 426,354 | 430,976 | ||||||||||||
Change in value of held-to-maturity financial assets | (2,614 | ) | (2,098 | ) | (1,652 | ) | (1,225 | ) | 4,904 | |||||||||||
Shares of other comprehensive income of associates and joint ventures | (1,757 | ) | (3,762 | ) | (4,195 | ) | ||||||||||||||
Shares of other comprehensive income of associates | (47,286 | ) | (57,097 | ) | ||||||||||||||||
Cash flow hedges | — | — | (1,321 | ) | (2,133 | ) | (515 | ) | ||||||||||||
Currency translation differences | — | (6,957 | ) | (1,465 | ) | |||||||||||||||
|
|
|
|
| ||||||||||||||||
Total | (Won) | 350,941 | (Won) | 430,572 | (Won) | 191,642 | ₩ | 295,142 | ₩ | 336,312 | ||||||||||
|
|
|
|
| ||||||||||||||||
25.526.4 Retained earnings
The details of retained earnings as of January 1, 2010, and December 31, 20102012 and 2011,2013, consist of:
| As of January 1, | As of December 31, | 2012 | 2013 | |||||||||||||||||
| 2010 | 2010 | 2011 | (In millions of Korean won) | |||||||||||||||||
| (In millions of Korean won) | ||||||||||||||||||||
Legal reserves | (Won) | 61,200 | (Won) | 115,182 | (Won) | 124,014 | ||||||||||||||
Legal reserves(1) | ₩ | 124,014 | ₩ | 188,638 | ||||||||||||||||
Voluntary reserves | 568,000 | 982,000 | 982,000 | 982,000 | 982,000 | |||||||||||||||
Unappropriated retained earnings | 1,923,985 | 1,523,706 | 3,846,737 | 5,395,405 | 6,359,518 | |||||||||||||||
|
|
|
|
| ||||||||||||||||
Total | (Won) | 2,553,185 | (Won) | 2,620,888 | (Won) | 4,952,751 | ₩ | 6,501,419 | ₩ | 7,530,156 | ||||||||||
|
|
|
|
| ||||||||||||||||
With respect to the allocation of net profit earned in a fiscal term, the Parent Company must set aside in its legal reserve an amount equal to at least 10% of its net income after tax as reported in the separate statement of comprehensive income each time it pays dividends on its net profits earned until its legal reserve reaches at least the aggregate amount of its capital stock in accordance with Article 53 of the Financial Holding Company Act. The reserve is not available for the payment of cash dividends, but may be transferred to capital stock, or used to reduce accumulated deficit.
In addition, as of December 31, 2011, Kookmin Bank’s total balance of accumulated restricted retained earnings in accordance with the Banking Act of Korea and other regulations is (Won) 1,575,680 million.
With respect to the allocation of net profit earned in a fiscal term, the Parent Company must set aside in its legal reserve an amount equal to at least 10% of its net income after tax as reported in the separate statement of comprehensive income each time it pays dividends on its net profits earned until its legal reserve reaches at least the aggregate amount of its share capital in accordance with Article 53 of the Financial Holding Company Act. The reserve is not available for the payment of cash dividends, but may be transferred to share capital, or used to reduce accumulated deficit.Regulatory Reserve for Credit Losses(1) Measurement and disclosure of Regulatory Reserve for Credit Losses are required in accordance with Article 26 through 28 of the Supervisory Regulations on Financial Holding Companies in Korea which have been effective since November 18, 2010. The amount to be appropriated as the reserve is (Won)1,816,074 million for the year ended December 31, 2011 which is not available for the payment of cash dividends.
26.27. Net Interest Income
The details of interest income and interest expense for the years ended December 31, 20102011, 2012 and 2011,2013, are as follows:
| For the Year Ended December 31, | ||||||||||||||||||||
| 2010 | 2011 | 2011 | 2012 | 2013 | ||||||||||||||||
| (In millions of Korean won) | (In millions of Korean won) | |||||||||||||||||||
Interest income | ||||||||||||||||||||
Due from financial institutions | (Won) | 38,029 | (Won) | 74,663 | ₩ | 74,663 | ₩ | 160,400 | ₩ | 146,105 | ||||||||||
Loans | 11,512,207 | 12,412,206 | 12,412,206 | 12,623,923 | 10,942,021 | |||||||||||||||
Financial investments | ||||||||||||||||||||
Available-for-sale financial assets | 766,252 | 775,783 | 775,783 | 799,020 | 694,218 | |||||||||||||||
Held-to-maturity financial assets | 735,448 | 693,605 | 693,605 | 626,763 | 574,586 | |||||||||||||||
|
|
|
|
| ||||||||||||||||
Sub Total | 13,051,936 | 13,956,257 | ||||||||||||||||||
Sub-total | 13,956,257 | 14,210,106 | 12,356,930 | |||||||||||||||||
|
|
|
|
| ||||||||||||||||
Interest expenses | ||||||||||||||||||||
Deposits | 4,708,531 | 4,944,615 | 4,944,615 | 5,450,781 | 4,279,153 | |||||||||||||||
Debts | 306,490 | 398,802 | 398,802 | 400,000 | 364,499 | |||||||||||||||
Debentures | 1,863,111 | 1,508,328 | 1,508,328 | 1,261,542 | 1,190,446 | |||||||||||||||
|
| |||||||||||||||||||
Sub Total | 6,878,132 | 6,851,745 | ||||||||||||||||||
Sub-total | 6,851,745 | 7,172,323 | 5,834,098 | |||||||||||||||||
|
|
|
|
| ||||||||||||||||
Net interest income | (Won) | 6,173,804 | (Won) | 7,104,512 | ₩ | 7,104,512 | ₩ | 7,037,783 | ₩ | 6,522,832 | ||||||||||
|
|
|
|
| ||||||||||||||||
Interest income recognized on impaired loans and financial investments amounts to (Won) 121,221₩127,120 million (2010: (Won) 100,942(2012: ₩124,183 million, 2011: ₩121,221 million) and (Won) 200₩569 million (2010: (Won) 200(2012: ₩200 million, 2011: ₩200 million), respectively, for the yearsyear ended December 31, 20102011, 2012 and 2011.2013.
27.28. Net Fee and Commission income
The details of fee and commission income, and fee and commission expense for the years ended December 31, 20102011, 2012 and 2011,2013, are as follows:
| For the Year Ended December 31, | ||||||||||||||||||||
| 2010 | 2011 | 2011 | 2012 | 2013 | ||||||||||||||||
| (In millions of Korean won) | (In millions of Korean won) | |||||||||||||||||||
Fee and commission income | ||||||||||||||||||||
Banking activity fees | (Won) | 183,862 | (Won) | 188,652 | ₩ | 188,652 | ₩ | 169,244 | ₩ | 167,507 | ||||||||||
Lending activity fees | 79,734 | 88,521 | 88,521 | 89,964 | 90,413 | |||||||||||||||
Credit card related fees and commissions | 1,043,768 | 1,142,306 | 1,142,306 | 1,179,618 | 1,126,944 | |||||||||||||||
Debit card related fees and commissions | 166,680 | 192,686 | 192,686 | 217,870 | 255,742 | |||||||||||||||
Agent activity fees | 136,034 | 238,216 | 238,216 | 285,183 | 207,036 | |||||||||||||||
Trust and other fiduciary fees | 149,450 | 165,772 | 165,772 | 148,672 | 160,521 | |||||||||||||||
Fund management related fees | 64,116 | 75,699 | 75,699 | 81,477 | 93,494 | |||||||||||||||
Guarantee fees | 38,752 | 34,181 | 34,181 | 33,594 | 34,173 | |||||||||||||||
Foreign currency related fees | 109,646 | 114,722 | 114,722 | 108,611 | 102,047 | |||||||||||||||
Commissions from transfer agent services | 279,081 | 211,776 | 211,776 | 174,829 | 177,793 | |||||||||||||||
Other business account commission on consignment | 43,979 | 173,893 | 173,893 | 30,354 | 29,799 | |||||||||||||||
Securities brokerage fees | 42,964 | 57,435 | 57,435 | 67,858 | 68,158 | |||||||||||||||
Other | 143,385 | 145,895 | 145,895 | 166,602 | 143,738 | |||||||||||||||
|
|
|
|
| ||||||||||||||||
Sub Total | 2,481,451 | 2,829,754 | ||||||||||||||||||
Sub-total | 2,829,754 | 2,753,876 | 2,657,365 | |||||||||||||||||
|
|
|
|
| ||||||||||||||||
Fee and commission expense | ||||||||||||||||||||
Trading activity related fees | 6,310 | 3,498 | ||||||||||||||||||
Trading activity related fees(1) | 3,498 | 14,963 | 9,358 | |||||||||||||||||
Lending activity fees | 4,110 | 2,743 | 2,743 | 20,466 | 18,791 | |||||||||||||||
Credit card related fees and commissions | 541,125 | 838,843 | 842,294 | 997,368 | 934,114 | |||||||||||||||
Outsourcing related fees | 56,027 | 61,551 | 61,551 | 62,546 | 74,516 | |||||||||||||||
Foreign currency related fees | 17,670 | 18,003 | 18,003 | 11,638 | 12,561 | |||||||||||||||
Management fees of written-off loans | 8,680 | 9,775 | 6,331 | 3,284 | 4,065 | |||||||||||||||
Other | 142,815 | 100,591 | 100,584 | 76,905 | 124,721 | |||||||||||||||
|
|
|
|
| ||||||||||||||||
Sub Total | 776,737 | 1,035,004 | ||||||||||||||||||
Sub-total | 1,035,004 | 1,187,170 | 1,178,126 | |||||||||||||||||
|
|
|
|
| ||||||||||||||||
Net fee and commission income | (Won) | 1,704,714 | (Won) | 1,794,750 | ₩ | 1,794,750 | ₩ | 1,566,706 | ₩ | 1,479,239 | ||||||||||
|
|
|
|
| ||||||||||||||||
The above amounts include fee and commission income of (Won) 2,481,451 million and (Won) 2,829,754 million from financial assets, and fee and commission expense of (Won) 770,427 million and (Won) 1,031,506 million
| (1) | The fees from financial assets/liabilities |
28.29. Net gaingains or loss fromlosses on financial assets/liabilities at fair value through profit or loss
28.129.1 Net gaingains or loss fromlosses on financial instruments held for trading
Net gain or loss from financial instruments held for trading includes interest income, dividend income and gains or losses arising from changes in the fair values, sales and redemptions. The details for the years ended December 31, 20102011, 2012 and 2011,2013, are as follows:
| For the Year Ended December 31, | 2011 | 2012 | 2013 | |||||||||||||||||
| 2010 | 2011 | (In millions of Korean won) | ||||||||||||||||||
| (In millions of Korean won) | ||||||||||||||||||||
Gains related to financial instruments held for trading | ||||||||||||||||||||
Financial assets held for trading | ||||||||||||||||||||
Debt securities | (Won) | 319,648 | (Won) | 207,564 | ₩ | 284,225 | ₩ | 462,456 | ₩ | 340,601 | ||||||||||
Equity securities | 41,504 | (26,226 | ) | 70,345 | 117,103 | 109,698 | ||||||||||||||
|
|
|
|
| ||||||||||||||||
Sub Total | 361,152 | 181,338 | 354,570 | 579,559 | 450,299 | |||||||||||||||
|
|
|
|
| ||||||||||||||||
Derivatives held for trading | ||||||||||||||||||||
Interest rate | (116,208 | ) | (40,243 | ) | 970,825 | 948,426 | 1,090,262 | |||||||||||||
Currency | 707,860 | 886,265 | 4,194,484 | 2,718,568 | 2,524,173 | |||||||||||||||
Stock or stock index | (24,249 | ) | 59,512 | 365,123 | 685,454 | 218,509 | ||||||||||||||
Credit | 2,044 | 259 | 1,107 | — | — | |||||||||||||||
Commodity | (61 | ) | 183 | 2,421 | 486 | 1,336 | ||||||||||||||
Other | 978 | 515 | 3,775 | 20,668 | 20,825 | |||||||||||||||
|
|
|
|
| ||||||||||||||||
Sub Total | 570,364 | 906,491 | 5,537,735 | 4,373,602 | 3,855,105 | |||||||||||||||
|
|
|
|
| ||||||||||||||||
Financial liabilities held for trading | (117,120 | ) | (59,303 | ) | 48,483 | 69,866 | 95,382 | |||||||||||||
|
|
| ||||||||||||||||||
Other financial instruments | (75 | ) | 231 | 1,046 | 48 | 70 | ||||||||||||||
|
|
|
|
| ||||||||||||||||
Total | (Won) | 814,321 | (Won) | 1,028,757 | ₩ | 5,941,834 | ₩ | 5,023,075 | ₩ | 4,400,856 | ||||||||||
|
|
|
|
| ||||||||||||||||
Losses related to financial instruments held for trading | ||||||||||||||||||||
Financial assets held for trading | ||||||||||||||||||||
Debt securities | ₩ | 76,661 | ₩ | 72,078 | ₩ | 118,362 | ||||||||||||||
Equity securities | 96,571 | 70,852 | 81,733 | |||||||||||||||||
|
|
| ||||||||||||||||||
Sub-total | 173,232 | 142,930 | 200,095 | |||||||||||||||||
|
|
| ||||||||||||||||||
Derivatives held for trading | ||||||||||||||||||||
Interest rate | 1,011,068 | 962,738 | 1,076,647 | |||||||||||||||||
Currency | 3,308,219 | 2,274,799 | 2,007,454 | |||||||||||||||||
Stock or stock index | 305,610 | 665,037 | 224,019 | |||||||||||||||||
Credit | 848 | — | — | |||||||||||||||||
Commodity | 2,238 | 506 | 182 | |||||||||||||||||
Other | 3,260 | 14,651 | 2,343 | |||||||||||||||||
|
|
| ||||||||||||||||||
Sub Total | 4,631,243 | 3,917,731 | 3,310,645 | |||||||||||||||||
|
|
| ||||||||||||||||||
Financial liabilities held for trading | 107,786 | 113,929 | 110,114 | |||||||||||||||||
|
|
| ||||||||||||||||||
Other financial instruments | 816 | 35 | 29 | |||||||||||||||||
|
|
| ||||||||||||||||||
Total | ₩ | 4,913,077 | ₩ | 4,174,625 | ₩ | 3,620,883 | ||||||||||||||
|
|
| ||||||||||||||||||
Net gains or losses on financial instruments held for trading | ₩ | 1,028,757 | ₩ | 848,450 | ₩ | 779,973 | ||||||||||||||
|
|
| ||||||||||||||||||
28.229.2 Net gaingains or loss fromlosses on financial instruments designated at fair value through profit or loss
Net gain or loss from financial instruments designated at fair value through profit or loss includes interest income, dividend income and gains or losses arising from changes in the fair values, sales and redemptions. The details for the years ended December 31, 20102011, 2012 and 2011,2013, are as follows:
| For the Year Ended December 31, | 2011 | 2012 | 2013 | |||||||||||||||||
| 2010 | 2011 | (In millions of Korean won) | ||||||||||||||||||
| (In millions of Korean won) | ||||||||||||||||||||
Gains related to financial instruments designated at fair value through profit or loss | ||||||||||||||||||||
Financial assets designated at fair value through profit or loss | (Won) | 487 | (Won) | (50,853 | ) | ₩ | 6,231 | ₩ | 117,213 | ₩ | 23,760 | |||||||||
Financial liabilities designated at fair value through profit or loss | — | 57,963 | 66,126 | 5,230 | 20,846 | |||||||||||||||
|
|
|
|
| ||||||||||||||||
Total | (Won) | 487 | (Won) | 7,110 | 72,357 | 122,443 | 44,606 | |||||||||||||
|
|
|
|
| ||||||||||||||||
Losses related to financial instruments designated at fair value through profit or loss | ||||||||||||||||||||
Financial assets designated at fair value through profit or loss | 57,084 | 6,753 | 14,754 | |||||||||||||||||
Financial liabilities designated at fair value through profit or loss | 8,163 | 152,176 | 53,003 | |||||||||||||||||
|
|
| ||||||||||||||||||
Total | 65,247 | 158,929 | 67,757 | |||||||||||||||||
|
|
| ||||||||||||||||||
Net gains or losses on financial instruments designated at fair value through profit or loss | ₩ | 7,110 | ₩ | (36,486 | ) | ₩ | (23,151 | ) | ||||||||||||
|
|
| ||||||||||||||||||
29.30. Other operating income and expenses
The details of other operating income and expenses for the years ended December 31, 20102011, 2012 and 2011,2013, are as follows:
| For the Year Ended December 31, | ||||||||||||||||||||
| 2010 | 2011 | 2011 | 2012 | 2013 | ||||||||||||||||
| (In millions of Korean won) | (In millions of Korean won) | |||||||||||||||||||
Other operating income | ||||||||||||||||||||
Revenue related to available-for-sale financial assets | ||||||||||||||||||||
Gains on redemption of available-for-sale financial assets | (Won) | 592 | (Won) | 118 | ₩ | 118 | ₩ | 480 | ₩ | 867 | ||||||||||
Gains on sale of available-for-sale financial assets | 178,941 | 551,506 | 551,506 | 149,925 | 189,011 | |||||||||||||||
|
|
|
|
| ||||||||||||||||
Sub Total | 179,533 | 551,624 | ||||||||||||||||||
Sub-total | 551,624 | 150,405 | 189,878 | |||||||||||||||||
|
|
|
|
| ||||||||||||||||
Revenue related to held-to-maturity financial assets | ||||||||||||||||||||
Reversal of impairment on held-to-maturity financial assets | 4 | 117 | ||||||||||||||||||
Reversal of impairment losses on held-to-maturity financial assets | 117 | — | — | |||||||||||||||||
|
|
|
|
| ||||||||||||||||
Sub Total | 4 | 117 | ||||||||||||||||||
Sub-total | 117 | — | — | |||||||||||||||||
|
|
|
|
| ||||||||||||||||
Gains on foreign exchange transactions | 1,980,593 | 1,562,633 | 1,562,633 | 1,093,904 | 1,387,450 | |||||||||||||||
Income related to insurance | 1,064,042 | 1,001,628 | 1,011,089 | 1,730,466 | 1,233,773 | |||||||||||||||
Dividend income | 101,795 | 94,391 | 94,391 | 69,023 | 64,441 | |||||||||||||||
Others | 446,937 | 473,801 | 464,340 | 242,169 | 261,886 | |||||||||||||||
|
|
|
|
| ||||||||||||||||
Sub Total | 3,772,904 | 3,684,194 | ||||||||||||||||||
Sub-total | 3,684,194 | 3,285,967 | 3,137,428 | |||||||||||||||||
|
|
|
|
| ||||||||||||||||
Other operating expenses | ||||||||||||||||||||
Expense related to available-for-sale financial assets | ||||||||||||||||||||
Loss on redemption of available-for-sale financial assets | 46 | 22 | 22 | 11 | 65 | |||||||||||||||
Loss on sale of available-for-sale financial assets | 18,233 | 19,038 | 19,038 | 16,884 | 25,157 | |||||||||||||||
Impairment on available-for-sale financial assets | 48,184 | 51,072 | 51,072 | 280,610 | 163,464 | |||||||||||||||
|
|
|
|
| ||||||||||||||||
Sub Total | 66,463 | 70,132 | ||||||||||||||||||
Sub-total | 70,132 | 297,505 | 188,686 | |||||||||||||||||
|
|
|
|
| ||||||||||||||||
Expense related to held-to-maturity financial assets | ||||||||||||||||||||
Impairment on held-to-maturity financial assets | 523 | 150 | 150 | 154 | 5 | |||||||||||||||
|
|
|
|
| ||||||||||||||||
Sub Total | 523 | 150 | ||||||||||||||||||
Sub-total | 150 | 154 | 5 | |||||||||||||||||
|
|
|
|
| ||||||||||||||||
Loss on foreign exchanges transactions | 2,381,297 | 2,208,390 | 2,208,390 | 1,410,525 | 1,667,335 | |||||||||||||||
Expense related to insurance | 1,091,665 | 1,078,808 | 1,088,357 | 1,822,178 | 1,358,830 | |||||||||||||||
Others | 1,300,299 | 1,418,723 | 1,409,174 | 1,287,547 | 1,227,337 | |||||||||||||||
|
|
|
|
| ||||||||||||||||
Sub Total | 4,840,247 | 4,776,203 | ||||||||||||||||||
Sub-total | 4,776,203 | 4,817,909 | 4,442,193 | |||||||||||||||||
|
|
|
|
| ||||||||||||||||
Net other operating income (expenses) | (Won) | (1,067,343 | ) | (Won) | (1,092,009 | ) | ₩ | (1,092,009 | ) | ₩ | (1,531,942 | ) | ₩ | (1,304,765 | ) | |||||
|
|
|
|
| ||||||||||||||||
30. Employee Benefits31. General and administrative expenses
30.1 The details of employee benefits31.1 General and administrative expenses
The details of employee benefitsgeneral and administrative expenses for the years ended December 31, 20102011, 2012 and 2011,2013, are as follows:
| For the Year Ended December 31, | ||||||||
| 2010 | 2011 | |||||||
| (In millions of Korean won) | ||||||||
Salaries and other short-term employee benefits | (Won) | 1,603,553 | (Won) | 1,657,823 | ||||
Post-employment benefits-defined benefit plans | 151,343 | 204,337 | ||||||
Post-employment benefits-defined contribution plans | 2,767 | 4,005 | ||||||
Termination benefits | 654,039 | 12,308 | ||||||
Share-based payments(1) | (4,850 | ) | (7,609 | ) | ||||
|
|
|
| |||||
Total | (Won) | 2,406,852 | (Won) | 1,870,864 | ||||
|
|
|
| |||||
| 2011(1) | 2012 | 2013 | ||||||||||
| (In millions of Korean won) | ||||||||||||
Employee Benefits | ||||||||||||
Salaries and short-term employee benefits—salaries | ₩ | 1,657,823 | ₩ | 1,598,045 | ₩ | 1,641,326 | ||||||
Salaries and short-term employee benefits—others | 521,894 | 657,473 | 677,107 | |||||||||
Post employment benefits—defined benefit plans | 159,660 | 171,508 | 171,108 | |||||||||
Post employment benefits—defined contribution plans | 4,005 | 5,463 | 7,094 | |||||||||
Termination benefits | 12,308 | (3,960 | ) | 19,714 | ||||||||
Share-based payments(reversal)(2) | (7,609 | ) | 13,871 | 17,289 | ||||||||
|
|
|
|
|
| |||||||
Sub-total | 2,348,081 | 2,442,400 | 2,533,638 | |||||||||
|
|
|
|
|
| |||||||
Depreciation and amortization | 342,493 | 328,152 | 286,756 | |||||||||
|
|
|
|
|
| |||||||
Other general and administrative expenses | ||||||||||||
Rental expense | 255,760 | 276,769 | 290,886 | |||||||||
Tax and dues | 144,716 | 72,111 | 141,274 | |||||||||
Communication | 73,531 | 53,549 | 55,549 | |||||||||
Electricity and utilities | 23,535 | 24,898 | 26,315 | |||||||||
Publication | 23,308 | 20,764 | 19,259 | |||||||||
Repairs and maintenance | 15,576 | 13,426 | 14,615 | |||||||||
Vehicle | 11,392 | 12,114 | 11,816 | |||||||||
Travel | 5,405 | 5,526 | 5,722 | |||||||||
Training | 25,300 | 22,443 | 19,498 | |||||||||
Service fees | 99,706 | 105,972 | 104,210 | |||||||||
Others | 518,328 | 467,486 | 474,026 | |||||||||
|
|
|
|
|
| |||||||
Sub-total | 1,196,557 | 1,075,058 | 1,163,170 | |||||||||
|
|
|
|
|
| |||||||
Total | ₩ | 3,887,131 | ₩ | 3,845,610 | ₩ | 3,983,564 | ||||||
|
|
|
|
|
| |||||||
| (1) | Other general and administrative expenses for the year ended December 31, 2011, reclassified as employee benefits, amount to ₩521,894 million. |
| (2) | Reversal of share-based payments was due to the decrease in share price. |
30.231.2 Share-based payments
30.2.131.2.1 Share options
The details of the share options as of December 31, 2011,2013, are as follows:
| Grant date | Exercise period | Granted shares(1) | Vesting conditions | Grant date | Exercise period | Granted shares(1) | Vesting conditions | |||||||||||||||||||||
| (Years) | (In number of shares) | (Years) | (In number of shares) | |||||||||||||||||||||||||
Series 12 | 2004.02.09 | 8 | 60,000 | Service period: 1 year(4) | ||||||||||||||||||||||||
Series 13-1 | 2004.03.23 | 8 | 20,000 | Service period: 1 year(3) | ||||||||||||||||||||||||
Series 15-1 | 2005.03.18 | 8 | 165,000 | Service period: 3 years(3) | ||||||||||||||||||||||||
Series 15-2 | 2005.03.18 | 8 | 690,000 | Service period: 3 years(4) | ||||||||||||||||||||||||
Series 17 | 2005.07.22 | 8 | 30,000 | Service period: 3 years(4) | ||||||||||||||||||||||||
Series 18 | 2005.08.23 | 8 | 15,000 | Service period: 3 years(4) | ||||||||||||||||||||||||
Series 19 | 2006.03.24 | 8 | 930,000 | Service period: 1, 2, 3 years(2) | 2006.03.24 | 8 | 930,000 | Service period: 1, 2, 3 years(2) | ||||||||||||||||||||
Series 20 | 2006.04.28 | 8 | 30,000 | Service period: 3 years(2) | 2006.04.28 | 8 | 30,000 | Service period: 3 years(2) | ||||||||||||||||||||
Series 21 | 2006.10.27 | 8 | 20,000 | Service period: 2 years(2) | 2006.10.27 | 8 | 20,000 | Service period: 2 years(2) | ||||||||||||||||||||
Series 22 | 2007.02.08 | 8 | 855,000 | Service period: 1, 3 years(2) | 2007.02.08 | 8 | 855,000 | Service period: 1, 3 years(2) | ||||||||||||||||||||
Series 23 | 2007.03.23 | 8 | 30,000 | Service period: 3 years(2) | 2007.03.23 | 8 | 30,000 | Service period: 3 years(2) | ||||||||||||||||||||
|
| |||||||||||||||||||||||||||
Total | 2,845,000 | 1,865,000 | ||||||||||||||||||||||||||
|
| |||||||||||||||||||||||||||
| (1) | Granted shares represent the total number of shares initially granted to directors and employees whose options have not been exercised at the end of the reporting period. |
| (2) | The exercise price is indexed to the sum of the major competitors’ total market capitalization. |
|
|
The changes in the number of granted share options and the weighted average exercise price for the years ended December 31, 20102012 and 2011,2013, are as follows:
| For the Year Ended December 31, 2010 | 2012 | |||||||||||||||||||||||||||||||||||||||||||||||||||
| Number of granted shares | Number of exercisable share | Exercise price per share | Remaining contractual life (Years) | Number of granted shares | Number of exercisable shares | Exercise price per share | Remaining contractual life(Years) | |||||||||||||||||||||||||||||||||||||||||||||
| Beginning | Exercised | Expired | Ending | Beginning | Expired | Ending | ||||||||||||||||||||||||||||||||||||||||||||||
| (In Korean won, except shares) | (In Korean won, except shares) | |||||||||||||||||||||||||||||||||||||||||||||||||||
Series 8-1 | 24,942 | — | 24,942 | — | — | (Won) | — | — | ||||||||||||||||||||||||||||||||||||||||||||
Series 8-2 | 191,831 | 5,000 | 186,831 | — | — | — | — | |||||||||||||||||||||||||||||||||||||||||||||
Series 9 | 23,899 | — | 23,899 | — | — | — | — | |||||||||||||||||||||||||||||||||||||||||||||
Series 10-1 | 40,063 | — | — | 40,063 | 40,063 | 47,360 | 0.22 | |||||||||||||||||||||||||||||||||||||||||||||
Series 10-2 | 67,993 | 16,690 | — | 51,303 | 51,303 | 35,500 | 0.22 | |||||||||||||||||||||||||||||||||||||||||||||
Series 11 | 5,091 | — | — | 5,091 | 5,091 | 40,500 | 0.65 | |||||||||||||||||||||||||||||||||||||||||||||
Series 12 | 54,250 | — | — | 54,250 | 54,250 | 46,100 | 1.11 | 54,250 | 54,250 | — | — | — | — | |||||||||||||||||||||||||||||||||||||||
Series 13-1 | 20,000 | — | — | 20,000 | 20,000 | 48,650 | 1.23 | 20,000 | 20,000 | — | — | — | — | |||||||||||||||||||||||||||||||||||||||
Series 14 | 610,000 | — | 610,000 | — | — | — | — | |||||||||||||||||||||||||||||||||||||||||||||
Series 15-1 | 125,362 | — | — | 125,362 | 125,362 | 54,656 | 2.21 | 125,362 | — | 125,362 | 125,362 | 54,656 | 0.21 | |||||||||||||||||||||||||||||||||||||||
Series 15-2 | 480,714 | — | 29,786 | 450,928 | 450,928 | 46,800 | 2.21 | 440,928 | — | 440,928 | 440,928 | 46,800 | 0.21 | |||||||||||||||||||||||||||||||||||||||
Series 16 | 8,827 | — | — | 8,827 | 8,827 | 45,700 | 2.32 | |||||||||||||||||||||||||||||||||||||||||||||
Series 17 | 29,441 | — | — | 29,441 | 29,441 | 49,200 | 2.56 | 29,441 | — | 29,441 | 29,441 | 49,200 | 0.56 | |||||||||||||||||||||||||||||||||||||||
Series 18 | 7,212 | — | — | 7,212 | 7,212 | 53,000 | 2.65 | 7,212 | — | 7,212 | 7,212 | 53,000 | 0.64 | |||||||||||||||||||||||||||||||||||||||
Series 19 | 751,651 | — | — | 751,651 | 751,651 | 77,063 | 3.23 | 751,651 | — | 751,651 | 751,651 | 77,063 | 1.23 | |||||||||||||||||||||||||||||||||||||||
Series 20 | 25,613 | — | — | 25,613 | 25,613 | 81,900 | 3.33 | 25,613 | — | 25,613 | 25,613 | 81,900 | 1.32 | |||||||||||||||||||||||||||||||||||||||
Series 21 | 18,987 | — | — | 18,987 | 18,987 | 76,600 | 3.82 | 18,987 | — | 18,987 | 18,987 | 76,600 | 1.82 | |||||||||||||||||||||||||||||||||||||||
Series 22 | 696,674 | — | 39,176 | 657,498 | 657,498 | 77,100 | 4.11 | 657,498 | — | 657,498 | 657,498 | 77,100 | 2.11 | |||||||||||||||||||||||||||||||||||||||
Series 23 | 15,246 | — | — | 15,246 | 15,246 | 84,500 | 4.23 | 15,246 | — | 15,246 | 15,246 | 84,500 | 2.22 | |||||||||||||||||||||||||||||||||||||||
Series Kookmin Credit Card -1 | 22,146 | — | — | 22,146 | 22,146 | 71,538 | 0.22 | |||||||||||||||||||||||||||||||||||||||||||||
Series Kookmin Credit Card -2 | 9,990 | — | — | 9,990 | 9,990 | 129,100 | 0.24 | |||||||||||||||||||||||||||||||||||||||||||||
|
|
|
|
|
|
|
|
| ||||||||||||||||||||||||||||||||||||||||||||
Total | 3,229,932 | 21,690 | 914,634 | 2,293,608 | 2,293,608 | 2,146,188 | 74,250 | 2,071,938 | 2,071,938 | |||||||||||||||||||||||||||||||||||||||||||
|
|
|
|
|
|
|
|
| ||||||||||||||||||||||||||||||||||||||||||||
Weighted average exercise price | (Won) | 63,028 | (Won) | 13,163 | (Won) | 18,060 | (Won) | 67,108 | (Won) | 67,108 | ₩ | 68,144 | ₩ | 46,787 | ₩ | 68,909 | ₩ | 68,909 | ||||||||||||||||||||||||||||||||||
The weighted-average share price for share options exercised during the year ended December 31, 2010, was (Won) 53,878.
Series 10-1 Series 10-2 Series 11 Series 12 Series 13-1 Series 15-1 Series 15-2 Series 16 Series 17 Series 18 Series 19 Series 20 Series 21 Series 22 Series 23 Series Kookmin Credit Card -1 Series Kookmin Credit Card -2 Total Weighted average exercise price For the Year Ended December 31, 2011 Number of granted shares Number of
exercisable
share Exercise
price per
share Remaining
contractual
life (Years) Beginning Exercised Expired Ending (In Korean won, except shares) 40,063 23,385 16,678 — — (Won) — — 51,303 51,303 — — — — — 5,091 5,091 — — — — — 54,250 — — 54,250 54,250 46,100 0.11 20,000 — — 20,000 20,000 48,650 0.23 125,362 — — 125,362 125,362 54,656 1.21 450,928 10,000 — 440,928 440,928 46,800 1.21 8,827 8,827 — — — — — 29,441 — — 29,441 29,441 49,200 1.56 7,212 — — 7,212 7,212 53,000 1.65 751,651 — — 751,651 751,651 77,063 2.23 25,613 — — 25,613 25,613 81,900 2.33 18,987 — — 18,987 18,987 76,600 2.82 657,498 — — 657,498 657,498 77,100 3.11 15,246 — — 15,246 15,246 84,500 3.23 22,146 — 22,146 — — — — 9,990 — 9,990 — — — — 2,293,608 98,606 48,814 2,146,188 2,146,188 (Won) 67,108 (Won) 40,630 (Won) 75,058 (Won) 68,144 (Won) 68,144
The weighted-average share price at the date of exercise for share options exercised during the year ended December 31, 2011, is (Won) 57,960.
Series 15-1 Series 15-2 Series 17 Series 18 Series 19 Series 20 Series 21 Series 22 Series 23 Total Weighted average exercise price 2013 Number of granted shares Number of
exercisable
shares Exercise
price per
share Remaining
contractual
life(Years) Beginning Expired Ending (In Korean won, except shares) 125,362 125,362 — — — — 440,928 440,928 — — — — 29,441 29,441 — — — — 7,212 7,212 — — — — 751,651 — 751,651 751,651 77,063 0.23 25,613 — 25,613 25,613 81,900 0.32 18,987 — 18,987 18,987 76,600 0.82 657,498 — 657,498 657,498 77,100 1.11 15,246 — 15,246 15,246 84,500 1.22 2,071,938 602,943 1,468,995 1,468,995 ₩ 68,909 ₩ 48,625 ₩ 77,235 ₩ 77,235
The fair value of each option granted is estimated using a Black-Scholes option pricing model based on the assumptions in the table below:
| Share price | Weighted average exercise price | Expected volatility (%) | Option’s expected life (Years) | Expected dividends | Risk free interest rate (%) | Fair value | ||||||||||||||||||||||
| (In Korean won) | ||||||||||||||||||||||||||||
Series 12 (Directors) | (Won) | 37,500 | (Won) | 46,100 | 20.22 | 0.05 | (Won) | 4 | 3.40 | (Won) | 1 | |||||||||||||||||
Series 12 (Employees) | 37,500 | 46,100 | 20.22 | 0.05 | 4 | 3.40 | 1 | |||||||||||||||||||||
Series 13-1 (Directors) | 37,500 | 48,650 | 38.54 | 0.11 | 8 | 3.40 | 51 | |||||||||||||||||||||
Series 15-1 (Directors) | 37,500 | 54,656 | 47.50 | 0.61 | 44 | 3.40 | 1,564 | |||||||||||||||||||||
Series 15-2 (Directors) | 37,500 | 46,800 | 47.50 | 0.61 | 44 | 3.40 | 2,794 | |||||||||||||||||||||
Series 15-2 (Employees) | 37,500 | 46,800 | 47.50 | 0.61 | 44 | 3.40 | 2,794 | |||||||||||||||||||||
Series 17 (Directors) | 37,500 | 49,200 | 42.94 | 0.78 | 57 | 3.40 | 2,467 | |||||||||||||||||||||
Series 18 (Employees) | 37,500 | 53,000 | 42.92 | 0.21 | 16 | 3.40 | 151 | |||||||||||||||||||||
Series 19 (Directors) | 37,500 | 76,726 | 38.64 | 1.12 | 81 | 3.40 | 424 | |||||||||||||||||||||
Series 19 (Employees) | 37,500 | 77,390 | 42.46 | 0.79 | 58 | 3.40 | 256 | |||||||||||||||||||||
Series 20 (Employees) | 37,500 | 81,900 | 40.71 | 0.89 | 65 | 3.40 | 194 | |||||||||||||||||||||
Series 21 (Employees) | 37,500 | 76,600 | 35.85 | 1.39 | 100 | 3.39 | 523 | |||||||||||||||||||||
Series 22 (Directors) | 37,500 | 77,100 | 52.02 | 0.44 | 33 | 3.40 | 135 | |||||||||||||||||||||
Series 22 (Employees) | 37,500 | 77,100 | 35.01 | 1.67 | 120 | 3.38 | 719 | |||||||||||||||||||||
Series 23 (Non-executive directors) | 37,500 | 84,500 | 48.62 | 0.56 | 41 | 3.40 | 107 | |||||||||||||||||||||
| Share price | Weighted average exercise price | Expected volatility (%) | Option’s expected life (Years) | Expected dividends | Risk free interest rate (%) | |||||||||||||||||||
| (In Korean won) | ||||||||||||||||||||||||
Series 19 (Directors) | ₩ | 40,700 | ₩ | 76,726 | 10.99 | 0.11 | ₩ | 57 | 2.67 | |||||||||||||||
Series 19 (Employees) | 40,700 | 77,390 | 10.99 | 0.11 | 57 | 2.67 | ||||||||||||||||||
Series 20 (Employees) | 40,700 | 81,900 | 15.65 | 0.16 | 81 | 2.67 | ||||||||||||||||||
Series 21 (Employees) | 40,700 | 76,600 | 22.52 | 0.41 | 205 | 2.67 | ||||||||||||||||||
Series 22 (Directors) | 40,700 | 77,100 | 23.67 | 0.55 | 275 | 2.67 | ||||||||||||||||||
Series 22 (Employees) | 40,700 | 77,100 | 27.42 | 0.23 | 116 | 2.67 | ||||||||||||||||||
Series 23 (Non-executive directors) | 40,700 | 84,500 | 22.76 | 0.61 | 304 | 2.67 | ||||||||||||||||||
The option’s expected life is separately estimated for employees and directors using actual historical behavior and projected future behavior to reflect the effects of expected early exercise. Expected volatility is based on the historical volatility of the share price over the most recent period that is generally commensurate with the expected term of the option. To reflect the changes in exercise price which is indexed to the sum of the major competitors’ total market capitalization, cross volatility is used in calculating the expected volatility.
30.2.231.2.2 Share Grants
The Group changed the scheme of share basedshare-based payment from share optionoptions to share grantgrants in November 2007. The share grant award program is an incentive plan that sets, on grant date, the maximum amount of shares that can be awarded. Actual shares granted at the end of the vesting period is determined in accordance with achievement of pre-specified targets over the vesting period.
The details of the share grantgrants as of December 31, 2011,2013, are as follows:
Share grants | Grant date | Number of granted shares | Vesting conditions | |||||||
| (In number of shares) | ||||||||||
(KB Financial Group Inc.) | ||||||||||
Series 1 | 2008.09.29 | 22,557 | Services fulfillment, Achievements of targets on the basis of market and non-market performance(2) | |||||||
Series 2 | 2009.03.27 | 3,090 | Services fulfillment(3) | |||||||
Series 3 | 2010.01.01 | 32,256 | Services fulfillment, Achievements of targets on the basis of market and non-market performance(4),(11) | |||||||
Series 4 | 2010.07.13 | 218,944 | Services fulfillment, Achievements of targets on the basis of market and non-market performance(5),(11) | |||||||
Series 5 | 2010.12.23 | 13,260 | Services fulfillment, Achievements of targets on the basis of market and non-market performance(6),(11) | |||||||
Series 6 | 2011.08.10 | 8,183 | Services fulfillment, Achievements of targets on the basis of market and non-market performance(6),(11) | |||||||
|
| |||||||||
Sub Total | 298,290 | |||||||||
|
| |||||||||
(Kookmin Bank) | ||||||||||
Series 13 | 2008.10.18 | 7,950 | Services fulfillment, Achievements of targets on the basis of market and non-market performance(8),(10),(11) | |||||||
Series 17 | 2009.10.12 | 5,300 | Services fulfillment, Achievements of targets on the basis of market and non-market performance(8),(11) | |||||||
Series 19 | 2010.01.01 | 9,980 | Services fulfillment, Achievements of targets on the basis of market and non-market performance(8),(11),(12) | |||||||
Series 20-1 | 2010.01.08 | 24,746 | Services fulfillment, Achievements of targets on the basis of market and non-market performance(8),(11),(12) | |||||||
Series 20-2 | 2010.01.08 | 105,714 | Services fulfillment, Achievements of targets on the basis of market and non-market performance(8),(11),(12) | |||||||
Series 23 | 2010.07.29 | 73,650 | Services fulfillment, Achievements of targets on the basis of market and non-market performance(7),(11) | |||||||
Series 24 | 2010.08.03 | 57,072 | Services fulfillment, Achievements of targets on the basis of market and non-market performance(8),(11),(12) | |||||||
Series 25 | 2010.08.12 | 18,472 | Services fulfillment, Achievements of targets on the basis of market and non-market performance(7),(11) | |||||||
Series 27 | 2010.09.20 | 8,092 | Services fulfillment, Achievements of targets on the basis of market and non-market performance(8),(11) | |||||||
Share grants | Grant date | Number of granted shares(1) | Vesting conditions | |||||||
| (In number of shares) | ||||||||||
(KB Financial Group Inc.) | ||||||||||
Series 2 | 2009.03.27 | 3,090 | Service fulfillment(2) | |||||||
Series 3 | 2010.01.01 | 32,256 | Services fulfillment, Achievement of targets on the basis of market and non-market performance(3),(8) | |||||||
Series 4 | 2010.07.13 | 218,944 | Services fulfillment, Achievement of targets on the basis of market and non-market performance(4),(8) | |||||||
Series 5 | 2010.12.23 | 13,260 | Services fulfillment, Achievement of targets on the basis of market and non-market performance(5),(8) | |||||||
Series 6 | 2011.08.10 | 8,183 | Services fulfillment, Achievement of targets on the basis of market and non-market performance(5),(8) | |||||||
Series 7 | 2012.01.01 | 42,568 | Services fulfillment, Achievement of targets on the basis of market and non-market performance(3),(8) | |||||||
Series 8 | 2012.01.01 | 59,272 | Services fulfillment, Achievement of targets on the basis of market and non-market performance(3),(8) | |||||||
Series 9 | 2013.07.17 | 94,185 | Services fulfillment, Achievement of targets on the basis of market and non-market performance(3),(8) | |||||||
|
| |||||||||
Sub-Total | 471,758 | |||||||||
|
| |||||||||
(Kookmin Bank) | ||||||||||
Series 32 | 2011.03.24 | 7,986 | Services fulfillment, Achievement of targets on the basis of market and non-market performance(6),(8) | |||||||
Series 33 | 2011.07.07 | 6,025 | Services fulfillment, Achievement of targets on the basis of market and non-market performance(7),(8) | |||||||
Series 34 | 2011.08.10 | 10,242 | Services fulfillment, Achievement of targets on the basis of market and non-market performance(7),(8) | |||||||
Series 36 | 2011.10.18 | 8,596 | Services fulfillment, Achievement of targets on the basis of market and non-market performance(7),(8) | |||||||
Series 37 | 2011.12.23 | 68,310 | Services fulfillment, Achievement of targets on the basis of market and non-market performance(7),(8) | |||||||
Series 38 | 2012.01.01 | 171,100 | Services fulfillment, Non-market performance(7),(8) | |||||||
Series 39 | 2012.01.08 | 18,250 | Services fulfillment, Achievement of targets on the basis of market and non-market performance(7),(8) | |||||||
Series 40 | 2012.08.01 | 9,864 | Services fulfillment, Achievement of targets on the basis of market and non-market performance(7),(8) | |||||||
Series 41 | 2012.08.02 | 37,513 | Services fulfillment, Achievement of targets on the basis of market and non-market performance(7),(8) | |||||||
Series 42 | 2012.09.20 | 8,244 | Services fulfillment, Achievement of targets on the basis of market and non-market performance(7),(8) | |||||||
Series 43 | 2012.11.26 | 13,918 | Services fulfillment, Achievement of targets on the basis of market and non-market performance(7),(8) | |||||||
Series 44 | 2013.01.01 | 17,242 | Services fulfillment, Achievement of targets on the basis of market and non-market performance(7),(8) | |||||||
Series 45 | 2013.01.01 | 77,584 | Services fulfillment, Achievement of targets on the basis of market and non-market performance(7),(8) | |||||||
Series 46 | 2013.01.01 | 120,680 | Services fulfillment, Achievement of targets on the basis of market and non-market performance(7),(8) | |||||||
Series 47 | 2013.07.01 | 10,298 | Services fulfillment, Achievement of targets on the basis of market and non-market performance(7),(8) | |||||||
Series 48 | 2013.07.23 | 74,666 | Services fulfillment, Achievement of targets on the basis of market and non-market performance(7),(8) | |||||||
Series 49 | 2013.07.24 | 109,420 | Services fulfillment, Achievement of targets on the basis of market and non-market performance(7),(8) | |||||||
Series 50 | 2013.07.24 | 82,926 | Services fulfillment, Achievement of targets on the basis of market and non-market performance(7),(8) | |||||||
Series 51 | 2013.07.25 | 9,180 | Services fulfillment, Achievement of targets on the basis of market and non-market performance(7),(8) | |||||||
Series 52 | 2013.08.01 | 10,278 | Services fulfillment, Achievement of targets on the basis of market and non-market performance(7),(8) | |||||||
Grant deferred in 2010 | — | 5,240 | Satisfied | |||||||
Grant deferred in 2011 | — | 17,670 | Satisfied | |||||||
Grant deferred in 2012 | — | 47,892 | Satisfied | |||||||
Grant deferred in 2013 | — | 25,273 | Satisfied | |||||||
|
| |||||||||
Sub-Total | 968,397 | |||||||||
|
| |||||||||
Share grants Vesting conditions Series 28 Services fulfillment, Achievements of targets on the basis of market and non-market performance(8),(11) Series 29 Services fulfillment, Achievements of targets on the basis of market and non-market performance(8),(11) Series 30 Services fulfillment, Achievements of targets on the basis of market and non-market performance(8),(11) Series 31 Services fulfillment, Achievements of targets on the basis of market and non-market performance(8),(11) Series 32 Services fulfillment, Achievements of targets on the basis of non-market performance(9),(11) Series 33 Services fulfillment, Achievements of targets on the basis of market and non-market performance(8),(11) Series 34 Services fulfillment, Achievements of targets on the basis of market and non-market performance(8),(11) Series 35 Services fulfillment, Achievements of targets on the basis of market and non-market performance(8),(11) Series 36 Services fulfillment, Achievements of targets on the basis of market and non-market performance(11),(13) Grant deferred in 2010 Satisfied Grant deferred in 2011 Satisfied Sub Total (Other subsidiaries) Share granted in 2010 Services fulfillment, Achievements of targets on the basis of market and non-market performance(14) Share granted in 2011 Services fulfillment, Achievements of targets on the basis of market and non-market performance(14) Sub Total Total Grant date Number of granted shares (In number of shares) 2010.12.21 68,564 2010.12.23 10,764 2010.12.29 58,168 2011.01.03 16,306 2011.03.24 7,986 2011.07.07 5,736 2011.08.10 10,242 2011.10.12 8,346 2011.10.18 8,106 — 15,496 — 3,589 524,279 33,817 38,931 72,748 895,317
Share grants | Grant date | Number of granted shares(1) | Vesting conditions | |||||
| (In number of shares) | ||||||||
(Other subsidiaries) | ||||||||
Share granted in 2010 | 4,129 | Services fulfillment, Achievement of targets on the basis of market and non-market performance(9) | ||||||
Share granted in 2011 | 38,931 | Services fulfillment, Achievement of targets on the basis of market and non-market performance(9) | ||||||
Share granted in 2012 | 63,976 | Services fulfillment, Achievement of targets on the basis of market and non-market performance(9) | ||||||
Share granted in 2013 | 104,394 | Services fulfillment, Achievement of targets on the basis of market and non-market performance(9) | ||||||
Sub-Total | 211,430 | |||||||
Total | 1,651,585 | |||||||
| (1) | Granted shares represent the total number of shares initially granted to directors and employees at the end of reporting period. |
| (2) |
|
The number of granted shares to be compensated is determined based on fulfillment of service requirements. |
The 30%, 30% and 40% of the number of granted shares to be compensated are determined upon the accomplishment of targeted KPIs, targeted financial results of the Group and targeted relative TSR, respectively. However, 50% of certain granted shares will be compensated based on the accomplishment of targeted KPIs and the remaining 50% of those shares will be compensated based on the accomplishment of targeted relative TSR. |
The 37.5%, 37.5% and 25% of the number of certain granted shares to be compensated are determined based on the accomplishment of targeted relative TSR, targeted relative EPS ratio and qualitative indicators, respectively. The 30%, 30% and 40% of the number of other granted shares to be compensated are determined based on the accomplishment of targeted KPIs, targeted financial results of the Group and targeted relative TSR, respectively. The 40%, 40% and 20% of the number of the remaining granted shares to be compensated are determined based on the accomplishment of the targeted relative EPS ratio, the targeted relative TSR and qualitative indicators, respectively. |
The 40%, 30% and 30% of the number of granted shares to be compensated are determined based on the accomplishment of the targeted relative TSR, the targeted KPIs and the targeted financial results of the Group, respectively. |
The |
The 30%, 30% and 40% of the number of granted shares to be compensated are determined based on the accomplishment of the targeted KPIs, the targeted financial results of |
|
|
|
|
|
Certain portion of the granted shares is compensated over a maximum period of three-years. |
| (9) | The 30%, 30% and 40% of the number of granted shares to be compensated are determined based on the accomplishment of the key performance results, targeted |
The details of share grants linked to short-term performance as of December 31, 2011,2013, are as follows:
| Grant date | Number of vested shares(1) | Vesting conditions | Grant date | Number of vested shares(1) | Vesting conditions | |||||||||||||||
(KB Financial Group Inc.) | ||||||||||||||||||||
Share granted in 2010 | 2010.01.01 | 9,218 | Satisfied | 2010.01.01 | 3,082 | Satisfied | ||||||||||||||
Share granted in 2011 | 2011.01.01 | 21,187 | Proportion to service period | 2011.01.01 | 12,856 | Satisfied | ||||||||||||||
Share granted in 2012 | 2012.01.01 | 22,349 | Satisfied | |||||||||||||||||
Share granted in 2013 | 2013.01.01 | 21,835 | Proportion to service period | |||||||||||||||||
(Kookmin Bank) | ||||||||||||||||||||
Share granted in 2010 | 2010.01.01 | 82,415 | Satisfied | 2010.01.01 | 27,548 | Satisfied | ||||||||||||||
Share granted in 2011 | 2011.01.01 | 165,343 | Proportion to service period | 2011.01.01 | 94,822 | Satisfied | ||||||||||||||
Share granted in 2012 | 2012.01.01 | 155,466 | Satisfied | |||||||||||||||||
Share granted in 2013 | 2013.01.01 | 174,304 | Proportion to service period | |||||||||||||||||
| (1) | The number of shares, which are exercisable, is determined by the results of performance. The share grants are settled over three years. |
Share grants are measured at fair value using the Monte Carlo Simulation Model and assumptions used in determining the fair value are as follows:
| Expected exercise period | Risk free rate | Fair value (Market performance condition) | Fair value (Non-market performance condition) | |||||||||||||
| (Years) | (%) | (In Korean won) | ||||||||||||||
Linked to long term performance |
| |||||||||||||||
(KB Financial Group Inc.) |
| |||||||||||||||
Series 1-2 | — | 3.40 | (Won) | — | (Won) | 37,452 | ||||||||||
Series 1-4 | 0.23 | 3.40 | — | 36,214 | ||||||||||||
Series 2-3 | 0.24 | 3.40 | — | 36,207 | ||||||||||||
Series 3-1 | 0.00~2.00 | 3.40 | 57,407 | 37,452~41,104 | ||||||||||||
Series 3-2 | 0.00~3.00 | 3.40 | — | 37,452~42,634 | ||||||||||||
Series 3-3 | 0.00~2.00 | 3.40 | 57,407 | 37,452~41,104 | ||||||||||||
Series 4-1 | 1.53~5.01 | 3.38 | 14,747 | 42,634~45,738 | ||||||||||||
Series 4-2 | 1.53~5.01 | 3.38 | 15,252 | 42,634~45,738 | ||||||||||||
Series 4-3 | 1.00~4.00 | 3.40 | 8,349 | 36,211~44,159 | ||||||||||||
Series 4-4 | 1.00~4.00 | 3.40 | 8,221 | 36,211~44,159 | ||||||||||||
Series 4-5 | 1.00~4.00 | 3.40 | 4,107 | 36,211~44,159 | ||||||||||||
Series 5-1 | 1.00~4.00 | 3.40 | 5,286 | 36,211~44,159 | ||||||||||||
Series 6-1 | 2.00~5.01 | 3.37 | 19,421 | 36,109~45,738 | ||||||||||||
(Kookmin Bank) | ||||||||||||||||
Series 13 | 1.00~3.00 | 3.40 | 36,339 | 36,339~42,634 | ||||||||||||
Series 17 | 1.00~3.00 | 3.40 | 36,343 | 36,343~42,634 | ||||||||||||
Series 19 | — | 3.40 | — | 36,291 | ||||||||||||
Series 20-1 | 0.02~4.00 | 3.40 | 8,718 | 36,916~44,159 | ||||||||||||
Series 20-2 | 0.02~4.00 | 3.40 | 8,718 | 36,917~44,159 | ||||||||||||
Series 23 | 1.53~4.53 | 3.38 | 21,644 | 36,110~42,520 | ||||||||||||
Series 24 | 0.59~4.00 | 3.40 | 9,086 | 36,222~42,634 | ||||||||||||
Series 25 | 1.53~4.53 | 3.38 | 21,644 | 36,110~42,520 | ||||||||||||
Series 27 | 0.72~4.00 | 3.40 | 5,225 | 36,169~42,634 | ||||||||||||
Series 28 | 1.00~4.00 | 3.40 | 4,609 | 36,211~42,634 | ||||||||||||
Series 29 | 1.00~4.00 | 3.40 | 5,286 | 36,211~42,634 | ||||||||||||
Series 30 | 1.00~4.00 | 3.40 | 5,606 | 36,211~42,634 | ||||||||||||
Series 31 | 1.00~4.00 | 3.40 | 5,623 | 36,211~42,634 | ||||||||||||
Series 32 | 2.23~5.17 | 3.36 | — | 36,302~42,729 | ||||||||||||
Series 33 | 1.50~4.17 | 3.39 | 15,878 | 36,283~42,634 | ||||||||||||
Series 34 | 1.61~4.17 | 3.38 | 18,635 | 36,280~42,634 | ||||||||||||
Series 35 | 2.00~4.17 | 3.37 | 21,198 | 36,109~42,634 | ||||||||||||
Series 36 | 2.00~4.17 | 3.37 | 21,649 | 36,109~42,634 | ||||||||||||
Grant deferred in 2010 | 0.25~3.25 | 3.38 | — | 37,060~42,634 | ||||||||||||
Grant deferred in 2011 | 0.25~3.25 | 3.38 | — | 36,479~42,634 | ||||||||||||
(Other subsidiaries) | ||||||||||||||||
Share granted in 2010 | 1.00~2.17 | 3.36~3.40 | 607~16,958 | 36,132~36,240 | ||||||||||||
Share granted in 2011 | 1.00~2.35 | 3.36~3.40 | 607~18,772 | 36,058~36,240 | ||||||||||||
Linked to short-term performance | ||||||||||||||||
(KB Financial Group Inc.) | ||||||||||||||||
Share granted in 2010 | 0.00~2.00 | 3.49 | — | 40,580~44,631 | ||||||||||||
Share granted in 2011 | 1.00~3.00 | 3.49 | — | 40,580~46,184 | ||||||||||||
(Kookmin Bank) | ||||||||||||||||
Share granted in 2010 | 0.59~2.00 | 3.38 | — | 37,060~41,104 | ||||||||||||
Share granted in 2011 | 0.23~3.00 | 3.38 | — | 36,479~42,634 | ||||||||||||
| Expected exercise period | Risk free rate | Fair value (Market performance condition) | Fair value (Non-market performance condition) | |||||||||||||
| (Years) | (%) | (In Korean won) | ||||||||||||||
Linked to long term performance |
| |||||||||||||||
(KB Financial Group Inc.) | ||||||||||||||||
Series 2-3 | 0.24 | 2.67 | — | 42,113 | ||||||||||||
Series 3-1 | 0.25 | 2.67 | — | 40,662 | ||||||||||||
Series 3-2 | 0.25~1.00 | 2.67 | — | 40,662~42,844 | ||||||||||||
Series 3-3 | 0.25 | 2.67 | — | 40,662 | ||||||||||||
Series 4-1 | 0.53~2.53 | 2.67 | — | 42,562~43,760 | ||||||||||||
Series 4-2 | 0.53~2.53 | 2.67 | — | 42,562~43,760 | ||||||||||||
Series 4-3 | 0.25~2.00 | 2.67 | 37,117 | 37,117~43,343 | ||||||||||||
Series 4-4 | 0.25~2.00 | 2.67 | 37,117 | 40,662~43,343 | ||||||||||||
Series 4-5 | 0.25~2.00 | 2.67 | 37,117 | 40,662~43,343 | ||||||||||||
Series 5-1 | 0.25~1.00 | 2.67 | — | 40,662~42,844 | ||||||||||||
Series 6-1 | 0.25~3.00 | 2.67 | — | 40,429~44,160 | ||||||||||||
Series 7-1 | 0.25~3.00 | 2.67 | — | 40,429~44,160 | ||||||||||||
Series 8-1 | 0.25~3.00 | 2.67 | — | 40,429~44,160 | ||||||||||||
Series 9-1 | 2.00~5.00 | 2.76 | 20,402 | 41,154~45,144 | ||||||||||||
(Kookmin Bank) | ||||||||||||||||
Series 32 | 0.25~2.97 | 2.67 | — | 39,923~44,228 | ||||||||||||
Series 33 | 0.25~3.00 | 2.67 | — | 40,662~44,160 | ||||||||||||
Series 34 | 0.25~3.00 | 2.67 | — | 40,662~44,160 | ||||||||||||
Series 36 | 0.25~3.00 | 2.67 | — | 40,662~44,160 | ||||||||||||
Series 37 | 0.25~3.00 | 2.67 | — | 40,662~44,160 | ||||||||||||
Series 38 | 0.25~3.00 | 2.67 | — | 40,662~44,160 | ||||||||||||
Series 39 | 0.25~3.00 | 2.67 | — | 40,662~44,160 | ||||||||||||
Series 40 | 0.25~3.00 | 2.67 | — | 40,662~44,160 | ||||||||||||
Series 41-1 | 0.58~4.00 | 2.67 | 10,272 | 42,844~44,477 | ||||||||||||
Series 41-2 | 0.25~3.00 | 2.67 | — | 40,662~44,160 | ||||||||||||
Series 42 | 0.25~3.00 | 2.67 | — | 40,662~44,160 | ||||||||||||
Series 43 | 0.90~4.00 | 2.67 | 3,421 | 42,844~44,477 | ||||||||||||
Series 44 | 0.25~3.00 | 2.67 | — | 40,662~44,160 | ||||||||||||
Series 45-1 | 1.00~4.00 | 2.67 | 8,988 | 42,844~44,477 | ||||||||||||
Series 45-2 | 0.25~3.00 | 2.67 | — | 40,662~44,160 | ||||||||||||
Series 46-1 | 1.00~4.00 | 2.67 | 8,988 | 42,844~44,477 | ||||||||||||
Series 46-2 | 0.25~3.00 | 2.67 | — | 40,662~44,160 | ||||||||||||
Series 47 | 0.25~3.00 | 2.67 | — | 40,662~44,160 | ||||||||||||
Series 48 | 1.56~5.00 | 2.72 | 21,274 | 43,343~45,144 | ||||||||||||
Series 49-1 | 1.56~5.00 | 2.72 | 21,255 | 43,343~45,144 | ||||||||||||
Series 49-2 | 0.25~3.00 | 2.67 | 28,655 | 40,662~44,160 | ||||||||||||
Series 50 | 1.56~5.00 | 2.72 | 21,255 | 43,343~45,144 | ||||||||||||
Series 51 | 1.56~5.00 | 2.72 | 21,050 | 43,343~45,144 | ||||||||||||
Series 52 | 1.58~5.00 | 2.73 | 21,307 | 43,343~45,144 | ||||||||||||
Grant deferred in 2010 | 0.25~1.00 | 2.67 | — | 40,662~42,844 | ||||||||||||
Grant deferred in 2011 | 0.25~1.00 | 2.67 | — | 40,662~42,844 | ||||||||||||
Grant deferred in 2012 | 0.25~2.00 | 2.67 | — | 40,662~43,343 | ||||||||||||
Grant deferred in 2013 | 0.45~2.45 | 2.67 | — | 42,492~43,760 | ||||||||||||
(Other subsidiaries) Share granted in 2010 Share granted in 2011 Share granted in 2012 Share granted in 2013 Linked to short term performance (KB Financial Group Inc.) Share granted in 2011 Share granted in 2012 Share granted in 2013 (Kookmin Bank) Share granted in 2011 Share granted in 2012 Share granted in 2013 Expected
exercise
period Risk free
rate Fair value (Market
performance
condition) Fair value
(Non-market
performance
condition) (Years) (%) (In Korean won) 0.25 2.67 — 40,429~42,113 0.25~0.35 2.67 0~10 40,429~42,148 1.00~1.54 2.67~2.72 8,732~18,607 41,418~41,747 0.25~2.75 2.67~2.86 8,990~22,079 34,513~41,747 0.25~1.00 2.67 — 40,662~42,844 0.25~2.00 2.67 — 40,662~43,343 1.00~3.00 2.67 — 42,844~44,160 0.25~1.00 2.67 — 40,662~42,844 0.25~2.00 2.67 — 40,662~43,343 1.00~3.00 2.67 — 40,662~44,160
Expected volatility is based on the historical volatility of the share price over the most recent period that is generally commensurate with the expected term of the grant. And the current stock price as of December 31, 2011,2013, was used for the underlying asset price. Additionally, the average three-year historical dividend rate was used as the expected dividend rate. The Group used the historical data of Kookmin Bank for the period before the Parent Company was incorporated.
As of January 1, 2010, and December 31, 20102012 and 2011,2013, the accrued expenses related to share-based payments including share options and share grants amounted to (Won) 47,896 million, (Won) 38,757₩37,858 million and (Won) 27,236₩48,423 million, respectively, and therespectively. The compensation costs from share options and share grants amountingamounts to (Won) 4,850₩7,609 million were reversed for the year ended December 31, 2010,2011, and the compensation costs amounting to (Won) 7,609₩13,871 million and ₩17,289 million were reversedrecognized as an expense for the yearyears ended December 31, 2011.2012 and 2013, respectively. There is no intrinsic value of the vested share options (January 1, 2010: (Won) 17,571 million, December 31, 2010: (Won) 8,615 million).options.
31.32. Other generalnon-operating income and administrative expenses
The details of other generalnon-operating income and administrative expenses for the years ended December 31, 20102011, 2012 and 2011,2013, are as follows:
| For the Year Ended December 31, | ||||||||
| 2010 | 2011 | |||||||
| (In millions of Korean won) | ||||||||
Welfare expense | (Won) | 569,264 | (Won) | 558,965 | ||||
Rental expense | 248,715 | 255,867 | ||||||
Tax and dues | 141,164 | 145,556 | ||||||
Communication | 49,462 | 73,555 | ||||||
Electricity and utilities | 23,169 | 23,535 | ||||||
Publication | 22,326 | 23,308 | ||||||
Repairs and maintenance | 16,070 | 15,576 | ||||||
Vehicle | 40,710 | 40,882 | ||||||
Travel | 5,000 | 5,405 | ||||||
Training | 20,475 | 25,506 | ||||||
Service fees | 117,002 | 110,814 | ||||||
Others | 358,728 | 439,482 | ||||||
|
|
|
| |||||
Total | (Won) | 1,612,085 | (Won) | 1,718,451 | ||||
|
|
|
| |||||
| 2011 | 2012 | 2013 | ||||||||||
| (In millions of Korean won) | ||||||||||||
Other non-operating income | ||||||||||||
Gains of disposal in property and equipment | ₩ | 313 | ₩ | 5,840 | ₩ | 819 | ||||||
Rent received | 3,678 | 4,349 | 8,615 | |||||||||
Others | 56,580 | 50,666 | 101,848 | |||||||||
|
|
|
|
|
| |||||||
Sub-total | 60,571 | 60,855 | 111,282 | |||||||||
|
|
|
|
|
| |||||||
Other non-operating expenses | ||||||||||||
Losses of disposal in property and equipment | 768 | 426 | 928 | |||||||||
Donation | 77,889 | 80,446 | 59,760 | |||||||||
Restoration cost | 1,981 | 945 | 909 | |||||||||
Others | 122,425 | 97,310 | 61,994 | |||||||||
|
|
|
|
|
| |||||||
Sub-total | 203,063 | 179,127 | 123,591 | |||||||||
|
|
|
|
|
| |||||||
Net other non-operating income(expense) | ₩ | (142,490 | ) | ₩ | (118,272 | ) | ₩ | (12,309 | ) | |||
|
|
|
|
|
| |||||||
32.33. Tax expenseexpenses
Income tax expense for the years ended December 31, 20102011, 2012 and 2011, consists2013, consist of:
| For the Year Ended December 31, | ||||||||||||||||||||
| 2010 | 2011 | 2011 | 2012 | 2013 | ||||||||||||||||
| (In millions of Korean won) | (In millions of Korean won) | |||||||||||||||||||
Tax payable | ||||||||||||||||||||
Current tax expense | (Won) | 233,867 | (Won) | 816,051 | ₩ | 816,051 | ₩ | 695,135 | ₩ | 569,449 | ||||||||||
Adjustments recognized in the period for current tax of prior years | (172,291 | ) | 23,479 | 3,639 | 18,017 | 86,931 | ||||||||||||||
|
|
|
|
| ||||||||||||||||
Sub Total | 61,576 | 839,530 | ||||||||||||||||||
Sub-total | 819,690 | 713,152 | 656,380 | |||||||||||||||||
|
|
|
|
| ||||||||||||||||
Changes in deferred income tax assets (liabilities) | (97,827 | ) | (100,836 | ) | (80,996 | ) | (87,494 | ) | (89,477 | ) | ||||||||||
|
|
|
|
| ||||||||||||||||
Income tax recognized directly in equity | ||||||||||||||||||||
Exchange differences on translating foreign operations | (384 | ) | (11 | ) | ||||||||||||||||
Remeasurements of net defined benefit liabilities | 12,327 | 9,663 | (13,085 | ) | ||||||||||||||||
Change in value of available-for-sale financial assets | (33,618 | ) | 46,303 | 46,303 | (77,956 | ) | 7,942 | |||||||||||||
Change in value of held-to-maturity financial assets | (287 | ) | (249 | ) | (249 | ) | (240 | ) | (1,787 | ) | ||||||||||
Share of other comprehensive income of associates and joint ventures | (1 | ) | 31 | |||||||||||||||||
Share of other comprehensive income of associates | 31 | 390 | 9 | |||||||||||||||||
Cash flow hedges | — | 241 | 241 | 1,025 | (618 | ) | ||||||||||||||
Loss on sales of treasury shares | — | 47,225 | ||||||||||||||||||
Losses on Sale of Treasury Stock | 47,225 | — | — | |||||||||||||||||
Others | — | (29 | ) | — | ||||||||||||||||
|
|
|
|
| ||||||||||||||||
Sub Total | (34,290 | ) | 93,540 | |||||||||||||||||
Sub-total | 105,878 | (67,147 | ) | (7,539 | ) | |||||||||||||||
|
|
|
|
| ||||||||||||||||
Tax expense (income) | (Won) | (70,541 | ) | (Won) | 832,234 | |||||||||||||||
Others | — | — | (7,778 | ) | ||||||||||||||||
|
|
|
|
| ||||||||||||||||
Tax expense | ₩ | 844,572 | ₩ | 558,511 | ₩ | 551,586 | ||||||||||||||
|
|
| ||||||||||||||||||
An analysis of the net profit before income tax and income tax expense for the years ended December 31, 20102011, 2012 and 2011,2013, follows:
| Proportion (%) | For the Year Ended December 31, | |||||||||||||||||||||||
| 2010 | 2011 | 2011 | 2012 | 2013 | ||||||||||||||||||||
| (In millions of Korean won) | (In millions of Korean won) | |||||||||||||||||||||||
Net profit before income tax | (Won) | 149,368 | (Won) | 3,260,806 | ₩ | 3,305,293 | ₩ | 2,298,644 | ₩ | 1,815,291 | ||||||||||||||
|
|
|
|
| ||||||||||||||||||||
Tax at the applicable tax rate(1) | 24.20 | (Won) | 36,121 | (Won) | 789,089 | ₩ | 799,855 | ₩ | 555,810 | ₩ | 438,838 | |||||||||||||
Non-taxable income | (0.44 | ) | (3,681 | ) | (14,325 | ) | (14,325 | ) | (6,291 | ) | (17,716 | ) | ||||||||||||
Non-deductible expense | 0.50 | 9,371 | 16,220 | 16,220 | 13,263 | 33,489 | ||||||||||||||||||
Tax credit and tax exemption | (0.07 | ) | (5,959 | ) | (2,198 | ) | (2,198 | ) | (187 | ) | (1,417 | ) | ||||||||||||
Temporary difference for which no deferred tax is recognized | (0.08 | ) | 61,417 | (2,567 | ) | (2,567 | ) | 1,633 | 47,138 | |||||||||||||||
Deferred tax relating to changes in recognition and measurement | (0.26 | ) | (9,703 | ) | (8,459 | ) | (8,459 | ) | (7,289 | ) | 2,828 | |||||||||||||
Adjustments recognized in the period for the current tax of prior years | 0.72 | (172,291 | ) | 23,479 | ||||||||||||||||||||
Income tax paid(refund) for tax of prior years | 23,479 | (19,870 | ) | 41,322 | ||||||||||||||||||||
Income tax expense of overseas branch | 0.56 | 13,888 | 18,308 | 18,308 | 16,929 | 4,796 | ||||||||||||||||||
Effects from change in tax rate | 0.50 | (1,235 | ) | 16,436 | 18,008 | 941 | (871 | ) | ||||||||||||||||
Others. | (0.11 | ) | 1,531 | (3,749 | ) | |||||||||||||||||||
Others | (3,749 | ) | 3,572 | 3,179 | ||||||||||||||||||||
|
|
|
|
| ||||||||||||||||||||
Tax expense (income) | 25.52 | (Won) | (70,541 | ) | (Won) | 832,234 | ||||||||||||||||||
Tax expense | ₩ | 844,572 | ₩ | 558,511 | ₩ | 551,586 | ||||||||||||||||||
|
|
|
|
| ||||||||||||||||||||
Average effective tax rate (Income tax expense / Profit before tax) (%) | 25.55 | 24.30 | 30.39 | |||||||||||||||||||||
| (1) | Applicable income tax rate for |
The details of current tax liabilities (income tax payables) and current tax assets (income tax refund receivables) before offsetting,and current tax liabilities (income tax payables), as of January 1, 2010, and December 31, 20102012 and 2011,2013, are as follows:
| As of January 1, 2010 | 2012 | |||||||||||||||||||||||
| Tax payables (receivables) before offsetting | Offsetting | Tax payables (receivables) after offsetting | Tax payables (receivables) before offsetting | Offsetting | Tax payables (receivables) after offsetting | |||||||||||||||||||
| (In millions of Korean won) | (In millions of Korean won) | |||||||||||||||||||||||
Income tax refund receivables | (Won) | (169,469 | ) | (Won) | 169,166 | (Won) | (303 | ) | ₩ | (429,676 | ) | ₩ | 415,156 | ₩ | (14,520 | ) | ||||||||
Income tax payables | 268,918 | (169,166 | ) | 99,752 | 679,822 | (415,156 | ) | 264,666 | ||||||||||||||||
| As of December 31, 2010 | ||||||||||||
| Tax payables (receivables) before offsetting | Offsetting | Tax payables (receivables) after offsetting | ||||||||||
| (In millions of Korean won) | ||||||||||||
Income tax refund receivables | (Won) | (320,417 | ) | (Won) | 186,016 | (Won) | (134,401 | ) | ||||
Income tax payables | 215,657 | (186,016 | ) | 29,641 | ||||||||
| As of December 31, 2011 | 2013 | |||||||||||||||||||||||
| Tax payables (receivables) before offsetting | Offsetting | Tax payables (receivables) after offsetting | Tax payables (receivables) before offsetting | Offsetting | Tax payables (receivables) after offsetting | |||||||||||||||||||
| (In millions of Korean won) | (In millions of Korean won) | |||||||||||||||||||||||
Income tax refund receivables | (Won) | (228,579 | ) | (Won) | 216,981 | (Won) | (11,598 | ) | ₩ | (99,524 | ) | ₩ | 82,057 | ₩ | (17,467 | ) | ||||||||
Income tax payables | 805,806 | (216,981 | ) | 588,825 | 293,320 | (82,057 | ) | 211,263 | ||||||||||||||||
33.34. Dividends
The dividends paid to the shareholders of the Parent Company in 20102011, 2012 and 20112013 were (Won)78,897₩41,163 million ((Won)230(₩120 per share), ₩278,173 million (₩720 per share) and (Won)41,163₩231,811 million ((Won)120(₩600 per share), respectively. The dividenddividends to the shareholders of the Parent Company in respect of the year ended December 31, 2011,2013, of (Won) 720₩500 per share, amounting to total dividends of (Won) 278,173₩193,176 million, is to be proposed at the annual general shareholder’s meeting on March 23, 2012.28, 2014. The Group’s consolidated financial statements as of December 31, 2011,2013, do not reflect this dividend payable.
34.35. Accumulated other comprehensive income
The details of accumulated other comprehensive income for the years ended December 31, 20102012 and 2011,2013, are as follows:
| For the Year Ended December 31, 2010 | 2012 | |||||||||||||||||||||||||||||||||||||||
| Beginning | Changes except for reclassification | Reclassification to profit or loss | Tax effect | Ending | Beginning | Changes except for reclassification | Reclassification to profit or loss | Tax effect | Ending | |||||||||||||||||||||||||||||||
| (In millions of Korean won) | (In millions of Korean won) | |||||||||||||||||||||||||||||||||||||||
Remeasurements of net defined benefit liabilities | ₩ | (23,254 | ) | ₩ | (39,916 | ) | ₩ | — | ₩ | 9,663 | ₩ | (53,507 | ) | |||||||||||||||||||||||||||
Exchange differences on translating foreign operations | (Won) | — | (Won) | (6,573 | ) | (Won) | — | (Won) | (384 | ) | (Won) | (6,957 | ) | (1,464 | ) | (25,597 | ) | — | — | (27,061 | ) | |||||||||||||||||||
Change in value of available-for-sale financial assets | 355,312 | 85,292 | 36,403 | (33,618 | ) | 443,389 | 191,752 | 383,043 | (70,485 | ) | (77,956 | ) | 426,354 | |||||||||||||||||||||||||||
Change in value of held-to-maturity financial assets | (2,614 | ) | 807 | (4 | ) | (287 | ) | (2,098 | ) | (1,652 | ) | 671 | (4 | ) | (240 | ) | (1,225 | ) | ||||||||||||||||||||||
Shares of other comprehensive income of associates and joint ventures | (1,757 | ) | (2,004 | ) | — | (1 | ) | (3,762 | ) | |||||||||||||||||||||||||||||||
Shares of other comprehensive income of associates | (3,023 | ) | (44,605 | ) | (48 | ) | 390 | (47,286 | ) | |||||||||||||||||||||||||||||||
Cash flow hedges | (1,320 | ) | (26,838 | ) | 25,000 | 1,025 | (2,133 | ) | ||||||||||||||||||||||||||||||||
|
|
|
|
|
|
|
|
|
| |||||||||||||||||||||||||||||||
Total | (Won) | 350,941 | (Won) | 77,522 | (Won) | 36,399 | (Won) | (34,290 | ) | (Won) | 430,572 | ₩ | 161,039 | ₩ | 246,758 | ₩ | (45,537 | ) | ₩ | (67,118 | ) | ₩ | 295,142 | |||||||||||||||||
|
|
|
|
|
|
|
|
|
| |||||||||||||||||||||||||||||||
| For the Year Ended December 31, 2011 | 2013 | |||||||||||||||||||||||||||||||||||||||
| Beginning | Changes except for reclassification | Reclassification to profit or loss | Tax effect | Ending | Beginning | Changes except for reclassification | Reclassification to profit or loss | Tax effect | Ending | |||||||||||||||||||||||||||||||
| (In millions of Korean won) | (In millions of Korean won) | |||||||||||||||||||||||||||||||||||||||
Remeasurements of net defined benefit liabilities | ₩ | (53,507 | ) | ₩ | 54,069 | ₩ | — | ₩ | (13,085 | ) | ₩ | (12,523 | ) | |||||||||||||||||||||||||||
Exchange differences on translating foreign operations | (Won) | (6,957 | ) | (Won) | 5,503 | (Won) | — | (Won) | (11 | ) | (Won) | (1,465 | ) | (27,061 | ) | (2,372 | ) | — | — | (29,433 | ) | |||||||||||||||||||
Change in value of available-for-sale financial assets | 443,389 | (37,308 | ) | (252,109 | ) | 46,303 | 200,275 | 426,354 | 198,798 | (202,118 | ) | 7,942 | 430,976 | |||||||||||||||||||||||||||
Change in value of held-to-maturity financial assets | (2,098 | ) | 699 | (4 | ) | (249 | ) | (1,652 | ) | (1,225 | ) | 1,005 | 6,911 | (1,787 | ) | 4,904 | ||||||||||||||||||||||||
Shares of other comprehensive income of associates and joint ventures | (3,762 | ) | (464 | ) | — | 31 | (4,195 | ) | ||||||||||||||||||||||||||||||||
Shares of other comprehensive income of associates | (47,286 | ) | (9,765 | ) | (55 | ) | 9 | (57,097 | ) | |||||||||||||||||||||||||||||||
Cash flow hedges | — | 21,631 | (23,193 | ) | 241 | (1,321 | ) | (2,133 | ) | (2,991 | ) | 5,227 | (618 | ) | (515 | ) | ||||||||||||||||||||||||
|
|
|
|
|
|
|
|
|
| |||||||||||||||||||||||||||||||
Total | (Won) | 430,572 | (Won) | (9,939 | ) | (Won) | (275,306 | ) | (Won) | 46,315 | (Won) | 191,642 | ₩ | 295,142 | ₩ | 238,744 | ₩ | (190,035 | ) | ₩ | (7,539 | ) | ₩ | 336,312 | ||||||||||||||||
|
|
|
|
|
|
|
|
|
| |||||||||||||||||||||||||||||||
35.36. Earnings per share
35.136.1 Basic earnings per share
Basic earnings per share is calculated by dividing profit and loss attributable to ordinary equity holders of the Parent Company by the weighted average number of ordinary shares outstanding, excluding the treasury shares, (Note 25), during the years ended December 31, 20102011, 2012 and 2011.2013.
Weighted average number of ordinary shares outstanding:
| For the Year Ended December 31, 2010 | 2011 | |||||||||||||||||||||||
| Number of shares (a) | Days outstanding (b) | Total outstanding shares [(a) x (b)] | Number of shares (a) | Days outstanding (b) | Total outstanding shares [(a) x (b)] | |||||||||||||||||||
| (In number of shares) | (In number of shares) | |||||||||||||||||||||||
Beginning (A) | 386,351,693 | 365 | 141,018,367,945 | 386,351,693 | 365 | 141,018,367,945 | ||||||||||||||||||
Treasury shares (B) | 43,322,704 | 365 | 15,812,786,960 | 43,322,704 | 13 | 563,195,152 | ||||||||||||||||||
| 40,984,474 | 28 | 1,147,565,272 | |||||||||||||||||||||
| 37,463,510 | 42 | 1,573,467,420 | ||||||||||||||||||||||
| 34,966,962 | 105 | 3,671,531,010 | ||||||||||||||||||||||
| ||||||||||||||||||||||||
| 6,955,758,854 | ||||||||||||||||||||||||
| ||||||||||||||||||||||||
Total outstanding shares [(C)=(A)-(B)] | 125,205,580,985 | 134,062,609,091 | ||||||||||||||||||||||
|
| |||||||||||||||||||||||
Weighted average number of ordinary shares outstanding | 343,028,989 | 367,294,819 | ||||||||||||||||||||||
| For the Year Ended December 31, 2011 | ||||||||||||
| Number of shares (a) | Days outstanding (b) | Total outstanding shares [(a) x (b)] | ||||||||||
| (In number of shares) | ||||||||||||
Beginning (A) | 386,351,693 | 365 | 141,018,367,945 | |||||||||
Treasury shares (B) | 43,322,704 | 13 | 563,195,152 | |||||||||
| 40,984,474 | 28 | 1,147,565,272 | ||||||||||
| 37,463,510 | 42 | 1,573,467,420 | ||||||||||
| 34,966,962 | 105 | 3,671,531,010 | ||||||||||
|
| |||||||||||
| 6,955,758,854 | ||||||||||||
|
| |||||||||||
Total outstanding shares [(C)=(A)-(B)] | 134,062,609,091 | |||||||||||
|
| |||||||||||
Weighted average number of ordinary shares outstanding | 367,294,819 | |||||||||||
| 2012 | ||||||||||||
| Number of shares (a) | Days outstanding (b) | Total outstanding shares [(a) x (b)] | ||||||||||
| (In number of shares) | ||||||||||||
Beginning (A) | 386,351,693 | 366 | 141,404,719,638 | |||||||||
|
| |||||||||||
Weighted average number of ordinary shares outstanding | 386,351,693 | |||||||||||
Beginning (A) Weighted average number of ordinary shares outstanding [(D) =(C)/365] 2013 Number of
shares (a) Days
outstanding (b) Total outstanding
shares [(a) x (b)] (In number of shares) 386,351,693 365 141,018,367,945 386,351,693
Basic earnings per share:
| For the Year Ended December 31, | ||||||||
| 2010 | 2011 | |||||||
| (in Korean won and in number of shares) | ||||||||
Profit attributable to ordinary shares (E) | (Won) | 146,600,053,919 | (Won) | 2,373,026,068,477 | ||||
Weighted average number of ordinary shares outstanding (F) | 343,028,989 | 367,294,819 | ||||||
Basic earnings per share [(G)=(E)/(F)] | (Won) | 427 | (Won) | 6,461 | ||||
| 2011 | ||||
| (in Korean won and in number of shares) | ||||
Profit attributable to ordinary shares (C) | ₩ | 2,405,176,343,515 | ||
Weighted average number of ordinary shares outstanding (D) | 367,294,819 | |||
Basic earnings per share [(E)=(C)/(D)] | ₩ | 6,548 | ||
| 2012 | ||||
| (in Korean won and in number of shares) | ||||
Profit attributable to ordinary shares (C) | ₩ | 1,731,033,767,411 | ||
Weighted average number of ordinary shares outstanding (D) | 386,351,693 | |||
Basic earnings per share [(E)=(C)/(D)] | ₩ | 4,480 | ||
| 2013 | ||||
| (in Korean won and in number of shares) | ||||
Profit attributable to ordinary shares (C) | ₩ | 1,260,509,261,925 | ||
Weighted average number of ordinary shares outstanding (D) | 386,351,693 | |||
Basic earnings per share [(E)=(C)/(D)] | ₩ | 3,263 | ||
35.236.2 Diluted earnings per share
Diluted earnings per share is calculated using the weighted average number of ordinary shares outstanding which is adjusted by the weighted average number of additional ordinary shares that would have been outstanding assuming the conversion of all dilutive potential ordinary shares. The Group’s dilutive potential ordinary shares include share grants.
A calculation is done to determine the number of shares that could have been acquired at fair value (determined as the average market share price of the Group’s outstanding shares for the period) based on the monetary value of the subscription rights attached to the share options. The number of shares calculated above is compared with the number of shares that would have been issued assuming the exercise of share grants.
Adjusted profit for diluted earnings per share:
| For the Year Ended December 31, | ||||||||
| 2010 | 2011 | |||||||
| (In Korean won) | ||||||||
Profit attributable to ordinary shares | (Won) | 146,600,053,919 | (Won) | 2,373,026,068,477 | ||||
Adjustment | — | — | ||||||
Adjusted profit for diluted earnings per share | (Won) | 146,600,053,919 | (Won) | 2,373,026,068,477 | ||||
| 2011 | ||||
| (In Korean won) | ||||
Profit attributable to ordinary shares | ₩ | 2,405,176,343,515 | ||
Adjustment | — | |||
Adjusted profit for diluted earnings per share | ₩ | 2,405,176,343,515 | ||
| 2012 | ||||
| (In Korean won) | ||||
Profit attributable to ordinary shares | ₩ | 1,731,033,767,411 | ||
Adjustment | — | |||
Adjusted profit for diluted earnings per share | ₩ | 1,731,033,767,411 | ||
| 2013 | ||||
| (In Korean won) | ||||
Profit attributable to ordinary shares | ₩ | 1,260,509,261,925 | ||
Adjustment | — | |||
Adjusted profit for diluted earnings per share | ₩ | 1,260,509,261,925 | ||
Adjusted weighted average number of ordinary shares outstanding to calculate diluted earnings per share:
| For the Year Ended December 31, | ||||||||||||||||||||
| 2010 | 2011 | 2011 | 2012 | 2013 | ||||||||||||||||
| (in number of shares) | (in number of shares) | |||||||||||||||||||
Weighted average number of ordinary shares outstanding | 343,028,989 | 367,294,819 | 367,294,819 | 386,351,693 | 386,351,693 | |||||||||||||||
Adjustment | ||||||||||||||||||||
Share grants | 415,726 | 884,974 | 884,974 | 1,193,606 | 1,639,306 | |||||||||||||||
Adjusted weighted average number of ordinary shares outstanding for diluted earnings per share | 343,444,715 | 368,179,793 | 368,179,793 | 387,545,299 | 387,990,999 | |||||||||||||||
Diluted earnings per share:
| For the Year Ended December 31, | ||||||||
| 2010 | 2011 | |||||||
| (In Korean won) | ||||||||
Adjusted profit for diluted earnings per share | (Won) | 146,600,053,919 | (Won) | 2,373,026,068,477 | ||||
Adjusted weighted average number of ordinary shares outstanding for diluted earnings per share | 343,444,715 | 368,179,793 | ||||||
Diluted earnings per share | (Won) | 427 | (Won) | 6,445 | ||||
| 2011 | ||||
| (in Korean won and in number of shares) | ||||
Adjusted profit for diluted earnings per share | ₩ | 2,405,176,343,515 | ||
Adjusted weighted average number of ordinary shares outstanding for diluted earnings per share | 368,179,793 | |||
Diluted earnings per share | ₩ | 6,533 | ||
| 2012 | ||||
| (in Korean won and in number of shares) | ||||
Adjusted profit for diluted earnings per share | ₩ | 1,731,033,767,411 | ||
Adjusted weighted average number of ordinary shares outstanding for diluted earnings per share | 387,545,299 | |||
Diluted earnings per share | ₩ | 4,467 | ||
| 2013 | ||||
| (in Korean won and in number of shares) | ||||
Adjusted profit for diluted earnings per share | ₩ | 1,260,509,261,925 | ||
Adjusted weighted average number of ordinary shares outstanding for diluted earnings per share | 387,990,999 | |||
Diluted earnings per share | ₩ | 3,249 | ||
36.37. Insurance Contracts
36.137.1 Insurance liabilities
The details of insurance liabilities presented within other liabilities as of January 1, 2010, and December 31, 20102012 and 2011,2013, are as follows:
| As of January 1, | As of December 31, | |||||||||||||||||||
| 2010 | 2010 | 2011 | 2012 | 2013 | ||||||||||||||||
| (In millions of Korean won) | (In millions of Korean won) | |||||||||||||||||||
Individual insurance | ||||||||||||||||||||
Pure Endowment insurance | (Won) | 1,053,225 | (Won) | 1,640,681 | (Won) | 2,159,534 | ₩ | 3,281,701 | ₩ | 3,861,364 | ||||||||||
Death insurance | 51,646 | 51,166 | 54,008 | 63,821 | 85,123 | |||||||||||||||
Joint insurance | 932,532 | 1,152,599 | 1,301,139 | 1,470,755 | 1,634,590 | |||||||||||||||
Group insurance | 676 | 234 | 266 | 1,285 | 1,339 | |||||||||||||||
Other | 8,615 | 13,496 | 15,407 | 19,604 | 16,627 | |||||||||||||||
|
|
|
|
| ||||||||||||||||
Total | ₩ | 4,837,166 | ₩ | 5,599,043 | ||||||||||||||||
| (Won) | 2,046,694 | (Won) | 2,858,176 | (Won) | 3,530,354 |
|
| |||||||||||||
|
|
| ||||||||||||||||||
The changes in insurance liabilities for the years ended December 31, 20102012 and 2011,2013, are as follows:
| For the Year Ended December 31, 2010 | 2012 | |||||||||||||||||||||||||||||||||||||||||||||||
| Individual insurance | Group insurance | Other(1) | Total | Individual insurance | Group insurance | Others(1) | Total | |||||||||||||||||||||||||||||||||||||||||
| Pure endowment insurance | Death insurance | Joint insurance | Pure Endowment insurance | Death insurance | Joint insurance | |||||||||||||||||||||||||||||||||||||||||||
| (In millions of Korean won) | (In millions of Korean won) | |||||||||||||||||||||||||||||||||||||||||||||||
Beginning | (Won) | 1,053,225 | (Won) | 51,646 | (Won) | 932,532 | (Won) | 676 | (Won) | 8,615 | (Won) | 2,046,694 | ₩ | 2,159,534 | ₩ | 54,008 | ₩ | 1,301,139 | ₩ | 266 | ₩ | 16,489 | ₩ | 3,531,436 | ||||||||||||||||||||||||
Provision (Reversal) | 587,456 | (480 | ) | 220,067 | (442 | ) | 4,881 | 811,482 | ||||||||||||||||||||||||||||||||||||||||
Provision | 1,122,167 | 9,813 | 169,616 | 1,019 | 3,115 | 1,305,730 | ||||||||||||||||||||||||||||||||||||||||||
|
|
|
|
|
|
|
|
|
|
|
| |||||||||||||||||||||||||||||||||||||
Ending | (Won) | 1,640,681 | (Won) | 51,166 | (Won) | 1,152,599 | (Won) | 234 | (Won) | 13,496 | (Won) | 2,858,176 | ₩ | 3,281,701 | ₩ | 63,821 | ₩ | 1,470,755 | ₩ | 1,285 | ₩ | 19,604 | ₩ | 4,837,166 | ||||||||||||||||||||||||
|
|
|
|
|
|
|
|
|
|
|
| |||||||||||||||||||||||||||||||||||||
| For the Year Ended December 31, 2011 | 2013 | |||||||||||||||||||||||||||||||||||||||||||||||
| Individual insurance | Group insurance | Other(1) | Total | Individual insurance | Group insurance | Others(1) | Total | |||||||||||||||||||||||||||||||||||||||||
| Pure endowment insurance | Death insurance | Joint insurance | Pure Endowment insurance | Death insurance | Joint insurance | |||||||||||||||||||||||||||||||||||||||||||
| (In millions of Korean won) | (In millions of Korean won) | |||||||||||||||||||||||||||||||||||||||||||||||
Beginning | (Won) | 1,640,681 | (Won) | 51,166 | (Won) | 1,152,599 | (Won) | 234 | (Won) | 13,496 | (Won) | 2,858,176 | ₩ | 3,281,701 | ₩ | 63,821 | ₩ | 1,470,755 | ₩ | 1,285 | ₩ | 19,604 | ₩ | 4,837,166 | ||||||||||||||||||||||||
Provision | 518,853 | 2,842 | 148,540 | 32 | 1,911 | 672,178 | 579,663 | 21,302 | 163,835 | 54 | (2,977 | ) | 761,877 | |||||||||||||||||||||||||||||||||||
|
|
|
|
|
|
|
|
|
|
|
| |||||||||||||||||||||||||||||||||||||
Ending | (Won) | 2,159,534 | (Won) | 54,008 | (Won) | 1,301,139 | (Won) | 266 | (Won) | 15,407 | (Won) | 3,530,354 | ₩ | 3,861,364 | ₩ | 85,123 | ₩ | 1,634,590 | ₩ | 1,339 | ₩ | 16,627 | ₩ | 5,599,043 | ||||||||||||||||||||||||
|
|
|
|
|
|
|
|
|
|
|
| |||||||||||||||||||||||||||||||||||||
| (1) |
|
36.2 Insurance-related37.2 Insurance assets
The details of insurance-relatedinsurance assets presented within other assets as of January 1, 2010, and December 31, 20102012 and 2011,2013, are as follows:
| As of January 1, | As of December 31, | |||||||||||||||||||
| 2010 | 2010 | 2011 | 2012 | 2013 | ||||||||||||||||
| (In millions of Korean won) | (In millions of Korean won) | |||||||||||||||||||
Reinsurance assets | (Won) | 806 | (Won) | 690 | (Won) | 1,064 | ₩ | 3,751 | ₩ | 5,245 | ||||||||||
Deferred acquisition costs | 38,580 | 71,407 | 126,304 | 151,925 | 151,909 | |||||||||||||||
|
|
|
|
| ||||||||||||||||
Total | (Won) | 39,386 | (Won) | 72,097 | (Won) | 127,368 | ₩ | 155,676 | ₩ | 157,154 | ||||||||||
|
|
|
|
| ||||||||||||||||
The changes in reinsurance assets for the years ended December 31, 20102012 and 2011,2013, are as follows:
| For the Year Ended December 31, | ||||||||||||||||
| 2010 | 2011 | 2012 | 2013 | |||||||||||||
| (In millions of Korean won) | (In millions of Korean won) | |||||||||||||||
Beginning | (Won) | 806 | (Won) | 690 | ₩ | 2,146 | ₩ | 3,751 | ||||||||
Increase (decrease) | (116 | ) | 374 | 1,605 | 1,494 | |||||||||||
|
|
|
| |||||||||||||
Ending | (Won) | 690 | (Won) | 1,064 | ₩ | 3,751 | ₩ | 5,245 | ||||||||
|
|
|
| |||||||||||||
The changes in deferred acquisition costs for the years ended December 31, 20102012 and 2011,2013, are as follows:
| For the Year Ended December 31, | ||||||||||||||||
| 2010 | 2011 | 2012 | 2013 | |||||||||||||
| (In millions of Korean won) | (In millions of Korean won) | |||||||||||||||
Beginning | (Won) | 38,580 | (Won) | 71,407 | ₩ | 126,304 | ₩ | 151,925 | ||||||||
Increase (decrease) | 59,026 | 102,476 | ||||||||||||||
Increase | 106,959 | 102,702 | ||||||||||||||
Amortization | (26,199 | ) | (47,579 | ) | (81,338 | ) | (102,718 | ) | ||||||||
|
|
|
| |||||||||||||
Ending | (Won) | 71,407 | (Won) | 126,304 | ₩ | 151,925 | ₩ | 151,909 | ||||||||
|
|
|
| |||||||||||||
36.337.3 Insurance premiums and reinsurance
The details of insurance premiums for the years ended December 31, 20102011, 2012 and 2011,2013, are as follows:
| For the Year Ended December 31, 2010 | 2011 | |||||||||||||||||||||||||||||||||||||||||||
| Pure endowment insurance | Death insurance | Joint insurance | Group insurance | Total | Pure endowment insurance | Death insurance | Joint insurance | Group insurance | Others | Total | ||||||||||||||||||||||||||||||||||
| (In millions of Korean won) | (In millions of Korean won) | |||||||||||||||||||||||||||||||||||||||||||
Insurance premiums earned | (Won) | 691,158 | (Won) | 4,100 | (Won) | 365,980 | (Won) | 1,489 | (Won) | 1,062,727 | ₩ | 651,281 | ₩ | 7,073 | ₩ | 339,204 | ₩ | 1,640 | ₩ | 8,173 | ₩ | 1,007,371 | ||||||||||||||||||||||
Reinsurance premiums paid | (328 | ) | (738 | ) | (144 | ) | (322 | ) | (1,532 | ) | (333 | ) | (773 | ) | (161 | ) | (1,373 | ) | (2,056 | ) | (4,696 | ) | ||||||||||||||||||||||
|
|
|
|
|
|
|
|
|
|
| ||||||||||||||||||||||||||||||||||
Net premiums earned | (Won) | 690,830 | (Won) | 3,362 | (Won) | 365,836 | (Won) | 1,167 | (Won) | 1,061,195 | ₩ | 650,948 | ₩ | 6,300 | ₩ | 339,043 | ₩ | 267 | ₩ | 6,117 | ₩ | 1,002,675 | ||||||||||||||||||||||
|
|
|
|
|
|
|
|
|
|
| ||||||||||||||||||||||||||||||||||
| For the Year Ended December 31, 2011 | 2012 | |||||||||||||||||||||||||||||||||||||||||||
| Pure endowment insurance | Death insurance | Joint insurance | Group insurance | Total | Pure endowment insurance | Death insurance | Joint insurance | Group insurance | Others | Total | ||||||||||||||||||||||||||||||||||
| (In millions of Korean won) | (In millions of Korean won) | |||||||||||||||||||||||||||||||||||||||||||
Insurance premiums earned | (Won) | 651,281 | (Won) | 7,073 | (Won) | 339,204 | (Won) | 1,640 | (Won) | 999,198 | ₩ | 1,307,974 | ₩ | 19,547 | ₩ | 352,482 | ₩ | 3,967 | ₩ | 39,081 | ₩ | 1,723,051 | ||||||||||||||||||||||
Reinsurance premiums paid | (333 | ) | (773 | ) | (161 | ) | (1,373 | ) | (2,640 | ) | (196 | ) | (2,637 | ) | (133 | ) | (892 | ) | (8,354 | ) | (12,212 | ) | ||||||||||||||||||||||
|
|
|
|
|
|
|
|
|
|
| ||||||||||||||||||||||||||||||||||
Net premiums earned | (Won) | 650,948 | (Won) | 6,300 | (Won) | 339,043 | (Won) | 267 | (Won) | 996,558 | ₩ | 1,307,778 | ₩ | 16,910 | ₩ | 352,349 | ₩ | 3,075 | ₩ | 30,727 | ₩ | 1,710,839 | ||||||||||||||||||||||
|
|
|
|
|
|
|
|
|
|
| ||||||||||||||||||||||||||||||||||
Insurance premiums earned Reinsurance premiums paid Net premiums earned 2013 Pure endowment
insurance Death
insurance Joint
insurance Group
insurance Others Total (In millions of Korean won) ₩ 795,031 ₩ 41,389 ₩ 336,540 ₩ 5,019 ₩ 42,474 ₩ 1,220,453 (480 ) (3,854 ) (278 ) (2,177 ) (7,302 ) (14,091 ) ₩ 794,551 ₩ 37,535 ₩ 336,262 ₩ 2,842 ₩ 35,172 ₩ 1,206,362
The details of reinsurance transactions for the years ended December 31, 20102011, 2012 and 2010,2013, are as follows:
| For the Year Ended December 31, 2010 | 2011 | |||||||||||||||||||||||||||||||
| Reinsurance expense | Reinsurance revenue | Reinsurance expense | Reinsurance revenue | |||||||||||||||||||||||||||||
| Reinsurance premium paid | Reinsurance claims | Reinsurance commission | Total | Reinsurance premium paid | Reinsurance claims | Reinsurance commission | Total | |||||||||||||||||||||||||
| (In millions of Korean won) | (In millions of Korean won) | |||||||||||||||||||||||||||||||
Individual | (Won) | 1,210 | (Won) | 661 | (Won) | 294 | (Won) | 955 | ₩ | 1,268 | ₩ | 623 | ₩ | 674 | ₩ | 1,297 | ||||||||||||||||
Group | 322 | 360 | — | 360 | 1,372 | 1,133 | — | 1,133 | ||||||||||||||||||||||||
Others | 2,056 | 1,288 | — | 1,288 | ||||||||||||||||||||||||||||
|
|
|
|
|
|
|
| |||||||||||||||||||||||||
Total | (Won) | 1,532 | (Won) | 1,021 | (Won) | 294 | (Won) | 1,315 | ₩ | 4,696 | ₩ | 3,044 | ₩ | 674 | ₩ | 3,718 | ||||||||||||||||
|
|
|
|
|
|
|
| |||||||||||||||||||||||||
| For the Year Ended December 31, 2011 | 2012 | |||||||||||||||||||||||||||||||
| Reinsurance expense | Reinsurance revenue | Reinsurance expense | Reinsurance revenue | |||||||||||||||||||||||||||||
| Reinsurance premium paid | Reinsurance claims | Reinsurance commission | Total | Reinsurance premium paid | Reinsurance claims | Reinsurance commission | Total | |||||||||||||||||||||||||
| (In millions of Korean won) | (In millions of Korean won) | |||||||||||||||||||||||||||||||
Individual | (Won) | 1,268 | (Won) | 623 | (Won) | 674 | (Won) | 1,297 | ₩ | 2,966 | ₩ | 1,150 | ₩ | 1,000 | ₩ | 2,150 | ||||||||||||||||
Group | 1,372 | 1,133 | — | 1,133 | 892 | 1,138 | — | 1,138 | ||||||||||||||||||||||||
Others | 8,354 | 4,127 | — | 4,127 | ||||||||||||||||||||||||||||
|
|
|
|
|
|
|
| |||||||||||||||||||||||||
Total | (Won) | 2,640 | (Won) | 1,756 | (Won) | 674 | (Won) | 2,430 | ₩ | 12,212 | ₩ | 6,415 | ₩ | 1,000 | ₩ | 7,415 | ||||||||||||||||
|
|
|
|
|
|
|
| |||||||||||||||||||||||||
Individual Group Others Total 2013 Reinsurance expense Reinsurance revenue Reinsurance premium paid Reinsurance claims Reinsurance commission Total (In millions of Korean won) ₩ 4,612 ₩ 3,850 ₩ 466 ₩ 4,316 2,177 2,124 220 2,344 7,302 6,660 — 6,660 ₩ 14,091 ₩ 12,634 ₩ 686 ₩ 13,320
Insurance expenses for the years ended December 31, 20102011, 2012 and 2010,2013, are as follows:
| For the Year Ended December 31, 2010 | 2011 | |||||||||||||||||||||||||||||||||||||||||||
| Pure Endowment insurance | Death insurance | Joint insurance | Group insurance | Total | Pure endowment insurance | Death insurance | Joint insurance | Group insurance | Others | Total | ||||||||||||||||||||||||||||||||||
| (In millions of Korean won) | (In millions of Korean won) | |||||||||||||||||||||||||||||||||||||||||||
Insurance expense | (Won) | 1,440 | (Won) | 883 | (Won) | 36,807 | (Won) | 990 | (Won) | 40,120 | ₩ | 2,010 | ₩ | 670 | ₩ | 25,201 | ₩ | 1,663 | ₩ | 206 | ₩ | 29,750 | ||||||||||||||||||||||
Dividend expense | 21 | 10 | — | — | 31 | 73 | 11 | 1 | — | — | 85 | |||||||||||||||||||||||||||||||||
Refund expense | 107,470 | 4,105 | 116,767 | 182 | 228,524 | 150,627 | 3,565 | 171,090 | 276 | — | 325,558 | |||||||||||||||||||||||||||||||||
Provision(Reversal) | 594,632 | (2,714 | ) | 220,008 | (443 | ) | 811,483 | |||||||||||||||||||||||||||||||||||||
Provision | 518,853 | 2,842 | 148,540 | 32 | 2,993 | 673,260 | ||||||||||||||||||||||||||||||||||||||
|
|
|
|
|
|
|
|
|
|
| ||||||||||||||||||||||||||||||||||
Sub-total | 703,563 | 2,284 | 373,582 | 729 | 1,080,158 | 671,563 | 7,088 | 344,832 | 1,971 | 3,199 | 1,028,653 | |||||||||||||||||||||||||||||||||
|
|
|
|
|
|
|
|
|
|
| ||||||||||||||||||||||||||||||||||
Reinsurance claims | 157 | 443 | 61 | 360 | 1,021 | (106 | ) | (433 | ) | (84 | ) | (1,133 | ) | (1,288 | ) | (3,044 | ) | |||||||||||||||||||||||||||
|
|
|
|
|
|
|
|
|
|
| ||||||||||||||||||||||||||||||||||
Net insurance expense | (Won) | 703,406 | (Won) | 1,841 | (Won) | 373,521 | (Won) | 369 | (Won) | 1,079,137 | ₩ | 671,457 | ₩ | 6,655 | ₩ | 344,748 | ₩ | 838 | ₩ | 1,911 | ₩ | 1,025,609 | ||||||||||||||||||||||
|
|
|
|
|
|
|
|
|
|
| ||||||||||||||||||||||||||||||||||
| For the Year Ended December 31, 2011 | 2012 | |||||||||||||||||||||||||||||||||||||||||||
| Pure Endowment insurance | Death insurance | Joint insurance | Group insurance | Total | Pure endowment insurance | Death insurance | Joint insurance | Group insurance | Others | Total | ||||||||||||||||||||||||||||||||||
| (In millions of Korean won) | (In millions of Korean won) | |||||||||||||||||||||||||||||||||||||||||||
Insurance expense | (Won) | 2,010 | (Won) | 670 | (Won) | 25,201 | (Won) | 1,663 | (Won) | 29,544 | ₩ | 2,659 | ₩ | 1,637 | ₩ | 6,232 | ₩ | 2,775 | ₩ | 2,423 | ₩ | 15,726 | ||||||||||||||||||||||
Dividend expense | 73 | 11 | 1 | — | 85 | 154 | 12 | — | — | — | 166 | |||||||||||||||||||||||||||||||||
Refund expense | 150,627 | 3,565 | 171,090 | 276 | 325,558 | 202,965 | 4,043 | 183,061 | 215 | — | 390,284 | |||||||||||||||||||||||||||||||||
Provision | 521,055 | 2,557 | 148,533 | 32 | 672,177 | 1,122,167 | 9,813 | 169,616 | 1,019 | 3,115 | 1,305,730 | |||||||||||||||||||||||||||||||||
|
|
|
|
|
|
|
|
|
|
| ||||||||||||||||||||||||||||||||||
Sub-total | 673,765 | 6,803 | 344,825 | 1,971 | 1,027,364 | 1,327,945 | 15,505 | 358,909 | 4,009 | 5,538 | 1,711,906 | |||||||||||||||||||||||||||||||||
|
|
|
|
|
|
|
|
|
|
| ||||||||||||||||||||||||||||||||||
Reinsurance claims | 106 | 433 | 84 | 1,133 | 1,756 | (184 | ) | (898 | ) | (68 | ) | (1,138 | ) | (4,127 | ) | (6,415 | ) | |||||||||||||||||||||||||||
|
|
|
|
|
|
|
|
|
|
| ||||||||||||||||||||||||||||||||||
Net insurance expense | (Won) | 673,659 | (Won) | 6,370 | (Won) | 344,741 | (Won) | 838 | (Won) | 1,025,608 | ₩ | 1,327,761 | ₩ | 14,607 | ₩ | 358,841 | ₩ | 2,871 | ₩ | 1,411 | ₩ | 1,705,491 | ||||||||||||||||||||||
|
|
|
|
|
|
|
|
|
|
| ||||||||||||||||||||||||||||||||||
| 2013 | ||||||||||||||||||||||||
| Pure endowment insurance | Death insurance | Joint insurance | Group insurance | Others | Total | |||||||||||||||||||
| (In millions of Korean won) | ||||||||||||||||||||||||
Insurance expense | ₩ | 6,557 | ₩ | 2,287 | ₩ | 1,085 | ₩ | 4,922 | ₩ | 5,645 | ₩ | 20,496 | ||||||||||||
Dividend expense | 295 | 13 | — | — | — | 308 | ||||||||||||||||||
Refund expense | 259,710 | 5,257 | 185,286 | 351 | — | 450,604 | ||||||||||||||||||
Provision | 579,663 | 21,302 | 163,835 | 54 | (2,977 | ) | 761,877 | |||||||||||||||||
|
|
|
|
|
|
|
|
|
|
|
| |||||||||||||
Sub-total | 846,225 | 28,859 | 350,206 | 5,327 | 2,668 | 1,233,285 | ||||||||||||||||||
|
|
|
|
|
|
|
|
|
|
|
| |||||||||||||
Reinsurance claims | (204 | ) | (3,592 | ) | (54 | ) | (2,124 | ) | (6,660 | ) | (12,634 | ) | ||||||||||||
|
|
|
|
|
|
|
|
|
|
|
| |||||||||||||
Net insurance expense | ₩ | 846,021 | ₩ | 25,267 | ₩ | 350,152 | ₩ | 3,203 | ₩ | (3,992 | ) | ₩ | 1,220,651 | |||||||||||
|
|
|
|
|
|
|
|
|
|
|
| |||||||||||||
36.437.4 Insurance risk
Summary of insurance risk
Insurance risk is the risk of loss arising from the actual risk at the time of claims exceeding the estimated risk at the time of underwriting. Insurance risk is classified by insurance price risk and policy reserve risk.
Insurance price risk is the risk of loss arising from differences between premiums from policyholders and actual claims paid.
Policy reserve risk is the risk of loss arising from differences between policy reserves the Group holds and actual claims to be paid.
Concentration of insurance risk and reinsurance policy
The Group uses reinsurance with the intent to expand the ability of underwriting insurance contracts through mitigating the exposure to insurance risk, and generates synergy by joint development of products, management discipline and collecting information on foreign markets.
The Group cedes reinsurance for mortality, illness and other risks arising from insurance contracts where the Group has little experience for a necessary period of time required to accumulate experience.
The Group’s Reinsurance is ceded through the following process:
i. In the decision-making process of launching a new product, the Group makes a decision on ceding reinsurance. Subsequently, a reinsurer is selected through bidding, agreements with the relevant departments and final approval by of the executive management.
ii. The reinsurance department analysesanalyzes the object of reinsurance, the maximum limit of reinsurance and the loss ratio with the relevant departments.
The characteristic and exposure of insurance price risk
The insurance risk of a life insurance company is measured by insurance price risk. As the life insurance coverage is in the form of a fixed payment, the fluctuation of policy reserve is small and the period from insured event to claims payment is not long, the policy reserve risk is managed by assessments of adequacy of the policy reserve.
The Group measures the exposure of insurance price risk as the shortfall of the risk premiums received compared to the claims paid on all insurance contracts for the last one year from the end of12 months preceding the reporting period.date.
The maximum exposure of premium risk before mitigating risk by reinsurance as of January 1, 2010, and December 31, 20102012 and 2011, are as2013, follows:
| As of January 1, 2010 | ||||||||
| Risk premium | Claims paid | |||||||
| (In millions of Korean won) | ||||||||
Protection insurance | (Won) | 1,610 | (Won) | 2,296 | ||||
Sickness insurance | 3,052 | 1,872 | ||||||
Other life insurance | 1,899 | 760 | ||||||
|
|
|
| |||||
Total | (Won) | 6,561 | (Won) | 4,928 | ||||
|
|
|
| |||||
| 2012 | ||||||||
| Before reinsurance mitigation | After reinsurance mitigation | |||||||
| (In millions of Korean won) | ||||||||
Mortality | ₩ | 8,016 | ₩ | 5,905 | ||||
Disability | 509 | 176 | ||||||
Hospitalization | 821 | 507 | ||||||
Operation and diagnosis | 1,914 | 911 | ||||||
Actual losses for medical expense | 121 | 43 | ||||||
Other | 86 | 66 | ||||||
|
|
|
| |||||
Total | ₩ | 11,467 | ₩ | 7,608 | ||||
|
|
|
| |||||
Protection insurance Sickness insurance Other life insurance Total Mortality Disability Hospitalization Operation and diagnosis Actual losses for medical expense Other Total As of December 31, 2010 Risk premium Claims paid (In millions of Korean won) (Won) 2,200 (Won) 1,995 2,029 1,429 2,318 898 (Won) 6,547 (Won) 4,322 2013 Before
reinsurance
mitigation After
reinsurance
mitigation (In millions of Korean won) ₩ 10,969 ₩ 5,431 660 370 861 600 1,731 1,164 243 132 89 68 ₩ 14,553 ₩ 7,765
| As of December 31, 2011 | ||||||||
| Risk premium | Claims paid | |||||||
| (In millions of Korean won) | ||||||||
Protection insurance | (Won) | 1,612 | (Won) | 2,666 | ||||
Sickness insurance | 3,121 | 1,288 | ||||||
Other life insurance | 2,973 | 966 | ||||||
|
|
|
| |||||
Total | (Won) | 7,706 | (Won) | 4,920 | ||||
|
|
|
| |||||
TheAverage ratios of claims paid per risk premium received on the basis of exposure of premium risk after mitigating risk by reinsurancebefore mitigation for the past three years as of January 1, 2010, and December 31, 20102012 and 2011, are as follows:2013, were 68% and 69%, respectively.
| As of January 1, 2010 | ||||||||
| Risk premium | Claims paid | |||||||
| (In millions of Korean won) | ||||||||
Protection insurance | (Won) | 908 | (Won) | 2,178 | ||||
Sickness insurance | 2,055 | 582 | ||||||
Other life insurance | 1,430 | 221 | ||||||
|
|
|
| |||||
Total | (Won) | 4,393 | (Won) | 2,981 | ||||
|
|
|
| |||||
| As of December 31, 2010 | ||||||||
| Risk premium | Claims paid | |||||||
| (In millions of Korean won) | ||||||||
Protection insurance | (Won) | 1,968 | (Won) | 1,787 | ||||
Sickness insurance | 1,298 | 889 | ||||||
Other life insurance | 1,749 | 624 | ||||||
|
|
|
| |||||
Total | (Won) | 5,015 | (Won) | 3,300 | ||||
|
|
|
| |||||
| As of December 31, 2011 | ||||||||
| Risk premium | Claims paid | |||||||
| (In millions of Korean won) | ||||||||
Protection insurance | (Won) | 1,077 | (Won) | 2,100 | ||||
Sickness insurance | 1,538 | 300 | ||||||
Other life insurance | 2,452 | 764 | ||||||
|
|
|
| |||||
Total | (Won) | 5,067 | (Won) | 3,164 | ||||
|
|
|
| |||||
The exposure of market risk arising from embedded derivatives included in host insurance contracts as of January 1, 2010, and December 31, 20102012 and 2011,2013, are as follows:
| As of January 1, | As of December 31, | |||||||||||
| 2010 | 2010 | 2011 | ||||||||||
| (In millions of Korean won) | ||||||||||||
Variable annuity policyholders reserve | (Won) | 250,689 | (Won) | 370,763 | (Won) | 459,174 | ||||||
Variable universal policyholders reserve | 22,404 | 39,189 | 70,533 | |||||||||
Variable annuity guarantee reserve | 1,385 | 2,980 | 3,444 | |||||||||
Variable universal guarantee reserve | 148 | 324 | 35 | |||||||||
| 2012 | 2013 | |||||||||||||||
| Policy holders reserve | Guarantee reserve | Policy holders reserve | Guarantee reserve | |||||||||||||
| (In millions of Korean won) | ||||||||||||||||
Variable annuity | ₩ | 524,903 | ₩ | 3,937 | ₩ | 540,797 | ₩ | 4,058 | ||||||||
Variable universal | 117,397 | 59 | 132,413 | 135 | ||||||||||||
Others | — | — | 1,443 | — | ||||||||||||
|
|
|
|
|
|
|
| |||||||||
Total | ₩ | 642,300 | ₩ | 3,996 | ₩ | 674,653 | ₩ | 4,193 | ||||||||
|
|
|
|
|
|
|
| |||||||||
Premium reserves and unearned premium reserves classified based on each residual maturity as of January 1, 2010, and December 31, 20102012 and 2011,2013, are as follows:
| As of January 1, 2010 | 2012 | |||||||||||||||||||||||||||||||||||||||||||||||||||||||
| Lower than 3 years | 3-5 years | 5-10 years | 10-15 years | 15-20 years | Over 20 Years | Total | Lower than 3 years | 3-5 years | 5-10 years | 10-15 years | 15-20 years | 20 years or more | Total | |||||||||||||||||||||||||||||||||||||||||||
| (In millions of Korean won) | (In millions of Korean won) | |||||||||||||||||||||||||||||||||||||||||||||||||||||||
Premium reserves | (Won) | 104,758 | (Won) | 40,938 | (Won) | 756,286 | (Won) | 213,529 | (Won) | 140,117 | (Won) | 763,415 | (Won) | 2,019,043 | ₩ | 156,070 | ₩ | 276,101 | ₩ | 1,615,643 | ₩ | 270,973 | ₩ | 345,853 | ₩ | 2,109,936 | ₩ | 4,774,576 | ||||||||||||||||||||||||||||
Unearned premium reserves | 29 | — | 2 | 3 | 1 | 6 | 41 | 741 | — | 2 | — | 2 | 4 | 749 | ||||||||||||||||||||||||||||||||||||||||||
| As of December 31, 2010 | ||||||||||||||||||||||||||||
| Lower than 3 years | 3-5 years | 5-10 years | 10-15 years | 15-20 years | Over 20 Years | Total | ||||||||||||||||||||||
| (In millions of Korean won) | ||||||||||||||||||||||||||||
Premium reserves | (Won) | 79,161 | (Won) | 107,265 | (Won) | 1,088,495 | (Won) | 275,794 | (Won) | 255,179 | (Won) | 1,011,942 | (Won) | 2,817,836 | ||||||||||||||
Unearned premium reserves | 28 | — | 2 | — | 1 | 6 | 37 | |||||||||||||||||||||
| As of December 31, 2011 | 2013 | |||||||||||||||||||||||||||||||||||||||||||||||||||||||
| Lower than 3 years | 3-5 years | 5-10 years | 10-15 years | 15-20 years | Over 20 Years | Total | Lower than 3 years | 3-5 years | 5-10 years | 10-15 years | 15-20 years | 20 years or more | Total | |||||||||||||||||||||||||||||||||||||||||||
| (In millions of Korean won) | (In millions of Korean won) | |||||||||||||||||||||||||||||||||||||||||||||||||||||||
Premium reserves | (Won) | 67,027 | (Won) | 213,330 | (Won) | 1,198,711 | (Won) | 294,585 | (Won) | 319,018 | (Won) | 1,389,754 | (Won) | 3,482,425 | ₩ | 259,324 | ₩ | 324,305 | ₩ | 1,570,009 | ₩ | 294,058 | ₩ | 426,287 | ₩ | 2,653,510 | ₩ | 5,527,493 | ||||||||||||||||||||||||||||
Unearned premium reserves | 35 | — | 2 | — | 2 | 4 | 43 | 642 | 1 | 3 | — | 2 | 3 | 651 | ||||||||||||||||||||||||||||||||||||||||||
37.38. Supplemental Cash Flow Information
Cash and cash equivalents as of January 1, 2010, and December 31, 20102012 and 2011,2013, are as follows:
| As of January 1, | As of December 31, | |||||||||||||||||||
| 2010 | 2010 | 2011 | 2012 | 2013 | ||||||||||||||||
| (In millions of Korean won) | (In millions of Korean won) | |||||||||||||||||||
Cash | (Won) | 1,567,197 | (Won) | 1,594,505 | (Won) | 1,840,829 | ₩ | 2,041,647 | ₩ | 1,963,977 | ||||||||||
Checks with other banks | 791,481 | 643,270 | 781,269 | 808,461 | 734,574 | |||||||||||||||
Due from Bank of Korea | 5,734,677 | 2,972,548 | 3,942,158 | 3,215,181 | 7,128,025 | |||||||||||||||
Due from other financial institutions | 1,009,275 | 1,619,505 | 2,613,869 | 4,527,316 | 4,966,078 | |||||||||||||||
|
|
|
|
| ||||||||||||||||
Sub-total | 9,102,630 | 6,829,828 | 9,178,125 | 10,592,605 | 14,792,654 | |||||||||||||||
|
|
|
|
| ||||||||||||||||
Restricted due from financial institutions | (6,113,627 | ) | (3,360,053 | ) | (4,171,213 | ) | (3,643,387 | ) | (7,665,903 | ) | ||||||||||
Due from financial institutions with original maturities over three months | (120,369 | ) | (218,196 | ) | (266,108 | ) | ||||||||||||||
Due from financial institutions with original maturities over three-months | (361,913 | ) | (957,565 | ) | ||||||||||||||||
|
|
|
|
| ||||||||||||||||
Sub-total | (6,233,996 | ) | (3,578,249 | ) | (4,437,321 | ) | (4,005,300 | ) | (8,623,468 | ) | ||||||||||
|
|
|
|
| ||||||||||||||||
Total | (Won) | 2,868,634 | (Won) | 3,251,579 | (Won) | 4,740,804 | ₩ | 6,587,305 | ₩ | 6,169,186 | ||||||||||
|
|
|
|
| ||||||||||||||||
Significant non-cash transactions for the years ended December 31, 20102011, 2012 and 2011,2013, are as follows:
| For the Year Ended December 31, | ||||||||||||||||||||
| 2010 | 2011 | 2011 | 2012 | 2013 | ||||||||||||||||
| (In millions of Korean won) | (In millions of Korean won) | |||||||||||||||||||
Decrease in loans due to the write-offs | (Won) | 2,278,930 | (Won) | 2,181,414 | ₩ | 2,181,414 | ₩ | 2,197,135 | ₩ | 2,132,066 | ||||||||||
Changes in accumulated other comprehensive income due to valuation of investment securities | 88,593 | (242,668 | ) | |||||||||||||||||
Changes in accumulated other comprehensive income due to valuation of financial investments | (242,668 | ) | 245,757 | (3,591 | ) | |||||||||||||||
Changes in investment in associates due to debt-for-equity swap with Ssangyong Engineering & Construction Co., Ltd | — | — | 28,779 | |||||||||||||||||
Changes in financial investments due to debt-for-equity swap with Taihan Electric Wire Co., Ltd | — | — | 115,716 | |||||||||||||||||
Increase in available-for-sale financial assets from debt-equity swap | 132,938 | 1,914 | 1,914 | 1,388 | — | |||||||||||||||
Decrease in Accumulated other comprehensive income from measurement of investment securities in associates | — | (44,263 | ) | (9,811 | ) | |||||||||||||||
Cash inflow and outflow due to paid from income tax, received (paid) from interestinterests and dividends for the years ended December 31, 20102011 2012 and 2011,2013, are as follows:
| For the Year Ended December 31, | Activity | 2011 | 2012 | 2013 | ||||||||||||||||||||||
| Activity | 2010 | 2011 | (In millions of Korean won) | |||||||||||||||||||||||
| (In millions of Korean won) | ||||||||||||||||||||||||||
Income tax refunded | Operating | (Won) | 130,096 | (Won) | 121,533 | |||||||||||||||||||||
Income tax paid | Operating | ₩ | (121,533 | ) | ₩ | 838,073 | ₩ | 504,900 | ||||||||||||||||||
Interest received | Operating | 14,046,425 | 14,384,913 | Operating | 14,384,913 | 14,494,389 | 12,749,214 | |||||||||||||||||||
Interest paid | Operating | 6,945,482 | 6,830,541 | Operating | 6,830,541 | 7,247,429 | 6,407,081 | |||||||||||||||||||
Dividends received | Operating | 103,055 | 98,212 | Operating | 98,212 | 96,587 | 98,579 | |||||||||||||||||||
Dividends paid | Financing | 78,897 | 41,163 | Financing | 41,163 | 278,173 | 231,811 | |||||||||||||||||||
Dividends paid on hybrid capital instrument | Financing | 64,600 | 46,331 | Financing | 46,331 | — | — | |||||||||||||||||||
38.39. Contingent liabilities and commitments
Acceptances and guarantees as of January 1, 2010, and December 31, 20102012 and 2011,2013, are as follows:
| As of January 1, | As of December 31, | |||||||||||
| 2010 | 2010 | 2011 | ||||||||||
| (In millions of Korean won) | ||||||||||||
Confirmed acceptances and guarantees | ||||||||||||
Confirmed acceptances and guarantees in Korean won | ||||||||||||
Acceptances and guarantees for corporate purchasing card | (Won) | 762,199 | (Won) | 801,657 | (Won) | 70,134 | ||||||
Acceptances and guarantees for KB purchasing loan | — | 19,724 | 684,445 | |||||||||
Bid bond | — | — | 402 | |||||||||
Performance bond | — | — | 649 | |||||||||
Other acceptances and guarantees | 874,362 | 887,885 | 849,537 | |||||||||
|
|
|
|
|
| |||||||
Sub-total | 1,636,561 | 1,709,266 | 1,605,167 | |||||||||
|
|
|
|
|
| |||||||
Confirmed acceptances and guarantees in foreign currency | ||||||||||||
Acceptances of letter of credit | 395,410 | 294,191 | 411,145 | |||||||||
Letter of guarantees | 71,323 | 65,966 | 57,903 | |||||||||
Bid bond | 47,406 | 64,462 | 41,721 | |||||||||
Performance bond | 530,191 | 647,318 | 437,046 | |||||||||
Refund guarantees | 3,844,148 | 2,945,179 | 3,025,855 | |||||||||
Other acceptances and guarantees | 333,417 | 297,813 | 268,391 | |||||||||
|
|
|
|
|
| |||||||
Sub-total | 5,221,895 | 4,314,929 | 4,242,061 | |||||||||
|
|
|
|
|
| |||||||
Financial guarantees | ||||||||||||
Acceptances and guarantees for debentures | 890 | 397 | 208 | |||||||||
Acceptances and guarantees for mortgage | 82,372 | 69,901 | 57,079 | |||||||||
Overseas debt guarantees | 216,424 | 239,707 | 244,929 | |||||||||
International financing guarantees in foreign currencies | 296,502 | 292,470 | — | |||||||||
Financial guarantees | — | — | 20,000 | |||||||||
|
|
|
|
|
| |||||||
Sub-total | 596,188 | 602,475 | 322,216 | |||||||||
|
|
|
|
|
| |||||||
Total confirmed acceptances and guarantees | 7,454,644 | 6,626,670 | 6,169,444 | |||||||||
|
|
|
|
|
| |||||||
Unconfirmed acceptances and guarantees | ||||||||||||
Guarantees of letter of credit | 5,181,392 | 4,362,986 | 4,023,393 | |||||||||
Refund guarantees | 2,678,712 | 2,089,411 | 1,672,063 | |||||||||
|
|
|
|
|
| |||||||
Total unconfirmed acceptances and guarantees | 7,860,104 | 6,452,397 | 5,695,456 | |||||||||
|
|
|
|
|
| |||||||
Total | (Won) | 15,314,748 | (Won) | 13,079,067 | (Won) | 11,864,900 | ||||||
|
|
|
|
|
| |||||||
Confirmed acceptances and guarantees Confirmed acceptances and guarantees in Korean won Acceptances and guarantees for corporate purchasing card Acceptances and guarantees for KB purchasing loan Other acceptances and guarantees Sub-total Confirmed acceptances and guarantees in foreign currency Acceptances of letter of credit Letter of guarantees Bid bond Performance bond Refund guarantees Other acceptances and guarantees Sub-total Financial guarantees Guarantees for Debenture-Issuing Acceptances and guarantees for mortgage Overseas debt guarantees International financing guarantees in foreign currencies Sub-total Total confirmed acceptances and guarantees Unconfirmed acceptances and guarantees Guarantees of letter of credit Refund guarantees Total unconfirmed acceptances and guarantees Total 2012 2013 (In millions of Korean won) ₩ 17 ₩ 17 546,480 448,906 1,017,631 782,646 1,564,128 1,231,569 204,764 281,049 66,535 57,596 85,228 24,212 529,088 999,872 2,172,006 2,263,202 552,015 906,105 3,609,636 4,532,036 — 20,200 45,123 43,272 238,670 319,080 21,422 41,896 305,215 424,448 5,478,979 6,188,053 3,326,326 3,265,906 918,191 775,181 4,244,517 4,041,087 ₩ 9,723,496 ₩ 10,229,140
Acceptances and guarantees by counter party as of January 1, 2010, and December 31, 20102012 and 2011,2013, are as follows:
| As of January 1, 2010 | 2012 | |||||||||||||||||||||||||||||||
| Confirmed guarantees | Unconfirmed guarantees | Total | Proportion (%) | Confirmed guarantees | Unconfirmed guarantees | Total | Proportion (%) | |||||||||||||||||||||||||
| (In millions of Korean won) | (In millions of Korean won) | |||||||||||||||||||||||||||||||
Large corporate | (Won) | 5,279,776 | (Won) | 3,511,025 | (Won) | 8,790,801 | 57.40 | |||||||||||||||||||||||||
Small- and medium-sized enterprise | 2,062,959 | 1,346,199 | 3,409,158 | 22.26 | ||||||||||||||||||||||||||||
Corporations | ₩ | 4,237,305 | ₩ | 2,450,719 | ₩ | 6,688,024 | 68.78 | |||||||||||||||||||||||||
Small companies | 1,185,994 | 763,254 | 1,949,248 | 20.05 | ||||||||||||||||||||||||||||
Public and others | 111,909 | 3,002,880 | 3,114,789 | 20.34 | 55,680 | 1,030,544 | 1,086,224 | 11.17 | ||||||||||||||||||||||||
|
|
|
|
|
|
|
| |||||||||||||||||||||||||
Total | (Won) | 7,454,644 | (Won) | 7,860,104 | (Won) | 15,314,748 | 100.00 | ₩ | 5,478,979 | ₩ | 4,244,517 | ₩ | 9,723,496 | 100.00 | ||||||||||||||||||
|
|
|
|
|
|
|
| |||||||||||||||||||||||||
| As of December 31, 2010 | ||||||||||||||||
| Confirmed guarantees | Unconfirmed guarantees | Total | Proportion (%) | |||||||||||||
| (In millions of Korean won) | ||||||||||||||||
Large corporate | (Won) | 4,619,783 | (Won) | 2,901,615 | (Won) | 7,521,398 | 57.51 | |||||||||
Small- and medium-sized enterprise | 1,893,387 | 1,277,378 | 3,170,765 | 24.24 | ||||||||||||
Public and others | 113,500 | 2,273,404 | 2,386,904 | 18.25 | ||||||||||||
|
|
|
|
|
|
|
| |||||||||
Total | (Won) | 6,626,670 | (Won) | 6,452,397 | (Won) | 13,079,067 | 100.00 | |||||||||
|
|
|
|
|
|
|
| |||||||||
| As of December 31, 2011 | 2013 | |||||||||||||||||||||||||||||||
| Confirmed guarantees | Unconfirmed guarantees | Total | Proportion (%) | Confirmed guarantees | Unconfirmed guarantees | Total | Proportion (%) | |||||||||||||||||||||||||
| (In millions of Korean won) | (In millions of Korean won) | |||||||||||||||||||||||||||||||
Large corporate | (Won) | 4,571,010 | (Won) | 2,954,567 | (Won) | 7,525,577 | 63.43 | |||||||||||||||||||||||||
Small- and medium-sized enterprise | 1,505,137 | 1,005,318 | 2,510,455 | 21.16 | ||||||||||||||||||||||||||||
Corporations | ₩ | 4,998,062 | ₩ | 2,723,162 | ₩ | 7,721,224 | 75.48 | |||||||||||||||||||||||||
Small companies | 1,029,039 | 623,803 | 1,652,842 | 16.16 | ||||||||||||||||||||||||||||
Public and others | 93,297 | 1,735,571 | 1,828,868 | 15.41 | 160,952 | 694,122 | 855,074 | 8.36 | ||||||||||||||||||||||||
|
|
|
|
|
|
|
| |||||||||||||||||||||||||
Total | (Won) | 6,169,444 | (Won) | 5,695,456 | (Won) | 11,864,900 | 100.00 | ₩ | 6,188,053 | ₩ | 4,041,087 | ₩ | 10,229,140 | 100.00 | ||||||||||||||||||
|
|
|
|
|
|
|
| |||||||||||||||||||||||||
Acceptances and guarantees by industry as of January 1, 2010, and December 31, 20102012 and 2011,2013, are as follows:
| As of January 1, 2010 | ||||||||||||||||
| Confirmed guarantees | Unconfirmed guarantees | Total | Proportion (%) | |||||||||||||
| (In millions of Korean won) | ||||||||||||||||
Public sector | (Won) | 329 | (Won) | 2,948,404 | (Won) | 2,948,733 | 19.25 | |||||||||
Financial institutions | 44,304 | 72,819 | 117,123 | 0.76 | ||||||||||||
Service | 271,437 | 43,144 | 314,581 | 2.05 | ||||||||||||
Manufacturing | 4,981,682 | 3,859,891 | 8,841,573 | 57.73 | ||||||||||||
Others | 2,156,892 | 935,846 | 3,092,738 | 20.19 | ||||||||||||
|
|
|
|
|
|
|
| |||||||||
Total | (Won) | 7,454,644 | (Won) | 7,860,104 | (Won) | 15,314,748 | 100.00 | |||||||||
|
|
|
|
|
|
|
| |||||||||
| As of December 31, 2010 | 2012 | |||||||||||||||||||||||||||||||
| Confirmed guarantees | Unconfirmed guarantees | Total | Proportion (%) | Confirmed guarantees | Unconfirmed guarantees | Total | Proportion (%) | |||||||||||||||||||||||||
| (In millions of Korean won) | (In millions of Korean won) | |||||||||||||||||||||||||||||||
Financial institutions | ₩ | 92,037 | ₩ | 8,610 | ₩ | 100,647 | 1.04 | |||||||||||||||||||||||||
Manufacturing | 3,262,542 | 2,198,617 | 5,461,159 | 56.16 | ||||||||||||||||||||||||||||
Service | 389,831 | 33,815 | 423,646 | 4.36 | ||||||||||||||||||||||||||||
Whole sale & Retail | 924,602 | 725,224 | 1,649,826 | 16.97 | ||||||||||||||||||||||||||||
Construction | 754,876 | 284,448 | 1,039,324 | 10.69 | ||||||||||||||||||||||||||||
Public sector | (Won) | 38,641 | (Won) | 2,207,654 | (Won) | 2,246,295 | 17.18 | 20,650 | 972,777 | 993,427 | 10.22 | |||||||||||||||||||||
Financial institutions | 28,059 | 2,067 | 30,126 | 0.23 | ||||||||||||||||||||||||||||
Service | 300,826 | 31,747 | 332,573 | 2.54 | ||||||||||||||||||||||||||||
Manufacturing | 4,489,697 | 3,263,259 | 7,752,956 | 59.28 | ||||||||||||||||||||||||||||
Others | 1,769,447 | 947,670 | 2,717,117 | 20.77 | 34,441 | 21,026 | 55,467 | 0.56 | ||||||||||||||||||||||||
|
|
|
|
|
|
|
| |||||||||||||||||||||||||
Total | (Won) | 6,626,670 | (Won) | 6,452,397 | (Won) | 13,079,067 | 100.00 | ₩ | 5,478,979 | ₩ | 4,244,517 | ₩ | 9,723,496 | 100.00 | ||||||||||||||||||
|
|
|
|
|
|
|
| |||||||||||||||||||||||||
| As of December 31, 2011 | ||||||||||||||||
| Confirmed guarantees | Unconfirmed guarantees | Total | Proportion (%) | |||||||||||||
| (In millions of Korean won) | ||||||||||||||||
Public sector | (Won) | 58,129 | (Won) | 1,663,052 | (Won) | 1,721,181 | 14.51 | |||||||||
Financial institutions | 75,048 | 5,176 | 80,224 | 0.68 | ||||||||||||
Service | 162,960 | 49,197 | 212,157 | 1.79 | ||||||||||||
Manufacturing | 4,196,612 | 2,884,922 | 7,081,534 | 59.68 | ||||||||||||
Others | 1,676,695 | 1,093,109 | 2,769,804 | 23.34 | ||||||||||||
|
|
|
|
|
|
|
| |||||||||
Total | (Won) | 6,169,444 | (Won) | 5,695,456 | (Won) | 11,864,900 | 100.00 | |||||||||
|
|
|
|
|
|
|
| |||||||||
Financial institutions Manufacturing Service Whole sale & Retail Construction Public sector Others Total As of January 1, 2010, and December 31, 2010 and 2011, the principal amounts of trust fund for which the Group guarantees payment of principal are as follows and there is no amount the Group has to pay in relation to the management results of these trust funds in accordance with the guarantees of payment of principal as of January 1, 2010, and December 31, 2010 and 2011. 2013 Confirmed
guarantees Unconfirmed
guarantees Total Proportion
(%) (In millions of Korean won) ₩ 145,197 ₩ 3,924 ₩ 149,121 1.46 3,867,870 2,270,254 6,138,124 60.01 523,698 115,710 639,408 6.25 1,083,264 745,658 1,828,922 17.88 484,764 244,727 729,491 7.13 72,583 635,326 707,909 6.92 10,677 25,488 36,165 0.35 ₩ 6,188,053 ₩ 4,041,087 ₩ 10,229,140 100.00
| As of January 1, | As of December 31, | |||||||||||
| 2010 | 2010 | 2011 | ||||||||||
| (In millions of Korean won) | ||||||||||||
Trust fund guarantees | (Won) | 2,868,512 | (Won) | 2,954,320 | (Won) | 2,891,645 | ||||||
Commitments as of January 1, 2010, and December 31, 20102012 and 2011,2013, are as follows:
| As of January 1, | As of December 31, | |||||||||||
| 2010 | 2010 | 2011 | ||||||||||
| (In millions of Korean won) | ||||||||||||
Commitments | ||||||||||||
Corporate loan commitments | (Won) | 27,029,379 | (Won) | 27,644,011 | (Won) | 36,365,468 | ||||||
Retail loan commitments | 13,268,454 | 14,149,393 | 14,632,998 | |||||||||
Credit line on credit cards | 43,610,192 | 44,776,141 | 39,070,550 | |||||||||
Private indirect reinvestment trusts for the stabilization of bond markets | 518,913 | 518,913 | 1,037,826 | |||||||||
UAMCO., Ltd. | 162,750 | 89,950 | 89,950 | |||||||||
Purchase of security investment | 796,200 | 559,950 | 547,150 | |||||||||
|
|
|
|
|
| |||||||
Total commitments | 85,385,888 | 87,738,358 | 91,743,942 | |||||||||
|
|
|
|
|
| |||||||
Financial Guarantees | ||||||||||||
Credit line | 297,670 | 155,162 | 471,951 | |||||||||
Purchase of security investment | 521,500 | 396,050 | 151,000 | |||||||||
|
|
|
|
|
| |||||||
Total financial guarantees | 819,170 | 551,212 | 622,951 | |||||||||
|
|
|
|
|
| |||||||
Total | (Won) | 86,205,058 | (Won) | 88,289,570 | (Won) | 92,366,893 | ||||||
|
|
|
|
|
| |||||||
Commitments Corporate loan commitments Retail loan commitments Credit line on credit cards Private placement commitments Purchase of other security investment Total commitments Financial Guarantees Credit line Purchase of security investment Total financial guarantees Total 2012 2013 (In millions of Korean won) ₩ 40,770,994 ₩ 42,446,365 14,348,821 13,976,426 36,214,899 37,112,333 80,000 80,000 1,778,767 1,806,908 93,193,481 95,422,032 1,141,554 2,572,424 62,500 100,500 1,204,054 2,672,924 ₩ 94,397,535 ₩ 98,094,956
Other Matters (including litigation)
i) The Group has filed 130164 lawsuits (excluding minor lawsuits in relation to the collection or management of loans), involving aggregate claims of (Won) 713,551₩797,816 million, and faces 266288 lawsuits (as the defendant) (excluding minor lawsuits in relation to the collection or management of loans) involving aggregate damages of (Won) 837,293₩532,098 million, which arose in the normal course of the business and are still pending as of December 31, 2011.2013.
The government filed a civil lawsuit against the Korea Lottery Service Inc., an accounting firm andMeanwhile, certain customers of Kookmin Bank seeking total damageshave filed lawsuits against Kookmin Bank in connection with fees paid for the registration of (Won)320,800 million. The plaintiff contends thatfixed collateral. Of the excessive payment of lottery service commission fees were due to an illegal actcases currently on trial, the Court has ruled in favor of Kookmin Bank’s employeesBank, and other parties. In April 2009, the Seoul Central District Court dismissed the government’s claim. In May 2009, the government appealedwhere the case has been appealed, these appeals were subsequently dismissed. Based on these rulings, there is a low probability of potential losses related to the Seoul High Court, which dismissed the appeal in September 2010. In October 2010, the government appealed the case to the Supreme Court of Korea, where it is currently pending. It is uncertain as to whether the Group will be ultimately liable for the damages in the aforementioned lawsuit. The amount of potential liabilities cannot be estimated as of December 31, 2011.lawsuits.
ii) According to the shareholders’ agreement on September 25, 2009, amongbetween Kookmin Bank, the International Finance Corporation (“IFC”) and the remaining shareholders, Kookmin Bank granted a put option to IFC with the right to sell shares of JSC Bank CenterCreditCenter Credit to itself or its designee. The exercise price is determined at its fair value by mutual agreement between Kookmin Bank and IFC. If the price is not agreed by the designated date, it is determined by the value measured by the selected independent external valuation institution. The put option may be exercised by IFC at any time from February 24, 2013, to February 24, 2017. However, if
iii) The face value of the put trigger event defined in the shareholders’ agreement occurs,securities sold to general customers through tellers’ sale amounts to ₩116,633 million and consequently, if a put notice is delivered to Kookmin Bank within 60 days from the date when IFC recognizes such event, IFC may also exercise its put option at any time after February 24, 2010.₩57,159 million as of December 31, 2012 and 2013, respectively.
iii)iv) Kookmin Bank underwent a tax investigation by the Seoul Regional Tax Office and in early 2007 was assessed to owe additional corporate tax including local income tax of (Won)482,755₩482,755 million. Kookmin Bank paid this amount to the tax authorities. Subsequently, Kookmin Bank filed a claim for adjudication onin August 2007 for repayment of the amount of (Won)482,643₩482,643 million. Of this amount, (Won)117,135₩117,135 million has been refunded to Kookmin Bank following a successful appeal to the National Tax Tribunal and administrative litigations. Further, a portion of the claim amounting to (Won)970₩970 million has been extinguished following litigation. Meanwhile, the claim for a refund of (Won)364,538₩364,538 million, specifically related to the merger of Kookmin Card Co., Ltd. was ruled in favor of Kookmin Bank in an original case on April 1, 2011, and in a second trial at the Seoul High Court on January 12, 2012. The ruling has been appealed by the Taxtax authorities to the Supreme Court, where it is currently pending third trial.trial as of December 31, 2013.
39. Asset-backed securitizationv) During the year ended December 31, 2013, Kookmin Bank underwent a tax investigation for the fiscal years 2008 to 2012 by the Seoul Regional Tax Office. As a result, Kookmin Bank was fined a total of ₩124,357 million for income taxes (including local income taxes), paid ₩113,699 million, excluding local income taxes, and recognized local income taxes amounting to ₩10,658 million as other payables. In October 2013, the Group appealed to the tax tribunal the ₩116,257 million in fines.
vi) The Group transferred loansfiled a claim for rectification of foreign income tax paid of Kookmin Bank for the fiscal years 2010 to 2011. The claim was ruled in favor of the Group in January 2014 and othera refund of ₩15,772 million was received from the Seoul Regional Tax Office. The refund will belong to Kookmin Bank.
vii) KB Kookmin Card suffered massive leakage of customer personal information in June 2013. This leakage was caused by an employee of outsourced subcontractor who was setting up a fraud detection system for KB Kookmin Card. Consequently, as at the date on which the Board of Directors approved the financial assetsstatements, KB Kookmin Card is subject to SPEs,claims from five plaintiffs, with an aggregated claim of ₩34 million. Additional lawsuits may be filed against the Group with respect to the leakage of customer personal information, and issued debentures secured by those transferred assets.the final outcomes of such litigations remain uncertain.
viii) The detailsGroup was chosen as the preferred bidder in the sale of borrowings which are secured by loans and other financial assets as of January 1, 2010, andWoori Financial Co., Ltd. on December 31, 2010 and 2011, are as follows:6, 2013.
| As of January 1, 2010 | ||||||||||||||||
| Interest rates (%) | Expiration date | Senior debentures | Underlying assets | |||||||||||||
| Loans | Securities | |||||||||||||||
| (In millions of Korean won) | ||||||||||||||||
KB 12th Securitization Specialty Co., Ltd.(3) | 7.00~8.50 | 2011-01-21 | (Won) | 70,000 | (Won) | 72,882 | (Won) | — | ||||||||
KB 13th Securitization Specialty Co., Ltd.(3) | 3.82~6.41 | 2011-07-02 | 165,000 | 218,980 | — | |||||||||||
KB Mortgage Loan First Securitization Specialty Co., Ltd.(1) | 2.63 | 2039-12-08 | 540,520 | 592,054 | — | |||||||||||
KAMCO Value Recreation 3th Securitization Specialty Co., Ltd.(2) | 6.27 | 2012-10-09 | 3,258 | 19,000 | — | |||||||||||
New Star 1st Co., Ltd.(3) | 4.65~5.05 | 2010-01-18 | 100,000 | — | 99,285 | |||||||||||
|
|
|
|
|
| |||||||||||
Total | 878,778 | 902,916 | 99,285 | |||||||||||||
Premiums (discounts) on debentures | (297 | ) | — | — | ||||||||||||
|
|
|
|
|
| |||||||||||
Net Senior debentures | (Won) | 878,481 | (Won) | 902,916 | (Won) | 99,285 | ||||||||||
|
|
|
|
|
| |||||||||||
| As of December 31, 2010 | ||||||||||||||||
| Interest rates (%) | Expiration date | Senior debentures | Underlying assets | |||||||||||||
| Loans | Securities | |||||||||||||||
| (In millions of Korean won) | ||||||||||||||||
KB 14th Securitization Specialty Co., | 6.03~6.57 | 2011-10-04~ 2012-01-04 | (Won) | 30,000 | (Won) | 85,564 | (Won) | — | ||||||||
KB Mortgage Loan First Securitization Specialty Co., Ltd.(1) | 1.98 | 2039-12-08 | 423,379 | 522,059 | — | |||||||||||
KAMCO Value Recreation 3th Securitization Specialty Co., Ltd.(2) | 5.08 | 2012-10-09 | 3,258 | 19,000 | — | |||||||||||
New Star 1st Co., Ltd.(3) | 4.65~5.05 | 2011-01-18 | 100,300 | — | 100,985 | |||||||||||
|
|
|
|
|
| |||||||||||
Total | 556,937 | 626,623 | 100,985 | |||||||||||||
Premiums (discounts) on debentures | (12 | ) | — | — | ||||||||||||
|
|
|
|
|
| |||||||||||
Net Senior debentures | (Won) | 556,925 | (Won) | 626,623 | (Won) | 100,985 | ||||||||||
|
|
|
|
|
| |||||||||||
| As of December 31, 2011 | ||||||||||||||||
| Interest rates (%) | Expiration date | Senior debentures | Underlying assets | |||||||||||||
| Loans | Securities | |||||||||||||||
| (In millions of Korean won) | ||||||||||||||||
KB Mortgage Loan 1st Securitization Specialty Co., Ltd.(1) | 2.57 | 2039-12-08 | (Won) | 335,169 | (Won) | 434,376 | (Won) | — | ||||||||
KAMCO Value Recreation 3th Securitization Specialty Co., Ltd.(2) | 5.16 | 2012-10-09 | 3,258 | 19,000 | — | |||||||||||
New Star 1st Co., Ltd.(3) | 5.05 | 2012-01-18 | 50,000 | — | 50,218 | |||||||||||
KB Kookmin Card First Securitization Co., Ltd.(1) | LIBOR+0.48 | 2014-11-26 | 345,990 | 616,089 | — | |||||||||||
|
|
|
|
|
| |||||||||||
Total | 734,417 | 1,069,465 | 50,218 | |||||||||||||
Premiums (discounts) on debentures | (2,566 | ) | — | — | ||||||||||||
|
|
|
|
|
| |||||||||||
Net Senior debentures | (Won) | 731,851 | (Won) | 1,069,465 | (Won) | 50,218 | ||||||||||
|
|
|
|
|
| |||||||||||
|
|
|
40. The Subsidiaries
The details of subsidiaries as of December 31, 2011,2013, are as follows:
Investor | Investee | Ownership interests(%) | Location | information | Industry | |||||||||
KB Financial | Kookmin Bank | 100.00 | Korea | Dec. 31 | Banking and domestic, foreign exchange transaction | |||||||||
KB Kookmin Card Co., Ltd. | 100.00 | Korea | Dec. 31 | Credit card | ||||||||||
KB Investment & Securities Co., Ltd. | 100.00 | Korea | Dec. 31 | Financial investment | ||||||||||
KB Life Insurance Co., Ltd. | Korea | Dec. 31 | Life insurance | |||||||||||
KB Asset Management Co., Ltd. | 100.00 | Korea | Dec. 31 | Security investment trust management and advisory | ||||||||||
KB Real Estate Trust Co., Ltd. | 100.00 | Korea | Dec. 31 | Real estate trust management | ||||||||||
KB Investment Co., Ltd. | 100.00 | Korea | Dec. 31 | Investment in small company | ||||||||||
KB Credit Information Co., Ltd. | 100.00 | Korea | Dec. 31 | Collection of receivables or credit investigation | ||||||||||
KB Data System Co., Ltd. | 100.00 | Korea | Dec. 31 | Software advisory, development, and supply | ||||||||||
KB Savings Bank Co., Ltd. | 100.00 | Korea | Dec. 31 | Savings banking | ||||||||||
Yehansoul Savings Bank Co., Ltd. | 100.00 | Korea | Dec. 31 | Savings banking | ||||||||||
Investor | Investee | Ownership interests(%) | Location | Date of financial information | Industry | |||||||||
Kookmin Bank | Kookmin Bank Int’l Ltd.(London) | 100.00 | United Kingdom | Dec. 31 | Banking and foreign exchange transaction | |||||||||
Kookmin Bank Hong Kong Ltd. | 100.00 | Hong Kong | Dec. 31 | Banking and foreign exchange transaction | ||||||||||
Kookmin Bank Cambodia PLC. | Cambodia | Dec. 31 | Banking and foreign exchange transaction | |||||||||||
Kookmin Bank (China) Ltd. | 100.00 | China | Dec. 31 | Banking and foreign exchange transaction | ||||||||||
| — | Korea | Dec. 31 | Trust | ||||||||||
KB Mortgage Loan First Securitization Specialty Co., Ltd. and | — | Korea
| Dec. 31 | Asset-backed securitization and others | ||||||||||
KB Evergreen Private Securities | 100.00 | Korea | Dec. 31 | Private equity fund | ||||||||||
Kookmin Bank, | KB06-1 Venture Investment | 75.00 | Korea | Dec. 31 | Capital investment | |||||||||
KB08-1 Venture Investment | 100.00 | Korea | Dec. 31 | Capital investment | ||||||||||
KB12-1 Venture Investment | 100.00 | Korea | Dec. 31 | Capital investment | ||||||||||
KB Start-up Creation Fund | 100.00 | Korea | Dec. 31 | Capital investment | ||||||||||
KB Asset Management Co., Ltd. | KB Wellyan Private Equity Real Estate Fund No. 6 | 95.67 | Korea | Dec. 31 | Capital investment | |||||||||
KB Wellyan Private Equity Real Estate Fund No. 7(2) | 47.97 | Korea | Dec. 31 | Capital investment | ||||||||||
KB Wellyan Private Equity Real Estate Fund No. 6, 7 | Boyoung construction(2) | — | Korea | Dec. 31 | Construction | |||||||||
KB Investment Co., Ltd. | NPS 07-5 KB Venture Fund(2) | 20.00 | Korea | Dec. 31 | Capital investment | |||||||||
09-5 KB Venture Fund(2) | 33.33 | Korea | Dec. 31 | Capital investment | ||||||||||
KoFC-KB Pioneer Champ No.2010-8 Investment Partnership(2) | 50.00 | Korea | Dec. 31 | Capital investment | ||||||||||
2011 KIF-KB IT Venture Fund(2) | 43.33 | Korea | Dec. 31 | Capital investment | ||||||||||
KoFC-KB Young Pioneer 1st Fund(2) | 33.33 | Korea | Dec. 31 | Capital investment | ||||||||||
Investor | Investee | Ownership interests(%) | Location | information | Industry | |||||||||
|
| |||||||||||||
| ||||||||||||||
| ||||||||||||||
| ||||||||||||||
| ||||||||||||||
| ||||||||||||||
| ||||||||||||||
| ||||||||||||||
| ||||||||||||||
|
| |||||||||||||
| ||||||||||||||
|
|
| ||||||||||||
KB Kookmin Card Co., Ltd | KB Kookmin Card First Securitization Co., Ltd. | 0.90 | Korea | Dec. 31 | Asset-backed securitization | |||||||||
Wise Mobile First Securitization Specialty(2) | — | Korea | Dec. 31 | Asset-backed securitization | ||||||||||
Wise Mobile Second Securitization Specialty(2) | — | Korea | Dec. 31 | Asset-backed securitization | ||||||||||
Wise Mobile third Securitization Specialty(2) | — | Korea | Dec. 31 | Asset-backed securitization | ||||||||||
Wise Mobile fourth Securitization Specialty(2) | — | Korea | Dec. 31 | Asset-backed securitization | ||||||||||
Wise Mobile fifth Securitization Specialty(2) | — | Korea | Dec. 31 | Asset-backed securitization | ||||||||||
Wise Mobile sixth Securitization Specialty(2) | — | Korea | Dec. 31 | Asset-backed securitization | ||||||||||
Wise Mobile seventh Securitization Specialty(2) | — | Korea | Dec. 31 | Asset-backed securitization | ||||||||||
KB Life Insurance Co., Ltd. |
| 100.00 | Korea | Dec. 31 | Private equity fund | |||||||||
Kookmin Bank, KB Investment & Securities, KB life Insurance, KB Real Estate Trust Co., Ltd | KB Wise Star Private Real Estate Feeder Fund 1st. | 100.00 | Korea | Dec. 31 | Investment trust | |||||||||
Kookmin Bank | Hanbando BTL Private Special Asset Fund(2) | 39.74 | Korea | Dec. 31 | Capital investment | |||||||||
Kookmin Bank, KB life Insurance | KB Hope Sharing BTL Private Special Asset(2) | 40.00 | Korea | Dec. 31 | Capital investment | |||||||||
Kookmin Bank | KB Mezzanine Private Securities Fund 1(2) | 46.51 | Korea | Dec. 31 | Capital investment | |||||||||
K Star KTB ETF(Bond)(2) | 48.20 | Korea | Dec. 31 | Capital investment | ||||||||||
Global Logistics Infra Private | 57.14 | Korea | Dec. 31 | Capital investment | ||||||||||
Global Logistics Infra Private | — | Korea | Dec. 31 | Capital investment | ||||||||||
KB Wise Star Private Real Estate Feeder Fund 1st. | KB Star Retail Real Estate Feeder Fund 1st.(2) | 48.98 | Korea | Dec. 31 | Capital investment | |||||||||
| (1) | The |
| (2) |
|
|
The condensed financial information of major subsidiaries as of January 1, 2010,December 31, 2012 and as of2013, and for the years ended December 31, 20102012 and 2011, are2013, is as follows:
| As of January 1, 2010 | ||||||||||||
| Assets | Liabilities | Equity | ||||||||||
| �� | (In millions of Korean won) | |||||||||||
Kookmin Bank(1) | (Won) | 257,644,139 | (Won) | 236,763,981 | (Won) | 20,880,158 | ||||||
KB Investment & Securities Co., Ltd.(1) | 2,231,260 | 1,930,018 | 301,242 | |||||||||
KB Life Insurance Co., Ltd.(1) | 2,524,059 | 2,372,540 | 151,519 | |||||||||
KB Asset Management Co., Ltd | 108,735 | 12,699 | 96,036 | |||||||||
KB Real Estate Trust Co., Ltd | 257,767 | 134,672 | 123,095 | |||||||||
KB Investment Co., Ltd.(1) | 425,136 | 320,862 | 104,274 | |||||||||
KB Futures Co., Ltd | 236,949 | 199,710 | 37,239 | |||||||||
KB Credit Information Co., Ltd | 29,488 | 6,189 | 23,299 | |||||||||
KB Data System Co., Ltd | 45,698 | 28,549 | 17,149 | |||||||||
| As of and for the Year Ended December 31, 2010 | 2012 | |||||||||||||||||||||||||||||||||||||||||||||||
| Assets | Liabilities | Equity | Operating revenue | Profit for the period | Total compre- hensive income for the period | Assets | Liabilities | Equity | Operating income (revenue) | Profit(loss) for the year | Total compre- hensive income(loss) for the year | |||||||||||||||||||||||||||||||||||||
| (In millions of Korean won) | (In millions of Korean won) | |||||||||||||||||||||||||||||||||||||||||||||||
Kookmin Bank(1) | (Won) | 254,529,047 | (Won) | 233,572,778 | (Won) | 20,956,269 | (Won) | 23,632,024 | (Won) | 151,062 | (Won) | 234,738 | ₩ | 261,046,853 | ₩ | 241,029,295 | ₩ | 20,017,558 | ₩ | 19,421,893 | ₩ | 1,440,123 | ₩ | 1,549,881 | ||||||||||||||||||||||||
KB Kookmin Card Co., Ltd.(1) | 14,046,174 | 10,966,541 | 3,079,633 | 2,921,167 | 290,741 | 297,423 | ||||||||||||||||||||||||||||||||||||||||||
KB Investment & Securities Co., Ltd.(1) | 2,420,085 | 2,071,770 | 348,315 | 536,198 | 39,535 | 47,073 | 3,314,907 | 2,769,160 | 545,747 | 1,003,421 | 17,892 | 21,760 | ||||||||||||||||||||||||||||||||||||
KB Life Insurance Co., Ltd.(1) | 3,673,209 | 3,343,362 | 329,847 | 1,241,274 | 18,362 | 58,903 | 5,987,928 | 5,594,727 | 393,201 | 1,944,103 | 16,645 | 38,498 | ||||||||||||||||||||||||||||||||||||
KB Asset Management Co., Ltd | 142,826 | 17,145 | 125,681 | 69,151 | 29,306 | 29,645 | ||||||||||||||||||||||||||||||||||||||||||
KB Asset Management Co., Ltd.(1) | 164,595 | 37,555 | 127,040 | 89,541 | 35,885 | 36,882 | ||||||||||||||||||||||||||||||||||||||||||
KB Real Estate Trust Co., Ltd | 259,189 | 130,057 | 129,132 | 51,038 | 6,020 | 6,037 | 201,572 | 35,363 | 166,209 | 52,021 | 21,751 | 21,565 | ||||||||||||||||||||||||||||||||||||
KB Investment Co., Ltd.(1) | 524,755 | 419,053 | 105,702 | 35,973 | 212 | 1,428 | 226,528 | 103,086 | 123,442 | 26,233 | 5,501 | 7,380 | ||||||||||||||||||||||||||||||||||||
KB Futures Co., Ltd | 192,863 | 150,076 | 42,787 | 27,564 | 4,528 | 5,548 | ||||||||||||||||||||||||||||||||||||||||||
KB Credit Information Co., Ltd | 31,263 | 6,412 | 24,851 | 46,325 | 1,552 | 1,552 | 30,422 | 7,631 | 22,791 | 58,584 | 331 | 331 | ||||||||||||||||||||||||||||||||||||
KB Data System Co., Ltd | 52,374 | 38,302 | 14,072 | 130,527 | (3,077 | ) | (3,077 | ) | 25,519 | 10,761 | 14,758 | 78,021 | (1,198 | ) | (1,461 | ) | ||||||||||||||||||||||||||||||||
KB Savings Bank Co., Ltd | 646,674 | 510,254 | 136,420 | 67,280 | (32,546 | ) | (32,404 | ) | ||||||||||||||||||||||||||||||||||||||||
Kookmin Bank(1) KB Kookmin Card KB Investment & Securities KB Life Insurance KB Asset Management KB Real Estate Trust Co., Ltd KB Investment KB Credit Information Co., Ltd KB Data System Co., Ltd Kookmin Bank(1) KB Kookmin Card Co., Ltd.(1) KB Investment & Securities Co., Ltd.(1) KB Life Insurance Co., Ltd.(1) KB Asset Management Co., Ltd.(1) KB Real Estate Trust Co., Ltd KB Investment Co., Ltd.(1) KB Credit Information Co., Ltd KB Data System Co., Ltd KB Savings Bank Co., Ltd Yehansoul Savings Bank Co., Ltd As of and for the Year Ended December 31, 2011 Assets Liabilities Equity Operating
revenue Profit for the
period Total
compre-
hensive
income for
the period (In millions of Korean won) (Won) 256,512,260 (Won) 237,443,855 (Won) 19,068,405 (Won) 22,274,350 (Won) 2,047,881 (Won) 1,601,009
Co., Ltd.(1) 13,349,351 10,567,141 2,782,210 2,426,030 319,794 328,188
Co., Ltd.(1) 3,314,875 2,792,356 522,519 787,354 28,169 37,732
Co., Ltd.(1) 4,515,809 4,161,121 354,688 1,220,799 18,572 24,842
Co., Ltd 177,691 57,612 120,079 83,855 (5,655 ) (5,603 ) 251,228 106,584 144,644 51,564 15,405 15,512
Co., Ltd.(1) 498,506 382,444 116,062 61,574 9,322 10,360 30,529 8,069 22,460 54,874 (2,391 ) (2,391 ) 30,590 14,370 16,220 117,467 2,148 2,148 2013 Assets Liabilities Equity Operating
income
(revenue) Profit(loss)
for the year Total compre-
hensive
income(loss) for
the year (In millions of Korean won) ₩ 265,258,942 ₩ 244,641,628 ₩ 20,617,314 ₩ 17,461,406 ₩ 819,719 ₩ 883,258 15,854,992 12,385,131 3,469,861 2,990,037 384,411 390,228 2,525,070 1,973,888 551,182 577,649 11,856 5,436 6,945,605 6,396,477 549,128 1,457,365 9,098 (23,209 ) 237,907 36,335 201,572 103,401 74,685 74,560 182,657 13,612 169,045 46,524 2,110 2,835 241,227 110,640 130,587 34,497 6,078 7,145 30,142 7,687 22,455 43,627 (336 ) (336 ) 21,753 6,880 14,873 50,440 19 115 584,025 449,087 134,938 47,865 (301 ) (1,482 ) 189,243 164,084 25,159 4,791 (5,331 ) (5,259 )
Financial information is based on its consolidated financial statements. |
Kookmin BankNature of the risks associated with interests in consolidated structured entities
KookminThe terms of contractual arrangements require to provide financial support to a consolidated structured entity
The Group has provided ABCP purchase commitment of ₩101,000 million to KH First Co., Ltd., the Group’s subsidiary, that had issued ABCP. This purchase commitment would require the Group to purchase unsold ABCP if there is a shortage of the investors for the ABCP issued by the structured entity.
The Group provides capital commitment to KB Wise Star Private Real Estate Feeder Fund 1st. and 8 other subsidiaries. The unexecuted amount of the investment agreement is ₩408,887 million. Based on the capital commitment, the Group is subject to increase its investment by the request from the asset management company or the additional agreement among investors.
The Group provides the guarantees of payment of principal or principal and fixed rate of return in case the operating results of the trusts are less than the guaranteed principal or principal and fixed rate of return.
Changes in subsidiaries
Yehansoul Savings Bank engages inCo., Ltd., KB Startup Investment, KB Evergreen Private Securities 63 and 46 other private equity funds, and Wise Mobile Second, Third, Fourth, Fifth, Sixth, Seventh Securitization and KB Star Retail Private Real Estate Feeder Fund First were newly consolidated during the banking business in accordance with Banking Act,year ended December 31,
2013. Yurie Select Private Securities Investment Trust 32 and 44 other private equity funds, KB K-Alpha private equity trust business in accordance with Capital Market and Financial Investment Business ActNew Star First Ltd. have been excluded from consolidation due to their liquidation. Also, KB Private Real Estate Securities Fund1 (NPL) and other relevant businesses. AsWoori KA First Asset Securitization Specialty Co., Ltd. have been excluded from consolidation due to the loss of control.
For the year ended December 31, 2011, Kookmin Bank has 1,165 domestic branches and offices and 7 overseas branches (excluding 32012, the following table summarizes the information relating to the Group’s subsidiaries and 2 offices). Kookmin Bank’s capital stockthat have material non-controlling interests, before any intra-group eliminations, are as of December 31, 2011, is (Won) 2,021,896 million.follows:
KB Kookmin Card Co., Ltd.
KB Kookmin Card Co., Ltd. (the “KB Kookmin Card”) was established upon spin off of Kookmin Bank’s credit card business segment in March 2011, to engage in the credit card business under the Act on Registration of Credit Business and Protection of Finance Users and other related business. Its headquarters are located in Seoul. KB Kookmin Card’s capital stock as of December 31, 2011, is (Won) 460,000 million.
KB Investment & Securities Co., Ltd.
KB Investment & Securities Co., Ltd. (the “KB Investment & Securities”) was established on August 16, 1995, to engage in financial investment business services including investment trading services and brokerage services and in other related services in accordance with the Capital Market and Financial Investment Business Act. On March 11, 2008, the former Hannuri Investment & Securities changed its name to KB Investment & Securities. KB Investment & Securities Co., Ltd. merged with KB Futures Co., Ltd. on March 12, 2011. Its headquarters are located in Seoul. KB Investment & Securities’ capital stock as of December 31, 2011, is (Won) 157,942 million.
KB Life Insurance Co., Ltd.
KB Life Insurance Co., Ltd. (the “KB Life Insurance”) was established on April 29, 2004, to engage in financial insurance operations. On May 31, 2004, the company merged with Hanil Life Insurance Co., Ltd., undertaking all the insurance contracts and related assets and liabilities. The life insurance business under the Insurance Business Act is one of the company’s major business operations. Its headquarters are located in Seoul. KB Life Insurance’s capital stock as of December 31, 2011, is (Won) 276,000 million.
KB Asset Management Co., Ltd.(1)
KB Asset Management Co., Ltd. (the “KB Asset Management”) was established on April 1988 to engage in investment advisory services including consulting and providing information on investments in securities. On July 1997, it started to engage in collective investment businesses (previously known as security investment trust operations) under the Capital Market and Financial Investment Business Act (previously called the Security Investment Trust Business Act). Its headquarters are located in Seoul. KB Asset Management’s capital stock as of December 31, 2011, is (Won) 38,338 million.
Real Estate Trust Co., Ltd.
KB Real Estate Trust Co., Ltd. (the “KB Real Estate Trust”) was established on December 3, 1996, to provide real estate trust services including land trust. Under the Capital Market and Financial Investment Business Act (previously called the Trust Business Act), the Financial Services Commission authorized the company to engage in real estate trust service. On September 16, 2002, the name of the company changed to KB Real Estate Trust Co., Ltd. from Jooeun Real Estate Trust Inc. Its headquarters are located in Seoul. KB Real Estate Trust’s capital stock as of December 31, 2011, is (Won) 80,000 million.
KB Investment Co., Ltd.
KB Investment Co., Ltd. (the “KB Investment”) was established on March 27, 1990, to provide services to small startup companies. Its main business is to invest in venture companies and small startup companies, and to organize startup investment cooperatives and private equity funds. On April 3, 1990, the company, under Section 7 of the Support for Small and Medium Enterprise Establishment Act, was listed on the Small Business Administration as a small startup business investment organization. KB Investment purchases impaired loans, invests in companies under debt restructuring process, and sells reorganized companies after normalization. In March 2001, the company, under the Industrial Development Act, registered as a Corporate Restructuring Company in the Ministry of Knowledge Economy. As approved by its shareholders on June 25, 2009, its name was changed to KB Investment Co., Ltd. Its headquarters are located in Seoul. KB Investment’s capital stock as of December 31, 2011, is (Won) 44,759 million.
KB Credit Information Co., Ltd.
KB Credit Information Co., Ltd. (the “KB Credit Information”) was established on October 9, 1999, under the Credit Information Protection Act to engage in loan collection services and credit research services. On May 2, 2002, the company merged with KM Credit Information Inc. to improve management of subsidiaries. As approved by its shareholders on October 28, 2002, its name was changed from Kookeun Credit Information Co., Ltd. to KB Credit Information Co., Ltd. Its headquarters are located in Seoul. KB Credit Information’s capital stock as of December 31, 2011, is (Won) 6,262 million.
KB Data Systems Co., Ltd.
KB Data Systems, Co., Ltd. (the “KB Data Systems”) was established on September 1991 to engage in computer system development and its sales, system maintenance, and information technology outsourcing services. Its headquarters are located in Seoul. KB Data Systems’ capital stock as of December 31, 2011, is (Won) 8,000 million.
Kookmin Bank Int’l Ltd.(London)
Kookmin Bank Int’l Ltd.(London) was established in November 1991 and operates its businesses mainly in general banking, trading finance, foreign currency exchange, and derivatives. Its name was changed from Korea Long Term Credit Bank Int’l Ltd. to Kookmin Bank Int’l Ltd.(London) when the Bank merged with Korea Long Term Credit Bank in January 1999. The headquarters are located in London, England. Kookmin Bank Int’l Ltd.(London)’s capital stock as of December 31, 2011, is USD 30,392,000.
Kookmin Bank Hong Kong Ltd.
Kookmin Bank Hong Kong Ltd. was established in July 1995 and operates its businesses in general banking and trading finance. The headquarters are located in Hong Kong. Kookmin Bank Hong Kong Ltd.’s capital stock as of December 31, 2011, is USD 20,000,000.
Kookmin Bank Cambodia PLC.
Kookmin Bank acquired 51% of ownership of Kookmin Bank Cambodia PLC. in May 2009. As of December 31, 2011, Kookmin Bank owns 53.19% through participation in capital stock increase in December 2010. In particular, Kookmin Bank Cambodia PLC. mainly operates lending, borrowing, foreign currency exchange services, and other ordinary banking businesses. The headquarters are located in Phnom Penh, Cambodia. Kookmin Bank Cambodia PLC.’s capital stock as of December 31, 2011, is USD 16,000,000.
Special Purpose Entities(SPEs)
Subsidiaries are all entities (including SPEs) over which the Group has the power to govern the financial and operating policies generally accompanying a shareholding of more than one half of the voting rights. However, there are some cases where the Group may still control some entities, mostly SPEs, with less than one half of the voting rights for a single, well-defined, and narrow purpose. SPEs may take the form of a corporation, trust, partnership or unincorporated entity. SPEs often are created with legal arrangements that impose strict and sometimes permanent limits on the decision-making powers of their governing board, trustee or management over the operations of the SPE. Frequently, these provisions specify that the policy guiding the ongoing activities of the SPE cannot be modified, other than perhaps by its creator or sponsor.
The Group consolidates an SPE when, in substance, the Group controls the SPE as follows:
In substance, the activities of the SPE are being conducted on behalf of the entity according to its specific business needs so that the Group obtains benefits from the SPE’s operations;
In substance, the Group has the decision-making powers to obtain the majority of the benefits of the activities of the SPE or, by setting up an ‘autopilot’ mechanism, the Group has delegated these decision-making powers;
In substance, the Group has rights to obtain the majority of the benefits of the SPE and therefore may be exposed to risks incident to the activities of the SPE; or
In substance, the Group retains the majority of the residual or ownership risks related to the SPE or its assets in order to obtain benefits from its activities.
The types of SPEs include asset-backed securitization specialty companies, project financing companies, private equity funds, and partnerships. The purpose of business activities of SPEs are the asset-backed securitization, providing lines of credit and loans, investing in equity shares and managing assets.
Changes in subsidiaries
KB Kookmin Card First Securitization Co., Ltd., 2011 KIF-KB IT Venture Fund, KoFC-KB Young Pioneer 1st Fund and KB Evergreen Private Securities 35(Bond) and other 47 private equity funds are newly included in consolidation. KB Investment & Securities Hong Kong Ltd., Kookmin No,16 Investment Partnership, KB 9th Securitization Specialty Co., Ltd. and five asset-backed securitization SPEs and PCA Income Private Securities A-5(Bond) and other 31 private equity funds have been excluded from consolidation because those were liquidated. In March, 2011, Kookmin Bank spun off its credit card business segment and established a new subsidiary, KB Kookmin Card Co., Ltd., and KB investment & Securities Co., Ltd. merged with KB Futures Co., Ltd.
41. Finance/Operating Lease
41.1 Finance lease
The future minimum lease payments arising as of December 31, 2011, are as follows:
| (In millions of Korean won) | ||||
| ||||
| ||||
| ₩ | 5,987,928 | ||
Liabilities of subsidiaries | ||||
| ||||
Non-controlling interests | 192,668 | |||
Profit attributable to non-controlling interests | ||||
Operating profit of subsidiaries | 22,769 | |||
Profit of subsidiaries | 16,645 | |||
Total comprehensive income of subsidiaries | 38,498 | |||
Profit attributable to non-controlling interests | 8,156 | |||
Cash flows of subsidiaries | ||||
Cash flows from operating activities | 833,231 | |||
Cash flows from investing activities | (826,956 | ) | ||
Cash flows from financing activities | 300 | |||
|
| |||
| ₩ | |||
|
| |||
| (1) |
|
Changes in non-controlling interest
The Group acquired an additional equity interest in Kookmin Bank Cambodia PLC in July 2012 for ₩8,048 million, with the carrying amount of the non-controlling interest being ₩8,364 million. The Group derecognized non-controlling interests of ₩7,013 million and recorded a decrease in equity attributable to shareholders of the parent entity of ₩1,035 million. In June 2013, the parent entity acquired an additional equity interest in Kookmin Bank Cambodia PLC for ₩1,463 million, with the carrying amount of the non-controlling interest being ₩1,495 million. This resulted in the elimination of non-controlling interest equity for Kookmin Bank Cambodia PLC and the remaining ₩32 million was recognized as an increase in the Group’s equity attributable to shareholders of the parent company. As of December 31, 2012, the Group owned 92.44%, which has increased to 100% as of December 31, 2013.
In addition, the Group acquired an additional equity interest in KB Life Insurance Co., Ltd. for ₩166,830 million, with the carrying amount of the non-controlling interest being ₩181,955 million. This resulted in the elimination of non-controlling interest equity for KB Life Insurance Co., Ltd. and the remaining ₩15,125 million was recognized as an increase in the Group’s equity attributable to shareholders of the parent company. As of December 31, 2012, the Group owned 51%, which has increased to 100% as of December 31, 2013.
41. Unconsolidated Structured Entity
As of December 31, 2013, the nature, purpose and activities of the unconsolidated structured entities and how the structured entities are financed, are as follows:
| ||||||
| ||||||
| ||||||
| ||||||
| Methods of Financing | |||||
Asset-backed securitization | Early cash generation through transfer of securitization assets Fees earned as services to SPC, such as providing lines of credit and ABCP purchase commitments | Fulfillment of Asset-backed securitization plan Purchase and transfer of securitization assets Issuance and repayment of ABS and ABCP | Issuance of ABS and ABCP based on securitization assets | |||
Project Financing | Granting PF loans to SOC and real estate Granting loans to ships/aircrafts SPC | Construction of SOC and real property Building ships/ construction and purchase of aircrafts | Loan commitments through Credit Line, providing lines of credit and investment agreements | |||
Trusts | Management of trusts with no guarantee of the principal | Management of trust assets Payment of trust fees and allocation of trust profits | Sales of trust financial instruments | |||
Investment funds | Investment in beneficiary certificates Investment in PEF and partnerships | Management of fund assets Payment of fund fees and allocation of fund profits | Sales of beneficiary certificate instruments Investment of managing partners and limited partners | |||
41.2
As of December 31, 2013, the size of the unconsolidated structured entities and the risks associated with its interests in unconsolidated structured entities, are as follows:
| Asset-backed securitization | Project Financing | Trusts | Investment funds | Others | Total | |||||||||||||||||||
| (In millions of Korean won) | ||||||||||||||||||||||||
Total assets of unconsolidated Structured Entity | ₩ | 12,631,056 | ₩ | 24,605,331 | ₩ | 2,261,415 | ₩ | 12,618,790 | ₩ | 3,502,834 | ₩ | 55,619,426 | ||||||||||||
Carrying amount on financial statements | ||||||||||||||||||||||||
Assets | ||||||||||||||||||||||||
Loans | 382,478 | 3,155,621 | — | — | 291,599 | 3,829,698 | ||||||||||||||||||
Financial investments | 1,121,676 | 97,754 | — | 525,680 | — | 1,745,110 | ||||||||||||||||||
Investment in associates | — | — | — | 403,153 | — | 403,153 | ||||||||||||||||||
Other assets | — | — | 165,709 | 1,909 | — | 167,618 | ||||||||||||||||||
|
|
|
|
|
|
|
|
|
|
|
| |||||||||||||
Sub-total | ₩ | 1,504,154 | ₩ | 3,253,375 | ₩ | 165,709 | ₩ | 930,742 | ₩ | 291,599 | ₩ | 6,145,579 | ||||||||||||
|
|
|
|
|
|
|
|
|
|
|
| |||||||||||||
Liabilities | ||||||||||||||||||||||||
Deposits | 306,931 | 487,818 | — | 8,142 | 5,473 | 808,364 | ||||||||||||||||||
Other liabilities | — | 14 | — | 144 | — | 158 | ||||||||||||||||||
|
|
|
|
|
|
|
|
|
|
|
| |||||||||||||
Sub-total | ₩ | 306,931 | ₩ | 487,832 | ₩ | — | ₩ | 8,286 | ₩ | 5,473 | ₩ | 808,522 | ||||||||||||
|
|
|
|
|
|
|
|
|
|
|
| |||||||||||||
Maximum exposure to loss(1) | ₩ | 4,672,378 | ₩ | 5,714,293 | ₩ | 294,043 | ₩ | 2,476,902 | ₩ | 386,000 | ₩ | 13,543,616 | ||||||||||||
|
|
|
|
|
|
|
|
|
|
|
| |||||||||||||
Methods of determining the maximum exposure to | | Providing lines of credit and purchase commitments | | | Investments /loans, Loan commitments /investment agreements /purchase commitments and Acceptances and guarantees | | | Principal /principal and interest trust: Total amount of trust asset | | | Investments /loans and capital commitments | | | Loan commitments | | |||||||||
| (1) | Maximum exposure to loss includes the asset amounts, after deducting loss(provision for assets, impairment losses and others), recognized in the financial statements of the Group. |
42. Finance/Operating Lease
42.1 Finance lease
The future minimum lease payments arising as of December 31, 2012 and 2013, are as follows:
| 2012 | 2013 | |||||||
| (In millions of Korean won) | ||||||||
Net carrying amount of finance lease assets | ₩ | 16,856 | ₩ | 16,955 | ||||
Minimum lease payment | ||||||||
Within 1 year | ₩ | 2,310 | ₩ | 1,927 | ||||
1-5 years | 1,427 | — | ||||||
|
|
|
| |||||
Total | ₩ | 3,737 | ₩ | 1,927 | ||||
|
|
|
| |||||
Present value of minimum lease payment | ||||||||
Within 1 year | ₩ | 2,163 | ₩ | 1,873 | ||||
1-5 years | 1,386 | — | ||||||
|
|
|
| |||||
Total | ₩ | 3,549 | ₩ | 1,873 | ||||
|
|
|
| |||||
42.2 Operating lease
42.2.1 The Group as operating lessee
The future minimum lease payments arising from the non-cancellable lease contracts as of December 31, 2011,2012 and 2013, are as follows:
| ||||
| ||||
| ||||
| ||||
| ||||
| ||||
| ||||
| ||||
| ||||
| ||||
| ||||
| 2012 | 2013 | |||||||
| (In millions of Korean won) | ||||||||
Minimum lease payment | ||||||||
Within 1 year | ₩ | 118,305 | ₩ | 121,446 | ||||
1-5 years | 102,855 | 108,962 | ||||||
Over 5 years | 643 | 67 | ||||||
|
|
|
| |||||
Total | ₩ | 221,803 | ₩ | 230,475 | ||||
|
|
|
| |||||
Minimum sublease payment | (154 | ) | (367 | ) | ||||
The lease payment reflected in profit or loss for the years ended December 31, 2011, 2012 and 2013, are as follows:
| 2011 | 2012 | 2013 | ||||||||||
| (In millions of Korean won) | ||||||||||||
Lease payment reflected in profit or loss | ||||||||||||
Minimum lease payment | ₩ | 188,854 | ₩ | 201,450 | ₩ | 204,164 | ||||||
Contingent rent | 4 | — | — | |||||||||
Sublease payment | (53 | ) | (165 | ) | (118 | ) | ||||||
|
|
|
|
|
| |||||||
Total | ₩ | 188,805 | ₩ | 201,285 | ₩ | 204,046 | ||||||
|
|
|
|
|
| |||||||
42.2.2 The Group as operating lessor
The future minimum lease receipts arising from the non-cancellable lease contracts as of December 31, 2012 and 2013, are as follows:
| 2012 | 2013 | |||||||
| (In millions of Korean won) | ||||||||
Minimum lease receipts | ||||||||
Within 1 year | ₩ | 2,028 | ₩ | 8,327 | ||||
1-5 years | 443 | 22,280 | ||||||
|
|
|
| |||||
Total | ₩ | 2,471 | ₩ | 30,607 | ||||
|
|
|
| |||||
42.43. Related Party Transactions
SignificantProfit and loss arising from transactions with related parties for the years ended December 31, 20102011, 2012 and 2011,2013, are as follows:
| For the Year Ended December 31, 2010 | ||||||||||||||
| Interest income and others | Provision (reversal) | Interest expense and others | ||||||||||||
| (In millions of Korean won) | ||||||||||||||
Associates | Korea Credit Bureau Co., Ltd | (Won) | 3 | (Won) | — | (Won) | 186 | |||||||
| UAMCO., Ltd | 1,950 | 71 | 95 | |||||||||||
| KB Global Star Game & Apps SPAC | 321 | — | 76 | |||||||||||
| Testian Co., Ltd | 46 | 21 | — | |||||||||||
| Semiland Co., Ltd | 25 | 7 | — | |||||||||||
| Powerrex Corporation Co., Ltd | 32 | (5 | ) | 1 | ||||||||||
| Sehwa Electronics Co., Ltd | 37 | (3 | ) | 17 | ||||||||||
| Serit Platform Co., Ltd | 60 | (24 | ) | 5 | ||||||||||
| KT Wibro infrastructure Co., Ltd | 3 | — | 55 | |||||||||||
Joint venture | Burrill-KB Life Science Fund | 1,205 | — | 785 | ||||||||||
Key management | 10,403 | 30 | 534 | |||||||||||
Other | Retirement pension | 107 | — | 453 | ||||||||||
|
|
|
|
|
| |||||||||
Total | (Won) | 14,192 | (Won) | 97 | (Won) | 2,207 | ||||||||
|
|
|
|
|
| |||||||||
| 2011 | 2012 | 2013 | ||||||||||||
| (In millions of Korean won) | ||||||||||||||
Associates | ||||||||||||||
Korea Credit Bureau Co., Ltd. | Fee and commission income | ₩ | — | ₩ | 3 | ₩ | 3 | |||||||
Interest expense | 168 | 143 | 139 | |||||||||||
UAMCO., Ltd. | Interest income | 1,196 | 297 | 31 | ||||||||||
| Reversal for credit loss | — | 68 | — | |||||||||||
| Other operating income | 13,455 | — | — | |||||||||||
| Other operating expense | 40,879 | 93,266 | 7,626 | |||||||||||
JSC Bank CenterCredit | Interest expense | 218 | — | — | ||||||||||
CH Engineering Co., Ltd. | Reversal for credit loss | — | 106 | — | ||||||||||
Kores Co., Ltd. | Interest income | — | 317 | 386 | ||||||||||
| Fee and commission income | — | 9 | — | |||||||||||
| Reversal for credit loss | — | — | 36 | |||||||||||
| Provision for credit loss | — | 325 | — | |||||||||||
Semiland Co., Ltd. | Interest income | 17 | 17 | 14 | ||||||||||
| Reversal for credit loss | 3 | 4 | — | |||||||||||
| Interest expense | 1 | — | — | |||||||||||
Powerrex Corporation Co., Ltd | Interest income | 74 | — | — | ||||||||||
| Reversal for credit loss | 104 | — | — | |||||||||||
| Interest expense | 1 | — | — | |||||||||||
Incheon Bridge Co., Ltd. | Interest income | — | — | 14,592 | ||||||||||
| Reversal for credit loss | — | — | 2 | |||||||||||
| Interest expense | — | — | 909 | |||||||||||
Ssangyong Engineering & Construction Co., Ltd. | Interest income | | — | | | — | | | 2,007 | | ||||
| Reversal for credit loss | — | — | 7,500 | |||||||||||
United PF 1st Recovery Private Equity Fund1 | Interest income | — | 500 | 91 | ||||||||||
| Other operating income | 30,722 | 1,900 | — | |||||||||||
| Reversal for credit loss | — | 7 | 83 | |||||||||||
| Interest expense | — | 28 | — | |||||||||||
KBIC Private Equity Fund No. 3 | Other operating income | — | 300 | 300 | ||||||||||
| Interest expense | — | — | 91 | |||||||||||
NPS KBIC Private Equity Fund No. 1 | Other operating income | — | 474 | 474 | ||||||||||
KoFC KBIC Frontier Champ2010-5(PEF) KoFC POSCO HANHWA KB shared growth Private Equity Fund KB GwS Private Securities Investment Trust KB Star office Private real estate Investment Trust No.1 Evalley Co., Ltd.(1) PyungJeon Industries Co., LTD.(1) Testian Co., Ltd. Serit Platform Co., Ltd.(1) Sehwa Electronics Co., Ltd.(1) DS Plant Co., Ltd.(1) KB Global Star Game & Apps SPAC(1) Interest income Joam Housing Development Co., Ltd.(1) Sunoo Co., Ltd.(1) Burrill-KB Life Science Fund Key management Other Retirement pension 2011 2012 2013 (In millions of Korean won) Other operating income — 1,000 1,014 Other operating income — 303 569 Fee and commission income — 12,978 — Interest expense — 9 75 Reversal for credit loss — 77 — Reversal for credit loss — — 1,055 Provision for credit loss — 343 — Interest income 24 104 10 Other operating income — 15 — Provision for credit loss 8 — — Interest income 85 78 58 Fee and commission income — 27 17 Provision for credit loss 26 4 74 Fee and commission income — 33 — Gains on financial assets/liabilities at fair value through profit or loss — 2 35 Interest income 21 — — Interest expense 19 10 — Fee and commission expense — — 7 Losses on financial assets/liabilities at fair value through profit or loss — 143 — Interest income 376 315 211 Fee and commission income — — 4 Reversal for credit loss (39 ) 3 2 Other operating income — 8 8 Interest expense — 1 2 Fee and commission expense — 2 — Losses on financial assets/liabilities at fair value through profit or loss — — 26 1,443 77 60 Gains on financial assets/liabilities at fair value through profit or loss — 158 273 Other operating income — 3 — Other non-operating income — — 7 Interest expense 36 430 10 Other operating expense — — 4 Interest expense — 1 — Interest expense — — 1 Net non-operating expense 17 — — Interest income and others 397 276 460 Reversal for credit loss (7 ) 1 9 Interest expense and others 289 167 332 Fee and commission income 199 415 386 Interest expense 898 1,699 1,971
| For the Year Ended December 31, 2011 | ||||||||||||||||||||||
| Gain on sale of loans | Interest income and others | Provision (reversal) | Loss on sale of loans | Interest expense and others | ||||||||||||||||||
| (In millions of Korean won) | ||||||||||||||||||||||
Associates | Korea Credit Bureau Co., Ltd | (Won) | — | (Won) | — | (Won) | — | (Won) | — | (Won) | 168 | |||||||||||
| UAMCO., Ltd | 13,455 | 1,196 | (3 | ) | 40,879 | 3 | ||||||||||||||||
KB Global Star Game & Apps SPAC | — | 1,443 | — | — | 36 | |||||||||||||||||
| Testian Co., Ltd | — | 24 | 8 | — | — | |||||||||||||||||
United PF 1st Recovery Private Equity Fund | 30,722 | — | — | — | — | |||||||||||||||||
| JSC Bank CenterCredit | — | — | — | — | 218 | |||||||||||||||||
| Semiland Co., Ltd | — | 17 | (3 | ) | — | 1 | ||||||||||||||||
| Powerrex Corporation Co., Ltd | — | 74 | (104 | ) | — | 1 | ||||||||||||||||
| Sehwa Electronics Co., Ltd | — | 21 | — | — | 19 | |||||||||||||||||
| Serit Platform Co., Ltd | — | 85 | 26 | — | — | |||||||||||||||||
| DS Plant Co., Ltd | — | 376 | 39 | — | — | |||||||||||||||||
Joint venture | Burrill-KB Life Science Fund | — | — | — | — | 17 | ||||||||||||||||
Key management | — | 397 | (1 | ) | — | 297 | ||||||||||||||||
Other | Retirement pension | — | 199 | — | — | 898 | ||||||||||||||||
|
|
|
|
|
|
|
|
|
| |||||||||||||
Total | (Won) | 44,177 | (Won) | 3,832 | (Won) | (38 | ) | (Won) | 40,879 | (Won) | 1,658 | |||||||||||
|
|
|
|
|
|
|
|
|
| |||||||||||||
| (1) | Not considered to be the Group’s related party as at December 31, 2013. |
The details of receivables and payables, and related allowances for loans losses arising from the related party transactions as of January 1, 2010, and December 31, 20102012 and 2011,2013, are as follows:
| As of January 1, 2010 | ||||||||||||||
| Receivables | Allowances for loan losses | Payables | ||||||||||||
| (In millions of Korean won) | ||||||||||||||
Associates | Korea Credit Bureau Co., Ltd | (Won) | — | (Won) | — | (Won) | 4,997 | |||||||
UAMCO., Ltd | — | — | 11,178 | |||||||||||
Semiland Co., Ltd | 1 | — | 10 | |||||||||||
Powerrex Corporation Co., Ltd | 150 | 109 | 86 | |||||||||||
Sehwa Electronics Co., Ltd | 1 | 3 | 903 | |||||||||||
Serit Platform Co., Ltd | 368 | 74 | 593 | |||||||||||
Joint venture | Burrill-KB Life Science Fund | — | — | — | ||||||||||
Key management | 194,249 | 633 | 111,505 | |||||||||||
Other | Retirement pension | — | — | 8,351 | ||||||||||
|
|
|
|
|
| |||||||||
Total | (Won) | 194,769 | (Won) | 819 | (Won) | 137,623 | ||||||||
|
|
|
|
|
| |||||||||
| 2012 | 2013 | |||||||||
| (In millions of Korean won) | ||||||||||
Associates | ||||||||||
JSC Bank CenterCredit | Cash and due from financial institutions | ₩ | 161 | ₩ | 353 | |||||
Korea Credit Bureau Co., Ltd. | Deposits | 18,017 | 20,200 | |||||||
| Other liabilities | 32 | 64 | ||||||||
UAMCO., Ltd. | Deposits | 6 | 5 | |||||||
| Provisions | 191 | 192 | ||||||||
| Other liabilities | 1 | — | ||||||||
Kores Co., Ltd. | Loans and receivables (Gross amount) | 7,854 | 7,854 | |||||||
| Allowances for loan losses | 3,872 | 3,836 | ||||||||
| Other liabilities | 3 | 2 | ||||||||
Semiland Co., Ltd. | Loans and receivables (Gross amount) | —�� | 19 | |||||||
| Deposits | 1 | 1 | ||||||||
| Provisions | 3 | 3 | ||||||||
Incheon Bridge Co., Ltd. | Loans and receivables (Gross amount) | 263,080 | 249,362 | |||||||
| Allowances for loan losses | 302 | 300 | ||||||||
| Other assets | — | 1,343 | ||||||||
| Deposits | 33,569 | 30,991 | ||||||||
| Other liabilities | 305 | 240 | ||||||||
Ssangyong Engineering & Construction Co., Ltd. | Loans and receivables (Gross amount) | — | 47,104 | |||||||
Allowances for loan losses | — | 38,784 | ||||||||
Deposits | — | 61 | ||||||||
Other liabilities | — | 14 | ||||||||
Terra Co., Ltd. | Deposits | — | 1 | |||||||
United PF 1st Recovery Private Equity Fund1 | Loans and receivables (Gross amount) | 2,805 | — | |||||||
Allowances for loan losses | 5 | — | ||||||||
Other assets | 4 | — | ||||||||
Provisions | 160 | 82 | ||||||||
Other liabilities | 1 | — | ||||||||
KB-Glenwood Private Equity Fund 1 | Deposits | — | 1 | |||||||
KBIC Private Equity Fund No. 3 | Other assets | 75 | 76 | |||||||
Deposits | — | 1,400 | ||||||||
Other liabilities | — | 25 | ||||||||
NPS KBIC Private Equity Fund No. 1 | Other assets | 65 | 65 | |||||||
Other liabilities | 125 | 42 | ||||||||
KoFC KBIC Frontier Champ 2010-5(PEF) | Other assets | | 251 | | | 266 | | |||
KoFC POSCO HANHWA KB shared growth Private Equity Fund | Other assets | 303 | 569 | |||||||
KB Star office Private real estate Investment Trust No.1 | Deposits | | 4,850 | | | 8,142 | | |||
Other liabilities | 9 | 31 | ||||||||
PyungJeon Industries Co.,LTD.(1) | Loans and receivables (Gross amount) | 2,125 | — | |||||||
Allowances for loan losses | 1,055 | — | ||||||||
Other liabilities | 1 | — | ||||||||
Testian Co., Ltd.(1) | Investments in associates | 413 | — | |||||||
Serit Platform Co., Ltd.(1) Loans and receivables (Gross amount) Allowances for loan losses Other assets Deposits Sehwa Electronics Co., Ltd.(1) Derivative financial liabilities Deposits Provisions Other liabilities DS Plant Co., Ltd.(1) Loans and receivables (Gross amount) Allowances for loan losses Investments in associates Other assets Deposits Provisions Other liabilities KB Global Star Game & Apps SPAC(1) Derivative financial assets Loans and receivables (Gross amount) Investments in associates Deposits Other liabilities Joam Housing Development Co., Ltd.(1) Deposits Key management Loans and receivables (Gross amount) Allowances for loan losses Other assets Deposits Insurance contract liability Other liabilities Provisions Other Retirement pension Other assets Deposits Other liabilities 2012 2013 (In millions of Korean won) 767 — 80 — 2 — 48 — 75 — 72 — 11 — 7 — 3,254 — 12 — 964 — 14 — 45 — 3 — 2 — 1,776 — 1,001 — 262 — 897 — 2 — 236 — 5,741 4,765 21 1 6 6 8,585 5,798 313 770 71 62 44 2 195 166 50,317 48,840 1,099 908
| As of December 31, 2010 | ||||||||||||||
| Receivables | Allowances for loan losses | Payables | ||||||||||||
| (In millions of Korean won) | ||||||||||||||
Associates | Korea Credit Bureau Co., Ltd | (Won) | — | (Won) | — | (Won) | 9,725 | |||||||
| UAMCO., Ltd | 40,330 | 71 | 15 | |||||||||||
| KB Global Star Game & Apps SPAC | 1,083 | — | 1,472 | |||||||||||
| Testian Co., Ltd | 610 | 21 | — | |||||||||||
| Semiland Co., Ltd | 229 | 7 | — | |||||||||||
| Joam Housing Development Co., Ltd | — | — | 75 | |||||||||||
| Powerrex Corporation Co., Ltd | 3,288 | 104 | 10 | |||||||||||
| Sehwa Electronics Co., Ltd | 350 | — | 25 | |||||||||||
| Serit Platform Co., Ltd | 786 | 50 | 9 | |||||||||||
Joint venture | Burrill-KB Life Science Fund | — | — | — | ||||||||||
Key management | 154,763 | 72 | 14,559 | |||||||||||
Other | Retirement pension | — | — | 7,919 | ||||||||||
|
|
|
|
|
| |||||||||
Total | (Won) | 201,439 | (Won) | 325 | (Won) | 33,809 | ||||||||
|
|
|
|
|
| |||||||||
Associates KB Global Star Game & Apps SPAC Joam Housing Development Co., Ltd Powerrex Corporation Co., Ltd Joint venture Key management Other Total As of December 31, 2011 Receivables Allowances for
loan losses Payables (In millions of Korean won) Korea Credit Bureau Co., Ltd (Won) — (Won) — (Won) 12,575 UAMCO., Ltd 38,745 68 146 JSC Bank CenterCredit — — 23,066 2,488 — 21,766 Testian Co., Ltd 632 29 — Semiland Co., Ltd 151 4 114 — — 58 — — 10 Sehwa Electronics Co., Ltd 38 — 649 Serit Platform Co., Ltd 768 76 17 DS Plant Co., Ltd 3,167 39 97 Burrill-KB Life Science Fund — — — 22,433 33 8,814 Retirement pension — — 36,516 (Won) 68,422 (Won) 249 (Won) 103,828
| (1) | Not considered to be the Group’s related party as at December 31, 2013. |
According to IAS 24, the Group includes subsidiaries, associates, joint ventures, key management (including family members), and post-employment benefit plans of the Group in the scope of related parties. Additionally, the Group discloses balances (receivables and payables) and other amounts arising from the related party transactions in the notes to the consolidated financial statements. Refer to Note 13 for details on investments in associates and joint ventures.associates.
Key management includes the directors of the Parent Company and the directors of Kookmin Bank and subsidiariescompanies where the directors andand/or their close family members have the power to influence the decision-making process. The Group recognized receivables amounting to (Won) 194,249 million, (Won) 154,763 million and (Won) 22,433 million as of January 1, 2010, and December 31, 2010 and 2011, respectively, and related allowances for loan losses amounting to (Won) 633 million, (Won) 72 million and (Won) 33 million as of January 1, 2010, and December 31, 2010 and 2011, from the sale to key management. Of those respective amounts, receivables amounting to (Won) 190,760 million, (Won) 152,023 million and (Won) 16,497 million, and related allowance for loan loss amounting to (Won) 628 million, (Won) 68 million and (Won) 21 million, are from companies where key management has a power to influence the decision-making process.
Accrued severance benefit plan is based on the retirement benefit pension plan with the Group and related parties enrolled in. The Group discloses receivable and payable balances arising from transactions between the Group and the retirement benefit pension plan assets in the notes to the financial statements. Kookmin Bank, one of the subsidiaries of the Group, has received deposits of (Won) 8,351 million, (Won) 7,919 million and (Won) 36,516 million as of January 1, 2010, and December 31, 2010 and 2011, respectively, from the retirement benefit pension plan and accounted for the amounts received as deposits under liabilities.control or joint control.
GuaranteesUnused commitments to related parties as of January 1, 2010, and December 31, 20102012 and 2011,2013, are as follows:
| As of January 1, | As of December 31, | 2012 | 2013 | |||||||||||||||||||||
| 2010 | 2010 | 2011 | (In millions of Korean won) | |||||||||||||||||||||
| (In millions of Korean won) | ||||||||||||||||||||||||
Balhae Infrastructure Fund | Purchase of security investment | ₩ | 21,744 | ₩ | 21,744 | |||||||||||||||||||
UAMCO., Ltd. | Loan commitments in Korean won | (Won) | — | (Won) | 87,548 | (Won) | 89,077 | Loan commitments in Korean won | 127,800 | 127,800 | ||||||||||||||
Purchase of security investment | 162,750 | 89,950 | 89,950 | Purchase of security investment | 89,950 | 89,950 | ||||||||||||||||||
Sehwa Electronics Co., Ltd. and others | Loan commitments in Korean won | — | 3,940 | 2,891 | ||||||||||||||||||||
United PF 1st Recovery Private Equity Fund | Loan commitments in Korean won | 106,395 | 54,600 | |||||||||||||||||||||
Others | 2,566 | 2,790 | 2,171 | Purchase of security investment | 49,383 | 49,383 | ||||||||||||||||||
KoFC KBIC Frontier Champ 2010-(PEF) | Purchase of security investment | 17,850 | 2,200 | |||||||||||||||||||||
KoFC POSCO HANHWA KB shared growth Private Equity Fund | Purchase of security investment | 43,750 | 35,975 | |||||||||||||||||||||
Incheon Bridge Co., Ltd. | Purchase of security investment | 37,587 | 42,088 | |||||||||||||||||||||
KB GwS Private Securities Investment Trust | Loan commitments | 2,899 | 757 | |||||||||||||||||||||
| Purchase of security investment | 1,119 | 1,119 | ||||||||||||||||||||||
| Other commitments | 88,151 | — | ||||||||||||||||||||||
The detailsUnused commitments received from related parties as of compensationDecember 31, 2012 and 2013, are as follows:
| 2012 | 2013 | |||||||||
| (In millions of Korean won) | ||||||||||
Associates | ||||||||||
Ssangyong Engineering & Construction Co., Ltd. | Acceptances and Guarantees Outstanding in Won | ₩ | — | ₩ | 293,500 | |||||
Compensation to key management for the years ended December 31, 20102011, 2012 and 2011,2013, are as follows:
| For the Year Ended December 31, 2010 | 2011 | |||||||||||||||||||||||||||||||||||||||
| Short-term employee benefits | Post- employment benefit | Termination benefits | Share-based payments | Total | Short-term employee benefits | Post- employment benefit | Termination benefits | Share-based payments | Total | |||||||||||||||||||||||||||||||
| (In millions of Korean won) | (In millions of Korean won) | |||||||||||||||||||||||||||||||||||||||
Registered directors (executive) | (Won) | 2,996 | (Won) | 205 | (Won) | — | (Won) | (5,695 | ) | (Won) | (2,494 | ) | ₩ | 4,614 | ₩ | 284 | ₩ | — | ₩ | 2,654 | ₩ | 7,552 | ||||||||||||||||||
Registered directors (non-executive) | 559 | — | — | (254 | ) | 305 | 1,011 | — | — | (48 | ) | 963 | ||||||||||||||||||||||||||||
Non-registered directors | 8,212 | 301 | 243 | 4,632 | 13,388 | 5,769 | 505 | 135 | 840 | 7,249 | ||||||||||||||||||||||||||||||
|
|
|
|
|
|
|
|
|
| |||||||||||||||||||||||||||||||
Total | (Won) | 11,767 | (Won) | 506 | (Won) | 243 | (Won) | (1,317 | ) | (Won) | 11,199 | ₩ | 11,394 | ₩ | 789 | ₩ | 135 | ₩ | 3,446 | ₩ | 15,764 | |||||||||||||||||||
|
|
|
|
|
|
|
|
|
| |||||||||||||||||||||||||||||||
| For the Year Ended December 31, 2011 | ||||||||||||||||||||
| Short-term employee benefits | Post- employment benefit | Termination benefits | Share-based payments | Total | ||||||||||||||||
| (In millions of Korean won) | ||||||||||||||||||||
Registered directors (executive) | (Won) | 4,614 | (Won) | 284 | (Won) | — | (Won) | 2,654 | (Won) | 7,552 | ||||||||||
Registered directors (non-executive) | 1,011 | — | — | (48 | ) | 963 | ||||||||||||||
Non-registered directors | 5,769 | 505 | 135 | 840 | 7,249 | |||||||||||||||
|
|
|
|
|
|
|
|
|
| |||||||||||
Total | (Won) | 11,394 | (Won) | 789 | (Won) | 135 | (Won) | 3,446 | (Won) | 15,764 | ||||||||||
|
|
|
|
|
|
|
|
|
| |||||||||||
Registered directors (executive) Registered directors (non-executive) Non-registered directors Total 43. Approval of Financial Statements 2012 Short-term
employee
benefits Post-
employment
benefits Termination
benefits Share-based
payments Total (In millions of Korean won) ₩ 4,075 ₩ 230 ₩ — ₩ 3,480 ₩ 7,785 1,107 — — 18 1,125 6,067 436 — 3,751 10,254 ₩ 11,249 ₩ 666 ₩ — ₩ 7,249 ₩ 19,164
Registered directors (executive) Registered directors (non-executive) Non-registered directors Total The financial statements 2013 Short-term
employee
benefits Post-
employment
benefits Termination
benefits Share-based
payments Total (In millions of Korean won) ₩ 3,270 ₩ 144 ₩ — ₩ (578) ₩ 2,836 1,199 — — 13 1,212 7,305 380 1,024 5,686 14,395 ₩ 11,774 ₩ 524 ₩ 1,024 ₩ 5,121 ₩ 18,443
Collateral received from related party entities as of and for the year ended December 31, 2011, were approved on February 9, 2011, by the Board of Directors.2012 and 2013, are as follows:
| 2012 | 2013 | |||||||||
| (In millions of Korean won) | ||||||||||
Associates | ||||||||||
Kores Co., Ltd. | Row house | ₩ | 24 | ₩ | 24 | |||||
| Apartment | 24 | 24 | ||||||||
| Factory/Forest land | 15,000 | 15,000 | ||||||||
44. Event after the Reporting PeriodBusiness combination
The Group established KBacquired Yehansoul Savings Bank Co., Ltd. with a capital investment of (Won) 171,526for ₩37,760 million in January 2012. KB Savings Bank Co., Ltd. signed a purchase & assumption (P&A) deal for selected assets and liabilities of Jeil Savings Bank Co., Ltd. with Korea Deposit Insurance Corporation on January 11, 2012. KB Savings Bank Co., Ltd. obtained an approval for operation from the Financial Services Commission and acquired the assets and liabilities of Jeil Savings Bank Co., Ltd. on January 13, 2012. The Group expects synergies from diversification of customers through the P&A deal and has recognized the goodwill attributable to the synergies in 2012.September 2013.
The consideration transferred and the assets and liabilities arising from the PM&A deal are as follows. As the final due diligence is in progress, according to the agreement with Korea Deposit Insurance Corporation, the amounts of assets acquired and the liabilities assumed are provisional and are subject to change per the final due diligence and valuation results.
| Amounts | ||||
| (In millions of Korean won) | ||||
Total consideration | ||||
Recognized amounts of identifiable assets acquired and liabilities assumed | ||||
Cash and due from financial institutions | ||||
Financial assets at fair value through profit | ||||
Loans | ||||
Financial investments | ||||
Other assets | ||||
|
| |||
Total assets | ||||
|
| |||
Deposits | ||||
Other liabilities | ||||
| 15,966 | ||||
Total liabilities | ||||
|
| |||
Total identifiable net assets | ₩ | |||
|
| |||
Goodwill | ||||
Acquisition-related costs(1) | ||||
| (1) | Recorded in fee and commission expense in the statement of comprehensive income. |
The receivables including loans from the PM&A deal at the acquisition date are as follows:
| Amounts | ||||
| (In millions of Korean won) | ||||
Fair value | ||||
Loans | ||||
| ||||
|
| |||
Total | ||||
|
| |||
Contractual cash flow | ||||
Loans | ||||
| ||||
|
| |||
Total | ||||
|
| |||
Estimate of the contractual cash flows not expected to be collected | ||||
Loans | ||||
| ||||
|
| |||
Total | ||||
|
| |||
Due to the business combination, the net operating loss and loss for the period from September 2, 2013 to December 31, 2013, included in the consolidated statement of comprehensive income were ₩6,678 million and ₩5,331 million, respectively.
Assuming the date of acquisition is beginning of the reporting period, income from operations and net profit for the year would have decreased by ₩23,793 million and ₩18,341 million, respectively. In calculating the pro forma information, the results of the acquired companies for the period before acquisition have been adjusted to reflect the Group’s accounting policies and the fair value adjustments made on acquisition.
45. Event after the Reporting Period
KB Savings Bank Co., Ltd. completed its merger with Yehansoul Savings Bank on January 13, 2014.
As a result of the leakage of customer personal information discussed in Note 39, KB Kookmin Card received notification from the Financial Service Commission on February 16, 2014, that KB Kookmin Card is subject to a temporary three-month suspension on the following operational activities:
Suspension of operations | The following credit-card operations are subject to the temporary suspension: * Issuance of KB Kookmin Card products including credit cards, debit card and checking cards to new clients (except in circumstances where the Financial Services Commission’s Chairman approves it for the benefit of the public interest) * Offering new products to existing KB Kookmin Card clients. * Offering new products via telemarketers, travel agents and insurance agents. | |
Suspension period | February 17, 2014 ~ May 16, 2014 (3 months) | |
The three-month suspension is likely to adversely affect the Group’s operational base in the short term. However, considering the Group’s asset quality, strong underlying financial performance and its credibility in the market, the long-term effect of the suspension has been determined as being low.
45.46. Approval of the Financial Statements
The issuance of the Group’s financial statements as of and for the year ended December 31, 2013, was approved on February 21, 2014, by the Board of Directors.
47. Parent Company Information
The following tables present the Parent Company Only financial information:
Condensed Statements of Financial Position
| 2010.01.01 | 2010.12.31 | 2011.12.31 | Jan. 1 2012 | Dec. 31 2012 | Dec. 31 2013 | |||||||||||||||||||
| (In millions of Korean won) | (In millions of Korean won) | |||||||||||||||||||||||
Assets | ||||||||||||||||||||||||
Cash held at bank subsidiaries | (Won) | 845,366 | (Won) | 759,998 | (Won) | 32,031 | ₩ | 32,031 | ₩ | 96,234 | ₩ | 77,298 | ||||||||||||
Receivables from nonbanking subsidiaries | 170,000 | 160,000 | 60,000 | 60,000 | 25,000 | 10,000 | ||||||||||||||||||
Investments in subsidiaries(1) | ||||||||||||||||||||||||
Banking subsidiaries | 16,774,896 | 16,774,896 | 14,821,721 | 14,821,721 | 14,821,721 | 14,821,721 | ||||||||||||||||||
Nonbanking subsidiaries | 837,226 | 898,426 | 2,951,601 | 2,951,601 | 3,123,127 | 3,470,722 | ||||||||||||||||||
Other assets | 36,826 | 186,592 | 645,337 | 645,337 | 323,946 | 284,801 | ||||||||||||||||||
|
|
|
|
|
| |||||||||||||||||||
Total assets | (Won) | 18,664,314 | (Won) | 18,779,912 | (Won) | 18,510,690 | �� | ₩ | 18,510,690 | ₩ | 18,390,028 | ₩ | 18,664,542 | |||||||||||
|
|
|
|
|
| |||||||||||||||||||
Liabilities and shareholders’ equity | ||||||||||||||||||||||||
Debts | (Won) | — | (Won) | — | (Won) | 130,000 | ₩ | 130,000 | ₩ | — | ₩ | — | ||||||||||||
Debentures | 798,421 | 799,353 | 49,988 | 49,988 | — | 349,157 | ||||||||||||||||||
Other liabilities | 7,450 | 159,438 | 614,422 | 614,422 | 305,686 | 266,963 | ||||||||||||||||||
Shareholders’ equity | 17,858,443 | 17,821,121 | 17,716,280 | 17,716,280 | 18,084,342 | 18,048,422 | ||||||||||||||||||
|
|
|
|
|
| |||||||||||||||||||
Total liabilities and shareholders’ equity | (Won) | 18,664,314 | (Won) | 18,779,912 | (Won) | 18,510,690 | ₩ | 18,510,690 | ₩ | 18,390,028 | ₩ | 18,664,542 | ||||||||||||
|
|
|
|
|
| |||||||||||||||||||
| (1) | Investments in subsidiaries were accounted at cost method in accordance with IAS 27. |
Condensed Statements of Comprehensive Income
| 2010 | 2011 | 2011 | 2012 | 2013 | ||||||||||||||||
| (In millions of Korean won) | (In millions of Korean won) | |||||||||||||||||||
Income | ||||||||||||||||||||
Dividends from subsidiaries: | ||||||||||||||||||||
Dividends from banking subsidiaries | (Won) | 95,305 | (Won) | — | ₩ | — | ₩ | 687,925 | ₩ | 245,044 | ||||||||||
Interest from subsidiaries | 36,150 | 26,999 | 26,999 | 6,018 | 3,859 | |||||||||||||||
Other income | 831 | 884 | 884 | — | — | |||||||||||||||
|
|
|
|
| ||||||||||||||||
Total income | 132,286 | 27,883 | 27,883 | 693,943 | 248,903 | |||||||||||||||
|
|
|
|
| ||||||||||||||||
Expense | ||||||||||||||||||||
Interest expense | 53,431 | 41,571 | 41,571 | 3,025 | 5,227 | |||||||||||||||
Noninterest expense | 38,177 | 51,537 | ||||||||||||||||||
Non-interest expense | 51,537 | 44,901 | 48,273 | |||||||||||||||||
|
|
|
|
| ||||||||||||||||
Total expense | 91,608 | 93,108 | 93,108 | 47,926 | 53,500 | |||||||||||||||
|
|
|
|
| ||||||||||||||||
Profit(loss) before tax expense | 40,678 | (65,225 | ) | (65,225 | ) | 646,017 | 195,403 | |||||||||||||
|
|
|
|
| ||||||||||||||||
Tax income(expense) | 897 | 1,547 | 1,547 | 1,080 | 423 | |||||||||||||||
|
|
|
|
| ||||||||||||||||
Profit(loss) for the year | (Won) | 41,575 | (63,678 | ) | (63,678 | ) | 647,097 | 195,826 | ||||||||||||
|
|
|
|
| ||||||||||||||||
Other comprehensive income(loss) for the year, net of tax | (1,357 | ) | (862 | ) | 65 | |||||||||||||||
|
|
| ||||||||||||||||||
Total comprehensive income for the year | ₩ | (62,231 | ) | ₩ | 646,235 | ₩ | 195,891 | |||||||||||||
|
|
| ||||||||||||||||||
Condensed Statements of Cash Flows
| 2010 | 2011 | |||||||
| (In millions of Korean won) | ||||||||
Operating activities | ||||||||
Net income (loss) | (Won) | 41,575 | (Won) | (63,678 | ) | |||
Reconciliation of net income (loss) to net cash provided by | ||||||||
Other operating activities, net | 11,442 | (4,383 | ) | |||||
|
|
|
| |||||
Net cash provided by (used in) operating activities | 53,017 | (68,061 | ) | |||||
|
|
|
| |||||
Investing activities | ||||||||
Net payments from (to) subsidiaries | (51,200 | ) | — | |||||
Other investing activities, net | (8,288 | ) | (10,743 | ) | ||||
|
|
|
| |||||
Net cash used in investing activities | (59,488 | ) | (10,743 | ) | ||||
|
|
|
| |||||
Financing activities | ||||||||
Increase in debts | — | 130,000 | ||||||
Decreases in debentures | — | (750,000 | ) | |||||
Cash dividends paid | (78,897 | ) | (41,163 | ) | ||||
|
|
|
| |||||
Net cash provided by (used in) financing activities | (78,897 | ) | (661,163 | ) | ||||
|
|
|
| |||||
Net increase in cash held at bank subsidiaries | (85,368 | ) | (739,967 | ) | ||||
Cash held at bank subsidiaries at January 1 | 845,363 | 759,995 | ||||||
|
|
|
| |||||
Cash held at bank subsidiaries at December 31 | (Won) | 759,995 | (Won) | 20,028 | ||||
|
|
|
| |||||
46. Transition to IFRS
Until December 31, 2010, the Group prepared its consolidated financial statements in accordance with both of K-GAAP and U.S. GAAP for the SEC filings in the U.S. The following sets out reconciliations and descriptions of the effects of the transition from K-GAAP to IFRS, and from U.S. GAAP to IFRS, on the Group’s equity as of January 1, 2010 and December 31, 2010, comprehensive income and cash flows for the year ended December 31, 2010.
46.1 Reconciliation of IFRS comparables from IFRS and K-GAAP
46.1.1 Main policy differences between K-GAAP and IFRS
|
| |||
|
|
|
|
| |||
|
|
| ||
| ||||
|
| |||
|
|
| ||
| ||||
|
|
| ||
|
| |||
|
|
| ||
| ||||
|
|
| ||
| ||||
|
| |||
|
| |||
| ||||
| ||||
| ||||
|
|
| ||
|
|
| ||
|
| |||
| ||||
| ||||
46.1.2 The impact on the financial information of the Group as a result of adoption of IFRS
The impact on the Group’s assets, liabilities, equity, profit, comprehensive income and cash flows as a result of adopting IFRS is as follows:
The details of adjustments to the assets, liabilities, and equity as of January 1, 2010:
| Assets | Liabilities | Equity | ||||||||||
| (In millions of Korean won) | ||||||||||||
K-GAAP | (Won) | 262,168,450 | (Won) | 244,057,124 | (Won) | 18,111,326 | ||||||
|
|
|
|
|
| |||||||
Adjustments: | ||||||||||||
Consolidation | (2,365,486 | ) | (2,290,995 | ) | (74,491 | ) | ||||||
Allowances for loan losses | 569,598 | — | 569,598 | |||||||||
Provisions for unused commitments/guarantees | — | (304,647 | ) | 304,647 | ||||||||
Interest income recognized by effective interest method | 43,124 | (24,810 | ) | 67,934 | ||||||||
Impairment recognition of securities | (15,641 | ) | — | (15,641 | ) | |||||||
Definition of derivative | (2,061 | ) | 8,837 | (10,898 | ) | |||||||
Fair value adjustments of financial instruments | — | (7,938 | ) | 7,938 | ||||||||
Provisions for membership rewards program | — | 22,305 | (22,305 | ) | ||||||||
Employee benefits | — | 81,812 | (81,812 | ) | ||||||||
Asset retirement obligation | 2,295 | 43,070 | (40,775 | ) | ||||||||
Classification of equity and liability | — | (821,297 | ) | 821,297 | ||||||||
Offsetting of financial assets and liabilities | 118,672 | 118,672 | — | |||||||||
Others | (354,870 | ) | (298,332 | ) | (56,538 | ) | ||||||
Tax effects | (5,110 | ) | 144,482 | (149,592 | ) | |||||||
|
|
|
|
|
| |||||||
Total adjustments | (2,009,479 | ) | (3,328,841 | ) | 1,319,362 | |||||||
|
|
|
|
|
| |||||||
IFRS | (Won) | 260,158,971 | (Won) | 240,728,283 | (Won) | 19,430,688 | ||||||
|
|
|
|
|
| |||||||
The details of adjustments to the assets, liabilities, equity, profit and comprehensive income as of and for the year ended December 31, 2010:
| Assets | Liabilities | Equity | ||||||||||
| (In millions of Korean won) | ||||||||||||
K-GAAP | (Won) | 262,007,968 | (Won) | 243,567,615 | (Won) | 18,440,353 | ||||||
|
|
|
|
|
| |||||||
Adjustments: | ||||||||||||
Consolidation | (4,255,827 | ) | (4,198,470 | ) | (57,357 | ) | ||||||
Allowances for loan losses | 663,522 | — | 663,522 | |||||||||
Provisions for unused commitments/guarantees | — | (113,612 | ) | 113,612 | ||||||||
Interest income recognized by effective interest method | 50,093 | (6,061 | ) | 56,154 | ||||||||
Impairment recognition of securities | (5,931 | ) | — | (5,931 | ) | |||||||
Definition of derivative | 462 | (1,545 | ) | 2,007 | ||||||||
Fair value adjustments of financial instruments | — | (7,628 | ) | 7,628 | ||||||||
Provisions for membership rewards program | — | 21,357 | (21,357 | ) | ||||||||
Employee benefits | — | 71,006 | (71,006 | ) | ||||||||
Asset retirement obligation | 3,148 | 49,460 | (46,312 | ) | ||||||||
Classification of equity and liability | — | (684,769 | ) | 684,769 | ||||||||
Goodwill | 89,673 | — | 89,673 | |||||||||
Equity method investment securities | 11,314 | 137 | 11,177 | |||||||||
Offsetting of financial assets and liabilities | 113,507 | 113,507 | — | |||||||||
Other | 105,020 | 155,924 | (50,904 | ) | ||||||||
Tax effects | (12,327 | ) | 137,771 | (150,098 | ) | |||||||
|
|
|
|
|
| |||||||
Total adjustments | (3,237,346 | ) | (4,462,923 | ) | 1,225,577 | |||||||
|
|
|
|
|
| |||||||
IFRS | (Won) | 258,770,622 | (Won) | 239,104,692 | (Won) | 19,665,930 | ||||||
|
|
|
|
|
| |||||||
| Profit | Total comprehensive income | |||||||
| (In millions of Korean won) | ||||||||
K-GAAP | (Won) | 100,183 | (Won) | 212,245 | ||||
|
|
|
| |||||
Adjustments: | ||||||||
Consolidation | 47,074 | 47,074 | ||||||
Allowances for loan losses | 93,683 | 93,683 | ||||||
Provisions for unused commitments/guarantees | (191,034 | ) | (191,034 | ) | ||||
Interest income recognized by effective interest method | (11,780 | ) | (11,780 | ) | ||||
Impairment recognition of securities | (3,426 | ) | (3,426 | ) | ||||
Definition of derivative | 12,913 | 12,913 | ||||||
Fair value adjustments of financial instruments | (311 | ) | (311 | ) | ||||
Provisions for membership rewards program | 948 | 948 | ||||||
Employee benefits | 10,805 | 10,805 | ||||||
Asset retirement obligation | (5,537 | ) | (5,537 | ) | ||||
Classification of equity and liability | 61,835 | 61,835 | ||||||
Goodwill | 89,673 | 89,673 | ||||||
Equity method investment securities | 12,251 | 7,533 | ||||||
Other | 13,496 | 5,481 | ||||||
Tax effects | (10,864 | ) | (10,864 | ) | ||||
|
|
|
| |||||
Total adjustments | 119,726 | 106,993 | ||||||
|
|
|
| |||||
IFRS | (Won) | 219,909 | (Won) | 319,238 | ||||
|
|
|
| |||||
Summary of adjustments to cash flows
The cash flows have been reclassified in accordance with IFRS as follows:
The cash flows related to deposits, which are the major income sources for financial companies and which cash flows were classified as financial activities under K-GAAP, were reclassified as operating activities under IFRS.
The cash flows of restricted due from financial institutions, which were classified as investing activities under K-GAAP, were reclassified as operating activities under IFRS.
The cash flows of derivatives applied with hedge accounting, which were classified as operating activities under K-GAAP, are reclassified in the same manner as the cash flows of the position being hedged.
Additionally, the cash flows from acquisition and disposal of equity or debt instruments of other corporations for the purpose other than trading purpose, which were classified as operating activities under K-GAAP, are reclassified as investing activities under IFRS.
Except for items mentioned above, there are no other significant differences on the cash flow statements prepared in accordance with IFRS and K-GAAP.
46.2 Reconciliation of IFRS comparables from IFRS and U.S. GAAP
46.2.1 Main policy differences between U.S. GAAP and IFRS
|
| |||
|
|
|
|
| |||
| ||||
|
|
| ||
|
| |||
|
| |||
|
| |||
|
| |||
| ||||
|
| |||
| ||||
|
|
| ||
|
| |||
|
|
| |||
|
| |||
| ||||
| ||||
|
| |||
|
| |||
| ||||
| ||||
46.2.2 The impact on the financial information of the Group as a result of adoption of IFRS
The impact on the Group’s assets, liabilities, equity, profit and comprehensive income as a result of adopting IFRS is as follows:
The details of adjustments to the assets, liabilities, and equity as of January 1, 2010 (transition date):
| Assets | Liabilities | Equity | ||||||||||
| (In millions of Korean won) | ||||||||||||
US-GAAP | (Won) | 253,855,432 | (Won) | 236,279,157 | (Won) | 17,576,275 | ||||||
|
|
|
|
|
| |||||||
Adjustments: | ||||||||||||
Consolidation | 2,618,184 | 2,566,606 | 51,578 | |||||||||
Classification and fair value measurement of debt and equity securities | 632,170 | — | 632,170 | |||||||||
Classification of Foreign Exchange spot contracts | 2,448,302 | 2,448,302 | — | |||||||||
Interest income recognized by effective interest method | (300,319 | ) | — | (300,319 | ) | |||||||
Loan impairment | 91,140 | — | 91,140 | |||||||||
Provisions for unused commitments/guarantees | — | (21,441 | ) | 21,441 | ||||||||
Revaluation of fixed assets (Property and equipment) | 1,735,752 | — | 1,735,752 | |||||||||
Goodwill and intangible assets acquired in business combinations | (457,169 | ) | — | (457,169 | ) | |||||||
Hybrid capital investments | — | (1,000,000 | ) | 1,000,000 | ||||||||
Uncertain Tax Positions | (575,057 | ) | — | (575,057 | ) | |||||||
Others | 124,374 | 163,667 | (39,293 | ) | ||||||||
Tax effects | (13,838 | ) | 291,992 | (305,830 | ) | |||||||
|
|
|
|
|
| |||||||
Total adjustments | 6,303,539 | 4,449,126 | 1,854,413 | |||||||||
|
|
|
|
|
| |||||||
IFRSs issued by the IASB | (Won) | 260,158,971 | (Won) | 240,728,283 | (Won) | 19,430,688 | ||||||
|
|
|
|
|
| |||||||
The details of adjustments to the assets, liabilities, equity, profit and comprehensive income as of and for the year ended December 31, 2010, are as follows:
| Assets | Liabilities | Equity | ||||||||||
| (In millions of Korean won) | ||||||||||||
US-GAAP | (Won) | 251,752,002 | (Won) | 234,716,456 | (Won) | 17,035,546 | ||||||
|
|
|
|
|
| |||||||
Adjustments: | ||||||||||||
Consolidation | 3,859,486 | 3,713,506 | 145,980 | |||||||||
Classification and fair value measurement of debt and equity securities | 445,310 | — | 445,310 | |||||||||
Classification of Foreign Exchange spot contracts | 1,299,467 | 1,299,467 | — | |||||||||
Interest income recognized by effective interest method | (366,119 | ) | — | (366,119 | ) | |||||||
Loan impairment | 705,482 | — | 705,482 | |||||||||
Provisions for unused commitments/guarantees | — | (30,934 | ) | 30,934 | ||||||||
Revaluation of fixed assets (Property and equipment) | 1,765,219 | — | 1,765,219 | |||||||||
Goodwill and intangible assets acquired in business combinations | (452,444 | ) | — | (452,444 | ) | |||||||
Hybrid capital investments | — | (1,000,000 | ) | 1,000,000 | ||||||||
Uncertain Tax Positions | (27,310 | ) | — | (27,310 | ) | |||||||
Others | (11,172 | ) | 134,705 | (145,877 | ) | |||||||
Tax effects | (199,299 | ) | 271,492 | (470,791 | ) | |||||||
|
|
|
|
|
| |||||||
Total adjustments | 7,018,620 | 4,388,236 | 2,630,384 | |||||||||
|
|
|
|
|
| |||||||
IFRSs issued by the IASB | (Won) | 258,770,622 | (Won) | 239,104,692 | (Won) | 19,665,930 | ||||||
|
|
|
|
|
| |||||||
US-GAAP Adjustments Consolidation Classification and fair value measurement of debt and equity securities Interest income recognized by effective interest method Loan impairment Provisions for unused commitments/guarantees Revaluation of fixed assets (Property and equipment) Goodwill and intangible assets acquired in business combinations Hybrid capital investments Uncertain Tax Positions Others Tax effects Total adjustments IFRSs issued by the IASB Operating activities Net income (loss) Reconciliation of net income (loss) to net cash provided by operating activities: Other operating activities, net Net cash provided by (used in) operating activities Investing activities Net payments from (to) subsidiaries Other investing activities, net Net cash used in investing activities Financing activities Increase in debts Decreases in debts Increases in debentures Decreases in debentures Cash dividends paid Net cash provided by (used in) financing activities Net increase in cash held at bank subsidiaries Cash held at bank subsidiaries at January 1 Cash held at bank subsidiaries at December 31 Profit Total comprehensive
income (In millions of Korean won) (Won) (592,524 ) (Won) (464,091 ) 18,266 33,193 (133,975 ) (186,860 ) (65,800 ) (65,800 ) 614,342 614,342 9,493 9,493 29,467 29,467 4,725 4,725 64,600 64,600 547,747 547,747 (154,133 ) (164,295 ) (122,299 ) (103,283 ) 812,433 783,329 (Won) 219,909 (Won) 319,238 2011 2012 2013 (In millions of Korean won) ₩ (63,678 ) ₩ 647,097 ₩ 195,826 (4,383 ) 15,807 40,272 (68,061 ) 662,904 236,098 — (136,526 ) (369,590 ) (10,743 ) 7,998 (2,710 ) (10,743 ) (128,528 ) (372,300 ) 130,000 170,000 315,000 — (300,000 ) (315,000 ) — — 349,077 (750,000 ) (50,000 ) — (41,163 ) (278,173 ) (231,811 ) (661,163 ) (458,173 ) 117,266 (739,967 ) 76,203 (18,936 ) 759,995 20,028 96,231 ₩ 20,028 ₩ 96,231 ₩ 77,295
F-186F-182