SECURITIES AND EXCHANGE COMMISSION
Washington, D.C. 20549
FORM 20-F
(Mark One)
| ¨ | REGISTRATION STATEMENT PURSUANT TO SECTION 12(b) OR (g) OF THE SECURITIES EXCHANGE ACT OF 1934 | |
| OR | ||
| þ | ANNUAL REPORT PURSUANT TO SECTION 13 OR 15(d) OF THE SECURITIES EXCHANGE ACT OF 1934 | |
| For the fiscal year ended 31 March | ||
| OR | ||
| ¨ | TRANSITION REPORT PURSUANT TO SECTION 13 OR 15(d) OF THE SECURITIES EXCHANGE ACT OF 1934 | |
| OR | ||
| ¨ | SHELL COMPANY REPORT PURSUANT TO SECTION 13 OR 15(d) OF THE SECURITIES EXCHANGE ACT OF 1934 | |
| Date of event requiring this shell company report | ||
| For the transition period from to | ||
Commission file number: 001-14958
NATIONAL GRID PLC
(Exact name of Registrant as specified in its charter)
England and Wales
(Jurisdiction of incorporation or organization)
1-3 Strand, London WC2N 5EH, England
(Address of principal executive offices)
Helen MahyAlison Kay
011 44 20 7004 3000
Facsimile No. 011 44 20 7004 3004
Group General Counsel and Company Secretary and General Counsel
National Grid plc
1-3 Strand London WC2N 5EH, England
(Name, Telephone, E-mail and/or Facsimile number and Address of Company Contact Person)
Securities registered or to be registered pursuant to Section 12(b) of the Securities Exchange Act of 1934:
Title of each class | Name of each exchange on which registered | |
| Ordinary Shares of 11 17/43 pence each | The New York Stock Exchange* | |
| American Depositary Shares, each representing five | The New York Stock Exchange | |
| Ordinary Shares of 11 17/43 pence each | ||
| 6.625% Guaranteed Notes due 2018 | The New York Stock Exchange | |
| 6.30% Guaranteed Notes due 2016 | The New York Stock Exchange | |
| Preferred Stock ($100 par value-cumulative): | ||
| 3.90% Series | The New York Stock Exchange | |
| 3.60% Series | The New York Stock Exchange |
| * | Not for trading, but only in connection with the registration of American Depositary Shares representing Ordinary Shares pursuant to the requirements of the Securities and Exchange Commission. |
Securities registered or to be registered pursuant to Section 12(g) of the Securities Exchange Act of 1934: None.
Securities for which there is a reporting obligation pursuant to Section 15(d)Section15(d) of the Securities Exchange Act of 1934: None.
The number of outstanding shares of each of the issuer’s classes of capital or common stock as of 31 March 31, 20122014 was
| Ordinary Shares of 11 17/43 pence each |
Indicate by check mark if the registrant is a well-known seasoned issuer, as defined in Rule 405 of the Securities Act: Yes þ No ¨o
If this report is an annual or transition report, indicate by check mark if the registrant is not required to file reports pursuant to Section 13 or 15(d) of the Securities Exchange Act of 1934. Yes ¨ No þ
Note — Checking the box above will not relieve any registrant required to file reports pursuant to Section 13 or 15(d) of the Securities Exchange Act of 1934 from their obligations under those Sections.
Indicate by check mark whether the registrant (1) has filed all reports required to be filed by Section 13 or 15(d) of the Securities Exchange Act of 1934 during the preceding 12 months (or for such shorter period that the registrant was required to file such reports), and (2) has been subject to such filing requirements for the past 90 days: Yes þ No ¨
Indicate by check mark whether the registrant has submitted electronically and posted on its corporate website, if any, every Interactive Data File required to be submitted and posted pursuant to Rule 405 of Regulation S-T (§ 232.405 of this chapter) during the preceding 12 months (or for such shorter period that the registrant was required to submit and post such files): Yes ¨ No ¨
Indicate by check mark whether the registrant is a large accelerated filer, an accelerated filer, or a non-accelerated filer. See definition of “accelerated filer” and “large accelerated filer” in Rule 12b-2 of the Exchange Act.
| Large accelerated filer þ | Accelerated filer ¨ | Non-accelerated filer ¨ |
Indicate by check mark which basis of accounting the registrant has used to prepare the financial statements included in this filing:
U.S. GAAP ¨ International Financial Reporting Standards as issued by the International Accounting Standards Board þ Other ¨
If “Other” has been checked in response to the previous question, indicate by check mark which financial statement item the registrant has elected to follow. Item 17 ¨ Item 18 ¨
If this is an annual report, indicate by check mark whether the registrant is a shell company (as defined in Rule 12b-2 of the Exchange Act). Yes ¨ No þ
This constitutes the annual report on Form 20-F of National Grid Plcplc (the “Company”) in accordance with the requirements of the US Securities and Exchange Commission (the “SEC”) for the year ended 31 March 20122014 and is dated 125 June 2012.2014. Details of events occurring subsequent to the approval of the annual report on 1618 May 20122014 are summarised in the section titled “Further Information” which forms a part of this Form 20-F . The content of the Group’s website (www.nationalgrid.com/uk) should not be considered to form part of this annual report on Form 20-F.
Form 20-F Cross Reference Table
Item | Form 20-F caption | Location in the document | Page | Form 20-F caption | Location in the document | Page(s) | ||||||||||
1 | Identity of directors, senior management and advisors | Not applicable | – |
Identity of directors, senior management and advisors |
Not applicable | – | ||||||||||
2 | Offer statistics and expected timetable | Not applicable | – |
Offer statistics and expected timetable |
Not applicable | – | ||||||||||
3 | Key Information |
Key Information | ||||||||||||||
3A Selected financial data | “Summary consolidated financial information” | 194-195 | ||||||||||||||
“Financial performance” | 56-63 | |||||||||||||||
“Additional disclosures—Exchange rates” | 189 | 3A Selected financial data | “Additional Information—Summary consolidated financial information” | 186-187 | ||||||||||||
“Strategic Report—Financial review” | 6-9 | |||||||||||||||
“Exchange Rates” | | “Further | | “Financial Statements—Unaudited commentary on consolidated cash flow statement—Net debt” | 91 | |||||||||||
“Additional Information—Other unaudited financial information—Reconciliations of adjusted profit measures” | 182 | |||||||||||||||
3B Capitalization and indebtedness | Not applicable | “Additional Information—Other disclosures—Exchange rates” | 178 | |||||||||||||
| – | “Exchange Rates” | | “Further Information” | | ||||||||||||
3C Reasons for the offer and use of proceeds | Not applicable | 3B Capitalization and indebtedness | Not applicable | – | ||||||||||||
| – | 3C Reasons for the offer and use of proceeds | Not applicable | – | |||||||||||||
3D Risk Factors | “Risk Factors��� | 41-43 | 3D Risk Factors | “Additional Information—Business information in detail—Risk factors” | 167-169 | |||||||||||
4 | Information on the company |
Information on the company | ||||||||||||||
4A History and development of the company | “Delivering our strategy—How do we deliver?—Financial outperformance—Capital investment programme” | 36 | 4A History and development of the company | “Want more information or help?” |
| 192- Back cover |
| |||||||||
“Delivering our strategy—What we delivered this year—Disciplined investment” | 54-55 | “Additional Information—Other disclosures—Key milestones” | 179 | |||||||||||||
Financial position and resources—Summarised balance sheet” | 72-73 | “Strategic Report—Chief Executive’s review” | 4-5 | |||||||||||||
“Additional information—Key milestones” | 185 | �� | “Strategic Report—Our vision and strategy” | 14-15 | ||||||||||||
“Useful Information” | 196 | “Strategic Report—Operating environment” | 12-13 | |||||||||||||
4B Business overview | “Operating across two geographies” | 15 | “Additional Information—Other disclosures—Articles of Association” | 176-177 | ||||||||||||
“Our business model—What we do” | 16-23 | “Financial Statements—Consolidated statement of financial position—Unaudited commentary on consolidated statement of financial position—Property, plant and equipment” | 89 | |||||||||||||
“Our operating environment—Regulatory environment” | 24-29 | “Financial Statements—Consolidated cash flow statement—Unaudited commentary on consolidated cash flow statement—Net capital expenditure” | 91 | |||||||||||||
“Risk factors—Infrastructure security and IT systems—We may suffer a major network failure or interruption, or may not be able to carry out critical non network operations” | 41 | “Additional Information—Other unaudited financial information—Commentary on consolidated financial statements for the year ended 31 March 2013” | 183-185 | |||||||||||||
4C Organizational structure | “Note 36 to the consolidated financial statements—Principal subsidiary undertakings” | 169 | “Financial Statements—Notes to the consolidated financial statements—2. Segmental analysis—(c) Capital expenditure, depreciation and amortisation” | 95 | ||||||||||||
4D Property, plants and equipment | “Operating across two geographies” | 15 | “Strategic Report—How our strategy creates value” | 21 | ||||||||||||
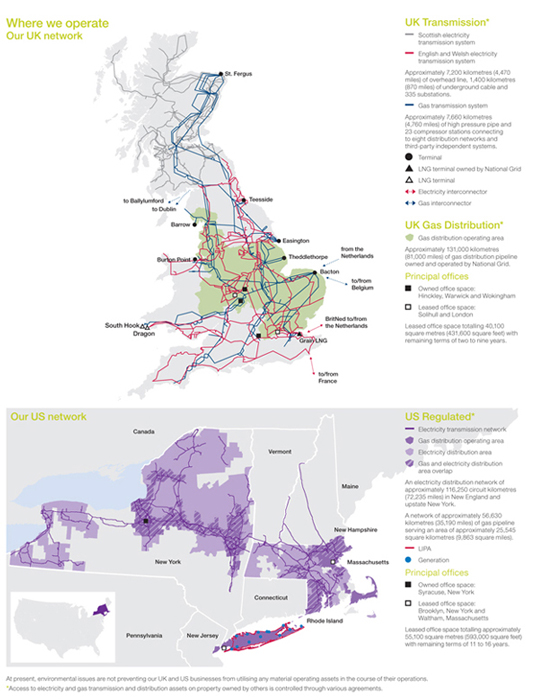
“Delivering our strategy—How do we deliver?—Environmental responsibility” | 34-35 | 4B Business overview | “Additional Information—Business information in detail—Where we operate” | 166 | ||||||||||||
“Financial position and resources—Summarised balance sheet—Property, plant and equipment” | 72 | “Strategic Report—Operating environment” | 12-13 | |||||||||||||
“Additional disclosures—Property, Plant and equipment” | 185 | “Strategic Report—Our vision and strategy”; “—What we do—Electricity”; “—What we do—Gas”; “—How we make money from our regulated assets”; and “—How our strategy creates value” | 14-21 | |||||||||||||
“Note 19 to the consolidated financial statements—Borrowings” | 142 | |||||||||||||||
4A | Unresolved staff comments | “Additional disclosures—Unresolved staff comments” | 185 | |||||||||||||
5 | Operational and financial review and prospects | |||||||||||||||
5A Operating results | “Financial performance” | 56-63 | ||||||||||||||
“Principal operations” | 64-71 | |||||||||||||||
“Financial position and resources—Net debt” | 74-76 | |||||||||||||||
“Note 32 to the consolidated financial | 156 | |||||||||||||||
i
Item | Form 20-F caption | Location in the document | ||||||
| 14 | |||||||
“Strategic Report—Principal operations” | 29-38 | |||||||
“Strategic Report—Non-financial KPIs” | 10-11 | |||||||
“Financial | 93-96 | |||||||
“Additional Information—Business information in detail—Risk factors—Infrastructure and IT systems—We may suffer a major network failure or interruption, or may not be able to carry out critical non network operations due to the failure of technology supporting our business-critical processes”; “—Changes in law or regulation or decisions by governmental bodies or regulators could materially adversely affect us”; and “—Customers and counterparties—Customers and counterparties may not perform their obligations” | 167 168 169 | |||||||
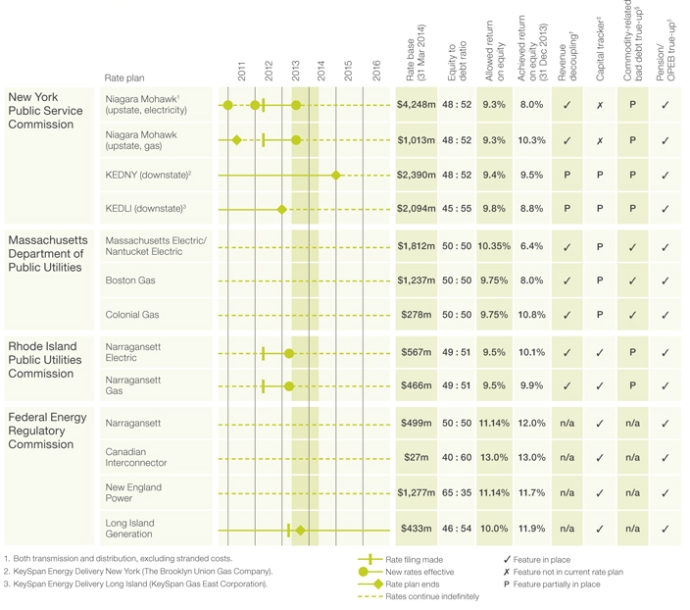
“Additional Information—Business information in detail—UK regulation”; “—US regulation”; and “—Summary of US price controls and rate plans” | 160-165 | |||||||
“Strategic Report—How we make money from our regulated assets” | 20 | |||||||
4C Organizational structure | “Financial Statements—Notes to the consolidated financial statements—32. Subsidiary undertakings, joint ventures and associates—Principal subsidiary undertakings” | 146 | ||||||
4D Property, plants and equipment | “Additional Information—Business information in detail—Where we operate” | 166 | ||||||
“Strategic Report—What we do—Electricity”; “—What we do—Gas”; and “—How we make money from our regulated assets” | 16-20 | |||||||
“Strategic Report—Principal operations” | 29-38 | |||||||
“Strategic Report—Our vision and strategy—Embed sustainability” and “—Drive growth” | 15 | |||||||
“Strategic Report—Operating environment—Changing energy mix”; “—Energy policy”; “—Regulation”; and “—Innovation and technology” | 12-13 | |||||||
“Financial Statements—Consolidated statement of financial position—Unaudited commentary on consolidated statement of financial position—Property, plant and equipment” | 89 | |||||||
“Additional Information—Other disclosures—Property, plant and equipment” | 179 | |||||||
“Financial Statements—Notes to the consolidated financial statements—11. Property, plant and equipment” | 111-112 | |||||||
“Financial Statements—Notes to the consolidated financial statements—19. Borrowings” | 119-121 | |||||||
4A | Unresolved staff comments | “Additional Information—Other disclosures—Unresolved SEC staff comments” | 181 | |||||
ii
Item | Form 20-F caption | Location in the document | Page(s) | |||||
5 | Operating and financial review and prospects | |||||||
5A Operating results | “ | 6-9 | ||||||
“Strategic Report—Operating environment” | ||||||||
“Additional Information—Business information in detail—UK regulation”; “—US regulation”; and “—Summary of US price controls and rate plans” | 160-165 | |||||||
“Strategic Report—Principal operations” | 29-38 | |||||||
“Financial Statements—Consolidated income statement—Unaudited commentary on the consolidated income statement” | 85 | |||||||
“Financial Statements—Notes to the consolidated financial statements—2. Segmental analysis—Unaudited commentary on the results of our principal operations by segment” | 96 | |||||||
“Additional Information—Other unaudited financial information” | 182-185 | |||||||
“Financial Statements—Notes to the consolidated financial statements—30. Financial risk management—(d) Currency risk” | 140-141 | |||||||
5B Liquidity and capital resources | “Strategic Report—Financial | |||||||
“ | ||||||||
| ||||||||
“Financial | ||||||||
“Additional Information—Business information in detail—Risk factors—Financing and liquidity—An inability to access capital markets at commercially acceptable interest rates could affect how we maintain and grow our business” | 169 | |||||||
“Financial Statements—Notes to the consolidated financial statements—2. Segmental analysis—Unaudited commentary on the results of our principal operations by segment” | 96 | |||||||
“Financial Statements—Notes to the consolidated financial statements—26. Net debt” | 130-131 | |||||||
“Financial Statements—Notes to the consolidated financial statements—19. Borrowings” | 119-121 | |||||||
“Financial Statements—Notes to the consolidated financial statements—15. Derivative financial instruments” | 114-116 | |||||||
“Additional Information—Business information in detail—Federal Energy Regulatory Commission—Short-term borrowing extension” | 164 | |||||||
“Additional Information—Directors’ Report disclosures—Material interests in shares” | ||||||||
“Material | | “Further Information” | | |||||
| ||||||||
5C Research and development, patents and licenses, etc. | “Additional | |||||||
5D Trend information | “Strategic Report—Financial | |||||||
“Strategic Report—Principal operations” | ||||||||
“Strategic Report—Operating environment” | 12-13 | |||||||
5E Off-balance sheet arrangements | “Financial |
iii
Item | Form 20-F caption | Location in the document | Page(s) | |||||
5F Tabular disclosure of contractual obligations | “ | |||||||
5G Safe Harbor | “Important notice” | |||||||
“Want more information or help?—Cautionary | Back cover | |||||||
6 | Directors, senior management and employees | |||||||
6A Directors and senior management | “ | |||||||
“Additional Information—Directors’ Report disclosures—Board biographies” | 171-173 | |||||||
6B Compensation | “Corporate Governance—Remuneration Report” | |||||||
“ | ||||||||
“ | ||||||||
“ | ||||||||
“Share | | “Further Information” | | |||||
6C Board practices | “Corporate Governance— | |||||||
“ | ||||||||
“Corporate Governance—Audit Committee”; “—Finance Committee”; “—Safety, Environment and Health Committee”; “—Nominations Committee”; “—Executive Committee”; and “—Management committees” | 49-57 | |||||||
“Corporate Governance—Remuneration Report—Annual statement from the Remuneration Committee chairman” | 58-59 | |||||||
“Corporate Governance—Remuneration Report—Future policy table—Executive Directors” | 60-63 | |||||||
“Corporate Governance—Remuneration Report—Future policy table—Non-executive Directors (NEDs)” | 63 | |||||||
“Corporate Governance—Remuneration Report—Service contracts and policy on payment for loss of office” and “—Dates of Directors’ service
| ||||||||
6D Employees | “ | |||||||
“Additional Information—Other disclosures—Employees” | ||||||||
6E Share ownership | “Corporate Governance—Remuneration Report—Shareholding requirement” and “—Differences in remuneration policy for all employees” | 64 | ||||||
“Corporate Governance—Remuneration Report—Statement of Directors’ shareholdings and share interests (audited information)” | 70-71 | |||||||
iiiv
Item | Form 20-F caption | Location in the document | ||||||
| “Corporate Governance—Remuneration Report— | |||||||
“Additional Information—Other disclosures—The All-employee Share Plans” | 181 | |||||||
“ | | Information” | ||||||
7 | Major shareholders and related party transactions | |||||||
7A Major shareholders | “Additional Information—Directors’ Report disclosures—Material interests in shares” | |||||||
“Material interests in shares” | “Further Information” | |||||||
7B Related party transactions | “ | |||||||
7C Interests of experts and counsel | Not applicable | – | ||||||
8 | Financial information | |||||||
8A Consolidated statements and other financial information | ||||||||
“Financial Statements—Report of Independent Registered Public Accounting | ||||||||
“ | ||||||||
“ | ||||||||
“ | ||||||||
“Financial Statements—Notes to the consolidated financial | 92-131 | |||||||
“Financial Statements—Notes to the consolidated financial statements – supplementary information” | ||||||||
“Strategic Report—Chairman’s statement” | 2-3 | |||||||
8B Significant changes | “Subsequent Events” | | “Further | | ||||
9 | The offer and listing | |||||||
9A Offer and listing details | “Additional Information—Other disclosures—The offer and listing—Price history” | |||||||
“Price | | “Further | | |||||
“ | ||||||||
“Exchange Rates” | | “Further | | |||||
9B | Not applicable | |||||||
9C Markets | “ | |||||||
9D Selling shareholders | Not applicable | – | ||||||
9E Dilution | Not applicable | – | ||||||
9F Expenses of the issue | Not applicable | – | ||||||
10 | Additional information | |||||||
10A Share capital | Not applicable | – | ||||||
10B Memorandum and articles of association | “Additional Information—Other disclosures— | |||||||
|
| |||||||
|
| |||||||
|
| |||||||
|
| |||||||
|
| |||||||
|
| |||||||
|
| |||||||
|
| |||||||
|
| |||||||
| ||||||||
iii
Item | Form 20-F caption | Location in the document | Page | |||||
Financial risk” | ||||||||
“Note 33 to the consolidated financial statements—Commodity risk” | 162-164 | |||||||
“Financial position and resources” | 72-77 | |||||||
11B Qualitative information about market risk | “Note 31 to the consolidated financial statements—Supplementary information on derivative financial instruments” | 155-156 | ||||||
“Note 32 to the consolidated financial statements—Financial risk” | 157-162 | |||||||
“Note 33 to the consolidated financial statements—Commodity risk” | 162-164 | |||||||
“Financial position and resources”
| 72-77 | |||||||
12 | Description of securities other than equity securities | |||||||
12A Debt securities | Not applicable | – | ||||||
12B Warrants and rights | Not applicable | – | ||||||
12C Other securities | Not applicable | – | ||||||
12D American depositary shares | “Additional disclosures—Description of securities other than equity securities depositary fees and charges” | 189 | ||||||
“Definitions and glossary of terms”
| 190 | |||||||
13 | Defaults, dividend arrearages and delinquencies | Not applicable | – | |||||
14 | Material modifications to the rights of security holders and use of proceeds | Not applicable | – | |||||
15 | Controls and procedures | “Internal control over financial reporting” | 47 | |||||
16 | 16A Audit committee financial expert | “Corporate Governance—Audit Committee—Experience” | 88 | |||||
16B Code of ethics | “Additional disclosures—Code of Ethics” | 184 | ||||||
16C Principal accountant fees and services | “Corporate Governance—Audit Committee—External Audit” | 89 | ||||||
“Note 2 to the consolidated financial statements—(e) Auditors’ remuneration” | 128 | |||||||
16D Exemptions from the listing standards for audit committees | Not applicable | – | ||||||
16E Purchases of equity securities by the issuer and affiliated purchasers | Not applicable | – | ||||||
16F Change in registrant’s certifying accountant | Not applicable | – | ||||||
16G Corporate governance | “Additional disclosures—Corporate governance practices: differences from New York Stock Exchange (NYSE) listing standards” | 184 | ||||||
16H Mine safety disclosure | Not applicable | – | ||||||
17 | Financial statements | Not applicable | – | |||||
18 | Financial statements | “Accounting policies” | 112-118 | |||||
“Adoption of new accounting standards” | 119 | |||||||
Consolidated primary statements” | 120-124 | |||||||
“Notes to the consolidated financial statements” | 125-150 | |||||||
“Notes to the consolidated financial statements—supplementary information” | 151-176 | |||||||
“Report of Independent Registered Public Accounting Firm” | 111 | |||||||
19 | Exhibits | Filed with the SEC | – |
iv
Business Review
An energy networks business focused on generating shareholder value through both dividends and asset/equity growth by investing in essential assets under predominantly regulated market conditions to service long-term, sustainable, consumer led demands.
|
|
| ||||||||
| ||||||||
| ||||||||
|
| |||||||
| ||||||||
| ||||||||
| ||||||||
| ||||||||
| ||||||||
| ||||||||
 |
|  |
www.nationalgrid.com
£3,495m-3%
Adjusted operating profit†2010/11: £3,600m
+8% excluding the impact of timing and major storms
51.3p+1%
Adjusted earnings per share† 2010/11: 50.9p (i)
$14.5bn+1%
US rate base 2010/11: $14.3bn
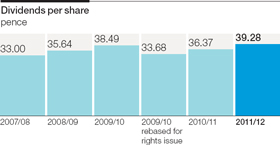
39.28p+8%
Ordinary dividends 2010/11: 36.37p
£3,539m-6%
Operating profit 2010/11: £3,745m
+5% excluding the impact of timing and major storms
57.1p-9%
Earnings per share 2010/11: 62.9p (i)
£22.2bn+7%
UK regulatory asset value 2010/11: £20.8bn
10.9%
Group return on equity‡ 2010/11: 10.8%
Our financial results are reported in sterling. The average exchange rate, as detailed on page 57, was $1.60 to £1 in 2011/12 compared with the average rate of $1.57 to £1 in 2010/11. Except as otherwise noted, the figures in this Report are stated in sterling or US dollars. All references to dollars or $ are to the US currency.
Business analysis 2011/12
Geographical analysis 2011/12

Annual Report and Accounts 2011/12National Grid plc01
Business Review
National Grid is an international electricity and gas company based in the UK and northeastern US. We play a vital role in connecting millions of people safely, reliably and efficiently to the energy they use.
Directors’ Report
The Directors’ Report, prepared in accordance with the requirements of the Companies Act 2006 and the UK Listing Authority’s Listing, and Disclosure and Transparency rules, comprising pages 8 to 107 and 184 to 189 was approved by the Board and signed on its behalf by:
Helen Mahy
Company Secretary & General Counsel
16 May 2012
The location within the main body of the Annual Report of the specific requirements of the Directors’ Report can be found in the checklist on page 81.

Segmental reporting
The performance of our principal businesses is reported by segment, reflecting the management responsibilities and economic characteristics of each activity.
Throughout this report, the following colours are used to indicate references to a particular segment:
Activities which do not fall within these segments are reported separately and are identified as:
Discussion relating to the Company as a whole is identified as:
If you require a full search facility, please go to the pdf of the Annual Report and Accounts 2011/12 in the investor relations section of our website and use a word search.
Important notice
This document contains certain statements that are neither reported financial results nor other historical information. These statements are forward-looking statements within the meaning of Section 27A of the Securities Act of 1933, as amended, and Section 21E of the Securities Exchange Act of 1934, as amended. For a description of factors that could affect future results, reference should be made to the full cautionary statement on the back cover of this document and to the risk factors section on pages 41 to 43.
www.nationalgrid.com
IFC to 79
Corporate Governance
80 to 107
Financial Statements
108 to 183
| ||
Additional Information
184 to 198
 |
Annual Report and Accounts 2011/12National Grid plc03
Business Review
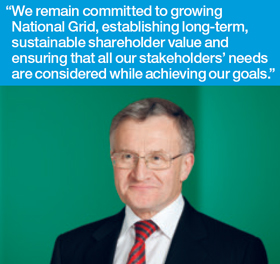
Sir Peter Gershon, Chairman
Results
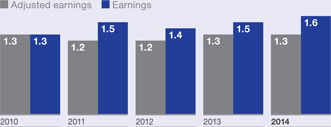
I am pleased to announce a good set of results for 2011/12. Adjusted earnings per share increased by 1% to 51.3 pence per share, compared to 50.9(i) pence per share in 2010/11. This increase is particularly pleasing in light of the significant timing differences and major storm costs incurred this year.
Dividend policy
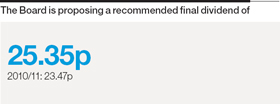
The Board is proposing a final dividend of 25.35 pence per share making a total of 39.28 pence per share for the 2011/12 financial year. This represents an increase of 8% from last year.
Our dividend is an important part of our returns to shareholders along with growth in the value of the asset base attributable to equity holders. This year is the last of our current dividend policy, which has been in place since January 2008. The Board has agreed a new one year dividend policy under which we plan to increase the dividend by 4% in nominal terms over the proposed dividend of 39.28 pence for 2011/12. This policy reflects the outcome from the one year TPCR4 rollover review and forecast inflation of around 3% for the same period. It will apply to the interim dividend to be paid in January 2013 and the final dividend to be paid in August 2013. We expect to announce a longer-term dividend policy after the current regulatory review is complete and its implications are clear.
Safety
This year has seen three fatalities occur. Any fatality associated with our business, whether an employee, contractor or member of the public, is deeply regrettable. Following thorough investigations, we are undertaking a wide range of measures to ensure we learn from these tragic events.
Safety is a top priority and will remain at the forefront of our core objectives. The Board’s governance arrangements for the oversight of safety are being strengthened and the Chief Executive is leading a new drive to further improve our safety performance. We will always be exposed to high risk working environments on a daily basis and embedding safety procedures and principles in our people is a key part of improving our performance. We continue to foster the belief across our businesses that all accidents can be avoided.
Operating responsibly
We are mindful of our responsibility to the environments in which we operate and ensuring we continue operating in a socially responsible manner is fundamental to our continued delivery of sustainable profits and creating long-term value for our investors.
This year, we have made significant contributions across a number of areas including new education initiatives, such as the opening of the London tunnels energy education centre, our ongoing partnership with Special Olympics Great Britain and our work in the US on the engineering our future initiative. Our UK and US employees also continue to give up their time to volunteer and support community projects such as City Year. Details of a range of activities we and our employees support are available on our website.
Innovation is a key driver in our business, especially when it comes to connecting new sources of energy. The UK public debate around overhead lines versus underground cables provokes strong opinion and we are mindful of Government guidance when developing new connections and consider carefully the impact of our work on local communities. What is clear is that, at higher voltages, undergrounding is much more expensive. The right balance between landscape and affordability needs to be struck with society deciding whether it is
04National Grid plcAnnual Report and Accounts 2011/12
www.nationalgrid.com
willing to accept the higher cost. We continue to work with those concerned to inform the debate, while also exploring innovative solutions to issues such as the visual impact of pylons (see page 50).
We have established a new energy partnership with the Buffalo Niagara medical campus which engages community stakeholders in innovative energy initiatives and helps support economic development and growth in the region. This partnership aims to set the benchmark for future energy efficient living and offers valuable insight into how people can embrace smart technologies in their everyday lives.
People
I am privileged to have taken over the role as Chairman of National Grid and would like to thank Sir John Parker for his personal contribution to the Company’s success during his time as chairman, and for all the guidance and support he offered during my induction. I am delighted to be his successor.
A balance of skills, experience, knowledge and diversity is key to an effective Board and will remain a priority as we continue to refresh the composition of our Board over the next two years, as outlined on page 81. During the year, we welcomed Ruth Kelly and Paul Golby as Non-executive Directors. Both bring with them independence, knowledge and experience which will be invaluable as we address future opportunities and challenges.
Furthermore, Nora Brownell will join our Board as a Non-executive Director from 1 June 2012. Nora brings with her a vast amount of experience of the US energy industry and regulatory environment that will help further strengthen our Board.
Stephen Pettit and Linda Adamany will step down from the Board with effect from 30 July and 31 October 2012 respectively. Both have made an invaluable contribution to the Board, with Stephen chairing our Risk & Responsibility Committee for a number of years. I would like to thank them both for their committed service.
We must continue to develop robust succession planning for our Directors and senior management by actively looking to recruit new and diverse talent into the business, and by ensuring our existing employees are developed and challenged to reach their full potential. Attracting new talent into the business through innovative recruitment drives, the development of new recruits, our apprentice schemes and the maintenance of our graduate programme as one of the industry leading programmes, will continue to form part of our focus.
The Board is aware of the ongoing discussions and opinions being voiced with regard to executive remuneration and the heightened profile of this topic. We acknowledge this is an important area for shareholders. Our new chair of the Remuneration Committee is focused on this matter and we have taken steps to enhance our disclosures as part of the Remuneration Report starting on page 90.
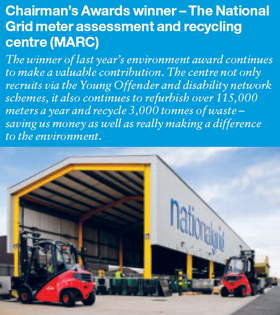
The Chairman’s Awards, a global employee recognition scheme, are an excellent initiative introduced by my predecessor and I am delighted to offer these my full support. This year attracted more than 160 submissions and the winners will be announced in June. They provide a perfect illustration of the talent and tireless effort of our employees to make National Grid an improved place to work and to make positive contributions to local communities. We were particularly interested in ideas to improve safety and wellbeing in the workplace and are pleased that a number of the initiatives submitted really strove to go the extra mile and demonstrate innovation.
Governance
We are again committed to setting the tone at the top and look to adopt best practice in corporate governance. Personally, I am dedicated to this approach and will continue to ensure that, as a Board, we remain engaged in exploring ways that can further improve our performance. Further details on Board evaluation and effectiveness are provided on page 82.
Outlook
The Board and I remain committed to delivering increased shareholder value and returns. We are more focused than ever on improving our safety performance, recognising the need for all our employees and contractors to be able to operate safely on a day-to-day basis to enable our business to continue to operate at an optimum level.
I extend my thanks to our US employees, who demonstrated outstanding commitment in responding to the severe storms experienced earlier this year, as well as to all our employees for their hard work and dedication to the success of the Company. This reinforces my belief that we are well positioned to meet the future opportunities and challenges we face.

Sir Peter Gershon

Annual Report and Accounts 2011/12National Grid plc05
Business Review

Steve Holliday, Chief Executive
Over the course of 2011/12, we have made good progress on our key priorities: disciplined investment; delivering improved performance and returns in the US; preparing for the new regulatory arrangements in the UK; and focusing on operational excellence across all our principal operations, in particular, through our restructuring of the US business and UK Gas Distribution. We remain at the centre of the challenge to connect future energy solutions in both the UK and northeastern US and continue to progress these through ongoing engagement with our stakeholders.
Financials
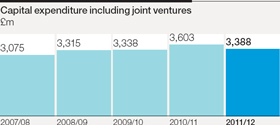
Throughout 2011/12, we have delivered good financial performance. Adjusted operating profit is up 8%, excluding the timing differences that benefited 2010/11 and the impact of two major storms in the US. We delivered another significant year of capital expenditure with £3.4 billion reflecting the sustained investment in our regulated activities. The launch of our first UK RPI linked retail bond proved a great success, raising further capital as well as securing a new investor base. We continued to manage our portfolio of businesses in a disciplined manner, releasing value through sales of two of our non-regulated businesses, OnStream in the UK and Seneca-Upshur in the US.
In November, Ofgem published final proposals for the one year (2012/13) transmission price control rollover for our UK Transmission business (TPCR4). These included real increases in revenues for electricity and gas transmission, reflecting the capital investment we have made over the current price control period.
Safety
Safety remains a top priority, as our financial and business performance must always be underpinned by a strong safety record. I must reiterate the message from our Chairman; the three fatalities associated with our business are deeply regrettable.
During 2011/12, our injury frequency rate was unchanged at 0.18. This remains an area where we must increase our efforts and strive to achieve zero injuries. Last year we focused on trends associated with high potential incidents and mitigating actions, our incident review process, and ever increasing engagement across the entire leadership team. These actions will continue to be in place going forward as we accept that more must be done to ensure all employees and contractors operate safely.
Delivering our strategy
We own and manage the networks to which many different energy sources are connected. That puts us at the heart of one of the greatest challenges facing our society: creating new sustainable energy solutions for the future and developing an energy system that can support economic prosperity in the 21st century.
This year, our programme of capital expenditure continued to be largely driven by our UK electricity and gas businesses and improvement of our networks. Highlighted in our business plans, submitted in support of the new regulatory framework RIIO (revenue = incentives + innovation + outputs), the level of investment in this area is planned to reach £31 billion through to 2021. We continue to work with Ofgem to reach an acceptable RIIO outcome for our UK regulated businesses. Details on the new framework can be found on page 25.
Following last year’s announcement of the changes in our US business, we have an increased local focus that has helped improve, in particular, our performance and responsiveness when interacting with our customers and regulators. Through the reorganisation, we were also able to achieve the targeted annualised cost saving of $200 million. The increased local engagement has already seen positive results. In December 2011, NYPSC approved our request to recover certain deferred costs and a portion of recent storm costs in our Niagara Mohawk electricity business. In April 2012, we also submitted important new rate filings for our Niagara Mohawk and Narragansett businesses.
In December, the UK Government published its technical update for the Electricity Market Reform bill, which is expected to be passed into legislation during the current parliamentary session. The changes proposed will be key in shaping investment decisions in new generation capacity and it is envisaged that we will assume responsibility for administration of the new framework for renewable and low carbon generation payments.
Operational
Maintaining a safe and reliable supply is a critical part of our job. Operationally we have performed well, with reliability of the UK electricity and gas transmission network at more than 99%. However, during the severe winter of 2010/11 we failed standards for uncontrolled gas escapes in all four of our networks and for controlled gas escapes in two of them, resulting in a fine of £4.3 million from Ofgem. The lessons we learnt were used to improve plans for the winter of 2011/12 when we met all our targets.
06National Grid plcAnnual Report and Accounts 2011/12
www.nationalgrid.com

In the US, our reliability was 93%. However, these figures always exclude major storms and 2011/12 was an exceptional year for weather events. Over the summer we faced tropical storm Irene, flooding and tornadoes, while in Massachusetts, an unseasonal snow storm in October affected 92% of the communities we serve. The level of devastation experienced as a result of these storms was huge and the process of rebuilding communities and replacing infrastructure was a challenge. The response, passion and commitment of our teams and the support we received from neighbouring states, were exceptional. The process of restoring power to communities can always be improved, but in such exceptional circumstances I am proud of the efforts of all those involved.
In December 2011, LIPA announced that we had not been selected to continue to manage and operate Long Island’s electricity system beyond the term of the current agreement, expiring on 31 December 2013. We are naturally disappointed by this decision, but our substantive assets on Long Island are not affected. We will continue to provide high quality services for the remainder of our contract and support the complex transition.
Customer
We remain determined to improve customer service and further understand customers’ needs so we can serve them in the most effective and efficient manner. This year has seen the opening of our new UK Gas Distribution customer centres, specifically designed to provide a more responsive and integrated service. The result of this and other initiatives implemented are already showing, with our customer satisfaction increasing by an average of 5.5% this year. Further improvement is important to us and will have even greater significance under the new regulatory framework, with incentives being introduced. Embedding customer focus now should enable us to be ready for this.
In the US, our results have been mixed. However, the success of the new structure and the deeper engagement with our stakeholders is already starting to improve relationships, with positive feedback being received. The ‘elevate 2015’ programme aims to design and implement more customer focused processes better aligned to meeting their needs, and by doing so, will enable greater improvement in our customer service performance.
We continue to progress efficiency initiatives across all our businesses. The UK Gas Distribution front office programme has successfully implemented replacement systems and streamlined core business processes that should help us move to upper quartile
customer performance. In addition, our US foundations project, which will integrate multiple information systems and improve control processes, is on target for late 2012 implementation. It aims to deliver a single financial system, a single cost allocation methodology and enhanced jurisdictional and functional reporting.
People
Our people form the foundation of our business. Personally, I remain committed to developing all of them to the best of their abilities. We need to deliver the planned increase in capital expenditure and without the correct people and capabilities we will be unable to meet this challenge.
In the UK, over the next nine years we are looking to recruit in the region of 2,500 engineers – a mixture of experienced engineers and development programme trainees – to support our investment programme. In the US, we also expect to fill around 800 management roles requiring an engineering background over the next 10 years. Developing talent is vital to our success and we recognise our role in enthusing the next generation of young people to pursue science, technology and mathematics at school and beyond. We are working with schools and partnerships to bring alive the opportunities that exist via the different routes into industry. Over the last year, our UK employees interacted with more than 3,900 students through work experience, Imagineering clubs and open days, and our US employees continue to be active in supporting local schools and communities. Our focus on inspiring the younger generation into engineering and science will continue on both sides of the Atlantic.
This year saw an 84% response rate to the employee survey. I am pleased with this, as the results provide a true reflection of how we are doing. Overall, our results have improved from the last survey, with customer and safety both scoring higher. There is still more work to be done on engagement and, as a leadership team across the Company, we are already starting to address this area.
Looking forward
The scale of the challenges we face over the next decade is significant, as we must deliver the networks to support future needs. Our job remains to connect people safely and reliably to the energy they use; this is a privileged position.
Our priorities for 2012/13 are focused towards:
|
|
|
|
|
|

Steve Holliday
Annual Report and Accounts 2011/12National Grid plc07
Business Review
1. Sir Peter Gershon CBE,
Chairman
Appointment to the Board: 1 August 2011 as Deputy Chairman, Chairman with effect from 1 January 2012
Committee membership: N (ch)
Career experience: Previous appointments include Chairman of Premier Farnell plc, Chief Executive of the Office of Government Commerce and Managing Director of Marconi Electronic Systems.
External appointments: Chairman of Tate & Lyle plc, member of the UK Defence Academy Advisory Board and HM Government Efficiency Board.
2. Steve Holliday,
Chief Executive
Appointment to the Board: October 2002, appointed to National Grid Group plc 2001, Chief Executive with effect from January 2007
Committee membership: E (ch), F
Career experience: Formerly Executive Director of British Borneo Oil and Gas; he also spent 19 years within the Exxon Group, where he held senior positions in the international gas business and managed major operational areas such as refining and shipping.
External appointments: Non-executive Director of Marks and Spencer Group plc and Chairman of the UK Business Council for Sustainable Energy, Crisis UK, the Technician Council and a member of the Board of Trustee Directors for Business in the Community and Infrastructure UK Advisory Council.
3. Andrew Bonfield,
Finance Director
Appointment to the Board: November 2010
Committee membership: E, F
Career experience: Chief Financial Officer at Cadbury plc until March 2010; he also spent five years as Executive Vice President & Chief Financial Officer of Bristol-Myers Squibb Company and has previous experience in the energy sector as Finance Director of BG Group plc.
External appointments: Non-executive Director of Kingfisher plc.
4. Tom King,
Executive Director, US
Appointment to the Board: August 2007
Committee membership: E
Career experience: President of PG&E Corporation and Chairman and CEO of Pacific Gas and Electric Company from 2003 to 2007, having held a number of senior positions within the PG&E group since joining in 1998. Senior management positions with Kinder Morgan Energy Partners and Enron Corporation.
5. Nick Winser,
Executive Director, UK
Appointment to the Board: April 2003
Committee membership: E
Career experience: Previously Chief Operating Officer of the US transmission business for National Grid Transco plc having joined The National Grid Company plc in 1993, becoming Director of Engineering in 2001. Prior to this, Nick had been with Powergen since 1991 as principal negotiator on commercial matters.
External appointments: Non-executive Director of Kier Group plc and co-Chair of the Energy Research Partnership.
6. Ken Harvey CBE,
Non-executive Director and
Senior Independent Director
Appointment to the Board: October 2002, appointed to Lattice Group plc board in 2000, Senior Independent Director with effect from October 2004
Committee membership: N, R (ch), R&R
Career experience: Formerly Engineering Director and then Deputy Chairman of London Electricity and Chairman and Chief Executive of NORWEB plc.
External appointments: Chairman of Pennon Group Plc.
7. Linda Adamany,
Non-executive Director
Appointment to the Board: November 2006
Committee membership: A, N, R&R
Career experience: Various executive roles for BP in both the UK and US, including Chief Executive of BP Shipping and Group Vice President and Commercial Director, BP Refining & Marketing and until April 2008, Group Vice President, BP plc.
8. Philip Aiken,
Non-executive Director
Appointment to the Board: May 2008
Committee membership: A, N, R&R
Career experience: Formerly Group President of BHP Billiton’s Energy business, Executive Director of BTR plc, held senior roles in BOC Group plc and was senior advisor to Macquarie Capital (Europe) Limited.
External appointments: Chairman of Robert Walters plc, Deputy Chairman of AVEVA Group plc, Non-executive and Senior Independent Director of Kazakhmys PLC and Non-executive Director of Miclyn Express Offshore Limited and Essar Energy plc.
9. Paul Golby CBE,
Non-executive Director
Appointment to the Board: 1 February 2012
Committee membership: N, R, R&R
Career experience: Formerly Executive Director of Clayhithe plc before joining East Midlands Electricity plc in 1998 as Managing Director. Appointed as Chief Executive of E.ON UK plc in 2002, and later additionally as Chairman, stepping down from the E.ON Board in December 2011.
External appointments: Non-executive Chairman of AEA Technology Group plc, Chairman of Engineering UK, Chair of the Engineering and Physical Sciences Research Council and a member of the Council for Science and Technology.
10. Ruth Kelly,
Non-executive Director
Appointment to the Board: 1 October 2011
Committee membership: A, F, N
Career experience: Various senior roles in Government from 2001 to 2008, including Secretary of State for Transport, Secretary of State for Communities and Local Government, Secretary of State for Education and Skills and Financial Secretary to the Treasury.
External appointments: Managing Director at HSBC and Governor for the National Institute of Economic and Social Research.
11. Stephen Pettit,
Non-executive Director
Appointment to the Board: October 2002, appointed to Lattice Group plc board in 2001
Committee membership: F, N, R, R&R (ch)
Career experience: Formerly Chairman of ROK plc, Executive Director of Cable & Wireless plc and Chief Executive, Petrochemicals at British Petroleum.
External appointments: Non-executive Director of Halma p.l.c and a member of BT Group plc’s Equality of Access Board.
12. Maria Richter,
Non-executive Director
Appointment to the Board: October 2003
Committee membership: A, F (ch), N
Career experience: With Morgan Stanley from 1993 to 2002, latterly as Managing Director of its Corporate Finance Retail Group; Vice President of Independent Power Group for Salomon Brothers and Vice President of Prudential Capital Corporation and Power Funding Associates.
External appointments: Non-executive Chairman of Pro Mujer UK and Non-executive Director of The Pantry, Inc., The Vitec Group plc and The Bessemer Group Inc.
08National Grid plcAnnual Report and Accounts 2011/12
www.nationalgrid.com
standards” |  | |
|
Annual Report and Accounts 2011/12National Grid plc09v
Item | Form 20-F caption | Location in the document | Page(s) | |||||
“Additional Information—Directors’ Report disclosures—Share capital” | 174-175 | |||||||
10C Material contracts | “Additional Information—Other disclosures—Material contracts” | 179 | ||||||
10D Exchange controls | “Additional Information—Other disclosures—Exchange controls” | 178 | ||||||
10E Taxation | “Additional Information——Other disclosures—Taxation” | 179-181 | ||||||
10F Dividends and paying agents | Not applicable | – | ||||||
10G Statement by experts | Not applicable | – | ||||||
10H Documents on display | “Additional Information—Other disclosures—Documents on display” | 178 | ||||||
10I Subsidiary information | Not applicable | – | ||||||
11 |
Quantitative and qualitative disclosures about market risk | |||||||
11A Quantitative information about market risk | “Financial Statements—Notes to the consolidated financial statements—15. Derivative financial instruments” | 114-116 | ||||||
“Financial Statements—Notes to the consolidated financial statements—30. Financial risk management—(a) Credit risk”; “—(b) Liquidity risk”; “—(c) Interest rate risk”; “—(d) Currency risk”; “—(e) Commodity risk”; “—(f) Capital risk management”; and “—(g) Fair value analysis” | 137-144 | |||||||
“Strategic Report—Financial review” | 6-9 | |||||||
11B Qualitative information about market risk | “Financial Statements—Notes to the consolidated financial statements—15. Derivative financial instruments” | 114-116 | ||||||
“Financial Statements—Notes to the consolidated financial statements—30. Financial risk management—(a) Credit risk”; “—(b) Liquidity risk”; “—(c) Interest rate risk”; “—(d) Currency risk”; “—(e) Commodity risk”; “—(f) Capital risk management”; and “—(g) Fair value analysis” | 137-144 | |||||||
“Strategic Report—Financial review” | 6-9 | |||||||
“Additional Information—Risk factors” | 167-169 | |||||||
12 | Description of securities other than equity securities | |||||||
12A Debt securities | Not applicable | – | ||||||
12B Warrants and rights | Not applicable | – | ||||||
12C Other securities | Not applicable | – | ||||||
12D American depositary shares | “Additional Information—Other disclosures—Description of securities other than equity securities: depositary fees and charges” | 178 | ||||||
“Additional Information—Other disclosures—Depositary payments to the Company” | 177 | |||||||
“Additional Information—Definitions and glossary of terms” | 188-191 | |||||||
13 |
Defaults, dividend arrearages and delinquencies | Not applicable | – | |||||
14 |
Material modifications to the rights of security holders and use of proceeds | Not applicable | – | |||||
15 |
Controls and procedures | “Additional Information—Internal control— Disclosure controls” and “—Internal control over financial reporting” | 170 |
vi
Item | Form 20-F caption | Location in the document | Page(s) | |||||
16 | 16A Audit committee financial expert | “Corporate Governance—Audit Committee—Experience” | 49 | |||||
16B Code of ethics | “Additional Information—Other disclosures—Code of Ethics” | 177 | ||||||
16C Principal accountant fees and services | “Corporate Governance—Audit Committee—External audit” | 51 | ||||||
“Financial Statements—Notes to the consolidated financial statements—3. Operating costs—(e) Auditors’ remuneration” | 98 | |||||||
16D Exemptions from the listing standards for audit committees | Not applicable | – | ||||||
16E Purchases of equity securities by the issuer and affiliated purchasers | Not applicable | – | ||||||
16F Change in registrant’s certifying accountant | Not applicable | – | ||||||
16G Corporate governance | “Additional Information—Other disclosures—Corporate governance practices: differences from New York Stock Exchange (NYSE) listing standards” | 177 | ||||||
16H Mine safety disclosure | Not applicable | – | ||||||
17 | Financial statements | Not applicable | – | |||||
18 | Financial statements | “Financial Statements—Company accounting policies” | 155 | |||||
“Financial Statements—Basis of preparation” | 82-83 | |||||||
“Financial Statements—Recent accounting developments” | 83 | |||||||
“Financial Statements—Consolidated income statement”; “—Consolidated statement of comprehensive income”; “—Consolidated statement of changes in equity”; “—Consolidated statement of financial position”; and “—Consolidated cash flow statement” | 84-91 | |||||||
“Financial Statements—Notes to the consolidated financial statements—analysis of items in the primary statements” | 92-131 | |||||||
“Financial Statements—Notes to the consolidated financial statements—supplementary information” | 132-154 | |||||||
“Financial Statements—Report of Independent Registered Public Accounting Firm—Audit opinion for Form 20-F” | 81 | |||||||
19 | Exhibits | Filed with the SEC | – |
vii
Business Review

Board diversity and succession
We believe creating an inclusive and diverse culture supports the attraction and retention of talented people, improves effectiveness, delivers superior performance and enhances the success of the Company. While criteria such as gender or ethnicity are important, we also value diversity of skills, experience, knowledge and expertise, as can be seen below. Our Board brings together people with different experience and backgrounds, and sometimes divergent opinions, but with shared goals.
|  | |  | |||||||||
|
|
|
| |||||||||
Strategic Report | Corporate Governance | Financial Statements | Additional Information | 01 | ||||||||
Strategic Report pages 02 to 41 | ||||
02 | ||||
| 04 | Chief Executive’s review | |||
| 06 | Financial review | |||
| 10 | Non-financial KPIs | |||
| 12 | Operating environment | |||
| 14 | Our vision and strategy | |||
| 16 | What we do | |||
| 20 | How we make money from our regulated assets | |||
| 21 | How our strategy creates value | |||
| 22 | Internal control and risk management | |||
| 26 | How executive remuneration aligns to Company strategy | |||
| 29 | Principal operations | |||
| 40 | ||||
Corporate Governance pages 42 to 73 | ||||
The Corporate Governance Report, introduced by the Chairman, contains details about the activities of the Board and its committees during the year, including reports from the Audit, Nominations, Remuneration, Finance, and Safety, Environment and Health Committees, as well as details of our shareholder engagement activities. | ||||
| 42 | Corporate Governance contents | |||
| 57 | Directors’ Report statutory and other disclosures | |||
58 | ||||
Financial Statements pages 74 to 159 | ||||
Including the independent auditors’ reports, consolidated financial statements prepared in accordance with IFRS and notes to the consolidated financial statements, as well as the Company financial statements prepared in accordance with UK GAAP. | ||||
| 74 | Contents of financial statements | |||
| 75 | Introduction to the financial statements | |||
| 76 | Statement of Directors’ responsibilities | |||
| 77 | Independent auditors’ report | |||
81 | Report of Independent Registered Public Accounting Firm | |||
Additional Information pages 160 to the inside back cover | ||||
Additional disclosures and information, definitions and glossary of terms, summary consolidated financial information and other useful information for shareholders, including contact details for more information or help. | ||||
| 160 | Contents of Additional Information | |||
188 | Definitions and glossary of terms | |||
Glossary | ||||
We use a number of technical terms and abbreviations within this document. For brevity, we do not define terms or provide explanations every time they are used; please refer to the glossary on pages 188 to 191 for this information. | ||||
02 National Grid Annual Report and Accounts 2013/14 | ||||||||||||||||||||

| | | |||||||||
statement | Our vision statement ‘Connecting you to your energy today, trusted to help you meet your energy needs tomorrow’ emphasises the importance of trust, which we earn not just by meeting our commitments, but by making sure that we do so in the right way. | ||||||||||
 | ||||||||||||
It has been an important and challenging year for National Grid – and the energy sector in general – on both sides of the Atlantic. Although we did not experience any major storm-related outages in our service areas during 2013/14, severe winter weather conditions – the polar vortex in the US and serious flooding in the UK – continued to test the resilience of our networks. I am pleased to report these have performed well as a result of prudent investments in past years, as well as the commitment of our people. Energy policies in both the UK and US strive to find an acceptable balance between affordability to the ultimate consumers, security of supply and sustainability considerations. Particularly since last September, the focus of UK media and political attention has been moving between each of these three factors, with no enduring consensus of what constitutes the optimum position. In the UK, the eight year RIIO settlement we accepted in February 2013 incentivises us to be as efficient as possible while ensuring that savings we achieve can be shared with consumers. Through these incentives we can maximise our efforts to help hard-pressed consumers and deliver good returns to our shareholders.
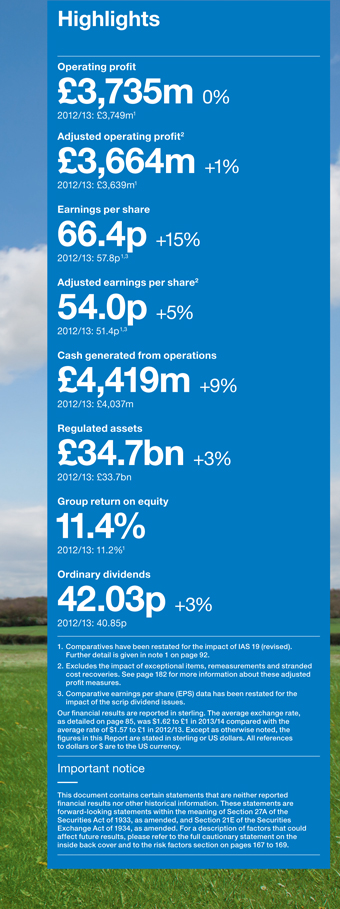
In our continuing efforts to be fair, balanced and understandable in our reporting we are including additional information this year and explaining some technical matters in greater detail, so that we are as transparent as we can be. In particular, I draw your attention to one aspect of our results. There have always been differences between IFRS reported results and underlying economic performance; however, one of the benefits of the RIIO price control regime is that it provides greater transparency of regulatory adjustments to | revenue in our principal UK businesses. The commentary on ‘timing differences and regulated revenue adjustments’ contained in the Financial review on page 08 aims to help understanding of this matter. The Board has recommended an increase in the final dividend to 27.54p per ordinary share ($2.3107 per American Depositary Share). If approved, this will bring the full-year dividend to 42.03p per ordinary share ($3.4801 per American Depositary Share), an increase of 2.9% over the 40.85p per ordinary share in respect of the financial year ending 31 March 2013.
We have developed a new remuneration policy to align more closely with RIIO, the continued evolution of our US business and shareholder value creation. The policy will be subject to shareholder approval at the AGM in July – a requirement of recent legislation. You can read our full Remuneration Report, introduced by Jonathan Dawson, our new Remuneration Committee Chairman, on page 58. As we describe on page 07, the high level of take-up of the scrip dividend in the last couple of years led to concerns about the potential dilutive effect of this option. This meant that we decided not to offer the scrip element for the 2013/14 interim dividend paid in January this year, as our forecast capital investment programme was already fully funded. I do appreciate, from the letters sent to me, that this caused some dissatisfaction. We have now identified a way of offering the scrip option for both the full-year and interim dividend, which balances shareholders’ appetite for the scrip dividend option with our cash requirements. At the AGM we are seeking approval for the allotment and buy-back authorities we need to do this. The scrip dividend option has been offered for the 2013/14 final dividend subject to shareholder approval of the relevant resolutions at the AGM. | |||||||||||
The Board is proposing
|
|
|
| ||||||||||||||
Strategic Report | Corporate Governance | Financial Statements | Additional Information | 03 |
Nick Winser, Executive Director UK, will step down from the Board in July 2014 at the AGM. He will continue with his roles as President of the European Network of Transmission System Operators for Electricity (ENTSO-E) and as Chairman of National Grid Electricity Transmission (NGET) and National Grid Gas (NGG) through to July 2015 before leaving the Company. After July 2015, the role of President of ENTSO-E will no longer be undertaken within the Company, and arrangements for a smooth handover of Nick’s other responsibilities will be announced in due course. This year we have welcomed Therese Esperdy and John Pettigrew to our Board and we will be saying goodbye to Maria Richter following the AGM. During Maria’s 10 years with the Company she has made a significant contribution to the Board and Finance Committee in particular and I would like to thank her for her commitment and wish her all the best in her future endeavours. Therese, who will be taking over as chairman of the Finance Committee from Maria, brings a wealth of corporate finance and debt market experience to our Board. We have also appointed a new Executive Director, John Pettigrew. John joined National Grid as a graduate entrant in 1991 and has been a member of the Executive Committee for nearly two years. The appointments of Therese and John have been part of a significant transition of the Board over the last three years through which we have secured a broad range of skills, experience, perspectives and challenge. Together with strong teamwork, I believe these qualities are contributing towards an effective Board, which will continue to set the right tone from the top, helping to meet the challenges ahead. | contributed £1.4 billion in taxes in the UK alone. Additionally, we estimate we support more than 28,500 jobs in the first tier of our supply chain – companies that are our suppliers across the globe. We aim to develop and operate our business with an inclusive and diverse culture. You can read more about our approach to diversity on page 41, as well as our Board diversity policy on page 56. Looking ahead Over the next 12 months the UK and US will see a dynamic political environment. In the UK, the Scottish independence referendum later this year and the general election in 2015 are likely to increase the focus on issues such as the affordability and security of energy supply, as will the proposed review of the energy industry by the Competition and Markets Authority. In the US, the mid-term US Congressional elections are on the horizon, together with the gubernatorial elections (election of the state governor) in New York, Rhode Island and Massachusetts. We expect debate to continue on essential infrastructure, resilience and sustainability, including our Connect21 dialogue with stakeholders. You can read more about Connect21 on page 35. Our people have a crucial role to play in meeting the opportunities ahead. I would like to thank our employees for their hard work and dedication over the past year. Rising to the challenges brought by severe weather and changes within the industry, they have continued to make National Grid a company we can be proud of. |
Governance pages 42 – 57 | ||||||
Being a responsible business Our vision statement ‘Connecting you to your energy today, trusted to help you meet your energy needs tomorrow’ emphasises the importance of trust, which we earn not just by meeting our commitments, but by making sure that we do so in the right way. That is why how we work is as important as what we do, and why doing the right thing is at the core of everything we do. During 2013/14 we spent time reinforcing the standards we expect of our employees in terms of ethical behaviour. As part of this, we have sent our employees a refreshed copy of ‘Doing the Right Thing’, which is our guide to ethical business conduct. We contribute to the communities in which we operate directly and indirectly in many ways. We maintain and operate the critical infrastructure needed to keep the lights on and the heating working across the UK and northeastern US; we employ more than 23,000 people; and in 2013/14 |  | |||||||
10National Grid plcAnnual Report and Accounts 2011/12
www.nationalgrid.com
Davies Review
In relation to gender diversity, as a result of the transition of our Board, see page 81, we expect the number of female Board members to fluctuate in coming months. We aspire to meet the targets set by Lord Davies by 2015 and the Board will be considering a formal diversity policy during the year ahead.
Our executive and leadership population is regularly and rigorously assessed against achievement of individual objectives and key leadership qualities to help build a sustainable development and succession plan. The Board reviews the talent pipeline to the
Executive Committee and the quality and diversity of talent further down the organisation. Individuals who are identified as potential successors to the Executive Committee within a three year timeframe also undergo an external benchmarking and assessment process carried out by an independent third party. At the same time, we have initiated a programme of executive sponsorship and mentoring of high potential female and minority ethnic managers in order to ensure increased diversity throughout the leadership of the Company.
|
|
|
| |||||||||||
04 National Grid Annual Report and Accounts 2013/14 | ||||||||||||||
|
| ||||||||
| |||||||||

It has been a year of solid performance for National Grid against a backdrop of intense public focus on energy prices, as well as new regulatory frameworks in both the UK and US. Safety is, as always, at the heart of the way we operate. In the UK we achieved an employee lost time injury frequency rate (IFR) of below 0.1. This is a world-class performance and I am incredibly proud of our teams who have worked so hard to get us to this significant milestone. You can read more about this achievement on page 10. The challenge now is to replicate this performance in the US, where we have more work to do. We will never let up on our relentless focus on safety. Despite the freezing and protracted winter in the US and the wettest winter on record in the UK, we achieved one of our best years in terms of reliability, keeping the lights on and the gas flowing. The investment we made in bolstering our flood defences in the UK protected potentially vulnerable assets such as substations, even though in some cases the surrounding areas suffered considerable flooding. In the US, our reliability performance was excellent as a result of continued targeted resiliency investment and management of our networks. The introduction of RIIO in the UK has been an appropriate development for our industry. If we can outperform against the incentives it offers and find ways to reduce our costs, the benefits are shared with our customers. Getting ready for RIIO has been a significant challenge for the UK business, but I am delighted to say that we have made a good start. There have also been significant Government and regulatory policy changes affecting our business in the UK, including the introduction of Electricity Market Reform (EMR) and the evolution of the system operator role in the long-term planning of the network. | We have adapted our ways of working so we can meet the needs of our customers and stakeholders and deliver value under RIIO. For example, we used innovative techniques to protect a section of the pipeline that carries gas from the liquefied natural gas (LNG) importation terminal in west Wales, prior to the construction of a new road. This meant we were able to meet the timescales of the local authority building the road without disrupting gas supply to consumers. In the US, it has been the first year of working under the new upstate New York and Rhode Island regulatory contracts and I am pleased that we have performed well in both cases. You can read more about developments in our US rate filings and regulatory environment on page 164. We have introduced Connect21, our thinking on advancing the USA’s natural gas and electricity infrastructure beyond its 20th century limitations (see page 35). Another priority in the US was the transition of the operation and maintenance of the Long Island Power Authority’s (LIPA) electric transmission and distribution system on Long Island to Public Service Electric and Gas Company – Long Island (PSEG-LI). We successfully handed over the contract on 31 December 2013 and have entered into a transition services agreement with LIPA/PSEG-LI. US enterprise resource planning system stabilisation continued, remedying the errors of poor implementation from the prior year. Over the course of the year, the US business made significant progress in the activities required to upgrade the system, with implementation expected in mid-2014. The focus is now on reducing the ongoing costs associated with the complex manual processes that are required to compensate for identified weaknesses in internal controls over financial reporting in the US. While these control weaknesses have not reduced the quality of financial statements |
|
|
| ||||||||||||
| ||||||||||||||
 |
Annual Report and Accounts 2011/12National Grid plc11
Business Review
The Board’s purpose is to create and deliver the long-term success of the Company and returns for shareholders.
There are a number of areas where the Board takes the lead, for example around corporate governance, strategic direction, financial policy – including the budget and business plan – and the reputation of the Company and its businesses.
The composition of the Board and the diverse skills and experience our Directors bring to the table are vital for ensuring shareholders’ interests are best represented and that there is sufficient constructive challenge and debate.
Our Non-executive Directors commit sufficient time to perform their duties and to understand the Company, for example through their work on the Committees, site visits, induction programmes for new Directors and meetings with management and employees.
While the Board delegates authority to its Committees to carry out certain tasks on its behalf – as set out in each Committee’s terms of reference, available on our website – it ensures that what has been discussed and any decisions taken are communicated to the other Directors. The chairman of each Committee provides a summary back to the Board at the following meeting.
For more information on the operation of the Board and its Committees refer to pages 80 to 89.
12National Grid plcAnnual Report and Accounts 2011/12
www.nationalgrid.com
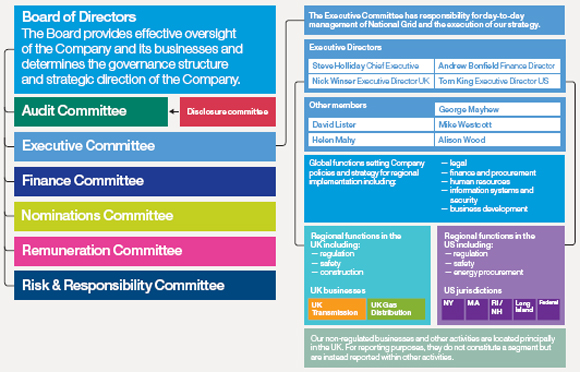
The Executive Committee has responsibility for making day-to-day management and operational decisions to safeguard the interests of the Company.
The nine members of the Committee have a broad range of skills and expertise which is constantly being updated through training and development, as well as through holding external non-executive directorships. This broadens experience and gives exposure to other companies’ governance frameworks and board practices. The Committee officially met 11 times this year but interaction among the members occurs much more regularly.
The Committee oversees the safety, operational and financial performance of the Company, taking management action it considers necessary to safeguard the interests of the Company and is responsible for furthering the strategy, business objectives and targets established by the Board. It approves capital and operational expenditure within its authority levels and regularly discusses, formulates and approves proposals to be considered by the Board.
Although the other members of the Committee do not sit on the Board, they all regularly attend Board meetings and other Committees (with Helen Mahy, the Company Secretary & General Counsel, attending all Board and Nominations Committee meetings as secretary) to ensure that every member is fully up to date and knowledge is shared.

 |
Annual Report and Accounts 2011/12National Grid plc13
Business Review
14National Grid plcAnnual Report and Accounts 2011/12
www.nationalgrid.com
 |
Annual Report and Accounts 2011/12National Grid plc15


Business Review
In common with all international companies, we operate in a complex environment with a number of external factors affecting our operations.
UK energy policy
The Climate Change Act 2008 requires the UK to cut greenhouse gas (GHG) emissions by 34% from the 1990 levels by 2020 and 80% by 2050. Continuing the drive toward these goals, in December 2011, DECC published its technical update for the Electricity Market Reform bill, which was confirmed in the Queen’s speech on 9 May 2012 and is expected to be passed into legislation during the current parliamentary session. The changes proposed by this legislation will be instrumental in shaping investment in new generation capacity over the coming decade which, in turn, underpins our expected capital investment plans.
DECC remains committed to reducing the costs of renewable generation and published a joint report with Ofgem in March 2012 highlighting that offshore and onshore development must be considered together when looking at network development needs. Our role as system operator includes offshore networks and we will play a key role in ensuring onshore and offshore network development is coordinated.
EU energy policy
With the implementation of the 3rd Energy Package in 2011, the development of the European Infrastructure Package in 2012 and emerging EU thinking on a roadmap to 2050 (ie moving beyond the 2020 CO2 targets), the EU is another factor in the development of energy policy in the UK. The 3rd Energy Package is largely associated with the development of EU level codes, to establish EU wide rules on technical and commercial issues relating to cross border trade. These codes are the responsibility of the European networks for transmission system operators for electricity and the European networks for transmission system operators for gas, and we have been working closely with both of them. In the years to come, we expect policy to develop around greater interconnection in the electricity market and networks in the North Sea.
US energy policy
US energy policy continues to be shaped by debates over the economy, the costs and benefits of regulation, and concerns over energy security. During the year, Congress enacted an extension of the Pipeline Safety Act and debated a variety of other energy related legislation including a clean energy standard, energy efficiency, renewable energy incentives and cyber security. The most significant changes however, came in the form of new US Environmental Protection Agency regulations. These included rules for mandatory reporting of GHG emissions from electricity and gas utility facilities and the promotion of the Mercury and Air Toxics Standards rule and the Cross-State Air Pollution Rule which will help to ensure air and water quality.
Federal agencies continued their investment in energy efficiency as a direct reflection of the Obama administration’s priorities. This has manifested itself in large projects at federal facilities in all of the Company’s service areas and we are working with a number of Government facilities to assist in this endeavour.
At the state level energy policy continues to be an active arena, particularly in the northeastern US, driven by interest in promoting energy efficiency, maintaining reliability, and deploying renewable technologies that help states meet environmental and energy diversity goals. New York has promoted a broad energy policy
agenda, including renewed focus on transmission development, a state energy plan, responsible exploration of shale gas, a mandated utility-based loan programme to increase efficiency installations with recovery through customer bills, and promotion of solar technology. Massachusetts continues to focus on climate and energy initiatives including the recent establishment of a GHG inventory programme. Rhode Island enacted several pieces of legislation in 2011 that will promote renewable technologies at the distribution system level, as well as significantly boost the support for gas energy efficiency programmes.
The economic uncertainty within the eurozone has led to volatility in financial markets during the year, however, we have not experienced any adverse effects. Instead, as the UK is seen as a safe haven, its bond yields have fallen and this has had a positive effect on our cost of debt. We continue to monitor developments as it may affect our ability to access capital markets or the financial strength of our counterparties.
Inflation in the UK has declined from its peak in September 2011 but remains above the long-term trend. Our UK regulated revenues are linked to inflation and this has therefore led to higher revenues (see below for an explanation of the UK regulatory regime). We also have index-linked debt so our financing cost increases with inflation, providing a partial economic offset.
In the US, the economic recovery was sluggish early in the year but accelerated towards year end, leading to recent declines in the unemployment rate. Unlike the position in the UK, we sell gas and electricity directly to consumers in the US and so are exposed to bad debt risk, which is affected by unemployment rates. Some of our rate plans include protection against such risk (see page 28), but in most cases they do not cover the full cost.
The Gas Act 1986 and Electricity Act 1989, as amended (the Acts), provide the fundamental legal framework for gas and electricity companies. They establish the licences for electricity generation, transmission, distribution and supply, and for gas transmission, distribution, shipping and supply. The licences established under the Acts require each of our business activities to develop, maintain and operate an economic and efficient network and to facilitate competition in the supply of gas and electricity in Great Britain. They also give the licensed businesses statutory powers, such as the right to bury our pipes or cables under public highways and the ability to use compulsory powers to purchase land to enable the conduct of our businesses.
Energy networks are regulated by Ofgem which operates under the direction and governance of the Gas and Electricity Markets Authority. Ofgem has established price control mechanisms that set the amount of revenue that can be earned by our regulated businesses.
Price control regulation is designed to ensure our interests, as a monopoly, are balanced with those of our customers. Ofgem allows us to charge reasonable, but not excessive, prices giving us a future level of revenue sufficient to meet our statutory duties and licence obligations, and also to make a reasonable return on our investment.
The price control includes a number of mechanisms to achieve its objectives, including financial incentives designed to encourage us to: continuously improve the cost and effectiveness of our services; manage and operate our networks; provide quality customer service; and invest in the development of the network in a manner that ensures long-term security of supply.
www.nationalgrid.com
To ensure that our licensed businesses are operating efficiently, and consumers are protected, we operate under eight price controls in the UK, comprising two for our UK electricity transmission operations, one covering our role as transmission owner (TO) and the other for our role as system operator (SO); two for our gas transmission operations, again one as TO and one as SO; and one for each of our four regional gas distribution networks. In addition to the eight price controls, our LNG storage business has a price control covering some aspects of its operations. There is also a tariff cap price control applied to certain elements of domestic metering and daily meter reading activities undertaken by National Grid Metering.
Current price controls
The current price control mechanisms for our gas distribution business will expire on 31 March 2013. The price controls for our transmission business were extended for one year and will now also expire on 31 March 2013. The extension included real increases in revenues for electricity and gas transmission next year and a base real vanilla return of 4.75%. The revenue increase partly reflects the capital investment we have made over the current price control period which forms part of our total UK RAV, which at 31 March 2012 was over £22 billion.
The current price control mechanism establishes the amount of money that can be earned by our regulated businesses is restricted by what is referred to as an RPI-X price control. The RPI-X allowance is based on Ofgem’s estimates of efficient operating expenditure (opex), capital expenditure (capex) and asset replacement, together with an allowance for depreciation and an allowed rate of return on capital invested in our businesses. The RPI-X price control takes the RPI as its inflation benchmark and subtracts X, an efficiency factor, from it. For example, at a time when annual inflation was 3%, a value for X of 2% would allow our regulated businesses to raise prices by no more than 1%.
The RAV, which represents the value ascribed by Ofgem to the capital employed in our regulated businesses, is adjusted to reflect asset additions, removals, depreciation and the rate of inflation.
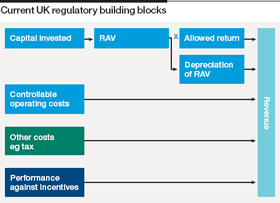
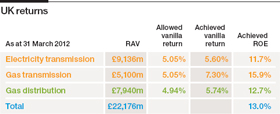 |
Future price controls
It is estimated that we will need to invest over £31 billion during the RIIO period, partly to facilitate the move to a low carbon economy. This will include the gas and electricity networks developing smarter grids, meeting environmental challenges and securing energy supplies.
In light of the challenges around the evolving energy environment and the significant investments required, Ofgem has introduced a new regulatory price control framework to replace the existing framework which has been in use for over 20 years. This is known as RIIO: revenue = incentives + innovation + outputs.
Under this regime, networks will be encouraged to deliver outputs, such as agreed levels of safety, reliability and environmental performance, while ensuring timely connections for customers, improving on customer satisfaction and (for UK Gas Distribution only) complying with social obligations. The networks will be incentivised to deliver these innovatively and efficiently. During the price control review process, Ofgem will assess what an efficient level of expenditure would be to deliver these outputs and will then set the revenue levels accordingly.
The RIIO price control will last for eight years with a mid-period review at four years.
The fundamentals of how our revenue is derived under RIIO are not that different, but the mechanics of how capex and opex (totex) are treated has changed, as demonstrated below. A fixed proportion of totex goes into the RAV (slow money) with the remainder remunerated within the year (fast money).
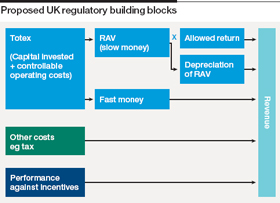
We have developed our business plans in conjunction with our stakeholders and have reflected their views and feedback in our updated plans, submitted to Ofgem in March and April 2012 for our UK Transmission and UK Gas Distribution businesses respectively. Full details of these business plans can be found on our website.
Ofgem will issue their initial proposals for the first RIIO price control period in July 2012 and their final proposals in December 2012. We will continue to work with Ofgem as the RIIO price controls are finalised, aiming to secure positive opportunities to invest for long-term profitable growth and reasonable returns.
|
Business Review
Our operating environment continued
Managing uncertainty
With an eight year price control period replacing the previous five year controls, there will inevitably be a larger exposure to potential variance against our forecasts; for example, on our electricity transmission business a different mix of generators may look to connect to the system than those we have assumed in our baseline plan. In order to understand the impact that different outcomes might have, we have modelled a range of credible future demand and generation scenarios using the scenarios developed with stakeholders through the UK Future Energy Scenarios process. The impact of these alternative scenarios against our baseline capital investment forecast (which uses the ‘gone green’ scenario) is illustrated below:
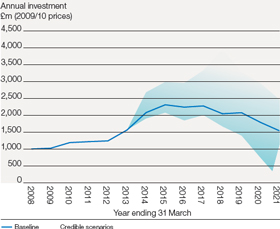
Building on our existing risk management approach, we have developed an innovative risk model to better understand the risks that our business will face, how those risks might best be managed and to evaluate the relationship between uncertainty mechanisms and the required rate of return. We have shared this model with stakeholders, including Ofgem, who have been broadly supportive of it.
Following discussions with stakeholders, we have therefore proposed a number of regulatory mechanisms, which would adjust our allowed investment levels over the period of the price control to ensure there are no inappropriate windfall gains or losses for our networks or consumers as a result of reality diverging from the assumptions we have made in forecasting the next eight years. In doing this, we have maintained the principle that risks should be borne by the party best able to manage them.
Further information on these mechanisms and the risks they seek to reduce is available on our price control stakeholder engagement website: www.talkingnetworkstx.com.
Regulators
In the US, public utilities’ retail transactions are regulated by state utility commissions, including the New York Public Service Commission (NYPSC), the Massachusetts Department of Public Utilities (MADPU), the Rhode Island Public Utilities Commission (RIPUC) and the New Hampshire Public Utilities Commission (NHPUC). Utility commissions serve as economic regulators in approving cost recovery and authorised rates of return. The state commissions establish the retail rates to recover the cost of transmission and distribution services, and focus on services and costs within their jurisdictions. FERC regulates the wholesale transactions of public utilities, such as interstate transmission and electricity generation, and provides for the cost recovery of these services.
Utility commissions are also charged with serving the public interest by ensuring utilities provide safe and reliable service at just and reasonable prices. They establish service standards and approve mergers and acquisitions of public utilities. FERC also regulates public utility holding companies and centralised service companies, including those of our US businesses.
All the states in which we operate have deregulated the commodity or supply component of electricity and gas utility services. Customers in deregulated states have the option to purchase electricity or gas services from competitive suppliers.
Regulatory process
Utilities in the US submit a formal rate filing to the applicable state regulatory body requesting a revenue adjustment in a proceeding known as a rate case. The rate case process is conducted in a litigated setting and, in the states in which we operate, it can take six to 13 months for the commission to render a final decision. In all states, the utility is required to prove that its requested rate change is prudent and reasonable. At FERC there is no defined process for adjudicating a rate case. FERC allows rates to be put in place before a final decision is reached, however, a refund may be required if the outcome is unfavourable. The utility may request a rate plan that can span multiple years.
During the rate case process, consumer advocates and other intervening parties scrutinise and often file opposing positions to the utility’s rate request. The rate case decision reflects a weighing of the facts in light of the regulator’s policy objectives. During a rate case, the utility, consumer advocates and intervening parties may agree on the resolution of aspects of a case and file a negotiated settlement with a commission for approval.
Gas and electricity rates are established from a revenue requirement, or cost of service, representing the utility’s total cost of providing distribution or delivery service to its customers. It includes operating expenses, depreciation, taxes and a fair and reasonable return on certain components of the utility’s regulated asset base, typically referred to as its rate base. The rate of return applied to the rate base is the utility’s weighted average cost of capital, representing its cost of debt and an allowed ROE intended to provide the utility with an opportunity to attract capital from investors and maintain its financial integrity. The total cost of service is apportioned among different customer classes and categories of service to establish the rates, through a process called rate design, for these classes of customers. The final cost of service and rate design are ultimately approved in the rate case decision.
The revenue requirement is derived from a comprehensive study of the utility’s total costs during a recent 12 month period of operations referred to as a test year. Each commission has its own rules and standards for adjustments to the test year which are intended to
www.nationalgrid.com
arrive at the total costs expected in the first year new rates will be in effect, or the rate year, and may include forecast capital investments in determining rate year rate base. Often, known and measurable adjustments are made to test year data to reflect normal operating conditions. In Massachusetts, only limited adjustments to this test year are allowed, which are required to be both known and measurable. New York and Rhode Island allow more comprehensive adjustments to the test year.
In summary, the US regulatory regime is based on a building block approach intended to allow the utility to recover its cost of service and earn a return on its investments.
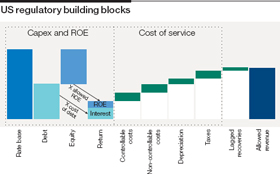
Our rate plans
We have five sets of electricity rates and seven sets of gas rates, covering our electricity distribution operations in upstate New York, Massachusetts, Rhode Island and New Hampshire, and our gas distribution networks in upstate New York, New York City, Long Island, Massachusetts, Rhode Island and New Hampshire. Distribution and transmission electricity services in upstate New York continue to be subject to a combined rate that is billed to end use customers. In New England, retail transmission rates reflect the recovery from our end use customers of wholesale transmission charges assessed to our electricity distribution companies. Wholesale rates for our electricity transmission network in New England and New York and for our Long Island generation business are subject to FERC approval.
We have regulatory arrangements that provide for the recovery of our historical investments and commitments related to our former electricity generation business that were stranded when some of our US subsidiaries divested their generation assets as part of industry restructuring and wholesale power deregulation in New England and New York. We have recovered most of our sunk investments in generation assets and revenue associated with stranded cost recoveries will decline significantly in future years.
Our rate plans are designed to produce a specific allowed ROE, by reference to an allowed operating expense level and rate base. Some rate plans include earned savings mechanisms that allow us to retain a proportion of the savings we achieve through improving efficiency, with the balance benefiting customers.
In addition, our performance under certain rate plans is subject to service performance targets. We may be subject to monetary penalties in cases where we do not meet those targets.
Allowed ROE in context
One measure used to monitor the performance of our regulated businesses is a comparison of achieved ROE to allowed ROE, with a target that the achieved should be equal to or above the
allowed. This measure cannot be used in isolation, however, as there are a number of factors that may prevent us from achieving that target in any given year:
|
|
|
We work to increase achieved ROEs through: productivity improvements; positive performance against incentives or earned savings mechanisms such as energy efficiency programmes, where available; and, through filing a new rate case when achieved returns are lower than that which the Company could reasonably expect to attain through a new rate case.
Features of our rate plans
We are responsible for billing our customers for their use of electricity and gas services. Customer bills typically comprise a commodity charge, covering the cost of the electricity or gas delivered, and charges covering our delivery service. Depending on the state, delivery rates are either based upon actual sales volumes and costs incurred in an historical test year, or on estimates of sales volumes and costs, and in both cases may differ from actual amounts. A substantial proportion of our costs, in particular electricity and gas purchases for supply to customers, are pass-through costs, meaning they are fully recoverable from our customers. Our charges to customers are designed to recover these costs with no profit. Rates are adjusted from time to time to ensure any over- or under-recovery of these costs is returned to, or recovered from, our customers. There can be timing differences between costs being incurred and rates being adjusted.
Revenue for our wholesale transmission business in New England and New York is collected from wholesale transmission customers, who are typically other utilities and include our own New England electricity distribution businesses. With the exception of upstate New York, which continues to combine retail transmission and distribution rates to end use customers, these wholesale transmission costs are incurred by distribution utilities on behalf of their customers and are fully recovered as a pass-through from end use customers as approved by each state commission.
Our Long Island generation plants sell capacity to LIPA under a power supply agreement, approved by FERC, which provides a similar economic effect to cost of service rate regulation. The contract expires in 2013 and new contract negotiations are underway.
In addition, in December 2011, LIPA announced that, after a lengthy competitive bid process related to the management services agreement, we had not been selected to continue to manage and operate Long Island’s electricity system beyond the term of the current agreement, which expires on 31 December 2013.
 |
Business Review
Our operating environment continued
Regulatory filings
The objectives of our rate case filings are to ensure we have the right cost of service with the ability to earn a fair and reasonable rate of return, while providing a safe and reliable service to our customers. In order to achieve these objectives and to reduce regulatory lag, we have been requesting structural changes, such as revenue decoupling mechanisms, capital trackers, commodity related bad debt true ups, and pension and other post-employment benefit (OPEB) true ups, separately from base rates. These terms are explained below the table on the opposite page.
The chart below shows the progress we have made on these regulatory principles (excluding New Hampshire). We continue to work towards implementing these regulatory principles across our US business.
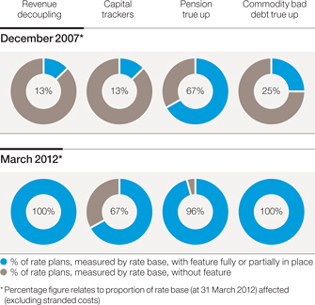
Although many of our rate plans feature revenue decoupling, in some cases decoupling applies only to some classes of customer. As a result, the proportion of revenues which is decoupled is 91% for our electricity businesses and 64% for our gas businesses for 2011/12. Transmission and generation revenue is effectively decoupled.
We have ongoing regulatory filings associated with downstate New York deferrals and tax refunds and the disposal of New Hampshire businesses. Progress continues in these areas. Below we summarise significant developments in rate filings during the year.
Upstate New York 2012 rate filing
On 27 April 2012, we filed a one year rate plan filing for our upstate New York electricity and gas businesses, to take effect from 1 April 2013. The filing included a request for an increase in electricity delivery revenue of $131 million. This would be more than offset by approximately $190 million per annum of rate reductions related to the recovery of certain past deferred costs, resulting in an overall net decrease of approximately $59 million to customers. The filing also includes a request for an increase in gas delivery revenue of $40 million, which would be partially offset by a net decrease in deferral recovery of $29 million. The filing is based on an ROE of 10.55% for the one year rate filing, and includes annual reconciliation mechanisms for certain non-controllable costs.
The filing, which is expected to take 11 months to review and to conclude in March 2013, includes investments of $454 million and $82 million in the electricity and gas businesses respectively. The increased electricity service costs also include the creation of a $29 million sustainable storm fund.
Upstate New York deferral filing
On 16 December 2011, NYPSC approved Niagara Mohawk Power Corporation’s request to recover $240 million in deferred costs ($211 million related to deferred environmental, capital expenditure, and pension costs included in our July 2011 deferral filing, $25 million related to recent storm response costs, and $4 million related to carrying charges and other adjustments). This amount will be collected over 15 months, effective from 1 January 2012. In addition, NYPSC approved the removal of $573 million from Niagara Mohawk’s rates related to stranded cost recoveries.
New York State review
In February 2011, NYPSC instituted a New York State proceeding to review its site investigation and environmental remediation (SIR) expenditure policies. The proceeding directed New York State’s utilities to assist in developing the future scope of utility SIR programmes including cost containment, cost allocation and methods for minimising the impact on customers of SIR cost recovery. A Recommended Decision was issued on 3 November 2011 – the proceeding is open and ongoing.
Rhode Island 2012 rate filing and appeal of ruling in 2009 rate filing
On 27 April 2012, we filed a new rate plan for our Rhode Island electricity and gas businesses, to take effect from 1 February 2013. The filing requests increases in electricity distribution revenue of $31 million and gas delivery revenue of $20 million, based on an ROE of 10.75% with annual reconciliation mechanisms for certain non-controllable costs such as pensions and OPEB, property taxes and commodity bad debt true up.
In order to ensure the new investments are effectively implemented, the new filing sets out the case for new rates, cost of service allowances and other needs for the businesses. The capital spending programme for these two utilities is addressed annually outside of this filing. The current levels of approved capital investment for the year which commenced on 1 April 2012 are $61.9 million for the gas system and $56.5 million for the electricity system. The filing is expected to take nine months to review and to conclude in January 2013.
On 23 January 2012, the Rhode Island Supreme Court issued its decision on our appeal of RIPUC’s decision in its 2009 rate case. The Court reversed RIPUC’s decision to impose National Grid’s capital structure onto Narragansett but affirmed their decision to disallow 50% of our incentive compensation. On 11 April 2012, RIPUC adopted a settlement resolving the capital structure aspects of the rate order, which we had appealed. The settlement authorises Narragansett a capital structure comprised of 48.78% common equity, an overall rate of return of 7.31%, and an additional $3.2 million electricity rate increase, effective from 23 April 2012.
Overland audit
In February 2011, NYPSC selected Overland Consulting Inc., a management consulting firm, to perform a management audit of our affiliate cost allocations, policies and procedures. The audit of these service company charges seeks to determine if any service company transactions have resulted in unreasonable costs to New York customers for the provision of delivery services. If potentially material levels of misallocated or inappropriate costs are discovered, at the direction of NYPSC, the investigation will be expanded to prior years to determine if they have been charged to the New York utilities. A report of this review to NYPSC is anticipated in 2012.
28National Grid plcAnnual Report and Accounts 2011/12
www.nationalgrid.com
Summary of US price controls and rate plans
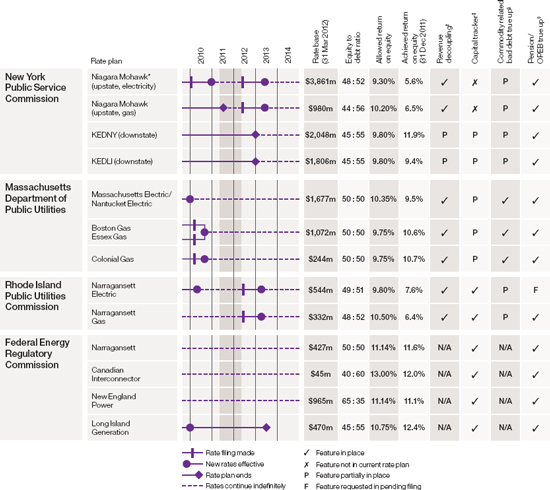
* Both transmission and distribution, excluding stranded costs
†Revenue decoupling
A mechanism that removes the link between a utility’s revenue and sales volume so that the utility is indifferent to changes in usage. Revenues are reconciled to a revenue target, with differences billed or credited to customers. Allows the utility to support energy efficiency.
‡Capital tracker
A mechanism that allows for the recovery of the revenue requirement of incremental capital investment above that embedded in base rates, including depreciation, property taxes and a return on the incremental investment.
§Commodity related bad debt true up
A mechanism that allows a utility to reconcile commodity related bad debt to either actual commodity related bad debt or to a specified commodity related bad debt write-off percentage. For electricity utilities, this mechanism also includes working capital.
¯Pension/OPEB true up
A mechanism that reconciles the actual non capitalised costs of pension and OPEB and the actual amount recovered in base rates. The difference may be amortised and recovered over a period or deferred for a future rate case.

Annual Report and Accounts 2011/12National Grid plc29
Business Review
The following chart demonstrates the alignment between the elements of our strategy, the strategic objectives that will enable us to deliver it, the risks we face and what we have delivered this year.
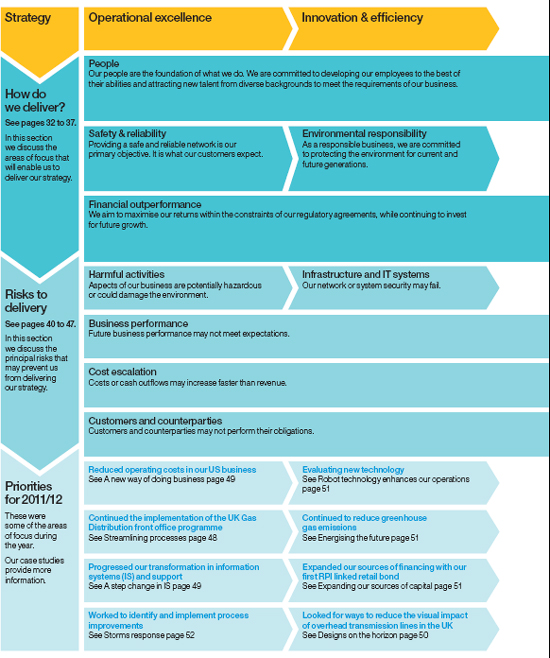
30National Grid plcAnnual Report and Accounts 2011/12
www.nationalgrid.com
Use this as a road map to the content on pages 32 to 55.
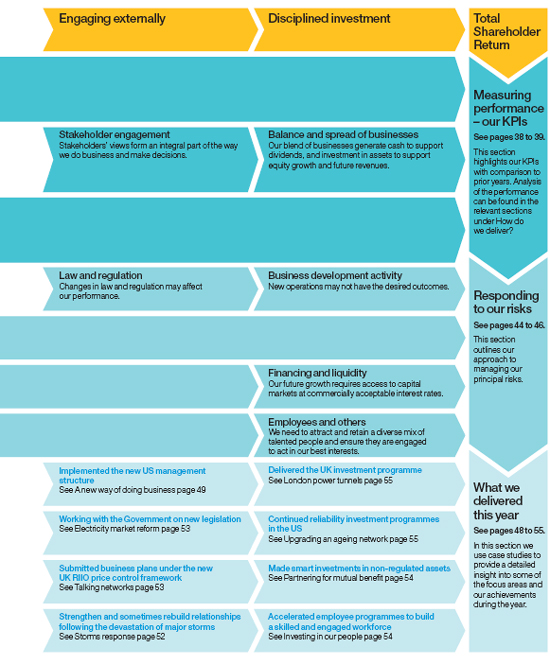

Annual Report and Accounts 2011/12National Grid plc31
Business Review
Delivering our strategy
Our people are the foundation of what we do. It is through their actions that we will deliver our strategy; ensuring we have a skilled, engaged and dedicated workforce is essential to this. Delivering a safe and reliable network is the number one priority for our people. We also remain committed to being an innovative leader in energy management and to safeguarding our global environment for future generations.
The relationships we hold with our regulators, customers and communities continue to be important; we have made changes to forge even deeper relationships and broaden our engagement with stakeholders.
We continue to invest to create organic growth and evaluate other investment opportunities as they arise. Any investment we make will fit with our strategic goals, deliver a reasonable return and maintain the balance and spread of our businesses.
People
We are committed to developing our employees to the best of their abilities and to ensuring we have access to the widest possible pool of talent to meet the current and future requirements of our business.
Building an engaged workforce
We measure how engaged our people are through our employee engagement index, calculated from certain questions in our employee survey. Our 2012 employee survey included 68 questions and was completed by 84% of our employees. The results allow us to identify specific areas where we are performing well and those areas we need to improve.
We have undergone a significant amount of change within our US business having completed the transition to the new jurisdictional operating model including identifying 1,150 roles that have been removed from our structure. Significant change affects each employee differently and, as expected, this has affected our 2012 global employee engagement index, which has decreased compared to the last results in 2010. We are now embarking on a review of our UK operating model to ensure that it is scalable and structured correctly to deliver the increasing capital investment programme and to be successful under the new RIIO price control framework.
We want to make sure our people are as fully engaged as they can be. To demonstrate our ongoing commitment to this important area, one of our 2012/13 shared priorities is to increase levels of employee engagement across all our teams. We have created a Company wide framework called engaging for performance that explains what we believe contributes to increasing engagement, which in turn results in higher levels of performance.
Survey reports are produced at Company wide, region, business unit, function and team levels and associated action plans are created. The engaging for performance framework provides managers with access to practical and easy to use tools and guidance to support them when developing team action plans.

Communicating for success
Good communication helps employee engagement and we have multiple communication channels to ensure our more than 25,000 employees have access to information that is relevant to them and so that they feel connected to the business. We use our intranet site to make announcements, share our achievements and to communicate what we have learnt and other information useful to our people. We also have various open forums where senior leaders share key topics relevant to our business. These provide our people with the opportunity to ask questions and connect with leadership. We produce a monthly magazine and use various team forums and other traditional communication methods such as email broadcasts and discussion boards.
Aligning individual and corporate goals
The incentive plans for our Executive Directors include financial measures such as earnings, returns and cash flow which align their interests with the success of the Company. See the Remuneration Report section of Corporate Governance on pages 90 to 106 for more information.
Our strategy is cascaded to employees. This ensures that the objectives of each employee align with those of the Company and the actions required to deliver the strategy are allocated to and shared by all our people, connecting them to our corporate goals.
Our performance, talent and reward management process for managers links incentive compensation to an assessment of both what the individual has achieved and how those outcomes have been achieved, with reference to their individual objectives. This provides ongoing incentive for all managers to contribute to the achievement of our strategic goals and ensures that our top performers are recognised for their contributions.
32National Grid plcAnnual Report and Accounts 2011/12
www.nationalgrid.com
Building capability
We have reviewed the leadership, business and technical capabilities that we will need to ensure we are successful, including: driving process excellence; innovation; and stakeholder management. We are designing tools and processes to help elevate our capabilities in those areas and they will be supported by training programmes and other learning opportunities. We have invested in a range of technologies that will enhance the learning experience and reduce the cost associated with training delivery. We endeavour to continually improve the quality of our new talent development programmes and our focus on this has external recognition, including 2010 Ofsted grade 1 outstanding performance rating and UK Learning and Skills Improvement Service Beacon status.
Our graduate scheme is well regarded and we have continued to be an employer of choice. In 2012, we were ranked 84 in the Times Top 100 graduate employers, an improvement on 2011 when we entered the Top 100 for the first time. Our graduate retention levels are good, standing at 86%.
The foundations of leadership programme, aimed at the next generation of managers, continued to run throughout 2011. For our female employees, we also continued to provide access to the Springboard and Spring Forward development programmes in the UK and Women Empowered in the US. We appeared in the Times Top 50 Employers for Women 2012, appearing in the list since 2006.
Promoting inclusion and diversity
We aim to develop and operate our business with an inclusive and diverse culture, ensuring equal opportunity in recruitment, career development, training and reward for all employees regardless of race, gender, nationality, age, disability, sexual orientation, gender identity, religion and background. Where existing employees become disabled, our policy is to provide continued employment and training wherever practical. A focus for 2011/12 was creating a level playing field in the organisation. These policies support the attraction and retention of the best people, improve effectiveness, deliver superior performance and enhance our success.
Our employee resource groups, which cover areas including gender, ethnicity, disability, faith, sexual orientation, veterans and new employees, continue to have good membership. These groups deliver opportunities for professional development, networking, supporting our community relations activities and increasing the broader understanding of inclusion and diversity through workshops, presentations and other educational events.
Information on our inclusion and diversity policies can be found on the corporate responsibility section of our website.
Attracting the best people
As a result of our extensive capital investment plans in the UK, we need to increase our employee numbers in key parts of our business, particularly engineers and other technical roles. In 2011/12, we have recruited more than 450 engineers and, over the next nine years, we expect to recruit over 2,500 more.
We are establishing medium- and long-term talent pipelines and have launched an engineering entry programme for recent graduates with science, technology, engineering or maths (STEM) degrees. The two year comprehensive and structured training programme will provide a blend of practical experience with traditional training programmes and will help the recruits develop project management and development expertise, as well as
increase their technical knowledge and gain specialist experience of the energy sector. On successful completion, they will be appointed to a permanent role.
With an ageing workforce and declining interest in STEM subjects by young people, pressure on recruitment will continue for many years. Our long-term talent programmes will help to provide us with the expertise we need to be successful well into the future. This year in the UK, we worked with more than 3,900 school students giving them an insight into engineering, the energy sector and National Grid. We delivered 22 open days, ran two residential work experience week courses for nearly 100 15 year olds at our training centre, supported seven engineering education scheme projects, delivered 30 STEM enhancement days and many talks in schools. In the US, we face similar challenges to ensure we have access to top quality, well trained candidates to maintain the number and quality of our workforce over time. Over the next 10 years, we expect to fill around 800 management level roles that require an engineering background and we run a number of initiatives similar to those in the UK. In addition to our work in the US with school aged children to inspire interest in STEM subjects, we work with local community colleges on their energy utility technology programmes designed to give students the technical and practical skills required to work on the construction or maintenance of power lines. We also run our own engineering pipeline programme and have recently completed the second year. This six year development programme is designed to inspire promising students to become engineers and provide them with an opportunity for fast tracked employment with us.
Safety and reliability
Providing safe and reliable services is what our customers expect.
Keeping our people and the public safe
While our employee lost time injury frequency rate was 0.18, the same as 2010/11, this year we have seen accidents leading to the deaths of two members of the public and one contractor. We have investigated thoroughly and learnt from these tragedies.
We recognise the need to reinvigorate and reinforce our safety agenda across the Company. All our senior leadership team are asked to be visible safety leaders actively engaging with employees to drive our safety ambition forward and ensuring lessons learnt from any incidents are acted on as appropriate.
Further development of our safety culture will be critical to navigating the heightened risks that come with our expanding capital investment programme. Key parts of the business have undertaken safety culture surveys to capture what our employees think about how we manage safety and help us identify areas where we need to improve. We are committed to ensuring that everyone has the expertise, and exhibits the right behaviours, to work safely and without harm. We will also leverage our size, and learn from our partners, to identify best practices and ensure these are shared and implemented across our business.
A recent area of focus has been deploying a major accident hazard framework and risk methodology and standards that build greater structure into process safety and risk management. These standards have been developed collaboratively by technical specialists in the UK and US. The requirements are being discussed
Annual Report and Accounts 2011/12National Grid plc33
Business Review
Delivering our strategy
How do we deliver? continued
with all of our relevant businesses and teams to ensure they are implemented and applied consistently. A review process has been established using technical specialists and third party independent assessors to aid sharing and consistent application of standards.
Our Executive Committee monitors progress against our safety goals monthly and the Board’s governance arrangements for the oversight of safety are being strengthened.
Delivering reliability
Our licences and regulatory agreements set out reliability targets and these are linked to our revenue streams. Excluding the impact of storms in the US, we are pleased to report that we have substantially met all our reliability targets for the year. We failed one target in Massachusetts, however, due to our good performance against other targets for the state, this had no financial impact. After failing to meet some of our emergency standards of service last year and being fined £4.3 million by Ofgem, we are also pleased to report that we met all our standards of service in the UK this year.
Reliability is achieved through four interrelated actions: planning our capital investments to meet changing demand and supply patterns; designing and building robust networks; risk based maintenance and replacement programmes; and detailed and tested incident response plans.
Our UK Future Energy Scenarios publication outlines our forecasts for energy needs in the UK up to 2050. We use this to inform our capital investment plans and ensure our networks will deliver what is required in the future. In the US, we are taking part in the Eastern Interconnection Planning Collaborative, funded by the US Department of Energy, and working with other utilities, regulators and independent system operators to model future energy scenarios and consider their effects on the future of the electricity transmission grid by 2030.
Our construction teams work closely with our engineers to ensure that the networks designed and built will meet internal and external technical specifications and deliver the required levels of reliability once brought into service. Our UK Transmission business, where the majority of our capital investment will be undertaken, is PAS 55 and ISO 9001 certified, and has detailed procedures in place governing a project throughout each phase of scoping, design, commissioning and the transition to normal operations. Key roles on each project are defined and owners assigned, along with appropriate independent checks to ensure quality is maintained.
We collect and analyse a large quantity of data relating to network reliability including faults, failures and defect information. Using this information, asset health indices are assigned to the major equipment groups. These are then considered together with safety, system and environmental criticality to give replacement priorities that feed into our maintenance and replacement programmes.
Planning for a disaster can take a number of forms. In December, our US team worked with the Department of Homeland Security, FBI, local law enforcement and fire departments and other government agencies in a simulated attack on one of our generation plants. The simulation tested our emergency response plans, validating the plans already in place and identifying areas for improvement.
Our commitment to reliability extends to our efforts to restore electricity and gas to customers in a timely manner when an outage occurs. Major flooding of the Mohawk River, in the area of the Amsterdam and Rotterdam Junction in New York, led to significant damage to our gas facilities at several locations and resulted in
approximately 440 customers losing their gas supply. Permanent repairs to the damaged facilities would have taken months, an outcome unacceptable to both us and our customers. We embarked on a plan to bring in LNG, a remedy with little or no precedent in New York. With extensive work by our crews and cooperation of NYPSC, New York State Departments of Transportation and Environmental Protection, the local fire department and others, we were able to successfully restore gas services within a week. Our service territories were in some cases seriously affected by storms this year which resulted in large restoration efforts across our businesses. While we try and learn lessons from these events and improve how we deal with them, our responses to some of them, such as tropical storm Irene and the October snow storm, are subject to investigations by a number of our regulators.
Smart grid
Modernising our networks is an essential part of our continued growth. In the US, we anticipate receiving a regulatory order this summer to carry out a $44 million pilot in Worcester, Massachusetts. We expect to test customer choice with a goal of reducing energy use by 5% as well as implementing new distribution grid equipment that has the potential to make capital investment more efficient, reduce losses, improve reliability, and assist with storm restoration as we modernise the grid. This pilot will serve to show what will be possible across the US business.
Environmental responsibility
As a responsible business, we are committed to protecting the environment for current and future generations.
Investing in and running electricity and gas networks means we use energy and raw materials, and produce waste. Our goal is to reduce any adverse effect we may have and we look for ways to improve the environment. We embrace new technology and methods to use resources more efficiently and sustainably, seek to responsibly refurbish existing assets and reduce waste through recycling and materials efficiency.
Reducing greenhouse gases
We have continued with our climate change and energy efficiency programmes and remain committed to our targets of a 45% reduction in Scope 1 and 2 greenhouse gas (GHG) emissions by 2020 and 80% by 2050. Refer to the glossary on page 193 for a definition of Scope 1 and 2 emissions. We continue to look for new technology or more efficient equipment that will help us achieve these goals and we have outperformed a number of targets for emissions during the year, including some tied to incentive revenues. Our total Scope 1 and 2 emissions for 2011/12 were 8.7 million tonnes carbon dioxide equivalent. This represents a 55% reduction on our 1990 base line. We have refreshed our rolling five year GHG reduction plans and, although our 2011/12 outturn is better than our 2020 target, we have many challenges through the next few years that will require considerable focus in the business.
We have a number of ongoing initiatives that have helped achieve these results. Some of our gas distribution networks in both the UK and US consist of old metallic pipe, which contributes significantly to the gas losses from our system. We have replaced around 2,500 kilometres of this leak prone pipe during the year across our UK and US businesses and have estimated the replacements in the UK will achieve the equivalent of a 3% reduction in gas losses each year.
34National Grid plcAnnual Report and Accounts 2011/12
www.nationalgrid.com
In the UK, we also now use computerised pressure management equipment that matches system pressures with demand, improving safety, driving considerable reductions in gas losses and, consequently, reducing the level of our greenhouse gas effects. We also continued our focus on reducing the losses of SF6, a powerful greenhouse gas, from high voltage switchgear on our system through improved leak detection and repair processes and continue research to identify alternatives.
Supporting the move to a low carbon economy
In the UK, we are already developing networks to facilitate new generation, eg commissioning Cleve Hill substation to enable London Array Limited to connect the world’s largest wind farm.
In the US, we are investing in oil to gas conversions in customer premises and installing gas infrastructure and services to support new construction. Over the last three years we have connected over 120,000 new gas heating customers. Demand for new interconnections of green generation in the US is on the rise with a 70% increase in the applications received in New York and New England in 2011. These included combined heat and power, farm waste, fuel cells, hydro, solar and wind projects. In response to this escalating market demand we have created two new groups within our business to process the requests efficiently and ensure they are connected in accordance with the appropriate technical standards and the applicable state tariffs.
We recently installed 32 new electric vehicle charging stations in Massachusetts under the Coulomb Technologies’ ChargePoint America programme. Through programmes such as these, we offer our customers more sustainable energy options that help to protect the environment.
Stakeholder engagement
Stakeholders’ views form an integral part of the way we do business and make decisions.
Meeting the needs of stakeholders
Our stakeholder engagement principles include:
|
|
|
|
For example, in the course of developing our electricity and gas transmission and gas distribution business plans for RIIO-T1 and RIIO-GD1, we held 26 workshops, talking directly to several hundred stakeholders with a broad range of interests. We produced three written consultations, held numerous forums and focus groups, undertook in-depth telephone interviews and surveyed opinions from over 10,000 customers. We used an independent third party to facilitate our stakeholder engagement so we could be sure we were not unwittingly influencing, misunderstanding or misinterpreting what our stakeholders were saying. For our Worcester smart grid pilot, we held a two day ‘appreciative inquiry summit’ to engage with the local community including local government, businesses and households. We recognise active participation from a broad
cross section of the community will be important to complete the pilot successfully.
Our regulators remain an important area of focus for our stakeholder engagement activities. Through our new US jurisdictional focus, we are better able to communicate with our regulators, ensuring they have a point of contact that understands their perspective and is committed to meeting their needs. We have also opened an office in Brussels to establish a stronger and more visible presence with EU institutions and policy makers on key strategic issues facing us in the years to come.
Industry engagement
Participation by our employees on other bodies allows us to engage more broadly, and we aim to be supportive of roles on industry boards and other groups. For example, our US vice president, engineering standards and policy, currently sits on the US Department of Transportation’s Technical Pipeline Safety Standards Committee. Engagement such as this allows us to participate in and inform debates as they occur and to learn from the best practices of others. In the wake of the San Bruno gas explosion, the US Government passed into law the Pipeline Safety, Regulatory Certainty and Job Creation Act. Some of the new rules and safeguards coming out of the law are a direct result of the issues discussed by the Committee.
Improving customer service
We recognise the importance of good customer and community relationships. Success is evident from the improved results in our key Ofgem customer satisfaction studies in the UK as shown in our KPIs on page 39. We participate in four studies in the J.D. Power and Associates customer satisfaction study in the US. Our target goal was a one quartile improvement in each of the four studies. We achieved this in the Business Gas study. However, in the Business Electric and Residential Electric studies, we remained in the same quartile and in the Residential Gas study we fell one quartile.
In late 2011, we opened our new integrated UK Gas Distribution customer centres in Hinckley and Leicester, which combine cutting edge technology and specialist training to offer a fresh approach to customer service. The new technology provides greater visibility of all the work we are doing, allowing our employees to respond more effectively and resolve more enquiries on the first call, resulting in improved service and customer satisfaction. The centres provide our customers with a single point of contact 24 hours a day, seven days a week to ensure we can always maintain a high level of service and meet our commitments. The importance of this work in the UK will be reinforced by requirements under the new RIIO price control, where customer satisfaction is a specific output measure linked to our potential revenue.
Working with our communities
We believe that helping local businesses is one of the best ways to help the communities we serve. If they are strong and growing we will be too. Through our community investment initiatives, we aim to identify and support local projects that can have a positive effect in the communities in which we operate.
In the US, since 2003, our economic development grants have totalled $53 million and have helped create or retain more than 19,000 jobs. In December 2011, we provided $1 million to Albany, New York for use in their State Street revitalisation. The grant will help build new footpaths, underground conduits, decorative lighting and other amenities. This revitalisation programme is expected to help the city’s economic growth by attracting more businesses, residents and visitors to the area.
Annual Report and Accounts 2011/12National Grid plc35
Business Review
Delivering our strategy
How do we deliver? continued
We have even extended our outreach to include the communities in which our key suppliers operate. The Global SpirIT initiative raises funds for the education of underprivileged children in India, where we have been working with IT suppliers for over 17 years.
Balance and spread of businesses
We deliver our returns to shareholders through a balance of equity growth and cash returned in the form of a growing dividend. This is supported by the complementary features of the businesses which, together, make up our group.
National Grid today consists of a balanced blend of distinct regulated businesses in the UK and US and some non-regulated businesses, primarily in the UK. This includes a mixture of cash generative developed assets with minimal investment requirements (such as our existing interconnectors and National Grid Metering), businesses with low to medium levels of growth and positive cash generation (such as our UK and US distribution businesses) and businesses with high levels of investment and growth (such as our UK electricity transmission business and potential new non-regulated investments).
We continue to develop our balance and mix of businesses through cycles of investment and cash generation. Our target is to maximise shareholder value while delivering appropriate levels of both cash generation, to support dividends, and investment in assets, to support equity growth and future revenues.
We consider a number of factors when assessing any current or future business’ contribution to the group. This includes its contribution to cash flows and earnings, its asset base growth and funding requirements and the regulatory or commercial framework applying to that business. On an ongoing basis we review the business balance, considering our strategic objectives and long-term growth opportunities.
Where an individual business is not expected to exhibit the range of characteristics we are looking for within a reasonable timeframe, or where we are offered a higher value for the business than we might place on it, we will consider selling that business. In the last year, we have sold Seneca-Upshur, a gas and oil exploration and production business in the US, and our OnStream non-regulated metering business in the UK and we await the final regulatory approvals for the sale of our Granite State Electric and EnergyNorth businesses in New Hampshire which we announced in December 2010.
Financial outperformance
We aim to maximise our returns within the constraints of our regulatory agreements, while continuing to invest for future growth.
We have seen a good financial performance this year with positive movement in all our financial KPIs excluding the impact of timing differences and major storms, where relevant.
Capital investment programme
A feature of our price controls and rate plans is that we earn a return on our regulated asset base. As a result, as our regulated asset base increases our returns should similarly increase. We continue to invest in our regulated asset base and, in the UK, our RIIO
submissions have reflected a need for investment over the eight year price control in excess of £31 billion for our UK Transmission and UK Gas Distribution businesses. This is dependent on the location and number of new connections required and, if achieved, will represent an average cumulative annual growth rate in our regulated asset value of over 8%.
This amount of investment will not be without its challenges: obtaining planning permission for major projects is time consuming and can create delays; finding and developing enough people with the right skills will be difficult; and managing the costs of key inputs that are forecast to increase faster than the rate of inflation due to worldwide demand for these products, will also pose a challenge.
In the US, we will continue to invest in our regulated asset base with a focus on modernising and maintaining our network and, where appropriate, increasing its capacity. For example, work is underway with FERC and other utilities on the construction of the New England East-West Solution. This is a new transmission line in southern New England that will increase capacity in a constrained area of the grid and once completed will represent a significant investment in a new transmission asset.
We continue to look for smart investments in non-regulated businesses and are assessing expansion plans for our Grain LNG business.
Despite the Government withdrawing funding for the proposed carbon capture and storage (CCS) project at Longannet, we believe CCS to be an important element in the Government’s strategy to achieve its carbon reduction targets. We are working with several UK emitters to develop CCS projects; these are seeking funding through a Government competition that is scheduled for the second half of 2012.
Work continues on plans for an interconnector between the UK and Belgium, a joint project with the Belgian transmission system operator which will be the first electricity link between the two countries. The 1,000 megawatt undersea cable will run between Zeebrugge and Richborough and is expected to enter commercial operation in 2018.
Remuneration from investment
In the UK, we work closely with Ofgem and the Health and Safety Executive, the main safety regulator in the UK, to balance the needs of all stakeholders for a safe and reliable network with a price control that provides the required return to allow us to operate our businesses effectively. We will only accept a price control settlement if we believe that it achieves this balance. In the US, some of our rate plans do not include capital trackers and therefore spend on capital programmes may be unremunerated until we file a new rate case. We carefully track our capital spending compared to our rate allowances and, when we believe additional spending is required, we may file a new rate case.
For more information on the features of our price controls and rate plans, refer to pages 25 to 29.
Incentives and outperformance
In the UK, achieving output targets to earn incentive revenue is a key element of our ability to provide superior financial returns. Our price control plans have historically included a range of incentive mechanisms and under RIIO the importance of incentive revenue will increase. Examples of our current incentive mechanisms include:
|
36National Grid plcAnnual Report and Accounts 2011/12
www.nationalgrid.com
|
|
Our US rate plans generally do not feature the same variety of incentive mechanisms used in the UK, however, some include earned savings mechanisms that allow us to retain a proportion of the savings we achieve through improving energy efficiency, with the balance benefiting customers. In addition, the electric generation power supply agreement with LIPA contains a performance-based incentive and penalty mechanism. We may earn or lose up to $4 million depending on how well we operate the generation units as measured by reliability, efficiency and capacity metrics.
Under our UK price controls and some of our US rate plans, our revenues include an imputed cost of debt. We manage our interest rate risk using fixed- and floating-rate debt and derivative financial instruments including interest rate swaps, swaptions and forward rate agreements. Where we actively manage our interest rate risk, we seek to minimise total financing costs (being interest costs and changes in the market value of debt), subject to constraints, with the aim of outperforming the imputed cost of debt. The Finance Committee regularly monitors performance by comparing the actual total financing costs with those of a comparable, passively managed, benchmark portfolio.
Increasing productivity
We are undertaking a number of transformation initiatives to improve the efficiency and effectiveness of our operations.
Our global information systems (IS) transformation project will replace ageing IS infrastructure that currently limits our ability to deliver reliable IT systems and inhibits the creation of platforms for growth. Under a partner provided approach, our IS services will offer a more flexible, cost effective, transparent and responsive delivery model. Our UK Gas Distribution front office programme has progressed significantly during the year and is already showing benefits. The final deployment of the system, which will help our repair and construction teams, is on track to complete ahead of the Olympics this summer. More information on these programmes can be found in the case studies on pages 48 and 49.
In the US, we are replacing two legacy information systems along with a range of ancillary systems. This change, in conjunction with various process improvement initiatives within our US finance function, simplifies our cost allocation methodology, allows better jurisdictional reporting and improves controls over our financial reporting processes.
Each of these transformation initiatives contributes to our ability to support our future growth, improve operational performance and efficiency, and respond to the needs of our stakeholders.
Managing costs
As discussed on pages 24 to 29, our allowed revenues are set in reference to an expected cost to deliver our services. We must manage our costs closely within that framework as, without the permission of our regulators, we may not be able to increase our revenues to compensate for cost overruns. We set budgets and assign owners for cost centres within the business who are responsible for delivering set outputs within that budget.
| ||||
| ||||
| ||||
| ||||
| ||||
| ||||
| ||||
| ||||
| ||||
| ||||
| ||||
| ||||
| ||||
| ||||
| ||||
| ||||
|
| |||
Annual Report and Accounts 2011/12National Grid plc37
Business Review
Delivering our strategy
Measuring performance – our KPIs
Financial KPIs
produced, they have necessitated significant additional cost.
|
|
|
In the US, we supply gas and electricity to customers who have chosen us as their supplier. Our regulatory agreements allow us to recover the costs we incur when we buy gas and electricity. During 2013/14 we saw an increase in complaints about higher energy bills – a consequence of the Energy prices have been
| |||||
In terms of our UK network upgrade plans, we are pleased with progress on the London Power Tunnels project and have now started site works on the HVDC link connecting Scotland and England. This joint venture with SP Transmission will support the export of low carbon Scottish generation. In the US, our Brooklyn/Queens Interconnect project will connect our existing natural gas distribution systems in Brooklyn and Queens, which will ensure greater reliability and safety, provide additional capacity and meet future energy needs for customers. This is the first new gas pipeline to be installed in the area in 50 years. We are determined to embed sustainability by seeking to combine innovation, engagement and efficiency – an example of which was a trial in the UK, working with manufacturers, construction partners and our procurement teams to re-manufacture aluminium overhead line conductors. | People
I was also pleased to attend a series of celebrations to mark 40 years’ service for more than 300 of our employees in both the UK and US. I am delighted that so many of our people have forged productive and committed careers at National Grid that have spanned such a long time. Yet at the same time, it serves as a reminder about the scale of the challenge we have in our industry to make sure we have enough people with the skills and experience we need in the future. It is a significant challenge on both sides of the Atlantic. In the UK, for example, around 89,000 people are needed annually to meet demand in the UK’s engineering sector over the next decade. Yet only around 51,000 are joining the profession each year. In the US, by 2018, STEM occupations will account for about 1.1 million new jobs and 1.3 million replacement positions due to STEM workers leaving the workforce. To help address this shortage, National Grid is running, or is involved with, a number of programmes and initiatives in the UK and US aimed at encouraging young people to study STEM subjects – you can read more about these initiatives on page 40. Our priorities for next year • Safety – build on our strong UK performance and focus our efforts on delivering consistent world-class safety performance across the organisation; • Customer-focused execution – in the UK, continue our strong start to RIIO; underpin energy security through our interconnector and infrastructure investment strategy. In the US, complete stabilisation of our enterprise resource system; perform strongly against our current regulatory rate plans while shaping the future; and • Stakeholders – continue to engage with our stakeholders in the US, UK and EU to understand their changing energy needs and to shape energy policy.
Steve Holliday |
| ||||||
Principal operations
|
| |||||||
| People
|
06 National Grid Annual Report and Accounts 2013/14
review | We have delivered another year of solid financial performance with a good start under RIIO in the UK and consolidation of underlying improvements in the US. | |||||||||||
Our financial KPIs Adjusted earnings per share Adjusted operating profit Our adjusted operating profit has increased by £25 million (1%) to £3,664 million. Across our three UK businesses operating under the new RIIO framework, adjusted operating profit was up £34 million. Allowed revenues increased in Electricity Transmission and Gas Distribution and fell in Gas Transmission. The resultant increase in revenue was offset by higher controllable costs, higher depreciation as a result of continued investment and adverse movements in timing year on year. Our US Regulated business was £129 million lower, reflecting a weaker dollar, the end of Niagara Mohawk deferral recoveries at March 2013, higher controllable costs due to inflation, and increased insurance costs following major storms last year. These were partially offset by the non-recurrence of the major storm costs incurred last year. Other activities adjusted operating profit was £120 million higher, driven by higher profits in the French interconnector, non-recurrence of Superstorm Sandy costs in our insurance captive, and improved performance in our Metering business. These were partially offset by increased spend on the stabilisation of new US information systems. Adjusted earnings Our adjusted net interest charge was slightly lower than 2012/13 at £1,108 million, reflecting the weaker dollar. Our adjusted tax charge was £38 million lower at £581 million. This was mainly due to a 1% decrease in the UK statutory corporation tax rate in the year, a change in the UK/US profit mix and changes in tax provisions in respect of prior years. As a result of this, our effective tax rate for 2013/14 was 22.5% (2012/13: 24.4%). The earnings performance described above has translated into adjusted EPS growth in 2013/14 of 2.6p (5%) (2012/13: 5.4p, 12%). Adjusted EPS1 pence
1. All comparatives restated for IAS 19 (revised). See note 1 on page 92. In accordance with IAS 33, all EPS and adjusted EPS amounts for comparative periods have been restated as a result of shares issued via scrip dividends and the bonus element of the 2010 rights issue. |
Measurement of financial performance We describe our results principally on an adjusted basis and explain the rationale for this on page 182. We present results on an adjusted basis before exceptional items, remeasurements and stranded cost recoveries. See page 182 for further details and reconciliations from the adjusted profit measures to IFRS, under which we report our financial results and position. The comparative numbers have been restated for the adoption of IAS 19 (revised) ‘Employee benefits’. See further detail in note 1 on page 92.
A reconciliation between reported operating profit and adjusted operating profit is provided below. Further commentary on movements in the income statement is provided on page 85.
|
| |||||||||||||
| Year ended 31 March | ||||||||||||||
| £m | 2014 | 2013 | 2012 | |||||||||||
| ||||||||||||||
Total operating profit | 3,735 | 3,749 | 3,535 | |||||||||||
Exceptional items | (55) | 84 | 122 | |||||||||||
Remeasurements – commodity contracts | (16) | (180) | 94 | |||||||||||
Stranded cost recoveries
|
| –
|
|
| (14)
|
|
| (260)
|
| |||||
| ||||||||||||||
Adjusted operating profit | 3,664 | 3,639 | 3,491 | |||||||||||
Adjusted net finance costs | (1,108) | (1,124) | (1,090) | |||||||||||
Share of post-tax results of joint ventures | 28 | 18 | 7 | |||||||||||
Adjusted taxation | (581) | (619) | (697) | |||||||||||
Attributable to non-controlling interests
|
| 12
|
|
| (1)
|
|
| (2)
|
| |||||
| ||||||||||||||
Adjusted earnings
|
| 2,015
|
|
| 1,913
|
|
| 1,709
|
| |||||
| ||||||||||||||
Adjusted EPS
|
| 54.0p
|
|
| 51.4p
|
|
| 46.0p
|
| |||||
| ||||||||||||||
Group return on equity (RoE) We measure our performance in generating value for our shareholders by dividing our annual return by our equity base.
Group RoE has increased during the year to 11.4%, due to the impact of major storms in the prior year. Excluding major storms, Group RoE has decreased by 30bps reflecting the end of Niagara Mohawk deferral recoveries, together with higher controllable costs and system costs in the US. These negative impacts were partially offset by French interconnector performance and the lower UK tax rate.
Group return on equity %
|
| |||||||||||||
Our revised financial KPIs page 09 Exchange rates page 85 Use of adjusted profit measures page 182 Reconciliations of adjusted profit measures page 182 |
Strategic Report | Corporate Governance | Financial Statements | Additional Information | 07 |
We have changed the way we present our financial information in the Strategic Report to remove duplication. As a result, the analysis here focuses on our KPIs and other performance measures we use to monitor our business performance. Analysis of our financial performance and position at 31 March 2014, including the performance of our principal operations, has been relocated to the financial statements, however this analysis still forms part of our Strategic Report financial review. See page 75 for further information. See pages 183 to 185 for commentary on our financial performance and position for the year ended 31 March 2013 compared with 2012. |
Regulated asset growth Our regulated assets have increased by 3% (£1 billion) to £34.7 billion, reflecting the continued high levels of investment in our networks in both the UK and US. Maintaining efficient growth in our regulated assets ensures we are well positioned to continue providing consistently high levels of service to our customers and increases our revenue allowances in future years.
The UK regulatory asset value (RAV) increased by £1.1 billion, reflecting inflation and significant capital expenditure in our UK Electricity Transmission business in particular. The US rate base decreased by £0.1 billion. Foreign exchange movements decreased the rate base reported in sterling by £0.9 billion. Offsetting this, investment in the networks and working capital movements increased rate base by £0.8 billion.
Total regulated assets and regulated asset growth £bn
| The Board is confident that growth in assets, earnings and cash flows, supported by improving cash efficiency and an exposure to attractive regulatory markets, should help the Group to maintain strong, stable credit ratings and a consistent prudent level of gearing, while delivering attractive returns for shareholders.
Other performance measures Dividend growth During the year we generated £1.3 billion of sustainable business net cash flow after our capital expenditure programmes. This has enabled the growth of the dividend in line with RPI, being 2.9%(2012/13: dividend growth of 4%), taking into account the recommended final dividend of 27.54p.
The high level of take-up of this scrip option in the last couple of years has led to concerns about the potential dilutive effect on value of this option. This meant that we decided not to offer the scrip element for the 2013/14 interim dividend paid in January this year, as our forecast capital programme was already fully funded. We continue to offer the scrip option for the year-end dividend.
|
How we make money from our regulated assets page 20
UK regulation pages 160 – 162
US regulation pages 162 – 165
| ||||||||||||||||||||
Year ended 31 March
| ||||||||||||||||||||||
| % | 2014 | 2013 | 2012 | |||||||||||||||||||
| ||||||||||||||||||||||
| Dividend growth | 3 | 4 | 8 | |||||||||||||||||||
| ||||||||||||||||||||||
1. US rate base calculated as at 31 December for these years.
2. Estimated figure until the conclusion of the regulatory reporting cycle.
Value added Our dividend is an important part of our returns to shareholders along with growth in the value of the asset base attributable to equity investors. These are reflected in the value added metric that will underpin our approach to sustainable decision making and long-term incentive arrangements.
Overall value added in the year was £2.1 billion or 57.2p per share as set out below: |
Cash generated from operations Cash generated from operations was £4,419 million (2012/13: £4,037 million). Adjusted operating profit before depreciation, amortisation and impairment was £81 million higher year on year. Changes in working capital improved by £351 million over the prior year, principally in the US due to the timing of receivables from LIPA relating to Superstorm Sandy, higher commodity costs and weather differences year on year. Partially offsetting these improvements, cash outflows relating to exceptional items were £38 million higher due to reorganisation in the UK and LIPA MSA transition costs in the US.
UK regulated return on equity The UK RoE has decreased 90bps to 12.7%, reflecting the new regulatory arrangements under the RIIO framework in place from this year. This performance represents 260bps outperformance over allowed returns.
UK return on equity %
| |||||||||||||||||||||
| Year ended 31 March | Change | |||||||||||||||||||||
| £bn at constant currency | 2014 | 2013 | £bn | |||||||||||||||||||
| ||||||||||||||||||||||
UK regulated assets1 | 25.2 | 24.3 | +0.9 | |||||||||||||||||||
US regulated assets2 | 11.2 | 10.3 | +0.9 | |||||||||||||||||||
Other invested capital | 1.7 | 1.5 | +0.2 | |||||||||||||||||||
| ||||||||||||||||||||||
| Total assets | 38.1 | 36.1 | +2.0 | |||||||||||||||||||
| Dividend paid | +1.1 | |||||||||||||||||||||
| Movement in goodwill | – | |||||||||||||||||||||
| Net debt | (21.2) | (20.2) | -1.0 | |||||||||||||||||||
| ||||||||||||||||||||||
| Value added | +2.1 | |||||||||||||||||||||
| ||||||||||||||||||||||
| Value added per share | 57.2p | |||||||||||||||||||||
| ||||||||||||||||||||||
1. Consists of regulated asset values and other regulatory assets and liabilities of the UK businesses regulated under RIIO price controls.
2. US regulated assets increased from $17.2 billion to $18.7 billion in the year. These represent rate base plus assets outside of rate base, including working capital. | ||||||||||||||||||||||
08 National Grid Annual Report and Accounts 2013/14 | ||||||||||||
Financial review continued |
US regulated return on equity The US RoE has decreased 20bps to 9.0%, mainly driven by lower allowed rates in our KEDNY and Long Island Generation businesses following the introduction of new rate plans during the year.
| Interest cover The principal measure we use to monitor financial discipline is interest cover, which is a measure of the cash flows we generate compared with the net interest cost of servicing our borrowings. The table below shows our interest cover for the last three years.
|
| Our operations – performance at a glance
Business analysis 2013/14 %
Adjusted operating profit
| |||||||||||||||||||
US return on equity %
Return on capital employed RoCE provides a performance comparison between our regulated UK and US businesses and is one of the measures that we use to make strategic and investment decisions about our portfolio of businesses. The table below shows the RoCE for our businesses over the last five years:
Return on capital employed %
The UK RoCE has decreased from 8.6% to 8.0% in 2013/14, reflecting the new RIIO regulatory allowances, including lower cost of debt allowance, higher gearing assumption in the gas businesses, and the inclusion of our share of exceptional costs. The decrease in the US RoCE from 7.1% to 6.4% is primarily due to the end of Niagara Mohawk deferral recoveries and controllable cost increases. Excluding the impact of major storm costs, the US RoCE would have been 7.7% in 2012/13.
Net debt We expect our net debt to continue to grow for the next few years as we fund our capital investment programmes and enhance our networks. We continue to borrow at attractive rates when needed and believe that the level of net debt remains appropriate for our business. Our five year net debt trend is shown on page 91. | Year ended 31 March | |||||||||||||||||||||
| Times | 2014 | 2013 | 2012 | |||||||||||||||||||
| ||||||||||||||||||||||
| Interest cover | 4.1 | 3.9 | 3.9 | |||||||||||||||||||
| ||||||||||||||||||||||
The increase in interest cover in 2013/14 reflects flat finance costs year on year. Our target long-term range for interest cover is in excess of 3 times. Further details on our capital management and credit ratings can be found in note 30 (f) and on the debt investors’ section of our website.
Timing and regulated revenue adjustments As described on page 20, our allowed revenues are set in accordance with our regulatory price controls or rate plans. We calculate the tariffs we charge our customers based on the estimated volume of energy we expect will be delivered during the coming period. The actual volumes delivered will differ from this estimate. Therefore, our total actual revenue will be different from our total allowed revenue. These differences are commonly referred to as timing differences.
If we collect more than the allowed level of revenue, the balance must be returned to customers in subsequent periods, and if we collect less than the allowed level of revenue we may recover the balance from customers in subsequent periods. In the US, a substantial portion of our costs are pass-through costs (including commodity and energy efficiency costs) and are fully recoverable from our customers. Timing differences between costs of this type being incurred and their recovery through revenue are also included in timing.
The amounts calculated as timing differences are estimates and subject to change until the variables that determine allowed revenue are final.
Our operating profit for the year includes a total estimated in-year under-collection of £42 million (2012/13: £16 million over-collection). Our closing balance at 31 March 2014 was £60 million over-recovered.
In the UK, there was a cumulative under-recovery of £57 million at 31 March 2014 (2013: under-recovery of £5 million). All other things being equal, the majority of that balance will normally be recoverable from customers starting in the year ending 31 March 2016. |
| |||||||||||||||||||||
Strategic Report | Corporate Governance | Financial Statements | Additional Information | 09 |
In the US, cumulative timing over-recoveries at 31 March 2014 were £117 million (2013: £110 million). The majority of that balance will be returned to customers next year.
In addition to the timing adjustments described above, following the start of the RIIO price controls in the UK, outperformance against allowances as a result of the totex incentive mechanism, together with changes in output-related allowances included in the original price control, will almost always be adjusted in future revenue recoveries, typically starting in two years’ time.
Our current IFRS revenues and earnings include the amounts that will need to be repaid but exclude amounts that will be recovered in future periods. Such adjustments will form an important part of the continuing difference between reported IFRS results and underlying economic performance based on our regulatory obligations.
For our UK regulated businesses as a whole, regulated revenue adjustments totalled £106 million in the year. This is based on our estimates of: work carried out in line with allowances; in expectation of future allowances; or work avoided altogether – either as a result of us finding innovative solutions or of the need being permanently removed. | In the US, accumulated regulatory entitlements to future revenue net of over- or under-recoveries amounted to £1,027 million at 31 March 2014 (2013: £1,311 million). These entitlements cover a range of different areas, with the most significant being environmental remediation and pension assets, as well as deferred storm costs.
All regulatory entitlements are recoverable (or repayable) over different periods, which are agreed with the regulators to match the expected payment profile for the liabilities. As at 31 March 2014, these extend until 2059.
Major storms Despite the very cold winter across much of the US, there were no major storms in 2013/14. In 2012/13, two major storms in the US, Superstorm Sandy and Storm Nemo, as well as a number of smaller storms, had a material effect on the results of National Grid, reducing operating profit by £136 million.
The table below shows adjusted operating profit and operating profit for the past three years, excluding the impact of timing differences and major storms.
|
Non-financial KPIs pages 10 – 11
Our vision and strategy pages 14 – 15
| ||||||||||||||
Year ended 31 March
| ||||||||||||||||
| Excluding the impact of timing differences and major storms | 2014 £m
| 2013 £m
| 2012 £m
| |||||||||||||
| ||||||||||||||||
Adjusted operating profit
| 3,706
| 3,759
| 3,589
| |||||||||||||
Operating profit | 3,777
| 3,869
| 3,633
| |||||||||||||
| ||||||||||||||||
Our revised financial KPIs | ||||||||||||
KPI | Definition | 2013/14 result | ||||||||||
Adjusted EPS | Adjusted earnings divided by the weighted average number of shares. | 54.0p | ||||||||||
Group RoE | Adjusted earnings with certain regulatory-based adjustments divided by equity. | 11.4% | ||||||||||
Regulated asset growth | Growth in the total UK RAV and US rate base versus the prior year. | 3% | ||||||||||
Value added | Annual growth in our assets after deducting dividends, goodwill and net debt. | £2.1bn | ||||||||||
We measure the achievement of our objectives, make operational and investment decisions and reward our employees
KPIs are used to measure our progress on strategic priorities, aligning with those activities that combine to deliver our strategy. We have changed our financial KPIs during 2013/14 to reflect the changing metrics used to monitor the Group following RIIO. We have included ‘value added’, a new metric that we use to |
We have included regulated asset growth, as this is a measure of the ability of the business to generate revenue in the future. While we continue to focus on efficient capital expenditure, the value of our regulated assets drives our revenue allowances in future years. We have stopped reporting our regulated controllable operating costs metric. This was included to monitor cost control, but following the introduction of RIIO, all our businesses’ activities are focused on costs, through innovative and efficient delivery of high-quality services. Our ability to control costs is also reflected in the adjusted EPS and Group RoE metrics, which are based on our adjusted earnings. | |||||||||||
10 National Grid Annual Report and Accounts 2013/14 | ||||||||||||
| Non-financial KPIs are often leading indicators of future financial performance. Improvements in these measures build our competitive advantage. | |||||||||||||
Employee lost time injury frequency rate (IFR) per 100,000 hours worked |
| |||||||
Definition Number of employee lost time injuries per 100,000 hours worked in a 12 month period. Goal Zero
| Our ambition is to achieve a world-class safety performance by 2015, featuring an IFR of below 0.1, with a target for 2013/14 of 0.15. We intend to achieve this through a relentless leadership focus, robust safety management systems and tactical actions focused on our Our IFR for 2013/14 was 0.14, better than our target for the year. This is compared with 0.17 in 2012/13, illustrating positive progress towards our world-class target. Our IFR for the UK was 0.06 and for the US it was 0.19. | Strategic element Deliver operational excellence
UK Principal operations pages US Principal operations pages 35 – 37 | ||||||
Network reliability Definition Various definitions appropriate to |
|
Deliver operational excellence | ||||||
Performance
| Measure
| Target
|
UK Principal operations pages 29 – 33
US Principal operations pages 35 – 37
| |||||||||||||||||||
| ||||||||||||||||||||||
2009/10 |
2010/11 |
2011/12 |
2012/13 |
2013/14 |
2013/14 | |||||||||||||||||
| ||||||||||||||||||||||
UK Electricity Transmission |
99.9999 |
99.9999 |
99.999999 |
99.99999 |
99.99999 |
% |
|
99.9999 |
| |||||||||||||
| ||||||||||||||||||||||
UK Gas Transmission
| 100 | 100 | 100 | 100 | 100 | % | 100 | |||||||||||||||
| ||||||||||||||||||||||
UK Gas Distribution | 99.999 | 99.999 | 99.999 | 99.999 | 99.999 | % | 99.999 | |||||||||||||||
| ||||||||||||||||||||||
Electricity transmission – US | 147 | 414 | 5181 | 346 | 118 | MWh losses | 308 | |||||||||||||||
| ||||||||||||||||||||||
Electricity – US: Commercial | 114 | 123 | 121 | 1052 | 107 | Minutes of outage | * | |||||||||||||||
| ||||||||||||||||||||||
* Targets are set jurisdictionally by operating company. |
| |||||||||||||||||||||
1. 2011/12 result restated to reflect final data. |
| |||||||||||||||||||||
2. 2012/13 result excludes New Hampshire, which was sold during the year.
|
| |||||||||||||||||||||
Customer satisfaction
Definition We measure customer satisfaction through our position in customer satisfaction surveys. |
|
Strategic element Deliver operational excellence
UK Principal operations
pages 29 – 33
US Principal operations pages 35 – 37
| ||||||||||||||||||||
| Performance | Measure | Target | ||||||||||||||||||||
| ||||||||||||||||||||||
2009/10
|
2010/11
|
2011/12
|
2012/13
|
2013/14
|
2013/14
| |||||||||||||||||
| ||||||||||||||||||||||
UK Electricity Transmission
|
n/a | n/a | n/a | n/a | 7.4 | Score out of 10 | 6.91 | |||||||||||||||
| ||||||||||||||||||||||
UK Gas Transmission | n/a | n/a | n/a | n/a | 7.2 | Score out of 10 | 6.91 | |||||||||||||||
| ||||||||||||||||||||||
UK Gas Distribution
| 4th | 4th | 3rd | 3rd | * | Quartile ranking | Improve | |||||||||||||||
| ||||||||||||||||||||||
Gas distribution – US: Residential
| 3rd | 2nd | 3rd | 3rd | 2nd | Quartile ranking | Improve | |||||||||||||||
| ||||||||||||||||||||||
Gas distribution – US: Commercial
| 2nd | 4th | 3rd | 4th | 4th | Quartile ranking | Improve | |||||||||||||||
| ||||||||||||||||||||||
Electricity – US: Residential
| 4th | 3rd | 3rd | 3rd | 2nd | Quartile ranking | Improve | |||||||||||||||
| ||||||||||||||||||||||
Electricity – US: Commercial
| 3rd | 2nd | 2nd | 3rd | 2nd | Quartile ranking | Improve | |||||||||||||||
| ||||||||||||||||||||||
* Under RIIO-GD1, our customer satisfaction results are now reported on an annual basis, rather than quarterly, which was how we reported them under our previous price control. We will publish the results on our website in the summer as part of our commitment to our stakeholders, and in our Annual Report and Accounts for 2014/15. |
| |||||||||||||||||||||
1. 6.9 represents our baseline target, set by Ofgem, for reward or penalty under RIIO.
|
| |||||||||||||||||||||
Strategic Report | Corporate Governance | Financial Statements | Additional Information | 11 |
For more information pages 14 – 15 | ||||||
| ||||||
Employee engagement index % | ||||||
Definition Employee engagement index calculated using responses to our employee survey.
To increase
| We measure employee engagement through our employee opinion survey. The results of our 2014 survey, which was completed by 78% of our employees, have helped us identify specific areas where we are performing well and those areas we need to improve. Our engagement index has risen by eight points to 71%, our highest engagement score since we started conducting Group-wide employee opinion surveys. Managers receive a scorecard that aims to create greater leadership accountability and we produce survey reports and action plans at Company, regional, business unit, function and team levels. |
Engage our people
People pages 40 – 41 | ||||
% reduction against 1990 baseline |
| |||||
Definition Percentage reduction in greenhouse gas emissions against our 1990 baseline. Target 45% reduction by 2020 and 80% reduction by 2050
Our total Scope 1 and Scope 2 greenhouse gas emissions (excluding electricity transmission and distribution line losses) for 2013/14 were around 7.4 million tonnes carbon dioxide equivalent (Scope 1 was 7.2 and Scope 2 was 0.2). This is equivalent to an intensity of 501 tonnes carbon dioxide equivalent per £million of revenue for 2013/14. The 2013/14 emissions quantity represents a 62% reduction from our 1990 baseline and a 9% reduction from our 2012/13 emissions. Although our outturn is better than our 2020 target, we will need to innovate if we are to meet the target for 2050. We have remained focused on greenhouse gas emissions reduction programmes to achieve our corporate commitment targets of 45% and 80% reduction in Scope 1 and 2 emissions by 2020 and 2050 respectively from our 1990 baseline. | We continue to look for innovations and efficiencies that will help us achieve these targets. In 2013 we significantly improved our scores in the CDP Global 500 ratings and were admitted for the first time to the Global Leaders Index for carbon disclosure. We measure and report our greenhouse gas emissions in accordance with the WRI/WBCSD Greenhouse Gas Protocol: Corporate Accounting and Reporting Standard (Revised Edition) for all six Kyoto gases, using the operational control approach for emissions accounting. These Scope 1 and 2 emissions are independently assured against the international standard ISO 14064-3 Greenhouse Gas assurance protocol. A copy of this statement of assurance is available on our website. In the UK we have experienced a mild year, which has been beneficial to the overall emissions of many of our business units. In the UK activities at Grain LNG have led to a 60% reduction of energy consumption of on-site nitrogen production. Our Electricity Transmission business has reduced SF6 leak rates to 1.2% in 2013/14 compared with 1.7% in the previous year and our Property function has delivered a 2% year-on-year reduction in electricity-related emissions across occupied sites. In the US we have completed power plant turbine efficiency upgrades in Long Island and continued to focus on efficiency-related maintenance programmes. This has contributed towards outperforming our LIPA contractual efficiency target. Our US and UK Gas Distribution businesses have continued to deliver significant reductions in emissions in line with forecasts. |
Embed sustainability | ||||
| ||||||||||||
Economic environment Our UK price controls and US rate plans are agreed against the backdrop of the broader macroeconomic environment. In the UK, economic growth is projected to continue to increase at a moderate pace in 2014, while the RPI measure of inflation is expected to remain subdued. Monetary policymakers have indicated that interest rates are expected to remain low during 2014, despite significant reductions in unemployment. In the US, employment and GDP growth continue to improve steadily. The US Congress has reached a two year budget deal, which should ease some concerns in market conditions. Market indicators in areas such as housing and construction are returning to pre-2008 levels. | ||||
Market driver |
| |||
| ||||
Cost and environmental pressures affecting traditional electricity generation Older gas-fired power stations in the UK and many coal-fired power stations in the US are closing or being mothballed due to changes in environmental regulations. In the UK, fuel prices are affecting the economic viability of fossil fuel-fired electricity generation. Further decline in traditional electricity generation is likely if the UK’s carbon reduction targets are to be met. The US is seeing renewed demand for gas, as the increasing availability of shale gas has lowered prices. |
Current uncertainty in the UK market has led some developers to delay investing in new generation capacity. An agreement on long-term prices for | |||
The locations where gas comes into the UK are changing, with forecast reductions in North Sea production and increased reliance on imported gas. New low carbon generation may not be located in the same place or have the same characteristics as existing plant. |
Changes to the energy mix and location of supply and demand centres will create pressures on our networks, potentially requiring further investment. | |||
Shale gas production is transforming supply and demand In the US, shale gas production will mean lower-priced gas over the long term, changing supply and demand patterns. | We may need to invest in additional network capacity As more generation plants convert to lower priced natural gas, we may need to invest in additional gas network capacity. Changes in generation could also mean modifications to the electricity transmission network. | |||
Energy policy | ||||
Sustainability, security of supply and affordability underpin EU policy In a difficult economic and financial context, the EU’s energy policy is underpinned by the three cornerstones of sustainability, security of supply and affordability. The European Commission published its 2030 Climate Change and Energy framework in 2014, featuring a continued ambition in terms of greenhouse gas reduction targets and energy policy objectives. Negotiations for a new international agreement on climate change continued at the nineteenth session of the Conference of the Parties (COP19) in 2013, and nations are looking to the Paris worldwide conference in 2015 as the next opportunity to work out a new climate change deal. | Policy decisions can affect our investment needs and compliance obligations Energy policy decisions by governments, government authorities and others have a direct impact on our business, influencing the emerging challenges and opportunities. They can affect the amount and location of investment required in our networks and the way we operate. They can also change our compliance obligations. This requires more market integration, interconnection and renewable generation Greater levels of market integration, interconnection and renewable generation are fundamental to achieving the EU’s policy objectives. While European developments present challenges, the significant level of investment required may create opportunities for growth. For example, potential future interconnector opportunities include connections between the UK and Belgium, Norway, France, Ireland, Denmark and Iceland. | |||
Strategic Report | Corporate Governance | Financial Statements | Additional Information | 13 |
Market driver | Impact | |||||||
UK policy changes are in place to attract investment | National Grid has been asked to play a key delivery role | |||||||
In the UK, energy policy continues to evolve from the Climate Change Act 2008, which commits the UK Government to reducing UK greenhouse gas emissions to at least 80% lower than a 1990 baseline by 2050. The Energy Act 2013 implements the main aspects of Electricity Market Reform (EMR), and puts in place measures to attract the investment needed to replace current generating capacity and upgrade the grid by 2020, and to cope with a rising demand for electricity. | In the UK, National Grid has been asked to play a major role as the delivery body for EMR, to be conferred on National Grid by Government in secondary legislation. | |||||||
US policy is evolving to meet environmental and energy diversity goals | Options for increased renewable and distributed generation are being explored | |||||||
In the US, many federal level developments have been | In the US, the impact on natural gas dependency has resulted in an evaluation of the best way of increasing fuel diversity through renewable and distributed generation resources. We continue to support movement towards a clean energy economy; and support additional measures to increase America’s energy productivity. | |||||||
Regulation | ||||||||
Infrastructure investment needs must be balanced with affordability | We must accommodate customers’ cost concerns and also provide safe, up-to-date systems | |||||||
Regulators acknowledge that there is a significant need for infrastructure investment. However, affordability continues to be a primary concern. Cast iron gas mains still in use can be more than 100 years old, becoming riskier to use and contributing to greenhouse gas emissions through leaks. Severe weather in recent years has also highlighted the potential need for additional investment in network resilience. Regulators and policymakers are beginning to ask utilities to put plans in place to strengthen their networks’ ability to withstand the effects of severe weather. | We must accommodate our customers’ affordability concerns while fulfilling our obligations to provide safe and reliable services and upgrading our systems. Investment is required for new connections, to meet the challenges of changing supply and demand patterns, and to replace ageing infrastructure in the UK and US. | |||||||
UK regulators want greater efficiency and innovation | This is driving them to favour more market competition | |||||||
In the UK, the regulatory focus during the year has been on the new RIIO price controls which give greater focus to incentives and innovation than the previous regulatory regime. | In the UK, competition is already in place for offshore development and Ofgem has stated its intent to retain the option of using greater competition for certain large onshore projects. | |||||||
The projected increase in offshore wind generation and interconnection has created a debate on the regulatory approach to electricity transmission investment – a debate we continue to be fully engaged in. | For more information about network efficiency and innovation, see pages 30, 31 and 33. | |||||||
US policymakers are focused on grid modernization In the US, we are actively involved in the New York Energy Highway initiative to examine new ways of delivering infrastructure in the state. In Massachusetts, we are working with regulators and policymakers on a | This will present opportunities to address customers’ needs more effectively In the US, developments like the New York Energy Highway initiative, the Reforming Energy Vision initiative announced by the Governor of New York, the Massachusetts Grid Modernization regulatory proceeding and our Connect21 dialogue with stakeholders, will help present new opportunities to respond to customers’ needs and build the necessary infrastructure to address them. | |||||||
Innovation and technology | ||||||||
Technology developments have the potential to reshape our market There is continued significant technological development in the energy sector as new technologies take shape and approach commercial viability. HVDC technology could play an important part in the development of a more integrated electricity grid, particularly the extension of offshore links. | This influences demand and helps us to manage supply While carbon-based generation is likely to remain a significant part of the global energy mix, carbon capture and storage technologies may become critical to governments achieving their climate change targets. Technologies such as energy storage, electric transportation and distributed generation all have the potential to affect our networks significantly. New consumer products, such as alternative fuelled vehicles and distributed generation, will increase demand and require new infrastructure. Smart grids will change the way loads are balanced across the distribution network, allowing our customers to make smarter energy choices and increasing network flexibility. Our infrastructure needs the flexibility to respond innovatively to emerging developments, potentially by being managed differently rather than by creating new infrastructure to meet supply and demand changes. |
14 National Grid Annual Report and Accounts 2013/14 | ||||||||||||
Strategic Report | Corporate Governance | Financial Statements | Additional Information | 15 |
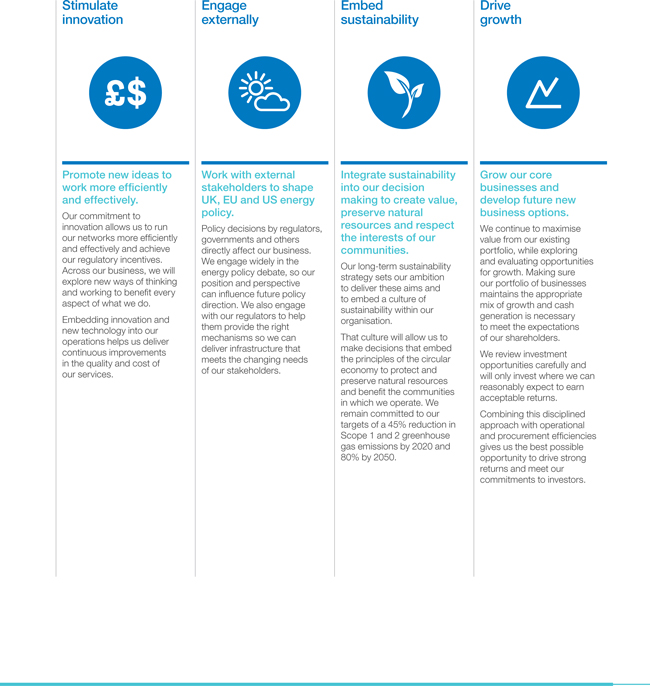 |
| ||||||||||||
Electricity | The electricity industry connects generation sources to homes and businesses through transmission and distribution networks. Electricity is sold to consumers by companies that have bought it from generators and that pay to use the networks across which it is transmitted. |
| ||||
Strategic Report | Corporate Governance | Financial Statements | Additional Information | 17 |
www.nationalgrid.com
System operator As system operator (SO) for England and Wales, we coordinate and direct electricity flows onto and over the transmission system, balancing generation supply and user demand. Where necessary, we pay sources of supply and demand to increase or decrease their generation or usage. | We have the same role for the two high voltage electricity transmission networks in Scotland and we have been appointed as system operator for the offshore electricity transmission regime. Our charges for SO services in the UK are subject to a price control approved by Ofgem. System users pay us for connection, for using the system and balancing services. | As electricity transmission system operator, our price control includes incentives to minimise the costs and associated risks of balancing the system through buying and selling energy, as well as procuring balancing services from industry participants. In the US, similar services are provided by independent system operators. |
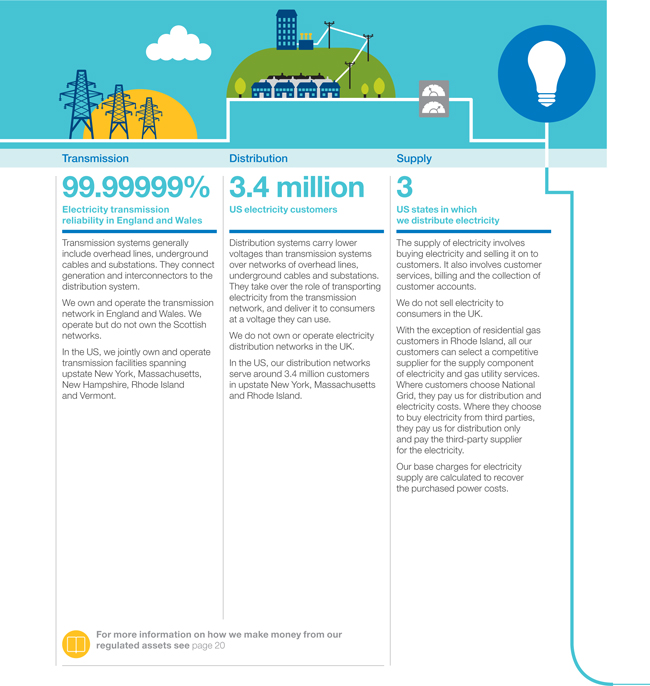 |
18 National Grid Annual Report and Accounts 2013/14 | ||||||||||||
What we do Gas | The gas industry connects producers, processors, storage, transmission and distribution network operators, as well as suppliers to industrial, commercial and domestic users. |
| ||||
Strategic Report | Corporate Governance | Financial Statements | Additional Information | 19 |
Non-financial KPIs
System operator As system operator we are responsible for the high pressure gas National Transmission System (NTS) in Great Britain. We have responsibility for the residual balancing activities on the NTS and for keeping the physical system within safe operating limits. | Our price control, set by Ofgem, includes incentives that aim to maintain and improve our daily operational efficiency and are subject to renegotiation at set intervals. |
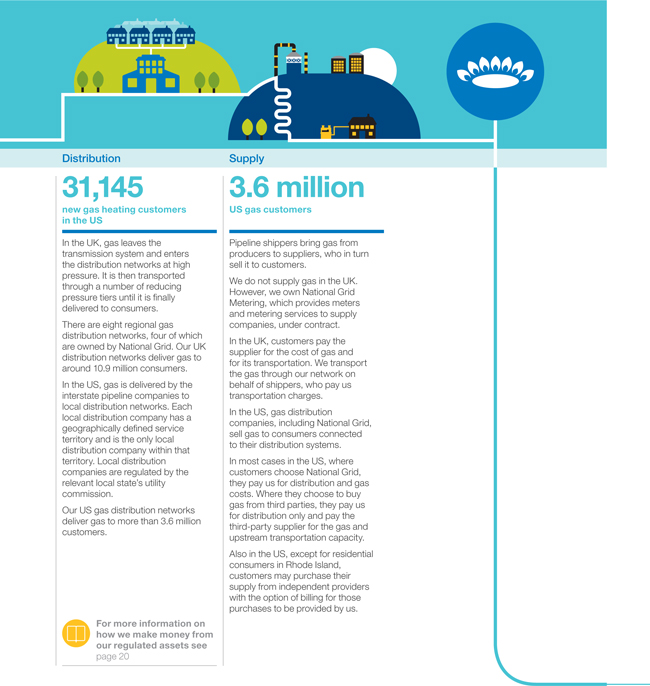 |
| ||||||||||||
20 National Grid Annual Report and Accounts 2013/14 | ||||||||||||
money from our regulated assets | Our transmission and distribution businesses so that we provide value for money while maintaining safe and reliable networks, and deliver good customer service. | |||||||||||
In the UK we have one regulator for our businesses, Ofgem. In the US, different services and locations are regulated by different bodies. For the areas in which we operate, these are the relevant state regulators and FERC. Each of our regulatory agreements can include differences in structure, terms and values, which we summarise below. You can find more details about regulatory agreements on pages 160 to 165. The value of our regulated assets is calculated based on the terms of our regulatory agreements. In the UK, the value of regulated assets is also indexed for inflation. Our regulatory agreements also determine the amount we are allowed to charge customers, commonly referred to as our allowed revenues. Allowed revenue is calculated based on a number of factors: Depreciation of regulated assets – the value of regulated assets is depreciated over an anticipated lifespan. The amount of depreciation is included in our allowed revenue, which represents the repayment of the amount we have invested in the asset. Return on equity and cost of debt – regulated assets are funded through debt or equity. Regulatory agreements set this ratio. The equity portion earns a ‘return on equity’. This represents the profit we can earn on our investment in regulated assets. The debt portion earns an allowance based on the cost of debt (interest costs). Some regulatory agreements allow us to charge customers based on the interest we pay; others use an external benchmark interest rate to incentivise us to raise debt efficiently. The benchmark interest method also provides an opportunity to outperform our regulatory allowance. Cost of service – in establishing our regulatory agreements, our regulators consider what costs an efficiently run company would incur to operate and maintain our networks. They vary and examples can include costs relating to employees, office rental, IT systems and taxes. The regulators have different approaches to determining what is considered an efficient or prudent cost and this may be different to the actual costs we incur. | Investment in network assets – in the UK we are given a cost allowance to make necessary investments in the networks. These investment costs allowed by the regulator are linked to the outputs delivered by the networks. Performance against incentives – our regulatory agreements, mainly in the UK, include incentives that are designed to encourage specific actions, such as reducing greenhouse gas emissions. Outperforming against incentive targets can increase our allowed revenues in the current year or a future year. Failing to achieve certain minimum targets may lead to a reduction in our allowed revenue. A further incentive mechanism enables customers and shareholders to share the difference between allowed and actual costs via adjustments to revenue. Commodity costs – in the US, we supply gas and electricity to customers who have chosen us as their supplier. Most of our regulatory agreements include mechanisms known as trackers that allow us to recover the costs we incur when we buy gas and electricity. Deferrals – the costs we incur may not be included in the calculation of allowed revenue in the same year. Instead, these are deferred for regulatory purposes and we can normally recover them in future years. See pages 08 and 09 of the Financial review. For example, in the US we incur costs restoring power to customers immediately after a major storm. However, these costs will generally be included in allowed revenue over a number of years and may not start until the relevant Timing – our regulated revenue entitlements are set based on our regulatory price controls. We use forecast energy volumes that we expect to deliver to set the billing tariff. Where there is a difference between the actual and estimated energy volumes, the amount of |
Financial review pages 06 – 09 UK regulation pages 160 – 162 US regulation pages 162 – 165 | ||||||||||
| ||||||||||||
Strategic Report |
| Financial Statements | Additional Information | 21 | ||||||||
| ||||||||||||
Network reliability targets
| ||||||||||||||||||||||||||||
| ||||||||||||||||||||||||||||
| Performance | Measure | Target | ||||||||||||||||||||||||||
| ||||||||||||||||||||||||||||
| 07/08 | 08/09 | 09/10 | 10/11 | 11/12 | 11/12 | |||||||||||||||||||||||
| ||||||||||||||||||||||||||||
Electricity transmission – UK | 99.9999 | 99.9999 | 99.9999 | 99.9999 | 99.999999 | % | 99.9999 | |||||||||||||||||||||
| ||||||||||||||||||||||||||||
Gas transmission – UK | 100 | 100 | 100 | 100 | 100 | % | 100 | |||||||||||||||||||||
| ||||||||||||||||||||||||||||
Gas distribution – UK | 99.999 | 99.9999 | 99.999 | 99.999 | 99.999 | % | 99.999 | |||||||||||||||||||||
| ||||||||||||||||||||||||||||
Electricity transmission – US | 437 | 266 | 147 | 414 | 558 | MWh losses | * | |||||||||||||||||||||
| ||||||||||||||||||||||||||||
Electricity distribution – US | 110 | 114 | 114 | 123 | 121 | Minutes of outage | * | |||||||||||||||||||||
| ||||||||||||||||||||||||||||
| *Targets are set jurisdictionally by operating company | ||||||||||||||||||||||||||||
See page 34 for additional details on network reliability
|
| |||||||||||||||||||||||||||
Customer satisfaction
| ||||||||||||||||||||||||||||
| ||||||||||||||||||||||||||||
| Performance (quartile) | Measure | Target | ||||||||||||||||||||||||||
| ||||||||||||||||||||||||||||
| 09/10 | 10/11 | 11/12 | ||||||||||||||||||||||||||
| ||||||||||||||||||||||||||||
UK Gas Distribution | 4th | 4th | 3rd | Quartile ranking | Improve | |||||||||||||||||||||||
| ||||||||||||||||||||||||||||
Gas distribution – US: Residential | 3rd | 2nd | 3rd | Quartile ranking | Improve | |||||||||||||||||||||||
| ||||||||||||||||||||||||||||
Gas distribution – US: Commercial | 2nd | 4th | 3rd | Quartile ranking | Improve | |||||||||||||||||||||||
| ||||||||||||||||||||||||||||
Electricity – US: Residential | 4th | 3rd | 3rd | Quartile ranking | Improve | |||||||||||||||||||||||
| ||||||||||||||||||||||||||||
Electricity – US: Commercial | 3rd | 2nd | 2nd | Quartile ranking | Improve | |||||||||||||||||||||||
| ||||||||||||||||||||||||||||
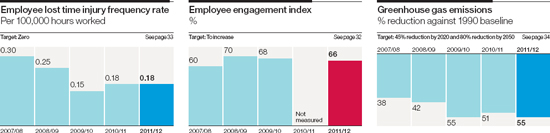 | ||||
|
Annual Report and Accounts 2011/12National Grid plc39
Business Review
Delivering our strategy
The Board is committed to the long-term success of the Company and the protection of our reputation and assets. It ensures we maintain a sound system of internal control in order to safeguard the interests of our shareholders.
Our system of internal control, and in particular our risk management process, has been designed to manage rather than eliminate material risks to the achievement of our strategic and business objectives while also recognising that any such process can provide only reasonable, and not absolute, assurance against material misstatement or loss. This process complies with the Turnbull working party guidance, revised October 2005, and additionally contributes to our compliance with the obligations under the Sarbanes-Oxley Act 2002 and other internal assurance activities.
In accordance with the UK Corporate Governance Code and the schedule of matters reserved to the Board, the Board retains overall responsibility for our system of internal control and monitoring of its effectiveness. Our system of internal control is based on thorough and systematic processes for the identification and assessment of business critical risks and their management and monitoring over time. In depth reports are provided from both line managers and internal assurance providers such as corporate audit, corporate risk and ethics and compliance. These reports are provided to the Committees in relation to their specific areas of responsibility and they, in turn, provide reports to the Board.
The Board reviews the effectiveness of our internal control process, including around financial reporting, on an annual basis to ensure it remains robust and to identify any weaknesses. The latest review covered the financial year to 31 March 2012 and included the period to the approval of this Annual Report and Accounts. It included:
|
|
|
Risk management process
Our risk management process is designed to protect value and enhance performance by building vigilance, agility and resilience into our management process. The process ensures that risks are assessed against a uniform set of criteria, continuously managed and regularly reported in a visible and structured manner. The output informs management decisions and provides assurance to management and the Board, helping to safeguard our assets and reputation.
Our risk management process is based on comprehensive bottom-up and top-down assessments of a wide range of risks, which typically include strategic, operational (including safety and reliability), financial and project risks. All businesses and the corporate and global functions that support them, prepare and maintain risk registers to capture their key risks and the actions being taken to manage them. Executive Directors and other senior management review, challenge and debate these bottom-up results, producing an overall evaluation of the risks facing the Company. The Executive, Audit and Risk & Responsibility Committees review the risk profile and any changes to it in accordance with their terms of reference, and the Audit Committee reviews the overall risk management process.
In the last year, a number of enhancements to the process were initiated. The corporate risk function was reorganised and brought into the strategic planning and corporate development function to provide appropriate regional focus in line with the new operating model and to forge stronger links with strategic planning activities. The Board considered the characteristics of our corporate risk appetite and the outcome will determine the appropriate risk appetite for us in the pursuit and delivery of our corporate strategy. New reporting formats, including dashboards incorporating risk timings and mitigation objectives, were developed and rolled out to focus the risk management debate toward future actions. Also, the implementation of a governance, risk and compliance system that will improve our ability to link risks, automate risk metrics and capture associated assurance data has commenced.
Compliance management process
Our enterprise wide compliance management process is consistent with, and complementary to, our risk management process and provides assurance to senior management on the effectiveness of control frameworks to manage key internal and external obligations, and also highlights any instances of significant non compliance with those obligations. External obligations are driven primarily by key legal and regulatory requirements, while internal obligations focus on compliance with our corporate policies and procedures.
In examining a business area’s compliance performance, we look for any actual or potential instances of non compliance and consult with other assurance providers. Before issuing an opinion on an area’s compliance control framework, we obtain the views of experts in the field such as internal safety and environmental specialists.
The Executive, Risk & Responsibility and Audit Committees each receive a report twice a year setting out our key internal and external compliance obligations and any significant non compliance with those obligations, together with compliance opinions and action plans to improve controls where necessary.
www.nationalgrid.com
Our risk management process has identified the following risk factors that could have a material adverse effect on our business, financial condition, results of operations and reputation, as well as the value and liquidity of our securities. Any investment decision regarding our securities and any forward-looking statements made by us should be considered in the light of these risk factors and the cautionary statement set out on the back cover.
|
| |||||||||||||
National Grid is exposed to a variety of uncertainties that could have a material adverse effect on:
Ÿ our operational results; Ÿ our reputation; and Ÿ the value and The Board is committed to protecting and enhancing our reputation and assets, while safeguarding the interests of our shareholders. It has overall responsibility for the Company’s system of risk management and internal control. Below, we describe the main arrangements put in place so that the Board can carry out this responsibility and so that its members can be assured of the integrity of the Company’s risk management and internal control systems, financial information and financial controls. Risk management approach Our Company-wide corporate risk management process provides a framework through which we can consistently identify, assess, prioritise, manage and report risks. It is designed to support delivery of our strategic and business objectives described on pages 14 and 15. The risks we identify are collated in risk registers and are reported at functional and regional levels of the Company. These registers include an assessment of how likely it is that each risk will materialise. They highlight the potential ‘worst case credible’ financial and reputational impact of the risk and details of mitigation activities. The risk registers also describe the adequacy of our existing risk controls. The main risks for our UK and US businesses are summarised and are reviewed, reported and discussed regularly by our senior leadership team. In addition, we also record the main strategic risks for the Company which are developed through discussions with the Executive leadership team. These risks are reported and discussed with the Executive Committee and Audit Committee every six months and by the Chief Executive through quarterly performance reports. During 2013/14 the Board reviewed the main elements of our risk management process. This included validating the risks included in our corporate risk profile and consideration of how we treat special categories of risks, such as potential extreme catastrophic events and emerging risks (uncertainties that are still developing). The results of the Board review are being incorporated into the ongoing work of the Corporate Risk team. | ||||||||||
Our Board also sets and monitors risk appetite annually. We have a framework that differentiates our appetite for risk by categories. At the annual review meeting, the Board compares the decisions the Company has taken to the appetite level in each category. It then considers the appropriate appetite levels to set for the year ahead.
Accepting that it is not possible to identify, anticipate or eliminate every risk that may arise and that risk is an inherent part of doing business, our risk management process aims to provide reasonable assurance that we understand and manage the main uncertainties that we face in delivering our objectives. This includes consideration of inherent risks, which exist because of the nature of day-to-day operations in our industry. An overview of the key inherent risks we face is provided on pages 167 to 169. Examples include: Ÿ aspects of the work we do could potentially harm employees, contractors, members of the public or the environment; Ÿ we may suffer a major network failure or interruption, or may not be able to carry out critical
|
|
|
Business Review
Delivering our strategy
Risks to delivery continued
|
|
|
|
|
|
|
| |||||
| ||||||||||||
| Corporate Governance | Financial Statements | Additional Information | 23 |
www.nationalgrid.com
|
| |||||||
Our corporate risk profile contains the principal risks that the Board considers to be the main ones currently faced by the Company. An overview of these risks is provided below, together with examples of the relevant controls and | ||||||||
Strategic objective | Risk description | Example of mitigations | ||||||
Deliver growth | Failure to identify the right opportunities to execute our strategic ambition. Failure to sufficiently grow our core business and have viable options for new business over the longer term would negatively affect the Group’s credibility and jeopardise the achievement of intended financial returns. Our ability to achieve our ambition for growth is subject to a wide range of external uncertainties, including the availability of potential investment targets and attractive financing; and internal uncertainties, such as the performance of our operating businesses and our business planning model assumptions. | Ÿ We regularly monitor and analyse market conditions, competitors and their potential strategies, as well as the performance of our Group portfolio. We are also looking to access new sources of finance and capabilities through partnering. Ÿ We have internal processes for reviewing and approving investments in new businesses, disposals of existing ones and organic growth investment opportunities. These processes are reviewed regularly to make sure our approach supports our short- and long-term strategies. We undertake due diligence exercises on investment or partnering opportunities and carry out post-investment reviews to make sure we learn lessons for the future. | ||||||
Engage externally | Inability to influence future energy policy. Policy decisions by regulators, governments and others directly affect our business. We must engage widely in the energy policy debate, making sure our position and perspective help to shape future policy direction. | Ÿ In the UK, we are working closely with DECC on Electricity Market Reform (EMR) plans. We have also restructured our business so we are prepared for our new role under EMR and to make sure we are well positioned to deliver value under RIIO. The Board is also continuing to monitor the increasing public debate around the cost, availability, security and sustainability of UK energy supplies. | ||||||
|
| |||||||
|
| |||||||
|
| |||||||
Annual Report and Accounts 2011/12National Grid plcŸ 43
Business Review
Delivering our strategy
Risks to delivery continued
When appropriate, management implements processes, procedures and controls to minimise the likelihood of a risk occurring or the potential impact if it does occur. Below are examples of the actions implemented to address the risks discussed above. It is not possible to eliminate a risk and even where a response is in place and effective, a risk may still occur.
|
| |||||
|
| |||||
|
In the US, we have | |||||
Engage our people | Inability to secure the business capacity, appropriate leadership capability and employee engagement levels required to deliver our vision and strategy. It is through the high-quality work of our employees that we will achieve our vision, respond to the changing needs of our stakeholders and create a competitive advantage. Obtaining and fostering an engaged and talented team that has the knowledge, training, skills and experience to deliver on our strategic objectives is vital to our success. We must attract, integrate and retain the talent we need at all levels of the business. | Ÿ We have identified the core capabilities that align with our strategic ambition and continue to develop our Academy to help develop the right skills for the future (see page 40). Ÿ We are involved in a number of initiatives to help secure the future engineering talent required (see page 40). Ÿ We continue to develop our succession plans for key roles, including leadership. Ÿ We have described on page 41 some of the ways we seek to engage employees, including how we promote inclusion and diversity. Ÿ We monitor employee engagement and formally solicit employee opinions via a Company-wide employee survey annually. | ||||
24 National Grid Annual Report and Accounts 2013/14 | ||||||||||||
Internal control and risk management continued |
44National Grid plcAnnual Report and Accounts 2011/12
www.nationalgrid.com
Strategic objective | Risk description | Example of mitigations | ||||
Deliver operational excellence | Failure to achieve levels of financial performance required to meet regulatory requirements. The Group operates under a number of regulatory regimes and we must maintain the performance levels required. Failure to achieve the agreed returns could damage our reputation and threaten future growth opportunities and regulatory arrangements. | Ÿ We have a US strategy focused on safety and reliability, customer responsiveness, stewardship and cost competitiveness. Performance measures are tracked and reported monthly. US jurisdictional presidents continue to develop strong relationships with local regulators and communities. A process excellence initiative was launched to deliver sustainable and innovative performance improvements with initial focus on six core end-to-end processes. Ÿ The UK operating model implemented in 2013 to support our performance under RIIO is now established and we continue to roll out our performance excellence framework across the business. Ÿ We monitor network reliability and customer satisfaction as KPIs, as described on page 10. | ||||
|
Ÿ We are undertaking a programme to strengthen identified weaknesses in US controls over financial reporting. Ÿ We are implementing a global information management framework focusing on data integrity and security. Ÿ We have completed a data assurance programme, and we are developing actions to improve our data quality and integrity processes based on the results. | |||||
We experience a catastrophic/major cyber security breach. Due to the nature of our business we recognise that our critical national infrastructure systems may be a potential target for cyber threats. We must protect our business assets and infrastructure and be prepared for any malicious attack. | Ÿ We use industry best practices as part of our cyber security policies, processes and technologies. Ÿ We continually invest in cyber strategies that are commensurate with the changing nature of the security landscape. This includes collaborative working with DECC and the Centre for Protection of National Infrastructure (CPNI) on key cyber risks and development of an enhanced critical national infrastructure (CNI) security strategy and our involvement in the US with developing the National Institute of Standards and Technology (NIST) Cyberspace Security Framework. | |||||
Failure to prevent a significant process safety event. The nature of our day-to-day operations is such that safety incidents can occur. The safety of our employees, contractors, suppliers, and the communities in which we operate is critical. We must operate within local laws and regulations relating to health, safety and the environment. | Ÿ We have established safety and occupational health plans, programmes and procedures that are aimed at continuous improvements in safety performance. Ÿ We supplement Company-wide initiatives with specific regional safety programmes. These are aimed at addressing specific areas so that safety is at the forefront of every employee’s mind. We also benchmark against other industry groups to seek and implement best practice. Ÿ We continue to focus on process safety, aimed at preventing major incidents. A baseline assessment has been completed and a 10 year plan is under development. Ÿ We monitor employee IFR as a KPI as described on page 10. | |||||
| Corporate Governance | Financial Statements | Additional Information | 25 |
Our internal control process We have a number of processes to support our internal control environment. These processes are managed by dedicated specialist teams, as described in the box on the right. Oversight of these activities is provided through regular review and Reviewing the effectiveness of our Each year the Board reviews the effectiveness of our internal control process, including financial reporting, to make sure it remains robust. The latest review covered the financial year to 31 March 2014 and Ÿ the Certificate of Assurance for noting following approval by the Audit Committee to provide overall assurance around the effectiveness of National Grid’s risk management and internal controls systems; Ÿ where appropriate, assurance from our Ÿ assurances about the certifications required under Sarbanes-Oxley as a result of our US reporting obligations. Our risk management and internal control processes comply with the Turnbull guidance on internal control and the requirements of the UK Corporate Governance Code. They are also the basis of our compliance with obligations set by the Sarbanes-Oxley Act 2002 and other internal assurance activities. Internal control over financial reporting We have specific internal mechanisms to govern the financial reporting process and the preparation of the Annual Report and Accounts. Our financial controls guidance sets out the fundamentals of internal control over financial reporting, which are applied across the Company. Our financial processes include a range of system, transactional and management oversight controls. In addition, our businesses prepare detailed monthly management reports that include analysis of their results along with comparisons to relevant budgets, forecasts and prior year results. These are presented to and reviewed by senior management within our Finance function. | These reviews are supplemented by quarterly performance reviews, attended by the Chief Executive and Finance Director which consider historical results and expected future performance and involve senior management from both operational and financial areas of the business. Each month the Finance Director presents a consolidated financial report to the Board. As part of our assessment of financial controls, we | |||||||||
| ||||||||||
Our specialist teams that manage the processes supporting our internal control environment are described below. | ||||||||||
Risk management: Ÿ works with the Board to determine risk appetite and Ÿ is responsible for the independent review and challenge of risk information throughout the business, compilation and analysis of risk profiles and monitoring risk management processes within the Company; and Ÿ regularly reports on | ||||||||||
Ethics and compliance management: Ÿ maintains our standards of ethical business conduct; Ÿ promotes ethical behaviour and monitors compliance with external legal and regulatory requirements; and Ÿ operates our whistle-blower helplines and supports activities to prevent and detect bribery. | ||||||||||
Corporate audit: Ÿ develops and executes a risk-based audit plan; and Ÿ provides independent, objective assurance to the Audit Committee, SEH Committee and the Executive | ||||||||||
Safety, environment and Ÿ develops policy recommendations for the Board; Ÿ monitors safety, environment and health performance; and Ÿ works with process owners to deliver our safety, environment and health objectives. | ||||||||||
Internal controls: Ÿ works with process owners to identify, document and test the design and operation of internal control over financial reporting; and Ÿ helps refine and improve controls where | ||||||||||
|
| |||||||||
Annual Report and Accounts 2011/12National Grid plc45
Business Review
Delivering our strategy
Risks to delivery continued
|
| |||||||||
|
| |||||||||
| ||||||||||||
remuneration aligns
to Company strategy
The Remuneration Committee determines remuneration policy and practices through which we aim to promote the success of the Company by attracting, motivating and retaining high-calibre Executive Directors and other senior employees to deliver value for our shareholders, customers and the communities in which we operate.
Our strategy To be a recognised leader in the development and operation of safe, reliable and sustainable energy infrastructure, to meet the needs of our customers and communities and to generate value for our investors.
Our strategic objectives | The Committee believes that the changes will further enhance the long-term alignment between executive remuneration and the delivery of the corporate strategy.
The information set out below describes current rather than future policy.
Alignment to strategy Annual Performance Plan (APP) Our APP aims to incentivise and reward the achievement of annual financial and strategic business measures, and the delivery of annual individual objectives. Performance metrics, including corporate financial measures and individual objectives, are agreed at the start of each performance year and are aligned with the strategic business priorities for that year.
The table below shows the financial measures and their relative weightings that were included within the APP for the Executive Directors for 2013/14:
|
Our vision and strategy pages 14 – 15
Remuneration Report
pages 58 – 73
| ||||||||||||||
|
Deliver operational excellence
Engage our people
Stimulate innovation
Engage externally
Embed sustainability
Drive growth | |||||||||||||||
Andrew Bonfield and Steve Holliday | ||||||||||||||||
| Tom King | Nick Winser | |||||||||||||||
| ||||||||||||||||
| Adjusted EPS | 24% | 24% | 24% | |||||||||||||
| Cash flow (Group or regional) | 38% | 28% | 43% | |||||||||||||
UK RoE |
14% |
n/a |
33% | |||||||||||||
| US RoE | 14% | 24% | n/a | |||||||||||||
US capital plan delivery
|
10% |
24% |
n/a | |||||||||||||
| ||||||||||||||||
Financial measures together represent 70% of the APP.
Individual performance objectives in the APP reflect 30% of the plan and are defined in terms of target and stretch performance requirements. The performance objectives change each year, depending upon business priorities. Examples of individual objectives include those relating to safety, stakeholder relations, employee engagement and capability, and the development of Group and financial strategy.
In order to provide balance for all our stakeholders, at the end of the year the Remuneration Committee has discretion to reduce APP awards to take account of any safety, customer, service-related, environmental or governance issues that may have occurred.
| ||||||||||||||||
The Remuneration Committee aligns the remuneration policy to our Company strategy and main business objectives. Performance-based incentives are earned through achieving demanding targets for short-term business and individual performance, as well as creating long-term value for our shareholders, customers and the communities in which we operate.
Remuneration Committee review of remuneration During the year, the Remuneration Committee undertook a detailed review of the remuneration arrangements for Executive Directors, with the aim of achieving further alignment between executive reward and long-term shareholder value.
As a result of this review, the Committee is proposing some significant changes to the arrangements for the 2014/15 financial year, and these are set out in detail on pages 58 to 73. Shareholders are being asked to approve these changes at the AGM on 28 July 2014. | ||||||||||||||||
Strategic Report | Corporate Governance | Financial Statements | Additional Information | 27 |
| Long Term Performance Plan (LTPP) | ||||||||||
| Our LTPP aims to
| ||||||||||
The
| ||||||||||
Performance measure |
| Definitions and | ||||||||
Adjusted earnings per share (EPS) | 50% | Threshold performance – where EPS growth
Performance period – three years | ||||||||
Relative total shareholder return (TSR) | 25% | Threshold performance – where TSR is at the median of the FTSE 100 Stretch performance – where TSR performance is 7.5 percentage points or more above that of the median of the FTSE 100 Performance period – three years | ||||||||
UK and US RoE | 25% | Threshold performance – where allowed regulatory returns are achieved (UK) or under-performed by one percentage point (US) Stretch performance – where allowed regulatory returns are out-performed by at least two percentage points (UK) or at least one percentage point (US) Performance period – four years | ||||||||
If the Remuneration Committee considers the underlying performance of the Company does not justify the vesting of LTPP awards, even if some or all of the performance measures are satisfied in whole or in part, it can declare that some or all of the awards lapse. | ||||||||||
For full details about our remuneration policy and how it is implemented, please see the Remuneration Report on pages 58 to | ||||||||||

Strategic Report | Corporate Governance | Financial Statements | Additional Information | 29 |
46National Grid plcAnnual Report and Accounts 2011/12
www.nationalgrid.com
The Board considers that it is imperative to have accurate and reliable information to enable informed and timely decisions to be taken that further our objectives. Key elements in managing information assurance risks include education, training and awareness.
These initiatives emphasise the importance of information security, the quality of data collection and the affirmation process that supports our business transactions, evidencing our decisions and actions. All communication channels, including training for doing the right thing, make it clear that the accurate and honest reporting of data and other information must never be compromised. These initiatives are supported by the letter of assurance process in which managers affirm, among other things, they have control frameworks in place to ensure data and other information is reported accurately. In line with ongoing transformation initiatives, we continue to monitor and evolve our control processes.
Internal control over financial reporting
Our process
In addition to the risk management process set out on the previous pages, we have specific internal mechanisms to govern the financial reporting process and the preparation of the Annual Report and Accounts. Our financial controls guidance sets out the fundamentals of internal control over financial reporting which are applied across the group and the group accounting guides provide guidance on our accounting policies. Teams of controls specialists are embedded within the business to provide support in developing, implementing and operating effective internal controls and ongoing assurance to management that financial controls are both designed and operating effectively.
Within our processes we have system, transaction and oversight controls. In addition, our businesses prepare detailed monthly management reports which include analysis of their results along with comparisons to relevant budgets, forecasts and prior year results. These are presented to and challenged by senior management within Finance, including the Finance Director, the group financial controller and the global tax and treasury director. The Finance Director, in turn, presents a consolidated management report to the Board.
These reviews are supplemented by quarterly performance reviews, chaired by the Chief Executive. They discuss historical results and expected future performance and involve senior management from both operational and financial areas of the business.
Our opinion
Working with management, including the Chief Executive and Finance Director, we have evaluated the effectiveness of the design and operation of our disclosure controls and procedures as at 31 March 2012. Our disclosure controls and procedures are designed to provide reasonable assurance of achieving their objectives, however the effectiveness of any system of disclosure controls and procedures has limitations including the possibility of human error and the circumvention or overriding of the controls and procedures. Even effective disclosure controls and procedures provide only reasonable assurance of achieving their objectives. Based on the evaluation, the Chief Executive and Finance Director concluded that the disclosure controls and procedures are effective to provide reasonable assurance that information required to be disclosed in the reports that we file and submit under the Exchange Act is recorded, processed, summarised and reported as and when required and that such information is accumulated and
communicated to our management, including the Chief Executive and Finance Director, as appropriate, to allow timely decisions regarding disclosure.
Our management, including the Chief Executive and Finance Director, has carried out an evaluation of our internal control over financial reporting pursuant to the Disclosure and Transparency Rules and Section 404 of Sarbanes-Oxley. As required by Section 404, management is responsible for establishing and maintaining an adequate system of internal control over financial reporting (as defined in Rules 13a-15(f) and 15d-15(f) under the Exchange Act). Our internal control over financial reporting is designed to provide reasonable assurance regarding the reliability of financial reporting and the preparation of financial statements for external purposes in accordance with generally accepted accounting principles. Because of its inherent limitations, internal control over financial reporting may not prevent or detect misstatements. Also, projections of any evaluation of effectiveness to future periods are subject to risk that controls may become inadequate because of changes in conditions, or that the degree of compliance with the policies or procedures may deteriorate.
Management evaluation of the effectiveness of the Company’s internal control over financial reporting was based on the framework in Internal Control-Integrated Framework issued by the Committee of Sponsoring Organizations of the Treadway Commission. Based on this evaluation, management concluded that our internal control over financial reporting was effective as at 31 March 2012.
PricewaterhouseCoopers LLP, which has audited our consolidated financial statements for the year ended 31 March 2012, has also audited the effectiveness of our internal control over financial reporting. Their attestation report can be found on page 111.
During the year, there were no changes in our internal control over financial reporting that have materially affected, or are reasonably likely to materially affect, it.
Annual Report and Accounts 2011/12National Grid plc47
Business Review
Delivering our strategy
|
| ||||||
|
|
| |||||
48National Grid plcAnnual Report and Accounts 2011/12
www.nationalgrid.com
As we enter each new year, we assess our strategy and set priorities for the coming period. These priorities cover a broad array of actions that will collectively, over time, deliver our strategy. Some examples of the actions taken this year can be found in the How do we deliver? section on pages 32 to 37. In this section, we provide a closer look at some of our priorities and how we have performed against them during the year.
|  |   | ||||||||||||
||
| ||||||||||||||
| ||||||||||||||
|
UK Electricity Transmission
| ||||||||
What we do We own the We are also the national electricity transmission system operator, responsible for both the England and Wales transmission system, and the two high voltage transmission networks in Scotland, which we Day-to-day operation of the Where we are heading Although demand for electricity is generally increasing around the world, in the Changes in the sources and characteristics of generation connecting to our network mean we need to develop the way we balance and operate our network to accommodate these sources, including wind, new Industry forecasts indicate there will be a tightening of the margin between the available supply of electricity and the demand for it over the next few years. We have a central role
What we’ve achieved during 2013/14 • We made significant progress with our network upgrade plans. We are pleased with our progress on the London Power Tunnels project and have now started site works on the first 600 kV subsea HVDC link in the world. Connecting Scotland and England, this link will support the export of low carbon Scottish generation. • In March 2014, the new Transmission National Control Centre in Warwick became operational. This will help our focus on the future complexities of network security, energy management and streamlining our operational and safety switching | activities, increasing the potential for access to the transmission system. • We improved our asset maintenance policy, which will provide greater efficiency for our maintenance programme. We are implementing the policy throughout 2014 to minimise disruption to customers and planned work. • We worked closely with DECC and Ofgem to help inform and manage security of supply through a period of significant change in the UK energy market. • We have carried out analysis to help inform the Government’s decisions on energy policy as well as administering key parts of the • We have developed two new balancing services that could be used to provide additional reserves to support the operation of the electricity transmission system if margins continue to tighten towards the middle of this decade. These new services, known as the Demand Side Balancing Reserve and the Supplemental Balancing Reserve, were approved by Ofgem in Priorities for the • Work with our • Engage with customers and stakeholders while we progress our major infrastructure projects through the planning process. • Continue the roll-out of our new performance excellence way of working across Electricity Transmission. • Develop new, innovative ways to deliver the network reliability our customers require, at minimum cost. • Build on the analysis results that informed the first EMR delivery plan and successfully implement and operate the Capacity Market and Contracts for Difference Feed-in Tariff regime, as part of the Government’s EMR project. This will support a sustainable, affordable and secure electricity market into the future, in addition to the procurement of balancing services to support mid-decade capacity margins. • Shape development in the UK and | 30% UK Electricity Transmission adjusted operating profit of Group total | ||||||
 | |
| ||||||
| ||||||||
Annual Report and Accounts 2011/12National Grid plc49
Business Review
Delivering our strategy
What we delivered this year
50National Grid plcAnnual Report and Accounts 2011/12
www.nationalgrid.com
|

The cast iron sealing bot or CISBOT
bolted damper assemblies, temporary conductor strand repairs and the electrical resistance measurement of conductor joints. At all times LineScout is operating on live lines, controlled via our ground teams to provide a safe mode of operation, and, equally importantly, enables customer supply to remain uninterrupted.
Such is the potential of both pieces of technology that we are continuing to work with our partners to explore further ways in which we can benefit from other technological developments.
Expanding our sources of capital
Innovation also extends to the way we finance our operations. September 2011 saw the launch of our first RPI linked retail bond. The 10 year bond attracted huge demand and was reopened twice to meet further demand, eventually totalling £283 million in capital raised. Open to retail investors for a minimum investment of just £2,000, this bond reached a new investor base attracting around 10,000 private investors and increased the diversity of our funding sources without a significant premium to our existing bonds. Externally recognised for its innovation, it won two awards including ‘Deal of the Year' from the Association of Corporate Treasurers and is seen as a benchmark for other corporations to follow. The bond proved that even in difficult economic times we retain the ability to attract investors.
This has clearly exceeded our expectations and we are extremely pleased about the total amount raised. It shows that there is demand for inflation linked products from a business such as National Grid.
Malcolm Cooper global tax and treasury director comments on the success of the retail bond
Energising the future
Our innovative energy partnership with Buffalo Niagara medical campus in upstate New York was recognised at the 2012 Energy Efficiency Global Forum in March 2012, when the project won the Energy Efficiency Global Visionary Award for the Americas.
The award was granted to Buffalo Niagara for creating a five year energy innovation and economic development plan for the campus and surrounding residential community that integrates energy efficiency, modernisation, alternative transportation and renewable energy. Campus officials worked with nearby residents, National Grid and campus institutions to create an impressive path towards energy efficiency.
Our partnership with Buffalo Niagara forms part of our community engagement through the promotion of energy efficiency and innovation. Part of our contribution to this programme will be a model energy efficient home. Originally constructed in 1915, the home will be an illustration of how the latest technologies can be integrated within existing properties and will use various innovative energy solutions, interactive learning tools and will offer further information on residential energy programmes. In addition, we commissioned 21 vehicle charging stations in December 2011 and over the coming years will complete work to increase the capacity of our network to ensure we can meet the growing energy demands of the local community.
Four cities on four continents were honoured as exemplars of energy efficiency leadership by the Alliance to Save Energy and the Southeast Energy Efficiency Alliance. The awards celebrate cutting edge energy efficiency achievements. Selections are made by the 50+ member Energy Efficiency Global International Steering Committee, chaired by US Senator Mark Warner and Schneider Electric US President Jeff Drees.
Annual Report and Accounts 2011/12National Grid plc51
Business Review
Delivering our strategy
What we delivered this year

52National Grid plcAnnual Report and Accounts 2011/12
www.nationalgrid.com
|
| |||
|
| |||
| ||||
| ||||
Annual Report and Accounts 2011/12National Grid plc53
Business Review
Delivering our strategy
What we delivered this year
Principal operations continued |
54National Grid plcAnnual Report and Accounts 2011/12
www.nationalgrid.com
UK Gas Distribution
| ||||||||
We own and operate four of the eight regional gas distribution networks in Great Britain. Our networks comprise approximately 131,000 kilometres (81,000 miles) of gas distribution pipeline and we transport gas from the gas national transmission system to around 10.9 million consumers on behalf of 32 gas shippers. Gas consumption in our UK networks was 264 TWh in 2013/14 compared with 306 TWh in 2012/13. We manage the national gas emergency number (0800 111 999). This service, along with the enquiries lines, appliance repair helpline and meter enquiry service, handled nearly 2.5 million calls during 2013/14.
We have articulated an ambition for 2017 – to be the best gas distribution business in Britain. We are using modern technology and new, innovative techniques to develop gas networks that are fit for the future, safe and secure, keeping people warm.
| • A notable example of innovation during 2013/14 has been the use of a repair robot called CISBOT to fix a leaking 18 inch gas main in London. This was the first time in Great Britain that an 18 inch gas main has been fixed by robots. This kind of automation reduces traffic disruption and avoids the need to • Working with Future Biogas we successfully commissioned the first commercial biogas-to-grid project in Doncaster. The biomethane injection is produced from a maize feedstock and is the first of
All our priorities support our Gas Distribution ambition and are above and beyond meeting our standards. • Achieve our safest year ever by improving the safety to members of the public, continuing to reduce cable strikes and making improvements that will help reduce the number of third-party encroachments. • Improve the experience our customers have with us and the way in which we engage with our stakeholders, including reducing complaints and rejuvenating our customer connections process. • Invest in our people to help them develop their skills and increase their capability, including a focus on the role of the supervisor and promoting accelerated development assignments. • Engage with our people by embedding performance excellence in the remainder of our Gas Distribution business and delivering on our enhanced engagement strategy. • Drive innovation so we can improve the services and value we provide to our customers by both maximising existing technology and identifying new opportunities for future development. • Improve the quality and availability of our data and management information so we can operate more efficiently in the future. | 25% UK Gas Distribution adjusted operating profit of Group total | ||||||
| ||||||||
|
|
|
| |||||
Annual Report and Accounts 2011/12National Grid plc55
Business Review
| ||
| ||
| ||
|
56National Grid plcAnnual Report and Accounts 2011/12
www.nationalgrid.com
Measurement of financial performance
We report our financial results and position in accordance with IFRS.
Use of adjusted profit measures
In considering the financial performance of our businesses and segments, we analyse each of our primary financial measures of operating profit, profit before tax, profit for the year attributable to equity shareholders and earnings per share into two components.
The first of these components is referred to as an adjusted profit measure, also known as a business performance measure. This is the principal measure used by management to assess the performance of the underlying business.
Adjusted results exclude exceptional items, remeasurements, stranded cost recoveries, and the amortisation of acquisition-related intangibles. These items are reported collectively as the second component of the financial measures.
Accounting policy T on page 117 explains in detail the items which are excluded from our adjusted profit measures.
Adjusted profit measures have limitations in their usefulness compared with the comparable total profit measures as they exclude important elements of our financial performance. However, we believe that by presenting our financial performance in two components it is easier to read and interpret financial performance between periods, as adjusted profit measures are more comparable having removed the distorting effect of the excluded items. Those items are more clearly understood if separately identified and analysed. The presentation of these two components of financial performance is additional to, and not a substitute for, the comparable total profit measures presented.
Management uses adjusted profit measures as the basis for monitoring financial performance and in communicating financial performance to investors in external presentations and announcements of financial results. Internal financial reports, budgets and forecasts are primarily prepared on the basis of adjusted profit measures, although planned exceptional items, such as significant restructurings, and stranded cost recoveries are also reflected in budgets and forecasts. We separately monitor and disclose the excluded items as a component of our overall financial performance.
Reconciliations of adjusted profit measures to the total profit measure, that includes both components can be found on page 120.
As discussed on pages 24 to 29, our allowed revenues are set in accordance with our regulatory price controls or rate plans. We calculate the billing rates we charge our customers based on the estimated volume of energy we believe will be sold during the coming period. The actual volumes sold will differ from this estimate and therefore our total actual revenue will be different from our total allowed revenue. These differences are commonly referred to as timing differences. If we collect more than the allowed level of revenue, the balance must be returned to customers in subsequent periods, and if we collect less than the allowed level of revenue we may recover the balance from customers in subsequent periods. The amounts calculated as timing differences are estimates and subject to change until the variables that determine allowed revenue are final.
Our operating profit for the year includes an estimated in year over collection of £18 million (2010/11: £274 million over collection; 2009/10: £163 million under collection) and our closing balance
of over-recovery at 31 March 2012 was £90 million. All other things being equal, the majority of that balance would normally be returned to customers in the following year. The table below shows adjusted operating profit and operating profit, adjusted for timing differences.
| Years ended 31 March | ||||||||||||
| Excluding the impact of timing differences | 2012 £m | 2011 £m | 2010 £m | |||||||||
Adjusted operating profit | 3,477 | 3,326 | �� | 3,284 | ||||||||
Operating profit | 3,521 | 3,471 | 3,456 | |||||||||
Our financial results are reported in sterling. Transactions for our US operations are denominated in dollars and so the related amounts that are reported in sterling depend on the dollar to sterling exchange rate. As the average rate of the dollar at $1.60:£1 in 2011/12 was weaker than the average rate of $1.57:£1 in 2010/11, the same amount of revenue, adjusted operating profit and operating profit in dollars earned in 2010/11 would have been reported as £135 million, £21 million and £26 million lower respectively if earned in 2011/12. In 2009/10, the average rate was $1.58:£1; if the revenue, adjusted operating profit and operating profit in dollars recognised in 2009/10 was earned in 2010/11 it would have been reported as £29 million, £3 million and £4 million higher respectively.
The balance sheet has been translated at an exchange rate of $1.60:£1 at 31 March 2012 ($1.61:£1 at 31 March 2011).
Key performance indicators (KPIs)
Our financial KPIs are set out on pages 38 and 39.
Total shareholder return (TSR)
We measure TSR as a KPI on a cumulative three year basis. The measure reflects changes in our share price and also assumes that dividends paid to shareholders over that period were reinvested in our shares. Cumulative TSR for the period from 1 April 2009 to 31 March 2012 was 51% (1 April 2008 to 31 March 2011: 4%; 1 April 2007 to 31 March 2010: -3%). This reflects the fact that, following a sharp fall in equity prices amid the turbulence in the financial markets during 2008/09, the subsequent recovery in the following three years has reversed these losses and resulted in further growth in TSR.
Group return on equity
We measure our performance in generating value for our shareholders by dividing our annual return by our equity base. We have changed the calculation methodology for group return on equity to better align with the methodology used for our new return on capital employed (RoCE) metric discussed on page 59.
Our annual return consists of the group’s adjusted earnings, amended for regulatory and accounting differences including, where applicable, timing differences, the impact of inflation on our UK RAV, pension and other post-employment benefits, certain capital related operating costs, the exclusion of non debt related interest, and changes to the tax expense resulting from the tax impact of these adjustments. Our equity base consists of opening capital employed less opening net debt. Opening capital employed consists of opening UK RAV, plus opening US rate base, plus the opening net book value of assets and liabilities of our non-regulated businesses and joint ventures, plus opening goodwill. Opening net debt is adjusted for significant individual transactions during the year such as rights issues and significant acquisition or disposal activities.
Annual Report and Accounts 2011/12National Grid plc57
Business Review
Financial performance continued
Using the revised methodology, we monitor our performance using the annual return each year. For 2011/12, our group ROE was 10.9%, compared with 10.8% in 2010/11 and 12.6% in 2009/10. The return in 2011/12 was in line with the prior year but was restrained by the significantly higher US storm costs. Excluding the higher major storm costs, the 2011/12 return was 11.3%, the increase driven by growth in the Company’s pre timing earnings. The high return in 2009/10 was primarily driven by inflation fluctuations in the UK affecting our allowed revenues and interest expense associated with our RPI linked bonds.
Regulated controllable operating costs
We measure regulated controllable operating costs as a proportion of our regulated assets, as measured by our UK RAV and our US rate base.
This ratio decreased to 6.7% in 2011/12, compared with 7.2% in 2010/11 and 7.5% in 2009/10 on a constant currency basis, reflecting cost savings in our US business following the restructure and the efficient growth of our regulated asset base.
Adjusted earnings per share
We monitor our financial performance during the year by measuring adjusted earnings per share. This and other profit measures are described on the following pages.
Dividends and dividend cover
The proposed total ordinary dividend for 2011/12 amounts to £1,401 million or 39.28 pence per ordinary share. This represents an increase of 8% over the previous year’s ordinary dividend per share of 36.37 pence.
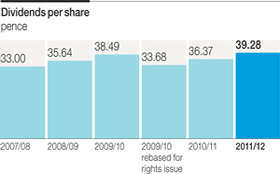
The table below shows the ordinary dividends paid or payable by National Grid for the past five financial years.
| Years ended 31 March | ||||||||||||||||||||
| Dividends | 2012 pence | 2011 pence | 2010 pence | 2009 pence | 2008 pence | |||||||||||||||
Interim | 13.93 | 12.90 | 13.65 | 12.64 | 11.70 | |||||||||||||||
Final | 25.35 | 23.47 | 24.84 | 23.00 | 21.30 | |||||||||||||||
Total | 39.28 | 36.37 | 38.49 | 35.64 | 33.00 | |||||||||||||||
| Dividends per ADS | $ | $ | $ | $ | $ | |||||||||||||||
Interim | 1.10 | 1.02 | 1.15 | 0.95 | 1.21 | |||||||||||||||
Final | 2.02 | 1.90 | 1.77 | 1.74 | 2.05 | |||||||||||||||
Total | 3.12 | 2.92 | 2.92 | 2.69 | 3.26 | |||||||||||||||
Dividends expressed in dollars per ADS in the table above reflect the amounts paid or payable to ADS holders, rounded to two decimal places.
The final dividend proposed in respect of each financial year is reported in the financial statements for the following year. Therefore, the proposed final dividend for 2011/12 of 25.35 pence per share, amounting to approximately £905 million (assuming all dividends are settled in cash), will be reported in the financial statements for the year ending 31 March 2013.
| Years ended 31 March | ||||||||||||
| Total ordinary dividends covered by: | 2012 times | 2011 times | 2010 times | |||||||||
Adjusted earnings | 1.3 | 1.4 | 1.5 | |||||||||
Earnings | 1.5 | 1.8 | 1.5 | |||||||||
• We have improved our overall safety performance (see page 10). We have focused on reducing cable strikes with programmes like ‘dial before you dig’ and seen a 14% reduction in cable strikes during 2013/14. • The number of customer complaints we received during 2013/14 was 13.3% less than the previous year. However, we know our customers want more and we are focusing our attention on improving even further, particularly the experience customers have when they want to connect to our network. • Last year we listened to what our stakeholders had to say through our consultation process and we made 29 commitments to improve in areas of stakeholder priority such as fuel poverty, vulnerability, gas safety – including carbon monoxide awareness – and new and innovative ways of working. • We have been simplifying and improving the way we work so that our employees can be as effective as possible and our customers get a service they value. We are doing this by looking for ways to streamline, innovate and improve everyday working practices with our business and our strategic partners who help us reach our goals. |

| ||||
| ||||
| ||||
| ||||
58National Grid plcAnnual Report and Accounts 2011/12
www.nationalgrid.com
Interest cover
In order to deliver sustainable growth, we must be disciplined in the way we manage our balance sheet. The principal measure we use to monitor financial discipline is interest cover, being a measure of the cash flows we generate compared with the net interest cost of servicing our borrowings. The table below shows our interest cover for the last three years:
| Years ended 31 March | ||||||||||||
2012 times | 2011 times | 2010 times | ||||||||||
Interest cover | 3.9 | 3.8 | 3.9 | |||||||||
The primary reasons for the increase in 2011/12 were a fall in finance costs driven by interest rates on short-term instruments combined with benefits from our 2010/11 debt buy back programme partially offset by a small decrease in our operational cash inflows for the year.
Return on capital employed
RoCE is designed to provide a performance comparison between our regulated UK and US businesses and is one of the measures that we use to make strategic and investment decisions around our portfolio of businesses. Our RoCE calculation is a post-tax return on assets measure based on an IFRS operating profit adjusted, where applicable, for timing differences, the impact of inflation on our UK RAV and differences between the treatment of certain costs by regulators and their treatment in the financial statements, including taxation, pension and other post-employment benefits, and certain capital related operating costs. We also deduct taxation at the statutory rate. The capital employed is the opening UK RAV and opening US rate base.
The table below shows the RoCE for our businesses over the last three years:
| Years ended 31 March | ||||||||||||
| RoCE | 2012 % | 2011 % | 2010 % | |||||||||
UK regulated | 8.6 | 8.5 | 9.6 | |||||||||
US regulated | 6.8 | 7.1 | 5.5 | |||||||||
The increase in UK RoCE is due to higher operating profit following the benefits of inflation on our RPI-X price controls partially offset by growth in our asset base. The fall in the US RoCE is due to higher storm costs, partially offset by savings driven by our restructuring. Excluding the impact of higher major storm costs, the US RoCE would have been 7.6%, an increase of 0.5% compared with 2011.
The following chart shows the five year trend in adjusted profit attributable to equity shareholders of the parent (adjusted earnings) and adjusted earnings per share.
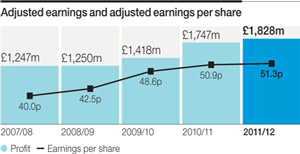
The following chart shows the five year trend in profit attributable to equity shareholders (earnings) and earnings per share.
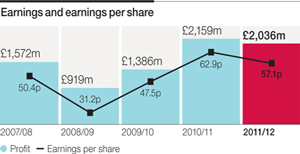
In accordance with IAS 33, all earnings per share and adjusted earnings per share amounts for comparative periods have been restated as a result of shares issued via scrip dividends and the bonus element of the rights issue.
Diluted adjusted earnings per share and diluted earnings per share are shown in the table below:
| Years ended 31 March | ||||||||||||
2012 pence | 2011 pence | 2010 pence | ||||||||||
Adjusted diluted earnings per share | 51.0 | 50.6 | 48.3 | |||||||||
Diluted earnings per share | 56.8 | 62.5 | 47.3 | |||||||||
The principal reason for the dilution in each year relates to employee share plans.
Annual Report and Accounts 2011/12National Grid plc59
Business Review
Financial performance continued
Adjusted operating profit
The £105 million decrease in adjusted operating profit in 2011/12 to £3,495 million is primarily due to:
|
|
Partially offset by:
|
|
Other operating costs were relatively flat year on year, reflecting reduced costs in our US Regulated segment as a result of the restructuring, offset by higher costs within the UK due to inflation and additional staffing costs to support both the GDFO system implementation in our UK Gas Distribution business and the ongoing increase in our capital investment programme in UK Transmission.
The £479 million increase in 2010/11 to £3,600 million was primarily due to the favourable timing differences that adversely affected the current year and increased revenues in our US Regulated segment following the introduction of new rates in several of our utilities.
More information can be found in the discussion of our segments on pages 62 to 71.
Adjusted net finance costs
| Years ended 31 March | ||||||||||||
2012 £m | 2011 £m | 2010 £m | ||||||||||
Adjusted net finance costs | 917 | 1,134 | 1,155 | |||||||||
The £217 million decrease in adjusted net finance costs in 2011/12 to £917 million is primarily due to lower interest rates on short-term instruments; lower debt repurchase costs that had peaked in the prior year due to the use of surplus funds from the rights issue; the benefit of lower average net debt as a result of those buy backs; and a favourable variance in pension interest primarily due to a higher than expected rate of return on US pension assets. The slight increase in 2010/11 compared with 2009/10 primarily reflected lower net pension interest due to higher plan assets and higher rates of return on those assets, offset by higher accretions on index-linked debt following the return of UK inflation.
Adjusted taxation
Adjusted tax for 2011/12 was a charge of £755 million (2010/11: £722 million; 2009/10: £553 million). This represents an effective tax rate of 29.2% (2010/11: 29.2%; 2009/10: 28.0%). The 2011/12 effective tax rate before exceptional items, remeasurements and stranded cost recoveries did not change from 2010/11 because a fall in prior period tax credits was offset, primarily by a 2% reduction in the UK corporation tax rate and a change in the UK/US profit mix where higher UK profits were taxed at UK tax rates, which are lower than those in the US. The increase in the rate from 2009/10 to 2010/11 mainly arose from a change in the UK/US profit mix where higher US profits were taxed at US tax rates that are higher than those in the UK. More information on taxation can be found in note 5 to the consolidated financial statements.
Exceptional items, remeasurements and stranded cost recoveries
Exceptional charges of £122 million in 2011/12 consisted of restructuring charges of £101 million, environmental charges of £55 million and impairment charges of £64 million, offset by net gains on the disposals of two subsidiaries of £97 million and other net gains of £1 million.
Exceptional charges of £350 million in 2010/11 consisted of restructuring costs of £89 million, environmental charges of £128 million, impairment costs and related charges of £133 million and other charges of £15 million, offset by net gains on disposals of three subsidiaries and an associate of £15 million.
Exceptional charges of £268 million in 2009/10 consisted of restructuring charges of £149 million, environmental charges of £63 million and other charges of £67 million, offset by net gains on disposals of £11 million.
Exceptional finance costs and remeasurements
There were no exceptional finance costs in 2011/12. There were £73 million of exceptional finance costs during 2010/11 relating to the early redemption of debt following the rights issue in June 2010, offset by £43 million of exceptional interest income relating to tax settlements in the US. There were £33 million of exceptional finance costs during 2009/10 relating to the early redemption of debt. Financial remeasurements relate to net gains and losses on derivative financial instruments, 2011/12 included a loss of £70 million (2010/11: £36 million gain; 2009/10: £81 million gain). The financial element of commodity contract revaluations was nil in 2011/12 (2010/11: nil; 2009/10: £1 million loss).
Stranded cost recoveries
Stranded cost recoveries decreased by £88 million to £260 million as the costs were substantially recovered during the year. (2010/11: £348 million; 2009/10: £369 million).
Exceptional taxation
Taxation related to exceptional items, remeasurements and stranded cost recoveries changes each year in line with the nature and amount of transactions recorded.
In addition, exceptional tax from 2011/12 included an exceptional deferred tax credit of £242 million arising from a reduction in the UK corporation tax rate from 26% to 24% applicable from 1 April 2012. A similar reduction in the UK corporation tax rate in 2010/11 from 28% to 26% resulted in a £226 million deferred tax credit in that year.
An additional exceptional tax credit of £59 million arose in 2010/11 from settling a number of KeySpan pre acquisition items with the US tax authorities. In 2009/10 a £41 million exceptional tax charge arose due to a change in US tax legislation under the Patient Protection and Affordable Care Act.
More information on exceptional items, remeasurements and stranded cost recoveries can be found in note 3 to the consolidated financial statements.
60National Grid plcAnnual Report and Accounts 2011/12
www.nationalgrid.com
Reconciliations of adjusted profit measures
Reconciliation of adjusted operating profit to total operating profit
Adjusted operating profit is presented on the face of the income statement under the heading operating profit before exceptional items, remeasurements and stranded cost recoveries.
| Years ended 31 March | ||||||||||||
2012 £m | 2011 £m | 2010 £m | ||||||||||
Adjusted operating profit | 3,495 | 3,600 | 3,121 | |||||||||
Exceptional items | (122 | ) | (350 | ) | (268) | |||||||
Remeasurements | (94 | ) | 147 | 71 | ||||||||
Stranded cost recoveries | 260 | 348 | 369 | |||||||||
Total operating profit | 3,539 | 3,745 | 3,293 | |||||||||
Reconciliation of adjusted operating profit to adjusted earnings and earnings
Adjusted earnings is presented in note 6 to the consolidated financial statements, under the heading adjusted earnings.
| Years ended 31 March | ||||||||||||
2012 £m | 2011 £m | 2010 £m | ||||||||||
Adjusted operating profit | 3,495 | 3,600 | 3,121 | |||||||||
Adjusted net finance costs | (917 | ) | (1,134 | ) | (1,155) | |||||||
Share of post-tax results of joint ventures | 7 | 7 | 8 | |||||||||
Adjusted profit before tax | 2,585 | 2,473 | 1,974 | |||||||||
Adjusted taxation | (755 | ) | (722 | ) | (553) | |||||||
Adjusted profit | 1,830 | 1,751 | 1,421 | |||||||||
Attributable to non-controlling interests | (2 | ) | (4 | ) | (3) | |||||||
Adjusted earnings | 1,828 | 1,747 | 1,418 | |||||||||
Exceptional items | 174 | (16 | ) | (270) | ||||||||
Remeasurements | (122 | ) | 219 | 17 | ||||||||
Stranded cost recoveries | 156 | 209 | 221 | |||||||||
Earnings | 2,036 | 2,159 | 1,386 | |||||||||
Reconciliation of adjusted earnings per share to earnings per share
Adjusted earnings per share is presented in note 6 to the consolidated financial statements.
| Years ended 31 March | ||||||||||||
2012 pence | 2011 pence | 2010 pence | ||||||||||
Adjusted earnings per share | 51.3 | 50.9 | 48.6 | |||||||||
Exceptional items | 4.9 | (0.5 | ) | (9.3) | ||||||||
Remeasurements | (3.4 | ) | 6.4 | 0.6 | ||||||||
Stranded cost recoveries | 4.3 | 6.1 | 7.6 | |||||||||
Earnings per share | 57.1 | 62.9 | 47.5 | |||||||||
Reconciliation of adjusted profit before tax to total profit before tax
Adjusted profit before tax is presented on the face of the income statement under the heading profit before tax before exceptional items, remeasurements and stranded cost recoveries.
| Years ended 31 March | ||||||||||||
2012 £m | 2011 £m | 2010 £m | ||||||||||
Adjusted profit before tax | 2,585 | 2,473 | 1,974 | |||||||||
Exceptional items | (122 | ) | (380 | ) | (301) | |||||||
Remeasurements | (164 | ) | 183 | 151 | ||||||||
Stranded cost recoveries | 260 | 348 | 369 | |||||||||
Total profit before tax | 2,559 | 2,624 | 2,193 | |||||||||
Reconciliation of adjusted operating profit excluding timing differences and major storms to total operating profit
Adjusted operating profit excluding timing differences and major storms is discussed in the Business Review.
| Years ended 31 March | ||||||||||||
2012 £m | 2011 £m | 2010 £m | ||||||||||
Adjusted operating profit excluding timing differences and major storms | 3,593 | 3,326 | 3,284 | |||||||||
Major storms | (116 | ) | – | – | ||||||||
Adjusted operating profit excluding timing differences | 3,477 | 3,326 | 3,284 | |||||||||
Timing differences | 18 | 274 | (163) | |||||||||
Adjusted operating profit | 3,495 | 3,600 | 3,121 | |||||||||
Exceptional items, remeasurements and stranded cost recoveries | 44 | 145 | 172 | |||||||||
Total operating profit | 3,539 | 3,745 | 3,293 | |||||||||
Reconciliation of adjusted operating profit excluding timing differences to total operating profit
Adjusted operating profit excluding timing differences and total operating profit excluding timing differences are discussed in the Business Review.
| Years ended 31 March | ||||||||||||
2012 £m | 2011 £m | 2010 £m | ||||||||||
Adjusted operating profit excluding timing differences | 3,477 | 3,326 | 3,284 | |||||||||
Exceptional items, remeasurements and stranded cost recoveries | 44 | �� | 145 | 172 | ||||||||
Total operating profit excluding timing differences | 3,521 | 3,471 | 3,456 | |||||||||
Timing differences | 18 | 274 | (163) | |||||||||
Total operating profit | 3,539 | 3,745 | 3,293 | |||||||||
Annual Report and Accounts 2011/12National Grid plc61
Business Review
Financial performance continued
| Years ended 31 March | ||||||||||||
2012 £m | 2011 £m | 2010 £m | ||||||||||
UK Transmission | 3,804 | 3,484 | 3,475 | |||||||||
UK Gas Distribution | 1,605 | 1,524 | 1,518 | |||||||||
US Regulated | 7,795 | 8,746 | 8,372 | |||||||||
Other activities | 715 | 678 | 741 | |||||||||
Total segmental revenues | 13,919 | 14,432 | 14,106 | |||||||||
Less: sales between operating segments | (87) | (89) | (99) | |||||||||
Total | 13,832 | 14,343 | 14,007 | |||||||||
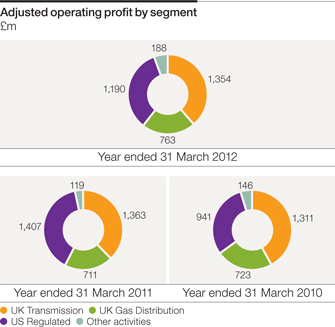
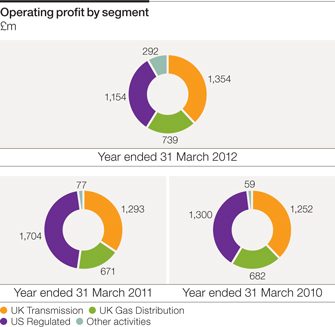
62National Grid plcAnnual Report and Accounts 2011/12
www.nationalgrid.com
Analysis of adjusted operating profit
The chart on this page analyses the movements in adjusted operating profit by segment, comparing 2011/12 with 2010/11 and comparing 2010/11 with 2009/10. The charts on pages 65, 67, 69 and 71 show the principal movements in each segment over the same periods.
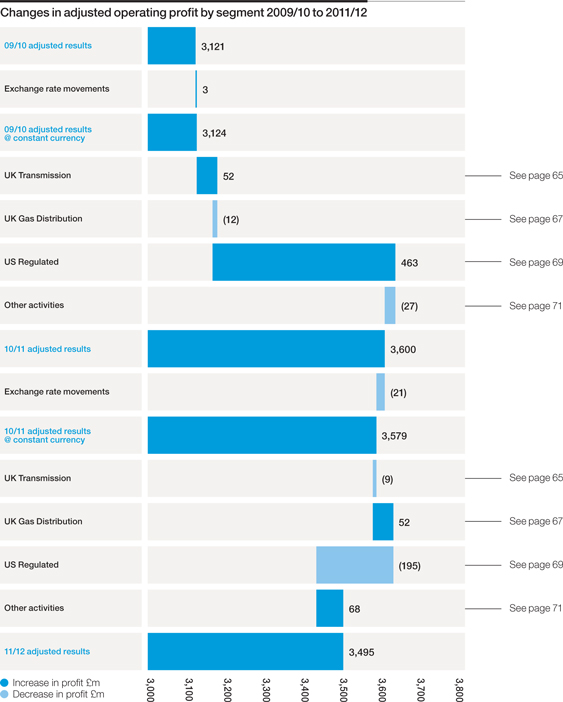
Annual Report and Accounts 2011/12National Grid plc63
Business Review
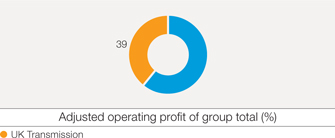
We own the electricity transmission system in England and Wales and are the national electricity transmission system operator, responsible for both the England and Wales transmission system, and the two high voltage transmission networks in Scotland, which we do not own. Day-to-day operation of the system involves the continuous real-time matching of demand and generation output. We are also designated as system operator for the new offshore electricity transmission regime.
We own and operate the gas national transmission system in Great Britain, with day-to-day responsibility for balancing demand.
We own and operate the UK assets, and a portion of the subsea cables, that comprise the electricity interconnector between England and France as part of a joint arrangement with the French transmission operator.
For more details on how our UK Transmission business operates see pages 16 to 17 and 20 to 21.
Key achievements
|
|
|
|
|
Strategy
As part of the group’s strategic objectives, UK Transmission’s strategy includes:
|
|
|
|
Principal risks
|
|
|
Outlook
We believe the outlook for our UK Transmission business over the coming year is positive. While there are challenges ahead, we believe we have the right skills and approach to overcome them.
In the next 12 months we aim to deliver over £1.5 billion of capital investment and over the RIIO price control period we estimate this will be £25 billion.
Our safety and reliability performance has remained strong during the year and we believe this can continue. Our customer satisfaction scores have improved and work is underway to help deliver further improvement in this area.
We are working with stakeholders to try to develop the network of the future, designed to have appropriate flexibility to cope with the transition to a low carbon economy.
 |  | |
64National Grid plcAnnual Report and Accounts 2011/12
www.nationalgrid.com
 |
|
UK Transmission
The results of the UK Transmission segment for the years ended 31 March 2012, 2011 and 2010 were as follows:
| Years ended 31 March | ||||||||||||
2012 £m | 2011 £m | 2010 £m | ||||||||||
Revenue | 3,804 | 3,484 | 3,475 | |||||||||
Operating costs excluding exceptional items | (2,450 | ) | (2,121 | ) | (2,164) | |||||||
Adjusted operating profit | 1,354 | 1,363 | 1,311 | |||||||||
Exceptional items | – | (70 | ) | (59) | ||||||||
Operating profit | 1,354 | 1,293 | 1,252 | |||||||||
Principal movements (2009/10 – 2011/12)
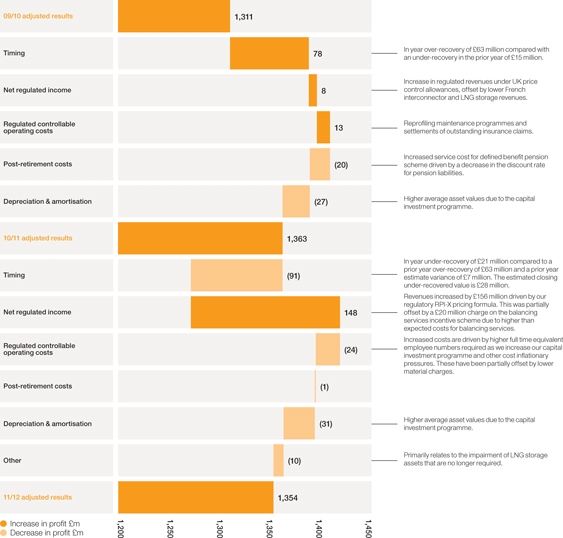
Annual Report and Accounts 2011/12National Grid plc65
Business Review
Principal operations
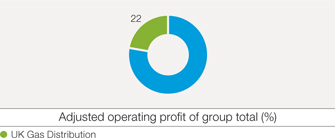
We own and operate four of the eight regional gas distribution networks in Great Britain. Our networks comprise approximately 132,000 kilometres (82,000 miles) of gas distribution pipeline and we transport gas from the gas national transmission system to around 10.8 million consumers on behalf of 26 active gas shippers. Gas consumption in our UK networks was 259 TWh in 2011/12 compared with 304 TWh in 2010/11.
We manage the national gas emergency number (0800 111 999). This service, along with the enquiries lines, appliance repair helpline and meter enquiry service, handled 2,498,804 calls during 2011/12.
For more details on how our UK Gas Distribution business operates see pages 20 and 21.
Key achievements
|
|
|
|
|
Strategy
As part of the group’s strategic objectives, UK Gas Distribution’s strategy includes:
|
|
|
|
Principal risks
|
|
|
Outlook
We expect to complete the roll out of the GDFO system across our networks over the summer of 2012. Once completed, this will be an enabling tool for our process improvements and should assist in improving productivity.
Our mains replacement programme will continue and is estimated at around £5 billion over the eight years of the first RIIO price control. In addition, we estimate around £1.3 billion in other capital expenditure.
We plan to introduce process and system improvements which are designed to help achieve output measures and earn incentive revenues under RIIO.
 |  | |
www.nationalgrid.com
 |
UK Gas Distribution
The results of the UK Gas Distribution segment for the years ended 31 March 2012, 2011 and 2010 were as follows:
| Years ended 31 March | ||||||||||||
2012 £m | 2011 £m | 2010 £m | ||||||||||
Revenue | 1,605 | 1,524 | 1,518 | |||||||||
Operating costs excluding exceptional items | (842 | ) | (813 | ) | (795 | ) | ||||||
Adjusted operating profit | 763 | 711 | 723 | |||||||||
Exceptional items | (24 | ) | (40 | ) | (41 | ) | ||||||
Operating profit | 739 | 671 | 682 | |||||||||
Principal movements (2009/10 – 2011/12)
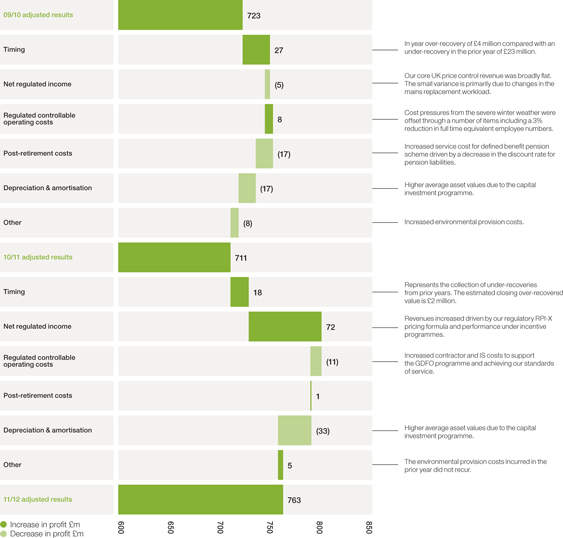
Annual Report and Accounts 2011/12National Grid plc67
Business Review
Principal operations
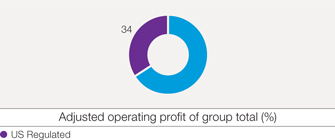
We own and operate electricity distribution networks in upstate New York, Massachusetts, Rhode Island and New Hampshire. Through these networks we serve approximately 3.5 million electricity consumers in New England and upstate New York.
We also maintain and operate the electricity transmission and distribution system on Long Island owned by LIPA. The LIPA service territory covers approximately 3,185 square kilometres (1,230 square miles).
We own 57 electricity generation units on Long Island that together provide 4.1 GW of power under contract to LIPA. Our plants consist of oil and gas fired steam turbine, gas turbine and diesel driven generating units ranging from 2 MW to 385 MW.
Our US gas distribution networks provide services to around 3.5 million consumers across the northeastern US, located in service territories in upstate New York, New York City, Long Island, Massachusetts, New Hampshire and Rhode Island. We added 35,000 new gas heating customers in these areas in 2011/12.
We are responsible for billing, customer service and supply services. We forecast, plan for and procure approximately 14 billion standard cubic metres of gas and 33 TWh of electricity annually across four states.
For more details on how our US Regulated business operates see pages 18 to 19 and 22 to 23.
Key achievements
|
|
|
|
|
Strategy
As part of the group’s strategic objectives, US Regulated’s strategy includes:
|
|
|
|
Principal risks
|
|
|
|
Outlook
We believe the US Regulated business has opportunities to improve performance and we have a plan in place to realise these opportunities over the next few years.
The next 12 months will see significant changes to our information systems with the implementation of a new enterprise resource planning system. This will be supplemented by process improvements aimed at delivering efficiency gains while also improving operational performance.
 |  | |
www.nationalgrid.com
 | ||||||||||||
| Corporate Governance | Financial Statements | Additional Information | 35 |
US Regulated
The results of the US Regulated segment for the years ended 31 March 2012, 2011 and 2010 were as follows:
| Years ended 31 March | ||||||||||||
2012 £m | 2011 £m | 2010 £m | ||||||||||
Revenue excluding stranded cost recoveries | 7,516 | 8,391 | 7,996 | |||||||||
Operating costs excluding exceptional items, remeasurements and stranded cost recoveries | (6,326 | ) | (6,984 | ) | (7,055) | |||||||
Adjusted operating profit | 1,190 | 1,407 | 941 | |||||||||
Exceptional items and remeasurements | (296 | ) | (51 | ) | (10) | |||||||
Stranded cost recoveries | 260 | 348 | 369 | |||||||||
Operating profit | 1,154 | 1,704 | 1,300 | |||||||||
Principal movements (2009/10 – 2011/12)
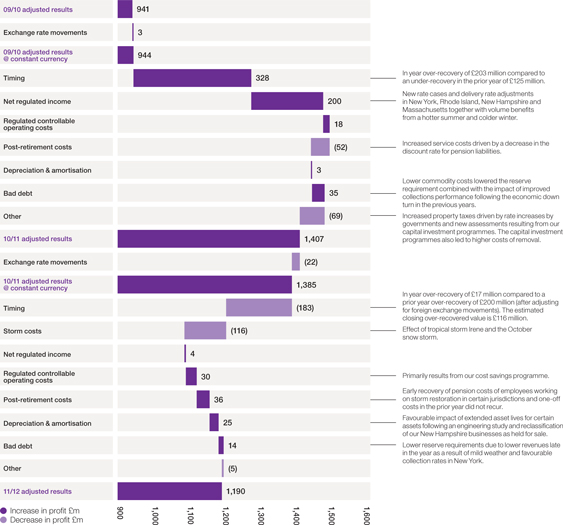
Principal operations continued |
Annual Report and Accounts 2011/12National Grid plc69
US Regulated business | ||||||||
What we do We own and operate electricity distribution networks in upstate New York, Massachusetts, and Rhode Island. Through these networks we serve approximately 3.4 million electricity consumers in New England and upstate New York. Our US gas distribution networks provide services to around 3.6 million consumers across the northeastern US, located in service territories in upstate New York, New York City, Long Island, Massachusetts and Rhode Island. We added 31,145 new gas heating customers in these areas in 2013/14. We own and operate an electricity transmission system of approximately 14,328 kilometres (8,903 miles) spanning upstate New York, Massachusetts, Rhode Island, New Hampshire and Vermont, operating 169 kilometres (105 miles) of underground cable and 521 substations, with a further 12 planned. We also own and operate 50 fossil fuel-powered units on Long Island that together provide approximately 3,800 MW of power under contract to LIPA. A 15 year Power Supply Agreement (PSA) with LIPA was renewed in May 2013 for 3,634 MW of capacity, comprising eight dual fuel (gas/oil-fired) steam units at three sites, 11 dual fuel combustion turbine units, and 27 oil-fired combustion turbine/ diesel units. Under a separate contract with LIPA, four dual fuel combustion turbine units provide an additional 160 MW of capacity. We are responsible for billing, customer service and supply services. We forecast, plan for and procure approximately 15 billion standard cubic metres of gas and 32 TWh of electricity annually across three states. Where we are heading We have introduced Connect21, our thinking on advancing America’s natural gas and electricity infrastructure beyond its 20th century limitations, and creating a more customer-centric, resilient, agile, efficient and environmentally sound energy network. Our approach is threefold: — Build a resilient backbonefor our energy system that can provide reliable, flexible electric and gas service to all customers and integrate clean energy wherever it is located on the grid. — Inform customers about choices available to them to meet their energy needs and educate them on how to manage their use in the most cost-effective way. — Offer customised solutions to customers who want different levels of service. | Connect21 will help develop America’s economic and environmental health in three very important ways: — Drive economic growth: invest in our networks in ways that enhance state and local economies and encourage innovation, while simultaneously reducing the stress currently being exerted on our environment and public health. — Promote cleaner energy: work with the industry to find new ways to deliver cleaner energy, and more importantly encourage consumers to use energy more efficiently. We are already making progress on cleaner sources of energy, such as natural gas. The amount of energy generated by natural gas in the US is expected to double between 1990 and 2040, making gas the leading fuel for electricity generation. — Advance innovative technologies: harness existing technologies to put energy information and usage control in the hands of customers, which will help drive improvements in our consumption behaviours. Leverage technology to build smarter, more resilient electric and natural gas networks that can withstand the extreme weather. Principal risks Our regional risk profile describes the main risks our US business faces. The current risk themes for the US are: — our ability to manage data and systems improvements required to deliver core business processes and regulatory requirements; — our ability to recover costs through existing rate- making mechanisms and to influence the development of the future US utility business model; and — safety performance and network reliability, security and resilience. What we’ve achieved Within each of our jurisdictions we have focused on Elevate 2015, our journey towards operational excellence. This focus has encompassed our end-to-end business processes, including: — delivery; — maintenance and operation of electric and gas assets; — supply chain management; — meter to cash; and — emergency response. Four main principles govern our business improvement strategy: safety and reliability; stewardship; customer responsiveness; and cost competitiveness. | 31% US Regulated | ||||||
36 National Grid Annual Report and Accounts 2013/14 | ||||||||||||
Business Review
Principal operations continued |
US Regulated business
All jurisdictions have benefited from emergency response improvements. This has been a focus for the US business in response to the major storms we have experienced in recent years, such as Superstorm Sandy in 2012. Our Emergency Management Policy reinforces our commitment to our customers and the communities we serve. We strive to use effective emergency management principles and protocols that enhance our ability to provide safe and reliable energy services. We have continued to strengthen resilience by assessing vulnerabilities throughout our system, flood-proofing critical equipment, readying more restoration crews, repair equipment and fuel supplies, reducing the risk of downed power lines from fallen trees and branches, and enhancing communications with our customers and stakeholders. During 2013/14 we introduced some new tools and initiatives: — Weather predictive tool: allows us to use data from past storm events to learn and predict future potential damage, which will help our storm response planning. — Expanded contractor relationships: expanding contractor relationships that cover a wider geographic area to increase flexibility and responsiveness in any type of storm. — Enhanced damage assessment: by using technology now available to us (mobile devices such as tablets) we have introduced an enhanced damage assessment process that helps us to gather information from the field more quickly. Coupled with data from existing outage reporting systems, this allows us to determine where to send crews more quickly and accurately. This, in turn, will help us to determine and execute restoration times faster for customers and communities. US enterprise resource planning system stabilisation continued, remedying the errors of poor implementation from the prior year. Over the course of the year, the US business made significant progress in the activities required to upgrade the system, with implementation expected in mid-2014. The focus is now on reducing the ongoing costs associated with the complex manual processes that are required to compensate for identified weaknesses in internal controls over financial reporting in the US. While these control weaknesses have not reduced the quality of financial statements produced, they have necessitated significant additional cost. Overall, the business remains on track to successfully conclude the programme during 2014, with expected costs unchanged from the guidance provided last year. Safety: we continue to make improvements on last year, including decreases in OSHA recordable incidents, road traffic collisions and lost time incidents. Still, we have much to accomplish to |  | |||||||
reach our goal of zero injuries every day. Some of our initiatives during 2013/14 include the development and implementation of a safe motor vehicle operation policy, Smith System driver training, a soft tissue injury prevention programme, and slippery surface simulator training. Also, in a continued effort to promote safety awareness and improvement, we have shared incident reports and lessons learned briefings with all employees, on a daily basis. Network reliability: we met all our reliability targets in Rhode Island and New York. In Massachusetts, we missed two of our electricity circuit level metrics and avoided a financial penalty due to earned offsets for good performance on our system metrics. Customer satisfaction: we use independent customer research studies and other measures to supplement the four J.D. Power and Associates customer satisfaction studies. We saw improvements in three of the four overall J.D. Power customer satisfaction quartile results – see page 10 for details. In terms of our achievements during 2013/14, here are some highlights from each of our jurisdictions: Massachusetts Infrastructure investment: we invested $510 million to enhance the resilience, efficiency and safety of our infrastructure – $212 million in electric and $298 million in natural gas. Energy efficiency: we introduced ‘Smart Energy Solutions’, a programme rolled out to 15,000 customers. The programme uses grid modernisation solutions, including advanced meters and communications systems and offers our customers better data about their energy usage, which helps them to make more informed decisions. Gas expansion: we installed 32 miles of new gas mains, replaced 162 miles of gas mains and added more than 9,700 new natural gas customers. | National Grid teams maintain and repair the gas distribution networks across Rhode Island, where we deliver gas to 252,000 customers. The team in this picture is creating a solid base to reinstate the ground after some works on Rhode Island’s gas network. | |||||||
Strategic Report | Corporate Governance | Financial Statements | Additional Information | 37 |
Economic development: we installed 15 miles of new electric circuit in Cape Ann, and reconfigured existing circuits to release additional capacity (more than $15 million investment). New York Infrastructure investment: we invested $1,008 million to enhance the resilience, efficiency and safety of our infrastructure – $471 million in electric and $537 million in natural gas. In partnership with the New York City Department of Environmental Protection, we launched the Newtown Creek Renewable Gas Demonstration project in Brooklyn. As part of our commitment to sustainable energy solutions, Newtown Creek is the first project in the US that directly injects renewable gas into a local distribution system by converting effluent from a wastewater treatment plant into biogas. Energy efficiency: we are working with 13 institutions and 50 public and private companies within the Buffalo Niagara Medical Campus to enhance power quality and reliability, as well as address other energy and transportation challenges related to the expansion and development of the campus. Gas expansion: we completed the largest oil to natural gas conversion on Long Island, saving the Northport VA Hospital nearly $3 million a year, displacing 1.5 million gallons of oil annually, and reducing carbon emissions by more than 5,000 tonnes a year. Economic development: we provided the State University of New York at Canton (SUNY Canton) with a $750,000 Renewable Energy and Economic Development incentive to help with the completion of an on-campus wind turbine project. Rhode Island Infrastructure investment: we are planning to build the underground infrastructure to provide electricity to newly created land parcels following relocation of route I-195 in Providence ($3 million investment). | electricity efficiency and more than $44 million in benefits from natural gas efficiency). FERC Clean Line energy investment: Clean Line Energy Partners is developing several long-haul HVDC transmission lines to connect the best renewable energy resources to communities. Five projects are currently in development which span across states in the Midwest and Southwest US. We are an equity partner in these projects and the first utility to invest with Clean Line. DeepWater Wind: the 30 MW DeepWater Offshore Wind Farm, located off the coast of Block Island, Rhode Island is in development and could become the first offshore wind farm in the US. We are designing and constructing the approximately 20 mile submarine transmission cable from Narragansett, Rhode Island to Block Island, Rhode Island. The transmission cable will allow the energy generated by the wind farm to access the mainland Rhode Island customers and connect Block Island Power Company (BIPCo), which will become a new wholesale customer of National Grid, to the mainland electric system. While the wind farm will provide Rhode Island customers with a sustainable source of generation, the transmission cable will allow BIPCo to reduce its dependence on diesel generation which will result in significantly lower energy prices and emissions for the residents of Block Island. Priorities for the year ahead — Deliver a step change in safety to ensure zero injuries each day. — Develop our people and build their capabilities for today and the future. — Put the customer first to meet all our obligations by working towards process excellence and successfully completing our US Foundation Program (USFP). — Drive regulatory performance through each jurisdiction and lead the delivery of future energy networks. | National Grid US field operations crew leader Mark Harris. | ||||||||
Energy efficiency: Rhode Island energy efficiency programmes will result in savings of more than 1.6 million MWh of electricity and 4.37 million Dth of natural gas over the lifetime of installed measures. The resulting reduction in carbon emissions is equivalent to taking more than 186,700 motor vehicles off the road for one year. Gas expansion: the Rhode Island Public Utilities Commission (RIPUC) approved a $3 million gas expansion pilot programme to be included in the FY2014 Gas Infrastructure, Safety and Reliability (ISR) Plan. Economic development: energy efficiency programmes resulted in more than 540 full-time equivalent jobs and should generate economic benefits of more than $237 million over the life of the installed measures (with more than $190 million from |
| |||||||||
38 National Grid Annual Report and Accounts 2013/14 | ||||||||||||
Principal operations
Principal operations continued |
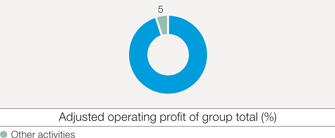
Other activities | ||||||||||||||
Grain LNG Grain LNG is one of three LNG importation facilities in the UK. It was constructed in three phases, We are exploring with customers Interconnectors The England-France interconnector is
BritNed is a joint venture between National Grid and TenneT, the Dutch transmission system
Metering National Grid Metering (NGM) provides installation and maintenance services to energy suppliers in the regulated market in Great Britain. It maintains an asset base of around 15 million domestic, industrial and commercial meters. Through Ofgem’s Review of Metering Arrangements, National Grid has been appointed National Metering Manager (NMM) to facilitate the transition to smart metering in the domestic sector. To support this, NGM has also undertaken a pricing consultation to define the tariff caps to apply to traditional domestic gas metering. This took effect on 1 April 2014 and will last until the end of the transition to smart metering. In addition, NGM has been further developing its
NGM has achieved its highest customer satisfaction scores for the last six years for both its Domestic and Industrial & Commercial businesses. | UK Property National Grid Property is responsible gas works. During Xoserve Xoserve delivers transactional services on behalf of all the major gas network transportation companies in Great Britain, including National Grid. Xoserve is jointly owned by National Grid, as majority shareholder, and the other gas distribution network companies. US non-regulated businesses Some of our US businesses are not subject to state or federal rate-making authority. These include interests in Corporate activities Corporate activities comprise central overheads, Group insurance and expenditure incurred on business development.
| |||||||||||||
 | ||||||||||||||

40 National Grid | ||||||||||||
Strategic Report | Corporate Governance | Financial Statements | Additional Information | 41 |
 |
|
Other activitiesVolunteering
The resultsOur employees continue to support our local communities, sharing their time and expertise on a range of skills-based volunteering and fundraising activities. This year in the UK we continued supporting Special Olympics GB by sponsoring the National Summer Games, launched our other activities for the years ended 31 March 2012, 2011first-ever employee chosen charity partnership with Macmillan Cancer Support and 2010 were as follows:
| Years ended 31 March | ||||||||||||
| 2012 £m | 2011 £m | 2010 £m | ||||||||||
Revenue | 715 | 678 | 741 | |||||||||
Operating costs excluding exceptional items | (527 | ) | (559 | ) | (595 | ) | ||||||
Adjusted operating profit | 188 | 119 | 146 | |||||||||
Exceptional items | 104 | (42 | ) | (87 | ) | |||||||
Operating profit | 292 | 77 | 59 | |||||||||
Principal movements (2009/10joined forces with two initiatives – 2011/12)Step up to Serve and TeachFirst.
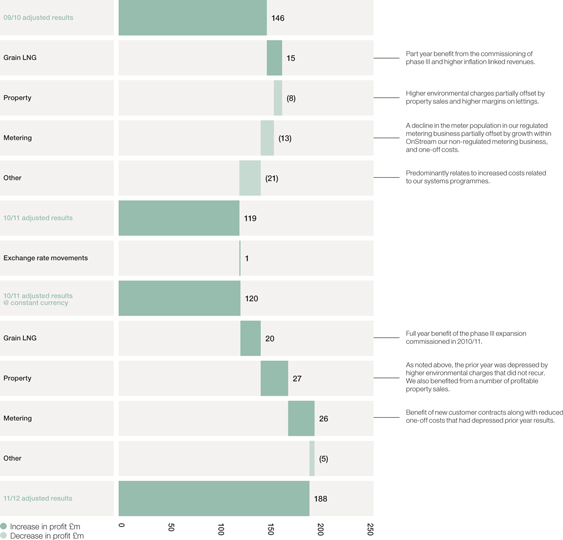

Annual ReportHealth and Accounts 2011/12National Grid plc71wellbeing
Business ReviewPromoting an inclusive and diverse workforce
We aim to develop and operate our business with an inclusive and diverse culture, with equal opportunity to all in recruitment, career development, training and reward. This applies to all employees regardless of race, gender, nationality, age, disability, sexual orientation, gender identity, religion and background. Where existing employees become disabled, our policy is to provide continued employment and training wherever practical. Our policies support the attraction and retention of the best people, improve effectiveness, deliver superior performance and enhance our success.
During 2013/14, Race for Opportunity and Opportunity Now each awarded us with their Gold standard and recognised us as one of the top 10 private sector employers in terms of their benchmark criteria. We were also once again selected as one of the Times Top 50 Employers for Women.
In the US, we have focused on boosting membership and awareness of our Employee Resource Groups, which have measurable goals that are in line with our vision and Elevate 2015 ambitions.
These groups aim to build awareness and understanding of inclusion and diversity throughout the organisation. Their activities include programmes designed to build skills that help manage differences.
The table below shows the breakdown by gender at different levels of the organisation. We have included information relating to subsidiary directors, as this is required by the Companies Act 2006 (Strategic Report and Directors’ Reports) Regulations 2013. We define ‘senior management’ as those managers who are at levels Executive –1 and Executive –2, as well as those who are directors of subsidiaries or who have responsibility for planning, directing or controlling the activities of the Company, or a strategically significant part of the Company, and are employees of the Company.
|
| |||||||||||||||||||||||
| Financial year ended 31 March 2014 | ||||||||||||||||||||||||
|
| |||||||||||||||||||||||
Male
| Female
| Total
|
% male
| %
| ||||||||||||||||||||
| ||||||||||||||||||||||||
Our Board | 9 | 4 | 13 | 69.2 | 30.8 | |||||||||||||||||||
Senior management | 182 | 56 | 238 | 76.5 | 23.5 | |||||||||||||||||||
Whole company
| 18,387 | 5,522 | 23,909 | 76.9 | 23.1 | |||||||||||||||||||
| ||||||||||||||||||||||||
Human rights National Grid does not have a specific policy relating to human rights, but respect for human rights is incorporated into our employment practices and our values, which include respecting others and valuing diversity.
‘Doing the Right Thing’ is our guide to ethical business conduct. The way in which we conduct ourselves allows us to build trust with the people we work with. We earn this trust by doing things in the right way, building our reputation as an ethical company that our stakeholders want to do business with, and that our employees want to work for.
Our procurement policies integrate sustainability into the way we do business throughout our supply chain, so that we create value, preserve natural resources and respect the interests of the communities we serve and from which we procure goods and services. Additionally, through our supplier code of conduct, we expect our suppliers to keep to all laws relating to their business, as well as the principles of the United Nations Global Compact, the United Nations Declaration of Human Rights and the International Labour Organization (ILO). |
| |||||||||||||||||||||||
The Strategic Report was approved by the Board of Directors on 18 May 2014 and signed on its behalf by: | |||||||||||||||||||||||||||||||||||||||||||||||||||||||||||||||||||||||||||||||||||||||||||||||||||||||||||||||||||||||||||||||||||||||||||||||||||||||||||||||||||||||||||||||||||||||||||||||||||||||||||||||||||||||||||||||||||||||||||||||||||||||||||||||||||||||||||||||||||||||||||||||||||||||||||||||||||||||||||||||||||||||||||||||||||||||||||||||||||||||||||||||||||||||||||||||||||||||||||||||||||
Group General Counsel & Company Secretary

page 56 | |||||||||||||||||||||||||||||||||||||||||||||||||||||||||||||||||||||||||||||||||||||||||||||||||||||||||||||||||||||||||||||||||||||||||||||||||||||||||||||||||||||||||||||||||||||||||||||||||||||||||||||||||||||||||||||||||||||||||||||||||||||||||||||||||||||||||||||||||||||||||||||||||||||||||||||||||||||||||||||||||||||||||||||||||||||||||||||||||||||||||||||||||||||||||||||||||||||||||||||||||||

42 National Grid | ||||||||||||
| Corporate | ||||||||
Governance | ||||||||
| Contents |  | |||||||
44 44 44 45 45 46 46 46 48 48 49 53 54 55 56 56 57 58 |
Director induction and development Board and committee evaluation Non-executive Director independence Safety, Environment and Health Committee | |||||||
Chairman’s foreword An effective Board is vital to the sound foundations of good corporate governance. Our Board has undergone a significant change over the last three years to refresh membership and replace long-serving Non-executive Directors. As part of this planned transition, this year we have welcomed Therese Esperdy and John Pettigrew to our Board and, following the AGM, Maria Richter will be stepping down from the Board. We will also be saying goodbye to Nick Winser, who will not be standing for re-election to the Board at the AGM, but will continue in his role as President of ENTSO-E and Chairman of NGET and NGG until July 2015 when he will be leaving the Company.
Through the progressive refresh of the Board we have successfully renewed the membership and key roles to bring a diverse range of skills and experience to our Board. I am pleased to report that the results of the Board evaluation this year were positive, showing that our regenerated Board is functioning well, although there is always room for improvement. See page 46 for examples of the actions we have identified for the coming year. All our new Board members undertake a thorough induction programme to get them up to speed on our businesses. The induction programme is tailored to the new Director to take account of previous experience and their specific role on the Board. I am confident that the programmes designed for Therese and John, which are detailed on page 45, will provide a good basis to enable them both to make a valuable early contribution to our Board. As a Board we continue to support constructive challenge, encourage robust debate and recognise the value of different thinking styles. During the year we held a development session for the Board on ‘thinking styles’, see page 45 for details. It is my strong belief that our ongoing emphasis on a positive and collegiate boardroom environment is helping the dynamics of the relationship between our Executive and Non-executive Directors. Because of this, we are able to increase the individual contribution of Directors and use their diverse backgrounds and expertise in enriching the quality of boardroom debates and discussions. The behaviours and dynamics of the Board will be an ongoing focus for us as we strive to continually improve our effectiveness and performance.
Sir Peter Gershon Chairman | ||||||||
| ||||||||
Strategic Report | Corporate Governance | Financial Statements | Additional Information | 43 |
|
|
In order to illustrate the impact that changes in assumptions could have on our results and financial position, the following sensitivities are presented:Our
|
|
Accounting developments
Annual Report and Accounts
| ||||||||||||
Corporate Governance continued |
|
I am fully committed to strong corporate governance practices and firmly believe in the benefits an effective board can bring to an organisation. It is evident to me that the Board, under the leadership of Sir John, made great progress in enhancing its effectiveness. However, we must not rest on our laurels, and I have been looking at ways to further improve it. As well as my own observations, I have discussed the Board’s operation and processes with each Director individually. For more information, see Board evaluation and effectiveness on page 82.
We have made changes to Board meeting agendas to ensure our Non-executive Directors have greater opportunity to support, challenge and add value, particularly on strategic issues. Further, our Non-executive Directors have committed to individually visit different sites to continuously broaden their understanding of the Company and meet our employees and contractors. We have also undertaken a comprehensive review of our risk appetite with a corresponding increase in our understanding of this important area.
As a priority following my appointment, I have worked with the Nominations Committee to review the evolution of the Board and Committee composition, in light of the longevity of service of several of our Non-executive Directors and noting in particular the strategic challenges and opportunities our Company faces. We have identified the balance of skills, experience, capabilities, independence, diversity and knowledge of the Company required on the Board and its Committees against which future appointments will be made, see page 81 for more details on Board transition.
As part of this succession planning process, which should complete in July 2014, we are delighted to welcome Ruth Kelly, Paul Golby and, with effect from 1 June 2012, Nora Brownell to our Board. During 2012, we will be saying goodbye to Stephen Pettit and Linda Adamany and thank them for their committed service to the Board. The phased recruitment and induction of new Non-executive Directors facilitates a structured handover and allows us to retain essential experience and knowledge to ensure continuity during a period of change. I am confident our Non-executive Directors retain independent character and judgement and continue to play an essential role in the composition of our Board due to the skills and expertise they bring. For more information on the diversity of our Board see pages 10 and 11.
I look forward to leading the Board through this period of transition and overseeing the changes ahead to further strengthen our corporate governance.

Sir Peter Gershon
Chairman
We are committed to operating our businesses in a responsiblelong-term success of the Company and deliver sustainable manner. Our corporate governance framework forms an integral part of this approach in order to safeguard shareholder value.
Compliance statement The Board considers that it complied in full with the provisions of the UK Corporate Governance Code 2012 (the Code) during the financial year being reported, see page 51 for our explanation in relation to external audit tendering. | The Board sets the risk appetite for the Company and takes the lead in areas such as safeguarding the reputation of the Company and financial policy, as well as making sure we maintain a sound system of internal control (see page 25). The Board as a whole is responsible for making sure that there is satisfactory dialogue with shareholders. Further details of our investor engagement activities are set out opposite. The Board’s full responsibilities are set out in the matters reserved for the Board, available on our website, together with other documentation relating to the Company’s governance. Examples of Board focus during the year: | |||||||
| ||||||||
This report explains keythe main features of the Company’s governance structure to providegive a greater understanding of how the main principles of the Code have been applied and to highlight areas of focus during the year.applied. The report also includes items required by the Disclosure and Transparency Rules. The location within the Annual Report and Accounts ofindex on page 57 sets out where to find each of the disclosures required in the Directors’ Report together with the Board’s sign-off on the report.
Fair, balanced and understandable
The Board received a paper on the governance arrangements that have been put in place to make sure that the Annual Report and Accounts meet the requirements of the Code.
The coordination and review of the Annual Report and Accounts follows a well-established and documented process, which is conducted in parallel with the formal audit process undertaken by the external auditors. The Board considered and endorsed the arrangements in place to enable it to confirm (see page 76) that the Annual Report and Accounts, taken as a whole, is fair, balanced and understandable.
Our Board is set out on the previous page, along with the age, committee membership, independence, and tenure of all members. Their full biographical details are set out on pages 171 to 173.
The Directors who were in place during the year are shown on page 48, together with details of Board meeting attendance. Committee membership during the year and attendance at meetings is set out in the index at the topeach of the following page. Our business model is explained onindividual committee reports later in this report. For further details about the Directors’ service contracts and letters of appointment, see page 14 as required by the Code.
A full description65 of the matters reservedRemuneration Report.
— review of safety performance and initiatives following the previously reported fatality in April 2013;
— half-day strategy session including discussions on technology developments and the differences between the UK, European and US markets, followed by further discussions about strategy at Board meetings;
— risk workshop in support of the Board’s oversight of corporate risk management;
— updates on RIIO delivery and the UK business change programme;
— US Foundation Program post systems implementation review and regular updates;
— UK regulatory update, including future energy scenarios and EMR delivery plan;
— update on the politics of UK energy, including the increased profile of the Company in the run-up to the Board, together with other documentationnext UK general election;
— in-depth US operational update on topics central to the delivery of the US business strategy;
— talent management update, including important elements of our strategy relating to people;
—the Company’s governance, is available on our website.results from the 2013 employee opinion survey and the associated action plan; and
— progress against the actions arising from the 2012/13 Board and committee evaluation.
Examples of changes during the year
The role of the Senior Independent Director has been updated during the year, and the Board has increased its focus on risk matters, see pages 40 to 47.
Additionally, a project was undertaken to formulate revised global delegations of authority which set out the processes for decision- making within the Company. Over time, the existing delegations had become complex, making it difficult to interpret quickly the correct delegation of authority requirement for decision-making. The principles of the simplified processes and guidance, which also incorporated consideration of risk, were approved by the Executive Committee and then the Board in January 2012. The revised framework came into effect from 1 April 2012 following a period of training and communication and applies equally to the UK and US.
80National Grid plcAnnual Report and Accounts 2011/12
www.nationalgrid.com
| Directors’ Report statutory and other disclosures (starting on page indicated) | |||||||||||||||||||||
| 107 | Annual General Meeting | 184 | Conflicts of interest | 14 | Future developments | expenditure | ||||||||||||||||
| 186 | Articles of Association | 24 | Contractual and other | 40 | Internal control | 185 | Post balance sheet events | |||||||||||||||
| 89 | Audit information | arrangements | 184 | Material interests in shares | 14 | Principal activities and | ||||||||||||||||
| 8 | Board of Directors | 184 | Directors’ indemnity | 32 | People | business review | ||||||||||||||||
| 184 | Change of control provisions | 103 | Directors’ share interests | 185 | Policy and practice on | 185 | Research and development | |||||||||||||||
| 184 | Charitable donations | 58 | Dividends | payment of creditors | 40 | Risk management | ||||||||||||||||
| 184 | Code of Ethics | 74 | Financial instruments | 185 | Political donations and | 107 | Share capital | |||||||||||||||
The Board reserves a number of matters for its sole consideration where these matters impact the strategic direction, effective oversight and reputation of the Company and its businesses.
Board focus during the year
|
|
|
|
|
|
|
|
|
|
Expectedexpected Board focus for next yearyear:
|
Our Chairman is responsible for the leadership and management of the Board and its governance. By promoting a culture of openness and debate, he facilitates the effective contribution of all Directors and helps maintain constructive relations between Executive and Non-executive Directors. Our Chief Executive is responsible for the executive leadership and day-to-day management of the Company, to ensure the delivery of the strategy agreed by the Board. Through his leadership of the Executive Committee, he demonstrates commitment to safety, operational and financial performance. | — annual review of safety activities; — continued detailed review of strategy and financing; — risk appetite discussions; — progress on the stabilisation of the new enterprise resource system and updates on the US Foundation Program; — review of the business performance under RIIO; — outcome of the New York gas audit; — talent review and succession planning; — results and actions from the 2014 employee opinion survey; and — progress against the actions from the 2013/14 Board and committee evaluation. |
|
Our Senior Independent Director acts as a sounding board for the Chairman and serves as an intermediary for the other Directors, as well as shareholders as required. Independent of management,our Non-executive Directors bring diverse skills and experience, vital to constructive challenge and debate. Exclusively, they form the Audit, Nominations and Remuneration Committees, and have an important role in developing proposals on strategy. |
|
|
|
|
|
|
|
Sir Peter joinedThe successful delivery of our strategy depends upon attracting and retaining the Board on 1 August 2011 as Deputy Chairman and assumed the role of Chairman on 1 January 2012 when Sir John Parker stepped down. Additionally during the year, Ruth Kelly and Paul Golby joined the Board as Non-executive Directors and John Allan stepped down. The Directors during the year are set out on page 85.
In their deliberations, the Nominations Committee and the Board consider balance asright talent. This starts with having a keyhigh-quality Board. Balance is an important requirement for the composition of the Board, not only in terms of the number of ExecutivesExecutive and Non-executives,Non-executive Directors, but also with regard toin terms of the mixrange of expertise and backgrounds.
Role of our Board
While traditional diversity criteria such as gender and ethnicity are important, we also value diversity of skills, experience knowledge, independence and diversity. knowledge. You can read about our Board diversity policy in the Nominations Committee report on page 55.
Strategic Report | Corporate Governance | Financial Statements | Additional Information | 45 |
46 National Grid Annual Report and Accounts 2013/14 | ||||||||||||
Corporate Governance continued |
| Corporate Governance
|
| Additional Information
|
| ||||||||||||||||||||||||||||||||||||||||||||||||||||||||||||||||||||||||||||||||||||||||||||||||||||||||||||||||||||||||||||||||||||||||||||||||||||||||||||||||||||||||||||||||||||||||||||||||||||||||||||||||||||||||||||||||||||||||||||||||||||||||||||||||||||||||||||||||||||||||||||||||||||||||||||||||||||||||||||||||||||||||||||||||||||||||||||||||||||||||||||||||||||||||||||||||||||||||||||||||||||||||||||||||||||||||||||||||||||||||||||||||||||||||||||||||||||||||||||||||||||||||||||||||||||||||||||||||||||||||||||||||||||||||||||||||||||||||||||||||||||||||||||||||||||||||||||||||||||||||||||||||||||||||||||||||||||||||||||||||||||||||||||||||||||||||||||||||||||||||||||||||||||||||||||||||||||||||||||||||||||||||||||||||||||||||||||||||||||||||||||||||||||||||||||||||||||||||||||||||||||||||||||||||||||||||||||||||||||||||||||||||||||||||||||||||||||||||||||
| ||||||||||||||||||||||||||||||||||||||||||||||||||||||||||||||||||||||||||||||||||||||||||||||||||||||||||||||||||||||||||||||||||||||||||||||||||||||||||||||||||||||||||||||||||||||||||||||||||||||||||||||||||||||||||||||||||||||||||||||||||||||||||||||||||||||||||||||||||||||||||||||||||||||||||||||||||||||||||||||||||||||||||||||||||||||||||||||||||||||||||||||||||||||||||||||||||||||||||||||||||||||||||||||||||||||||||||||||||||||||||||||||||||||||||||||||||||||||||||||||||||||||||||||||||||||||||||||||||||||||||||||||||||||||||||||||||||||||||||||||||||||||||||||||||||||||||||||||||||||||||||||||||||||||||||||||||||||||||||||||||||||||||||||||||||||||||||||||||||||||||||||||||||||||||||||||||||||||||||||||||||||||||||||||||||||||||||||||||||||||||||||||||||||||||||||||||||||||||||||||||||||||||||||||||||||||||||||||||||||||||||||||||||||||||||||||||||||||||||||||
Corporate Governance continued |
|
John Allan (vi)
Other attendees:
— Chief Executive;
— Company Secretary & General Counsel;
— director of UK safety, sustainability and resilience;
— US senior vice president safety, health, environmental services;
— director of corporate audit; and
The Chairman sets the Board’s agenda in line with its responsibilities and role as set out in the matters reserved for the Board, and the main challenges and opportunities facing the Company, making sure adequate time is available to discuss all items, including strategic issues. To support discussion and decision making, Board and committee members receive papers sufficiently in advance of meetings so that they can prepare for and consider agenda items. Additionally, the Chairman holds a short meeting with the Non-executive Directors before and after each Board meeting to discuss the focus of the upcoming meeting and afterwards to share feedback and discuss any outstanding matters. A one-page executive summary for non-standard papers provides information and clarity around the contribution or action required. Where appropriate, subject matter experts give presentations and provide the opportunity for Directors to ask questions. Board membership and attendance Board membership and attendance at meetings are set out below. Attendance is expressed as the number of meetings attended out of the number possible or applicable for the individual Director during the year to 31 March 2014. Committee membership during the year and attendance at meetings is set out in each of the individual committee reports later in this report. Instances of non-attendance during the year at Board and committee meetings were determined to be reasonable due to the individual circumstances. Should any Director not be able to attend a Board or committee meeting, the Chairman and committee chairman are informed and the absent Director is requested to communicate opinions and comments on the matters to be considered. The Board delegates authority to its committees to carry out certain tasks on its behalf, so that it can operate efficiently and give the right level of attention and consideration to relevant matters. The role and responsibilities of the committees are set out in their terms of reference, available on our website. The committee structure and delegation and reporting lines are set out in the diagram below. In addition to the vertical lines of responsibility and reporting, the committees communicate and work together where required. For example, on some risk matters the Safety, Environment and Health (SEH) Committee collaborates with the Audit Committee. These lines of communication are shown in the diagram below. Committee agendas and schedules of items to be discussed at future meetings are prepared in line with the terms of reference of each committee. At committee meetings, items are discussed and, as appropriate, matters are endorsed, approved or recommended to the Board by the committee. The chairman of each committee provides the Board with a summary of the main decisions and discussion points so the non-committee members are kept up to date. Below the Board committees are a number of management committees, including the Executive Committee. The Executive Committee has responsibility for making management and operational decisions about the day-to-day running of the Company. Further information on some of the management committees, including the membership and operation of the Executive Committee, is set out on pages 56 and 57. Reports from each of the Board committees together with details of their activities during the year, are set out on the following pages. Name Attendance Sir Peter Gershon Steve Holliday Andrew Bonfield Tom King John Pettigrew1 Nick Winser Phillip Aiken Nora Mead Brownell Jonathan Dawson Therese Esperdy2 Paul Golby Ruth Kelly Maria Richter Mark Williamson 11 of 11 Ken Harvey3 George Rose3 4 of 4 1. John Pettigrew was appointed to the Board with effect from 1 April 2014. 2. Therese Esperdy was appointed to the Board with effect from 18 March 2014. 3. George Rose and Ken Harvey stepped down from the Board with effect from 29 July 2013. Strategic Report Corporate Governance Financial Statements Additional Information 49— the Chairman, other Executive Directors and corporate affairs director, as appropriate.11 of 11 10 of 11 11 of 11 11 of 11 0 of 0 10 of 11 11 of 11 10 of 11 11 of 11 1 of 1 11 of 11 11 of 11 11 of 11 3 of 4 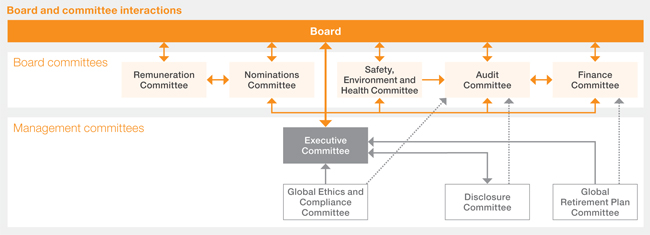
Helen MahyCompany Secretary & General Counsel11 of 11 Other attendees:— global director of tax and treasury;— head of group tax;— head of risk and insurance, global head of pensions, vice president US treasury and external advisors as appropriate; and— the Chairman and management, as appropriate.George Mayhewcorporate affairs director11 of 11 Mike Westcottglobal human resources director10 of 11 Alison Woodglobal director of strategyand business development11 of 11 Other attendees:Senior management as necessary to keep the Committee fully apprised of the Company’s businesses.
Role Oversees the Company’s financial reporting, and internal controls and their effectiveness, together with the procedures for identifying, assessing and reporting risks. It also oversees the services provided by the external auditors and their remuneration. Review of the year My first eight months as chairman have been busy but enjoyable. Last July we said goodbye to George Rose and this July Maria Richter will be stepping down from the Board. I would like to thank them both for their contribution to the Committee. In particular to George for his guidance and support during his handover to me. As a committee we have held six meetings during the year, two of which were held in the US, providing all members with the opportunity to meet our US teams. Following last year’s committee performance evaluation, we now also meet privately after some of our longer meetings. We use this time to review the meeting and discuss how we can evolve and make our meetings more effective. The Committee’s main focus has been the US finance function and ongoing improvement of the new enterprise resource system. The Committee has received regular reports throughout the year from the Finance Director and US Chief Financial Officer. The UK finance team has provided valuable support to the US team and I visited the US with the Finance Director and Group Financial Controller in January to review progress and priorities for 2014. The work on stabilisation of the systems also coincided with the LIPA MSA transition. This was an important milestone in the overall US financial control program. With the start of RIIO, the Committee received a paper from the UK finance team on the accounting implications of this new arrangement and its impact on the financial control environment. We also reviewed the disclosures within this Annual Report to ensure they provide a fair, balanced and understandable view in the context of current accounting standards. Next year is also looking busy with an ongoing focus on the enterprise resource system and continual improvement in processes and controls around these systems.
Mark Williamson Committee chairman | Significant issues Some of the significant issues the Audit Committee considered in relation to the financial statements during the year set out below are explained in more detail later in the report: Ÿ US financial controls program; Ÿ LIPA MSA transition contract accounting; Ÿ presentation of exceptional items; and Ÿ fair, balanced and understandable assessment. Other matters reviewed Examples of other matters the Audit Committee reviewed: Ÿ accounting for RIIO; Ÿ the enhanced disclosures required by International Auditing Standard (UK and Ireland) 700; Ÿ the Company’s refreshed approach to going concern following the publication of the Sharman Report; Ÿ the increased work involved to support the LIPA MSA transition; Ÿ the revised Certificate of Assurance process; Ÿ Sarbanes-Oxley Act 2002 testing and attestations; Ÿ external reporting obligations and the programme to improve the Company-wide framework; Ÿ a revised ethical business conduct process for Directors and executive members; and Ÿ a proposed revised approach to risk reporting. Committee membership and attendance Committee membership during the year and attendance at meetings is set out below. Attendance is expressed as the number of meetings attended out of the number possible or applicable for the individual Director during the year to 31 March 2014. Biographical details and experience of Committee members are set out on pages 171 to 173. | |||||||||||||
Name
Attendance
84National Grid plcAnnual Report and Accounts 2011/12Mark Williamson (chairman)1
www.nationalgrid.com
| ||||||||||||||||
6 of 6 |
| |||||||||||||||
| ||||||||||||||||
| ||||||||||||||||
|
| |||||||||||||||
|
| |||||||||||||||
|
| |||||||||||||||
|
| |||||||||||||||
|
| |||||||||||||||
|
| |||||||||||||||
|
| |||||||||||||||
|
| |||||||||||||||
| ||||||||||||||||
| ||||||||||||||||
|
|
| ||||||||||||||
| ||||||||||||||||
|
|
| ||||||||||||||
|
|
| ||||||||||||||
|
|
| ||||||||||||||
|
|
| ||||||||||||||
|
|
| ||||||||||||||
|
|
| ||||||||||||||
|
|
| ||||||||||||||
|
|
| ||||||||||||||
| ||||||||||||||||
| ||||||||||||||||
| ||||||||||||||||
| ||||||||||||||||
| ||||||||||||||||

Annual Report and Accounts 2011/12National Grid plc85
Corporate Governance
Corporate Governance continued
|
|
|
86National Grid plcAnnual Report and Accounts 2011/12Philip Aiken
www.nationalgrid.com
|
|
|
|
|
|

Annual Report and Accounts 2011/12National Grid plc875 of 6
Corporate Governance
Corporate Governance continued
Ruth Kelly | 6 of 6 | ||||||||||||
Maria Richter | 6 of 6 | ||||||||||||
George Rose2 | 2 of 2 | ||||||||||||
1. Chairman from July 2013. | |||||||||||||
2. George Rose stepped down from the Board with effect from 29 July 2013. | |||||||||||||
| |||||||||||||
Experience
Mark Williamson took over as chairman of the Audit Committee following the 2013 AGM. The Board has determined that George RoseMark:
Ÿ has recent and relevant financial experience andexperience;
Ÿ is a suitably qualified audit committee financial expert within the meaning of the SEC audit committee financial expert requirements. The Board also considers George to berequirements; and
Ÿ is independent within the meaning of the New York Stock Exchange listing rules.
The composition of the Committee during the year is set out on page 85, with biographical details
50 National Grid Annual Report and | ||||||||||||
Corporate Governance continued |
Financial reporting The Committee
An important factor in These considerations are The Committee reviews and approves the external audit plan annually (see Audit quality below) and, as part of this, considers the significant risks upon which the external auditors — US financial controls program (including quality of reconciliation process, US plant accounting and user access controls); — LIPA MSA transition contract accounting; and — presentation of exceptional items. Other risks, including the accuracy and valuation of treasury derivative transactions, and management override of internal control, were not considered in detail by the Committee during the year as nothing significant arose that warranted Committee attention. Summarised below are the issues that attracted the most focus, and time, of the Committee in relation to the financial statements during the year. US financial controls program: the primary focus of the Committee during the year has been the work to make sure of the integrity of the new financial system in the US. This included the measures taken to remediate US financial control deficiencies and those highlighted as a result of the implementation of the new enterprise resource system. Over the course of the year, the Committee requested and reviewed a number of reports in order to understand the detail of the issues. These issues include the timeliness and quality of certain balance sheet account reconciliations, and the process and systems to ensure appropriate capitalisation of labour costs. The Committee has also challenged and reviewed management’s remediation plans and the design of compensating controls, including enhanced analytical reviews to make sure the Company maintains an effective internal control environment over financial reporting. Given the significance of this LIPA | professionals, as well as to provide a new enterprise resource system to LIPA. The Committee reviewed the Presentation of exceptional items: at the half year and year end, the Committee discussed and challenged a detailed analysis of items to be classified as exceptional to make sure the items did not include income or costs relating to the
In particular, the Committee considered the treatment of the Fair, balanced and understandable assessment: the In reaching this conclusion the Committee reviewed, among other things, the impact of the Confidential reporting procedures and whistleblowing The integrity of the financial statements is further supported by the confidential reporting and whistleblowing procedures we have in place. The Committee reviews these procedures once a year to Internal The Audit work is delivered by a combination of internal resources – employees who typically have either a finance or operational business background – and external sources, where specific specialist skills are required. The audit plan contains a mix of risk-based and cyclical reviews together with a small amount of work that is mandated, typically by US regulators. A number of focus areas are identified, such as financial, regulatory and asset management processes. Appropriate coverage is provided across each of these areas. Inputs to the plan include risk registers, corporate priorities, external research of emerging risks and trends and discussions with senior management. A tool that captures all auditable areas, prior coverage and inherent process risk is also The plan is reviewed and Corporate Audit provides a twice-yearly report to the Audit Committee. The report summarises common control themes arising and Where specific control issues |
| Corporate Governance | Financial Statements | Additional Information | 51 |
www.nationalgrid.com
External audit The Committee is responsible for overseeing relations with the external auditors, including the approval of fees, and makes recommendations to the Board on their appointment reappointment. Details of total remuneration Auditor independence and objectivity The independence of the external auditors is essential to the provision of an objective opinion on the true and fair view presented in the financial statements. Auditor independence and objectivity is
Audit quality To maintain audit quality and provide comfort on the integrity of financial reporting, the Committee reviews and challenges the proposed external audit plan to The Committee also considers PwC’s response to accounting, financial control and audit issues as they arise, and meets with them at least annually without management present, providing the external auditors with the opportunity to raise any matters in confidence. Auditor appointment An annual review is conducted by the Committee of the level and constitution of the external audit and non-audit fees and the effectiveness, independence and objectivity of the external auditors. The annual review includes consideration of:
Following this year’s annual review, the Committee is satisfied with the effectiveness, independence and objectivity of the external auditors, Audit tender PwC have been the Company’s external auditors since the merger with Lattice Group plc in 2002, having been the incumbent external auditors of both the merging parties and the audit contract has not been put out to tender since then. Their performance has been reviewed annually by the Committee since that time. During the year the Committee spent time discussing a potential tender for the external audit, following the new requirement on audit tendering and rotation of auditors. The Committee The Committee considered the additional disruption that both an audit The Committee concluded that a tender is not in the There are no contractual obligations restricting our choice of external auditors and | ||||||||||||||||||||||||
Non-audit services provided by the external auditors Non-audit services provided by the external auditors require approval by the Committee. Approval is given on the basis the service will not compromise independence and is a natural extension of the audit or if there are overriding business or efficiency reasons making the external auditors most suited to provide the service. Certain services are prohibited from being performed by the external auditors, as required under the SOX Act. Total non-audit services provided by PwC during the year ended 31 March 2014 were £1.7 million (2013: £2.3 million), which comprised 15% (2013: 23%) of total audit and audit-related fees. Total audit and audit-related fees include the statutory fee and fees paid to PwC for other services that the external auditors are required to perform, for example regulatory audits and SOX Act attestation. Non-audit fees represent all other services provided by PwC not included in the above. Significant non-audit services provided by PwC in the year included the review of US pensions and other post-retirement benefits census data (£0.5 million) and tax compliance services in territories other than the US (£0.5 million). PwC were engaged to review census data used in US pensions and other post-retirement benefit calculations and advise on enhancements to procedures and controls surrounding census data completeness and accuracy. The Committee considered PwC best placed to provide this service given their in-depth understanding of our processes and control environment. In order to maintain the external auditors’ independence and objectivity, the work was performed by a team independent of the audit team, management reviewed and considered PwC’s findings and PwC did not make any decisions on behalf of management. Additionally, PwC had no input in respect of the production of financial information subsequently used by the audit team. The Committee also considered that tax compliance services were most efficiently provided by the external auditors, as much of the information used in preparing computations and returns is derived from audited financial information. In order to maintain the external auditors’ independence and objectivity, management reviewed and considered PwC’s findings and PwC did not make any decisions on behalf of management. |
52 National Grid Annual Report and Accounts 2013/14 | ||||||||||||
Corporate Governance continued |
Audit information Having made the requisite enquiries, so far as the Directors in office at the date of the approval of this report are aware, there is no relevant audit information of which the auditors are unaware and each Director has taken all reasonable steps to make themselves aware of any relevant audit information and to establish that the auditors are aware of that information. Internal control, risk and compliance We regularly consider To continuously improve and remain at best practice levels, the risk management team reviews risk process standards, emerging trends and concepts being driven by the main consultancy firms and seeks to apply these as appropriate. The standards issued by the Committee of Sponsoring Organizations of the Treadway Commission (COSO) and the international risk standard ISO 31000 continue to inform the principles of our risk management process. Specific improvements delivered during the year, The scope of risk The Board has participated in Details of our internal control and risk management systems, including over the financial reporting process Compliance management The Global Ethics and Compliance team has continued to focus on promoting improved consistency of reporting on control frameworks across the compliance The Committee asked for a review of the | Going concern Having made enquiries and reviewed management’s assessment of the
In accordance with the draft recommendations of the updated Financial Reporting Council guidance on going concern and liquidity risk, we have reviewed and amended our going concern assessment process.
Our process is an extension of our business planning process, and is further supplemented by our annual budget and other liquidity risk management controls. Our five year business plan and one year budget were reviewed and approved by the Board at its meetings in September 2013 and March 2014 respectively. The Finance Committee provides ongoing oversight of our liquidity policy, which requires us to maintain sufficient liquidity for a rolling 12 month period. In light of our refreshed approach, we have reconsidered what the most appropriate ‘foreseeable future’ period is. Given our business model, current regulatory clarity and other factors affecting our operating environment, and the robustness of our business planning process and scenario analysis, we have concluded the foreseeable future period is the five years ending 31 March 2018, in line with our business plan. This period is considered to be the ‘foreseeable future’ as required for this going concern assessment only, and is in accordance with company law, accounting standards and the Listing Rules. We will reassess this period annually in light of developments in our operating environment, business model and strategic priorities. Our business plan considers the significant solvency and liquidity risks involved in delivering our business model in light of our strategic priorities. The business plan models a number of upside and downside scenarios, derived from the risks and opportunities identified, and determines the impact these would have on our results and financial position over the five year period. In addition, we have reviewed and challenged a number of worst case scenarios and their possible remediation. Our business model calls for significant capital investment to maintain and expand our network infrastructure. To deliver this, our business plan highlights that we will need to access capital markets to raise additional funds from time to time. We have a long and successful history in this regard; however, our business plan also models various KPIs used by lenders and credit rating agencies in assessing a company’s credit worthiness. These models indicate that we should continue to have access to capital markets at commercially acceptable interest rates throughout the five year period. To monitor and control risks around access to capital markets we have policies and procedures in place to help mitigate, as far as possible, any risk of a change in our credit ratings and other credit metrics. More detail on our financial risks, including liquidity and solvency, is provided in note 30 to the consolidated financial statements. There have been no major changes to the Group’s significant liquidity and solvency risks in the year. |
Strategic Report | Corporate Governance | Financial Statements
| Additional Information
|
|
Role Sets policy and
Review of the year The Finance Committee was established in 2002 to focus on the Company’s debt book to make sure these matters were given the necessary attention. Following a number of new Non-executive Directors joining the Board in 2012/13, a presentation on the work and remit of the Committee was given to the Board in April 2013. The presentation focused on the risks inherent in the areas the Finance Committee covers namely, treasury activities, insurance, pensions and tax. The presentation aimed to help all Directors understand the role and responsibilities of the Committee. During the year, external advisors have given presentations to the Committee on matters such as capital markets, the results of a debt investor survey and the current state of banks. Additionally, information was circulated between meetings to make sure the Committee was kept fully briefed. This year, we continued to focus on funding plans to take into account international debt market conditions. The Committee received regular reports on treasury, tax, insurance, pensions and commodity activities to keep us advised of progress and we approved recommendations where appropriate. In July, after seven years as chair of this Committee, I will be stepping down from the Board. I have been working closely with Therese to ensure a smooth handover of responsibilities. I have no doubt the Committee will continue to perform effectively and evolve under Therese’s leadership.
Maria Richter Committee chairman | Matters considered Examples of matters the Committee considered during the year include: | |||||||||||||||||||||||
| — | long-term funding requirements; | |||||||||||||||||||||||
| — | setting and reviewing treasury policies; | |||||||||||||||||||||||
| — | treasury performance updates provided at each meeting; | |||||||||||||||||||||||
| — | UK and US tax updates; | |||||||||||||||||||||||
| — | activities of the Energy Procurement Risk Management Committee in the US; | |||||||||||||||||||||||
| — | activities of the Incentive Risk Management Committee in the UK; | |||||||||||||||||||||||
| — | credit rating agencies’ views on the Company; | |||||||||||||||||||||||
| — | foreign exchange policy; | |||||||||||||||||||||||
| — | pensions updates, in particular funding of the Company’s pension deficits; and | |||||||||||||||||||||||
| — | insurance renewal strategy. | |||||||||||||||||||||||
Committee membership and attendance Committee membership during the year and attendance at meetings is set out below. Attendance is expressed as the number of meetings attended out of the number possible or applicable for the individual Director during the year to 31 March 2014. | ||||||||||||||||||||||||
| Name | Attendance | |||||||||||||||||||||||
| Maria Richter (chairman) | 4 of 4 | |||||||||||||||||||||||
Steve Holliday | 4 of 4 | |||||||||||||||||||||||
Andrew Bonfield | 4 of 4 | |||||||||||||||||||||||
Jonathan Dawson | 4 of 4 | |||||||||||||||||||||||
Therese Esperdy1 | 0 of 0 | |||||||||||||||||||||||
Ruth Kelly | 4 of 4 | |||||||||||||||||||||||
Mark Williamson2 | 1 of 1 | |||||||||||||||||||||||
1. | Therese Esperdy was appointed to the Committee with effect from 18 March 2014. | |||||||||||||||||||||||
| 2. | Mark Williamson stepped down following his appointment as chairman of the Audit Committee on 29 July 2013. | |||||||||||||||||||||||
54 National Grid Annual Report and Accounts 2013/14 | ||||||||||||
Corporate Governance continued |
Safety, Environment and Health Committee
Role In relation to safety, environment and health, the Committee reviews the strategies, policies, initiatives, risk exposure, targets and performance of the Company and, where appropriate, of its suppliers and contractors. It monitors the resources we use for compliance and driving improvement in these areas. The Committee also reviews investigations into major incidents and subsequent measures taken. Review of the year In terms of safety, our focus over the past year has again been on process safety. This includes the progress made, following the introduction of the new safety management system, in managing major hazard assets across our businesses, as well as the work required for the Company to become an industry leader in this area. In particular, we have reviewed in depth the risks relating to our US LNG assets and the introduction of a new decision support tool for managing risks on gas transmission pipelines. We have also begun a review of the interfaces between our IT systems and safety processes. Following a fatality and other incidents involving contractors in the US gas distribution business, we spent time with senior local management considering what measures needed to be put in place to promote a culture of safety among both employees and contractors and prevent a reoccurrence. In relation to environmental matters, we have continued to monitor the Company’s strategy and approach to sustainability. In particular, we have looked at projects the Company is engaged in to reuse and recycle our resources such as overhead line conductors. We have also reviewed the Company’s 2012 to 2016 Health and Wellbeing strategy. This includes a focus on mental wellbeing and how this affects not only employees’ absence, but also their levels of performance and engagement at work and in their home life. The Company is working to identify business areas most susceptible to workplace pressure that may impact employees’ mental wellbeing. We have started to provide training and information to reduce the stigma associated with mental illness as well as developing and promoting access to health and wellbeing support and treatment for affected employees.
Philip Aiken Committee chairman | Matters considered Examples of matters the SEH Committee reviewed during the year include: | |||||||||||
| — | ongoing monitoring of safety performance and significant incidents in both the US and UK; | |||||||||||
| — | lessons learnt and steps taken following a contractor fatality in the US in April 2013; | |||||||||||
| — | update on the UK and US safety and environment strategy, leadership and governance processes, looking at work done to coordinate approaches in the two regions. This includes the establishment of a Group-level safety, environment and health management committee which meets monthly and reports to the Executive Committee; | |||||||||||
| — | Group-wide employee process safety culture survey results; | |||||||||||
| — | audit of asbestos legislation compliance across the UK business; | |||||||||||
| — | review of procedures for detecting gas mains in the US; | |||||||||||
| — | consideration of the Company’s risk appetite in the context of safety; and | |||||||||||
| — | climate change strategy, including performance against emissions targets and carbon budgets. | |||||||||||
Committee membership and attendance Committee membership during the year and attendance at meetings is set out below. Attendance is expressed as the number of meetings attended out of the number possible or applicable for the individual Director during the year to 31 March 2014. | ||||||||||||
| Name | Attendance | |||||||||||
| Philip Aiken (chairman) | 5 of 5 | |||||||||||
Andrew Bonfield1 | 0 of 0 | |||||||||||
Nora Mead Brownell | 5 of 5 | |||||||||||
Paul Golby | 5 of 5 | |||||||||||
| Ken Harvey2 | 2 of 2 | |||||||||||
1. | Andrew Bonfield was appointed to the Committee with effect from 27 March 2014. | |||||||||||
| 2. | Ken Harvey stepped down from the Board with effect from 29 July 2013. | |||||||||||
Strategic Report | Corporate Governance | Financial Statements | Additional Information | 55 |
Role Responsible for considering the structure, size and composition of the Board and committees, and succession planning. It also identifies and proposes individuals to be Directors and executive management reporting directly to the Chief Executive, and establishes the criteria for any new position. Review of the year The Board is now in the final stages of its phased transition that commenced in 2011. Most recently we have welcomed Therese Esperdy and John Pettigrew to our Board and, following the AGM, Maria Richter will be stepping down from the Board. Nick Winser will also step down from the Board at this time, but will continue in his role as President of ENTSO-E and Chairman of NGET and NGG until July 2015 when he will be leaving the Company. Following the changes in Board membership, the composition of the committees was reviewed and updated to reflect the new balance of skills, knowledge and experience on the Board. Diversity of background, thinking styles and expertise have been important criteria in the transition of the Board. During the year the
Examples of matters the Nominations Committee considered during the year include: | |||||||||||||||||||||||||||||||||||||||||||||||||||||||||||||||||||||||||||||||||||||||||||||||||||||||||||||||||||||||||||||||||||||||||||||||||||||||||||||||||||||||||||||||||||||||||||||||||||||||||||||||||||||||||||||||||||||||||||||||||||||||||||||||||||||||||||||||||||||||||||||||||||||||||||||||||||||||||||||||||||||||||||||||||||||||||||||||||||||||||||||||||||||||||||||||||||||||||||||||||||||||||||||||||||||||||||||||||||||||||||||||||||||||||||||||||||||||||||||||||||||||||||||||||||||||||||||||||||||||||||||||||||||||||
—
At National Grid, we believe that creating an inclusive and diverse culture supports the attraction and retention of talented people, improves effectiveness, delivers superior performance and enhances the success of the Company. Our Board diversity policy promotes this and reaffirms our aspiration to meet and exceed the target of 25% of Board positions being held by women by 2015, as set out by Lord Davies. We currently have 28% women on our Board, which will change to 25% on the departure of Maria Richter and Nick Winser, and 20% women on our Executive Committee. The During the year the Committee — the Board aspires to exceed the target of 25% of Board positions to be held by women by 2015; — all Board appointments will be made on merit, in the context of the skills and experience that are needed for the Board to be effective; | — we will only engage executive search firms who have signed up to the voluntary code of conduct on gender diversity; — where appropriate, we will assist with the — where appropriate, we will continue to — we will review our progress against the Board diversity policy annually; — we will report on our progress against the policy and our objectives in the Annual Report and Accounts along with details of initiatives to promote gender and other forms of diversity among our Board, Executive Committee and other senior management; and — we will continue to make key diversity data, both about the Board and our wider employee population, available in the Annual Report and Accounts. Progress against the objectives and the policy will be reviewed annually and reported in the Annual Report and Accounts. The implementation of a successful diversity policy will need to be measured over a period of some years during which the size and shape of the Board may change to support the business. Led by the Chief Executive, the Executive Committee oversees the safety, operational and financial performance of the Company. It is responsible for making day-to-day management and operational decisions it considers necessary to safeguard the interests of the Company and to further the strategy, business objectives and targets established by the Board. The Committee plays an important role in the development of our people and in driving a high-performance culture. It approves expenditure and other financial commitments within its authority levels and discusses, formulates and approves proposals to be considered by the Board. There are currently 10 members on the Committee. They have a broad range of skills and expertise, which are updated through training and development. Some members also hold external non-executive directorships, giving them valuable board experience. On a quarterly basis the Committee receives an inclusion and diversity scorecard which sets out statistics from the business at all levels in the UK and US. Progress against our aspirational inclusion and diversity targets is reviewed on an annual basis. The Committee officially met 12 times this year, but the members interact much more regularly. Those members of the Committee who are not Directors all regularly attend Board and committee meetings for specific agenda items with Alison Kay, Group General Counsel & Company Secretary, being secretary to the Board and Nominations Committee. This means that knowledge is shared and every member is kept up to date with business activities and developments. | ||||||||||||||||||||||||||||||||||||||||||||||||||||||||||||||||||||||||||||||||||||||||||||||||||||||||||||||||||||||||||||||||||||||||||||||||||||||||||||||||||||||||||||||||||||||||||||||||||||||||||||||||||||||||||||||||||||||||||||||||||||||||||||||||||||||||||||||||||||||||||||||||||||||||||||||||||||||||||||||||||||||||||||||||||||||||||||||||||||||||||||||||||||||||||||||||||||||||||||||||||||||||||||||||||||||||||||||||||||||||||||||||||||||||||||||||||||||||||||||||||||||||||||||||||||||||||||||||||||||||||||||||||||||||
Strategic Report | Corporate Governance | Financial Statements | Additional Information | 57 |
1Steve Holliday, Committee chairman 2Andrew Bonfield, Finance Director 3Stephanie Hazell, Group Strategy & Corporate Development Director (joined the Committee in June 2013 to replace Alison Wood) 4Alison Kay, Group General Counsel & Company Secretary (see page 173 for her biography) 5Tom King, Executive Director, US 6David Lister, Chief Information Officer 7George Mayhew, Corporate Affairs Director 8John Pettigrew, Executive Director, UK 9Mike Westcott, Group Human Resources Director 10Nick Winser, Executive Director, UK To help make sure we allocate time and expertise in the right way, the Company has a number of management committees, which include the Disclosure Committee, Global Ethics and Compliance Committees and the Global Retirement Plan Committee. These management committees provide reports, where relevant, to the appointing committee in line with our governance framework on the responsibilities they have been delegated. Disclosure Committee The role of the Disclosure Committee is to assist the Chief Executive and the Finance Director in fulfilling their responsibility for overseeing the accuracy and timeliness of the disclosures made – whether in connection with our presentations to analysts, financial reporting obligations or other material stock exchange announcements. This year the Committee met to consider the announcements of the full- and half-year results and the interim management statements. It reported on the matters arising to the Audit Committee. In doing so it spent time considering the Company’s disclosure obligations relating to RIIO, the implementation of the US financial systems and controls, the LIPA MSA transition and the Board’s approach to the offer of the scrip dividend option. The Committee also reports the results of its evaluation of the effectiveness of the Company’s disclosure controls to the Audit Committee. | The Committee is chaired by the Finance Director and its members are the Group General Counsel & Company Secretary, the Global Tax and Treasury Director, the Group Financial Controller, the Director of Investor Relations, the Director of Corporate Audit and the Deputy Group General Counsel, with other attendees as appropriate. | |||||||||
| ||||||||||
| Directors’ Report statutory and other disclosures (starting on page indicated) | ||||||||||
AGM page 46 | ||||||||||
Articles of Association page 176 | ||||||||||
Audit information page 52 | ||||||||||
Board of Directors page 43 | ||||||||||
Business model page 14 | ||||||||||
Change of control provisions page 173 | ||||||||||
Code of Ethics page 177 | ||||||||||
Conflicts of interest page 173 | ||||||||||
Contractual and other arrangements page 160 | ||||||||||
Directors’ indemnity page 173 | ||||||||||
Directors’ share interests page 70 | ||||||||||
Diversity page 41 | ||||||||||
Dividend page 02 | ||||||||||
Events after the reporting period page 173 | ||||||||||
Financial instruments page 83 | ||||||||||
Future developments page 12 | ||||||||||
Greenhouse gas emissions page 11 | ||||||||||
Human rights page 41 | ||||||||||
Important events affecting the Company during the year page 06 | ||||||||||
Internal control page 22 | ||||||||||
Material interests in shares page 174 | ||||||||||
People page 40 | ||||||||||
Political donations and expenditure page 174 | ||||||||||
Principal activities page 12 | ||||||||||
Research and development page 174 | ||||||||||
Risk management page 22 | ||||||||||
Share capital page 174 | ||||||||||
The Directors’ Report, prepared in accordance with the requirements of the Companies Act 2006 and the UK Listing Authority’s Listing, and Disclosure and Transparency rules, comprising pages 06 to 73 and 160 to 187, was approved by the Board and signed on its behalf by: Alison Kay Group General Counsel & Company Secretary Company number 4031152 18 May 2014 | ||||||||||
58 National Grid Annual Report and Accounts 2013/14 | ||||||||||||
Report |
Annual statement from the Remuneration Committee chairman I am delighted to present my first Directors’ Remuneration Report. Following the introduction of a new UK regulatory framework in 2013 and the continued evolution of our US business, last summer the Committee initiated an extensive review of our executive remuneration strategy. Our objective was to assess whether the principles on which the current remuneration strategy is based continued to reflect our business drivers given recent changes. Our review concluded that a number of significant changes were appropriate. They are presented in this report for our shareholders’ consideration and, I hope, approval at our 2014 AGM. The key factor in our discussions was to enhance the alignment of interest between executives and shareholders over the longer term. National Grid is a long-term business, where decisions taken today can have significant impact on performance and profitability over several years. Therefore the Committee believes that the bulk of incentives to executives should be paid in shares and that it is essential for high levels of personal shareholdings to become mandatory, rather than simply guidelines. Having reached provisional conclusions I wrote to a number of our larger shareholders to seek their views. In the light of the constructive responses we received, the Committee amended its proposals and these amendments are incorporated into the recommendations in this report. The key components of our recommendations are: — A rebalancing of variable pay from the Annual Performance Plan (APP) to the Long Term Performance Plan (LTPP). It is proposed: – to reduce the APP maximum from 150% of salary to 125% of salary for the CEO and the other Executive Directors; and – to increase the LTPP maximum from 225% to 350% of salary for the CEO and from 200% to 300% of salary for the other Executive Directors. — Increased alignment with shareholders by requiring Executive Directors to retain a significantly higher number of shares earned. It is proposed: – for the CEO, the new requirement is a shareholding of 500% of pre-tax salary, equivalent to over nine years’ post-tax salary; and – for the other Executive Directors, the new requirement is a shareholding of 400% of pre-tax salary. | — Stronger alignment with our business model and the long-term value drivers around a dividend-led total return. It is proposed to move to two key LTPP metrics – RoE (50% weighting) and value growth (50% weighting): – RoE is aimed at focusing management on driving profits within the business; and – value growth is viewed as a clearer indicator than EPS of the long-term growth of the business and the creation of shareholder value. — Extended holding periods for incentive awards. It is proposed that any APP award is paid half in cash and half in shares. The shares would be paid immediately and be subject to a minimum holding period of two years. LTPP performance metrics would be measured over a three year period and awards would then be subject to a minimum two year holding period. The Company’s commitment to increasing the annual dividend by at least RPI for the foreseeable future would be reflected in LTPP awards. The Committee will have the explicit power to reduce LTPP vesting should the Company fail to honour the dividend commitment, irrespective of the level of vesting resulting from the performance against the LTPP targets set by the Committee. The consequence of all these changes is to reduce near-term cash incentives (APP) and tilt the balance to longer-term awards and longer-term shareholding exposure, with a greater proportion of Executive Directors’ remuneration earned in shares. As a result, we are striking an important balance between long-term reward and increased financial risk to executives through very high levels of mandatory shareholdings. In setting the quantum of future LTPP awards we have taken account of the reduced APP opportunity and longer holding periods that we are proposing. However, I want to assure shareholders that the Committee’s intention is that any increase in remuneration should arise from commensurate increases in long-term performance. We will therefore seek to ensure that targets set for the LTPP metrics contain appropriately demanding levels of performance to justify any increase in executive reward. For the 2014 LTPP award we are proposing that maximum payout would require an average annual Group RoE of 12.5% and an average annual value growth of 12% over the three year performance period. The Committee considers these stretch targets, in the light of the business plan and recent performance, to be more challenging to management than those for LTPP set in the recent past. To achieve such a performance would require incremental Group pre-tax profits of over £250 million per annum, which in turn would imply achieved customer We can also confirm that, had the proposed APP and |
Strategic Report | Corporate Governance | Financial Statements | Additional Information | 59 |
In addition to the incentive plans review, the Committee reviewed future pension policy and John Pettigrew joined the Board on 1 April 2014 with a starting salary of £475,000 and will not receive a salary increase from 1 June 2014. His remuneration package is in line with the remuneration policy presented for approval in this report. In particular, his salary is below the Committee’s assessment of the market rate for equivalent roles. Subject to his performance, the Committee’s intention is to increase his salary towards market level by way of future phased increases in excess of those awarded to other Executive Directors. Our 2013/14 performance is set out on page 68. Overall, against the APP performance metrics of adjusted EPS, operating profit, US capital delivery, UK and US RoE and individual objectives, performance was ahead of target. As a result, we have made awards to the Executive Directors of between 83% and 129% of salary. Details of future targets and historical performance will be disclosed each year in respect of the LTPP, and details of historical performance will be disclosed each year in respect of the APP. The Committee believes that our proposals to restructure incentive pay are appropriate for the Company and on behalf of the Committee I commend them to shareholders.
Jonathan Dawson Committee chairman | Directors’ remuneration policy The following tables provide details of the policy we intend to apply, subject to shareholder approval, for three years from the date of the 2014 AGM. Following approval it will be displayed on the Company’s There may be circumstances from time to time when the Committee will consider it appropriate to apply some judgement and
Our peer group The Committee benchmarks its remuneration policy against appropriate peer groups annually to ensure we remain competitive in the relevant markets. The primary focus for reward benchmarking is the FTSE 11-40 for UK-based Executive Directors and general industry and energy services companies with similar levels of revenue for US-based Executive Directors. These peer groups are considered appropriate for a large, complex, international and predominantly regulated business. | ||||||||||||||||||||||||
| |||||||||||||||||||||||||
60 National Grid Annual Report and Accounts | ||||||||||||
Remuneration Report continued |
Future policy table – Executive Directors | |||||||||||||||||||||||||||||||||||||||||||||||||||||||||||||||||||||||||||||||||||||||||||||||||||||||||||||||||||||||||||||||||||||||||||||||||||||||||||||||||||||||||||||||||||||||||||||||||||||||||||||||||||||||||||||||||||||||||||||||||||||||||||||||||||||||||||||||||||||||||||||||||||||||||||||||||||||||||||||||||||||||||||||||||||||||||||||||||||||||||||||||||||||||||||||||||||||||||||||||||||||||||||||||||||||||||||||||||||||||||||||||||||||||||||||||||||||||||||||||||||||||||||||||||||||||||||||||||||||||||||||||||||||||||||||||||||||||||||||||||||||||||||||||||||||||||||||||||||||||||||||||||||||||||||||||||||||||||||||||||||||||||||||||||||||||||||||||||||||||||||||||||||||||||||||||||||||||||||||||||||||||||||||||||||||||||||||||||||||||||||||||||||||||||||||||||||||||||||||||||||||||||||||||||||||||||||||||||||||||||||||||||||||||||||||||||||||||||||||||||||||||||||||||||||||||||||||||||||||||||||||||||||||||||||||||||||||||||||||||||||||||||||||||||||||||||||||||||||||||
| |||||||||||||||||||||||||||||||||||||||||||||||||||||||||||||||||||||||||||||||||||||||||||||||||||||||||||||||||||||||||||||||||||||||||||||||||||||||||||||||||||||||||||||||||||||||||||||||||||||||||||||||||||||||||||||||||||||||||||||||||||||||||||||||||||||||||||||||||||||||||||||||||||||||||||||||||||||||||||||||||||||||||||||||||||||||||||||||||||||||||||||||||||||||||||||||||||||||||||||||||||||||||||||||||||||||||||||||||||||||||||||||||||||||||||||||||||||||||||||||||||||||||||||||||||||||||||||||||||||||||||||||||||||||||||||||||||||||||||||||||||||||||||||||||||||||||||||||||||||||||||||||||||||||||||||||||||||||||||||||||||||||||||||||||||||||||||||||||||||||||||||||||||||||||||||||||||||||||||||||||||||||||||||||||||||||||||||||||||||||||||||||||||||||||||||||||||||||||||||||||||||||||||||||||||||||||||||||||||||||||||||||||||||||||||||||||||||||||||||||||||||||||||||||||||||||||||||||||||||||||||||||||||||||||||||||||||||||||||||||||||||||||||||||||||||||||||||||||||||||
Operation | Maximum levels |
Salaries are targeted broadly at mid-market level. | No prescribed maximum annual increase. Any increases are generally aligned to salary increases received by other Company employees and to market movement. Increases in excess of this may be made at the | Not applicable. | |||||||||||||||||||||||||||||||||||||||||||||||||||||||||||||||||||||||||||||||||||||||||||||||||||||||||||||||||||||||||||||||||||||||||||||||||||||||||||||||||||||||||||||||||||||||||||||||||||||||||||||||||||||||||||||||||||||||||||||||||||||||||||||||||||||||||||||||||||||||||||||||||||||||||||||||||||||||||||||||||||||||||||||||||||||||||||||||||||||||||||||||||||||||||||||||||||||||||||||||||||||||||||||||||||||||||||||||||||||||||||||||||||||||||||||||||||||||||||||||||||||||||||||||||||||||||||||||||||||||||||||||||||||||||||||||||||||||||||||||||||||||||||||||||||||||||||||||||||||||||||||||||||||||||||||||||||||||||||||||||||||||||||||||||||||||||||||||||||||||||||||||||||||||||||||||||||||||||||||||||||||||||||||||||||||||||||||||||||||||||||||||||||||||||||||||||||||||||||||||||||||||||||||||||||||||||||||||||||||||||||||||||||||||||||||||||||||||||||||||||||||||||||||||||||||||||||||||||||||||||||||||||||||||||||||||||||||||||||||||||||||||||||||||||||||||||||||||||||
They are generally reviewed annually. Salary reviews take into account: | |||||||||||||||||||||||||||||||||||||||||||||||||||||||||||||||||||||||||||||||||||||||||||||||||||||||||||||||||||||||||||||||||||||||||||||||||||||||||||||||||||||||||||||||||||||||||||||||||||||||||||||||||||||||||||||||||||||||||||||||||||||||||||||||||||||||||||||||||||||||||||||||||||||||||||||||||||||||||||||||||||||||||||||||||||||||||||||||||||||||||||||||||||||||||||||||||||||||||||||||||||||||||||||||||||||||||||||||||||||||||||||||||||||||||||||||||||||||||||||||||||||||||||||||||||||||||||||||||||||||||||||||||||||||||||||||||||||||||||||||||||||||||||||||||||||||||||||||||||||||||||||||||||||||||||||||||||||||||||||||||||||||||||||||||||||||||||||||||||||||||||||||||||||||||||||||||||||||||||||||||||||||||||||||||||||||||||||||||||||||||||||||||||||||||||||||||||||||||||||||||||||||||||||||||||||||||||||||||||||||||||||||||||||||||||||||||||||||||||||||||||||||||||||||||||||||||||||||||||||||||||||||||||||||||||||||||||||||||||||||||||||||||||||||||||||||||||||||||||||||
| — | business and individual contribution; | ||||||||||||||||||||||||||||||||||||||||||||||||||||||||||||||||||||||||||||||||||||||||||||||||||||||||||||||||||||||||||||||||||||||||||||||||||||||||||||||||||||||||||||||||||||||||||||||||||||||||||||||||||||||||||||||||||||||||||||||||||||||||||||||||||||||||||||||||||||||||||||||||||||||||||||||||||||||||||||||||||||||||||||||||||||||||||||||||||||||||||||||||||||||||||||||||||||||||||||||||||||||||||||||||||||||||||||||||||||||||||||||||||||||||||||||||||||||||||||||||||||||||||||||||||||||||||||||||||||||||||||||||||||||||||||||||||||||||||||||||||||||||||||||||||||||||||||||||||||||||||||||||||||||||||||||||||||||||||||||||||||||||||||||||||||||||||||||||||||||||||||||||||||||||||||||||||||||||||||||||||||||||||||||||||||||||||||||||||||||||||||||||||||||||||||||||||||||||||||||||||||||||||||||||||||||||||||||||||||||||||||||||||||||||||||||||||||||||||||||||||||||||||||||||||||||||||||||||||||||||||||||||||||||||||||||||||||||||||||||||||||||||||||||||||||||||||||||||||||||
| — | the | ||||||||||||||||||||||||||||||||||||||||||||||||||||||||||||||||||||||||||||||||||||||||||||||||||||||||||||||||||||||||||||||||||||||||||||||||||||||||||||||||||||||||||||||||||||||||||||||||||||||||||||||||||||||||||||||||||||||||||||||||||||||||||||||||||||||||||||||||||||||||||||||||||||||||||||||||||||||||||||||||||||||||||||||||||||||||||||||||||||||||||||||||||||||||||||||||||||||||||||||||||||||||||||||||||||||||||||||||||||||||||||||||||||||||||||||||||||||||||||||||||||||||||||||||||||||||||||||||||||||||||||||||||||||||||||||||||||||||||||||||||||||||||||||||||||||||||||||||||||||||||||||||||||||||||||||||||||||||||||||||||||||||||||||||||||||||||||||||||||||||||||||||||||||||||||||||||||||||||||||||||||||||||||||||||||||||||||||||||||||||||||||||||||||||||||||||||||||||||||||||||||||||||||||||||||||||||||||||||||||||||||||||||||||||||||||||||||||||||||||||||||||||||||||||||||||||||||||||||||||||||||||||||||||||||||||||||||||||||||||||||||||||||||||||||||||||||||||||||||||
| — | scope of the | ||||||||||||||||||||||||||||||||||||||||||||||||||||||||||||||||||||||||||||||||||||||||||||||||||||||||||||||||||||||||||||||||||||||||||||||||||||||||||||||||||||||||||||||||||||||||||||||||||||||||||||||||||||||||||||||||||||||||||||||||||||||||||||||||||||||||||||||||||||||||||||||||||||||||||||||||||||||||||||||||||||||||||||||||||||||||||||||||||||||||||||||||||||||||||||||||||||||||||||||||||||||||||||||||||||||||||||||||||||||||||||||||||||||||||||||||||||||||||||||||||||||||||||||||||||||||||||||||||||||||||||||||||||||||||||||||||||||||||||||||||||||||||||||||||||||||||||||||||||||||||||||||||||||||||||||||||||||||||||||||||||||||||||||||||||||||||||||||||||||||||||||||||||||||||||||||||||||||||||||||||||||||||||||||||||||||||||||||||||||||||||||||||||||||||||||||||||||||||||||||||||||||||||||||||||||||||||||||||||||||||||||||||||||||||||||||||||||||||||||||||||||||||||||||||||||||||||||||||||||||||||||||||||||||||||||||||||||||||||||||||||||||||||||||||||||||||||||||||||||
| — | market data in the
| ||||||||||||||||||||||||||||||||||||||||||||||||||||||||||||||||||||||||||||||||||||||||||||||||||||||||||||||||||||||||||||||||||||||||||||||||||||||||||||||||||||||||||||||||||||||||||||||||||||||||||||||||||||||||||||||||||||||||||||||||||||||||||||||||||||||||||||||||||||||||||||||||||||||||||||||||||||||||||||||||||||||||||||||||||||||||||||||||||||||||||||||||||||||||||||||||||||||||||||||||||||||||||||||||||||||||||||||||||||||||||||||||||||||||||||||||||||||||||||||||||||||||||||||||||||||||||||||||||||||||||||||||||||||||||||||||||||||||||||||||||||||||||||||||||||||||||||||||||||||||||||||||||||||||||||||||||||||||||||||||||||||||||||||||||||||||||||||||||||||||||||||||||||||||||||||||||||||||||||||||||||||||||||||||||||||||||||||||||||||||||||||||||||||||||||||||||||||||||||||||||||||||||||||||||||||||||||||||||||||||||||||||||||||||||||||||||||||||||||||||||||||||||||||||||||||||||||||||||||||||||||||||||||||||||||||||||||||||||||||||||||||||||||||||||||||||||||||||||||||
attract
Benefits provided include: Benefits have no pre-determined maximum, as the cost of providing these varies from year to year. Participation in
Not applicable. — | company car or a cash alternative (UK only); | — | use of a driver when required; | — | private medical insurance; | — | life assurance; | — | personal accident insurance; | — | opportunity to purchase additional benefits under flexible benefits schemes available to all employees; and | — | opportunity to participate in the following HM Revenue & Customs (UK) or Internal Revenue Service (US) tax advantaged all-employee share plans: Sharesave: UK employees may make monthly contributions from net salary for a period of 3 or 5 years. The savings can be used to purchase shares at a discounted price, set at the Share Incentive Plan (SIP): UK employees may use gross salary to
The Directors are responsible for preparing the Annual Report and Accounts, including the consolidated financial statements and the Company financial statements, Company law requires the Directors to prepare financial statements for each financial year. Under that law the Directors have prepared the consolidated financial statements in accordance with International Financial Reporting Standards (IFRS) as adopted by the In preparing these financial statements, the Directors are required to:
The Directors are responsible for keeping adequate accounting records that are sufficient to show and explain the Company’s transactions and disclose with reasonable accuracy at any time the financial position of the Company on a consolidated and individual basis, and to enable them to ensure that the consolidated financial statements comply with the Companies Act 2006 and Article 4 of the IAS Regulation and the Company financial statements and the Remuneration Report comply with the Companies Act 2006. They are also responsible for safeguarding the assets of the Company and its subsidiaries and hence for taking reasonable steps for the prevention and detection of fraud and other irregularities. The Directors are responsible for the maintenance and integrity of the Company’s website. Legislation in the United Kingdom governing the preparation and dissemination of financial statements may differ from legislation in other jurisdictions. Each of the Directors, whose names and functions are listed on — to the best of their — to the best of their knowledge, the Strategic Report contained in the Annual Report and Accounts includes a fair review of the development and performance of the business and the position of the Company on a consolidated and individual basis, together with a description of the principal risks and uncertainties that it faces; and — they consider that the Annual Report and Accounts, taken as a whole, is fair, balanced and understandable and provides the information necessary for shareholders to assess the Company’s performance, business model and strategy.
By order of the Board
Group General Counsel & Company Secretary 18 May 2014 Company
| ||||||||||||||||||||||||||||||||||||||||||||||||||||||||||||||||||||||||||||||||||||||||||||||||||||||||||||||||||||||||||||||||||||||||||||||||||||||||||||||||||||||||||||||||||||||||||||||||||||||||||||||||||||||||||||||||||||||||||||||||||||||||||||||||||||||||||||||||||||||||||||||||||||||||||||||||||||||||||||||||||||||||||||||||||||||||||||||||||||||||||||||||||||||||||||||||||||||||||||||||||||||||||||||||||||||||||||||||||||||||||||||||||||||||||||||||||||||||||||||||||||||||||||||||||||||||||||||||||||||||||||||||||||||||||||||||||||||||||||||||||||||||||||||||||||||||||||||||||||||||||||||||||||||||||||||||||||||||||||||||||||||||||||||||||||||||||||||||||||||||||||||||||||||||||||||||||||||||||||||||||||||||||||||||||||||||||||||||||||||||||||||||||||||||||||||||||||||||||||||||||||||||||||||||||||||||||||||||||||||||||||||||||||||||||||||||||||||||||||||||||||||||||||||||||||||||||||||||||||||||||||||||||||||||||||||||||||||||||||||||||||||||||||||||||||||||||
Strategic Report
Corporate Governance
Financial Statements
Additional Information
www.nationalgrid.com
78 National Grid Annual Report and Accounts 2013/14 | ||||||||||||
[INTENTIONALLY LEFT BLANK]
Strategic Report | Corporate Governance | Financial Statements | Additional Information | 79 |
[INTENTIONALLY LEFT BLANK]
80 National Grid Annual Report and Accounts 2013/14 | ||||||||||||
[INTENTIONALLY LEFT BLANK]
Strategic Report | Corporate Governance | Financial Statements | Additional Information | 81 |
Report of Independent Registered Public Accounting Firm to the Board of Directors and Shareholders of National Grid plc |
In our opinion, the accompanying consolidated Also in our opinion, the Company maintained, in all material respects, effective internal control over financial reporting as of 31 March Our responsibility is to express opinions on these financial statements and on the Company’s internal control over financial reporting based on our integrated audits. We conducted our audits in accordance with the standards of the Public Company Accounting Oversight Board (United States). Those standards require that we plan and perform the audits to obtain reasonable assurance about whether the financial statements are free of material misstatement and whether effective internal control over financial reporting was maintained in all material respects. Our audits of the financial statements included examining, on a test basis, evidence supporting the amounts and disclosures in the financial statements, assessing the accounting principles used and significant estimates made by management, and evaluating the overall financial statement presentation. Our audit of internal control over financial reporting included obtaining an understanding of internal control over financial reporting, assessing the risk that a material weakness exists, and testing and evaluating the design and operating effectiveness of internal control based on the assessed risk. Our audits also included performing such other procedures as we considered necessary in the circumstances. We believe that our audits provide a reasonable basis for our opinions. | A company’s internal control over financial reporting is a process designed to provide reasonable assurance regarding the reliability of financial reporting and the preparation of financial statements for external purposes in accordance with generally accepted accounting principles. A company’s internal control over financial reporting includes those policies and procedures that (i) pertain to the maintenance of records that, in reasonable detail, accurately and fairly reflect the transactions and dispositions of the assets of the company; (ii) provide reasonable assurance that transactions are recorded as necessary to permit preparation of financial statements in accordance with generally accepted accounting principles, and that receipts and expenditures of the company are being made only in accordance with authorisations of management and directors of the company; and (iii) provide reasonable assurance regarding prevention or timely detection of unauthorised acquisition, use, or disposition of the company’s assets that could have a material effect on the financial statements. Because of its inherent limitations, internal control over financial reporting may not prevent or detect misstatements. Also, projections of any evaluation of effectiveness to future periods are subject to the risk that controls may become inadequate because of changes in conditions, or that the degree of compliance with the policies or procedures may deteriorate. PricewaterhouseCoopers LLP London United Kingdom
|
Financial Statements82 National Grid Annual Report and Accounts 2013/14
preparation |
Accounting policies describe our approach to recognising and measuring transactions and balances in the year. Accounting policies applicable across the financial statements
This section also shows areas of judgement and key sources of estimation uncertainty in
|
The consolidated financial statements incorporate the financial statements of the Company and its subsidiaries, together with a share of the results, assets and liabilities of jointly controlled entities (joint ventures) and associates using the equity method of accounting, where the investment is carried at cost plus post-acquisition changes in the share of net assets of the joint venture or associate, less any provision for impairment. A subsidiary is defined as an entity controlled by the Company. Control is achieved where the Company has the power to Losses in excess of the consolidated interest in joint ventures and associates are not recognised, except where the Company or its subsidiaries have made a commitment to make good those losses. Where necessary, adjustments are made to bring the accounting policies used in the individual financial statements of the Company, subsidiaries, joint ventures and associates into line with those used by the Company in its consolidated financial statements under IFRS. Intercompany transactions are eliminated. The results of subsidiaries, joint ventures and associates acquired or disposed of during the year are included in the consolidated income statement from the effective date of acquisition or up to the effective date of disposal, as appropriate. Acquisitions are accounted for using the
Transactions in currencies other than the functional currency of the Company or subsidiary concerned are recorded at the rates of exchange prevailing on the dates of the transactions. At each Gains and losses arising on the retranslation of monetary assets and liabilities are included in the income statement, except where the adoption of hedge accounting requires inclusion in other comprehensive income On consolidation, the assets and liabilities of operations that have a functional currency different from the Company’s functional currency of pounds sterling, principally our US operations that have a functional currency of dollars, are translated at exchange rates prevailing at the | |||||||||||||||||||||||||||||||||||||||||||||||||||||||||||||||||||||||||||||||||||||||||||||||||||||||||||||||||||||||
The Company has its primary listing on
The consolidated financial statements have been prepared on an historical cost basis, except for the recording of pension assets and liabilities, the revaluation of derivative financial instruments and certain commodity contracts and investments classified as available-for-sale. The consolidated financial statements have been prepared on a going concern basis following the assessment made by the Directors as set out on page 52. These consolidated financial statements are presented in pounds sterling, which is also the functional currency of the Company. The preparation of financial statements requires management to make estimates and assumptions that affect the
| ||||||||||||||||||||||||||||||||||||||||||||||||||||||||||||||||||||||||||||||||||||||||||||||||||||||||||||||||||||||||
|
Financial Statements | Additional Information
| 83
The preparation of financial statements requires management to make estimates and assumptions that affect the reported amounts of assets and liabilities, disclosures of contingent assets and liabilities and the reported amounts of revenue and expenses during the reporting period. Actual results could differ from these estimates. Information about such judgements and estimations is contained in the Areas of judgement that have the most significant effect on the amounts recognised in the financial statements are as follows:
Key sources of estimation uncertainty that have significant risk of causing a material adjustment to the carrying amounts of assets and liabilities within the next financial year are as follows:
New IFRS accounting standards and interpretations adopted in During the year ended 31 March Other standards, interpretations and amendments issued by the IASB and IFRIC that have not had a material impact on the Company’s consolidated results or assets and liabilities are: — IFRS 10 ‘Consolidated financial statements’; — IFRS 11 ‘Joint arrangements’; — IFRS 12 ‘Disclosure of interests in other entities’; — amendments to IAS 27 ‘Separate financial statements’ and IAS 28 ‘Investments in associates and joint ventures’ as a result of the adoption of the above standards; — amendments to IAS 1 ‘Presentation of financial statements’; and — amendments to IFRS 7 ‘Financial instruments: Disclosures’. New IFRS accounting standards and interpretations not yet adopted The Company enters into a significant number of transactions
Other standards and interpretations or amendments thereto which have been issued, but are not yet effective, are not expected to have a material impact on the Company’s consolidated financial statements. |

84 National Grid Annual Report and Accounts
| ||||||||||||
income statement for the years ended 31 March |
| Notes | | 2014 £m | | | 2014 £m | |
| 2013 (restated £m | )1
|
| 2013 (restated £m | )1
|
| 2012 (restated £m | )1
|
| 2012 (restated)1 £m |
| ||||||||||||
| ||||||||||||||||||||||||||||||
Revenue | 2(a | ) | 14,809 | 14,359 | 13,832 | |||||||||||||||||||||||||
Operating costs | 3 | (11,074 | ) | (10,610 | ) | (10,297) | ||||||||||||||||||||||||
| ||||||||||||||||||||||||||||||
Operating profit | ||||||||||||||||||||||||||||||
Before exceptional items, remeasurements and stranded cost recoveries | 2(b | ) | 3,664 | 3,639 | 3,491 | |||||||||||||||||||||||||
Exceptional items, remeasurements and stranded cost recoveries | 4 | 71 | 110 | 44 | ||||||||||||||||||||||||||
Total operating profit | 2(b | ) | 3,735 | 3,749 | 3,535 | |||||||||||||||||||||||||
Finance income | 5 | 36 | 30 | 28 | ||||||||||||||||||||||||||
Finance costs | ||||||||||||||||||||||||||||||
Before exceptional items and remeasurements | 5 | (1,144 | ) | (1,154 | ) | (1,118 | ) | |||||||||||||||||||||||
Exceptional items and remeasurements | 4,5 | 93 | 68 | (70 | ) | |||||||||||||||||||||||||
Total finance costs | 5 | (1,051 | ) | (1,086 | ) | (1,188) | ||||||||||||||||||||||||
Share of post-tax results of joint ventures and associates | 14 | 28 | 18 | 7 | ||||||||||||||||||||||||||
| ||||||||||||||||||||||||||||||
Profit before tax | ||||||||||||||||||||||||||||||
Before exceptional items, remeasurements and stranded cost recoveries | 2(b | ) | 2,584 | 2,533 | 2,408 | |||||||||||||||||||||||||
Exceptional items, remeasurements and stranded cost recoveries | 4 | 164 | 178 | (26 | ) | |||||||||||||||||||||||||
Total profit before tax | 2(b | ) | 2,748 | 2,711 | 2,382 | |||||||||||||||||||||||||
Taxation | ||||||||||||||||||||||||||||||
Before exceptional items, remeasurements and stranded cost recoveries | 6 | (581 | ) | (619 | ) | (697 | ) | |||||||||||||||||||||||
Exceptional items, remeasurements and stranded cost recoveries | 4,6 | 297 | 62 | 234 | ||||||||||||||||||||||||||
Total taxation | 6 | (284 | ) | (557 | ) | (463) | ||||||||||||||||||||||||
| ||||||||||||||||||||||||||||||
Profit after tax | ||||||||||||||||||||||||||||||
Before exceptional items, remeasurements and stranded cost recoveries | 2,003 | 1,914 | 1,711 | |||||||||||||||||||||||||||
Exceptional items, remeasurements and stranded cost recoveries | 4 | 461 | 240 | 208 | ||||||||||||||||||||||||||
| ||||||||||||||||||||||||||||||
Profit for the year | 2,464 | 2,154 | 1,919 | |||||||||||||||||||||||||||
| ||||||||||||||||||||||||||||||
Attributable to: | ||||||||||||||||||||||||||||||
Equity shareholders of the parent | 2,476 | 2,153 | 1,917 | |||||||||||||||||||||||||||
Non-controlling interests | (12 | ) | 1 | 2 | ||||||||||||||||||||||||||
| ||||||||||||||||||||||||||||||
| 2,464 | 2,154 | 1,919 | ||||||||||||||||||||||||||||
| ||||||||||||||||||||||||||||||
Earnings per share2 | ||||||||||||||||||||||||||||||
Basic | 7(a | ) | 66.4p | 57.8p | 51.6p | |||||||||||||||||||||||||
Diluted | 7(b | ) | 66.1p | 57.5p | 51.3p | |||||||||||||||||||||||||
| ||||||||||||||||||||||||||||||
1. See note 1 on page 92.
2. Comparative amounts have been restated to reflect the impact of additional shares issued as scrip dividends.
|
| |||||||||||||||||||||||||||||
Strategic Report
|
| Financial Statements | Additional Information | 85 | |||||||||||||||||||||||||||||||||||||||||||||||||||||||||||||||||||||||||||||||||||||||||||||||||||||||||||||||||||||||||||||||||||||||||||||||||||||||||||||||||||||||||||||||||||||||||||||||||||||||||||||||||||||||||||||||||||||||||||||||||||||||||||||||||||||||||||||||||||||||||||||||||||||||||||||||||||||||||||||||||||||||||||||||||||||||||||||||||||||||||||||||||||||||||||||||||||||||||||||||||||||||||||||||||||||||||||||||||||||||||||||||||||||||||||||||||||||||||||||||||||||||||||||||||||||||||||||||||||||||||||||||||||||||||||||||||||||||||||||||||||||||||||||||||||||||||||||||||||||||||||||||||||||||||||||||||||||||||||||||||||||||||||||||||||||||||||||||||||||||||||||||||||||||||||||||||||||||||||||||||||||||||||||||||||||||||||||||||||||||||||||||||||||||||||||||||||||||||||||||||||||||||||||||||||||||||||||||||||||||||||||||||||||||||||||||||||||||||||||||||||||||||||||||||||||||||||||||||||||||||||||||||||||||||||||||||||||||||||||||||||||||||||||||||||||||||||||||||||
Unaudited commentary on the consolidated income statement | ||
The consolidated income statement shows all revenue earned and costs incurred in the year, with the difference being the overall profit for the year. | Adjusted earnings and EPS The following chart shows the five year trend in adjusted profit attributable to equity shareholders of the parent (adjusted earnings) and adjusted EPS. | |
Revenue Revenue for the year ended 31 March 2014 increased by £450m to £14,809m. This increase was driven by higher revenues in our UK Electricity Transmission and UK Gas Distribution businesses, principally as a result of the new RIIO regulatory arrangements. Revenue in our US Regulated businesses was also higher, reflecting higher pass-through costs such as gas and electricity commodity costs, partially offset by the end of the Niagara Mohawk deferral revenue recoveries at 31 March 2013 and the impact of the weaker dollar. Operating costs Operating costs for the year ended 31 March 2014 of £11,074m were £464m higher than the prior year. This increase in costs was predominantly due to increases in pass-through costs in our UK and US Regulated businesses, together with higher depreciation and amortisation as a result of continued investment and increases in our controllable costs. Exceptional items, remeasurements and stranded cost recoveries included in operating costs for the year ended 31 March 2014 were £39m lower than the prior year. Net exceptional gains included in 2013/14 of £55m primarily consisted of a net gain on the LIPA MSA transition in the US of £254m, a gain of £16m following the sale to a third party of a settlement award, restructuring costs of £136m and UK gas holder demolition costs of £79m. The 2013/14 results also included a gain of £16m on remeasurements of commodity contracts. There were no major storms affecting our operations in the year ended 31 March 2014. In 2012/13, two major storms in the US, Superstorm Sandy and Storm Nemo, increased operating costs by £136m. Net finance costs For the year ended 31 March 2014, net finance costs before exceptional items and remeasurements were £16m lower than 2012/13 at £1,108m, mainly due to the impact of the weaker dollar (£17m). Finance costs for the year ended 31 March 2014 also included a gain of £93m on financial remeasurements relating to net gains and losses on derivative financial instruments. Taxation The tax charge on profits before exceptional items, remeasurements and stranded cost recoveries was £38m lower than 2012/13. This was mainly due to a 1% decrease in the UK statutory corporation tax rate in the year and a change in the UK/US profit mix where higher UK profits were taxed at the lower UK tax rate. Our tax charge was also affected by changes in tax provisions in respect of prior years. | Adjusted earnings and adjusted EPS1
1. All comparatives restated for IAS 19 (revised). See note 1 on page 92. Adjusted earnings and adjusted EPS are attributable to equity shareholders of the parent. The above earnings performance translated into adjusted EPS growth in 2013/14 of 2.6p (5%). In accordance with IAS 33, all EPS and adjusted EPS amounts for comparative periods have been restated Exchange rates Our financial results are reported in sterling. Transactions for our US operations are denominated in dollars, so the related amounts that are reported in sterling depend on the dollar to sterling exchange rate. The weighted average dollar rate weakened to $1.62:£1 in 2013/14 from $1.57:£1 in 2012/13. Consequently, if 2012/13 results had been translated at 2013/14 exchange rates, revenue, adjusted operating profit and operating profit reported in sterling would have been £242m, £34m and £39m lower respectively. The | |
Exceptional tax for 2013/14 included an exceptional deferred tax credit of £398m arising from a reduction in the UK corporation tax rate from 23% to | This unaudited commentary does not form part of the | |
| ||||||||||||
of comprehensive income for the years ended 31 March
| |||||||||||||||||||||||||||||||||||||||||||||||||||||||||||||||||||||||||||||||||||||||||||||||||||||||||||||||||||||||||||||||||||||||||||||||||||||||||||||||||||||||||||||||||||||||||||||||||||||||||||||||||||||||||||||||||||||||||||||||||||||||||||||||||||||||||||||||||||||||||||||||||||||||||||||||||||||||||||||||||||||||||||||||||||||||||||||||||||||||||||||||||||||||||||||||||||||||||||||||||||||||||||||||||||||||||||||||||||||||||||||||||||||||||||||||||||||||||||||||||||
Financial Statements
| Notes | | 2014 £m | |
| 2013 (restated £m | )1
| | 2012 (restated)1 £m | | |||||||||||
| ||||||||||||||||||||
Profit for the year | 2,464 | 2,154 | 1,919 | |||||||||||||||||
Other comprehensive income/(loss) | ||||||||||||||||||||
Items that will never be reclassified to profit or loss | ||||||||||||||||||||
Remeasurements of net retirement benefit obligations | 22 | 485 | (714 | ) | (1,140) | |||||||||||||||
Tax on items that will never be reclassified to profit or loss | 6 | (172 | ) | 179 | 342 | |||||||||||||||
| ||||||||||||||||||||
Total items that will never be reclassified to profit or loss | 313 | (535 | ) | (798) | ||||||||||||||||
| ||||||||||||||||||||
Items that may be reclassified subsequently to profit or loss | ||||||||||||||||||||
Exchange adjustments | (158 | ) | 117 | 27 | ||||||||||||||||
Net gains/(losses) in respect of cash flow hedges | 63 | (31 | ) | (18) | ||||||||||||||||
Transferred to profit or loss in respect of cash flow hedges | 27 | 73 | 19 | |||||||||||||||||
Net gains on available-for-sale investments | 6 | 20 | 16 | |||||||||||||||||
Transferred to profit or loss on sale of available-for-sale investments | (14 | ) | (10 | ) | (9) | |||||||||||||||
Tax on items that may be reclassified subsequently to profit or loss | 6 | (2 | ) | (15 | ) | – | ||||||||||||||
| ||||||||||||||||||||
Total items that may be reclassified subsequently to profit or loss | (78 | ) | 154 | 35 | ||||||||||||||||
| ||||||||||||||||||||
Other comprehensive income/(loss) for the year, net of tax | 235 | (381 | ) | (763) | ||||||||||||||||
| ||||||||||||||||||||
Total comprehensive income for the year | 2,699 | 1,773 | 1,156 | |||||||||||||||||
| ||||||||||||||||||||
Attributable to: | ||||||||||||||||||||
Equity shareholders of the parent | 2,711 | 1,772 | 1,154 | |||||||||||||||||
Non-controlling interests | (12 | ) | 1 | 2 | ||||||||||||||||
| ||||||||||||||||||||
| 2,699 | 1,773 | 1,156 | ||||||||||||||||||
| ||||||||||||||||||||
1. See note 1 on page 92. | ||||||||||||||||||||
| ||||||||||||||||||||||||||||||||||||||||||||||||||||||||||||||||||||||||||||||||||||||||||||||||||||||||||||||||||||||||||||||||||||||||||||||||||||||||||||||||||||||||||||||||||||||||||||||||||||||||||||||||||||||||||||||||||||||||||||||||||||||||||||||||||||||||||||||||||||||||||||||||||||||||||||||||||||||||||||||||||||||||||||||||||||||||||||||||||||||||||||||||||||||||||||||||||||||||||||||||||||||||||||||||||||||||||||||||||||||||||||||||||||||||||||||||||||||||||||||||||||||||||||||||||||||||||||||||||||||||||||||||||||||||||||||||||||||||||||||||||||||||||||||||||||||||||||||||||||||||||||||||||||||||||||||||||||||||||||||||||||||||||||||||||||||||||||||||||||||||||||||||||||||||||||||||||||||||||||||||||||||||||||||||||||||||||||||||||||||||||||||||||||||||||||||||||
The consolidated | Exchange adjustments Adjustments are made when we translate the results and net assets of our companies operating outside the UK, as well as debt we have issued in foreign currencies. The net movement for the year resulted in a loss of £158m (2012/13: £117m gain). Net gains/(losses) in respect of cash flow hedges The value of derivatives held to hedge cash flows is impacted by changes in expected interest rates and exchange rates. The net gain for the year was £63m (2012/13: £31m loss). This unaudited commentary does not form part of the financial statements. | |||||||||||||||||||||||||||||||||||||||||||||||||||||||||||||||||||||||||||||||||||||||||||||||||||||||||||||||||||||||||||||||||||||||||||||||||||||||||||||||||||||||||||||||||||||||||||||||||||||||||||||||||||||||||||||||||||||||||||||||||||||||||||||||||||||||||||||||||||||||||||||||||||||||||||||||||||||||||||||||||||||||||||||||||||||||||||||||||||||||||||||||||||||||||||||||||||||||||||||||||||||||||||||||||||||||||||||||||||||||||||||||||||||||||||||||||||||||||||||||||||||||||||||||||||||||||||||||||||||||||||||||||||||||||||||||||||||||||||||||||||||||||||||||||||||||||||||||||||||||||||||||||||||||||||||||||||||||||||||||||||||||||||||||||||||||||||||||||||||||||||||||||||||||||||||||||||||||||||||||||||||||||||||||||||||||||||||||||||||||||||||||||||||||||||||||||
Remeasurements of net retirement benefit obligations We had a net gain after tax of £313m (2012/13: net cost of £535m) on our pension and other post-employment benefit schemes which is due to changes in key assumptions made in the valuation calculation and differences to actual outcomes during the year. | ||||||||||||||||||||||||||||||||||||||||||||||||||||||||||||||||||||||||||||||||||||||||||||||||||||||||||||||||||||||||||||||||||||||||||||||||||||||||||||||||||||||||||||||||||||||||||||||||||||||||||||||||||||||||||||||||||||||||||||||||||||||||||||||||||||||||||||||||||||||||||||||||||||||||||||||||||||||||||||||||||||||||||||||||||||||||||||||||||||||||||||||||||||||||||||||||||||||||||||||||||||||||||||||||||||||||||||||||||||||||||||||||||||||||||||||||||||||||||||||||||||||||||||||||||||||||||||||||||||||||||||||||||||||||||||||||||||||||||||||||||||||||||||||||||||||||||||||||||||||||||||||||||||||||||||||||||||||||||||||||||||||||||||||||||||||||||||||||||||||||||||||||||||||||||||||||||||||||||||||||||||||||||||||||||||||||||||||||||||||||||||||||||||||||||||||||||
Strategic Report | Corporate Governance | Financial Statements | Additional Information | 87 |
of changes in equity for the years ended 31 March |
| | Called up share capital £m | | | Share premium account £m | | | Retained earnings £m | |
| Other equity reserves £m | 1
|
| Total shareholders’ equity £m |
|
| Non- controlling interests £m |
| Total equity £m | ||||||||||||
| ||||||||||||||||||||||||||||||
Equity as at 1 April 2011 as previously reported | 416 | 1,361 | 12,153 | (4,870 | ) | 9,060 | 9 | 9,069 | ||||||||||||||||||||||
Impact of change in accounting policy2 | – | – | (8 | ) | – | (8 | ) | – | (8) | |||||||||||||||||||||
| ||||||||||||||||||||||||||||||
Equity as at 1 April 2011 (restated) | 416 | 1,361 | 12,145 | (4,870 | ) | 9,052 | 9 | 9,061 | ||||||||||||||||||||||
Profit for the year2 | – | – | 1,917 | – | 1,917 | 2 | 1,919 | |||||||||||||||||||||||
Total other comprehensive (loss)/income for the year2 | – | – | (798 | ) | 35 | (763 | ) | – | (763) | |||||||||||||||||||||
| ||||||||||||||||||||||||||||||
Total comprehensive income for the year2 | – | – | 1,119 | 35 | 1,154 | 2 | 1,156 | |||||||||||||||||||||||
Equity dividends | – | – | (1,319 | ) | – | (1,319 | ) | – | (1,319) | |||||||||||||||||||||
Scrip dividend related share issue3 | 6 | (6 | ) | 313 | – | 313 | – | 313 | ||||||||||||||||||||||
Issue of treasury shares | – | – | 13 | – | 13 | – | 13 | |||||||||||||||||||||||
Purchase of own shares | – | – | (4 | ) | – | (4 | ) | – | (4) | |||||||||||||||||||||
Other movements in non-controlling interests | – | – | – | – | – | (4 | ) | (4) | ||||||||||||||||||||||
Share-based payment | – | – | 24 | – | 24 | – | 24 | |||||||||||||||||||||||
Tax on share-based payment | – | – | 3 | – | 3 | – | 3 | |||||||||||||||||||||||
| ||||||||||||||||||||||||||||||
At 31 March 2012 (restated) | 422 | 1,355 | 12,294 | (4,835 | ) | 9,236 | 7 | 9,243 | ||||||||||||||||||||||
Profit for the year2 | – | – | 2,153 | – | 2,153 | 1 | 2,154 | |||||||||||||||||||||||
Total other comprehensive (loss)/income for the year2 | – | – | (535 | ) | 154 | (381 | ) | – | (381) | |||||||||||||||||||||
| ||||||||||||||||||||||||||||||
Total comprehensive income for the year2 | – | – | 1,618 | 154 | 1,772 | 1 | 1,773 | |||||||||||||||||||||||
Equity dividends | – | – | (1,433 | ) | – | (1,433 | ) | – | (1,433) | |||||||||||||||||||||
Scrip dividend related share issue3 | 11 | (11 | ) | 623 | – | 623 | – | 623 | ||||||||||||||||||||||
Issue of treasury shares | – | – | 19 | – | 19 | – | 19 | |||||||||||||||||||||||
Purchase of own shares | – | – | (6 | ) | – | (6 | ) | – | (6) | |||||||||||||||||||||
Other movements in non-controlling interests | – | – | – | – | – | (3 | ) | (3) | ||||||||||||||||||||||
Share-based payment | – | – | 20 | – | 20 | – | 20 | |||||||||||||||||||||||
Tax on share-based payment | – | – | (2 | ) | – | (2 | ) | – | (2) | |||||||||||||||||||||
| ||||||||||||||||||||||||||||||
At 31 March 2013 (restated) | 433 | 1,344 | 13,133 | (4,681 | ) | 10,229 | 5 | 10,234 | ||||||||||||||||||||||
Profit for the year | – | – | 2,476 | – | 2,476 | (12 | ) | 2,464 | ||||||||||||||||||||||
Total other comprehensive income/(loss) for the year | – | – | 313 | (78 | ) | 235 | – | 235 | ||||||||||||||||||||||
| ||||||||||||||||||||||||||||||
Total comprehensive income/(loss) for the year | – | – | 2,789 | (78 | ) | 2,711 | (12 | ) | 2,699 | |||||||||||||||||||||
Equity dividends | – | – | (1,503 | ) | – | (1,503 | ) | – | (1,503) | |||||||||||||||||||||
Scrip dividend related share issue3 | 6 | (8 | ) | 444 | – | 442 | – | 442 | ||||||||||||||||||||||
Issue of treasury shares | – | – | 14 | – | 14 | – | 14 | |||||||||||||||||||||||
Purchase of own shares | – | – | (5 | ) | – | (5 | ) | – | (5) | |||||||||||||||||||||
Other movements in non-controlling interests | – | – | (4 | ) | – | (4 | ) | 15 | 11 | |||||||||||||||||||||
Share-based payment | – | – | 20 | – | 20 | – | 20 | |||||||||||||||||||||||
Tax on share-based payment | – | – | 7 | – | 7 | – | 7 | |||||||||||||||||||||||
| ||||||||||||||||||||||||||||||
At 31 March 2014 | 439 | 1,336 | 14,895 | (4,759 | ) | 11,911 | 8 | 11,919 | ||||||||||||||||||||||
| ||||||||||||||||||||||||||||||
1. For further details of other equity reserves, see note 25 on page 129. 2. See note 1 on page 92. 3. Included within share premium account are costs associated with scrip dividends. | ||||||||||||||||||||||||||||||
Unaudited commentary on consolidated statement of changes in equity | ||||
The consolidated statement of changes in equity | Dividends We paid a total of | |||
This unaudited commentary does not form part of the financial
| ||||
| ||||||||||||
of financial position as at 31 March |
| Notes | 2014 £m | 2013 £m | ||||||||||||||
| ||||||||||||||||
Non-current assets | ||||||||||||||||
Goodwill | 9 | 4,594 | 5,028 | |||||||||||||
Other intangible assets | 10 | 669 | 589 | |||||||||||||
Property, plant and equipment | 11 | 37,179 | 36,592 | |||||||||||||
Other non-current assets | 12 | 87 | 104 | |||||||||||||
Pension assets | 22 | 174 | 195 | |||||||||||||
Financial and other investments | 13 | 284 | 278 | |||||||||||||
Investments in joint ventures and associates | 14 | 351 | 371 | |||||||||||||
Derivative financial assets | 15 | 1,557 | 1,972 | |||||||||||||
| ||||||||||||||||
Total non-current assets | 44,895 | 45,129 | ||||||||||||||
| ||||||||||||||||
Current assets | ||||||||||||||||
Inventories and current intangible assets | 16 | 268 | 291 | |||||||||||||
Trade and other receivables | 17 | 2,855 | 2,910 | |||||||||||||
Financial and other investments | 13 | 3,599 | 5,431 | |||||||||||||
Derivative financial assets | 15 | 413 | 273 | |||||||||||||
Cash and cash equivalents | 18 | 354 | 671 | |||||||||||||
| ||||||||||||||||
Total current assets | 7,489 | 9,576 | ||||||||||||||
| ||||||||||||||||
Total assets | 52,384 | 54,705 | ||||||||||||||
| ||||||||||||||||
Current liabilities | ||||||||||||||||
Borrowings | 19 | (3,511 | ) | (3,448) | ||||||||||||
Derivative financial liabilities | 15 | (339 | ) | (407) | ||||||||||||
Trade and other payables | 20 | (3,031 | ) | (3,051) | ||||||||||||
Current tax liabilities | (168 | ) | (231) | |||||||||||||
Provisions | 23 | (282 | ) | (308) | ||||||||||||
| ||||||||||||||||
Total current liabilities | (7,331 | ) | (7,445) | |||||||||||||
| ||||||||||||||||
Non-current liabilities | ||||||||||||||||
Borrowings | 19 | (22,439 | ) | (24,647) | ||||||||||||
Derivative financial liabilities | 15 | (824 | ) | (1,274) | ||||||||||||
Other non-current liabilities | 21 | (1,841 | ) | (1,884) | ||||||||||||
Deferred tax liabilities | 6 | (4,082 | ) | (4,077) | ||||||||||||
Pensions and other post-retirement benefit obligations | 22 | (2,585 | ) | (3,692) | ||||||||||||
Provisions | 23 | (1,363 | ) | (1,452) | ||||||||||||
| ||||||||||||||||
Total non-current liabilities | (33,134 | ) | (37,026) | |||||||||||||
| ||||||||||||||||
Total liabilities | (40,465 | ) | (44,471) | |||||||||||||
| ||||||||||||||||
Net assets | 11,919 | 10,234 | ||||||||||||||
| ||||||||||||||||
Equity | ||||||||||||||||
Share capital | 24 | 439 | 433 | |||||||||||||
Share premium account | 1,336 | 1,344 | ||||||||||||||
Retained earnings | 14,895 | 13,133 | ||||||||||||||
Other equity reserves | 25 | (4,759 | ) | (4,681) | ||||||||||||
| ||||||||||||||||
Shareholders’ equity | 11,911 | 10,229 | ||||||||||||||
Non-controlling interests | 8 | 5 | ||||||||||||||
| ||||||||||||||||
Total equity | 11,919 | 10,234 | ||||||||||||||
| ||||||||||||||||
1. See note 1 on page 92.
The consolidated financial statements set out on pages 82 to 154 were approved by the Board of Directors on 18 May 2014 and were signed on its behalf by:
Sir Peter Gershon Chairman Andrew Bonfield Finance Director
|
| |||||||||||||||
| Corporate Governance | Financial Statements | Additional Information | 89 |
Unaudited commentary on consolidated statement of financial position
| ||||||||||
The consolidated statement of financial position sets out all the Group’s assets and liabilities at the year end. As a capital-intensive business, we have significant amounts of physical assets and corresponding borrowings. | of £42m, more than offset by foreign exchange movements of £112m and utilisation of £288m in relation to all classes of provisions. Other non-current liabilities decreased by £43m principally due to foreign exchange movements of £47m.
Net debt Net debt is the aggregate of cash and cash equivalents, current financial and other investments, borrowings, and derivative financial assets and liabilities. See further analysis with the consolidated cash flow statement on page 90.
Net pension and other post-retirement obligations A summary of the total UK and US assets and liabilities and the overall net IAS 19 (revised) accounting deficit is shown below: | |||||||||
Goodwill and other intangible assets Goodwill and intangibles decreased by £354m to £5,263m as at 31 March 2014. This decrease primarily relates to foreign exchange movements of £472m and software amortisation of £127m, partially offset by software additions of £179m. | ||||||||||
Property, plant and equipment Property, plant and equipment increased by £587m to £37,179m as at 31 March 2014. This was principally due to capital expenditure of £3,262m on the renewal and extension of our regulated networks, offset by foreign exchange movements of £1,244m, and £1,299m of depreciation in the year.
Investments and other non-current assets Investments in joint ventures and associates, financial and other investments and other non-current assets have decreased by £31m to £722m. This is principally due to changes in the fair value of our US commodity contract assets and available-for-sale investments.
Inventories and current intangible assets, and trade and other receivables Inventories and current intangible assets, and trade and other receivables have decreased by £78m to £3,123m at 31 March 2014. This decrease is principally due to foreign exchange movements of £195m, partially offset by an increase in trade and other receivables of £120m mostly due to colder weather in the US in February and March 2014 compared with 2013 resulting in increased billings for commodity costs and customer usage.
Trade and other payables Trade and other payables have decreased by £20m to £3,031m due to favourable foreign exchange movements of £150m, partially offset by higher payables in the UK due in part to changes in payment terms with new Gas Distribution strategic partners and increased activity on the Western Link project.
Current tax liabilities Current tax liabilities have decreased by £63m to £168m as at 31 March 2014. This is primarily due to higher tax payments made in 2013/14 although these were partially offset by a larger current year tax charge.
Deferred tax liabilities Deferred tax liabilities have increased by £5m to £4,082m as at 31 March 2014. This was primarily due to the impact of the £172m deferred tax charge on actuarial gains (a £179m tax credit in 2012/13) being offset by the impact of the reduction in the UK statutory tax rate for future periods, foreign exchange movements and the reduction in prior year charges.
Provisions and other non-current liabilities Provisions (both current and non-current) and other non-current liabilities decreased by £158m to £3,486m as at 31 March 2014.
Total provisions decreased by £115m in the year. The underlying movements include additions of £230m primarily relating to a provision for the demolition of certain gas holders in the UK of £79m, restructuring provisions of £86m and other provisions
| Net plan liability | UK £m | US £m | Total £m | ||||||
| ||||||||||
| As at 1 April 2013 (as restated) | (1,169) | (2,328) | (3,497) | |||||||
| Exchange movements | – | 186 | 186 | |||||||
| Current service cost | (96) | (129) | (225) | |||||||
| Net interest cost | (47) | (81) | (128) | |||||||
| Curtailments and settlements – LIPA | – | 214 | 214 | |||||||
| Curtailments and settlements – other | (30) | (12) | (42) | |||||||
| Actuarial (losses)/gains | ||||||||||
– on plan assets | (98) | 283 | 185 | |||||||
– on plan liabilities | 452 | (152) | 300 | |||||||
| Employer contributions | 235 | 361 | 596 | |||||||
| ||||||||||
| As at 31 March 2014 | (753) | (1,658) | (2,411) | |||||||
| ||||||||||
| Represented by: | ||||||||||
Plan assets | – | 174 | 174 | |||||||
Plan liabilities | (753) | (1,832) | (2,585) | |||||||
| ||||||||||
| (753) | (1,658) | (2,411) | ||||||||
| ||||||||||
The principal movements in net obligations during the year include a curtailment gain of £214m following the LIPA MSA transition, net actuarial gains of £485m and employer contributions of £596m. Net actuarial gains include actuarial gains on plan liabilities of £542m arising as a consequence of an increase in the UK real discount rate and the nominal discount rate in the US. This is partially offset by actuarial losses of £283m arising from increases in life expectancy in the US. Actuarial (losses)/gains on plan assets reflects the asset allocations in the different plans. In both the UK and US, returns on equities were above the assumed rate; however, UK government securities had negative returns and corporate bonds were close to nil.
Further information on our pension and other post-retirement obligations can be found in notes 22 and 29 to the consolidated financial statements. Details of the restatements made for IAS 19 (revised) can be found in note 1.
Off balance sheet items There were no significant off balance sheet items other than the contractual obligations shown in note 30 (b) to the consolidated financial statements, and the commitments and contingencies discussed in note 27.
Through the ordinary course of our operations, we are party to various litigation, claims and investigations. We do not expect the ultimate resolution of any of these proceedings to have a material adverse effect on our results of operations, cash flows or financial position.
This unaudited commentary does not form part of the financial statements. | ||||||||||
90 National Grid Annual Report and Accounts 2013/14 | ||||||||||||
Consolidated cash flow statement for the years ended 31 March
| ||||||||||||||||||||||||||||||||||||||||||||||||||||||||||||||||||||||||||||||||||||||||||||||||||||||||||||||||||||||||||||||||||||||||||||||||||||||||||||||||||||||||||||||||||||||||||||||||||||||||||||||||||||||||||||||||||||||||||||||||||||||||||||||||||||||||||||||||||||||||||||||||||||||||||||||||||||||||||||||||||||||||||||||||||||||||||||||||||||||||||||||||||||||||||||||||||||||||||||||||||||||||||||||||||||||||||||||||||||||||||||||||||||||||||||||||||||||||||||||||||||||||||||||||||||||||||||||||||||||||||||||||||||||||||||||||||||||||||||||||||||||||||||||||||||||||||||||||||||||||||||||||||||||||||||||||||||||||||||||||||||||||||||||||||||||||||||||||||||||||||||||||||||||||||||||||||||||||||||||||||||||||||||||||||||||||||||||||||||||||||||||||||||||||||||||||||||||||||||||||||||||||||||||||||||||||||||||||||||||||||||||||||||||||||||||||||||||||||||||||||||||||||||||||||||||||||||||||||||||||||||||||
Strategic Report | Corporate Governance | Financial Statements | Additional Information | 91 | |||||||||||||||||||||||||||||||||||||||||||||||||||||||||||||||||||||||||||||||||||||||||||||||||||||||||||||||||||||||||||||||||||||||||||||||||||||||||||||||||||||||||||||||||||||||||||||||||||||||||||||||||||||||||||||||||||||||||||||||||||||||||||||||||||||||||||||||||||||||||||||||||||||||||||||||||||||||||||||||||||||||||||||||||||||||||||||||||||||||||||||||||||||||||||||||||||||||||||||||||||||||||||||||||||||||||||||||||||||||||||||||||||||||||||||||||||||||||||||||||||||||||||||||||||||||||||||||||||||||||||||||||||||||||||||||||||||||||||||||||||||||||||||||||||||||||||||||||||||||||||||||||||||||||||||||||||||||||||||||||||||||||||||||||||||||||||||||||||||||||||||||||||||||||||||||||||||||||||||||||||||||||||||||||||||||||||||||||||||||||||||||||||||||||||||||||||||||||||||||||||||||||||||||||||||||||||||||||||||||||||||||||||||||||||||||||||||||||||||||||||||||||||||||||||||||||||||||||||||||||||||||||||||||||||||||||||||||||||||||||||||||||||||||||||||||||||||||||||
Unaudited commentary on consolidated cash flow statement
| ||||||||||||
The consolidated cash flow statement shows how the cash balance has moved during the year. Cash inflows and outflows are presented to allow users to understand how they relate to the day-to-day operations of the business (operating activities); the money that has been spent or earned on assets in the year, including acquisitions of physical assets or other businesses (investing activities); and the cash raised from debt or share issues and other loan borrowings or repayments (financing activities).
| receivables increased due to colder weather in the US in February and March 2014, cash outflows relating to exceptional items were £38m higher due to reorganisation in the UK and LIPA MSA transition costs in the US.
Net capital expenditure Net capital expenditure in the year of £3,119m was £238m lower than the prior year. This was a result of lower spend in our UK regulated businesses, the impact of the weaker dollar, and reduced capital spend on the US enterprise resource system in 2013/14.
Net interest paid Net interest paid in 2013/14 was £866m, £103m higher than 2012/13, due to higher average net debt levels.
Tax paid Tax paid in the year to 31 March 2014 was £400m, £113m higher than prior year. This reflected higher tax payments in the UK on higher taxable profits.
Net acquisitions and disposals There were no material acquisitions or disposals in the year. The year ended 31 March 2013 included proceeds received on the disposal of our gas and electricity businesses in New Hampshire in the US.
Dividends paid Dividends paid in the year ended 31 March 2014 amounted to £1,059m. This was £249m higher than 2012/13, reflecting the 4% increase in the final dividend for the year ended 31 March 2013 paid in August 2013, together with a lower average scrip dividend take-up in the year. Given the relatively high scrip uptake for the dividend paid in August 2013, no scrip option was offered for the interim dividend paid in January 2014.
Other cash movements Other cash flows principally arise from dividends from joint ventures and movements in treasury shares.
Non-cash movements The non-cash movements are predominantly due to the change in foreign exchange arising on net debt held in currencies other than sterling. In the year ended 31 March 2014, the dollar weakened from $1.52 at 31 March 2013 to $1.67 at 31 March 2014. This has caused a reduction in the sterling value of net debt.
Other non-cash movements are from changes in fair values of financial assets and liabilities and interest accretions and accruals.
Net debt
Net debt at 31 March £m
This unaudited commentary does not form part of the financial statements.
| |||||||||||
Reconciliation of cash flow to net debt | ||||||||||||
| 2014 | 2013 | |||||||||||
| £m | £m | |||||||||||
| ||||||||||||
Cash generated from operations | 4,419 | 4,037 | ||||||||||
Net capital expenditure | (3,119) | (3,357) | ||||||||||
| ||||||||||||
Business net cash flow | 1,300 | 680 | ||||||||||
| ||||||||||||
Net interest paid | (866) | (763) | ||||||||||
Tax paid | (400) | (287) | ||||||||||
Net acquisitions and disposals | (4) | 169 | ||||||||||
Dividends paid | (1,059) | (810) | ||||||||||
Other cash movements | 47 | 34 | ||||||||||
Non-cash movements | 1,221 | (855) | ||||||||||
| ||||||||||||
Decrease/(increase) in net debt | 239 | (1,832) | ||||||||||
| ||||||||||||
Opening net debt | (21,429) | (19,597) | ||||||||||
| ||||||||||||
Closing net debt | (21,190) | (21,429) | ||||||||||
| ||||||||||||
Cash generated from operations
Cash generated from operations £m
Cash flows from our operations are largely stable when viewed over the longer term. Our electricity and gas transmission and distribution operations in the UK and US are subject to multi-year rate agreements with regulators. In the UK, we have largely stable intra-year cash flows. However, in the US our short-term cash flows are dependent on the price of gas and electricity and the timing of customer payments. The regulatory mechanisms for recovering costs from customers can result in significant cash flow swings from year to year. Changes in volumes in the US, for example as a consequence of abnormally mild or extreme weather can affect cash flows, particularly in the winter months.
For the year ended 31 March 2014, cash flow from operations increased by £382m to £4,419m.
Adjusted operating profit before depreciation, amortisation and impairment was £81m higher year on year. Changes in working capital improved by £351m over the prior year, principally in the US due to the collection of receivables from LIPA relating to Superstorm Sandy. Partially offsetting this improvement, | ||||||||||||
92 National Grid Annual Report and Accounts | ||||||||||||
Notes to the consolidated financial statements – analysis of items in the primary statements |
1.Adoption of IAS 19 (revised) ‘Employee benefits’
| ||||||||||||||
This note sets out the impact that the required adoption of IAS 19 (revised) ‘Employee benefits’ has had on our previously reported results. It provides details of the originally reported and the restated figures.
| ||||||||||||||
During the year, the Group adopted IAS 19 (revised) ‘Employee benefits’. The adoption constitutes a change in accounting policy and therefore the comparative information has been restated.
The standard requires past service costs to be recognised immediately in profit or loss and all actuarial gains and losses are recognised in other comprehensive income as they occur. The standard also replaces the interest cost on the DB obligation and the expected return on plan assets with a net interest cost based on the net DB asset or liability and the discount rate, measured at the beginning of the year. The impact on the Group for the years ended 31 March 2013 and 31 March 2012 is set out in the table below:
| ||||||||||||||
As previously reported | Restatement for IAS 19 (revised) | As restated | ||||||||||||
31 March 2013 £m | 31 March £m | 31 March 2013 £m | 31 March £m | 31 March £m | 31 March 2012 £m | |||||||||
| ||||||||||||||
Consolidated income statement | ||||||||||||||
| Operating costs | (10,605) | (10,293) | (5) | (4) | (10,610) | (10,297) | ||||||||
| Total operating profit | 3,754 | 3,539 | (5) | (4) | 3,749 | 3,535 | ||||||||
| Total finance income | 1,252 | 1,301 | (1,222) | (1,273) | 30 | 28 | ||||||||
| Total finance costs | (2,104) | (2,288) | 1,018 | 1,100 | (1,086) | (1,188) | ||||||||
| Total profit before tax | 2,920 | 2,559 | (209) | (177) | 2,711 | 2,382 | ||||||||
| Total taxation | (624) | (521) | 67 | 58 | (557) | (463) | ||||||||
| Profit for the year | 2,296 | 2,038 | (142) | (119) | 2,154 | 1,919 | ||||||||
| ||||||||||||||
Consolidated statement of financial position | ||||||||||||||
| Deferred tax liabilities | (4,076) | (3,738) | (1) | 2 | (4,077) | (3,736) | ||||||||
| Pensions and other post-retirement benefit obligations | (3,694) | (3,088) | 2 | (5) | (3,692) | (3,093) | ||||||||
| Total non-current liabilities | (37,027) | (31,998) | 1 | (3) | (37,026) | (32,001) | ||||||||
| Total liabilities | (44,472) | (38,089) | 1 | (3) | (44,471) | (38,092) | ||||||||
| Retained earnings | 13,132 | 12,297 | 1 | (3) | 13,133 | 12,294 | ||||||||
| Total equity | 10,233 | 9,246 | 1 | (3) | 10,234 | 9,243 | ||||||||
| ||||||||||||||
Consolidated statement of other comprehensive income | ||||||||||||||
| Remeasurements of net retirement benefit obligations | (930) | (1,325) | 216 | 185 | (714) | (1,140) | ||||||||
Tax on items that will never be reclassified to profit or loss | 249 | 403 | (70) | (61) | 179 | 342 | ||||||||
| Total comprehensive income for the year | 1,769 | 1,151 | 4 | 5 | 1,773 | 1,156 | ||||||||
| ||||||||||||||
Consolidated statement of changes in equity | ||||||||||||||
| Other comprehensive income | (527) | (887) | 146 | 124 | (381) | (763) | ||||||||
| Total comprehensive income for the year | 1,769 | 1,151 | 4 | 5 | 1,773 | 1,156 | ||||||||
| ||||||||||||||
| Consolidated cash flow statement | ||||||||||||||
| Pensions and other post-retirement benefit obligations | (413) | (386) | 5 | 4 | (408) | (382) | ||||||||
| ||||||||||||||
| EPS – basic | 62.6p | 55.6p | (4.8)p | (4.0)p | 57.8p | 51.6p | ||||||||
| EPS – diluted | 62.3p | 55.4p | (4.8)p | (4.1)p | 57.5p | 51.3p | ||||||||
| ||||||||||||||
The restated amounts for EPS in the above table reflect the impact of additional shares issued as scrip dividends. The effect of the change in accounting policy on the statement of cash flows was immaterial, with no impact on the cash position at any of the reporting dates.
We have revised our pension and other post-retirement benefit obligations disclosures in notes 22 and 29 to provide greater clarity by separately presenting our UK and US pension plans due to their different risk profiles.
| ||||||||||||||
Strategic Report | Corporate Governance | Financial Statements | Additional Information
| 93
|
| Notes | 2012 £m | 2011 £m | 2010 £m | |||||||||||||||||||||
Cash flows from operating activities | ||||||||||||||||||||||||
Total operating profit | 1(b | ) | 3,539 | 3,745 | 3,293 | |||||||||||||||||||
Adjustments for: | ||||||||||||||||||||||||
Exceptional items, remeasurements and stranded cost recoveries | 3 | (44 | ) | (145 | ) | (172 | ) | |||||||||||||||||
Depreciation, amortisation and impairment | 1,282 | 1,245 | 1,188 | |||||||||||||||||||||
Share-based payment charge | 24 | 25 | 25 | |||||||||||||||||||||
Changes in working capital | 146 | 185 | 431 | |||||||||||||||||||||
Changes in provisions | (116 | ) | (93 | ) | (98 | ) | ||||||||||||||||||
Changes in pensions and other post-retirement benefit obligations | (386 | ) | (304 | ) | (521 | ) | ||||||||||||||||||
Cash flows relating to exceptional items | (205 | ) | (147 | ) | (135 | ) | ||||||||||||||||||
Cash flows relating to stranded cost recoveries | 247 | 343 | 361 | |||||||||||||||||||||
Cash generated from operations | 4,487 | 4,854 | 4,372 | |||||||||||||||||||||
Tax (paid)/received | (259 | ) | 4 | 144 | ||||||||||||||||||||
Net cash inflow from operating activities | 4,228 | 4,858 | 4,516 | |||||||||||||||||||||
Cash flows from investing activities | ||||||||||||||||||||||||
Acquisition of investments | (13 | ) | (135 | ) | (86 | ) | ||||||||||||||||||
Net proceeds from sale of investments in subsidiaries | 365 | 11 | 6 | |||||||||||||||||||||
Purchases of intangible assets | (203 | ) | (176 | ) | (104 | ) | ||||||||||||||||||
Purchases of property, plant and equipment | (3,147 | ) | (2,958 | ) | (3,007 | ) | ||||||||||||||||||
Disposals of property, plant and equipment | 24 | 26 | 15 | |||||||||||||||||||||
Dividends received from joint ventures | 26 | 9 | 18 | |||||||||||||||||||||
Interest received | 24 | 26 | 21 | |||||||||||||||||||||
Net movements in short-term financial investments | 553 | (1,577 | ) | 805 | ||||||||||||||||||||
Net cash flow used in investing activities | (2,371 | ) | (4,774 | ) | (2,332 | ) | ||||||||||||||||||
Cash flows from financing activities | ||||||||||||||||||||||||
Proceeds of rights issue | – | 3,214 | – | |||||||||||||||||||||
Proceeds from issue of treasury shares | 13 | 18 | 18 | |||||||||||||||||||||
Purchase of own shares | (4 | ) | (3 | ) | (7 | ) | ||||||||||||||||||
Proceeds from loans received | 1,809 | 767 | 1,933 | |||||||||||||||||||||
Repayment of loans | (1,914 | ) | (2,878 | ) | (2,257 | ) | ||||||||||||||||||
Net movements in short-term borrowings and derivatives | (49 | ) | 348 | (175 | ) | |||||||||||||||||||
Interest paid | (749 | ) | (965 | ) | (1,003 | ) | ||||||||||||||||||
Exceptional finance costs on the redemption of debt | – | (73 | ) | (33 | ) | |||||||||||||||||||
Dividends paid to shareholders | (1,006 | ) | (858 | ) | (688 | ) | ||||||||||||||||||
Net cash flow used in financing activities | (1,900 | ) | (430 | ) | (2,212 | ) | ||||||||||||||||||
Net decrease in cash and cash equivalents | 27(a | ) | (43 | ) | (346 | ) | (28 | ) | ||||||||||||||||
Exchange movements | – | (3 | ) | (1 | ) | |||||||||||||||||||
Net cash and cash equivalents at start of year | 342 | 691 | 720 | |||||||||||||||||||||
Net cash and cash equivalents at end of year (i) | 17 | 299 | 342 | 691 | ||||||||||||||||||||
| |||||||||||
This note sets out the financial performance for the year split into the different parts of the business (operating segments). We monitor and manage the performance of these operating segments on a day-to-day basis.
We own a portfolio of businesses that range from cash generative developed assets with minimal investment requirements (such as National Grid
Our regulated businesses earn revenue for the transmission, distribution and generation services they have provided during the year. In any one year, the revenue recognised may differ from that allowed under our regulatory agreements and any such timing differences are adjusted through future prices. Our non-regulated businesses earn revenue in line with their contractual terms.
Revenue primarily represents the sales value derived from the generation, transmission and distribution of energy, together with the sales value derived from the provision of other services to customers and, previously, recovery of US stranded costs during the year. It excludes value added (sales) tax and intra-group sales. Revenue includes an assessment of unbilled energy and transportation services supplied to customers between the date of the last meter reading and the year end. This is estimated based on historical consumption and weather patterns. Where revenue exceeds the maximum amount permitted by regulatory agreement and adjustments will be made to future prices to reflect this over-recovery, no liability is recognised, as such an adjustment relates to the provision of future services. Similarly no asset is recognised where a regulatory agreement permits adjustments to be made to future prices in respect of an under-recovery. US stranded costs were various generation-related costs incurred prior to the divestiture of generation assets beginning in the late 1990s and costs of legacy contracts that are being recovered from customers. The We present revenue and the results of the business analysed by operating
Following the commencement of new RIIO regulatory arrangements in the UK, we have changed the way in which we report our operational and financial performance. We have reviewed our segmental disclosure for the year ended 31 March 2014 with the separation of our UK Transmission segment into two new segments: UK Electricity Transmission and UK Gas Transmission. We have also moved the Great Britain-France electricity interconnector from UK Electricity Transmission to Other activities. The information given in this note for the years ended 31 March 2013 and 2012 has been restated to provide a like-for-like comparison. |
Other activities primarily relate to non-regulated businesses and other commercial operations not included within the above segments, including: UK based gas and electricity metering activities (including OnStream up to the date it was sold on 24 October 2011); UK property management; a UK LNG import terminal; other LNG operations; US unregulated transmission pipelines; US gas fields (related to Seneca-Upshur up to the date it was sold on 3 October 2011); together with corporate activities.
Sales between operating segments are priced having regard to the regulatory and legal requirements to which the businesses are subject. The analysis of revenue by geographical area is on the basis of destination. There are no material sales between the UK and US geographical areas.
As a consequence of the introduction of a new operating model, which took effect on 4 April 2011, there has been a change to the reported segments: the US Transmission, US Gas Distribution and US Electricity Distribution & Generation segments which were presented as separate segments in prior periods, have been combined and are reported as a single ‘US Regulated’ segment.
(a) Revenue
Total sales 2012 £m | Sales between segments 2012 £m | Sales to third parties 2012 £m | Total sales 2011 £m | Sales between segments 2011 £m | Sales to third parties 2011 £m | Total sales 2010 £m | Sales between segments 2010 £m | Sales to third parties 2010 £m | ||||||||||||||||||||||||||||||||||
Operating segments | ||||||||||||||||||||||||||||||||||||||||||
UK Transmission | 3,804 | (5 | ) | 3,799 | 3,484 | (7 | ) | 3,477 | 3,475 | (6 | ) | 3,469 | ||||||||||||||||||||||||||||||
UK Gas Distribution | 1,605 | (52 | ) | 1,553 | 1,524 | (60 | ) | 1,464 | 1,518 | (70 | ) | 1,448 | ||||||||||||||||||||||||||||||
US Regulated | 7,795 | – | 7,795 | 8,746 | – | 8,746 | 8,372 | – | 8,372 | |||||||||||||||||||||||||||||||||
Other activities | 715 | (30 | ) | 685 | 678 | (22 | ) | 656 | 741 | (23 | ) | 718 | ||||||||||||||||||||||||||||||
| 13,919 | (87 | ) | 13,832 | 14,432 | (89 | ) | 14,343 | 14,106 | (99 | ) | 14,007 | |||||||||||||||||||||||||||||||
Total excluding stranded | 13,553 | 13,988 | 13,631 | |||||||||||||||||||||||||||||||||||||||
Stranded cost recoveries | 279 | 355 | 376 | |||||||||||||||||||||||||||||||||||||||
| 13,832 | 14,343 | 14,007 | ||||||||||||||||||||||||||||||||||||||||
Geographical areas | ||||||||||||||||||||||||||||||||||||||||||
UK | 6,000 | 5,556 | 5,543 | |||||||||||||||||||||||||||||||||||||||
US | 7,832 | 8,787 | 8,464 | |||||||||||||||||||||||||||||||||||||||
| 13,832 | 14,343 | 14,007 | ||||||||||||||||||||||||||||||||||||||||
Where revenue received or receivable exceeds the maximum amount permitted by regulatory agreement and adjustments will be made to future prices to reflect the over-recovery, no liability is recognised. Similarly, no asset is recognised where a regulatory agreement permits adjustments to be made to future prices in respect of an under-recovery. In the UK, there was an under-recovery of £26m at 31 March 2012 (2011: £34m; 2010: £100m). In the US, under-recoveries and other regulatory entitlements to future revenue amounted to £1,429m at 31 March 2012 (2011: £1,618m; 2010: £2,333m).
94 National Grid Annual Report and Accounts 2011/12National Grid plc1252013/14
Notes to the consolidated financial statementscontinued |
2. Segmental analysiscontinued The following table describes the main activities for each operating segment:
| ||||||||||||||||||||
| ||||||||||||||||||||
| UK Electricity Transmission | High voltage electricity transmission networks in Great Britain. | |||||||||||||||||||
| ||||||||||||||||||||
| UK Gas Transmission | The gas transmission network in Great Britain and UK LNG storage activities. | |||||||||||||||||||
| ||||||||||||||||||||
| UK Gas Distribution | Four of the eight regional networks of Great Britain’s gas distribution system. | |||||||||||||||||||
| ||||||||||||||||||||
| US Regulated | Gas distribution networks, electricity distribution networks and high voltage electricity transmission networks in New York and New England (including EnergyNorth and Granite State up to the date they were sold on 3 July 2012) and electricity generation facilities in New York and Massachusetts. | |||||||||||||||||||
| ||||||||||||||||||||
Other activities primarily relate to non-regulated businesses and other commercial operations not included within the above segments, including: the Great Britain-France electricity interconnector; UK-based gas metering activities; UK property management; a UK LNG import terminal; US LNG operations; US unregulated transmission pipelines; together with corporate activities.
Sales between operating segments are priced considering the regulatory and legal requirements to which the businesses are subject. The analysis of revenue by geographical area is on the basis of destination. There are no material sales between the UK and US geographical areas.
(a) Revenue
| ||||||||||||||||||||
| 2014 | 2013 | 2012 | ||||||||||||||||||
| Total sales £m | Sales between segments £m | Sales to third parties £m | Total sales (restated)1 £m | Sales between segments (restated)1 £m | Sales to third parties (restated)1 £m | Total sales (restated)1 £m | Sales between segments (restated)1 £m | Sales to third parties (restated)1 £m | ||||||||||||
| ||||||||||||||||||||
Operating segments | ||||||||||||||||||||
UK Electricity Transmission | 3,387 | (14) | 3,373 | 3,110 | (15) | 3,095 | 2,811 | (16) | 2,795 | |||||||||||
UK Gas Transmission | 941 | (104) | 837 | 1,118 | (89) | 1,029 | 983 | (8) | 975 | |||||||||||
UK Gas Distribution | 1,898 | (49) | 1,849 | 1,714 | (47) | 1,667 | 1,605 | (52) | 1,553 | |||||||||||
US Regulated | 8,040 | – | 8,040 | 7,918 | – | 7,918 | 7,795 | – | 7,795 | |||||||||||
Other activities | 736 | (26) | 710 | 678 | (28) | 650 | 744 | (30) | 714 | |||||||||||
| ||||||||||||||||||||
| 15,002 | (193) | 14,809 | 14,538 | (179) | 14,359 | 13,938 | (106) | 13,832 | ||||||||||||
| ||||||||||||||||||||
Total excluding stranded cost recoveries | 14,809 | 14,359 | 13,553 | |||||||||||||||||
Stranded cost recoveries | – | – | 279 | |||||||||||||||||
| ||||||||||||||||||||
| 14,809 | 14,359 | 13,832 | ||||||||||||||||||
| ||||||||||||||||||||
| ||||||||||||||||||||
Geographical areas | ||||||||||||||||||||
UK | 6,759 | 6,421 | 6,000 | |||||||||||||||||
US | 8,050 | 7,938 | 7,832 | |||||||||||||||||
| ||||||||||||||||||||
| 14,809 | 14,359 | 13,832 | ||||||||||||||||||
| ||||||||||||||||||||
1. Restated to reflect the changes in operating segment presentation as described on page 93.
| ||||||||||||||||||||
Strategic Report | Corporate Governance | Financial Statements | Additional Information | 95 |
| 2. Segmental analysiscontinued | ||||||||||||||||||||||||||||
| (b) Operating profit | ||||||||||||||||||||||||||||
A reconciliation of the operating segments’ measure of profit to total profit before tax is provided below. Further details of the exceptional items, remeasurements and stranded cost recoveries are provided in note 4.
| ||||||||||||||||||||||||||||
| Before exceptional items, remeasurements and stranded cost recoveries | After exceptional items, remeasurements and stranded cost recoveries | |||||||||||||||||||||||||||
2014 £m | 2013 (restated)1 £m | 2012 (restated)1 £m | 2014 £m | 2013 (restated)1 £m | 2012 (restated)1 £m | |||||||||||||||||||||||
| ||||||||||||||||||||||||||||
Operating segments | ||||||||||||||||||||||||||||
UK Electricity Transmission | 1,087 | 1,049 | 876 | 1,027 | 1,020 | 876 | ||||||||||||||||||||||
UK Gas Transmission | 417 | 531 | 453 | 406 | 517 | 453 | ||||||||||||||||||||||
UK Gas Distribution | 904 | 794 | 763 | 780 | 763 | 739 | ||||||||||||||||||||||
US Regulated | 1,125 | 1,254 | 1,192 | 1,388 | 1,438 | 1,156 | ||||||||||||||||||||||
Other activities | 131 | 11 | 207 | 134 | 11 | 311 | ||||||||||||||||||||||
| ||||||||||||||||||||||||||||
| 3,664 | 3,639 | 3,491 | 3,735 | 3,749 | 3,535 | |||||||||||||||||||||||
| ||||||||||||||||||||||||||||
Geographical areas | ||||||||||||||||||||||||||||
UK | 2,723 | 2,530 | 2,347 | 2,531 | 2,456 | 2,351 | ||||||||||||||||||||||
US | 941 | 1,109 | 1,144 | 1,204 | 1,293 | 1,184 | ||||||||||||||||||||||
| ||||||||||||||||||||||||||||
| 3,664 | 3,639 | 3,491 | 3,735 | 3,749 | 3,535 | |||||||||||||||||||||||
| ||||||||||||||||||||||||||||
Reconciliation to profit before tax | ||||||||||||||||||||||||||||
Operating profit | 3,664 | 3,639 | 3,491 | 3,735 | 3,749 | 3,535 | ||||||||||||||||||||||
Finance income | 36 | 30 | 28 | 36 | 30 | 28 | ||||||||||||||||||||||
Finance costs | (1,144) | (1,154) | (1,118) | (1,051) | (1,086) | (1,188) | ||||||||||||||||||||||
Share of post-tax results of joint ventures and associates | 28 | 18 | 7 | 28 | 18 | 7 | ||||||||||||||||||||||
| ||||||||||||||||||||||||||||
Profit before tax | 2,584 | 2,533 | 2,408 | 2,748 | 2,711 | 2,382 | ||||||||||||||||||||||
| ||||||||||||||||||||||||||||
1. See note 1 on page 92. Also restated to reflect the changes in operating segment presentation as described on page 93. | ||||||||||||||||||||||||||||
(c) Capital expenditure, depreciation and amortisation | ||||||||||||||||||||||||||||
| Capital expenditure | Depreciation and amortisation | |||||||||||||||||||||||||||
| 2014 £m | 2013 (restated)1 £m | 2012 (restated)1 £m | 2014 £m | 2013 (restated)1 £m | 2012 (restated)1 £m | |||||||||||||||||||||||
| ||||||||||||||||||||||||||||
Operating segments | ||||||||||||||||||||||||||||
UK Electricity Transmission | 1,381 | 1,430 | 1,153 | (343) | (323) | (281) | ||||||||||||||||||||||
UK Gas Transmission | 181 | 249 | 235 | (172) | (162) | (146) | ||||||||||||||||||||||
UK Gas Distribution | 480 | 666 | 645 | (271) | (261) | (251) | ||||||||||||||||||||||
US Regulated | 1,219 | 1,124 | 1,052 | (419) | (430) | (411) | ||||||||||||||||||||||
Other activities | 180 | 217 | 290 | (211) | (185) | (183) | ||||||||||||||||||||||
| ||||||||||||||||||||||||||||
| 3,441 | 3,686 | 3,375 | (1,416) | (1,361) | (1,272) | |||||||||||||||||||||||
| ||||||||||||||||||||||||||||
Geographical areas | ||||||||||||||||||||||||||||
UK | 2,155 | 2,471 | 2,217 | (938) | (902) | (849) | ||||||||||||||||||||||
US | 1,286 | 1,215 | 1,158 | (478) | (459) | (423) | ||||||||||||||||||||||
| ||||||||||||||||||||||||||||
| 3,441 | 3,686 | 3,375 | (1,416) | (1,361) | (1,272) | |||||||||||||||||||||||
| ||||||||||||||||||||||||||||
By asset type | ||||||||||||||||||||||||||||
Property, plant and equipment | 3,262 | 3,511 | 3,172 | (1,289) | (1,260) | (1,193) | ||||||||||||||||||||||
Non-current intangible assets | 179 | 175 | 203 | (127) | (101) | (79) | ||||||||||||||||||||||
| ||||||||||||||||||||||||||||
| 3,441 | 3,686 | 3,375 | (1,416) | (1,361) | (1,272) | |||||||||||||||||||||||
| ||||||||||||||||||||||||||||
1. Restated to reflect the changes in operating segment presentation as described on page 93. | ||||||||||||||||||||||||||||
Total non-current assets other than derivative financial assets, financial and other investments, deferred tax assets and pension assets located in the UK and US were £24,531m and £18,349m respectively as at 31 March 2014 (31 March 2013: UK £23,344m, US £19,340m; 31 March 2012: UK £21,793m, US £17,666m).
| ||||||||||||||||||||||||||||
96 National Grid Annual Report and Accounts 2013/14 | ||||||||||||
Notes to the consolidated financial statementscontinued |
| ||||||||||||||||||||||||||||||||||||||||||||||||||||||||||||||||||||||||||||||||||||||||||||||||||||||||||||||||||||||||||||||||||||||||||||||||||||||||||||||||||||||||||||||||||||||||||||||||||||||||||||||||||||||||||||||||||||||||||||||||||||||||||||||||||||||||||||||||||||||||||||||||||||||||||||||||||||||||||||||||||||||||||||||||||||||||||||||||||||||||||||||||||||||||||||||||||||||||||||||||||||||||||||||||||||||||||||||||||||||||||||||||||||||||||||||||||||||||||||||||||||||||||||||||||||||||||||||||||||||||||||||||||||||||||||||||||||||||||||||||||||||||||||||||||||||||||||||||||||||||||||||||||||||||||||||||||||||||||||||||||||||||||||||||||||||||||||||||||||||||||||||||||||||||||||||||||||||||||||||||||||||||||||||||||||||||||||||||||||||||||||||||||||||||||||||||||||||||||||||||||||||||||||||||||||||||||||||||||||||||||||||||||||||||||||||||||||||||||||||||||||||||||||||||||||||||||||||||||||||||||||||||||||||||||||||||||||||||||||||||||||||||||||||||||||
We have summarised the results of our principal operating segments here by segment to provide direct reference to the
| US Regulated Revenue in our US Regulated businesses was £122m higher at £8,040m, and adjusted operating profit fell by £129m to £1,125m. The weaker dollar reduced operating profit in the year by £38m. Excluding the impact of foreign exchange, net regulated income fell by £52m, principally due to the end of deferral income recoveries for Niagara Mohawk at 31 March 2013. Timing differences added another £29m profit compared with prior year. Regulated controllable costs increased by £89m at constant currency as a result of inflation and wage increases, higher insurance costs post Superstorm Sandy, and cost true-ups identified during the implementation of new financial systems. Other operating costs (excluding major storms) increased by £61m at constant currency due to the higher cost of non-major storm remediation, higher property taxes and depreciation of the new US enterprise resource system. There were no major storms affecting our operations in the year ended 31 March 2014. In 2012/13, two major storms in the US, Superstorm Sandy and Storm Nemo, reduced operating profit within US Regulated by £82m at constant currency. Our capital investment programme continues in the US, with a further £1,219m invested in 2013/14, including gas leak reduction programmes and gas growth and connection spend.
Revenue in Other activities increased by £58m to £736m in the year ended 31 March 2014. Adjusted operating profit was £120m higher at £131m. There was no repeat of the major storm cost of £51m incurred in our insurance captive in the prior year due to Superstorm Sandy. Operating profit in the French interconnector was £62m higher as a result of strong auction revenues this year. In our other non-regulated businesses, adjusted operating profit was £7m higher due to improved results in our UK metering business and insurance captive, partially offset by higher costs associated with the stabilisation of the new US enterprise resource system. Capital expenditure in our Other activities was £37m lower at £180m, principally reflecting reduced capital spend on the new US enterprise resource system. This unaudited commentary does not form part of the financial statements. | |||||||||||||||||||||||||||||||||||||||||||||||||||||||||||||||||||||||||||||||||||||||||||||||||||||||||||||||||||||||||||||||||||||||||||||||||||||||||||||||||||||||||||||||||||||||||||||||||||||||||||||||||||||||||||||||||||||||||||||||||||||||||||||||||||||||||||||||||||||||||||||||||||||||||||||||||||||||||||||||||||||||||||||||||||||||||||||||||||||||||||||||||||||||||||||||||||||||||||||||||||||||||||||||||||||||||||||||||||||||||||||||||||||||||||||||||||||||||||||||||||||||||||||||||||||||||||||||||||||||||||||||||||||||||||||||||||||||||||||||||||||||||||||||||||||||||||||||||||||||||||||||||||||||||||||||||||||||||||||||||||||||||||||||||||||||||||||||||||||||||||||||||||||||||||||||||||||||||||||||||||||||||||||||||||||||||||||||||||||||||||||||||||||||||||||||||||||||||||||||||||||||||||||||||||||||||||||||||||||||||||||||||||||||||||||||||||||||||||||||||||||||||||||||||||||||||||||||||||||||||||||||||||||||||||||||||||||||||||||||||||||||||||||||||||
UK Electricity Transmission For the year ended 31 March 2014, revenue in the UK Electricity Transmission segment increased by £277m, and adjusted operating profit increased by £38m. Net regulated income after pass-through costs was £170m higher, reflecting increases in allowed revenues under the new RIIO regulatory framework. This was partially offset by under-recoveries of revenue in the year of £60m compared with over-recoveries of £29m in the prior year. Regulated controllable costs were £27m higher due to inflation, legal fees and one-off credits in the prior year. Depreciation and amortisation was £20m higher reflecting the continued capital investment programme (investment in the year was £1,381m). Other costs were £4m lower than prior year. UK Gas Transmission Revenue in the UK Gas Transmission segment decreased by £177m in 2013/14 to £941m and adjusted operating profit fell by £114m to £417m. Net regulated income after pass-through costs was £80m lower, with lower permit income than prior year under the new RIIO arrangements. In addition, under-recoveries in the year of £21m compared with over-recoveries last year of £17m, gave rise to an adverse timing movement of £38m. Depreciation and amortisation was £10m higher due to investment, with £181m invested in the year. Partially offsetting these, other operating costs were £14m lower. UK Gas Distribution UK Gas Distribution revenue increased by £184m in the year to £1,898m, and adjusted operating profit increased to £904m from £794m in 2012/13. Net regulated income after pass-through costs was £96m higher, reflecting increases in allowed revenues under the new RIIO regulatory framework. Timing differences added another £39m, with £29m over-recoveries in 2013/14, compared with a £10m under-recovery in the prior year. Partially offsetting these, regulated controllable costs were £14m higher primarily due to inflation. Depreciation and amortisation was £10m higher reflecting the continued capital investment programme (investment in the year was £480m). Other costs were £1m higher than prior year. | ||||||||||||||||||||||||||||||||||||||||||||||||||||||||||||||||||||||||||||||||||||||||||||||||||||||||||||||||||||||||||||||||||||||||||||||||||||||||||||||||||||||||||||||||||||||||||||||||||||||||||||||||||||||||||||||||||||||||||||||||||||||||||||||||||||||||||||||||||||||||||||||||||||||||||||||||||||||||||||||||||||||||||||||||||||||||||||||||||||||||||||||||||||||||||||||||||||||||||||||||||||||||||||||||||||||||||||||||||||||||||||||||||||||||||||||||||||||||||||||||||||||||||||||||||||||||||||||||||||||||||||||||||||||||||||||||||||||||||||||||||||||||||||||||||||||||||||||||||||||||||||||||||||||||||||||||||||||||||||||||||||||||||||||||||||||||||||||||||||||||||||||||||||||||||||||||||||||||||||||||||||||||||||||||||||||||||||||||||||||||||||||||||||||||||||||||||||||||||||||||||||||||||||||||||||||||||||||||||||||||||||||||||||||||||||||||||||||||||||||||||||||||||||||||||||||||||||||||||||||||||||||||||||||||||||||||||||||||||||||||||||||||||||||||||||
Strategic Report | Corporate Governance | Financial Statements | Additional Information | 97 |
| ||||||||||||||||||||||||
Below we have presented separately certain items included in our operating costs. These include a breakdown of payroll costs (including disclosure of amounts paid to key management personnel) and fees paid to our auditors.
| ||||||||||||||||||||||||
Rentals under operating leases are charged to the income statement on a straight-line basis over the term of the relevant lease. | ||||||||||||||||||||||||
Before exceptional items, remeasurements and stranded cost recoveries | Exceptional items, remeasurements and stranded cost recoveries | Total | ||||||||||||||||||||||
2014 £m | 2013 (restated)1 £m | 2012 (restated)1 £m | 2014 £m | 2013 (restated)1 £m | 2012 (restated)1 £m | 2014 £m | 2013 (restated)1 £m | 2012 (restated)1 £m | ||||||||||||||||
| ||||||||||||||||||||||||
Depreciation and amortisation | 1,416 | 1,361 | 1,267 | – | – | 5 | 1,416 | 1,361 | 1,272 | |||||||||||||||
Payroll costs | 1,373 | 1,434 | 1,381 | 59 | 22 | 82 | 1,432 | 1,456 | 1,463 | |||||||||||||||
Purchases of electricity | 1,513 | 1,251 | 1,356 | (49) | (111) | 89 | 1,464 | 1,140 | 1,445 | |||||||||||||||
Purchases of gas | 1,722 | 1,384 | 1,518 | 33 | (69) | 5 | 1,755 | 1,315 | 1,523 | |||||||||||||||
Rates and property taxes | 963 | 969 | 955 | – | – | – | 963 | 969 | 955 | |||||||||||||||
Balancing Services Incentive Scheme | 872 | 805 | 818 | – | – | – | 872 | 805 | 818 | |||||||||||||||
Payments to other UK network owners | 630 | 487 | 407 | – | – | – | 630 | 487 | 407 | |||||||||||||||
Other | 2,656 | 3,029 | 2,360 | (114) | 48 | 54 | 2,542 | 3,077 | 2,414 | |||||||||||||||
| ||||||||||||||||||||||||
| 11,145 | 10,720 | 10,062 | (71) | (110) | 235 | 11,074 | 10,610 | 10,297 | ||||||||||||||||
| ||||||||||||||||||||||||
Operating costs include: | ||||||||||||||||||||||||
Inventory consumed | 422 | 389 | 360 | |||||||||||||||||||||
Operating leases | 115 | 109 | 97 | |||||||||||||||||||||
Research and development expenditure | 12 | 15 | 15 | |||||||||||||||||||||
| ||||||||||||||||||||||||
1. See note 1 on page 92. | ||||||||||||||||||||||||
(a) Payroll costs | ||||||||||||||||||||||||
2014 £m | 2013 (restated)1 £m | 2012 (restated)1 £m | ||||||||||||||||||||||
| ||||||||||||||||||||||||
Wages and salaries2 | 1,575 | 1,596 | 1,566 | |||||||||||||||||||||
Social security costs | 126 | 120 | 116 | |||||||||||||||||||||
Pension costs (note 22) | 245 | 231 | 231 | |||||||||||||||||||||
Share-based payment | 20 | 20 | 24 | |||||||||||||||||||||
Severance costs (excluding pension costs) | 30 | 16 | 35 | |||||||||||||||||||||
| ||||||||||||||||||||||||
| 1,996 | 1,983 | 1,972 | ||||||||||||||||||||||
Less: payroll costs capitalised | (564) | (527) | (509) | |||||||||||||||||||||
| ||||||||||||||||||||||||
| 1,432 | 1,456 | 1,463 | ||||||||||||||||||||||
| ||||||||||||||||||||||||
1. See note 1 on page 92. | ||||||||||||||||||||||||
2. Included within wages and salaries are US other post-retirement benefit costs of £44m (2013: £43m; 2012: £60m). For further information refer to note 22 on page 122. | ||||||||||||||||||||||||
(b) Number of employees
| ||||||||||||||||||||||||
| 31 March 2014 Number | Monthly average 2014 Number | 31 March 2013 Number1 | Monthly average 2013 Number1 | 31 March 2012 Number1 | Monthly average 2012 | |||||||||||||||||||
| ||||||||||||||||||||||||
UK | 9,693 | 9,641 | 9,990 | 9,816 | 9,696 | 9,769 | ||||||||||||||||||
US | 14,216 | 15,094 | 15,438 | 15,555 | 15,843 | 16,080 | ||||||||||||||||||
| ||||||||||||||||||||||||
| 23,909 | 24,735 | 25,428 | 25,371 | 25,539 | 25,849 | |||||||||||||||||||
| ||||||||||||||||||||||||
1. Comparatives have been re-presented on a basis consistent with the current year classification.
The vast majority of employees in the US are either directly or indirectly employed in the transmission, distribution and generation of electricity or the distribution of gas, while those in the UK are either directly or indirectly employed in the transmission and distribution of gas or the transmission of electricity. At 31 March 2014, there were 2,044 (2013: 2,151; 2012: 2,357) employees in other operations, excluding shared services.
| ||||||||||||||||||||||||
98 National Grid
| ||||||||||||
Notes to the consolidated |
| 3. Operating costscontinued | ||||||||||||||
| (c) Key management compensation | ||||||||||||||
2014 £m | 2013 £m | 2012 £m | ||||||||||||
| ||||||||||||||
Short-term employee benefits | 9 | 8 | 10 | |||||||||||
Post-employment benefits | 1 | 3 | 6 | |||||||||||
Share-based payment | 5 | 5 | 5 | |||||||||||
| ||||||||||||||
| 15 | 16 | 21 | ||||||||||||
| ||||||||||||||
Key management compensation relates to the Board of Directors, including the Executive Directors and Non-executive Directors for the years presented. |
| |||||||||||||
(d) Directors’ emoluments | ||||||||||||||
| Details of Directors’ emoluments are contained in the audited part of the Remuneration Report, which forms part of these financial statements. | ||||||||||||||
(e) Auditors’ remuneration | ||||||||||||||
Auditors’ remuneration is presented below in accordance with the requirements of the UK Companies Act 2006 and the principal accountant fees and services disclosure requirements of Item 16C of Form 20-F.
|
| |||||||||||||
2014 £m | 2013 £m | 2012 £m | ||||||||||||
| ||||||||||||||
Audit fees1payable to the parent Company’s auditors and their associates in respect of: | ||||||||||||||
Audit of the parent Company’s individual and consolidated financial statements | 0.9 | 1.1 | 1.1 | |||||||||||
The auditing of accounts of any associate of the Company | 7.8 | 6.0 | 5.2 | |||||||||||
Other services supplied2 | 2.3 | 2.7 | 2.3 | |||||||||||
| ||||||||||||||
| 11.0 | 9.8 | 8.6 | ||||||||||||
| ||||||||||||||
Total other services3 | ||||||||||||||
Tax fees4 | ||||||||||||||
Tax compliance services | 0.5 | 0.5 | 0.5 | |||||||||||
Tax advisory services | 0.3 | 0.3 | 0.2 | |||||||||||
All other fees5 | ||||||||||||||
Other assurance services | 0.1 | 0.1 | 0.3 | |||||||||||
Services relating to corporate finance transactions not covered above | – | 0.3 | 0.2 | |||||||||||
Other non-audit services not covered above | 0.8 | 1.1 | 2.6 | |||||||||||
| ||||||||||||||
| 1.7 | 2.3 | 3.8 | ||||||||||||
| ||||||||||||||
Total auditors’ remuneration | 12.7 | 12.1 | 12.4 | |||||||||||
| ||||||||||||||
1. Audit fees in each year represent fees for the audit of the Company’s financial statements and regulatory reporting for the years ended 31 March 2014, 2013 and 2012, and the review of interim financial statements for the six month periods ended 30 September 2013, 2012 and 2011 respectively. |
| |||||||||||||
2. Other services supplied represent fees payable for services in relation to other statutory filings or engagements that are required to be carried out by the auditors. In particular, this includes fees for reports under section 404 of the US Public Company Accounting Reform and Investor Protection Act of 2002 (Sarbanes-Oxley) and audit reports on regulatory returns. |
| |||||||||||||
3. There were no audit related fees as described in Item 16C(b) of Form 20-F. |
| |||||||||||||
4. Tax fees include amounts charged for tax compliance, tax advice and tax planning. Total tax fees for the year ended 31 March 2014 were £0.8m (2013: £0.8m; 2012: £0.7m). |
| |||||||||||||
5. All other fees include amounts relating to the review of US pensions and other post-retirement benefits census data and sundry services, all of which have been subject to approval by the Audit Committee. Total other fees for the year ended 31 March 2014 were £0.9m (2013: £1.5m; 2012: £3.1m). |
| |||||||||||||
In addition, fees of £0.1m were incurred in 2014 in relation to the audits of the pension schemes of the Company (2013: £0.1m; 2012: £0.1m). |
| |||||||||||||
Subject to the Company’s Articles of Association and the Companies Act 2006, the Audit Committee is solely and directly responsible for the approval of the appointment, reappointment, compensation and oversight of the Company’s independent auditors. It is our policy that the Audit Committee must approve in advance all non-audit work to be performed by the independent auditors to ensure that the service will not compromise auditor independence. Certain services are prohibited from being performed by the external auditors under the Sarbanes-Oxley Act 2002.
|
| |||||||||||||
Strategic Report
|
| Financial Statements
|
|
| |||||||||||||||||||||||||||||||||||||||||||||||||||||||||||||||||||||||||||||||||||||||||||||||||||||||||||||||||||||||||||||||||||||||||||||||||||||||||||||||||||||||||||||||||||||||||||||||||||||||||||||||||||||||||||||||||||||||||||||||||||||||||||||||||||||||||||||||||||||||||||||||||||||||||||||||||||||||||||||||||||||||||||||||||||||||||||||||||||||||||||||||||||||||||||||||||||||||||||||||||||||||||||||||||||||||||||||||||||||||||||||||||||||||||||||||||||||||||||||||||||||||||||||||||||||||||||||||||||||||||||||||||||||||||||||||||||||||||||||||||||||||||||||||||||||||||||||||||||||||||||||||||||||||||||||||||||||||||||||||||||||||||||||||||||||||||||||||||||||||||||||||||||||||||||||||||||||||||||||||||||||||||||||||||||||||||||||||||||||||||||||||||||||||||||||||||||||||||||||||||||||||||||||||||||||||||||||||||||||||||||||||||||||||||||||||||||||||||||||||||||||||||||||||||||||||||||||||||||||||||||||||||||||||||||||||||||||||||||||||||||||||||||||||||||||||||||||||||||
Notes to the financial |
15. Derivative financial instrumentscontinued
| ||||||||||
| Cash flow hedgescontinued | ||||||||||
When a forecast transaction is no longer expected to occur, the cumulative gain or loss that was reported in equity is transferred to the income statement.
|
| |||||||||
Where a non-financial asset or a non-financial liability results from a forecasted transaction or firm commitment being hedged, the amounts deferred in equity are included in the initial measurement of that non-monetary asset or liability.
|
| |||||||||
| 2014 £m | 2013 £m | |||||||||
| ||||||||||
| Cross-currency interest rate/interest rate swaps | 224 | 123 | ||||||||
| Foreign exchange forward contracts | (11) | 1 | ||||||||
| Inflation linked swaps | (32) | (16) | ||||||||
| ||||||||||
| Cash flow hedges | 181 | 108 | ||||||||
| ||||||||||
Net investment hedges |
| |||||||||
Borrowings, cross-currency swaps and forward currency contracts are used in the management of the foreign exchange exposure arising from the investment in non-sterling denominated subsidiaries. Where these contracts qualify for hedge accounting they are designated as net investment hedges.
|
| |||||||||
| 2014 £m | 2013 £m | |||||||||
| ||||||||||
| Cross-currency interest rate swaps | 342 | (56) | ||||||||
| �� | Foreign exchange forward contracts | 66 | (39) | |||||||
| ||||||||||
| Net investment hedges | 408 | (95) | ||||||||
| ||||||||||
The cross-currency swaps and forward foreign currency contracts are hedge accounted using the spot to spot method. The foreign exchange gain or loss on retranslation of the borrowings and the spot to spot movements on the cross-currency swaps and forward currency contracts are transferred to equity to offset gains or losses on translation of the net investment in the non-sterling denominated subsidiaries, with any ineffective portion recognised immediately in the income statement.
|
| |||||||||
| Derivatives not in a formal hedge relationship | ||||||||||
Our policy is not to use derivatives for trading purposes. However, due to the complex nature of hedge accounting under IAS 39 some derivatives may not qualify for hedge accounting, or are specifically not designated as a hedge where natural offset is more appropriate. Changes in the fair value of any derivative instruments that do not qualify for hedge accounting are recognised in remeasurements within the income statement.
|
| |||||||||
| 2014 £m | 2013 £m | |||||||||
| ||||||||||
| Cross-currency interest rate/interest rate swaps | 15 | 16 | ||||||||
| Foreign exchange forward contracts | 1 | (10) | ||||||||
| Forward rate agreements | – | (5) | ||||||||
| Inflation linked swaps | (165) | (182) | ||||||||
| ||||||||||
| Derivatives not in a formal hedge relationship | (149) | (181) | ||||||||
| ||||||||||
Discontinuation of hedge accounting | ||||||||||
Hedge accounting is discontinued when the hedging instrument expires or is sold, terminated, exercised or no longer qualifies for hedge accounting. At that time, any cumulative gains or losses relating to cash flow hedges recognised in equity are initially retained in equity and subsequently recognised in the income statement in the same periods in which the previously hedged item affects net profit or loss. Amounts deferred in equity with respect to net investment hedges are subsequently recognised in the income statement in the event of the disposal of the overseas operations concerned. For fair value hedges, the cumulative adjustment recorded to the carrying value of the hedged item at the date hedge accounting is discontinued is amortised to the income statement using the effective interest method.
|
| |||||||||
| Embedded derivatives | ||||||||||
No adjustment is made with respect to derivative clauses embedded in financial instruments or other contracts that are defined as closely related to those instruments or contracts. Consequently these embedded derivatives are not accounted for separately from the debt instrument. Where there are embedded derivatives in host contracts not closely related, the embedded derivative is separately accounted for as a derivative financial instrument.
|
| |||||||||
Strategic Report | Corporate Governance | Financial Statements | Additional Information | 117 |
16.Inventories and current intangible assets
| ||||||||||||
Inventories represent assets that we intend to use in order to generate revenue in the short term, either by selling the asset itself (for example fuel stocks) or by using it to fulfil a service to a customer or to maintain our network (consumables). |
| |||||||||||
Inventories are stated at the lower of weighted average cost and net realisable value. |
| |||||||||||
Where applicable, cost comprises direct materials and direct labour costs as well as those overheads that have been incurred in bringing the inventories to their present location and condition. |
| |||||||||||
Emission allowances, principally relating to the emissions of carbon dioxide in the UK and sulphur and nitrous oxides in the US, are recorded as intangible assets within current assets and are initially recorded at cost and subsequently at the lower of cost and net realisable value. Where emission allowances are granted by relevant authorities, cost is deemed to be equal to the fair value at the date of allocation. Receipts of such grants are treated as deferred income, which is recognised in the income statement as the related charges for emissions are recognised or on impairment of the related intangible asset. A provision is recorded in respect of the obligation to deliver emission allowances and emission charges are recognised in the income statement in the period in which emissions are made.
|
| |||||||||||
| 2014 £m | 2013 £m | |||||||||||
| ||||||||||||
Fuel stocks | 74 | 114 | ||||||||||
Raw materials and consumables | 128 | 156 | ||||||||||
Work in progress | 13 | 13 | ||||||||||
Current intangible assets – emission allowances | 53 | 8 | ||||||||||
| ||||||||||||
| 268 | 291 | |||||||||||
| ||||||||||||
There is a provision for obsolescence of £29m against inventories as at 31 March 2014 (2013: £27m).
|
| |||||||||||
118 National Grid Annual Report and Accounts | ||||||||||||
Notes to the consolidated financial statementscontinued |
17.Trade and other receivables
| ||||||||||
Trade and other receivables are amounts which are due from our customers for services (and commodities in the US) we have provided. Other receivables also include prepayments made by us, for example, property lease rentals paid in advance.
|
| |||||||||
Trade, loan and other receivables are initially recognised at fair value and subsequently measured at amortised cost, less any appropriate allowances for estimated irrecoverable amounts. A provision is established for irrecoverable amounts when there is objective evidence that amounts due under the original payment terms will not be collected.
|
| |||||||||
| 2014 | 2013 | |||||||||
| £m | £m | |||||||||
| ||||||||||
| Trade receivables | 1,602 | 1,325 | ||||||||
| Prepayments and accrued income | 1,090 | 1,421 | ||||||||
| Commodity contract assets | 42 | 42 | ||||||||
| Current tax assets | 11 | – | ||||||||
| Other receivables | 110 | 122 | ||||||||
| ||||||||||
| 2,855 | 2,910 | |||||||||
| ||||||||||
Trade receivables are non interest-bearing and generally have a 30-90 day term. Due to their short maturities, the fair value of trade and other receivables approximates their book value. Commodity contract assets are recorded at fair value. All other receivables are recorded at amortised cost. |
| |||||||||
Provision for impairment of receivables | ||||||||||
| 2014 | 2013 | |||||||||
| £m | £m | |||||||||
| ||||||||||
| At 1 April | 261 | 270 | ||||||||
| Exchange adjustments | (23) | 13 | ||||||||
| Charge for the year, net of recoveries | 105 | 75 | ||||||||
| Uncollectible amounts written off against receivables | (94) | (97) | ||||||||
| ||||||||||
| At 31 March | 249 | 261 | ||||||||
| ||||||||||
Trade receivables past due but not impaired | ||||||||||
| 2014 | 2013 | |||||||||
| £m | £m | |||||||||
| ||||||||||
| Up to 3 months past due | 212 | 242 | ||||||||
| 3 to 6 months past due | 69 | 45 | ||||||||
| Over 6 months past due | 65 | 4 | ||||||||
| ||||||||||
| 346 | 291 | |||||||||
| ||||||||||
For further information on our wholesale and retail credit risk, refer to note 30 (a). For further information on our commodity risk, refer to note 30 (e).
|
| |||||||||
Strategic Report | Corporate Governance | Financial Statements | Additional Information | 119 |
| ||||||||||
Cash and cash equivalents includes cash balances, together with short-term investments with a maturity of less than three months that are readily convertible to cash. |
| |||||||||
Net cash and cash equivalents reflected in the cash flow statement are net of bank overdrafts, which are reported in borrowings. The carrying amounts of cash and cash equivalents and bank overdrafts approximate their fair values. |
| |||||||||
Cash at bank earns interest at floating rates based on daily bank deposit rates. Short-term deposits are made for periods varying between one day and three months, depending on the immediate cash requirements, and earn interest at the respective short-term deposit rates. |
| |||||||||
Net cash and cash equivalents held in currencies other than sterling have been converted into sterling at year-end exchange rates. |
| |||||||||
For further information on currency exposures, refer to note 30 (d).
|
| |||||||||
| 2014 | 2013 | |||||||||
| £m | £m | |||||||||
| ||||||||||
| Cash at bank | 75 | 99 | ||||||||
| Short-term deposits | 279 | 572 | ||||||||
| ||||||||||
| Cash and cash equivalents excluding bank overdrafts | 354 | 671 | ||||||||
| Bank overdrafts | (15) | (23) | ||||||||
| ||||||||||
| Net cash and cash equivalents | 339 | 648 | ||||||||
| ||||||||||
At 31 March 2014, £24m (2013: £21m) of cash and cash equivalents were restricted. This primarily relates to cash held in captive insurance companies. |
| |||||||||
| ||||||||||
We borrow money primarily in the form of bonds and bank loans. These are for a fixed term and may have fixed or floating interest rates or are linked to RPI. As indicated in note 15, we use derivatives to manage risks associated with interest rates and foreign exchange. |
| |||||||||
Our strategy in action |
| |||||||||
Our price controls and rate plans require us to fund our networks within a certain ratio of debt to equity and, as a result, we have issued a significant amount of debt. As we continue to invest in our networks, the level of debt is expected to increase over time. To maintain a strong balance sheet and to allow us to access capital markets at commercially acceptable interest rates, we balance the amount of debt we issue with the value of our assets and take account of certain other metrics used by credit rating agencies.
|
| |||||||||
Borrowings, which include interest-bearing and inflation linked debt and overdrafts are recorded at their initial fair value which normally reflects the proceeds received, net of direct issue costs less any repayments. Subsequently these are stated at amortised cost, using the effective interest method. Any difference between the proceeds after direct issue costs and the redemption value is recognised over the term of the borrowing in the income statement using the effective interest method. |
| |||||||||
The Finance Committee controls refinancing risk by limiting the amount of our debt maturities arising from borrowings in any one year which is demonstrated by our maturity profile.
|
| |||||||||
| 2014 | 2013 | |||||||||
| £m | £m | |||||||||
| ||||||||||
| Current | ||||||||||
| Bank loans | 1,485 | 1,194 | ||||||||
| Bonds | 1,730 | 1,761 | ||||||||
| Commercial paper | 252 | 438 | ||||||||
| Finance leases | 19 | 20 | ||||||||
| Other loans | 10 | 12 | ||||||||
| Bank overdrafts | 15 | 23 | ||||||||
| ||||||||||
| 3,511 | 3,448 | |||||||||
| ||||||||||
| Non-current | ||||||||||
| Bank loans | 1,414 | 1,863 | ||||||||
| Bonds | 20,732 | 22,435 | ||||||||
| Finance leases | 151 | 175 | ||||||||
| Other loans | 142 | 174 | ||||||||
| ||||||||||
| 22,439 | 24,647 | |||||||||
| ||||||||||
| Total | 25,950 | 28,095 | ||||||||
| ||||||||||
120 National Grid Annual Report and Accounts 2013/14 | ||||||||||||
Notes to the consolidated
Financial Statements
| Additional Information | 161 | |||||||||||||||||||||||||||||||||||||||||||||||||||||||||||||||||||||||||||||||||||||||||||||||||||||||||||||||||||||||||||||||||||||||||||||||||||||||||||||||||||||||||||||||||||||||||||||||||||||||||||||||||||||||||||||||||||||||||||||||||||||||||||||||||||||||||||||||||||||||||||||||||||||||||||||||||||||||||||||||||||||||||||||||||||||||||||||||||||||||||||||||||||||||||||||||||||||||||||||||||||||||||||||||||||||||||||||||||||||||||||||||||||||||||||||||||||||||||||||||||||||||||||||||||||||||||||||||||||||||||||||||||||||||||||||||||||||||||||||||||||||||||||||||||||||||||||||||||||||||||||||||||||||||||||||||||||||||||||||||||||||||||||||||||||||||||||||||||||||||||||||||||||||||||||||||||||||||||||||||||||||||||||||||||||||||||||||||||||||||||||||||||||||||||||||||||||||||||||||||||||||||||||||||||||||||||||||||||||||||||||||||||||||||||||||||||||||||||||||||||||||||||||||||||||||||||||||||||||||||||||||||||||||||||||||||||||||||||||||||||||||||||||||||||||||||||||||||||||||
RIIO price controls Our UK regulator has introduced a new regulatory framework called RIIO (revenue = incentives + innovation + outputs) that became effective on 1 April 2013 and lasts for eight years. The building blocks of the RIIO price control are broadly similar to the historical price controls used in the UK; however there are some significant differences in the mechanics of the calculations.
How is revenue calculated? Under RIIO the outputs we deliver are clearly articulated and are integrally linked to the calculation of our allowed revenue. These outputs have been determined through an extensive consultation process which has given stakeholders a greater opportunity to input to these decisions. The clarity around outputs should lead to greater transparency of our performance in delivering them.
The six key output categories are:
· Safety: ensuring the provision of a safe energy network. · Reliability (and availability): promoting networks capable of delivering long-term reliability, as well as minimising the number and duration of interruptions experienced over the price control period, and ensuring adaptation to climate change. · Environmental impact: encouraging companies to play their role in achieving broader environmental objectives – specifically facilitating the reduction of carbon emissions – as well as minimising their own carbon footprint. · Customer and stakeholder satisfaction: maintaining high levels of customer satisfaction and stakeholder engagement, and improving service levels. · Customer connections: encouraging networks to connect customers quickly and efficiently. · Social obligations (UK GD only): extending the gas network to communities that are fuel poor where it is efficient to do so and introducing measures to address carbon monoxide poisoning incidents.
Within each of these output categories are a number of primary and secondary deliverables, reflecting what our stakeholders want us to deliver over the coming price control period. The nature and number of these deliverables varies according to the output category, with some being linked directly to our allowed revenue, some linked to legislation, and others having only a reputational impact. Ofgem, using information submitted by us along with independent assessments, determines the efficient level of expected costs necessary to deliver them. Under RIIO this is known as totex, short for total expenditure, and is similar to the sum of controllable opex, capex and repex (for UK GD) under the previous price control.
A number of assumptions are necessary in setting these outputs, such as certain prices or the volumes of work that will be needed. As a result, to protect us and our customers from windfall gains and losses, there are a number of uncertainty mechanisms within the RIIO framework that can result in adjustments to totex if actual prices or volumes differ from the assumptions.
Where we under- or over-spend the allowed totex for reasons that are not covered by uncertainty mechanisms, there is a sharing factor, ie the under- or over-spend is shared between us and customers through an adjustment to allowed revenues in a future year. This sharing factor provides an incentive for us to provide the outputs efficiently as we are able to keep a portion of the savings, with the remainder benefiting our customers. | This sharing factor is one of the ways that RIIO has given innovation more prominence. Innovation includes traditional areas such as new technologies, as well as the broader challenge of finding new ways of working to deliver outputs more efficiently. This broader challenge will have an impact on everyone in our business.
Totex is then split between fast and slow money, a new concept under RIIO, based on a specified percentage. Fast money represents the amount of totex that we are able to recover in the current year. Slow money is added to our RAV.
In addition to fast money, in each year we are allowed to collect a depreciation of and a return on our RAV.
This operates in a similar way to the previous price control, although there have been changes to the asset lives for electricity transmission (transition from 20 years to 45 years evenly across the RIIO period) and the depreciation calculation for UK GD (changed from 45 years straight line to 45 years sum of digits for assets added post 2002). We are also allowed to collect additional revenues related to non-controllable costs and incentives.
The incentive mechanisms can increase or decrease our allowed revenue and result from our performance against various measures related to our outputs. RIIO has introduced new incentive mechanisms as a way to provide further incentives to align our objectives with those of our customers and other stakeholders. For example, performance against our customer satisfaction targets can have a positive or negative effect of up to 1% of allowed annual revenues. Incentives will normally affect our revenues two years after the year of performance.
RIIO regulatory building blocks
Allowed returns The cost of capital allowed under RIIO is as follows: | |||||||||||||||
| Transmission | Gas Distribution | |||||||||||||||
| Gas | Electricity | |||||||||||||||
| Cost of equity (post-tax real) | 6.8% | 7.0% | 6.7% | |||||||||||||
| Cost of debt (pre-tax real) | iBoxx 10 year simple trailing average index (2.92% for 2013/14) | |||||||||||||||
| Notional gearing | 62.5% | 60.0% | 65.0% | |||||||||||||
| Vanilla WACC1 | 4.38% | 4.55% | 4.24% | |||||||||||||
1. Vanilla WACC = cost of debt x gearing + cost of equity x (1- gearing). | ||||||||||||||||
| ||||||||||||
Business information in detail continued |
| Gas Transmission | Electricity Transmission | Gas Distribution | ||||||||||||||||||||
Transmission |
System |
Transmission |
System |
North |
East of England |
West Midlands | London | |||||||||||||||
| Repex: | Stepped decline from 50% in 2013/14 to 0% in 2020/21 | |||||||||||||||||||||
| Baseline 35.6% | in seven equal instalments of 7.14% per annum | |||||||||||||||||||||
1 Fast | Uncertainty 10% | 62.60% | 15.00% | 72.10% | 73.90% | 73.37% | 75.05% | 76.53% | ||||||||||||||
| Repex: | Stepped increase from 50% in 2013/14 to 100% in 2020/21 | |||||||||||||||||||||
| Baseline 64.4% | in seven equal instalments of 7.14% per annum | |||||||||||||||||||||
2 Slow | Uncertainty 90% | 37.40% | 85.00% | 27.90% | 26.10% | 26.63% | 24.95% | 23.47% | ||||||||||||||
3 Sharing | 44.36% | 46.89% | 63.04% | |||||||||||||||||||
The sharing factor means that any over- and under-spend is shared between the businesses and consumers. The shared figures displayed are the sharing factors that apply to UK ET, UK GT and UK GD.
Regulators In the US, public utilities’ retail transactions are regulated by state utility commissions, including the NYPSC, the MADPU and the RIPUC. Utility commissions serve as economic regulators, approving cost recovery and authorised rates of return. The state commissions establish the retail rates to recover the cost of transmission and distribution services, and focus on services and costs within their jurisdictions. FERC regulates the wholesale transactions of public utilities, such as interstate transmission and electricity generation, and provides for the wholesale cost recovery of these services. Utility commissions are also charged with serving the public interest by ensuring utilities provide safe and reliable service at just and reasonable prices. They establish service standards and approve mergers and acquisitions of public utilities. FERC also regulates public utility holding companies and centralised service companies, including those of our US businesses. With the exception of residential gas customers in Rhode Island, all of our customers are allowed to select a competitive supplier for the supply component of electricity and gas utility services. Regulatory process Utilities in the US submit a formal rate filing to the relevant state regulatory body, requesting a revenue adjustment in a proceeding known as a rate case. The rate case process is conducted in a litigated setting and, in the states in which we operate, it can take 10 to 13 months for the commission to render a final decision. In all states, the utility is required to prove that its requested rate change is prudent and reasonable. The utility may request a rate plan that can span multiple years. Unlike the state processes, the federal regulator has no specified timeline for adjudicating a rate case, but typically makes a final decision retroactive when the case is completed. During the rate case process, consumer advocates and other intervening parties scrutinise and often file opposing positions to the utility’s rate request. The rate case decision reflects a weighing of the facts in light of the regulator’s policy objectives. During a rate case, the utility, consumer advocates and intervening parties may agree on the resolution of aspects of a case and file a negotiated settlement with a commission for approval. | Gas and electricity rates are established from a revenue requirement which comprises the utility’s total cost of providing distribution or delivery service to its customers. It includes operating expenses, depreciation, taxes and a fair and reasonable return on certain components of the utility’s regulated asset base, typically referred to as its rate base. The rate of return applied to the rate base is the utility’s weighted average cost of capital. This represents its cost of debt and an allowed RoE intended to provide the utility with an opportunity to attract capital from investors and maintain its financial integrity. The total revenue requirement is apportioned among different customer classes and categories of service to establish the prices for service. The final revenue requirement and prices are ultimately approved in the rate case decision. The revenue requirement is derived from a comprehensive study of the utility’s total costs during a recent 12 month period of operations, referred to as a test year. Each commission has its own rules and standards for adjustments to the test year. These are intended to arrive at the total costs expected in the first year new rates will be in effect, or the rate year, and may include forecast capital investments in determining rate year rate base. Often, known and measurable adjustments are made to test year data to reflect normal operating conditions. In Massachusetts, only limited adjustments to this test year are allowed, which are required to be both known and measurable. New York and Rhode Island allow more comprehensive adjustments to the test year. In summary, the US regulatory regime is based on a building block approach intended to allow the utility to recover its cost of service and earn a return on its investments. US regulatory building blocks
Each operating company has a set of rates for service. We have three electric distribution operations (upstate New York, Massachusetts, and Rhode Island) and six gas distribution | |||||||||||||||||||||||||||||||||||||||||||||||||||||||||||||||||||||||||||||||||||||||||||||||||||||||||||||||||||||||||||||||||||||||||||||||||||||||||||||||||||||||||||||||||||||||||||||||||||||||||||||||||||||||||||||||||||||||||||||||||||||||||||||||||||||||||||||||||||||||||||||||||||||||||||||||||||||||||||||||||||||||||||||||||||||||||||||||||||||||||||||||||||||||||||||||||||||||||||||||||||||||||||||||||||||||||||||||||||||||||||||||||||||||||||||
Strategic Report
|
| Financial Statements
| Additional Information | 163 | ||||||||||||||||||||||||||||||||||||||||||||||||||||||||||||||||||||||||||||||||||||||||||||||||||||||||||||||||||||||||||||||||||||||||||||||||||||||||||||||||||||||||||||||||||||||||||||||
networks (upstate New York, New York City, Long Island, Massachusetts (2), and Rhode Island). Distribution and transmission electricity services in upstate New York are recovered with a combined rate billed to end use customers. In New England, retail transmission rates recover wholesale transmission charges assessed to our electric distribution companies from our end use customers. Our rate plans are designed to a specific allowed RoE, by reference to an allowed operating expense level and rate base. Some rate plans include earnings sharing mechanisms that allow us to retain a proportion of the earnings above our allowed RoE we achieve through improving efficiency, with the balance benefiting customers. In addition, our performance under certain rate plans is subject to service performance targets. We may be subject to monetary penalties in cases where we do not meet those targets.
One measure used to monitor the performance of our regulated businesses is a comparison of achieved RoE to allowed RoE, with a target that the achieved should be equal to or above the allowed. This measure cannot be used in isolation, however, as there are a number of factors that may prevent us from achieving that target in any given year: · Regulatory lag: in the years following the rate year, costs may increase due to inflation or other factors. If the cost increases cannot be offset by productivity gains, the total cost to deliver will be higher as a proportion of revenue and therefore achieved RoE will be lowered. · Cost disallowances: a cost disallowance is a decision by the regulator that a certain expense should not be recovered in rates from customers. The regulator may do this for a variety of reasons. We can respond to some disallowances by choosing not to incur those costs; others may be unavoidable. As a result, unless offsetting cost reductions can be found, the achieved RoE will be lowered. · Market conditions: if a utility files a new rate case, the new allowed RoE may be below the current allowed RoE as financial market conditions may have changed. As such, a utility that appears to be underperforming the allowed RoE and files a new rate case may not succeed in increasing revenues. We work to increase achieved RoEs through: productivity improvements; positive performance against incentives or earned savings mechanisms such as energy efficiency programmes, where available; and, through filing a new rate case when achieved returns are lower than that which the Company could reasonably expect to attain through a new rate case. Features of our rate plans We are responsible for billing our customers for their use of electricity and gas services. Customer bills typically comprise a commodity charge, covering the cost of the electricity or gas delivered, and charges covering our delivery service. Depending on the state, delivery rates are either based upon actual sales volumes and costs incurred in an historical test year, or on estimates of sales volumes and costs, and in both cases may differ from actual amounts. A substantial proportion of our costs, in particular electricity and gas purchases for supply to customers, are pass-through costs, meaning they are fully recoverable from our customers. These pass-through costs are recovered through separate charges to customers that are designed to recover those costs with no profit. Rates are adjusted from time to time to ensure any over- or under-recovery of these costs is returned to, | or recovered from, our customers. There can be timing differences between costs being incurred and rates being adjusted. Revenue for our wholesale transmission businesses in New England and New York is collected from wholesale transmission customers, who are typically other utilities and include our own New England electricity distribution businesses. With the exception of upstate New York, which continues to combine retail transmission and distribution rates to end use customers, these wholesale transmission costs are incurred by distribution utilities on behalf of their customers and are fully recovered as a pass-through from end use customers as approved by each state commission. Our Long Island generation plants sell capacity to LIPA under a power supply agreement, approved by FERC, which provides a similar economic effect to cost of service rate regulation. US regulatory filings The objectives of our rate case filings are to ensure we have the right cost of service with the ability to earn a fair and reasonable rate of return, while providing a safe and reliable service to our customers. In order to achieve these objectives and to reduce regulatory lag, we have been requesting structural changes, such as revenue decoupling mechanisms, capital trackers, commodity-related bad debt true-ups, and pension and other post-employment benefit (OPEB) true-ups, separately from base rates. These terms are explained below the table on page 165. Below we summarise significant developments in rate filings and the regulatory environment during the year. Massachusetts Capital investment programmes Our Massachusetts gas and electricity operating companies have rate mechanisms that allow for the recovery of new capital investment, including a return, outside of base rate proceedings, subject to further review and reconciliation. Most recently, on the gas side, MADPU allowed approximately $11.6 million into rates effective from 1 November 2013, related to incremental additions to the rate base, and on the electricity side it allowed approximately $8.8 million into rates effective from 1 March 2014, related to rate base additions. Storm fund recovery The Massachusetts electricity business collects $4.3 million per year in base rates to credit towards a storm fund devoted to funding storm restoration. The severity and frequency of storms in Massachusetts over the last few years left our storm fund in a deficit position of approximately $212 million. On 3 May 2013, MADPU allowed us to begin collecting $40 million per year for three years towards the replenishment of the storm fund, subject to a review of the prudency of the underlying costs. That review is under way. The funding of the remaining deficit will be addressed as part of the prudency review and in future rate proceedings. Storm management audit The MADPU’s December 2012 order regarding our performance during Tropical Storm Irene and the October 2011 snowstorm requires us to undergo an independent audit regarding our storm management. This audit is under way, addressing: emergency management systems, protocols and plans; preparation for and management of restoration efforts with respect to emergency events; the Company’s emergency response resources and allocation of those resources during an emergency event; communications with state, municipal and public safety officials and with the DPU; dissemination of timely information to the public; and identification of management recommendations. |
164 National Grid | ||||||||||||
Business information in detail continued |
New York Upstate New York 2012 rate plan filing Effective from 1 April 2013, the upstate New York electricity and gas businesses began the first year of their new three year rate plan. The new rate plan provides an increase in electricity delivery revenue of $43.4 million, $51.4 million and $28.3 million for rate years one to three respectively. For the gas operations, the rate plan provides a decrease in delivery revenue of $3.3 million in rate year one and an increase of $5.9 million and $6.3 million in rate years two and three respectively. The revenue requirements for Niagara Mohawk’s electricity and gas businesses are based on a RoE of 9.3%, which includes a stay out premium for the three year term, and a capital structure that includes a 48% common equity component. The final agreement also includes annual reconciliation mechanisms for certain non-controllable costs. Downstate New York rate plan extension In 2013, The Brooklyn Union Gas Company (also known as KeySpan Energy Delivery New York or KEDNY) received approval from the PSC to extend its existing five year rate plan by two years. The extension provides a 9.4% RoE, with a 48% equity structure. Under the agreement, 80% of any earnings over 9.4% will fund recovery of prior environmental deferrals with the remaining 20% being retained by KEDNY. The agreement increased capital expenditure allowances to $320.1 million in 2013 and $293.7 million in 2014 as compared with the prior capital allowances of $155.4 million per year. The agreement also proposed updates to various customer service and other performance metrics. 2013 New York gas management audit On 13 February 2013, the PSC announced a comprehensive management and operations audit of National Grid’s three New York gas distribution utilities. New York law requires periodic management audits of all utilities at least once every five years. We last underwent a management audit in 2009 when the PSC audited Niagara Mohawk’s electricity business. The final report is expected to be filed with the PSC this summer. The report will make recommendations regarding the operation and management of our New York gas utilities, and will specify costs and savings associated with each recommendation. In our next major gas rate proceeding, the Commission will consider our effectiveness in implementing the audit recommendations and seek to reflect the costs and savings associated with the recommendations in rates.
LIPA Amended and Restated Power Supply Agreement (A&RPSA) We own and manage a number of power plants on Long Island, with a generation capacity of 3.8 GW. We supply wholesale capacity and energy to LIPA under an agreement with LIPA that was renewed in May 2013. LIPA in turn provides retail electricity to communities and businesses on Long Island.
On 23 May 2013, FERC approved the A&RPSA which expires on 30 April 2028 and replaces the original Power Supply Agreement that was effective from May of 1998 to May of 2013. LIPA may terminate the agreement as early as 30 April 2025 upon two years’ advance notice. The A&RPSA became effective on 28 May 2013. The agreement resulted in a rate decrease of $27.4 million annually compared with the rate in effect for the final year of the previous PSA. The agreement sets a RoE of 9.75% and a capital structure with an equity component of 50%. The A&RPSA continues certain annual rate adjustments, such as pension and other post-retirement benefit expenses, property tax true-up, adjustments for new plant in service, and certain inflationary | increases. The A&RPSA allows both parties a RoE reopener in contract years four to six depending on financial market changes, and National Grid a one-time rate reopener in contract year six. The A&RPSA also contains new options for modernising the power plants through retirement or repowering existing facilities to reduce energy costs and improve environmental performance. Rhode Island Rhode Island 2014/15 electricity and gas infrastructure, safety, and reliability plans (ISR) Legislation provides our Rhode Island gas and electricity operating divisions with rate mechanisms that allow for recovery of capital investment, including a return, outside of base rate proceedings through the submission of annual ISR plans. The electricity plan includes electricity operation expenses for vegetation management and certain inspection and maintenance costs. In December 2013, we filed annual petitions seeking approval of our 2014/15 ISR plans for the electricity and gas systems. The PUC approved the petitions in March 2014. The electricity ISR plan encompasses a $74.3 million spending programme for capital investment and $10.7 million for operating and maintenance expenses for vegetation management and inspection and maintenance. The gas ISR plan encompasses a $71.7 million spending for capital investment and, for the first time, incremental operation and maintenance expense for the hiring, training and supervision of additional personnel to support increases in leak-prone pipe replacement. FERC Complaint on transmission allowed RoE In September 2011 and December 2012, complaints were filed with FERC against certain transmission owners, including our New England transmission business, to lower the base RoE from the FERC approved rate of 11.14% to 9.2% and 8.7% respectively. The transmission owners argued that the complainants have not proven the existing rate is unjust and unreasonable and that the 11.14% base RoE should remain in effect. Non-binding preliminary findings by a FERC administrative law judge, suggested a 10.6% base RoE for a 15 month refund and a 9.7% base RoE prospectively. Short-term borrowing extension In October 2013, National Grid filed an application with FERC on behalf of its electricity public utility subsidiaries seeking an extension of the Commission’s prior authorisation to issue short-term debt, as required by Section 204 of the Federal Power Act. National Grid explained in its extension request that challenges associated with the implementation of the US enterprise resource system had delayed the production of certain FERC financial reports that are required in any Section 204 filing. FERC denied the extension request on the grounds that the lack of current FERC financial reports rendered the Commission unable to make the required findings under Section 204 as to the Company’s ability to perform certain public utility functions. As a result, National Grid implemented a contingency plan aimed at ensuring that each impacted public utility subsidiary would have sufficient cash resources pending a new short-term borrowing authorisation. This contingency plan included the receipt of open account advances and/or capital contributions permitted under the existing FERC borrowing authorisation. National Grid intends to file its Section 204 renewal applications as soon as practicable this year. |
Strategic Report | Corporate Governance | Financial Statements | Additional Information | 165 |
Summary of US price controls and rate plans
| ||||||
†Revenue decoupling A mechanism that removes the link between a utility’s revenue and sales volume so that the utility is indifferent to changes in usage. Revenues are reconciled to a revenue target, with differences billed or credited to customers. Allows the utility to support energy efficiency. ‡Capital tracker A mechanism that allows for the recovery of the revenue requirement of incremental capital investment above that embedded in base rates, including depreciation, property taxes and a return on the incremental investment. | §Commodity-related bad debt true-up A mechanism that allows a utility to reconcile commodity-related bad debt to either actual commodity-related bad debt or to a specified commodity-related bad debt write-off percentage. For electricity utilities, this mechanism also includes working capital. ¯Pension/OPEB true-up A mechanism that reconciles the actual non-capitalised costs of pension and OPEB and the actual amount recovered in base rates. The difference may be amortised and recovered over a period or deferred for a future rate case. | |||||
166 National Grid Annual Report and Accounts 2013/14 | ||||||||||||
Business information in detail continued |
Strategic Report | Corporate Governance | Financial Statements | Additional Information | 167 |
Management of our risks is an important part of our internal control environment, as we describe on pages 22 to 25. In addition to the principal risks listed we face a number of inherent risks that could have a material adverse effect on our business, financial | ||||||||
Risk factors | ||||||||
Potentially harmful activities | ||||||||
Aspects of the work we do could potentially harm employees, contractors, members of the public or the environment. Potentially hazardous activities that arise in connection with our business include the operation and maintenance of electricity generation facilities, electricity lines and substations and the storage, transmission and distribution of gas. Electricity and gas utilities also typically use and generate hazardous and potentially hazardous products and by-products. In addition, there may be other aspects of our operations that are not currently regarded or proved to have adverse effects but could become so, such as the effects of electric and magnetic fields. A significant safety or environmental incident, or the failure of our safety processes or of our occupational health plans, as well as the breach of our regulatory or contractual obligations or our climate change targets, could materially adversely affect our results of operations and our reputation. We commit significant resources and expenditure to process safety and to monitoring safety and occupational health, as well as environmental risks, and to meeting our obligations under negotiated settlements. | We are also subject to laws and regulations in the UK and US governing health and safety matters to protect the public and our employees and contractors, who could potentially be harmed by these activities as well as laws and regulations relating to pollution, the protection of the environment, and the use and disposal of hazardous substances and waste materials. These expose us to costs and liabilities relating to our operations and properties whether current, including those inherited from predecessor bodies, or formerly owned by us, and sites used for the disposal of our waste. The If more onerous requirements are imposed or our ability to recover these costs under regulatory frameworks changes, this could have a material adverse impact on our business, reputation, results of operations and financial position. For more information about environmental, climate change and health and safety matters relating to our business, see the corporate responsibility section of our website. | |||||||
Infrastructure and IT systems | ||||||||
We may suffer a major network failure or interruption, or may not be able to carry out critical non-network operations due to the failure of technology supporting our business-critical processes. Operational performance could be materially adversely affected by a failure to maintain the health of the system or network, inadequate forecasting of demand, inadequate record keeping or control of data or failure of information systems and supporting technology. This could cause us to fail to meet agreed standards of service, incentive and reliability targets, or be in breach of a licence, approval, regulatory requirement or contractual obligation. Even incidents that do not amount to a breach could result in adverse regulatory and financial consequences, as well as harming our reputation. In addition to these risks, we may be affected by other potential events that are largely outside our control, such as the impact of weather (including as a result of climate change and major storms), unlawful or unintentional acts of third parties, insufficient or unreliable supply or force majeure. Weather conditions can affect financial performance and severe weather that causes outages or damages infrastructure together with our actual or perceived response will materially adversely affect operational and potentially business performance and our reputation. | Malicious attack, sabotage or other intentional acts, including breaches of our cyber security, may also damage our assets (which include critical national infrastructure) or otherwise significantly affect corporate activities and, as a consequence, have a material adverse impact on our reputation, business, results of operations and financial condition. Unauthorised access to, or deliberate breaches of, our IT systems may also lead to manipulation of our proprietary business data or customer information. Unauthorised access to private customer information may make us liable for a violation of data privacy regulations. Even where we establish business continuity controls and security against threats against our systems, these may not be sufficient. Due to control weaknesses occurring from the implementation of the US business’s new enterprise resource system, associated controls over financial reporting and related system programme conversion difficulties, we may be unable to provide accurate financial reporting and regulatory compliance reporting in a timely manner, which may include the provision of financial statements. This could result in regulatory fines, penalties, and other sanctions and adversely impact our operations, our reputation and our relationship with our regulators and other stakeholders. | |||||||
168 National Grid Annual Report and Accounts 2013/14 | ||||||||||||
Business information in detail continued |
Risk factors | ||||||||||||||||||||||||||||||||||||||||||||||||||||||||||||||||||||||||||||||||||||||||||||||||||||||||||||||||||||||||||||||||||||||||||||||||||||||||||||||||||||||||||||
Law and regulation | ||||||||||||||||||||||||||||||||||||||||||||||||||||||||||||||||||||||||||||||||||||||||||||||||||||||||||||||||||||||||||||||||||||||||||||||||||||||||||||||||||||||||||||
Changes in law or regulation or decisions by governmental bodies or regulators could materially adversely affect us. Most of our businesses are utilities or networks subject to regulation by governments and other authorities. Changes in law or regulation or regulatory policy and precedent, including decisions of governmental bodies or regulators, in the countries or states in which we operate could materially adversely affect us. If we fail to engage in the energy policy debate, we may not be able to influence future energy policy and deliver our strategy. Decisions or rulings concerning, for example: (i) whether licences, approvals or agreements to operate or supply are granted, amended or renewed, whether consents for construction projects are granted in a timely manner or whether there has been any breach of the terms of a licence, approval or regulatory requirement; and (ii) timely recovery of incurred expenditure or obligations, the ability to pass through commodity costs, a decoupling of | energy usage and revenue, and other decisions relating to the impact of general economic conditions on us, our markets and customers, implications of climate change, whether aspects of our activities are contestable, the level of permitted revenues and dividend distributions for our businesses and in relation to proposed business development activities, could have a material adverse impact on our results of operations, cash flows, the financial condition of our businesses and the ability to develop those businesses in the future. As the result of control weaknesses in our US business, we may be unable to provide timely regulatory reporting, which may include the provision of financial statements. This could result in the imposition of regulatory fines, penalties and other sanctions, which could impact our operations, our reputation and our relationship with our regulators and other stakeholders. For further information see pages 160 to 165, which explain our regulatory environment in detail. | |||||||||||||||||||||||||||||||||||||||||||||||||||||||||||||||||||||||||||||||||||||||||||||||||||||||||||||||||||||||||||||||||||||||||||||||||||||||||||||||||||||||||||
Business performance | ||||||||||||||||||||||||||||||||||||||||||||||||||||||||||||||||||||||||||||||||||||||||||||||||||||||||||||||||||||||||||||||||||||||||||||||||||||||||||||||||||||||||||||
Current and future business performance may not meet our expectations or those of our regulators and shareholders. Earnings maintenance and growth from our regulated gas and electricity businesses will be affected by our ability to meet or exceed efficiency targets and service quality standards set by, or agreed with, our regulators. | If we do not meet these targets and standards, or if we do not implement the transformation projects we are carrying out as envisaged, including to our US financial systems and controls over financial reporting, or are not able to deliver our RIIO operating model and the US Elevate 2015 strategy successfully, we may not achieve the expected benefits, our business may be materially adversely affected and our performance, results of operations and reputation may be materially harmed and we may be in breach of regulatory or contractual obligations. | |||||||||||||||||||||||||||||||||||||||||||||||||||||||||||||||||||||||||||||||||||||||||||||||||||||||||||||||||||||||||||||||||||||||||||||||||||||||||||||||||||||||||||
Growth and business development activity | ||||||||||||||||||||||||||||||||||||||||||||||||||||||||||||||||||||||||||||||||||||||||||||||||||||||||||||||||||||||||||||||||||||||||||||||||||||||||||||||||||||||||||||
Failure to respond to external market developments and execute our strategic ambition may negatively affect our performance. Conversely, new businesses or activities that we undertake alone or with partners may not deliver target outcomes and may expose us to additional operational and financial risk. Failure to grow our core business sufficiently and have viable options for new future business over the longer term could negatively affect the Group’s credibility and reputation and jeopardise the achievement of intended financial returns. Business development activities and the delivery of our growth ambition, including acquisitions, disposals, joint ventures, partnering and organic investment opportunities (including organic investments made as a result of changes to the energy | mix), are subject to a wide range of both external uncertainties (including the availability of potential investment targets and attractive financing), and internal uncertainties (including actual performance of our various existing operating companies and our business planning model assumptions and ability to integrate acquired businesses effectively). As a result, we may suffer unanticipated costs and liabilities and other unanticipated effects. We may also be liable for the past acts, omissions or liabilities of companies or businesses we have acquired, which may be unforeseen or greater than anticipated. In the case of joint ventures, we may have limited control over operations and our joint venture partners may have interests that diverge from our own. The occurrence of any of these events could have a material adverse impact on our results of operations or financial condition, and could also impact our ability to enter into other transactions. | |||||||||||||||||||||||||||||||||||||||||||||||||||||||||||||||||||||||||||||||||||||||||||||||||||||||||||||||||||||||||||||||||||||||||||||||||||||||||||||||||||||||||||
Cost escalation | ||||||||||||||||||||||||||||||||||||||||||||||||||||||||||||||||||||||||||||||||||||||||||||||||||||||||||||||||||||||||||||||||||||||||||||||||||||||||||||||||||||||||||||
Changes in foreign currency rates, interest rates or commodity prices could materially impact earnings or our financial condition. We have significant operations in the US and so are subject to the exchange rate risks normally associated with non UK operations, including the need to translate US assets and liabilities, and income and expenses, into sterling, our primary reporting currency. In addition, our results of operations and net debt position may be affected because a significant proportion of our borrowings, | derivative financial instruments
| |||||||||||||||||||||||||||||||||||||||||||||||||||||||||||||||||||||||||||||||||||||||||||||||||||||||||||||||||||||||||||||||||||||||||||||||||||||||||||||||||||||||||||
Strategic Report
|
| Financial Statements | Additional Information | 169 | |||||||||||||||||||||||||||||||||||||||||||||||||||||||||||||||||||||||
Risk factors | ||||
Operating costs may increase faster than revenues. | In periods of inflation in the US, our operating costs may increase by more than our revenues. In both the UK and US such increased costs may materially adversely affect the results of our operations. | |||
Income under our price controls in the UK is linked to the RPI. Our operating costs may increase without a corresponding increase in the RPI and therefore without a corresponding increase in UK revenues. Our income under our rate plans in the US is not typically linked to inflation. | ||||
We may be required to make significant contributions to fund pension and other post-retirement benefits. We participate in a number of pension schemes that together cover substantially all our employees. In both the UK and US, the principal schemes are DB schemes where the scheme assets are held independently of our own financial resources. In the US, we also have other post-retirement benefit schemes. Estimates of the amount and timing of future funding for the UK and US schemes are based on actuarial assumptions | and other factors including: the actual and projected market performance of the scheme assets, future long-term bond yields, average life expectancies and relevant legal requirements. Actual performance of scheme assets may be affected by volatility in debt and equity markets. Changes in these assumptions or other factors may require us to make additional contributions to these pension schemes which, to the extent they are not recoverable under our price controls or state rate plans, could materially adversely affect the results of our operations and financial condition. | |||
Financing and liquidity | ||||
An inability to access capital markets at commercially acceptable interest rates could affect how we maintain and grow our businesses. Our businesses are financed through cash generated from our ongoing operations, bank lending facilities and the capital markets, particularly the long-term debt capital markets. Some of the debt we issue is rated by credit rating agencies and changes to these ratings may affect both our borrowing capacity and borrowing costs. In addition, restrictions imposed by regulators may also limit how we service the financial requirements of our current businesses or the financing of newly acquired or developing businesses. Financial markets can be subject to periods of volatility and shortages of liquidity. If we were unable to access the capital markets or other sources of finance at competitive rates for a prolonged period, our cost of financing may increase, the discretionary and uncommitted elements of our proposed capital investment programme may need to be reconsidered and the manner in which we implement our strategy may need to be reassessed. Such events could have a material adverse impact on our business, results of operations and prospects. Some of our regulatory agreements impose lower limits for the long-term senior unsecured debt credit ratings that certain | companies within the Group must hold or the amount of equity within their capital structures. One of the principal limits requires National Grid plc to hold an investment grade long-term senior unsecured debt credit rating. In addition, some of our regulatory arrangements impose restrictions on the way we can operate. These include regulatory requirements for us to maintain adequate financial resources within certain parts of our operating businesses and may restrict the ability of National Grid plc and some of our subsidiaries to engage in certain transactions, including paying dividends, lending cash and levying charges. The Due to control weaknesses in our US business, we may be unable to provide accurate financial information to our debt investors in a timely manner. Our debt agreements and banking facilities contain covenants, including those relating to the | |||
Customers and counterparties | ||||
Customers and counterparties may not perform their obligations. Our operations are exposed to the risk that customers, suppliers, banks and other financial institutions and others with whom we do business will not satisfy their obligations, which could materially adversely affect our financial position. | This risk is significant where our subsidiaries have concentrations of receivables from gas and electricity utilities and their affiliates, as well as industrial customers and other purchasers, and may also arise where customers are unable to pay us as a result of increasing commodity prices or adverse economic conditions. There is also a risk to us where we invest excess cash, enter into derivatives and other financial contracts with banks or other financial institutions. Banks who provide us with credit facilities may also fail to perform under those contracts. | |||
Employees and others | ||||
We may fail to attract, develop and retain employees with the competencies, including leadership and business capabilities, values and behaviours required to deliver our strategy and vision and ensure they are engaged to act in our best interests. Our ability to implement our strategy depends on the capabilities and performance of our employees and leadership at all levels of the business. Our ability to implement our strategy and vision may be negatively affected by the loss of key personnel or an inability to attract, integrate, engage and retain appropriately | qualified personnel, or if significant disputes arise with our employees. As a result, there may be a material adverse effect on our business, financial condition, results of operations and prospects. There is a risk that an employee or someone acting on our behalf may breach our internal controls or internal governance framework or may contravene applicable laws and regulations. This could have an impact on the results of our operations, our reputation and our relationship with our regulators and other stakeholders. | |||
170 National Grid Annual Report and Accounts 2013/14 | ||||||||||||
| ||||||||||||||||||||||||||||||||||||||||||||||||||||||
| Internal control over financial reporting | ||||||||||||||||||||||||||||||||||||||||||||||||||||||||||||||||||||||||||||||||||||||||||||||||||||||||||||||||||||||||||||||||||||||||||||||||||||||||||||||||||||||||||||||||||||||||||||||||||||||||||||||||||||||||||||||||||||||||||||||||||||||||||||||||||||||||||||||||||||||
The | Our management, including the Chief Executive and Finance Director, has carried out an evaluation of our internal control over financial reporting pursuant to the Disclosure and Transparency Rules and Section 404 of the Sarbanes-Oxley Act 2002. As required by Section 404, management is responsible for establishing and maintaining an adequate system of internal control over financial reporting (as defined in Rules 13a-15(f) and 15d-15(f) under the Exchange Act). Our internal control over financial reporting is designed to provide reasonable assurance regarding the reliability of financial reporting and the preparation of financial statements for external purposes in accordance with generally accepted accounting principles. Because of its inherent limitations, internal control over financial reporting may not prevent or detect misstatements. Also, projections of any evaluation of effectiveness to future periods are subject to risk that controls may become inadequate because of changes in conditions, or that the degree of compliance with the policies or procedures may deteriorate. Management evaluation of the effectiveness of the Company’s
PricewaterhouseCoopers LLP, which has audited our consolidated financial
During the | |||||||||||||||||||||||||||||||||||||||||||||||||||||||||||||||||||||||||||||||||||||||||||||||||||||||||||||||||||||||||||||||||||||||||||||||||||||||||||||||||||||||||||||||||||||||||||||||||||||||||||||||||||||||||||||||||||||||||||||||||||||||||||||||||||||||||||||||||||||
Key elements in managing information assurance risks include education, training, awareness and ongoing transformation initiatives. | ||||||||||||||||||||||||||||||||||||||||||||||||||||||||||||||||||||||||||||||||||||||||||||||||||||||||||||||||||||||||||||||||||||||||||||||||||||||||||||||||||||||||||||||||||||||||||||||||||||||||||||||||||||||||||||||||||||||||||||||||||||||||||||||||||||||||||||||||||||||
In line with ongoing transformation initiatives, we also continue to monitor and evolve our control processes, which is supported by the Certificate of Assurance process in which managers affirm, among other
| ||||||||||||||||||||||||||||||||||||||||||||||||||||||||||||||||||||||||||||||||||||||||||||||||||||||||||||||||||||||||||||||||||||||||||||||||||||||||||||||||||||||||||||||||||||||||||||||||||||||||||||||||||||||||||||||||||||||||||||||||||||||||||||||||||||||||||||||||||||||
| All communication channels, including training for ‘Doing the Right Thing’, make it clear that the accurate and honest reporting of data and other information must never be compromised. | ||||||||||||||||||||||||||||||||||||||||||||||||||||||||||||||||||||||||||||||||||||||||||||||||||||||||||||||||||||||||||||||||||||||||||||||||||||||||||||||||||||||||||||||||||||||||||||||||||||||||||||||||||||||||||||||||||||||||||||||||||||||||||||||||||||||||||||||||||||||
| Working with management, including the Chief Executive and Finance Director, we have evaluated the effectiveness of the design and operation of our disclosure controls and procedures as at 31 March 2014. Our disclosure controls and procedures are designed to provide reasonable assurance of achieving their objectives, however the effectiveness of any system of disclosure controls and procedures has limitations including the possibility of human error and the circumvention or overriding of the controls and procedures. Even effective disclosure controls and procedures provide only reasonable assurance of achieving their objectives. Based on the evaluation, the Chief Executive and Finance Director concluded that the disclosure controls and procedures are effective to provide reasonable assurance that information required to be disclosed in the reports that we file and submit under the Exchange Act is recorded, processed, summarised and reported as and when required and that such information is accumulated and communicated to our management, including the Chief Executive and Finance Director, as appropriate, to allow timely decisions regarding disclosure. | ||||||||||||||||||||||||||||||||||||||||||||||||||||||||||||||||||||||||||||||||||||||||||||||||||||||||||||||||||||||||||||||||||||||||||||||||||||||||||||||||||||||||||||||||||||||||||||||||||||||||||||||||||||||||||||||||||||||||||||||||||||||||||||||||||||||||||||||||||||||
Strategic Report
|
| Financial Statements | Additional Information | 171 | |||||||||||||||||||||||||||||||||||||||||||||||||||||||||||||||||||||||||||||||||||||||||||||||||||||||||||||||||||||||||||||||||||||||||||||||||||||||||||||||||||||||||||||||||||||||||||||||||||||||||||||||||||||||||||||||||||||||||||||||||||||||||||||||||||||||||||||||||||||||||||||||||||||||||||||||||||||||||||||||||||||||||||
disclosures |
A summary of the material terms of our Articles of Association (the Articles) and Sir Peter Gershon CBE FREng, Chairman Appointment to the Board: August 2011 as Deputy Chairman, Chairman with effect from January 2012 Committee membership: N (ch) Previous appointments: Chairman of Premier Farnell plc, Chief Executive of the Office of Government Commerce, Managing Director of Marconi Electronic Systems and member of the UK Defence Academy Advisory Board. External appointments: Chairman of Tate & Lyle plc and the Aircraft Carrier Alliance and member of the HM Government Efficiency and Reform Board and The Sutton Trust Board. Experience: — Chairman — Engineer — Government — Partnering/JV/contract management — City — High tech industry — US — International — General management Steve Holliday FREng, Chief Executive Appointment to the Board: October 2002, appointed to National Grid Group plc 2001, Chief Executive with effect from January 2007. Committee membership: F Previous appointments: Executive Director of British Borneo Oil and Gas; he also spent 19 years within the Exxon Group, where he held senior positions in the international gas business and managed major operational areas such as refining and shipping. Most recently Chairman of UK Business Council for Sustainable Energy and the Technician Council. External appointments: Non-executive Director of Marks and Spencer Group plc, Chairman of Crisis UK, the Prince’s National Ambassador, Vice Chair for Business in the Community and Chair of the Energy and Efficiency Industrial Partnership. Experience: — Chief Executive — Engineer — Government/regulatory — Partnering/JV/contract management — City — Utilities – energy — Customer — Oil and gas — US — International | Philip Aiken AM, Non-executive Director Appointment to the Board: May 2008 Committee membership: A, N, S (ch) Previous appointments:Group President of BHP Billiton’s Energy business, Executive Director of BTR plc, held senior roles in BOC Group plc, senior advisor to Macquarie Capital (Europe) Limited, Chairman of Robert Walters plc, Non-executive and Senior Independent Director of Kazakhmys PLC and Non-executive Director of Miclyn Express Offshore Limited. External appointments: Chairman of AVEVA Group plc, Non-executive and Senior Independent Director of Essar Energy plc and Non-executive Director of Essar Oil Limited and Newcrest Mining Limited. Experience: — Chairman — Partnering/JV/contract management — Emerging markets — Natural resources — International Andrew Bonfield, Finance Director Appointment to the Board: November 2010 Committee membership: F, S Previous appointments: Chief Financial Officer at Cadbury plc until March 2010; he also spent five years as Executive Vice President & Chief Financial Officer of Bristol-Myers Squibb Company and has previous experience in the energy sector as Finance Director of BG Group plc. External appointments: Non-executive Director of Kingfisher plc. Experience: — Finance Director — Accountant — Government/regulatory — Partnering/JV/contract management — City — Utilities – energy — Customer — US — International Nora Mead Brownell, Non-executive Director Appointment to the Board: 1 June 2012 Committee membership: N, R, S Previous appointments: Commissioner of the Pennsylvania Public Utility Commission from 1997 to 2001, Commissioner for the External appointments: Board member of Comverge, Inc. and Experience: — US Government/regulatory — US utilities – energy — FERC — Various non-executive directorships — US |
| ||||||||||||
Directors’ Report disclosures continued |
| Jonathan Dawson, Non-executive Director | Ruth Kelly, Non-executive Director | |||||
Appointment to the Board: 4 March 2013 Committee membership: F, N, R (ch) Previous appointments: Various roles within the Ministry of Defence before joining Lazard where he spent over 20 years. Non-executive Director of Galliford Try plc 2004 to 2008, National Australia Group Europe Limited 2005 to 2012 and Standard Life Investments (Holdings) Limited 2010 to 2013. External appointments: Non-executive and Senior Independent Director of Next plc, Non-executive Director of Jardine Lloyd Thompson Group plc and Chairman of Penfida Limited. Experience: — City — Corporate finance — Banking — Pensions Therese Esperdy, Non-executive Director Appointment to the Board: 18 March 2014 Committee membership: F, N Previous appointments: Joined Chase Securities in 1997, having started her banking career with Lehman Brothers. Various senior roles at JPMorgan Chase & Co. including Head of US Debt Capital Markets and Global Head of Debt Capital Markets at JPMorgan. External appointments: Co head of Banking, Asia Pacific for JPMorgan Chase & Co. Experience: — City — Corporate finance — Banking — US — International Paul Golby CBE FREng, Non-executive Director Appointment to the Board: February 2012 Committee membership: N, R, S Previous appointments: Executive Director of Clayhithe plc before joining East Midlands Electricity plc in 1998 as Managing Director, Chief Executive of E.ON UK plc in 2002, and later additionally as Chairman, stepping down from the E.ON board in December 2011 and most recently Non-executive Chairman of AEA Technology Group plc. External appointments: Chairman of EngineeringUK, Chair of the Engineering and Physical Sciences Research Council and a member of the Council for Science and Technology. Experience: — Chairman and chief executive — Engineer — Government/regulatory — City — Utilities – energy | Appointment to the Board: October 2011 Committee membership: A, F, N Previous appointments: Various senior roles in Government from 2001 to 2008, including Secretary of State for Transport, Secretary of State for Communities and Local Government, Secretary of State for Education and Skills and Financial Secretary to the Treasury. External appointments: Senior Executive at HSBC and Governor for the National Institute of Economic and Social Research. Experience: — Government/regulatory — Partnering/JV/contract management — Financial and economic — Infrastructure projects Tom King, Executive Director, US Appointment to the Board: August 2007 Previous appointments: President of PG&E Corporation and Chairman and CEO of Pacific Gas and Electric Company from 2003 to 2007, having held a number of senior positions within the PG&E group since joining in 1998. Senior management positions with Kinder Morgan Energy Partners and Enron Corporation. Experience: — Government/regulatory — Partnering/JV/contract management — Utilities – energy — Customer — FERC — Generation — US John Pettigrew, Executive Director, UK Appointment to the Board: 1 April 2014 Previous appointments: Joined The National Grid Company plc in 1991 and held various senior management roles, becoming Director of Engineering in 2003. He went on to become Chief Operating Officer and Executive Vice President for the US Electricity Distribution & Generation business between 2007 and 2010; Chief Operating Officer for UK Gas Distribution between 2010 and 2012; and UK Chief Operating Officer from 2012 to 2014. Currently UK Chief Operating Officer. Experience: — Government/regulatory — Partnering/JV/contract management — Utilities – energy — US Maria Richter, Non-executive Director Appointment to the Board: October 2003 Committee membership: A, F (ch), N Previous appointments: Morgan Stanley from 1993 to 2002, latterly as Managing Director of its Corporate Finance Retail Group. Vice President of Independent Power Group for Salomon Brothers and Vice President of Prudential Capital Corporation and Power Funding Associates. Most recently Non-executive Director of The Pantry, Inc. and The Vitec Group plc. External appointments: Non-executive Chairman of Pro Mujer UK and Non-executive Director of The Bessemer Group, Inc. Experience: — City — Financial services — Emerging markets — US — International |
| Corporate Governance
| Financial Statements | Additional Information | 173 |
Mark Williamson, Non-executive Director
Committee membership: A (ch), N, R Previous appointments: Chief Accountant then Group Financial Controller of External appointments: Non-executive, Chairman of the Audit Committee and Senior Independent Director of Alent plc, and Chairman of Imperial Tobacco Group PLC. Experience: — Finance director — Accountant — Government/regulatory — City — Utilities – energy — International
Nick Winser CBE FREng, Executive Director, UK
Non-executive Director of Kier Group plc, Chair of CIGRE UK, Vice President and Trustee of The
— Engineer — Government/regulatory — Partnering/JV/contract management — City — Utilities – energy — Customer — US
Alison Kay, Group General Counsel & Company Secretary
Previous appointments: Various roles since joining National Grid
|
CGT information relating to National Grid shares for UK resident shareholders can be found on our website under Investors, Shareholder Services. Share prices on specific dates can also be found on our website.
No compensation would be paid for loss of office of Directors on a change of control of the Company. As at 31 March No other agreements that take effect, alter or terminate upon a change of control of the Company following a takeover bid are considered to be significant in terms of their potential impact on the business as a whole.
The Board continues to monitor and note possible conflicts of interest that each Director may have and Directors are reminded of their continuing obligations in relation to conflicts at each Board meeting. Potential conflicts are considered and, if appropriate, approved and
The Company has arranged, in accordance with the Companies Act 2006 and the Articles,
| ||||||||||||||||||||||||||||||||||||||||||||||||||||||||||||||||||||||||||||||||||||||||||||||||||||||||||||||||||||||||||||||||||||||||||
| Key | |||||||||||||||||||||||||||||||||||||||||||||||||||||||||||||||||||||||||||||||||||||||||||||||||||||||||||||||||||||||||||||||||||||||||||
| A | Audit Committee | ||||||||||||||||||||||||||||||||||||||||||||||||||||||||||||||||||||||||||||||||||||||||||||||||||||||||||||||||||||||||||||||||||||||||||
| F | Finance Committee | ||||||||||||||||||||||||||||||||||||||||||||||||||||||||||||||||||||||||||||||||||||||||||||||||||||||||||||||||||||||||||||||||||||||||||
| N | Nominations Committee | ||||||||||||||||||||||||||||||||||||||||||||||||||||||||||||||||||||||||||||||||||||||||||||||||||||||||||||||||||||||||||||||||||||||||||
| R | Remuneration Committee | ||||||||||||||||||||||||||||||||||||||||||||||||||||||||||||||||||||||||||||||||||||||||||||||||||||||||||||||||||||||||||||||||||||||||||
| S | Safety, Environment and | ||||||||||||||||||||||||||||||||||||||||||||||||||||||||||||||||||||||||||||||||||||||||||||||||||||||||||||||||||||||||||||||||||||||||||
| Health Committee | |||||||||||||||||||||||||||||||||||||||||||||||||||||||||||||||||||||||||||||||||||||||||||||||||||||||||||||||||||||||||||||||||||||||||||
| (ch) | Chairman of committee | ||||||||||||||||||||||||||||||||||||||||||||||||||||||||||||||||||||||||||||||||||||||||||||||||||||||||||||||||||||||||||||||||||||||||||
174 National Grid | ||||||||||||
Directors’ Report disclosures continued |
As at 31 March 2014, National Grid had been notified of the following holdings in voting rights of 3% or more in the issued share capital of the Company:
| The share capital of the Company consists of ordinary shares of 11 17⁄43 pence nominal value each and ADSs, which represent five ordinary shares.
Authority to purchase shares Shareholder approval was given at the 2013 AGM to purchase up to 10% of the Company’s share capital. The Directors intend to seek shareholder approval to renew this authority at this year’s AGM.
In some circumstances, the Company may find it advantageous to have the authority to purchase its own shares in the market. The Directors believe that it is an important part of the financial management of the Company to have the flexibility to repurchase issued shares in order to manage its capital base.
The Company will only purchase shares where the Directors believe this would be in the best interests of shareholders generally, for example to manage the excess share dilution created by a large take-up through the scrip dividend scheme. The authority will only be used after careful consideration, taking into account market conditions prevailing at the time, other investment opportunities, appropriate gearing levels and the overall financial position of the Company.
Share issuance arising from the operation of the scrip dividend scheme may be actively managed through the repurchase of the Company’s shares. It is expected that such repurchases will not exceed 1% of the issued share capital (excluding treasury shares) per annum. For further details in relation to the management of the scrip dividend scheme, see page 02.
Repurchased shares may be held as treasury shares by the Company, and resold for cash, cancelled, either immediately or at some point in the future, or used for the purposes of employee share schemes.
No shares were repurchased during the year. Of the shares repurchased in prior years and held as treasury shares, 7,578,281 have been transferred to employees under the employee share plans, leaving a balance as at the date of this report of 119,565,599 ordinary shares held as treasury shares. | |||||||||
| Number of ordinary shares | % of voting rights1 | |||||||||
| ||||||||||
| The Capital Group Companies, Inc. | 414,173,676 | 11.103 | ||||||||
| Black Rock, Inc. | 182,630,798 | 5.21 | ||||||||
| Crescent Holding GmbH | 149,414,285 | 4.07 | ||||||||
| ||||||||||
1. This number is calculated in relation to the issued share capital at the time the holding was disclosed.
As at 18 May 2014, no further notifications have been received.
The rights attached to ordinary shares are detailed on page 175. All ordinary shares carry the same voting rights.
Political donations and expenditure National Grid made no donations in the UK or EU during the year, including donations as defined for the purposes of the Political Parties, Elections and Referendums Act 2000. National Grid USA and its affiliated New York and federal political action committees (each, a PAC) made political donations in the US totalling $100,325 (£61,929) during the year. National Grid USA’s affiliated New York PAC was funded partly by contributions from National Grid USA and certain of its subsidiaries and partly by voluntary employee contributions. National Grid USA’s affiliated federal PAC was funded wholly by voluntary employee contributions.
Expenditure on research and development during the year was £12 million (2012/13: £15 million; 2011/12: £15 million). RIIO has strengthened the incentives and provided additional innovation funding support to stimulate innovation so that we deliver increased benefits for our stakeholders.
During 2013/14, collaboration has been a key focus for a number of National Grid’s innovation projects in all three of our UK Regulated business areas: UK ET, UK GT and UK GD. Innovation in UK ET has focused on technologies and approaches for enhancing the capacity and the reliability of the electricity transmission network. UK GT has focused innovation on safety and alternative material while incorporating commercial, operation and process-led innovation to complement the preceding focus on asset management. Innovation in UK GD has centred around life extension and emission reduction, looking to robotic technologies that can remediate our assets while having the minimum of impact on our customers through street works. Focus has also been on understanding the potential of alternative fuel sources to support a low carbon economy.
| ||||||||||
Strategic Report | Corporate Governance | Financial Statements | Additional Information | 175 |
Authority to allot shares Shareholder approval was given at the 2013 AGM to allot shares of up to one third of the This year the Directors are seeking a lower level of
The Company intends to actively manage the share issuance arising from the operation of the scrip dividend scheme. In some circumstances, additional shares may be allotted to the market under the authority provided by this resolution. Under these unlikely circumstances, it is Rights attached to shares Ordinary shareholders and ADS holders receive dividends and can vote at general meetings. Treasury shares do not attract a vote or dividends. There are no restrictions on the transfer or sale of ordinary shares. Some of the Company’s employee share
The following
| ||||||||||||||||||||||||||||||||||||||||||||||||||||||||||||||||||||||||||||||||||||||||||||||||||||||||||||||||||||||||||||||||||||||||||||||||||||||||||||||||||||||||
| ||||||||||||
| ||||||||||||
| ||||||||||||
| ||||||||||||
| ||||||||||||
| ||||||||||||
| ||||||||||||
| ||||||||||||
| ||||||||||||
| ||||||||||||
| ||||||||||||
| ||||||||||||
| ||||||||||||
| ||||||||||||
| ||||||||||||
| ||||||||||||
CGT information relating to National Grid shares for UK resident shareholders can be found on our website under Investors. Share prices on specific dates can also be found on our website.
This information can be found under the heading note 10 property, plant and equipment on page 137, operating across two geographies on page 15 and principal operations on pages 64 to 71.
We negotiate with recognised unions. It is our policy to maintain well developed communications and consultation programmes and there have been no material disruptions to our operations from labour disputes during the past five years. National Grid believes that it can conduct its relationships with trade unions and employees in a satisfactory manner.
There are no unresolved staff comments required to be reported.

176 National Grid Annual Report and Accounts 2011/122013/14National Grid plc185
Additional Information
|
Price history
The following table shows the highest and lowest intraday market prices for our ordinary shares and ADSs for the periods indicated.
Ordinary share (pence) | ADS ($) | |||||||||
| High | Low | High | Low | |||||||
| ||||||||||
2011/12 |
| 660.50 | 545.50 | 52.18 | 45.80 | |||||
2010/11* |
| 666.00 | 474.80 | 51.00 | 36.72 | |||||
2009/10 |
| 685.50 | 511.00 | 56.59 | 38.25 | |||||
2008/09 |
| 754.00 | 515.00 | 74.89 | 36.64 | |||||
2007/08 |
| 863.00 | 686.00 | 86.58 | 69.22 | |||||
2011/12 Q4 |
| 660.50 | 605.50 | 51.86 | 46.85 | |||||
Q3 |
| 653.50 | 590.00 | 51.53 | 46.49 | |||||
Q2 |
| 650.59 | 545.50 | 51.00 | 45.80 | |||||
Q1 |
| 639.00 | 581.50 | 52.18 | 46.93 | |||||
2010/11 Q4 |
| 598.31 | 521.50 | 48.41 | 42.29 | |||||
Q3 |
| 600.50 | 536.50 | 48.88 | 42.76 | |||||
Q2 |
| 565.00 | 480.30 | 44.17 | 36.72 | |||||
Q1 |
| 666.00 | 474.80 | 51.00 | 36.77 | |||||
April 2012 |
| 674.50 | 627.00 | 54.18 | 49.85 | |||||
March 2012 |
| 660.50 | 622.50 | 51.86 | 49.78 | |||||
February 2012 |
| 651.50 | 620.00 | 51.37 | 49.38 | |||||
January 2012 |
| 639.00 | 605.50 | 49.99 | 46.85 | |||||
December 2011 |
| 634.00 | 590.00 | 49.87 | 46.49 | |||||
| ||||||||||
*On 20 May 2010, we announced a 2 for 5 rights issue of 990,439,017 ordinary shares at 355 pence per share
The following description is a summary of the material terms of our Articles
Summary The Articles set out the internal regulations of the Company and cover such matters as the rights of shareholders and the conduct of the Board and general meetings. Copies are available upon request and are displayed on the Company’s website. Amendments to the Articles have to be approved by at least 75% of those voting in person or by proxy at a general meeting of the Company. Subject to company law and the Articles, the Directors may exercise all the powers of the Company, and may delegate authorities to General The Company is incorporated under the name National Grid plc and is registered in England and Wales with registered number 4031152. Under the Companies Act 2006, the Company’s objects are unrestricted. Directors Under the Articles, a Director must disclose any personal interest in a matter and may not vote in respect of that matter, subject to certain limited exceptions. As permitted under the Companies Act 2006, the Articles provide that the non conflicted Directors of the Company may authorise a conflict or potential conflict for a particular matter. In doing so, the non conflicted Directors must act in a way they consider, in good faith, will be most likely to promote the success of the Company for the benefit of the shareholders as a whole. The Directors (other than a Director acting in an executive capacity) are paid fees for their services, which in total must not exceed £2,000,000 a year or any higher sum as decided by an ordinary resolution at a general meeting of shareholders. In addition, special pay may be awarded to a Director who acts in an executive capacity, serves on a committee, performs services which the Directors consider to extend beyond the ordinary duties of a Director, devotes special attention to the business of National Grid or goes or lives abroad on the Company’s behalf. Directors may also receive reimbursement for expenses properly incurred, and may be awarded pensions and other benefits. The compensation awarded to the Executive Directors is determined by the Remuneration Committee The Directors are empowered to exercise all the powers of National Grid to borrow money, subject to the limitation that the aggregate principal amount of all borrowings of its Directors can be appointed or removed by the Board or shareholders in a general meeting. Directors must stand for election at the first AGM following their appointment to the Board. Each Director must retire at least every three years but will be eligible for re-election. In accordance with best practice introduced | by the UK Corporate Governance Code, all Directors wishing to continue in office currently offer themselves for re-election annually. No person is disqualified from being a Director or is required to vacate that office by reason of attaining a maximum age. A Director is not required to hold shares in National Grid in order to qualify as a Director. Rights, preferences and restrictions (i) Dividend rights National Grid may not pay any dividend otherwise than out of profits available for distribution under the Companies Act 2006 and other applicable provisions of English law. In addition, as a public company, National Grid may only make a distribution if, at the time of the distribution, the amount of its net assets is not less than the aggregate of its called up share capital and undistributable reserves (as defined in the Companies
(ii) Voting rights Subject to any rights or restrictions attached to any shares and to any other provisions of the Articles, at any general meeting on a show of hands, every shareholder who is present in person will have one vote and on a poll, every shareholder will have one vote for every share which they hold. On a show of hands or poll, shareholders may cast votes either personally or by proxy and a proxy need not be a shareholder. Under the Articles, all substantive resolutions at a general meeting must be decided on a poll, and resolutions of a procedural nature are decided by a show of hands, unless a poll is demanded in accordance with the Articles. (iii) Liquidation rights In a winding up, a liquidator may, in each case with the sanction of a special resolution passed by the shareholders and any other sanction required under English law, (a) divide among the shareholders the whole or any part of National Grid’s assets (whether the assets are of the same kind or not) and may, for this purpose, value any assets and determine how the division should be carried out as between shareholders or different classes of shareholders, or (b) transfer any part of the assets to trustees on trust for the benefit of the shareholders as the liquidator determines, but in neither case will a shareholder be compelled to accept assets upon which there is a liability. Variation of rights Subject to applicable provisions of English law, the rights attached to any class of shares of National Grid may be varied or cancelled with the written consent of the holders of three quarters in nominal value of the issued shares of that class, or with the sanction of a special resolution passed at a separate meeting of the holders of the shares of that class. | |||||||
Strategic Report | Corporate Governance | Financial Statements | Additional Information | 177 |
General meetings AGMs must be convened each year within six months of the Company’s accounting reference date upon advance written notice of 21 clear days. Any other general meeting may be convened provided at least 14 clear days’ written notice is given, subject to annual approval of shareholders. In certain limited circumstances, the Company can convene a general meeting by shorter notice. The notice must specify, among other things, the nature of the business to be transacted, the place, the date and the time of the meeting. Rights of non residents There are no restrictions under National Grid’s Articles that would limit the rights of persons not resident in the UK to vote in relation to ordinary shares. Disclosure of interests Under the Companies Act 2006, National Grid may, by written notice, require a person whom it has reasonable cause to believe to be or to have been in the last three years interested in its shares to provide additional information relating to that interest. Under the Articles, failure to provide such information may result in a shareholder losing their rights to attend, vote or exercise any other right in relation to shareholders’ meetings. Under the UK Disclosure and Transparency Rules, there is also an obligation on a person who acquires or ceases to have a notifiable interest in shares in National Grid to notify the Company of that fact. The disclosure threshold is 3% and disclosure is required each time the person’s direct and indirect holdings reach, exceed or fall below each 1% threshold thereafter. The UK City Code on Takeovers and Mergers imposes strict disclosure requirements with regard to dealings in the securities of an offeror or offeree company, and also on their respective associates, during the course of an offer period. Other regulators in the UK, US and elsewhere may have, or assert, notification or approval rights over acquisitions or transfers of shares.
In accordance with US legal requirements, the Board has adopted a Code of Ethics for senior financial professionals. This code is available on our website (where any amendments or waivers will also be posted). There
The corporate governance practices of the Company are primarily based on the requirements of the UK Corporate Governance Code (the Code) but substantially conform to those required of US companies listed on the NYSE. The following is a summary of the significant ways in which the Company’s corporate governance practices differ from those followed by US companies under Section 303A Corporate Governance Standards of the NYSE. | ||||
| — | The NYSE rules and the Code apply different tests for
| |||
| — | The NYSE rules require a | |||
| corporate governance committee in | ||||
| — | The NYSE rules require listed companies to adopt and disclose corporate governance guidelines. While the Company reports compliance with the
each Annual Report and Accounts, | |||
| — | The NYSE rules require a separate audit committee composed of at least three independent members. While the Company’s Audit Committee exceeds the NYSE’s minimum independent non-executive director membership requirements, it should be noted that the quorum for a meeting of the Audit Committee, of two independent non-executive directors, is less than the minimum membership requirements under the NYSE rules. | |||
| — | The NYSE rules require a compensation committee composed entirely of independent directors, and prescribe criteria to evaluate the independence of the committee’s members and its ability to engage external compensation advisors. While the Code prescribes different independence criteria, the Non-executive Directors on the Remuneration Committee have each been deemed independent by the Board under the NYSE rules. Although the evaluation criteria for appointment of external advisors differ under the Code, the Remuneration Committee is solely responsible for appointment, retention and termination of such advisors. | |||
Depositary payments to the Company The Depositary has agreed to reimburse the Company for expenses it incurs that are related maintenance expenses of the ADS programme. The Depositary has also agreed to pay the standard out-of-pocket maintenance costs for the ADSs, which consist of the expenses of postage and envelopes for mailing annual and interim financial reports, printing and distributing dividend cheques, electronic filing of US federal tax information, mailing required tax forms, stationery, postage, facsimile and telephone calls. It has also agreed to reimburse the Company annually for certain investor relationship programmes or special investor relations promotional activities. There are limits on the amount of expenses for which the Depositary will reimburse the Company, but the amount of reimbursement available to the Company is not necessarily tied to the amount of fees the Depositary collects from investors. For the period 1 April 2013 to 16 May 2014, the Company received a total of $1,955,464 in reimbursements from the Depositary consisting of $1,215,766 and $739,698 received in September 2013 and March 2014 respectively. Fees that are charged on cash dividends will be apportioned between the Depositary and the Company, see page 178. Any questions from ADS holders should be directed to: The Bank of New York Mellon Depositary Receipts PO Box 30170 College Station, Texas 77842-3170 Telephone: 1-800-466-7215 (International +1-201-680-6825) Email: shrrelations@cpushareownerservices.com | ||||
178 National Grid | ||||||||||||
Other disclosures continued |
Description of securities other than equity securities: depositary fees and charges The Bank of New York Mellon, as Depositary, collects its fees for delivery and surrender of ADSs directly from investors depositing shares or surrendering ADSs for the purpose of withdrawal or from intermediaries acting for them. The Depositary collects fees for making distributions to investors (including, it is expected going forward, in respect of cash dividends) by deducting those fees from the amounts distributed or by selling a portion of distributable property to pay the fees. The Depositary may generally refuse to provide fee attracting services until its fees for those services are paid.
| National Grid is subject to the filing requirements of the Exchange Act, as amended. In accordance with these requirements, we file reports and other information with the SEC. These materials, including this document, may be inspected during normal business hours at our registered office 1-3 Strand, London WC2N 5EH or at the SEC’s Public Reference Room at 100 F Street, NE, Washington, DC 20549. For further information about the Public Reference Room, please call the SEC at 1-800-SEC-0330. Some of our filings are also available on the SEC’s website at www.sec.gov.
We negotiate with recognised unions. It is our policy to maintain well-developed communications and consultation programmes and there have been no material disruptions to our operations from labour disputes during the past five years. National Grid believes that it can conduct its relationships with trade unions and employees in a satisfactory manner.
There are currently no UK laws, decrees or regulations that restrict the export or import of capital, including, but not limited to, foreign exchange control restrictions, or that affect the remittance of dividends, interest or other payments to non UK resident holders of ordinary shares except as otherwise set out in Taxation on page 179 and except in respect of the governments of and/or certain citizens, residents or bodies of certain countries (described in applicable Bank of England Notices or European Union Council Regulations in force as at the date of this document).
The following table shows the history of the exchange rates of one pound sterling to dollars for the periods indicated. | |||||||||||||||||
Persons depositing or withdrawing shares must pay: | For | |||||||||||||||||
$5.00 per 100 ADSs (or portion of 100 ADSs) | Issuance of ADSs, including issuances resulting from a distribution of shares or rights or other property; cancellation of ADSs for the purpose of withdrawal, including if the deposit agreement terminates; distribution of securities distributed to holders of deposited securities that are distributed by the Depositary to ADS registered holders. | |||||||||||||||||
| Registration or transfer fees | Transfer and registration of shares on our share register to or from the name of the Depositary or its agent when they deposit or withdraw shares. | |||||||||||||||||
| Expenses of the Depositary | Cable, telex and facsimile transmissions (when expressly provided in the deposit agreement); converting foreign currency to dollars. | |||||||||||||||||
Taxes and other governmental charges the Depositary or the Custodian has to pay on any ADS or share underlying an ADS, for example, stock transfer taxes, stamp duty or withholding taxes | As necessary. | Dollar equivalent of £1 sterling | ||||||||||||||||
| ||||||||||||||||||
| High | Low | |||||||||||||||||
| ||||||||||||||||||
April 2014 | 1.6885 | 1.6586 | ||||||||||||||||
March 2014 | 1.6730 | 1.6489 | ||||||||||||||||
February 2014 | 1.6758 | 1.6296 | ||||||||||||||||
January 2014 | 1.6631 | 1.6345 | ||||||||||||||||
December 2013 | 1.6528 | 1.6242 | ||||||||||||||||
| ||||||||||||||||||
The Company amended the deposit agreement under which the ADS representing its ordinary shares are issued to allow a fee of up to $0.05 per ADS to be charged for any cash distribution made to ADS holders, including cash dividends. ADS holders who receive cash in relation to the 2013/14 final dividend will be charged a fee of $0.02 per ADS by the Depositary prior to distribution of the cash dividend. | Average1 | |||||||||||||||||
| ||||||||||||||||||
2013/14 | 1.60 | |||||||||||||||||
2012/13 | 1.57 | |||||||||||||||||
2011/12 | 1.60 | |||||||||||||||||
2010/11 | 1.57 | |||||||||||||||||
2009/10 | 1.58 | |||||||||||||||||
| ||||||||||||||||||
1. The average for each period is calculated by using the average of the exchange rates on the last day of each month during the period. See weighted average exchange rate on page 85.
| ||||||||||||||||||
Strategic Report | Corporate Governance | Financial Statements | Additional Information
| 179 |
Some of the key dates and actions in the corporate history of National Grid are listed below. The full history goes back much further. | The following table includes a brief analysis of shareholder numbers and shareholdings as at 31 March 2014. | |||||||||||||||||
Size of shareholding | Number of shareholders | % of shareholders | Number of shares | % of shares | ||||||||||||||
| ||||||||||||||||||
| 1986 | British Gas (BG) privatisation | |||||||||||||||||
|
| |||||||||||||||||
| 1990 | Electricity transmission network in England and Wales transferred to National Grid on electricity privatisation | 1–50 | 174,219 | 17.6366 | 5,070,597 | 0.1316 | ||||||||||||
| ||||||||||||||||||
| 1995 | National Grid listed on the London Stock Exchange | 51–100 | 269,540 | 27.2862 | 19,092,359 | 0.4953 | ||||||||||||
| ||||||||||||||||||
| 1997 | Centrica demerged from BG | 101–500 | 427,082 | 43.2345 | 89,577,097 | 2.3241 | ||||||||||||
| ||||||||||||||||||
| 1997 | Energis demerged from National Grid | 501–1,000 | 58,849 | 5.9574 | 41,182,963 | 1.0685 | ||||||||||||
| ||||||||||||||||||
| 2000 | Lattice Group demerged from BG and listed separately | 1,001–10,000 | 55,016 | 5.5694 | 135,292,646 | 3.5101 | ||||||||||||
| ||||||||||||||||||
| 2000 | New England Electric System and Eastern Utilities Associates acquired | 10,001–50,000 | 2,079 | 0.2105 | 37,261,484 | 0.9667 | ||||||||||||
| ||||||||||||||||||
| 2002 | Niagara Mohawk Power Corporation merged with National Grid in US | 50,001–100,000 | 203 | 0.0206 | 14,546,599 | 0.3774 | ||||||||||||
| ||||||||||||||||||
| 2002 | National Grid and Lattice Group merged to form National Grid Transco | 100,001–500,000 | 429 | 0.0434 | 104,413,484 | 2.709 | ||||||||||||
| ||||||||||||||||||
| 2004 | UK wireless infrastructure network acquired from Crown Castle International Corp | 500,001–1,000,000 | 122 | 0.0124 | 85,852,431 | 2.2274 | ||||||||||||
| ||||||||||||||||||
| 2005 | Four UK regional gas distribution networks sold and National Grid adopted as our name | 1,000,001+ | 287 | 0.029 | 3,322,050,361 | 86.1899 | ||||||||||||
|
| |||||||||||||||||
| 2006 | Rhode Island gas distribution network acquired | Total | 987,826 | 100 | 3,854,340,021 | 100 | ||||||||||||
|
| |||||||||||||||||
| 2007 | UK and US wireless infrastructure operations and the Basslink electricity interconnector in Australia sold |
This section discusses certain US federal income tax and UK tax consequences of the ownership of ADSs and ordinary shares by certain beneficial holders thereof. This discussion applies to holders who qualify for benefits under the income tax convention between the US and the UK (the Tax Convention) and are a resident of the US for the purposes of the Tax Convention and are not resident or ordinarily resident in the UK for UK tax purposes at any material time (a US Holder).
US Holders generally will be entitled to benefits under the Tax Convention if they are:
• the beneficial owner of the ADSs or ordinary shares, as applicable, and of any dividends that they receive; • an individual resident or citizen of the US, a US corporation, or a US partnership, estate, or trust (but only to the extent the income of the partnership, estate, or trust is subject to US taxation in the hands of a US resident person); and • not also a resident of the UK for UK tax purposes.
If a US Holder holds ADSs or ordinary shares in connection with the conduct of business or the performance of personal services in the UK or otherwise in connection with a branch, agency or permanent establishment in the UK, then the US Holder will not be entitled to benefits under the Tax Convention. Special rules, including a limitation of benefits provision, apply in limited circumstances to ADSs or ordinary shares owned by an investment or holding company. This section does not discuss the treatment of holders described in the preceding two sentences. This section does not purport to be a comprehensive description of all the tax considerations that may be relevant to any particular investor. National Grid has assumed that shareholders, including US Holders, are familiar with the tax rules applicable to investments in securities generally and with any special rules to which they may be subject. In particular, the discussion deals only with investors that will beneficially hold ADSs or ordinary shares as capital assets and does not address the tax treatment of investors that are subject to special rules, such as banks, insurance companies, dealers in securities or currencies, partnerships or other entities classified as partnerships for US federal income tax purposes, persons that control (directly or indirectly) 10% or more of our voting stock, persons that elect mark-to-market treatment, persons that hold ADSs or ordinary shares as a position in a straddle, conversion transaction, synthetic security, or other integrated financial transaction, persons who are liable for the alternative minimum tax, or the Medicare tax on net investment income, and persons whose functional currency is not the dollar. | ||||||||||||||||
| ||||||||||||||||||
| 2007 | KeySpan Corporation acquired | |||||||||||||||||
| ||||||||||||||||||
| 2008 | Ravenswood generation station sold | |||||||||||||||||
| ||||||||||||||||||
| 2010 | Rights issue raised £3.2 billion | |||||||||||||||||
| ||||||||||||||||||
| 2012 | New Hampshire electricity and gas distribution businesses sold | |||||||||||||||||
| ||||||||||||||||||
Each of our Executive Directors has a service agreement and each Non-executive Director has a letter of appointment. No contract (other than contracts entered into in the ordinary course of business) has been entered into by National Grid within the two years immediately preceding the date of this report which is, or may be, material; or which contains any provision under which any member of National Grid has any obligation or entitlement which is material to National Grid at the date of this report.
This information can be found under the heading note 11 property, plant and equipment on page 111, note 19 Borrowings on pages 119 to 121, Strategic Report pages 12 to 20, where we operate on page 166 and principal operations on pages 29 to 38.
| ||||||||||||||||||
180 National Grid Annual Report and Accounts 2013/14
Other disclosures continued |
The statements regarding US and UK tax laws and administrative practices set forth below are based on laws, treaties, judicial decisions and regulatory interpretations in effect on the date of this document. These laws and practices are subject to change without notice, possibly with retrospective effect. In addition, the US statements set forth below are based on the representations of The Bank of New York Mellon as depositary (the Depositary). These statements assume that each obligation provided for in, or otherwise contemplated by, the deposit agreement entered into between National Grid Transco plc (now National Grid plc), the Depositary and the registered holders of ADRs, pursuant to which ADSs have been issued, dated as of 21 November 1995 and amended and restated as of 1 August 2005, and any related agreement, will be performed in accordance with its terms. Beneficial owners of ADSs who are residents or citizens of the US will be treated as the owners of the underlying ordinary shares for the purposes of the US Internal Revenue Code. For the purposes of the Tax Convention, the Estate Tax Convention and UK tax considerations, we have assumed that a holder of ADRs will be treated as the owner of the ordinary shares represented by those ADSs and this section is based on that assumption. Despite a A US Holder should consult their own advisor as to the tax consequences of the purchase, ownership and disposition of ADSs or ordinary shares in light of their particular circumstances, including the effect of any state, local or other national laws. Taxation of dividends Under the Tax Convention, the UK is allowed to impose a 15% withholding tax on dividends paid to US shareholders controlling less than 10% of the voting capital of National Grid. The UK does not, however, currently impose a withholding tax on such dividends. Cash distributions received by a US Holder with respect to their ADSs or ordinary shares generally will be treated as foreign source dividend income subject to US federal income taxation as ordinary income, to the extent paid out of National Grid’s current or accumulated earnings and profits, as determined under US federal income tax principles. The dollar amount of dividends received by certain non corporate US Holders with respect to ADSs or ordinary shares Based on National Grid’s audited financial statements and relevant market and shareholder data, National Grid believes that it was not treated as a PFIC for US federal income tax purposes with respect to its taxable years ending 31 March | Taxation of capital gains US Holders will not be liable for UK taxation on any capital gain realised on the disposal of ADSs or ordinary shares. Sales or other taxable dispositions of ADSs or ordinary shares by a US Holder generally will give rise to US source capital gain or loss equal to the difference between the dollar value of the amount realised on the disposition and the US Holder’s dollar basis in the shares or ADSs. Any such capital gain or loss generally will be long-term capital gain or loss, currently subject to taxation at reduced rates for non corporate taxpayers, if the ordinary shares or ADSs were held for more than one year. The deductibility of capital losses is subject to limitations. UK stamp duty and stamp duty reserve tax (SDRT) Transfers of ordinary shares – SDRT at the rate of 0.5% of the amount of value of the consideration will generally be payable on any agreement to transfer ordinary shares that is not completed by the execution of a duly stamped instrument of transfer to the transferee. Where an instrument of transfer is executed and duly stamped before the expiry of the period of six years beginning with the date on which the agreement is made, the SDRT liability will be cancelled, and, if a claim is made within the specified period, any SDRT which has been paid will be refunded. SDRT is due whether or not the agreement or transfer of such chargeable securities is made or carried out in the UK and whether or not any party to that agreement or transfer is a UK resident. Purchases of ordinary shares completed by execution of a stock transfer form will generally give rise to a liability to UK stamp duty at the rate of 0.5% (rounded up to the nearest £5) of the amount or value of the consideration. Paperless transfers under the CREST paperless settlement system will generally be liable to SDRT at the rate of 0.5%, and not stamp duty. SDRT is generally the liability of the purchaser and UK stamp duty is usually paid by the purchaser or transferee. Transfers of ADSs – No UK stamp duty will be payable on the acquisition or transfer of existing ADSs or beneficial ownership of ADSs, provided that any instrument of transfer or written agreement to transfer is executed outside the UK and remains at all times outside the UK. An agreement for the transfer of ADSs in the form of ADRs will not give rise to a liability for SDRT. A charge to stamp duty or SDRT may arise on the transfer of ordinary shares to the Depositary or The Bank of New York Mellon as agent of the Depositary (the Custodian). The rate of stamp duty or SDRT will generally be 1.5% of the value of the consideration or, in some circumstances, the value of the ordinary shares concerned. However, following a
| ||||||||||||||||||||||||||||||||||||||||||||||||||||||||||||||||||||||||||||||||||||||||||||||||||||||||||||||||||||||||||||||||||||||||||||||||||||||||||||||||||||||||||||||||||||||||||||||||||||||||||||||||||||||||||||||||||||||||||||||||||||||||||||||||||||||||||||||||||||||||||||||||||||||||||||||||||||||||||||||||||||||||||||||||||||||||||||||||||||||||||||||||||||||||||||||||||||||||||||||||||||||||||||||||||||||||||||||||||||||||||||||||||||||||||||||||||||||||||||||||||||||||||||||||||||||||||||||||||||||||||||||||||||||||||||||||||||||||||||||||||||||||||||||||||||||||||||||||||||||||||||||||||||||||||||||||||||||||||||||||||||||||||||||||||||||||||||||||||||||||||||||||||||||||||||||||||||||||||||||||||||||||||||||||||||||||||||||||||||||||||||||||||||||||||||||||||||||||||||||||||||||||||||||||||||||||||||||||||||||||||||||||||||||||||||||||||||||||||||||||||||||||||||||||||||||||||||||||||||||||||||||||||||||||||||||||||||||||||||||||||||||||||||||||||||||||||||||||||||||


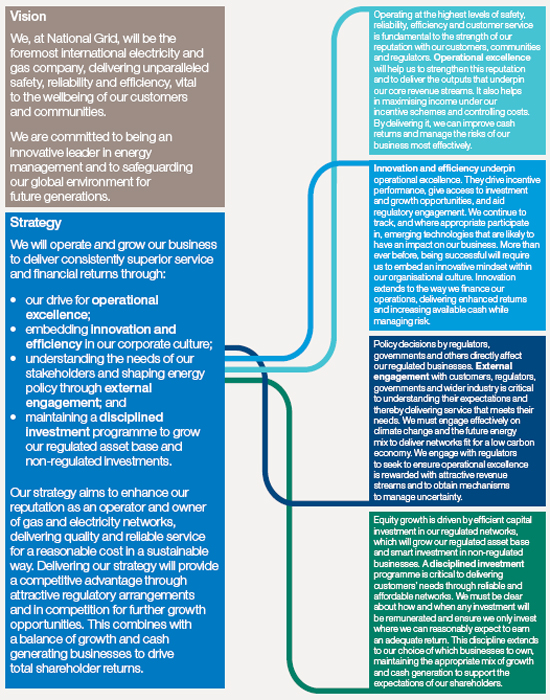
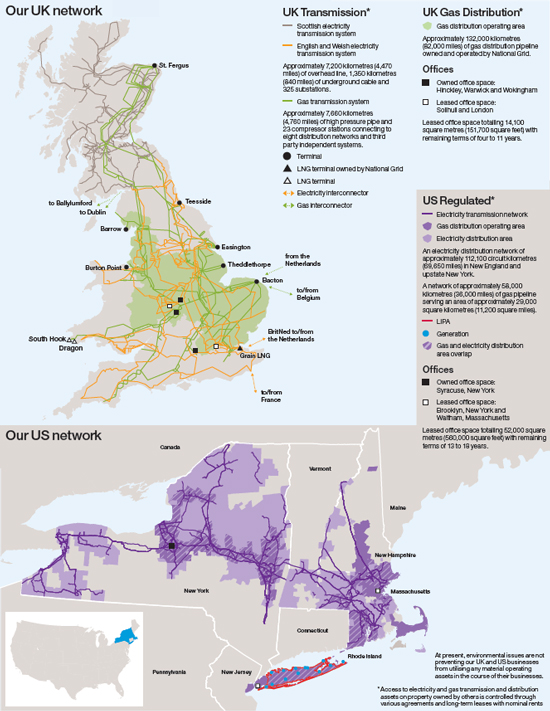


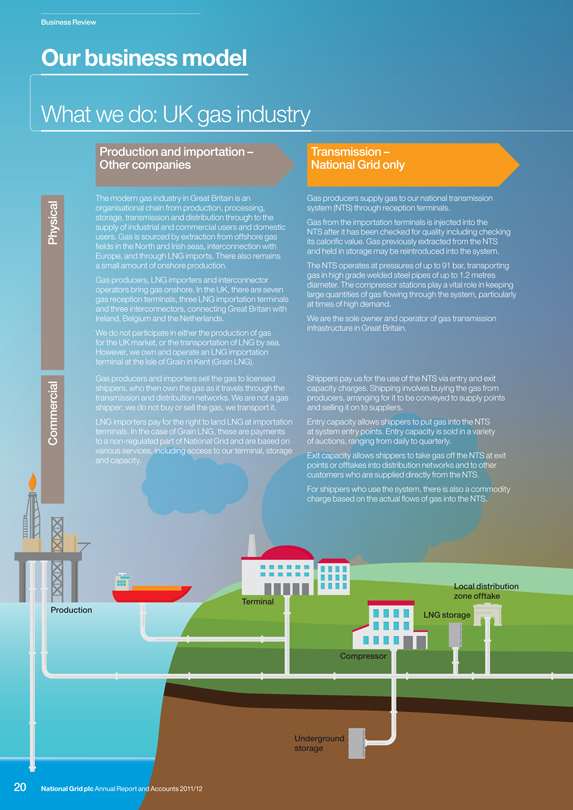


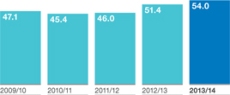
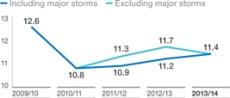

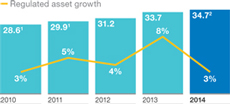

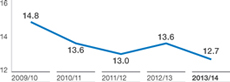
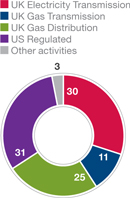
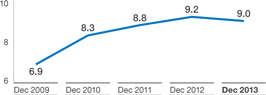
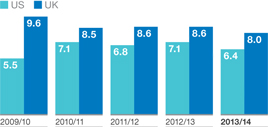

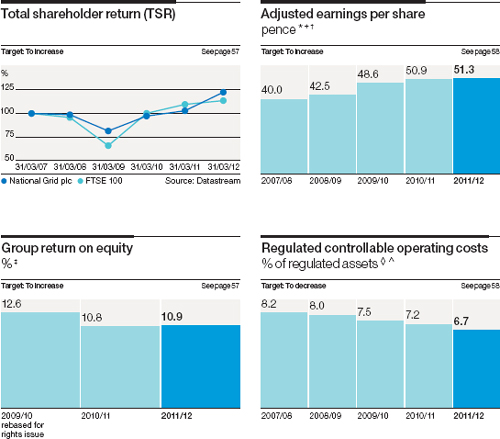

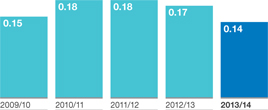


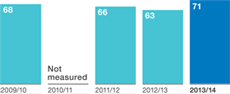

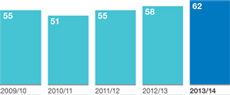
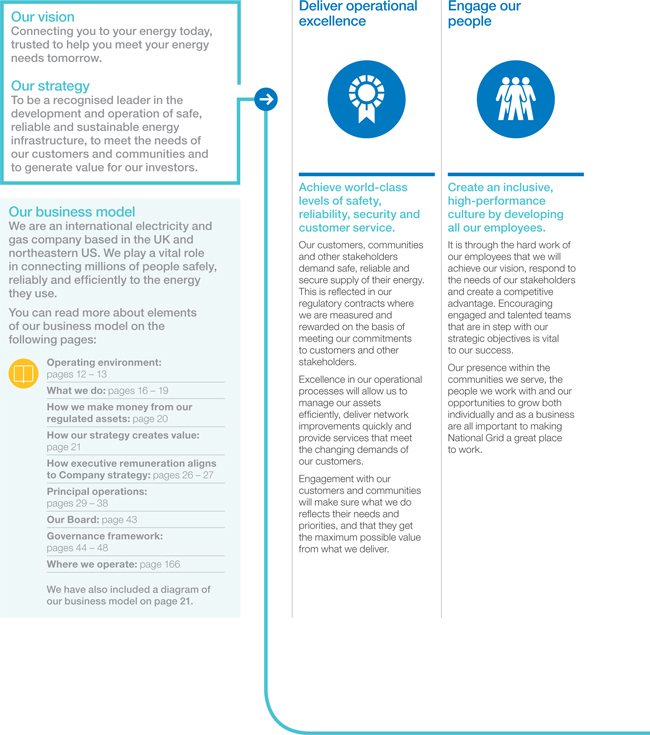
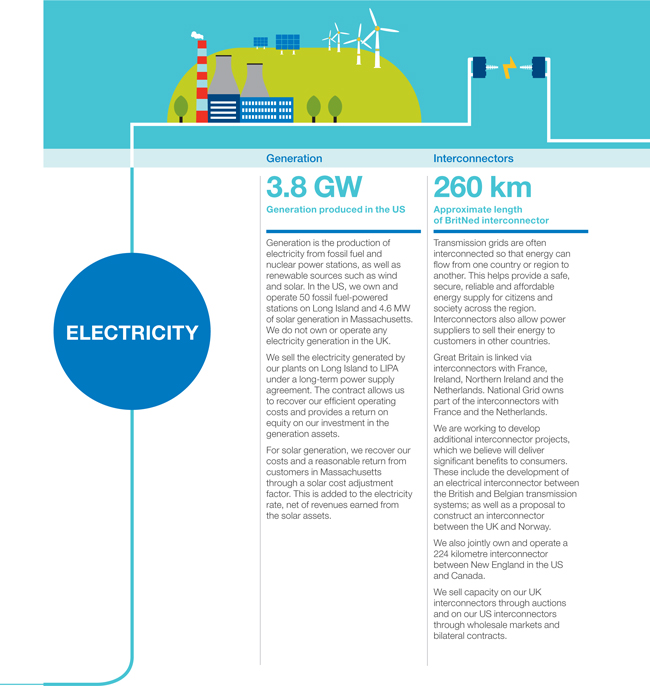
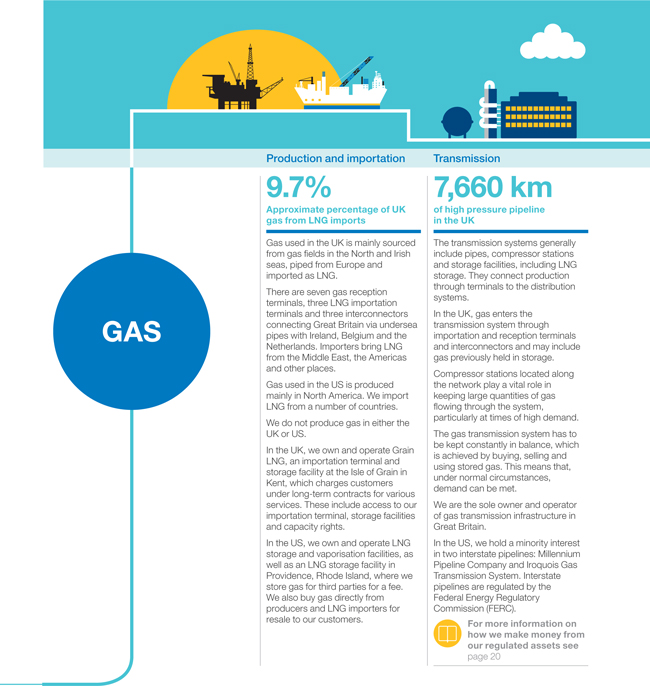


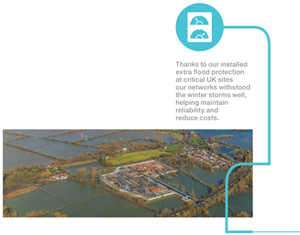


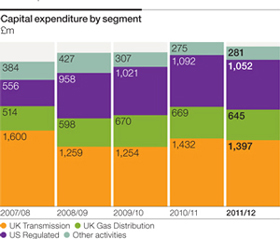
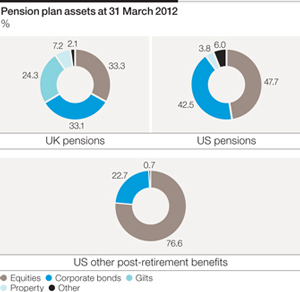
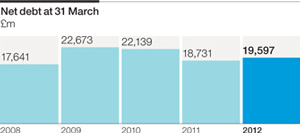
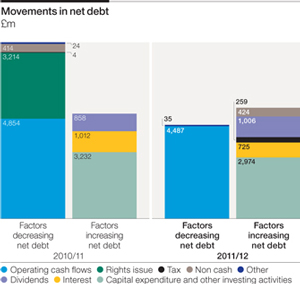
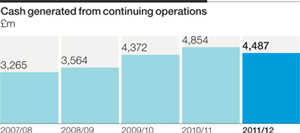
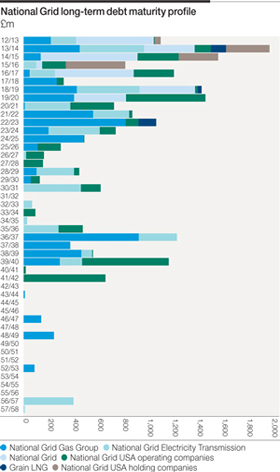
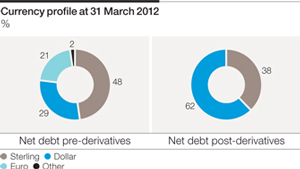
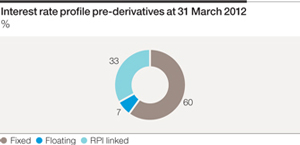
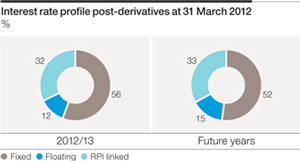


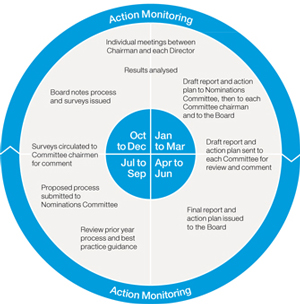


 Ken Harvey