UNITED STATES
SECURITIES AND EXCHANGE COMMISSION
WASHINGTON, D.C. 20549
FORM 20-F
(Mark One)
| ¨ |
orOR
| x |
For the fiscal year ended March 31, 20122014
orOR
| ¨ |
For the transition period from to
orOR
| ¨ |
Date of event requiring this shell company report
Commission file number 001-34837
MakeMyTrip Limited
(Exact Name of Registrant as specified in its charter)
| Not Applicable | Mauritius | |
| (Translation of Registrant’s Name Into English) | (Jurisdiction of Incorporation or Organization) |
Tower A, SP Infocity, 243,
Udyog Vihar, Phase 1
Gurgaon, Haryana 122016, India
(91-124) 439-5000
(Address and Telephone Number of Principal Executive Offices)
Rajesh MagowMohit Kabra
Group Chief Financial and Operating Officer
Tower A, SP Infocity, 243,
Udyog Vihar, Phase 1
Gurgaon, Haryana 122016, India
(91-124) 439-5000
rajesh.magow@makemytrip.commohit.kabra@makemytrip.com
(Name, Telephone, E-mail and/or facsimile number and Address of Company Contact Person)
Securities registered or to be registered pursuant to Section 12(b) of the Act.
| Ordinary Shares, par value $0.0005 per share | Nasdaq Global Market | |
| (Title of Class) | (Name of Exchange On Which Registered) |
Securities registered or to be registered pursuant to Section 12(g) of the Act.
None
(Title of Class)
Securities for which there is a reporting obligation pursuant to Section 15(d) of the Act.
None
(Title of Class)
Indicate the number of outstanding shares of each of the issuer’s classes of capital or common stock as of the close of the period covered by the annual report.Annual Report.
As of March 31, 2012, 37,159,6052014, 41,678,341 ordinary shares, par value $0.0005 per share, were issued and outstanding.
Indicate by check mark if the registrant is a well-known seasoned issuer, as defined in Rule 405 of the Securities Act.
Yes ¨ No x
If this report is an annual or transition report, indicate by check mark if the registrant is not required to file reports pursuant to Section 13 or 15(d) of the Securities Exchange Act of 1934.
Yes ¨ No x
Note – Checking the box above will not relieve any registrant required to file reports pursuant to Section 13 or 15(d) of the Securities Exchange Act of 1934 from their obligations under those Sections.
Indicate by check mark whether the registrant (1) has filed all reports required to be filed by Section 13 or 15(d) of the Securities Exchange Act of 1934 during the preceding 12 months (or for such shorter period that the registrant was required to file such reports), and (2) has been subject to such filing requirements for the past 90 days.
Yes x No ¨
Indicate by check mark whether the registrant has submitted electronically and posted on its corporate Web site, if any, every Interactive Data File required to be submitted and posted pursuant to Rule 405 of Regulation S-T (§232.405 of this chapter) during the preceding 12 months (or for such shorter period that the registrant was required to submit and post such files).
Yes ¨ No ¨
Indicate by check mark whether the registrant is a large accelerated filer, an accelerated filer or a non-accelerated filer. See the definitions of “large accelerated filer” and “accelerated filer” in Rule 12b-2 of the Exchange Act. (Check one):
| Large accelerated filer ¨ | Accelerated filer x | Non-accelerated filer ¨ |
Indicate by check mark which basis of accounting the registrant has used to prepare the financial statements included in this filing:
| International Financial Reporting Standards as issued | Other¨ | ||
| by the International Accounting Standards Board x |
If “Other” has been checked in the previous question, indicate by check mark which financial statement item the registrant has elected to follow.
Item 17 ¨ Item 18 ¨
If this is an annual report,Annual Report, indicate by check mark whether the registrant is a shell company (as defined in Rule 12b-2 of the Securities Exchange Act of 1934).
Yes ¨ No x
(APPLICABLE ONLY TO ISSUERS INVOLVED IN BANKRUPTCY PROCEEDINGS DURING THE PAST FIVE YEARS)
Indicate by check mark whether the registrant has filed all documents and reports required to be filed by Sections 12, 13 or 15(d) of the Securities Exchange Act of 1934 subsequent to the distribution of securities under a plan confirmed by a court:
Yes ¨ No ¨
| PAGE | ||||
ITEM 1. IDENTITY OF DIRECTORS, SENIOR MANAGEMENT AND ADVISERS | ||||
| 21 | ||||
| 75 | ||||
| 77 | ||||
ITEM 11. QUANTITATIVE AND QUALITATIVE DISCLOSURES ABOUT MARKET RISK | ||||
ITEM 12. DESCRIPTION OF SECURITIES OTHER THAN EQUITY SECURITIES | ||||
ITEM 14. MATERIAL MODIFICATIONS TO THE RIGHTS OF SECURITY HOLDERS AND USE OF PROCEEDS | ||||
ITEM 16D. EXEMPTIONS FROM THE LISTING STANDARDS FOR AUDIT COMMITTEES | ||||
ITEM 16E. PURCHASES OF EQUITY SECURITIES BY THE ISSUER AND AFFILIATED PURCHASERS | ||||
| 97 | ||||
| 97 | ||||
| 97 | ||||
| 100 | ||||
CONVENTIONS USED IN THIS ANNUAL REPORT
In this annual report,Annual Report, we refer to information regarding the travel service industry and our competitors from market research reports, analyst reports and other publicly available sources, including from PhoCusWright Inc., or PhoCusWright, an independent travel industry research company founded and previously controlled by Mr. Philip C. Wolf, one of our directors. See “Item 7. Major Shareholders and Related Party Transactions — Transactions with PhoCusWright” for details of our transactions with PhoCusWright. We also refer to data from The Economic Times, a daily business newspaper in India, and the United States Central Intelligence Agency “World Factbook,”Factbook”, or CIA World Factbook.Factbook, the Directorate General of Civil Aviation, the Indian governmental regulatory body for civil aviation, or DGCA and the Internet and Mobile Association of India, or IAMAI.
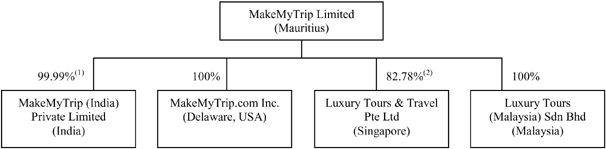
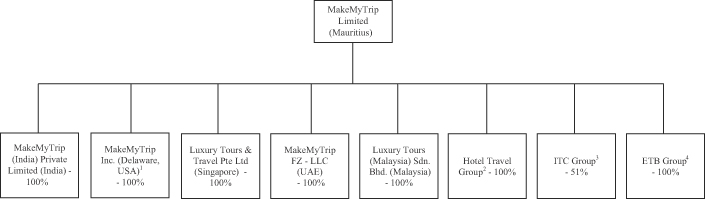
We conduct our business principally through our Indian subsidiary, MakeMyTrip (India) Private Limited, or MMT India. Our other principal operating subsidiaries include Hotel Travel Limited, Malaysia and HTN Co., Ltd., Thailand, the two main operating entities of the group of companies known as the Hotel Travel Group; ITC Bangkok Co., Ltd., Thailand, the main operating entity of the group of companies known as the ITC Group; Luxury Tours & Travel Pte Ltd, Singapore, or Luxury Tours; Luxury Tours (Malaysia) Sdn. Bhd. or Luxury Tours (Malaysia); MakeMyTrip Inc., or MMT USA; and Easy To Book Service B.V., the main operating entity of the group of companies known as the Easytobook.com group, or the ETB Group. In this annual report,Annual Report, unless otherwise stated or unless the context otherwise requires, references to “we,” “us,” “our,” “our company” or “our group” are to MakeMyTrip Limited and its subsidiaries collectively, and references to “our holding company” are to MakeMyTrip Limited on a standalone basis.
In this annual report,Annual Report, references to “US,” the “United States” or “USA” are to the United States of America, its territories and its possessions, references to “India” are to the Republic of India, references to “Mauritius” are to the Republic of Mauritius, references to “the Netherlands” are to the Kingdom of the Netherlands, references to “Singapore” are to the Republic of Singapore, and references to “Malaysia” are to the Federation of Malaysia.Malaysia and references to “Thailand” are to the Kingdom of Thailand. References to “$,” “dollars” or “US dollars” are to the legal currency of the United States, and references to “Rs.,” “Rupees” or “Indian Rupees” are to the legal currency of India.India and references to “Euro” are to the legal currency of the European Union.
Solely for the convenience of the reader, this annual reportAnnual Report contains translations of certain Indian Rupee amounts into US dollars at specified rates. Except as otherwise stated in this annual report,Annual Report, all translations from Indian Rupees to US dollars are based on the noon buying rate of Rs. 55.3458.36 per $1.00 in the City of New York for cable transfers of Indian Rupees, as certified for customs purposes by the Federal Reserve Bank of New York on June 15, 2012.May 23, 2014. No representation is made that the Indian Rupee amounts referred to in this annual reportAnnual Report could have been or could be converted into US dollars at such rates or any other rates. Any discrepancies in any table between totals and sums of the amounts listed are due to rounding.
On July 22, 2010, we effected a 20-for-one share split with respect to all our ordinary and preferred shares, as well as a 20-for-one adjustment with respect to the number of ordinary shares underlying our share options and a corresponding adjustment to the exercise prices of such options. At the same time, the par value of our shares was changed from $0.01 per share to $0.0005 per share. All share information and per share data included in this annual report has been presented on a post-share split basis, unless otherwise specifically stated or the context otherwise requires. In connection with our initial public offering in August 2010, all of our preferred shares were converted into ordinary shares upon the completion of our initial public offering.
Unless otherwise indicated, the consolidated financial statements and related notes as of and for the fiscal years ended March 31, 2010, 20112012, 2013 and 20122014 included elsewhere in this annual reportAnnual Report have been prepared in accordance with International Financial Reporting Standards, or IFRS, as issued by the International Accounting Standards Board, or IASB. References to a particular “fiscal year” are to our fiscal year ended March 31 of that year. Our fiscal quarters end on June 30, September 30, December 31 and DecemberMarch 31. References to a year other than a “fiscal” year are to the calendar year ended December 31.
We also refer in various places within this annual reportAnnual Report to “adjusted operating profit (loss),” “adjusted net profit (loss)” and “revenue less service cost,” which is aare non-IFRS measure thatmeasures. “Revenue less service cost” is calculated as revenue less costs for the acquisition of relevant services and products for sale to customerscustomers. The IFRS measures most directly comparable to “adjusted operating profit (loss)” and “adjusted net profit (loss)” are results from operating activities and profit (loss) for the year, respectively. Each item is more fully explained in “Management’s Discussion“Item 5. Operating and Analysis of Financial ConditionReview and Results of Operations.”Prospects”. The presentation of thisthese non-IFRS informationmeasures is not meant to be considered in isolation or as a substitute for our consolidated financial results prepared in accordance with IFRS as issued by the IASB.
SPECIAL NOTE REGARDING FORWARD-LOOKING STATEMENTS
This annual reportAnnual Report contains forward-looking statements that relate to our current expectations and views of future events. These forward-looking statements are contained principally in the sections entitled “Item 3. Key Information,” “Item 4. Information on the Company” and “Item 5. Operating and Financial Review and Prospects.” These statements relate to events that involve known and unknown risks, uncertainties and other factors, including those listed under “Item 3. Key Information — D. Risk Factors,” which may cause our actual results, performance or achievements to be materially different from any future results, performance or achievements expressed or implied by the forward-looking statements.
In some cases, these forward-looking statements can be identified by words or phrases such as “may,” “will,” “expect,” “anticipate,” “aim,” “estimate,” “intend,” “plan,” “believe,” “potential,” “continue,” “is/are likely to” or other similar expressions.
These forward-looking statements are subject to risks, uncertainties and assumptions, some of which are beyond our control. In addition, these forward-looking statements reflect our current views with respect to future events and are not a guarantee of future performance. Actual outcomes may differ materially from the information contained in the forward-looking statements as a result of a number of factors, including, without limitation, the risk factors set forth in “Item 3. Key Information — D. Risk Factors,” and the following:
our ability to maintain and expand our supplier relationships;
our reliance on technology;
our ability to expand our business, implement our strategy and effectively manage our growth;
political and economic stability in and around India;
our ability to successfully implement our growth strategy;
our ability to attract, train and retain executives and other qualified employees;
increasing competition in the Indian travel industry; and
risks associated with online commerce security.
The forward-looking statements made in this annual reportAnnual Report relate only to events or information as of the date on which the statements are made in this annual report.Annual Report. Our actual results, performance, or achievement may differ from those expressed in, or implied by, these forward-looking statements. Accordingly, we can give no assurances that any of the events anticipated by these forward-looking statements will transpire or occur or, if any of the foregoing factors or other risks and uncertainties described elsewhere in this annual reportAnnual Report were to occur, what impact they would have on these forward-looking statements, including our results of operations or financial condition. In view of these uncertainties, you are cautioned not to place undue reliance on these forward-looking statements.
Except as required by law, we undertake no obligation to update or revise publicly any forward-looking statements, whether as a result of new information, future events or otherwise, after the date on which the statements are made or to reflect the occurrence of unanticipated events.
ITEM 1. IDENTITY OF DIRECTORS, SENIOR MANAGEMENT AND ADVISERS
Not applicable
ITEM 2. OFFER STATISTICS AND EXPECTED TIMETABLE
Not applicable
A. Selected Consolidated Financial Data
The following selected consolidated statement of profit or loss and other comprehensive income and loss(loss) data for fiscal years 2010, 20112012, 2013 and 20122014 and the selected consolidated statement of financial position data as of March 31, 20112013 and 20122014 have been derived from our audited consolidated financial statements included elsewhere in this annual report.Annual Report. The selected consolidated statement of profit or loss and other comprehensive income and loss(loss) data for fiscal years 20082010 and 20092011 and the selected consolidated statement of financial position as of March 31, 2008, 20092010, 2011 and 20102012 have been derived from our audited consolidated financial statements not included in this annual report.Annual Report. The financial data set forth below should be read in conjunction with, and areis qualified by reference to, “Item 5. Operating and Financial Review and Prospects” and the consolidated financial statements and notes thereto included elsewhere in this annual report.Annual Report. Our consolidated financial statements are prepared and presented in accordance with IFRS as issued by the IASB. Our historical results do not necessarily indicate results expected for any future period.
Prior to initiation of our initial public offering that was completed in August 2010, we had not prepared consolidated financial statements. Our India-incorporated and Delaware-incorporated operating subsidiaries prepare financial statements in accordance with Indian Generally Accepted Accounting Principles and United States Generally Accepted Accounting Principles, respectively. We have adopted IFRS as issued by the IASB with a transition date of April 1, 2007 and have prepared consolidated financial statements with effect from that date.
The following information should be read in conjunction with, and is qualified in its entirety by reference to, “Item 5. Operating and Financial Review and Prospects” and the audited consolidated financial statements and the notes thereto included elsewhere in this annual report.Annual Report.
| Fiscal Year Ended March 31 | ||||||||||||||||||||
| 2008 | 2009 | 2010 | 2011 | 2012 | ||||||||||||||||
| (in thousands, except per share data and number of shares) | ||||||||||||||||||||
Consolidated Statement of Comprehensive Income (Loss) Data: | ||||||||||||||||||||
Revenue: | ||||||||||||||||||||
Air ticketing | $ | 14,091.4 | $ | 19,225.1 | $ | 32,119.5 | $ | 47,622.7 | $ | 76,190.3 | ||||||||||
Hotels and packages | 24,189.4 | 48,622.8 | 50,287.9 | 74,558.0 | 116,701.1 | |||||||||||||||
Other revenue | 50.1 | 703.8 | 1,152.8 | 2,540.7 | 3,707.8 | |||||||||||||||
|
|
|
|
|
|
|
|
|
| |||||||||||
Total revenue | 38,330.9 | 68,551.7 | 83,560.2 | 124,721.4 | 196,599.3 | |||||||||||||||
|
|
|
|
|
|
|
|
|
| |||||||||||
Service cost: | ||||||||||||||||||||
Procurement cost of hotels and packages services | (21,823.8 | ) | (43,069.2 | ) | (42,292.2 | ) | (63,650.9 | ) | (98,474.8 | ) | ||||||||||
Cost of air ticket coupons | — | (491.8 | ) | (985.5 | ) | — | (9,939.6 | ) | ||||||||||||
Personnel expenses | (8,459.2 | ) | (9,679.8 | ) | (16,562.0 | ) | (14,399.0 | ) | (26,520.7 | ) | ||||||||||
Other operating expenses | (23,229.0 | ) | (24,369.9 | ) | (28,160.5 | ) | (40,698.9 | ) | (54,868.7 | ) | ||||||||||
Depreciation and amortization | (1,107.5 | ) | (1,558.7 | ) | (1,569.7 | ) | (1,910.6 | ) | (2,790.2 | ) | ||||||||||
|
|
|
|
|
|
|
|
|
| |||||||||||
Results from operating activities | (16,288.7 | ) | (10,617.6 | ) | (6,009.8 | ) | 4,061.9 | 4,005.4 | ||||||||||||
Net finance income (costs) | (2,611.2 | ) | 3,244.1 | (188.8 | ) | (1,923.9 | ) | (2,969.2 | ) | |||||||||||
|
|
|
|
|
|
|
|
|
| |||||||||||
Share of loss of equity-accounted investee | — | — | — | — | (66.0 | ) | ||||||||||||||
|
|
|
|
|
|
|
|
|
| |||||||||||
Profit (Loss) before tax | (18,899.8 | ) | (7,373.5 | ) | (6,198.6 | ) | 2,138.0 | 970.2 | ||||||||||||
Income tax benefit (expense) | 4.5 | 25.3 | (8.4 | ) | 2,691.7 | 6,078.1 | ||||||||||||||
|
|
|
|
|
|
|
|
|
| |||||||||||
Profit (Loss) for the year | $ | (18,895.4 | ) | $ | (7,348.2 | ) | $ | (6,207.0 | ) | $ | 4,829.7 | $ | 7,048.4 | |||||||
|
|
|
|
|
|
|
|
|
| |||||||||||
| xxxxx | xxxxx | xxxxx | xxxxx | xxxxx | ||||||||||||||||||||||||||||||||||||
Profit (Loss) per ordinary share: | ||||||||||||||||||||||||||||||||||||||||
| Fiscal Year Ended March 31 | ||||||||||||||||||||||||||||||||||||||||
| 2010 | 2011 | 2012 | 2013 | 2014 | ||||||||||||||||||||||||||||||||||||
| (in thousands, except percentages) | ||||||||||||||||||||||||||||||||||||||||
Consolidated Statement of Profit or Loss and Other Comprehensive Income (Loss) Data: | ||||||||||||||||||||||||||||||||||||||||
Revenue: | ||||||||||||||||||||||||||||||||||||||||
Air ticketing | $ | 32,119.5 | $ | 47,622.7 | $ | 76,190.3 | $ | 60,888.8 | $ | 66,523.2 | ||||||||||||||||||||||||||||||
Hotels and packages | 50,287.9 | 74,558.0 | 116,701.1 | 164,129.3 | 184,500.7 | |||||||||||||||||||||||||||||||||||
Other revenue | 1,152.8 | 2,540.7 | 3,707.8 | 3,803.8 | 4,350.7 | |||||||||||||||||||||||||||||||||||
Total revenue | 83,560.2 | 124,721.4 | 196,599.3 | 228,821.9 | 255,374.6 | |||||||||||||||||||||||||||||||||||
Other Income | 1,312.3 | |||||||||||||||||||||||||||||||||||||||
Service cost: | ||||||||||||||||||||||||||||||||||||||||
Procurement cost of hotels and packages services | (42,292.2 | ) | (63,650.9 | ) | (98,474.8 | ) | (136,537.1 | ) | (144,507.8 | ) | ||||||||||||||||||||||||||||||
Cost of air ticket coupons | (985.5 | ) | — | (9,939.6 | ) | (4,119.6 | ) | (4,471.7 | ) | |||||||||||||||||||||||||||||||
Personnel expenses | (16,562.0 | ) | (14,399.0 | ) | (26,520.7 | ) | (34,520.5 | ) | (37,220.8 | ) | ||||||||||||||||||||||||||||||
Other operating expenses | (28,160.5 | ) | (40,698.9 | ) | (54,868.7 | ) | (67,954.0 | ) | (80,116.0 | ) | ||||||||||||||||||||||||||||||
Depreciation and amortization | (1,569.7 | ) | (1,910.6 | ) | (2,790.2 | ) | (3,752.7 | ) | (5,692.1 | ) | ||||||||||||||||||||||||||||||
Results from operating activities | (6,009.8 | ) | 4,061.9 | 4,005.4 | (18,062.0 | ) | (15,321.6 | ) | ||||||||||||||||||||||||||||||||
Net finance income (costs) | (188.8 | ) | (1,923.9 | ) | (2,969.2 | ) | (741.9 | ) | (5,334.0 | ) | ||||||||||||||||||||||||||||||
Share of loss of equity-accounted investee | — | — | (66.0 | ) | (186.1 | ) | (171.5 | ) | ||||||||||||||||||||||||||||||||
Profit (Loss) before tax | (6,198.6 | ) | 2,138.0 | 970.2 | (18,990.1 | ) | (20,827.0 | ) | ||||||||||||||||||||||||||||||||
Income tax benefit (expense) | (8.4 | ) | 2,691.7 | 6,078.1 | (8,599.0 | ) | (78.5 | ) | ||||||||||||||||||||||||||||||||
Profit (Loss) for the year | $ | (6,207.0 | ) | $ | 4,829.7 | $ | 7,048.4 | $ | (27,589.1 | ) | $ | (20,905.6 | ) | |||||||||||||||||||||||||||
Earnings (Loss) per ordinary share: | ||||||||||||||||||||||||||||||||||||||||
Basic | $ | (1.08 | ) | $ | (0.42 | ) | $ | (0.35 | ) | $ | 0.17 | $ | 0.20 | $ | (0.35 | ) | $ | 0.17 | $ | 0.20 | $ | (0.74 | ) | $ | (0.55 | ) | ||||||||||||||
Diluted | $ | (1.08 | ) | $ | (0.55 | ) | $ | (0.35 | ) | $ | 0.15 | $ | 0.19 | $ | (0.35 | ) | $ | 0.15 | $ | 0.19 | $ | (0.74 | ) | $ | (0.55 | ) | ||||||||||||||
Weighted average number of ordinary shares outstanding: | ||||||||||||||||||||||||||||||||||||||||
Basic | 17,437,120 | 17,437,120 | 17,521,120 | 28,320,901 | 36,682,240 | 17,521,120 | 28,320,901 | 36,682,240 | 37,315,434 | 37,832,246 | ||||||||||||||||||||||||||||||
Diluted | 17,437,120 | 20,403,420 | 17,521,120 | 34,950,246 | 38,234,070 | 17,521,120 | 34,950,246 | 38,234,070 | 37,315,434 | 37,832,246 | ||||||||||||||||||||||||||||||
Proforma earnings (loss) per ordinary Share (unaudited)(1): | ||||||||||||||||||||||||||||||||||||||||
Proforma earnings (loss) per ordinary share(1) | ||||||||||||||||||||||||||||||||||||||||
Basic | $ | (0.59 | ) | $ | (0.38 | ) | $ | (0.18 | ) | $ | 0.16 | $ | — | $ | (0.18 | ) | $ | 0.16 | $ | — | $ | — | $ | — | ||||||||||||||||
Diluted | $ | (0.59 | ) | $ | (0.38 | ) | $ | (0.18 | ) | $ | 0.15 | $ | — | $ | (0.18 | ) | $ | 0.15 | $ | — | $ | — | $ | — | ||||||||||||||||
Proforma weighted average number of ordinary shares outstanding (unaudited)(1): | ||||||||||||||||||||||||||||||||||||||||
Proforma weighted average number of ordinary shares outstanding(1) | ||||||||||||||||||||||||||||||||||||||||
Basic | 26,980,680 | 29,761,580 | 29,845,580 | 32,993,361 | — | 29,845,580 | 32,993,361 | — | — | — | ||||||||||||||||||||||||||||||
Diluted | 26,980,680 | 29,761,580 | 29,845,580 | 34,929,282 | — | 29,845,580 | 34,929,282 | — | — | — | ||||||||||||||||||||||||||||||
Note:
| (1) | In December 2006, August 2007 and May 2008, we issued Series A, Series B and Series C preferred shares, respectively, that were converted into ordinary shares effective upon the completion of our initial public offering on August 17, 2010. Our proforma earnings (loss) per ordinary share (basic and diluted) and proforma weighted average number of ordinary shares outstanding (basic and diluted) have been calculated and presented for fiscal years |
The following table sets forth a summary of our consolidated statement of financial position as of March 31, 2008, 2009, 2010, 2011, 2012, 2013 and 2012:2014:
| As of March 31 | As of March 31 | |||||||||||||||||||||||||||||||||||||||
| 2008 | 2009 | 2010 | 2011 | 2012 | 2010 | 2011 | 2012 | 2013 | 2014 | |||||||||||||||||||||||||||||||
| (in thousands) | (in thousands) | |||||||||||||||||||||||||||||||||||||||
Consolidated Statement of Financial Position Data: | ||||||||||||||||||||||||||||||||||||||||
Trade and other receivables | $ | 9,852.8 | $ | 5,428.2 | $ | 12,449.5 | $ | 12,857.2 | $ | 21,382.4 | $ | 12,449.5 | $ | 12,857.2 | $ | 21,382.4 | $ | 26,111.4 | $ | 29,355.7 | ||||||||||||||||||||
Term deposits | 7,346.3 | 16,038.9 | 14,471.4 | 16,941.9 | 44,325.1 | 14,471.4 | 16,941.9 | 44,325.1 | 48,115.0 | 105,169.8 | ||||||||||||||||||||||||||||||
Cash and cash equivalents | 3,775.5 | 5,471.6 | 9,341.5 | 51,730.3 | 43,798.2 | 9,341.5 | 51,730.3 | 43,798.2 | 36,501.5 | 38,011.8 | ||||||||||||||||||||||||||||||
Net current assets | (29,638.5 | ) | 66,585.5 | 89,469.2 | 57,758.1 | 37,264.6 | ||||||||||||||||||||||||||||||||||
Total assets | 33,226.6 | 37,898.2 | 50,633.5 | 112,939.6 | 170,191.4 | 50,633.5 | 112,939.6 | 170,191.4 | 194,620.1 | 269,837.0 | ||||||||||||||||||||||||||||||
Total equity (deficit) attributable to equity holders of our company | (17,244.6 | ) | (27,237.5 | ) | (24,955.4 | ) | 76,275.9 | 118,791.8 | ||||||||||||||||||||||||||||||||
Total equity (deficit) | (24,955.4 | ) | 76,275.9 | 118,791.8 | 101,994.0 | 162,299.5 | ||||||||||||||||||||||||||||||||||
Loans and borrowings(1) | 24,198.1 | 39,712.5 | 40,966.9 | 209.6 | 259.4 | 40,966.9 | 209.6 | 259.4 | 419.9 | 318.1 | ||||||||||||||||||||||||||||||
Trade and other payables | 12,321.1 | 13,440.1 | 26,467.0 | 29,694.7 | 46,697.6 | 26,467.0 | 29,694.7 | 46,697.6 | 80,592.2 | 86,213.5 | ||||||||||||||||||||||||||||||
Total liabilities | 50,468.1 | 65,131.6 | 75,584.5 | 36,663.8 | 51,399.6 | 75,584.5 | 36,663.8 | 51,399.6 | 92,626.2 | 107,537.5 | ||||||||||||||||||||||||||||||
Total equity (deficit) and liabilities | $ | 33,226.6 | $ | 37,898.2 | $ | 50,633.5 | $ | 112,939.6 | $ | 170,191.4 | $ | 50,633.5 | $ | 112,939.6 | $ | 170,191.4 | $ | 194,620.1 | $ | 269,837.0 | ||||||||||||||||||||
Note:
| (1) | The preferred shares issued by us were compound financial instruments with equity, liability and embedded derivative components. Accordingly, the liability portion of our preferred shares amounting |
Other Data:
The following table sets forth for the periods indicated, certain selected consolidated financial and other data:
| Fiscal Year Ended March 31 | Fiscal Year Ended March 31 | |||||||||||||||||||||||||||||||||||||||
| 2008 | 2009 | 2010 | 2011 | 2012 | 2010 | 2011 | 2012 | 2013 | 2014 | |||||||||||||||||||||||||||||||
| (in thousands, except percentages) | (in thousands, except percentages) | |||||||||||||||||||||||||||||||||||||||
Number of transactions: | ||||||||||||||||||||||||||||||||||||||||
Air ticketing | 1,029.1 | 1,250.8 | 1,766.9 | 2,824.6 | 3,715.4 | 1,766.9 | 2,824.6 | 3,715.4 | 3,794.1 | 3,999.2 | ||||||||||||||||||||||||||||||
Hotels and packages | 36.9 | 81.4 | 109.7 | 175.9 | 343.1 | 109.7 | 175.9 | 343.1 | 568.1 | 869.8 | ||||||||||||||||||||||||||||||
Revenue less service cost(1): | ||||||||||||||||||||||||||||||||||||||||
Air ticketing | $ | 14,091.4 | $ | 18,733.3 | $ | 31,134.0 | $ | 47,622.7 | $ | 66,250.7 | $ | 31,134.0 | $ | 47,622.7 | $ | 66,250.7 | $ | 56,769.2 | $ | 62,051.5 | ||||||||||||||||||||
Hotels and packages | 2,365.6 | 5,553.6 | 7,995.7 | 10,907.1 | 18,226.3 | 7,995.7 | 10,907.1 | 18,226.3 | 27,592.2 | 39,992.9 | ||||||||||||||||||||||||||||||
Other revenue | 50.1 | 703.8 | 1,152.8 | 2,540.7 | 3,707.8 | 1,152.8 | 2,540.7 | 3,707.8 | 3,803.8 | 4,350.7 | ||||||||||||||||||||||||||||||
|
|
|
|
| $ | 40,282.5 | $ | 61,070.5 | $ | 88,184.9 | $ | 88,165.2 | $ | 106,395.1 | ||||||||||||||||||||||||||
| $ | 16,507.1 | $ | 24,990.7 | $ | 40,282.5 | $ | 61,070.5 | $ | 88,184.9 | |||||||||||||||||||||||||||||||
|
|
|
|
| ||||||||||||||||||||||||||||||||||||
Gross bookings(2): | ||||||||||||||||||||||||||||||||||||||||
Air ticketing | $ | 198,799.6 | $ | 260,945.1 | $ | 408,603.1 | $ | 647,846.9 | $ | 839,234.3 | $ | 408,603.1 | $ | 647,846.9 | $ | 839,234.3 | $ | 939,637.5 | $ | 943,699.1 | ||||||||||||||||||||
Hotels and packages | 26,489.7 | 52,365.7 | 57,273.1 | 94,608.2 | 153,723.2 | 57,273.1 | 94,608.2 | 153,723.2 | 229,921.0 | 317,518.4 | ||||||||||||||||||||||||||||||
Net revenue margins(3): | ||||||||||||||||||||||||||||||||||||||||
Air ticketing | 7.1 | % | 7.2 | % | 7.6 | % | 7.4 | % | 7.9 | % | 7.6 | % | 7.4 | % | 7.9 | % | 6.0 | % | 6.6 | % | ||||||||||||||||||||
Hotels and packages | 8.9 | % | 10.6 | % | 14.0 | % | 11.5 | % | 11.9 | % | 14.0 | % | 11.5 | % | 11.9 | % | 12.0 | % | 12.6 | % | ||||||||||||||||||||
Notes:
| (1) | As certain parts of our revenue are recognized on a “net” basis and other parts of our revenue are recognized on a “gross” basis, we evaluate our financial performance based on revenue less service cost, which is a non-IFRS measure, as we believe that revenue less service cost reflects more accurately the value addition of the travel services that we provide to our customers. The presentation of this non-IFRS information is not meant to be considered in isolation or as a substitute for our consolidated financial results prepared in accordance with IFRS as issued by the IASB. Our revenue less service cost may not be comparable to similarly titled measures reported by other companies due to potential differences in the method of calculation. The following table reconciles our revenue (an IFRS measure) to revenue less service cost (a non-IFRS measure): |
| Air Ticketing | Hotels and Packages | Other Revenue | Total | Air Ticketing | Hotels and Packages | Other Revenue | Total | |||||||||||||||||||||||||||||||||||||||||||||||||||||||||||||||||||||||||||||||||||||||||||||||||||||||||||||||||||||||||||||||||||||||||||||||||||||||||
| Fiscal Year Ended March 31 | Fiscal Year Ended March 31 | Fiscal Year Ended March 31 | Fiscal Year Ended March 31 | Fiscal Year Ended March 31 | Fiscal Year Ended March 31 | Fiscal Year Ended March 31 | Fiscal Year Ended March 31 | |||||||||||||||||||||||||||||||||||||||||||||||||||||||||||||||||||||||||||||||||||||||||||||||||||||||||||||||||||||||||||||||||||||||||||||||||||||||||
| 2008 | 2009 | 2010 | 2011 | 2012 | 2008 | 2009 | 2010 | 2011 | 2012 | 2008 | 2009 | 2010 | 2011 | 2012 | 2008 | 2009 | 2010 | 2011 | 2012 | 2010 | 2011 | 2012 | 2013 | 2014 | 2010 | 2011 | 2012 | 2013 | 2014 | 2010 | 2011 | 2012 | 2013 | 2014 | 2010 | 2011 | 2012 | 2013 | 2014 | |||||||||||||||||||||||||||||||||||||||||||||||||||||||||||||||||||||||||||||||||||||||||||||||||||||||||||||||||||||||||
| (In thousands) | (in thousands) | |||||||||||||||||||||||||||||||||||||||||||||||||||||||||||||||||||||||||||||||||||||||||||||||||||||||||||||||||||||||||||||||||||||||||||||||||||||||||||||||
Revenue | $ | 14,091.4 | $ | 19,225.1 | $ | 32,119.5 | $ | 47,622.7 | $ | 76,190.3 | $ | 24,189.4 | $ | 48,622.8 | $ | 50,287.9 | $ | 74,558.0 | $ | 116,701.1 | $ | 50.1 | $ | 703.8 | $ | 1,152.8 | $ | 2,540.7 | $ | 3,707.8 | $ | 38,330.9 | $ | 68,551.7 | $ | 83,560.2 | $ | 124,721.4 | $ | 196,599.3 | $ | 32,119.5 | $ | 47,622.7 | $ | 76,190.3 | $ | 60,888.8 | $ | 66,523.2 | $ | 50,287.9 | $ | 74,558.0 | $ | 116,701.1 | $ | 164,129.3 | $ | 184,500.7 | $ | 1,152.8 | $ | 2,540.7 | $ | 3,707.8 | $ | 3,803.8 | $ | 4,350.7 | $ | 83,560.2 | $ | 124,721.4 | $ | 196,599.3 | $ | 228,821.9 | $ | 255,374.6 | ||||||||||||||||||||||||||||||||||||||||||||||||||||||||||||||||||||||||||||||||
Less: | ||||||||||||||||||||||||||||||||||||||||||||||||||||||||||||||||||||||||||||||||||||||||||||||||||||||||||||||||||||||||||||||||||||||||||||||||||||||||||||||||
Service cost | — | 491.8 | 985.5 | — | 9,939.6 | 21,823.8 | 43,069.2 | 42,292.2 | 63,650.9 | 98,474.8 | — | — | — | — | — | 21,823.8 | 43,561.0 | 43,277.7 | 63,650.9 | 108,414.3 | ||||||||||||||||||||||||||||||||||||||||||||||||||||||||||||||||||||||||||||||||||||||||||||||||||||||||||||||||||||||||||||||||||||||||||||
|
|
|
|
|
|
|
|
|
|
|
|
|
|
|
|
|
|
|
| |||||||||||||||||||||||||||||||||||||||||||||||||||||||||||||||||||||||||||||||||||||||||||||||||||||||||||||||||||||||||||||||||||||||||||||
Less: Service Cost | 985.5 | — | 9,939.6 | 4,119.6 | 4,471.7 | 42,292.2 | 63,650.9 | 98,474.8 | 136,537.1 | 144,507.8 | — | — | — | — | — | 43,277.7 | 63,650.9 | 108,414.3 | 140,656.7 | 148,979.6 | ||||||||||||||||||||||||||||||||||||||||||||||||||||||||||||||||||||||||||||||||||||||||||||||||||||||||||||||||||||||||||||||||||||||||||||
Revenue less service cost | $ | 14,091.4 | $ | 18,733.3 | $ | 31,134.0 | $ | 47,622.7 | $ | 66,250.7 | $ | 2,365.6 | $ | 5,553.6 | $ | 7,995.7 | $ | 10,907.1 | $ | 18,226.3 | $ | 50.1 | $ | 703.8 | $ | 1,152.8 | $ | 2,540.7 | $ | 3,707.8 | $ | 16,507.1 | $ | 24,990.7 | $ | 40,282.5 | $ | 61,070.5 | $ | 88,184.9 | $ | 31,134.0 | $ | 47,622.7 | $ | 66,250.7 | $ | 56,769.2 | $ | 62,051.5 | $ | 7,995.7 | $ | 10,907.1 | $ | 18,226.3 | $ | 27,592.2 | $ | 39,992.9 | $ | 1,152.8 | $ | 2,540.7 | $ | 3,707.8 | $ | 3,803.8 | $ | 4,350.7 | $ | 40,282.5 | $ | 61,070.5 | $ | 88,184.9 | $ | 88,165.2 | $ | 106,395.1 | ||||||||||||||||||||||||||||||||||||||||||||||||||||||||||||||||||||||||||||||||
|
|
|
|
|
|
|
|
|
|
|
|
|
|
|
|
|
|
|
| |||||||||||||||||||||||||||||||||||||||||||||||||||||||||||||||||||||||||||||||||||||||||||||||||||||||||||||||||||||||||||||||||||||||||||||
| (2) | Gross bookings represent the total amount paid by our customers for the travel services and products booked through us, including taxes, fees and other charges, and are net of cancellations and refunds. |
| (3) | Net revenue margins is defined as revenue less service cost as a percentage of gross bookings. |
B. Capitalization and Indebtedness
Not applicable
C. Reasons for the Offer and Use of Proceeds
Not applicable
D. Risk Factors
This annual reportAnnual Report contains forward-looking statements that involve risks and uncertainties. Our actual results could differ materially from those anticipated in these forward-looking statements as a result of a number of factors, including those described in the following risk factors and elsewhere in this annual report.Annual Report. If any of the following risks actually occur, our business, financial condition and results of operations could suffer.
Risks Related to Us and Our Industry
Declines or Disruptions in the Travel Industry Could Adversely Affect Our Business and Financial Performance.
Our business and financial performance is affected by the health of the travel industry in India and worldwide, including changes in supply and pricing. Events specific to the travel industry that could negatively affect our business include continued fare increases, travel-related strikes or labor unrest, general civil unrest, fuel price volatility and bankruptcies or liquidations of our suppliers. For example, events in the Middle East over the past several years have resulted in an adverse impact on travel to that region. Such events have also contributed to an increase in crude oil prices which may have an adverse impact on the travel industry globally, including our business. Similarly, political unrest in Bangkok, Thailand, has negatively impacted travel to those locations. In addition, the drop in the average value of the Indian Rupee as compared to the US dollar in fiscal year 2014 adversely impacted the Indian travel industry as it made travel for Indian consumers outside of India more expensive.
Additionally, our business is sensitive to safety concerns, and thus our business has in the past declined and may in the future decline after incidents of actual or threatened terrorism, during periods of political instability or conflict or during other periods in which travelers become concerned about safety issues, including as a result of natural disasters such as tsunamis or earthquakes or when travel might involve health-related risks, such as the influenza A virus (H1N1), avian flu (H5N1 and H7N9) and Severe Acute Respiratory Syndrome, or other epidemics or pandemics. Such events are outside our control and could result in a significant decrease in demand for our travel services. Any such decrease in demand, depending on its scope and duration, together with any other issues affecting travel safety, could significantly and adversely affect our business and financial performance over the short and long term. The occurrence of such events could result in disruptions to our customers’ travel plans and we may incur additional costs and constrained liquidity if we provide relief to affected customers by not charging cancellation fees or by refunding the cost of airline tickets, hotel reservations and other travel services and products. If there is a prolonged substantial decrease in travel volumes, particularly air travel and hotels, for these or any other reasons, our business, financial condition and results of operations would be adversely affected.
Our Business and Results of Operations Could Be Adversely Affected by Global Economic Conditions.
Consumer purchases of discretionary items generally decline during periods of recession and other periods in which disposable income is adversely affected. As a substantial portion of travel expenditure, for both business and leisure, is discretionary, the travel industry tends to experience weak or reduced demand during economic downturns.
Unfavorable changes in the above factors or in other business and economic conditions affecting our customers could result in fewer reservations made through our websites and/or lower our net revenue margins, and have a material adverse effect on our financial condition and results of operations.
Since the beginning of the global financial crisis in the third quarter of 2008, adverse developments in the international financial markets have created challenging economic conditions for businesses and governments around the world. These adverse developments have included increased market volatility, tightened liquidity in credit markets, diminished expectations for economic growth and a reduction in consumer and business spending. While the global economy has recovered to some extent since 2010, the recovery remains fragile and slow-paced as high-income countries continue to suffer from volatility and slow growth, and it could be adversely impacted by several factors, including the deterioration of general economic conditions or political unrest in Europe as fiscal austerity continues, unemployment rates remain elevated and the potential for conflict in eastern Europe, restrained monetary policy in the form of tapering and other debt and fiscal issues in the United States and a slowdown in economic growth in China as its new leadership attempts to rebalance its economy from investment and exports to increased domestic consumption and restrain lending practices. The weakness and uncertainty in the global economy have negatively impacted both corporate and consumer spending patterns and demand for travel services, globally and in India, and may continue to do so in the future.
As an intermediary in the travel industry, a significant portion of our revenue is affected by fares and tariffs charged by our suppliers as well as volumes of sales made by us. During periods of poor economic conditions, airlines and hotels tend to reduce rates or offer discounted sales to stimulate demand, thereby reducing our commission-based income. A slowdown in economic conditions may also result in a decrease in transaction volumes and adversely affect our revenue. It is difficult to predict the effects of the uncertainty in global economic conditions. If economic conditions worsen globally or in India, our growth plans, business, financial condition and results of operations could be adversely impacted.
If We Are Unable to Maintain Existing, and Establish New, Arrangements with Our Travel Suppliers, Our Business May Be Adversely Affected.
Our business is dependent on our ability to maintain our relationships and arrangements with existing suppliers, such as airlines which supply air tickets to us directly, Amadeus (ourIT Group, SA, or Amadeus, our global distribution system, or GDS, service provider)provider, Indian Railways, hotels, hotel suppliers and Indian Railways,destination management companies, bus operators and car hire companies, as well as our ability to establish and maintain relationships with new travel suppliers, including hotels, bus operators and car hire companies.suppliers. A substantial portion of our revenue less service cost is derived from fees and commissions negotiated with travel suppliers for bookings made through our websites or via our other distribution channels. Adverse changes in existing arrangements, including an inability by any travel supplier to fulfill their payment obligation to us in a timely manner, increasing industry consolidation or our inability to enter into newor renew arrangements with these parties on favorable terms, if at all, could reduce the amount, quality, pricing and breadth of the travel services and products that we are able to offer, which could adversely affect our business and financial performance. For example, we have experienced short-term disruptions in the supply of tickets from domestic airlines in the past.
AdverseIn addition, adverse economic developments affecting the travel industry could also adversely impact our ability to maintain our existing relationships and arrangements with one or more of our suppliers. For example,In particular, adverse changes to the overall business and financial climate for the airline industry in India due to various factors including, but not limited to, rising fuel costs, high taxes, significant depreciation of the Indian Rupee as compared to the US dollar making travel for Indian consumers outside India more expensive, and increased liquidity constraints, could affect the ability of one or more of our airline suppliers to continue to operate or otherwise meet our demand for tickets, which, in turn, could materially and adversely affect our financial resultsresults. For example, during fiscal year 2013, Kingfisher Airlines, one of the major airlines in India and one of our airline suppliers, shut down its operations, which resulted in a decline in the total capacity in the airline industry in India. In addition, adverse economic developments affecting the travel industry resulted in airlines in India reducing the base commissions paid to travel agencies from fiscal year 2013. Further, in fiscal year 2014, due to capacity constraints in the airline industry in India, the domestic airfare environment was marked by record high airfares which led to reduced growth in domestic air travel in the country. These factors were primarily responsible for causing us to record a net loss of $(20.9) million in fiscal year 2014 as compared to a net loss of $(27.6) million in fiscal year 2013 and a profit of $7.0 million in fiscal year 2012. Any consolidation in the airline industry involving our suppliers may also adversely affect our existing relationships and arrangements with such suppliers.
No assurance can be given that our agreements or arrangements with our travel suppliers or GDS service provider will continue or that our travel suppliers or GDS service provider will not further reduce or eliminate fees or commissions or attempt to charge us for content, terminate our contracts, make their products or services unavailable to us as part of exclusive arrangements with our competitors or default on or dispute their payment or other obligations towards us, any of which could reduce our revenue and net revenue margins or may require us to initiate legal or arbitral proceedings to enforce their contractual payment obligations, which may adversely affect our business and financial performance. For example, in late April 2012, Jet AirwaysSee also “— Some of Our Airline Suppliers (Including Our GDS Service Provider) May Reduce or Eliminate the Commission and IndiGo, eachOther Fees They Pay to Us for the Sale of whom was oneAir Tickets and This Could Adversely Affect Our Business and Results of our top five airline suppliers in fiscal year 2012, ceased to allow us to sell their tickets in connection with allegations that we offered “opaque fares.Operations.” Although we reached an agreement to resume the sale of Jet Airways and IndiGo tickets by early May 2012, a prolonged dispute with these airlines could have materially and adversely affected our financial results.
We Do Not Have Formal Agreements with Many of Our Travel Suppliers.
We rely on various travel suppliers to facilitate the sale of our travel services. We do not have formal agreements with many of our travel suppliers, including low-cost airlines and many hotels, whose booking systems or central reservations systems are relied upon by us for bookings and confirmation as well as certain payment gateway arrangements, and there can be no assurance that these third parties will not terminate these arrangements with us at short notice or without notice. Further, where we have entered into formal agreements, many of these agreements are short-term contracts, requiring periodic renewal and providing our counterparties with a right to terminate at short notice or without notice. Some of these agreements are scheduled to expire in the near future and we are in the process of renewing those agreements. Many of our airline suppliers with whom we have contractsformal agreements, including airlines, are also able to either terminate or alter the terms of their contracts with us at will or by providing a few days’at short notice. For example, our agreement with Indian Railways Catering and Tourism Corporation Limited, or IRCTC, which allows us to transact with Indian Railways’ passenger reservation system through the Internet, can be terminated or temporarily suspended by IRCTC without prior notice and at its sole discretion. Termination, non-renewal or suspension or an adverse amendment of any of the abovementioned agreements and/or arrangements could have a material adverse effect on our business, financial condition and results of operations.
We Have Sustained Operating Losses in the Past and May Continue to Experience Operating Losses in the Future.
We sustained operating losses in fiscal years 2013 and 2014 and in all our fiscal years through March 31,prior to and including fiscal year 2010. While we have hadgenerated operating profitprofits in fiscal years 2011 and 2012, there can be no assurance that we cannot assure youwill be able to return to profitability or that we can avoid operating losses in the future. We expect that our operatingadvertisement and business promotion expenses going forward will increase as a result of our continued investment in the hotels and thepackages business The degree of increase in these expenses will be largely based on anticipated organizational growth and revenue trends. As a result, any decrease or delay in generating additional sales volumes and revenue could result in substantial operating losses.
We Rely on Third-Party Systems and Service Providers, and Any Disruption or Adverse Change in Their Businesses Could Have a Material Adverse Effect on Our Business.
We currently rely on certain third-party computer systems, service providers and software companies, including the GDS used by full service airlines, and the electronic central reservation systems used by low-cost airlines, certain hotels and hotel suppliers which are directly-connecteddirectly connected to us, Indian Railways and bus operators. In particular, we rely on third parties to:
Any interruption or deterioration in performance of these third-party systems and services could have a material adverse effect on our business. Further, the information provided to us by certain of these third-party systems, such as the central reservations systems of certain of our hotel suppliers, may not always be accurate due to either technical glitches or human error, and we may incur monetary and/or reputational loss as a result.
Our success is also dependent on our ability to maintain our relationships with these third-party systems and service providers, including our technology partners. In the event our arrangements with any of these third parties are impaired or terminated, we may not be able to find an alternative source of systems support on a timely basis or on commercially reasonable terms, which could result in significant additional costs or disruptions to our business.
Our Results of Operations Are Subject to Fluctuations in Currency Exchange Rates.
Our presentation currency is the US dollar. However, the functional currency of MMT India, our key operating subsidiary, is the Indian Rupee. We receive a substantial portion of our revenue in Indian Rupees and most of our costs are incurred in Indian Rupees. Any fluctuation in the value of the Indian Rupee against the US dollar, such as the approximately 10.8% drop in the average value of the Indian Rupee as compared to the US dollar in fiscal year 2014 as compared to the average value of the Indian Rupee against the US dollar in fiscal year 2013, will affect our results of operations. For example, our loss on account of foreign exchange fluctuations in fiscal year 2014 was $2.7 million as compared to $1.9 million in fiscal year 2013. We expect to be adversely affected by any further depreciation of the Indian Rupee against the US dollar. The drop in the average value of the Indian Rupee as compared to the US dollar in fiscal year 2014 adversely impacted the Indian travel industry as it made outbound travel for Indian consumers more expensive. In addition, our exposure to foreign currency risk also arises in respect of our non-Indian Rupee-denominated trade and other receivables, trade and other payables, and cash and cash equivalents.
Based on our operations in fiscal year 2014, a 10.0% appreciation of the US dollar against the Indian Rupee as of March 31, 2014, assuming all other variables remained constant, would have increased our loss for fiscal year 2014 by $2.5 million. Similarly, a 10.0% depreciation of the US dollar against the Indian Rupee as of March 31, 2014, assuming all other variables remained constant, would have decreased our loss for fiscal year 2014 by $2.5 million.
Further, we are also exposed to movements in currency exchange rates between the US dollar and the Euro. As the functional currency of the Hotel Travel Group is the US dollar, our exposure to foreign currency risk primarily arises in respect of our non-US dollar denominated trade and other receivables, trade and other payables and cash and cash equivalents, which were $1.2 million, $0.8 million and $3.4 million, respectively, as of March 31, 2014. Based on our operations in fiscal year 2014, a 10.0% appreciation of the Euro against the US dollar as of March 31, 2014, assuming all other variables remained constant, would have decreased our loss for the year by $0.4 million. Similarly, a 10.0% depreciation of the Euro against the US dollar as of March 31, 2014, assuming all other variables remained constant, would have increased our loss for the year by $0.4 million.
We are also exposed to movements between the US dollar and the Indian Rupee in our operations, as 4.4%, 3.9% and 2.9% of our revenue for fiscal years 2012, 2013 and 2014, respectively, was generated by MMT India from its air ticketing business and received in US dollars although our expenses are generally incurred in Indian Rupees. Additionally, we receive revenue from our hotels and packages business in Indian Rupees, but a portion of our expenses in this segment (those relating to outbound packages from India in particular) could be incurred in a non-Indian currency. We currently do not have any hedging agreements or similar arrangements with any counter-party to cover our exposure to any fluctuations in foreign exchange rates. Fluctuation in the Indian Rupee-US dollar exchange rate could have a material adverse effect on our business and our financial condition and results of operations as reported in US dollars.
We Outsource a Significant Portion of Our Call Center Services and If Our Outsourcing Service Providers Fail to Meet Our Requirements or Face Operational or System Disruptions, Our Business May Be Adversely Affected.
We outsource our call center service for sales for all international flights and most of our hotel reservations and packages. We also outsource our call center service for post-sales customer service support for all flights (domestic and international), hotel reservations and packages, and rail and bus ticketing, as well as back office fulfillment and ticketing services, to various third parties in India. If our outsourcing service providers experience difficulty meeting our requirements for quality and customer service standards, our reputation could suffer and our business and prospects could be adversely affected. Our operations and business could also be materially and adversely affected if our outsourcing service providers face any operational or system interruptions.
Further, many of our contracts with outsourcing service providers are short-term or have short notice periods. For example, our agreement with Serco BPO Private Limited (formerly Intelenet Global Services Private Limited,Limited), or Intelenet Global Services, a subsidiary of Serco, Group plc, which provides call center services for our Indian domestic air ticketinghotels and international air ticketingpackages business as well as post-sales customer service support for air tickets, is for a renewable term of three years but may be terminated by either party on two months’ notice. The agreements with some of our outsourcing service providers, including iEnergizer IT Services Private Limited, or iEnergizer IT Services, and Motif India Infotech Private Limited, or Motif India Infotech, may be terminated by either party on 90 days’ notice after the first year in the term of such agreements. In the event one or more of our contracts with our outsourcing service providers is terminated on short notice, we may be unable to find alternative outsourcing service providers on commercially reasonable terms, or at all. Further, the quality of the service provided by a new or replacement outsourcing service providersprovider may not meet our requirements, including during the transition and training phase. Hence, termination of any of our contracts with our outsourcing service providers could cause a decline in the quality of our services and disrupt and adversely affect our business, results of operations and financial condition.
We Rely on Information Technology to Operate Our Business and Maintain Our Competitiveness, and Any Failure to Adapt to Technological Developments or Industry Trends Could Harm Our Business.
We depend on the use of sophisticated information technology and systems, which we have customized in-house for search and reservation for flights and hotels, as well as payments, refunds, CRM,customer relationship management, communications and administration. As our operations grow in both size and scope, we must continuously improve and upgrade our systems and infrastructure to offer our customers enhanced services, features and functionality, while maintaining the reliability and integrity of our systems and infrastructure in a cost-effective manner. Our future success also depends on our ability to upgrade our services and infrastructure ahead of rapidly evolving consumer demands while continuing to improve the performance, features and reliability of our service in response to competitive offerings.
We may not be able to maintain or replace our existing systems or introduce new technologies and systems as quickly as our competitors, in a cost-effective manner or at all. We may also be unable to devote adequate financial resources to develop or acquire new technologies and systems in the future.
We may not be able to use new technologies effectively, or we may fail to adapt our websites, mobile applications, transaction processing systems and network infrastructure to consumer requirements or emerging industry standards. If we face material delays in introducing new or enhanced solutions, our customers may forego the use of our services in favor of those of our competitors. Any of these events could have a material adverse effect on our operations.
We currently license from third-parties some of the technologies incorporated into our websites. As we continue to introduce new services that incorporate new technologies, we may be required to license additional technology. We cannot be sure that such technology licenses will be available on commercially reasonable terms, if at all.
The Travel Industry forin India and India-Related Travel IsWorldwide is Intensely Competitive, and We May Not Be Able to Effectively Compete in the Future.
The Indian travel market is intensely competitive. Factors affecting our competitive success include, among other things, price, availability and breadth of choice of travel services and products, brand recognition, customer service, fees charged to travelers, ease of use, accessibility and reliability. We currently compete with both established and emerging providers of travel services and products, including other online travel agencies both in India and abroad, such as cleartrip.com, expedia.co.in, travelocity.co.in, yatra.com, goibibo.com, booking.com and yatra.com,agoda.com, as well as traditional travel agencies, tour operators, travel suppliers and operators of travel industry reservation databases. Certain of our competitors have also launched websites in other countries to better cater to Indian and other customers located in those areas. For example, in 2011, cleartrip.com launched website operations in the United Arab Emirates. Large, established Internet search engines have also launched applications offering travel itineraries in destinations around the world, and meta-search companies who can aggregate travel search results also compete against us for customers. Certain of our competitors have launched brand marketing campaigns to increase their visibility with customers. For example, goibibo.com recently commenced a television advertising campaign in India. Some of our competitors have significantly greater financial, marketing, personnel and other resources than us and certain of our competitors have a longer history of established businesses and reputations in the Indian travel market (particularly in the hotels and packages business) as compared with us. From time to time we may be required to reduce service fees and net revenue margins in order to compete effectively and maintain or gain market share.
Further, we may also face increased competition from new entrants in our industry. We cannot assure you that we will be able to successfully compete against existing or new competitors in our existing lines of business as well as new lines of business into which we may venture. If we are not able to compete effectively, our business and results of operations may be adversely affected.
Some travel suppliers are seeking to decrease their reliance on distribution intermediaries such as us, by promoting direct distribution channels. Many airlines, hotels, car rental companies and tour operators have call centers and have established their own travel distribution websites.websites and mobile applications. From time to time, travel suppliers offer advantages, such as bonus loyalty awards and lower transaction fees or discounted prices, when their services and products are purchased from supplier-related channels. We also compete with competitors who may offer less content, functionality and marketing reach but at a relatively lower cost to suppliers. If our access to supplier-provided content or features were to be diminished either relative to our competitors or in absolute terms or if we are unable to compete effectively with travel supplier-related channels or other competitors, our business could be materially and adversely affected.
Some of Our Airline Suppliers (Including Our GDS Service Provider) May Reduce or Eliminate the Commission and Other Fees They Pay to Us for the Sale of Air Tickets, and This Could Adversely Affect Our Business and Results of Operations.
In our air ticketing business, we generate revenue through commissions and incentive payments from airline suppliers, service fees charged to our customers and fees from our GDS service provider. Our airline suppliers may reduce or eliminate the commissions and incentive payments they pay to us. For example, recent news reports have suggested that airlines in India are planing to reducereduced the base commissions paid to travel agencies.agencies during fiscal year 2013. To the extent any of our airline suppliers further reduce or eliminate the commissions or incentive payments they pay to us in the future, our revenue may be further reduced unless we are able to adequately mitigate such reduction by increasing the service feefees we charge to our customers in a sustainable manner. However, anyAny increase in service fees, to mitigate reductions in or elimination of commissions or otherwise, may also result in a loss of potential customers. Further, our arrangementarrangements with the airlines that supply air tickets to us may limit the amount of service feefees that we are able to charge our customers. Our business would also be negatively impacted if competition or regulation in the travel industry causes us to reduce or eliminate our service fees.
We Depend on and Expect to Continue to Depend on a Small Number of Airline Suppliers in India for a Significant Percentage of our Air Ticketing Revenue.
The domestic air travel industry in India is dominated by five airlines. As a substantial portion of our air ticketing revenue is represented by base commissions and incentive payments paid to us by these domestic airlines, our dependence on a limited number of domestic airlines means that a reduction or elimination in base commissions and incentive payments by any one or all of these airlines could have a material adverse effect on our revenue.
In addition, our reliance on a small number of airline suppliers in India gives those airline suppliers additional bargaining power in negotiating agreements with us. A reduction or elimination of base commissions and incentive payments by any of these domestic airline suppliers, the loss of any of these domestic airline suppliers or a domestic airline supplier exerting significant price and margin pressure on us could materially and adversely affect our business, financial condition and results of operations.
We Rely on the Value of Our Brand,Brands, and Any Failure to Maintain or Enhance Consumer Awareness of Our BrandBrands Could Have a Material Adverse Effect on Our Business, Financial Condition and Results of Operations.
We believe continued investment in our brand, “MakeMyTrip,” is critical to retain and expand our business. We believe that our brand is well respected and recognized in the Indian travel market. We have invested in developing and promoting our brand since our inception and expect to continue to spend on maintaining our brand’s value to enable us to compete against increased spending by our competitors, as well as against emerging competitors, including search engines and meta-search engines, and to allow us to expand into new geographies and products where our brand is not well known. With the acquisition of the Hotel Travel Group and the ITC Group in November 2012, we acquired the brands “HotelTravel” and “ITC,” which we believe are well-known brands globally, especially in Southeast Asia. We also acquired the “Easytobook” brand, which we believe is a well-known brand in Europe, through our acquisition of the ETB Group in February 2014. We have invested and intend to continue to invest in developing and promoting these brands. There is no assurance that we will be able to successfully maintain or enhance consumer awareness of our brands. Even if we are successful in our branding efforts, such efforts may not be cost-effective. Our marketing costs may also increase as a result of inflation in media pricing (including search engine keywords). There is no assurance that we will be able to successfully maintain or enhance consumer awareness of our brand. Even if we are successful in our branding efforts, such efforts may not be cost-effective. If we are unable to maintain or enhance consumer awareness of our brandbrands and generate demand in a cost-effective manner, it would negatively impact our ability to compete in the travel industry and would have a material adverse effect on our business. See also “— We Cannot Be Sure That Our Intellectual Property Is Protected from Copying or Use by Others, Including Current or Potential Competitors.”
We May Not Be Successful in Implementing Our Growth Strategies.
Our growth strategy involvesstrategies involve expanding our hotels and packages business (including through our travel agents’ network andnetwork), expanding our service offerings. Further, one of our strategies is to enhanceand product offerings, enhancing our service platforms by investing in technology, and expanding into new geographic markets. markets and pursuing strategic partnerships and acquisitions.
Our success in implementing our growth strategies areis affected by:
Many of these factors are beyond our control and there can be no assurance that we will succeed in implementing our strategy. Separately,strategies.
Even if we are successful in executing our growth strategystrategies, our different businesses may not grow at the same rate or with a uniform effect on our revenues and profitability. For example, the rate of growth in our hotels and packages business, which has generally outpaced our air tickets business and is a relatively higher margin business, may not grow at a pace to affect our overall growth in the short term as it is currently smaller than our air tickets business. In addition, the relatively higher margins of our hotels and packages business may be adversely affected by our recent acquisitions, due to the additional expenses associated with such acquisitions.
We are also involvessubject to additional risks involved in our strategies of expanding into new geographic markets which will involve additional risks.and pursuing strategic partnerships and acquisitions. See “— Our International Operations, Some of Which Are New to Us, Involve Additional Risks.Risks” and “— We May Not Be Successful in Pursuing Strategic Partnerships and Acquisitions, and Future Partnerships and Acquisitions May Not Bring Us Anticipated Benefits.”
We May Not Be Successful in Pursuing Strategic Partnerships and Acquisitions, and Future Partnerships and Acquisitions May Not Bring Us Anticipated Benefits.
Part of our growth strategy is the pursuit of strategic partnerships and acquisitions. There can be no assurance that we will succeed in implementing this strategy as it is subject to many factors which are beyond our control, including our ability to identify, attract and successfully execute suitable acquisition opportunities and partnerships. This strategy may also subject us to uncertainties and risks, including acquisition and financing costs, potential ongoing and unforeseen or hidden liabilities, diversion of management resources and cost of integrating acquired businesses. For instance, we are involved in a dispute with former shareholders of the Hotel Travel Group. See “Business — Legal Proceedings.” We could face difficulties integrating the technology of acquired businesses with our existing technology, and employees of the acquired business into various departments and ranks in our company, and it could take substantial time and effort to integrate the business processes being used in the acquired businesses with our existing business processes. Moreover, there is no assurance that such partnerships or acquisitions will achieve our intended objectives or enhance our revenue.
InWe have made a number of acquisitions since March 2010, we acquiredincluding the acquisition of certain assets of Travis Internet Private Limited, an online bus ticketing company, including the website www.ticketvala.com, which gives us the ability to provide our bus suppliers with access to a real time bus reservations technology platform. We intend to leverage this platform to enable more bus operators to be directly-connected to our booking system with such technology, but there is no assurance that we will be able to successfully leverage this new platform to further expand our bus offering.
On May 9, 2011, we acquired approximately 79%100% of Luxury Tours, & Travel Pte Ltd, a Singapore-based travel agency, engaged in the business of providing hotel reservations, excursion tours and other related services to inbound and outbound travelers in Singapore and the rest of Southeast Asia. We have agreed to acquire the remaining shares in Luxury Tours & Travel Pte Ltd in three tranches over a three-year earn-out period. Our stake has increased to approximately 83% pursuant to an additional investment in fiscal year 2012. We intend to leverage this acquisition to build a position of strength in Southeast Asia through relationships with local hotels and vendors, but there is no assurance that we will be able to successfully leverage this acquisition to further grow our business in the region.
In August 2011, we acquired 19.9% of Le Travenues Technology Private Limited, which owns and operates www.ixigo.com, an online travel meta search engine. We believe this investment could potentially complementengine, an initial 29% stake (and up to 100% at our online travel business. However, there is no assurance this investment will be successful or bring about desired results.
In November 2011, we acquired approximately 29% ofdiscretion) in My Guest House Accommodations Private Limited, or My Guest House, which is engaged in the business of aggregation, sales and distribution of hotel room inventory with a special focus on budget lodging accommodations and serviced apartments. Pursuantapartments, a 100% stake in the companies comprising the Hotel Travel Group, a group of companies which operate through their website HotelTravel.com and offers its customers online hotel reservations in South East Asia and other key global travel destinations, and a 51% stake (and up to our agreements with My Guest House, we expect to acquire 100% of My Guest House’s ordinary shares, through an earn outearn-out structure based uponover four years) in the achievementITC Group, a well-established hotel aggregator and tour operator in Thailand.
In February 2014, we acquired a 100% equity interest in the group of various business parameters spread over eight years. companies comprising the ETB Group. Established in 2004, the ETB Group primarily operates through its website www.easytobook.com and offers its customers online hotel reservations in Europe, North America and other key global travel destinations.
We believe this investment could potentially complementthese acquisitions serve to strengthen our onlinepresence in key geographic markets and expand the travel business.products and services that we can offer our customers. However, there is no assurance that this investmentany of these investments or acquisitions will be successful or bring about desiredtheir intended results. Any such failure could negatively impact our ability to compete in the travel industry and have a material adverse effect on our business.
For further details on these investments and acquisitions, see “Item 4. Business — Recent Acquisitions” and “Information On the Company — History and Development of our Company — Investments and Acquisitions” in this Annual Report.
Our Arrangements with Some of Our Airline Suppliers May Subject Us to Additional Monetary Risks.
We generally do not assume inventory risk in our air ticketing business as we typically act as an agent. However, on a few occasions, we pre-purchase air ticket inventory in order to enjoy special negotiated rates and we assume inventory risk on such tickets. When we sell pre-purchased tickets to our customers, revenue is accounted for on a “gross” basis (representing the price of the tickets paid by our customers) and the amount spent to pre-purchase the ticket is classified as a service cost. We obtain inventory for most hotels outside India through contracts with online travel agents and aggregators outside India. In some instances, in order to enjoy special negotiated rates for these hotels, we pre-purchase hotel room nights and assume inventory risk on them. If we are unable to sell pre-purchased tickets or hotel room nights inventory as anticipated either at all or at expected rates, our revenue and business may be adversely affected. We do not presently engage in such practices, such as guaranteeing a minimum number of room reservations, with our hotel suppliers.
Certain of Our Businesses or Services Have Only Recently Been Introduced and, As a Result, It May Be Difficult to Evaluate Their Performance and Prospects.
Some of the services and products offered by us were introduced recently. For example, we started our car hire service in May 2012, which was followed more recently by our self-driven car hire business. As a result, this business has a limited operating history and it may be difficult to evaluate its performance and prospects.
Our International Operations, Some of Which Are New to Us, Involve Additional Risks.
We have been operating in the United States since 2000, servicing mainly the air ticketing needs of non-resident Indians in the United States traveling inbound to India. We also launched our website in the United Arab Emirates in December 2009 and launched our website in Canada in July 2010, following, among other things,2010. We further expanded our presence in the registrationUnited Arab Emirates through the incorporation of our websites’ domain names (www.makemytrip.ae and www.makemytrip.ca) with the relevant registry as well as the procurement of additional servers to handle the increased traffic from these international websites. Our websitea new wholly owned subsidiary in Canada is currently owned by a company registered in Canada.fiscal year 2013. We need to continue to tailor our services and business model to the unique circumstances of such markets to succeed, including building new supplier relationships and customer preferences. We have also expanded, and intend to continue to expand, our business in other new markets, particularly those with a significant non-resident Indian population as well as those with proximity to India or favored by Indian travelers. For example, on May 9, 2011, we acquired approximately 79%We have entered into new geographies in Southeast Asia and in Europe through our acquisitions of Luxury Tours, &the Hotel Travel Pte Ltd, a Singapore-based travel agency. Our stake has increased to approximately 83% pursuant to an additional investment in March 2012.Group, the ITC Group and the ETB Group. Adapting our practices and models effectively to the supplier and customer preferences ofin these, or other, new markets could be difficult and costly and could divert management and personnel resources. We could also face additional regulatory requirements in ourthese, or other, new markets which could be onerous. We cannot assure you that we will be able to efficiently or effectively manage the growth of our operations in these, or other, new markets.
In addition, we are subject to additional risks in our new international operations that may not exist in our Indian operations, including:
If we are not able to effectively mitigate or eliminate these risks, our results of operations could be adversely affected.
For example, since our acquisition of the Hotel Travel Group, a portion of our business and some of our employees are located in Thailand, and we intend to continue to develop and expand our business in Thailand. Consequently, our financial performance and the market price of our ordinary shares will be affected by social and civil unrest and other political, social and economic developments in or affecting Thailand, such as the recent military coup formed to overthrow the government in Thailand, as well as any changes in exchange rates and controls, interest rates and changes in government policies, including taxation policies.
Our Business Could Be Negatively Affected by Changes in Search Engine Logic.
We utilize Internet search engines such as GoogleTMGoogle™ and Yahoo!TM™ India, including through the purchase of travel-related keywords, to drive traffic to our websites. These search engines frequently update and change the logic that determines the placement and display of results of a user’s search, such that the purchased or optimal placement of links to our websites may be negatively affected. In addition, a significant amount of our business is directed to our websites through pay-per-click and display advertising campaigns on the Internet and search engines whose pricing and operating dynamics can rapidly change, both technically and competitively. If major search engines such as GoogleTMGoogle™ or Yahoo!TM™ India, which we utilize for a significant amount of our search engine traffic, change the logic used on their websites for search results in a manner that negatively affects the search engine ranking, paid or unpaid, of our websites or those of our third-party distribution partners, we may experience a decline in traffic on our websites and our business may be adversely affected.
System Interruption in Our Information Systems and Infrastructure May Harm Our Business.
We rely significantly on computer systems to facilitate and process transactions. We may in the future experience system interruptions that make some or all of these systems unavailable or prevent us from efficiently fulfilling bookings or providing services to our customers. Any interruptions, outages or delays in our systems, or deterioration in their performance, could impair our ability to process transactions and decrease the quality of our service to our customers. If we were to experience frequent or persistent system failures, our reputation and brand could be harmed.
While we have backup systems and contingency plans for critical aspects of our operations or business processes, certain other non-critical systems are not fully redundant and our disaster recovery or business continuity planning may not be sufficient. Fires, floods, power outages, telecommunications failures, earthquakes, acts of war or terrorism, acts of God, computer viruses, sabotage, break-ins and electronic intrusion attempts from both external and internal sources and similar events or disruptions may damage, impact or interrupt our computer or communications systems, business processes or infrastructure at any time. Although we have put measures in place to protect certain portions of our facilities and assets, any of these events could cause system interruptions, delays and loss of critical data, and could prevent us from providing services to our customers and/or suppliers for a significant period of time. We do not carry business interruption insurance for such eventualities. Remediation may be costly and we may not have adequate insurance to cover such costs. Moreover, the costs of enhancing infrastructure to attain improved stability and redundancy may be time consuming and expensive and may require resources and expertise that are difficult to obtain.
We Are Exposed to Risks Associated with Online Security and Credit Card Fraud.
The secure transmission of confidential information over the Internet is essential in maintaining customer and supplier confidence in us. Security breaches, whether instigated internally or externally on our system or other Internet-based systems, could significantly harm our business. We currently require customers to guarantee their transactions with their credit cards online. We rely on licensed encryption and authentication technology to effect secure transmission of confidential customer information, including credit card numbers, over the Internet. However, advances in technology or other developments could result in a compromise or breach of the technology that we use to protect customer and transaction data. We incur substantial expense to protect against and remedy security breaches and their consequences. However, our security measures may not prevent security breaches and we may be unsuccessful in or incur additional costs by implementing our remediation plan to address these potential exposures. In fiscal year 2014, our key operating subsidiaries in India and Malaysia incurred losses of $0.2 million and $0.06 million, respectively, on unauthorized credit card transactions. These losses pertained to credit card or digital commerce fraud committed by third parties on MMT India’s website through the purchase of air tickets and hotels and packages products using fraudulent credit cards.
We also have agreements with banks and certain companies that process customer credit card transactions for the facilitation of customer bookings of travel services from our travel suppliers. The online payment gateway for certain of our sales made through our mobile platform orand through international credit and debit cards is not secured by “Verified by VISA”, “MasterSecure” or “MasterSecure,”“American Express SafeKey” and we may be liable for accepting fraudulent credit cards on our websites. We may also be subject to other payment disputes with our customers for such sales. If we are unable to combat the use of fraudulent credit cards, our revenue from such sales would be susceptible to demands from the relevant banks and credit card processing companies, and our results of operations and financial condition could be adversely affected.
Declines or Disruptions in the Travel Industry Could Adversely Affect Our Business and Financial Performance.
Our business and financial performance are affected by the health of the Indian as well as worldwide travel industry, including changes in supply and pricing. Events specific to the travel industry that could negatively affect our business include continued fare increases, travel-related strikes or labor unrest, such as the recent strikes and other similar actions at Air India, fuel price volatility and bankruptcies or liquidations of our suppliers. For example, events in the Middle East over the past several years have resulted in an adverse impact on travel to that region. Such events have also contributed to an increase in crude oil prices which may have an adverse impact on the travel industry globally, including our business.
Additionally, our business is sensitive to safety concerns, and thus our business has in the past declined and may in the future decline after incidents of actual or threatened terrorism, during periods of political instability or conflict or during other periods in which travelers become concerned about safety issues, including as a result of natural disasters such as tsunamis or earthquakes or when travel might involve health-related risks, such as the Influenza, H1N1 virus, avian flu and Severe Acute Respiratory Syndrome, or other epidemics or pandemics. Such concerns are outside our control and could result in a significant decrease in demand for our travel services. Any such decrease in demand, depending on its scope and duration, together with any other issues affecting travel safety, could significantly and adversely affect our business and financial performance over the short and long term. The occurrence of such events could result in disruptions to our customers’ travel plans and we may incur additional costs and constrained liquidity if we provide relief to affected customers by not charging cancellation fees or by refunding the cost of airline tickets, hotel reservations and other travel services and products. If there is a prolonged substantial decrease in travel volumes, particularly air travel and hotels, for these or any other reasons, our business, financial condition and results of operations would be adversely affected.
Our Business and Results of Operations Could Be Adversely Affected by Global Economic Conditions.
Consumer purchases of discretionary items generally decline during recessionary periods and other periods in which disposable income is adversely affected. As a substantial portion of travel expenditure, for both business and leisure, is discretionary, the travel industry tends to experience weak or reduced demand during economic downturns.
Unfavorable changes in the above factors or in other business and economic conditions affecting our customers could result in fewer reservations made through our websites and/or lower our net revenue margins, and have a material adverse effect on our financial condition and results of operations.
Since the beginning of the global financial crisis in the third quarter of 2008, adverse developments in the international financial markets have created challenging economic conditions for businesses and governments around the world. These adverse developments have included increased market volatility, tightened liquidity in credit markets, diminished expectations for economic growth and a reduction in consumer and business spending. While the global economy has grown since 2010, continued speculation regarding the stability of the Eurozone currency due to the inability of certain European countries to resolve their sovereign debt issues has created additional uncertainty in the European and global economies. Further, the Indian economy has recently experienced a slowdown in growth, exacerbated by the decline in the value of the Indian rupee, from Rs. 44.20 per $1.00 as of July 29, 2011 to Rs. 55.34 per $1.00 as of June 15, 2012. The weakness and uncertainty in the global and Indian economies have negatively impacted both corporate and consumer spending patterns and demand for travel services in general and may continue to do so in the future.
As an intermediary in the travel industry, a significant portion of our revenue is affected by fares and tariffs charged by our suppliers as well as volumes of sales made by us. During periods of poor economic conditions, airlines and hotels tend to reduce rates or offer discounted sales to stimulate demand, thereby reducing our commission-based income. A slowdown in economic conditions may also result in a decrease in transaction volumes and adversely affect our revenue. It is difficult to predict the effects of the uncertainty in global economic conditions. If economic conditions worsen globally or in India, our growth plans, business, financial condition and results of operations could be adversely impacted.
Our Processing, Storage, Use and Disclosure of Customer Data of Our Customers or Visitors to Our Website Could Give Rise to Liabilities As a Result of Governmental Regulation, Conflicting Legal Requirements, Differing Views of Personal Privacy Rights or Data Security Breaches.
In the processing of our customer transactions, we receive and store a large volume of customer information. Such information is increasingly subject to legislation and regulations in various jurisdictions and governments are increasingly acting to protect the privacy and security of personal information that is collected, processed and transmitted in or from the governing jurisdiction. We could be adversely affected if legislation or regulations are expanded or amended to require changes in our business practices or if governing jurisdictions interpret or implement their legislation or regulations in ways that negatively affect our business, financial condition and results of operations. As privacy and data protection become more sensitive issues in India, we may also become exposed to potential liabilities. For example, under the Information Technology Act, 2000, as amended, we are subject to civil liability for wrongful loss or gain arising from any negligence by us in implementing and maintaining reasonable security practices and procedures with respect to sensitive personal data or information on our computer systems, networks, databases and software. India has also implemented privacy laws, including the Information Technology (Reasonable Security Practices and Procedures and Sensitive Personal Data or Information) Rules, 2011, which impose limitations and restrictions on the collection, use and disclosure of personal information. Any liability we may incur for violation of such laws and regulations and related costs of compliance and other burdens may adversely affect our business and profitability.
We cannot guarantee that our security measures will prevent data breaches. Companies that handle such information have also been subject to investigations, lawsuits and adverse publicity due to allegedly improper disclosure of personally identifiable information. Security breaches could damage our reputation, cause interruptions in our operations, expose us to a risk of loss or litigation and possible liability, and could also cause customers and potential customers to lose confidence in the security of our transactions, which would have a negative effect on the demand for our services and products. Moreover, public perception concerning security and privacy on the Internet could adversely affect customers’ willingness to use our websites. A publicized breach of security in India or in other countries in which we have operations, even if it only affects other companies conducting business over the Internet, could inhibit the growth of the Internet as a means of conducting commercial transactions, and, therefore, the prospects of our business.
These and other privacy and security developments that are difficult to anticipate could adversely affect our business, financial condition and results of operations.
We Cannot Be Sure That Our Intellectual Property Is Protected from Copying or Use by Others, Including Current or Potential Competitors.
Our websites and mobile applications rely on content and in-house customizations and enhancements of third-party technology, much of which is not subject to intellectual property protection. We protect our logo, brand name, websites’ domain names and, to a more limited extent, our content by relying on copyrights, trademarks, trade secret laws and confidentiality agreements. Even with all of these precautions, it is possible for someone else to copy or otherwise obtain and use our content, techniques, and technology without our authorization or to develop similar technology. While our domain names cannot be copied, another party could create an alternative domain name resembling ours that could be passed off as our domain name. Effective trademark, copyright and trade secret protection may not be available in every country in which we operate, offline or through the Internet, and policing unauthorized use of our content and technological customizations is difficult and expensive. Our logo and brand name, “MakeMyTrip,” are only registered as trademarks in India, Mauritius, Canada, Indonesia, Bhutan, Nepal, Singapore, Taiwan and the United States and are not protectedregistered in other countries where we operate or otherwise. We have, however, applied for our trademark registration of our “MakeMyTrip” brand in several countries, including Canada, Australia, Singapore,Thailand, the United Arab Emirates, Malaysia and Sri Lanka. We have also applied for copyright registrationrecently registered copyrights of our logo and brand name “MakeMyTrip” in India. We have also applied for patents in India for certain aspects of our technological systems. Further, after our acquisitions of the Hotel Travel Group and the ITC Group in November 2012, we have filed trademark applications for the logos “HotelTravel” and “ITC” in Thailand, which are currently pending. We cannot be sure that our trademarks or domain names will be protected to the same extent as in India, Mauritius, Bhutan and the United Statescountries in which they are already registered or that the steps we have taken will prevent misappropriation or infringement of what we consider our proprietary information. Such misappropriation or infringement could have a material adverse effect on our business. In the future, we may need to engage in litigation to enforce our intellectual property rights, to protect our trade secrets or to determine the validity and scope of the proprietary rights of others. Such litigation might result in substantial costs and diversion of resources and management attention.
Our Business Experiences Seasonal Fluctuations and Quarter-to-Quarter Comparisons of Our Results May Not Be Meaningful.
Our business experiences seasonal fluctuations. We tend to experience higher revenue from our hotels and packages business in the second and fourth calendar quarters of each year, which coincide with the summer holiday travel season and the year-end holiday travel season for our customers in India and other markets. In our air ticketing business, we tend to experiencemay have higher revenues in the third and fourth calendar quartersa particular quarter arising out of each year and lower revenue in the first calendar quarter, mainly as a resultperiodic discounted sales of changes in demand for business travel.tickets by our suppliers. As a result, quarter-to-quarter comparisons of our results may not be meaningful.
Changing Laws, Rules and Regulations and Legal Uncertainties in India, Including Adverse Application of Corporate and Tax Laws, and Regulations, May Adversely Affect Our Business and Financial Performance.
OurThe regulatory and policy environment in which we operate is evolving and subject to change. Such changes, including the instances briefly mentioned below, may adversely affect our business, financial condition, results of operations and prospects, to the extent that we are unable to suitably respond to and comply with such changes in applicable law and policy.
The new Companies Act, 2013 and the rules thereunder, or the new Companies Act, contains significant changes to Indian company law, including in relation to the issue of capital by companies, related party transactions, corporate governance, audit matters, shareholder class actions and restrictions on the number of layers of subsidiaries. Moreover, companies exceeding certain net worth, revenue or profit thresholds are required to spend at least 2.0% of average net profits from the immediately preceding three financial years on corporate social responsibility projects, failing which an explanation is required to be provided in such companies’ annual reports. In addition, such companies are required to disclose their corporate social responsibility policies and activities on their websites. While several provisions of the new Companies Act are currently effective, the existing Companies Act, 1956 remains in effect with respect to other provisions. The timing for effectiveness of the remaining provisions of the new Companies Act is unclear. We may incur increased costs and other burdens relating to compliance with these new requirements, which may also require significant management time and other resources, and any failure to comply may adversely affect our business and results of operations.
The Government of India proposes to revamp the implementation of direct taxes through the introduction of the Direct Taxes Code, or DTC. The tax impact of the DTC on our business is currently unclear. The Government of India has also proposed a comprehensive national goods and services tax, or GST, regime that will combine taxes and levies by the central and state governments into a unified rate structure. Given the limited availability of information in the public domain concerning the GST, we are unable to provide any assurance as to the tax regime following implementation of the GST. The implementation of this new structure may be affected by any disagreement between certain state governments, which could create uncertainty. Any such future amendments may affect the overall tax efficiency of any company operating in India, and may result in significant additional taxes becoming payable.
The impact of any or all of the above changes to Indian legislation on our business cannot be fully determined at this time. Additionally, our business and financial performance could be adversely affected by unfavorable changes in or interpretations of existing, or the promulgation of new, laws, rules and regulations applicable to us and our business, including those relating to the Internet and e-commerce, consumer protection and privacy. Such unfavorable changes could decrease demand for our services and products, increase costs and/or subject us to additional liabilities. For example, there may continue to be an increasing number of laws and regulations pertaining to the Internet and e-commerce, which may relate to liability for information retrieved from or transmitted over the Internet or mobile networks, user privacy, content restrictions, taxation and the quality of services and products sold or provided through the Internet. Furthermore, the growth and development of e-commerce may result in more stringent consumer protection laws that may impose additional burdens on onlineInternet businesses generally. Any such changes could have an adverse effect on our business and financial performance.
The application of various Indian and international sales, use, occupancy, value-added and other tax laws, rules and regulations to our services and products is subject to interpretation by the applicable taxing authorities. Many of the statutes and regulations that impose these taxes were established before the growth of the Internet, mobile networks and e-commerce. If such tax laws, rules and regulations are amended, new adverse laws, rules or regulations are adopted or current laws are interpreted adversely to our interests, particularly with respect to occupancy or value-added or other taxes, the results could increase our tax payments (prospectively or retrospectively) and/or subject us to penalties and, if we pass on such costs to our customers, decrease the demand for our services and products. As a result, any such changes or interpretations could have an adverse effect on our business and financial performance. In recent years, we have received notices from the Indian tax regulatory authority for a demand of service tax on certain matters, some of which relate to the travel industry in India and involve complex interpretation of law. We have also received a notice and various assessment orders from the Indian income tax authorities. We have filed our replies in all such assessments based on the legal advice received by us. While we believe thatauthorities, to which we have strong cases in our favor, thereresponded. There can be no assurance that the Indian tax authorities will not take a different view. See “Item 8. Financial Information — A. Consolidated Statements and Other Financial Information — Legal Proceedings.”
Infrastructure in India May Not Be Upgraded in Order to Support Higher Internet Penetration, Which May Result in Additional Investments and Expenses for Us.
The majority of our bookings are made through our Indian website. However,website and our mobile offerings. According to the IAMAI’s forecasts, India’s Internet penetration in India was 10.2% asuser population is forecasted to reach 243 million by June 2014, more than 75% of December, 2011, accordingwhom are expected to primarily access the Internet World Stats.via mobile devices. There can be no assurance that Internet penetration in India will increase in the future as slowdowns or disruptions in upgrading efforts for infrastructure in India could reduce the rate of increase in the use of the Internet. As such we may need to make additional investments in alternative distribution channels. Further, any slowdown or negative deviation in the anticipated increase in Internet penetration in India may adversely affect our business and prospects.
Our Significant Shareholders Are Able to Exercise Significant Influence over Our Company and May Have Interests That Are Different from Those of Our Other Shareholders.
As of April 30, 2012,March 31, 2014, SB Asia Investment Fund II L.P., or SAIF, owned 31.85%owns 24.8% of the issued and outstanding shares of our company and each of T. Rowe Price (as defined in “Major Shareholders and Related Party Transactions”), Tiger Global (as defined in “Major Shareholders and Related Party Transactions”), Mr. Deep Kalra, owned 19.34%personally and 9.44%through Travogue (as defined in “Major Shareholders and Related Party Transactions”) and Wasatch Advisors Inc., beneficially own 21.7%, 17.5%, 8.9% and 8.4%, respectively, of the issued and outstanding shares of our company. By virtue of such significant shareholdings, these shareholders have the ability to exercise significant influence over our company and our affairs and business, including the election of directors, the timing and payment of dividends, the adoption and amendments to our Constitution, the approval of a merger or sale of substantially all our assets and the approval of most other actions requiring the approval of our shareholders. The interests of these shareholders may be different from or conflict with the interests of our other shareholders and their influence may result in the delay or prevention of a change of management or control of our company, even if such a transaction may be beneficial to our other shareholders.
Our Results of Operations Are Subject to Fluctuations in Currency Exchange Rates.
As the functional currency of MMT India, our key operating subsidiary, is the Indian Rupee, our exposure to foreign currency risk primarily arises in respect of our non-Indian Rupee-denominated trade and other receivables, trade and other payables, and cash and cash equivalents. Based on our operations in fiscal year 2012, a 10.0% appreciation of the US dollar against the Indian Rupee as of March 31, 2012, assuming all other variables remained constant, would have decreased our profit for fiscal year 2012 by $0.8 million. Similarly, a 10.0% depreciation of the US dollar against the Indian Rupee as of March 31, 2012, assuming all other variables remained constant, would have increased our profit for fiscal year 2011 by $0.8 million. Based on our operations in fiscal year 2011, a 10.0% appreciation of the US dollar against the Indian Rupee as of March 31, 2011, assuming all other variables remain constant, would have decreased our profit for fiscal year 2011 by $0.6 million. Similarly, a 10.0% depreciation of the US dollar against the Indian Rupee as of March 31, 2011, assuming all other variables remain constant, would have increased our profit for fiscal year 2011 by $0.6 million.
We are also exposed to movements between the US dollar and the Indian Rupee in our operations, as approximately 7.2% and 11.1% of our revenue for fiscal years 2011 and 2012, respectively, was generated by MMT India from its air ticketing business and received in US dollars although our expenses are generally incurred in Indian Rupees. Additionally, we receive revenue from our hotels and packages segment in Indian Rupees, but a portion of our expenses in this segment (those relating to outbound packages from India in particular) could be incurred in a non-Indian currency. We currently do not have any hedging agreements or similar arrangements with any counter-party to cover our exposure to any fluctuations in foreign exchange rates. While, we do incorporate margins in our pricing to cover any adverse fluctuations in foreign exchange rates, there can be no assurance that such margins will adequately protect us from adverse fluctuations in foreign exchange rates and hence our earnings remain susceptible to foreign exchange rate fluctuations.
Our Ability to Attract, Train and Retain Executives and Other Qualified Employees Is Critical to Our Business, Results of Operations and Future Growth.
Our business and future success is substantially dependent on the continued services and performance of our key executives, senior management and skilled personnel, particularly personnel with experience in our industry and our information technology and systems. Any of these individuals may choose to terminate their employment with us at any time and we cannot assure you that we will be able to retain these employees or find adequate replacements, if at all. The specialized skills we require can be difficult, time-consuming and expensive to acquire and/or develop and, as a result, these skills are often in short supply. A lengthy period of time may be required to hire and train replacement personnel when skilled personnel depart our company. Our ability to compete effectively depends on our ability to attract new employees and to retain and motivate our existing employees. We may be required to increase our levels of employee compensation more rapidly than in the past to remain competitive in attracting the quality of employees that our business requires. If we do not succeed in attracting well-qualified employees or retaining or motivating existing employees, our business and prospects for growth could be adversely affected.
Inaccurate Information from Suppliers of Hotel Room Inventory May Lead to Customer Complaints.
Our customers that purchase hotel room inventory online through our websites may rely on the description of the accommodation presented on such websites to ascertain the quality of amenities and services provided at the relevant accommodation. We receive information utilized in the accommodation description on our websites directly from the accommodation provider. To the extent that the information presented on our websites does not reflect the actual quality of amenities and services at the accommodation, we may face customer complaints that may have an adverse effect on our reputation and the likelihood of repeat customers, which in turn may adversely affect our business.
Risks Related to Operations in India
A Substantial Portion of Our Business and Operations Are Located in India and We Are Subject to Regulatory, Economic, Social and Political Uncertainties in India.
A substantial portion of our business and most of our employees are located in India, and we intend to continue to develop and expand our business in India. Consequently, our financial performance and the market price of our ordinary shares will be affected by changes in exchange rates and controls, interest rates, changes in government policies, including taxation policies, social and civil unrest and other political, social and economic developments in or affecting India.
The Government of India has exercised and continues to exercise significant influence over many aspects of the Indian economy. Since 1991, successive Indian governments have generally pursued policies of economic liberalization and financial sector reforms, including by significantly relaxing restrictions on the private sector. Nevertheless, the role of the Indian central and state governments in the Indian economy as producers, consumers and regulators has remained significant and we cannot assure you that such liberalization policies will continue. The rate of economic liberalization could change, and specific laws and policies affecting travel service companies, foreign investments, currency exchange rates and other matters affecting investments in India could change as well. A significant change in India’s policy of economic liberalization and deregulation or any social or political uncertainties could adversely affect business and economic conditions in India generally and our business and prospects.
As the Domestic Indian Market Constitutes a Significant Source of Our Revenue, a Slowdown in Economic Growth in India Could Cause Our Business to Suffer.
In fiscal years 2010, 20112012, 2013 and 2012, 94.7%2014, 82.8%, 92.8%85.7% and 82.8%83.2%, respectively, of our revenue was derived directly from sales by our subsidiary in India. The performance and growth of our business are necessarily dependent on economic conditions prevalent in India, which may be materially and adversely affected by political instability or regional conflicts, a general rise in interest rates, inflation, and economic slowdown elsewhere in the world or otherwise. The CIA World Factbook estimates that consumer inflation in India was 10.9%9.2% in 2009, 11.7%2012 and 9.6% in 2010 and 6.8% in 2011.2013. The Indian economy also remains largely driven by the performance of the agriculture sector which depends on the quality of the monsoon which is difficult to predict. The Indian economy has grown significantly over the past few years, although it has recently experienced an economic slowdown. In the past, economic slowdowns in the Indian economy have harmed the travel industry as customers have less disposable income for their travels, especially holiday travel. Any continued or future slowdown in the Indian economy or a further increase in inflation could have a material adverse effect on the demand for the travel products we sell and, as a result, on our financial condition and results of operations.
Trade deficits could also adversely affect our business and the price of our ordinary shares. India’s trade relationships with other countries and its trade deficit, driven to a major extent by global crude oil prices, may adversely affect Indian economic conditions. If trade deficits increase or are no longer manageable because of the rise in global crude oil prices or otherwise, the Indian economy, and therefore our business, our financial performance and the price of our ordinary shares could be adversely affected.
India also faces major challenges in sustaining its growth, which include the need for substantial infrastructure development and improving access to healthcare and education. If India’s economic growth cannot be sustained or otherwise slows down significantly our business and prospects could be adversely affected.
The Travel Industry in India is Susceptible to Extraneous Events Such As Terrorist Attacks and Other Acts of Violence, Which May Result in a Reduction in Travel Volumes to Affected Areas.
Terrorist attacks and other acts of violence or war involving India or other neighboring countries may adversely affect the Indian markets and the worldwide financial markets. As many terrorist attacks tend to be focused on tourists or tourist destinations, such acts may also result in a reduction in confidence in the Indian travel industry and could adversely impact our business and prospects. In addition, any deterioration in international relations between India and other countries may result in concerns regarding regional stability which could adversely affect the price of our ordinary shares. The occurrence of any of these events may result in a loss of business confidence and have an adverse effect on our business and financial performance.
South Asia has also experienced instances of civil unrest and hostilities among neighboring countries from time to time, including between India and Pakistan. There have also been incidents in and near India such as terrorist attacks and troop mobilizations along the border. Such military activity, terrorist attacks or other adverse social, economic and political events in India in the future could adversely affect the Indian economy by disrupting communications and making travel more difficult. Resulting political tensions could create a greater perception that investments in Indian companies involve a high degree of risk and could have an adverse impact on our business and the price of our ordinary shares. Furthermore, if India were to become engaged in armed hostilities, we might not be able to continue our operations. While we maintain insurance for losses arising from terrorist activities, our insurance policies do not cover business interruptions from terrorist attacks or for other reasons.
Natural Calamities Could Have a Negative Impact on the Indian Economy and Cause Our Business to Suffer.
India has experienced natural calamities such as earthquakes, tsunamis, floods and drought in the past few years. In December 2004, Southeast Asia, including bothFor example, in June 2013, the easternstate of Uttarakhand in northern India, a popular tourism destination, experienced widespread floods and western coasts of India, experienced a massive tsunami, and in October 2005, the State of Jammu and Kashmir experienced an earthquake, both of which events caused significant loss of life and property damage.landslides. The extent and severity of these natural disasters determines their impact on the Indian economy. Substantially all of our operations and employees are located in India and there can be no assurance that we will not be affected by natural disasters in the future. Furthermore, if any of these natural disasters occur in tourist destinations such as the tsunami in 2004 which affected the state of Kerala, a popular vacation destination in India, travel to and within India could be adversely affected, which could have an adverse impact on our business and financial performance.
Restrictions on Foreign Investment in India May Prevent Us from Making Future Acquisitions or Investments in India, Which May Adversely Affect Our Results of Operations, Financial Condition and Financial Performance.
India regulates ownership of Indian companies by foreigners, although some restrictions on foreign investment have been relaxed in recent years. These regulations and restrictions may apply to acquisitions by us or our affiliates, including MMT India and affiliates which are not resident in India, of shares in Indian companies or the provision of funding by us or any other entity to Indian companies within our group. For example, under its consolidated foreign direct investment policy, the Government of India has set out additional requirements for foreign investments in India, including requirements with respect to downstream investments by Indian companies, owned or controlled by foreign entities, and the transfer of ownership or control of Indian companies in sectors with caps on foreign investment from resident Indian persons or entities to foreigners. Further, India’s Foreign Exchange Management Act, 1999, as amended, and the rules and regulations promulgated thereunder, or FEMA, restrict us from lending to or borrowing from our Indian subsidiary. These requirements, which currently include restrictions on valuations and sources of funding for such investments and may include prior approval from the Foreign Investment Promotion Board, may adversely affect our ability to make investments in India, including through MMT India. There can be no assurance that we will be able to obtain any required approvals for future acquisitions or investments in India, or that we will be able to obtain such approvals on satisfactory terms.
We Are Subject to Governmental Regulations and Oversight in India, Including by the Reserve Bank of India, and Have Paid Penalties in the Past in Relation to Non-Compliance.
The Reserve Bank of India, or RBI, has prescribed certain requirements in connection with the acquisition and transfer of foreign securities by Indian residents and transfers and issuances of shares to foreigners. We have paid penalties to the Reserve Bank of India to remedy certain instances of non-compliance with respect to such requirements in the past. If we are not compliant with applicable Indian foreign exchange laws and regulations in the future, we may become liable to penalties or actions imposed by the Reserve Bank of India.
Our Business and Activities Are Regulated by the Competition Act, 2002.
The Competition Act, 2002, as amended, or the Competition Act, seeks to preventprohibits practices that could have an appreciable adverse effect on competition in India. Under the Competition Act, any arrangement, understanding or action, whether formal or informal, which causes or is likely to cause an appreciable adverse effect on competition withinin India is void and willmay result in substantial penalties and compensation to be subjectpaid to substantial penalties.persons shown to have suffered losses. Any agreement thatamong competitors which directly or indirectly determines purchase or sale prices, results in bid rigging or collusive bidding, limits or controls production, supply, markets, technical development, investment or createsthe provision of services, or shares the market sharingor source of production or provision of services in any manner, including by way of allocation of geographical area typeor types of goods or services or number of customers in the market, or which involves bid rigging is presumed to have an appreciable adverse effect on competition. Provisions relating to the regulation of certain acquisitions, mergers or amalgamations which have an appreciable adverse effect on competition and regulations recently issued by the Competition Commission of India with respect to notification requirements for such combinations became effective on June 1, 2011.
The effect ofFurther, the Competition Act onprohibits the business environmentabuse of a dominant position by any enterprise either directly or indirectly, including by way of unfair or discriminatory pricing or conditions in India is unclear. the sale of goods or services, using a dominant position in one relevant market to enter into, or protect, another relevant market, and denial of market access, and such practices are subject to substantial penalties and may also be subject to compensation for losses and orders to divide the enterprise.
If we or any member of our group, including MMT India, are affected, directly or indirectly, by the application or interpretation of any provision of the Competition Act or any enforcement proceedings initiated by the Competition Commission of India or any other relevant authority under the Competition Act or(or any other claim by any other party under the Competition ActAct) or any adverse publicity that may be generated due to scrutiny or prosecution by the Competition Commission of India or any other relevant authority under the Competition Act, including by way of financial penalties, our business, and financial performance and reputation may be materially and adversely affected.
Acquisitions, mergers and amalgamations which exceed certain revenue and asset thresholds require prior approval by the Competition Commission of India. Any such acquisitions, mergers or amalgamations which have an appreciable adverse effect on competition in India are prohibited and void. There can be no assurance that we will be able to obtain approval for such future transactions on satisfactory terms, or at all.
Our Investors May Be Subject to Indian Taxes on Income Arising Through the Sale of Our Ordinary Shares.
Recent amendmentsAmendments introduced in 2012 to the Income Tax Act, 1961, as amended, provide that income arising directly or indirectly through the sale of a capital asset, including any shares ofor interest in a company incorporated outside of India, will be subject to tax in India, if such shares deriveor interest directly or indirectly or directlyderive their value substantially from assets located in India, irrespective of whether the seller of such shares has a residence, place of business, business connection, or any other presence in India. The amendments do not define the term “substantially” or address the interplay between a tax treatythe double taxation avoidance agreements that India has entered into with other countries, and the Income Tax Act in the event of an indirect transfer of shares. Further, the applicability and implications of the recent amendments are largely unclear. If the Indian tax authorities determine that our ordinary shares derive their value substantially from assets located in India, our investors may be subject to Indian income taxes on the income arising directly or indirectly through the sale of our ordinary shares.
Risks Related to Investments in Mauritian Companies
As Our Shareholder, You May Have Greater Difficulties in Protecting Your Interests Than As a Shareholder of a United States Corporation.
We are incorporated under the laws of Mauritius. The laws generally applicable to United States corporations and their shareholders may provide shareholders of United States corporations with rights and protection for which there may be no corresponding or similar provisions under the Companies Act 2001 of Mauritius, as amended, or the Mauritius Companies Act. As such, if you invest in our ordinary shares, you may or may not be accorded the same level of shareholder rights and protection that a shareholder of a United States corporation may be accorded under the laws generally applicable to United States corporations and their shareholders. Taken together with the provisions of our Constitution, some of these differences may result in your having greater difficulties in protecting your interests as our shareholder than you would have as a shareholder of a United States corporation. This affects, among other things, the circumstances under which transactions involving an interested director are voidable, whether an interested director can be held accountable for any benefit realized in a transaction with us, what rights you may have as a shareholder to enforce specified provisions of the Mauritius Companies Act or our Constitution, and the circumstances under which we may indemnify our directors and officers.
We May Become Subject to Unanticipated Tax Liabilities That May Have a Material Adverse Effect on Our Results of Operations.
We are a Mauritius Category 1 Global Business Company and are tax resident in Mauritius. The Income Tax Act 1995 of Mauritius imposes a tax in Mauritius on the chargeable income of our company at the rate of 15.0%. However, under the Income Tax (Foreign Tax Credit) Regulations 1996 of Mauritius, subject to the Income Tax Act 1995 and the regulations under the Income Tax (Foreign Tax Credit) Regulations 1996, credit is allowed for foreign tax on the foreign source income of a resident of Mauritius against Mauritius tax computed by reference to the same income, and where credit is allowed against Mauritius tax chargeable in respect of any income, the amount of Mauritius tax so chargeable shall be reduced by the amount of the credit. Under the Income Tax Act 1995, “foreign source income” means income which is not derived from Mauritius and includes, in the case of a corporation holding a Category 1 Global Business LicenceLicense under the Financial Services Act 2007 of Mauritius, income derived from its transactions with non-residents or corporations holding a Category 1 Global Business LicenceLicense under the Financial Services Act. Subject to the provisions of the Income Tax (Foreign Tax Credit) Regulations 1996, no credit is allowed in respect of foreign tax unless written evidence is presented to the Mauritius Revenue Authority showing the amount of foreign tax which has been charged and forcharged. For this purpose, ���written“written evidence” includes a receipt of the relevant authorities of the foreign country for the foreign tax or any other evidence that the foreign tax has been deducted or paid to the relevant authorities of that country. However, pursuant to regulation 8 of the Income Tax (Foreign Tax Credit) Regulations 1996, if written evidence is not presented to the Mauritius Revenue Authority showing the amount of foreign tax charged on our company’s foreign source income, the amount of foreign tax shall nevertheless be conclusively presumed to be equal to 80%80.0% of the Mauritius tax chargeable with respect to that income and in such circumstance, the effective tax rate in Mauritius on our company’s chargeable income would be 3%3.0%.
Following amendments to the Financial Services Act 2007 of Mauritius pursuant to the Finance (Miscellaneous Provisions) Act 2010 in December 2010, Mauritius companies holding a Category 1 Global Business Licence,License, or GBC1, issued by the Financial Services Commission in Mauritius are permitted to conduct business both in and outside Mauritius (instead of outside Mauritius only). The operations of a GBC1 company in Mauritius will be subject to tax on chargeable income at the rate of 15%15.0% in Mauritius.
We hold two tax residence certificates issued Our company holds a specific Tax Residence Certificate for India, valid until May 4, 2015 and a general Tax Residence Certificate for all jurisdictions, valid until May 8, 2015, from the Mauritius Revenue Authority, as per the guidelines prescribed by the Mauritius Revenue Authority. These tax residence certificates are renewed annually and we have applied for their renewal and currently await the renewed certificates.
We believe that a significant portion of the income derived from our operations will not be subject to tax in countries in which we conduct activities or in which our customers are located, other than Mauritius, SingaporeIndia, the Netherlands, Malaysia, Thailand and India.Singapore. However, this belief is based on the anticipated nature and conduct of our business, which may change. It is also based on our understanding of our position under the tax laws of the countries in which we have assets or conduct activities. This position is subject to review and possible challenge by taxing authorities and to possible changes in law that may have retroactive effect. Our results of operations could be materially and adversely affected if we become subject to a significant amount of unanticipated tax liabilities.
Risks Related to Our Ordinary Shares
Investors May Have Difficulty Enforcing Judgments against Us, Our Directors and Management.
We are incorporated under the laws of Mauritius. Further, we conduct substantially all of our operations in India through our key operating subsidiary in India. The majority of our directors and officers, and some of the experts named in this annual report,Annual Report, reside outside the United States, and a majority of our assets and some or all of the assets of such persons are located outside the United States. As a result, it may be difficult or impossible to effect service of process within the United States upon us or those persons, or to recover against us or them on judgments of United States courts, including judgments predicated upon the civil liability provisions of the United States federal securities laws. An award of punitive damages under a United States court judgment based upon United States federal securities laws is likely to be construed by Mauritian and Indian courts to be penal in nature and therefore unenforceable in both Mauritius and India. Further, no claim may be brought in Mauritius or India against us or our directors and officers in the first instance for violation of United States federal securities laws because these laws have no extraterritorial application under Mauritian or Indian law and do not have force of law in Mauritius or India. However, a Mauritian or Indian court may impose civil liability, including the possibility of monetary damages, on us or our directors and officers if the facts alleged in a complaint constitute or give rise to a cause of action under Mauritian or Indian law. Moreover, it is unlikely that a court in Mauritius or India would award damages on the same basis as a foreign court if an action were brought in Mauritius or India or that a Mauritian or Indian court would enforce foreign judgments if it viewed the amount of damages as excessive or inconsistent with Mauritius or Indian practice or public policy.
The courts of Mauritius or India would not automatically enforce judgments of United States courts obtained in actions against us or our directors and officers, or some of the experts named herein, predicated upon the civil liability provisions of the United States federal securities laws, or entertain actions brought in Mauritius or India against us or such persons predicated solely upon United States federal securities laws. Further, there is no treaty in effect between the United States and Mauritius providing for the enforcement of judgments of United States courts in civil and commercial matters and the United States has not been declared by the Government of India to be a reciprocating territory for the purposes of enforcement of foreign judgments, and there are grounds upon which Mauritian or Indian courts may decline to enforce the judgments of United States courts. Some remedies available under the laws of United States jurisdictions, including remedies available under the United States federal securities laws, may not be allowed in Mauritian or Indian courts if contrary to public policy in Mauritius or India. Because judgments of United States courts are not automatically enforceable in Mauritius or India, it may be difficult for you to recover against us or our directors and officers or some experts named in this annual reportAnnual Report based upon such judgments. In India, prior approval of the Reserve Bank of India is required in order to repatriate any amount recovered pursuant to such judgments.
As a Foreign Private Issuer, We are Permitted to, and We Will, Follow Certain Home Country Corporate Governance Practices in Lieu of Certain Nasdaq Requirements Applicable to US Issuers. This May Afford Less Protection to Holders of Our Ordinary Shares.
As a foreign private issuer whose ordinary shares are listed on the Nasdaq Global Market, we are permitted to, and we will, follow certain home country corporate governance practices in lieu of certain Nasdaq Global Market requirements. A foreign private issuer must disclose in its annual reportsAnnual Reports filed with the Securities and Exchange Commission, or the SEC, each Nasdaq Global Market requirement with which it does not comply followed by a description of its applicable home country practice. As a company incorporated in Mauritius and listed on the Nasdaq Global Market, we currently intend to follow our home country practice with respect to the composition of our board of directors and nominations committee and executive sessions. Unlike the requirements of the Nasdaq Global Market, the corporate governance practice and requirements in Mauritius do not require us to have a majority of our board of directors to be independent; do not require us to establish a nominations committee; and do not require us to hold regular executive sessions where only independent directors shall be present. Such Mauritian home country practices may afford less protection to holders of our ordinary shares.
An Active or Liquid Trading Market for Our Ordinary Shares May Not Be Maintained and the Trading Price for Our Ordinary Shares May Fluctuate Significantly.
An active, liquid trading market for our ordinary shares may not be maintained in the long term and we cannot be certain that any trading market for our ordinary shares will be sustained or that the present price will correspond to the future price at which our ordinary shares will trade. Loss of liquidity could increase the price volatility of our ordinary shares.
Any additional issuance of ordinary shares would dilute the positions of existing investors in the ordinary shares and could adversely affect the market price of our ordinary shares. We cannot assure you that the price of our ordinary shares will not decline.decline below their prevailing market price. You may be unable to sell your ordinary shares at a price that is attractive to you.
The Sale or Availability for Sale of Substantial Amounts of Our Ordinary Shares Could Adversely Affect Their Market Price.
Sales of substantial amounts of our ordinary shares in the public market, or the perception that such sales could occur, could adversely affect the market price of our ordinary shares and could materially impair our future ability to raise capital through offerings of our ordinary shares.
As of March 31, 20122014, we had 37,159,60541,678,341 ordinary shares outstanding. Further, although certain of our share option holders are subject to restrictions on selling shares acquired upon the exercise of options, the majority of the options granted under our equity plan are freely exerciseable. All of the ordinary shares sold in our prior public offerings are freely tradeabletradable without restriction or further registration under the U.S.US Securities Act of 1933, or the Securities Act, unless held by our “affiliates” as that term is defined in Rule 144 under the Securities Act. Subject to applicable restrictions and limitations under Rule 144 of the Securities Act, all of our shares outstanding before our prior public offerings will be eligible for sale in the public market. If these shares are sold, or if it is perceived that they will be sold, in the public market, the trading price of our ordinary shares could decline. We cannot predict what effect, if any, market sales of ordinary shares held by our significant shareholders or any other shareholder or the availability of these ordinary shares for future sale will have on the market price of our ordinary shares.
Future Issuances of Any Equity Securities May Decrease the Trading Price of Our Ordinary Shares.
Any future issuance of equity securities could dilute the interests of our shareholders and could substantially decrease the trading price of our ordinary shares. We may issue equity or equity-linked securities in the future for a number of reasons, including to finance our operations and business strategy (including in connection with acquisitions and other transactions), to adjust our ratio of debt to equity, to satisfy our obligations upon the exercise of then-outstanding options or other equity-linked securities, if any, or for other reasons.
Our Holding Company Will Have to Rely Principally on Dividends and Other Distributions on Equity Paid by Our Operating Subsidiaries and Limitations on Their Ability to Pay Dividends to Our Holding Company Could Adversely Impact Shareholders’ Ability to Receive Dividends on Our Ordinary Shares.
Dividends and other distributions on equity paid by our operating subsidiaries will be our holding company’s principal source for cash in order for us to be able to pay any dividends and other cash distributions to our shareholders. As of the date of this annual report,Annual Report, MMT India has not paid any cash dividends on its equity shares. If our operating subsidiaries incur debt on their own behalf in the future, the instruments governing the debt may restrict their ability to pay dividends or make other distributions to our holding company. As our key operating subsidiary is established in India, it is also subject to certain limitations with respect to dividend payments.
Compliance with Rules and Requirements Applicable to Public Companies May Cause Us to Incur Additional Costs, and Any Failure by Us to Comply with Such Rules and Requirements Could Negatively Affect Investor Confidence in Us and Cause the Market Price of Our Ordinary Shares to Decline.
As a public company, we incur significant legal, accounting and other expenses. For example, we are required by Section 404 of the Sarbanes-Oxley Act of 2002 to include a report of management’s assessment on our internal control over financial reporting and an auditor’s attestation report on our internal control over financial reporting in our annual reportAnnual Report on Form 20-F. Effective internal control over financial reporting is necessary for us to provide reliable financial reports.
Complying with these rules and requirements may be difficult and costly for us. We have incurred and anticipate that we will continue to incur considerable costs and use significant management time and other resources in an effort to comply with Section 404 and other United States public company reporting requirements. We cannot predict or estimate the amount of additional costs we may incur or the timing of such costs. In addition, if we fail to comply with any significant rule or requirement associated with being a public company, such failure could result in the loss of investor confidence and could harm our reputation and cause the market price of our ordinary shares to decline.
We May Be Classified as a Passive Foreign Investment Company, Which Could Result in Adverse US Federal Income Tax Consequences to US Holders of Our Ordinary Shares.
Based on, among other things, the current and anticipated valuation of our assets and composition of our income and assets, we do not believe we were a passive foreign investment company, or PFIC, for US federal income tax purposes for our current taxable year ending March 31, 2012.2014 or will become a PFIC in the foreseeable future. However, the application of the PFIC rules is subject to uncertainty in several respects. In addition, a separate determination must be made after the close of each taxable year as to whether we were a PFIC for that year. Accordingly, we cannot assure you that we will not be a PFIC for our current taxable year or any future taxable year. A non-US corporation will be a PFIC for any taxable year if either (1) at least 75%75.0% of its gross income for such year is passive income or (2) at least 50%50.0% of the value of its assets (based on an average of the quarterly values of the assets) during such year is attributable to assets that produce passive income or are held for the production of passive income. For this purpose, we will be treated as owning our proportionate share of the assets and earning our proportionate share of the income of any other corporation in which we own, directly or indirectly, at least 25.0% (by value) of the stock. Because the value of our assets for purposes of the PFIC test will generally be determined in part by reference to the market price of our ordinary shares, fluctuations in the market price of the ordinary shares may cause us to become a PFIC. In addition, changes in the composition of our income or assets may cause us to become a PFIC. If we are a PFIC for any taxable year during which a US Holder (as defined in “Item 10. Additional Information — E. Taxation — US Federal Income Taxation”) holds an ordinary share, certain adverse US federal income tax consequences could apply to such US Holder. See “Item 10. Additional Information — E. Taxation — US Federal Income Taxation — Passive Foreign Investment Company.”
We May Be Treated as a “Foreign Financial Institution” Under the US Foreign Account Tax Compliance Act, Which May Impose Withholding Requirements on Payments on Our Ordinary Shares.
Provisions under the US Internal Revenue Code and Treasury Regulations thereunder, commonly referred to as “FATCA,” generally may impose 30.0% withholding on certain “withholdable payments” and “foreign passthru payments” (each as defined in the US Internal Revenue Code) made by a “foreign financial institution” (as defined in the US Internal Revenue Code) that has entered into an agreement with the IRS to perform certain diligence and reporting obligations with respect to the foreign financial institution’s US-owned accounts (each such foreign financial institution, a “Participating Foreign Financial Institution”). If we were treated as a foreign financial institution and if we become a Participating Foreign Financial Institution, to the extent payments on the ordinary shares are considered foreign passthru payments, such withholding may be imposed on such payments to any foreign financial institution (including an intermediary through which a holder may hold the ordinary shares) that is not a Participating Foreign Financial Institution or any other investor who does not provide information sufficient to establish that the investor is not subject to withholding under FATCA, unless such foreign financial institution or investor is otherwise exempt from FATCA. Under current guidance, the term “foreign passthru payment” is not defined and it is therefore not clear whether or to what extent payments on the ordinary shares would be considered foreign passthru payments, although IRS guidance has indicated that the definition of “foreign passthru payment” is intended to cover payments that are attributable to underlying US source income. Withholding on foreign passthru payments would not be required with respect to payments made before January 1, 2017. The United States has entered into intergovernmental agreements with certain non-US jurisdictions that will modify the FATCA withholding regime described above. It is not yet clear how the intergovernmental agreements will address foreign passthru payments and whether such intergovernmental agreements may relieve foreign financial institutions of any obligation to withhold on foreign passthru payments.
| ITEM 4. | INFORMATION ON THE COMPANY |
A. History and Development of our Company
Our company (Company No. 24478/5832) is a public company incorporated under the laws of Mauritius with limited liability on April 28, 2000 and we hold a Category 1 Global Business Licence issued by the Financial Services Commission in Mauritius. Our registered office is located at c/o Multiconsult Limited, Rogers House, 5 President John KennedyLes Cascades Building, Edith Cavell Street, Port Louis, Mauritius and the telephone number for this office is (230) 212 9800 and our principal executive office is located at Tower A, SP Infocity, 243, Udyog Vihar, Phase 1, Gurgaon, Haryana 122016, India and the telephone number for this office is (91-124) 439-5000. Our principal website address is www.makemytrip.com. Our other websites include www.makemytrip.ae; www.makemytrip.ca; www.makemytrip.com.sg; www.us.makemytrip.com, www.hoteltravel.com and www.easytobook.com. Information contained on our website, or the website of any of our subsidiaries or affiliates, is not a part of this annual report.Annual Report. Our agent for service in the United States is CT Corporation System, 111 Eighth Avenue,MakeMyTrip Inc., 60 East 42nd Street, Suite 2029, New York, New York 10011.NY 10165.
Founded by Mr. Deep Kalra, we commenced operations in 2000 and in the first five years following our inception, we focused on the non-resident Indian market in the United States, servicing mainly their need for United States-India inbound air tickets. We started our Indian business with the launch of our Indian website in September 2005.
As of March 31, 2010, our stated capital was $53,900,376.00, comprising 877,106 ordinary shares with a par value of $0.01 each and 616,223 preferred shares with a par value of $0.01 each, of which 328,863 preferred shares were designated Series A preferred shares, 148,315 preferred shares were designated Series B preferred shares and 139,045 preferred shares were designated Series C preferred shares. We effected a 20-for-one share split on July 22, 2010.
On August 17, 2010, we completed an initial public offering of 5,750,000 of our ordinary shares at $14.00 per share. All of our preferred shares were converted into 12,324,460 ordinary shares upon the completion of our initial public offering in August 2010.
As of March 31, 2011, our stated capital was $113,372,678.25, comprising 35,099,639 ordinary shares with a par value of $0.0005 each. On June 2, 2011, we completed a follow-on public offering of 5,244,000 of our ordinary shares at $24.00 per share. On June 29, 2011, in connection with our follow-on public offering, we completed an additional over-allotment offering of 350,000 of our ordinary shares at $24.00 per share.
On November 6, 2012, we issued 209,050 shares as a part of the initial consideration for the acquisition of the Hotel Travel Group.
On March 19, 2014, we completed a follow-on public offering of 5,500,000 of our ordinary shares at $23.00 per share and an over-allotment offering of 825,000 of our ordinary shares at $23.00 per share.
As of March 31, 2012,2014, our stated capital was $151,359,855.90,$ 231,869,798.86, comprising 37,159,60541,678,341 ordinary shares with a par value of $0.0005 each.
On April 22, 2014, we issued 38,656 shares as part of deferred consideration payable in relation to our acquisition of the Hotel Travel Group. These shares were issued from treasury shares held by us.
As of April 30, 2012,2014, our stated capital was $151,359,856.00,$231,869,798.88, comprising 37,159,81441,678,374 ordinary shares with a par value of $0.0005 each.
Recent Investments and Acquisitions
On May 9, 2011,In November 2012, we acquired an approximate 79% equitya 100.0% stake in Luxury Tours &the companies comprising the Hotel Travel Pte Ltd, a Singapore-based travel agency that provides hotel reservations, excursion tours and other related services to inbound and outbound travelersGroup. The Hotel Travel Group has been operating in Singapore and the region, in accordanceSoutheast Asia with the termswell-established brand “Hotel Travel” and through the website www.hoteltravel.com for over a decade with a presence in Malaysia, Thailand and Singapore. The total consideration payable to the promoters of the share purchase agreement dated February 9, 2011 entered into with Luxury Tours &Hotel Travel Pte Ltd and its existing shareholders. We paid cash consideration of approximately $3.0Group by us is $25.0 million, subject to working capitalan estimated balance sheet adjustment. On November 6, 2012, $10.0 million of this amount was paid in cash and $3.3 million in the form of our shares, after making an adjustment for a portion of the estimated balance sheet adjustment. We have agreed to pay the remaining consideration in the form of our shares, subject to a final adjustment, in accordancethree annual tranches, with the termsfinal tranche scheduled for January 2016. We believe the acquisition of the shareHotel Travel Group will help us further strengthen our presence in the hotels and packages segment in India and Southeast Asia.
In November 2012, we acquired a 51.0% stake in the ITC Group, a well-established hotel aggregator and tour operator in Thailand. The aggregate consideration we paid was (i) $2.2 million for the purchase agreement. We have further invested approximately $0.8of shares from the existing shareholders of the ITC Group, and (ii) $1.0 million duringfor the year ended March 31, 2012 for subscription of new equity shares in Luxury Tours & Travel Pte Ltd, thereby increasing our stake to approximately 83%.
We planof the ITC Group. As of March 31, 2014, we owned 51.0% of the ITC Group, and we expect to acquire the remaining shares of Luxury Tours & Travel Pte Ltdthe ITC Group from the existing shareholders in cash, payable in two additionalfour tranches, over an earn-out period ending June 2014. The earn-out will beDecember 2016, at a price based on a valuation linked to the future profitability of Luxury Tours & Travel Pte Ltd.the ITC Group and the employment status of the ITC Group’s promoter. We believe this acquisition will help us further expand our presence in Thailand, a key market for outbound holidays, by establishing more direct hotel relationships in the country.
On February 6, 2014, we completed our acquisition of the entire equity interest in a group of companies comprising the ETB Group. We purchased shares from the existing shareholders of the ETB Group and invested a further amount into the ETB Group. The total purchase consideration and investment in the ETB Group is approximately $4.4 million. The acquisition of the ETB Group is expected to further strengthen our existing travel technology platform and systems and to broaden the international hotel room offerings for customers travelling overseas, particularly to Europe which is a key tourist destination for Indians. We also intend to leverage this acquisition to build a position of strength inincrease travel between Europe, India and Southeast Asia, through relationshipsour expanded hotel and packages business which offer rooms in each of these key regions.
We have historically financed our capital expenditure requirements with local hotels and vendors.
In July 2011, we incorporated Luxury Tours (Malaysia) Sdn Bhd to further expand ourcash flows from operations, in Malaysia and adjacent markets. In August, 2011, Luxury Tours (Malaysia) Sdn Bhd became our wholly-owned subsidiary. To date, we have invested $168,000 in Luxury Tours (Malaysia) Sdn Bhd.
In August 2011, we acquired 19.9% of Le Travenues Technology Private Limited, which owns and operates www.ixigo.com, an online travel meta search engine. We paid cash consideration of $4.8 million for the purchase of new shares as well as vendor shares. SAIF,through the sale of our largest shareholder, acquired 56.7%convertible and redeemable preferred shares and ordinary shares and proceeds from our public offerings.
We made capital expenditures of Le Travenues Technology Private Limited$9.0 million, $6.9 million and $5.6 million in fiscal years 2012, 2013 and 2014, respectively. As of March 31, 2014, we had committed capital expenditures of $0.4 million for $13.7 million. We believe this investment could potentially complement our online travel business.
In November 2011, we acquired approximately 29%fiscal year 2015, substantially all of My Guest House, which is engaged in the business of aggregation, sales and distribution of hotel room inventory with a special focus on budget lodging accommodations and serviced apartments. Pursuant to our agreements with My Guest House, we expect to acquire 100%spend in India. In addition, we expect to spend an additional approximately $7.0 million to $9.0 million on capital expenditures during fiscal year 2015. Our capital expenditures have principally consisted of My Guest House’s ordinary shares through an earn out structure based upon the achievementpurchases of various business parameters spread over eight years.servers, workstations, computers, computer software, leasehold improvements and other items related to our technology platform and infrastructure, upgrading of our websites, as well as improvements to our leasehold premises.
For further details, see “Risk Factors — Risks Related to Us and Our Industry — We believe this investment could potentially complement our online travel business.
B. Business Overview
We are the largest online travel company in India, based on gross bookings for 2011,2012, according to PhoCusWright. Through our primary website, www.makemytrip.com, or MakeMyTrip.com, and other technology-enhancedmobile platforms, travelers can research, plan and book a wide range of travel services and products in India as well as overseas. Our services and products include air tickets, hotels, packages, rail tickets, bus tickets, car hire and ancillary travel requirements such as facilitating access to third-party travel insurance.insurance and visa processing. As of March 31, 2014, we provided our customers with access to all major domestic full-service and low-cost airlines operating in India and all major airlines operating to and from India, over 11,400 hotels and guesthouses in India and more than 170,200 hotels and properties outside India, Indian Railways and several major Indian and Singapore bus operators.
We commenced operations in 2000 and in the first five years following our inception, we focused on the non-resident Indian market in the United States, primarily servicing mainly their needits demand for United States-India inboundStates to India air tickets. We started our Indian business with the launch of our Indian website in September 2005. During the initial years ofWe currently target our operations, weservices and travel products to leisure travelers and corporate travelers who prefer to make their own travel arrangements through our online and offline sales channels.
We have invested significant capital in our infrastructure as well asand in sales and marketing efforts to build our brand and gain recognition, and we recorded net losses for alleach of our completed fiscal years. Inyears except for fiscal year 2008, our second full fiscal year since we commenced our Indian business, weyears 2011 and 2012. We recorded a net loss of $(18.9) million. We reduced our net losslosses in fiscal years 2009 and 2010 recording net losses of $(7.3) million and $(6.2) million, respectively, and recorded net profits of $4.8 million and $7.0 million, respectively, in fiscal years 2011 and 2012. We also reduced our operating loss in fiscal years 2009 and 2010, recording operating losses of $(10.6) million and $(6.0) million, respectively, and recorded operating profits of $4.1 million and $4.0 million, respectively, in fiscal years 2011 and 2012. Excluding the effects of employee share-based compensation costs, we would have recorded an operating loss of $(10.2) million in fiscal year 2009, and operating profits of $0.8 million, $4.6 million and $10.9 million, respectively, in fiscal years 2010, 2011 and 2012; and we would have recorded a net loss of $(6.9)$(27.6) million and $(20.9) million in fiscal year 2009,years 2013 and net profits of $0.6 million, $5.4 million and $13.9 million, respectively, in fiscal years 2010, 2011 and 2012.2014, respectively.
We believe the strength of our brand, quality of our services, user-friendliness of our website experience, focus on our customers and efficacy of our marketing programs have enabled us to capture a significant share of the domestic air tickets market in India, while driving increased bookingsincreasing online penetration of the primarily-offline international outbound air tickets market. In fiscal year 2010, 1.6 million transactionsticketing market in India. We have won a number of awards, including, most recently, the Best Travel Portal by CNBC Awaaz (2013), Most Innovative B2C Company at Travel Innovation Summit by PhoCusWright (2013) for domesticcreating consumer friendly technologies, and Best Travel Portal by Lonely Planet (2013). We have leveraged our leading market share in air tickets in India were booked through us, and we generated $31.1 million inour strong brand to rapidly diversify into the hotels and packages business which represented 37.6% of our revenue less service cost from our air ticketing business. Induring fiscal year 2011, 2.6 million2014 as compared to 31.3% in fiscal year 2013. The number of transactions for domestic air tickets in India wereand hotels and packages booked through us were 3.7 million and we generated $47.6 million343,141, respectively, in revenue less service cost from our air ticketing business. In fiscal year 2012, 3.53.8 million transactions for domestic air tickets in India were booked through us, and we generated $66.3 million in revenue less service cost from our air ticketing business. We leverage our strength in air travel to grow into non-air travel and other segments of the travel industry, specifically hotels and packages. Revenue less service cost from our hotels and packages business totaled $8.0 million568,133, respectively, in fiscal year 2010, accounting for 19.8% of our2013 and 4.0 million and 869,805, respectively, in fiscal year 2014. Our total revenue less service cost $10.9 million in fiscal year 2011, accounting for 17.9% of our total revenue less service cost, and $18.2was $88.2 million in fiscal year 2012, accounting for 20.7% of our total revenue less service cost.$88.2 million in fiscal year 2013, and $106.4 million in fiscal year 2014.
We haveOur websites are designed our websites to provide our customers with a user-friendly experience. According to comScore, www.makemytrip.com had an average of over 4.28.3 million unique visitors per month in fiscal year 2012. In fiscal year 2010, 2.02014 and an average of over 7.2 million transactions were executed through our websites, accounting for approximately 94.5% of our total transactions,unique visitors per month in fiscal year 2011, 3.6 million transactions were executed2013.
Our customers are now able to make bookings on our mobile site, http://m.makemytrip.com, and on major mobile platforms through our websites, accountingmobile applications for iPhone and Android, which allow bookings for Indian and international flights, hotels and holiday packages and Indian bus offerings, our mobile application for BlackBerry, which allows bookings for Indian domestic flights, and our Windows Mobile application, which allows bookings for Indian domestic flights and hotels. Our mobile traffic and transactions are increasing rapidly and our mobile customer base has increased from 23,365 as of March 31, 2012 to 327,892 as of March 31, 2014. As of March 31, 2014, our BlackBerry application, which was launched in early 2011, had been downloaded approximately 96.0% of our total transactions, and in fiscal year 2012, 4.9 million transactions were executed through our websites, accounting for approximately 95.9% of our total transactions.
We recently made significant improvements to our online hotel booking platform, which provide an enhanced user experience for researching and booking hotels on MakeMyTrip.com. Furthermore, we recently launched337,000 times, our Android application, which allows customers to book domestic flightswas launched in India, complementingApril 2012, had been downloaded approximately 1.5 million times, our existingiPhone application, which was launched in July 2012, had been downloaded approximately 682,000 times and our Windows Mobile application, which was launched in August 2013, had been downloaded approximately 238,000 times. As of March 31, 2014, we had 2.5 million mobile offerings, including our Blackberry application, and updated our mobile website, m.makemytrip.com, to provide an enhanced experience for Android and iPhone users.
We have built an advanced and secure technology platform, which integrates our sales, customer service and fulfillment operations. Our technology platform is scalable and can be upgraded to handle increased traffic and complexity of products with limited additional investment. As reported by The Economic Times on February 6, 2011,In the Indian middle class is expected to growpast, when multiple airlines have offered promotional rates, we have experienced peak traffic and our websites handled approximately 42,000 transactions and over three times from 160 million people currently to 547 million people by 2026.2,000,000 searches in our flights section a day. In order to meet the requirements of this growing Indian middle class travel market where Internet penetration is relatively low, we also utilize other technology-enhanced distribution channels, including call centers and travel stores in India, as well as our travel agents’ network in India.
We providehave made selective acquisitions to enhance our customers withhotel inventory in popular travel destinations for our user base and to gain access to all major domestic full-servicetechnology. Most recently, in February 2014, we acquired a group of companies headquartered in Amsterdam, Netherlands, operating through its website, Easytobook.com, which offers online hotel reservations in Europe, North America and low-cost airlines operating in India and all major airlines operating to and from India, more than 8,000 hotels and guesthouses in India and a wide selection of hotels outside India, Indian Railways and several major Indian and Singaporean bus operators. On the other hand, wekey global travel destinations. We believe we are a cost-effective distribution channel for our suppliers, providing reach to a large and expanding customer base in India as well as non-resident Indians.
In our air ticketing business, we generate revenue through commissions and incentive payments from airlines, service fees charged to our customers and fees from our GDS service providers. We primarily use Amadeus GDS. In our hotels and packages business, our revenue represents the total amount paid by our customers for these travel services and products and the cost of procuring the relevant services and products are classified as service cost. We evaluate our financial performance based on revenue less service cost, which is a non-IFRS measure, as we believe that revenue less service cost reflects more accurately the value addition of the travel services that we provide to our customers Our total revenue less service cost increased from $61.1 million in fiscal year 2011 to $88.2 million in fiscal year 2012.
We believe the overall Indian travel industry will experience continued growth due to income growth in India and the increased spending by Indians on travel and recreation. According to Internet World Stats, as of December 2011, Internet penetration was at 10.2% in India, making India the world’s third largest population of internet users after China and the United States, as compared with 78.3% in the United States. We therefore believe that the Indian online travel industry is well-positioned for long-term growth and that our well-recognized brand, leadership in the online travel market in India and broad and technology-enhanced distribution channels position us well to capitalize on these growth opportunities.
Furthermore, for two years in a row, MMT India has been ranked one of the top three best places to work among the top 500 companies in India, according to rankings published in 2010 and 2011 of “India’s Best Companies to Work For” by the Great Place to Work Institute, an independent global research and consulting firm, and The Economic Times, a daily business newspaper in India.
Our Strengths
We have the following competitive strengths:
The Largest Online Travel Company in India with a Well-Recognized Brand. Since commencing our travel business in India in 2005, we have become the largest company in the Indian online travel market with 47% of total market share, based on gross bookings for 2011,2012, according to PhoCusWright. In fiscal year 2010, 1.6 million transactions for domestic air tickets in India and 109,672 transactions for hotels and packages were booked through us. In fiscal year 2011, 2.6 million transactions for domestic air tickets in India and 175,869 transactions for hotels and packages were booked through us. In fiscal year 2012, 3.5 million transactions for domestic air tickets in India and 343,141 transactions for hotels and packages were booked through us. In fiscal year 2013, 3.4 million transactions for domestic air tickets in India and 568,133 transactions for hotels and packages were booked through us. In fiscal year 2014, 3.5 million transactions for domestic air tickets in India and 869,805 transactions for hotels and packages were booked through us. According to comScore, www.makemytrip.com had an average of over 4.28.3 million unique visitors per month in fiscal year 2012.2014 and an average of over 7.2 million unique visitors per month in fiscal year 2013. Based on data from the DGCA, we estimate that one in eight domestic air passengers in India booked their air ticket through our company in fiscal year 2014.
We believe that our brand is well-recognized in the Indian travel industry. In 2012, MakeMyTrip was named2013, we were voted the Best Indian Travel Portal by the readers of Lonely Planet Magazine India. In 2012, we were selected as the Best Travel Portal (Indian) by readers of Lonely Planet Magazine India and inFavourite Travel Portal by readers of Outlook Traveller magazine. In 2011, MakeMyTrip waswe were named the Best Online Travel Agency and Best Domestic Tour Operator by the Times of India. We were also the first and only online travel agency brand to be selected as a SuperbrandTM in India for 2009-2010. We have invested in developing and promoting our brand since our inception, using a combination of traditional channels such as print, radio and television, mass media campaigns, as well as search engine marketing and other innovative digital marketing tools, such as outreach through FacebookTM, LinkedInTM and other social media websites, viral marketing and online display banners, to broaden our reach to travelers in India and overseas. We also believe that our brand strength is responsible for allowing us to source a significant portion of our traffic from non-paid sources such as search engine results and direct traffic, as opposed to paid results, such as search engine marketing.
We believe that our reputation and market position have also provided us with better leverage when contracting with airlines, hotels and other suppliers.
Comprehensive Selection of Service and Product Offerings.We offer our customers a comprehensive selection of travel and travel-related services and products. We cater to the travel needs of residents in India as well as non-resident Indians and others traveling to India from the United States, Europe, Southeast Asia, the United Arab Emirates and other countries. Our services and products include air tickets, hotels, packages, rail tickets, bus tickets, car hire and ancillary travel requirements such as facilitating access to travel insurance and visa processing. We provideAs of March 31, 2014, we provided our customers with access to all major domestic full-service and low-cost airlines operating in India and all major airlines operating to and from India, more than 8,000over 11,400 hotels and guesthouses in India and a wide selection ofmore than 170,200 hotels and properties outside India, Indian Railways and several major Indian and SingaporeanSingapore bus operators. We also offer our customers accessOur selection of domestic hotels is diverse, with a number of choices for travelers from one-star to limited-time offers for hotels, holidays and flights at reduced rates on our special deals website, www.makemytripdeals.com.five-star offerings. We believe our comprehensive selection of travel services and products makes us a “one stop shop” for our customers’ travel needs and allows us to combine multiple products and provide customized packages that suit the unique needs of our customers.
Broad Distribution Network.We use a variety of technology-enhanced distribution channels to target the growing Indian middle class travel market, where Internet penetration is still relatively low. Our distribution network is centered on our India-focused website, www.makemytrip.com (which includes our US sub-domain website), our Southeast Asia-focused website, www.hoteltravel.com, our Europe-focused website, www.easytobook.com, our United Arab Emirates-focused website, www.makemytrip.ae, and our Canadian website, www.makemytrip.ca, our call centers, our airport counters and our various travel stores in 4243 cities in India as of April 30, 2012.March 31, 2014. As of April 30, 2012,March 31, 2014, we also had a network of over 12,000approximately 1,150 registered agents across approximately 1,000190 cities and towns in India who can access our business-to-business, or B2B, website enablingwhich enables them to sell our full suite of online travel services to their customers. We recently launchedOur customers are now able to make bookings on our mobile site, http://m.makemytrip.com, and on major mobile platforms through our mobile applications for iPhone and Android, which allow bookings for Indian and international flights, hotels and holiday packages and Indian bus offerings, our mobile application for BlackBerry, which allows bookings for Indian domestic flights, and our Windows Mobile application, which allows customers to bookbookings for Indian domestic flights in India, complementing our existing mobile offerings, including our Blackberry application, and updated our mobile website, m.makemytrip.com, to provide an enhanced experience for Android and iPhone users.hotels. Our broad distribution network gives us widespread access to travelers both in India as well as abroad.
Advanced, Secure and Scalable Technology Platform.We have built an advanced and secure technology platform, which integrates our sales, customer service and fulfillment operations. We have designed our websites to be user-friendly, providing our customers with extensive low pricelow-price options and alternative routings, as well as offering them combinations of flight and hotel bookings at cost effectivecost-effective rates. Our websites also enable our customers to find their right destinations easily by using colloquial names or major landmarks. We also recently made significant improvements to our online hotel booking platform, such as more flexible filters and an improved listing and details pages, which provide an enhanced user experience for researching and booking hotels on MakeMyTrip.com. In addition, we are in the processWe continue to focus on automation by making changes to our extranet to allow more of building a new hotel extranet, which we believe will improve operational efficiency for our team and the hotel suppliers whoto use our system.a self-service mode in managing their rates and inventory.
Our web-based booking engine has been designed to link to our suppliers’ systems either through “direct connects” or a GDS (we primarily use Amadeus GDS), and is capable of delivering real time availability and pricing information for multiple options simultaneously. In addition, we also provide extranet access to our hotel suppliers where they can update their rates, inventory and content on our websites.
Our technology platform in India is able to handle up to 13.0 million website requests and 8.5 million page views per day. This platform is scalable, and can be upgraded to handle increased traffic and complexity of products with limited additional investment. In the past, when multiple airlines have offered promotional rates, we have experienced peak traffic and our websites handled approximately 42,000 transactions and over 2.0 million searches in our flights section a day. We intend to continue to invest in mobile offerings and applications. Our ETB technology platform is able to handle up to 2.2 million website requests per day.
Customer-Focused Approach.We place significant emphasis on technology, personnel and training to improve our services to our customers. Our customers can choose from our various customer service channels to contact us, including web-based self serviceself-service or chat support as well as our toll-free call centers, our airport counters, our travel stores and e-mail. We have access to a large amount of customer data on account of our size, which allows us to optimize our online marketing and provide customized product offerings. Our mobile service platform also enables customers to receive e-tickets and flight alerts via text messages (SMS) on their mobile phones. We recently launchedOur customers are now able to make bookings on our mobile site, http://m.makemytrip.com, and on major mobile platforms through our mobile applications for iPhone and Android, which allow bookings for Indian and international flights, hotels and holiday packages and Indian bus offerings, our mobile application for BlackBerry, which allows bookings for Indian domestic flights, and our Windows Mobile application, which allows customers to bookbookings for Indian domestic flights in India, complementing our existingand hotels. In addition to being able to make different types of travel bookings on their smartphones and mobile offerings, including our Blackberry application,devices, customers can view their booking details, cancel bookings, request e-tickets, track refund status, check flight status, look for new deals and updated our mobile website, m.makemytrip.com,use location-based services to provide an enhanced experience for Android and iPhone users. We also made significant improvements to our online hotel booking platform whichfind nearby places of interest. Our websites provide an enhanced user experience for researching and booking hotels, on MakeMyTrip.com. We provideas well as valuable travel information not available on our websites,mobile site, such as flight status information, user-generated travel reviews and destination guides to help customers conduct research and make travel decisions. We haveOur website also addedincludes a new search tool for international flights called “Inspire” targeted towards leisure travelers. This tool recommends international destinations to customers based on their selected interests and budget, shows fare trends for the next few months and facilitates the purchase of flight tickets. We have also recently launched “RoutePlanner,” a socialservice on our website that helps users choose among various transportation options, including air, bus, rail and hired car, for travel between any two of over 4,000 cities in India. In addition, we have launched our “Holidays” application called “Tripalong” (www.tripalong.in), which allows air-travelers to shareon Windows 8 and synchronize theirour “Trip Ideas” application on Android and iPhone. Both of these applications are focused on helping users choose among various domestic and international travel itineraries using popular social networks, such as Facebook and LinkedIn.destinations.
We primarily outsource our call center operations and fulfillment process to IBM Daksh Business Process Services Private Limited, or IBM, iEnergizer IT Services, Intelenet Global ServicesSerco, InterGlobe Technologies Private Limited, or InterGlobe and Motif India Infotech in India, as we believe these experienced and reputable service providers are able to adhere to our customer service standards and enhance our service quality. We also have a dedicated in-house escalation service which operates 24 hours a day, seven days a week, and is responsible for addressing issues or complaints raised by our customers.
Experienced Management Team.We operate in an industry where we believe one of the most important assets is the quality of our people. Our senior management team is comprised of industry executives with significant experience in the travel industry, including online travel agencies, in India, the United States and the United Kingdom. Our management team also has in-depth experience in the Internet and information technology industries, having worked with companies such as GE Capital, Google, IBMKohler India, and CA Technologies, and in the consumer industry, including Pepsi. We also actively recruit MBA graduates and engineers from leading institutions in India to fill important management roles in our company.
Our Strategy
We believe that the relatively low but fast growing Internet penetration and mobile internet in India, coupled with income growth in India provide us with significant growth opportunities. Our objective is to grow profitably by building on our current leadership position to become India’s dominant travel company. The key elements of our strategy include:
Expand Our Hotels and Packages Business.Our hotels and packages business generally yields higher net revenue margins than our air ticketing business. Webusiness, and we intend to acquire or build technology platformscontinue shifting our business mix towards this segment. This will be done by proactively investing to gain further market share, through increasing automation, adopting new technologies and a deep customer focus. Our objective is to enable more hotel suppliers to be directly-connectedseamlessly connected to our various websites as this allows our supplierswith the latest methodologies which include direct connects, channel managers and direct integrations with various aggregators. We also continue to upload information about available rooms, services and rates directly from their central reservation systems onto our websites, as well as automatically confirm hotel reservations madefocus on automation by our customers on a real time basis. In fiscal year 2011, we launched a booking engine on our website that allows our customers to search and book some of our domestic holiday packages online, and we recently made significant improvementsmaking changes to our online hotel booking platform, which provide an enhanced user experience for researching and booking hotels on MakeMyTrip.com. As of April 30, 2012, only approximately 4.7%extranet to allow more of our hotel suppliers to use a self-service mode in India were directly-connectedmanaging their rates, inventory, content and payments. We are investing heavily on improving the customer experience by improving our offering on various devices (especially mobile and tablets) which the customers use to us. We believe that our Indian hotels and packages business will grow as more of our suppliers become directly-connected toconnect with us and as we expand our travel agents’ network in India. Therefore, we are in the process of building a new extranet, which we believe will improve operational efficiency for our team and hotel suppliers who use our system. Increasing the number of “direct connects” with our hotel suppliers will also allow us to reduce the costs of fulfillment associated with confirmations and reconfirmations of reservations made under our direct allocation arrangements.becoming more content focused. We also intend to grow our packages business outside India through strategic partnerships and acquisitions, as well as by strengthening our relationships with key aggregators from whom we procure inventory for our overseas packages. See “— Pursue Selective Strategic Partnerships and Acquisitions.”packages products.
Expand Our Service and Product Portfolio to Enhance Cross-Selling Opportunities.We believe that expanding our service and product offerings is an important means of customer acquisition as the diversity of our services and products will improve our offerings to customers, attract more customers to our websites and allow us to cross sell higher-margin services and products to them. We actively market additional travel services to our customers. For example, we market non-air services directly to customers after they have booked their air tickets with us.
We seek to continue expanding our travel offerings beyond core air tickets, hotels and packages to mass market products including bus rail and car hire.rail. We introduced the sale of bus tickets in 2008 and the sale of rail tickets in 2009. We commenced the provision of chauffeur-driven car hire services online in May 2010, which was followed by self-driven car hire services. Currently, we offer customers the ability to rent self-driven cars worldwide and chauffeur-driven cars in over 200 cities in India through partnerships with over 100 car vendors. Wealso provide car hire services through our fully automated car hire website, call centers and travel stores as a standalone product and also in conjunction with flight bookings, hotelour holiday package bookings and holiday package bookings.
Expand Our Travel Agents’ Network.We are focused on expanding our travel agents’ network in India, to enable more travel agents to gainother value-added ancillary services such as facilitating access to insurance and visa processing to enhance our B2B website. We are looking to leverage thesecustomers’ travel agents to increase the sale of our hotels and holiday package products. We have a dedicated call center to service requests and queries from these agents, and provide training to assist these agents in the operation of our B2B web-based booking system. As of April 30, 2012, we had a network of over 12,000 registered agents across approximately 1,000 cities and towns in India.experience.
Enhance Our Service Platforms by Investing in Technology.We intend to continue to invest in technology to enhance the features of our services and our platforms. For example, we plan to integrate our Indian domestic air ticketsvarious hotel booking system withsystems across our international air tickets booking system and allow cross fare class bookings in one transaction.various websites. We also intend to extend user feedback features to more products, enable more user-friendly bookings to be saved by our customers and used across all our services and products, enhance our mobile service platform to make mobile transactions more user-friendly and allow real time fingerprinting to prevent online credit card fraud. We intend to sell more of our holiday packages online in addition to selling through our call centers, which we believe will result in increasing our operating margins. We believe that our continued investments in technology will enable us to enhance our customer service and to capitalize on the expected growth opportunities in the online travel market in India. We recently launchedintend to continue to focus on increasing our Android application, which allows customersonline and mobile customer base. We intend to book domestic flightscontinue to invest in India, complementingmobile offerings and applications. We also intend to strengthen our BlackBerry application,focus on analytics, and updatedupgrading our mobile website, m.makemytrip.com, to provide an enhanced experience for Android and iPhone users.technology platform.
Expand into New Geographic Markets.We believe we are well positioned for growth in other overseas markets, particularly those with a significant non-resident Indian population as well as destinations with proximity to India and favored by Indian travelers.travelers, particularly popular regional destinations that are located within a five-hour flight from India. In December 2009, we launched our website, www.makemytrip.ae, in the United Arab Emirates, following, among other things, the registration of our website’s domain name with the relevant registry as well as the procurement of additional servers to handle the increased traffic from this new international website. The United Arab Emirates has a significant non-resident Indian population, and our website is intended to serve the travel needs of non-resident Indian travelers traveling from the United Arab Emirates and neighboring Middle Eastern countries to India as well as on their travels elsewhere. We further expanded our presence in the United Arab Emirates through the incorporation of a new wholly owned subsidiary, MakeMyTrip FZ LLC, in fiscal year 2013. We launched our Canadian website, www.makemytrip.ca, in July 2010 to serve the travel needs of the Indian residents there. We entered the Singapore market by acquiring Luxury Tours & Travel Pte. Ltd, Singapore, in May 2011. Further, inIn July 2011, we incorporated Luxury Tours (Malaysia) Sdn Bhd to expand our operations in Malaysia and adjacent markets. In August, 2011, Luxury Tours (Malaysia) Sdn Bhd becameNovember 2012, we expanded in Thailand and Southeast Asia through our wholly-owned subsidiary.acquisitions of the Hotel Travel Group and the ITC Group. In February 2014, we entered the European market by acquiring the ETB Group.
Pursue Selective Strategic Partnerships and Acquisitions.In addition to growing our business organically, we may also pursue strategic partnerships and targeted acquisitions that complement our service offerings, or strengthen or establish our presence in our targeted overseas markets. Our purchase of certain assets of Travis Internet Private Limited, which operated www.ticketvala.com, in March 2010 was a step in this direction for our bus network.markets or to gain access to technology. In May 2011,February 2014, we acquired approximately 79%100% of the ETB Group, which primarily operates through its website www.easytobook.com and offers its customers online hotel reservations in Europe, North America and other key global travel destinations. During fiscal 2013, we completed our acquisition of 100% of Luxury Tours, & Travel Pte Ltd, a Singapore-based travel agency which is engaged in the business of providing hotel reservations, excursion tours and other related services to inbound and outbound travelers in Singapore and the rest of Southeast Asia. Our stake has increased to approximately 83.0% pursuant to an additional investment in March 2012. In August 2011,November 2012, we acquired 19.9%100% of Le Travenues Technology Private Limited, which ownsthe Hotel Travel Group, a well-established travel company in Southeast Asia, especially Thailand, and operates www.ixigo.com, an online travel meta search engine.a 51% stake in ITC group, a well-established hotel aggregator and tour operator focused on Thailand. We expect to acquire the remaining shares of the ITC Group from its existing shareholders by December 2016. In November 2011, we acquired approximately 29% of MyGuestMy Guest House, which is engaged in the business of aggregation, sales and distribution of hotel room inventory with a special focus on budget lodging accommodations and serviced apartments. As of March 31, 2014, we hold 38.34% in My Guest House. In August 2011, we acquired 19.9% of Le Travenues Technology Private Limited, which owns and operates www.ixigo.com, an online travel meta search engine. We believe our existing technology platform will enable us to successfully and cost-effectively integrate our partners or new companies we acquire into our network and allow us to ensure our best practices are followed.
Our Services and Products
We offer a comprehensive selection of travel and travel-related services and products catering to the needs of residents in India and non-resident Indians and others traveling to India from the United States and other countries. We provide travelers with the tools and information they need to efficiently research, plan, book and purchase travel services and products in India as well as overseas. Our services and products include air tickets, hotels, packages, rail tickets, bus tickets, car hire and ancillary travel requirements such as visa processing and facilitating access to travel insurance. Our key customers include leisure travelers and small businesses.
Air Tickets
Our air tickets business is primarily targeted at domestic travel within India and international travel originating in India; and inbound travel to India from the United States and other countries.
Indian Domestic and Outbound Travel.We have experienced significant growth in our air ticketing business covering domestic travel within India and international travel from India since we commenced our Indian operations in 2005. The following table sets forth the number of transactions for air travel booked through us in this business in the last three fiscal years.recent prior periods.
| Number of Transactions | Number of Transactions | |||||||||||||||||||||||
| for Fiscal Year Ended March 31 | For fiscal year March 31 | |||||||||||||||||||||||
| 2010 | 2011 | 2012 | 2012 | 2013 | 2014 | |||||||||||||||||||
Indian domestic air travel | 1.6 million | 2.6 million | 3.5 million | 3.5 million | 3.4 million | 3.5 million | ||||||||||||||||||
Outbound air travel | 93,757 | 146,033 | 194,670 | 185,623 | 241,388 | 327,392 | ||||||||||||||||||
We provide our customers with a wide selection of airline tickets for all major domestic full-service and low-cost airlines operating in India, including Air India, Air India Express, Go Air, IndiGo, Airlines, Jet Airways, Kingfisher AirlinesSpiceJet and SpiceJet;Air Costa; and all major international flights that originate from cities in India, including Air India, British Airways, Emirates, Jet Airways, Lufthansa, Malaysia Airlines, Singapore Airlines, Thai Airways, FlyDubai, Air Asia, Etihad Airways, Kenya Airways, Qatar Airways, Virgin Atlantic, Malindo and Virgin Atlantic.Tiger Airways. We obtain inventory from these airlines either through a GDS (we primarily use Amadeus GDS) or via “direct connects” to the airlines’ booking systems.
We believe our websites provide comprehensive information to our customers in a time-efficient and unbiased manner. Customers are able to quickly and easily evaluate a broad range of potential fare and airline combinations through our user-friendly websites. Customers may search for flights based on their preferred travel dates, destinations, number of passengers, number of stops and class of travel, or may use our more advanced search tool and include additional search parameters. For example, on our Indian domestic flights, customers may include searches for night flights, specify a preference for direct flights, as well as include only certain airlines and only refundable fares. Our website then displays fare and flight offerings matching those specifications. Customers can also easily filter and sort the results of their search according to their preferences.
Inbound Travel to India.We began selling air tickets for the United States-to-India sector in 2000. Our customers are mainly non-resident Indians and persons of Indian origin traveling to India. Our customers may search and book their flights on our US sub-domain website, us.makemytrip.com, which is linked to our primary website, www.makemytrip.com, and uses a similar search and display interface as our primary website, and may also call our toll-free US hotline, 1800-INDIA-10. The total number of transactions for inbound air travel to India booked through us was 36,135 in fiscal year 2010,primarily from the United States and 47,765 in fiscal year 2011, and 42,129 in fiscal year 2012.
In December 2009, we launched our website in the United Arab Emirates www.makemytrip.ae, catering mainly to non-resident Indians traveling to India as well as on their travels to other countries. We intend to expand our businessthrough us was 78,348 in other markets outside India, particularly those with a significant non-resident Indian population as well as those with proximity to Indiafiscal year 2012, 109,877 in fiscal year 2013, and favored by Indian travelers. We launched our Canadian website, www.makemytrip.ca,154,996 in July 2010. Our Canadian website is currently owned by a company registered in Canada.fiscal year 2014.
Hotels and Packages
We introduced our hotels and packages business in 2005 and have since experienced significant growth in this area.area, including through the acquisition of the Hotel Travel Group in November 2012 and the ETB Group in February 2014. We also offer “Last Minute Deals” on our website and mobile applications to offer significant discounts to our customers on hotel bookings for same-day check-ins. The total number of transactions in our hotels and packages business was 109,672 in fiscal year 2010, 175,869 in fiscal year 2011, and 343,141 in fiscal year 2012.2012, 568,133 in fiscal year 2013, and 869,805 in fiscal year 2014.
Hotels.Through our websites, customers can search, compare and make reservations at more than 8,00011,400 hotels and guesthouses in India and more than 170,200 hotels and properties outside India, as of April 30, 2012, up from the more than 4,500 as of April 30, 2011, and a wide selection of hotels outside India.March 31, 2014. We procure room inventory from our hotel suppliers through three methods: “direct connects,allocation,” “direct allocation”connects” and, through third party aggregators, in the case offor most hotels outside India. As of April 30, 2012, approximately 4.7%India, through contracts with online travel agents and aggregators. Substantially all of our hotel suppliers were directly-connected to our booking system. Through these “direct connects,” our booking systems are integrated with the central reservations systems of the hotels and reservations to be made and confirmed on a real time basis. All our other hotel suppliersin India have a “direct allocation” arrangement with us whereby they allocate rooms directly to us either by managing their room inventory on an extranet provided by us, or through channel managers, or supported by us or via telephone. We do not assume any inventory risk for such “direct allocation” room inventory as unsold inventory is released to the hotels within an agreed period of time. The remaining hotels in India are connected through direct connects. “Direct connect” is the method by which our booking systems are integrated with the central reservations systems of the hotels and reservations made are confirmed on a real time basis, although this applies to a small proportion of our total hotels. Through our ongoing efforts to increase the automation of and otherwise improve our extranet, our hotel suppliers are now able to perform more of the necessary functions for executing transactions through our system without our direct involvement. We obtain inventory for most hotels outside India through contracts with other online travel agents and aggregators outside India. In some instances, in order to enjoy special negotiated rates for these hotels, we pre-purchase hotel room nights and assume inventory risk on them. We also own the travel website www.easytobook.com, which was acquired in February 2014 as part of our acquisition of the ETB Group. The room inventory on HotelTravel.com is also sold to MakeMyTrip.com customers. The provision of rooms at HotelTravel.com is predominantly accomplished through contracts with online travel agents and aggregators, outside India. Webut it also includes “direct connects”. MakeMyTrip.com’s inventory of hotel rooms is also sold through HotelTravel.com. In addition to the complete integration of the hotel room inventory available on HotelTravel.com and MakeMyTrip.com, we are also working to integrate the technological capabilities of both websites. For example, we are currently in the process of buildingmoving the hosting and monitoring of HotelTravel.com’s technology infrastructure to our Indian external data centers and team, and we expect to complete this transfer in fiscal year 2015. In addition, our internal team that operates 24 hours a new extranet, which we believeday, seven days a week monitoring the technology infrastructure of MakeMyTrip.com is in the process of taking on similar responsibilities with respect to HotelTravel.com. These and other planned integrations notwithstanding, certain business and sales functions of MakeMyTrip.com and HotelTravel.com will improve operational efficiencycontinue to be operated separately.
The customer base for MakeMyTrip.com is primarily residents in India and non-resident Indians and others traveling to India from the United States and other countries. The customer base for HotelTravel.com and Easytobook.com is global, spread across Japan, Europe, Australia and North America. With respect to our websites and apps, the focus of our technological improvement and sales efforts is on consolidating multiple supply sources and identifying the best rates possible for our teamcustomers. In addition, we have invested in multi-lingual products and the hotel suppliers who usemarketing, with in-house translation and customer service teams for twelve different languages. On our system.
Customerswebsites Makemytrip.com, HotelTravel.com, EasytoBook.com and through our applications on various mobile platforms, customers may search for hotels based on their destination, preferred dates for check-in and check-out, and may easily filter ourtheir search results by selecting star ratings, specific hotel chains and location.location etc. Customers can also indicate amenity preferences, such as business services, Internet access, fitness centers, swimming pools and travel assistance. Our “City Map View” also“View Map” offers customers the ability to compare hotel locations on an interactive neighborhood map. Customers can also preview the property by viewing hotel pictures and read hotel reviews from other MakeMyTrip customers on our website and on our travel community website, www.oktatabyebye.com. We recently made significant improvements to ourOur online hotel booking platform which provideprovides an enhanced user experience for researching and booking hotels on MakeMyTrip.com.the desktop and mobile devices.
Packages.We offer pre-packaged vacations designed by our in-house product specialists, under arrangements with various travel suppliers and our GDS service provider to cater to both individual and group travelers. Our packages also include various travel services such as travel insurance, visa processing, airport transfer and sightseeing.
| • | Domestic Packages.We offer a variety of packages, including escorted tours, honeymoon specials and weekend breakaways, as well as vacation themes, such as beach, adventure, family, pilgrimage, romantic, shopping, cruise and culture. Our demographic target for the “weekend breakaways” packages are corporate executives. |
For our customers travelling within India, our Indian website offers a flight plus hotel option, using a similar search and display interface as our separate air ticketing and hotels web-interface,websites, which enables customers to view multiple combinations of airlines and hotels to assemble a trip which satisfies his or her unique requirements. Our website allows customers to customize their trips by combining two or more travel products and selecting their desired air and hotel supplier, often at a discounted price, compared to booking the individual components separately.
| • | International Packages.We offer pre-designed independent packages, customized independent vacations, customized group tours and pre-designed escorted tours. The wide array of holiday options offered is intended to suit varying budgets and preferences of potential customers. |
| • | Meetings, Incentives, Conferences, Exhibitions and Events.Our MICE group offers services to organizations |
Other Services and Products
Rail Tickets.We introduced the sale of railway tickets in India in 2009 after entering into an agreement with IRCTC, which granted us “direct-connect” access to Indian Railways’ passenger reservation system online and enabled our customers to reserve and purchase Indian Railways tickets on a real time basis through our Indian website. Indian Railways is India’s state-owned railway which owns and operates most of India’s rail transport. We booked 185,948, 576,585838,429, 387,991, and 838,429245,542 transactions for rail tickets in fiscal years 2010, 20112012, 2013 and 2012,2014 respectively.
Using a customized search interface, our customers are able to quickly search for train tickets based on their preferred travel dates, destinations and class of travel. Our customized interface allows a customer to compare travel options across various trains, classes, dates and prices. The search results displayed are detailed and have been customized to suit the needs of local Indian railway users. For example, customers are able to see the wait list status for relevant train trips and are able to plan their travel accordingly. Like other products, customers can also easily filter the results of their search according to their specific preferences. However, as a result of Indian Railways’ regulations, although customers may search for rail tickets 24 hours a day and seven days a week, reservations may not be made between 8.00 a.m. and 10.00 a.m., and 11.30 p.m. and 12.30 a.m. India time.
Bus Tickets.We have agreements with several major Indian and SingaporeanSingapore bus operators, some of which are operators of multiple routes, as well as with aggregators and other intermediaries. Our bus tickets inventory is obtained through four channels: real time inventory from operators who are directly-connecteddirectly connected to our booking system; inventory from aggregators who are directly-connecteddirectly connected to our booking system; inventory from operators who manage their inventory on an extranet supported by us; and inventory obtained by agreement with operators where a certain number of tickets are pre-allocated to us or sold to us “on request.” We booked 57,529, 147,640309,726, 543,201 and 309,726645,001 transactions for bus tickets in fiscal years 2010, 20112012, 2013 and 2012,2014 respectively.
Customers can search for bus tickets based on their preferred travel dates and routes and our website will typically display numerous options for customers to choose from. We offer our customers basic information on the type of bus used on the relevant route and customers are able to select seats, choose from the available boarding points in the relevant city on the routes as well as obtain information on the location of the chosen boarding point.point among other details.
With the acquisition of certain assets of Travis Internet Private Limited (which operated www.ticketvala.com) in March 2010, we obtained access to a technology platform offering real time bus booking services, quotations and cost comparison, allowing last minute bookings as well, which we have integrated with our booking systems. We intend to leverage this platform to enable more bus operators to be directly-connected to our booking system to further expand our bus offering.
Car Hire.We introduced car hire services on our Indian website in May 2010. We currently offer customers the ability to rent self-driven cars worldwide and hire chauffeur-driven cars in over 200 cities in India through partnerships with over 100 car vendors. We provide car hire services through our fully automated car hire website, call centers and travel stores as a standalone product and also in conjunction with flight bookings, hotel bookings, and holiday package bookings.
Ancillary Services and Products
As an ancillary service offered to our customers, we provide our customers with the option to purchase travel insurance from Apollo Munich Health Insurance Company Limited, with whom we entered into a memorandum of understanding in April 2008. We facilitate access to this travel insurance through our Indian website, as well as via our call centers and travel stores. On our Indian website, prior to confirming and proceeding with the reservation of and payment for a flight or hotel, our customers are prompted to purchase such travel insurance. We also provide visa processing services, and sell telephone calling cards to our customers. In addition, we offer travel-related businesses and other third parties the opportunity to advertise on our websites.
Distribution Channels
We utilize a variety of technology-enhanced distribution channels to target the growing Indian middle class travel market, where Internet penetration is still relatively low. Our broad distribution network gives us access to Indians traveling domestically or overseas and also reaches non-resident Indians and others traveling inbound to India. Our distribution network uses a combination of our websites, call centers, airport counters and travel stores as well as our travel agents’ network in India and mobile service platform, giving us multiple channels to access these customers.
Our customers’ varied needs are served by different distribution channels. During fiscal year 2012,2014, over 96%93.4% of our sales of air tickets for travel in India were made through our website, and 3.2%,4.6% of our sales for air tickets, which were most oftencommonly for inbound travel, were made through our call centers. The majority ofOur sales of air tickets for outbound travel from India werehotel rooms are also primarily made through our website.websites. Our customers can book standard flight plus hotel packages on our websites, but the majority of the sales of packages within or outside India are concluded through our call centers, or travel stores.stores and travel agents’ network. All of our rail and bus ticket sales in India are made through our Indian website.
In fiscal year 2012,2014, transactions executed through our websites, call centers and travel stores accounted for approximately 95.9%93.4%, 3.1%4.6% and 1.0%2.0%, respectively, of our total transactions. Further, in fiscal year 2014, our mobile platforms contributed approximately 7.5% of the total transactions carried out through our websites. Our proportion of mobile transactions to total transactions has reduced compared to the previous fiscal year because of an increase in the number of transactions carried out through the ETB Group and Hotel Travel websites, which had relatively fewer transactions through their mobile platforms relative to MakeMyTrip.
Internet Websites
We currently operate the websites www.makemytrip.com (including the sub-domain us.makemytrip.com), www.makemytrip.ae, www.makemytrip.com.sg and www.makemytrip.ca servicing the Indian domestic and outbound market, the United States-India inbound market (focusing in particular on non-resident Indians in the United States), the United Arab Emirates as well as neighboring Middle East countries, Singapore and neighboring Southeast Asian countries and the Canada-India market, respectively. Our Canadian website, www.makemytrip.ca,We have tailored www.makemytrip.com and its content to our predominantly Indian user base. For example, we have localized our top-selling hotel webpages with information and using language that we believe would be more attractive and relevant to an Indian user. We also own the travel websites HotelTravel.com, which was acquired as part of our acquisition of the Hotel Travel Group in November 2012, and EasyToBook.com which was acquired as part of our acquisition of ETB Group in February 2014. HotelTravel.com’s inventory is also sold to MakeMyTrip.com customers. Similarly, MakeMyTrip.com’s inventory of hotel rooms is also sold through HotelTravel.com. In addition to the complete integration of the hotel room inventory available on HotelTravel.com and, we are also working to integrate the technological capabilities of both websites. For example, we are currently owned byin the process of moving the hosting and monitoring of HotelTravel.com’s technology infrastructure to our Indian external data centers and team and we expect to complete this transfer in fiscal year 2015. In addition, our internal team that operates 24 hours a company registeredday, seven days a week monitoring the technology infrastructure of MakeMyTrip.com is in Canada.the process of taking on similar responsibilities with respect to HotelTravel.com. These and other planned integrations notwithstanding, certain business and sales functions of MakeMyTrip.com and HotelTravel.com will continue to be operated separately. In addition, we also operate www.makemytripdeals.com,own the travel website www.easytobook.com, which provideswas acquired in February 2014 as part of our acquisition of the ETB Group. Through the website, customers with access to limited-time offers forcan search, compare and make reservations at approximately 170,200 hotels holidays and flights at reduced rates,properties internationally and www.tripalong.in, which allows air-travelers to share and synchronize their travel itineraries using popular social networks.in India. Our websites have been designed to provide a user-friendly experience to our customers and are reviewed and upgraded from time to time.
In March 2010, we acquired certain assets of Travis Internet Private Limited, an online bus ticket company in India. As part of this acquisition, we acquired the website www.ticketvala.com, which enables customers to obtain quotations and book bus tickets online on a real time basis, which we have integrated with our booking system and our Indian website.
Using our websites, customers can easily and quickly review the pricing and availability of nearly all our services and products, evaluate and compare options, and book and purchase such service and products online within minutes.online. We have also designed our websites to offer personalized recommendations and offers based on a customer’s history. In addition, we have self-service customer support modules on our websites to let our customers check their refund status, modify or cancel reservations and view their travel itineraries. Customers can also purchase ancillary travel-related services and products, such as travel insurance as part of the booking process. Certain packages for MICE or other customized packages cannot be purchased online although customers can submit inquiries through our websites and our sales representatives will contact such customers to follow up and process the transaction, if required. We have introduced self-service customer support modules on our websites to let our customers check their refund status, modify or cancel reservations and view their travel itineraries.
Typically, a transaction on our websites involves the following steps:
Search.A customer conducts a search for a particular product, or combination of products (for example, flight plus hotel), on our websites by defining desired parameters. For example, for domestic Indian flights, apart from the city of departure and destination, number of travelers and dates of travel, our customers can also input additional parameters such as preferred cabin class, preferred airlines, refundable fares and direct flights. Our websites’ search capabilities employ scalable search and routing logic that we believe return comprehensive results without sacrificing search response times or creating added stress on our suppliers’ infrastructure. Our search results are generated in a cost-effective and time-efficient manner, since over 80% of our search results come from cache. Our web-based booking engine, which has been designed to link to our suppliers’ systems either through “direct connects” or a GDS (we primarily use Amadeus GDS), allows us to deliver real time information.
In addition, we also provide extranet access to our hotel suppliers where they can update their rates, inventory and content on our websites.Select.At this stage, our websites display to the customer various possible selections that are available in a user-friendly format, and also prompt the customer with available special offers or provide additional information about the product. Our websites are enabled with asynchronous JavaScript and extensible markup language allowing customers to sort or refine search results by further defining certain parameters such as price range, time range, preferred airlines and availability of refunds for air tickets, and star rating, preferred hotel chains and hotel amenities.
Review.After a customer has selected a particular option, our websites will provide the customer with an opportunity to review the details of the product being purchased and the terms and conditions of such purchase. At this stage, our websites connect to the Amadeus GDS or the websites of our travel suppliers to confirm the availability and pricing of the product selected, and in the event the customer’s choice is not available, the customer will be informed of the next-best alternative to the selected product. Customers booking air tickets or hotels will also be shown options to purchase travel insurance and other related ancillary services.
Payment.We offer our customers a variety of payment methods. On our Indian website, customers may pay in Indian Rupees with credit cards, debit cards issued by several major banks in India (including Citibank, ICICI Bank, HDFC Bank, State Bank of India and AXIS Bank), bank transfers or cash cards. We also offer cash-on-delivery for select travel products and partial payment options for large value transactions. The payment gateway for sales on our Indian website is secured by “Verified by VISA”, “MasterSecure” and “American Express SafeKey”. On our US website, customers may pay in US dollars with credit cards or through Paypal.PayPal. On our United Arab Emirates website, customers may pay in United Arab Emirates Dirham with credit cards. The payment gateway for sales on our Indian website is secured by “Verified by VISA”On HotelTravel.com and “MasterSecure.”Easytobook.com, customers may pay in multiple currencies with credit cards.
In order to simplify the booking process for our customers, our websites do not require prior customer registration in order for the purchase to be completed. Customers who do not wish to register will simply be prompted prior to payment to provide basic contact details (including their name, telephone number and e-mail address) for purposes of the travel product they intend to purchase. An electronic confirmation is sent to the customer’s e-mail address and customers can also use TripAssist on our websitesself-service web-support, TripAssist, to check their flight or train details, print e-tickets and cancel flight and rail bookings and track progress of refunds.
Call Centers
Our in-house call centers, which mainly handle our sales and post-sales customer service support for our international hotels and packages business as well as domestic Indian packages with more complicated itineraries, are run out of Gurgaon in India. TheseIndia, as well as out of Singapore and Thailand. Our call centers in India operate 24 hours a day, seven days a week and customers can call these centers through various toll-free numbers in India to consult with our sales representatives, receive comprehensive, real time hotel and package information, and make travel bookings. As of April 30, 2012,March 31, 2014, we employed approximately 84131 sales representatives, including supervisors, in all of our in-house call centers, as compared with approximately 94 sales representatives as of March 31, 2009. This decline in numbers of sales representatives was primarily due to outsourcing.centers. All of our sales representatives in India participate in a formal four-week training program before commencing work and have an in-depth knowledge of their relevant local market. Our sales representatives are also trained and updated with our new services and products.
To achieve cost efficiencycost-efficiency and scalability, we utilize various third partythird-party vendors in India to manage our call center service and we outsource our call center service for sales and service for all international flights (both inbound to India and outbound from India), and most of our hotel reservations and packages to such vendors. Our outsourcing service providers also handle our post-sales customer service support for all flights (domestic and international), hotel reservations and packages, and rail and bus ticketing, as well as back office fulfillment and ticketing services. Our key outsourcing service providers are IBM, iEnergizer IT Services, Intelenet Global ServicesSerco, InterGlobe and Motif India Infotech in India, where agents provide both English and Hindi language options to our customers. We believe these experienced and reputable service providers are able to adhere to our customer service standards and enhance our service quality. Our agreementsagreement with IBM and iEnergizer IT Services provideprovides our customers the optionsoption of using Gujarati and Tamil respectively, for their transactions. Our agreement with IBM has been transferred to another party which has acquired IBM’s business process outsourcing business. However, the business process outsourcing business will continue to operate under the IBM name. These external call centers also operate 24 hours a day, seven days a week. In aggregate, we had 1,1161,168 external sales and service agents from IBM, iEnergizer IT Services, Intelenet Global Services andSerco, InterGlobe, Motif India Infotech and other providers constituting our outsourced call center sales and service force as of April 30, 2012, compared to 232 as of March 31, 2009.2014. In addition, we also have 10 agents located at our outsourced call centers that handle customer service for any post-sale issues or queries for Easytobook.com. Our external agents must undergo a formal four-week training program as well as periodic refresher training courses in order to understand our processes and systems and be able to effectively service our customers.
All our call centers are equipped with our enterprise resource planning, or ERP, application, allowing our sales representatives and agents to make bookings and create packages, as well as attend to customer requests. These centers are also linked to our CRM system which enables us to monitor the performance of our sales representatives and outsourced agents on a round-the-clock basis. We also have software that enables us to log on to customer calls enabling us to perform random checks on our call centers on a real time basis. Our system also enables us to monitor the number of waiting calls and limit customer abortedcustomer-aborted calls on our hotlines due to unacceptably long waiting times. We have an in-house quality team which monitors the quality of our call center transactions, including the tone and voice of our customers, in order to ensure high quality service is consistently offered to our customers.
Travel Stores
As of April 30, 2012,March 31, 2014, we had 2220 company-owned travel stores in 18 cities, including one in our office in Gurgaon, in 21 cities and 3435 franchisee-owned travel stores in 30 cities, including metropolitan areas across India, which primarily sell packages. We also hadpackages in 31 cities, and counters in threefour major airports in India. We started our franchisee network in 2009 with six stores and initiated a major expansion in 2011, when we added 25 additional stores.2011.
At all of our travel stores, customers can consult with our sales representatives, receive comprehensive, real time flight, hotel and package information as well as information for other services and products, and make travel bookings, without prior appointment. Unlike agents in our travel agents’ network described below, agents in our travel stores sell our products exclusively. All our travel stores are also equipped with our ERP application and linked to our CRM system. We believe that our travel stores are important for our overall growth as they represent a direct interface between our customers and us, in addition to giving us access to customers who still prefer to meet representatives to make their travel bookings.
The experience for a customer in all our travel stores, including those owned and operated by franchisees, is substantially similar because all our travel stores are operated according to the same guidelines, as required in our contractual arrangements with our franchisees. In addition to providing our franchisees with the use of our ERP application, links to our CRM system and a license to use our brand, we also make frequent on-site visits and provide other technical operational support to our franchisees. In exchange, we receive a fixed non-refundable fee and a share of revenues from all sales made by our franchisee-owned stores. The fee amounts and revenue-sharing rates are negotiable depending on the location of the store and other factors. In general, we encourage our franchisees to adapt their businesses to meet the demands and needs of their local market and customers.
Travel Agents’ Network
We have a travel agents’ network in India which we started in 2009 to enable registered agents to access our B2B website and sell our full suite of online travel products to their customers.customers, although access is now only available for our hotels and packages products. As of April 30, 2012,March 31, 2014, we had a network of over 12,000approximately 1,150 registered agents across approximately 1,000190 cities and towns in India. Our B2B website uses a similar interface as our external customer-facing websites and we were able to launch our B2B platform in a few months by leveraging technology already being used by us for our customer-facing websites. We believe our network is attractive to travel agents as we provide access to a range of travel services and products which such agents may not otherwise be able to access cost-effectively or at all. These travel agents earn commissions from us depending on the volume and type of travel services and products sold. Furthermore, our travel agents’ network allows us to expand our footprint in India and distribution network in a cost-effective manner.
Mobile
In 2008, we launched our mobile service platform. Our mobile services allow customers to search, book and pay for Indian domestic air tickets on their mobile phones at no additional cost. The tickets and bookings are delivered through email and SMS. Apart from flightIn 2012, we extended our mobile services to allow customers to book domestic hotels, buses and holiday packages on mobile and updated our mobile site, http://m.makemytrip.com, with touch-optimization and a better design and user interface for Android and iPhone users.
In addition to our basic and touch mobile sites accessible at http://m.makemytrip.com, our mobile services are available through our BlackBerry application, which was launched in early 2011, our Android application, which was launched in April 2012, our iPhone application, which was launched in July 2012 and our Windows Mobile application, which was launched in August 2013. Our mobile applications registered more than 2.7 million cumulative downloads as of March 31, 2014.
Our customers are now able to make bookings on our mobile site, http://m.makemytrip.com, and on major mobile platforms through our mobile applications for iPhone and Android allow bookings for Indian and international flights, hotels and holiday packages and Indian bus offerings, our mobile application for BlackBerry allows bookings for Indian domestic flights, and our Windows Mobile application allows bookings for Indian domestic flights and hotels. In addition to being able to make different types of travel bookings on their smartphones and mobile devices, customers can view their booking details, cancel bookings, request e-tickets, and track refund status, on their mobile devices. Customers can also check flight status, look for new deals and use location-based services to find nearby places of interest. Currently, BlackBerry users can access MakeMyTrip mobile offerings through our BlackBerry application, which allows customers to book domestic flights in India and automatically synchronizes the flight details with the calendar on their BlackBerry devices. As of April 30, 2012, there had been more than 150,000 downloads of this application. Customers with reserved tickets, whether booked through a desktop computer or a mobile device, have the ability to access flight information or cancel reservations through this application.
In April 2012, we launched a similar mobile application for Android devices. As of April 30, 2012, there have been nearly 12,000 downloads of this application. We are in the process of developing a similar mobile application for the iPhone, which we plan to launch in the second quarter of fiscal year 2013. We also plan to increase the scope of services available on smartphones and other mobile devices. We also intend to increase the penetration and usage of our mobile offerings by targeting more mobile service platforms in the future. We recently updated our mobile website, m.makemytrip.com, with touch-optimization and a better design and user interface for Android and iPhone users, which lets customers search and book flights using different smartphone browsers.
Technology and Infrastructure
General
We benefit from an advanced technology platform which we believe has a high level of reliability, security and scalability, and which has been designed to handle high transaction volumes across all our websites on shared infrastructure. We operate our technology platform through two external data centers in India, one housedlocated in Mumbai and one housedlocated in Chennai, one external data center located in Singapore, which we are in the process of shutting down, and one internal data center in our office in Gurgaon. Our Indian external data centers run together in “active-active” mode so that each serves approximately half of our website traffic at any given time. The Singaporean external data center primarily serves our HotelTravel.com business with critical data replicated to our Indian external data centers, although we are currently in the process of moving the hosting of HotelTravel.com’s technology infrastructure to our Indian external data centers and it is expected to be completed by the end of June 2014. Our internal data center runs independently and serves all the data needs of our internal operations, such as e-mail.
In the event one of our Indian external data centers shuts down, our other Indian external data center will automatically take over for it. This capability helps us to ensure business continuity and minimize potential damage in the event of a disruption. Our technology system in India is capable of handling up to 13.0 million website requests a day and 8.5 million page views per day.
To further support business continuity, our Indian external data centers are able to replicate and synchronize data from each other on a continuous basis, which effectively allows them to back up each other’s data. In addition, all data is backed up on a weekly basis on tapes. These tapes are kept at a safe and secure location outside the data centers.
Our technology infrastructure is monitored by an internal team that operates 24 hours a day, seven days a week and is assisted by an outsourced security monitoring and engineering support team that also operate 24 hours a day, seven days a week. All our servers installed at our data centers and at our offices are also secured with firewalls.
We have the ability to scale our technology platform up and down to meet our needs without incurring substantial costs through the use of virtual machines and infrastructure when required. Our technology stack is also modular and can be easily modified for multiple lines of business.
We believe we have core technology advantages in multiple areas, including:
website logic that simplifies and improves our customers’ ability to book a trip most suited to their requirements, including providing extensive low pricelow-price options and alternative routings, and assisting customers in finding their destinations easily by using colloquial names or major landmarks;
website availability on a variety of mobile platform,platforms, including IOS,iPhone, Android, BlackBerry and Blackberry;
scalable search and caching technologies that return comprehensive results and allow us to provide more flight and hotel options to our customers without sacrificing search response times or creating added stress on our suppliers’ operating or cost infrastructure;
capability to combine various flight plus hotel options, offering our customers the ability to see multiple combinations of airlines and hotels to assemble a package, resulting in trips that are frequently less expensive than individually booked components and more flexible for theour customers;
social engagement platform that allows our customers to connect to their virtual friends through our site, using various sharing options from external social networks, or through our standalone social application, “Tripalong”;networks; and
capability to monitor the more than 10,000 unique system, application, network, security and business metrics that make up our technology platform, including the capability to generate advanced reports and alerts related to this data.
Fully Integrated Technology Platform
Our CRM system in India uses software by Oracle RightNowTM CRM, which integrates our sales, customer service and fulfillment operations. Our web-enabled centralized booking system in India enables our customers and B2B partners to search and book travel services and products we sell and provide on a real time basis. We also have “Verified by VISA”, “MasterSecure” and “MasterSecure”“American Express SafeKey” payment gateways, which provides additional security for transactions via our Indian website using credit cards and debit cards issued by Indian institutions. We also offer payment options via netbanking and other instruments.
Our system also allows us to provide high quality customer service by promptly processing customer inquiries and requests and by monitoring the performance of our sales and customer service representatives and our outsourced call center sales force on a round-the-clock basis. Our system also enables us to monitor the number of waiting calls and limit aborted calls on our hotlines due to long waiting time.
We integrate our ERP application (which uses Microsoft DynamicsTM) with our CRM system which enables our agents to create packages, make and amend bookings as well as attend to customer inquiries. Our CRM system is designed to analyze customer needs for better servicing. It generates reports identifying areas of opportunity or weakness and thereby helps us in improving our service and product quality. We also use software from Omniture Web Analytics, softwareSAS, Big Data Hive and Qlikview to assist us in analyzing our web-based business in India through various metrics, such as the rate of conversion of visitors to our websites to purchasing customers.
Our systems include automation for ticketing, monitoring of schedule changes and providing alerts to customers, as well as auto-cancelation of reservations made through a GDS or airlines’ central reservations systems. We are continually looking for opportunities to automate our processes in order to further increase our productivity and improve the scalability of our business.
Security
We are committed to protecting the security of our customers’ information. We maintain an information security team that is responsible for implementing and maintaining controls to prevent unauthorized users to access our systems. These controls include the implementation of information security policies and procedures, security monitoring software, encryption policies, access policies, password policies, physical access limitations, and detection and monitoring of fraud from internal staff. We have acquired a fraud detection system which uses transaction patterns and other data sources which seek to prevent fraudulent transactions in real time. All sensitive data transmitted through our systems is encrypted using SSL 1024 bit encryption technology. Our information security team also coordinates internal and external audits every six months. Our travel portal in India is compliant with the PCI-DSS (Payment Card Industry Data Security Standard) (a set of requirements for enhancing payment account security developed by the Payment Card Industry Security Standards Council, which include key credit card and financial services companies).
Marketing and Brand Awareness
We believe our online and offline marketing strategies increase our brand awareness, drive potential customers to our websites and improve the rate at which visitorspotential customers visiting our website become actual customers.
Our marketing channels primarily include online advertising, such as paid search engine marketing and optimization with leading Internet search engines (such as GoogleTMGoogle™), as well as utilizing and display advertising on websites (such as Yahoo!TM India)™ India and TripAdvisor™), offline advertising using print or broadcast media, such as television or radio, e-mails and short messages, and other marketing channels, such as through our call centers and travel stores. We have consistently invested in building our brand and expanding our reach to travelers in India as well as overseas, through mass media campaigns as well as through innovative digital marketing tools such as viral marketing and online display banners. We also have a strong presence in social media, such as FacebookTMFacebook™, YouTube™ and TwitterTMTwitter™. During 2011 and 2012, we invested significantly in building our brand awareness as a holiday travel brand through our “Memories Unlimited” marketing campaign. Recently, we started a marketing campaign promoting our hotel bookings business.
Our marketing programs and initiatives also include targeted campaigns, promotional or seasonal offers, as well as, from time to time, partnerships with international tourism boards. From time to time, we may run promotional schemes offering free air tickets upon the purchase of certain air tickets. For example, in the past we are currently runninghave run a promotion offering one free domestic air ticket upon the purchase of one domestic air ticket in India, subject to certain conditions. The estimated cost of any such free air tickets is recognisedrecognized at the time of issuance of the paid air tickets. We do not expect this promotion to have a significant impact on our revenues.
We have partnerships with the entertainment business in India to promote our hotel products. In addition, we were the official travel partner of the Sunrisers Hyderabad in 2013, one of the cricket teams in the Indian Premier League, to promote our online hotel offerings. As the team’s principal sponsor, we had our logo prominently displayed on the front of each player’s jersey and around the stadium and grounds in Hyderabad. The campaign was supported with television commercials that ran nationwide in April and May 2013, featuring Indian and international cricket stars booking hotels online with www.makemytrip.com.
We also have alliances and arrangements with several major banks in India, including Kotak Mahindra Bank, ICICI Bank, IndusInd Bank and HSBC, as well as with American Express, with whom we run promotional offers and vouchers. These alliances and arrangements provide us with access to our partners’ large customer base where targeted marketing for customer acquisition can be made at relatively low costs. In an arrangementthe quarter ending March 31, 2014, we also expanded ‘My Trip Rewards’, our loyalty program, in association with PAYBACK, a global customer loyalty rewards company,company. Our program was remodeled in January 2014 to allow for automatic enrollment of customers on our website, which has helped in expanding the size of our program, and changes on our website have allowed our customers to use or earn loyalty points with greater ease for online bookings. As of March 31, 2014, we recently launchedhad approximately 800,000 members, who made a “by invite” membershipsignificant contribution to our overall business. We believe that our program called “My Trip Rewards” to reward customers for their loyaltyhas been particularly successful in connection with our hotels and ongoing engagement with us.packages business.
We have won many industry awards, including the Best IndianTravel Portal by CNBC Awaaz (2013), Most Innovative B2C Company at Travel Innovation Summit by PhoCusWright (2013) for creating consumer friendly technologies, Best Travel Portal by Lonely Planet in 2012,(2013), Best Travel Portal (Indian) by Lonely Planet (2012), Outlook Traveller Favourite Travel Portal (2012), Travel Innovator of the Year by Travel Distribution World Asia Awards (2012), E Retailer of the Year at the Star Retailer Awards (2012), Best Mobile Strategy award at EyeforTravel’s Social Media & Mobile in 2012,Travel Asia conference (2013), Porter Prize (named after Michael E. Porter) for “Industry Architecture Shift” (2012), Safari India National Tourism Award for Best Online Tour Company (2012), Best Online Travel Agency and Best Domestic Tour Operator by the Times of India in 2011, Best Online Travel Portal of the Year by Class of Travel & Tourism Awards in 2010,(2011), Best Travel Portal by CNBC Awaaz in 2009(2009) and Best Online Travel Agent for Excellence in the Indian Travel Market by TravelBiz Monitor in 2009,(2009), as well as numerous awards from trade partners.
Customer Service
Our customer focused approach is centered on ensuring a favorable user experience on our websites as well as excellent customer service. Our intention is to provide customer support prior to, during and after travel. Our websites are designed to provide a user-friendly experience and integrate valuable travel information, such as flight status information, user-generated travel reviews and destination guides, to help customers research and make travel decisions. We also monitor feedback from our customers using our CRM system and review and upgrade the features of our websites from time to time.
The key channels through which we implement our customer support and communicate with our customers are as follows:
Web-based Support.We offer two web-based customer support services. Our self serviceself-service web-support, called “TripAssist,” which is available on our Indian website, enables our customers to check the status of their domestic flight, train, bus or hotel bookings, cancel bookings and track the progress of their refund, among other things. Customers who require assistance or have inquiries about certain products also have an option to contact our sales representatives via our websites and we have dedicated personnel available 24 hours a day, seven days a week, who provide assistance to our customers on a real time basis.
Call Centers.We provide our customers with comprehensive and real time assistance through our call centers which are available 24 hours a day, seven days a week. Currently, we outsource a portion of our customer service call center operations to IBM, iEnergizer IT Services, Intelenet Global ServicesSerco, InterGlobe and Motif India Infotech in India, whose employees have been trained by our respective outsourcing service providers and us.
Travel Stores.Customers may also visit our various travel stores and airport counters in 4243 cities in India and obtain assistance from our sales and customer service representatives.
Mobile Service.Our mobile service platform enables customersIn addition to search, book and pay for Indian domestic air ticketsbeing able to make different types of travel bookings on their smartphones and mobile phones at no additional cost. The tickets and bookings are delivered through email and SMS. Apart from flight bookings,devices, customers can view their booking details, cancel bookings, request e-tickets, and track refund status, on their mobile devices. Customers can also check flight status, look for new deals and use location-based services to find nearby places of interest. Furthermore, we recently launched our Android application, which allows customers to book domestic flights in India, complementing our Blackberry application, and updatedThese services are available through all our mobile website, m.makemytrip.com, to provide an enhanced experience for Androidapplications and iPhone users.
E-mail.Customers may also e-mail any inquiries or complaints, which we endeavor to address expeditiously.
Through our CRM system, we are able to maintain a customer database containing information on the transaction history and preferences of each customer who has booked a travel product through us. We document all sales and customers service processes at our company using business process management system methodology, wheresuch that the entire value chain, starting from the customer’s requirement until the delivery of the relevant service or product, or refund, if applicable, is documented. We also monitor our customer transactions and have a dedicated in-house escalation service which operatesoperating 24 hours a day, seven days a week, which is responsible for answering any complaints or issues raised by our customers.
We have a fulfillment process that we mainly outsource, which minimizes any travel disruption for our customers, with a team of personnel responsible for ensuring that customers’ hotel bookings are checked and reconfirmed prior to the date of travel.
As part of our customer focused approach, we have also set up an Indian online travel community website, www.oktatabyebye.com, which allows our customers and other travelers to exchange views and travel tips. Our Indian website also offers our customers the option to make cash donations to plant trees in India to reduce their carbon footprint, when completing their bookings.
Supplier Relationships
We believe we have cultivated and maintain good relationships with our travel suppliers. We have a dedicated team to maintain and enhance our existing relationships, and develop new relationships, with travel suppliers. Our supplier relationship teams negotiate agreements or arrangements with suppliers for access to travel inventory for our services and products, and also monitor supplier-sponsored promotions. They also focus on relationship management with our suppliers. One of the key services we provide to our suppliers is the provision of customer feedback and preferences which we obtain primarily through our CRM system, user-generated content on our websites as well as through our call centers, and via www.oktatabyebye.com, our Indian online travel community website.centers.
Our top five (in alphabetical order) airline suppliers for travel in India and overseas (based on revenue less service cost earned by us) and our top five (in alphabetical order) hotel suppliers (based on gross bookings) for fiscal year 20122014 were:
Airlines (Travel within India) | Airlines (International Travel) | Hotels (within India) | ||||
| Air India | Air India | |||||
| Go Air | Emirates | |||||
| IndiGo | Etihad Airways | Indian Hotels Company Limited | ||||
| Jet Airways | Jet Airways | |||||
| Malaysian Airlines |
Airlines
We have access to real time inventory of all major airlines operating in, from and to India either through a GDS (we primarily use Amadeus GDS) or through “direct connects” to our airline suppliers’ booking systems.
Most of these airlines offer us fares that match those offered by the airlines on their own websites as well as on other online travel websites. The fares paid by our customers include our service fee in addition to the fares charged by the airlines. We currently have commission arrangements with all India-based airlines, as well as major international airlines that service India, where part of our commission is linked to the number of sales facilitated by us or the revenue realized by these airlines on sales completed through us. Similarly, we earn fees from our GDS service provider on a per-ticketper-segment basis for sales completed by us through the GDS that are linked to the volumes of sales completed by us.
Hotels
We provideAs of March 31, 2014, we provided our customers with access to more than 8,000over 11,400 hotels and guesthouses in India, as of April 30, 2012, up fromand more than 4,500 as of April 30, 2011,170,200 hotels and a wide selection of hotelsproperties outside India. Our hotel supply team is responsible for negotiating agreements or arrangements with independent hotels, hotel chains and hotel management companies in India and securing competitive rates, promotions and access to inventory for listing on our websites as well as packaging of holidays. We select our hotel partners by their reputation and quality and monitor customer feedback on our websites as well as other channels in order to ensure that hotels listed on our websites maintain acceptable standards.
In our hotels and packages business, our revenue represents the total amount paid by our customers for these travel services and products and the cost of procuring the relevant services and products are classified as service cost. We also earn commissions from other hotel suppliers, typically larger hotel chain operators, depending on the volume of reservations made through us.
AsThrough our websites, customers can search, compare and make reservations at more than 11,400 hotels and guesthouses in India and more than 170,200 hotels and properties outside India as of April 30, 2012, approximately 4.7%March 31, 2014. We procure room inventory from our hotel suppliers through three methods: “direct allocation,” “direct connects” and, for most hotels outside India, through contracts with online travel agents and aggregators. Substantially all of our hotel suppliers were directly-connected to our booking system. Through these “direct connects,” our booking systems are integrated with the central reservations systems of the hotels and reservations to be made and confirmed on a real time basis. We intend to work with our suppliers to increase the number of “direct connects” as we believe “direct connects” benefit both us and the hotels. All other hotel suppliersin India have a “direct allocation” arrangement with us whereby they allocate rooms directly to us either by managing their room inventory on an extranet provided by us, or through channel managers, or supported by us or via telephone. We aredo not subject toassume any inventory risk on our direct allocationsfor such “direct allocation” as unsold inventory is released to the hotels within an agreed period of time. The remaining hotels in India are connected through direct connects. “Direct connect” is the method by which our booking systems are integrated with the central reservations systems of the hotels and reservations made are confirmed on a real time period.basis, although this applies to a small proportion of our total hotels. Through our ongoing efforts to increase the automation of and otherwise improve our extranet, our hotel suppliers are now able to perform more of the necessary functions for executing transactions through our system without our direct involvement. We obtain inventory for most hotels outside India through contracts with other online travel agents and aggregators outside India. In some instances, in order to enjoy special negotiated rates for these hotels, we pre-purchase hotel room nights and assume inventory risk on them. We earn commissions from such agents and aggregators depending onalso own the volumetravel website www.easytobook.com, which was acquired in February 2014 as part of room reservations made through them.our acquisition of the ETB Group. In addition, we own the travel website HotelTravel.com.
Competition
The market for travel services and products is highly competitive. We currently compete with both established and emerging providers of travel services and products, including other online travel agencies, such as cleartrip.com, expedia.com, travelocity.comtravelocity.co.in, yatra.com, goibibo.com, booking.com and yatra.com,agoda.com, as well as traditional travel agencies, tour operators, travel suppliers and operators of travel industry reservation databases. Large, established Internet search engines have also launched applications offering travel itineraries in destinations around the world, and meta-search companies who can aggregate travel search results also compete with us for customers. In our domestic hotels and packages business, we compete primarily with Cox & Kings, Kuoni India and Thomas Cook, all of which are established industry players in the Indian travel market.
Some of our competitors have significantly greater financial, marketing, personnel and other resources than us, and certain of our competitors have a longer history of established businesses and reputations in the Indian travel market (particularly in the hotels and packages business) as compared with us. Factors affecting our competitive success include, among other things, price, availability and breadth of choice of travel services, brand recognition, customer service and customer care, fees charged to travelers, ease of use of website interface, accessibility and reliability.
Certain of our travel suppliers have also been steadily focusing on increasing online demand on their own websites and decreasing or eliminating their dependence on third-party distributors like us. For instance, many low-cost airlines may, subject to applicable regulations, reduce or eliminate commissions to agents such as us or restrict the amount of service fees we are able to charge customers. Suppliers who sell on their own websites typically do not charge a processing fee, and, in some instances, offer advantages such as their own bonus miles or loyalty points, which could make their offerings more attractive to customers than offerings like ours. See “Item 3. Key Information — D. — Risk Factors — Risks Related to Us and Our Industry — The Travel Industry in India and Worldwide is Intensely Competitive, and We May Not Be Able to Effectively Compete in the Future.”
Intellectual Property
Our intellectual property rights include trademarks and domain names associated with the name “MakeMyTrip,” and other rights arising from confidentiality agreements relating to our website content and technology. We regard our intellectual property as a factor contributing to our success, although we are not dependent on any patents, intellectual property-related contracts or licenses other than some commercial software licenses available to the general public.success. We rely on trade marktrademark law, trade secret protection, non-competition and confidentiality agreements with our employees and some of our partners and vendors, to protect our intellectual property rights. We require our employees to enter into agreements to keep confidential all information relating to our customers, methods, business and trade secrets during and after their employment with us. Our employees are required to acknowledge and recognize that all inventions, trade secrets, works of authorship, developments and other processes made by them during their employment are our property.
We have registered our domain names, “www.makemytrip.com” (which includes the sub-domain “us.makemytrip.com” for our US website), “www.makemytrip.ae,” “www.makemytrip.com.sg,” “www.makemytripdeals.com,“www.luxury.com.sg,” “www.tripalong.in,“www.indiaahoy.com,” “www.luxury.com.sg” and “www.indiaahoy.com,”“www.hoteltravel.com” and have full legal rights over these domain names for the period for which such domain names are registered. We conduct our business under the “MakeMyTrip” brand name and logo and have registered the trademarks “MakeMyTrip” in India, Mauritius, Bhutan, Nepal, Singapore, Taiwan, Indonesia, Canada and the United States and “MakeMyTrip Times” and “India Ahoy” in India. We have applied for registration of the trademark “MakeMyTrip” in Indonesia, Australia, Canada, Singapore, Malaysia, Taiwan, Sri Lanka, Nepal, Hong Kong, China, Thailand and the United Arab Emirates. We have also applied for trademark registration of the trademarkslogos “Happy Holidays, Happy Prices” (our trademark for our holiday packages), “Traveltalkies”, “MakeMyTrip –“makemytrip.com — Memories Unlimited” “India Ahoy” and “my”; word marks “Traveltalkies” and “Memories Unlimited”; and logos and word marks for “tripalong”, “routeplanner” and “MakeMyTrip — Hotels Unlimited” in India, and such applications are currently pending, and we have filed responses to objections by the Trademark Registry to certain such applications. We have recently registered copyrights of our logo and brand name “MakeMyTrip” in India and copyright registration of certain specific representations of the logo “my”. We have also obtained an assignment over the trademark “Luxury Tours & Travel”. After our acquisitions of the Hotel Travel Group and the ITC Group in November 2012, we have filed trademark applications for the logos “HotelTravel” and “ITC” in Thailand, which are currently pending. We have also applied for copyright protection for our logo and brand namepatents in India and such applications are currently pending. We are also in the processfor certain aspects of obtaining an assignment over the trademarks “ticketvala.com” and “eBusxpress” for which Travis Internet Private Limited had applied for registration and over the trademark “Luxury Tours & Travel”, which was registered under the name of the previous controlling shareholder of Luxury Tours & Travel Pte Ltd.our technological systems.
Employees
As of March 31, 2012,2014, we had 1,2731,712 employees. The following tables show a breakdown of our employees as of the end of our past three fiscal years by category of activity and geographic location.
| Number of Employees as of | ||||||||||||||||||||||||
| March 31 | Number of Employees as of March 31, | |||||||||||||||||||||||
Division/Function | 2010 | 2011 | 2012 | 2012 | 2013 | 2014 | ||||||||||||||||||
Management | 7 | 6 | 5 | |||||||||||||||||||||
Management(1) | 5 | 6 | 7 | |||||||||||||||||||||
Product development | 20 | 40 | 60 | 60 | 45 | 42 | ||||||||||||||||||
Sales and marketing | 442 | 575 | 670 | 670 | 768 | 645 | ||||||||||||||||||
Technology development and technology support | 111 | 151 | 188 | 188 | 297 | 351 | ||||||||||||||||||
Others (including operations, business development, administration, finance and accounting, legal and human resources) | 177 | 238 | 350 | 350 | 497 | 667 | ||||||||||||||||||
|
|
|
|
|
| |||||||||||||||||||
Total | 757 | 1,010 | 1,273 | 1,273 | 1,613 | 1,712 | ||||||||||||||||||
|
|
|
|
|
| |||||||||||||||||||
Location India United States Singapore Malaysia Total Number of Employees as of March 31 2010 2011 2012 754 1,006 1,188 3 4 4 — — 75 — — 6 757 1,010 1,273
Notes:
| 1. | Includes Mr. Amit Somani who resigned on February 10, 2014 and whose resignation was effective from May 9, 2014. |
| Number of Employees as of March 31, | ||||||||||||
Location | 2012 | 2013 | 2014 | |||||||||
India | 1,188 | 1,279 | 1,308 | |||||||||
United States and Canada | 4 | 5 | 5 | |||||||||
Singapore | 75 | 78 | 56 | |||||||||
Malaysia | 6 | 11 | 17 | |||||||||
Thailand | — | 235 | 267 | |||||||||
United Arab Emirates | — | 4 | 3 | |||||||||
China and Hong Kong | — | 1 | 2 | |||||||||
The Netherlands | — | — | 39 | |||||||||
Israel | — | — | 15 | |||||||||
|
|
|
|
|
| |||||||
Total | 1,273 | 1,613 | 1,712 | |||||||||
|
|
|
|
|
| |||||||
None of our employees are represented by a labor union. We believe that our relations with our employees are good. We also contract with a third partyparties for the provision of temporary employees from time to time based on the needs of our businesses for various functions, including administration, technology-related projects and staffing at our travel stores and airport counters. As of March 31, 2012,2014, we employed 134228 temporary employees. As of April 30, 2012, we employed 138 temporaryand contractual employees.
Insurance
We maintain and annually renew insurance for losses (but not business interruption) arising from fire, burglary as well as terrorist activities for our corporate office at Gurgaon, India, as well as for our various company-owned travel stores in 2118 cities in India.India and for our airport counters in Mumbai, Delhi, Chennai and Hyderabad. In connection with our initial public offering in August 2010, we purchased a liability policy that also covers our directors and officers with a policy limit of $50 million. We extended this policy in connection with our follow-on public offeringofferings in June 2011.2011 and March 2014. In addition, we have a liability policy of $30 million to insure our directors and officers from various liabilities arising out of the general performance of their duties. We have purchased public liability insurance and fidelity insurance for MMT India and have also purchased public liability insurance, fidelity insurance and work injury compensation insurance with an aggregate policy limit of approximately $2.0$1.0 million for Luxury Tours & Travel Pte. Ltd., Singapore.Tours.
Regulations
We are subject to various laws and regulations in India arising from our operations in India, including travel agent requirements and the operation of our website, call centers, airport counters and company-owned travel stores.
In orderMMT India requires licenses from state tourism departments to act as a travel agent oragent/tour operator in certain states in India. MMT India has received a tour operatorlicense in West Bengal and applied for such license in the National Capital Territory of Delhi, MMT India is required to obtain a license from the Licensing Authority, Tourism Department, Government of National Capital Territory of Delhi under the Delhi Motor Vehicle Rules, 1993, as amended. MMT India has applied for such a license. MMT India has also obtained security clearances for each of its directors from the Directorate General of Civil Aviation, Government of India, pursuant to which it is now eligible to apply for a license to operate inclusive tour package tourist charter flights as part of our holiday packages, as and when required.
Delhi. In addition, Luxury Tours & Travel Pte. Ltd. holds a travel agent’s license from the Singapore Tourism Board, and Luxury Tours (Malaysia) Sdn Bhd holds an Inbound license from the Ministry of Tourism, Malaysia.Malaysia and ITC Bangkok Co., Ltd. holds an inbound license from the Tourism Authority of Thailand.
MMT India has obtained a license from the Reserve Bank of India to act as a Full Fledged Money Changer (single branch), which requires that MMT India maintain a minimum net owned funds of Rs. 2.5 million (approximately $45,000)$0.04 million). However, other than money changing services provided to certain of our existing customers, we do not intend to expand our money changing operations.
MMT India recently paid aggregate penalties of Rs. 250,000 (approximately $4,500) to remedy non-compliance with certain requirements of the Reserve Bank of India in connection with transfers from certain former employees to MakeMyTrip Limited of an aggregate of 37,274 shares of MMT India, representing approximately 0.01% of its issued shares, and certain issuances of shares of MMT India to MakeMyTrip Limited.
Under the Information Technology Act, 2000, as amended, we are subject to civil liability to compensate for wrongful loss or gain to any person arising from negligence in implementing and maintaining reasonable security practices and procedures with respect to sensitive personal data or information that we possess, deal with or handle in our computer systems, networks, databases and software. India has also implemented privacy laws, including the Information Technology (Reasonable Security Practices and Procedures and Sensitive Personal Data or Information) Rules, 2011, which impose limitations and restrictions on the collection, use and disclosure of personal information.
We obtained approvals to operate our domestic and international call centers in India as “Other Service Providers” from the Department of Telecommunications, Ministry of Communications and Information Technology, Government of India, which are valid for 20 years from September 27, 2005 and June 6, 2001, respectively. We have also obtained Telemarketing Centre Approvals for Delhi and Gurgaon, which are valid until 2018.
We obtain and maintain registrations under the Shops and Establishments Act and Rules of each state where our company-owned travel stores are located.
Our operations in India currently do not benefit from tax holidays under any applicable laws or regulations.
The consolidated foreign direct investment policy, or the FDI Policy, issued by the Department of Industrial Policy & Promotion, Ministry of Commerce & Industry, Government of India and the Foreign Exchange Management Act, 1999, as amended, and the regulations framed thereunder, or the FEMA have certain requirements with respect to downstream investments by Indian companies that are owned or controlled by foreign entities. These requirements currently include restrictions on issuances, pricing and valuation of shares of Indian companies and sources of funding for such investments, which may, in certain cases, require prior notice to or approval of the Government of India.
The Companies Act, 2013 and the rules thereunder, or the new Companies Act, which has recently been enacted, contains significant changes to Indian company law, including in relation to the issue of capital by companies, related party transactions, corporate governance, audit matters, shareholder class actions, restrictions on the number of layers of subsidiaries and corporate social responsibility spending. While several provisions of the new Companies Act are currently effective, the existing Companies Act, 1956 remains in effect with respect to other provisions. The timing for effectiveness of the remaining provisions of the new Companies Act is unclear. See “Item 3. Key Information — D. – Risk Factors — Risks Related to Us and Our Industry — Changing Laws, Rules and Regulations and Legal Uncertainties in India, Including Adverse Application of Corporate and Tax Laws, May Adversely Affect Our Business and Financial Performance.”
C. Organizational Structure
The following diagram illustrates our corporate structure and the place of formation and ownership interest of each of our significant subsidiaries, as of the date of this annual report.Annual Report.
Notes:
| (1) |
| (2) |
| (3) | The ITC Group consists of (i) ITC Bangkok Co., Ltd. (Thailand) — 51%; and (ii) other insignificant subsidiaries. |
| (4) | The ETB Group consists of (i) Easy to |
D. Property, Plants and Equipment
Our primary facility is our principal executive office located in Gurgaon, India. We lease this approximate 86,500approximately 93,700 square foot facility under a nine-year lease which commenced in thethrough at least fiscal year 2012.2020.
As of April 30, 2012,March 31, 2014, we also had 2220 company-owned travel stores in 18 cities, including one in our office in Gurgaon, 35 franchisee-owned travel stores which primarily sell packages in 2131 cities and counters in India, including Mumbai, Kolkata, Ahmedabad, Chennai, Delhi, Goa, Hyderabad, Jaipur and Pune.four major airports in India. Outside of India, we havelease offices in New York, San Francisco, Singapore, Kuala Lumpur, Phuket, Bangkok, Amsterdam and Kuala Lumpur. All of these properties are leased,Herzliya, Israel and we are currentlyown two offices in the process of renewing certain such lease agreements for future periods.Phuket.
| ITEM 4A. | UNRESOLVED STAFF COMMENTS |
Not applicable
ITEM 5. OPERATING AND FINANCIAL REVIEW AND PROSPECTS
| ITEM 5. | OPERATING AND FINANCIAL REVIEW AND PROSPECTS |
The following discussion of our business, financial condition and results of operations should be read in conjunction with “Item 3. Key Information — A. Selected Consolidated Financial Data” and our consolidated financial statements and the related notes included elsewhere in this annual report.Annual Report. This discussion contains forward-looking statements and involves numerous risks and uncertainties, including, but not limited to, those described in “Item 3. Key Information — D. Risk Factors” and elsewhere in this annual report.Annual Report. Actual results could differ materially from those contained in any forward-looking statements.
Overview
We are the largest online travel company in India, based on gross bookings for 2011,2012, according to PhoCusWright. Through our primary website, www.makemytrip.com, and other technology-enhanced platforms, travelers can research, plan and book a wide range of travel services and products in India as well as overseas. Our services and products include air tickets, hotels, packages, rail tickets, bus tickets, car hire and ancillary travel requirements such as facilitating access to travel insurance. As reported by The Economic Times on February 6, 2011, the Indian middle class is expected to grow over three times from 160 million people currently to 547 million people by 2026. In order to meet the requirements of this growing Indian middle class travel market where Internet penetration is relatively low, we also utilize other technology-enhanced distribution channels, including call centers, our travel stores in India, as well as our travel agents’ network in India. Our customers are now able to make bookings on our mobile site, http://m.makemytrip.com, and on major mobile platforms through our mobile applications, including Indian and international flights, hotels and holiday packages and Indian bus offerings through our Android and iPhone applications, Indian domestic flights through our BlackBerry application, and Indian domestic flights and hotels through our Windows Mobile application. We believe that smartphones and mobile devices will become a more integral part of how our customers shop for and purchase our products in the coming years.
We generate revenue through two main lines of business, air ticketing, and hotels and packages. Sales in ourOur sales of air ticketing businesstickets and hotel rooms are primarily made through our website and our mobile applications. Our customers can book standard flight plus hotel packages on our websites, whereasbut the majority of the sales in our hotels andof packages businesswithin or outside India are made mainlyconcluded through our call centers, travel stores and travel agents’ network. We also generate revenue through the online sale of rail and bus tickets and by facilitating access to travel insurance, as well as advertising revenue from third partythird-party advertisements on our websites.
In our air ticketing business, our three main sources of revenue are (1) commissions and incentive payments from airline suppliers for tickets booked by customers through our distribution channels, (2) service fees we charge our customers and (3) fees from our GDS service provider. Revenue from our air ticketing business generally represents the commissions, incentive payments and fees we earn as an agent on a “net” basis.
In our hotels and packages business, revenue (including revenue on air tickets sold as part of packages) is generally accounted for on a “gross” basis, representing the total amount paid by our customers for these travel services and products. The cost of procuring the relevant services and products for sale to our customers in this business is classified as service cost. Our hotels and packages revenue also includes commissions we earn for the sale of hotel rooms (without packages), and commissions we earn as an agent from other online travel agents and aggregators from whom we procure hotel rooms for our customers for most hotels outside India, which are accounted for on a “net” basis. We earn commissions in a similar manner for certain non-hotel products related to our packages.
As certain parts of our revenue are recognized on a “net” basis and other parts of our revenue are recognized on a “gross” basis, we evaluate our financial performance based on revenue less service cost, which is a non-IFRS measure, as we believe that revenue less service cost reflects more accurately the value addition of the travel services that we provide to our customers. The presentation of this non-IFRS information is not meant to be considered in isolation or as a substitute for our consolidated financial results prepared in accordance with IFRS as issued by the IASB. Our revenue less service cost may not be comparable to similarly titled measures reported by other companies due to potential differences in the method of calculation.
The following tables reconcile our revenue (an IFRS measure) to revenue less service cost (a non-IFRS measure):
| Air Ticketing | Hotels and Packages | Other Revenue | Total | |||||||||||||||||||||||||||||||||||||||||||||||||||||||||||||||||||||||||||||||||||||||||||||
| Fiscal Year Ended March 31 | Fiscal Year Ended March 31 | Fiscal Year Ended March 31 | Fiscal Year Ended March 31 | Air Ticketing | Hotels and Packages | Other Revenue | Total | |||||||||||||||||||||||||||||||||||||||||||||||||||||||||||||||||||||||||||||||||||||||||
| 2010 | 2011 | 2012 | 2010 | 2011 | 2012 | 2010 | 2011 | 2012 | 2010 | 2011 | 2012 | Fiscal Year Ended March 31 | Fiscal Year Ended March 31 | Fiscal Year Ended March 31 | Fiscal Year Ended March 31 | |||||||||||||||||||||||||||||||||||||||||||||||||||||||||||||||||||||||||||||||||
| (in thousands, except percentages) | 2012 | 2013 | 2014 | 2012 | 2013 | 2014 | 2012 | 2013 | 2014 | 2012 | 2013 | 2014 | ||||||||||||||||||||||||||||||||||||||||||||||||||||||||||||||||||||||||||||||||||||
Revenue | $ | 32,119.5 | $ | 47,622.7 | $ | 76,190.3 | $ | 50,287.9 | $ | 74,558.0 | $ | 116,701.1 | $ | 1,152.8 | $ | 2,540.7 | $ | 3,707.8 | $ | 83,560.2 | $ | 124,721.4 | $ | 196,599.3 | $ | 76,190.3 | $ | 60,888.8 | $ | 66,523.2 | $ | 116,701.1 | $ | 164,129.3 | $ | 184,500.7 | $ | 3,707.8 | $ | 3,803.8 | $ | 4,350.7 | $ | 196,599.3 | $ | 228,821.9 | $ | 255,374.6 | ||||||||||||||||||||||||||||||||||||||||||||||||
Less: | ||||||||||||||||||||||||||||||||||||||||||||||||||||||||||||||||||||||||||||||||||||||||||||||||
Service cost | 985.5 | — | 9,939.6 | 42,292.2 | 63,650.9 | 98,474.8 | — | — | — | 43,277.7 | 63,650.9 | 108,414.3 | ||||||||||||||||||||||||||||||||||||||||||||||||||||||||||||||||||||||||||||||||||||
|
|
|
|
|
|
|
|
|
|
|
| |||||||||||||||||||||||||||||||||||||||||||||||||||||||||||||||||||||||||||||||||||||
Less: Service Cost | 9,939.6 | 4,119.6 | 4,471.7 | 98,474.8 | 136,537.1 | 144,507.8 | — | — | — | 108,414.3 | 140,656.7 | 148,979.6 | ||||||||||||||||||||||||||||||||||||||||||||||||||||||||||||||||||||||||||||||||||||
Revenue less service cost | $ | 31,134.0 | $ | 47,622.7 | $ | 66,250.7 | $ | 7,995.7 | $ | 10,907.1 | $ | 18,226.3 | $ | 1,152.8 | $ | 2,540.7 | $ | 3,707.8 | $ | 40,282.5 | $ | 61,070.5 | $ | 88,184.9 | $ | 66,250.7 | $ | 56,769.2 | $ | 62,051.5 | $ | 18,226.3 | $ | 27,592.2 | $ | 39,992.9 | $ | 3,707.8 | $ | 3,803.8 | $ | 4,350.7 | $ | 88,184.9 | $ | 88,165.2 | $ | 106,395.1 | ||||||||||||||||||||||||||||||||||||||||||||||||
|
|
|
|
|
|
|
|
|
|
|
| |||||||||||||||||||||||||||||||||||||||||||||||||||||||||||||||||||||||||||||||||||||
% of total revenue less service cost | 77.3 | % | 78.0 | % | 75.1 | % | 19.8 | % | 17.9 | % | 20.7 | % | 2.9 | % | 4.1 | % | 4.2 | % | 100.0 | % | 100.0 | % | 100.0 | % | 75.1 | % | 64.4 | % | 58.3 | % | 20.7 | % | 31.3 | % | 37.6 | % | 4.2 | % | 4.3 | % | 4.1 | % | 100.0 | % | 100.0 | % | 100.0 | % | ||||||||||||||||||||||||||||||||||||||||||||||||
Key Operating Metrics
Our operating results are affected by certain key metrics that represent overall transaction activity and subsequent financial performance generated by our travel services and products. Three of the most important metrics, which are critical in determining the ongoing growth of our business, are revenue less service cost, gross bookings and net revenue margins.
Revenue from our air ticketing business is generally accounted for on a “net” basis (representing the commissions, incentive payments and fees we earn) and recognized at the time of issuance of air tickets. We account for our air ticketing revenue in this manner as we typically act as an agent and as we do not assume any performance obligation after the confirmation of the issuance of tickets. However, on a few occasions, we pre-purchase air ticket inventory in order to enjoy special negotiated rates and revenue from the sale of such tickets is accounted for on a “gross” basis (representing the price of the tickets paid by our customers) as we assume inventory risk on such pre-purchased tickets. The cost of such air tickets areis classified as service cost.
Revenue from our hotels and packages business (including air tickets sold as part of packages) is generally accounted for on a “gross” basis, representing the total amount paid by our customers for these travel services and products, as we are the primary obligor and have responsibility for the delivery of services. The cost of procuring the relevant services and products for sale to our customers in this business is classified as service cost. However, our hotels and packages revenue also includes commissions we earn for the sale of hotel rooms (without packages), and commissions we earn as an agent from other online travel agents and aggregators from whom we procure hotel rooms for our customers for most hotels outside India, which are accounted for on a “net” basis. We earn commissions in a similar manner for certain non-hotel products related to our packages. Our hotels and packages revenue is recognized on the check-in date for hotel reservations and the date of departure for packages.
As certain parts of our revenue are recognized on a “net” basis and other parts of our revenue are recognized on a “gross” basis, we evaluate our financial performance based on revenue less service cost, as we believe this reflects more accurately the value addition of the travel services that we provide to our customers.
Gross bookings represent the total amount paid by our customers for the travel services and products booked through us, including taxes, fees and other charges, and are net of cancellations and refunds.
Net revenue margins is defined as revenue less service cost as a percentage of gross bookings and represent the commissions, fees, incentive payments and other amounts earned in our business. We follow net revenue margin trends closely across our various lines of business to gain insight into the profitability of our various businesses.
The following table sets forth the number of transactions, gross bookings and net revenue margins for our air ticketing business, and hotels and packages business for ourduring last three fiscal years.
| Fiscal Year Ended March 31 | Fiscal Year Ended March 31 | |||||||||||||||||||||||
| 2010 | 2011 | 2012 | 2012 | 2013 | 2014 | |||||||||||||||||||
| (in thousands, except percentages) | (in thousands, except percentages) | |||||||||||||||||||||||
Number of transactions: | ||||||||||||||||||||||||
Air ticketing | 1,766.9 | 2,824.6 | 3,715.4 | 3,715.4 | 3,794.1 | 3,999.2 | ||||||||||||||||||
Hotels and packages | 109.7 | 175.9 | 343.1 | 343.1 | 568.1 | 869.8 | ||||||||||||||||||
Gross bookings: | ||||||||||||||||||||||||
Air ticketing | $ | 408,603.1 | $ | 647,846.9 | $ | 839,234.3 | $ | 839,234.3 | $ | 939,637.5 | $ | 943,699.1 | ||||||||||||
Hotels and packages | 57,273.1 | 94,608.2 | 153,723.2 | 153,723.2 | 229,921.0 | 317,518.4 | ||||||||||||||||||
|
|
|
|
|
| |||||||||||||||||||
| $ | 465,876.2 | $ | 742,455.1 | $ | 992,957.5 | $ | 992,957.5 | $ | 1,169,558.6 | $ | 1,261,217.5 | |||||||||||||
|
|
|
|
|
| |||||||||||||||||||
Net revenue margins: | ||||||||||||||||||||||||
Air ticketing | 7.6 | % | 7.4 | % | 7.9 | % | 7.9 | % | 6.0 | % | 6.6 | % | ||||||||||||
Hotels and packages | 14.0 | % | 11.5 | % | 11.9 | % | 11.9 | % | 12.0 | % | 12.6 | % | ||||||||||||
Combined net revenue margin for air ticketing and hotels and packages | 8.4 | % | 7.9 | % | 8.5 | % | 8.5 | % | 7.2 | % | 8.1 | % | ||||||||||||
Factors Affecting Our Results of Operations
Changes in Our Business Mix and Net Revenue Margins.Changes in the Indian air travel industry have affected, and will continue to affect, the revenue per transaction for travel agents, including our company. In particular, volatility in global economic conditions and jet fuel prices in recent years, as well as increased liquidity constraints, have caused our airline partners to pursue cost reductions in their operations, including reducing distribution costs. Measures taken by airlines to reduce such costs have included reductions in travel agent commissions. In our experience, the commission rate paid by airlines to travel agents has generally been decreasing and we expect this trend to continue. Many international airlines which fly to India have also either significantly reduced or eliminated commissions to travel agents. Unlike full-service airlines, low-cost airlines do not generally utilize GDSs for their ticket inventory. As a result, travel agents selling air tickets for low-cost airlines generally do not earn fees from GDSs.
InDuring fiscal year 2010, these trends prompted Indian travel agents, including2013, Kingfisher Airlines, one of the major airlines in India and one of our company, to increase the amount of service fees charged to customers and the number of services forairline suppliers, shut down its operations, which fees are levied. Asresulted in a result, although commissionsdecline in the air ticketing business faced downward pressurestotal capacity in the airline industry our air ticketingin India. In addition, adverse changes to the overall business and financial climate for the airline industry in India due to various factors including, but not limited to, rising fuel costs, high taxes, significant depreciation of the Indian Rupee as compared to the US dollar making travel for Indian consumers outside India more expensive, and increased liquidity constraints, resulted in airlines in India reducing the base commissions paid to travel agencies. These factors were primarily responsible for causing us to record a net revenue margins increased from 7.2%loss of $(27.6) million in fiscal year 20092013 as compared to 7.6%a profit of $7.0 million in fiscal year 2010. In addition, many of our Indian airline suppliers also paid incentive fees2012. Adverse economic developments continued to negatively affect the travel agents such as ourselves during the economic slowdownindustry in fiscal year 2010 and most2014, which was a significant reason for our net loss of fiscal year 2009 in order to improve their sales.
In fiscal year 2011, our air ticketing net revenue margins decreased to 7.4% from 7.6%$(20.9) million in fiscal year 2010. This decrease was mainly2014 as compared to a resultnet loss of a reduction in the service fees we charge in our domestic air ticketing business in order to attract more customers and gain market share. This reduction in service fees partially offset the effects of an increase in our gross bookings and higher volume-related incentives we earned from the airlines during fiscal year 2011.
In fiscal year 2012, our air ticketing net revenue margins increased to 7.9% from 7.4%$(27.6) million in fiscal year 2011. This increase was mainly a result of an improvement2013. Any consolidation in the negotiated rates and incentive deals we received fromairline industry involving our suppliers in the fiscal year 2012.may also adversely affect our existing relationships and arrangements with such suppliers.
The hotels and packages business tends to yield higher margins than the air ticketing business, reflecting the greater value added in respect of the travel services that we provide in the hotels and packages segment as well as the diversity and more complex nature of hotels and packages services as compared with air tickets. Our net revenue margins in theWe are focused on expanding our hotels and packages business and, accordingly, changing our revenue mix towards our hotels and packages segment.
In fiscal year 2013, our air ticketing net revenue margins decreased to 6.0% from 14.0%7.9% in fiscal year 2010 to 11.5%2012. This decrease was mainly as a result of airlines in India reducing their base commissions in fiscal year 2011.2013. In fiscal year 2014, our air ticketing net revenue margins increased to 6.6% from 6.0% for fiscal year 2013. This decrease in margin occurred because we reduced our marginincrease was mainly as a result of an improvement in the third quarter ofnegotiated rates and incentive deals we received from our air ticketing suppliers in fiscal year 2011 in order to increase2014.
In fiscal year 2013, our market share and promote new holiday packages as we continued to develop new travel destinations. Our net revenue margins in the hotels and packages business increased marginally from 11.5% in fiscal year 2011 to 11.9% in fiscal year 2012.2012 to 12.0% in fiscal year 2013. The increase in margin was achieved due to an expansion of our supplier base through the negotiationacquisition of better rates withthe Hotel Travel Group and the ITC Group in the third quarter of fiscal year 2013. As a result of selling inventory available from internal suppliers such as the Hotel Travel Group and ITC Group in fiscal year 2013, we purchased less inventory from external vendors as compared to fiscal year 2012, who typically charge a commission in addition to the cost of the hotel room or package.
In fiscal year 2014, our suppliers,net revenue margins in the hotels and packages business increased from 12.0% in fiscal year 2013 to 12.6% in fiscal year 2014. The increase in margin was achieved due to an increase of our supplier through the acquisitions in fiscal year 2013 and the acquisition of Luxury Toursthe ETB Group in February 2014. As a result of selling inventory available from internal suppliers such as the Hotel Travel Group and Travel inITC Group during fiscal year 2012.
We are focused on expanding our hotels and packages business. Our hotels and packages transactions have increased over the last three fiscal years, increasing from 109,672 transactions in fiscal year 2010 to 343,141 transactions in fiscal year 2012.2012 to 869,805 transactions in fiscal year 2014. Gross bookings for hotels and packages have increased from $57.3 million in fiscal year 2010 to $153.7 million in fiscal year 2012.2012 to $317.5 million in fiscal year 2014. Revenue less service cost from our hotels and packages business accounted for 19.8%20.7%, 17.9%31.3% and 20.7%37.6% of our total revenue less service cost in fiscal years 2010, 20112012, 2013 and 2012,2014, respectively. The increase of revenue less service cost in fiscal year 2014 as compared to fiscal year 2013 was due to a significant increase in the number of transactions and an increase in net revenue margins, further aided by the acquisitions of the Hotel Travel Group and the ITC Group in fiscal year 2013 and acquisition of the ETB Group in the fourth quarter of fiscal year 2014.
Seasonality in the Travel Industry.We experience seasonal fluctuations in the demand for travel services and products offered by us. We tend to experience higher revenues from our hotels and packages business in the second and fourth calendar quarters of each year, which coincide with the summer holiday travel season and the year-end holiday travel season for our customers in India and other markets. In our air ticketing business, we tend to experience higher revenues in the third and fourth calendar quarters of each year and lower revenue in the first calendar quarter, mainly as a result of changes in demand for business travel.
Advertising and Business Promotion Expenses.Competition in the Indian online travel industry has intensified and the industry is expected to remain highly competitive for the foreseeable future. Increased competition may cause us to increase our advertising and business promotion expenses in the future in order to compete effectively with new entrants and existing players in the market. We may also increase our advertising and business promotion expenses as a result of our expansion into new markets and such expenses may not be offset by increased revenue particularly at the initial commencement of business in these new markets. We intend to invest in marketing to further increase our brand awareness through our “Memories Unlimited” campaign and our marketing campaign promotingour hotel bookings business in fiscal year 2013, in addition to our regular advertising and business promotion expenses to further strengthen our brand.
Trends and Changes in the Indian Economy and Travel Industry.Our financial results have been, and are expected to continue to be, affected by trends and changes in the Indian economy and travel industry, particularly the Indian online travel industry. These trends and changes include:
US Dollar-Indian Rupee Exchange Rate.The reporting currency of our financial statements is the US dollar. However, the functional currency of our key operating subsidiary in India is the Indian Rupee. We generate a substantial portion of our revenue in Indian Rupees and substantially all of our costs are borne in Indian Rupees. A majority all of our assets and liabilities are also denominated in Indian Rupees.
The financial statements of all our subsidiaries are translated to our reporting currency using relevant exchange rates in accordance with IFRS. In particular, the assets and liabilities of our foreign operations are translated to US dollars at exchange rates as of the relevant reporting date, and the income and expenses of our foreign operations are translated to US dollars at the average of the exchange rates applicable during the relevant reporting period. Foreign exchange gains and losses resulting from the settlement of transactions and from the re-measurement of monetary items at year-end exchange rates are recognized in the profit or loss of the period in which they arise. For the purposes of consolidation, all income and expenses are translated at the average rate of exchange during the period covered by the applicable statement of income and assets and liabilities are translated at the exchange rate prevailing on the balance sheet date. When the US dollar strengthens against the Indian Rupee, our revenue and costs in Indian Rupees converted to US dollars decrease. When the US dollar weakens, our revenue and costs in Indian Rupees converted to US dollars increase.
Recently, there have been periods of high volatility in the Indian Rupee and US dollar exchange rate. In fiscal year 2014, the average value of the Indian Rupee depreciated 10.3% against the US dollar as compared to the average value of the Indian Rupee in fiscal year 2013. This volatility is illustrated in the table set forth in the section titled “Exchange Rates.” As a result of the depreciation of the Indian Rupee against the US dollar during fiscal year 2014, our loss on account of foreign exchange fluctuations during fiscal year 2014 was $(2.7) million as compared to $(1.9) million for fiscal year 2013.
Our Revenue, Service Cost and Other Revenue and Expenses
Revenue
We started our businesscommenced operations in 2000 with a focusand in the first five years following our inception, we focused on the sales of air tickets to non-resident IndiansIndian market in the United States, traveling inboundprimarily servicing its demand for air tickets from the United States to India. In 2005, we started our Indian air ticketing business. Over time, we have expanded our hotels and packages business as well as expanded internationally and introduced new non-air services and products such as the sale of rail and bus tickets, and facilitating access to travel insurance. We also generate advertising revenue from third partythird-party advertisements on our websites.
Air Ticketing.We earn commissions from airlines for tickets booked by customers through our distribution channels as well as incentive payments linked to the number of sales facilitated by us. We either deduct commissions at the time of payment of the fare to our airline suppliers or collect our commissions on a regular basis from our airline suppliers, whereas incentive payments are collected from our airline suppliers on a periodic basis. Incentives earned from airlines are recognized on the basis of performance targets agreed with the relevant airline and when performance obligations have been completed. We charge our customers a service fee for booking airline tickets. We receive fees from our GDS service provider based on the volume of sales completed by us through the GDS. Revenue from air tickets sold as part of packages is eliminated from our air ticketing revenues and added to our hotels and packages revenue.
Hotels and Packages.Revenue from our hotels and packages business generally represents the total amount paid by our customers for these services and products as well as revenue from air tickets sold as part of packages. Our hotels and packages revenue also includes commissions we earn for the sale of hotel rooms (without packages), and commissions we earn as an agent from other online travel agents and aggregators from whom we procure hotel rooms for our customers for most hotels outside India, which is recordedare accounted for on a “net” basis. We earn commissions in a similar manner for certain non-hotel products related to our packages. As revenue in our hotels and packages business is accounted for on a “gross” basis, revenue from air tickets sold as part of packages is grossed up to include the fare paid by customers as well as all commissions and fees charged by us, and added to our hotels and packages revenue.
Other Revenue.Our other revenue primarily comprises revenue from commissions or fees from IRCTC for the sale of rail tickets, bus operators for the sale of bus tickets, as well as Apollo Munich Health Insurance Company Limited (previously known as Apollo DKV Insurance Company Limited) for our facilitation of the access to travel insurance, and third-party advertising on our websites. We also receive fees from aggregators from whom we procure inventory for certain bus tickets, when we book bus tickets through them. We expect that revenue from these other businesses will continue to contribute an insignificant percentage of our revenue in the near future.
Service Cost
Service cost primarily consists of costs paid to hotel and package suppliers for the acquisition of relevant services and products for sale to customers, and includes the procurement cost of hotel rooms and other local services such as sightseeing costs for packages and local transport costs; it does not include any component of personnel cost, depreciation or other operating costs. As revenue from our air ticketing business is generally recognized on a “net” basis, there is typically no service cost associated with our air ticketing business. However, on a few occasions, we pre-purchase air ticket inventory in order to enjoy special negotiated rates and revenue from the sale of such tickets is recognized on a “gross” basis (representing the retail value of the tickets paid by our customers). The cost of such air tickets areis classified as service cost.
The following tablestable sets forth revenue recorded on a “gross” basis and on a “net” basis as well as service costs within our air ticketing business, our hotels and packages business and our other revenue during our last three fiscal years.
| Air Ticketing | Hotels and Packages | Other Revenue | Total | |||||||||||||||||||||||||||||||||||||||||||||||||||||||||||||||||||||||||||||||||||||||||||||
| Fiscal Year Ended March 31 | Fiscal Year Ended March 31 | Fiscal Year Ended March 31 | Fiscal Year Ended March 31 | Air Ticketing | Hotels and Packages | Other Revenue | Total | |||||||||||||||||||||||||||||||||||||||||||||||||||||||||||||||||||||||||||||||||||||||||
| 2010 | 2011 | 2012 | 2010 | 2011 | 2012 | 2010 | 2011 | 2012 | 2010 | 2011 | 2012 | Fiscal Year Ended March 31 | Fiscal Year Ended March 31 | Fiscal Year Ended March 31 | Fiscal Year Ended March 31 | |||||||||||||||||||||||||||||||||||||||||||||||||||||||||||||||||||||||||||||||||
| (in thousands) | 2012 | 2013 | 2014 | 2012 | 2013 | 2014 | 2012 | 2013 | 2014 | 2012 | 2013 | 2014 | ||||||||||||||||||||||||||||||||||||||||||||||||||||||||||||||||||||||||||||||||||||
Revenue on gross basis | $ | 1,110.2 | $ | — | $ | 12,520.0 | $ | 48,724.2 | $ | 71,155.1 | $ | 110,962.9 | $ | — | $ | — | $ | — | $ | 49,834.4 | $ | 71,155.1 | $ | 123,482.9 | $ | 12,520.0 | $ | 5,139.0 | $ | 5,228.0 | $ | 110,962.9 | $ | 154,972.9 | $ | 164,087.7 | $ | — | $ | — | $ | — | $ | 123,482.9 | $ | 160,111.9 | $ | 169,315.7 | ||||||||||||||||||||||||||||||||||||||||||||||||
Revenue on net basis | 31,009.3 | 47,622.7 | 63,670.3 | 1,563.7 | 3,402.9 | 5,738.3 | 1,152.8 | 2,540.7 | 3,707.8 | 33,725.8 | 53,566.3 | 73,116.4 | 63,670.3 | 55,749.8 | 61,295.1 | 5,738.3 | 9,156.4 | 20,413.0 | 3,707.8 | 3,803.8 | 4,350.7 | 73,116.4 | 68,710.0 | 86,058.9 | ||||||||||||||||||||||||||||||||||||||||||||||||||||||||||||||||||||||||
|
|
|
|
|
|
|
|
|
|
|
|
|
|
|
|
|
|
|
|
|
|
|
| |||||||||||||||||||||||||||||||||||||||||||||||||||||||||||||||||||||||||
Revenue | 32,119.5 | $ | 47,622.7 | $ | 76,190.3 | 50,287.9 | $ | 74,558.0 | $ | 116,701.1 | 1,152.8 | $ | 2,540.7 | $ | 3,707.8 | 83,560.2 | $ | 124,721.4 | $ | 196,599.3 | $ | 76,190.3 | $ | 60,888.8 | $ | 66,523.2 | $ | 116,701.1 | $ | 164,129.3 | $ | 184,500.7 | $ | 3,707.8 | $ | 3,803.8 | $ | 4,350.7 | $ | 196,599.3 | $ | 228,821.9 | $ | 255,374.6 | ||||||||||||||||||||||||||||||||||||||||||||||||||||
Less: | ||||||||||||||||||||||||||||||||||||||||||||||||||||||||||||||||||||||||||||||||||||||||||||||||
Service cost | 985.5 | — | $ | 9,939.6 | 42,292.2 | 63,650.9 | 98,474.8 | — | — | — | 43,277.7 | 63,650.9 | 108,414.3 | 9,939.6 | 4,119.6 | 4,471.7 | 98,474.8 | 136,537.1 | 144,507.8 | — | — | — | 108,414.3 | 140,656.7 | 148,979.6 | |||||||||||||||||||||||||||||||||||||||||||||||||||||||||||||||||||||||
|
|
|
|
|
|
|
|
|
|
|
|
|
|
|
|
|
|
|
|
|
|
|
| |||||||||||||||||||||||||||||||||||||||||||||||||||||||||||||||||||||||||
Revenue less service cost | $ | 31,134.0 | $ | 47,622.7 | $ | 66,250.7 | $ | 7,995.7 | $ | 10,907.1 | $ | 18,226.3 | $ | 1,152.8 | $ | 2,540.7 | $ | 3,707.8 | $ | 40,282.5 | $ | 61,070.5 | $ | 88,184.9 | $ | 66,250.7 | $ | 56,769.2 | $ | 62,051.5 | $ | 18,226.3 | $ | 27,592.2 | $ | 39,992.9 | $ | 3,707.8 | $ | 3,803.8 | $ | 4,350.7 | $ | 88,184.9 | $ | 88,165.2 | $ | 106,395.1 | ||||||||||||||||||||||||||||||||||||||||||||||||
|
|
|
|
|
|
|
|
|
|
|
|
|
|
|
|
|
|
|
|
|
|
|
| |||||||||||||||||||||||||||||||||||||||||||||||||||||||||||||||||||||||||
Personnel Expenses
Personnel expenses primarily consist of wages and salaries, employee welfare expenses, contributions to mandatory retirement provident funds as well as other expenses related to the payment of retirement benefits, and employee share-based compensation.
Other Operating Expenses
Other operating expenses primarily consist of, among other things, advertising and business promotion expenses, charges by payment gateway providers and fees paid to our outsourcing service providers for our call center service and other functions.
Depreciation and Amortization
Depreciation consists primarily of depreciation expense recorded on property and equipment, such as computers and office furniture, fixtures and equipment, leasehold improvements, motor vehicles and power backup generators at certain of our offices, including our corporate office in Gurgaon, India. Amortization expense consists primarily of amortization recorded on intangible assets including website development expenses, software and intangible assets acquired in business combinations.
Finance Income
Finance income consists mainly ofcomprises interest income on funds invested and net gains and/or losses arising from thegain on change in fair value of derivatives. Interest income is recognized as it accrues in profit or loss, using the derivative component on our preferred shares (being the option embedded in our preferred shares which obliges our company to issue additional preferred shares to preferred shareholders if we subsequently issue new preferred shares at lower prices than the original issue prices of the preferred shares of the same class) as well aseffective interest income on our term deposits.
Finance Costs
Finance costs consist primarily ofexpenses comprise interest expense accrued on our convertible preferred shares which are considered as interest bearing loans for accounting purposes (except for their embedded option derivative value), bank charges,borrowings, unwinding of the discount on provisions, losses on disposal of available-for-sale financial assets, net loss on change in fair value of derivatives and impairment losslosses recognized on financial assets, including trade and other advances, which represent provisions for bad and doubtful debts under certain terminated contracts with travel suppliers as well as advances under dispute by our suppliers, and costreceivables. Borrowing costs that are not directly attributable to the acquisition, construction or production of public offerings of our ordinary shares. All of our preferred shares were converted into ordinary shares upona qualifying asset are recognized in profit or loss using the completion of our initial public offering in August 2010.effective interest method.
Foreign currency gains and losses are reported on a net basis as a component of finance income and costs. For transactions, the translation is recorded at exchange rates on the date of the transaction.
Foreign Currency Translation
Our functional currency and that of two of our subsidiary, MakeMyTrip.com Inc.,significant subsidiaries, MMT USA and Hotel Travel Limited is the US dollar. However, the functional currencies of our subsidiaries organized in India, Singapore, Malaysia, Thailand, British Virgin Islands, United Arab Emirates and Malaysiathe Netherlands are their respective local currencies. We report our consolidated financial statements in US dollars. The financial statements of all our subsidiaries are translated to our reporting currency using relevant exchange rates in accordance with IFRS. In particular, the assets and liabilities of our foreign operations are translated to US dollars at exchange rates as of the relevant reporting date, and the income and expenses of our foreign operations are translated to US dollars at the average of the exchange rates applicable during the relevant reporting period. Adjustments resulting from the translation of financial statements of our subsidiaries, except MakeMyTrip.com Inc.for MMT USA and Hotel Travel Limited , from their functional currency to our reporting currency are accumulated and reported as other comprehensive income (loss), which is a separate component of our shareholders’ equity. See also “— Quantitative and Qualitative Disclosures about Market Risk — Foreign Exchange Risk.”
Critical Accounting Policies
Certain of our accounting policies require the application of judgment by our management in selecting appropriate assumptions for calculating financial estimates, which inherently contain some degree of uncertainty. Our management bases its estimates on historical experience and various other assumptions that are believed to be reasonable under the circumstances, the results of which form the basis for making judgments about the reported carrying values of assets and liabilities and the reported amounts of revenues and expenses that may not be readily apparent from other sources. Actual results may differ from these estimates under different assumptions or conditions.
We believe the following are the critical accounting policies and related judgments and estimates used in the preparation of our consolidated financial statements. Our management has discussed the application of these critical accounting estimates with our board of directors and audit committee. For more information on each of these policies, see “Note 3 — Significant Accounting Policies” in the notes to our consolidated financial statements.statements included in this Annual Report.
Revenue Recognition
We derive our revenue primarily from two sources: air ticketing and hotels and packages.
Revenue from our air ticketing business is primarily generated from our websites whereas revenue from our hotels and packages business is primarily generated through call centers, travel stores and travel agents’ network. We also generate revenue through the sale of rail and bus tickets, facilitating access to travel insurance and advertising revenue from third partythird-party advertisements on our websites.
Air Ticketing.Income from our air ticketing business comprises commissions and incentive payments from airline suppliers, service fees charged to customers and fees from our GDS service provider. We recognize income from our air ticket bookings at the time of issuance of tickets on the net commission we earn as an agent as we do not assume any performance obligation after the confirmation of the issuance of the air tickets to our customers. Incentives earned from airlines are recognized on the basis of performance targets agreed with the relevant airline and when performance obligations have been completed. In cases where we pre-purchase air tickets and assume inventory risk, revenue from the sale of such tickets areis accounted for on a “gross” basis. The costs of such air tickets areis classified as service cost.
Hotels and Packages.Income from our hotels and packages business, including income from air tickets sold as part of packages, is accounted for on a “gross” basis as we are the primary obligor in the arrangement and incur risk and responsibility, including the responsibility for delivery of services. Our hotels and packages revenue also includes commissions we earn for the sale of hotel rooms (without packages), and commissions we earn as an agent from other online travel agents and aggregators from whom we procure hotel rooms for our customers for most hotels outside India, which are accounted for on a “net” basis. We earn commissions in a similar manner for certain non-hotel products related to our packages. Our hotels and packages revenue is recognized on the check-in date for hotel reservations and the date of departure for packages, respectively.
Other Revenue.We also earn commissions and fees from railway and bus operators, earn fees by facilitating access to travel insurance policies to our customers and generate revenue from third partythird-party advertisements on our websites. Income from these other sources is recognized as the services are being performed.
We recognize revenue when we have persuasive evidence of an arrangement in respect of services to be provided, where such services have been rendered, and the fee is determinable and collectibilitycollectability is reasonably assured. We conclude that we have persuasive evidence of an arrangement when we enter into a legally enforceable agreement with our customers with terms and conditions that describe the service and the related payments. We consider fees to be determinable when services have been provided in accordance with the agreement, i.e. upon booking of the air ticket in the case of airline ticketing revenue, upon date of departure in the case of packages and upon check-in in the case of hotels. As the customer is primarily required to pay the amount at the time of transaction, collectibilitycollectability is reasonably assured. We do not believe we have significant uncertainty regarding revenue recognition, or that the same would not be affected by uncertain future events. No majorsignificant estimates or assumptions are made at the time of revenue recognition.
Revenue is recognized net of cancellations, refunds, discounts and taxes. In the event of cancellation of airline tickets, revenue recognized in respect of commissions earned by our company on such tickets is reversed and is net off from our revenue earned during the fiscal period at the time of cancellation. In addition, a liability is recognized in respect of the refund due to our customers for the gross amount charged to such customers net of cancellation fees. The revenue from the sale of packages and hotel reservations is recognized on the customer’s departure and check-in dates, respectively. Cancellations, if any, do not impact revenue recognition since revenue is recognized upon the availingavailment of services by the customer.
Service Cost
Service cost primarily consists of costs paid to hotel and package suppliers for the acquisition of relevant services and products for sale to customers, and includes the procurement cost of hotel rooms and other services. Service costs also include costs of pre-purchased air tickets in respect of sale of airline tickets where our company assumes inventory risks.
Service costs are the amount paid or accrued against procurement of these services and products from the respective suppliers and do not include any other operating cost to provide these services or products. Service costs are recognized when incurred, which coincides with the recognition of the corresponding revenue.
Other operating costs include costs such as advertising and business promotion costs, payment gateway charges, web hosting charges and outsourcing fees, which are recognized on an accrual basis. Depreciation and amortization costs are amortized over the estimated useful lives of the assets.
Advertising and business promotion costs are primarily comprised of Internet, television, radio and print media advertisement costs, as well as event-driven promotion costs for our company’s products and services. Such costs are the amounts paid by us to or accrued by us toward advertising agencies or direct service providers for advertising on websites, television, print formats, search engine marketing and any other media. Advertising and business promotion costs are recognized when incurred.
Accounting Estimates
While preparing our financial statements, we make estimates and assumptions that affect the reported amount of assets and liabilities, disclosure of contingent liabilities as of the date of our financial statements and the reported amount of revenues and expenses for the relevant reporting period. As additional information becomes available or periodically, in accordance with relevant accounting principles or policies, we reassess our estimates. Such revisions in our estimates could materially impact our results of operations and our financial position. We believe that the estimates used in the preparation of our consolidated financial statements are prudent and reasonable. Actual results could differ from these estimates. Certain of our accounting policies require higher degreesdegree of judgment than others in their application. We consider the policies discussed below to be critical to an understanding of our financial statements as their application places the most significant demands on management’s judgment.
Business Combinations, Goodwill and Intangible Assets
Business combinations are accounted for using the acquisition method as at the acquisition date, which is the date on which control is transferred to us. Control exists when the parent has power over the entity, is the powerexposed, or has rights, to govern the financial and operating policies of an entity so as to obtain benefitsvariable returns from its activities.involvement with the entity and has the ability to affect those returns by using its power over the entity. Power is demonstrated through existing rights that give the ability to direct relevant activities, including those which significantly affect the entity’s returns.
The cost of an acquisition is measured as the fair value of the assets given, equity instruments issued and liabilities incurred or assumed at the date of exchange. The cost of acquisition also includes the fair value of any contingent or deferred consideration, if any. Identifiable assets acquired and liabilities and contingent liabilities assumed in a business combination are measured initially at fair value at the date of acquisition. Transaction costs incurred in connection with a business combination are expensed as incurred.
The purchase consideration is comprised of the fair value of the assets given, equity instruments issued, liabilities incurred or assumed at the date of exchange and the fair value of any contingent or deferred consideration, if any. A financial liability is recognized in respect of the acquisition of remaining shares of the subsidiary from the existing shareholders, if any, which represents its fair value as at the acquisition date.
The consideration transferred does not include amounts related to remuneration of employees or former owners of the acquiree for future services. Such amounts are recognized in profit or loss as a compensation cost.
Goodwill represents excess of the cost of acquisition over our share in the fair value of the acquiree’s identifiable assets, liabilities and contingent liabilities. If the excess is negative, a bargain purchase gain is recognized immediately in the profit or loss. Subsequent to initial recognition, goodwill is measured at cost less accumulated impairment losses.losses, if any.
Intangible assets acquired in a business combination are measured at fair value as at the date of acquisition. Following initial recognition, intangible assets are carried at cost less any accumulated amortization and impairment losses, if any.
Intangible assets acquired in a business combination are amortized on a straight-line basis over their estimated useful lives that reflect the expected pattern of consumption of the future economic benefits embodied in the asset. The estimated useful lives are as follows:
• Customer | ||||
• Contract | ||||
• Marketing | ||||
• Software | 5 years | |||
• Website development costs | 3-5 years |
Available-for-sale Financial Assets
Available-for-sale financial assets are non-derivative financial assets that are either designated as available-for-sale or are not classified in any of the other categories. Available-for-sale financial assets are recognisedrecognized initially at fair value plus any directly attributable transaction costs. Subsequent to initial recognition, they are measured at fair value and any changes, other than impairment losses, are recognized in other comprehensive income (loss) and presented within equity in the fair value reserve. When an investment is derecognized, the cumulative gain or loss in other comprehensive income (loss) is transferred to profit or loss. Available-for-sale financial assets comprise of equity securities.
Impairment Loss on Trade and Other Receivables
We estimate the amount of uncollectible receivables each period and establish an impairment loss for uncollectible amounts. We provide impairment loss based on (i) our specific assessment of the collectability of all significant amounts; and (ii) any specific knowledge we have acquired that might indicate that an amount is uncollectible. The assessments reflect management’s best assumptions and estimates. Significant management judgment is involved in estimating these factors, and they include inherent uncertainties. Management periodically evaluates and updates the estimates based on the conditions that influence these factors. The variability of these factors depends on a number of conditions, including uncertainty about future events, and thus our accounting estimates may change from period to period.
Impairment of Non-Financial Assets
The carrying amounts of our non-financial assets, primarily property, plant and equipment, website development cost, software and other intangible assets, are reviewed at each reporting date to determine whether there is any indication of impairment. If any such indication exists, then the asset’s recoverable amount is estimated. Goodwill is tested annually for impairment. An impairment loss is recognized if the carrying amount of an asset or cash generating unit, or CGU, exceeds its recoverable amount.
The recoverable amount of an asset or CGU is the greater of its value in use and its fair value less costs to sell. In assessing value in use, the estimated future cash flows are discounted to their present value using a pre-tax discount rate that reflects current market assumptions of the time value of money and the risks specific to the asset. For the purpose of impairment testing, assets are grouped together into the smallest group of assets that generates cash inflows from continuing use that are largely independent of the cash inflows of other assets or CGUs. Subject to an operating segment ceiling test, CGUs to which goodwill has been allocated are aggregated to that level at which impairment testing is performed which reflects the lowest level at which goodwill is monitored for internal reporting purposes. Goodwill acquired in a business combination is allocated to a group of CGUs that are expected to benefit from the synergies of the combination.
Impairment losses are recognized in profit or loss. Impairment losses recognized in respect of CGUs are allocated first to reduce the carrying amount of any goodwill allocated to the CGU (or group of CGUs), and then to reduce the carrying amounts of the other assets in the CGU (or group of CGUs) on a pro rata basis.
An impairment loss in respect of goodwill is not reversed. For other assets an impairment loss is reversed only to the extent that the asset’s carrying amount does not exceed the carrying amount that would have been determined, net of depreciation or amortization, if no impairment loss had been recognized.
Share-based Payment Transactions
Our employees receive remuneration in the form of equity instruments for rendering services over a defined vesting period. The value of equity instruments granted to our employees is measured by reference to the fair value of the instrument at the relevant date of grant. We record an expense for the value of such equity instruments granted and record an increase to our equity.
The equity instruments generally vest in tranches over the vesting period. The fair value determined at the grant date is expensed over the vesting period of the respective tranches. We recognize share-based compensation net of an estimated forfeiture rate and therefore only recognize compensation cost for those shares expected to vest over the service period of the award.
We apply the Black-Scholes valuation model in determining the fair value of options granted, which requires the input of highly subjective assumptions, including the expected life of the share option, share price volatility, and the pre-vesting option forfeiture rate. Expected life is based on historical exercise patterns, which we believe are representative of future behavior. We estimate expected volatility at the date of grant based on historical volatility of comparable companies for the period equal to the expected term of the options. Expected dividends percentage is taken as zero as we do not anticipate issuing dividends. The risk-free interest rate is the yield on a treasury bond with a remaining term equal to the expected option life assumed at the date of grant. The assumptions used in calculating the fair value of share options represent our best estimates, but these estimates involve inherent uncertainties and the application of management judgment. As a result, if factors change and we use different assumptions, our share-based compensation expense could be materially different in the future. In addition, we are required to estimate share-based compensation expense net of estimated forfeitures. In determining the estimated forfeiture rates for share-based awards, we periodically conduct an assessment of the actual number of equity awards that have been forfeited to date as well as those expected to be forfeited in the future. We consider many factors when estimating expected forfeitures, including the type of award, the employee class and historical experience. If our actual forfeiture rate is materially different from our estimate, the share-based compensation expense could be significantly different from what we have recorded in the current period.
In the future, if we elect to use different assumptions under the Black-Scholes valuation model, it could result in a significantly different impact on our net income or loss.
Estimated Useful Lives of Property, Plant and Equipment and Website Development Cost
Property, Plant and Equipment.In accordance with International Accounting Standards, or IAS, 16, “Property, Plant and Equipment,” we estimate the useful lives of plant and equipment in order to determine the amount of depreciation expense to be recorded during any reporting period. If technological changes were to occur more rapidly than anticipated or in a different form than anticipated, the useful lives assigned to these assets may have to be shortened, resulting in the recognition of increased depreciation expense in future periods. Likewise, if anticipated technological or other changes occur more slowly than expected, the useful lives could be extended. This could result in a reduction of depreciation expense in future periods.
Website Development Cost.Website development costs representing vendor invoices towards costs of design, configuration, coding, installation and testing of our websites are capitalized until implementation. Upon implementation, the asset is amortized to expense over its estimated useful life. Ongoing website post-implementation costs of operation and application maintenance are charged to expense as incurred. In accordance with IAS 38 “Intangible Assets,” website development costs also include costs incurred on development related to internally generated intangible assets which have been capitalized on meeting the criteria of technical feasibility, future economic benefit, marketability and being separately identifiable.
We review the carrying value of long-lived assets or asset groups to be used in operations whenever events or changes in circumstances indicate that the carrying amount of the assets might not be recoverable. Factors that would necessitate an impairment assessment include a significant adverse change in the extent or manner in which an asset is used, a significant adverse change in legal factors or the business climate that could affect the value of the asset, or a significant decline in the observable market value of an asset, among others.
Income Tax
Income tax comprises current and deferred tax. Income tax expense is recognized in our profit or loss, except to the extent it relates to items directly recognized in equity, in which case it is recognized in equity.
Current Income Tax.As part of the process of preparing our consolidated financial statements, we are required to estimate our income taxes in each of the jurisdictions in which we operate. We are subject to tax assessments in each of these jurisdictions. A tax assessment can involve complex issues, which may only be resolved over extended time periods. Although we have considered all these issues in estimating our income taxes, there could be an unfavorable resolution of such issues that may affect our results of operations.
Current income tax for our current and prior periods are measured at the amount expected to be recovered from or paid to the taxation authorities based on the taxable income for that period. The tax rates and tax laws used to compute the amount are those that are enacted or substantively enacted by the reporting date.
The amount of income tax we pay is subject to evaluation of assessment proceedings by income tax authorities, which may result in adjustments to our carried forward tax losses. Our estimate of the potential outcome for any uncertain tax issue is highly judgmental. We believe we have adequately provided for any reasonably foreseeable outcome related to these matters. However, our future results may include favorable or unfavorable adjustments to our estimated tax liabilities in the period the assessments are made or resolved, tax examinations are closed or when statutes of limitation on potential assessments expire. As a result, our effective tax rate may fluctuate significantly.
Deferred Income Tax.We recognize deferred income tax using the balance sheet approach. Deferred tax is recognized on temporary differences as of the relevant reporting date between the tax bases of assets and liabilities and their carrying amounts for financial reporting purposes. We recognize a deferred tax asset only to the extent that it is probable that future taxable profits will be available against which the deductible temporary differences and tax loss carry forwards can be utilized.
We consider many factors when assessing the likelihood of future realization of our deferred tax assets, including our recent earnings experience by jurisdiction, expectations of future taxable income, and the carry forward periods available to us for tax reporting purposes, as well as other relevant factors. Due to inherent complexities arising from the nature of our businesses, future changes in income tax law or variances between our actual and anticipated operating results, we assess the likelihood of future realization of our deferred tax assets based on our judgments and estimates. Therefore, actual income taxes could materially vary from these judgments and estimates.
The measurement of deferred tax assets involves judgment regarding the deductibility of costs not yet subject to taxation and estimates regarding sufficient future taxable income to enable utilization of unused tax losses in different tax jurisdictions. All deferred tax assets are subject to review of probable utilization. If, however, unexpected events occur in the future that would prevent us from realizing all or a portion of our net deferred tax assets, an adjustment would result in a charge to income in the period in which such determination was made.
Deferred income tax assets and liabilities are measured at the tax rates that are expected to apply in the period when the asset is realized or the liability is settled, based on tax rates and tax laws that have been enacted or substantively enacted at the reporting date. Deferred tax assets and liabilities are offset if there is a legally enforceable right to offset current tax liabilities and assets, and they relate to income taxes levied by the same tax authority on the same taxable entity, or on different tax entities which intend to settle current tax liabilities and assets on a net basis or their tax assets and liabilities simultaneously.
Compound Financial Instruments
Compound financial instruments issued by our company comprise our convertible and redeemable preferred shares with a discretionary, non-cumulative dividend that may be converted into our ordinary share capital at the option of the holder. Our preferred shares comprise equity, liability and embedded derivative components. One preferred share is convertible into one ordinary share. As our preferred shares contain adjustment clauses that represent price protection features which protect the original preferred shareholders from decline in the fair market value of their shares, our company may have to issue a variable number of ordinary shares on conversion and hence this represents a liability.
Equity instruments are instruments that evidence a residual interest in the assets of an entity after deducting all of its liabilities. Therefore, as the initial carrying amount of our preferred shares (which are compound financial instruments) has been allocated to their equity and liability components, the equity component has been assigned the residual amount after deducting the amount separately determined for their liability component from the entire fair value of our preferred shares. The value of derivative features (such as the conversion option) embedded in our preferred shares is included as a component of liability. The sum of the carrying amounts assigned to the liability and equity components on initial recognition was equal to the fair value that would be ascribed to the instrument as a whole. No gain or loss was recognized from initially recording the components of the instrument.
The fair value of the financial liability has been initially recognized at the amount payable on demand, discounted from the first date that the amount could be required to be paid. As the preference shareholders can demand repayment of the purchase price at any time subsequent to issuance, the fair value of the liability component has been calculated at not less than the nominal amount of the preference shares issued.
The equity component has been recognized initially based on the difference between the fair value of our preferred shares as a whole and the fair value of their liability component (including the embedded derivative liability). From the liability component that included the embedded derivative liability, the fair value of the derivative liability has been separated and the balance has been accounted for as a non-derivative liability. Any directly attributable transaction costs have been allocated to the liability and equity components of our preferred shares in proportion to their initial carrying amounts. Subsequent to initial recognition, the non-derivative liability component of our preferred shares has been measured at their amortized cost using an “effective interest” method. The equity component of our preferred shares is not re-measured subsequent to its initial recognition. Separable embedded derivatives in our preferred shares are recognized as described below.
The fair value of the separable embedded derivative is measured using the binomial lattice model. Measurement inputs include share price on measurement date, expected term of the instrument, anti-dilution price of different class of convertible and redeemable preference shares, risk free rate (based on government bonds), expected volatility (based on weighted average historic volatility adjusted for changes expected due to publicly available information), probability of funds to be raised from an initial public offering or private placement, probability of conversion or redemption of the convertible and redeemable preference shares. The assumptions used in calculating the fair value of derivative liability represent our best estimates, but these estimates involve inherent uncertainties and the application of management judgment. As a result, if factors change and we use different assumptions, our fair value of derivative liability could be materially different in the future.
Interest, dividends, losses and gains relating to the liability component of our preferred shares have been recognized in our profit or loss.
Derivative Financial Instruments
Our preferred shares, which have all been converted to ordinary shares upon the completion of our initial public offering in August 2010, included a variable conversion feature which represents an embedded derivative feature. We also have a similar feature in our investment in equity-accounted investees. Such derivatives are recognized initially at fair value, determined at inception using an appropriate valuation method. Subsequent to initial recognition, derivatives are measured at fair value, and changes therein are accounted in profit or loss.
Results of Operations
The following table sets forth a summary of our consolidated statement of profit or loss and other comprehensive income (loss), both actual amounts and as a percentage of total revenue, for the periods indicated.
| Fiscal Year Ended March 31 | ||||||||||||||||||||||||
| 2010 | 2011 | 2012 | ||||||||||||||||||||||
| Amount | % | Amount | % | Amount | % | |||||||||||||||||||
| (in thousands, except percentages) | ||||||||||||||||||||||||
Revenue | $ | 83,560.2 | 100.0 | $ | 124,721.4 | 100.0 | $ | 196,599.3 | 100.0 | |||||||||||||||
Service cost | (43,277.7 | ) | (51.8 | ) | (63,650.9 | ) | (51.0 | ) | (108,414.3 | ) | (55.1) | |||||||||||||
Personnel expenses | (16,562.0 | ) | (19.8 | ) | (14,399.0 | ) | (11.5 | ) | (26,520.7 | ) | (13.5) | |||||||||||||
Other operating expenses | (28,160.5 | ) | (33.7 | ) | (40,698.9 | ) | (32.6 | ) | (54,868.7 | ) | (27.9) | |||||||||||||
Depreciation and amortization | (1,569.7 | ) | (1.9 | ) | (1,910.6 | ) | (1.5 | ) | (2,790.2 | ) | (1.4) | |||||||||||||
Results from operating activities | (6,009.8 | ) | (7.2 | ) | 4,061.9 | 3.3 | 4,005.4 | 2.0 | ||||||||||||||||
Finance income | 1,874.2 | 2.2 | 1,601.8 | 1.3 | 1,987.9 | 1.0 | ||||||||||||||||||
Finance costs | (2,062.9 | ) | (2.5 | ) | (3,525.7 | ) | (2.8 | ) | (4,957.1 | ) | (2.5) | |||||||||||||
Profit (Loss) before tax | (6,198.6 | ) | (7.4 | ) | 2,138.0 | 1.7 | 970.2 | 0.5 | ||||||||||||||||
Income tax benefit (expense) | (8.4 | ) | * | 2,691.7 | 2.2 | 6,078.1 | 3.1 | |||||||||||||||||
Profit (Loss) for the year | (6,207.0 | ) | (7.4 | ) | 4,829.7 | 3.9 | 7,048.4 | 3.6 | ||||||||||||||||
| Fiscal Year Ended March 31 | ||||||||||||||||||||||||
| 2012 | 2013 | 2014 | ||||||||||||||||||||||
| Amount | % | Amount | % | Amount | % | |||||||||||||||||||
| (in thousands, except percentages) | ||||||||||||||||||||||||
Revenue | $ | 196,599.3 | 100.0 | $ | 228,821.9 | 100.0 | $ | 255,374.6 | 100.0 | |||||||||||||||
Other Income | $ | 1,312.3 | 0.5 | |||||||||||||||||||||
Service cost | (108,414.3 | ) | (55.1 | ) | (140,656.7 | ) | (61.5 | ) | (148,979.6 | ) | (58.3 | ) | ||||||||||||
Personnel expenses | (26,520.7 | ) | (13.5 | ) | (34,520.5 | ) | (15.1 | ) | (37,220.8 | ) | (14.6 | ) | ||||||||||||
Other operating expenses | (54,868.7 | ) | (27.9 | ) | (67,954.0 | ) | (29.7 | ) | (80,116.0 | ) | (31.4 | ) | ||||||||||||
Depreciation and amortization | (2,790.2 | ) | (1.4 | ) | (3,752.7 | ) | (1.6 | ) | (5,692.1 | ) | (2.2 | ) | ||||||||||||
Results from operating activities | 4,005.4 | 2.0 | (18,062.0 | ) | (7.9 | ) | (15,321.6 | ) | (6.0 | ) | ||||||||||||||
Finance income | 1,987.9 | 1.0 | 4,197.6 | 1.8 | 2,441.8 | 1.0 | ||||||||||||||||||
Finance costs | (4,957.1 | ) | (2.5 | ) | (4,939.5 | ) | (2.2 | ) | (7,775.7 | ) | (3.0 | ) | ||||||||||||
Share of loss of equity-accounted investee | (66.0 | ) | (0.0 | ) | (186.1 | ) | (0.1 | ) | (171.5 | ) | (0.1 | ) | ||||||||||||
Profit (Loss) before tax | 970.2 | 0.5 | (18,990.1 | ) | (8.3 | ) | (20,827.0 | ) | (8.2 | ) | ||||||||||||||
Income tax benefit (expense) | 6,078.1 | 3.1 | (8,599.0 | ) | (3.8 | ) | (78.5 | ) | (0.0 | ) | ||||||||||||||
Profit (Loss) for the year | 7,048.4 | 3.6 | (27,589.1 | ) | (12.1 | ) | (20,905.6 | ) | (8.2 | ) | ||||||||||||||
Fiscal Year 20122014 Compared to Fiscal Year 20112013
Revenue.Revenue. We hadgenerated revenue of $196.6$255.4 million in fiscal year 2012,2014, an increase of 57.6%11.6% over revenue of $124.7$228.8 million in fiscal year 2011.
Air Ticketing.Revenue from our air ticketing business increased by 60.0%9.3% to $76.2$66.5 million in fiscal year 20122014 from $47.6$60.9 million in fiscal year 2011.2013. Our revenue less service costs increased by 39.1%9.3% to $66.3$62.1 million in fiscal year 20122014 from $47.6$56.8 million in fiscal year 2011.Our2013. The overall growth was driven by an increase in net revenue margin (defined as revenue less service costs as a percentage of gross bookings increased by 29.5%,bookings) from 6.0% in fiscal year 2013 to 6.6% in fiscal year 2014, primarily due to a 31.5% growth in the number of transactions both as a result of an improvement in the overall air travel market as well as the continued increase in our domestic air ticket market share. Our air ticketing net revenue margins increased to 7.9% in fiscal year 2012 from 7.4% in fiscal year 2011, mainly due to special negotiated rates and incentive deals we received from our air ticketing suppliers in fiscal year 2012.2014 and a 5.4% increase in the number of air ticketing transactions in fiscal year 2014 as compared to fiscal year 2013.
Hotels and Packages.Revenue from our hotels and packages business increased by 56.5%12.4% to reach $116.7$184.5 million in fiscal year 20122014 from $74.6$164.1 million in fiscal year 2011.2013. Our revenue less service costs increased by 44.9% to $40.0 million in fiscal year 2014 from $27.6 million in fiscal year 2013. This growth was due to an increase of 62.6% in gross bookings primarily due toby 38.1%, a 95.1%53.1% increase in the number of transactions. Duetransactions and an increase in our net revenue margins from 12.0% in fiscal year 2013 to the strong12.6% in fiscal year 2014. The growth in our gross bookings,this segment was further aided by the acquisition of ETB Group in February 2014.
Other Revenue. Our other revenue less service cost from our hotels and packages business increased by 67.1% to $18.2$4.4 million in fiscal year 20122014 from $10.9$3.8 million in fiscal year 2011,2013, primarily as a result of adue to an increase in our hotels and packages net revenue margins to 11.9% in fiscal year 2012facilitation fees from 11.5% in fiscal year 2011. In fiscal year 2012, netrevenue margins improved as we achievedmore favorable terms on the basis of expanding supplier relationships and from the acquisition of Luxury Tours and Travel infiscal year 2012.travel insurance.
Other Revenue.Income.Our other revenue increased by 45.9% to $3.7income accounted for $1.3 million in fiscal year 2012 from $2.52014, primarily due to gain on bargain purchase of $1.2 million on ETB Group acquisition in February 2014.
Service Cost. Service cost increased to $149.0 million in fiscal year 2011, primarily due to increased sale of rail tickets and bus tickets and other miscellaneous income.
Service Cost.Service cost increased to $108.42014 from $140.7 million in fiscal year 2012 from $63.7 million in fiscal year 2011,2013, mainly as a result of an increase in the transaction volume in our hotels and packages business and an increase in the cost of air ticket inventory from $0.0 in fiscal year 2011 to $9.9$4.1 million in fiscal year 2012due2013 to increased cost of pre-purchased air tickets.$4.5 million in fiscal year 2014.
Total Revenue Lessless Service Cost.Our total revenue less service costcosts increased by 44.4%20.7% to $106.4 million in fiscal year 2014 from $88.2 million in fiscal year 20122013. This growth resulted from $61.1 million in fiscal year 2011, primarily as a result of a 39.1% increase in our air ticketing revenue less service cost in line with the increase in the number of transactions, as well as a 67.1%44.9% increase in our hotels and packages revenue less service cost, mainly reflecting thecosts and an increase of 9.3% in the number of transactions.our air ticketing revenue less service costs.
Personnel Expenses.Personnel expenses increased to $26.5 million in the fiscal year 2012 from $14.4$37.2 million in fiscal year 2011, mainly as2014 from $34.5 million in fiscal year 2013 representing 35.0% and 39.2% of net revenue for fiscal year 2014 and 2013, respectively. This increase was primarily due to an increase in wages, a resultsmall increase in employee headcount, most of whom were in the hotels and packages business, and consolidation of the acquisition of the ETB Group made in fourth quarter of fiscal year 2014, which was partially offset by lower employee share-based compensation costs related to RSUs granted to employees of $6.9$0.6 million in fiscal year 2012, as against $0.5 million in fiscal year 2011. Personnel expenses also increased in fiscal year 2012 due to increases in annual wages and average employee headcount in fiscal year 2012, as compared to fiscal year 2011.2014. Excluding employee share-based compensation costs, personnel expenses as a percentage of net revenue decreased by 0.5%1.4% from fiscal year 20112013 to fiscal year 2012.2014.
Other Operating Expenses.Other operating expenses increased by 34.8%17.9% to $54.9$80.1 million in thefiscal year ended March 31, 20122014 from $40.7$68.0 million in thefiscal year ended March 31, 2011,2013, primarily as a result of an increase in payment gateway charges, advertising and business promotion expenses and outsourcing feespayment gateway charges in line with the growth in our business.business and the acquisition of the ETB Group in February 2014. Other operating expenses as a percentageinclude mergers and acquisitions related expenses of net revenue decreased by 4.4%from$0.4 million in fiscal year 2011 to2014 as against $0.7 million in fiscal year 2012.
Depreciation and Amortization.Our depreciation and amortization expenses increased by 46.0%51.7% to $2.8$5.7 million in fiscal year 20122014 from $1.9$3.8 million in fiscal year 2011,2013, primarily as a result of an increase in amortization costs on acquisition-related intangibles and cost incurred for purchases of computers, leasehold assets,on website developments and software.
Results from Operating Activities.Activities. As a result of the foregoing factors, our results from operating activities decreased to an operating profitwas a loss of $4.0$15.3 million in fiscal year 2012 from an operating profit2014 as compared to a loss of $4.1$18.1 million in fiscal year 2011. Excluding2013.Our adjusted operating profit (loss) is calculated by excluding the effects of the following from our results from operating activities: employee share-based compensation costs, for both fiscal years 2011mergers and 2012,acquisitions related expenses, amortization of acquisition related intangibles and direct costs related to the registration of shares of our shareholders, and gain on bargain purchase. After taking into account such adjustments, we would have recorded anhad adjusted operating profitloss of $4.6$3.5 million in fiscal year 20112014 and an operating profit of $10.9$5.1 million in fiscal year 2012.2013, respectively. For further information in respect of this non-IFRS measure, see “ –Certain Non-IFRS Measures” elsewhere in this Annual Report.
Finance Income.Our finance income increaseddecreased to $2.0$2.4 million in fiscal year 20122014 from $1.6$4.2 million in fiscal year 2011,2013, primarily as a result of an increasea decrease in interest income on term deposits partially offset by higher foreign exchange gainwith banks in fiscal year 2011.2014.
Finance Costs.Our finance costs increased to $5.0$7.8 million in fiscal year 2012 from $3.52014 as compared to $4.9 million in fiscal year 2011,2013, primarily due to an increase inhigher foreign exchange loss due to weakeninglosses on account of depreciation of the Indian Rupee versusagainst the U.S.US dollar in fiscal year 2012, partially offset by higher public offering costs2014 of $0.8 million, increase in net change in fair value of financial liability related to our initial public offeringbusiness combination in fiscal year 2011 compared to public offering2014 of $0.6 million and costs incurred related to our follow-on public offering in fiscal year 2012. In addition, we had a higher impairment loss on trade and other advances in fiscal year 2012.
Income Tax Benefit (Expense).Income tax benefit increased to $6.1 million in In fiscal year 2012 from $2.7 million in fiscal year 2011, primarily due to the recognition of a deferred tax asset for unused tax losses and existing deductible differences in accordance with our accounting policy on deferred tax assets as our management considered it probable that future taxable profits would be available. In assessing the ongoing recoverability2013, we recorded impairment of deferred tax assets of $8.5 million related to our management considers whether it is more likely thanIndian subsidiary, based on the evaluation of convincing evidence as required by International Accounting Standard—Income Taxes (IAS 12). The impairment had no impact on our ability to utilize loss carry forwards or tax assets in the future and was not that some portion or alla reflection of management’s views on its ability to increase the profitability of the business in the future. During fiscal year 2014, we did not recognize deferred tax assets will not be realized. Management has not recognized balance deferred tax assets of $0.5 million in respect of the unusedasset on tax losses of MakeMyTrip.com Inc. and Luxury Tours & Travel Pte Ltd, Singapore because a trend of profitable growth in these subsidiaries is not yet fully established. Excluding the effects of deferred tax benefit for both fiscal years 2011 and 2012, we would have recorded an income tax expense of $0 in fiscal year 2011 and an income tax expense of $22,675 in fiscal year 2012.other temporary differences based on recognition guidance as required by IAS 12.
Profit (Loss) for the Year.Year. As a result of the foregoing factors, including the effects of income tax benefit (expense), employee share-based compensation costs, mergers and income tax benefit,acquisitions related expenses, amortization of acquisition related intangibles, and costs incurred related to our profitfollow-on offering and gain on bargain purchase for fiscal year 20122014, our loss for fiscal year 2014 was $7.1$20.9 million as againstcompared to a profitloss of $4.8$27.6 million in fiscal year 2011. Excluding2013. Our adjusted net profit (loss) is calculated by excluding the effects of the following from our profit (loss) for the year: mergers and acquisitions related expenses, amortization of acquisition related intangibles, employee share-based compensation costs, and incomenet loss on change in the fair value of derivative financial instruments, net change in fair value of financial liability related to business combination, deferred tax benefit for both fiscal years 2011(expense), public offering costs and 2012,gain on bargain purchase. After taking into account such adjustments, we would have recorded ahad adjusted net profitloss of $2.7$7.3 million in fiscal year 20112014 and a net profit$6.0 million in fiscal year 2013, respectively. For further information in respect of $7.9this non-IFRS measure, see “ – Certain Non-IFRS Measures” elsewhere in this Annual Report.
Fiscal Year 2013 Compared to Fiscal Year 2012
Revenue. We generated revenue of $228.8 million in fiscal year 2013, an increase of 16.4% over revenue of $196.6 million in fiscal year 2012.
Fiscal Year 2011 Compared to Fiscal Year 2010
Revenue.We had revenue of $124.7 million in fiscal year 2011, an increase of 49.3% over revenue of $83.6 million in fiscal year 2010.
Air Ticketing.Revenue from our air ticketing business increaseddecreased by 48.3%20.1% to $47.6$60.9 million in fiscal year 20112013 from $32.1$76.2 million in fiscal year 2010.2012. Our grossrevenue less service cost decreased by 14.3% to $56.8 million in fiscal year 2013 from $66.3 million in fiscal year 2012. Gross bookings increased by 58.6%,12.0% from fiscal year 2012 to fiscal year 2013 primarily due to a 59.9%materially higher airfares resulting from capacity constraints in the Indian airline industry, further aided by 2.1% growth in the number of transactions both astransactions. The decline in revenue less service cost was mainly due to a result of an improvement in the overall air travel market as well as the continued increasedecline in our domestic air ticket market share, partially offset by a 0.8% decrease in the average value per transaction. Our air ticketing net revenue margins declinedmargin to 7.4%6.0% from 7.9%, as airlines in fiscal year 2011 from 7.6% in fiscal year 2010, primarily as a result of a reduction by us of the service fees we charge in our domestic air ticketing business in order to attract more customers and gain market share.India reduced their base commissions.
Hotels and Packages.Revenue from our hotels and packages business increased by 48.3%40.6% to reach $74.6$164.1 million in fiscal year 20112013 from $50.3$116.7 million in fiscal year 2010.2012. Our revenue less service cost increased by 51.4% to $27.6 million in fiscal year 2013 from $18.2 million in fiscal year 2012. This was due to an increase of 65.2% in gross bookings by 49.6% primarily due to a 60.3%65.6% increase in the number of transactions and anmarginal increase in the average value per transaction of 3.0%. Despite strongour net revenue margin from 11.9% in fiscal year 2012 to 12.0% in fiscal year 2013. The growth in our gross bookings,this segment was further aided by the acquisition of the Hotel Travel Group and the ITC Group in November 2012.
Other Revenue. Our other revenue less service cost from our hotels and packages business increased by only 36.4% to $10.9$3.8 million in fiscal year 20112013 from $8.0$3.7 million in fiscal year 2010,2012, primarily as a result of a reduction in our hotels and packages net revenue margins to 11.5% in fiscal year 2011 from 14.0% in fiscal year 2010. In fiscal year 2010, our travel suppliers provided more favorable terms due to the slowdownhigher advertisement income on our websites partially offset by a decrease in India’s economy. We also reduced our margin in the third quartersales of fiscal year 2011 in orderrail tickets.
Service Cost. Service cost increased to increase our market share and promote new holiday packages as we continued to develop new travel destinations.
Other Revenue.Our other revenue more than doubled to $2.5$140.7 million in fiscal year 20112013 from $1.2$108.4 million in fiscal year 2010, primarily due to an increase in facilitation fees on travel insurance and the sale of rail tickets and bus tickets. We commenced the sale of rail tickets in June 2009.
Service Cost.Service cost increased by 47.1% to $63.7 million in fiscal year 2011 from $43.3 million in fiscal year 2010,2012, mainly as a result of an increase in the transaction volume in our hotels and packages business.business, slightly offset by a decrease in the cost of air ticket inventory from $9.9 million in fiscal year 2012 to $4.1 million in fiscal year 2013 due to a lower volume of pre-purchased air tickets.
Total Revenue Lessless Service Cost.Our total revenue less service cost increased by 51.6% to $61.1was $88.2 million in both fiscal year 2012 and in fiscal year 2011 from $40.3 million in fiscal year 2010, primarily2013 as a resultdecrease of a 53.0% increase14.3% in our air ticketing revenue less service cost in line with thefiscal year 2013 was offset by an increase in the number of transactions, as well as a 36.4% increase51.4% in our hotels and packages revenue less service cost in fiscal year 2013.
Personnel Expenses. Personnel expenses increased to $34.5 million in fiscal year 2013 from $26.5 million in fiscal year 2012, mainly reflectingas a result of employee share-based compensation costs of $11.7 million in fiscal year 2013 as compared to $6.9 million in fiscal year 2012, as well as due to increases in annual wages, growth in employee headcount in line with the increase in the number of transactions. However, the total revenue less service cost was partially offset by reductions in the net revenue marginsgrowth in our hotels and packages business to 11.5% in fiscal year 2011 from 14.0% in fiscal year 2010 and our air ticketing business to 7.4% in fiscal year 2011 from 7.6% in fiscal year 2010.
Personnel Expenses.Personnel expenses decreased by 13.1% to $14.4 million in fiscal year 2011 from $16.6 million in fiscal year 2010, primarily as a result of a reduction in employee share-based compensation costs to $0.5 million in fiscal year 2011 from $6.8 million in fiscal year 2010. The employee share-based compensation costs for fiscal year 2010 were primarily attributable to grants of fully-vested employee share optionsacquisitions made in the firstthird quarter of fiscal year 2010, as a result of options issued under our 2001 Equity Option Plan and grants intended to replace prior options granted under MMT India’s share option plan.2013. Excluding employee share-based compensation costs, personnel expenses as a percentage of net revenue increased by 41.7% in fiscal year 20113.7% from fiscal year 2010, primarily as a result of annual wage increases and an increase in average employee headcount.
Other Operating Expenses.Other operating expenses increased by 44.5%23.8% to $40.7$68.0 million in fiscal year 20112013 from $28.2$54.9 million in fiscal year 2010,2012, primarily as a result of an increase in payment gateway charges, an increase inoutsourcing fees, advertising and business promotion expenses as a resultand payment gateway charges in line with the growth in our hotels and packages business and acquisitions made in the third quarter of an increasefiscal year 2013. Other operating expenses include mergers and acquisitions related expenses of $0.7 million in online searches, promotions on outbound toursfiscal year 2013 compared to $0.2 million in fiscal year 2012. Mergers and an increase in spending on CRM,acquisitions related expenses include professional fees and outsourcing fees.certain other expenses associated with acquisitions and certain non-routine transactions, whether or not consummated.
Depreciation and Amortization.Our depreciation and amortization expenses increased by 21.7%34.5% to $1.9$3.8 million in fiscal year 20112013 from $1.6$2.8 million in fiscal year 2010,2012, primarily as a result of amortization costs incurred for purchases of computers and software.on acquisition-related intangibles.
Results from Operating Activities.Activities. As a result of the foregoing factors, our results from operating activities improved to an operating profitwas a loss of $4.1$18.1 million in fiscal year 2011 from2013 as compared to a lossprofit of $(6.0)$4.0 million in fiscal year 2010. Excluding2012.Our adjusted operating profit (loss) is calculated by excluding the effects of the following from our results from operating activities: employee share-based compensation costs, for both fiscal years 2010mergers and 2011,acquisitions related expenses, amortization of acquisition related intangibles and direct costs related to the registration of shares of our shareholders, and gain on bargain purchase. After taking into account such adjustments, we would have recorded anhad adjusted operating profitloss of $0.8$5.1 million in fiscal year 20102013 and an operating profit of $4.6$11.2 million in fiscal year 2011.2012, respectively. For further information in respect of this non-IFRS measure, see “ – Certain Non-IFRS Measures” elsewhere in this Annual Report.
Finance Income.Our finance income decreasedincreased to $1.6$4.2 million in fiscal year 20112013 from $1.9$2.0 million in fiscal year 2010,2012, primarily as a result of a decreasean increase in interest income on term deposits due to our withdrawal of certain term deposits to pay down bank overdrafts, a lower rate of interest earned on Mauritius based term deposits and a reduction of the net gain recognized on the change in fair value of the embedded derivative component of our preferred shares, partially offset by a foreign exchange gain in fiscal year 2011.2013.
Finance Costs.Our finance costs increased by 70.9%decreased to $3.5$4.9 million in fiscal year 2011 from $2.12013 as compared to $5.0 million in fiscal year 2010,2012, primarily due to public offering costs related to our follow-on public offering and higher foreign exchange losses in fiscal year 2012, which were offset by higher provisioning of loss on trade and other receivables in fiscal year 2013.
Income Tax Benefit (Expense). Deferred tax assets of $8.9 million had been recognized in previous fiscal years, relating to our initial public offering of $2.1 million, partially offset by a decreaseunutilized tax losses and other temporary differences in foreign exchange loss. In addition, interest expenses on the liability portionrespect of our preference shares were $1.1Indian subsidiary. After two consecutive years of profits, our Indian subsidiary incurred losses in fiscal year 2013. Based on evaluation of convincing evidence required by IAS 12, we have recorded an impairment of deferred tax assets of $8.5 million in fiscal year 20102013. The impairment has no impact on our ability to utilize loss carry forwards or tax assets in the future and $0.4 millionis not a reflection of management’s views on our ability to increase the profitability of our business in fiscal year 2011.the future.
Income Tax Benefit (Expense).We recognized income tax benefit of $2.7 million in fiscal year 2011, due to the recognition of a deferred tax asset for unused tax losses as our management considered it probable that future taxable profits would be available. We had an income tax expense of $8,428 in fiscal year 2010. Excluding the effects of deferred tax benefit for both fiscal years 2010 and 2011, we would have recorded an income tax expense of $8,428 in fiscal year 2010 and an income tax expense of $0 in fiscal year 2011.
Profit (Loss) for the Year.Year. As a result of the foregoing factors, including the effects of deferred tax assets on previous years’ tax losses, employee share-based compensation costs, mergers and acquisitions related expenses and amortization of acquisition-related intangibles and follow-on public offering costs, our profitloss for fiscal year 20112013 was $4.8$27.6 million an improvement againstas compared to a lossprofit of $(6.2)$7.0 million in fiscal year 2010. Excluding2012. Our adjusted net profit (loss) is calculated by excluding the effects of the following from our profit (loss) for the year: mergers and acquisitions related expenses, amortization of acquisition related intangibles, employee share-based compensation costs, for both fiscal years 2010net loss on change in the fair value of derivative financial instruments, net change in fair value of financial liability related to business combination, deferred tax benefit (expense), public offering costs and 2011,gain on bargain purchase. After taking into account such adjustments, we would have recorded ahad adjusted net profitloss of $0.6$6.0 million in fiscal year 20102013 and a net profit of $5.4$9.3 million in fiscal year 2011.2013, respectively. For further information in respect of this non-IFRS measure, see “ – Certain Non-IFRS Measures” elsewhere in this Annual Report.
Liquidity and Capital Resources
Historically, our sources of liquidity have principally been proceeds from the sale of our convertible preferred shares and ordinary shares, bank overdrafts and working capital facilities and cash flows from operations. Our cash requirements have mainly been for working capital as well as capital expenditures.
As of March 31, 2012,2014, our primary sources of liquidity were $43.8$38.0 million of cash and cash equivalents and $44.3$105.2 million in term deposits with various banks, in India, which are available on demand. SuchA portion of such term deposits are used to secure bank overdraft facilities with various banks in India, including HDFC Bank, ICICIYes Bank and YesIndusInd Bank, which are used for working capital purposes. As of March 31, 2012,2014, we did not have any amountshad no amount outstanding under our bank overdraft facilities.
Our trade and other receivables primarily comprise commissions, incentive or other payments owing to us from airlines, receivables from our corporate and retail customers to whom we typically extend credit periods, security deposits paid primarily for our leased premises as well as interest accrued but not due on our term deposits. Our trade and other receivables increased from $12.9$26.1 million as of March 31, 20112013 to $21.4$29.4 million as of March 31, 2012,2014, primarily as a result of the growth in our air ticketing business, as well as due to our acquisition of Luxury Tours & Travel Pte Ltd, Singapore in the first quarter ofETB Group during fiscal year 2012.2014 and an increase in receivables in our hotels and packages business during fiscal year 2014.
Our other current assets primarily consist of deposits and advances to our suppliers to secure better prices and availability of bookings in future periods. Our other current assets increased from $17.9$23.7 million as of March 31, 20112013 to $21.8$34.7 million as of March 31, 2012,2014, primarily due to increases in advances to airlines by $1.9 million primarily for fiscal year 2013, increases in advances to hotels by $1.4 million and increases in prepaid expenses on insurance and other maintenance charges.
We also haveAs of March 31, 2014, MMT India had the following two secured working capital facilitiesfacility available in India: (i) withIndia from HDFC BankBank: an overdraft facility for cash credit of up to Rs. 100200 million (approximately $1.8($3.4 million), with interest payable at an average rate of 14.5% per annum as of March 31, 2012, and (ii) with Yes Bank for cash credit of up to Rs. 250 million (approximately $4.5 million) at an average rate of 13.25% per annum as of March 31, 2012. Both facilities are secured by an assignment of certain of our credit card receivables and charges over our current assets and fixed assets.
Additionally, we have the following three overdraft facilities in India: (i) with HDFC Bank for Rs. 420 million (approximately $7.6 million) at an average rate of 9.4%9.8% (weighted average fixed deposit rate plus 1.00%) per annum, assecured by fixed deposits of MMT India. As of March 31, 2012, (ii) with2014, no amount was outstanding under this facility.
As of March 31, 2014, MMT India had the following facility available in India from Yes BankBank: an overdraft facility for up to Rs. 300 million (approximately $5.4($5.1 million), with interest payable at an average rate of 10.5%10.4% (weighted average fixed deposit rate plus 1.00%) per annum, assecured by fixed deposits of MMT India. As of March 31, 2012, and (iii)2014, no amount was outstanding under this facility.
As of March 31, 2014, MMT India had the following facilities available in India from IndusInd Bank: (i) an secured overdraft facility for up to Rs. 300 million ($5.1 million), with ICICI Bank for Rs. 500 million (approximately $9.0 million)interest payable at an average rate of 9.5%10.4% (weighted average fixed deposit rate plus 1.00%) per annum, secured by fixed deposits of MMT India, (ii) an unsecured overdraft facility for up to Rs. 150 million ($2.6 million) with primary security as exclusive charge over the entire assets of MMT India and (iii) an overdraft facility against credit card receivables of Rs. 200 million ($3.4 million) along with charge on entire assets of the company. As of March 31, 2012.2014, no amounts were outstanding under these facilities.
From time to time, we are also required by certain international and Indian airlines, hotels and packages suppliers, as well as certain aggregators from whom we obtain hotel inventory and other travel suppliers, to obtain bank guaranteesguarantees/letters of credit to secure our obligations to them. As of March 31, 2012, (i)2014, MMT India had obtained approximatelysanctioned bank guarantee limits of (i) Rs. 839.91,400 million ($15.224.0 million) in bank guarantees, substantially all from YESIndusInd Bank in favor of International Air Transport Association, or IATA, against any payment default by us to all airlines participating in IATA’s bill settlement plan,exclusive charge on the assets along with corporate guarantee from MakeMyTrip Limited, (ii) MakeMyTrip.com Inc. had obtained certificates of deposit totaling approximately $0.5Rs. 5 million for purposes of providing guarantees to various international airlines,($0.1 million) from Yes Bank against fixed deposits and (iii) Luxury Tours & Travel Pte Ltd had obtained certificates of deposit totaling approximately $0.5Rs. 50 million for purposes of providing guarantees to various international airlines and hotels and packages suppliers.
($0.9 million) from HDFC Bank against fixed deposit. As of March 31, 2012,no amountwas outstanding under oursecured working capital2014, an aggregate of Rs. 1,061.9 million ($18.2 million) of such bank guarantees were utilized, including (i) Rs. 1,033.3 million ($17.7 million) from IndusInd Bank, (ii) Rs. 3.0 million ($0.05 million) from Yes Bank and overdraft facilities and(iii) Rs. 25.57 million ($0.4 million) from HDFC Bank, respectively, but no demand had been made against any of ourthese guarantees.
In addition, MMT USA has obtained certificates of deposit totaling $0.6 million to provide guarantees to various international airlines; Luxury Tours has obtained certificates of deposit totaling $0.3 million to provide guarantees to various hotels and packages suppliers; and the ITC Group has obtained certificates of deposit totaling $0.8 million to provide guarantees to various international airlines.
Apart from the foregoing borrowings, we have no outstanding bank loans or financial guarantees or similar commitments to guarantee our payment obligations or those of third parties.
We believe that our current cash and cash equivalents and cash flow from operations will be sufficient to meet our anticipated regular working capital requirements and our needs for capital expenditures, for the next 12 months. We may, however, require additional cash resources due to changing business conditions or other future developments, including any investments or acquisitions we may decide to pursue.
The following table sets forth the summary of our cash flows for the periods indicated:
| Fiscal Year Ended March 31 | Fiscal year ended March 31 | |||||||||||||||||||||||
| 2010 | 2011 | 2012 | 2012 | 2013 | 2014 | |||||||||||||||||||
| (in millions) | (in millions) | |||||||||||||||||||||||
Net cash from/(used in) operating activities | $ | 5.2 | $ | (6.3 | ) | $ | 10.9 | $ | 10.9 | $ | 13.6 | $ | (4.0 | ) | ||||||||||
Net cash from/(used in) investing activities | 3.5 | (3.0 | ) | (46.2 | ) | (46.2 | ) | (17.9 | ) | (64.5 | ) | |||||||||||||
Net cash from/(used in) financing activities | (0.2 | ) | 52.4 | 35.2 | 35.2 | (1.4 | ) | 72.5 | ||||||||||||||||
Net increase/(decrease) in cash and cash equivalents | 8.5 | 43.0 | (0.1 | ) | (0.1 | ) | (5.7 | ) | 4.0 | |||||||||||||||
Cash and cash equivalents at beginning of period | (2.4 | ) | 5.3 | 47.9 | ||||||||||||||||||||
Cash and cash equivalents at beginning of year | 47.9 | 43.8 | 35.6 | |||||||||||||||||||||
Effect of exchange rate fluctuations on cash held | (0.7 | ) | (0.5 | ) | (4.0 | ) | (4.0 | ) | (2.4 | ) | (1.7 | ) | ||||||||||||
Cash and cash equivalents at end of period | 5.3 | (1) | 47.9 | (2) | 43.8 | (3) | ||||||||||||||||||
Cash and cash equivalents at end of year | 43.8 | (1) | 35.6 | (2) | 38.0 | (3) | ||||||||||||||||||
Notes:
| (1) |
| Excludes $44.3 million of term deposits not classified as “cash and cash equivalents.” As of March 31, 2012, we did not have any amounts outstanding under our overdraft facilities. |
| (2) | Includes $0.9 million of bank overdrafts and excludes $48.1 million of term deposits not classified as “cash and cash equivalents.” |
| (3) | Excludes $105.2 million of term deposits not classified as “cash and cash equivalents.” As of March 31, 2014, we did not have any amounts outstanding under our overdraft facilities. |
Net Cash From/(Used In) Operating Activities.Activities
In fiscal year 2012,2014, net cash flows fromused in operating activities were $10.9was $4.0 million, as compared to net cash flows used infrom operating activities of $6.3$13.6 million in fiscal 2011.year ended March 31, 2013. This increasechange resulted from an increase in total collections against revenue from $120.2$236.0 million to $186.6$262.1 million, offset by increases in total cash payments to suppliers in relation to service costs incurred from $73.2$133.6 million to $105.0$170.1 million and total cash outflows in respect of personnel and other operating expenses from $53.3$88.8 million to $97.3 million.
In fiscal year 2013, net cash used in operating activities was $13.6 million, as compared to net cash from operating activities of $10.9 million in fiscal 2012. This change resulted from an increase in total collections against revenue from $186.6 million to $236.0 million, offset by increases in total cash payments to suppliers in relation to service costs incurred from $105.0 million to $133.6 million and total cash outflows in respect of personnel and other operating expenses from $70.7 million to $88.8 million.
In fiscal year 2014, total collection against revenue was $262.1 million, as compared to recognized revenue of $255.4 million, for a difference of $6.7 million. In fiscal year ended March 31, 2013, total collections against revenue were $236.0 million, as compared to recognized revenue of $228.8 million, for a difference of $7.2 million. There was no material change in the total collection against revenue and revenue recognized in fiscal year 2014 as compared to fiscal year 2013. In fiscal year 2012, total collections against revenue were $186.6 million, compared to recognized revenue of $196.6 million, for a difference of $10.0 million. In fiscal year 2011, total collections against revenue were $120.2 million, compared to recognized revenueThe decrease of $124.7 million, for a difference of $4.5 million. The increase of $5.5$17.2 million in the difference between recognition and collection of revenues from fiscal year 20112012 to fiscal year 20122013 was primarily due to an increase in advance from our customers from $2.1 million to $11.4 million, offset by a decrease in receivables from airlines and customers from $2.3 million to $8.7 million, partially offset by a decrease in advances received from our customers from $3.6 million to $2.1 million. Our collections were also reducedincreased by an increasea decrease in withholding tax deductions for commissions or payments received from airlines and other suppliers, which increaseddecreased from $3.1 millionin fiscal year 2011 to $3.6 millionin fiscal year 2012. to $2.0 million in fiscal year 2013.
In fiscal year 2014, total cash payments to suppliers in relation to service costs incurred were $170.1 million, as compared with $149.0 million in service costs accrued. This was primarily due to deposits and advances paid to suppliers for the promotion of our packages products, including advances to airlines for fiscal year 2015. In fiscal year ended March 31, 2013, total cash payments to suppliers in relation to service costs incurred were $133.6 million, as compared with $140.7 million in service costs accrued. This was primarily due to advances from customers for future bookings, particularly in our hotels segment. In fiscal year 2012, total cash payments to suppliers in relation to service costs incurred were $105.2$105.0 million, as compared with $108.4 million in service costs accrued. This was primarily due to deposits and advances paid to suppliers for the promotion of holiday products, including advances to airlines for fiscal year 2013. We also pre-purchased air ticket inventory at favorable rates during fiscal year 2012.
In fiscal year 2011,2014, total cash payments to suppliersoutflows in relation to service costs incurredrespect of personnel and other operating expenses were $73.2$97.3 million, as compared with $63.782.9% of the $117.3 million in service costssuch expenses accrued. ThisIn fiscal year ended March 31, 2013, total cash outflows in respect of personnel and other operating expenses were $88.8 million, 86.7% of the $102.5 million in such expenses accrued. There was primarily due to deposits and advancesno material change in the percentage of expenses paid to suppliers for the promotion of holiday products, including advances to airlines for fiscal year 2012.expenses accrued.
In fiscal year 2012, total cash outflows in respect of personnel and other operating expenses were $70.7 million, 86.9%86.8% of the $81.4 million in such expenses accrued. In fiscal year 2011, total cash outflows in respect of personnel and other operating expenses were $53.3 million, 96.7% of the $55.1 million in such expenses accrued. The decreaseThere was no material change in the percentage of expenses paid to expenses accrued was primarily due to an increase of non-cash employee share-based compensation costs from $0.5 to $6.9 million from fiscal year 2011 to fiscal year 2012.accrued.
Net Cash From/(Used In) Investing Activities.
In fiscal year 2014, cash used in investing activities was $64.5 million. Further, we had invested in term deposits with banks amounting to $59.4 million (computed using average exchange rates for the period), and net investment of $2.1 million in fixed assets, as well as investment of $3.5 million in software and website development projects, partially offset by $2.5 million in interest received on our term deposits and proceeds from sale of fixed assets amounting to $0.2 million. Further, $2.2 million (net of cash acquired) was paid to acquire the ETB Group.
In fiscal year 2013, cash used in investing activities was $17.9 million, primarily as a result of a cash payment of $6.6 million (net of cash acquired) to acquire the Hotel Travel Group, $3.0 million (net of cash acquired) to acquire a majority stake in the ITC Group, and $0.6 million to acquire additional equity interests in My Guest House. Further, we had term deposits with banks amounting to $4.3 million (computed using average exchange rates for the period), and net investment of $2.7 million in fixed assets, as well as investment of $4.1 million in software and website development projects, partially offset by $3.4 million in interest received on our term deposits.
In fiscal year 2012, cash used in investing activities was $46.2 million, primarily as a result of cash deposited in our term deposits with banks amounting to $29.9 million (computed using average exchange rates for the period), and net investment of $5.5 million in fixed assets, as well as investment of $3.5 million in software and website development projects, partially offset by $0.9 million in interest received on our term deposits. We had also made investments of approximately $4.8 million to acquire a 19.98% equity interest in Le Travenues Technology Private Limited, approximately $2.4 million to acquire a majority stake in Luxury Tours & Travel Pte Ltd, Singapore and approximately $1.0 million to acquire a 28.57% equity interest in My Guest House in the fiscal year 2012. In fiscal year 2011, cash used in investing activities was $3.0 million, primarily as a result of cash deposited in our term deposits with banks amounting to $2.5 million (computed using average exchange rates for the period), and net investment of $1.2 million in fixed assets, as well as investment of $1.6 million in software and website development projects, partially offset by $2.3 million in interest received on our term deposits.
Net Cash From/(Used In) Financing Activities. In fiscal year 2014, cash generated from financing activities was $72.5 million, primarily as a result of net proceeds from the issuance of ordinary shares in our follow-on public offering of $73.7 million. Additionally, we collected $0.3 million as proceeds from the issuance of shares on exercise of share based options by certain of our employees. The cash from these issuance was offset by $1.4 million as interest on bank overdrafts and our other finance charges. In fiscal year 2013, cash used in financing activities was $1.4 million, primarily as a result of payment of $0.8 million to complete our acquisition of Luxury Tours. Additionally, we repurchased 40,142 of our own ordinary shares for $0.5 million and paid interest on bank overdrafts and our working capital facilities of $0.6 million. The cash from these payments was partially offset by collection of $0.4 million as proceeds from the issuance of shares on exercise of share options by certain of our employees. In fiscal year 2012, cash from financing activities was $35.2 million, primarily as a result of net proceeds from the issuance of ordinary shares in our follow-on public offering of $35.4 million. Additionally, we collected $0.9 million as proceeds from the issuance of shares on exercise of share options by certain of our employees. The cash from these issuances was partially offset by $0.8 million as interest paid on bank overdrafts and our working capital facilities of $0.8 million. In fiscal year 2011, cash from financing activities was $52.4 million, primarily as a result of net proceeds from the issuance of ordinary shares in our initial public offering of $52.0 million. Additionally, we collected $1.3 million as proceeds from the issuance of shares on exercise of share options by certain of our employees. The cash from these issuances was partially offset by $0.3 million paid for the acquisition of additional interest in MMT India that we purchased from certain of our ex-employees and $0.6 million interest paid on our bank overdrafts and working capital facilities.
Capital Expenditures
We have historically financed our capital expenditure requirements with cash flows from operations, as well as through the sale of our convertible and redeemable preferred shares and ordinary shares.shares and proceeds from our public offerings.
We made capital expenditures of 1.1$9.0 million, $2.8$6.9 million and $9.0$5.6 million in fiscal years 2010, 20112012, 2013 and 2012,2014, respectively. As of March 31, 2012,2014, we had committed capital expenditures of $1.7$0.4 million for fiscal year 2015, substantially all of which we expect to spend $1.4 million during fiscal year 2012 and the remainder over the next three years.in India. In addition, we expect to spend an additional approximately $8.0$7.0 million to $10.0$9.0 million on capital expenditures during fiscal year 2013. The2015. Our capital expenditures in the pasthave principally consisted of purchases of servers, workstations, computers, computer software, leasehold improvements and other items related to our technology platform and infrastructure, upgrading of our websites, as well as improvements to our leasehold premises.
Off-Balance Sheet Arrangements
As of March 31, 2012,2014, MMT India had obtained approximately Rs. 839.91,061.9 million ($15.218.2 million) in bank guarantees, mainlyprimarily from YESIndusInd Bank in favor of IATA, against any payment default by us to all airlines participating in IATA’s bill settlement plan, and MakeMyTrip.com Inc.MMT USA and the ITC Group had obtained certificates of deposit totaling approximately $0.5$0.6 million and $0.8 million, respectively, for the purposes of providing guarantees to various international airlines. Additionally, Luxury Tours & Travel Pte Ltdhad obtained certificates of deposit totaling approximately $0.5$0.3 million for purposes of providing guarantees to various international airlineshotels and packages suppliers for purposes of providing guarantees to various hotels and packages suppliers. Apart from the foregoing, we do not have any outstanding off-balance sheet derivative financial instruments, guarantees, interest rate swap transactions or foreign currency forward contracts. We do not engage in trading activities involving non-exchange traded contracts.
Contractual Obligations
The following table sets forth our contractual obligations as of March 31, 2014. Other than the lease obligations specified below, we do not have any long-term commitments:
| Payment Due by Period | ||||||||||||||||||||
Contractual Obligations | Total | Less than 1 year | 1-3 years | 3-5 years | More than 5 years | |||||||||||||||
| (in thousands) | ||||||||||||||||||||
Operating lease obligations(1) | $ | 10,251.7 | $ | 2,354.1 | $ | 3,465.5 | $ | 2,640.8 | $ | 1,791.4 | ||||||||||
Finance lease obligations(2) | 43.0 | 18.6 | 24.4 | — | — | |||||||||||||||
Purchase obligations(3) | 434.3 | 434.3 | — | — | — | |||||||||||||||
Employee benefits(4) | 963.2 | — | — | — | — | |||||||||||||||
Notes:
| (1) | Operating lease obligations relate to our leasing arrangements for our various office premises. |
| (2) | Finance lease obligations relate to our leasing arrangements for motor vehicles used in our business. |
| (3) | We enter into purchase orders from time to time for various equipment or other requirements for our business. |
| (4) | Employee benefits in the statement of financial position include $963,176 in respect of employee benefit obligation. For this amount, the extent of the amount and timing of repayment/settlement is not reliably estimable or determinable at present and accordingly have not been disclosed in the table above. |
Inflation
The CIA World Factbook estimates that consumer inflation in India was 6.4%9.2% in 2007, 8.3%2012 and 9.6% in 2008, 10.9% in 2009, 11.7% in 2010 and 6.8% in 2011.2013. For more information, see “Item 3. Key Information — D. Risk“Risk Factors — Risks Related to Operations in India — As the Domestic Indian Market Constitutes a Significant Source of Our Revenue, a Slowdown in Economic Growth in India Could Cause Our Business to Suffer.”
Quantitative and Qualitative Disclosures about Market Risk
Our business activities are exposed to a variety of market risks, including credit risk, foreign currency risk and interest rate risk.
Credit Risk.Financial instruments that potentially subject us to concentrations of credit risk consist principally of term deposits, cash equivalents, and trade and other receivables. By their nature, all such financial instruments involve risks, including the credit risk of non-performance by counterparties. Our cash equivalents, bank balances and term deposits are placed with banks with high investment grade credit ratings, and our term deposits may be withdrawn at any time prior to maturity except that this would result in a lower interest rate. Trade and other receivables are typically unsecured and arise mainly from commissions and incentive payments owing to us from our airline suppliers, receivables from our hotel suppliers which represent amounts owing to us from deposits we place with such hotels, and receivables from our corporate and retail customers to whom we typically extend credit periods. We review the credit worthiness of our clients to which we have granted credit terms in the normal course of the business. We believe there is no significant risk of loss in the event of non-performance of the counterparties to these financial instruments, other than the amounts already provided for in our financial statements. See note 3035 to our audited consolidated financial statements in this Annual Report for additional information relating to our exposure to credit risk.
Foreign Exchange Risk.We are exposed to movements in currency exchange rates, primarily those related to the US dollar and the Indian Rupee. As the functional currency of MMT India, our key operating subsidiary, is the Indian Rupee, our exposure to foreign currency risk primarily arises in respect of our non-Indian Rupee-denominated trade and other receivables, trade and other payables and cash and cash equivalents, which were $5.1$8.2 million, $17.1$38.0 million and $3.6$3.0 million, respectively, as of March 31, 2012, and $3.6 million, $11.0 million and $1.0 million, respectively, as of March 31, 2011.2014. Based on our operations in fiscal year 2012,2014, a 10.0% appreciation of the US dollar against the Indian Rupee as of March 31, 2012,2014, assuming all other variables remained constant, would have decreasedincreased our profitloss for the year by $0.8$2.6 million. Similarly, a 10.0% depreciation of the US dollar against the Indian Rupee as of March 31, 2012, assuming all other variables remained constant, would have increased our profit for the year by $0.8 million. Based on our operations in fiscal year 2011, a 10.0% appreciation of the US dollar against the Indian Rupee as of March 31, 2011,2014, assuming all other variables remained constant, would have decreased our profitloss for the year by $0.6$2.6 million.
Further, we are also exposed to movements in currency exchange rates between the US dollar and the Euro. As the functional currency of the Hotel Travel Group is the US dollar, our exposure to foreign currency risk primarily arises in respect of our non-US dollar denominated trade and other receivables, trade and other payables and cash and cash equivalents, which were $1.2 million, $0.8 million and $3.4 million, respectively, as of March 31, 2014. Based on our operations in fiscal year 2014, a 10.0% appreciation of the Euro against the US dollar as of March 31, 2014, assuming all other variables remained constant, would have decreased our loss for the year by $0.4 million. Similarly, a 10.0% depreciation of the US dollarEuro against the Indian RupeeUS dollar as of March 31, 2011,2014, assuming all other variables remained constant, would have increased our loss for the year by $0.4 million.
We are also exposed to movements between the US dollar and the Indian Rupee in our operations, as approximately 7.2%3.9% and 11.1%2.9% of our revenue for fiscal years 20112013 and 2012,2014, respectively, was generated by MMT India from its air ticketing business and received in US dollars although our expenses are generally incurred in Indian Rupees. We currently do not have any hedging agreements or similar arrangements with any counter-party to cover our exposure to any fluctuations in foreign exchange rates. While we do incorporate margins in our pricing to cover any adverse fluctuations in foreign exchange rates, there can be no assurance that such margins will adequately protect us from adverse fluctuations in foreign exchange rates and hence our earnings remain susceptible to foreign exchange rate fluctuations. However as this risk associated with currency exchange is largely confined to our non-Indian Rupee revenue, we believe our exposure is minimal and immaterial.
Interest Rate Risk.Our exposure to interest rate risk for changes in interest rates relates primarily to our term deposits and bank overdrafts. As of March 31, 2012,2014, we had fixed rate financial instruments consisting of $66.3$105.2 million of term deposits. As of March 31, 2011,2013, we had fixed rate financial instruments consisting of $16.9$55.4 million of term deposits and $3.9$0.9 million of variable rate financial instruments, consisting of our bank overdrafts. We have not used any derivative financial instruments to hedge interest rate risk. We have not been exposed nor do we anticipate being exposed to material risks due to changes in interest rates. Our future interest income and financing cost may fluctuate in line with changes in interest rates. We do not account for any fixed rate financial instruments at fair value through profit or loss. As of March 31, 2012,2014, we had no amount outstanding on account of variable rate financial instruments. Accordingly, a change in interest rates as of March 31, 2012 would not have affected our profit or loss. Based on our consolidated balance sheet as of March 31, 2012, aA sensitivity analysis shows that any increase in the interest rates as of March 31, 20122014 would not have affected our profit or loss and would not have had any impact on our equity. As of March 31, 2013, we had $0.9 million outstanding on account of variable rate financial instruments. A sensitivity analysis shows that an increase of 100 basis points in interest rates as of March 31, 2013 would have increased loss or decreased profit by $0.1 million and would not have had any impact on our equity. Similarly, a decrease of 100 basis points in interest rates as of March 31, 2013 would have decreased loss or increased profit by $0.1 million and would not have had any impact on our equity.
Certain Non-IFRS Measures
In addition to referring to revenue less service cost, we also refer to adjusted operating profit (loss) and adjusted net profit (loss) which are non-IFRS measures and most directly comparable to results from operating activities and profit (loss) for the year, respectively, each of which is an IFRS measure. We believe that adjusted operating profit (loss) and adjusted net profit (loss) are useful in measuring the results of our company and provide investors and analysts a more accurate representation of our operating results. However, the presentation of these non-IFRS measures are not meant to be considered in isolation or as a substitute for our consolidated financial results prepared in accordance with IFRS as issued by the IASB. These non-IFRS measures may not be comparable to similarly titled measures reported by other companies due to potential differences in the method of calculation.
The following table reconciles our results from operating activities (an IFRS measure) to adjusted operating profit (loss) (a non-IFRS measure) for the periods indicated:
| Reconciliation of Adjusted Operating Profit (Loss) | Fiscal Year Ended March 31 | |||||||||||
| (Unaudited) | 2012 | 2013 | 2014 | |||||||||
| (in millions) | ||||||||||||
Result from operating activities as per IFRS | $ | 4.0 | $ | (18.1 | ) | $ | (15.3 | ) | ||||
Add: Employee share-based compensation costs | 6.9 | 11.7 | 11.1 | |||||||||
Add: Direct cost related to registration of shares by shareholders | — | — | 0.1 | |||||||||
Less: Gain on bargain purchase | — | — | (1.2 | ) | ||||||||
Add: Merger and acquisitions related expenses | 0.2 | 0.7 | 0.4 | |||||||||
Add: Acquisition related intangibles amortization | 0.1 | 0.6 | 1.4 | |||||||||
|
|
|
|
|
| |||||||
Adjusted Operating Profit (Loss) | $ | 11.2 | $ | (5.1 | ) | $ | (3.5 | ) | ||||
|
|
|
|
|
| |||||||
The following table reconciles our profit (loss) for the year (an IFRS measure) to adjusted net profit (loss) (a non-IFRS measure) for the periods indicated:
| Reconciliation of Adjusted Net Profit (Loss) | Fiscal Year Ended March 31 | |||||||||||
| (Unaudited) | 2012 | 2013 | 2014 | |||||||||
| (in millions) | ||||||||||||
Profit (Loss) for the year as per IFRS | $ | 7.0 | $ | (27.6 | ) | $ | (20.9 | ) | ||||
Add: Employee share-based compensation costs | 6.9 | 11.7 | 11.1 | |||||||||
Add: Direct cost related to public offerings | 0.9 | — | 0.5 | |||||||||
Less: Gain on bargain purchase | — | — | (1.2 | ) | ||||||||
Add: Acquisition related intangibles amortization | 0.1 | 0.6 | 1.4 | |||||||||
Add (Less): Net (gain) loss on change in fair value of derivative financial instrument | 0.1 | (0.2 | ) | 0.2 | ||||||||
Add: Merger and acquisitions related expenses | 0.2 | 0.7 | 0.4 | |||||||||
Add (Less): Net change in fair value of financial liability related to business combination | 0.2 | 0.2 | 1.1 | |||||||||
Less: Income tax (benefit) expense | (6.1 | ) | 8.6 | 0.1 | ||||||||
|
|
|
|
|
| |||||||
Adjusted Net Profit (Loss) | $ | 9.3 | $ | (6.0 | ) | $ | (7.3 | ) | ||||
|
|
|
|
|
| |||||||
New Accounting Standards and Interpretations Not Yet Adopted by Our Group
IFRS 9 ‘Financial Instruments’, is part ofFinancial Instruments:In November 2009, the IASB’s wider project to replace IAS 39 ‘FinancialInternational Accounting Standards Board issued IFRS 9, Financial Instruments: Recognition and Measurement’.Measurement, to reduce the complexity of the current rules on financial instruments as mandated in IAS 39. IFRS 9 retains but simplifies the mixed measurement modelhas fewer classification and establishes two primary measurement categories as compared to IAS 39 and has eliminated the categories of held to maturity, available for financial assets, amortized costsale and fair value. The basisloans and receivables. Further it eliminates the rule-based requirement of classification depends on the entity’s business modelsegregating embedded derivatives and the contractual cash flow characteristics of the financial asset. The effective datetainting rules pertaining to held to maturity investments. For an investment in an equity instrument which is not held for trading, IFRS 9 is annual periods beginningpermits an irrevocable election, on or after January 1, 2015 with early adoption permitted. We are ininitial recognition, on an individual share-by-share basis, to present all fair value changes from the process of evaluating the impact of the new standard.
IFRS 10, ‘Consolidated Financial Statements’, which replaces parts of IAS 27, ‘Consolidated and Separate Financial Statements and all of SIC-12, ‘Consolidation – Special Purpose Entities’, builds on existing principles by identifying the concept of control as the determining factor in whether an entity should be included within the consolidated financial statements of the parent company. IFRS 10 is effective for annual periods beginning on or after January 1, 2013. We are evaluating the impact of IFRS 10 on our consolidated financial statements. The remainder of IAS 27, ‘Separate Financial Statements’, now contains accounting and disclosure requirements for investments in subsidiaries, joint ventures and associates only when an entity prepares separate financial statements and is therefore not applicable in preparing our consolidated financial statements.
IFRS 12, ‘Disclosure of Interest in Other Entities’, is a new and comprehensive standard on disclosure requirements for all forms of interestsinvestment in other entities, including joint arrangements, associates, special purpose vehicles and other off balance sheet vehicles. The standard includes disclosure requirements for entities covered under IFRS 10 and IFRS 11. IFRS 12 is effective for annual periods beginning on or after January 1, 2013. We are evaluating the impact of IFRS 12 on our consolidated financial statements.
IFRS 13, ‘Fair Value Measurement’, provides guidance on how fair value should be applied where its use is already required or permitted by other standards within IFRS, including a precise definition of fair value and a single source of fair value measurement and disclosure requirements for use across IFRS. IFRS 13 is effective for annual periods beginning on or after January 1, 2013. We are evaluating the impact of IFRS 13 on our consolidated financial statements.
IAS 1 (Amended), Presentation of Financial Statements, was publishedcomprehensive income. No amount recognized in June 2011. The amendments to IAS 1 Presentation of Financial Statements require companies preparing financial statements in accordance with IFRS to group items within other comprehensive income that maywould ever be reclassified to the profit or loss separately from those items which would not be recyclableloss. IFRS, 9 was further amended in October 2010, and such amendment introduced requirements on accounting for financial liabilities. This amendment addresses the issue of volatility in the profit or loss sectiondue to changes in the fair value of an entity’s own debt. It requires the entity, which chooses to measure a liability at fair value, to present the portion of the income statement. It also requiresfair value change attributable to the tax associated with items presented before tax to be shown separately for each ofentity’s own credit risk in the two groups of other comprehensive income items (without changing the option to present items of other comprehensive income either before tax or net of tax).
The amendments also reaffirm existing requirements that items in other comprehensive income and profit or loss should be presented as either a single statement or two consecutive statements. This amendment is applicable to annual periods beginning on or after July 1, 2012, with early adoption permitted. We are evaluating the impact of IAS 1 (Amended) on the our consolidated financial statements.
IAS 19 (Amended), Employee Benefits, was issued in June 2011.income. The effective date for adoption of IAS 19 (Amended)companies to adopt IFRS 9 has not yet been determined. The group is annual periods beginning on or after January 1, 2013, though early adoption is permitted.
IAS 19 (Amended) has eliminated an option to defer the recognition of gains and losses through re-measurements and requires such gain or loss to be recognized through other comprehensive income in the year of occurrence to reduce volatility. The amended standard requires immediate recognition of effects of any plan amendments. Further, it also requires
expected return on plan assets recognized in profit or loss to be restricted to government bond yields or corporate bond yields, considered for valuation of projected benefit obligation, irrespective of actual portfolio allocations. The actual return from the portfolio in excess of or less than such yields is recognized through other comprehensive income.
These amendments enhance the disclosure requirements for defined benefit plans by requiring information about the characteristics of defined benefit plans and risks that entities are exposed to through participation in those plans.
The amendments need to be adopted retrospectively. We are currently evaluating the requirements of IAS 19 (Amended),IFRS 9, and havehas not yet determined the impact on ourthe consolidated financial statementsstatements.
Contractual Obligations
Amendments to IAS 32 Offsetting Financial Assets and Financial Liabilities:
In December 2011, the International Accounting Standards Board issued amendments to IAS 32, Offsetting Financial Assets and Financial Liabilities. The following table sets forth our contractual obligations as of March 31, 2012. Other than the lease obligations specified below, we do not have any long-term commitments:
| Payment Due by Period | ||||||||||||||||||||
Contractual Obligations | Total | Less than 1 year | 1-3 years | 3-5 years | More than 5 years | |||||||||||||||
| (in thousands) | ||||||||||||||||||||
Operating lease obligations(1) | $ | 12,481.5 | $ | 2,184.1 | $ | 3,157.2 | $ | 2,704.6 | $ | 4,435.5 | ||||||||||
Finance lease obligations(2) | 133.9 | 35.7 | 56.8 | 35.4 | 6.0 | |||||||||||||||
Purchase obligations(3) | 1,665.8 | 1,377.2 | 288.6 | — | — | |||||||||||||||
Employee Benefits(4) | 681.1 | — | — | — | — | |||||||||||||||
amendments clarify that:
| an entity currently has a legally enforceable right to set-off if that right is |
ITEM 6. DIRECTORS, SENIOR MANAGEMENT AND EMPLOYEES
The group is required to adopt amendments to IAS 32 by accounting year commencing April 1, 2014. The group has evaluated the requirements of amendments to IAS 32 and these are not expected to have a material impact on the consolidated financial statements.
| ITEM 6. | DIRECTORS, SENIOR MANAGEMENT AND EMPLOYEES |
A. Directors and Senior Management
Our board of directors consists of nine10 directors.
The following table sets forth the name, age and position of each of our directors, executive officers and significant employees as of the date hereof:
Name | Age | Position/Title | ||||
| Directors*: | ||||||
| Deep Kalra | 44 | Director, Group Chairman and Group Chief Executive Officer | ||||
| 41 | Director and Group Chief Commercial Officer | |||||
| Rajesh Magow | 45 | Director and Chief Executive Officer —India | ||||
| Aditya Tim Guleri | 49 | Director | ||||
| Philip C. Wolf | 57 | Director | ||||
| Vivek N. Gour | 51 | Independent Director | ||||
| Frederic Lalonde | 40 | Independent Director | ||||
| Ranodeb Roy | 46 | Independent Director | ||||
| Gyaneshwarnath Gowrea | 48 | Director | ||||
| 35 | Director | |||||
| Executive Officers | ||||||
| 43 | Group Chief Financial | |||||
| Mohit Gupta | 41 | Group Chief Business and Marketing Officer | ||||
| 46 | |||||
| Group Chief Technology Officer | |||||
Notes:
| (1) | Mr. Naushad Ally Sohoboo was appointed as a director with effect from May 20, 2014. |
| (2) | Other than directors who are also executive officers. |
| Mr. |
Directors
Unless otherwise indicated, the business address offor our directors and executive officers is Tower A, SP Infocity, 243, Udyog Vihar, Phase 1, Gurgaon, Haryana 122016, India.
Deep Kalrais our founder,co-founder, group chairman and group chief executive officer, and was appointed to our board of directors on October 9, 2001. Mr. Kalra’s responsibilities as group chief executive officer include executing our business strategy and managing the overall performance and growth of our company. Mr. Kalra has over 1921 years of experience in e-commerce, sales, corporate finance and financial analysis. Prior to founding our company in April 2000, Mr. Kalra worked with GE Capital, a subsidiary of the General Electric Company, for just over a year, where he was vice president of business development. Mr. Kalra had previously also worked with AMF Bowling Inc. and ABN AMRO Bank. Both General Electric Company is a NYSE-listed company, and AMF Bowling are listed companies in the United States.Inc. was a NYSE-listed company when Mr. Kalra is also a member of the executive council of the National Association of Software and Services Companies (NASSCOM) in India and chairs NASSCOM’s Internet working group.worked there. He is also the president and a board member of The Indus Entrepreneurs (TiE) and a founding member of IAMGURGAON, a non-governmental organization focused on improving the quality of life in Gurgaon. Mr. Kalra has a bachelor’s degree in economics from St. Stephen’s College, Delhi University, India, and a master’s degree in business administration from the Indian Institute of Management, Ahmedabad, India.
Ravi AdusumalliKeyur Joshi is our co-founder and group chief commercial officer, and was appointed to our board of directors on July 20, 2005November 6, 2012. Prior to co-founding our company in 2000, Mr. Joshi worked with Around the World Travel (now known as Justfares.com) in Seattle, United States, and he has over 14 years of experience in the online travel industry. Mr. Joshi also served as senior officer with Tata Motors from March 1997 to March 1998. Mr. Joshi has a bachelor’s degree in chemistry from Gujarat University, India, and a master’s degree in business administration from the City University of New York, United States.
Rajesh Magow is our co-founder and chief executive officer for India, and was appointed to our board of directors on November 6, 2012. Mr. Magow has over 21 years of experience in the information technology and Internet industries. After being part of our senior management team in 2001 for a few months, Mr. Magow worked as part of senior management with Tecnovate eSolutions Private Limited, a wholly-owned subsidiary of eBookers.com (a United Kingdom-based online travel company that was listed on NASDAQ until it was acquired by the Cendant group in February 2005) from 2001 to June 2006. Mr. Magow was part of the senior management team that set up eBookers’ call center and back office operations in India and was a board member of Tecnovate from January 2001 to June 2006. Prior to Tecnovate, he also worked with Aptech Limited and Voltas Limited. Mr. Magow rejoined our company in 2006. Mr. Magow also serves as a nomineedirector of SAIF. HeFlipkart Pte. Ltd., Singapore. Mr. Magow is a partnerchartered accountant from the Institute of SAIF Partners II L.P., or SAIF Partners, and has been engaged by SAIF Partners since 2002. Prior to that, Mr. Adusumalli worked with Credit Suisse First Boston as an associate and also with Wasatch Funds. Mr. Adusumalli has a bachelorChartered Accountants of arts degree from Cornell University, United States. The business address for Mr. Adusumalli is PO Box 12430, Zephyr Cove, NV 89448, United States.India, New Delhi.
Aditya Tim Guleriwas appointed to our board of directors on April 3, 2007 as a nominee of Sierra Ventures VIII-A, L.P., Sierra Ventures VIII-B, L.P. and Sierra Ventures Associates VIII, LLC, or the Sierra Ventures entities. Mr. Guleri is a managing member of Sierra Ventures Associates VIII, LLC, the general partner of Sierra Ventures VIII-A, L.P. and Sierra Ventures VIII-B, L.P., and in that capacity, he serves on the boards of directors of various companies that Sierra Ventures invests in, providing operational and financial guidance. Prior to joining Sierra Ventures Associates VIII, LLC in February 2001, Mr. Guleri was vice chairman and executive vice president with Epiphany, Inc. from March 2000 until February 2001, and prior to that, he was chairman, chief executive officer and co-founder of Octane Software Inc. since September 1997. He started his career in September 1989 with the information technology team at LSI Logic Corporation until September 1991 and worked with Scopus Technology Inc. from 1992 until 1996. Mr. Guleri has a bachelor of science degree in electrical engineering from Punjab Engineering College, Chandigarh, India and a master of science degree in engineering and operating research from Virginia Polytechnic Institute and State University, United States. The business address for Mr. Guleri is 2884 Sand Hill Road, Suite 100, Menlo Park, CA 94025, United States.
Philip C. Wolfwas appointed to our board of directors on July 20, 2005. Until December 31, 2012, Mr. Wolf iswas the non-executive chairman of PhoCusWright Inc., a travel industry research firm he founded in 1994. Mr. Wolf was1994 and served as president and chief executive officer of PhoCusWright prior tountil its acquisition by Northstar Travel Media LLC in June 2011. Prior to founding PhoCusWright, Mr. Wolf was president and chief executive officer of a venture-funded software developer and travel booking engine pioneer which held two patents for its pricing algorithms. He also sits on the board of Sparrow Media, LLC. Formerlyvarious companies, including Hopper, QuickMobile, Booking Markets, TrustYou and Travel.ru. Mr. Philip was an adjunct professor at New York University’s GraduatePreston Robert Tisch Center for Hospitality, Tourism and Sports Management, he is currentlyand a distinguished lecturer at the Cornell University School of Hotel Administration. Mr. Wolf has a bachelor of arts degree in public policy studies from Duke University, United States and a master’s degree in business administration from the Owen Graduate School of Management, Vanderbilt University, United States. The business address for Mr. Wolf is 1 Route 37 East, Suite 200, Sherman, CT 06784,6 Huckleberry Lane, Truro, MA 02666-0329, United States.
Vivek N. Gourwas appointed to our board of directors on May 1, 2010. Mr. Gour is also the managing director and chief executive officer of Air Works India Engineering Private Limited, a privately held company in which he has a significant equity stake. Prior to joining our company, Mr. Gour was the chief financial officer of Genpact Limited from January 2005 to February 2010; Genpact is listed on the New York Stock Exchange. From October 2003 to December 2004, Mr. Gour served as chief financial officer for GE Global Business Processes. From October 2002 to September 2003, he served as chief financial officer of GE Capital India, and from August 2001 to September 2002 as senior vice-president (strategic projects) of GE Capital India. Mr. Gour has a bachelor of commerce degree from Mumbai University, India, and a master of business administration (finance) from Delhi University, India. The business address for Mr. Gour is Kalyani House, Plot # 40, 1st Floor, Sector 18, Gurgaon – 122001, Haryana, India.
Frederic Lalondewas appointed to our board of directors on December 18, 2006. Mr. Lalonde is the founder, director and chief executive officer of Hopper Inc. (formerly known as Openplaces Inc.), a privately held company which runs www.hopper.travel,www.hopper.com, a travel search engine. Prior to founding his own company, Mr. Lalonde worked at Expedia Inc. from 2004 to 2006 where he served as vice president of hotel supplier strategy and vice president of hotels and packages product planning. Mr. Lalonde has also been a director of Sparrow Media LLC since August 2009. The business address for Mr. Lalonde is 5795, Ave de Gaspe, Suite 100, Montreal, QC, Canada, H2S 2X3.
Ranodeb Roywas appointed to our board of directors on January 19, 2012. Mr. Roy is a director and the chief executive officer of RV Capital Management Private Limited.Limited based in Singapore. Prior to joining our board of directors, Mr. Roy was a managing director and head of fixed incomethe Fixed Income Division – Asia Pacific at Morgan Stanley from March 2008 to December 2011 and was responsible for the fixed income division in Asia.2011. Mr. Roy has also worked at Merrill Lynch, Hong Kong as managing director, co-head of fixed income currencyFixed Income Currency and commodities,Commodities, or FICC, group in 2007 where he was, responsible for FICC business in Asia.2007. He has also held various senior positions at Merrill Lynch in major financial centers, including New York, Tokyo and Hong Kong. Mr. Roy started his career at Bank of America in Mumbai in 1992. Mr. Roy has a master’s degree in business administration, with majors in finance and marketing, from the Indian Institute of Management, Ahmedabad, India and a bachelor’s degree in computer science and engineering from the Indian Institute of Technology at Kanpur, India. The business address offor Mr. Roy is 50 Raffles Place, 37F3 Phillip Street, #15-05 Royal Group Building, Singapore Land Tower, Singapore 048623.
Gyaneshwarnath Gowreawas appointed to our board of directors on February 11, 2009 and is one of our resident directors in Mauritius. Mr. Gowrea has been ais the head of tax of the Cim group, the parent company of Multiconsult. He was the managing director withof Multiconsult Limited since 2009.from 2009 to 2011. From 2007 to 2008, he was director of GlobalAAAGlobal Services Ltd. and from 1999 to 2006 he was a manager with Multiconsult. Mr. Gowrea completed his secondary education at John Kennedy College in Mauritius and holds various professional qualifications, including being a fellow of the Chartered Association & Certified Accountants, United Kingdom and a fellow of the Mauritius Institute of Directors.Directors, member of the Trust and Estate Practitioners, member of the Institute of Fiscal Association and also hold a Master degree The business address for Mr. Gowrea is Rogers House, 5 President John KennedyLes Cascades Building, 33 Edith Cavell Street, Port Louis, Mauritius.
Mohammad Akhtar JanallyNaushad Ally Sohoboowas appointed to our board of directors on February 11, 2009May 20, 2014 and is one of our resident directors in Mauritius. Mr. JanallySohoboo is a manager at Multiconsult,within the Cim Global Business, having joined Multiconsult Limited (now part of Cim Group) in July 2003.August 2004. He has a wide range of experience in corporate secretarial work and accounting. At the Cim Group, he is involved in the structuring, set-up, taxation and administration of various global business entities promoted by a wide portfolio of clients, including large multinational companies and high net-worth individuals. He is also a director of several client companies of Cim Global Management. Mr. JanallySohoboo completed his secondary education from the Islamic Cultural College, Mauritius. He is also a member of the Association of Chartered Certified Accountants, United Kingdom.UK since 2012 and is registered as a Professional Accountant with the Mauritius Institute of Professional Accountants. He is also a member of the Mauritius Institute of Directors. The business address for Mr. JanallySohoboo is Rogers House, 5 President John Kennedyc/o Multiconsult Limited, Les Cascades Building, 33 Edith Cavell Street, Port Louis, Mauritius.
Executive Officers
The business address for our executive officers is Tower A, SP Infocity, 243, Udyog Vihar, Phase 1, Gurgaon, Haryana 122016, India.
Keyur JoshiMohit Kabrais our co-founder and group chief commercialfinancial officer. Prior to co-founding our companyjoining us in 2000,July 2011, Mr. Joshi worked with Around the World Travel (now renamed Justfares.com) in Seattle, United States, and he has over 11 years of experience in the online travel industry. Mr. Joshi alsoKabra served as senior officer with Tata Motorsa Director of Finance in Kohler India from March 1997 to March 1998. Mr. Joshi has a bachelor’s degree in chemistry from Gujarat University, India, and a master’s degree in business administration from the City University of New York, United States.
Rajesh Magowis our co-founder and group chief financial and operating officer. Mr. Magow has over 19 years of experience in the information technology and Internet industries. After being part of our senior management team in 2001 for a few months, Mr. Magow worked as part of senior management with Tecnovate eSolutions Private Limited, a wholly-owned subsidiary of eBookers.com (a United Kingdom-based online travel company that was listed on NASDAQ until it was acquired by the Cendant group in February 2005) from 20012006 to June 2006.2011. Mr. Magow was partKabra holds a bachelor of the senior management team that set up eBookers’ call center and back office operations in India and was a board member of Tecnovatecommerce degree from January 2001 to June 2006. Prior to Tecnovate, he also worked with Aptech Limited and Voltas Limited. Mr. Magow rejoined our company in 2006. Mr. Magow also serves as a director of Flipkart Private Limited, Singapore. Mr. MagowSt. Joseph’s Junior College. He is a chartered accountantqualified Chartered Accountant from the Institute of Chartered Accountants of India, New Delhi.
Mohit Guptais our group chief business and marketing officer. Prior to joining us in May 2008, Mr. Gupta served as vice president, marketing for Pepsi Foods Private Limited and worked in numerous other capacities at Pepsi Foods Private Limited. from July 1998 to April 2008. Mr. Gupta holds a bachelor of engineering (mechanical) degree from Sardar Patel University, Vallabh Vidyanagar, India and a master’s degree in business administration from the Indian Institute of Management, Kolkata, India.
Amit Somaniis our group chief products officer. Prior to joining us in January 2010, Mr. Somani served as group product manager for Google Inc. (India) from July 2007 to December 2009, and prior to that as director of engineering and product management at IBM in San Jose, California, United States, from July 1995 to May 2007. Mr. Somani has over 16 years of experience in online businesses. Mr. Somani holds a bachelor of technology degree in computer science and engineering from the Institute of Technology, Banaras Hindu University, Varanasi, India and a master’s degree in computer science from the University of Wisconsin, United States. Mr. Somani holds seven patents and is the recipient of three IBM outstanding technical achievement awards.
Sanket Atal is our group chief technology officer. Mr. Atal has over 2023 years of experience in software development and has managed large organizations. From June 2010 to June 2012, Mr. Atal was Senior Vice President and General Manager for the India Technology Center of CA Technologies in Hyderabad, which is CA Technologies’ largest center worldwide. Prior to joining CA Technologies, he worked at Oracle from January 1997April 2006 till June 2010. Mr. Atal was one of the founders of Oracle’s research and development center in Portland, Oregon and worked there until his relocation to India in August of 2006. In India, he headed product development for Oracle’s Server Technologies division with teams in Bangalore, Hyderabad and Noida. He began his career with Sequent Computer Systems, and later Informix, where he worked on a joint project to develop a parallel processing Relational Database Management System. Mr. Atal holds a bachelor’s degree in computer science and mathematics from Cornell University, a master’smaster of science degree in computer science from the University of Wisconsin-MadisonWisconsin, Madison and a master’smaster degree in business administration from the University of Oregon.
B. Compensation
For fiscal year 2012,2014, the aggregate compensation (including director’s fees, but excluding grants of stock options and RSUs that are described below) to our directors and executive officers included in the list under the heading “— Directors and Executive Officers of our Group” was $1.4$2.5 million, which included $0.3$0.5 million in base salary, $0.2$0.3 million in housing and rent allowance, $0.2$0.5 million in special allowances and $0.7$1.2 million in performance linked bonuses and others.other payments. The foregoing compensation figures include $0.06$0.1 million which may be awarded in the form of RSUs at the option of the relevant director. Mr. Naushad Ally Sohoboo, our director who was appointed to the board of directors with effect from May 20, 2014 did not receive any compensation during fiscal year 2014. Our employment agreements (as amended from time to time) with each of our group chairman and group chief executive officer, chief executive officer – India, group chief financial and operatingcommercial officer and group chief commercialfinancial officer provide for bonus entitlements calculated as a percentage of gross annual salary and linked to gross sales targets of our company. Our employment agreements with our other executive officers provide for a variable performance component which is payable upon each of the individual officer and our company attaining certain performance targets. Except as otherwise disclosed, these aggregate cash compensation amounts for fiscal year 20122014 do not include stock compensation and employee benefits to our directors and executive officers. Stock compensation to our directors and executive officers are disclosed separately in the tables under “— Outstanding Options” and “Outstanding RSUs,” and employee benefits to our directors and executive officers are disclosed separately under “— Employee Benefit Plans.”
Share Incentive Plans
Equity Option Plan
Our board of directors adopted the MakeMyTrip.com 2001 Equity Option Plan, or our Equity Option Plan, on January 12, 2001, retrospectively effective from June 1, 2000, pursuant to the enabling authority granted under a shareholders’ resolution dated January 12, 2001, in order to attract and retain appropriate talent in the employment of our company, to motivate our employees with incentives, to create shareholder value by aligning the interests of employees with the long term interests of our company and to create a sense of ownership and provide wealth creation opportunities for our employees. MMT India had also adopted an equity option plan in 2006. Employees who were previously granted options under the MMT India Equity Option Plan have instead been granted options under our Equity Option Plan. The MMT India Equity Option Plan and all options granted to employees under such plan were terminated with effect from July 14, 2010.
Although we do not intend to make additional grants under our Equity Option Plan, the options already granted under Equity Option Plan continue to remain valid and exercisable. The following paragraphs describe the principal terms of our Equity Option Plan.
Administration
Our Equity Option Plan is administered by the compensation committee of our board of directors. Among other things, our compensation committee determines the terms and conditions of each option grant, including, but not limited to, the number of options, exercise price, vesting period, exercise period and any lock-in period, forfeiture provisions, adjustments to be made to the number of options and exercise price in the event of a change in capital structure or other corporate action, and satisfaction of any performance conditions.
Vesting Schedule
Unless otherwise specified in the grant, all initial grants made to any individual vest in the following manner:
10% on the expiry of 12 months from the date of grant.
20% on the expiry of 24 months from the date of grant.
30% on the expiry of 36 months from the date of grant.
40% on the expiry of 48 months from the date of grant.
Unless otherwise specified in the grant, all subsequent grants made on the basis of the performance of the individual vest in four equal installments at the anniversary of the respective grant date. Our compensation committee has absolute discretion to vary such vesting dates as it deems fit. Other than as set forth under “— Outstanding Options,” all options we have granted to date have vested in full on their respective grant dates.
Option Exercise and Expiration
Unless otherwise specified in the grant, vested options must be exercised prior to the earliest of the following dates:
48 months from the vesting date.
72 months from the date of grant.
six months following the recipient’s date of voluntary resignation or termination of employment, other than due to death, disablement or retirement.
one year following the death of a recipient or termination due to disablement or retirement.
Cashless Exercise of Options
Our Equity Option Plan permits holders of options to exercise their options using a cashless exercise method. In a cashless exercise, the holder of options exercises the options by simultaneously selling the shares underlying the options upon exercise. Our board or compensation committee may also require the holder of options (especially in the case where such method of cashless exercise may contravene certain regulatory requirements) to surrender the options to our company at the selling price of the shares underlying the options in lieu of such exercise and simultaneous sale of shares. In each of the foregoing, the holder of options is only entitled to receive the difference between the selling price and the exercise price for the options, after deductions for all applicable taxes and expenses.
Pursuant to the terms of our Equity Option Plan, any holder of options who may be restricted or prevented by applicable laws and regulations from paying in full or in part the exercise price of his or her options or from exercising such restricted options and acquiring our ordinary shares, will be required to exercise such restricted options using the cashless exercise method, as described above.
Effect of Change of Control or Restructuring of Capital
Upon any restructuring of capital or the occurrence of a change of control of our company, the recipient of any option that is outstanding at the time of such restructuring or change of control will be entitled to such number and type of securities that is being offered in lieu of the shares underlying such option by virtue of such restructuring of capital or change of control, if any.
Amendment or Termination
Our board of directors may at any time amend, alter or terminate our Equity Option Plan or any grant under our Equity Option Plan. However, amendments to any grant under our Equity Option Plan are subject to consent from the recipient of such grant, if such amendment would impair or prejudice the rights of such recipient. Additionally, the approval of shareholders holding not less than 75% of our issued share capital will be required to increase the number of shares available for issuance under options granted pursuant to our Equity Option Plan, change the exercise price of any option or to extend the maximum period during which grants under our Equity Option Plan may be made. The term of our Equity Option Plan was for an initial seven years but was extended to June 1, 2012 pursuant to a board resolution passed on June 12, 2009 which had retrospective effect from June 1, 2007. Our Equity Option Plan was subsequently amended and restated, and extended to June 1, 2014, pursuant to board and shareholder resolutions passed on May 25, 2010. We have not extended the validity of this plan, but the existing grants under this plan remain valid as per the terms of the original grant.
Number of Shares granted under 2001 Equity Option Plan
As of March 31, 2012,2014, pursuant to our Equity Option Plan, we had outstanding options exercisable into a total of 823,221478,918 ordinary shares with exercise price ranging from $0.4875 to $5.3940.
Share Incentive Plan
We adopted the MakeMyTrip 2010 Share Incentive Plan on May 25, 2010, or our Share Incentive Plan, upon which our Share Incentive Plan became immediately effective. Although our Equity Option Plan will continue to be valid under its terms and will govern the terms of all options granted thereunder, we intend to grant all new equity share awards under our Share Incentive Plan.
The purpose of our Share Incentive Plan is to promote the success and enhance the value of our company by linking the personal interests of the members of our board, employees and consultants of our company, subject to restrictions under applicable law, to those of our shareholders and by providing such individuals with an incentive for outstanding performance to generate superior returns to our shareholders. Our Share Incentive Plan is further intended to provide us with flexibility in our ability to motivate, attract and retain the services of such individuals upon whose judgment, interest and special effort the successful conduct of our operations are largely dependent.
The following paragraphs describe the principal terms of our Share Incentive Plan.
Administration
Our Share Incentive Plan is administered by our board of directors which, to the extent permitted by applicable laws, may delegate its authority to one or more members of our board or one or more officers of the company, subject to certain restrictions set forth in our Share Incentive Plan.
Shares Available for Awards
Subject to certain adjustments set forth in our Share Incentive Plan, the aggregate number of shares that may be issued or awarded under our Share Incentive Plan is equal to (i) ten percent (10%) of the shares outstanding on the effective date (i.e., May 25, 2010) plus (ii) an increase on the date we consummated our initial public offering, by such amount such that the number of shares which may be issued or transferred pursuant to awards under our Share Incentive Plan will be equal to ten percent (10%) of the shares outstanding on such date, which were 3,413,400 plus (iii) an annual increase on the first day of each year beginning January 1, 2011 and ending January 1, 2019 by such amount that the number of shares which may be issued or transferred pursuant to awards under our Share Incentive Plan will equal ten percent (10%) of the shares outstanding on the last day of the immediately preceding fiscal year or (iv) such smaller number of shares as determined by our board of directors. To the extent that an award terminates, expires or lapses for any reason, or is settled in cash and not shares, then any shares subject to the award will again be available for the grant. Any shares delivered by the holder or withheld by our company upon the exercise of any award, in payment of the exercise price or tax withholding, may again be optioned, granted or awarded, subject to certain limitations set forth in our Share Incentive Plan.
Eligibility
Our employees, consultants and non-employee directors are eligible to be granted awards, except that awards will not be granted to consultants or non-employee directors who are residents of any country in the European Union and any other country, which, pursuant to applicable laws, does not allow grants to any non-employees or consultants.
Options
Our board of directors is authorized to grant options on shares. The per share option exercise price of all options granted pursuant to our Share Incentive Plan will be determined by our board of directors, which may be a fixed or variable price related to the fair market value of the shares; provided that no option may be granted to an individual subject to taxation in the United States at less than the fair market value on the date of the grant, without compliance with Section 409A of the United States Internal Revenue Code of 1986, as amended (or the Code), or the holder’s consent. Our board of directors will determine the methods of payment of the exercise price of an option, which may include without limitation cash or check, shares, proceeds or other forms of legal consideration acceptable to our board of directors. The term of options granted under our Share Incentive Plan may not exceed 10 years from the date of grant. Except as limited by the requirements of Section 409A of the Code, our board of directors may extend the term of any outstanding option and may extend the time period during which vested options may be exercised, or may amend any other term or condition of such option, in connection with any termination of service of the holder.
Restricted Shares
Our board of directors is authorized to grant shares subject to various restrictions, including without limitation restrictions on transferability.
Share Appreciation Rights
Our board of directors is authorized to grant share appreciation rights to eligible individuals, entitling the holder to receive an amount determined by multiplying the difference obtained by subtracting the exercise price per share of the share appreciation right from the share value on the date of exercise of the share appreciation right by the number of ordinary shares with respect to which the share appreciation right is exercised, subject to any limitations our board of directors may impose. The term of share appreciation rights will be set by our board of directors. Amounts payable upon exercise of a share appreciation right will be in cash, shares or a combination of both, as determined by our board of directors.
Dividend Equivalents
Our board of directors may grant dividend equivalents based on dividends declared on the ordinary shares of our company. Such dividend equivalents will be converted to cash by such formula and at such time and subject to such limitations as may be determined by our board of directors.
Share Payments
Our board of directors is authorized to make share payments, which may, but are not required to be made, in lieu of base salary, bonus, fees or other cash compensation. The number or value of shares of any share payment will be determined by our board of directors and may be based upon any criteria, including service to our company, as determined by our board of directors.
Deferred Shares
Our board of directors is authorized to grant deferred shares based on any specific criteria, including service to our company, as our board of directors determines. Shares underlying a deferred share award will not be issued until the deferred share award has vested, pursuant to a vesting schedule or other conditions or criteria set by our board of directors. Unless otherwise provided by our board of directors, a holder of deferred shares will have no rights as a shareholder with respect to such deferred shares until the deferred share awards have vested and the shares underlying the deferred share awards have been issued.
Restricted Share Units
Our board of directors is authorized to grant, in its sole discretion, restricted share units, or RSUs, to our directors, executive officers and employees. The RSUs have been awarded so far in lieu of cash compensation, as an incentive for future performance and as a reward for past performance. Each grant of RSUs is subject to various vesting conditions as determined by our board of directors. Such vesting conditions may include, for example, the vesting schedule, expiration dates and employment restrictions.
Upon exercise of a holder’s RSUs, subject to applicable laws, our company will issue to the holder one unrestricted, fully transferable share (or the fair market value of one such share in cash) for each vested and nonforfeitablenon-forfeited RSU. RSUs may be paid in cash, shares or both, as determined by our board of directors.
The RSUs may be exercised using a cashless exercise method. In a cashless exercise, the holder of the RSUs exercises the RSUs by simultaneously selling the shares underlying the RSUs upon exercise. Our board or compensation committee may also require the holder of the RSUs (especially in the case where such method of cashless exercise may contravene certain regulatory requirements) to surrender the RSUs to our company at the selling price of the shares underlying the RSUs in lieu of such exercise and simultaneous sale of shares. In each of the foregoing, the holder of the RSUs is only entitled to receive the difference between the selling price and the exercise price for the RSUs, after deduction of all applicable taxes and expenses.
The term of a dividend equivalent award, share payment award, deferred share award and/or RSU award will be determined by our board of directors in its sole discretion.
During fiscal year 2012,2014, we granted 977,693828,390 RSUs, of which 762,911538,554 RSUs were granted to our directors and executive officers. See “— Outstanding RSUs” for more information.
Adjustments
In the event of certain changes in our capitalization, our board of directors, in its sole discretion, will make such proportionate and equitable adjustments to reflect such changes with respect to (i) the aggregate number and type of shares that may be issued under our Share Incentive Plan, (ii) the terms and conditions of any outstanding awards and (iii) the grant or exercise price per share for any outstanding award under our Share Incentive Plan.
Corporate Transactions
If a corporate transaction occurs and outstanding awards under our Share Incentive Plan are not converted, assumed or replaced by the successor, such awards will generally become fully exercisable and all forfeiture restrictions on such awards will lapse. Upon, or in anticipation of, a corporate transaction, our board of directors may, in its sole discretion, (i) cause any awards outstanding to terminate at a specific time in the future and give each holder the right to exercise such awards during such period of time as our board of directors will determine, (ii) either purchase any award for an amount of cash equal to the amount that could have been attained upon the exercise of such award or realization of the holder’s rights had such award been currently exercisable or payable or fully vested or (iii) replace such award with other rights or property selected by our board of directors in its sole discretion.
Non-transferability
Awards granted under our Share Incentive Plan are generally not transferable during the lifetime of the award holder.
Amendment, Suspension or Termination
Unless terminated earlier, our Share Incentive Plan will expire on, and no award may be granted pursuant to it after, the tenth anniversary of its effective date. Any awards that are outstanding on the tenth anniversary of the effective date of our Share Incentive Plan will remain in force according to the terms of our Share Incentive Plan and the applicable award agreement. Except as otherwise provided in our Share Incentive Plan, our board of directors may terminate, amend or modify our Share Incentive Plan at any time and from time to time. However, shareholder approval will be required for any amendment (i) to the extent necessary and desirable to comply with applicable laws and (ii) that results in an increase in benefits that would not apply equally to all shareholders of shares or a change in eligible individuals. Except as provided in our Share Incentive Plan or any award agreement, any amendment, suspension or termination may not impair any rights or obligations under any award without the award holder’s consent.
Outstanding Options
During fiscal year 2010, options to acquire 1,201,240 ordinary shares were granted to several of our directorsyears 2012, 2013 and executive officers. During fiscal years 2011 and 2012,2014, no options were granted to any of our directors and executive officers under our Equity Option Plan. As of March 31, 2014, 408,968 outstanding options were held by our directors and executive officers as set forth in the following table,table. As of April 30, 2014, 408,968 outstanding options as of March 31, 2012 were:were held by our directors and executive officers.
Name | Shares Underlying Outstanding Options | Exercise Price | Date of Grant | Date of Expiration | Shares Underlying Outstanding Options | Exercise Price ($ per Share) | Date of Grant | Date of Expiration | ||||||||||||||||||||||||
| ($ per share) | ||||||||||||||||||||||||||||||||
Keyur Joshi | 89,000 | 1.98 | June 25, 2009 | June 25, 2013 | (1) | 16,250 | 1.98 | June 25, 2009 | June 25, 2017 | (1) | ||||||||||||||||||||||
Rajesh Magow | 182,140 | 0.74 | June 25, 2009 | June 25, 2013 | (1) | 182,140 | 0.74 | June 25, 2009 | June 25, 2017 | (1) | ||||||||||||||||||||||
| 114,000 | 1.98 | June 25, 2009 | June 25, 2013 | (1) | 114,000 | 1.98 | June 25, 2009 | June 25, 2017 | (1) | |||||||||||||||||||||||
| 32,981 | 0.53 | June 25, 2009 | June 25, 2013 | (1) | 32,981 | 0.53 | June 25, 2009 | June 25, 2017 | (1) | |||||||||||||||||||||||
Other directors and executive officers(5) | 72,000 | (2) | 0.53 | June 25, 2009 | June 25, 2013 | (1) | ||||||||||||||||||||||||||
Other directors and executive officers | 1,000 | 0.53 | June 25, 2009 | June 25, 2017 | (1) | |||||||||||||||||||||||||||
| 50,000 | (3) | 5.06 | June 25, 2009 | June 25, 2013 | (1) | 28,918 | 5.06 | June 25, 2009 | June 25, 2017 | (1) | ||||||||||||||||||||||
| 135,000 | 0.53 | January 4, 2010 | See note | (4) | 33,679 | 0.53 | January 4, 2010 | November 9, 2014 | ||||||||||||||||||||||||
Notes:
| (1) | All these options vested upon the date of grant and |
| In |
Outstanding RSUs
During fiscal year 2012, 762,9112014, 538,554 RSUs were issued under our Share Incentive Plan to our directors and executive officers, of which 2,4363,900 fully vested RSUs were granted to our directors in lieu of cash compensation owed to them through March 31, 2011.for fiscal year 2013. As set forth in the following table, outstanding RSUs as of March 31, 20122014 were:
| ||||||||
| ||||||||
| ||||||||
| ||||||||
| ||||||||
Name Deep Kalra Keyur Joshi Rajesh Magow Other executive officers Other directors Shares Underlying
Outstanding RSUs Total RSUs
Granted in
Fiscal Year
2014 Exercise
Price ($ per Share) 688,433 137,366 0.0005 275,324 135,941 0.0005 324,665 174,887 0.0005 139,087 86,460 0.0005 10,345 3,900 0.0005
Notes:
Employee Benefit Plans
We maintain employee benefit plans in the form of certain statutory and incentive plans covering substantially all of our employees. For fiscal year 2012,2014, the aggregate amount set aside or accrued by us to provide for pension or retirement benefits for all our employees (including our directors and executive officers) was $1,102,653.
Provident Fund
In accordance with Indian law, all of our employees in India are entitled to receive benefits under the Employees’ Provident Fund Scheme, 1952, as amended, a retirement benefit scheme under which an equal amount of 12% of basic salary of an employee is contributed both by employer and employee in a fund with government/trust with company. Also, in accordance with applicable laws, all of our employees at our non-Indian subsidiaries are entitled to receive benefits under the relevant provident fund laws and regulations applicable in such jurisdictions. Our company makessubsidiaries make a monthly deposit to a government fundthese funds and we have contributed an aggregate of an aggregate of $955,497approximately $1.2 million in fiscal year 2012.2014.
Gratuity
In accordance with Indian law, we pay gratuity up to our eligible employees in India. Under our gratuity plan, an employee is entitled to receive a gratuity payment on the termination of his or her employment if the employee has rendered continuous service to our company for not less than five years, or if the termination of employment is due to death or disability. The amount of gratuity payable to an eligible employee is equal to 15 days’ salary for every year of employment (or any portion of a year exceeding six months), and currently the aggregate amount of gratuity shall not exceed Rs. 1,000,000Rs.1,000,000 (approximately $18,000)$17,135). We have provided for an aggregate of $58,730approximately $0.1 million in fiscal year 2010, an2012, aggregate of $176,957approximately $0.2 million in fiscal year 20112013 and an aggregate of $147,156approximately $0.2 million in fiscal year 20122014 for our gratuity payments.
Employment Agreements with Executive Officers
Each of our executive officers has entered into an employment agreement with MMT India. These agreements do not have fixed terms of employment. We may terminate the employment of our officers for cause, at any time, without notice or remuneration, for certain acts of the executive officer, including but not limited to any criminal offense theft, fraud, embezzlement, intoxication, violence, sexual harassment or damage to our reputation. Generally, either party may terminate employment at any time by giving the other party a written notice of three months or by paying an amount equal to three month’s salary in lieu of such notice. The employment agreements of Messrs. Deep Kalra, Keyur Joshi and Rajesh Magow were amended, effective April 1, 2010, to change the notice period for termination from three months to six months (or 12 months in the event of a change in control). Our company’s executive employment agreements do not provide for any special termination benefits, nor do we have any other arrangements with our executive officers for special termination benefits.
Each executive officer has agreed to respect and not claim any right over any intellectual property owned by our company. Additionally, each executive officer has assigned all his or her right, title and interest to, and in, any property relating to our business (whether tangible or intangible) which is created during the term of its employment. In addition, each executive officer has agreed to be bound by the non-competition restrictions set forth in his or her employment agreement. Specifically, each executive officer has agreed, while employed by us and for a period of six months after termination of his or her employment, not to:
Mr. Kalra’s employment agreement, however, specifies a noncompetition period of 12 months, with the additional restriction that, during this period, he will not engage or have a substantial financial interest in any travel intermediary business that competes directly with our company.
C. Board Practices
Board of Directors
Our holding company is managed and controlled by our board of directors from Mauritius. Our board of directors currently has nineten directors. There are no family relationships between any of our directors and executive officers. A director is not required to hold any shares in our company by way of qualification. There are no severance benefits payable to our directors upon termination of their directorships, other than to Mr. Deep Kalra, Mr. Keyur Joshi and Mr. Rajesh Magow, who isare our directors and also our group chief executive officer.officers and are entitled to severance benefits in such capacity pursuant to the terms of their employment.
Terms of Directors and Executive Officers
In accordance with our Constitution, one-third of our directors (or, if their number is not a multiple of three, the number nearest to but not less than one-third) shall retire from office by rotation at each annual meeting of our company, provided that neither the chairman of our board nor a director holding office as managing director shall be subject to retirement by rotation or be taken into account in determining the number of directors to retire. A retiring director shall be eligible for re-election. The directors to retire in each year shall be those who have been longest in office since their last re-election or appointment and as between persons who became or were last re-elected directors on the same day, those to retire shall (unless they otherwise agree among themselves) be determined by lot. The office of a director shall be vacated if the director resigns, dies, becomes mentally unsound or bankrupt, becomes disqualified from being a director or ceases to hold office under Mauritius law, or is removed by our shareholders. A director may be removed by an ordinary resolution of our shareholders.
Under Mauritius law, the office of a director of our company is required to become vacant at the conclusion of the annual meeting of our company commencing next after the director attains the age of 70 years. However, a person of or over the age of 70 years may, by ordinary resolution of which no shorter notice is given than that required to be given for the holding of a meeting of shareholders, be appointed or re-appointed or authorized to continue to hold office as a director until the next annual meeting of our company.
Executive officers are selected by and serve at the discretion of the board of directors.
Duties of Directors
Under Mauritius law, our directors have a duty to our company to exercise their powers honestly in good faith in the best interests of our company. Our directors also have a duty to our company to exercise the degree of care, diligence and skill that a reasonably prudent person would exercise in comparable circumstances. Where a director of a public company also holds office as an executive, the director is required under Mauritius law to exercise that degree of care, diligence and skill which a reasonably prudent and competent executive in that position would exercise. In fulfilling their duty of care to our company, our directors must ensure compliance with the Mauritius Companies Act and our Constitution, as amended from time to time. A shareholder has the right to seek damages against our directors if a duty owed by our directors to him as a shareholder is breached.
The functions and powers of our board of directors include, among others:
Committees of the Board of Directors
We have established two committees under our board of directors: an audit committee and a compensation committee. Each committee’s members and functions are described below.
Audit Committee
Our audit committee consists of Messrs. Vivek N. Gour, Ranodeb Roy and Frederic Lalonde and is chaired by Mr. Gour. Each member of the audit committee satisfies the independence requirements of Rule 5605 of the Nasdaq Stock Market, Marketplace Rules and the independence requirements of Rule 10A-3 under the Exchange Act. Our board of directors also has determined that Mr. Gour qualifies as an audit committee financial expert within the meaning of the SEC rules. Our audit committee oversees our accounting and financial reporting processes and the audits of the financial statements of our company. Our audit committee is responsible for, among other things:
Compensation Committee
Our compensation committee consists of Messrs. Vivek N. Gour, Philip C. Wolf and Frederic Lalonde and is chaired by Mr. Gour. Messrs. Gour, Wolf and Lalonde satisfy the independence requirements of Rule 5605 of the Nasdaq Stock Market, Marketplace Rules.Rules and the independence requirements of Rule 10A-3 under the Exchange Act. Our compensation committee assists our board of directors in reviewing and approving the compensation structure of our directors and executive officers, including all forms of compensation to be provided to our directors and executive officers. Members of the compensation committee are not prohibited from direct involvement in determining their own compensation. Our chief executive officer may not be present at any committee meeting during which his compensation is deliberated. The compensation committee is responsible for, among other things:
We currently do not have in place a nominations committee, and the actions ordinarily taken by such committee are resolved by a majority of the independent directors on our board. As a foreign private issuer, we are permitted to follow home country corporate governance practices under Rule 5615(a)(3) of the Nasdaq Stock Market, Marketplace Rules. Our home country practice differs from Rule 5605(e) of the Nasdaq Stock Market, Marketplace Rules regarding implementation of a nominations committee charter or board resolution, because our company, as a holder of a GBC1 issued by the Financial Services Commission of Mauritius, is not required under Mauritian law to establish a nominations committee.
Code of Business Conduct and Ethics
Our code of business conduct and ethics provides that our directors and officers are expected to avoid any action, position or interest that conflicts with the interests of our company or gives the appearance of a conflict. Directors and officers have an obligation under our code of business conduct and ethics to advance our company’s interests when the opportunity to do so arises. The full text of our code of business conduct and ethics is available on our website, at http://investors.makemytrip.com/governance.cfm.
Indemnification Agreements
We have entered into indemnification agreements with each of our directors to indemnify them against certain liabilities and expenses arising from their being a director.
D. Employees
See “Item 4. Information on the Company — B. Business Overview — Employees.”
E. Share Ownership by Directors and Executive Officers
The following table sets forth information with respect to the beneficial ownership of our equity shares as of March 31, 20122014 by each of our directors and all our directors and executive officers as a group. As used in this table, beneficial ownership means the sole or shared power to vote or direct the voting or to dispose of or direct the sale of any security. A person is deemed to be the beneficial owner of securities that can be acquired within 60 days upon the exercise of any option, warrant or right. Ordinary shares subject to options, warrants or rights that are currently exercisable or exercisable within 60 days are deemed outstanding for computing the ownership percentage of the person holding the options, warrants or rights, but are not deemed outstanding for computing the ownership percentage of any other person. The amounts and percentages below are based on 37,159,60541,678,341 ordinary shares outstanding as of March 31, 2012.2014.
| Equity Shares Beneficially Owned | Equity Shares Beneficially Owned | |||||||||||||||
| Name of | As of March 31, 2014 | |||||||||||||||
Beneficial Owner | Number | Percent | ||||||||||||||
| March 31, 2012 | ||||||||||||||||
Name | Number | Percent | ||||||||||||||
Directors: | ||||||||||||||||
Deep Kalra(1) | 3,511,803 | 9.45 | % | 3,693,206 | 8.9 | % | ||||||||||
Ravi Adusumalli | — | — | ||||||||||||||
Aditya Tim Guleri(2) | * | * | ||||||||||||||
Keyur Joshi(1) | 143,158 | 0.3 | % | |||||||||||||
Rajesh Magow | 335,814 | 0.8 | % | |||||||||||||
Ravi Adusumalli(2) | — | — | ||||||||||||||
Ranodeb Roy | — | — | ||||||||||||||
Aditya Tim Guleri(3) | * | * | ||||||||||||||
Philip C. Wolf | * | * | * | * | ||||||||||||
Vivek N. Gour | * | * | * | * | ||||||||||||
Ranodeb Roy | — | — | ||||||||||||||
Frederic Lalonde | * | * | 24,883 | 0.0 | % | |||||||||||
Gyaneshwarnath Gowrea | — | — | — | — | ||||||||||||
Mohammad Akhtar Janally | | — | | | — | | ||||||||||
Keyur Joshi(1) | * | * | ||||||||||||||
Rajesh Magow | * | * | ||||||||||||||
Mohammad Akhtar Janally(2) | — | — | ||||||||||||||
Executive Officers: | ||||||||||||||||
Mohit Gupta | * | * | 29,918 | 0.0 | % | |||||||||||
Amit Somani(3) | * | * | ||||||||||||||
All our directors and executive officers as a group(4) | 4,248,802 | 11.25 | % | |||||||||||||
Mohit Kabra | — | — | ||||||||||||||
Sanket Atal | * | * | ||||||||||||||
Amit Somani(4) | 42,061 | 0.1 | % | |||||||||||||
All our directors and executive officers as a group | 4,309,986 | 10.2 | % | |||||||||||||
Notes:
| * | Represents beneficial ownership of less than 1.0% |
Notes:
| (1) | Travogue Electronic Travel Private Limited, or Travogue, is a company controlled by Mr. Deep Kalra. Mr. Deep Kalra holds 78.4% of the equity shares of Travogue. Accordingly, as of March 31, 2014, Mr. Kalra’s beneficial ownership of our ordinary shares includes |
| (2) | With effect from May 20, 2014, our directors, Mr. Ravi Adusumalli and Mr. Mohammad Akhtar Janally, resigned from our Company. Mr. Naushad Ally Sohoboo was appointed as a director with effect from May 20, 2014 and does not own any of our ordinary shares as of the date of this Annual Report. |
| (3) | Consists of ordinary shares held by Sierra Ventures Associates VIII, LLC as nominee for its members (including those shares held for the Guleri Family Trust UTD dated April 7, 1999, or the Guleri Family trust, of which Mr. Aditya Tim Guleri is a trustee and beneficiary). Mr. Guleri is one of the managing members of Sierra Ventures Associates VIII, LLC, the sole general partner of Sierra Ventures VIII-A, L.P. and Sierra Ventures VIII-B, L.P., and may be deemed to control these entities. However, Mr. Guleri disclaims beneficial ownership of all shares held by these entities, except as stated above and except to the extent of his respective proportionate pecuniary interest therein. |
| (4) |
ITEM 7. MAJOR SHAREHOLDERS AND RELATED PARTY TRANSACTIONS
A. Major Shareholders
The following table sets forth information regarding beneficial ownership of our ordinary shares as of March 31, 20122014 held by each person who is known to us to have 5.0% or more beneficial share ownership based on an aggregate of 37,159,60541,678,341 ordinary shares outstanding as of March 31, 2012.2014.
Beneficial ownership is determined in accordance with the SEC rules and includes shares over which the indicated beneficial owner exercises voting and/or investment power or receives the economic benefit of ownership of such securities. Equity shares subject to options currently exercisable or exercisable within 60 days are deemed outstanding for the purposes of computing the percentage ownership of the person holding the options but are not deemed outstanding for the purposes of computing the percentage ownership of any other person.
| Equity Shares Beneficially Owned | Equity Shares Beneficially Owned | |||||||||||||||
Name of Beneficial Owner | Number | Percent | Number | Percent | ||||||||||||
SAIF(1) | 11,836,570 | 31.85 | % | 10,336,570 | 24.8 | % | ||||||||||
Tiger Global(2) | 7,184,866 | 19.34 | % | |||||||||||||
Travogue(3) | 3,000,000 | 8.07 | % | |||||||||||||
T. Rowe Price(2) | 9,040,787 | 21.7 | % | |||||||||||||
Tiger Global(3) | 7,299,826 | 17.5 | % | |||||||||||||
Wasatch Advisors, Inc.(4) | 3,493,892 | 8.4 | % | |||||||||||||
Travogue(5) | 3,000,000 | 7.2 | % | |||||||||||||
Notes:
| (1) |
| (2) | Information |
| (3) | The shareholders are Tiger Global Private Investment Partners IV, L.P. |
| Information based on Amendment No. 1 to a report on Schedule 13G filed with the SEC on February 13, 2014. |
| (5) | Information based on a report on Schedule 13G jointly filed with the SEC on February 14, 2011 by Travogue and Mr. Deep Kalra. Travogue is a company controlled by Mr. Deep Kalra. Mr. Deep Kalra holds 78.4% of the equity shares of Travogue. Accordingly, Mr. Kalra’s beneficial ownership of our ordinary shares includes |
Significant Changes in Percentage of Ownership
The following table sets forth the significant changes in the shareholding interests of our company by our principal shareholders in our ordinary shares and preferred shares in the last three fiscal years. Except as disclosed below, there were no significant changes in the percentage of ownership in our company in the last three fiscal years. Percentages set forth below are based on the number of ordinary shares outstanding as of the dates set forth below.
| As of March 31, | ||||||||||||||||||||||||
| 2012 | 2013 | 2014 | ||||||||||||||||||||||
Name and Type of Shares | Number | Percent | Number | Percent | Number | Percent | ||||||||||||||||||
SAIF: | ||||||||||||||||||||||||
Ordinary shares | 11,836,570 | 31.85 | % | 11,836,570 | 31.48 | % | 10,336,570 | 24.80 | % | |||||||||||||||
Tiger Global(1) : | ||||||||||||||||||||||||
Ordinary shares | 7,356,346 | 19.80 | % | 7,356,346 | 19.41 | % | 7,299,826 | 17.51 | % | |||||||||||||||
Travogue: | ||||||||||||||||||||||||
Ordinary shares | 3,000,000 | 8.07 | % | 3,000,000 | 7.98 | % | 3,000,000 | 7.20 | % | |||||||||||||||
Massachusetts Financial Company:(2) | ||||||||||||||||||||||||
Ordinary shares | — | — | — | — | 1,974,595 | 4.74 | % | |||||||||||||||||
T. Rowe Price:(3) | ||||||||||||||||||||||||
Ordinary shares | — | — | 3,741,688 | 9.95 | % | 9,040,787 | 21.69 | % | ||||||||||||||||
Wasatch Advisors Inc.:(4) | ||||||||||||||||||||||||
Ordinary shares | — | — | 2,869,034 | 7.63 | % | 3,493,892 | 8.38 | % | ||||||||||||||||
Notes:
| (1) | The shareholders are Tiger Global Private Investment Partners IV, L.P., Tiger Global Private Investment Partners V, L.P., Tiger Global Investments, L.P., Lee Fixel and The E&SS Foundation Inc. The Tiger Global entities are controlled by Chase Coleman, Scott Shleifer, Lee Fixel and Feroz Dewan. |
| (2) | As of December 31, 2013, Massachusetts Financial Company held 1,974,595 ordinary shares, amounting to 5.22% of the ordinary shares outstanding as of that date. |
| (3) | Information based on Amendment No. 4 to a report on Schedule 13G filed with the SEC on April 10, 2014. The shareholders are T. Rowe Price New Horizons Fund, Inc. and T. Rowe Price Associates, Inc. |
| (4) | Information based on Amendment No. 1 to a report on Schedule 13G filed with the SEC on February 13, 2014. |
On August 17, 2010, we completed our initial public offering on the Nasdaq Global Market. We sold an aggregate of 5,750,000 ordinary shares (including 4,153,846 ordinary shares sold by us and 1,596,154 ordinary shares sold by the selling shareholders). The price per ordinary share was $14.00.
On June 2, 2011, we completed oura follow-on public offering on the Nasdaq Global Market. We sold anAn aggregate of 5,244,000 ordinary shares were sold (including 1,450,000 ordinary shares sold by us and 3,794,000 ordinary shares sold by the selling shareholders). On June 29, 2011, in connection with oura follow-on public offering, we completed an additional over-allotment offering of 350,000 of our ordinary shares (including 96,777 ordinary shares sold by us and 253,223 ordinary shares sold by the selling shareholders). The price per ordinary share was $24.00.
On March 19, 2014, we completed a follow-on public offering on the Nasdaq Global Market. An aggregate of 6,325,000 ordinary shares were sold (including 3,325,000 ordinary shares sold by us and 3,000,000 ordinary shares sold by the selling shareholders). The price per ordinary share was $23.00.
As of March 31, 20122014, there were approximately 2319 holders of our ordinary shares, including us, of which fourfive have registered addresses in the United States. Since certain of these ordinary shares were held by brokers or other nominees, the number of record holders in the US may not be representative of the number of beneficial holders or where the beneficial holders are resident. Each of our equity shares is entitled to one vote on all matters that require a vote of shareholders, and none of our shareholders has any contractual or other special voting rights.
B. Related Party Transactions
Our audit committee charter requires our audit committee to review all related party transactions on an ongoing basis and for all such transactions to be approved by our audit committee. The following is a summary of our related party transactions.
Shareholders Agreements
As of May 20, 2008, Mr. Deep Kalra, Mr. Keyur Joshi, Mr. Sachin Bhatia, Travogue, SAIF, Helion Venture Partners LLC, the Sierra Ventures entities, Tiger Global, Mr. Lee Fixel, Mr. Feroz Dewan, Mr. Scott Shleifer and our company entered into a shareholders agreement (which superseded earlier shareholders agreements) that contained various rights such as registration rights, pre-emption rights, rights of first refusal and co-sale rights, board nomination rights and information access rights as well as provided for matters which required special approval by certain of our shareholders.
As of July 16, 2010, Mr. Deep Kalra, Mr. Keyur Joshi, Mr. Sachin Bhatia, Travogue, SAIF, Helion Venture, the Sierra Venture entities, Tiger Global, Mr. Lee Fixel, Mr. Feroz Dewan, Mr. Scott Shleifer and our company entered into a shareholders agreement (which superseded earlier shareholders agreements, including the May 20, 2008 shareholders agreement). The July 16, 2010 shareholders agreement terminates all the various rights contained in the earlier shareholders agreements described in the preceding paragraph except for the registration rights, which are described in greater detail inSee “Item 10. Additional Information — B. Memorandum and Articles of Association — Registration Rights.”
Transactions with SAIF
In fiscal years 2010, 20112012, 2013 and 2012,2014, we earned revenue of $16,901, $22,442$45,808, $63,110 and $0, respectively, from SAIF primarily for the sales of air tickets to it. These transactions were carried out in the ordinary course of our business and on an arm’s length basis.
In August 2011, we acquired a 19.98% equity interest in Le Travenues Technology Private Limited (Ixigo), which owns and operates www.ixigo.com, an online travel meta search engine. The holding company of Le Travenues Technology Private Limited is SAIF Partners India IV Limited, an affiliate of our shareholder that owned 31.85% of our shares as of March 31, 2012. Pursuant to the terms of this investment, we have the right to use the domain and source data of www.ixigo.com and Ixigo has the right to use the domain and source data of www.oktatabyebye.com, which is owned and operated by us.
Transactions with Chandra Capital
In fiscal years 2011 and 2012, we earned revenue of $4,560 and $45,808,$86,689, respectively, from Chandra Capital, an investment company owned by Mr. Ravi Adusumalli, primarily from the sales of air tickets to it. Mr. Adusumalli iswas appointed as a director onto our board of directors on July 20, 2005 as a nominee of SAIF, one of our principal shareholders that owned 31.85%24.80% of our shares as of March 31, 2012.2014, and he resigned from our board of directors with effect from May 20, 2014. These transactions were carried out in the ordinary course of our business and on an arm’s length basis.
Trade and Other Receivables Outstanding
As of March 31, 2012, 2013 and 2014, we had trade and other receivables outstanding of $73,849, $29,961 and $122,236, respectively, from related parties.
Trade and Other Payables Outstanding
As of March 31, 2012, 2013 and 2014, we had trade and other payables outstanding of $16,455, nil and nil, respectively, to related parties.
Transactions with PhoCusWright
From time to time, we purchase independent market reports on the travel and travel-related industry from PhoCusWright, a company founded by Mr. Philip C. Wolf, one of our directors. On December 31, 2012, Mr. Wolf resigned as non-executive chairman of PhoCusWright. The amounts paid by us to PhoCusWright were $19,300, $25,100 and $28,998 in fiscal years 2010, 20112012 and 2012,2013 were $28,998 and $42,116, respectively.
Employment Agreements
See “Item 6. Directors, Senior Management and Employees — B. Compensation — Employment Agreements with Executive Officers.”
Equity Option and Share Incentive Plans
See “Item 6. Directors, Senior Management and Employees — B. Compensation — Share Incentive Plans.”
C. Interest of Experts and Counsel
Not applicable
A. Consolidated Statements and Other Financial Information
| A. | Consolidated Statements and Other Financial Information |
See “Item 18. Financial Statements” for a list of the financial statements filed as part of this annual report.Annual Report.
Legal Proceedings
Except as described below, there are no governmental, legal or arbitration proceedings (including any such proceedings which are pending or threatened, of which we are aware) which we believe could reasonably be expected to have a material adverse effect on our results of operations or financial position:position.
Tax Proceedings
Certain tax matters involving our key subsidiary, MMT India, are disclosed below.
Income Tax
Assessment Year 2005-06
In November 2008, we received a show cause notice from the Indian income tax authorities for the assessment year 2005-2006 and a demand for an additional payment of approximately Rs. 8.1Rs.8.1 million (approximately $146,000)$0.1 million) (exclusive of any applicable penalties) due to a reassessment, advising us of an upward revision of our taxabledeclared income in India for thethat assessment year 2005-2006, on the groundsas a result of (i) an increase proposed by the transfer pricing officer to adjust our intra-group international transactionstransaction prices upwards to an arm’s length price, and (ii) the disallowance of website development depreciation expenses as capital expenditure incurred during the year. In January 2009, we filed our objections to both the show cause notice and the demand for the additional payment with the Commissioner of Income Tax (Appeals). TheIn February 2009, the demand for the additional payment was quasheddismissed by the Indian income tax authorities in February 2009 after adjustment of broughtagainst our carried forward losses. Our appeal against the show cause notice in connection with the intra-group international transactions transfer pricing matter was decided in our favor in February 2011. We also received partial relief from the disallowance of website development expenses as capital expenditure incurred.depreciation expenses. In May 2011, we filed our objectionsobjection to the partial disallowance of website development depreciation expenses with the Income Tax Appellate Tribunal authorities, and a hearing is currently scheduled for September 18, 2012.August 6, 2014.
Assessment Year 2006-07 In December 2009, we received a draft assessment order from the Indian income tax authorities for the assessment year 2006-2007, alleging certain irregularities in the method of computation of income and, advising us of an upward revision Further, ininof our declared income in India for thethat assessment year due toas a result of (i) an increase of approximately Rs. 8 million (approximately $145,000) proposed by the transfer pricing officer to adjust our intra-group international transactionstransaction prices upwards to an arm’s length price, and a further(ii) an increase of approximately Rs. 3.7 million (approximately $67,000) on account of the proposed disallowance of website development depreciation expenses as capital expenditure incurred during the year. In January 2010, we filed our objections with the Dispute Resolution Panel. TheseIn September 2010, the increases in our declared income assessed by the Indian income tax authorities were upheld by the Dispute Resolution Panel in September 2010. Further, inPanel. In October 2010, we received ana final assessment order from the Indian income tax authorities confirming the additions made and initiating penalty proceedings against us under the Income Tax Act, 1961. In December 2010, we filed our further objections with the Income Tax Appellate Tribunal authorities, and a hearing is currently scheduled for September 18, 2012.
In October 2010, we received a preliminary assessment order from the transfer pricing officer covering the assessment year 2007-2008. The assessing officer issued an assessment order in January 2011 relating to this matter. Pursuant to these orders, the Indian income tax authorities advised us of an upward adjustment of our income of approximately Rs. 333 million (approximately $6.0 million) in order to reflect their assessment of the arm’s length price our international transactions and an addition of Rs. 26 million (approximately $470,000) due to the disallowance of website development expenses as capital expenditure incurred during the year. However, we received nodid not receive a demand for any additional tax payments because our carried forward losses exceeded our assessed income. In December 2010, we filed our objections to the assessment order with the Income Tax Appellate Tribunal authorities. A hearing is scheduled for August 6, 2014.
Assessment Year 2007-08
In January 2011, we received an assessment order from the Indian income tax authorities for the assessment year 2007-2008, alleging certain irregularities in the method of computation of income and, advising us of an upward revision of our declared income in India for that assessment year as a result of (i) an increase proposed by the transfer pricing officer to adjust our intra-group international transaction prices upwards to an arm’s length price, and (ii) an increase on account of the disallowance of website development depreciation expenses incurred during the year. However, we did not receive a demand for any additional tax payments because our carried forward losses exceeded our declared taxable income. WeIn March 2011, we filed ouran appeal with the Commissioner of Income Tax (Appeals). Our appeal against the assessment order in March 2011. While we believe that we have a strong caseconnection with the intra-group international transactions transfer pricing matter was decided in our favor there can be no assurance that the Indian tax authorities will not take a different view.
In October 2011, wein February 2013. We also received a preliminary assessment orderpartial relief from the transfer pricing officer covering the assessment year 2008-2009. The assessing officer issued an assessment order in February 2012 advising usCommissioner of an upward adjustment of our income of approximately Rs. 550 million (approximately $9.9 million) in order to reflect their assessment of the arm’s length price of our international transactions. Additional upward adjustments were made of approximately Rs. 66 million (approximately $1.2 million) due toIncome Tax (Appeals) on the disallowance of website development expenses as capital expenditure incurred duringdepreciation expenses. We believe that the year andIncome Tax Department appealed the order of approximately Rs. 120 million (approximately $2.2 million) duethe Commissioner of Income Tax (Appeals) to the non-deductionIncome Tax Appellate Tribunal, and we understand that a hearing is currently scheduled for September 2, 2014. However, we have not received any official notice of such appeal.
Assessment Year 2008-09
In February 2012, we received an assessment order from the Indian income tax deducted at source on payment gateway charges. At issue wasauthorities for the amount of withholding taxes we are required to pay in connection with our payments to banks for use of their payment gateway facilities. We also receivedassessment year 2008-2009, and a demand for additional tax payments amounting toof approximately Rs. 43Rs.43 million (approximately $0.8$0.7 million) but this, advising us of an upward revision of our declared income in India for that assessment year as a result of (i) an increase proposed by the transfer pricing officer to adjust our intra-group international transaction prices upwards to an arm’s length price, (ii) an increase on account of the proposed disallowance of website development depreciation expenses incurred during the year, and (iii) an increase due to the non-payment of sufficient withholding tax in connection with our use of banking payment gateway facilities. The demand for additional tax payments of approximately Rs.43 million (approximately $0.7 million), was dismissed by the Indian income tax authorities in March 2012 following the adjustment of broughtcarried forward losses. In March 2012, we filed our objections with the Commissioner of Income Tax (Appeals). Our appeal against the assessment order in connection with the intra-group international transactions transfer pricing matter was decided in our favor in June 2013. We also received partial relief from the disallowance of website development depreciation expenses and non-payment of sufficient withholding tax in connection with payment gateway charges. Against this partial relief, we and the Income Tax Department each filed appeals in August 2013 with the Income Appellate Tax Tribunal and a hearing is currently scheduled for September 2, 2014.
Assessment Year 2009-10
In May 2013, we received an assessment order from the Indian income tax authorities for the assessment year 2009-2010, and a demand for additional tax payments of approximately Rs.276 million (approximately $4.7 million), advising us of an upward revision of our declared income in India for that assessment year as a result of (i) an increase proposed by the transfer pricing offer to adjust our intra-group international transaction prices upwards to an arm’s length price, (ii) increases due to the non-payment of sufficient withholding tax in connection with our use of banking payment gateway facilities and the cost of air tickets incurred to MMT USA, and (iii) increases for disallowance of excess depreciation expense on computer peripherals and software licenses, and for the disallowance of website development depreciation expenses incurred during the year, and on account of amounts received from business associates, which were treated as deferred revenue. On May 30, 2013, we filed our objections with the Commissioner of Income Tax (Appeals). In November 2013, we also received an order imposing an additional penalty for allegedly attempting to conceal the above matters and a notice of demand amounting to approximately Rs.330 million (approximately $5.7 million), but this demand was temporarily set aside by the Indian tax authorities in January 2014 after adjustment of refunds for the assessment year 2012-2013. In December 2013, we filed our objections to the penalty with the Commissioner of Income Tax (Appeals). A hearing is yet to be scheduled.
Assessment Year 2010-11
In March 2014, we received an assessment order from the Indian income tax authorities for the assessment year 2010-11, and a demand for additional tax payments of approximately Rs.736 million (approximately $12.6 million), advising us of an upward revision of our declared income in India for that assessment year as a result of (i) an increase on account of the disallowance of website development depreciation expenses incurred during the year (ii) an increase due to the non-payment of sufficient withholding tax in connection with our use of banking payment gateway facilities (iii) an increase for disallowance of excess depreciation expense on computer peripherals and software licenses (iv) an increase due to the non-payment of sufficient withholding tax on re-imbursement of expenses to MMT USA (v) an increase for advertising and publicity expenses being capital in nature, and (vi) an increase due to change in the method of accounting for recognizing loyalty cum signing bonus. In April 2014, we filed our objections with the Commissioner of Income Tax (Appeals) along with stay of demand. A hearing is yet to be scheduled.
Service Tax
Show Cause and Demand Notice — Fiscal Years 2006 to 2012
In the year ended March 31, 2009, a general industry wide inquiry on compliance with service tax rules and regulations by various travel agencies in India was initiated by the Mumbai Zonal Unit of Directorate General of Excise Intelligence & Customs, an excise and customs tax regulatory authority in India. In October 2011, pursuant to an audit conducted by the service tax authorities, we received a notice from the tax authorities for fiscal years 2006 to 2010, demanding payment of service tax in respect of certain matters, some of which relate to the travel industry in India and involve a complex interpretation of Indian law. We have received similar notices for fiscal years 2011 and 2012, in October 2011 and October 2012, respectively. In March 2011, we filed replies with the Commissioner of Service Tax for fiscal years 2006 to 2010, and, similarly, filed objections in January 2012 for fiscal year 2011, and in February 2013, for fiscal year 2012, respectively. In August 2013, the Commissioner of Service Tax rejected our objections and confirmed the demand on all the above matters with negligible relief. In November 2013, we filed an appeal with the Customs, Excise and Service Tax Appellate Tribunal. The aggregate value of the claims is approximately Rs.1,700 million (approximately $29.1 million) and additional interest and penalties if finally determined to be payable. We have not deposited any service tax with the relevant authorities in response to these demands and we do not recognize these claims as a contingent liability as we believe the likelihood of the claims being upheld by the relevant authorities to be remote. The matter is currently pending and the hearing is to be scheduled.
Show Cause and Demand Notice — Fiscal Years 2008 to 2011
In September 2012, we received a notice from the service tax authorities for fiscal years 2008 to 2011, demanding payment of service tax in respect of certain matters, some of which relate to the travel industry in India and involve a complex interpretation of Indian law. In February 2013, we filed a reply with the Commissioner of Service Tax. In March 2014 we received an order wherein the demand raised by the service tax authorities was confirmed by the Commissioner of Central Excise. The aggregate value of these claims is approximately Rs.15.3 million (approximately $0.3 million). We have not deposited any service tax with the relevant authorities in response to this demand and we do not recognize this claim as a contingent liability as we believe the likelihood of the claims being upheld by the relevant authorities to be remote. We intend to file an appeal against the same with the Customs, Excise and Service Tax Appellate Tribunal in June 2014.
Show Cause and Demand Notice — Fiscal Year 2012
In November 2012, we received a notice from the service tax authorities for fiscal year 2012, demanding payment of service tax in respect of certain matters, which relate to the travel industry in India but are not covered in the show cause notices mentioned in the above paragraphs relating to service tax, and involve a complex interpretation of Indian law. In February 2013, we filed a reply with the Commissioner of Service Tax. In March 2014 we received an order wherein the demand raised by the service tax authorities was confirmed by the Commissioner of Central Excise. The aggregate value of the claims is approximately Rs.16.1 million (approximately $0.3 million). We have not deposited any service tax with the relevant authorities in response to this demand and we do not recognize this claim as a contingent liability as we believe the likelihood of the claims being upheld by the relevant authorities to be remote. We intend to file an appeal against the same with the Customs, Excise and Service Tax Appellate Tribunal in June 2014.
Show Cause and Demand Notice — Fiscal Year 2013
In May 2014, we received two notices from the service tax authorities for fiscal year 2013, demanding payment of service tax in respect of certain matters, which relate to the travel industry in India and involve a complex interpretation of Indian law. We are in the process of filing a reply with the relevant authorities. The aggregate value of the claims is approximately Rs. 1,075 million (approximately $18.4 million). We have not deposited any service tax with the relevant authorities in response to these demands and we do not recognize these claims as a contingent liability as we believe the likelihood of the claims being upheld by the relevant authorities to be remote.
Other Proceedings
Dispute with Tata Sons Limited
On June 2, 2009, we received a notification of complaint filed by Tata Sons Limited, or Tata, from the World Intellectual Property Organization, or WIPO, Arbitration and Mediation Center under the Uniform Domain Name Dispute Resolution Policy. Tata alleged that our use of the word “tata” in the domain name for our Indian online travel community website, “www.oktatabyebye.com,” derived benefit from the goodwill of the “Tata” name. On August 11, 2009, WIPO ordered that our domain name be transferred to Tata. The order can be contested in a court of appropriate jurisdiction and we have accordingly appealed against the order at the High Court of Delhi and the United States District Court in the Western District of Washington. In furtherance of our appeal in India, we and Tata have agreed to stay all proceedings in the United States until the Indian proceedings are resolved or terminated, and that in the event of resolution in the Indian proceedings, the parties will cooperate with one another and perform any acts reasonably necessary to comply with the Indian court’s ruling. The parties have since mutually agreed to withdraw the case filed in the United States. The Delhi High Court has since delegated authority to a local commissioner to record evidence from each party and cross-examine witnesses and to report on the findings to the Delhi High Court. The next hearing is scheduled for August 31, 2012 in the Delhi High Court.Court is scheduled for September 15, 2014.
During the year ended March 31, 2009, a general industry wide inquiry was initiated by the Mumbai Zonal Unit of Directorate General of Excise Intelligence & Customs, an excise and customs tax regulatory authority in India, on various travel agencies in IndiaDispute with regard to compliance with service tax rules and regulations by travel companies in India. Pursuant to an audit conducted by the service tax authorities, we received a notice in October 2010 with a demand of service tax on certain matters, some of which relate to the travel industry in India and involve complex interpretation of law. Based on legal advice, we believe that we have a strong case in our favor and we filed our response to this notice in March 2011. A hearing will be held on July 18, 2012.
In October 2011, we received a notice for financial year 2010-2011 from service tax authorities with a demand regarding certain matters, some of which relate to the travel industry in India and involve complex interpretation of law. Based on legal advice, we believe that we have a strong case in our favor and we have filed our response to this notice in January 2012.Ezeego1
In August 2010, we were informed that one of our competitors may have filed a criminal complaint in India against us likely alleging the misuse of domain names similar to the name of such competitor’s website. The police authorities are investigating the matters in such complaint, which was filed by our competitor, Ezeego1, and we are cooperating with the authorities and have responded to questions in respect of such pending investigation. However, we have not received any notice of claim or summons either from any Indian court or such competitor and we believe that such complaint is without merit or basis. We have separately filed a criminal complaint for defamation against Ezeego1 and certain other parties in the court of the Sessions Judge, Patiala House New Delhidistrict court in respect of statements relating to proceedings purported to be pending against us and related hearings are currently pending in the accused have been summoned to appear at aDelhi High Court and the Patiala House district court with the next hearing scheduled for August 6,July 23, 2014.
Dispute with Hotel Pine Spring
We filed criminal complaints under the provisions of the Negotiable Instruments Act, 1991, as amended, during fiscal year 2013 to recover monies related to the dishonoring of checks in the amount of Rs.40.0 million ($0.7 million) provided to us by Hotel Pine Spring, one of our hotels and packages vendors in Srinagar, India. These checks were provided as security for deposits made by us under our agreements signed with the hotel in fiscal years 2011 and 2012 in order to assure available room inventory at pre-agreed rates. We deposited the checks when the agreements were not complied with by the hotel, including by not providing a bank guarantee. We have initiated criminal proceedings against the hotel and its owner for failing to honor the check and for breach of our agreement. The hearings under those cases are due in July 2014.
Dispute with Former Shareholders of the Hotel Travel Group
Our company is a respondent in a Singapore International Arbitration Centre (SIAC) arbitration proceeding commenced by former shareholders of the Hotel Travel Group, which we acquired in November 2012. The dispute is in connection with the operation of the indemnification and escrow mechanisms under a share purchase agreement under which these former shareholders of the Hotel Travel Group agreed to sell and transfer to our company and the share capital of the companies that constitute the Hotel Travel Group. The share purchase agreement is governed by Mauritius law. The sum in dispute is $2.5 million. The hearing is scheduled for June 11, 2014.
B. Significant Changes
There has been no significant subsequent event following the close of the last financial year up to the date of this annual reportAnnual Report that are known to us and require disclosure in this annual reportAnnual Report for which disclosure was not made in this annual report.Annual Report.
A. Offer and Listing Details
Our outstanding ordinary shares are currently listed and traded on the Nasdaq Global Market under the symbol “MMYT.”
The following table shows the reported high and low trading prices quoted in US dollars for our ordinary shares on the NasdaqNASDAQ Global Market.
| Nasdaq Global Market Price Per Ordinary Share | Nasdaq Global Market Price Per Ordinary Share | |||||||||||||||
Period | High | Low | High | Low | ||||||||||||
Fiscal Year | ||||||||||||||||
2011(1) | $ | 42.88 | $ | 20.75 | $ | 42.88 | $ | 20.75 | ||||||||
2012 | $ | 34.22 | $ | 16.06 | $ | 34.22 | $ | 16.06 | ||||||||
2013 | $ | 23.63 | $ | 10.77 | ||||||||||||
2014 | $ | 29.73 | $ | 12.50 | ||||||||||||
Fiscal Quarter | ||||||||||||||||
2011 | ||||||||||||||||
2nd Quarter(1) | $ | 42.88 | $ | 20.75 | ||||||||||||
2013 | ||||||||||||||||
1st Quarter | $ | 23.63 | $ | 12.26 | ||||||||||||
2nd Quarter | $ | 18.50 | $ | 13.38 | ||||||||||||
3rd Quarter | $ | 40.80 | $ | 23.81 | $ | 17.74 | $ | 10.77 | ||||||||
4th Quarter | $ | 32.41 | $ | 24.03 | $ | 16.16 | $ | 12.67 | ||||||||
2012 | ||||||||||||||||
2014 | ||||||||||||||||
1st Quarter | $ | 34.22 | $ | 21.37 | $ | 14.47 | $ | 12.85 | ||||||||
2nd Quarter | $ | 26.25 | $ | 16.06 | $ | 15.63 | $ | 13.49 | ||||||||
3rd Quarter | $ | 33.90 | $ | 21.01 | $ | 19.73 | $ | 14.01 | ||||||||
4th Quarter | $ | 24.93 | $ | 20.36 | $ | 29.73 | $ | 19.30 | ||||||||
Month | ||||||||||||||||
2011 | ||||||||||||||||
2013 | ||||||||||||||||
December | $ | 25.43 | $ | 23.26 | $ | 19.73 | $ | 16.18 | ||||||||
2012 | ||||||||||||||||
2014 | ||||||||||||||||
January | $ | 24.93 | $ | 21.53 | $ | 27.93 | $ | 20.16 | ||||||||
February | $ | 24.70 | $ | 20.36 | $ | 29.73 | $ | 22.97 | ||||||||
March | $ | 24.50 | $ | 22.60 | $ | 28.20 | $ | 22.59 | ||||||||
April | $ | 23.60 | $ | 16.99 | $ | 27.94 | $ | 19.76 | ||||||||
May | $ | 21.06 | $ | 13.17 | $ | 28.97 | $ | 19.06 | ||||||||
June(2) | $ | 16.66 | $ | 12.26 | $ | 25.95 | $ | 24.68 | ||||||||
Notes:
| (1) | From August 17, 2010 following completion of our initial public offering on the |
| (2) | Until June |
B. Plan of Distribution
Not Applicable
C. Markets
Our ordinary shares are listed on the Nasdaq Global Market under the symbol “MMYT”.
D. Selling Shareholders
Not applicable
E. Dilution
Not applicable
F. Expenses of the Issue
Not applicable
A.Share Capital
Not applicable
B.Memorandum and Articles of Association
General
Our company (Company No. 24478/5832) is a public company incorporated under the laws of Mauritius with limited liability and we hold a Category 1 Global Business Licence issued by the Financial Services Commission in Mauritius. Our affairs are governed by our Constitution, the Mauritius Companies Act, the Securities Act 2005 of Mauritius, or the Mauritius Securities Act, and other applicable laws of Mauritius and any rules or regulations made thereunder.
Our Constitution states that the objects of our company are to carry out any business or activity permitted under our company’s Category 1 Global Business Licence, and to the extent permitted by law, our company may effect any business transaction and take any steps which it considers expedient to further the objects of our company.
As of March 31, 2012,2014, our stated capital was $151,359,855.90$231,869,798.86 comprising 37,159,60541,678,341 ordinary shares with a par value of $0.0005 each.
The following are summaries of certain provisions of our Constitution and the Mauritius Companies Act insofar as they relate to the material terms of our ordinary shares. The term “shareholders” as used in these summaries in relation to our company refers to persons whose names are entered into the share register of our company as the current holder of one or more shares of our company. These summaries do not purport to be complete and are subject to, and are qualified in their entirety by reference to, the provisions of our Constitution and the Mauritius Companies Act.
Ordinary Shares
General
All of our ordinary shares are fully paid. Certificates representing our ordinary shares are issued in registered form. Our shareholders who are non-residents of Mauritius may freely hold and vote their ordinary shares.
Dividends
Under the Mauritius Companies Act and our Constitution, we may only pay dividends out of retained earnings, after having made good any accumulated losses at the beginning of the accounting period, and no distribution (which term includes dividend) may be made unless our board of directors is satisfied that, upon the distribution being made (1) our company is able to pay its debts as they become due in the normal course of business and (2) the value of our company’s assets is greater than the sum of (a) the value of its liabilities and (b) our company’s stated capital. Subject to the Mauritius Companies Act and our Constitution, the declaration and payment of any dividend has to be authorized by our board of directors, subject to the approval of our shareholders.
Our board of directors may from time to time pay to our shareholders such interim dividends as appear to the directors to be justified by our profits, and in particular (but without prejudice to the generality of the foregoing) if at any time the share capital of our company is divided into different classes, our board of directors may also pay any fixed dividend which is payable on any shares of our company half-yearly or on any other dates, whenever our profits, in the opinion of our board of directors, justifies such payment.
Our board of directors may retain any dividends or other monies payable on or in respect of a share upon which our company has a lien, and may apply the same in or towards satisfaction of the debts, liabilities or engagements in respect of which the lien exists.
No dividend shall carry interest against us.
Any dividend or other moneys payable in cash on or in respect of a share may be paid by check or warrant sent through the post addressed to the registered address of the shareholder entitled, or in the case of joint holders, to the registered address of the person whose name stands first in our register of members in respect of the joint holding, or to such person at such address as such shareholder may in writing direct or may be sent by remittance or telegraphic transfer to the bank account of the holder at his bank account as may be notified in writing to us. Every check or warrant or remittance or telegraphic transfer so sent shall be made payable to the order of the person to whom it is sent or, in the case of joint holders, to the order of the holder whose name stands first on our register of members in respect of such shares, and shall be sent at his or their risk and the payment of any such check or warrant by the bank on which it is drawn shall operate as a good discharge to us in respect of the dividend or moneys represented thereby.
Any dividend unclaimed after a period of six years from the date of declaration of such dividend may be forfeited by our board of directors and if so, shall revert to us.
Voting Rights
Subject to any rights or restrictions as to voting for the time being attached to any class of shares and our Constitution, each holder of our ordinary shares who is present in person or by proxy at a meeting of shareholders shall have one vote on a show of hands and on a poll, each holder of our ordinary shares who is present in person or by proxy shall have one vote for every ordinary share which he holds or represents. Voting at any meeting of shareholders is by show of hands unless a poll is demanded. A poll may be demanded by: (1) the chairman of such meeting, (2) not less than 5five shareholders having the right to vote at the meeting, (3) a shareholder or shareholders representing not less than 10%10.0% of the total voting rights of all shareholders having the right to vote at the meeting, or (4) by a shareholder or shareholders holding shares in the company that confer a right to vote at the meeting and on which the aggregate amount paid up is not less than 10%10.0% of the total amount paid up on all shares that confer that right.
An ordinary resolution to be passed by the shareholders requires the affirmative vote of a simple majority of votes of those shareholders entitled to vote and voting on the matter which is the subject matter of the resolution, while a special resolution is a resolution approved by a majority of 75%75.0% or, if a higher majority is required by the Constitution, that higher majority, of the votes of those shareholders entitled to vote and voting on the question. A special resolution will be required for matters such as amending our Constitution.
Transfer of Ordinary Shares
Subject to the restrictions contained in our Constitution, as applicable, any of our shareholders may transfer all or any of his or her ordinary shares by an instrument of transfer in the usual or common form or in a form prescribed by the Designated Stock Exchange (as defined in our Constitution) or in any other form approved by our board of directors.
Our board of directors may, in its absolute discretion, decline to register any transfer of any ordinary share (not being a fully paid up share) to a person of whom it does not approve, or any transfer of any share issued under any share incentive scheme for employees upon which a restriction on transfer imposed thereby still subsists, or any transfer of shares upon which our company has a lien. Our board of directors may also decline to register any transfer of any ordinary share unless:
a fee of such maximum sum as the Designated Stock Exchange may determine to be payable or such lesser sum as our board of directors may from time to time require is paid to our company in respect thereof;
the instrument of transfer is lodged at the registered office of our company for the time being or at such other place (if any) as our board of directors may appoint, accompanied by the relevant share certificate(s) and such other evidence as our board of directors may reasonably require to show the right of the transferor to make the transfer (and, if the instrument of transfer is executed by some other person on his behalf, the authority of the person so to do); and
the instrument of transfer is in respect of only one class of shares.
If our board of directors refuses to register a transfer of any shares, they shall within 28 days after the date on which the transfer was lodged with our company send to the transferor and the transferee notice of the refusal as required by the Mauritius Companies Act and the reasons for the refusal will be given in the notice.
Liquidation
On a return of capital on winding up or otherwise (other than on conversion, redemption or purchase of ordinary shares), assets available for distribution among the holders of ordinary shares shall be distributed among the holders of the ordinary shares on a pro rata basis. If our assets available for distribution are insufficient to repay all of the paid-up capital, the assets will be distributed so that the losses are borne by our shareholders proportionately.
Redemption of Shares
Subject to the provisions of the Mauritius Companies Act and other applicable law, we may issue shares on terms that are subject to redemption, at our option or at the option of the holders, on such terms and in such manner, including out of capital, as may be determined by our board of directors or by ordinary resolution of the shareholders of our company.
Variations of Rights of Shares
If at any time our share capital is divided into different classes of shares, all or any of the special rights attached to any class of shares may, subject to the provisions of the Mauritius Companies Act, be varied with the sanction of a special resolution passed at a meeting of the holders of the shares of that class. Consequently, the rights of any class of shares cannot be detrimentally altered without a majority of 75%75.0% of the vote of all of the shares in that class. The rights conferred upon the holders of the shares of any class issued with preferred or other rights shall not, unless otherwise expressly provided by the terms of issue of the shares of that class, be deemed to be varied by the creation or issue of further shares rankingpari passuwith such existing class of shares.
Meetings of Shareholders
An annual shareholders’ meeting shall be convened by our board of directors not more than once in each year and not later than six months after our balance sheet date. Special meetings of shareholders may be convened by our board of directors or on the written request of shareholders holding shares carrying together not less than 5%5.0% of the voting rights entitled to be exercised on the issue. Subject to our Constitution, advance notice of at least 14 days is required for the convening of our annual shareholders’ meeting and any special meeting of our shareholders. A quorum for a shareholders meeting shall be present where the shareholders or their proxies are present or have cast postal votes, who are between them able to exercise not less than 33.3% of the votes to be cast on the business to be transacted by the meeting.
A shareholder may exercise the right to vote either by being present in person, by proxy or postal vote. A proxy for a shareholder may attend and be heard at a meeting of shareholders as if the proxy were the shareholder. A proxy shall be appointed by notice in writing signed by the shareholder, and the notice shall state whether the appointment is for a particular meeting or a specified term.
Inspection of Books and Records
Under the Mauritius Companies Act, we are required to keep available our certificate of incorporation, our Constitution, our share register, the full names and residential addresses of our directors, the registered office and address for service of our company, copies of the instruments creating or evidencing charges which are required to be registered under section 127 of the Mauritius Companies Act, minutes of all meetings and resolutions of shareholders, copies of written communications to all shareholders or to all holders of a class of shares during the preceding seven years (including financial statements, and group financial statements), certificates given by directors under the Mauritius Companies Act and the interests register (if any) of our company for inspection by any shareholder of our company or by a person authorized in writing by a shareholder for the purpose, between the hours of 9.00 a.m. and 5.00 p.m. on each working day during the inspection period at the place at which our records are kept in Mauritius. A shareholder who wishes to inspect such records must serve written notice on us of his intention to inspect the records.
The term “inspection period” is defined in the Mauritius Companies Act to mean the period commencing on the third working day after the day on which notice of intention to inspect is served on us by the person or shareholder concerned and ending with the eighth working day after the day of service.
Changes in Capital
We may from time to time by ordinary resolution:
increase the share capital by such sum, to be divided into shares of such classes and amount, as the resolution shall prescribe;
consolidate and divide all or any of our share capital into shares of a larger amount than our existing shares;
sub-divide our existing shares, or any of them, into shares of a smaller amount; or
cancel any shares which, at the date of the passing of the resolution, have not been taken or agreed to be taken by any person, and diminish the amount of our share capital by the amount of the shares so cancelled in accordance with the Mauritius Companies Act.
We may by special resolution reduce our share capital or any capital redemption reserve in any manner permitted by law.
Purchase by Our Company of its Own Shares
Our company may, subject to and in accordance with the Mauritius Companies Act, purchase or otherwise acquire its own shares, on such terms and in such manner as our board of directors may from time to time think fit. Any share that is so purchased or acquired by our company shall, unless held as treasury shares in accordance with the Mauritius Companies Act, be deemed to be cancelled immediately on purchase or acquisition. On such cancellation of a share, the rights and privileges attached to that share shall expire, and the number of issued shares of our company shall be diminished by the number of such shares so cancelled, and where any such cancelled shares was purchased or acquired out of the capital of our company, the amount of the share capital of our company shall be reduced accordingly. In any other instance, our company may hold or deal with any such share which is so purchased or acquired by it in such manner as may be permitted by or in accordance with the Mauritius Companies Act.
Directors’ Borrowing Powers
Our Constitution provides that our board of directors may exercise all the powers of our company to borrow money and to mortgage or charge all or any part of the undertaking, property and assets (present and future) and uncalled capital of our company and, subject to the Mauritius Companies Act, to issue debentures, bonds and other securities, whether outright or as collateral security for any debt, liability or obligation of our company or of any third party.
Interested Directors
The Mauritius Companies Act and our Constitution provide that a director of our company shall, forthwith after becoming aware of the fact that he is interested in a transaction or a proposed transaction with our company, cause to be entered in the interests register of our company and disclose to our board of directors the nature and monetary value of that interest, or where the monetary value of the director’s interest cannot be quantified, the nature and extent of that interest. A general notice entered in the interests register or disclosed to our board of directors to the effect that a director is a shareholder, director, officer or trustee of another named company or other person and is to be regarded as interested in any transaction which may, after the date of the entry or disclosure, be entered into with that company or person, is a sufficient disclosure of interest in relation to that transaction. To the extent that our company is a reporting issuer (as defined in section 86 of the Mauritius Securities Act) the relevant disclosure requirements under the Mauritius Securities Act may also be applicable. We have obtained an exemption from the Mauritius Financial Services Commission from the disclosure requirements applicable to reporting issuers under the Mauritius Securities Act.
Under our Constitution, a director of our company may not vote in respect of any contract or arrangement or any proposed contract or arrangement in which he has any interest, directly or indirectly.
Section 149 of the Mauritius Companies Act provides that a transaction entered into by a company in which a director of the company is interested may be avoided by the company at any time before the expiration of 6six months after the transaction is disclosed to all the shareholders (whether by means of the company’s annual reportAnnual Report or otherwise). However, a transaction shall not be avoided where the company receives fair value under it, and where a transaction is entered into by the company in the ordinary course of its business and on usual terms and conditions, the company shall be presumed to have received a fair value under the transaction. Under the Mauritius Companies Act, the avoidance of a transaction under Section 149 of the Mauritius Companies Act will not affect the title or interest of a person in or to property which that person has acquired where the property was acquired (a) from a person other than the company, (b) for valuable consideration, and (c) without knowledge of the circumstances of the transaction under which the person referred to in paragraph (a) acquired the property from the company.
Notification of Shareholdings by Directors and Substantial Shareholders
Our Constitution provides that (a) each of our directors shall, upon his appointment to our board of directors, give an undertaking to our company that, for so long as he remains a director of our company, he shall forthwith notify our company secretary of the particulars of our shares beneficially owned by him at the time of his appointment and of any change in such particulars (including the circumstances of any such change), and (b) each member of our company shall, upon becoming a substantial shareholder of our company, give an undertaking to our company that, for so long as he remains as a substantial shareholder of our company, he shall notify our company secretary of the particulars of our shares in which he has an interest at the time of his becoming a substantial shareholder or of any change in such particulars (including the circumstances of any such change) within 48 hours of such time or change (as the case may be), provided that he shall only be required to give notice of a change in the percentage level of his interests in the shares where there is a change of 1%1.0% or more in the percentage level of his shareholding interest in the relevant class of shares in our company. For this purpose, a “substantial shareholder” means a person who holds by himself or his nominee a share or an interest in a share in the capital of our company which entitles him to exercise not less than 5%5.0% of the aggregate voting power exercisable at a meeting of our shareholders.
Category 1 Global Business Company
We are a public company incorporated under the laws of Mauritius with limited liability and we hold a Category 1 Global Business Licence issued by the Financial Services Commission in Mauritius. “Limited liability” means that the liability of each shareholder is limited to the amount unpaid by the shareholder on the shares of the company. Mauritius law distinguishes between domestic companies and global business companies. Any company that is formed or registered in Mauritius and which conducts business outside of Mauritius may apply for a Category 1 Global Business Licence. The requirements for a Category 1 Global Business Company are essentially the same as for a domestic company except for some of the exemptions and privileges listed below (which are not exhaustive):
a Category 1 Global Business Company does not have to file an annual return of its shareholders with the Registrar of Companies;
a Category 1 Global Business Company may issue no par value shares; and
a Category 1 Global Business Company may register as a protected cell company.
Following amendments to the Financial Services Act 2007 of Mauritius pursuant to the Finance (Miscellaneous Provisions) Act 2010 in December 2010, Mauritius companies holding a Category 1 Global Business Licence, or GBC1, issued by the Financial Services Commission in Mauritius are permitted to conduct business both in and outside Mauritius (instead of outside Mauritius only).
We are subject to reporting and other information and disclosure requirements of the Mauritius Securities Act and any rules or regulations made thereunder. However, we have obtained an exemption from the Mauritius Financial Services Commission from the disclosure requirements applicable to reporting issuers under the Mauritius Securities Act.
Differences in Corporate Law
The Mauritius Companies Act differs from laws applicable to United States corporations and their shareholders. Set forth below is a summary of the significant differences between the provisions of the Mauritius Companies Act applicable to us and the laws applicable to companies incorporated in the United States and their shareholders.
Pursuant to the Mauritius Companies Act, subject to certain exceptions prescribed in the Mauritius Companies Act, a Mauritius company shall not enter into the following transactions unless the transaction is approved by special resolution or contingent on approval by special resolution of the shareholders of the company:
| (a) | the acquisition of, or an agreement to acquire, whether contingent or not, assets the value of which is more than |
| (b) | the disposition of, or an agreement to dispose of, whether contingent or not, assets of the company the value of which is more than |
| (c) | a transaction that has or is likely to have the effect of the company acquiring rights or interests or incurring obligations or liabilities the value of which is more than |
Under the Mauritius Companies Act, a special resolution is a resolution that is approved by a majority of 75%75.0% or, if a higher majority is required by the constitution of a Mauritius company, that higher majority, of the votes of those shareholders entitled to vote and voting on the question.
Where a transaction involves the acquisition or disposition or the acquiring of rights, interests or incurring obligations of, in any case, more than half the value of the Mauritius company’s assets, subject to certain exceptions prescribed in the Mauritius Companies Act, the transaction has to be approved by ordinary resolution or contingent on approval by ordinary resolution, and a Mauritius company shall not enter into the following transactions unless the transaction is approved by ordinary resolution or contingent on approval by ordinary resolution of the shareholders of the company:
| (a) | the acquisition of, or an agreement to acquire, whether contingent or not, assets the value of which is more than |
| (b) | the disposition of, or an agreement to dispose of, whether contingent or not, assets of the company the value of which is more than |
| (c) | a transaction that has or is likely to have the effect of the company acquiring rights or interests or incurring obligations or liabilities the value of which is more than |
Under the Mauritius Companies Act, an ordinary resolution is a resolution that is approved by a simple majority of the votes of those shareholders entitled to vote and voting on the matter which is the subject of the resolution.
Mergers and Similar Arrangements
A merger of two or more constituent companies under Mauritius law requires an amalgamation proposal to be approved by the directors of each constituent company and by special resolution of the shareholders of each constituent company.
A merger between a Mauritius parent company and its Mauritius subsidiary or subsidiaries does not require approval by a resolution of shareholders. For this purpose a “subsidiary” has the meaning assigned to it by the Mauritius Companies Act.
Save in certain circumstances, a dissentient shareholder of a Mauritius constituent company is entitled to payment of the fair and reasonable price for his shares upon dissenting to a merger or consolidation. The exercise of appraisal rights will normally preclude the exercise of any other rights save for the right to seek relief on the grounds that the merger or consolidation is void or unlawful.
In addition, there are statutory provisions that facilitate the reconstruction and amalgamation of companies where the Supreme Court of Mauritius, on the application of the company or, with leave of the court, any shareholder or creditor of the company, may order that an arrangement or amalgamation or compromise shall be binding on the company and on such other persons or classes of persons as the court may specify and any such order may be made on such terms and conditions as the court thinks fit.
Shareholders’ Suits
In principle, we will normally be the proper plaintiff, but under the Mauritius Companies Act, the Mauritius courts may grant leave to a shareholder (including a minority shareholder) to bring a derivative action.
Indemnification of Directors and Executive Officers and Limitation of Liability
Under the Mauritius Companies Act, a company may indemnify a director or employee of the company or a related company for any costs incurred by him or the company in respect of any proceedings (a) that relates to liability for any act or omission in his capacity as a director or employee and (b) in which judgment is given in his favor, in which he is acquitted, which is discontinued, in which he is granted relief under section 350 of the Mauritius Companies Act or where proceedings are threatened and such threatened action is abandoned or not pursued.
The Mauritius Companies Act further provides that a company may indemnify a director or employee of the company or a related company in respect of (a) liability to any person, other than the company or a related company, for any act or omission in his capacity as a director or employee or (b) costs incurred by that director or employee in defending or settling any claim or proceedings relating to any such liability, save in respect of any criminal liability or liability in respect of a breach (in the case of a director) of the duty to exercise his powers honestly in good faith in the best interests of the company. Our Constitution provides for indemnification, to the extent permitted by Mauritius law, of our directors and officers for costs, charges, losses, expenses and liabilities incurred or sustained by them in the execution and discharge of their duties in their respective offices or in relation thereto, except in respect of their own fraud or dishonesty.
Directors’ Fiduciary Duties
Under Delaware corporate law, a director of a Delaware corporation has a fiduciary duty to the corporation and its shareholders. This duty has two components: the duty of care and the duty of loyalty. The duty of care requires that a director act in good faith, with the care that an ordinarily prudent person would exercise under similar circumstances. Under this duty, a director must inform himself of, and disclose to shareholders, all material information reasonably available regarding a significant transaction. The duty of loyalty requires that a director act in a manner he or she reasonably believes to be in the best interests of the corporation. He or she must not use his or her corporate position for personal gain or advantage. This duty prohibits self-dealing by a director and mandates that the best interest of the corporation and its shareholders take precedence over any interest possessed by a director, officer or controlling shareholder and not shared by the shareholders generally. In general, actions of a director are presumed to have been made on an informed basis, in good faith and in the honest belief that the action taken was in the best interests of the corporation. However, this presumption may be rebutted by evidence of a breach of one of the fiduciary duties. Should such evidence be presented concerning a transaction by a director, a director must prove the procedural fairness of the transaction, and that the transaction was of fair value to the corporation.
As a matter of Mauritius law, a director of a Mauritius company is in the position of a fiduciary with respect to the company and therefore it is considered that he owes duties to the company that include a duty to act bona fide in the best interests of the company, a duty not to make a profit based on his or her position as director (unless the company permits him to do so) and a duty not to put himself in a position where the interests of the company conflict with his or her personal interest or his or her duty to a third party. Under the Mauritius Companies Act, our directors have a duty to our company to exercise their powers honestly, in good faith and in the best interests of our company. Our directors also have a duty to our company to exercise the degree of care, diligence and skill that a reasonably prudent person would exercise in comparable circumstances. Where a director of a public company also holds office as an executive, the director is required under Mauritius law to exercise that degree of care, diligence and skill which a reasonably prudent and competent executive in that position would exercise. In fulfilling their duty of care to our company, our directors must ensure compliance with the Mauritius Companies Act and our Constitution, as amended from time to time.
Neither Mauritian law nor our Constitution requires the majority of our directors to be independent.
Shareholder Action by Written Consent
Under the Delaware General Corporation Law, a corporation may eliminate the right of shareholders to act by written consent by amendment to its certificate of incorporation. Mauritius law provides that, save for the annual meeting of a company, shareholders may approve corporate matters by way of a unanimous written resolution signed by or on behalf of each shareholder who would have been entitled to vote on such matter at a general meeting without a meeting being held or by resolution in writing signed by shareholders holding not less than 75% or such other percentage as the constitution of the company may require for passing a special resolution, whichever is the greater, of the shareholders who would be entitled to vote on that resolution at a meeting of shareholders who together hold not less than 75% (or, if a higher percentage is required by the constitution, that higher percentage)75 per cent. of the votes entitled to be cast on that resolution.resolution, or such percentage above 75 per cent. as is required under the constitution.
Shareholder Meetings
Shareholders of a Delaware corporation generally do not have the right to call meetings of shareholders unless that right is granted in the certificate of incorporation or bylaws. However, if a corporation fails to hold its annual general meeting within a period of 30 days after the date designated for the annual meeting, or if no date has been designated for a period of 13 months after its last annual general meeting, the Delaware Court of Chancery may order a meeting to be held upon the application of a shareholder.
Mauritius law and our Constitution allow our shareholders to requisition a shareholders’ meeting. We are obliged by law to call a shareholders’ annual meeting once every year.
Cumulative Voting
Under the Delaware General Corporation Law, cumulative voting for elections of directors is not permitted unless the corporation’s certificate of incorporation specifically provides for it. Cumulative voting potentially facilitates the representation of minority shareholders on a board of directors since it permits the minority shareholder to cast all the votes to which the shareholder is entitled on a single director, which increases the shareholder’s voting power with respect to electing such director. As permitted under Mauritius law, our Constitution does not provide for cumulative voting. As a result, our shareholders are not afforded any less protections or rights on this issue than shareholders of a Delaware corporation.
Removal of Directors
Under the Delaware General Corporation Law, a director of a corporation with a classified board may be removed only for cause with the approval of a majority of the outstanding shares entitled to vote, unless the certificate of incorporation provides otherwise. Under our Constitution, directors may be removed by ordinary resolution of our shareholders.
Transactions with Interested Shareholders
The Delaware General Corporation Law contains business combination provision applicable to Delaware corporations whereby, unless the corporation has specifically elected not to be governed by such statute by amendment to its certificate of incorporation, it is prohibited from engaging in certain business combinations with an “interested shareholder” for three years following the date that such person becomes an interested shareholder. Subject to specified exceptions, an interested shareholder is a person or a group that owns 15%15.0% or more of the corporation’s outstanding voting stock (including any rights to acquire stock pursuant to an option, warrant, agreement, arrangement or understanding, or upon the exercise of conversion or exchange rights, and stock with respect to which the person has voting rights only), or is an affiliate or associate of the corporation and was the owner of 15%15.0% of more of the corporation’s outstanding voting stock at any time within the previous three years. This has the effect of limiting the ability of a potential acquirer to make a two-tiered bid for the target in which all shareholders would not be treated equally. The statute does not apply if, among other things, prior to the date on which such shareholder becomes an interested shareholder, the board of directors approves either the business combination or the transaction which resulted in the person becoming an interested shareholder. This encourages any potential acquirer of a Delaware corporation to negotiate the terms of any acquisition transaction with the target’s board of directors.
There is no such statutory provision under Mauritius law restricting transactions between a company and its significant shareholders.
Dissolution; Winding Up
Under the Delaware General Corporation Law, unless the board of directors approves the proposal to dissolve, dissolution must be approved by all shareholders entitled to vote thereon. Only if the dissolution is initiated by the board of directors may it be approved by a simple majority of the corporation’s outstanding shares. Delaware law allows a Delaware corporation to include in its certificate of incorporation a supermajority voting requirement in connection with dissolutions initiated by the board.
Under Mauritius law, a company may be wound up by either an order of the courts of Mauritius or by a special resolution of its members or, if the company is unable to pay its debts, by a special resolution of its members with leave of the court. The court has authority to order winding up in a number of specified circumstances including where it is, in the opinion of the court, just and equitable to do so.
Under the Insolvency Act 2009 of Mauritius, our company may be dissolved, liquidated or wound up by special resolution of our shareholders.
Variation of Rights of Shares
Under the Delaware General Corporation Law, a corporation may vary the rights of a class of shares with the approval of a majority of the outstanding shares of such class, unless the certificate of incorporation provides otherwise. Under Mauritius law and our Constitution, if our share capital is divided into more than one class of shares, we may vary the rights attached to any class only with the sanction of a special resolution passed at a general meeting of the holders of the shares of that class.
Amendment of Governing Documents
Under the Delaware General Corporation Law, a corporation’s governing documents may be amended with the approval of a majority of the outstanding shares entitled to vote, unless the certificate of incorporation provides otherwise. As permitted by Mauritius law, our Constitution may only be amended by special resolution of our shareholders.
Rights of Non-Resident or Foreign Shareholders
There are no limitations imposed by our Constitution on the rights of non-resident or foreign shareholders to hold or exercise voting rights on our shares.
Issuance of preferredPreferred shares
Our Constitution allows for our company to issue preferred shares. Our Constitution provides that the directors of our company may offer, issue, grant options over or otherwise dispose of shares of our company to such persons, at such times and for such consideration and upon such terms and conditions as the board of directors of our company may in its absolute discretion determine (save that no shares shall be issued below the par value of the share) and that any share in our company may be issued with or have attached thereto such rights or restrictions whether in regard to dividend, voting, return of capital or otherwise as our company may determine or, if there has not been any such determination or so far as the same does not make specific provision, as the board of directors of our company may determine.
Compulsory Acquisition
The Financial Services Commission in Mauritius has issued the Securities (Takeover) Rules 2010, or the Rules, under the Financial Services Act 2007 of Mauritius and the Mauritius Securities Act which may apply to takeover offers where the offeree is a reporting issuer in Mauritius and to a corporation holding a global business license which is listed on a relevant securities exchange. The Rules include provisions, inter alia, for the making of a mandatory offer and compulsory acquisition of shares. The Rules came into operation on May 1, 2011.
Anti-takeover provisionsAnti-Takeover Provisions
Mauritius law does not prevent Mauritius companies from adopting a wide range of defensive measures, such as staggered boards, issue of preferred shares, adoption of poison pill shareholder rights plans and provisions that restrict the rights of shareholders to call meetings. Our Constitution includes the following provisions which may be regarded as defensive measures: (i) a staggered board of directors, (ii) the ability to issue preferred shares, (iii) granting directors the absolute discretion to decline to register a transfer of any shares (other than a fully paid share), and (iv) requiring that amendments to the Constitution be approved by a special resolution of the shareholders of our company.
Registration Rights
Pursuant to a shareholders agreement dated as of July 16, 2010, by and among our company, Mr. Deep Kalra, Mr. Keyur Joshi and Mr. Sachin Bhatia, SB Asia Investment Fund II L.P., or SAIF, Travogue Electronic Travel Private Limited, Helion Venture thePartners, LLC, Sierra Ventures entities,VIII-A, L.P., Sierra Ventures VIII-B, L.P., Sierra Ventures Associates VIII, LLC, Tiger Global Private Investment Partners IV, L.P., Tiger Global Private Investment Partners V, L.P., Mr. Lee Fixel, Mr. Feroz Dewan, and Mr. Scott Shleifer (collectively referred to as the “Shareholders”), we have granted certain registration rights to certain holders of our Registrable Shares, as described below. The term “Registrable Shares,” as defined in the abovementioned shareholders agreement, means:
| (i) | any ordinary shares held by any of the Shareholders or the employees/management of our company or its subsidiaries; and |
| (ii) | any other ordinary shares of our company issued in respect of the ordinary shares described in paragraph (i) above pursuant to stock splits, stock dividends, reclassifications recapitalizations or similar events; |
provided that ordinary shares that are Registrable Shares shall cease to be Registrable Shares (a) upon any sale pursuant to a registration statement or Rule 144 under the Securities Act, (b) with respect to a Shareholder, when such Shareholder is eligible to sell, transfer or otherwise convey all of such Shareholder’s Registrable Shares without restriction pursuant to applicable law or (c) upon any sale in any manner to a person or entity which is not entitled to the rights provided by the shareholders agreement.
Subject to the terms of the shareholders agreement and lock-up agreements described in this annual report,Annual Report, at any time or from time to time after February 14, 2011, one or more of the Shareholders may request that our company effect a registration under the Securities Act of all or any part of the Registrable Shares owned by the Shareholders, provided that (i) the Registrable Shares to be so registered have a proposed aggregate offering price net of underwriting commissions, if any, of at least $5,000,000$5,000,000.0 in the aggregate, and (ii) our company shall not be required to effect more than two registrations requested in this manner in any 12 month period.
At any time after our company becomes eligible to file a registration statement on Form F-3 (or any similar or successor form for which our company then qualifies relating to secondary offerings), one or more of the Shareholders will have the right to require our company to effect the registration on Form F-3 (or any similar or successor form for which our Companycompany then qualifies) of all or any portion of the Registrable Shares held by the Shareholders, provided that (i) our company shall not be required to effect any registration of Registrable Shares unless such Registrable Shares have a proposed aggregate offering price net of underwriting commissions (if any) of at least $5,000,000$5,000,000.0 in the aggregate, and (ii) our company shall not be required to effect more than two registrations requested in this manner in any 12 month period.
In each case, no Shareholder may make more than one request for registration in any six month period.
Whenever our company proposes to file a registration statement including, but not limited to, registration statements relating to secondary offerings of securities of our company (but excluding registration statements relating to the paragraphs above and relating to employee benefit plans or with respect to corporate reorganizations) at any time and from time to time, our company will, at least 30 days prior to such filing, give written notice to all Shareholders of its intention to do so and, upon the written request of any Shareholder(s) given within 20 days after our company provides such notice, our company will use its reasonable efforts to cause all Registrable Shares that our company has been requested by such Shareholder(s) to register or to be registered under the Securities Act to the extent necessary to permit their sale or other disposition in accordance with the intended methods of distribution specified in the request of such Shareholder(s), provided that our company shall have the right to postpone or withdraw any such registration effected without obligation to any Shareholder.
We will pay all Registration Expenses (as defined below) of all registrations under the shareholders agreement, subject to certain provisos set out in the shareholdersshareholders’ agreement. For this purpose, the term “Registration Expenses” means all expenses incurred by our company in complying with the shareholders agreement, including (without limitation) all registration and filing fees, exchange listing fees, printing expenses, road show expenses, fees and disbursements of counsel for our company, the reasonable fees and expenses of one (1) special counsel selected by the selling Shareholders to represent the selling Shareholders, state Blue Sky fees and expenses (if any), fees and expenses of our company’s independent auditors and the expense of any special audits incidental to or required by any such registration, but excluding underwriting discounts, selling commissions and the fees and expenses of selling Shareholders’ own counsel (other than the counsel selected to represent all the selling Shareholders).
On June 14, 2013, we filed a registration statement on Form F-3 to register all Registrable Shares of SAIF pursuant to the exercise of its demand registration right by SAIF under the abovementioned shareholders agreement. The registration statement was declared effective on July 17, 2013. No shares were sold by SAIF under such registration statement. All such shares have been included in the registration statement on Form F-3 that we filed on February 14, 2014, as amended on March 4, 2014. This registration statement was declared effective on March 10, 2014. As of March 31, 2014, SAIF had sold 1,500,000 ordinary shares under this registration statement.
C. Material Contracts
Described herein.
D. Exchange Controls
GeneralIndia
The Government of India regulates ownership of Indian companies by foreigners. Foreign investment in securities issued by Indian companies isand exchange controls are generally regulated by the Foreign Exchange Management Act, 1999, as amended, and the regulations framed thereunder or FEMA, read with the rules, regulations and notifications issued under FEMA. A person resident outside India can transferTransfers of any security of an Indian company or any other securityfrom foreigners to an Indian resident onlyresidents and vice versa are required to be in accordance with the terms and conditions specified in FEMA and the rules, regulations and notifications made thereunder or as permitted by the RBI.
Foreign Direct Investment
The GovernmentReserve Bank of India. These regulations and restrictions may apply to acquisitions by us or our affiliates, including MMT India pursuantand affiliates which are not resident in India, of shares in Indian companies or the provision of funding by us or any other entity to Indian companies within our group. For example, under its liberalization policy, set up the Foreign Investment Promotion Board, or FIPB, to regulate allconsolidated foreign direct investment. Foreign direct investment or FDI, means investment by way of subscription and/or purchase of shares or securities convertible or exchangeable into shares of an Indian company by a non resident investor. FDI in India can be either through the automatic route where no prior approval of any regulatory authority is required or through the government approval route. Over a period of time,policy, the Government of India has relaxed the restrictions onset out additional requirements for foreign investment. Subject to certain conditions, under current regulations, FDI in most industry sectors does not require prior approval of the FIPB or the RBI if the percentage of equity holding by all foreign investors does not exceed specified industry-specific thresholds. These conditions include certain minimum pricing requirements, compliance with the Securities and Exchange Board of India, or SEBI, (Substantial Acquisition of Shares and Takeovers) Regulations, 1997, as amended, or the Takeover Code, and ownership restrictions based on the nature of the foreign investor. FDI is prohibited in certain sectors such as retail trading. Also, certain investments require the prior approval of the FIPB, including:
investments in excess of specified sectoral caps or investments in sectors in which FDI is not permitted or in sectors which specifically require approval of the FIPB;
India, including requirements with respect to downstream investments by anyIndian companies owned or controlled by foreign investor who had on January 12, 2005, an existing joint venture or a technology transfer/trade mark agreement inentities, and the same field as the Indian company in which the FDI is proposed. However, no prior approval is required if: (a) the investor is a venture capital funds registered with SEBI or a multinational financial institution, or (b) the existing joint venture, investment by either of the parties is less than 3%, or (c) the existing joint venture or collaboration is now defunct or sick, or (d) for transfer of shares of an Indian company engaged in the information technology sectorownership or in the mining sector for the same area or mineral;
foreign investment of more than 24% in the equity capital of units manufacturing items reserved for small scale industries; and
all proposals relating to the acquisition of shares of an Indian company by a foreign investor (including an individual of Indian nationality or origin residing outside India and corporations established and incorporated outside India) which are not under the automatic route.
The Government of India amended the method of calculating foreign investment in an Indian company pursuant to Press Note No. 2 (2009 Series) dated February 13, 2009 and Press Note No. 4 (2009 Series) dated February 25, 2009.
A person residing outside India (other than a citizen of Pakistan or Bangladesh) or any entity incorporated outside India (other than an entity incorporated in Pakistan or Bangladesh and an Overseas Corporate Body as defined in FEMA) has general permission to purchase shares, convertible debentures or preference shares of an Indian company, subject to certain terms and conditions.
Currently, subject to certain exceptions, FDI and investment by Non-Resident Indians, or NRIs (as such term is defined in FEMA), in Indian companies do not require the prior approval of the FIPB or the RBI. The Government of India has indicated that in all cases where FDI is allowed on an automatic basis without FIPB approval, the RBI would continue to be the primary agency for the purposes of monitoring and regulating foreign investment. The foregoing description applies only to an issuance of shares and not to a transfer of shares by Indian companies.
Investment by Foreign Institutional Investors
Pension funds, mutual funds, investment trusts, insurance or reinsurance companies, international or multinational organizations or agencies thereof, foreign governmental agencies, sovereign wealth funds or foreign central banks, endowment funds, university funds, foundation or charitable trusts or charitable societies investing on their own behalf and asset management companies, investment managers or advisors, banks or institutional portfolio managers, trustees, investing their proprietary funds or on behalf of “broad based” funds must register with SEBI as a foreign institutional investor, or FII, and obtain the approval of the RBI unless they are investing in securitiescontrol of Indian companies through FDI.in sectors with caps on foreign investment from resident Indian persons or entities to foreigners. These requirements currently include restrictions on valuations and sources of funding for such investments and may include prior approval from the Foreign Investment Promotion Board.
FIIs who are registered with SEBI are requiredOur ability to comply withpay dividends to our shareholders will depend on, among other things, the provisionsavailability of dividends from MMT India. As of the SEBI (Foreign Institutional Investors) Regulations, 1995, as amended, or the Foreign Institutional Investors Regulations. A registered FII may, subject to the pricingdate of this Annual Report, MMT India has not paid any cash dividends on its equity shares. Dividends other than in cash are not permitted under Indian law. The declaration and ownership restrictions discussed below, buy and freely sell securities issued bypayment of any Indian company, realize capital gains on investments made through the initial amount invested in India, subscribe to or renounce rights offerings for shares, appoint a domestic custodian for custody of investments made and repatriate the capital, capital gains, dividends income received by way of interest and any compensation received towards sale or renunciation of rights offerings of shares.
Subject to the terms and conditions set out in the Foreign Institutional Investor Regulations, a registered FII or its sub-account may buy or sell equity shares, debentures and warrants of unlisted, listed or tofuture will be listed Indian companies through stock exchanges in India at ruling market price and also buy or sell shares or debentures of listed or unlisted companies other than on a stock exchange in compliance with the applicable SEBI/RBI pricing norms. Under the portfolio investment scheme under Schedule 2 to the Foreign Exchange Management (Transfer or Issue of Securityrecommended by a Person Resident outside India) Regulations, 2000 and the Foreign Institutional Investors Regulations, an FII is not permitted to hold more than 10% of the total issued capital of an Indian company in its own name; a foreign corporate or individual sub-account of the FII is not permitted to hold more than 5% of the total issued capital of an Indian company, and a broad based sub-account is not permitted to hold more than 10% of the total issued capital of an Indian company. The total holding of all FIIs together with their sub-accounts in an Indian company is subject to a cap of 24% of the total issued capital of the company, which may be increased up to the percentage of sectoral cap on FDI in respect of the said company pursuant to a resolution of the board of directors of the companyMMT India and the approval ofapproved by the shareholders of MMT India at their discretion and would depend on a number of factors, including its financial condition, results of operations, capital requirements and surplus, contractual obligations, applicable Indian legal restrictions, the provisions of its articles of association, the terms of its credit facilities and other financing arrangements at the time a dividend is considered and other factors considered relevant by the board of directors. MMT India may also from time to time pay interim dividends. MMT India is liable to pay dividend distribution tax in India at the rate of 15.0%, plus applicable cess and surcharge, on any dividends paid by it.
Under Indian law, a company declares dividends upon a recommendation by a special resolution in a general meeting. Ourits board of directors and approval by a majority of the shareholders at the annual general meeting of shareholders held within six months of the end of each fiscal year. However, while final dividends can be paid out by a company only after such dividends have been recommended by the board of directors and approved by shareholders, interim dividends can be paid out with only a recommendation by the board of directors. The shareholders have approved anthe right to decrease but not to increase any dividend amount recommended by the board of directors. Under Indian law, shares of a company belonging to the same class must receive equal dividend treatment.
MMT India may, before the declaration of any dividend in any financial year, transfer such percentage of its profits for that financial year as it may consider appropriate to the reserves of MMT India.
If profits for a particular year are insufficient to declare dividends (including interim dividends), the dividends for that year may be declared and paid out from accumulated profits if the following conditions are fulfilled:
Regulation 15Aone-tenth of the Foreign Institutional Investors Regulations provides that an FII may issue or otherwise deal in offshore derivative instruments such as participatory notes, equity linked notes or any other similar instruments against underlying securities, listed or proposed to be listed on any stock exchange in India, only in favor of those entities which are regulated by any regulatory authority in the countries of their incorporation or establishment, subject to compliance with “know your client” requirements. SEBI has clarified that certain categories of entities would be deemed to be regulated entities for purposes of Regulation 15Asum of the Foreign Institutional Investors Regulations. An FII is also required to ensure that no further issue or transfer of any offshore derivative instrument is made to any person other than a person regulated by an appropriate foreign regulatory authority.
There is uncertainty under Indian law about the tax regime applicable to FIIs that hold and trade ADSs. FIIs are urged to consult with their Indian legal and tax advisors about the relationship between the FII guidelines and ADSs and any equity shares withdrawn upon surrender of ADSs.
Portfolio Investment by Non-Resident Indians
A variety of methods for investing in shares of Indian companies are available to NRIs. Under the portfolio investment scheme, each NRI can purchase up to 5% of thecompany’s paid-up share capital and free reserves, and the amount so drawn shall first be utilized to set off the losses incurred in the financial year before any dividend in respect of an Indian company, subject to equity shares is declared;
Overseas corporate bodies controlled by NRIs, or OCBs, were previously permitted to invest on more favorable terms under the portfolio investment scheme. The RBI no longer recognizes OCBs as an eligible class of investment vehicle under various routes and schemes under the foreign exchange regulations.
Transfer of Shares
Previously the sale of shares of an Indian company from a non-resident to a resident required RBI approval, unless the sale was made on a stock exchange through a registered stockbroker at the market price. The RBI has now granted general permission to persons resident outside India to transfer shares and convertible debentures held by them to an Indian resident, subject to compliance with certain terms and conditions and reporting requirements. A resident who wishes to purchase shares from a non-resident must, pursuant to the relevant notice requirements, file a declaration with an authorized dealerprovided for in the prescribed Form FC-TRS, together with the relevant documents and file an acknowledgment thereof with the Indian company to effect transfer of the shares. However, a non-resident to whom the sharesprevious years are being transferred is required to obtain the prior permission of the Government of India to acquire the shares if he had on January 12, 2005, an existing joint venture or technology transfer agreement or trademark agreementset off against profits in the same field other than in the information technology field to that in which the Indian company whose shares are being transferred is engaged, except:
investments to be made by venture capital funds registered with SEBI or a multinational financial institution;
where the existing joint venture investment by either of the parties is less than 3%;
where the existing venture/collaboration is defunct or sick; or
for transfer of shares of an Indian company engaged in the information technology sector or in the mining sector for the same area or mineral.
A non-resident may also transfer any security to a person resident in India by way of gift. The transfer of shares from an Indian resident to a non-resident does not require the prior approval of the Government of India or the RBI if the activities of the investee company are under the automatic route pursuant to the FDI Policy and are not under the financial services sector, the investor does not have an existing joint venture or technology transfer agreement or trademark agreement in the same field as described above, the non-resident shareholding is within sector limits under the FDI policy, the transaction is not under the Takeover Code and the pricing is in accordance with the guidelines prescribed by SEBI and the RBI.
A non-resident of India is generally permitted to sell equity shares underlying the ADSs held by him to any other non-resident of India without the prior approval of the RBI. However, approval by the FIPB is required if the person acquiring the shares has a previous venture or tie up in India in the same field in which the company whose shares are being transferred is engaged. Further, the RBI has granted general permission for the transfer of shares by a person resident outside India to a person resident in India, subject to compliance with certain pricing norms and reporting requirements.
Other than mutual funds that may purchase ADSs subject to terms and conditions specified by the RBI and employees in connection with stock options, a person resident in India is not permitted to hold ADSs of an Indian company. An ADS holder is permitted to surrender the ADSs held by him in an Indian company and to receive the underlying equity shares under the terms of the deposit agreement.
Exchange Rates
Our consolidated financial statements and other financial data included in this annual reportAnnual Report are presented in US dollars. Our business and operations are primarily conducted in India through our Indian subsidiary, MMT India. The functional currency of MMT India is Indian Rupees and its revenues and expenses are denominated in that currency. The functional currency of the Hotel Travel Group is the US dollar but a significant amount of its trade and other receivables, trade and other payables and cash and cash equivalents are denominated in Euro. We report our consolidated financial results in US dollars. The conversion of Indian Rupees into US dollars in this annual reportAnnual Report is based on the noon buying rate in The City of New York for cable transfers of Indian Rupees as certified for customs purposes by the Federal Reserve Bank of New York. For your convenience, unless otherwise noted, all translations from Indian Rupees to US dollars and from US dollars to Indian Rupees in this annual reportAnnual Report were made at a rate of Rs. 55.3458.36 per $1.00, the noon buying rate in effect as of June 15, 2012.May 23, 2014. We make no representation that any Indian Rupee or US dollar amounts referred to in this annual reportAnnual Report could have been or could be converted into US dollars or Indian Rupees, as the case may be, at any particular rate or at all. The effects of foreign currency translation adjustments are included as a component of other comprehensive income in our shareholders’ equity.
The following table setstables set forth, for each of the periods indicated, the low, average, high and period-end noon buying rates in The City of New York for cable transfers, in Indian Rupees per US dollar and in Euro per US dollar, as certified for customs purposes by the Federal Reserve Bank of New York. These rates are provided solely for your convenience and are not necessarily the exchange rates that we used in this annual reportAnnual Report or will use in the preparation of our periodic reports or any other information to be provided to you.
| Indian Rupees per US Dollar Noon Buying Rate | ||||||||||||||||
Period | Period End | Average(1) | Low | High | ||||||||||||
Fiscal Year | ||||||||||||||||
2007 | 39.41 | 41.00 | 38.48 | 44.49 | ||||||||||||
2008 | 48.58 | 43.70 | 39.12 | 50.12 | ||||||||||||
2009 | 46.40 | 48.22 | 46.00 | 51.96 | ||||||||||||
2010 | 44.80 | 45.58 | 43.90 | 47.49 | ||||||||||||
2011 | 53.01 | 46.86 | 44.00 | 53.71 | ||||||||||||
Month | ||||||||||||||||
December 2011 | 53.01 | 52.38 | 51.23 | 53.71 | ||||||||||||
January 2012 | 49.54 | 51.00 | 49.39 | 53.11 | ||||||||||||
February 2012 | 48.99 | 49.18 | 48.65 | 49.48 | ||||||||||||
March 2012 | 50.89 | 50.36 | 49.14 | 51.38 | ||||||||||||
April 2012 | 52.65 | 51.69 | 50.64 | 52.65 | ||||||||||||
May 2012 | 56.38 | 54.33 | 52.50 | 56.38 | ||||||||||||
June(2) | 55.34 | 55.46 | 54.91 | 55.69 | ||||||||||||
| Indian Rupees per US Dollar Noon Buying Rate | ||||||||||||||||
Period | Period End | Average(1) | Low | High | ||||||||||||
Fiscal Year | ||||||||||||||||
2010 | 44.95 | 47.38 | 44.94 | 50.48 | ||||||||||||
2011 | 44.54 | 45.49 | 43.90 | 47.49 | ||||||||||||
2012 | 50.89 | 47.85 | 44.00 | 53.71 | ||||||||||||
2013 | 54.52 | 54.35 | 50.64 | 57.13 | ||||||||||||
2014 | 60.00 | 60.42 | 53.65 | 68.80 | ||||||||||||
Month | ||||||||||||||||
December 2013 | 61.92 | 61.81 | 60.87 | 62.38 | ||||||||||||
January 2014 | 62.63 | 62.11 | 61.45 | 63.09 | ||||||||||||
February 2014 | 61.78 | 62.16 | 61.78 | 62.63 | ||||||||||||
March 2014 | 60.00 | 60.95 | 59.89 | 62.17 | ||||||||||||
April 2014 | 60.21 | 60.35 | 59.86 | 61.17 | ||||||||||||
May 2014 | 59.16 | 59.28 | 58.30 | 60.21 | ||||||||||||
Notes:
| (1) | Averages for a period other than one month are calculated by using the average of the noon buying rate at the end of each month during the period. Monthly averages are calculated by using the average of the daily noon buying rates during the relevant month. |
| Euro per US Dollar Noon Buying Rate | ||||||||||||||||
Period | Period End | Average(1) | Low | High | ||||||||||||
Fiscal Year | ||||||||||||||||
2010 | 0.75 | 0.71 | 0.78 | 0.66 | ||||||||||||
2011 | 0.71 | 0.76 | 0.84 | 0.70 | ||||||||||||
2012 | 0.75 | 0.73 | 0.79 | 0.67 | ||||||||||||
2013 | 0.78 | 0.78 | 0.83 | 0.73 | ||||||||||||
2014 | 0.73 | 0.75 | 0.78 | 0.72 | ||||||||||||
Month | ||||||||||||||||
December 2013 | 0.73 | 0.73 | 0.74 | 0.72 | ||||||||||||
January 2014 | 0.74 | 0.74 | 0.74 | 0.73 | ||||||||||||
February 2014 | 0.72 | 0.73 | 0.74 | 0.72 | ||||||||||||
March 2014 | 0.73 | 0.72 | 0.73 | 0.72 | ||||||||||||
April 2014 | 0.72 | 0.72 | 0.73 | 0.72 | ||||||||||||
May 2014 | 0.73 | 0.73 | 0.74 | 0.72 | ||||||||||||
Notes:
Source: Federal Reserve Statistical Release.
E. Taxation
Mauritius TaxationTax Consequences
Our company holds a valid Category 1 Global Business Licence issued by the Financial Services Commission in Mauritius,Mauritius. Our company holds a validspecific Tax Residence Certificate issuedfor India, valid until May 4, 2015 and a general Tax Residence Certificate for all jurisdictions, valid until May 8, 2015, from the Mauritius Revenue Authority, as per the guidelines prescribed by the Mauritius Revenue Authority in connection withAuthority. These certificates are required for the Agreementavoidance of double taxation under the Agreements for the Avoidance of Double Taxation signed between Mauritius and India, and a valid Tax Residence Certificate issued by the Mauritius Revenue Authority in connection with the Agreement for the Avoidance of Double Taxation signed between Mauritius and Singapore. Our company is tax resident in Mauritius.other jurisdictions, including India.
The Income Tax Act 1995 of Mauritius imposes a tax in Mauritius on the chargeable income of our company at the rate of 15%15.0%. However, under the Income Tax (Foreign Tax Credit) Regulations 1996 of Mauritius, subject to the Income Tax Act 1995 and the regulations of the Income Tax (Foreign Tax Credit) Regulations 1996, credit is allowed for foreign tax on the foreign source income of a resident of Mauritius against Mauritius tax computed by reference to the same income, and where credit is allowed against Mauritius tax chargeable in respect of any income, the amount of Mauritius tax so chargeable shall be reduced by the amount of the credit. Under the Income Act, 1995, “foreign source income” means income which is not derived from Mauritius and includes in the case of a corporation holding a Category 1 Global Business Licence under the Financial Services Act 2007 of Mauritius, income derived from its transactions with non-residents or corporations holding a Category 1 Global Business Licence under the Financial Services Act. Subject to the provisions of the Income Tax (Foreign Tax Credit) Regulations 1996, no credit is allowed in respect of foreign tax unless written evidence is presented to the Mauritius Revenue Authority showing the amount of foreign tax which has been charged and for this purpose, “written evidence” includes a receipt of the relevant authorities of the foreign country for the foreign tax or any other evidence that the foreign tax has been deducted or paid to the relevant authorities of that country. However, pursuant to regulation 8 of the Income Tax (Foreign Tax Credit) Regulations 1996, if written evidence is not presented to the Mauritius Revenue Authority showing the amount of foreign tax charged on our foreign source income, the amount of foreign tax shall nevertheless be conclusively presumed to be equal to 80%80.0% of the Mauritius tax chargeable with respect to that income and in such circumstance, the effective tax rate in Mauritius on our chargeable income would be 3%3.0%.
Following amendments to the Financial Services Act 2007 of Mauritius pursuant to the Finance (Miscellaneous Provisions) Act 2010 in December 2010, Mauritius companies holding a Category 1 Global Business Licence, or GBC1, issued by the Financial Services Commission in Mauritius are permitted to conduct business both in and outside Mauritius (instead of outside Mauritius only). The operations of a GBC1 company in Mauritius will be subject to tax on chargeable income at the rate of 15%15.0% in Mauritius.
Mauritius currently has no capital gains tax and has no taxation in the nature of a withholding tax on the payment of dividends. There is no withholding tax requirement on interest or royalties payments applicable to us as a holder of a Category 1 Global Business Licence issued by the Financial Services Commission in Mauritius where such interest are paid to a non-resident of Mauritius not carrying on any business in Mauritius and such royalties are paid to non-residents of Mauritius. There is no estate duty, inheritance tax or gift tax in Mauritius.
Under existing Mauritius laws:
no capital, transfer or registration duties are levied in Mauritius on the issue, purchase or sale of our ordinary shares;
dividend payments or other distributions to holders of our ordinary shares are exempt from Mauritius tax, and no withholding will be required of our company on dividend payments or other distributions; and
gains derived from the sale or disposition of our ordinary shares will not be subject to Mauritius tax.
There are currently no exchange controls or currency exchange restrictions in Mauritius.
Prospective investors are advised to consult their tax advisors with respect to their particular tax situations and the tax effects of an investment in our shares.
US Federal Income Taxation
The following discussion describes certain material US federal income tax consequences to US Holders (as defined below) under current law of an investment in our ordinary shares. This discussion applies only to US Holders that hold the ordinary shares as capital assets (generally, property held for investment) and that have the US dollar as their functional currency. This discussion is based on the tax laws of the United States in effect as of the date of this annual reportAnnual Report and on US Treasury regulations in effect or, in some cases, proposed as of the date of this annual report,Annual Report, as well as judicial and administrative interpretations thereof available on or before such date. All of the foregoing authorities are subject to change, which change could apply retroactively and could affect the tax consequences described below.
The following discussion does not deal with the tax consequences to any particular investor or to persons in special tax situations such as:
banks and other financial institutions;
insurance companies;
regulated investment companies;
real estate investment trusts;
broker-dealers;
traders that elect to use a mark-to-market method of accounting;
US expatriates;
tax-exempt entities;
persons liable for alternative minimum tax;
persons holding ordinary shares as part of a straddle, hedging, conversion or integrated transaction;
persons that actually or constructively own 10%10.0% or more of the total combined voting power of all classes of our voting stock;
persons who acquired ordinary shares pursuant to the exercise of any employee share option or otherwise as compensation; or
partnerships or other pass-through entities, or persons holding ordinary shares through such entities.
The discussion also does not deal with the consequences of the recently enacted Medicare tax on “net investment income.”
PROSPECTIVE INVESTORS ARE URGED TO CONSULT THEIR TAX ADVISORS REGARDING THE APPLICATION OF THE US FEDERAL TAX RULES TO THEIR PARTICULAR CIRCUMSTANCES AS WELL AS THE STATE, LOCAL, NON-US AND OTHER TAX CONSEQUENCES TO THEM OF THE PURCHASE, OWNERSHIP AND DISPOSITION OF OUR ORDINARY SHARES.
The discussion below of the US federal income tax consequences to “US Holders” will apply to you if you are a beneficial owner of our ordinary shares and you are, for US federal income tax purposes:
an individual who is a citizen or resident of the United States;
a corporation (or other entity taxable as a corporation for US federal income tax purposes) created or organized in the United States or under the laws of the United States, any state thereof or the District of Columbia;
an estate, the income of which is subject to US federal income taxation regardless of its source; or
a trust that (1) is subject to the primary supervision of a court within the United States and the control of one or more United States persons for all substantial decisions or (2) has a valid election in effect under applicable US Treasury regulations to be treated as a United States person.
The tax treatment of a partner in a partnership (or other entity taxable as a partnership for US federal income tax purposes) that holds our ordinary shares will depend on the status of such partner and the activities of such partnership. If you are a partner in such partnership, you should consult your tax advisors.
Dividends and Other Distributions
Subject to the passive foreign investment company, or PFIC, rules discussed below, the gross amount (in US dollars) of any distribution we make to you with respect to our ordinary shares (including the amount of any non-US taxes withheld therefrom) will generally be includible in your gross income as dividend income, on the date of receipt, but only to the extent that such distribution is paid out of our current or accumulated earnings and profits (as determined under US federal income tax principles). Amounts not treated as dividend income for US federal income tax purposes will constitute a return of capital and will first be applied against and reduce yourthe tax basis in your ordinary shares, but not below zero. Distributions in excess of our current and accumulated earnings and profits and your tax basis in yourthe ordinary shares will be treated as capital gain realized on the sale or other disposition of the ordinary shares. However, we do not intend to calculate our earnings and profits under US federal income tax principles. Therefore, you should expect that any distribution we make to you will be reported as a dividend even if such distribution would otherwise be treated as a non-taxable return of capital or as capital gain under the rules described above. Any dividends we pay may not be eligible for the dividends-received deduction allowed to corporations in respect of dividends received from other US corporations.
With respect to certain non-corporate US Holders, including individual US Holders, for taxable years beginning before January 1, 2013, dividends will be taxed at the lower capital gains rate applicable to “qualified dividend income,” provided that (1) either our ordinary shares are readily tradable on an established securities market in the United States, (2) we are neither a PFIC nor treated as such with respect to you for the taxable year in which the dividend is paid and the preceding taxable year and (3) certain holding period requirements are met. Under US Internal Revenue Service authority, common or ordinary shares are considered for purposes of clause (1) above to be readily tradable on an established securities market in the United States if they are listed on the Nasdaq Global Market, as our ordinary shares are. You should consult your tax advisors regarding the availability of the lower tax rate applicable to qualified dividend income for any dividends we pay with respect to our ordinary shares, as well as the effect of any change in applicable law after the date of this annual report.Annual Report.
For foreign tax credit purposes, the limitation on foreign taxes eligible for credit is calculated separately with respect to specific classes of income. For this purpose, any dividends we pay with respect to our ordinary shares will generally be treated as foreign source income and constitute “passive category income” but could, in the case of certain US Holders, constitute “general category income.” If the dividends are taxed as qualified dividend income (as discussed above), the amount of the dividends taken into account for purposes of calculating the foreign tax credit limitation will be limited to the gross amount of the dividends, multiplied by the reduced tax rate applicable to qualified dividend income and divided by the highest tax rate normally applicable to dividends. The rules relating to the determination of the foreign tax credit are complex, and you should consult your tax advisors regarding the availability of a foreign tax credit in your particular circumstances.
Dispositions
Subject to the PFIC rules discussed below, you will recognize taxable capital gain or loss on any sale, exchange or other taxable disposition of an ordinary share equal to the difference between the amount realized (in US dollars) for the ordinary share and your adjusted tax basis (in US dollars) in the ordinary share. If you are a non-corporate US Holder, including an individual US Holder, that has held the ordinary share for more than one year, you may be eligible for reduced tax rates. The deductibility of capital losses is subject to limitations. Any gain or loss that you recognize on a disposition of our ordinary shares will generally be treated as US source income or loss for foreign tax credit limitation purposes.
Passive Foreign Investment Company
Based on, among other things, the current and anticipated valuation of our assets and composition of our income and assets, we do not believe we werewill be a PFIC for US federal income tax purposes for our current taxable year ending March 31, 2012.or will become a PFIC in the foreseeable future. However, the application of the PFIC rules is subject to uncertainty in several respects. In addition, a separate determination must be made after the close of each taxable year as to whether we were a PFIC for that year. Accordingly, we cannot assure you that we will not be a PFIC for our current taxable year or any future taxable year.
A non-US corporation will be a PFIC for any taxable year if either:
at least 75%75.0% of its gross income for such year is passive income; or
at least 50%50.0% of the value of its assets (based on an average of the quarterly values of the assets) during such year is attributable to assets that produce passive income or are held for the production of passive income (the “asset test”).
For this purpose, we will be treated as owning our proportionate share of the assets and earning our proportionate share of the income of any other corporation in which we own, directly or indirectly, at least 25%25.0% (by value) of the stock.
Because the value of our assets for purposes of the asset test will generally be determined in part by reference to the market price of our ordinary shares, fluctuations in the market price of the ordinary shares may cause us to become a PFIC. In addition, changes in the composition of our income or assets may cause us to become a PFIC. If we are a PFIC for any taxable year during which you hold ordinary shares, we will continue to be treated as a PFIC with respect to you for all succeeding years during which you hold the ordinary shares, unless we cease to be a PFIC and you make a “deemed sale” election with respect to the ordinary shares. If such election is made, you will be deemed to have sold the ordinary shares you hold at their fair market value and any gain from such deemed sale would be subject to the rules described in the following two paragraphs. After the deemed sale election, so long as we do not become a PFIC in a subsequent taxable year, your ordinary shares with respect to which such election was made will not be treated as shares in a PFIC.
For each taxable year that we are treated as a PFIC with respect to you, you will be subject to special tax rules with respect to any “excess distribution” you receive and any gain you recognize from a sale or other disposition (including a pledge) of the ordinary shares, unless you make a “mark-to-market” election as discussed below. Distributions you receive in a taxable year that are greater than 125%125.0% of the average annual distributions you received during the shorter of the three preceding years or your holding period for the ordinary shares will be treated as an excess distribution. Under these special tax rules:
the excess distribution or recognized gain will be allocated ratably over your holding period for the ordinary shares;
the amount allocated to the current taxable year and any taxable years in your holding period prior to the first taxable year in which we were a PFIC will be treated as ordinary income; and
the amount allocated to each other taxable year will be subject to the highest tax rate in effect for individuals or corporations, as applicable, for each such year and the interest charge applicable to underpayments of tax will be imposed on the resulting tax attributable to each such year.
The tax liability for amounts allocated to taxable years prior to the year of disposition or excess distribution cannot be offset by any net operating losses for such years, and gains (but not losses) from a sale or other disposition of our ordinary shares cannot be treated as capital, even if you hold the ordinary shares as capital assets.
If we are treated as a PFIC with respect to you for any taxable year, to the extent any of our subsidiaries are also PFICs or we make direct or indirect equity investments in other entities that are PFICs, you will be deemed to own the shares in such lower-tier PFICs that are directly or indirectly owned by us in that proportion that the value of the ordinary shares you own bears to the value of all of our ordinary shares, and you may be subject to the rules described in the preceding two paragraphs with respect to the shares of such lower-tier PFICs that you would be deemed to own. You should consult your tax advisors regarding the application of the PFIC rules to any of our subsidiaries.
A US Holder of “marketable stock” (as defined below) of a PFIC may make a mark-to-market election for such stock to elect out of the PFIC rules described above regarding excess distributions and recognized gains. If you make a mark-to-market election for our ordinary shares, you will include in gross income for each year that we are a PFIC an amount equal to the excess, if any, of the fair market value of the ordinary shares you hold as of the close of your taxable year over your adjusted tax basis in such ordinary shares. You will be allowed a deduction for the excess, if any, of the adjusted tax basis of the ordinary shares over their fair market value as of the close of the taxable year. However, deductions will be allowable only to the extent of any net mark-to-market gains on the ordinary shares included in your income for prior taxable years. Amounts included in your gross income under a mark-to-market election, as well as any gain from the actual sale or other disposition of the ordinary shares, will be treated as ordinary income. Ordinary loss treatment will apply to the deductible portion of any mark-to-market loss on the ordinary shares, as well as to any loss from the actual sale or other disposition of the ordinary shares, to the extent that the amount of such loss does not exceed the net mark-to-market gains previously included for such ordinary shares. Your tax basis in the ordinary shares will be adjusted to reflect any such income or loss amounts. If you make a mark-to-market election, the tax rules that apply to distributions by corporations that are not PFICs would apply to any distributions that we make, except that the lower tax rate applicable to qualified dividend income (discussed above under “— Dividends and Other Distributions”) generally would not apply.
The mark-to-market election is available only for “marketable stock,” which is stock that is traded in greater than de minimisminims quantities on at least 15 days during each calendar quarter (“regularly traded”) on a qualified exchange or other market, as defined in applicable US Treasury regulations. Our ordinary shares are listed on the Nasdaq Global Market, which is a qualified exchange or other market for these purposes. Consequently, if the ordinary shares are regularly traded and you are a holder of the ordinary shares, we expect that the mark-to-market election would be available to you if we were to become a PFIC. Because a mark-to-market election cannot be made for equity interests in any lower-tier PFICs that we own, a US Holder may continue to be subject to the PFIC rules described above regarding excess distributions and recognized gains with respect to its indirect interest in any investments held by us that are treated as an equity interest in a PFIC for US federal income tax purposes. You should consult your tax advisors as to the availability and desirability of a mark-to-market election, as well as the impact of such election on interests in any lower-tier PFICs.
Alternatively, a US person that owns stock of a PFIC generally may make a “qualified electing fund” election with respect to such corporation to elect out of the PFIC rules described above regarding excess distributions and recognized gains. A US person that makes a qualified electing fund election with respect to a PFIC will generally include in gross income for a taxable year such US person’s pro rata share of the corporation’s earnings and profits for the taxable year. However, the qualified electing fund election is available only if the PFIC provides such US person with certain information regarding its earnings and profits as required under applicable US Treasury regulations. We currently do not intend to prepare or provide the information that would enable you to make a qualified electing fund election.
Unless otherwise provided by the US Treasury, each US shareholder of a PFIC is required to file an annual reportAnnual Report containing such information as the US Treasury may require. If we are or become a PFIC, you should consult your tax advisor regarding any reporting requirements that may apply to you.
You should consult your tax advisors regarding the application of the PFIC rules to your investment in our ordinary shares and the elections discussed above.
Information Reporting and Backup Withholding
Dividend payments with respect to ordinary shares and proceeds from the sale, exchange or other disposition of ordinary shares will generallymay be subject to information reporting to the US Internal Revenue Service and possible US backup withholding at a current rate of 28%28.0%. Backup withholding will not apply, however, to a US Holder that furnishes a correct taxpayer identification number and makes any other required certification on US Internal Revenue Service Form W-9 or that is otherwise exempt from backup withholding. US Holders that are exempt from backup withholding should still complete US Internal Revenue Service Form W-9 to avoid possible erroneous backup withholding. You should consult your tax advisors regarding the application of the US information reporting and backup withholding rules.
Backup withholding is not an additional tax. Amounts withheld as backup withholding may be credited against your US federal income tax liability, and you may obtain a refund of any excess amounts withheld under the backup withholding rules by filing an appropriate claim for refund with the US Internal Revenue Service and furnishing any required information in a timely manner.
Additional Reporting Requirements
U.S.US individuals that own “specified foreign financial assets” with an aggregate value in excess of US$50,000certain threshold amounts are generally required to file an information report with respect to such assets with their tax returns. “Specified foreign financial assets” include any financial accounts maintained by foreign financial institutions, as well as any of the following, but only if they are not held in accounts maintained by financial institutions: (i)(is) stocks and securities issued by non-U.S.non-US persons, (ii) financial instruments and contracts held for investment that have non-U.S.non-US issuers or counterparties, and (iii) interests in foreign entities. Our ordinary shares may be subject to these rules. US Holders that are individuals should consult their tax advisers regarding the application of this requirement to their ownership of the our shares.
F. Dividends and Paying Agents
Not applicable
G. Statements by Experts
Not applicable
H. Documents on Display
All information filed with the SEC can be inspected and copied at the public reference facilities maintained by the SEC at 100 F Street, N.E., Washington, D.C. 20549. You can request copies of these documents upon payment of a duplicating fee, by writing to the SEC. Please call the SEC at 1-800-SEC-0330 for further information on the operation of the public reference rooms. The SEC maintains a website atwww.sec.govthat contains reports, proxy and information statements and other information regarding registrants that make electronic filings through its Electronic Data Gathering, Analysis, and Retrieval, or EDGAR, system. All our Exchange Act reports and other SEC filings will be available through the EDGAR system.
I. Subsidiary Information
Not applicable
| ITEM 11. | QUANTITATIVE AND QUALITATIVE DISCLOSURES ABOUT MARKET RISK |
Our business activities are exposed to a variety of market risks, including credit risk, foreign currency risk and interest rate risk.
Credit Risk.Financial instruments that potentially subject us to concentrations of credit risk consist principally of term deposits, cash equivalents, and trade and other receivables. By their nature, all such financial instruments involve risks, including the credit risk of non-performance by counterparties. Our cash equivalents, bank balances and term deposits are placed with banks with high investment grade credit ratings, and our term deposits may be withdrawn at any time prior to maturity except that this would result in a lower interest rate. Trade and other receivables are typically unsecured and arise mainly from commissions and incentive payments owing to us from our airline suppliers, receivables from our hotel suppliers which represent amounts owing to us from deposits we place with such hotels, and receivables from our corporate and retail customers to whom we typically extend credit periods. We review the credit worthiness of our clients to which we have granted credit terms in the normal course of the business. We believe there is no significant risk of loss in the event of non-performance of the counterparties to these financial instruments, other than the amounts already provided for in our financial statements. See note 3035 to our audited consolidated financial statements included elsewhere in this Annual Report for additional information relating to our exposure to credit risk.
Foreign Exchange Risk.We are exposed to movements in currency exchange rates, primarily those related to the US dollar and the Indian Rupee. As the functional currency of MMT India, our key operating subsidiary, is the Indian Rupee, our exposure to foreign currency risk primarily arises in respect of our non-Indian Rupee-denominated trade and other receivables, trade and other payables and cash and cash equivalents, which were $5.1$8.2 million, $17.1$38.0 million and $3.6$3.0 million, respectively, as of March 31, 2012, and $3.6 million, $11.0 million and $1.0 million, respectively, as of March 31, 2011.2014. Based on our operations in fiscal year 2012,2014, a 10.0% appreciation of the US dollar against the Indian Rupee as of March 31, 2012,2014, assuming all other variables remained constant, would have decreasedincreased our profitloss for the year by $0.8$2.6 million. Similarly, a 10.0% depreciation of the US dollar against the Indian Rupee as of March 31, 2012, assuming all other variables remained constant, would have increased our profit for the year by $0.8 million. Based on our operations in fiscal year 2011, a 10.0% appreciation of the US dollar against the Indian Rupee as of March 31, 2011,2014, assuming all other variables remained constant, would have decreased our profitloss for the year by $0.6$2.6 million.
Further, we are also exposed to movements in currency exchange rates between the US dollar and the Euro. As the functional currency of the Hotel Travel Group is the US dollar, our exposure to foreign currency risk primarily arises in respect of our non-US dollar denominated trade and other receivables, trade and other payables and cash and cash equivalents, which were $1.2 million, $0.8 million and $3.4 million, respectively, as of March 31, 2014. Based on our operations in fiscal year 2014, a 10.0% appreciation of the Euro against the US dollar as of March 31, 2014, assuming all other variables remained constant, would have decreased our loss for the year by $0.4 million. Similarly, a 10.0% depreciation of the US dollarEuro against the Indian RupeeUS dollar as of March 31, 2011,2014, assuming all other variables remained constant, would have increased our loss for the year by $0.4 million.
We are also exposed to movements between the US dollar and the Indian Rupee in our operations, as approximately 7.2%3.9% and 11.1%2.9% of our revenue for fiscal years 20112013 and 2012,2014, respectively, was generated by MMT India from its air ticketing business and received in US dollars although our expenses are generally incurred in Indian Rupees. We currently do not have any hedging agreements or similar arrangements with any counter-party to cover our exposure to any fluctuations in foreign exchange rates. While we do incorporate margins in our pricing to cover any adverse fluctuations in foreign exchange rates, there can be no assurance that such margins will adequately protect us from adverse fluctuations in foreign exchange rates and hence our earnings remain susceptible to foreign exchange rate fluctuations. However as this risk associated with currency exchange is largely confined to our non-Indian Rupee revenue, we believe our exposure is minimal and immaterial.
Interest Rate Risk.Our exposure to interest rate risk for changes in interest rates relates primarily to our term deposits and bank overdrafts. As of March 31, 2012,2014, we had fixed rate financial instruments consisting of $66.3$105.2 million of term deposits. As of March 31, 2011,2013, we had fixed rate financial instruments consisting of $16.9$55.4 million of term deposits and $3.9$0.9 million of variable rate financial instruments, consisting of our bank overdrafts. We have not used any derivative financial instruments to hedge interest rate risk. We have not been exposed nor do we anticipate being exposed to material risks due to changes in interest rates. Our future interest income and financing cost may fluctuate in line with changes in interest rates. We do not account for any fixed rate financial instruments at fair value through profit or loss. As of March 31, 2012,2014, we had no amount outstanding on account of variable rate financial instruments. Accordingly, a change in interest rates as of March 31, 2012 would not have affected our profit or loss. Based on our consolidated balance sheet as of March 31, 2012, aA sensitivity analysis shows that any increase in the interest rates as of March 31, 20122014 would not have affected our profit or loss and would not have had any impact on our equity. As of March 31, 2013, we had $0.9 million outstanding on account of variable rate financial instruments. A sensitivity analysis shows that an increase of 100 basis points in interest rates as of March 31, 2013 would have increased loss or decreased profit by $0.1 million and would not have had any impact on our equity. Similarly, a decrease of 100 basis points in interest rates as of March 31, 2013 would have decreased loss or increased profit by $0.1 million and would not have had any impact on our equity.
| ITEM 12. | DESCRIPTION OF SECURITIES OTHER THAN EQUITY SECURITIES |
A. Debt Securities
Not applicable
B. Warrants and Rights
Not applicable
C. Other Securities
Not applicable
D. American Depositary Shares
Not applicable
| ITEM 13. | DEFAULTS, DIVIDEND ARREARAGES AND DELINQUENCIES |
None
| ITEM 14. | MATERIAL MODIFICATIONS TO THE RIGHTS OF SECURITY HOLDERS AND USE OF PROCEEDS |
Not applicable
| ITEM 15. | CONTROLS AND PROCEDURES |
A. Disclosure Controls and Procedures
As required by Rules 13a-15 and 15d-15 under the Exchange Act, management, including our group chief executive officer and our group chief financial and operating officer, has evaluated the effectiveness of our disclosure controls and procedures as of the end of the period covered by this report. Disclosure controls and procedures refer to controls and other procedures designed to ensure that information required to be disclosed in the reports we file or submit under the Exchange Act is recorded, processed, summarized and reported, within the time periods specified in the rules and forms of the SEC. Disclosure controls and procedures include, without limitation, controls and procedures designed to ensure that information required to be disclosed by us in our reports that we file or submit under the Exchange Act is accumulated and communicated to management, including our principal executive and principal financial officers, or persons performing similar functions, as appropriate to allow timely decisions regarding our required disclosure.
Based on the foregoing, our group chief executive officer and our group chief financial and operating officer have concluded that, as of March 31, 2012,2014, our disclosure controls and procedures were effective.
B. Management’s Report on Internal Control over Financial Reporting
Our management is responsible for establishing and maintaining adequate internal control over financial reporting as defined in Rules 13a-15(f) and 15d-15(f) under the Exchange Act. Our internal control over financial reporting is a process to provide reasonable assurance regarding the reliability of financial reporting and the preparation of financial statements for external purposes in accordance with International Financial Reporting Standards, or IFRS, as issued by the International Accounting Standards Board, or IASB. Our internal control over financial reporting includes those policies and procedures that:
pertain to the maintenance of records that, in reasonable detail, accurately and fairly reflect the transactions and dispositions of our assets;
provide reasonable assurance that transactions are recorded as necessary to permit preparation of financial statements in accordance with IFRS, as issued by IASB;
provide reasonable assurance that our receipts and expenditures are being made only in accordance with authorizations of our management and directors; and
provide reasonable assurance regarding prevention or timely detection of unauthorized acquisition, use or disposition of our assets that could have a material effect on the financial statements.
Because of its inherent limitations, internal control over financial reporting may not prevent or detect misstatements. Also, projections of any evaluation of effectiveness to future periods are subject to the risk that controls may become inadequate because of changes in conditions, or that the degree of compliance with the policies or procedures may deteriorate.
Our management, with the participation of our group chief executive officer and our group chief financial and operating officer, assessed the effectiveness of our internal control over financial reporting as of March 31, 2012.2014. In conducting its assessment of internal control over financial reporting, management based its evaluation on the 1992 framework in “Internal Control – Integrated Framework” issued by the Committee of Sponsoring Organizations of the Treadway Commission. Based on its evaluation, our management has concluded that our internal control over financial reporting was effective as of March 31, 2012.2014.
We acquired Luxury Tours and Travel Pte Limited on May 9, 2011,the ETB Group in February 2014, and in making the assessment of effectiveness of the Company’s internal control over financial reporting as of March 31, 2012,2014, we excluded Luxury Tours and Travel Pte Limited’sthe ETB Group’s internal control over financial reporting associated with total assets of $6,123,614$8,673,980 (of which $ 3,067,269$5,263,284 represents goodwill and intangibles included within the scope of the assessment) and total revenuesrevenue of $12,093,348$1,461,230, included in theour consolidated financial statements as of and for the year ended March 31, 2012.2014.
Our independent registered public accounting firm, KPMG, has audited the consolidated financial statements included in this annual reportAnnual Report on Form 20-F, and as part of their audit, has issued their report, included herein, on the effectiveness of our internal control over financial reporting as of March 31, 2012.2014.
C. Attestation Report of the Registered Public Accounting Firm
Report of Independent Registered Public Accounting Firm
The Board of Directors and Shareholders
MakeMyTrip Limited:
We have audited MakeMyTrip Limited and subsidiaries’ (“the Company”) internal control over financial reporting as of March 31, 2012,2014, based on criteria established inInternal Control –Integrated Framework(1992) issued by the Committee of Sponsoring Organizations of the Treadway Commission (COSO). The Company’s management is responsible for maintaining effective internal control over financial reporting and for its assessment of the effectiveness of internal control over financial reporting, included in the accompanyingManagement’s Report on Internal Control Overover Financial Reporting. Our responsibility is to express an opinion on the Company’s internal control over financial reporting based on our audit.
We conducted our audit in accordance with the standards of the Public Company Accounting Oversight Board (United States). Those standards require that we plan and perform the audit to obtain reasonable assurance about whether effective internal control over financial reporting was maintained in all material respects. Our audit included obtaining an understanding of internal control over financial reporting, assessing the risk that a material weakness exists, and testing and evaluating the design and operating effectiveness of internal control based on the assessed risk. Our audit also included performing such other procedures as we considered necessary in the circumstances. We believe that our audit provides a reasonable basis for our opinion.
A company’s internal control over financial reporting is a process designed to provide reasonable assurance regarding the reliability of financial reporting and the preparation of financial statements for external purposes in accordance with generally accepted accounting principles. A company’s internal control over financial reporting includes those policies and procedures that (1) pertain to the maintenance of records that, in reasonable detail, accurately and fairly reflect the transactions and dispositions of the assets of the company; (2) provide reasonable assurance that transactions are recorded as necessary to permit preparation of financial statements in accordance with generally accepted accounting principles, and that of receipts and expenditures of the company are being made only in accordance with authorizations of management and directors of the company; and (3) provide reasonable assurance regarding prevention or timely detection of unauthorized acquisition, use, or disposition of the company’s assets that could have a material effect on the financial statements.
Because of its inherent limitations, internal control over financial reporting may not prevent or detect misstatements. Also, projections of any evaluation of effectiveness to future periods are subject to the risk that controls may become inadequate because of changes in conditions, or that the degree of compliance with the policies or procedures may deteriorate.
In our opinion, the Company maintained, in all material respects, effective internal control over financial reporting as of March 31, 2012,2014, based on criteria established inInternal Control – Integrated Framework(1992) issued by the Committee of Sponsoring Organizations of the Treadway Commission.Commission (COSO).
The Company acquired Luxury Tours and Travel Pte LimitedEasytobook Holding B.V. during the year ended March 31, 2012,2014, and management excluded from its assessment of the effectiveness of the Company’s internal control over financial reporting as of March 31, 2012, Luxury Tours and Travel Pte Limited’s2014, Easytobook Holding B.V.’s internal control over financial reporting associated with total assets of $6,123,614$8,673,980 (of which $ 3,067,269$5,263,284 represents goodwill and intangiblesintangible assets included within the scope of the assessment) and total revenues of $12,093,348$1,461,230 included in the consolidated financial statements of the Company as of and for the year ended March 31, 2012.2014. Our audit of internal control over financial reporting of the Company also excluded an evaluation of the internal control over financial reporting of Luxury Tours and Travel Pte Limited.Easytobook Holding B.V.
We also have audited, in accordance with the standards of the Public Company Accounting Oversight Board (United States), the consolidated statements of financial position of the Company as of March 31, 20122013 and 2011,2014, and the related consolidated statements of profit or loss and other comprehensive income (loss), changes in equity (deficit) and cash flows for each of the years in the three-year period ended March 31, 2012,2014, and our report dated June 25, 20126, 2014 expressed an unqualified opinion on those consolidated financial statements.
/s/ KPMG
Gurgaon, India
June 25, 2012
D. Changes in Internal Control over Financial Reporting
Management has evaluated, with the participation of our group chief executive officer and our group chief financial and operating officer, whether any changes in our internal control over financial reporting that occurred during our last fiscal year have materially affected, or are reasonably likely to materially affect, our internal control over financial reporting. Based on the evaluation we conducted, management has concluded that no such changes have occurred.
In making its assessment of the changes in internal control over financial reporting during the period covered by this Annual Report, our management excluded an evaluation of the internal control over financial reporting of Luxury Tours and Travel Pte Limited,the ETB Group, acquired during the year ended March 31, 2012.2014. See Note 8 to the Consolidated Financial Statements for a discussion of the acquisitions.acquisition.
| ITEM 16A. | AUDIT COMMITTEE FINANCIAL EXPERT |
Our audit committee consists of Messrs. Vivek N. Gour, Ranodeb Roy and Frederic Lalonde and is chaired by Mr. Gour. Each of our audit committee members satisfies the independence requirements of Rule 56055605(a)(2) of the Nasdaq Stock Market, Marketplace Rules, and the independence requirements of Rule 10A-310A-3(b)(1) under the Exchange Act. See “Item 6. Directors, Senior Management and Employees — C. Board Practices” for the experience and qualifications of the members of the audit committee. Our board of directors also has determined that Mr. Gour qualifies as an audit committee financial expert within the meaning of the SEC rules.
| ITEM 16B. | CODE OF ETHICS |
We have adopted a written Codecode of Business Conductbusiness conduct and Ethicsethics that provides that our directors and officers are expected to avoid any action, position or interest that conflicts with the interests of our company or gives the appearance of a conflict. Directors and officers have an obligation under our code of business conduct and ethics to advance our company’s interests when the opportunity to do so arises. The full text of our code of business conduct and ethics is available on our website, athttp://investors.makemytrip.com/governance.cfm.
| ITEM 16C. | PRINCIPAL ACCOUNTANT FEES AND SERVICES |
Our financial statements prepared in accordance with IFRS are audited by KPMG, a firm registered with the Public Company Accounting Oversight Board in the United States.
KPMG has served as our independent registered public accountant for each of the years ended March 31, 2010,2012, March 31, 20112013 and March 31, 20122014 for which audited statements appear in this annual report.Annual Report.
The following table shows the aggregate fees for professional services and other services rendered by KPMG and the various member firms of KPMG to us, including some of our subsidiaries, in fiscal years 2010, 20112013 and 2012.2014.
| Fiscal | ||||||||||||
| 2010 | 2011 | 2012 | ||||||||||
Audit fees (audit and review of financial statements and offerings) | $ | 102,631 | $ | 561,219 | $ | 326,979 | ||||||
Tax fees (tax audit, other certifications and tax advisory services) | 82,300 | 76,568 | 80,633 | |||||||||
All other fees (advisory services) | — | 56,598 | 2,705 | |||||||||
|
|
|
|
|
| |||||||
Total | $ | 184,931 | $ | 694,385 | $ | 410,317 | ||||||
|
|
|
|
|
| |||||||
| Fiscal | ||||||||
| 2013 | 2014 | |||||||
Audit fees (audit and review of financial statements and offerings) | $ | 192,921 | $ | 344,603 | ||||
Tax fees (other certifications and tax advisory services) | 105,639 | 269,275 | ||||||
All other fees (advisory services) | 2,389 | 1,574 | ||||||
|
|
|
| |||||
Total | $ | 300,949 | $ | 615,452 | ||||
|
|
|
| |||||
Audit Committee Pre-approval Process
Our audit committee reviews and pre-approves the scope and the cost of audit services related to us and permissible non-audit services performed by the independent auditors, other than those forde minimusminimisservices which are approved by the audit committee prior to the completion of the audit. All of the services related to our company provided by KPMG during the last fiscal year have been approved by the audit committee.
| ITEM 16D. | EXEMPTIONS FROM THE LISTING STANDARDS FOR AUDIT COMMITTEES |
Not applicable
| ITEM 16E. | PURCHASES OF EQUITY SECURITIES BY THE ISSUER AND AFFILIATED PURCHASERS |
The following table provides information about purchases by us during fiscal year 2014 of our outstanding ordinary shares, par value $0.0005 per share:
Period | (a) Total Number of Shares Purchased | (b) Average Price Paid per Share(2) | (c) Total Number of Shares Purchased as Part of Publicly Announced Plans or Programs | (d) Maximum Number (or Approximate Dollar Value) of Shares that May Yet Be Purchased Under the Plans or Programs(1) | ||||||||||||
Up to 03/31/13 | 40,142 | 12.63 | 40,142 | $ | 24,492,145 | |||||||||||
04/01/13 – 04/30/13 | — | — | — | $ | 24,492,145 | |||||||||||
05/01/12 – 05/31/13 | 100 | 12.50 | 100 | $ | 24,490,893 | |||||||||||
06/01/13 – 06/30/13 | — | — | — | $ | 24,490,893 | |||||||||||
07/01/13 – 07/31/13 | — | — | — | $ | 24,490,893 | |||||||||||
08/01/12 – 08/31/13 | — | — | — | $ | 24,490,893 | |||||||||||
09/01/13 – 09/30/13 | — | — | — | $ | 24,490,893 | |||||||||||
10/01/13 – 10/31/13 | — | — | — | $ | 24,490,893 | |||||||||||
11/01/12 – 11/30/13 | — | — | — | $ | 24,490,893 | |||||||||||
12/01/13 – 12/31/13 | — | — | — | $ | 24,490,893 | |||||||||||
01/01/14 – 01/31/14 | — | — | — | $ | 24,490,893 | |||||||||||
02/01/14 – 02/28/14 | — | — | — | $ | 24,490,893 | |||||||||||
03/01/14 – 03/31/14 | — | — | — | $ | 24,490,893 | |||||||||||
Total | 40,242 | 12.63 | 40,242 | $ | 24,490,893 | |||||||||||
|
|
|
|
|
| |||||||||||
Notes:
| (1) | On November 6, 2012, our board of directors authorized us to purchase our outstanding ordinary shares, par value $0.0005 per share. The authorization permits us to purchase our ordinary shares on the open market, in privately negotiated transactions or otherwise in an aggregate amount of up to $25 million. We repurchased 40,142 and 100 ordinary shares at an average price of approximately $12.63 per share and $ 12.50 per share (excluding broker and transaction fees) in fiscal year 2013 and 2014 respectively. As of March 31, 2014, we had remaining authority to repurchase up to approximately $24.49 million of our outstanding ordinary shares. |
| (2) | The average price paid per share excludes broker and transaction fees. |
| ITEM 16F. | CHANGE IN REGISTRANT’S CERTIFYING ACCOUNTANT |
Not applicable
Not applicable
| ITEM 16G. | CORPORATE GOVERNANCE |
The Nasdaq Marketplace Rules, or the Nasdaq Rules, provide that foreign private issuers may follow home country practice in lieu of the corporate governance requirements of the Nasdaq Stock Market LLC, subject to certain exceptions and requirements and except to the extent that such exemptions would be contrary to U.S.US federal securities laws and regulations. The significant differences between our corporate governance practices and those followed by U.S.US companies under the Nasdaq Rules are summarized as follows:
We follow home country practice that permits our board of directors to consist of less than a majority of independent directors, in lieu of complying with Rule 5605(b)(1) of the Nasdaq Rules that requires that the board of directors consist of a majority of independent directors.
We follow home country practice that permits our board of directors not to implement a nominations committee, in lieu of complying with Rule 5605(e) of the Nasdaq Rules that requires the implementation of a nominations committee.
We follow home country practice that permits us not to hold regular executive sessions where only independent directors are present, in lieu of complying with Rule 5605(b)(2) of the Nasdaq Rules that requires that regular executive sessions are held where only independent directors are present.
Other than the above, we have followed and intend to continue to follow the applicable corporate governance standards under the Nasdaq Marketplace Rules.
In accordance with Rule 5250(d)(1) under Nasdaq Marketplace Rules, we will post this annual reportAnnual Report on Form 20-F on our company website at http://investors.makemytrip.com. In addition, we will provide hard copies of our annual reportAnnual Report free of charge to shareholders and ADS holders upon request.
| ITEM 16H. | MINE SAFETY DISCLOSURE |
Not applicable
| ITEM 17. | FINANCIAL STATEMENTS |
See “Item 18. Financial Statements” for a list of the financial statements filed as part of this annual report.Annual Report.
| ITEM 18. | FINANCIAL STATEMENTS |
The following financial statements are filed as part of this annual report,Annual Report, together with the report of the independent registered public accounting firms:
Report of Independent Registered Public Accounting Firm.
Consolidated Statements of Financial Position as of March 31, 20112013 and 2012.
Consolidated Statements of Profit or Loss and other Comprehensive Income (Loss) for the years ended March 31, 2010, 20112012, 2013 and 2012.
Consolidated Statements of Changes in Equity (Deficit) for the years ended March 31, 2010, 20112012, 2013 and 2012.
Consolidated Statements of Cash Flows for the years ended March 31, 2010, 20112012, 2013 and 2012.
Notes to the Consolidated Financial Statements.
| ITEM 19. | EXHIBITS |
The following exhibits are filed as part of this annual report:Annual Report:
| 1.1 | Constitution of MakeMyTrip Limited (Incorporated by reference to Exhibit 3.1 to the Registration Statement on Form F-1 (File No. 333-168315) as filed with the SEC on July 26, 2010). | |||
| 2.1 | Form of ordinary share certificate (Incorporated by reference to Exhibit 4.1 to the Registration Statement on Form F-1 (File No. 333-168315) as filed with the SEC on July 26, 2010). | |||
| 4.1 | Amended and Restated MakeMyTrip.com 2001 Equity Option Plan (Incorporated by reference to Exhibit 10.1.1 to the Registration Statement on Form F-1 (File No. 333-168315) as filed with the SEC on July 26, 2010). | |||
| 4.2 | MakeMyTrip 2010 Share Incentive Plan (Incorporated by reference to Exhibit 10.1.2 to the Registration Statement on Form F-1 (File No. 333-168315) as filed with the SEC on July 26, 2010). | |||
| 4.3 | ||||
| Fourth Amended and Restated Shareholders Agreement dated July 16, 2010 by and among the shareholders named therein and our company (Incorporated by reference to Exhibit 10.3 to the Registration Statement on Form F-1 (File No. 333-168315) as filed with the SEC on July 26, 2010). | ||||
Form | ||||
| ||||
| Passenger Sales Agency Agreement dated August 30, 2002 by and between MMT India and each IATA member, represented by the Director General of IATA (Incorporated by reference to Exhibit 10.5 to the Registration Statement on Form F-1 (File No. 333-168315) as filed with the SEC on July 26, 2010). | ||||
| Business Process Outsourcing Services Agreement dated March 5, 2008 by and between MMT India and IBM (Incorporated by reference to Exhibit 10.6.1 to the Registration Statement on Form F-1 (File No. 333-168315) as filed with the SEC on July 26, 2010). | ||||
| Statement of Work dated March 5, 2008 by and between MMT India and IBM, or the IBM Statement of Work (Incorporated by reference to Exhibit 10.6.2 to the Registration Statement on Form F-1 (File No. 333-168315) as filed with the SEC on July 26, 2010). | ||||
| First Amendment to the IBM Statement of Work dated July 16, 2008 (effective as of March 5, 2008), by and between MMT India and IBM (Incorporated by reference to Exhibit 10.6.3 to the Registration Statement on Form F-1 (File No. 333-168315) as filed with the SEC on July 26, 2010). | ||||
| Second Amendment to the IBM Statement of Work dated July 28, 2009 (effective as of May 1, 2009), by and between MMT India and IBM (Incorporated by reference to Exhibit 10.6.4 to the Registration Statement on Form F-1 (File No. 333-168315) as filed with the SEC on July 26, 2010). | ||||
| Amendment Number 3 to the Business Process Outsourcing Services Agreement dated November 4, 2009 (effective as of June 1, 2009) by and between MMT India and IBM (Incorporated by reference to Exhibit 10.6.5 to the Registration Statement on Form F-1 (File No. 333-172572) as filed with the SEC on March 2, 2011). | ||||
| Fourth Amendment to the Business Process Outsourcing Services Agreement dated December 9, 2010 (effective as of April 1, 2010) by and between MMT India and IBM (Incorporated by reference to Exhibit 10.6.6 to the Registration Statement on Form F-1 (File No. 333-172572) as filed with the SEC on March 2, 2011). | ||||
| Fifth Amendment to the Business Process Outsourcing Services Agreement dated December 10, 2010 (effective as of July 15, 2010) by and between MMT India and IBM (Incorporated by reference to Exhibit 10.6.7 to the Registration Statement on Form F-1 (File No. 333-172572) as filed with the SEC on March 2, 2011). | ||||
| Sixth Amendment to the Master Services Agreement and Statement of Work dated December 18, 2010 (effective as of December 1, 2010) by and between MMT India and IBM (Incorporated by reference to Exhibit 10.6.8 to the Registration Statement on Form F-1 (File No. 333-172572) as filed with the SEC on March 2, 2011). | ||||
| Seventh Amendment to Master Services Agreement and Statement of Work dated April 7, 2011 by and between MMT India and IBM (Incorporated by reference to Exhibit 10.6.9 to the Registration Statement on Form F-1 (File No. 333-172572) as filed with the SEC on May 13, 2011). | ||||
| Eighth Amendment to the Master Services Agreement and Statement of Work dated October 27, 2011 (effective as of August 1, 2011) by and between MMT India and | ||||
| Ninth Amendment to the Master Services Agreement and Statement of Work dated December 29, 2011 (effective as of January 1, 2012) by and between MMT India and | ||||
| Statement of Work dated December 29, 2011 (effective as of January 1, 2012) by and between MMT India and IBM (Incorporated by reference to Exhibit 4.20 to the Annual Report on Form 20-F (File No. 001-34837) as filed with the SEC on June 25, 2012). | ||||
| 4.18 | Amendment No. 10 to the Master Service Agreement and Statement of Work dated July 4, 2012 by and between MMT India and IBM (Incorporated by reference to Exhibit 4.18 to the Annual Report on Form 20-F (File No. 001-34837) as filed with the SEC on June 13, 2013). | |||
| 4.19 | Amendment No. 11 to the Business Process Outsourcing Services Agreement dated November 1, 2012 by and between MMT India and IBM (Incorporated by reference to Exhibit 4.19 to the Annual Report on Form 20-F (File No. 001-34837) as filed with the SEC on June 13, 2013). | |||
| 4.20**# | Amendment No. 12 to the Business Process Outsourcing Services Agreement and Statement of Work dated July 12, 2013 by and between MMT India and IBM. | |||
| 4.21**# | ||||
| 4.22** | ||||
| 4.23** | Letter from Concentrix Corporation to MMT India dated January 31, 2014 regarding the acquisition of IBM by Synnex. | |||
| 4.24 | Master Services Agreement dated July 6, 2009 by and between MMT India and RightNow Technologies, Inc (Incorporated by reference to Exhibit 10.8 to the Registration Statement on Form F-1 (File No. 333-168315) as filed with the SEC on July 26, 2010). | |||
| Oracle Cloud Services Agreement dated May 14, 2014 by and between MMT India and Oracle India Pvt Ltd. | ||||
| 4.26 | Sanction Letter for Working Capital Facilities dated September 7, 2009 by and between MMT India and HDFC Bank (including letter of amendment) (Incorporated by reference to Exhibit 10.10 to the Registration Statement on Form F-1 (File No. 333-168315) as filed with the SEC on July 26, 2010). | |||
| | Sanction Letter for Working Capital Facilities dated January 6, 2011 by and between MMT India and HDFC Bank (Incorporated by reference to Exhibit 10.10.2 to the Registration Statement on Form F-1 (File No. 333-172572) as filed with the SEC on March 2, 2011). | |||
| | Sanction Letter for Credit Facilities dated December 17, 2012 by and between MMT India and Yes Bank Limited (Incorporated by reference to Exhibit 4.23 to the Annual Report on Form 20-F (File No. 001-34837) as filed with the SEC on June 13, 2013). | |||
| 4.29 | Supplemental Master Facility Agreement dated February 7, 2013 by and between MMT India and Yes Bank Limited (Incorporated by reference to Exhibit 4.24 to the Annual Report on Form 20-F (File No. 001-34837) as filed with the SEC on June 13, 2013). | |||
| 4.30** | Sanction Letter for Credit Facilities dated December 17, 2013 by and between MMT India and IndusInd Bank. | |||
| 4.31** | Sanction Letter for Credit Facilities dated January 31, 2014 by and between MMT India and IndusInd Bank. | |||
| 4.32** | Sanction Letter for Credit Facilities dated March 18, 2014 by and between MMT India and IndusInd Bank. | |||
| 4.33** | Master General Terms Agreement dated February 6, 2014 by and between MMT India and IndusInd Bank. | |||
| 4.34 | Form of director and executive officer indemnification agreement (Incorporated by reference to Exhibit 10.11 to the Registration Statement on Form F-1 (File No. 333-168315) as filed with the SEC on July 26, 2010). | |||
| 8.1** | List of significant subsidiaries of MakeMyTrip Limited. | |||
| 12.1** | Certification by the Chief Executive Officer pursuant to 17 CFR 240. 15d-14(a), as adopted pursuant to Section 302 of the Sarbanes-Oxley Act of 2002. | |||
| 12.2** | Certification by the Chief Financial Officer pursuant to 17 CFR 240. 15d-14(a), as adopted pursuant to Section 302 of the Sarbanes-Oxley Act of 2002. | |||
| 13.1** | Certification by the Chief Executive Officer pursuant to 18 U.S.C. Section 1350, as adopted pursuant to Section 906 of the Sarbanes-Oxley Act of 2002. | |||
| 13.2** | Certification by the Chief Financial Officer pursuant to 18 U.S.C. Section 1350, as adopted pursuant to Section 906 of the Sarbanes-Oxley Act of 2002. | |||
| 15.1** | Consent of Independent Registered Public Accounting Firm. | |||
| ** | Filed herewith |
| # | Confidential treatment requested |
The registrant hereby certifies that it meets all of the requirements for filing on Form 20-F and that it has duly caused and authorized the undersigned to sign this annual reportAnnual Report on its behalf.
Date: June 25, 20126, 2014
| MAKEMYTRIP LIMITED | ||
| By: | /s/ Deep Kalra | |
| Name: | Deep Kalra | |
| Title: | Group Chairman and Group Chief Executive Officer | |
INDEX TO CONSOLIDATED FINANCIAL STATEMENTS
| Page | ||||
Consolidated | F-3 | |||
| F-4 | ||||
| F-5 | ||||
| F-8 | ||||
| F-9 | ||||
Report of Independent Registered Public Accounting Firm
The Board of Directors and Shareholders
MakeMyTrip Limited:
We have audited the accompanying consolidated statements of financial position of MakeMyTrip Limited and subsidiariessubsidiaries’ (“the Company”) as of March 31, 20122013 and 2011,2014, and the related consolidated statements of profit or loss and other comprehensive income (loss), changes in equity (deficit) and cash flows for each of the years in the three-year period ended March 31, 2012.2014. These consolidated financial statements are the responsibility of the Company’s management. Our responsibility is to express an opinion on these consolidated financial statements based on our audits.
We conducted our audits in accordance with the standards of the Public Company Accounting Oversight Board (United States). Those standards require that we plan and perform the audit to obtain reasonable assurance about whether the financial statements are free of material misstatement. An audit includes examining, on a test basis, evidence supporting the amounts and disclosures in the financial statements. An audit also includes assessing the accounting principles used and significant estimates made by management, as well as evaluating the overall financial statement presentation. We believe that our audits provide a reasonable basis for our opinion.
In our opinion, the consolidated financial statements referred to above present fairly, in all material respects, the financial position of the Company as of March 31, 20122013 and 2011,2014, and the results of their operations and their cash flows for each of the years in the three-year period ended March 31, 2012,2014, in conformity with International Financial Reporting Standards as issued by the International Accounting Standards Board.
We also have audited, in accordance with the standards of the Public Company Accounting Oversight Board (United States), the Company’s internal control over financial reporting as of March 31, 2012,2014, based on criteria established inInternal Control –— Integrated Framework(1992) issued by the Committee of Sponsoring Organizations of the Treadway Commission (COSO), and our report dated June 25, 20126, 2014 expressed an unqualified opinion on the effectiveness of the Company’s internal control over financial reporting.
/s/ KPMG
Gurgaon, India
June 25, 20126, 2014
CONSOLIDATED STATEMENT OF FINANCIAL POSITION
| As at March 31 | ||||||||||
| Note | 2013 | 2014 | ||||||||
| (in USD) | ||||||||||
Assets | ||||||||||
Property, plant and equipment | 17 | 9,203,826 | 8,532,640 | |||||||
Intangible assets and goodwill | 18 | 34,987,017 | 39,240,542 | |||||||
Trade and other receivables, net | 20 | 820,951 | 982,585 | |||||||
Investment in equity-accounted investee | 8 | 1,294,082 | 1,122,594 | |||||||
Other investments | 9 | 4,958,994 | 3,973,363 | |||||||
Derivative instruments | 14,678 | — | ||||||||
Term deposits | 22 | 911,245 | 75,656,254 | |||||||
Non-current tax assets | — | 6,515,244 | ||||||||
Other non-current assets | 24 | 527,391 | 476,326 | |||||||
|
|
|
| |||||||
Total non-current assets | 52,718,184 | 136,499,548 | ||||||||
Inventories | 1,522,693 | 515,663 | ||||||||
Derivative instruments | 188,973 | — | ||||||||
Current tax assets | 7,535,440 | 2,183,841 | ||||||||
Trade and other receivables, net | 20 | 25,290,442 | 28,373,066 | |||||||
Term deposits | 22 | 47,203,717 | 29,513,593 | |||||||
Other current assets | 23 | 23,659,215 | 34,739,530 | |||||||
Cash and cash equivalents | 21 | 36,501,478 | 38,011,775 | |||||||
|
|
|
| |||||||
Total current assets | 141,901,958 | 133,337,468 | ||||||||
|
|
|
| |||||||
Total assets | 194,620,142 | 269,837,016 | ||||||||
|
|
|
| |||||||
Equity | ||||||||||
Share capital | 25 | 18,797 | 20,836 | |||||||
Share premium | 25 | 153,742,563 | 238,423,499 | |||||||
Reserves | (494,988 | ) | (1,481,871 | ) | ||||||
Accumulated deficit | (60,964,228 | ) | (81,806,068 | ) | ||||||
Share based payment reserve | 19,901,803 | 20,092,179 | ||||||||
Foreign currency translation reserve | 25 | (10,904,046 | ) | (13,663,555 | ) | |||||
|
|
|
| |||||||
Total equity attributable to equity holders of the Company | 101,299,901 | 161,585,020 | ||||||||
Non-controlling interest | 694,050 | 714,505 | ||||||||
|
|
|
| |||||||
Total equity | 101,993,951 | 162,299,525 | ||||||||
|
|
|
| |||||||
Liabilities | ||||||||||
Loans and borrowings | 28 | 284,433 | 203,108 | |||||||
Employee benefits | 32 | 1,010,293 | 963,176 | |||||||
Deferred revenue | 31 | — | 2,353,593 | |||||||
Deferred tax liabilities | 19 | 383,444 | 277,096 | |||||||
Other non-current liabilities | 30 | 6,804,211 | 7,667,666 | |||||||
|
|
|
| |||||||
Total non-current liabilities | 8,482,381 | 11,464,639 | ||||||||
Bank overdraft | 21 | 866,521 | — | |||||||
Loans and borrowings | 28 | 135,459 | 115,005 | |||||||
Trade and other payables | 34 | 80,592,241 | 86,213,527 | |||||||
Deferred revenue | 31 | 37,901 | 1,336,238 | |||||||
Other current liabilities | 29 | 2,511,688 | 8,408,082 | |||||||
|
|
|
| |||||||
Total current liabilities | 84,143,810 | 96,072,852 | ||||||||
|
|
|
| |||||||
Total liabilities | 92,626,191 | 107,537,491 | ||||||||
|
|
|
| |||||||
Total equity and liabilities | 194,620,142 | 269,837,016 | ||||||||
|
|
|
| |||||||
CONSOLIDATED STATEMENTSSTATEMENT OF FINANCIAL POSITIONPROFIT OR LOSS AND OTHER COMPREHENSIVE INCOME (LOSS)
| As at March 31 | ||||||||||
| Note | 2011 | 2012 | ||||||||
| (in USD) | ||||||||||
Assets | ||||||||||
Property, plant and equipment | 17 | 3,762,598 | 7,064,373 | |||||||
Intangible assets | 18 | 2,796,840 | 8,349,403 | |||||||
Trade and other receivables, net | 20 | 600,067 | 807,159 | |||||||
Investment in equity-accounted investee | 9 | — | 838,212 | |||||||
Other investment | 10 | — | 4,416,543 | |||||||
Derivatives instruments | — | 202,054 | ||||||||
Term deposits | 22 | 706,873 | 648,506 | |||||||
Other non-current assets | 24 | 219,021 | 449,559 | |||||||
Deferred tax assets | 19 | 2,924,308 | 8,892,842 | |||||||
|
|
|
| |||||||
Total non-current assets | 11,009,707 | 31,668,651 | ||||||||
Inventories | — | 2,367,548 | ||||||||
Current tax assets | 3,855,431 | 5,908,213 | ||||||||
Trade and other receivables, net | 20 | 12,257,102 | 20,575,261 | |||||||
Term deposits | 22 | 16,235,047 | 43,676,624 | |||||||
Other current assets | 23 | 17,852,029 | 21,792,776 | |||||||
Cash and cash equivalents | 21 | 51,730,321 | 43,798,230 | |||||||
Assets held for sale | 7 | — | 404,109 | |||||||
|
|
|
| |||||||
Total current assets | 101,929,930 | 138,522,761 | ||||||||
|
|
|
| |||||||
Total assets | 112,939,637 | 170,191,412 | ||||||||
|
|
|
| |||||||
Equity | ||||||||||
Share capital | 25 | 17,546 | 18,576 | |||||||
Share premium | 25 | 111,541,661 | 150,144,112 | |||||||
Fair value reserve | — | (428,937 | ) | |||||||
Accumulated deficit | (38,024,060 | ) | (31,827,379 | ) | ||||||
Share based payment reserve | 32 | 3,914,844 | 9,388,239 | |||||||
Foreign currency translation reserve | 25 | (1,174,111 | ) | (8,578,442 | ) | |||||
|
|
|
| |||||||
Total equity attributable to equity holders of the Company | 76,275,880 | 118,716,169 | ||||||||
Non-controlling interest | — | 75,620 | ||||||||
|
|
|
| |||||||
Total equity | 76,275,880 | 118,791,789 | ||||||||
|
|
|
| |||||||
Liabilities | ||||||||||
Loans and borrowings | 28 | 148,923 | 177,280 | |||||||
Employee benefits | 31 | 667,050 | 681,135 | |||||||
Other non-current liabilities | 30 | 503,320 | 1,487,658 | |||||||
|
|
|
| |||||||
Total non-current liabilities | 1,319,293 | 2,346,073 | ||||||||
Bank overdraft | 21 | 3,855,977 | — | |||||||
Loans and borrowings | 28 | 60,634 | 82,083 | |||||||
Derivatives instruments | — | 149,135 | ||||||||
Trade and other payables | 33 | 29,694,702 | 46,697,644 | |||||||
Deferred income | 26,533 | 23,122 | ||||||||
Other current liabilities | 29 | 1,706,618 | 2,101,566 | |||||||
|
|
|
| |||||||
Total current liabilities | 35,344,464 | 49,053,550 | ||||||||
|
|
|
| |||||||
Total liabilities | 36,663,757 | 51,399,623 | ||||||||
|
|
|
| |||||||
Total equity and liabilities | 112,939,637 | 170,191,412 | ||||||||
|
|
|
| |||||||
| For the Year Ended March 31, | ||||||||||||||
| Note | 2012 | 2013 | 2014 | |||||||||||
| (in USD) | ||||||||||||||
Revenue | ||||||||||||||
Air ticketing | 76,190,303 | 60,888,851 | 66,523,174 | |||||||||||
Hotels and packages | 116,701,137 | 164,129,318 | 184,500,736 | |||||||||||
Other revenue | 10 | 3,707,818 | 3,803,776 | 4,350,701 | ||||||||||
|
|
|
|
|
| |||||||||
Total revenue | 196,599,258 | 228,821,945 | 255,374,611 | |||||||||||
Other income | 11 | — | — | 1,312,299 | ||||||||||
Service cost | ||||||||||||||
Procurement cost of hotel and packages services | 98,474,788 | 136,537,143 | 144,507,848 | |||||||||||
Cost of air tickets coupon | 9,939,556 | 4,119,631 | 4,471,703 | |||||||||||
Personnel expenses | 12 | 26,520,745 | 34,520,455 | 37,220,798 | ||||||||||
Other operating expenses | 13 | 54,868,655 | 67,953,977 | 80,116,006 | ||||||||||
Depreciation and amortization | 14 | 2,790,154 | 3,752,743 | 5,692,145 | ||||||||||
|
|
|
|
|
| |||||||||
Result from operating activities | 4,005,360 | (18,062,004 | ) | (15,321,590 | ) | |||||||||
Finance income | 15 | 1,987,904 | 4,197,603 | 2,441,764 | ||||||||||
Finance costs | 15 | 4,957,097 | 4,939,526 | 7,775,731 | ||||||||||
|
|
|
|
|
| |||||||||
Net finance costs | (2,969,193 | ) | (741,923 | ) | (5,333,967 | ) | ||||||||
|
|
|
|
|
| |||||||||
Share of loss of equity-accounted investee | (65,957 | ) | (186,130 | ) | (171,487 | ) | ||||||||
|
|
|
|
|
| |||||||||
Profit (loss) before tax | 970,210 | (18,990,057 | ) | (20,827,044 | ) | |||||||||
Income tax benefit (expense) | 16 | 6,078,146 | (8,599,023 | ) | (78,520 | ) | ||||||||
|
|
|
|
|
| |||||||||
Profit (loss) for the year | 7,048,356 | (27,589,080 | ) | (20,905,564 | ) | |||||||||
Other comprehensive income (loss) | ||||||||||||||
Items that are or may be reclassified subsequently to profit or loss: | ||||||||||||||
Foreign currency translation differences on foreign operations | (7,421,044 | ) | (2,309,906 | ) | (2,767,820 | ) | ||||||||
Net change in fair value of available-for-sale financial assets | (428,937 | ) | 459,047 | (985,631 | ) | |||||||||
|
|
|
|
|
| |||||||||
| (7,849,981 | ) | (1,850,859 | ) | (3,753,451 | ) | |||||||||
|
|
|
|
|
| |||||||||
Items that will never be reclassified subsequently to profit or loss: | ||||||||||||||
Remeasurement of defined benefit (asset) liability | 23,223 | (125,748 | ) | 63,999 | ||||||||||
Income tax expense on other comprehensive income | (7,535 | ) | (13,800 | ) | — | |||||||||
|
|
|
|
|
| |||||||||
Other comprehensive loss for the year, net of tax | (7,834,293 | ) | (1,990,407 | ) | (3,689,452 | ) | ||||||||
|
|
|
|
|
| |||||||||
Total comprehensive loss for the year | (785,937 | ) | (29,579,487 | ) | (24,595,016 | ) | ||||||||
|
|
|
|
|
| |||||||||
Profit (Loss) attributable to: | ||||||||||||||
Owners of the Company | 7,183,935 | (27,592,521 | ) | (20,934,330 | ) | |||||||||
Non-controlling interest | (135,579 | ) | 3,441 | 28,766 | ||||||||||
|
|
|
|
|
| |||||||||
Profit (Loss) for the year | 7,048,356 | (27,589,080 | ) | (20,905,564 | ) | |||||||||
|
|
|
|
|
| |||||||||
Total comprehensive income (loss) attributable to: | ||||||||||||||
Owners of the Company | (633,645 | ) | (29,583,133 | ) | (24,615,471 | ) | ||||||||
Non-controlling interest | (152,292 | ) | 3,646 | 20,455 | ||||||||||
|
|
|
|
|
| |||||||||
Total comprehensive loss for the year | (785,937 | ) | (29,579,487 | ) | (24,595,016 | ) | ||||||||
|
|
|
|
|
| |||||||||
Earnings (Loss) per share | ||||||||||||||
Basic | 27 | 0.20 | (0.74 | ) | (0.55 | ) | ||||||||
Diluted | 27 | 0.19 | (0.74 | ) | (0.55 | ) | ||||||||
MAKEMYTRIP LIMITED
CONSOLIDATED STATEMENTS OF COMPREHENSIVE INCOME (LOSS)MAKEMYTRIP LIMITED
| For the Year Ended March 31 | ||||||||||||||
| Note | 2010 | 2011 | 2012 | |||||||||||
| (in USD) | ||||||||||||||
Revenue | ||||||||||||||
Air ticketing | 32,119,488 | 47,622,719 | 76,190,303 | |||||||||||
Hotels and packages | 50,287,896 | 74,557,976 | 116,701,137 | |||||||||||
Other revenue | 11 | 1,152,822 | 2,540,692 | 3,707,818 | ||||||||||
|
|
|
|
|
| |||||||||
Total revenue | 83,560,206 | 124,721,387 | 196,599,258 | |||||||||||
Service cost | ||||||||||||||
Procurement cost of hotel and packages services | 42,292,226 | 63,650,910 | 98,474,788 | |||||||||||
Cost of air tickets coupon | 985,482 | — | 9,939,556 | |||||||||||
Personnel expenses | 12 | 16,562,034 | 14,399,040 | 26,520,745 | ||||||||||
Other operating expenses | 13 | 28,160,506 | 40,698,895 | 54,868,655 | ||||||||||
Depreciation and amortization | 14 | 1,569,747 | 1,910,637 | 2,790,154 | ||||||||||
|
|
|
|
|
| |||||||||
Result from operating activities | (6,009,789 | ) | 4,061,905 | 4,005,360 | ||||||||||
Finance income | 15 | 1,874,177 | 1,601,750 | 1,987,904 | ||||||||||
Finance costs | 15 | 2,062,947 | 3,525,685 | 4,957,097 | ||||||||||
|
|
|
|
|
| |||||||||
Net finance costs | (188,770 | ) | (1,923,935 | ) | (2,969,193 | ) | ||||||||
|
|
|
|
|
| |||||||||
Share of loss of equity-accounted investee | 9 | — | — | (65,957 | ) | |||||||||
|
|
|
|
|
| |||||||||
Profit (Loss) before tax | (6,198,559 | ) | 2,137,970 | 970,210 | ||||||||||
Income tax benefit (expense) | 16 | (8,428 | ) | 2,691,721 | 6,078,146 | |||||||||
|
|
|
|
|
| |||||||||
Profit (Loss) for the year | (6,206,987 | ) | 4,829,691 | 7,048,356 | ||||||||||
Other comprehensive income (loss) | ||||||||||||||
Foreign currency translation differences on foreign operations | 15 | 1,651,468 | (301,952 | ) | (7,421,044 | ) | ||||||||
Net change in fair value of available-for-sale financial assets | 15 | — | — | (428,937 | ) | |||||||||
Defined benefit plan actuarial gains (losses) | (14,431 | ) | (73,356 | ) | 23,223 | |||||||||
Income tax benefit (expense) on other comprehensive income (loss) | 16 | 5,590 | 24,514 | (7,535 | ) | |||||||||
|
|
|
|
|
| |||||||||
Other comprehensive income (loss) for the year, net of tax | 1,642,627 | (350,794 | ) | (7,834,293 | ) | |||||||||
|
|
|
|
|
| |||||||||
Total comprehensive income (loss) for the year | (4,564,360 | ) | 4,478,897 | (785,937 | ) | |||||||||
|
|
|
|
|
| |||||||||
Profit (Loss) attributable to: | ||||||||||||||
Owners of the Company | (6,206,239 | ) | 4,827,471 | 7,183,935 | ||||||||||
Non-controlling interest | (748 | ) | 2,220 | (135,579 | ) | |||||||||
|
|
|
|
|
| |||||||||
Profit (Loss) for the year | (6,206,987 | ) | 4,829,691 | 7,048,356 | ||||||||||
|
|
|
|
|
| |||||||||
Total comprehensive income (loss) attributable to: | ||||||||||||||
Owners of the Company | (4,563,894 | ) | 4,476,742 | (633,645 | ) | |||||||||
Non-controlling interest | (466 | ) | 2,155 | (152,292 | ) | |||||||||
|
|
|
|
|
| |||||||||
Total comprehensive income (loss) for the year | (4,564,360 | ) | 4,478,897 | (785,937 | ) | |||||||||
|
|
|
|
|
| |||||||||
Earnings (Loss) per share | ||||||||||||||
Basic | 27 | (0.35 | ) | 0.17 | 0.20 | |||||||||
Diluted | 27 | (0.35 | ) | 0.15 | 0.19 | |||||||||
|
|
|
|
|
| |||||||||
MAKEMYTRIP LIMITED
CONSOLIDATED STATEMENTSSTATEMENT OF CHANGES IN EQUITY (DEFICIT)
| Attributable to Equity Holders of the Company | Non- Controlling Interest | Total Deficit | Attributable to Equity Holders of the Company | |||||||||||||||||||||||||||||||||||||||||||||||||||||||||||||||||
| Share Capital | Share Premium | Accumulated Deficit | Share Based Payment Reserve | Foreign Currency Translation Reserve | Total | Share Capital | Share Premium | Fair Value Reserves | Accumulated Deficit | Share Based Payment Reserve | Foreign Currency Translation Reserve | Total | Non- Controlling Interest | Total Equity | ||||||||||||||||||||||||||||||||||||||||||||||||||||||
| (In USD) | (In USD) | |||||||||||||||||||||||||||||||||||||||||||||||||||||||||||||||||||
Balance as at April 1, 2009 | 8,714 | 10,816,307 | (36,295,338 | ) | 756,199 | (2,523,402 | ) | (27,237,520 | ) | 4,061 | (27,233,459 | ) | ||||||||||||||||||||||||||||||||||||||||||||||||||||||||
Balance as at April 1, 2011 | 17,546 | 111,541,661 | — | (38,024,060 | ) | 3,914,844 | (1,174,111 | ) | 76,275,880 | — | 76,275,880 | |||||||||||||||||||||||||||||||||||||||||||||||||||||||||
Total comprehensive income (loss) for the year | ||||||||||||||||||||||||||||||||||||||||||||||||||||||||||||||||||||
Loss for the year | — | — | (6,206,239 | ) | — | — | (6,206,239 | ) | (748 | ) | (6,206,987 | ) | ||||||||||||||||||||||||||||||||||||||||||||||||||||||||
Profit (loss) for the year | — | — | — | 7,183,935 | — | — | 7,183,935 | (135,579 | ) | 7,048,356 | ||||||||||||||||||||||||||||||||||||||||||||||||||||||||||
Other comprehensive income (loss) | ||||||||||||||||||||||||||||||||||||||||||||||||||||||||||||||||||||
Foreign currency translation differences | — | — | — | — | 1,651,184 | 1,651,184 | 284 | 1,651,468 | — | — | — | — | — | (7,404,331 | ) | (7,404,331 | ) | (16,713 | ) | (7,421,044 | ) | |||||||||||||||||||||||||||||||||||||||||||||||
Defined benefit plan actuarial gains (losses), net of tax | — | — | (8,839 | ) | — | — | (8,839 | ) | (2 | ) | (8,841 | ) | ||||||||||||||||||||||||||||||||||||||||||||||||||||||||
Net change in fair value of available-for-sale financial assets | — | — | (428,937 | ) | — | — | — | (428,937 | ) | — | (428,937 | ) | ||||||||||||||||||||||||||||||||||||||||||||||||||||||||
Remeasurement of defined benefit (asset) liability | — | — | — | 15,688 | — | — | 15,688 | — | 15,688 | |||||||||||||||||||||||||||||||||||||||||||||||||||||||||||
|
|
|
|
|
|
|
|
|
|
|
|
|
|
|
|
| ||||||||||||||||||||||||||||||||||||||||||||||||||||
Total other comprehensive income (loss) | — | — | (8,839 | ) | — | 1,651,184 | 1,642,345 | 282 | 1,642,627 | — | — | (428,937 | ) | 15,688 | — | (7,404,331 | ) | (7,817,580 | ) | (16,713 | ) | (7,834,293 | ) | |||||||||||||||||||||||||||||||||||||||||||||
|
|
|
|
|
|
|
|
|
|
|
|
|
|
|
|
| ||||||||||||||||||||||||||||||||||||||||||||||||||||
Total comprehensive income (loss) for the year | — | — | (6,215,078 | ) | — | 1,651,184 | (4,563,894 | ) | (466 | ) | (4,564,360 | ) | — | — | (428,937 | ) | 7,199,623 | — | (7,404,331 | ) | (633,645 | ) | (152,292 | ) | (785,937 | ) | ||||||||||||||||||||||||||||||||||||||||||
|
|
|
|
|
|
|
|
|
|
|
|
|
|
|
|
| ||||||||||||||||||||||||||||||||||||||||||||||||||||
Transactions with owners, recorded directly in equity | ||||||||||||||||||||||||||||||||||||||||||||||||||||||||||||||||||||
Contributions by owners | ||||||||||||||||||||||||||||||||||||||||||||||||||||||||||||||||||||
Share-based payment | — | — | — | 6,771,376 | — | 6,771,376 | — | 6,771,376 | — | — | — | — | 6,951,549 | — | 6,951,549 | — | 6,951,549 | |||||||||||||||||||||||||||||||||||||||||||||||||||
Issue of ordinary shares on exercise of share options | 53 | 540,215 | — | (465,665 | ) | — | 74,603 | — | 74,603 | |||||||||||||||||||||||||||||||||||||||||||||||||||||||||||
Issue of ordinary shares on exercise of share based awards | 257 | 2,326,010 | — | — | (1,461,737 | ) | — | 864,530 | — | 864,530 | ||||||||||||||||||||||||||||||||||||||||||||||||||||||||||
Transfer to accumulated deficit on expiry of share awards | — | — | — | 16,417 | (16,417 | ) | — | — | — | — | ||||||||||||||||||||||||||||||||||||||||||||||||||||||||||
Issue of ordinary shares through follow-on public offering, net of issuance costs | 773 | 36,276,441 | — | — | — | — | 36,277,214 | — | 36,277,214 | |||||||||||||||||||||||||||||||||||||||||||||||||||||||||||
|
|
|
|
|
|
|
|
|
|
|
|
|
|
|
|
| ||||||||||||||||||||||||||||||||||||||||||||||||||||
Total contributions by owners | 53 | 540,215 | — | 6,305,711 | — | 6,845,979 | — | 6,845,979 | 1,030 | 38,602,451 | — | 16,417 | 5,473,395 | — | 44,093,293 | — | 44,093,293 | |||||||||||||||||||||||||||||||||||||||||||||||||||
|
|
|
|
|
|
|
|
|
|
|
|
|
|
|
|
| ||||||||||||||||||||||||||||||||||||||||||||||||||||
Transactions with non-owners, recorded directly in equity | ||||||||||||||||||||||||||||||||||||||||||||||||||||||||||||||||||||
Contributions by non-owners | ||||||||||||||||||||||||||||||||||||||||||||||||||||||||||||||||||||
Issue of ordinary shares by a subsidiary on exercise of share options | — | — | — | — | — | — | 795 | 795 | ||||||||||||||||||||||||||||||||||||||||||||||||||||||||||||
Changes in ownership interests in subsidiaries | ||||||||||||||||||||||||||||||||||||||||||||||||||||||||||||||||||||
Financial liability for acquisition of non-controlling interest | — | — | — | (870,934 | ) | — | — | (870,934 | ) | — | (870,934 | ) | ||||||||||||||||||||||||||||||||||||||||||||||||||||||||
Acquisition of subsidiary with non-controlling interests | — | — | — | — | — | — | — | 79,487 | 79,487 | |||||||||||||||||||||||||||||||||||||||||||||||||||||||||||
Subscription of new shares of subsidiary | — | — | — | (148,425 | ) | — | — | (148,425 | ) | 148,425 | — | |||||||||||||||||||||||||||||||||||||||||||||||||||||||||
|
|
|
|
|
|
|
|
|
|
|
|
|
|
|
|
| ||||||||||||||||||||||||||||||||||||||||||||||||||||
Total contributions by non-owners | — | — | — | — | — | — | 795 | 795 | ||||||||||||||||||||||||||||||||||||||||||||||||||||||||||||
Total changes in ownership interest in subsidiaries | — | — | — | (1,019,359 | ) | — | — | (1,019,359 | ) | 227,912 | (791,447 | ) | ||||||||||||||||||||||||||||||||||||||||||||||||||||||||
|
|
|
|
|
|
|
|
|
|
|
|
|
|
|
|
| ||||||||||||||||||||||||||||||||||||||||||||||||||||
Balance as at March 31, 2010 | 8,767 | 11,356,522 | (42,510,416 | ) | 7,061,910 | (872,218 | ) | (24,955,435 | ) | 4,390 | (24,951,045 | ) | ||||||||||||||||||||||||||||||||||||||||||||||||||||||||
Total transactions with owners | 1,030 | 38,602,451 | — | (1,002,942 | ) | 5,473,395 | — | 43,073,934 | 227,912 | 43,301,846 | ||||||||||||||||||||||||||||||||||||||||||||||||||||||||||
|
|
|
|
|
|
|
|
|
|
|
|
|
|
|
|
| ||||||||||||||||||||||||||||||||||||||||||||||||||||
Balance as at March 31, 2012 | 18,576 | 150,144,112 | (428,937 | ) | (31,827,379 | ) | 9,388,239 | (8,578,442 | ) | 118,716,169 | 75,620 | 118,791,789 | ||||||||||||||||||||||||||||||||||||||||||||||||||||||||
|
|
|
|
|
|
|
|
| ||||||||||||||||||||||||||||||||||||||||||||||||||||||||||||
MAKEMYTRIP LIMITED
CONSOLIDATED STATEMENTS OF CHANGES IN EQUITY (DEFICIT) — (Continued)
| Attributable to Equity Holders of the Company | ||||||||||||||||||||||||||||||||
| Share Capital | Share Premium | Accumulated Deficit | Share Based Payment Reserve | Foreign Currency Translation Reserve | Total | Non- controlling Interest | Total Equity (Deficit) | |||||||||||||||||||||||||
| (In USD) | ||||||||||||||||||||||||||||||||
Balance as at April 1, 2010 | 8,767 | 11,356,522 | (42,510,416 | ) | 7,061,910 | (872,218 | ) | (24,955,435 | ) | 4,390 | (24,951,045 | ) | ||||||||||||||||||||
Total comprehensive income (loss) for the year | ||||||||||||||||||||||||||||||||
Profit for the year | — | — | 4,827,471 | — | — | 4,827,471 | 2,220 | 4,829,691 | ||||||||||||||||||||||||
Other comprehensive income (loss) | ||||||||||||||||||||||||||||||||
Foreign currency translation differences | — | — | — | — | (301,893 | ) | (301,893 | ) | (59 | ) | (301,952 | ) | ||||||||||||||||||||
Defined benefit plan actuarial gains (losses), net of tax | — | — | (48,836 | ) | — | — | (48,836 | ) | (6 | ) | (48,842 | ) | ||||||||||||||||||||
|
|
|
|
|
|
|
|
|
|
|
|
|
|
|
| |||||||||||||||||
Total other comprehensive income (loss) | — | — | (48,836 | ) | — | (301,893 | ) | (350,729 | ) | (65 | ) | (350,794 | ) | |||||||||||||||||||
|
|
|
|
|
|
|
|
|
|
|
|
|
|
|
| |||||||||||||||||
Total comprehensive income (loss) for the year | — | — | 4,778,635 | — | (301,893 | ) | 4,476,742 | 2,155 | 4,478,897 | |||||||||||||||||||||||
|
|
|
|
|
|
|
|
|
|
|
|
|
|
|
| |||||||||||||||||
Transactions with owners, recorded directly in equity | ||||||||||||||||||||||||||||||||
Contributions by owners | ||||||||||||||||||||||||||||||||
Share-based payment | — | — | — | 527,285 | — | 527,285 | — | 527,285 | ||||||||||||||||||||||||
Issue of ordinary shares on exercise of share options | 540 | 4,965,951 | — | (3,648,035 | ) | — | 1,318,456 | — | 1,318,456 | |||||||||||||||||||||||
Transfer to accumulated deficit on expiry of share options | — | — | 26,316 | (26,316 | ) | — | — | — | — | |||||||||||||||||||||||
Convertible and redeemable preference shares converted to ordinary shares at initial public offering | 6,162 | 41,179,783 | — | — | — | 41,185,945 | — | 41,185,945 | ||||||||||||||||||||||||
Issue of ordinary shares through initial public offering, net of issuance costs | 2,077 | 54,039,405 | — | — | — | 54,041,482 | — | 54,041,482 | ||||||||||||||||||||||||
|
|
|
|
|
|
|
|
|
|
|
|
|
|
|
| |||||||||||||||||
Total contributions by owners | 8,779 | 100,185,139 | 26,316 | (3,147,066 | ) | — | 97,073,168 | — | 97,073,168 | |||||||||||||||||||||||
|
|
|
|
|
|
|
|
|
|
|
|
|
|
|
| |||||||||||||||||
Changes in ownership interests in subsidiaries | ||||||||||||||||||||||||||||||||
Acquisition of non-controlling interest | — | — | (318,595 | ) | — | — | (318,595 | ) | (6,545 | ) | (325,140 | ) | ||||||||||||||||||||
|
|
|
|
|
|
|
|
|
|
|
|
|
|
|
| |||||||||||||||||
Total changes in ownership interest in subsidiaries | — | — | (318,595 | ) | — | — | (318,595 | ) | (6,545 | ) | (325,140 | ) | ||||||||||||||||||||
|
|
|
|
|
|
|
|
|
|
|
|
|
|
|
| |||||||||||||||||
Total transactions with owners | 8,779 | 100,185,139 | (292,279 | ) | (3,147,066 | ) | — | 96,754,573 | (6,545 | ) | 96,748,028 | |||||||||||||||||||||
|
|
|
|
|
|
|
|
|
|
|
|
|
|
|
| |||||||||||||||||
Balance as at March 31, 2011 | 17,546 | 111,541,661 | (38,024,060 | ) | 3,914,844 | (1,174,111 | ) | 76,275,880 | — | 76,275,880 | ||||||||||||||||||||||
|
|
|
|
|
|
|
|
|
|
|
|
|
|
|
| |||||||||||||||||
MAKEMYTRIP LIMITED
CONSOLIDATED STATEMENTSSTATEMENT OF CHANGES IN EQUITY — (Continued)
| Attributable to Equity Holders of the Company | Attributable to Equity Holders of the Company | |||||||||||||||||||||||||||||||||||||||||||||||||||||||||||||||||||||||||||
| Share Capital | Share Premium | Fair Value Reserve | Accumulated Deficit | Share Based Payment Reserve | Foreign Currency Translation Reserve | Total | Non- Controlling Interest | Total Equity | Share Capital | Share Premium | Reserve for Own Shares | Fair Value Reserves | Accumulated Deficit | Share Based Payment Reserve | Foreign Currency Translation Reserve | Total | Non- Controlling Interest | Total Equity | ||||||||||||||||||||||||||||||||||||||||||||||||||||||||||
| (In USD) | (In USD) | |||||||||||||||||||||||||||||||||||||||||||||||||||||||||||||||||||||||||||
Balance as at April 1, 2011 | 17,546 | 111,541,661 | — | (38,024,060 | ) | 3,914,844 | (1,174,111 | ) | 76,275,880 | — | 76,275,880 | |||||||||||||||||||||||||||||||||||||||||||||||||||||||||||||||||
Balance as at April 1, 2012 | 18,576 | 150,144,112 | — | (428,937 | ) | (31,827,379 | ) | 9,388,239 | (8,578,442 | ) | 118,716,169 | 75,620 | 118,791,789 | |||||||||||||||||||||||||||||||||||||||||||||||||||||||||||||||
Total comprehensive income (loss) for the year | ||||||||||||||||||||||||||||||||||||||||||||||||||||||||||||||||||||||||||||
Profit (loss) for the year | — | — | — | 7,183,935 | — | — | 7,183,935 | (135,579 | ) | 7,048,356 | — | — | — | — | (27,592,521 | ) | — | — | (27,592,521 | ) | 3,441 | (27,589,080 | ) | |||||||||||||||||||||||||||||||||||||||||||||||||||||
Other comprehensive income (loss) | ||||||||||||||||||||||||||||||||||||||||||||||||||||||||||||||||||||||||||||
Foreign currency translation differences | — | — | — | — | — | (7,404,331 | ) | (7,404,331 | ) | (16,713 | ) | (7,421,044 | ) | — | — | — | — | — | — | (2,310,111 | ) | (2,310,111 | ) | 205 | (2,309,906 | ) | ||||||||||||||||||||||||||||||||||||||||||||||||||
Net change in fair value of available-for-sale financial assets | — | — | (428,937 | ) | — | — | — | (428,937 | ) | — | (428,937 | ) | — | — | — | 459,047 | — | — | — | 459,047 | — | 459,047 | ||||||||||||||||||||||||||||||||||||||||||||||||||||||
Defined benefit plan actuarial gains, net of tax | — | — | — | 15,688 | — | — | 15,688 | — | 15,688 | |||||||||||||||||||||||||||||||||||||||||||||||||||||||||||||||||||
Remeasurement of defined benefit (asset) liability | — | — | — | — | (139,548 | ) | — | — | (139,548 | ) | — | (139,548 | ) | |||||||||||||||||||||||||||||||||||||||||||||||||||||||||||||||
|
|
|
|
|
|
|
|
|
|
|
|
|
|
|
|
|
|
| ||||||||||||||||||||||||||||||||||||||||||||||||||||||||||
Total other comprehensive income (loss) | — | — | (428,937 | ) | 15,688 | — | (7,404,331 | ) | (7,817,580 | ) | (16,713 | ) | (7,834,293 | ) | — | — | — | 459,047 | (139,548 | ) | — | (2,310,111 | ) | (1,990,612 | ) | 205 | (1,990,407 | ) | ||||||||||||||||||||||||||||||||||||||||||||||||
|
|
|
|
|
|
|
|
|
|
|
|
|
|
|
|
|
|
| ||||||||||||||||||||||||||||||||||||||||||||||||||||||||||
Total comprehensive income (loss) for the year | — | — | (428,937 | ) | 7,199,623 | — | (7,404,331 | ) | (633,645 | ) | (152,292 | ) | (785,937 | ) | — | — | — | 459,047 | (27,732,069 | ) | — | (2,310,111 | ) | (29,583,133 | ) | 3,646 | (29,579,487 | ) | ||||||||||||||||||||||||||||||||||||||||||||||||
|
|
|
|
|
|
|
|
|
|
|
|
|
|
|
|
|
|
| ||||||||||||||||||||||||||||||||||||||||||||||||||||||||||
Transactions with owners, recorded directly in equity | ||||||||||||||||||||||||||||||||||||||||||||||||||||||||||||||||||||||||||||
Contributions by owners | ||||||||||||||||||||||||||||||||||||||||||||||||||||||||||||||||||||||||||||
Share-based payment | — | — | — | — | 6,951,549 | — | 6,951,549 | — | 6,951,549 | — | — | — | — | — | 11,722,188 | — | 11,722,188 | — | 11,722,188 | |||||||||||||||||||||||||||||||||||||||||||||||||||||||||
Issue of ordinary shares on exercise of share options | 257 | 2,326,010 | — | — | (1,461,737 | ) | — | 864,530 | — | 864,530 | ||||||||||||||||||||||||||||||||||||||||||||||||||||||||||||||||||
Transfer to accumulated defecit on expiry of share options | — | — | — | 16,417 | (16,417 | ) | — | — | — | — | ||||||||||||||||||||||||||||||||||||||||||||||||||||||||||||||||||
Issue of ordinary shares through follow-on public offering, net of issuance costs | 773 | 36,276,441 | — | — | — | — | 36,277,214 | — | 36,277,214 | |||||||||||||||||||||||||||||||||||||||||||||||||||||||||||||||||||
Issue of ordinary shares on exercise of share based awards | 116 | 1,250,609 | — | — | — | (832,779 | ) | — | 417,946 | — | 417,946 | |||||||||||||||||||||||||||||||||||||||||||||||||||||||||||||||||
Transfer to accumulated deficit on expiry of share based awards | — | — | — | — | 375,845 | (375,845 | ) | — | — | — | — | |||||||||||||||||||||||||||||||||||||||||||||||||||||||||||||||||
Own shares acquired | — | — | (525,098 | ) | — | — | — | — | (525,098 | ) | — | (525,098 | ) | |||||||||||||||||||||||||||||||||||||||||||||||||||||||||||||||
Issue of ordinary shares related to business combination | 105 | 2,347,842 | — | — | — | — | — | 2,347,947 | — | 2,347,947 | ||||||||||||||||||||||||||||||||||||||||||||||||||||||||||||||||||
|
|
|
|
|
|
|
|
|
|
|
|
|
|
|
|
|
|
| ||||||||||||||||||||||||||||||||||||||||||||||||||||||||||
Total contributions by owners | 1,030 | 38,602,451 | — | 16,417 | 5,473,395 | — | 44,093,293 | — | 44,093,293 | 221 | 3,598,451 | (525,098 | ) | — | 375,845 | 10,513,564 | — | 13,962,983 | — | 13,962,983 | ||||||||||||||||||||||||||||||||||||||||||||||||||||||||
|
|
|
|
|
|
|
|
|
|
|
|
|
|
|
|
|
|
| ||||||||||||||||||||||||||||||||||||||||||||||||||||||||||
Changes in ownership interests in subsidiaries | ||||||||||||||||||||||||||||||||||||||||||||||||||||||||||||||||||||||||||||
Financial liability for acquisition of non-controlling interest | — | — | — | (870,934 | ) | — | — | (870,934 | ) | — | (870,934 | ) | — | — | — | — | (1,801,496 | ) | — | — | (1,801,496 | ) | — | (1,801,496 | ) | |||||||||||||||||||||||||||||||||||||||||||||||||||
Acquisition of subsidiary with non-controlling interests | — | — | — | — | — | — | — | 79,487 | 79,487 | — | — | — | — | — | — | — | — | 620,162 | 620,162 | |||||||||||||||||||||||||||||||||||||||||||||||||||||||||
Subscription of new shares of subsidiary | — | — | — | (148,425 | ) | — | — | (148,425 | ) | 148,425 | — | |||||||||||||||||||||||||||||||||||||||||||||||||||||||||||||||||
Acquisition of non-controlling interests | — | — | — | — | 20,871 | — | (15,493 | ) | 5,378 | (5,378 | ) | — | ||||||||||||||||||||||||||||||||||||||||||||||||||||||||||||||||
|
|
|
|
|
|
|
|
|
|
|
|
|
|
|
|
|
|
| ||||||||||||||||||||||||||||||||||||||||||||||||||||||||||
Total changes in ownership interest in subsidiaries | — | — | — | (1,019,359 | ) | — | — | (1,019,359 | ) | 227,912 | (791,447 | ) | — | — | — | — | (1,780,625 | ) | — | (15,493 | ) | (1,796,118 | ) | 614,784 | (1,181,334 | ) | ||||||||||||||||||||||||||||||||||||||||||||||||||
|
|
|
|
|
|
|
|
|
|
|
|
|
|
|
|
|
|
| ||||||||||||||||||||||||||||||||||||||||||||||||||||||||||
Total transactions with owners | 1,030 | 38,602,451 | — | (1,002,942 | ) | 5,473,395 | — | 43,073,934 | 227,912 | 43,301,846 | 221 | 3,598,451 | (525,098 | ) | — | (1,404,780 | ) | 10,513,564 | (15,493 | ) | 12,166,865 | 614,784 | 12,781,649 | |||||||||||||||||||||||||||||||||||||||||||||||||||||
|
|
|
|
|
|
|
|
|
|
|
|
|
|
|
|
|
|
| ||||||||||||||||||||||||||||||||||||||||||||||||||||||||||
Balance as at March 31, 2012 | 18,576 | 150,144,112 | (428,937 | ) | (31,827,379 | ) | 9,388,239 | (8,578,442 | ) | 118,716,169 | 75,620 | 118,791,789 | ||||||||||||||||||||||||||||||||||||||||||||||||||||||||||||||||
Balance as at March 31, 2013 | 18,797 | 153,742,563 | (525,098 | ) | 30,110 | (60,964,228 | ) | 19,901,803 | (10,904,046 | ) | 101,299,901 | 694,050 | 101,993,951 | |||||||||||||||||||||||||||||||||||||||||||||||||||||||||||||||
|
|
|
|
|
|
|
|
|
|
|
|
|
|
|
|
|
|
| ||||||||||||||||||||||||||||||||||||||||||||||||||||||||||
MAKEMYTRIP LIMITED
CONSOLIDATED STATEMENT OF CHANGES IN EQUITY — (Continued)
| Attributable to equity holders of the Company | ||||||||||||||||||||||||||||||||||||||||
| Share Capital | Share Premium | Reserve for Own Shares | Fair Value Reserves | Accumulated Deficit | Share Based Payment Reserve | Foreign Currency Translation Reserve | Total | Non- Controlling Interest | Total Equity | |||||||||||||||||||||||||||||||
| (In USD) | ||||||||||||||||||||||||||||||||||||||||
Balance as at April 1, 2013 | 18,797 | 153,742,563 | (525,098 | ) | 30,110 | (60,964,228 | ) | 19,901,803 | (10,904,046 | ) | 101,299,901 | 694,050 | 101,993,951 | |||||||||||||||||||||||||||
Total comprehensive income (loss) for the year | ||||||||||||||||||||||||||||||||||||||||
Profit (Loss) for the year | — | — | — | — | (20,934,330 | ) | — | — | (20,934,330 | ) | 28,766 | (20,905,564 | ) | |||||||||||||||||||||||||||
Other comprehensive income (loss) | ||||||||||||||||||||||||||||||||||||||||
Foreign currency translation differences | — | — | — | — | — | — | (2,759,509 | ) | (2,759,509 | ) | (8,311 | ) | (2,767,820 | ) | ||||||||||||||||||||||||||
Net change in fair value of available-for-sale financial assets | — | — | — | (985,631 | ) | — | — | — | (985,631 | ) | — | (985,631 | ) | |||||||||||||||||||||||||||
Remeasurement of defined benefit (asset) liability | — | — | — | — | 63,999 | — | — | 63,999 | — | 63,999 | ||||||||||||||||||||||||||||||
|
|
|
|
|
|
|
|
|
|
|
|
|
|
|
|
|
|
|
| |||||||||||||||||||||
Total other comprehensive income (loss) | — | — | — | (985,631 | ) | 63,999 | — | (2,759,509 | ) | (3,681,141 | ) | (8,311 | ) | (3,689,452 | ) | |||||||||||||||||||||||||
|
|
|
|
|
|
|
|
|
|
|
|
|
|
|
|
|
|
|
| |||||||||||||||||||||
Total comprehensive income (loss) for the year | — | — | — | (985,631 | ) | (20,870,331 | ) | — | (2,759,509 | ) | (24,615,471 | ) | 20,455 | (24,595,016 | ) | |||||||||||||||||||||||||
|
|
|
|
|
|
|
|
|
|
|
|
|
|
|
|
|
|
|
| |||||||||||||||||||||
Transactions with owners, recorded directly in equity | ||||||||||||||||||||||||||||||||||||||||
Contributions by owners | ||||||||||||||||||||||||||||||||||||||||
Share-based payment | — | — | — | — | — | 11,151,803 | — | 11,151,803 | — | 11,151,803 | ||||||||||||||||||||||||||||||
Issue of ordinary shares on exercise of share based awards | 376 | 11,249,546 | — | — | — | (10,932,936 | ) | — | 316,986 | — | 316,986 | |||||||||||||||||||||||||||||
Transfer to accumulated deficit on expiry of share based awards | — | — | — | — | 28,491 | (28,491 | ) | — | — | — | — | |||||||||||||||||||||||||||||
Own shares acquired | — | — | (1,252 | ) | — | — | — | — | (1,252 | ) | — | (1,252 | ) | |||||||||||||||||||||||||||
Issue of ordinary shares through follow-on public offering, net of issuance costs | 1,663 | 73,431,390 | — | — | — | — | — | 73,433,053 | — | 73,433,053 | ||||||||||||||||||||||||||||||
|
|
|
|
|
|
|
|
|
|
|
|
|
|
|
|
|
|
|
| |||||||||||||||||||||
Total transactions with owners | 2,039 | 84,680,936 | (1,252 | ) | — | 28,491 | 190,376 | — | 84,900,590 | — | 84,900,590 | |||||||||||||||||||||||||||||
|
|
|
|
|
|
|
|
|
|
|
|
|
|
|
|
|
|
|
| |||||||||||||||||||||
Balance as at March 31, 2014 | 20,836 | 238,423,499 | (526,350 | ) | (955,521 | ) | (81,806,068 | ) | 20,092,179 | (13,663,555 | ) | 161,585,020 | 714,505 | 162,299,525 | ||||||||||||||||||||||||||
|
|
|
|
|
|
|
|
|
|
|
|
|
|
|
|
|
|
|
| |||||||||||||||||||||
CONSOLIDATED STATEMENTSSTATEMENT OF CASH FLOWS
| For the Year Ended March 31 | For the year ended March 31, | |||||||||||||||||||||||
| 2010 | 2011 | 2012 | 2012 | 2013 | 2014 | |||||||||||||||||||
| (in USD) | (in USD) | |||||||||||||||||||||||
Cash flows from operating activities | ||||||||||||||||||||||||
Profit (Loss) for the year | (6,206,987 | ) | 4,829,691 | 7,048,356 | 7,048,356 | (27,589,080 | ) | (20,905,564 | ) | |||||||||||||||
Adjustments for: | ||||||||||||||||||||||||
Depreciation | 908,844 | 1,114,958 | 1,651,252 | 1,651,252 | 1,748,153 | 1,835,647 | ||||||||||||||||||
Amortisation of intangible assets | 660,903 | 795,679 | 1,138,902 | 1,138,902 | 2,004,590 | 3,856,498 | ||||||||||||||||||
Loss on disposal of intangible assets | — | 2,930 | — | |||||||||||||||||||||
Loss on disposal of property, plant and equipment | 25,501 | 80,563 | 71,446 | |||||||||||||||||||||
Loss on disposal of assets held for sale | — | 44,766 | — | |||||||||||||||||||||
Loss (gain) on disposal of property, plant and equipment | 71,446 | 25,560 | (80,520 | ) | ||||||||||||||||||||
Gain on license of software | — | (83,404 | ) | — | ||||||||||||||||||||
Gain on bargain purchase | — | — | (1,168,495 | ) | ||||||||||||||||||||
Net finance costs | 188,770 | 1,923,935 | 2,969,193 | 2,969,193 | 741,923 | 5,333,967 | ||||||||||||||||||
Share of loss of equity-accounted investee | — | — | 65,957 | 65,957 | 186,130 | 171,487 | ||||||||||||||||||
Share based payment | 6,771,376 | 527,285 | 6,894,450 | 6,894,450 | 11,667,188 | 11,096,803 | ||||||||||||||||||
Income tax expense (benefit) | 2,838 | (2,691,721 | ) | (6,078,146 | ) | |||||||||||||||||||
Income tax (benefit) expense | (6,078,146 | ) | 8,599,023 | 78,520 | ||||||||||||||||||||
Change in inventories | 820,830 | — | (2,551,027 | ) | (2,551,027 | ) | 736,545 | 881,458 | ||||||||||||||||
Change in trade and other receivables | (5,441,867 | ) | (2,286,381 | ) | (8,795,720 | ) | (8,795,720 | ) | (2,089,017 | ) | (6,414,239 | ) | ||||||||||||
Change in other current assets | (3,062,608 | ) | (10,253,524 | ) | (6,346,230 | ) | (6,346,230 | ) | (998,922 | ) | (12,830,884 | ) | ||||||||||||
Change in trade and other payables | 10,642,283 | 4,018,445 | 18,300,016 | 18,300,016 | 20,521,878 | 7,571,751 | ||||||||||||||||||
Change in employee benefits | 98,692 | 180,601 | 123,267 | 123,267 | 221,858 | 106,113 | ||||||||||||||||||
Change in deferred income | (622,769 | ) | (2,595,886 | ) | — | |||||||||||||||||||
Change in deferred revenue | — | (1,886 | ) | 3,621,539 | ||||||||||||||||||||
Change in other non-current assets | 49,375 | (94,512 | ) | (278,743 | ) | (278,743 | ) | (98,915 | ) | 4,475 | ||||||||||||||
Change in other current liabilities | 192,135 | 1,142,508 | 257,295 | |||||||||||||||||||||
Change in other non-current liabilities | 116,303 | 57,884 | 6,120 | |||||||||||||||||||||
Income tax (paid) refund | 87,682 | (3,084,612 | ) | (3,597,454 | ) | |||||||||||||||||||
Change in other liabilities | 263,415 | (71,011 | ) | 4,887,028 | ||||||||||||||||||||
Income tax paid | (3,597,454 | ) | (1,969,482 | ) | (2,003,180 | ) | ||||||||||||||||||
|
|
|
|
|
| |||||||||||||||||||
Net cash from (used in) operating activities | 5,231,301 | (6,332,157 | ) | 10,878,934 | 10,878,934 | 13,595,897 | (3,957,596 | ) | ||||||||||||||||
|
|
|
|
|
| |||||||||||||||||||
Cash flows from investing activities | ||||||||||||||||||||||||
Interest received | 892,861 | 2,289,667 | 928,687 | 928,687 | 3,431,647 | 2,539,783 | ||||||||||||||||||
Proceeds from sale of property, plant and equipment | 11,630 | 41,936 | 21,265 | 21,265 | 164,839 | 170,259 | ||||||||||||||||||
Investment in term deposits (net) | 3,653,559 | (2,519,501 | ) | (29,852,568 | ) | (29,852,568 | ) | (4,274,880 | ) | (59,372,562 | ) | |||||||||||||
Acquisition of property, plant and equipment | (653,776 | ) | (1,272,495 | ) | (5,538,589 | ) | (5,538,589 | ) | (2,890,055 | ) | (2,088,176 | ) | ||||||||||||
Payment for business acquisition, net of cash acquired | — | — | (2,446,455 | ) | (2,446,455 | ) | (9,643,148 | ) | (2,220,671 | ) | ||||||||||||||
Acquisition of equity-accounted investee | — | — | (1,022,913 | ) | (1,022,913 | ) | (642,000 | ) | — | |||||||||||||||
Acquisition of other investment | — | — | (4,845,480 | ) | (4,845,480 | ) | — | — | ||||||||||||||||
Acquisition of intangible assets | (452,544 | ) | (1,573,886 | ) | (3,468,503 | ) | (3,468,503 | ) | (4,094,471 | ) | (3,480,558 | ) | ||||||||||||
|
|
|
|
|
| |||||||||||||||||||
Net cash from (used in) investing activities | 3,451,730 | (3,034,279 | ) | (46,224,556 | ) | |||||||||||||||||||
Net cash used in investing activities | (46,224,556 | ) | (17,948,068 | ) | (64,451,925 | ) | ||||||||||||||||||
|
|
|
|
|
| |||||||||||||||||||
Cash flows from financing activities | ||||||||||||||||||||||||
Proceeds from issuance of shares on exercise of share options | 75,398 | 1,318,456 | 864,530 | |||||||||||||||||||||
Repurchase of own shares | — | (525,098 | ) | (1,252 | ) | |||||||||||||||||||
Proceeds from issuance of shares on exercise of share based awards | 864,530 | 417,946 | 316,986 | |||||||||||||||||||||
Direct cost incurred in relation to public offerings | — | (6,198,945 | ) | (1,725,428 | ) | (1,725,428 | ) | — | (2,819,456 | ) | ||||||||||||||
Proceeds from issuance of ordinary shares through public offerings | — | 58,153,844 | 37,122,648 | 37,122,648 | — | 76,475,000 | ||||||||||||||||||
Acquisition of non-controlling interests | — | (325,140 | ) | — | — | (792,982 | ) | — | ||||||||||||||||
Proceeds from (repayment of) bank loans | 104,935 | 64,605 | (158,486 | ) | (158,486 | ) | 109,175 | (32,001 | ) | |||||||||||||||
Payment of finance lease liabilities | (73,453 | ) | (61,162 | ) | (63,657 | ) | (63,657 | ) | (120,633 | ) | (33,661 | ) | ||||||||||||
Interest paid | (316,923 | ) | (588,299 | ) | (806,790 | ) | (806,790 | ) | (482,389 | ) | (1,446,621 | ) | ||||||||||||
|
|
|
|
|
| |||||||||||||||||||
Net cash from (used in) financing activities | (210,043 | ) | 52,363,359 | 35,232,817 | 35,232,817 | (1,393,981 | ) | 72,458,995 | ||||||||||||||||
|
|
|
|
|
| |||||||||||||||||||
Increase (decrease) in cash and cash equivalents | 8,472,988 | 42,996,923 | (112,805 | ) | (112,805 | ) | (5,746,152 | ) | 4,049,474 | |||||||||||||||
Cash and cash equivalents at beginning of the year | (2,442,385 | ) | 5,345,460 | 47,874,344 | 47,874,344 | 43,798,230 | 35,634,957 | |||||||||||||||||
Effect of exchange rate fluctuations on cash held | (685,143 | ) | (468,039 | ) | (3,963,309 | ) | (3,963,309 | ) | (2,417,121 | ) | (1,672,656 | ) | ||||||||||||
|
|
|
|
|
| |||||||||||||||||||
Cash and cash equivalents at end of the year | 5,345,460 | 47,874,344 | 43,798,230 | 43,798,230 | 35,634,957 | 38,011,775 | ||||||||||||||||||
|
|
|
|
|
| |||||||||||||||||||
Supplementary information | ||||||||||||||||||||||||
Additions to property, plant and equipment represented by finance lease obligations | 78,809 | — | 31,884 | 31,884 | — | — | ||||||||||||||||||
MAKEMYTRIP LIMITED
NOTES TO THE CONSOLIDATED FINANCIAL STATEMENTS
| 1) | REPORTING ENTITY |
MakeMyTrip Limited (the “Company”“Parent Company”) is a Company domiciled in Mauritius. The address of the Company’s registered office is Multiconsult Limited, Rogers House, 5 President John Kennedy Street, Port Louis, Mauritius. The consolidated financial statements of the Company comprise the Company andtogether with its subsidiaries (together referred to asand equity accounted investees (collectively, “the Company” or the “Group” and individually as “Group entities”). The Company has four subsidiaries: MakeMyTrip (India) Private Limited, MakeMyTrip.com Inc, Luxury Tours and Travel Pte Ltd and Luxury Tours (Malaysia) Sdn Bhd, incorporated in India, the United States of America (U.S.), Singapore and Malaysia, respectively. The Company acquired Luxury Tours and Travel Pte Ltd on May 9, 2011. Further, the Company has incorporated Luxury Tours (Malaysia) Sdn Bhd on August 15, 2011.
The Group is primarily engaged in the business of selling travel products and solutions in India, the U.S,U.S., the Netherlands, Singapore, Malaysia, Thailand, U.A.E and Malaysia.Canada. The Group offers its customers the entire range of travel services including ticketing, tours and packages and hotels.
On July 19, 2010, the shareholders approved resolutions effecting certain amendments to the authorized and issued share capital to:
effect a 20-for-one split The Company is domiciled in Mauritius. The address of the Company’s share capital on July 22, 2010 pursuant to which each ordinary share, Series A convertible and redeemable preference share, Series B convertible and redeemable preference share and Series C convertible and redeemable preference share of the Company was subdivided into 20 shares at a par value of USD 0.0005 per share.
adjust on July 22, 2010, ordinary shares of a par value of USD 0.01 each reserved under the MakeMyTrip.com Equity Option Plan for delivery in connection with the grant or vesting to ordinary shares of a par value of USD 0.0005 each, to reflect the subdivision of the Company’s ordinary shares approved by the shareholders of the Company.
All share and per share amounts presented in the consolidated financial statements have been adjusted on a retroactive basis to reflect the effect of share split and issuances.registered office is Multiconsult Limited, Les Cascades Building, Edith Cavell Street, Port Louis, Mauritius.
On August 17, 2010, the Company completed the initial public offering of its ordinary shares on National Association of Securities Dealers Automated Quotation System (NASDAQ), pursuant to which the Company issued and sold 3,846,154 ordinary shares and certain of its existing shareholders (referred to as the “Selling Shareholders”) sold 1,153,846 ordinary shares at a price of USD 14 per share. The offering resulted in gross proceeds of USD 53,846,156 and net proceeds of USD 50,076,925 to the Company and gross proceeds of USD 16,153,844 and net proceeds of USD 15,023,075 to the Selling Shareholders, after deducting underwriting discounts and commissions. The underwriters exercised their option to purchase 307,692 additional ordinary shares from the Company and 442,308 additional ordinary shares from the Selling Shareholders at the initial offering price of USD 14 per share to cover over-allotments, resulting in additional gross proceeds of USD 4,307,688 and net proceeds of USD 4,006,150 to the Company and additional gross proceeds of USD 6,192,312 and net proceeds of USD 5,758,850 to the Selling Shareholders, after deducting underwriting discounts and commissions.
On August 17, 2010, 6,577,260 Series A convertible and redeemable preference share of a par value USD 0.0005 each, 2,966,300 Series B convertible and redeemable preference share of a par value USD 0.0005 each, and 2,780,900 Series C convertible and redeemable preference share of a par value USD 0.0005 each were converted into 12,324,460 ordinary shares of a par value USD 0.0005 each by the holders of such preference shares.
MAKEMYTRIP LIMITED
NOTES TO THE CONSOLIDATED FINANCIAL STATEMENTS — (Continued)
over-allotments.
On June 2, 2011, the Company completed the follow-on public offering of its ordinary shares on NASDAQ, pursuant to which the Company issued and sold 1,450,000 ordinary shares and certain of its existing shareholders (referred to as the “Selling Shareholders”) sold 3,794,000 ordinary shares at a price of USD 24 per share. The offering resulted in gross proceeds of USD 34,800,000 and net proceeds of USD 33,669,000 to the Company and gross proceeds of USD 91,056,000 and net proceeds of USD 88,096,680 to the Selling Shareholders, after deducting underwriting discounts and commissions. Additionally, the Company incurred offering related expenses of approximately USD 518,942. Further on June 29, 2011, the underwriters exercised their option to purchase 96,777 additional ordinary shares from the Company and 253,223 additional ordinary shares from the Selling Shareholders at the follow-on offering price of USD 24 per share to cover over-allotments.
In December 2012, the Company purchased 40,142 of its own shares from the open market at the prevailing market price at different dates for USD 525,098, including directly attributable costs. In May 2013, the Company purchased 100 of its own shares from the open market at the prevailing market price for USD 1,252, including directly attributable costs.
On March 19, 2014, the Company completed the follow-on public offering of its ordinary shares on NASDAQ, pursuant to which Company issued and sold 3,000,000 ordinary shares and certain of its existing shareholders (referred to as the “Selling Shareholders”) sold 2,500,000 ordinary shares at a price of USD 23 per share. The offering resulted in gross proceeds of USD 69,000,000 and net proceeds of USD 66,671,250 to the Company, and gross proceeds of USD 57,500,000 and net proceeds of USD 55,559,375 to the Selling Shareholders, after deducting underwriting commissions. Additionally, the Company incurred offering related expenses of approximately USD 851,607. Further, the underwriters exercised their option to purchase 325,000 additional ordinary shares from the Company and 500,000 additional ordinary shares from the Selling Shareholders at the follow-on offering price of USD 23 per share to cover over-allotments, resulting in additional gross proceeds of USD 2,322,6487,475,000 and net proceeds of USD 2,247,1627,222,719 to the Company, and additional gross proceeds of USD 6,077,35211,500,000 and net proceeds of USD 5,879,83811,111,875 to the Selling Shareholders, after deducting underwriting discounts and commissions.
| 2) | BASIS OF PREPARATION |
| (a) | Statement of Compliance |
The consolidated financial statements have been prepared in accordance with International Financial Reporting Standards (IFRS) as issued by the International Accounting Standards Board (IASB). Accounting policies have been applied consistently to all periods presented in these financial statements.
MAKEMYTRIP LIMITED
NOTES TO THE CONSOLIDATED FINANCIAL STATEMENTS — (Continued)
The consolidated financial statements were authorized for issue by the Group’s Board of Directors on June 25, 2012.6, 2014.
| (b) | Basis of Measurement |
The consolidated financial statements have been prepared on the historical cost basis except for the following material items in the statement of financial position:
derivative financial instruments are measured at fair value;
share-based payments are valued using the Black Scholes valuation model at the date the optionsawards are granted;
long term interest free security deposits are measured at fair value;
Available-for-saleavailable-for-sale financial assets are measured at fair value; and
Non-derivative financial instrumentsdeferred consideration assumed in business combinations are measured at fair value.
| (c) | Functional and Presentation Currency |
These consolidated financial statements are presented in U.S. dollar (USD).
A Company’s functional currency is the currency of the primary economic environment in which an entity operates and is normally the currency in which the entity primarily generates and expends cash. USD is theThe functional currency of the Parent Company and its subsidiary, MakeMyTrip.com Inc as itsubsidiaries, Hotel Travel Limited and Hotel Travel (HK) Limited is the currency of the primary economic environment in which those entities operate. MakeMyTrip (India) Private Limited primarily operates its business in Indian Rupee (INR) and thus, INR has been determined to be theU.S. dollar. The functional currency of MakeMyTrip (India) Private Limited. Luxury Toursfor subsidiaries organized in India, the U.S., Singapore, Malaysia, Thailand, British Isles, Cayman Islands, China, British Virgin Islands, United Arab Emirates, Canada, the Netherlands, Switzerland and Travel Pte Ltd primarily operates its business in Singapore Dollars (SGD) and thus, SGD has been determined to be the functional currency of Luxury Tours and Travel Pte Ltd. Luxury Tours (Malaysia) Sdn Bhd primarily operates its business in Malaysia Ringgits (MYR) and thus, MYR has been determined to be the functional currency of this entity.
MAKEMYTRIP LIMITED
NOTES TO THE CONSOLIDATED FINANCIAL STATEMENTS — (Continued)
| (d) | Use of Estimates and Judgements |
The preparation of consolidated financial statements in conformity with IFRS require management to make judgments, estimates and assumptions that affect the application of accounting policies and the reported amounts of assets, liabilities, income and expenses. Actual results may differ from these estimates.
Estimates and underlying assumptions are reviewed on an ongoing basis. Revisions to accounting estimates are recognised in the period in which the estimates are revised and in any future periods affected.
Information about significant areas of estimation/uncertainty in applying accounting policies that have the most significant effect on the amounts recognised in the consolidated financial statements are as follows:
• | Note 3(d) and | Available for sale financial assets | ||
• | Note 3(e) and 17 | Property, plant and equipment | ||
• | Note 3(f) and 18 | Useful life of intangible assets | ||
• | Note 3(j) and | Employee benefit plans | ||
• | Note 3(p) | Income taxes | ||
• | Note 3(k) | Provisions and contingent liabilities | ||
• | Note 3(d) | Valuation of derivatives | ||
• | Note 3(j) and | Share based payment | ||
MAKEMYTRIP LIMITED
NOTES TO THE CONSOLIDATED FINANCIAL STATEMENTS — (Continued)
Information about assumptions and estimation uncertainties that have a significant risk of resulting in a material adjustment within the next financial year are included in the following notes:
• | Note | |||
• | Note 3(j) and | Measurement of defined benefit obligations | ||
| 3) | SIGNIFICANT ACCOUNTING POLICIES |
TheExcept as described below, the accounting policies set out below have been applied consistently to all periods presented in these consolidated financial statements.
Changes in accounting policies
The Group has adopted the following new standards and amendments to standards, including any consequential amendments to other standards, with effect from April 1, 2013.
IFRS 10 Consolidated Financial Statements (2011) (Refer (a) below)
IFRS 12 Disclosure of Interests in Other Entities
The adoption of this standard does not have any impact on these consolidated financial statements of the Group.
IFRS 13 Fair Value Measurement
On April 1, 2013, the Group adopted IFRS 13, “Fair Value Measurement” which establishes a single source of guidance for fair value measurement under IFRS. IFRS 13 provides a revised definition of fair value and guidance on how it should be applied where its use is already required or permitted by other standards within IFRS and introduces more comprehensive disclosure requirements on fair value measurement. There was no significant impact on these consolidated financial statements from the adoption of the measurement requirements of IFRS 13. The Group has provided the disclosures as required by IFRS 13 in note 35 - “Financial Instruments” of these consolidated financial statements.
Presentation of Items of Other Comprehensive Income (Amendment to IAS 1)
As a result of the amendments to IAS 1, the Group has modified the presentation of items of other comprehensive income in its consolidated statement of other comprehensive income (loss), to present separately items that would be reclassified to profit or loss in the future from those that would never be. Comparative information has also been re-presented accordingly.
The adoption of the amendment to IAS 1 has no impact on the recognised assets, liabilities and comprehensive income of the Group.
IAS 19 Employee Benefits (2011)
The group has adopted Revised IAS 19 effective April 1, 2013. The amended standard requires immediate recognition of the gains and losses through re-measurement of the net defined benefit liability/ (asset) through other comprehensive income. Further, it also requires the interest expense (income) considered in the Profit and Loss to be restricted to the discount rate based on the Government securities yield. The actual return of the portfolio, in excess of such yields is recognised through other comprehensive income.
MAKEMYTRIP LIMITED
NOTES TO THE CONSOLIDATED FINANCIAL STATEMENTS — (Continued)
Revised IAS 19 also requires effect of any plan amendments to be recognised immediately through the net profit/loss, in the statement of comprehensive income.
Previously, the actuarial gains and losses were charged or credited to net profit/loss in the statement of profit or loss and other comprehensive income (loss) in the period in which they arose and the expected return on plan assets computed based on market expectations were considered as part of the net gratuity cost. The adoption of Revised IAS 19, Employee Benefits, does not have any material impact on these consolidated financial statements.
| (a) | Basis of Consolidation |
| i) | Subsidiaries |
Subsidiaries areThe Group consolidates entities controlled bywhich it owns or controls. As a result of IFRS 10 (2011), the Group.Group has changed its accounting policy with respect to the basis for determining control. Control exists when the parent has power over the entity, is exposed, or has rights, to variable returns from its involvement with the entity and has the ability to affect those returns by using its power over the entity. Power is demonstrated through existing rights that give the ability to direct relevant activities, those which significantly affect the entity’s returns. Entities are consolidated from the date control commences until the date control ceases.
Previously, control existed when the Group hashad the power to govern the financial and operating policies of an entity so as to obtain benefits from its activities. In assessing control, potential voting rights that were currently are exercisable arewere also taken into account. The financial statementsIn accordance with the transitional provisions of subsidiaries are included inIFRS 10 (2011), the Group reassessed the control conclusion at April 1, 2013 and has concluded that there is no change to the scope of the entities to be consolidated financial statements fromas a result of the date that control commences until the dates that control ceases.adoption of IFRS 10.
| ii) | Investment in Associates (Equity Accounted Investees) |
Associates are those entities in which the Group has significant influence, but not control, over the financial and operating polices. Significant influence is presumed to exist when the Group holds between 20% and 50% of the voting power of another entity.
Investments in associates are accounted for using the equity method and are recognised initially at cost. The cost of investment includes transaction costs.
MAKEMYTRIP LIMITED
NOTES TO THE CONSOLIDATED FINANCIAL STATEMENTS — (Continued)
The consolidated financial statements include the Group’s share of the profit or loss and other comprehensive income of equity accounted investees, other adjustments to align the accounting policies with those of the Group, from the date that significant influence commences until the date that significant influence ceases.
| iii) | Non-controlling Interests |
Non-controlling interests are measured at their proportionate share of the acquiree’s identifiable net assets at the acquisition date. Change in the Group’s interest in a subsidiary that do not result in a loss of control are accounted for as equity transactions.
| iv) | Transactions Eliminated on Consolidation |
Intra-group balances and transactions, and any unrealized income and expenses arising from intra-group transactions, are eliminated in preparing the consolidated financial statements.
MAKEMYTRIP LIMITED
NOTES TO THE CONSOLIDATED FINANCIAL STATEMENTS — (Continued)
| (b) | Business Combinations |
Business combinations are accounted for using the acquisition method as at the acquisition date, which is the date on which control is transferred to the Group. Control is the power to govern the financial and operating policies of an entity so as to obtain benefits from its activities.
The cost of an acquisition is measured at the fair value of the assets given, equity instruments issued and liabilities incurred or assumed at the date of exchange. The cost of acquisition also includes the fair value of any contingent consideration and deferred consideration, if any. Identifiable assets acquired and liabilities and contingent liabilities assumed in a business combination are measured initially at fair value at the date of acquisition. Transaction costs incurred in connection with a business combination are expensed as incurred.
| (c) | Foreign Currency |
| i) | Foreign Currency Transactions |
Transactions in foreign currencies are translated to the respective functional currencies of Group entities at exchange rates at the dates of the transactions. Monetary assets and liabilities denominated in foreign currencies at the reporting date are translated to the functional currency at the exchange rate at that date. The foreign currency gain or loss on monetary items is the difference between amortized cost in the functional currency at the beginning of the period, adjusted for effective interest and payments during the period, and the amortized cost in foreign currency translated at the exchange rate at the end of the reporting period. Foreign currency differences arising on translation are recognized in profit or loss, except for the differences on available for sale equity investments, which are recognized in other comprehensive income arising on retranslation.
| ii) | Foreign Operations |
The assets and liabilities of foreign operations, including goodwill and fair value adjustment arising on acquisition, are translated to USD at exchange rates at the reporting date. The income and expenses of foreign operations are translated to USD at an average exchange rate applicable during the period.
Foreign currency differences are recognized in other comprehensive income as foreign currency translation reserve (FCTR). However, if the operation is a non-wholly owned subsidiary, then the relevant proportionate share of the translation difference is allocated to non-controlling interest. When a foreign operation is disposed of, in part or in full, the relevant amount in the FCTR is transferred to profit or loss as part of the profit or loss on disposal.
MAKEMYTRIP LIMITED
NOTES TO THE CONSOLIDATED FINANCIAL STATEMENTS — (Continued)
| (d) | Financial Instruments |
| i) | Non-Derivative Financial Assets |
The Group initially recognizes loans and receivables and deposits on the date that they are originated. All other financial assets are recognized initially on the trade date at which the Group becomes a party to the contractual provisions of the instrument.
The Group derecognizes a financial asset when the contractual rights to the cash flows from the asset expire, or it transfers the rights to receive the contractual cash flows on the financial asset in a transaction in which substantially all the risks and rewards of ownership of the financial asset are transferred. Any interest in transferred financial assets that is created or retained by the Group is recognized as a separate asset or liability.
MAKEMYTRIP LIMITED
NOTES TO THE CONSOLIDATED FINANCIAL STATEMENTS — (Continued)
Financial assets and liabilities are offset and the net amount is presented in the consolidated statement of financial position when, and only when, the Group has a legal right to offset the amounts and intends either to settle on a net basis or to realize the asset and settle the liability simultaneously.
The Group has the following non-derivative financial assets which are classified into the following specified categories: ‘trade and other receivables’, ‘available for sale’ and ‘term deposits’. The classification depends on the nature and purpose of the financial assets and is determined at the time of initial recognition.
Trade and other Receivables
Trade and other receivables are financial assets with fixed or determinable payments that are not quoted in an active market. Such assets are recognized initially at fair value plus any directly attributable transaction costs. Subsequent to initial recognition, trade and other receivables are measured at amortized cost using the effective interest method, less any impairment losses.
Trade receivables are initially recognized at fair value which primarily represents original invoice amount less any impairment loss or an allowance for any uncollectible amounts. Provision is made when there is objective evidence that the Group may not be able to collect the trade receivable. Balances are written off when recoverability is assessed as being remote.
Cash and cash equivalents
Cash and cash equivalents comprise cash at bank and on hand and short-term deposits with original maturities of three months or less that are readily convertible to known amounts of cash and which are subject to an insignificant risk of changeschange in value.
Available-for-sale Financial Assets
Available-for-sale financial assets are non-derivative financial assets that are either designated as available-for-sale or are not classified in any of the other categories. Available-for-sale financial assets are recognised initially at fair value plus any directly attributable transaction costs. Subsequent to initial recognition, they are measured at fair value and changes therein, other than impairment losses are recognized in other comprehensive income and presented within equity in the fair value reserve. When an investment is derecognized, the cumulative gain or loss in other comprehensive income is transferred to profit or loss. Available-for-sale financial assets comprise of equity securities.
MAKEMYTRIP LIMITED
NOTES TO THE CONSOLIDATED FINANCIAL STATEMENTS — (Continued)
Term deposits
Term deposits comprise deposits with banks, which have original maturities of more than three months. Such assets are recognized initially at fair value plus any directly attributable transaction costs. Subsequent to initial recognition, term deposits are measured at amortized cost using the effective interest method, less any impairment losses.
| ii) |
The Group recognizes financial liabilities initially on the trade date at which the Group becomes a party to the contractual provisions of the instrument.
The Group derecognizes a financial liability when its contractual obligations are discharged or cancelled or expire.
MAKEMYTRIP LIMITED
NOTES TO THE CONSOLIDATED FINANCIAL STATEMENTS — (Continued)
Financial assets and liabilities are offset and the net amount is presented in the consolidated statement of financial position when, and only when, the Group has a legal right to offset the amounts and intends either to settle on a net basis or to realize the asset and settle the liability simultaneously.
The Group has the following non-derivative financial liabilities: loans and borrowings, bank overdraft, other current and non-current liabilities and trade and other payables. Such financial liabilities are recognized initially at fair value plus any directly attributable transaction costs. Subsequent to initial recognition these financial liabilities are measured at amortized cost using the effective interest method.
Bank overdrafts that are repayable on demand and form an integral part of the Group’s cash management are included as a component of cash and cash equivalents for the purpose of the consolidated statement of cash flows.
| iii) | Share Capital |
Ordinary shares
Ordinary shares are classified as equity. Incremental costs directly attributable to the issue of ordinary shares are recognized as a deduction from equity.
Compound financial instruments issued by the Group comprise convertibleRepurchase and redeemable preference shares with discretionary, non cumulative dividend that can be converted to ordinaryreissue of share capital at(treasury shares)
When share capital recognized as equity is repurchased, the optionamount of the holder. One preference share can be converted into one ordinary share. This compound instrument also has an adjustment clause that representsconsideration paid, which includes directly attributable costs, net of any tax effects, is recognized as a price protection feature that protects the original preference shareholdersdeduction from declineequity. Repurchased shares are classified as treasury shares and are presented in the market value of the Group’s securities. This clause may result in the entity issuing variable number of preference shares on conversion hence, represents a liability.
Equity instruments are instruments that evidence a residual interest in the assets of an entity after deducting all of its liabilities. Therefore, when the initial carrying amount of a compound financial instrument is allocated to its equity and liability components, the equity component is assigned the residual amount after deducting from the fair value of the instrument as a whole the amount separately determinedreserve for the liability component. The value of any derivative features (such as conversion option) embedded in the compound financial instrument other than the equity component is included in the liability component. The sum of the carrying amounts assigned to the liability and equity components on initial recognition is always equal to the fair value that would be ascribed to the instrument as a whole. No gain or loss arises from initially recognizing the components of the instrument separately.
MAKEMYTRIP LIMITED
NOTES TO THE CONSOLIDATED FINANCIAL STATEMENTS — (Continued)
The fair value of the financial liability has been initially recognized at the amount payable on demand, discounted from the first date that the amount could be required to be paid.
The equity component is recognized initially at the difference between the fair value of the compound financial instrument as a whole and the fair value of the liability component (including the embedded derivative liability). From the liability component that includes the embedded derivative liability, the fair value of the derivative liability is separated and the balance host contract is accounted as a non-derivative liability. Any directly attributable transaction costs are allocated to the liability and equity components in proportion to their initial carrying amounts. Subsequent to initial recognition, the non-derivative liability component of a compound financial instrument is measured at amortized cost using the effective interest method. The equity component of a compound financial instrument is not re-measured subsequent to initial recognition. Separable embedded derivatives are recognized in accordance with accounting policy as per note 3(c)(v).
Interest, dividends, losses and gains relating to the financial liability are recognized in profit or loss.own shares.
| Derivative financial instruments |
The Group has an embedded derivative feature in its preference share capital and in its investment in equity-accounted investees. Derivatives are recognized initially at fair value.value; attributable transaction costs are recognized in profit or loss as incurred. Fair value of the derivative is determined on the inception using an appropriate valuation method. Subsequent to initial recognition, derivatives are measured at fair value, and changes therein are accounted in profit or loss.
| (e) | Property, Plant and Equipment |
| i) | Recognition and Measurement |
Items of property, plant and equipment are measured at cost less accumulated depreciation and accumulated impairment losses.
Cost includes expenditure that is directly attributable to the acquisition of the asset. Purchased software that is integral to the functionality of the related equipment is capitalized as part of that equipment.
When parts of an item of property, plant and equipment have different useful lives, they are accounted for as separate items (major components) of property, plant and equipment.
Gains and losses on disposal of an item of property, plant and equipment are determined by comparing the proceeds from disposal with the carrying amount of property, plant and equipment, and are recognized net within “other revenue/income/other operating expenses” in the consolidated statement of profit or loss.loss and other comprehensive income.
MAKEMYTRIP LIMITED
NOTES TO THE CONSOLIDATED FINANCIAL STATEMENTS — (Continued)
Advances paid towards the acquisition of property, plant and equipment outstanding at each reporting date and the cost of property, plant and equipment not ready to use before such date are disclosed under property, plant and equipment.
| ii) | Subsequent Costs |
Subsequent expenditure is recognized as an increase in the carrying amount of the asset when it is probable that future economic benefits deriving from the cost incurred will flow to the enterprise and the cost of the item can be reliably determined. The carrying amount of the replaced part is derecognized. The costs of the day-to-day servicing of property, plant and equipment are recognized in profit or loss as incurred.
MAKEMYTRIP LIMITED
NOTES TO THE CONSOLIDATED FINANCIAL STATEMENTS — (Continued)
| iii) | Depreciation |
Depreciation is calculated over the depreciable amount, which is the cost of an asset or other amount substituted for cost, less its residual value.
Depreciation is recognized in profit or loss on a straight-line basis over the estimated useful lives for each component of property, plant and equipment since this most closely reflects the expected pattern of consumption of the future economic benefits embodied in the asset. Leased assets are depreciated over the shorter of the lease term and their useful lives.
The estimated useful lives for the current and comparative periods are as follows:
• Computers | 5 years | |||
• Furniture and fixtures | 6 years | |||
• Office equipments | 7 years | |||
• Motor vehicles | 7 years | |||
• Diesel generator sets | 7 years |
Leasehold improvements are depreciated over the lease term or useful lives, whichever is shorter.
Depreciation methods, useful lives and residual values are reviewed at each financial year end and adjusted as appropriate.
| (f) | Intangible Assets |
| i) | Goodwill |
Goodwill represents excess of the cost of acquisition over the Group’s share in the fair value of the acquiree’s identifiable assets, liabilities and contingent liabilities. If the excess is negative, a bargain purchase gain is recognized immediately in the profit or loss. Subsequent to initial recognition, goodwill is measured at cost less accumulated impairment losses.
| ii) | Website Development Cost |
Website development costs incurred by the Group having finite useful lives, are measured at cost less accumulated amortization and accumulated impairment losses. Cost includes expenses incurred during the application development stage. The costs related to planning and post implementation phases of development are expensed as incurred.
Expenditure on research activities are recognized in profit or loss as incurred.
MAKEMYTRIP LIMITED
NOTES TO THE CONSOLIDATED FINANCIAL STATEMENTS — (Continued)
Development activities involve a plan or design for the production of new or substantially improved products and processes. Development expenditure is capitalized only if development costs can be measured reliably, the product or process is technically and commercially feasible, future economic benefits are probable, and the Group intends to and has sufficient resources to complete development and to use or sell the asset. The expenditure capitalized include the cost of materials, direct labour, overhead costs that are directly attributable to preparing the asset for its intended use, and capitalized borrowing cost.
MAKEMYTRIP LIMITED
NOTES TO THE CONSOLIDATED FINANCIAL STATEMENTS — (Continued)
Incidental operations are not necessary to bring an asset to the condition necessary for it to be capable of operating in the manner intended by management, the income and related expenses of incidental operations are recognized immediately in profit or loss, and included in their respective classifications of income and expense.
| iii) | Other Intangible Assets |
Other intangible assets comprise software that are acquired by the Group and intangible assets acquired in a business combination.
Softwares haveSoftware has finite useful lives and areis measured at cost less accumulated amortization and accumulated impairment losses. Cost includes any directly attributable incidental expenses necessary to make the assets ready for use.
Intangible assets acquired in a business combination are measured at fair value as at the date of acquisition. Following initial recognition, intangible assets are carried at cost less any accumulated amortization and impairment losses, if any.
| iv) | Subsequent Expenditure |
Subsequent expenditure is capitalized only when it increases the future economic benefits embodied in the specific asset to which it relates. All other expenditure, including expenditure on internally generated goodwill and brands, is recognized in profit or loss as incurred.
| v) | Amortization |
Amortization of assets, other than goodwill, is calculated over the cost of the assets, or other amount substituted for cost, less its residual value.
Amortization is recognized in profit or loss on a straight-line basis over the estimated useful lives of intangible assets from the date that they are available for use, since this most closely reflects the expected pattern of consumption of the future economic benefits embodied in the asset.
The estimated useful lives for the current and comparative periods are as follows:
• Website development costs | ||||
• Software | 5 years | |||
• Customer – related intangible assets | ||||
• Contract – related intangible assets | ||||
• Marketing – related intangible assets |
Amortization methods, useful lives and residual values are reviewed at each financial year-end and adjusted as appropriate.
MAKEMYTRIP LIMITED
NOTES TO THE CONSOLIDATED FINANCIAL STATEMENTS — (Continued)
| (g) | Assets Held for Sale |
Non-current assets that are expected to be recovered primarily through sale rather than continuing use are classified as held for sale. Immediately before classification as held for sale the assets are remeasured in accordance with the Group’s accounting policies. Thereafter generally the assets are remeasured at the lower of their carrying amount and fair value less costs to sell. Impairment losses on initial classification as held for sale and subsequent gains and losses on remeasurement are recognized in profit or loss. Gains are not recognized in excess of any cumulative impairment loss.
Once classified as held for sale, intangible assets and property, plant and equipment are no longer amortized or depreciated.
MAKEMYTRIP LIMITED
NOTES TO THE CONSOLIDATED FINANCIAL STATEMENTS — (Continued)
| (h) | Inventories |
Inventories are measured at the lower of cost and net realizable value. Net realizable value is the estimated selling price in the ordinary course of business, less the estimated selling expenses.
| (i) | Impairment |
| i) | Financial assets (Including Receivables) |
A financial asset not carried at fair value through profit or loss is assessed at each reporting date to determine whether there is objective evidence that it is impaired. A financial asset is impaired if objective evidence indicates that a loss event has occurred after the initial recognition of the asset, and that the loss event had a negative effect on the estimated future cash flows of that asset that can be estimated reliably.
Objective evidence that financial assets are impaired can include default or delinquency by a debtor, restructuring of an amount due to the Group on terms that the Group would not otherwise consider, indications that a debtor or issuer will enter bankruptcy, the disappearance of an active market for a security.
The Group considers evidence of impairment for receivables for each specific asset. All individually significant receivables are assessed for specific impairment.
An impairment loss in respect of a financial asset measured at amortized cost is calculated as the difference between its carrying amount and the present value of the estimated future cash flows discounted at the asset’s original effective interest rate. Losses are recognized in profit or loss and reflected in an allowance account against receivables. Interest on the impaired asset continues to be recognized through the unwinding of the discount. When a subsequent event causes the amount of impairment loss to decrease, the decrease in impairment loss is reversed through profit or loss.
Impairment losses on available-for-sale financial assets are recognized by reclassifying the losses accumulated in the fair value reserve in equity to profit or loss. The cumulative loss that is reclassified from equity to profit or loss is the difference between the acquisition cost, net of any principal repayment and amortization, and the current fair value, less any impairment loss recognized previously in profit or loss. Changes in cumulative impairment losses attributable to application of the effective interest method are reflected as a component onof interest income. If, in a subsequent period, the fair value of an impaired available-for-sale debt security increases and the increase can be related objectively to an event occurring after the impairment loss was recognized, then the impairment loss is reversed, with the amount of the reversal recognized in profit or loss. However, any subsequent recovery in the fair value of an impaired available-for-sale equity security is recognized in other comprehensive income.
MAKEMYTRIP LIMITED
NOTES TO THE CONSOLIDATED FINANCIAL STATEMENTS — (Continued)
| ii) | Non-Financial Assets |
The carrying amounts of the Group’s non-financial assets, primarily property, plant and equipment, website development cost, software and other intangible assets are reviewed at each reporting date to determine whether there is any indication of impairment. If any such indication exists, then the asset’s recoverable amount is estimated. Goodwill is tested annually for impairment. An impairment loss is recognized if the carrying amount of an asset or cash generating unit (CGU) exceeds its recoverable amount.
MAKEMYTRIP LIMITED
NOTES TO THE CONSOLIDATED FINANCIAL STATEMENTS — (Continued)
The recoverable amount of an asset or CGU is the greater of its value in use and its fair value less costs to sell. In assessing value in use, the estimated future cash flows are discounted to their present value using a pre-tax discount rate that reflects current market assumptions of the time value of money and the risks specific to the asset. For the purpose of impairment testing, assets are grouped together into the smallest group of assets that generates cash inflows from continuing use that are largely independent of the cash inflows of other assets or CGUs. Subject to an operating segment ceiling test, CGUs to which goodwill has been allocated are aggregated to that level at which impairment testing is performed which reflects the lowest level at which goodwill is monitored for internal reporting purposes. Goodwill acquired in a business combination is allocated to the group of CGUs that are expected to benefit from the synergies of the combination.
Impairment losses are recognized in profit or loss. Impairment losses recognized in respect of CGUs are allocated first to reduce the carrying amount of any goodwill allocated to the CGU (group of CGUs), and then to reduce the carrying amounts of the other assets in the CGU (group of CGUs) on a pro rata basis.
An impairment loss in respect of goodwill is not reversed. For other assetsasset, an impairment loss is reversed only to the extent that the asset’s carrying amount does not exceed the carrying amount that would have been determined, net of depreciation or amortization, if no impairment loss had been recognized.
| (j) | Employee Benefit Plans |
i) Defined Contribution Plans
A defined contribution plan is a post-employment benefit plan under which an entity pays fixed contributions into separate entity and will have no legal or constructive obligation to pay further amounts. Obligations for contributions to defined contribution plans are recognized as a personnel expense in profit or loss in the periods during which services are rendered by employees. Prepaid contributions are recognized as an asset to the extent that a cash refund or a reduction in future payments is available.
ii) Defined Benefit Plans
A defined benefit plan is a post-employment benefit plan other than a defined contribution plan. The Group’s gratuity scheme is a defined benefit plan.
The Group’s liability with regard to gratuity is based on an actuarial valuation carried out as at September 30 and March 31 each year. Actuarial gains and losses are recognized in other comprehensive income. Gains or losses on the curtailment or settlement of any defined benefit plan are recognized when the curtailment or settlement occurs. All expenses related to defined benefit plan are recognized in personnel expenses in profit and loss.
MAKEMYTRIP LIMITED
NOTES TO THE CONSOLIDATED FINANCIAL STATEMENTS — (Continued)
The Group’s net obligation in respect of defined benefit plan is calculated by estimating the amount of future benefit that employees have earned in return for their service in the current and prior periods; that benefit is discounted to determine its present value. Any unrecognized past service costs are deducted. The discount rate is based on the prevailing market yields of Indian government securities as at the reporting date that have maturity dates approximating the terms of the Group’s obligations and that are denominated in the same currency in which the benefits are expected to be paid. The calculation is performed half yearly by a qualified actuary using the projected unit credit method.
MAKEMYTRIP LIMITED
NOTES TO THE CONSOLIDATED FINANCIAL STATEMENTS — (Continued)
iii) Other Long-term Employee Benefits
Benefits under the Group’s compensated absences constitute other long term employee benefits.
The Group’s net obligation in respect of long-term employee benefits is the amount of future benefit that employees have earned in return for their service in the current and prior periods; that benefit is discounted to determine its present value, and the fair value of any related assets is deducted. The discount rate is based on the prevailing market yields of Indian government securities as at the reporting date that have maturity dates approximating the terms of the Group’s obligations. The calculation is performed using the projected unit credit method. Any actuarial gains or losses are recognized in profit or loss in the period in which they arise.
iv) Short-term Employee Benefits
Short-term employee benefit obligations are measured on an undiscounted basis and are expensed as the related service is provided. A liability is recognized for the amount expected to be paid under short-term cash bonus or profit-sharing plans if the Group has a present legal or constructive obligation to pay this amount as a result of past service provided by the employee, and the obligation can be estimated reliably.
v) Share Based Payment
The grant date fair value of share-based payment awards granted to employees is recognized as a personnel expense, with a corresponding increase in equity, over the period that the employees unconditionally become entitled to the awards. The amount recognized as an expense is adjusted to reflect the number of awards for which the related service and non-market vesting conditions are expected to be met, such that the amount ultimately recognized as an expense is based on the number of awards that do meet the related service and non-market performance conditions at the vesting date. The increase in equity recognized in connection with a share based payment transaction is presented in the share based payment reserve, a separate component in equity.
In respect of options modified, the Group includes the incremental fair value of the options in the measurement of the amounts recognized for services received from the employees. The incremental fair value is the difference between the fair value of the modified option and that of the original option both estimated as at the date of the modification. If the modification occurs during the vesting period or a modified vesting period, the incremental fair value is recognized over the period from the modification date until the date when the modified equity instruments vest. This is in addition to the amount based on the grant date fair value of the original equity instruments. If the modification relates to options which are fully vested, the incremental fair value of the modified options is recognized immediately.
| (k) | Provisions and Contingent Liabilities |
A provision is recognized if, as a result of a past event, the Group has a present legal or constructive obligation that can be estimated reliably, and it is probable that an outflow of economic benefits will be required to settle the obligation. Provisions are determined by discounting the expected future cash flows at a pre-tax rate that reflects current market assumptions of the time value of money and the risks specific to the liability. The unwinding of discount is recognized as finance cost.
The amount recognized as a provision is the best estimate of the consideration required to settle the present obligation at reporting date, taking into account the risks and uncertainties surrounding the obligation.
MAKEMYTRIP LIMITED
NOTES TO THE CONSOLIDATED FINANCIAL STATEMENTS — (Continued)
When some or all of the economic benefits required to settle a provision are expected to be recovered from a third party, the receivable is recognized as an asset if it is virtually certain that reimbursement will be received and the amount of the receivable can be measured reliably.
Contingent liabilities are possible obligations that arise from past events and whose existence will only be confirmed by the occurrence or non-occurrence of one or more future events not wholly within the control of the Group. Where it is not probable that an outflow of economic benefits will be required, or the amount cannot be estimated reliably, the obligation is disclosed as a contingent liability, unless the probability of outflow of economic benefits is remote.
| (l) | Revenue |
The Group provides travel products and services to leisure and corporate travelers in India and abroad. The revenue from rendering these services is recognized in the income statement at the time when significant risk and rewards are transferred to the customer. This is generally the case: 1) on the date of departure for tours and packages, 2) date of check in for hotel booking business, and 3) on the issuance of the ticket in the case of sale of airline tickets.
Income from the sale of airline tickets is recognized as an agent on a net commission earned basis, as the Group does not assume any performance obligation post the confirmation of the issuance of an airline ticket to the customer. Similarly, any commission earned on hotel reservations booked is being recognized on a net basis as an agent on the date of check in.
In case where the Company purchasepurchases airline tickets and assumes inventory risk, income from the sale of such airline tickets is accounted on gross basis as the Group is determined to be the primary obligator in this arrangement.
Incentives from airlines are recognized when the performance obligations under the incentive schemes are achieved.
Income from tours and packages, including income on airline tickets sold to customers as a part of tours and packages is accounted on gross basis as the Group is determined to be the primary obligor in the arrangement i.e., the risks and responsibilities are taken by the Group including the responsibility for delivery of services.
Income from other sources, primarily comprising advertising revenue, income from sale of rail and bus tickets and fees for facilitating website access to a travel insurance company are being recognized as the services are being performed. Income from the sale of rail and bus tickets is recognized as an agent on a net commission earned basis, as the Group does not assume any performance obligation post the confirmation of the issuance of the ticket to the customer.
Revenue is recognized net of cancellations, refunds, discounts and taxes. In the event of cancellation of airline tickets, revenue recognized in respect of commissions earned by ourthe company on such tickets is reversed and is net off from ourthe revenue earned during the fiscal period at the time the cancellation is made by ourthe customers. In addition, a liability is recognized in respect of the refund due to ourthe customers for the gross amount charged to such customers net of cancellation fees. The revenue from the sale of tours and packages and hotel reservations is recognized on the customer’s departure and check-in dates, respectively. Cancellations, if any, do not impact revenue recognition since revenue is recognized upon the availingavailment of services by the customer.
Revenue is allocated between the loyalty programme and the other components of the sale. The amount allocated to the loyalty programme is deferred, and is recognized as revenue when the Group fulfills its obligations to supply the products/services under the terms of the programme or when it is no longer probable that the points under the programme will be redeemed.
MAKEMYTRIP LIMITED
NOTES TO THE CONSOLIDATED FINANCIAL STATEMENTS — (Continued)
| (m) | Advertisement and Business Promotion Costs |
Advertising and business promotion costs primarily comprise of internet, television, radio and print media advertisement costs as well as event driven promotion cost for Group’s products and services. Such costs are the amount paid to or accrued towards advertising agencies or direct service providers for advertising on websites, television, print formats, search engine marketing and any other media. Advertising and business promotion costs are recognized when incurred.
| (n) | Leasing Arrangements |
Accounting for Finance Leases
On initial recognition, assets held under finance leases are recorded as property, plant and equipment and the related liability is recognized under borrowings. At inception of the lease, finance leases are recorded at amounts equal to the fair value of the leased asset or, if lower, the present value of the minimum lease payments. Minimum lease payments under finance leases are apportioned between the finance expense and the reduction of the outstanding liability. Contingent lease payments are accounted for by revising the minimum lease payments over the remaining term of the lease when the lease adjustment is confirmed.
The finance expense is allocated to each period during the lease term so as to produce a constant periodic rate of interest on the remaining balance of the liability.
Accounting for Operating Leases
Payments made under operating leases are recognized as an expense on a straight-line basis over the lease term. Lease incentives received are recognized as a reduction of the lease expense, over the term of the lease.
| (o) | Finance Income and Expenses |
Finance income comprises interest income on funds invested and net gain on change in fair value of derivatives. Interest income is recognized as it accrues in profit or loss, using the effective interest method.
Finance expenses comprise interest expense on borrowings, unwinding of the discount on provisions, losses on disposal of available-for-sale financial assets, net loss on change in fair value of derivatives and impairment losses recognized on financial assets, including trade and other receivables. Borrowing costs that are not directly attributable to the acquisition, construction or production of a qualifying asset are recognized in profit or loss using the effective interest method.
Foreign currency gains and losses are reported on a net basis.
| (p) | Income Taxes |
Income tax expense comprises current and deferred taxes. Current and deferred tax expense is recognized in profit or loss except to the extent that it relates to items recognized directly in equity or other comprehensive income, in which case it is recognized in equity or in other comprehensive income.
Current tax is the expected tax payable on the taxable income for the year, using tax rates enacted or substantively enacted at the reporting date, and any adjustment to tax payable in respect of previous years.
MAKEMYTRIP LIMITED
NOTES TO THE CONSOLIDATED FINANCIAL STATEMENTS — (Continued)
Deferred tax is recognized in respect of temporary differences between the carrying amounts of assets and liabilities for financial reporting purposes and the amounts used for taxation purposes. Deferred tax is not recognized for the following temporary differences: the initial recognition of assets or liabilities in a transaction that is not a business combination and that affects neither accounting nor taxable profit or loss, and differences relating to investments in subsidiaries to the extent that it is probable that they will not reverse in the foreseeable future. Deferred tax is measured at the tax rates that are expected to be applied to temporary differences when they reverse, based on the laws that have been enacted or substantively enacted by the reporting date. Deferred tax assets and liabilities are offset if there is a legally enforceable right to offset current tax liabilities and assets, and they relate to income taxes levied by the same tax authority on the same taxable entity, or on different tax entities, but they intend to settle current tax liabilities and assets on a net basis or their tax assets and liabilities will be realized simultaneously.
A deferred tax asset is recognized for unused tax losses and deductible temporary differences, to the extent that it is probable that future taxable profits will be available against which they can be utilized. Deferred tax assets are reviewed at each reporting date and are reduced to the extent that it is no longer probable that the related tax benefit will be realized.
In determining the amount of current and deferred tax, the Group takes into account the impact of uncertain tax positions and whether additional taxes and interest may be due. This assessment relies on estimates and assumptions and may involve a series of judgements about future events. New information may become available that causes the Company to change its judgement regarding the adequacy of existing tax liabilities; such changes to tax liabilities will impact tax expense in the period that such a determination is made.
| (q) | Earning (Loss) Per Share |
The Group presents basic and diluted earnings (loss) per share (EPS) data for its ordinary shares. Basic EPS is calculated by dividing the profit or loss attributable to ordinary shareholders of the Company by the weighted average number of ordinary shares outstanding during the period. Diluted EPS is determined by adjusting the profit or loss attributable to ordinary shareholders and the weighted average number of ordinary shares outstanding adjusted for the effects of all potential dilutive ordinary shares which comprise convertible and redeemable preference shares and share options granted to employees.shares.
| (r) | Operating Segment |
In accordance with IFRS 8 – Operating Segment, the operating segments used to present segment information are identified on the basis of internal reports used by the Group’s management to allocate resources to the segments and assess their performance. An operating segment is a component of the Group that engages in business activities from which it earns revenues and incurs expenses, including revenues and expenses that relate to transactions with any of the Group’s other components. Results of the operating segments are reviewed regularly by the leadership team, which has been identified as the CODM,chief operating decision maker (CODM), to make decisions about resources to be allocated to the segment and assess its performance and for which discrete financial information is available.
The Group has two reportable segments, i.e. air ticketing and hotels and packages. Accordingly, the Group has made relevant entity-wide disclosures (Refer to Note 6).
Segment results that are reported to the CODM include items directly attributable to a segment.
Revenue directly attributable to the segments is considered segment revenue. Segment revenue of the hotelsIncome from tours and packages segment is measured on a gross basis.basis and any commission earned on hotel reservations booked is being recognized on a net basis as an agent on the date of check in. Segment revenue of air ticketing segment is measured on a net basis except for the sale of airline tickets where the Group assumes inventory risks in which case it is measured on a gross basis.
MAKEMYTRIP LIMITED
NOTES TO THE CONSOLIDATED FINANCIAL STATEMENTS — (Continued)
Service cost includes cost of airline tickets, amounts paid to hotels and other service providers. Operating expenses other than service cost have not been allocated to the operating segments and are treated as unallocated/ common expenses. For the purposes of the CODM review, the measure of segment revenue as reduced by service cost is a key operating metric, which is sufficient to assess performance and make resource allocation decisions.
MAKEMYTRIP LIMITED
NOTES TO THE CONSOLIDATED FINANCIAL STATEMENTS — (Continued)
Segment capital expenditure does not include cost incurred during the period to acquire property, plant and equipment, goodwill and intangible assets as they cannot be allocated to segments and is not reviewed by the CODM.
Segment assets do not include property, plant and equipment, goodwill, intangible assets, trade and other receivables, term deposits, current tax assets, corporate assets, other current assets and other non-current assets as they cannot be allocated to segments and are not reviewed by the CODM.
Segment liabilities do not include trade and other payables, employee benefits, accrued expenses, deferred income, embedded derivatives, loans and borrowings and other liabilities as they cannot be allocated to segments and are not reviewed by the CODM.
| (s) | New Accounting Standards and Interpretations Not Yet Adopted |
IFRS 9 ‘Financial Instruments’, is part ofFinancial Instruments:In November 2009, the IASB’s wider project to replace IAS 39 ‘FinancialInternational Accounting Standards Board issued IFRS 9, Financial Instruments: Recognition and Measurement’.Measurement, to reduce the complexity of the current rules on financial instruments as mandated in IAS 39. IFRS 9 retains but simplifies the mixed measurement modelhas fewer classification and establishes two primary measurement categories as compared to IAS 39 and has eliminated the categories of held to maturity, available for financial assets, amortized costsale and fair value. The basisloans and receivables. Further it eliminates the rule-based requirement of classification depends on the entity’s business modelsegregating embedded derivatives and the contractual cash flow characteristics of the financial asset. The effective datetainting rules pertaining to held to maturity investments. For an investment in an equity instrument which is not held for trading, IFRS 9 is annual periods beginningpermits an irrevocable election, on or after January 1, 2015 with early adoption permitted. The Group is ininitial recognition, on an individual share-by-share basis, to present all fair value changes from the process of evaluating the impact of the new standard.
IFRS 10, ‘Consolidated Financial Statements’, which replaces parts of IAS 27, ‘Consolidated and Separate Financial Statements and all of SIC-12, ‘Consolidation – Special Purpose Entities’, builds on existing principles by identifying the concept of control as the determining factor in whether an entity should be included within the consolidated financial statements of the parent company. IFRS 10 is effective for annual periods beginning on or after January 1, 2013. The Group is evaluating the impact of IFRS 10 on the Group’s consolidated financial statements. The remainder of IAS 27, ‘Separate Financial Statements’, now contains accounting and disclosure requirements for investments in subsidiaries, joint ventures and associates only when an entity prepares separate financial statements and is therefore not applicable in preparing the Group’s consolidated financial statements.
IFRS 12, ‘Disclosure of Interest in Other Entities’, is a new and comprehensive standard on disclosure requirements for all forms of interestsinvestment in other entities, including joint arrangements, associates, special purpose vehicles and other off balance sheet vehicles. The standard includes disclosure requirements for entities covered under IFRS 10 and IFRS 11. IFRS 12 is effective for annual periods beginning on or after January 1, 2013. The Group is evaluating the impact of IFRS 12 on the Group’s consolidated financial statements.
IFRS 13, ‘Fair Value Measurement’, provides guidance on how fair value should be applied where its use is already required or permitted by other standards within IFRS, including a precise definition of fair value and a single source of fair value measurement and disclosure requirements for use across IFRS. IFRS 13 is effective for annual periods beginning on or after January 1, 2013. The Group is evaluating the impact of IFRS 13 on the Group’s consolidated financial statements.
IAS 1 (Amended) Presentation of Financial Statements: In June 2011, the International Accounting Standard Board published amendments to IAS 1 Presentation of Financial Statements. The amendments to IAS 1 Presentation of Financial Statements require companies preparing financial statementscomprehensive income. No amount recognized in accordance with IFRS to group items within other comprehensive income that maywould ever be reclassified to the profit or loss separately from those items which would not be recyclableloss. IFRS, 9 was further amended in October 2010, and such amendment introduced requirements on accounting for financial liabilities. This amendment addresses the issue of volatility in the profit or loss sectiondue to changes in the fair value of an entity’s own debt. It requires the entity, which chooses to measure a liability at fair value, to present the portion of the income statement. It also requiresfair value change attributable to the tax associated with items presented before taxentity’s own credit risk in the other comprehensive income. The effective date for companies to be shown separately for eachadopt IFRS 9 has not yet been determined. The group is currently evaluating the requirements of IFRS 9, and has not yet determined the impact on the consolidated financial statements.
Amendments to IAS 32 Offsetting Financial Assets and Financial Liabilities:In December 2011, the International Accounting Standards Board issued amendments to IAS 32, Offsetting Financial Assets and Financial Liabilities. The amendments clarify that:
an entity currently has a legally enforceable right to set-off if that right is
not contingent on a future event; and
enforceable both in the normal course of business and in the event of default, insolvency or bankruptcy of the two groups of other comprehensive income items (without changingentity and all counterparties;
gross settlement is equivalent to net settlement if and only if the option to present items of other comprehensive income either before taxgross settlement mechanism has features that:
eliminate or net of tax).result in insignificant credit and liquidity risk; and
process receivables and payables in a single settlement process or cycle.
MAKEMYTRIP LIMITED
NOTES TO THE CONSOLIDATED FINANCIAL STATEMENTS — (Continued)
The group is required to adopt amendments also reaffirm existing requirements that items in other comprehensive income and profit or loss should be presented as either a single statement or two consecutive statements. This amendment is applicable to annual periods beginning on or after JulyIAS 32 by accounting year commencing April 1, 2012, with early adoption permitted. The Group is evaluating the impact of IAS 1 (Amended) on the Group’s consolidated financial statements.
IAS 19 (Amended) Employee Benefits: In June 2011, International Accounting Standards Board issued IAS 19 (Amended), Employee Benefits. The effective date for adoption of IAS 19 (Amended) is annual periods beginning on or after January 1, 2013, though early adoption is permitted.
IAS 19 (Amended) has eliminated an option to defer the recognition of gains and losses through re-measurements and requires such gain or loss to be recognized through other comprehensive income in the year of occurrence to reduce volatility. The amended standard requires immediate recognition of effects of any plan amendments. Further, it also requires expected return on plan assets recognized in profit or loss to be restricted to government bond yields or corporate bond yields, considered for valuation of Projected Benefit Obligation, irrespective of actual portfolio allocations. The actual return from the portfolio in excess of or less than such yields is recognized through other comprehensive income.
These amendments enhance the disclosure requirements for defined benefit plans by requiring information about the characteristics of defined benefit plans and risks that entities are exposed to through participation in those plans.
The amendments need to be adopted retrospectively.2014. The group is currently evaluatinghas evaluated the requirements of amendments to IAS 19 (Amended),32 and hasthese are not yet determined theexpected to have a material impact on the consolidated financial statements.
| 4) | DETERMINATION OF FAIR VALUES |
A number of the Group’sgroup’s accounting policies and disclosures require the determinationmeasurement of fair value,values, for both financial and non-financial assets and liabilities.
The group has an established control framework with respect to the measurement of fair values. This includes a valuation team that has overall responsibility for overseeing all significant fair value measurements, including level 3 fair values, and reports directly to the Group Chief Financial Officer.
The valuation team regularly reviews significant unobservable inputs and valuation adjustments.
Significant valuation issues are reported to the group Audit committee.
When measuring the fair value of an asset or a liability, the group uses market observable data as far as possible. Fair values have been determined for measurement and / or disclosure purposesare categorized into different levels in a fair value hierarchy based on the following methods. inputs used in the valuation techniques as follows:
| • | Level 1:quoted prices (Unadjusted) in active markets for identical assets or liabilities. |
| • | Level 2: Inputs other than quoted prices included in level 1 that are observable for the asset or liability, either directly (i.e. as prices) or indirectly (i.e. derived from prices) |
| • | Level 3:Inputs for the assets or liability that are not based on observable market data. (Unobservable Inputs) |
If the inputs used to measure the fair value of an asset or a liability might be categorized in different levels of the fair value hierarchy, then the fair value measurement is categorized in its entirety in the same level of the fair value hierarchy as the lowest level input that is significant to the entire management.
When applicable, further information about the assumptions made in determining fair values is disclosed in the notes specific to that asset or liability.
| a) | Property, Plant and Equipment |
The fair value of property, plant and equipment recognized as a result of a business combination is the estimated amount for which a property could be exchanged on the date of acquisition between a willing buyer and a willing seller in an arm’s length transaction after proper marketing wherein the parties had each acted knowledgeably. The fair value of items of property, plant and equipment is based on the market approach and cost approaches using the quoted market prices for similar items when available and depreciated replacement cost when appropriate. Depreciated replacement cost reflects adjustments for physical deterioration as well as functional and economic obsolescence.
| b) | Intangible Assets |
The fair value of trademark and brand name acquired in a business combination is based on the discounted estimated royalty payments that have been avoided as a result of the trademark / brand name being owned. The fair value of customer relationships acquired in a business combination is determined using the multi-period excess earnings method, whereby the subject asset is valued after deducting a fair return on all other assets that are part of creating the related cash flows. The fair value of non-compete agreements acquired in a business combination is determined using the comparative income differential method. The fair value of website acquired in a business combination is determined using the replacement cost method.
MAKEMYTRIP LIMITED
NOTES TO THE CONSOLIDATED FINANCIAL STATEMENTS — (Continued)
The fair value of other intangible assets is based on the discounted cash flows expected to be derived from the use and eventual sale of the assets.
| c) | Non Derivative Financial Liabilities |
Fair value, which is determined for disclosure purposes, is calculated based on the present value of future principal and interest cash flows, discounted at the market rate of interest at the reporting date. In respect of the liability component of convertible and redeemable preference shares, the market rate of interest is determined by reference to the similar liabilities that do not have a conversion option. For finance leases, the market rate of interest is determined by reference to similar lease agreements.
| d) | Share Based Payment Transactions |
The fair value of the employee share optionsawards is measured using the Black-Scholes formula. Measurement inputs include share price on grant date, exercise price of the instrument, expected volatility (based on weighted average historic volatility adjusted for changes expected due to publicly available information), weighted average expected life of the instruments (based on historical experience and general behavior of the option holder), expected dividends and the risk-free interest rate (based on government bonds). Service and non-market performance conditions attached to the transactions are not taken into account in determining fair value.
| e) | Trade and other Receivables |
The fair value of trade and other receivables is estimated as the present value of future cash flows, discounted at the market rate of interest at the reporting date. The fair value is determined for disclosure purposes only.
| f) | Separable Embedded Derivative |
The fair value of the separable embedded derivative in its preference share capital is measured using the binomial lattice model. Measurement inputs include share price on measurement date, expected term of the instrument, anti dilution price of different class of convertible and redeemable preference shares, risk free rate (based on government bond), expected volatility (based on weighted average historic volatility adjusted for changes expected due to publicly available information), probability of raising funds, probability of raising funds from IPO or private placement, probability of conversion or redemption of the convertible and redeemable preference shares.
The fair value of the separable embedded derivative in its investment in equity-accounted investees is measured using the black-scholes model. Measurement inputs include share price, exercise price, volatility, interest rate and expected term.
| g) | Equity Securities |
The fair value of equity securities is determined using a valuation technique. Valuation techniques employed include market multiples and discounted cash flows analysis using expected future cash flows and a market related discount rate.
MAKEMYTRIP LIMITED
NOTES TO THE CONSOLIDATED FINANCIAL STATEMENTS — (Continued)
| 5) | FINANCIAL RISK MANAGEMENT |
Overview
In the normal course of its business, the Group is exposed to liquidity, credit and market risk (interest rate and foreign currency risk).
Liquidity Risk
Liquidity risk is the risk that the Group will encounter difficulty in meeting the obligations associated with its financial liabilities that are settled by delivering cash or another financial asset. The Group’s approach to managing liquidity is to ensure, as far as possible, that it will always have sufficient liquidity to meet its liabilities when due, under both normal and stressed conditions, without incurring unacceptable losses or risk to the Group’s reputation.
MAKEMYTRIP LIMITED
NOTES TO THE CONSOLIDATED FINANCIAL STATEMENTS — (Continued)
To ensure smooth operations, the Group has invested surplus funds in term deposits with banks and has taken overdraft facility against them.
Credit Risk
The Group’s exposure to credit risk is limited, as its customer base consists of a large number of customers and the majority of its collections from customers are made on an upfront basis at the time of consummation of the transaction. There is limited credit risk on sales made to corporate customers, incentives due from the airlines and its Global Distribution System (GDS) provider. The Group has not experienced any significant default in recovery from such customers.
Additionally, the Group places its cash and cash equivalents and term deposits with banks with high investment grade ratings, limits the amount of credit exposure with any one bank and conducts ongoing evaluation of the credit worthiness of the banks with which it does business. Given the high credit ratings of these financial institutions, the Group does not expect these financial institutions to fail in meeting their obligations. The maximum exposure to credit risk is represented by the carrying amount of each financial asset.
Foreign Currency Risk
The Group incurs foreign currency risk primarily in respect of revenue denominated in a currency other than the functional currency of MakeMyTrip (India) Private Limited (Indian subsidiary)(MMT India) and Hotel Travel Group (HT Group), in which the transaction takes place. On a consolidated basis, the Group is primarily exposed to foreign currency fluctuations between the USD and INR. INR, being the functional currency of its Indian subsidiary.MMT India and between the EUR and USD, being the functional currency of HT Group. The Group’s exposure to foreign currency risk was based on the following amounts as at the reporting dates (in equivalent USD).
Approximately 11.06%2.85% of the Group’s revenues generated by its Indian subsidiary for the fiscal year ended March 31, 20122014 (March 31, 2011: 7.19%2013: 3.82% and March 31, 2010: 9.13%2012: 4.42%) were generated outside India and were received in USD.
The Group currently does not have hedging or similar arrangements with any counter-party to cover its foreign currency exposure fluctuations in foreign exchange rates.
MAKEMYTRIP LIMITED
NOTES TO THE CONSOLIDATED FINANCIAL STATEMENTS — (Continued)
Interest Rate Risk
A majority of the financing of the Group has come from a mix of ordinary or convertible and redeemable preference shares with nominal dividends, proceeds from public offerings and an overdraft facility with banks. The interest rates on the overdraft facility availed by the Group are marginally higher than the interest rates on term deposits with the banks. Accordingly, there is limited interest rate risk. The Group’s investments in term deposits with bank are for short duration, and therefore do not expose the Company to significant interest ratesrate risk.
MAKEMYTRIP LIMITED
NOTES TO THE CONSOLIDATED FINANCIAL STATEMENTS — (Continued)
Market and Operational Risk
The Group is dependent on its ability to maintain existing and new arrangements with its suppliers. Adverse changes in existing relationships, increasing industry consolidation or Group’s inability to enter into new arrangements with these parties on favorable terms, if at all, could reduce the amount, quality, pricing and breadth of travel products and services that Group is able to offer, which in turn could adversely affect the Group’s business and financial performance.
The Indian travel market is intensely competitive. Factors affecting the Group’s competitive success include, among others: price, availability and breadth of travel products, ability to package and customize travel products, brand recognition, customer service and customer care, service fees, ease of use, accessibility and reliability. If the Group is not able to compete effectively on any of these factors, the Group’s business and results of operations may be adversely affected.
The Group’s business and financial performance are affected by the health of the Indian as well as worldwide travel industry, including changes in supply and pricing. Events specific to the air travel industry that could negatively affect the Group’s business include continued fare increases, travel-related strikes or labor unrest, fuel price volatility. The Group is also affected by economic conditions worldwide and in India, as poor economic conditions generally result in a reduction in travel volumes.
MAKEMYTRIP LIMITED
NOTES TO THE CONSOLIDATED FINANCIAL STATEMENTS — (Continued)
| 6) | OPERATING SEGMENTS |
The Group has two reportable segments, as described below, which are the Group’s Lines of Business (LoBs). The LoBs offer different products and services, and are managed separately because the nature of products and method used to distribute the services are different. For each of these LoBs, the Group’s Leadership team comprising of Group Chief Executive Officer, Chief Financial and OperatingExecutive Officer- India, Group Chief Commercial Officer, Chief Marketing Officer, Chief Innovation Officer,Group Chief Products Officer, Senior Vice PresidentGroup Chief Technology Officer, Group Chief Business Officer – Technology, Senior Vice President – Out Bound Tours, Senior Vice President – Domestic PackagesHolidays, and Senior Vice President – Human ResourcesGroup Chief Financial Officer, reviews internal management reports. Accordingly, the Leadership team is construed to be the Chief Operating Decision Maker (CODM). LoBs assets, liabilities and expenses (other than service cost) are reviewed on an entity-wide basis by the CODM, and hence are not being allocated to these LoBs. Segment revenue less service cost from each LoB are reported and reviewed by the CODM on a monthly basis.
The following summary describes the operations in each of the Group’s reportable segments:
1. Air ticketing: Primarily through an internet based platform, provides the facility to book international and domestic air tickets.
2. Hotels and packages: Through an internet based platform, call-centers and branch offices, provides holiday packages and hotel reservations.
Other operations primarily include the advertisement income from hosting advertisements on its internet web-sites and pay for facilitating website access to a travel insurance company. This segment does not meet any of the quantitative thresholds to be a reportable segment for any of the years presented in these consolidated financial statements.
Until June 30, 2010, for internal reporting purposes, the revenue related to airline tickets issued as a component of a Company developed tour and package is assigned to the air ticketing segment. Revenue in this segment is recorded on a net basis for internal reporting purposes. For the external reporting, such revenue is recorded on a gross basis. Effective July 1, 2010, the Company has changed the composition of its reportable segments. For internal reporting purposes, the revenue related to airline tickets issued as a component of a Company developed tour and package has been assigned to the hotels and packages segment and is recorded on a gross basis.
FollowingOther operations primarily include the advertisement income from hosting advertisements on its internet web-sites, income from sale of rail and bus tickets and income from facilitating website access to a changetravel insurance company. The operations do not meet any of the quantitative thresholds to be a reportable segment for any of the periods presented in the composition of its reportable segments, the Company has restated the corresponding items of segment information for earlier periods.these consolidated financial statements.
MAKEMYTRIP LIMITED
NOTES TO THE CONSOLIDATED FINANCIAL STATEMENTS — (Continued)
Information About Reportable Segments Reclassification:Segments:
| For the Year Ended March 31 | For the Year Ended March 31 | |||||||||||||||||||||||||||||||||||||||||||||||||||||||||||||||||||||||||||||||||||||||||||||||
| Air ticketing | Hotels and packages | Others | Total | Air ticketing | Hotels and packages | Others | Total | |||||||||||||||||||||||||||||||||||||||||||||||||||||||||||||||||||||||||||||||||||||||||
Particulars | 2010 | 2011 | 2012 | 2010 | 2011 | 2012 | 2010 | 2011 | 2012 | 2010 | 2011 | 2012 | 2012 | 2013 | 2014 | 2012 | 2013 | 2014 | 2012 | 2013 | 2014 | 2012 | 2013 | 2014 | ||||||||||||||||||||||||||||||||||||||||||||||||||||||||||||||||||||||||
| (in USD) | (in USD) | |||||||||||||||||||||||||||||||||||||||||||||||||||||||||||||||||||||||||||||||||||||||||||||||
External revenues | 32,119,488 | 47,622,719 | 76,190,303 | 50,287,896 | 74,557,976 | 116,701,137 | 1,152,822 | 2,540,692 | 3,707,818 | 83,560,206 | 124,721,387 | 196,599,258 | ||||||||||||||||||||||||||||||||||||||||||||||||||||||||||||||||||||||||||||||||||||
Revenues | 76,190,303 | 60,888,851 | 66,523,174 | 116,701,137 | 164,129,318 | 184,500,736 | 3,707,818 | 3,803,776 | 4,350,701 | 196,599,258 | 228,821,945 | 255,374,611 | ||||||||||||||||||||||||||||||||||||||||||||||||||||||||||||||||||||||||||||||||||||
|
|
|
|
|
|
|
|
|
|
|
|
|
|
|
|
|
|
|
|
|
|
|
| |||||||||||||||||||||||||||||||||||||||||||||||||||||||||||||||||||||||||
Total segment revenue | 32,119,488 | 47,622,719 | 76,190,303 | 50,287,896 | 74,557,976 | 116,701,137 | 1,152,822 | 2,540,692 | 3,707,818 | 83,560,206 | 124,721,387 | 196,599,258 | 76,190,303 | 60,888,851 | 66,523,174 | 116,701,137 | 164,129,318 | 184,500,736 | 3,707,818 | 3,803,776 | 4,350,701 | 196,599,258 | 228,821,945 | 255,374,611 | ||||||||||||||||||||||||||||||||||||||||||||||||||||||||||||||||||||||||
Service cost | 985,482 | — | 9,939,556 | 42,292,226 | 63,650,910 | 98,474,788 | — | — | — | 43,277,708 | 63,650,910 | 108,414,344 | 9,939,556 | 4,119,631 | 4,471,703 | 98,474,788 | 136,537,143 | 144,507,848 | — | — | — | 108,414,344 | 140,656,774 | 148,979,551 | ||||||||||||||||||||||||||||||||||||||||||||||||||||||||||||||||||||||||
|
|
|
|
|
|
|
|
|
|
|
|
|
|
|
|
|
|
|
|
|
|
|
| |||||||||||||||||||||||||||||||||||||||||||||||||||||||||||||||||||||||||
Segment revenue less service cost | 31,134,006 | 47,622,719 | 66,250,747 | 7,995,670 | 10,907,066 | 18,226,349 | 1,152,822 | 2,540,692 | 3,707,818 | 40,282,498 | 61,070,477 | 88,184,914 | 66,250,747 | 56,769,220 | 62,051,471 | 18,226,349 | 27,592,175 | 39,992,888 | 3,707,818 | 3,803,776 | 4,350,701 | 88,184,914 | 88,165,171 | 106,395,060 | ||||||||||||||||||||||||||||||||||||||||||||||||||||||||||||||||||||||||
Other income | �� | — | — | 1,312,299 | ||||||||||||||||||||||||||||||||||||||||||||||||||||||||||||||||||||||||||||||||||||||||||||
Personnel expenses | (16,562,034 | ) | (14,399,040 | ) | (26,520,745 | ) | (26,520,745 | ) | (34,520,455 | ) | (37,220,798 | ) | ||||||||||||||||||||||||||||||||||||||||||||||||||||||||||||||||||||||||||||||||||||
Other operating expenses | (28,160,506 | ) | (40,698,895 | ) | (54,868,655 | ) | (54,868,655 | ) | (67,953,977 | ) | (80,116,006 | ) | ||||||||||||||||||||||||||||||||||||||||||||||||||||||||||||||||||||||||||||||||||||
Depreciation and amortization | (1,569,747 | ) | (1,910,637 | ) | (2,790,154 | ) | ||||||||||||||||||||||||||||||||||||||||||||||||||||||||||||||||||||||||||||||||||||||||||
Depreciation and amortisation | (2,790,154 | ) | (3,752,743 | ) | (5,692,145 | ) | ||||||||||||||||||||||||||||||||||||||||||||||||||||||||||||||||||||||||||||||||||||||||||
Finance income | 1,874,177 | 1,601,750 | 1,987,904 | 1,987,904 | 4,197,603 | 2,441,764 | ||||||||||||||||||||||||||||||||||||||||||||||||||||||||||||||||||||||||||||||||||||||||||
Finance costs | (2,062,947 | ) | (3,525,685 | ) | (4,957,097 | ) | ||||||||||||||||||||||||||||||||||||||||||||||||||||||||||||||||||||||||||||||||||||||||||
Finance cost | (4,957,097 | ) | (4,939,526 | ) | (7,775,731 | ) | ||||||||||||||||||||||||||||||||||||||||||||||||||||||||||||||||||||||||||||||||||||||||||
Share of loss of equity-accounted investee | — | — | (65,957 | ) | (65,957 | ) | (186,130 | ) | (171,487 | ) | ||||||||||||||||||||||||||||||||||||||||||||||||||||||||||||||||||||||||||||||||||||||
|
|
|
|
|
| |||||||||||||||||||||||||||||||||||||||||||||||||||||||||||||||||||||||||||||||||||||||||||
Profit (Loss) before tax | (6,198,559 | ) | 2,137,970 | 970,210 | 970,210 | (18,990,057 | ) | (20,827,044 | ) | |||||||||||||||||||||||||||||||||||||||||||||||||||||||||||||||||||||||||||||||||||||||
|
|
|
|
|
| |||||||||||||||||||||||||||||||||||||||||||||||||||||||||||||||||||||||||||||||||||||||||||
Assets and liabilities are used interchangeably between segments and these have not been allocated to the reportable segments.
MAKEMYTRIP LIMITED
NOTES TO THE CONSOLIDATED FINANCIAL STATEMENTS — (Continued)
Geographical Information:
The air ticketing and hotel and packages segments are managed on a worldwide basis from India, the U.S., the Netherlands, Singapore, Malaysia and Malaysia.Thailand. In presenting information on the basis of geographical segments, segment revenue is based on the geographical location of customers. Segment assets are based on the geographical location of the assets.
| Revenue | Non-Current Assets* | Revenue | Non-Current Assets* | |||||||||||||||||||||||||||||||||||||
| For the year ended March 31 | As at March 31 | For the Year Ended March 31 | As at March 31 | |||||||||||||||||||||||||||||||||||||
| 2010 | 2011 | 2012 | 2011 | 2012 | 2012 | 2013 | 2014 | 2013 | 2014 | |||||||||||||||||||||||||||||||
| Particulars | (in USD) | (in USD) | ||||||||||||||||||||||||||||||||||||||
India | 79,173,117 | 115,753,388 | 162,743,607 | 10,319,570 | 21,967,050 | 175,791,993 | 195,998,581 | 212,577,192 | 16,657,561 | 22,563,959 | ||||||||||||||||||||||||||||||
United States | 4,387,089 | 8,967,999 | 21,735,996 | 690,137 | 555,553 | 8,687,610 | 8,740,772 | 7,287,044 | 816,568 | 645,850 | ||||||||||||||||||||||||||||||
Singapore | — | — | 12,093,348 | — | 3,623,020 | 12,093,348 | 17,282,977 | 11,997,442 | 3,406,498 | 3,316,668 | ||||||||||||||||||||||||||||||
Thailand | — | 4,023,799 | 11,150,155 | 4,749,821 | 2,889,032 | |||||||||||||||||||||||||||||||||||
Malaysia | — | — | 26,307 | — | 66,219 | 26,307 | 2,529,756 | 9,801,865 | 20,732,980 | 20,844,562 | ||||||||||||||||||||||||||||||
Netherlands | — | — | 1,461,230 | — | 6,056,174 | |||||||||||||||||||||||||||||||||||
Mauritius | — | 83,404 | — | 83,404 | 75,083,404 | |||||||||||||||||||||||||||||||||||
Others | — | 162,656 | 1,099,683 | 3,598 | 3,942 | |||||||||||||||||||||||||||||||||||
|
|
|
|
|
|
|
|
|
| |||||||||||||||||||||||||||||||
Total | 83,560,206 | 124,721,387 | 196,599,258 | 11,009,707 | 26,211,842 | 196,599,258 | 228,821,945 | 255,374,611 | 46,450,430 | 131,403,591 | ||||||||||||||||||||||||||||||
|
|
|
|
|
|
|
|
|
| |||||||||||||||||||||||||||||||
| * | Non-current assets presented above do not include investment in equity-accounted investee, other |
Major Customers:
Considering the nature of business, customers normally include individuals. Further, none of the corporate and other customers would account for more than 10% or more of the Group’s revenues.
Assets classified as held for sale includes:
| As at March 31 | ||||||||
| 2011 | –2012 | |||||||
| Particulars | (in USD) | |||||||
Property, plant and equipment | — | 404,109 | ||||||
|
|
|
| |||||
Total | — | 404,109 | ||||||
|
|
|
| |||||
MAKEMYTRIP LIMITED
NOTES TO THE CONSOLIDATED FINANCIAL STATEMENTS — (Continued)
| BUSINESS COMBINATIONS |
| a) | Acquisition of Luxury Tours & Travel Pte Ltd. |
On May 9, 2011, MakeMyTrip Limited (MMYT) acquired approximately 79% equity interest in Luxury Tours & Travel Pte Limited (LTT), a Singapore registered and licensed travel agency, engaged in the business of providing hotel reservations, excursion tours and other related services to inbound and outbound travelers in Singapore and the region. The business acquisition was conducted by entering into a Share Purchase Agreement (SPA) for a cash consideration of USD 3,228,670, subject to adjustment based on closing date net working capital. The total purchase price of the acquisition, net of USD 554,660 of cash acquired is USD 2,371,732. As per the terms of the acquisition with sellers, the purchase consideration is comprised of the following::
| (in USD) | ||||
| 3,228,670 | |||
Net working capital adjustment | (302,278 | ) | ||
|
| |||
Total purchase price | 2,926,392 | |||
|
| |||
The total amount paid by the Company, net of cash acquired of USD 554,660, as of the balance sheet date is USD 2,446,455. As a result, an amount of USD 74,723 representing excess of cash paid over purchase consideration has been accounted for as an amount recoverable from the seller and has been disclosed under “Other current assets” in the consolidated statements of financial position. Through this acquisition, MMYT intends to build a position of strength in the Southeast Asia region through strong relationships with local hotels. With the stronger local presence, the Company would be able to deliver greater value and enhanced customer service to its customers. Consequently, the excess of the purchase consideration paid over the fair value of the assets acquired has been accounted for as goodwill.
The operations of LTT have been consolidated in the financial statements of the Group from May 9, 2011. In the year ended March 31, 2012, LTT contributed revenue of USD 11,925,488 and loss of USD 758,521 to the Group’s result.
If the acquisition had occurred on April 1, 2011, management estimates that consolidated revenue would have been USD 197,966,346 and consolidated profit for the year would have been USD 6,852,297. This unaudited pro-forma information is not necessarily indicative of the results of operations that would have occurred had the acquisitions been made at the beginning of the period.
The acquisition has beenwas accounted for under the acquisition method of accounting in accordance with IFRS 3 “Business Combinations”. The assets and liabilities of LTT were recorded at fair value at the date of acquisition. The Company has completed its evaluation of certain assets and liabilities during the quarter ended March 31, 2012, as new information was obtained about facts and circumstances that existed as of the acquisition date, resulting in an adjustment of USD 5,039 to goodwill.
The purchase price has been allocated based on management’s estimates and an independent appraisal of fair values as follows:
| (in USD) | ||||
Property, plant and equipment | 195,294 | |||
Intangible assets | 854,319 | |||
Current assets and liabilities, net | (302,278 | ) | ||
Loans and borrowings | (267,446 | ) | ||
Deferred tax liabilities | (94,681 | ) | ||
|
| |||
Total identifiable net assets assumed | 385,208 | |||
Non-controlling interest | (79,487 | ) | ||
Goodwill | 2,620,671 | |||
|
| |||
Total purchase price | 2,926,392 | |||
|
| |||
None of the Goodwill recognised is expected to be deductible for income tax purposes.
The fair value of the current assets acquired includesincluded trade receivable with a fair value of USD 1,129,126.
MMYT further invested USD 812,062 during the fiscal year ended March 31, 2012 for the subscription of 49,603 new equity shares issued by LTT increasing its ownership from 79.36% to 82.78%. Further, in August 2012, MMYT acquired the remaining shares held by a shareholder of LTT for USD 792,982 in cash, increasing its ownership to 100%. (Also refer Note 26).
MAKEMYTRIP LIMITED
NOTES TO THE CONSOLIDATED FINANCIAL STATEMENTS — (Continued)
| b) | Acquisition of Hotel Travel Group |
On November 6, 2012, MMYT acquired 100% stake in the companies in the ‘Hotel Travel Group’ (HT Group). HT Group, with the brand ‘Hotel Travel’ and the websitewww.hoteltravel.com, is a well-established travel company in South East Asia and has its presence in Thailand, Singapore and Malaysia, where it has operating history of over a decade. The business acquisition was conducted by entering into a Share Purchase Agreement (SPA) for a total initial consideration payable to the Promoters of the HT Group of USD 25 million, subject to a balance sheet adjustment.
As per the terms of acquisition with sellers, the purchase consideration comprises of the following:
| (in USD) | ||||
Consideration transferred | ||||
Cash | 10,000,000 | |||
Equity instruments (209,050 ordinary shares) | 2,347,947 | |||
Deferred consideration | 4,418,248 | |||
| 16,766,195 | ||||
Equity instruments issued
MMYT agreed to pay the selling shareholders USD 5 million in the form of equity shares of MMYT. MMYT made payment of USD 3.3 million after making adjustment for a portion of estimated balance sheet adjustment on the date of acquisition in the form of equity shares of MMYT. The fair value of the ordinary shares issued was based on the market share price of the Company on November 6, 2012 and after making adjustment for certain selling restrictions.
Deferred consideration
MMYT also agreed to pay the selling shareholders over a three years period ending December 2015, additional consideration of USD 10 million in the form of variable number of equity shares of MMYT subject to final balance sheet adjustment. MMYT included USD 4,418,248 as deferred consideration related to the additional consideration, which represents its fair value at the acquisition date, using a discount rate of 13 percent. At March 31, 2014, the deferred consideration has increased to USD 5,314,042.
Earn-out consideration
Further, two of the selling shareholders of the HT Group continued in employment with the HT Group in key capacities, and were eligible for additional earn outs and incentives over a three-four years period ending December 2015/December 2016 based on HT Group meeting certain revenue and EBIDTA targets. The additional earn out payment may range from NIL to USD 35 million and are payable partly in cash and partly in the form of equity shares of MMYT. These amounts will be recorded as compensation cost over the earn-out period.
During the quarter ended December 31, 2013, due to a change in the probability of achievement of the earn-out targets, the compensation cost of USD 660,383 recorded till September 30, 2013 was reversed. Also, subsequently in January 2014, the services of the two selling shareholders were terminated in accordance with the non-performance clause as per the share purchase agreement.
Through this acquisition, MMYT intends to further strengthen its presence in hotel and holidays segment in India and South East Asia. Consequently, the excess of the purchase consideration paid over the fair value of the assets acquired has been accounted for as goodwill.
MAKEMYTRIP LIMITED
NOTES TO THE CONSOLIDATED FINANCIAL STATEMENTS — (Continued)
The operations of HT Group have been consolidated in the financial statements of the Group from November 6, 2012. In the year ended March 31, 2013, HT Group contributed revenue of USD 2,183,225 and loss of USD 2,601,814 to the Group’s result.
If the acquisition had occurred on April 1, 2012, management estimates that consolidated revenue would have been USD 232,664,632 and consolidated loss for the year ended March 31, 2013 would have been USD 29,183,264. This unaudited pro-forma information is not necessarily indicative of the results of operations that would have occurred had the acquisitions been made at the beginning of the period.
The acquisition has been accounted for under the acquisition method of accounting in accordance with IFRS 3 “Business Combinations”. The assets and liabilities of HT Group were recorded at fair value at the date of acquisition. The Company has completed its evaluation of certain assets and liabilities during the quarter ended December 31, 2013, as new information was obtained about facts and circumstances that existed as of the acquisition date, resulting in an adjustment of USD 78,755 to goodwill.
The purchase price has been allocated based on management’s estimates and an independent appraisal of fair values as follows:
| (in USD) | ||||
Property, plant and equipment | 1,597,710 | |||
Intangible assets | 11,892,182 | |||
Current assets and liabilities, net | (6,301,390 | ) | ||
Loans and borrowings | (47,328 | ) | ||
Total identifiable net assets assumed | 7,141,174 | |||
Goodwill | 9,625,021 | |||
Total purchase price | 16,766,195 | |||
None of the Goodwill recognised is expected to be deductible for income tax purposes.
The fair value of the current assets acquired includes trade receivable with a fair value of USD 533,227.
| c) | Acquisition of majority interest in ITC Group |
On November 26, 2012, MMYT acquired majority equity stake in a group of companies known as the “ITC Group”. The ITC Group comprises of International Tour Center Co., Ltd., ITC Bangkok Co., Ltd. and ITC South Co., Ltd. ITC Group is a well-established hotel aggregator and tour operator for Thailand. The ITC Group has relationships with a number of hotels and other local vendors in Thailand to provide hotel reservations, excursion tours and other travel related services for inbound and outbound travelers in Thailand and the South East Asia region. The business acquisition was conducted by entering into the Share Purchase Agreement (SPA) for a cash consideration of USD 2.2 million to the existing shareholders for the sale of their shares in the ITC Group and for USD 1 million for the subscription of new shares in the ITC Group.
As per the terms of acquisition with sellers, the purchase consideration is comprised of:
| (in USD) | ||||
Cash consideration | 3,200,000 | |||
Net working capital adjustment | (1,249,502 | ) | ||
Total purchase price | 1,950,498 | |||
MAKEMYTRIP LIMITED
NOTES TO THE CONSOLIDATED FINANCIAL STATEMENTS — (Continued)
Through this acquisition, MMYT will further expand its presence in Thailand, a key market for its outbound holiday’s business, by establishing more direct hotel relationships in the country. MMYT believes that these developments are positioning travel and tourism to Thailand for strong growth by making travel to the country easily accessible and affordable to the middle class in India. Consequently, the excess of the purchase consideration paid over the fair value of assets acquired has been accounted for as goodwill.
The operations of ITC Group have been consolidated in the financial statements of the Group from November 26, 2012. In the year ended March 31, 2013, ITC Group contributed revenue of USD 4,023,799 and profit of USD 224,360 to the Group’s result.
If the acquisition had occurred on April 1, 2012, management estimates that consolidated revenue would have been USD 234,418,721 and consolidated loss for the year ended March 31, 2013 would have been USD 28,394,683. This unaudited pro-forma information is not necessarily indicative of the results of operations that would have occurred had the acquisitions been made at the beginning of the period.
The acquisition has been accounted for under the acquisition method of accounting in accordance with IFRS 3 “Business Combinations”. The assets and liabilities of ITC Group were recorded at fair value at the date of acquisition. The Company has completed its evaluation of certain assets and liabilities during the quarter ended December 31, 2013, as new information was obtained about facts and circumstances that existed as of the acquisition date, resulting in no adjustment to goodwill.
The purchase price has been allocated based on management’s estimates and an independent appraisal of fair values as follows:
| (in USD) | ||||
Property, plant and equipment | 83,185 | |||
Intangible assets | 1,760,000 | |||
Current assets and liabilities, net | (59,253 | ) | ||
Loans and borrowings | (113,495 | ) | ||
Deferred tax liabilities | (404,800 | ) | ||
Total identifiable net assets assumed | 1,265,637 | |||
Non-controlling interest | (620,162 | ) | ||
Goodwill | 1,305,023 | |||
Total purchase price | 1,950,498 | |||
None of the Goodwill recognised is expected to be deductible for income tax purposes.
The fair value of the current assets acquired includes trade receivable with a fair value of USD 3,560,916.
MMYT will also acquire the remaining shares of LTTITC Group from the existing shareholdersshareholder (promoter) in cash for an estimated additional consideration of USD 870,934, which represents its fair value as at the acquisition date, in threefour equal tranches, over a threefour year earn-out period ending June 2014.December 2016. The earn-out will be based on valuation linked to future profitability of LTT.ITC Group and employment of promoter. The financial liability isin respect of acquisition of these shares has been recognised by debiting equity and disclosed under “Other currentnon-current liabilities” as per present access method of USD 1,801,496, which represents its fair value as at the acquisition date.
Further, an additional payment may be required for acquiring the remaining shares that can be forfeited due to termination of employment of the promoter. This potential additional liability, which is linked to the future profitability of ITC Group, will be recorded as compensation cost under IAS 19 for future services till December 2016 and “Other non-current liabilities”does not form part of additional consideration for acquiring the remaining shares. Based on the estimated projection, the company has not recorded any compensation cost associated with this liability during the year ended March 31, 2013 and 2014.
MAKEMYTRIP LIMITED
NOTES TO THE CONSOLIDATED FINANCIAL STATEMENTS — (Continued)
| d) | Acquisition of Easytobook (ETB) Group |
On February 06, 2014, MMYT acquired 100% equity stake in Easytobook Holding B.V. and its subsidiaries (“ETB Group”). ETB Group primarily operates through the websitewww.easytobook.com and offers its customers online hotel reservations in Europe, North America and other key global travel destinations. The ETB Group has unique front-end web design capabilities and has developed proprietary technologies for powering affiliate travel websites as well as dynamic shopping of various travel products. The ETB Group is headquartered in Amsterdam, Netherlands with a technology development team based in Herzliya, Israel.
The business acquisition was conducted by entering into the Share Purchase Agreement (SPA) for purchase consideration of USD 4,411,275. The total purchase price of the acquisition, net of USD 1,032,237 of cash acquired is USD 3,379,038.
As per the terms of acquisition with sellers, the purchase consideration comprises of the following:
| (in USD) | ||||
Consideration transferred | ||||
Cash | 3,252,908 | |||
Deferred consideration | 1,158,367 | |||
| 4,411,275 | ||||
Deferred consideration
MMYT has also agreed to pay additional consideration in three tranches over a three year period ending January 2017. MMYT has included USD 1,158,367 as deferred consideration related to the additional consideration, which represents its fair value at the acquisition date, using a discount rate of 13 percent. At March 31, 2014, the deferred consideration has increased to USD 1,202,418.
The acquisition of ETB Group is expected to further strengthen the existing travel technology stack of the Group and to enhance the international hotel room offerings for customers travelling overseas, particularly to Europe which is a key tourist destination for Indians, and vice versa. The excess of the fair value of assets acquired over the purchase consideration has been accounted for as bargain purchase gain in the consolidated statement of profit or loss and other comprehensive income (loss) for the year ended March 31, 2014 (refer note 11).
The operations of ETB Group have been consolidated in the financial statements of the Group from February 06, 2014. In the year ended March 31, 2014, ETB Group contributed revenue of USD 1,461,230 and loss of USD 889,872 to the Group’s result.
If the acquisition had occurred on April 1, 2013, management estimates that consolidated revenue would have been USD 267,862,006 and consolidated loss for the year ended March 31, 2014 would have been USD 24,800,321. This unaudited pro-forma information is not necessarily indicative of the results of operations that would have occurred had the acquisition been made at the beginning of the period.
The acquisition has been accounted for under the acquisition method of accounting in accordance with IFRS 3 “Business Combinations”. The assets and liabilities of ETB Group were recorded at fair value at the date of acquisition.
MAKEMYTRIP LIMITED
NOTES TO THE CONSOLIDATED FINANCIAL STATEMENTS — (Continued)
MMYTThe purchase price has further investedbeen allocated based on management’s estimates and an independent appraisal of fair values as follows:
| (in USD) | ||||
Property, plant and equipment | 141,430 | |||
Intangible assets | 5,730,271 | |||
Current assets and liabilities, net | (291,931 | ) | ||
Total identifiable net assets assumed | 5,579,770 | |||
Gain on bargain purchase | (1,168,495 | ) | ||
Total purchase price | 4,411,275 | |||
The fair value of the current assets acquired includes trade receivable with a fair value of USD 812,062 during the year for the subscription of 49,603 new equity shares issued by LTT.1,596,293.
The Group incurred acquisition related costs of USD 117,233134,416 relating to external legal fees and due diligence cost. These amounts have been included in other operating expenses in the consolidated statement of profit or loss and other comprehensive income.income (loss) for the year ended March 31, 2014.
| INVESTMENT IN EQUITY-ACCOUNTED INVESTEE |
In November 2011, the Company acquired 28.57% equity interest in My Guest House Accommodations Private Limited (MGH), which is engaged in the business of aggregation, sales and distribution of hotel room inventory with a special focus on budget lodging accommodations and serviced apartments. The Company paid cash consideration of $963,125USD 963,125 for the purchase of equity shares. Additionally, acquisition related expenses incurred by the Company amounted to $59,788. As per the agreement,USD 59,788.
In January 2013, the Company has entered into certain embedded option and forward agreements withacquired additional shares in MGH, andincreasing its promotersstake to make further investments based on achievement38.34% through equity infusion of certain milestones.USD 642,000, paid in cash.
Summary financial informationsinformation for equity accounted investee areis as follows:
As of March 31, 2012 | For the period November 27, 2011 to March 31, 2012 | |||||||||||||||
As at March 31 | As at March 31 | For the period November 27, 2011 to | For the Year Ended March 31 | |||||||||||||
2013 | 2013 | 2014 | March 31, 2012 | 2013 | 2014 | |||||||||||
Total assets | Total liabilities | Loss | Total liabilities | Total assets | Total liabilities | Loss | ||||||||||
| (in USD) | (in USD) | (in USD) | (in USD) | |||||||||||||
580,706 | 59,734 | 230,861 | ||||||||||||||
813,929 | 264,901 | 486,435 | 439,810 | 230,861 | 593,183 | 447,323 | ||||||||||
|
|
|
|
|
|
|
|
| ||||||||
| OTHER |
In August 2011, the Company acquired 19.98% equity interest in Le Travenues Technology Private Limited, which owns and operates www.ixigo.com, an online travel meta search engine. The Company paid cash consideration of $4,825,325USD 4,825,325 for the purchase of new shares as well as existing shares. Additionally, acquisition related expenses incurred by the Company amounted to $20,155. (Also refer note 37)USD 20,155.
This investment has been classified as “Available-for-sale Financial Assets” as per IAS 39 “Financial Instruments: Recognition and measurement”.
The Group’s exposure to risks and fair value versus carrying amount risks related to other investmentmeasurement is disclosed in note 5 and 34.35.
MAKEMYTRIP LIMITED
NOTES TO THE CONSOLIDATED FINANCIAL STATEMENTS — (Continued)
| OTHER REVENUE |
| For the Year Ended March 31 | For the Year Ended March 31 | |||||||||||||||||||||||
Particulars | 2010 | 2011 | 2012 | 2012 | 2013 | 2014 | ||||||||||||||||||
| (in USD) | (in USD) | |||||||||||||||||||||||
Advertising revenue | 372,442 | 578,284 | 909,851 | 909,851 | 1,190,225 | 878,830 | ||||||||||||||||||
Facilitation fee | 448,617 | 902,843 | 666,756 | 666,756 | 775,542 | 1,907,786 | ||||||||||||||||||
Commission on rail and bus reservation | 187,435 | 868,927 | 1,530,762 | 1,530,762 | 1,230,689 | 1,090,210 | ||||||||||||||||||
Miscellaneous | 144,328 | 190,638 | 600,449 | 600,449 | 607,320 | 473,875 | ||||||||||||||||||
|
|
|
|
|
| |||||||||||||||||||
Total | 1,152,822 | 2,540,692 | 3,707,818 | 3,707,818 | 3,803,776 | 4,350,701 | ||||||||||||||||||
|
|
|
|
|
| |||||||||||||||||||
| 11) | OTHER INCOME |
| For the Year Ended March 31 | ||||||||||||
Particulars | 2012 | 2013 | 2014 | |||||||||
| (in USD) | ||||||||||||
Gain on bargain purchase (refer note 7(d)) | — | — | 1,168,495 | |||||||||
Gain on disposal of property, plant and equipment | — | — | 143,804 | |||||||||
|
|
|
|
|
| |||||||
Total | — | — | 1,312,299 | |||||||||
|
|
|
|
|
| |||||||
| 12) | PERSONNEL EXPENSES |
| For the Year Ended March 31 | ||||||||||||
Particulars | 2010 | 2011 | 2012 | |||||||||
| (in USD) | ||||||||||||
Wages, salaries and other short term employees benefits | 8,288,755 | 11,548,649 | 16,902,901 | |||||||||
Contributions to defined contribution plans | 401,687 | 631,670 | 955,497 | |||||||||
Expenses related to defined benefit plans | 58,730 | 176,957 | 147,156 | |||||||||
Equity settled share based payments | 6,771,376 | 527,285 | 6,894,450 | |||||||||
Employee welfare expenses | 1,041,486 | 1,514,479 | 1,620,741 | |||||||||
|
|
|
|
|
| |||||||
Total | 16,562,034 | 14,399,040 | 26,520,745 | |||||||||
|
|
|
|
|
| |||||||
| For the Year Ended March 31 | ||||||||||||
Particulars | 2010 | 2011 | 2012 | |||||||||
| (in USD) | ||||||||||||
Traveling and conveyance | 1,222,138 | 2,206,550 | 2,912,341 | |||||||||
Advertising and business promotion | 9,674,728 | 12,488,906 | 16,984,856 | |||||||||
Communication | 1,275,778 | 1,905,389 | 2,507,847 | |||||||||
Repairs and maintenance | 815,736 | 802,288 | 1,293,159 | |||||||||
Rent | 1,244,798 | 1,394,969 | 2,079,183 | |||||||||
Legal and professional | 1,004,049 | 1,410,972 | 1,943,940 | |||||||||
Payment gateway and other charges | 6,143,714 | 9,886,444 | 13,002,068 | |||||||||
Website hosting charges | 183,079 | 377,183 | 470,267 | |||||||||
Net loss on disposal of property, plant and equipment | 25,501 | 80,563 | 71,446 | |||||||||
Loss on disposal of intangible assets | — | 2,930 | — | |||||||||
Outsourcing fees | 4,293,491 | 7,007,793 | 9,529,507 | |||||||||
Miscellaneous expenses | 2,277,494 | 3,134,908 | 4,074,041 | |||||||||
|
|
|
|
|
| |||||||
Total | 28,160,506 | 40,698,895 | 54,868,655 | |||||||||
|
|
|
|
|
| |||||||
| For the Year Ended March 31 | ||||||||||||
Particulars | 2012 | 2013 | 2014 | |||||||||
| (in USD) | ||||||||||||
Wages, salaries and other short term employees benefits | 16,902,901 | 19,362,165 | 22,973,472 | |||||||||
Contributions to defined contribution plans | 955,497 | 1,181,632 | 1,192,884 | |||||||||
Expenses related to defined benefit plans | 147,156 | 161,370 | 201,258 | |||||||||
Equity settled share based payments | 6,894,450 | 11,667,188 | 11,096,803 | |||||||||
Employee welfare expenses | 1,620,741 | 2,148,100 | 1,756,381 | |||||||||
|
|
|
|
|
| |||||||
Total | 26,520,745 | 34,520,455 | 37,220,798 | |||||||||
|
|
|
|
|
| |||||||
MAKEMYTRIP LIMITED
NOTES TO THE CONSOLIDATED FINANCIAL STATEMENTS — (Continued)
| 13) | OTHER OPERATING EXPENSES |
| For the Year Ended March 31 | ||||||||||||
Particulars | 2012 | 2013 | 2014 | |||||||||
| (in USD) | ||||||||||||
Traveling and conveyance | 2,912,341 | 3,349,350 | 2,417,115 | |||||||||
Advertising and business promotion | 16,984,856 | 19,690,015 | 27,884,856 | |||||||||
Communication | 2,507,847 | 2,744,018 | 2,888,732 | |||||||||
Repairs and maintenance | 1,293,159 | 1,667,478 | 1,770,035 | |||||||||
Rent | 2,079,183 | 2,624,313 | 2,857,370 | |||||||||
Legal and professional | 1,943,940 | 3,116,076 | 2,889,022 | |||||||||
Payment gateway and other charges | 13,002,068 | 15,204,413 | 17,766,147 | |||||||||
Website hosting charges | 470,267 | 1,281,188 | 1,174,782 | |||||||||
Net loss on disposal of property, plant and equipment | 71,446 | 25,560 | 63,284 | |||||||||
Loss on disposal of assets held for sale | — | 44,766 | — | |||||||||
Outsourcing fees | 9,529,507 | 13,587,174 | 13,178,402 | |||||||||
Miscellaneous expenses | 4,074,041 | 4,619,626 | 7,226,261 | |||||||||
|
|
|
|
|
| |||||||
Total | 54,868,655 | 67,953,977 | 80,116,006 | |||||||||
|
|
|
|
|
| |||||||
| 14) | DEPRECIATION AND AMORTIZATION |
| For the Year Ended March 31 | For the Year Ended March 31 | |||||||||||||||||||||||
Particulars | 2010 | 2011 | 2012 | 2012 | 2013 | 2014 | ||||||||||||||||||
| (in USD) | (in USD) | |||||||||||||||||||||||
Depreciation | 908,844 | 1,114,958 | 1,651,252 | 1,651,252 | 1,748,153 | 1,835,647 | ||||||||||||||||||
Amortization | 660,903 | 795,679 | 1,138,902 | 1,138,902 | 2,004,590 | 3,856,498 | ||||||||||||||||||
|
|
|
|
|
| |||||||||||||||||||
Total | 1,569,747 | 1,910,637 | 2,790,154 | 2,790,154 | 3,752,743 | 5,692,145 | ||||||||||||||||||
|
|
|
|
|
| |||||||||||||||||||
MAKEMYTRIP LIMITED
NOTES TO THE CONSOLIDATED FINANCIAL STATEMENTS — (Continued)
| 15) | FINANCE INCOME AND COSTS |
| For the Year Ended March 31 | ||||||||||||
Particulars | 2010 | 2011 | 2012 | |||||||||
| (in USD) | ||||||||||||
Recognized in profit or loss | ||||||||||||
Interest income on term deposits | 1,503,574 | 1,257,601 | 1,776,938 | |||||||||
Net foreign exchange gain | — | 257,031 | — | |||||||||
Net gain on change in fair value of separable embedded derivative financial instruments | 253,212 | 48,382 | — | |||||||||
Other interest income | 117,391 | 38,736 | 210,966 | |||||||||
|
|
|
|
|
| |||||||
Finance income | 1,874,177 | 1,601,750 | 1,987,904 | |||||||||
|
|
|
|
|
| |||||||
Interest expense on financial liabilities measured at amortised cost | 1,346,896 | 711,439 | 451,438 | |||||||||
Cost related to public offerings | — | 2,086,583 | 879,994 | |||||||||
Net foreign exchange loss | 582,402 | — | 2,257,833 | |||||||||
Impairment loss on trade and other advances | 37,943 | 424,512 | 833,994 | |||||||||
Net loss on change in fair value of derivative financial instrument | — | — | 65,825 | |||||||||
Other finance charges | 95,706 | 303,151 | 468,013 | |||||||||
|
|
|
|
|
| |||||||
Finance costs | 2,062,947 | 3,525,685 | 4,957,097 | |||||||||
|
|
|
|
|
| |||||||
Net finance costs recognized in profit or loss | (188,770 | ) | (1,923,935 | ) | (2,969,193 | ) | ||||||
|
|
|
|
|
| |||||||
Recognized in other comprehensive income | ||||||||||||
Foreign currency translation differences on foreign operations | 1,651,468 | (301,952 | ) | (7,421,044 | ) | |||||||
Net change in fair value of available-for-sale financial assets | — | — | (428,937 | ) | ||||||||
|
|
|
|
|
| |||||||
Finance income (cost) recognised in other comprehensive income | 1,651,468 | (301,952 | ) | (7,849,981 | ) | |||||||
|
|
|
|
|
| |||||||
Attributable to: | ||||||||||||
Equity holders of the Company | 1,651,184 | (301,893 | ) | (7,833,268 | ) | |||||||
Non-controlling interest | 284 | (59 | ) | (16,713 | ) | |||||||
|
|
|
|
|
| |||||||
Finance income (cost) recognised in other comprehensive income | 1,651,468 | (301,952 | ) | (7,849,981 | ) | |||||||
|
|
|
|
|
| |||||||
| For the Year Ended March 31 | ||||||||||||
Particulars | 2012 | 2013 | 2014 | |||||||||
| (in USD) | ||||||||||||
Recognized in profit or loss | ||||||||||||
Interest income on term deposits | 1,776,938 | 3,696,874 | 1,874,681 | |||||||||
Net foreign exchange gain | — | 639 | — | |||||||||
Change in fair value of financial liability | — | 262,497 | — | |||||||||
Other interest income | 210,966 | 86,861 | 567,083 | |||||||||
Net gain on change in fair value of derivative financial instrument | — | 150,732 | — | |||||||||
|
|
|
|
|
| |||||||
Finance income | 1,987,904 | 4,197,603 | 2,441,764 | |||||||||
|
|
|
|
|
| |||||||
Interest expense on financial liabilities measured at amortised cost | 451,438 | 136,622 | 148,836 | |||||||||
Change in fair value of financial liability | — | 417,223 | 1,082,962 | |||||||||
Cost related to public offerings | 879,994 | — | 390,690 | |||||||||
Net foreign exchange loss | 2,257,833 | 1,943,401 | 2,695,922 | |||||||||
Impairment loss on trade and other receivables | 833,994 | 2,072,126 | 1,990,362 | |||||||||
Net loss on change in fair value of derivative financial instrument | 65,825 | — | 203,651 | |||||||||
Finance and other charges | 468,013 | 370,154 | 1,263,308 | |||||||||
|
|
|
|
|
| |||||||
Finance costs | 4,957,097 | 4,939,526 | 7,775,731 | |||||||||
|
|
|
|
|
| |||||||
Net finance cost recognized in profit or loss | (2,969,193 | ) | (741,923 | ) | (5,333,967 | ) | ||||||
|
|
|
|
|
| |||||||
MAKEMYTRIP LIMITED
NOTES TO THE CONSOLIDATED FINANCIAL STATEMENTS — (Continued)
| 16) | INCOME TAX BENEFIT (EXPENSE) |
Income Tax Recognized in Profit or Loss
| For the year ended March 31 | For the Year Ended March 31 | |||||||||||||||||||||||
Particulars | 2010 | 2011 | 2012 | 2012 | 2013 | 2014 | ||||||||||||||||||
| (in USD) | (in USD) | |||||||||||||||||||||||
Current tax expense | ||||||||||||||||||||||||
Current period | (2,838 | ) | (174,950 | ) | (859,053 | ) | (859,053 | ) | (143,319 | ) | (184,868 | ) | ||||||||||||
|
|
|
|
|
| |||||||||||||||||||
Current tax expense | (2,838 | ) | (174,950 | ) | (859,053 | ) | (859,053 | ) | (143,319 | ) | (184,868 | ) | ||||||||||||
Deferred tax benefit (expense) | ||||||||||||||||||||||||
Origination and reversal of temporary differences | (990,884 | ) | 1,871,990 | (357,713 | ) | (357,713 | ) | 3,975,042 | 1,159,279 | |||||||||||||||
Change in unrecognized deductible temporary differences | 1,976,413 | (368,244 | ) | 1,866,436 | 1,866,436 | (8,928,668 | ) | (1,104,266 | ) | |||||||||||||||
Utilization of previously unrecognised tax losses | (938,356 | ) | (1,353,311 | ) | 3,183,905 | 3,183,905 | 45,240 | 51,335 | ||||||||||||||||
Recognition of previously unrecognized tax losses | — | 2,716,235 | 2,244,571 | 2,244,571 | — | — | ||||||||||||||||||
Reversal of previously recognized tax losses | (52,763 | ) | — | — | — | (3,547,318 | ) | — | ||||||||||||||||
|
|
|
|
|
| |||||||||||||||||||
Deferred tax benefit (expense) | (5,590 | ) | 2,866,670 | 6,937,199 | 6,937,199 | (8,455,704 | ) | 106,348 | ||||||||||||||||
|
|
|
|
|
| |||||||||||||||||||
Total income tax benefit (expense) | (8,428 | ) | 2,691,721 | 6,078,146 | 6,078,146 | (8,599,023 | ) | (78,520 | ) | |||||||||||||||
|
|
|
|
|
| |||||||||||||||||||
Income Tax Recognized in Other Comprehensive Income
| For the year ended March 31 | For the Year Ended March 31 | |||||||||||||||||||||||||||||||||||||||||||||||||||||||||||||||||||||||
| 2010 | 2011 | 2012 | 2012 | 2013 | 2014 | |||||||||||||||||||||||||||||||||||||||||||||||||||||||||||||||||||
Particulars | Before tax | Tax (expense) benefit | Net of tax | Before tax | Tax (expense) benefit | Net of tax | Before tax | Tax (expense) benefit | Net of tax | Before tax | Tax (expense) benefit | Net of tax | Before tax | Tax (expense) benefit | Net of tax | Before tax | Tax (expense) benefit | Net of tax | ||||||||||||||||||||||||||||||||||||||||||||||||||||||
| (In USD) | (in USD) | |||||||||||||||||||||||||||||||||||||||||||||||||||||||||||||||||||||||
Foreign currency translation differences on foreign operations | 1,651,468 | — | 1,651,468 | (301,952 | ) | — | (301,952 | ) | (7,421,044 | ) | — | (7,421,044 | ) | (7,421,044 | ) | — | (7,421,044 | ) | (2,309,906 | ) | — | (2,309,906 | ) | (2,767,820 | ) | — | (2,767,820 | ) | ||||||||||||||||||||||||||||||||||||||||||||
Net change in fair value of available-for-sale financial assets | — | — | — | — | — | — | (428,937 | ) | — | (428,937 | ) | (428,937 | ) | — | (428,937 | ) | 459,047 | — | 459,047 | (985,631 | ) | — | (985,631 | ) | ||||||||||||||||||||||||||||||||||||||||||||||||
Defined benefit plan actuarial gains (losses) | (14,431 | ) | 5,590 | (8,841 | ) | (73,356 | ) | 24,514 | (48,842 | ) | 23,223 | (7,535 | ) | 15,688 | ||||||||||||||||||||||||||||||||||||||||||||||||||||||||||
Remeasurement of defined benefit (asset) liability | 23,223 | (7,535 | ) | 15,688 | (125,748 | ) | (13,800 | ) | (139,548 | ) | 63,999 | — | 63,999 | |||||||||||||||||||||||||||||||||||||||||||||||||||||||||||
|
|
|
|
|
|
|
|
|
|
|
|
|
|
|
|
|
| |||||||||||||||||||||||||||||||||||||||||||||||||||||||
Total | 1,637,037 | 5,590 | 1,642,627 | (375,308 | ) | 24,514 | (350,794 | ) | (7,826,758 | ) | (7,535 | ) | (7,834,293 | ) | (7,826,758 | ) | (7,535 | ) | (7,834,293 | ) | (1,976,607 | ) | (13,800 | ) | (1,990,407 | ) | (3,689,452 | ) | — | (3,689,452 | ) | |||||||||||||||||||||||||||||||||||||||||
|
|
|
|
|
|
|
|
|
|
|
|
|
|
|
|
|
| |||||||||||||||||||||||||||||||||||||||||||||||||||||||
MAKEMYTRIP LIMITED
NOTES TO THE CONSOLIDATED FINANCIAL STATEMENTS — (Continued)
Reconciliation of Effective Tax Rate
| For the Year Ended March 31 | ||||||||||||||||||||||||||||||||||||||||||||||||
Particulars | For the year ended 31 March | 2012 | 2013 | 2014 | ||||||||||||||||||||||||||||||||||||||||||||
| 2010 | 2011 | 2012 | (in USD) | |||||||||||||||||||||||||||||||||||||||||||||
Profit (Loss) for the year | (6,206,987 | ) | 4,829,691 | 7,048,356 | 7,048,356 | (27,589,080 | ) | (20,905,564 | ) | |||||||||||||||||||||||||||||||||||||||
Income tax benefit (expense) | (8,428 | ) | 2,691,721 | 6,078,146 | 6,078,146 | (8,599,023 | ) | (78,520 | ) | |||||||||||||||||||||||||||||||||||||||
|
|
|
|
|
| |||||||||||||||||||||||||||||||||||||||||||
Profit (Loss) before tax | (6,198,559 | ) | 2,137,970 | 970,210 | 970,210 | (18,990,057 | ) | (20,827,044 | ) | |||||||||||||||||||||||||||||||||||||||
|
|
|
|
|
| |||||||||||||||||||||||||||||||||||||||||||
Income tax benefit using the Company's domestic tax rate | -15.00 | % | 929,784 | -15.00 | % | (320,696 | ) | -15.00 | % | (145,532 | ) | |||||||||||||||||||||||||||||||||||||
Income tax benefit (expense) using the Company’s domestic tax rate | 15.00 | % | (145,532 | ) | 15.00 | % | 2,848,509 | 15.00 | % | 3,124,057 | ||||||||||||||||||||||||||||||||||||||
Effect of tax rates in foreign jurisdictions | -12.81 | % | 794,323 | -43.55 | % | (931,079 | ) | -70.26 | % | (681,685 | ) | 70.26 | % | (681,685 | ) | 11.49 | % | 2,181,437 | 5.53 | % | 1,150,985 | |||||||||||||||||||||||||||
Non deductible expenses | 10.85 | % | (672,612 | ) | -0.43 | % | (9,253 | ) | -37.08 | % | (359,763 | ) | 37.08 | % | (359,763 | ) | 1.08 | % | (205,137 | ) | 1.27 | % | (263,870 | ) | ||||||||||||||||||||||||
Tax exempt income | -0.61 | % | 37,985 | 0.00 | % | — | 1.87 | % | 18,182 | 1.87 | % | 18,182 | 0.62 | % | 118,654 | 0.18 | % | 36,661 | ||||||||||||||||||||||||||||||
Recognition of previously unrecognized tax losses | 0.00 | % | — | 127.05 | % | 2,716,235 | 231.35 | % | 2,244,571 | 231.35 | % | 2,244,571 | 0.00 | % | — | 0.00 | % | — | ||||||||||||||||||||||||||||||
Utilization of previously unrecognised tax losses | -15.14 | % | 938,356.00 | 63.30 | % | 1,353,311 | 328.17 | % | 3,183,905 | 328.17 | % | 3,183,905 | 0.24 | % | 45,240 | 0.25 | % | 51,335 | ||||||||||||||||||||||||||||||
Reversal of previously recognized tax losses | 0.85 | % | (52,763 | ) | 0.00 | % | — | 0.00 | % | — | 0.00 | % | — | 18.68 | % | (3,547,318 | ) | 0.00 | % | — | ||||||||||||||||||||||||||||
Current year losses for which no deferred tax asset was recognized | 0.06 | % | (3,918 | ) | -21.54 | % | (460,527 | ) | -8.32 | % | (80,714 | ) | 8.32 | % | (80,714 | ) | 5.84 | % | (1,108,349 | ) | 14.74 | % | (3,069,282 | ) | ||||||||||||||||||||||||
Change in unrecognised temporary differences | 31.89 | % | (1,976,413 | ) | 17.22 | % | 368,244 | 192.37 | % | 1,866,436 | 192.37 | % | 1,866,436 | 47.02 | % | (8,928,668 | ) | 5.30 | % | (1,104,266 | ) | |||||||||||||||||||||||||||
Others | 0.05 | % | (3,170 | ) | -1.15 | % | (24,514 | ) | 3.38 | % | 32,746 | 3.38 | % | 32,746 | 0.02 | % | (3,391 | ) | 0.02 | % | (4,140 | ) | ||||||||||||||||||||||||||
|
|
|
|
|
|
|
|
| ||||||||||||||||||||||||||||||||||||||||
| 0.14 | % | (8,428 | ) | 125.90 | % | 2,691,721 | 626.48 | % | 6,078,146 | 6,078,146 | (8,599,023 | ) | (78,520 | ) | ||||||||||||||||||||||||||||||||||
|
|
|
|
|
|
|
|
| ||||||||||||||||||||||||||||||||||||||||
MAKEMYTRIP LIMITED
NOTES TO THE CONSOLIDATED FINANCIAL STATEMENTS — (Continued)
| 17) | PROPERTY, PLANT AND EQUIPMENT |
| Furniture and | Office | Motor | Leasehold | Diesel Generator | Capital Work | |||||||||||||||||||||||||||||||||||||||||||||||||||||||||||||||||||
| Particulars | Computers | Fixtures | Equipment | Vehicles | Improvements | Sets | in Progress | Total | Land | Building | Computers | Furniture and Fixtures | Office Equipment | Motor Vehicles | Leasehold Improvements | Diesel Generator Sets | Capital Work in Progress | Total | ||||||||||||||||||||||||||||||||||||||||||||||||||||||
| (In USD) | (In USD) | |||||||||||||||||||||||||||||||||||||||||||||||||||||||||||||||||||||||
Cost | ||||||||||||||||||||||||||||||||||||||||||||||||||||||||||||||||||||||||
Balance as at April 1, 2010 | 2,480,364 | 526,445 | 1,278,049 | 421,465 | 1,560,668 | 146,600 | 29,291 | 6,442,882 | ||||||||||||||||||||||||||||||||||||||||||||||||||||||||||||||||
Balance as at April 1, 2012 | — | — | 4,942,889 | 492,889 | 1,045,774 | 518,307 | 3,650,210 | 11,164 | — | 10,661,233 | ||||||||||||||||||||||||||||||||||||||||||||||||||||||||||||||
Acquisitions through business combinations | 906,406 | 522,411 | 43,654 | — | 98,857 | 89,890 | 19,677 | — | — | 1,680,895 | ||||||||||||||||||||||||||||||||||||||||||||||||||||||||||||||
Additions | 804,404 | 21,003 | 197,018 | 140,067 | 130,865 | 7,933 | (28,795 | ) | 1,272,495 | — | — | 1,831,770 | 5,969 | 68,760 | 213,069 | 453,891 | 3,032 | — | 2,576,491 | |||||||||||||||||||||||||||||||||||||||||||||||||||||
Disposals | (112,424 | ) | — | (114,727 | ) | (139,358 | ) | — | (3,111 | ) | — | (369,620 | ) | — | — | (19,944 | ) | (69,351 | ) | (85,322 | ) | (204,526 | ) | (46,816 | ) | — | — | (425,959 | ) | |||||||||||||||||||||||||||||||||||||||||||
Effect of movements in foreign exchange rates | (6,032 | ) | (2,721 | ) | (5,943 | ) | (2,366 | ) | (7,299 | ) | (771 | ) | (496 | ) | (25,628 | ) | 47,378 | 27,307 | (225,095 | ) | (22,187 | ) | (39,132 | ) | (10,174 | ) | (168,845 | ) | (524 | ) | — | (391,272 | ) | |||||||||||||||||||||||||||||||||||||||
|
|
|
|
|
|
|
|
|
|
|
|
|
|
|
|
|
| |||||||||||||||||||||||||||||||||||||||||||||||||||||||
Balance as at March 31, 2011 | 3,166,312 | 544,727 | 1,354,397 | 419,808 | 1,684,234 | 150,651 | — | 7,320,129 | ||||||||||||||||||||||||||||||||||||||||||||||||||||||||||||||||
Balance as at March 31, 2013 | 953,784 | 549,718 | 6,573,274 | 407,320 | 1,088,937 | 606,566 | 3,908,117 | 13,672 | — | 14,101,388 | ||||||||||||||||||||||||||||||||||||||||||||||||||||||||||||||
|
|
|
|
|
|
|
|
|
|
|
|
|
|
|
|
|
| |||||||||||||||||||||||||||||||||||||||||||||||||||||||
Balance as at April 1, 2011 | 3,166,312 | 544,727 | 1,354,397 | 419,808 | 1,684,234 | 150,651 | — | 7,320,129 | ||||||||||||||||||||||||||||||||||||||||||||||||||||||||||||||||
Balance as at April 1, 2013 | 953,784 | 549,718 | 6,573,274 | 407,320 | 1,088,937 | 606,566 | 3,908,117 | 13,672 | — | 14,101,388 | ||||||||||||||||||||||||||||||||||||||||||||||||||||||||||||||
Acquisitions through business combinations | 15,825 | 1,266 | 12,398 | 165,805 | — | — | — | 195,294 | — | — | 124,600 | 7,129 | 1,820 | — | 7,881 | — | — | 141,430 | ||||||||||||||||||||||||||||||||||||||||||||||||||||||
Additions | 2,334,327 | 20,200 | 214,574 | 28,717 | 3,441,912 | 3,421 | — | 6,043,151 | — | 20,398 | 1,364,108 | 42,764 | 178,688 | 209,160 | 162,539 | — | 17,318 | 1,994,975 | ||||||||||||||||||||||||||||||||||||||||||||||||||||||
Reclassification to assets held for sale | — | — | (338,360 | ) | — | (932,942 | ) | (123,294 | ) | — | (1,394,596 | ) | ||||||||||||||||||||||||||||||||||||||||||||||||||||||||||||
Disposals | (2,974 | ) | (2,839 | ) | (21,171 | ) | (40,485 | ) | (88,535 | ) | — | — | (156,004 | ) | — | — | (13,011 | ) | (2,197 | ) | (10,127 | ) | (43,371 | ) | (137,549 | ) | (2,734 | ) | — | (208,989 | ) | |||||||||||||||||||||||||||||||||||||||||
Effect of movements in foreign exchange rates | (570,601 | ) | (70,465 | ) | (176,064 | ) | (55,538 | ) | (454,459 | ) | (19,614 | ) | — | (1,346,741 | ) | (94,951 | ) | (55,401 | ) | (569,049 | ) | (36,210 | ) | (92,588 | ) | (56,191 | ) | (343,927 | ) | (1,238 | ) | — | (1,249,555 | ) | ||||||||||||||||||||||||||||||||||||||
|
|
|
|
|
|
|
|
|
|
|
|
|
|
|
|
|
| |||||||||||||||||||||||||||||||||||||||||||||||||||||||
Balance as at March 31, 2012 | 4,942,889 | 492,889 | 1,045,774 | 518,307 | 3,650,210 | 11,164 | — | 10,661,233 | ||||||||||||||||||||||||||||||||||||||||||||||||||||||||||||||||
Balance as at March 31, 2014 | 858,833 | 514,715 | 7,479,922 | 418,806 | 1,166,730 | 716,164 | 3,597,061 | 9,700 | 17,318 | 14,779,249 | ||||||||||||||||||||||||||||||||||||||||||||||||||||||||||||||
|
|
|
|
|
|
|
|
|
|
|
|
|
|
|
|
|
| |||||||||||||||||||||||||||||||||||||||||||||||||||||||
Depreciation and impairment loss | ||||||||||||||||||||||||||||||||||||||||||||||||||||||||||||||||||||||||
Balance as at April 1, 2010 | 1,184,543 | 252,737 | 585,875 | 127,346 | 490,692 | 53,509 | — | 2,694,702 | ||||||||||||||||||||||||||||||||||||||||||||||||||||||||||||||||
Balance as at April 1, 2012 | — | — | 2,111,595 | 368,141 | 559,150 | 172,296 | 383,083 | 2,595 | — | 3,596,860 | ||||||||||||||||||||||||||||||||||||||||||||||||||||||||||||||
Depreciation for the year | 543,205 | 85,728 | 190,252 | 58,762 | 215,696 | 21,315 | — | 1,114,958 | — | 16,603 | 962,292 | 66,090 | 141,008 | 83,343 | 477,171 | 1,646 | — | 1,748,153 | ||||||||||||||||||||||||||||||||||||||||||||||||||||||
Disposals | (108,184 | ) | — | (77,302 | ) | (60,695 | ) | — | (940 | ) | — | (247,121 | ) | — | — | (14,652 | ) | (63,207 | ) | (77,221 | ) | (58,856 | ) | (27,612 | ) | — | — | (241,548 | ) | |||||||||||||||||||||||||||||||||||||||||||
Effect of movements in foreign exchange rates | (1,696 | ) | (443 | ) | (1,764 | ) | (741 | ) | (295 | ) | (69 | ) | — | (5,008 | ) | — | 508 | (141,890 | ) | (17,154 | ) | (23,375 | ) | (6,074 | ) | (17,795 | ) | (123 | ) | — | (205,903 | ) | ||||||||||||||||||||||||||||||||||||||||
|
|
|
|
|
|
|
|
|
|
|
|
|
|
|
|
|
| |||||||||||||||||||||||||||||||||||||||||||||||||||||||
Balance as at March 31, 2011 | 1,617,868 | 338,022 | 697,061 | 124,672 | 706,093 | 73,815 | — | 3,557,531 | ||||||||||||||||||||||||||||||||||||||||||||||||||||||||||||||||
Balance as at March 31, 2013 | — | 17,111 | 2,917,345 | 353,870 | 599,562 | 190,709 | 814,847 | 4,118 | — | 4,897,562 | ||||||||||||||||||||||||||||||||||||||||||||||||||||||||||||||
|
|
|
|
|
|
|
|
|
|
|
|
|
|
|
|
|
| |||||||||||||||||||||||||||||||||||||||||||||||||||||||
Balance as at April 1, 2011 | 1,617,868 | 338,022 | 697,061 | 124,672 | 706,093 | 73,815 | — | 3,557,531 | ||||||||||||||||||||||||||||||||||||||||||||||||||||||||||||||||
Balance as at April 1, 2013 | — | 17,111 | 2,917,345 | 353,870 | 599,562 | 190,709 | 814,847 | 4,118 | — | 4,897,562 | ||||||||||||||||||||||||||||||||||||||||||||||||||||||||||||||
Depreciation for the year | 756,587 | 81,037 | 184,752 | 77,932 | 532,073 | 18,871 | — | 1,651,252 | — | 43,182 | 1,069,596 | 32,582 | 138,286 | 91,294 | 459,342 | 1,365 | — | 1,835,647 | ||||||||||||||||||||||||||||||||||||||||||||||||||||||
Reclassification to assets held for sale | — | — | (217,298 | ) | — | (693,944 | ) | (79,245 | ) | — | (990,487 | ) | ||||||||||||||||||||||||||||||||||||||||||||||||||||||||||||
Disposals | (1,871 | ) | (1,904 | ) | (12,594 | ) | (11,479 | ) | (35,442 | ) | — | — | (63,290 | ) | — | — | (12,229 | ) | (989 | ) | (6,053 | ) | (15,240 | ) | (84,134 | ) | (605 | ) | — | (119,250 | ) | |||||||||||||||||||||||||||||||||||||||||
Effect of movements in foreign exchange rates | (260,989 | ) | (49,014 | ) | (92,771 | ) | (18,829 | ) | (125,697 | ) | (10,846 | ) | — | (558,146 | ) | — | (4,280 | ) | (252,644 | ) | (26,927 | ) | (9,015 | ) | (14,144 | ) | (59,982 | ) | (358 | ) | — | (367,350 | ) | |||||||||||||||||||||||||||||||||||||||
|
|
|
|
|
|
|
|
|
|
|
|
|
|
|
|
|
| |||||||||||||||||||||||||||||||||||||||||||||||||||||||
Balance as at March 31, 2012 | 2,111,595 | 368,141 | 559,150 | 172,296 | 383,083 | 2,595 | — | 3,596,860 | ||||||||||||||||||||||||||||||||||||||||||||||||||||||||||||||||
Balance as at March 31, 2014 | — | 56,013 | 3,722,068 | 358,536 | 722,780 | 252,619 | 1,130,073 | 4,520 | — | 6,246,609 | ||||||||||||||||||||||||||||||||||||||||||||||||||||||||||||||
|
|
|
|
|
|
|
|
|
|
|
|
|
|
|
|
|
| |||||||||||||||||||||||||||||||||||||||||||||||||||||||
Carrying amounts | ||||||||||||||||||||||||||||||||||||||||||||||||||||||||||||||||||||||||
As at April 1, 2010 | 1,295,821 | 273,708 | 692,174 | 294,119 | 1,069,976 | 93,091 | 29,291 | 3,748,180 | ||||||||||||||||||||||||||||||||||||||||||||||||||||||||||||||||
As at April 1, 2012 | — | — | 2,831,294 | 124,748 | 486,624 | 346,011 | 3,267,127 | 8,569 | — | 7,064,373 | ||||||||||||||||||||||||||||||||||||||||||||||||||||||||||||||
|
|
|
|
|
|
|
|
|
|
|
|
|
|
|
|
|
| |||||||||||||||||||||||||||||||||||||||||||||||||||||||
As at March 31, 2011 | 1,548,444 | 206,705 | 657,336 | 295,136 | 978,141 | 76,836 | — | 3,762,598 | ||||||||||||||||||||||||||||||||||||||||||||||||||||||||||||||||
As at March 31, 2013 | 953,784 | 532,607 | 3,655,929 | 53,450 | 489,375 | 415,857 | 3,093,270 | 9,554 | — | 9,203,826 | ||||||||||||||||||||||||||||||||||||||||||||||||||||||||||||||
|
|
|
|
|
|
|
|
|
|
|
|
|
|
|
|
|
| |||||||||||||||||||||||||||||||||||||||||||||||||||||||
As at April 1, 2011 | 1,548,444 | 206,705 | 657,336 | 295,136 | 978,141 | 76,836 | — | 3,762,598 | ||||||||||||||||||||||||||||||||||||||||||||||||||||||||||||||||
As at April 1, 2013 | 953,784 | 532,607 | 3,655,929 | 53,450 | 489,375 | 415,857 | 3,093,270 | 9,554 | — | 9,203,826 | ||||||||||||||||||||||||||||||||||||||||||||||||||||||||||||||
|
|
|
|
|
|
|
|
|
|
|
|
|
|
|
|
|
| |||||||||||||||||||||||||||||||||||||||||||||||||||||||
As at March 31, 2012 | 2,831,294 | 124,748 | 486,624 | 346,011 | 3,267,127 | 8,569 | — | 7,064,373 | ||||||||||||||||||||||||||||||||||||||||||||||||||||||||||||||||
Balance as at March 31, 2014 | 858,833 | 458,702 | 3,757,854 | 60,270 | 443,950 | 463,545 | 2,466,988 | 5,180 | 17,318 | 8,532,640 | ||||||||||||||||||||||||||||||||||||||||||||||||||||||||||||||
|
|
|
|
|
|
|
|
|
|
|
|
|
|
|
|
|
| |||||||||||||||||||||||||||||||||||||||||||||||||||||||
MAKEMYTRIP LIMITED
NOTES TO THE CONSOLIDATED FINANCIAL STATEMENTS — (Continued)
| 18) | INTANGIBLE ASSETS |
| Website | ||||||||||||||||||||||||||||||||
| Particulars | Goodwill | Customer Relationship | Non-Compete | Brand / Trade Mark | Development Cost | Software | Capital work in progress | Total | ||||||||||||||||||||||||
| (in USD) | ||||||||||||||||||||||||||||||||
Cost | ||||||||||||||||||||||||||||||||
Balance as at April 1, 2010 | — | — | — | — | 2,487,862 | 1,377,205 | — | 3,865,067 | ||||||||||||||||||||||||
Additions | — | — | — | — | 338,422 | 866,582 | 368,882 | 1,573,886 | ||||||||||||||||||||||||
Disposals | — | — | — | — | — | (17,945 | ) | — | (17,945 | ) | ||||||||||||||||||||||
Effect of movements in foreign exchange rates | — | — | — | — | (10,148 | ) | 2,301 | 4,227 | (3,620 | ) | ||||||||||||||||||||||
|
|
|
|
|
|
|
|
|
|
|
|
|
|
|
| |||||||||||||||||
Balance as at March 31, 2011 | — | — | — | — | 2,816,136 | 2,228,143 | 373,109 | 5,417,388 | ||||||||||||||||||||||||
|
|
|
|
|
|
|
|
|
|
|
|
|
|
|
| |||||||||||||||||
Balance as at April 1, 2011 | — | — | — | — | 2,816,136 | 2,228,143 | 373,109 | 5,417,388 | ||||||||||||||||||||||||
Acquisitions through business combinations | 2,620,671 | 145,290 | 169,505 | 242,150 | — | 297,374 | — | 3,474,990 | ||||||||||||||||||||||||
Additions | — | — | — | — | 1,058,081 | 877,602 | 1,889,686 | 3,825,369 | ||||||||||||||||||||||||
Effect of movements in foreign exchange rates | (38,154 | ) | (2,115 | ) | (2,467 | ) | (3,525 | ) | (438,145 | ) | (345,260 | ) | (183,881 | ) | (1,013,547 | ) | ||||||||||||||||
|
|
|
|
|
|
|
|
|
|
|
|
|
|
|
| |||||||||||||||||
Balance as at March 31, 2012 | 2,582,517 | 143,175 | 167,038 | 238,625 | 3,436,072 | 3,057,859 | 2,078,914 | 11,704,200 | ||||||||||||||||||||||||
|
|
|
|
|
|
|
|
|
|
|
|
|
|
|
| |||||||||||||||||
Amortization | ||||||||||||||||||||||||||||||||
Balance as at April 1, 2010 | — | — | — | — | 1,335,432 | 505,576 | — | 1,841,008 | ||||||||||||||||||||||||
Amortization for the year | — | — | — | — | 506,101 | 289,578 | — | 795,679 | ||||||||||||||||||||||||
Disposals | — | — | — | — | — | (15,015 | ) | — | (15,015 | ) | ||||||||||||||||||||||
Effect of movements in foreign exchange rates | — | — | — | — | (1,730 | ) | 606 | — | (1,124 | ) | ||||||||||||||||||||||
|
|
|
|
|
|
|
|
|
|
|
|
|
|
|
| |||||||||||||||||
Balance as at March 31, 2011 | — | — | — | — | 1,839,803 | 780,745 | — | 2,620,548 | ||||||||||||||||||||||||
|
|
|
|
|
|
|
|
|
|
|
|
|
|
|
| |||||||||||||||||
Balance as at April 1, 2011 | — | — | — | — | 1,839,803 | 780,745 | — | 2,620,548 | ||||||||||||||||||||||||
Amortization for the year | — | 12,844 | 29,970 | 21,407 | 585,136 | 489,545 | — | 1,138,902 | ||||||||||||||||||||||||
Effect of movements in foreign exchange rates | — | (27 | ) | (63 | ) | (45 | ) | (278,611 | ) | (125,907 | ) | — | (404,653 | ) | ||||||||||||||||||
|
|
|
|
|
|
|
|
|
|
|
|
|
|
|
| |||||||||||||||||
Balance as at March 31, 2012 | — | 12,817 | 29,907 | 21,362 | 2,146,328 | 1,144,383 | — | 3,354,797 | ||||||||||||||||||||||||
|
|
|
|
|
|
|
|
|
|
|
|
|
|
|
| |||||||||||||||||
Carrying amounts | ||||||||||||||||||||||||||||||||
As at April 1, 2010 | — | — | — | — | 1,152,430 | 871,629 | — | 2,024,059 | ||||||||||||||||||||||||
|
|
|
|
|
|
|
|
|
|
|
|
|
|
|
| |||||||||||||||||
As at March 31, 2011 | — | — | — | — | 976,333 | 1,447,398 | 373,109 | 2,796,840 | ||||||||||||||||||||||||
|
|
|
|
|
|
|
|
|
|
|
|
|
|
|
| |||||||||||||||||
As at April 1, 2011 | — | — | — | — | 976,333 | 1,447,398 | 373,109 | 2,796,840 | ||||||||||||||||||||||||
|
|
|
|
|
|
|
|
|
|
|
|
|
|
|
| |||||||||||||||||
As at March 31, 2012 | 2,582,517 | 130,358 | 137,131 | 217,263 | 1,289,744 | 1,913,476 | 2,078,914 | 8,349,403 | ||||||||||||||||||||||||
|
|
|
|
|
|
|
|
|
|
|
|
|
|
|
| |||||||||||||||||
Capitalized borrowing cost related to capital work-in-progress amounted to USD 112,668 (March 31, 2011: Nil), with a capitalization rate of 12%.
Particulars | Goodwill | Customer Relationship | Non-Compete | Brand / Trade Mark | Website Development Cost | Software | Capital work in progress | Total | ||||||||||||||||||||||||
| (in USD) | ||||||||||||||||||||||||||||||||
Cost | ||||||||||||||||||||||||||||||||
Balance as at April 1, 2012 | 2,582,517 | 143,175 | 167,038 | 238,625 | 3,436,072 | 3,057,859 | 2,078,914 | 11,704,200 | ||||||||||||||||||||||||
Acquisitions through business combinations | 10,851,289 | 1,200,000 | 310,000 | 8,300,000 | 3,830,000 | 12,182 | — | 24,503,471 | ||||||||||||||||||||||||
Additions | — | — | — | — | 2,110,967 | 783,759 | 1,508,509 | 4,403,235 | ||||||||||||||||||||||||
Disposals | — | — | — | — | — | (156,174 | ) | — | (156,174 | ) | ||||||||||||||||||||||
Effect of movements in foreign exchange rates | 35,189 | 1,951 | 2,276 | 3,251 | (163,095 | ) | (121,390 | ) | (99,009 | ) | (340,827 | ) | ||||||||||||||||||||
|
|
|
|
|
|
|
|
|
|
|
|
|
|
|
| |||||||||||||||||
Balance as at March 31, 2013 | 13,468,995 | 1,345,126 | 479,314 | 8,541,876 | 9,213,944 | 3,576,236 | 3,488,414 | 40,113,905 | ||||||||||||||||||||||||
|
|
|
|
|
|
|
|
|
|
|
|
|
|
|
| |||||||||||||||||
Balance as at April 1, 2013 | 13,468,995 | 1,345,126 | 479,314 | 8,541,876 | 9,213,944 | 3,576,236 | 3,488,414 | 40,113,905 | ||||||||||||||||||||||||
Acquisitions through business combinations | — | — | — | 2,720,926 | 2,560,392 | — | 448,953 | 5,730,271 | ||||||||||||||||||||||||
Additions/Adjustment | 78,755 | — | — | — | 2,359,868 | 2,316,481 | (1,695,568 | ) | 3,059,536 | |||||||||||||||||||||||
Effect of movements in foreign exchange rates | (38,061 | ) | (2,110 | ) | (2,462 | ) | 26,157 | (428,975 | ) | (259,920 | ) | (323,283 | ) | (1,028,654 | ) | |||||||||||||||||
|
|
|
|
|
|
|
|
|
|
|
|
|
|
|
| |||||||||||||||||
Balance as at March 31, 2014 | 13,509,689 | 1,343,016 | 476,852 | 11,288,959 | 13,705,229 | 5,632,797 | 1,918,516 | 47,875,058 | ||||||||||||||||||||||||
|
|
|
|
|
|
|
|
|
|
|
|
|
|
|
| |||||||||||||||||
Amortization | ||||||||||||||||||||||||||||||||
Balance as at April 1, 2012 | — | 12,817 | 29,907 | 21,362 | 2,146,328 | 1,144,383 | — | 3,354,797 | ||||||||||||||||||||||||
Amortization for the year | — | 87,335 | 33,793 | 450,388 | 859,965 | 573,109 | — | 2,004,590 | ||||||||||||||||||||||||
Disposals | — | — | — | — | — | (83,521 | ) | — | (83,521 | ) | ||||||||||||||||||||||
Effect of movements in foreign exchange rates | — | 205 | 477 | 341 | (100,771 | ) | (49,230 | ) | — | (148,978 | ) | |||||||||||||||||||||
|
|
|
|
|
|
|
|
|
|
|
|
|
|
|
| |||||||||||||||||
Balance as at March 31, 2013 | — | 100,357 | 64,177 | 472,091 | 2,905,522 | 1,584,741 | — | 5,126,888 | ||||||||||||||||||||||||
|
|
|
|
|
|
|
|
|
|
|
|
|
|
|
| |||||||||||||||||
Balance as at April 1, 2013 | — | 100,357 | 64,177 | 472,091 | 2,905,522 | 1,584,741 | — | 5,126,888 | ||||||||||||||||||||||||
Amortization for the year | — | 215,965 | 36,080 | 1,136,737 | 1,729,745 | 737,971 | — | 3,856,498 | ||||||||||||||||||||||||
Effect of movements in foreign exchange rates | — | (396 | ) | (925 | ) | (661 | ) | (222,813 | ) | (124,075 | ) | — | (348,870 | ) | ||||||||||||||||||
|
|
|
|
|
|
|
|
|
|
|
|
|
|
|
| |||||||||||||||||
Balance as at March 31, 2014 | — | 315,926 | 99,332 | 1,608,167 | 4,412,454 | 2,198,637 | — | 8,634,516 | ||||||||||||||||||||||||
|
|
|
|
|
|
|
|
|
|
|
|
|
|
|
| |||||||||||||||||
Carrying amounts | ||||||||||||||||||||||||||||||||
As at April 1, 2012 | 2,582,517 | 130,358 | 137,131 | 217,263 | 1,289,744 | 1,913,476 | 2,078,914 | 8,349,403 | ||||||||||||||||||||||||
|
|
|
|
|
|
|
|
|
|
|
|
|
|
|
| |||||||||||||||||
As at March 31, 2013 | 13,468,995 | 1,244,769 | 415,137 | 8,069,785 | 6,308,422 | 1,991,495 | 3,488,414 | 34,987,017 | ||||||||||||||||||||||||
|
|
|
|
|
|
|
|
|
|
|
|
|
|
|
| |||||||||||||||||
As at April 1, 2013 | 13,468,995 | 1,244,769 | 415,137 | 8,069,785 | 6,308,422 | 1,991,495 | 3,488,414 | 34,987,017 | ||||||||||||||||||||||||
|
|
|
|
|
|
|
|
|
|
|
|
|
|
|
| |||||||||||||||||
Balance as at March 31, 2014 | 13,509,689 | 1,027,090 | 377,520 | 9,680,792 | 9,292,775 | 3,434,160 | 1,918,516 | 39,240,542 | ||||||||||||||||||||||||
|
|
|
|
|
|
|
|
|
|
|
|
|
|
|
| |||||||||||||||||
MAKEMYTRIP LIMITED
NOTES TO THE CONSOLIDATED FINANCIAL STATEMENTS — (Continued)
For the purpose of impairment testing, goodwill is allocated to a CGU representing the lowest level within the Group at which goodwill is monitored for internal management purposes, and which is not higher than the Group’s operating segment. Goodwill as at March 31, 20122014 has been allocated to respective acquired subsidiary level (Luxury Tours & Travel Pte Ltd).subsidiaries level. The recoverable amount of the CGU was based on its value in use and was determined by discounting the future cash flows to be generated from the continuing use of the CGU. These calculations use cash flow projections over a period of five years, based on next year financial budgets approved by management, with extrapolation for the remaining period, and an average of the range of assumption as mentioned below. The key assumptions used for the calculations are as follows:
| ||||
| ||||
| ||||
| As at March 31, | ||||||||
| 2013 | 2014 | |||||||
Discount rate | 18-22 | % | 19-22 | % | ||||
Terminal value growth rate | 3.5-4 | % | 3.5-4 | % | ||||
Average EBITDA margin | 12-25 | % | 14-36 | % | ||||
The above discount rate is based on the Weighted Average Cost of Capital (WACC) of a comparable market participant, which areis adjusted for specific risks. These estimates are likely to differ from future actual results of operations and cash flows.
Based on the above, no impairment was identified as of March 31, 20122014 as the recoverable value of the CGUs exceeded the carrying value. An analysis of the calculation’s sensitivity to a change in the key parameters (Revenue growth, operating margin, discount rate and long-term growth rate) based on reasonably probable assumptions, did not identify any probable scenarios where the CGU’s recoverable amount would fall below its carrying amount.
| 19) | TAX ASSETS AND LIABILITIES |
Unrecognized Deferred Tax Assets
Deferred tax assets have not been recognized in respect of the following items:
| As at March 31 | ||||||||
| 2011 | 2012 | |||||||
| Particulars | (in USD) | |||||||
Deductible temporary differences | 1,597,623 | — | ||||||
Tax loss carry forwards | 6,621,611 | 522,504 | ||||||
|
|
|
| |||||
Total | 8,219,234 | 522,504 | ||||||
|
|
|
| |||||
The carry forward tax losses as at March 31, 2012 expire as follows:
| US Subsidiary | Singapore Subsidiary | |||||||||||||||
Loss for the period | Tax losses | Expire on | Tax losses | Expire on | ||||||||||||
| (in USD) | ||||||||||||||||
Loss for the year 2007-2008 | 292,725 | 2028 | — | — | ||||||||||||
Loss for the year 2008-2009 | 164,110 | 2029 | — | — | ||||||||||||
Loss for the year 2011-2012 | — | — | 65,669 | No limit | ||||||||||||
|
|
|
| |||||||||||||
Total | 456,835 | 65,669 | ||||||||||||||
|
|
|
| |||||||||||||
| As at March 31 | ||||||||
| 2013 | 2014 | |||||||
| Particulars | (in USD) | |||||||
Deductible temporary differences | 7,775,513 | 8,362,827 | ||||||
Minimum alternate tax | 820,045 | 820,045 | ||||||
Tax loss carry forwards | 5,373,120 | 8,592,634 | ||||||
|
|
|
| |||||
Total | 13,968,678 | 17,775,506 | ||||||
|
|
|
| |||||
MAKEMYTRIP LIMITED
NOTES TO THE CONSOLIDATED FINANCIAL STATEMENTS — (Continued)
InDeferred tax assets of USD 8,892,842 had been recognized in the previous years, relating to unutilized tax losses and other temporary differences in respect of its Indian subsidiary. The Indian subsidiary after two consecutive years of profits had incurred losses in the financial year ended March 31, 2013. Based on evaluation of convincing evidence required by IAS 12, the management had recorded impairment of deferred tax asset of USD 8,455,704 in the financial year ended March 31, 2013. The impairment had no impact on the Company’s ability to utilize carry forwards losses or tax assets in the future. During the year ended March 31, 2012, a2014, the Company did not recognize deferred tax asset of USD 2,327,152 was recognized for unusedon tax losses as management considered it probable that future taxable profits would be available. Management has not recognized a deferred tax asset of USD 522,504 in respect of unused tax losses for the U.S. and Singapore subsidiariesother temporary differences because a trend of profitable growth in these subsidiariesfuture profitability is not yet fully established. In assessing the realizability of deferredclearly discernible. The above tax assets, management considers whether it is more likely than not that some portion or all of the deferred tax assets will not be realized. The ultimate realization of deferred tax assets is dependent upon the generation of future taxable income during the periods in which those temporary differences and loss carry-forwards become deductible or utilizable. Management considers the scheduled reversal of deferred tax liabilities and projected future taxable income in making this assessment. Based upon the level of historical taxable income and projections for future taxable income over the periods in which the deferred tax assets are deductible, management believes it is more likely than not that the Company will realize the benefits of these deductible differences and loss carry-forwards. The amount of the deferred tax asset considered realizable, however, could be reduced in the near term if estimates of future taxable income during the carry-forward period are reduced.losses expire at various dates ranging from 2015 to 2029.
Recognized Deferred Tax Assets and Liabilities
Deferred tax assets and liabilities are attributable to the following:
| As at March 31 | ||||||||||||||||||||||||
| Assets | Liabilities | Net | ||||||||||||||||||||||
| 2011 | 2012 | 2011 | 2012 | 2011 | 2012 | |||||||||||||||||||
| Particulars | (in USD) | |||||||||||||||||||||||
Property, plant and equipment | — | — | (39,517 | ) | (125,942 | ) | (39,517 | ) | (125,942 | ) | ||||||||||||||
Intangible assets | — | — | (439,664 | ) | (293,411 | ) | (439,664 | ) | (293,411 | ) | ||||||||||||||
Trade and other receivables | — | 349,526 | — | — | — | 349,526 | ||||||||||||||||||
Other current assets | 90,750 | 167,246 | — | — | 90,750 | 167,246 | ||||||||||||||||||
Employee benefits | 216,681 | 221,215 | — | — | 216,681 | 221,215 | ||||||||||||||||||
Other non-current liabilities | 68,606 | 89,136 | — | — | 68,606 | 89,136 | ||||||||||||||||||
Minimum alternate tax | 176,954 | 930,428 | — | — | 176,954 | 930,428 | ||||||||||||||||||
Tax loss carry forwards | 2,747,354 | 4,559,694 | — | — | 2,747,354 | 4,559,694 | ||||||||||||||||||
Share based payments | — | 2,580,788 | — | — | — | 2,580,788 | ||||||||||||||||||
Other disallowances | 103,144 | 414,162 | — | — | 103,144 | 414,162 | ||||||||||||||||||
|
|
|
|
|
|
|
|
|
|
|
| |||||||||||||
Deferred tax assets/(liabilities) | 3,403,489 | 9,312,195 | (479,181 | ) | (419,353 | ) | 2,924,308 | 8,892,842 | ||||||||||||||||
Set off | (479,181 | ) | (419,353 | ) | 479,181 | 419,353 | — | — | ||||||||||||||||
|
|
|
|
|
|
|
|
|
|
|
| |||||||||||||
Net deferrd tax assets/(liabilities) | 2,924,308 | 8,892,842 | — | — | 2,924,308 | 8,892,842 | ||||||||||||||||||
|
|
|
|
|
|
|
|
|
|
|
| |||||||||||||
| As at March 31 | ||||||||||||||||||||||||
| Assets | Liabilities | Net | ||||||||||||||||||||||
| 2013 | 2014 | 2013 | 2014 | 2013 | 2014 | |||||||||||||||||||
| Particulars | (in USD) | |||||||||||||||||||||||
Property, plant and equipment | — | — | (372,822 | ) | (386,977 | ) | (372,822 | ) | (386,977 | ) | ||||||||||||||
Intangible assets | — | — | (808,350 | ) | (2,340,250 | ) | (808,350 | ) | (2,340,250 | ) | ||||||||||||||
Tax loss carry forwards | 797,728 | 2,450,131 | — | — | 797,728 | 2,450,131 | ||||||||||||||||||
|
|
|
|
|
|
|
|
|
|
|
| |||||||||||||
Deferred tax assets/(liabilities) | 797,728 | 2,450,131 | (1,181,172 | ) | (2,727,227 | ) | (383,444 | ) | (277,096 | ) | ||||||||||||||
Set off | (797,728 | ) | (2,450,131 | ) | 797,728 | 2,450,131 | — | — | ||||||||||||||||
|
|
|
|
|
|
|
|
|
|
|
| |||||||||||||
Net deferred tax assets/(liabilities) | — | — | (383,444 | ) | (277,096 | ) | (383,444 | ) | (277,096 | ) | ||||||||||||||
|
|
|
|
|
|
|
|
|
|
|
| |||||||||||||
Movement in Temporary Differences During the Year
Particulars | Balance as on April 1, 2012 | Recognised in profit or loss | Recognised in other comprehensive income | Effects of movement in foreign exchange rates | Balance as on March 31, 2013 | Recognised in profit or loss | Recognised in other comprehensive income | Effects of movement in foreign exchange rates | Balance as on March 31, 2014 | |||||||||||||||||||||||||||
| (in USD) | ||||||||||||||||||||||||||||||||||||
Property, plant and equipment | (125,942 | ) | (253,111 | ) | — | 6,231 | (372,822 | ) | (46,796 | ) | — | 32,641 | (386,977 | ) | ||||||||||||||||||||||
Intangible assets | (293,411 | ) | (119,091 | ) | — | (395,848 | ) | (808,350 | ) | (1,561,024 | ) | — | 29,124 | (2,340,250 | ) | |||||||||||||||||||||
Trade and other receivables | 349,526 | (333,726 | ) | — | (15,800 | ) | — | — | — | — | — | |||||||||||||||||||||||||
Other current assets | 167,246 | (159,686 | ) | — | (7,560 | ) | — | — | — | — | — | |||||||||||||||||||||||||
Employee benefits | 221,215 | (197,415 | ) | (13,800 | ) | (10,000 | ) | — | — | — | — | — | ||||||||||||||||||||||||
Other non-current liabilities | 89,136 | (85,107 | ) | — | (4,029 | ) | — | — | — | — | ||||||||||||||||||||||||||
Minimum alternate tax | 930,428 | (888,370 | ) | — | (42,058 | ) | — | — | — | — | — | |||||||||||||||||||||||||
Tax loss carry forwards | 4,559,694 | (3,559,628 | ) | — | (202,338 | ) | 797,728 | 1,714,168 | — | (61,765 | ) | 2,450,131 | ||||||||||||||||||||||||
Share based payments | 2,580,788 | (2,464,129 | ) | — | (116,659 | ) | — | — | — | — | — | |||||||||||||||||||||||||
Others | 414,162 | (395,441 | ) | — | (18,721 | ) | — | — | — | — | ||||||||||||||||||||||||||
|
|
|
|
|
|
|
|
|
|
|
|
|
|
|
|
|
| |||||||||||||||||||
Total | 8,892,842 | (8,455,704 | ) | (13,800 | ) | (806,782 | ) | (383,444 | ) | 106,348 | — | — | (277,096 | ) | ||||||||||||||||||||||
|
|
|
|
|
|
|
|
|
|
|
|
|
|
|
|
|
| |||||||||||||||||||
MAKEMYTRIP LIMITED
NOTES TO THE CONSOLIDATED FINANCIAL STATEMENTS — (Continued)
Movement in Temporary Differences During the Year
| Balance as on | Recognised in | Recognised in other | Effects of movement in foreign | Balance as on March 31, | Recognised in | Recognised in other | Effects of movement in foreign exchange | Balance as on March | ||||||||||||||||||||||||||||
Particulars | April 1, 2010 | profit or loss | income | exchange rates | 2011 | profit or loss | income | rates | 31, 2012 | |||||||||||||||||||||||||||
| (in USD) | ||||||||||||||||||||||||||||||||||||
Property, plant and equipment | (96,540 | ) | 45,771 | — | 11,252 | (39,517 | ) | (98,597 | ) | — | 12,172 | (125,942 | ) | |||||||||||||||||||||||
Intangible assets | (483,058 | ) | 38,672 | — | 4,722 | (439,664 | ) | 196,395 | — | (50,142 | ) | (293,411 | ) | |||||||||||||||||||||||
Trade and other receivables | 80,636 | (79,273 | ) | — | (1,363 | ) | — | 376,613 | — | (27,087 | ) | 349,526 | ||||||||||||||||||||||||
Other current assets | 52,305 | 38,301 | — | 144 | 90,750 | 94,995 | — | (18,499 | ) | 167,246 | ||||||||||||||||||||||||||
Employee benefits | 143,654 | 48,486 | 24,514 | 27 | 216,681 | 42,435 | (7,535 | ) | (30,366 | ) | 221,215 | |||||||||||||||||||||||||
Other non-current liabilities | 74,147 | (5,068 | ) | — | (473 | ) | 68,606 | 31,625 | — | (11,095 | ) | 89,136 | ||||||||||||||||||||||||
Minimum alternate tax | — | 174,950 | — | 2,004 | 176,954 | 836,378 | — | (82,904 | ) | 930,428 | ||||||||||||||||||||||||||
Tax loss carry forwards | 11,809 | 2,716,235 | — | 19,310 | 2,747,354 | 2,327,152 | — | (514,812 | ) | 4,559,694 | ||||||||||||||||||||||||||
Share based payments | — | — | — | — | — | 2,780,793 | — | (200,005 | ) | 2,580,788 | ||||||||||||||||||||||||||
Others | 217,047 | (111,403 | ) | — | (2,500 | ) | 103,144 | 349,410 | — | (38,392 | ) | 414,162 | ||||||||||||||||||||||||
|
|
|
|
|
|
|
|
|
|
|
|
|
|
|
|
|
| |||||||||||||||||||
Total | — | 2,866,671 | 24,514 | 33,123 | 2,924,308 | 6,937,199 | (7,535 | ) | (961,130 | ) | 8,892,842 | |||||||||||||||||||||||||
|
|
|
|
|
|
|
|
|
|
|
|
|
|
|
|
|
| |||||||||||||||||||
| 20) | TRADE AND OTHER RECEIVABLES |
| As at March 31 | As at March 31 | |||||||||||||||
Particulars | 2011 | 2012 | 2013 | 2014 | ||||||||||||
| (in USD) | (in USD) | |||||||||||||||
Trade receivables, net | 10,890,207 | 17,985,015 | 20,776,165 | 23,637,589 | ||||||||||||
Due from employees | 95,958 | 324,612 | 222,738 | 144,131 | ||||||||||||
Security deposits | 1,243,558 | 1,647,549 | 3,459,922 | 4,181,343 | ||||||||||||
Interest accrued but not due on term deposits | 627,446 | 1,425,244 | ||||||||||||||
Interest accrued on term deposits | 1,652,568 | 1,392,588 | ||||||||||||||
|
|
|
| |||||||||||||
Total | 12,857,169 | 21,382,420 | 26,111,393 | 29,355,651 | ||||||||||||
|
|
|
| |||||||||||||
Non-current | 600,067 | 807,159 | 820,951 | 982,585 | ||||||||||||
Current | 12,257,102 | 20,575,261 | 25,290,442 | 28,373,066 | ||||||||||||
|
|
|
| |||||||||||||
Total | 12,857,169 | 21,382,420 | 26,111,393 | 29,355,651 | ||||||||||||
|
|
|
| |||||||||||||
The trade receivable consistsreceivables consist of airline, corporate and retail customers.
Security deposits include amounts paid in advance to suppliers of hotel and other services in order to guarantee the provision of those services.
The management do not consider there to be significant concentration of credit risk relating to trade and other receivables.
The Group’s exposure to credit and currency risks and impairment losses related to trade and theother receivables is disclosed in note 5 and 34.
MAKEMYTRIP LIMITED
NOTES TO THE CONSOLIDATED FINANCIAL STATEMENTS — (Continued)
| 21) | CASH AND CASH EQUIVALENTS |
| As at March 31 | As at March 31 | |||||||||||||||
Particulars | 2011 | 2012 | 2013 | 2014 | ||||||||||||
| (in USD) | (in USD) | |||||||||||||||
Cash in hand | 155,643 | 155,737 | 196,510 | 291,026 | ||||||||||||
Credit card collection in hand | 3,706,738 | 4,123,100 | 14,746,984 | 15,104,661 | ||||||||||||
Bank balances | 3,363,637 | 14,642,810 | 14,311,848 | 21,574,954 | ||||||||||||
Term deposits | 44,504,303 | 24,876,583 | 7,246,136 | 1,041,134 | ||||||||||||
|
|
|
| |||||||||||||
Cash and cash equivalents | 51,730,321 | 43,798,230 | 36,501,478 | 38,011,775 | ||||||||||||
Bank overdrafts used for cash management purposes | (3,855,977 | ) | — | 866,521 | — | |||||||||||
|
|
|
| |||||||||||||
Cash and cash equivalents in the statement of cash flows | 47,874,344 | 43,798,230 | 35,634,957 | 38,011,775 | ||||||||||||
|
|
|
| |||||||||||||
Credit card collection in hand represents the amount of collection from credit card swiped by the customers which is outstanding as at the year end and credited to Group’s bank accounts subsequent to the year end.
The Group’s exposure to interest rate risk and a sensitivity analysis for financial assets and financial liabilities is disclosed in note 5 and 34.35.
MAKEMYTRIP LIMITED
NOTES TO THE CONSOLIDATED FINANCIAL STATEMENTS — (Continued)
| 22) | TERM DEPOSITS |
| As at March 31 | As at March 31 | |||||||||||||||
| Particulars | 2011 | 2012 | 2013 | 2014 | ||||||||||||
| (in USD) | (in USD) | |||||||||||||||
Term deposits | 16,941,920 | 44,325,130 | 48,114,962 | 105,169,847 | ||||||||||||
|
|
|
| |||||||||||||
Total | 16,941,920 | 44,325,130 | 48,114,962 | 105,169,847 | ||||||||||||
|
|
|
| |||||||||||||
Non-current | 706,873 | 648,506 | 911,245 | 75,656,254 | ||||||||||||
Current | 16,235,047 | 43,676,624 | 47,203,717 | 29,513,593 | ||||||||||||
|
|
|
| |||||||||||||
Total | 16,941,920 | 44,325,130 | 48,114,962 | 105,169,847 | ||||||||||||
|
|
|
| |||||||||||||
As of March 31, 2012,2014, term deposits includes USD 536,960595,225 (March 31, 2011:2013: USD 661,960)801,960) against which mainly letter of credit has been issued to various airlines.
As of March 31, 2012,2014, term deposits includes USD 14,715,4698,994,698 (March 31, 2011:2013: USD 13,112,941)21,990,019) pledged with banks against bank guarantees and bank overdraft facility.
| 23) | OTHER CURRENT ASSETS |
| As at March 31 | As at March 31 | |||||||||||||||
Particulars | 2011 | 2012 | 2013 | 2014 | ||||||||||||
| (in USD) | (in USD) | |||||||||||||||
Advance to vendors | 16,685,798 | 20,062,884 | 20,776,327 | 31,951,731 | ||||||||||||
Prepaid expenses | 1,114,710 | 1,572,607 | 1,532,860 | 1,631,939 | ||||||||||||
Prepaid lease rentals | 51,521 | 79,790 | 93,843 | 90,861 | ||||||||||||
Other assets | — | 77,495 | 1,256,185 | 1,064,999 | ||||||||||||
| �� |
|
|
|
| ||||||||||||
Total | 17,852,029 | 21,792,776 | 23,659,215 | 34,739,530 | ||||||||||||
|
|
|
| |||||||||||||
| 24) | OTHER NON-CURRENT ASSETS |
| As at March 31 | ||||||||
Particulars | 2013 | 2014 | ||||||
| (in USD) | ||||||||
Prepaid lease rentals | 527,391 | 476,326 | ||||||
|
|
|
| |||||
Total | 527,391 | 476,326 | ||||||
|
|
|
| |||||
MAKEMYTRIP LIMITED
NOTES TO THE CONSOLIDATED FINANCIAL STATEMENTS — (Continued)
| As at March 31 | ||||||||
Particulars | 2011 | 2012 | ||||||
| (in USD) | ||||||||
Prepaid lease rentals | 219,021 | 449,559 | ||||||
|
|
|
| |||||
Total | 219,021 | 449,559 | ||||||
|
|
|
| |||||
| 25) | CAPITAL AND RESERVES |
Share Capital and Share Premium
| Ordinary Shares | ||||||||||||
Particulars | Number | Share capital | Share premium | |||||||||
| (in USD) | ||||||||||||
Balance as at April 1, 2010 | 17,542,120 | 8,767 | 11,356,522 | |||||||||
Issue of ordinary shares through initial public offering, net of issuance costs | 4,153,846 | 2,077 | 54,039,405 | |||||||||
Convertible and redeemable preference shares converted to ordinary shares at initial public offering | 12,324,460 | 6,162 | 41,179,783 | |||||||||
Shares issued during the year on exercise of options | 1,079,213 | 540 | 4,965,951 | |||||||||
|
|
|
|
|
| |||||||
Balance as at March 31, 2011 | 35,099,639 | 17,546 | 111,541,661 | |||||||||
|
|
|
|
|
| |||||||
Balance as at April 1, 2011 | 35,099,639 | 17,546 | 111,541,661 | |||||||||
Issue of ordinary shares through follow-on public offering, net of issuance costs | 1,546,777 | 773 | 36,276,441 | |||||||||
Shares issued during the year on exercise of options | 513,189 | 257 | 2,326,010 | |||||||||
|
|
|
|
|
| |||||||
Balance as at March 31, 2012 | 37,159,605 | 18,576 | 150,144,112 | |||||||||
|
|
|
|
|
| |||||||
| Ordinary Shares* | ||||||||||||
Particulars | Number | Share capital | Share premium | |||||||||
| (in USD) | ||||||||||||
Balance as at April 1, 2012 | 37,159,605 | 18,576 | 150,144,112 | |||||||||
Own shares acquired | (40,142 | ) | — | — | ||||||||
Shares issued during the year on exercise of share based awards | 233,503 | 116 | 1,250,609 | |||||||||
Issue of ordinary shares related to business combination | 209,050 | 105 | 2,347,842 | |||||||||
|
|
|
|
|
| |||||||
Balance as at March 31, 2013 | 37,562,016 | 18,797 | 153,742,563 | |||||||||
|
|
|
|
|
| |||||||
Balance as at April 1, 2013 | 37,562,016 | 18,797 | 153,742,563 | |||||||||
Issue of ordinary shares through follow-on public offering, net of issuance costs | 3,325,000 | 1,663 | 73,431,390 | |||||||||
Own shares acquired | (100 | ) | — | — | ||||||||
Shares issued during the year on exercise of share based awards | 751,183 | 376 | 11,249,546 | |||||||||
|
|
|
|
|
| |||||||
Balance as at March 31, 2014 | 41,638,099 | 20,836 | 238,423,499 | |||||||||
|
|
|
|
|
| |||||||
On July 22, 2010, the Group effected a 20-for-one share split which was approved by the shareholders, with respect to all ordinary and convertible and redeemable preference shares, as well as a 20-for-one adjustment with respect to the number of ordinary shares underlying share options. All share and per share data provided herein gives effect to this stock split, applied retroactively.
| * | Par value of USD 0.0005 per share |
On August 17, 2010, the Company completed the initial public offering of its ordinary shares on National Association of Securities Dealers Automated Quotation System (NASDAQ), pursuant to which the Company issued and sold 3,846,154 ordinary shares and certain of its existing shareholders (referred to as the “Selling Shareholders”) sold 1,153,846 ordinary shares at a price of USD 14 per share. The offering resulted in gross proceeds of USD 53,846,156 and net proceeds of USD 50,076,925 to the Company and gross proceeds of USD 16,153,844 and net proceeds of USD 15,023,075 to the Selling Shareholders, after deducting underwriting discounts and commissions. Additionally, the Company incurred offering related expenses of approximately USD 2,128,176. The underwriters also exercised their option to purchase 307,692 additional ordinary shares from the Company and 442,308 additional ordinary shares from the Selling Shareholders at the initial offering price of USD 14 per share to cover over-allotments, resulting in additional gross proceeds of USD 4,307,688 and net proceeds of USD 4,006,150 to the Company and additional gross proceeds of USD 6,192,312 and net proceeds of USD 5,758,850 to the Selling Shareholders, after deducting underwriting discounts and commissions.
On August 17, 2010, 6,577,260 Series A convertible and redeemable preference share of a par value USD 0.0005 each, 2,966,300 Series B convertible and redeemable preference share of a par value USD 0.0005 each, and 2,780,900 Series C convertible and redeemable preference share of a par value USD 0.0005 each were converted into 12,324,460 ordinary shares of a par value USD 0.0005 each. Accordingly, the carrying value of non-derivative liability component of convertible and redeemable preference shares as at the date of conversion of USD 41,185,945 has been reclassified to equity.
MAKEMYTRIP LIMITED
NOTES TO THE CONSOLIDATED FINANCIAL STATEMENTS — (Continued)
over-allotments.
On June 2, 2011, the Company completed the follow-on public offering of its ordinary shares on NASDAQ, pursuant to which the Company issued and sold 1,450,000 ordinary shares and certain of its existing shareholders (referred to as the “Selling Shareholders”) sold 3,794,000 ordinary shares at a price of USD 24 per share. The offering resulted in gross proceeds of USD 34,800,000 and net proceeds of USD 33,669,000 to the Company and gross proceeds of USD 91,056,000 and net proceeds of USD 88,096,680 to the Selling Shareholders, after deducting underwriting discounts and commissions. Additionally, the Company incurred offering related expenses of approximately USD 518,942. Further on June 29, 2011, the underwriters exercised their option to purchase 96,777 additional ordinary shares from the Company and 253,223 additional ordinary shares from the Selling Shareholders at the follow-on offering price of USD 24 per share to cover over-allotments.
On November 6, 2012, the Company issued 209,050 shares as a part of the initial consideration for the acquisition of Hotel Travel Group.
In December 2012, the Company purchased 40,142 of its own shares from the open market at the prevailing market price at different dates for USD 525,098, including directly attributable costs. In May 2013, the Company purchased 100 of its own shares from the open market at the prevailing market price for USD 1,252, including directly attributable costs.
MAKEMYTRIP LIMITED
NOTES TO THE CONSOLIDATED FINANCIAL STATEMENTS — (Continued)
On March 19, 2014, the Company completed the follow-on public offering of its ordinary shares on NASDAQ, pursuant to which Company issued and sold 3,000,000 ordinary shares and certain of its existing shareholders (referred to as the “Selling Shareholders”) sold 2,500,000 ordinary shares at a price of USD 23 per share. The offering resulted in gross proceeds of USD 69,000,000 and net proceeds of USD 66,671,250 to the Company, and gross proceeds of USD 57,500,000 and net proceeds of USD 55,559,375 to the Selling Shareholders, after deducting underwriting commissions. Additionally, the Company incurred offering related expenses of approximately USD 851,607. Further, the underwriters exercised their option to purchase 325,000 additional ordinary shares from the Company and 500,000 additional ordinary shares from the Selling Shareholders at the follow-on offering price of USD 23 per share to cover over-allotments, resulting in additional gross proceeds of USD 2,322,6487,475,000 and net proceeds of USD 2,247,1627,222,719 to the Company, and additional gross proceeds of USD 6,077,35211,500,000 and net proceeds of USD 5,879,83811,111,875 to the Selling Shareholders, after deducting underwriting discounts and commissions.
The Company presently has only one class of ordinary shares. For all matters submitted to vote in a shareholders meeting of the Company, every holder of an ordinary share as reflected in the records of the Company on the date of the shareholders meeting shall have one vote in respect of each share held.
Mauritius law mandates that any dividends shall be declared out of the distributable profits, after having set off accumulated losses at the beginning of the accounting period and no distribution may be made unless the Group’s board of directors is satisfied that upon the distribution being made (1) the Company is able to pay its debts as they become due in the normal course of business and (2) the value of the Company’s assets is greater than the sum of (a) the value of its liabilities and (b) Company’s stated capital. Should the Company declare and pay any dividends on ordinary shares, such dividends will be paid in USD to each holder of ordinary shares in proportion to the number of shares held to the total ordinary shares outstanding as on that date.
In the event of liquidation of the Company, all preferential amounts, if any, shall be discharged by the Company. The remaining assets of the Company shall be distributed to the holders of equity shares in proportion to the number of shares held to the total equity shares outstanding as on that date.
Foreign currency translation reserve
The translation reserve comprises foreign currency differences arising from the translation of the financial statements of the Indian, Singapore, Malaysia, the Netherlands, Thailand, U.A.E, Israel, Canada and MalaysiaChina subsidiaries.
| 26) | ACQUISITION OF NON-CONTROLLING INTERESTS |
In December 2010, the Group acquired an additional 0.01% interest in its Indian subsidiary (MakeMyTrip (India) private Limited) for USD 325,140 in cash, increasing its ownership from 99.98% to 99.99%. The Group recognised a decrease in non-controlling interest of USD 6,545 and an increase in accumulated deficit of USD 318,595.
In February 2012, the Group acquired an additional 3.42% interest in its Singapore subsidiary, (LuxuryLuxury Tours & Travel Pte Ltd)Ltd (LTT) through subscription of new equity shares issued by the subsidiary for USD 812,062 in cash, increasing its ownership from 79.36% to 82.78%. The Group recognised an increase in non-controlling interest of USD 148,425 and an increase in accumulated deficit of USD 148,425. Further, in August 2012, the Group acquired the remaining shares held by a shareholder of LTT for USD 792,982 in cash, increasing its ownership to 100%, and recognized a decrease in non-controlling interest of USD 5,378, an increase in accumulated deficit of USD 20,871 and a decrease in translation reserve of USD 15,493.
MAKEMYTRIP LIMITED
NOTES TO THE CONSOLIDATED FINANCIAL STATEMENTS — (Continued)
| 27) | EARNINGS (LOSS) PER SHARE |
The following is the reconciliation of the income (loss) attributable to ordinary shareholders and weighted average number of ordinary shares used in the computation of basic and diluted earnings (loss) per share for the year ended March 31, 2010, 20112012, 2013 and 2012:2014:
| For the Year Ended March 31 | ||||||||||||
Particulars | 2010 | 2011 | 2012 | |||||||||
Earnings (Loss) attributable to ordinary shareholders (USD) | (6,206,239 | ) | 4,827,471 | 7,183,935 | ||||||||
Accretion of liability component of Series A convertible and redeemable preference share (USD) | — | 253,058 | — | |||||||||
Accretion of liability component of Series B convertible and redeemable preference share (USD) | — | 130,261 | — | |||||||||
Accretion of liability component of Series C convertible and redeemable preference share (USD) | — | 42,972 | — | |||||||||
Net change in fair value of derivative on Series B convertible and redeemable preference share (USD) | — | (22,305 | ) | — | ||||||||
Net change in fair value of derivative on Series C convertible and redeemable preference share (USD) | — | (26,077 | ) | — | ||||||||
|
|
|
|
|
| |||||||
Earnings (Loss) attributable to ordinary shareholders – dilutive (USD) | (6,206,239 | ) | 5,205,380 | 7,183,935 | ||||||||
Weighted average number of ordinary shares outstanding used in computing basic earnings (loss) per share | 17,521,120 | 28,320,901 | 36,682,240 | |||||||||
Dilutive effect of share based awards (Nos.) | — | 1,935,921 | 1,551,830 | |||||||||
Dilutive effect of convertible securities (Nos.) | ||||||||||||
- Series A convertible and redeemable preference share | — | 2,504,765 | — | |||||||||
- Series B convertible and redeemable preference share | — | 1,129,632 | — | |||||||||
- Series C convertible and redeemable preference share | — | 1,059,028 | — | |||||||||
|
|
|
|
|
| |||||||
Weighted average number of ordinary shares outstanding used in computing dilutive earnings (loss) per share | 17,521,120 | 34,950,246 | 38,234,070 | |||||||||
Earnings (Loss) per share (USD) | ||||||||||||
Basic | (0.35 | ) | 0.17 | 0.20 | ||||||||
Diluted | (0.35 | ) | 0.15 | 0.19 | ||||||||
| For the Year Ended March 31 | ||||||||||||
Particulars | 2012 | 2013 | 2014 | |||||||||
Earnings (Loss) attributable to ordinary shareholders (USD) | 7,183,935 | (27,592,521 | ) | (20,934,330 | ) | |||||||
Weighted average number of ordinary shares outstanding used in computing basic earnings (loss) per share | 36,682,240 | 37,315,434 | 37,832,246 | |||||||||
Dilutive effect of share based awards (Nos.) | 1,551,830 | — | — | |||||||||
|
|
|
|
|
| |||||||
Weighted average number of ordinary shares outstanding used in computing dilutive earnings (loss) per share | 38,234,070 | 37,315,434 | 37,832,246 | |||||||||
Earnings (Loss) per share (USD) | ||||||||||||
Basic | 0.20 | (0.74 | ) | (0.55 | ) | |||||||
Diluted | 0.19 | (0.74 | ) | (0.55 | ) | |||||||
AtAs at March 31, 2012, Nil employee2014, 2,659,852 (March, 2013: 1,753,701 and March 2012: Nil) issuable ordinary shares including employees share based awards (March 31, 2011: Nil and March 31, 2010: 2,598,800) and Nil Series A convertible and redeemable preference shares (March 31, 2011: Nil and March 31, 2010: 6,577,260), Nil Series B convertible and redeemable preference shares (March 31, 2011: Nil and March 31, 2010: 2,966,300) and Nil Series C convertible and redeemable preference shares (March 31, 2011: Nil and March 31, 2010: 2,780,900) were excluded from the diluted weighted average number of ordinary shares calculation as their effect would have been anti-dilutive.
On July 22, 2010, the Group effected a 20-for-one share split which was approved by the shareholders, with respect to all ordinary and convertible and redeemable preference shares, as well as a 20-for-one adjustment with respect to the number of ordinary shares underlying share options. All share and per share data provided herein gives effect to this share split applied retroactively.
MAKEMYTRIP LIMITED
NOTES TO THE CONSOLIDATED FINANCIAL STATEMENTS — (Continued)
| 28) | LOANS AND BORROWINGS |
This note provides information about the contractual terms of Group’s interest bearing loans and borrowings, which are measured at amortized cost. For more information about the Group’s exposure to interest rate, foreign currency and liquidity risk, see note 5 and 34.
MAKEMYTRIP LIMITED
NOTES TO THE CONSOLIDATED FINANCIAL STATEMENTS — (Continued)
| As at March 31 | As at March 31 | |||||||||||||||
Particulars | 2011 | 2012 | 2013 | 2014 | ||||||||||||
| (in USD) | (in USD) | |||||||||||||||
Non-current liabilities | ||||||||||||||||
Finance lease liabilities | 19,027 | 98,248 | 55,765 | 24,369 | ||||||||||||
Secured bank loans | 129,896 | 79,032 | 228,668 | 178,739 | ||||||||||||
|
|
|
| |||||||||||||
Non-current portion of loans and borrowings | 148,923 | 177,280 | 284,433 | 203,108 | ||||||||||||
|
|
|
| |||||||||||||
| As at March 31 | As at March 31 | |||||||||||||||
Particulars | 2011 | 2012 | 2013 | 2014 | ||||||||||||
| (in USD) | (in USD) | |||||||||||||||
Current liabilities | ||||||||||||||||
Current portion of secured bank loans | 49,315 | 46,407 | 108,310 | 96,422 | ||||||||||||
Current portion of finance lease liabilities | 11,319 | 35,676 | 27,149 | 18,583 | ||||||||||||
|
|
|
| |||||||||||||
Current portion of loans and borrowings | 60,634 | 82,083 | 135,459 | 115,005 | ||||||||||||
|
|
|
| |||||||||||||
Terms and debt repayment schedule
Terms and conditions of outstanding loans were as follows:
| As at March 31, 2011 | As at March 31, 2012 | As at March 31, 2013 | As at March 31, 2014 | |||||||||||||||||||||||||||||||||||||||||||||||||
| Interest | Year of | Original | Carrying | Original | Carrying | Interest | Year of | Original | Carrying | Original | Carrying | |||||||||||||||||||||||||||||||||||||||||
Particulars | Currency | rate | maturity | value | amount | value | amount | Currency | rate | maturity | value | amount | value | amount | ||||||||||||||||||||||||||||||||||||||
| (in USD) | (in USD) | |||||||||||||||||||||||||||||||||||||||||||||||||||
Secured bank loans | INR | 9% - 13% | 2012 - 2016 | 225,459 | 179,211 | 201,439 | 125,439 | INR | 9% - 13% | 2014 - 2020 | 357,729 | 251,230 | 378,913 | 227,660 | ||||||||||||||||||||||||||||||||||||||
Finance lease liabilities | INR | 10% - 14% | 2012 - 2013 | 93,118 | 30,346 | 43,506 | 16,581 | SGD | 3.70% | 2014 | 32,250 | 16,124 | — | — | ||||||||||||||||||||||||||||||||||||||
Secured bank loans | THB | 7.25% | 2015 | 170,853 | 85,748 | 153,844 | 47,501 | |||||||||||||||||||||||||||||||||||||||||||||
Finance lease liabilities | SGD | 3.76%- 3.77% | 2010-2017 | — | — | 156,025 | 117,343 | THB | 4.35% - 7.60% | 2015 - 2016 | 91,010 | 66,790 | 81,950 | 42,952 | ||||||||||||||||||||||||||||||||||||||
The bank loans are secured over motor vehicles with a carrying amount of USD 168,573280,866 as at March 31, 20122014 (March 31, 2011:2013: USD 221,179)293,291).
The finance lease liabilities are secured over motor vehicles with a carrying amount of USD 177,33457,603 as at March 31, 20122014 (March 31, 2011:2013: USD 73,704)89,630).
MAKEMYTRIP LIMITED
NOTES TO THE CONSOLIDATED FINANCIAL STATEMENTS — (Continued)
Finance Lease Liabilities
Finance lease liabilities are as follows:
| As at March 31, 2011 | As at March 31, 2012 | |||||||||||||||||||||||||||||||||||||||||||||||
| Future | Present value of | Future | Present value of | |||||||||||||||||||||||||||||||||||||||||||||
| minimum lease | minimum lease | minimum lease | minimum lease | As at March 31, 2013 | As at March 31, 2014 | |||||||||||||||||||||||||||||||||||||||||||
| Particulars | payments | Interest | payments | payments | Interest | payments | Future minimum lease payments | Interest | Present value of minimum lease payments | Future minimum lease payments | Interest | Present value of minimum lease payments | ||||||||||||||||||||||||||||||||||||
| (in USD) | (in USD) | |||||||||||||||||||||||||||||||||||||||||||||||
Less than one year | 14,288 | 2,969 | 11,319 | 39,950 | 4,274 | 35,676 | 32,223 | 5,074 | 27,149 | 21,208 | 2,625 | 18,583 | ||||||||||||||||||||||||||||||||||||
Between one and five years | 20,641 | 1,614 | 19,027 | 103,528 | 11,261 | 92,267 | 60,916 | 5,151 | 55,765 | 25,837 | 1,468 | 24,369 | ||||||||||||||||||||||||||||||||||||
More than five years | — | — | — | 6,548 | 567 | 5,981 | — | — | — | — | — | — | ||||||||||||||||||||||||||||||||||||
|
|
|
|
|
|
|
|
|
|
|
| |||||||||||||||||||||||||||||||||||||
Total | 34,929 | 4,583 | 30,346 | 150,026 | 16,102 | 133,924 | 93,139 | 10,225 | 82,914 | 47,045 | 4,093 | 42,952 | ||||||||||||||||||||||||||||||||||||
|
|
|
|
|
|
|
|
|
|
|
| |||||||||||||||||||||||||||||||||||||
The Group has taken certain vehicles on lease and which have an option for the Group to purchase the vehicles as per terms of the lease agreements.
MAKEMYTRIP LIMITED
NOTES TO THE CONSOLIDATED FINANCIAL STATEMENTS — (Continued)
Credit Facility
The group has fund based limits with various banks amounting to USD 30,442,00119,227,393 as at March 31, 20122014 (March 31, 2011:2013: USD 20,978,063)21,705,236). The group has drawn down from its outstanding limit amounting to USD Nil as at March 31, 20122014 (March 31, 2011:2013: USD 3,855,977)866,521) (refer note 21).
MAKEMYTRIP LIMITED
NOTES TO THE CONSOLIDATED FINANCIAL STATEMENTS — (Continued)
Convertible and redeemable preference shares
The compound financial instrument issued by the Group comprises convertible and redeemable preference shares (series A, B and C) with a discretionary, non-cumulative 8% dividend that can be converted into ordinary share capital at the option of the holder. One preference share will be converted into one ordinary share. The details of convertible and redeemable preference share are as follows:
Particulars | Convertible and Redeemable Preference Share — Series A | Convertible and Redeemable Preference Share — Series B | Convertible and Redeemable Preference Share — Series C | |||||||||
| (in USD) | ||||||||||||
Number of shares | 6,577,260 | 2,966,300 | 2,780,900 | |||||||||
Subscription amount | 13,000,000 | 15,000,579 | 15,000,175 | |||||||||
This compound instrument also has following adjustment clauses:
if subsequent to the issuance of the preference shares, the Group issues securities to parties (except for issue of securities discussed below*) at a price lower than the issue price of the original preference shares but higher than USD 1.08, then the Group is obligated to issue additional preference shares to the original preference shareholders, such that the average price of all preference shares held by the original Series A, B and C preference shareholders is equal to the purchase price of the new Series A, B and C preference shares issued.
if subsequent to the issuance of the preference shares, the Group issues securities to parties (except for issue of securities discussed below*) with a conversion price lower than the issue price of the original preference shares but higher than USD 1.08, then the Group is obligated to issue additional preference shares to the original preference shareholders such that the average price of all preference shares held by the original Series A, B and C shareholders is equal to the conversion price of the new Series A, B and C preference shares issued.
if subsequent to the issuance of the preference shares, except for any (a) ordinary shares issued to the employees of the Group under any employee share option plan approved by the Board; and (b) ordinary shares issued to one of the ordinary shareholder, the Group issues additional securities to any person at a price per security that is lower than USD 1.08 or the price at which such security is convertible into ordinary or preference shares is less than USD 1.08, then the Group is obligated to issue additional ordinary shares or preferred shares to the original preference shareholders such that the average price of all ordinary or preference shares held by the original preference shareholders is equal to the purchase/conversion price of the new ordinary or preference share issuance price.
* Except for any Securities issued (a) to employees, consultants, officers or directors of the Group pursuant to preferred share option plans or preferred stock purchase plans (in each case, approved by the Board); (b) to financial institutions in connection with commercial credit arrangements, equipment financing or other similar financing arrangements, (c) pursuant to an Initial Public Offering (“IPO”); (d) pursuant to any stock splits, stock dividends or like transactions; or (e) to a non-financial corporation in connection with a license, distribution, business development, or for other similar arrangements.
The preference shares do not have a mandatory maturity period, however within the four years from the subscription date the preference shares may be redeemed if such redemption has been approved by the majority shareholders of the respective series. If the IPO does not happen within four years from the subscription date then the Group may also redeem such shares at any time after four years at a price equal to the purchase price of the preference shares.
MAKEMYTRIP LIMITED
NOTES TO THE CONSOLIDATED FINANCIAL STATEMENTS — (Continued)
The adjustment clauses as stated above represents a price protection feature that protects the original preference shareholders from declines in the market value of the Group’s securities. This clause may result in the entity issuing variable number of shares on conversion hence, represents a liability. Equity instruments are instruments that evidence a residual interest in the assets of an entity after deducting all of its liabilities. Therefore, when the initial carrying amount of a compound financial instrument is allocated to its equity and liability components, the equity component is assigned the residual amount after deducting from the fair value of the instrument as a whole the amount separately determined for the liability component. The value of any derivative features (such as conversion option) embedded in the compound financial instrument other than the equity component is included in the liability component. The sum of the carrying amounts assigned to the liability and equity components on initial recognition is always equal to the fair value that would be ascribed to the instrument as a whole. No gain or loss arises from initially recognizing the components of the instrument separately.
The equity component is recognized initially at the difference between the fair value of the compound financial instrument as a whole and the fair value of the liability component (including the embedded derivative liability). The fair value of the financial liability has been initially recognized at the amount payable on demand, discounted from the first date that the amount could be required to be paid. As the preference shareholders can demand repayment of the purchase price at any time subsequent to issuance, the fair value of the liability component has been calculated at not less than the nominal amount of the preference shares issued. From the liability component that includes the embedded derivative liability the fair value of the derivative liability is separated and the balance host contract is the liability. Any directly attributable transaction costs are allocated to the liability and equity components in proportion to their initial carrying amounts. Subsequent to initial recognition, the liability component of a compound financial instrument is measured at amortized cost using the effective interest method. The equity component of a compound financial instrument is not re-measured subsequent to initial recognition. Separable Embedded Derivatives are recognized initially at fair value; attributable transaction costs are recognized in profit or loss as incurred. Fair value of the derivative is determined on the inception using binomial lattice method. Subsequent to initial recognition, derivatives are measured at fair value, and changes therein are accounted through income statement.
The carrying amount of the liability component of convertible and redeemable preference share is summarized below:
| ||||
| ||||
| ||||
| ||||
| ||||
On July 22, 2010, the Group effected a 20-for-one share split which was approved by the shareholders, with respect to all ordinary and convertible and redeemable preference shares, as well as a 20-for-one adjustment with respect to the number of ordinary shares underlying share options. The number of convertible and redeemable preference shares and minimum issue price of USD 1.08 gives effect to this stock split, applied retroactively.
MAKEMYTRIP LIMITED
NOTES TO THE CONSOLIDATED FINANCIAL STATEMENTS — (Continued)
| 29) | OTHER CURRENT LIABILITIES |
| As at March 31 | ||||||||||||||||
Particulars | As at March 31 | |||||||||||||||
| 2011 | 2012 | 2013 | 2014 | |||||||||||||
| (in USD) | (in USD) | |||||||||||||||
Statutory liabilities | 1,706,618 | 1,876,980 | 1,782,279 | 6,428,045 | ||||||||||||
Deferred rent liabilities | — | 56,154 | 29,984 | 57,822 | ||||||||||||
Deferred consideration | 699,425 | 1,178,348 | ||||||||||||||
Other liabilities | — | 168,432 | — | 743,867 | ||||||||||||
|
|
|
| |||||||||||||
Total | 1,706,618 | 2,101,566 | 2,511,688 | 8,408,082 | ||||||||||||
|
|
|
| |||||||||||||
| 30) | OTHER NON-CURRENT LIABILITIES |
| As at March 31 | ||||||||||||||||
Particulars | As at March 31 | |||||||||||||||
| 2011 | 2012 | 2013 | 2014 | |||||||||||||
| (in USD) | (in USD) | |||||||||||||||
Deferred rent liabilities | 503,320 | 600,607 | 674,130 | 691,184 | ||||||||||||
Deferred consideration | 4,180,436 | 5,338,112 | ||||||||||||||
Other liabilities | — | 887,051 | 1,949,645 | 1,638,370 | ||||||||||||
|
|
|
| |||||||||||||
Total | 503,320 | 1,487,658 | 6,804,211 | 7,667,666 | ||||||||||||
|
|
|
| |||||||||||||
| 31) |
| As at March 31 | ||||||||
Particulars | 2011 | 2012 | ||||||
| (in USD) | ||||||||
Defined benefit plan | 478,026 | 481,313 | ||||||
Other long term employee benefit (liability for compensated absences) | 189,024 | 199,822 | ||||||
|
|
|
| |||||
Total | 667,050 | 681,135 | ||||||
|
|
|
| |||||
Defined Contribution Plan
| As at March 31 | ||||||||
Particulars | 2013 | 2014 | ||||||
| (in USD) | ||||||||
Global Distribution System provider | — | 2,801,515 | ||||||
Loyality programme | 37,901 | 888,316 | ||||||
|
|
|
| |||||
Total | 37,901 | 3,689,831 | ||||||
|
|
|
| |||||
Non-current | — | 2,353,593 | ||||||
Current | 37,901 | 1,336,238 | ||||||
|
|
|
| |||||
Total | 37,901 | 3,689,831 | ||||||
|
|
|
| |||||
The Group’s provident fund schemeGroup requires the services of a Global Distribution System (“GDS”) provider for facilitating the booking of airline tickets on its website or other distribution channels. There are various GDS companies like Abacus, Amadeus, World span, Galileo etc. These companies usually pay upfront fee to travel agents for using their system as they get paid by airlines on the basis of airline tickets booked through their GDS, which is a defined contribution plan. The following table sets outrecognized as air ticketing revenue on the disclosure in respectproportion of define contribution plan:
| For the Year Ended March 31 | ||||||||||||
Particulars | 2010 | 2011 | 2012 | |||||||||
| (in USD) | ||||||||||||
Contribution to provident fund | 401,687 | 631,670 | 955,497 | |||||||||
|
|
|
|
|
| |||||||
Total | 401,687 | 631,670 | 955,497 | |||||||||
|
|
|
|
|
| |||||||
The costactual airline tickets sold over the total estimated airline tickets to be sold over the term of the agreement and the balance amount is recognisedrecognized as personnel expenses in the consolidated statements of comprehensive income (loss).deferred revenue.
MAKEMYTRIP LIMITED
NOTES TO THE CONSOLIDATED FINANCIAL STATEMENTS — (Continued)
| 32) | EMPLOYEE BENEFIT PLANS |
| As at March 31 | ||||||||
Particulars | 2013 | 2014 | ||||||
| (in USD) | ||||||||
Defined benefit plan | 693,276 | 672,792 | ||||||
Other long term employee benefit (liability for compensated absences) | 317,017 | 290,384 | ||||||
|
|
|
| |||||
Total | 1,010,293 | 963,176 | ||||||
|
|
|
| |||||
Defined Benefit Plan
The Group’s gratuity scheme for the employees of its Indian subsidiary is a defined benefit plan. Gratuity is paid as a lump sum amount to employees at retirement or termination of employment at an amount based on the respective employee’s eligible salaries and the years of employment with the Group. The following table sets out the disclosure in respect of the defined benefit plan:
| As at March 31 | As at March 31 | |||||||||||||||
Particulars | 2011 | 2012 | 2013 | 2014 | ||||||||||||
| (in USD) | (in USD) | |||||||||||||||
Present value of unfunded obligations | 478,026 | 481,313 | 693,276 | 672,792 | ||||||||||||
|
|
|
| |||||||||||||
Total | 478,026 | 481,313 | 693,276 | 672,792 | ||||||||||||
|
|
|
| |||||||||||||
Movement in the Present Value of the Defined Benefit Obligation
| For the Year Ended March 31 | ||||||||||||
Particulars | 2010 | 2011 | 2012 | |||||||||
| (in USD) | ||||||||||||
Defined benefit obligations at the beginning of the year | 131,626 | 226,909 | 478,026 | |||||||||
Current service costs | 49,368 | 84,381 | 114,678 | |||||||||
Interest on obligation | 9,362 | 20,508 | 32,478 | |||||||||
Actuarial (gain) losses in other comprehensive income | 14,431 | 73,356 | (23,223 | ) | ||||||||
Benefits paid | (1,843 | ) | (764 | ) | (54,159 | ) | ||||||
Past service cost | — | 72,068 | — | |||||||||
Effects of movement in exchange rate | 23,965 | 1,568 | (66,487 | ) | ||||||||
|
|
|
|
|
| |||||||
Defined benefit obligations at the end of the year | 226,909 | 478,026 | 481,313 | |||||||||
|
|
|
|
|
| |||||||
Expense Recognised in Profit or Loss
| For the Year Ended March 31 | ||||||||||||
Particulars | 2010 | 2011 | 2012 | |||||||||
| (in USD) | ||||||||||||
Current service costs | 49,368 | 84,381 | 114,678 | |||||||||
Past service cost | — | 72,068 | — | |||||||||
Interest on obligation | 9,362 | 20,508 | 32,478 | |||||||||
|
|
|
|
|
| |||||||
Total | 58,730 | 176,957 | 147,156 | |||||||||
|
|
|
|
|
| |||||||
The expense is recognised in personnel expenses in the consolidated statements of comprehensive income (loss).
Actuarial Gains and (Losses) Recognised in Other Comprehensive Income
| For the Year Ended March 31 | ||||||||||||
Particulars | 2010 | 2011 | 2012 | |||||||||
| (in USD) | ||||||||||||
Cumulative amount at April 1 | 109,110 | 94,679 | 21,323 | |||||||||
Recognised during the year | (14,431 | ) | (73,356 | ) | 23,223 | |||||||
|
|
|
|
|
| |||||||
Cumulative amount at March 31 | 94,679 | 21,323 | 44,546 | |||||||||
|
|
|
|
|
| |||||||
| As at March 31 | ||||||||
Particulars | 2013 | 2014 | ||||||
| (in USD) | ||||||||
Defined benefit obligation at the beginning of the year | 481,313 | 693,276 | ||||||
Current service cost | 124,972 | 155,035 | ||||||
Interest cost | 36,398 | 46,223 | ||||||
Actuarial (gains) losses arising from: | ||||||||
- financial assumptions | 10,730 | (28,363 | ) | |||||
- experience adjustment | 115,018 | (35,636 | ) | |||||
Benefits paid | (52,401 | ) | (96,620 | ) | ||||
Effects of movement in exchange rate | (22,754 | ) | (61,123 | ) | ||||
|
|
|
| |||||
Defined benefit obligations at the end of the year | 693,276 | 672,792 | ||||||
|
|
|
| |||||
MAKEMYTRIP LIMITED
NOTES TO THE CONSOLIDATED FINANCIAL STATEMENTS — (Continued)
Expense Recognised in Profit or Loss
| For the Year Ended March 31 | ||||||||||||
Particulars | 2012 | 2013 | 2014 | |||||||||
| (in USD) | ||||||||||||
Current service costs | 114,678 | 124,972 | 155,035 | |||||||||
Interest on obligation | 32,478 | 36,398 | 46,223 | |||||||||
|
|
|
|
|
| |||||||
Total | 147,156 | 161,370 | 201,258 | |||||||||
|
|
|
|
|
| |||||||
The expense is recognised in personnel expenses in the consolidated statement of profit or loss and other comprehensive income (loss).
Actuarial Gains (Losses) Recognised in Other Comprehensive Income
| For the Year Ended March 31 | ||||||||||||
Particulars | 2012 | 2013 | 2014 | |||||||||
| (in USD) | ||||||||||||
Recognised during the year | 23,223 | (125,748 | ) | 63,999 | ||||||||
|
|
|
|
|
| |||||||
Total | 23,223 | (125,748 | ) | 63,999 | ||||||||
|
|
|
|
|
| |||||||
Actuarial Assumptions
Principal actuarial assumptions are given below:
| As at M arch 31 | As at March 31 | |||||||||||||||
| 2011 | 2012 | 2013 | 2014 | |||||||||||||
Discount rate (per annum) | 7.70 | % | 8.40 | % | 8.00 | % | 9.10 | % | ||||||||
Future salary increases (per annum) | 12.00 | % | 10.00 | % | 10.00 | % | 10.00 | % | ||||||||
Retirement age | 58 | 58 | 58 | 58 | ||||||||||||
Withdrawal rates | 30.00 | % | 25.00 | % | 25.00 | % | 25.00 | % | ||||||||
Weighted average duration of defined benefit obligation | 5 years | 5 years | ||||||||||||||
Assumptions regarding future mortality rates are based on LifeIndian Assured Lives Mortality (2006-08) (modified) Ultimate as published by Insurance Corporation of India (LIC) published mortality rates (1994-96) tables.Regulatory and Development Authority (IRDA).
The actuarial valuation is carried out half yearly by an independent actuary. The discount rate used for determining the present value of obligation under the defined benefit plan is determined by reference to market yields at the end of the reporting period on Indian Government Bonds. The currency and the term of the government bonds is consistent with the currency and term of the defined benefit obligation.
The salary growth rate takes into account inflation, seniority, promotion and other relevant factors on long-term basis.
MAKEMYTRIP LIMITED
NOTES TO THE CONSOLIDATED FINANCIAL STATEMENTS — (Continued)
Historical Information:Sensitivity analysis
Reasonably possible changes at the reporting date to one of the relevant actuarial assumptions, holding other assumptions constant, would have affected the defined benefit obligation by the amounts shown below:
| As at March 31 | ||||||||||||||||
Particulars | 2009 | 2010 | 2011 | 2012 | ||||||||||||
| (in USD) | ||||||||||||||||
Present value of defined benefit obligations | 133,588 | 226,909 | 478,026 | 481,313 | ||||||||||||
Experience gain (loss) adjustments arising on plan liabilities | 32,627 | 1,780 | (47,856 | ) | 6,594 | |||||||||||
Particulars | Positive (USD) | Negative (USD) | ||||||
Discount rate (1% movement) | (24,093 | ) | 25,932 | |||||
Future salary growth (1% movement) | 22,872 | (21,986 | ) | |||||
Withdrawal rate (1% movement) | (49,490 | ) | (57,816 | ) | ||||
| SHARE BASED PAYMENT |
Description of the Share-Based Payment Arrangements
Share Option Programme (Equity-Settled)
a) 2006 MakeMyTrip.com Equity Option Plan
In 2006, the Group established a share option program in India, named the ‘2006 MakeMyTrip.com Equity Option Plan’ (or ‘2006 ESOP’), which was approved by the shareholders of the Company at an extra-ordinary meeting held on December 21, 2005. The ESOP entitles the eligible employees to purchase ordinary shares of the Group’s Indian Subsidiary. The Group granted employee stock options to eligible employees on various dates.
MAKEMYTRIP LIMITED
NOTES TO THE CONSOLIDATED FINANCIAL STATEMENTS — (Continued)
Terms and Conditions of the 2006 ESOP Plan
The terms and conditions relating to the grants of the share option program are given below:
| ||||||||||||
| ||||||||||||
| ||||||||||||
| ||||||||||||
2. The stock options can be exercised within a period of 48 months from the date of vesting.
3. Options are to be settled by physical delivery of ordinary shares.
The number and weighted average exercise price of share options under 2006 ESOP plan are as follows:
| Weighted Average Exercise Price (USD) | Number of Options | |||||||
Particulars | 2010 | 2010 | ||||||
Outstanding at April 1 | 0.39 | 7,865,241 | ||||||
Forfeited and expired during the period | 0.21 | (24,224 | ) | |||||
Exercised during the period | 0.21 | (3,826 | ) | |||||
Granted during the period | — | — | ||||||
Replaced with options under MMT ESOP plan | 0.38 | (7,837,191 | ) | |||||
Outstanding at March 31 | — | — | ||||||
Exercisable at March 31 | — | — | ||||||
There arewere nil options outstanding at March 31, 2010 as all options outstanding under this plan have been replaced with options granted under the MakeMyTrip.com Equity Option Plan (“MMT ESOP plan.plan”). There have been no further issues of stock options under this plan.
b) MakeMyTrip.com Equity Option Plan
In 2000, the Group approved a share option programme in Mauritius, named the MakeMyTrip.com Equity Option Plan (“MMT ESOP Plan”). In June 2009, this plan was expanded in order to issue share options to employees of subsidiaries and directors of the group. The Group replaced certain share options to acquire shares in its Indian subsidiary held by employees at its subsidiaries with options granted under the MMT ESOP Plan.
MAKEMYTRIP LIMITED
NOTES TO THE CONSOLIDATED FINANCIAL STATEMENTS — (Continued)
Terms Total options granted under this plan were 2,703,810 during the year ended March 31, 2010. No options were granted during the year ended March 31, 2012, 2013 and Conditions of the MMT ESOP Plan2014.
The terms and conditions relating to the grants under MMT ESOP Plan are given below:
| ||||||||||||
| ||||||||||||
| ||||||||||||
| ||||||||||||
| ||||||||||||
The number and weighted average exercise price of share options under MMT ESOP plan are as follows:
Particulars | Weighted Average Exercise Price (USD) | Number of Options | Weighted Average Exercise Price (USD) | Number of Options | Weighted Average Exercise Price (USD) | Number of Options | Weighted Average Exercise Price (USD) | Number of Options | Weighted Average Exercise Price (USD) | Number of Options | Weighted Average Exercise Price (USD) | Number of Options | ||||||||||||||||||||||||||||||||||||
| 2010 | 2010 | 2011 | 2011 | 2012 | 2012 | For the Year Ended March 31 | ||||||||||||||||||||||||||||||||||||||||||
Outstanding at April 1 | — | — | 1.44 | 2,598,810 | 1.59 | 1,510,187 | ||||||||||||||||||||||||||||||||||||||||||
| 2012 | 2012 | 2013 | 2013 | 2014 | 2014 | |||||||||||||||||||||||||||||||||||||||||||
Outstanding at beginning of the year | 1.59 | 1,510,187 | 1.59 | 913,221 | 1.49 | 691,127 | ||||||||||||||||||||||||||||||||||||||||||
Forfeited and expired during the year | — | — | 1.29 | 9,410 | 1.05 | 86,000 | 1.05 | (86,000 | ) | — | — | — | — | |||||||||||||||||||||||||||||||||||
Granted during the year | 1.41 | 2,703,810 | — | — | — | — | — | — | — | — | — | — | ||||||||||||||||||||||||||||||||||||
Exercised during the year | 0.71 | 105,000 | 1.22 | 1,079,213 | 1.69 | 510,966 | 1.69 | (510,966 | ) | 1.88 | (222,094 | ) | 1.49 | (212,209 | ) | |||||||||||||||||||||||||||||||||
Outstanding at March 31 | 1.44 | 2,598,810 | 1.59 | 1,510,187 | 1.59 | 913,221 | ||||||||||||||||||||||||||||||||||||||||||
Exercisable at March 31 | 1.55 | 2,318,800 | 1.76 | 1,300,187 | 1.70 | 823,221 | ||||||||||||||||||||||||||||||||||||||||||
Outstanding at the end of the year | 1.59 | 913,221 | 1.49 | 691,127 | 1.49 | 478,918 | ||||||||||||||||||||||||||||||||||||||||||
Exercisable at the end of the year | 1.70 | 823,221 | 1.56 | 646,127 | 1.49 | 478,918 | ||||||||||||||||||||||||||||||||||||||||||
MAKEMYTRIP LIMITED
NOTES TO THE CONSOLIDATED FINANCIAL STATEMENTS — (Continued)
The options outstanding at March 31, 20122014 have an exercise price in the range of USD 0.4875 to USD 5.3940 (March 31, 2011:2013: USD 0.4875 to USD 5.3940 and March 31, 2010:2012: USD 0.00050.4875 to USD 5.3940) and a weighted average contractual life of 13 years and 84 months (March 31, 2011: 2 years and2013: 8 months and March 31, 2010: 32012: 1 years and 68 months).
Inputs for Measurement of Grant Date Fair Values of MMT ESOP Plan
The grant date fair value of the options granted to employees was measured based on the Black-Scholes formula. Expected volatility is estimated by considering historical average share price volatility of the comparable companies. The inputs used in the measurement of the fair values of the option at the date of grant during the year ended March 31, 2010 are summarized below:
| ||||
| ||||
| ||||
| ||||
| ||||
| ||||
| ||||
7,837,191 options outstanding under 2006 ESOP plan were replaced with 1,367,800 options under MMT ESOP plan which resulted in modification of the 2006 ESOP plan as defined under IFRS 2,Share — based Payment.On account of this modification, the Group has recognized USD 1,505,868 during the year ended March 31, 2010, as the incremental fair value being difference between the fair value of MMT ESOP plan and that of the 2006 ESOP plan both estimated as at the date of the modification.
Further, the Group has recognized the unamortized cost of USD 539,259 during the year ended March 31, 2010, under the 2006 ESOP plan as the options got immediately vested.
Also, the Group has recognized USD 4,726,249 during the year ended March 31, 2010, as ESOP cost for 1,336,000 fresh options granted under the MMT ESOP plan.
During the year ended March 31, 2012,2014, share based payment expense for these options recognized under personnel expenses (refer note 12) is amountingamounted to USD (25,082)29,035 (March 31, 2011:2013: USD 527,285).
On July 22, 2010, the Group effected a 20-for-one share split which was approved by the shareholders, with respect to all ordinary80,934 and convertible and redeemable preference shares, as well as a 20-for-one adjustment with respect to the number of ordinary shares underlying share options. All share and per share data provided herein gives effect to this stock split, applied retroactively.March 31, 2012: USD (25,082)).
c) Share Incentive Plan
In 2010, the Group approved a share incentive plan in Mauritius, named the MakeMyTrip 2010 Share Incentive Plan (“Share Incentive Plan”). During the year ended March 31, 2012, 2013 and 2014, the Group granted restricted share units, or RSUs, under the plan to eligible employees. Each RSU represents the right to receive one common share.
MAKEMYTRIP LIMITED
NOTES TO THE CONSOLIDATED FINANCIAL STATEMENTS — (Continued)
Terms and Conditions of the Share Incentive Plan
The terms and conditions relating to the grants under Share Incentive Plan are given below:
| Grant date/Employees entitled | Number of instruments | Vesting conditions | Contractual life of | |||||||||
| 977,693 | Refer notes | 4 – 8 years | |||||||||
RSUs granted during the year ended March 31, 2013 | 850,160 | Refer notes | 4 – 8 years | |||||||||
RSUs granted during the year ended March 31, 2014 | 828,390 | Refer notes | 4 – 8 years | |||||||||
|
| |||||||||||
Total RSU | ||||||||||||
|
| |||||||||||
Note:
1. Of the RSU granted during the year ended March 31, 2012:2014:
- 75,832 RSU1,132 (March 31, 2013: Nil and March 31, 2012: 75,832) RSUs have 25% graded vesting each six months over a 2 yearsyear period.
- 724,975 RSU438,801 (March 31, 2013: 572,349 and March 31, 2012: 724,975) RSUs have 33.33% graded vesting each year over a 3 yearsyear period.
- 174,450 RSU364,039 (March 31, 2013: 273,802 and March 31, 2012: 174,450) RSUs have graded vesting over 4 years.years: 10% on the expiry of 12 months from the grant date.date, 20% on the expiry of 24 months from the grant date.date, 30% on the expiry of 36 months from the grant date.date, 40% on the expiry of 48 months from the grant date.
- 24,418 (March 31, 2013: 4,009 and March 31, 2012: 2,436) RSUs were fully vested on the grant date.
2. The RSURSUs can be exercised within a period of 48 months from the date of vesting.
MAKEMYTRIP LIMITED
NOTES TO THE CONSOLIDATED FINANCIAL STATEMENTS — (Continued)
The number and weighted average exercise price of RSURSUs under the share incentive plan are as follows:
Weighted average (USD) | Number of RSU | |||||||||||||||||||||||||||||||
| Particulars | 2012 | 2012 | Weighted Average Exercise Price (USD) | Number of Awards | Weighted Average Exercise Price (USD) | Number of Awards | Weighted Average Exercise Price (USD) | Number of Awards | ||||||||||||||||||||||||
Outstanding as at April 1, 2011 | — | — | ||||||||||||||||||||||||||||||
Particulars | For the Year Ended March 31 | |||||||||||||||||||||||||||||||
| 2012 | 2012 | 2013 | 2013 | 2014 | 2014 | |||||||||||||||||||||||||||
Outstanding at April 1 | — | — | 0.0005 | 955,404 | 0.0005 | 1,742,604 | ||||||||||||||||||||||||||
Granted during the year | 0.0005 | 977,693 | 0.0005 | 977,693 | 0.0005 | 850,160 | 0.0005 | 828,390 | ||||||||||||||||||||||||
Forfeited and expired during the year | 0.0005 | (20,066 | ) | 0.0005 | (20,066 | ) | 0.0005 | (51,551 | ) | 0.0005 | (159,090 | ) | ||||||||||||||||||||
Exercised during the year | 0.0005 | (2,223 | ) | 0.0005 | (2,223 | ) | 0.0005 | (11,409 | ) | 0.0005 | (538,974 | ) | ||||||||||||||||||||
Outstanding as at March 31, 2012 | 0.0005 | 955,404 | ||||||||||||||||||||||||||||||
Exercisable as at March 31, 2012 | 0.0005 | 15,146 | ||||||||||||||||||||||||||||||
Outstanding at March 31 | 0.0005 | 955,404 | 0.0005 | 1,742,604 | 0.0005 | 1,872,930 | ||||||||||||||||||||||||||
Exercisable at March 31 | 0.0005 | 15,146 | 0.0005 | 292,716 | 0.0005 | 275,261 | ||||||||||||||||||||||||||
The RSU outstanding at March 31, 20122014 have an exercise price of USD 0.0005 (March 31, 2013: USD 0.0005 and March 31, 2012: USD 0.0005) and a weighted average contractual life of 5.0 years (March 31, 2013: 5.1 years and March 31, 2012: 5.7 years.years).
Inputs for Measurement of Grant Date Fair Values of Share Incentive Plan
The grant date fair value of the RSURSUs granted to employees was measured based on the Black-Scholes option-pricing model. Expected volatility is estimated by considering historical average share price volatility of the comparable companies. The inputs used in the measurement of the fair values of the RSURSUs at the date of grant are summarized below:
Share price (USD) Exercise price (USD) Expected volatility Expected term Expected dividends Risk-free interest rate During the year ended March 31, 2014, share based payment expense recognized under personnel expenses (refer note 12) is amounting to USD 11,359,705 (March 31, 2013: USD 11,294,316 and March 31, 2012: USD 6,919,532) for the RSUs granted under the share incentive plan. | ||||||||||||||||||||||||||||||||||||||||||||||||||||||||||||||||||||||||||||||||||||||||||||||||||||||||||||||||||||||||||||||||||||||
| ||||||||||||||||||||||||||||||||||||||||||||||||||||||||||||||||||||||||||||||||||||||||||||||||||||||||||||||||||||||||||||||||||||||
| ||||||||||||||||||||||||||||||||||||||||||||||||||||||||||||||||||||||||||||||||||||||||||||||||||||||||||||||||||||||||||||||||||||||
| ||||||||||||||||||||||||||||||||||||||||||||||||||||||||||||||||||||||||||||||||||||||||||||||||||||||||||||||||||||||||||||||||||||||
| ||||||||||||||||||||||||||||||||||||||||||||||||||||||||||||||||||||||||||||||||||||||||||||||||||||||||||||||||||||||||||||||||||||||
| ||||||||||||||||||||||||||||||||||||||||||||||||||||||||||||||||||||||||||||||||||||||||||||||||||||||||||||||||||||||||||||||||||||||
MAKEMYTRIP LIMITED
NOTES TO THE CONSOLIDATED FINANCIAL STATEMENTS — (Continued)
During the year ended March 31, 2012, share based payment expense recognized under personnel expenses (refer note 12) is amounting to USD 6,919,532 for the RSU granted under the share incentive plan.
| TRADE AND OTHER PAYABLES |
| As at March 31 | As at March 31 | |||||||||||||||
Particulars | 2011 | 2012 | 2013 | 2014 | ||||||||||||
| (in USD) | (in USD) | |||||||||||||||
Other trade payables | 13,159,344 | 25,437,805 | 47,083,699 | 36,129,190 | ||||||||||||
Accrued expenses | 6,892,467 | 10,331,310 | 11,660,143 | 16,327,624 | ||||||||||||
Advance from customers | 9,642,891 | 10,928,529 | 21,848,399 | 33,756,713 | ||||||||||||
|
|
|
| |||||||||||||
Total | 29,694,702 | 46,697,644 | 80,592,241 | 86,213,527 | ||||||||||||
|
|
|
| |||||||||||||
The Group’s exposure to currency and liquidity risk related to trade and other payables is disclosed in note 5 and 34.35.
| FINANCIAL INSTRUMENTS |
Credit Risk
Exposure to Credit Risk
The carrying amount of financial assets represents the maximum credit exposure. The maximum exposure to credit risk at the reporting date was:
| As at March 31 | As at March 31 | |||||||||||||||
Particulars | 2011 | 2012 | 2013 | 2014 | ||||||||||||
| (in USD) | (in USD) | |||||||||||||||
Trade and other receivables | 12,857,169 | 21,382,420 | 26,111,393 | 29,355,651 | ||||||||||||
Other assets | 1,256,185 | 1,064,999 | ||||||||||||||
Term deposits | 16,941,920 | 44,325,130 | 48,114,962 | 105,169,847 | ||||||||||||
Cash and cash equivalents (except cash in hand) | 51,574,678 | 43,642,493 | 36,304,968 | 37,720,749 | ||||||||||||
|
|
|
| |||||||||||||
Total | 81,373,767 | 109,350,043 | 111,787,508 | 173,311,246 | ||||||||||||
|
|
|
| |||||||||||||
The maximum exposure to credit risk for trade and other receivables at the reporting date by geographic region was:
| As at March 31 | As at March 31 | |||||||||||||||
Particulars | 2011 | 2012 | 2013 | 2014 | ||||||||||||
| (in USD) | (in USD) | |||||||||||||||
India | 11,814,563 | 18,318,872 | 18,585,268 | 19,027,850 | ||||||||||||
Others | 1,042,606 | 3,063,548 | 7,526,125 | 10,327,801 | ||||||||||||
|
|
|
| |||||||||||||
Total | 12,857,169 | 21,382,420 | 26,111,393 | 29,355,651 | ||||||||||||
|
|
|
| |||||||||||||
MAKEMYTRIP LIMITED
NOTES TO THE CONSOLIDATED FINANCIAL STATEMENTS — (Continued)
The maximum exposure to credit risk for trade and other receivables and term deposits at the reporting date by type of counterparty was:
| As at March 31 | As at March 31 | |||||||||||||||
Particulars | 2011 | 2012 | 2013 | 2014 | ||||||||||||
| (in USD) | (in USD) | |||||||||||||||
Airlines | 7,058,313 | 8,596,077 | 9,222,904 | 9,589,124 | ||||||||||||
Retail customers | 1,428,997 | 3,155,009 | 6,221,066 | 9,940,332 | ||||||||||||
Corporate customers | 1,961,528 | 4,480,419 | 4,649,209 | 3,837,402 | ||||||||||||
Deposit with hotels | 643,492 | 807,159 | ||||||||||||||
Deposit with hotels and others | 3,459,922 | 4,181,343 | ||||||||||||||
Term deposits with bank | 16,941,920 | 44,325,130 | 48,114,962 | 105,169,847 | ||||||||||||
Others | 1,764,839 | 4,343,756 | 2,558,292 | 1,807,450 | ||||||||||||
|
|
|
| |||||||||||||
Total | 29,799,089 | 65,707,550 | 74,226,355 | 134,525,498 | ||||||||||||
|
|
|
| |||||||||||||
Impairment Losses
The age of trade and other receivables and term deposits at the reporting date was:
| As at March 31 | As at March 31 | |||||||||||||||||||||||||||||||
| 2011 | 2012 | 2013 | 2014 | |||||||||||||||||||||||||||||
Particulars | Gross | Impairment | Gross | Impairment | Gross | Impairment | Gross | Impairment | ||||||||||||||||||||||||
| (in USD) | (in USD) | |||||||||||||||||||||||||||||||
Not past due | 27,662,679 | — | 59,141,527 | — | 65,209,117 | — | 130,685,693 | — | ||||||||||||||||||||||||
Past due 0-30 days | 737,496 | — | 2,182,304 | — | 2,905,557 | — | 2,130,581 | — | ||||||||||||||||||||||||
Past due 30-120 days | 1,614,040 | 257,292 | 4,315,532 | — | 5,954,368 | — | 965,586 | — | ||||||||||||||||||||||||
More than one year | 917,724 | 875,558 | 1,145,473 | 1,077,286 | ||||||||||||||||||||||||||||
More than 120 days | 2,377,597 | 2,220,284 | 2,365,751 | 1,622,113 | ||||||||||||||||||||||||||||
|
|
|
|
|
|
|
| |||||||||||||||||||||||||
Total | 30,931,939 | 1,132,850 | 66,784,836 | 1,077,286 | 76,446,639 | 2,220,284 | 136,147,611 | 1,622,113 | ||||||||||||||||||||||||
|
|
|
|
|
|
|
| |||||||||||||||||||||||||
The movement in the allowance for doubtful debts in respect of trade and other receivables during the year was as follows:
| For the year ended March 31 | For the year ended March��31 | |||||||||||||||
Particulars | 2011 | 2012 | 2013 | 2014 | ||||||||||||
| (in USD) | (in USD) | |||||||||||||||
Balance at the beginning of the year | 1,148,892 | 1,132,850 | 1,077,286 | 2,220,284 | ||||||||||||
Provision for doubtful debts | 424,512 | 528,042 | 1,387,780 | 1,472,944 | ||||||||||||
Amounts written off against the allowance | (351,202 | ) | (432,177 | ) | (193,134 | ) | (1,706,093 | ) | ||||||||
Effects of movement in exchange rate | (89,352 | ) | (151,429 | ) | (51,648 | ) | (365,022 | ) | ||||||||
Balance at the end of the year | 1,132,850 | 1,077,286 | 2,220,284 | 1,622,113 | ||||||||||||
Allowance for doubtful debts mainly represents amountamounts due from airlines, global distribution system providerproviders and retail customers. Based on historical experience, the Group believes that no impairment allowance is necessary, apart from above, in respect of trade receivables.
MAKEMYTRIP LIMITED
NOTES TO THE CONSOLIDATED FINANCIAL STATEMENTS — (Continued)
Liquidity risk
The following are the contractual maturities of financial liabilities, including estimated interest payments and excluding the impact of netting agreements:
As at March 31, 20112013
Non-derivative financial liabilities | Carrying amount | Contractual cash flows* | 6 months or less | 6-12 months | 1-2 years | 2-5 years | More than 5 years | Carrying amount | Contractual cash flows* | 6 months or less | 6-12 months | 1-2 years | 2-5 years | More than 5 years | ||||||||||||||||||||||||||||||||||||||||||
| (in USD) | (in USD) | |||||||||||||||||||||||||||||||||||||||||||||||||||||||
Finance lease liabilities | 30,346 | (34,929 | ) | (7,465 | ) | (6,823 | ) | (13,325 | ) | (7,316 | ) | — | 82,914 | (93,139 | ) | (16,111 | ) | (16,112 | ) | (32,222 | ) | (28,694 | ) | — | ||||||||||||||||||||||||||||||||
Secured bank loans | 179,211 | (205,671 | ) | (27,431 | ) | (32,176 | ) | (63,945 | ) | (82,119 | ) | — | 336,978 | (398,867 | ) | (68,640 | ) | (68,142 | ) | (117,104 | ) | (144,981 | ) | — | ||||||||||||||||||||||||||||||||
Trade and other payables | 20,051,811 | (20,051,811 | ) | (20,051,811 | ) | — | — | — | — | 58,743,842 | (58,743,842 | ) | (58,743,842 | ) | — | — | — | — | ||||||||||||||||||||||||||||||||||||||
Other current liabilities | 1,706,618 | (1,706,618 | ) | (1,706,618 | ) | — | — | — | — | |||||||||||||||||||||||||||||||||||||||||||||||
Other liabilities | 8,611,785 | (11,454,548 | ) | (1,782,279 | ) | (768,906 | ) | (768,628 | ) | (8,134,735 | ) | — | ||||||||||||||||||||||||||||||||||||||||||||
Bank overdraft | 3,855,977 | (3,855,977 | ) | (3,855,977 | ) | — | — | — | — | 866,521 | (866,521 | ) | (866,521 | ) | — | — | — | — | ||||||||||||||||||||||||||||||||||||||
|
|
|
|
|
|
|
|
|
|
|
|
|
| |||||||||||||||||||||||||||||||||||||||||||
Total | 25,823,963 | (25,855,006 | ) | (25,649,302 | ) | (38,999 | ) | (77,270 | ) | (89,435 | ) | — | 68,642,040 | (71,556,917 | ) | (61,477,393 | ) | (853,160 | ) | (917,954 | ) | (8,308,410 | ) | — | ||||||||||||||||||||||||||||||||
|
|
|
|
|
|
|
|
|
|
|
|
|
| |||||||||||||||||||||||||||||||||||||||||||
| Notes: * | Represents undiscounted cash flows of interest and principal |
As at March 31, 20122014
Non-derivative financial liabilities | Carrying amount | Contractual cash flows* | 6 months or less | 6-12 months | 1-2 years | 2-5 years | More than 5 years | Carrying amount | Contractual cash flows* | 6 months or less | 6-12 months | 1-2 years | 2-5 years | More than 5 years | ||||||||||||||||||||||||||||||||||||||||||
| (in USD) | (in USD) | |||||||||||||||||||||||||||||||||||||||||||||||||||||||
Finance lease liabilities | 133,924 | (150,026 | ) | (20,163 | ) | (19,787 | ) | (34,882 | ) | (68,646 | ) | (6,548 | ) | 42,952 | (47,045 | ) | (10,604 | ) | (10,604 | ) | (17,134 | ) | (8,703 | ) | — | |||||||||||||||||||||||||||||||
Secured bank loans | 125,439 | (143,282 | ) | (28,271 | ) | (28,271 | ) | (56,021 | ) | (30,719 | ) | — | 275,161 | (357,871 | ) | (87,391 | ) | (75,137 | ) | (111,766 | ) | (83,577 | ) | — | ||||||||||||||||||||||||||||||||
Trade and other payables | 35,769,115 | (35,769,115 | ) | (35,769,115 | ) | — | — | — | — | 52,456,814 | (52,456,814 | ) | (52,456,814 | ) | — | — | — | — | ||||||||||||||||||||||||||||||||||||||
Other liabilities | 2,932,463 | (3,233,677 | ) | (2,051,392 | ) | — | (1,182,285 | ) | — | — | 15,326,742 | (17,346,160 | ) | (7,964,991 | ) | (453,849 | ) | (6,784,933 | ) | (2,142,387 | ) | — | ||||||||||||||||||||||||||||||||||
|
|
|
|
|
|
|
|
|
|
|
|
|
| |||||||||||||||||||||||||||||||||||||||||||
Total | 38,960,941 | (39,296,100 | ) | (37,868,941 | ) | (48,058 | ) | (1,273,188 | ) | (99,365 | ) | (6,548 | ) | 68,101,669 | (70,207,890 | ) | (60,519,800 | ) | (539,590 | ) | (6,913,833 | ) | (2,234,667 | ) | — | |||||||||||||||||||||||||||||||
|
|
|
|
|
|
|
|
|
|
|
|
|
| |||||||||||||||||||||||||||||||||||||||||||
| Notes: * | Represents undiscounted cash flows of interest and principal |
| ||||||||||||||||||||||||||||
| ||||||||||||||||||||||||||||
| ||||||||||||||||||||||||||||
MAKEMYTRIP LIMITED
NOTES TO THE CONSOLIDATED FINANCIAL STATEMENTS — (Continued)
Currency Risk
Exposure to Currency Risk
The Group incurs foreign currency risk primarily in respect of revenue denominated in a currency other than the functional currency of the MakeMyTrip (India) Private Limited (Indian subsidiary)(MMT India) and Hotel Travel Group (HT Group), in which the transaction takes place. On a consolidated basis, the Group is primarily exposed to foreign currency fluctuations between the USD (presentation currency) and INR, being the functional currency of its Indian subsidiary.MMT India and between the EUR and USD, being the functional currency of HT Group. The Group’s exposure to foreign currency risk was based on the following amounts as at the reporting dates (in equivalent USD):
Between USD and INR
| As at M arch 31 | ||||||||
Particulars | 2011 | 2012 | ||||||
| (in USD) | ||||||||
Trade and other receivables | 3,567,671 | 5,122,592 | ||||||
Trade and other payables | (10,999,725 | ) | (17,138,755 | ) | ||||
Cash and cash equivalents | 1,022,149 | 3,641,352 | ||||||
|
|
|
| |||||
Net exposure | (6,409,905 | ) | (8,374,811 | ) | ||||
|
|
|
| |||||
| As at March 31 | ||||||||
Particulars | 2013 | 2014 | ||||||
| (in USD) | ||||||||
Trade and other receivables | 9,645,400 | 8,210,145 | ||||||
Trade and other payables | (26,728,502 | ) | (37,955,163 | ) | ||||
Cash and cash equivalents | 2,240,743 | 2,974,679 | ||||||
|
|
|
| |||||
Net exposure | (14,842,359 | ) | (26,770,339 | ) | ||||
|
|
|
| |||||
MAKEMYTRIP LIMITED
NOTES TO THE CONSOLIDATED FINANCIAL STATEMENTS — (Continued)
Between EUR and USD
Particulars | As at March 31, 2014 | |||
| (in USD) | ||||
Trade and other receivables | 1,153,321 | |||
Trade and other payables | (803,351 | ) | ||
Cash and cash equivalents | 3,417,995 | |||
Net exposure | 3,767,965 | |||
The following significant exchange rates applied during the year:
| Average exchange rate | Reporting date rate | Average exchange rate | Reporting date rate | |||||||||||||||||||||||||||||
USD | 2011 | 2012 | March 31, 2011 | March 31, 2012 | 2012-13 | 2013-14 | March 31, 2013 | March 31, 2014 | ||||||||||||||||||||||||
INR 1 | 0.0218 | 0.0192 | 0.0221 | 0.0207 | 0.0184 | 0.0166 | 0.0183 | 0.0167 | ||||||||||||||||||||||||
EUR 1 | — | 1.3751 | — | 1.3753 | ||||||||||||||||||||||||||||
Sensitivity Analysis
Any change in the exchange rate of USD against currencies other than INR and EUR is not expected to have significant impact on the Group’s profit or loss. Accordingly, a 10% appreciation of the USD as indicated below, against the INR would have increased loss by the amounts shown below and a 10% appreciation of the EUR as indicated below, against the USD would have decreased profitloss by the amounts shown below. This analysis is based on foreign currency exchange rate variances that the Group considered to be reasonably possible at the end of the reporting period. The analysis assumes that all other variables remain constant.
| For the Year Ended March 31 | For the Year Ended March 31 | |||||||||||||||
Particulars | 2011 | 2012 | 2013 | 2014 | ||||||||||||
| (in USD) | (in USD) | |||||||||||||||
10% strengthening of USD against INR | (610,467 | ) | (797,601 | ) | (1,413,558 | ) | (2,549,556 | ) | ||||||||
10% strengthening of EUR against USD | — | 358,854 | ||||||||||||||
A 10% depreciation of the USD against INR and EUR against USD would have had the equal but opposite effect on the above currency to the amounts shown above, on the basis that all other variables remain constant.
MAKEMYTRIP LIMITED
NOTES TO THE CONSOLIDATED FINANCIAL STATEMENTS — (Continued)
Interest Rate Risk
Profile
At the reporting date the interest rate profile of the Group’s interest-bearing financial instruments was as follows:
| As at March 31 | As at March 31 | |||||||||||||||
Particulars | 2011 | 2012 | 2013 | 2014 | ||||||||||||
| (in USD ) | (in USD) | |||||||||||||||
Fixed rate instruments | ||||||||||||||||
Financial assets | ||||||||||||||||
Term deposits | 16,941,920 | 44,325,130 | 48,114,962 | 105,169,847 | ||||||||||||
Cash and cash equivalents | 44,504,303 | 24,876,583 | 7,246,136 | 38,011,775 | ||||||||||||
Financial liabilities | ||||||||||||||||
Finanace lease liabilities | 30,346 | 133,924 | ||||||||||||||
Finance lease liabilities | 82,914 | 42,952 | ||||||||||||||
Secured bank loans | 179,211 | 125,439 | 336,978 | 275,161 | ||||||||||||
|
|
|
| |||||||||||||
| 61,655,780 | 69,461,076 | 55,780,990 | 143,499,735 | |||||||||||||
|
|
|
| |||||||||||||
Variable rate instruments | ||||||||||||||||
Financial liabilities | ||||||||||||||||
Bank overdraft | 3,855,977 | — | 866,521 | — | ||||||||||||
|
|
|
| |||||||||||||
| 3,855,977 | — | 866,521 | — | |||||||||||||
|
|
|
| |||||||||||||
Fair Value Sensitivity Analysis for Fixed Rate Instruments
The Group does not account for any fixed rate financial assets and liabilities at fair value through profit or loss. Therefore, a change in interest rates at the reporting date would not affect profit or loss.
Cash Flow Sensitivity Analysis for Variable Rate Instruments
An increase of 100 basis points in interest rates at the reporting date would have decreased profitincreased loss as at March 31, 20112014 by the amounts shown below. This analysis assumes that all other variables, in particular foreign currency rates, remain constant.
| Profit or Loss | ||||
| (in USD) | ||||
March 31, | ||||
March 31, | — | |||
A decrease of 100 basis points in the interest rates at the reporting date would not have had equal but oppositeany effect on the amounts shown above, on the basis that all other variable remain constant.
MAKEMYTRIP LIMITED
NOTES TO THE CONSOLIDATED FINANCIAL STATEMENTS — (Continued)
Fair Values
Fair Values Versus Carrying Amounts
The fair values of financial assets and liabilities, together with the carrying amounts shown in the statement of financial position, are as follows:
| As at March 31, 2011 | As at March 31, 2012 | As at March 31, 2013 | As at March 31, 2014 | |||||||||||||||||||||||||||||
Particulars | Carrying amount | Fair value | Carrying amount | Fair value | Carrying amount | Fair value | Carrying amount | Fair value | ||||||||||||||||||||||||
| (in USD) | (in USD) | |||||||||||||||||||||||||||||||
Assets carried at fair value | ||||||||||||||||||||||||||||||||
Other investment | — | — | 4,416,543 | 4,416,543 | ||||||||||||||||||||||||||||
Other investments | 4,958,994 | 4,958,994 | 3,973,363 | 3,973,363 | ||||||||||||||||||||||||||||
Derivatives instruments | — | — | 202,054 | 202,054 | 203,651 | 203,651 | — | — | ||||||||||||||||||||||||
|
|
|
|
|
|
|
| |||||||||||||||||||||||||
| — | �� | 4,618,597 | 4,618,597 | 5,162,645 | 5,162,645 | 3,973,363 | 3,973,363 | |||||||||||||||||||||||||
|
|
|
|
|
|
|
| |||||||||||||||||||||||||
Assets carried at amortised cost | ||||||||||||||||||||||||||||||||
Trade and other receivables | 12,857,169 | 12,857,169 | 21,382,420 | 21,382,420 | 26,111,393 | 26,111,393 | 29,355,651 | 29,355,651 | ||||||||||||||||||||||||
Term deposits | 16,941,920 | 16,941,920 | 44,325,130 | 44,325,130 | 48,114,962 | 48,114,962 | 105,169,847 | 105,169,847 | ||||||||||||||||||||||||
Cash and cash equivalents | 51,730,321 | 51,730,321 | 43,798,230 | 43,798,230 | 36,501,478 | 36,501,478 | 38,011,775 | 38,011,775 | ||||||||||||||||||||||||
Other assets | — | — | 77,495 | 77,495 | 1,256,185 | 1,256,185 | 1,064,999 | 1,064,999 | ||||||||||||||||||||||||
|
|
|
|
|
|
|
| |||||||||||||||||||||||||
| 81,529,410 | 81,529,410 | 109,583,275 | 109,583,275 | 111,984,018 | 111,984,018 | 173,602,272 | 173,602,272 | |||||||||||||||||||||||||
|
|
|
|
|
|
|
| |||||||||||||||||||||||||
Liabilities carried at fair value | ||||||||||||||||||||||||||||||||
Derivatives instruments | — | — | 149,135 | 149,135 | ||||||||||||||||||||||||||||
Financial liabilities | 6,829,506 | 6,829,506 | 8,898,697 | 8,898,697 | ||||||||||||||||||||||||||||
|
|
|
|
|
|
|
| |||||||||||||||||||||||||
| — | — | 149,135 | 149,135 | 6,829,506 | 6,829,506 | 8,898,697 | 8,898,697 | |||||||||||||||||||||||||
|
|
|
|
|
|
|
| |||||||||||||||||||||||||
Liabilities carried at amortized cost | ||||||||||||||||||||||||||||||||
Finanace lease liabilities | 30,346 | 30,346 | 133,924 | 133,924 | ||||||||||||||||||||||||||||
Finance lease liabilities | 82,914 | 82,914 | 42,952 | 42,952 | ||||||||||||||||||||||||||||
Secured bank loans | 179,211 | 179,211 | 125,439 | 125,439 | 336,978 | 336,978 | 275,161 | 275,161 | ||||||||||||||||||||||||
Bank overdraft | 3,855,977 | 3,855,977 | — | — | 866,521 | 866,521 | — | — | ||||||||||||||||||||||||
Trade and other payables | 20,051,811 | 20,051,811 | 35,769,115 | 35,769,115 | 58,743,842 | 58,743,842 | 52,456,814 | 52,456,814 | ||||||||||||||||||||||||
Other liabilities | 1,706,618 | 1,706,618 | 2,932,463 | 2,932,463 | 1,782,279 | 1,782,279 | 6,428,045 | 6,428,045 | ||||||||||||||||||||||||
|
|
|
|
|
|
|
| |||||||||||||||||||||||||
| 25,823,963 | 25,823,963 | 38,960,941 | 38,960,941 | 61,812,534 | 61,812,534 | 59,202,972 | 59,202,972 | |||||||||||||||||||||||||
|
|
|
|
|
|
|
| |||||||||||||||||||||||||
Fair value hierarchy
The table below analyses financial instruments carried at fair value, by valuation method. The different levels have been defined as follows:
Level 1: quoted prices (unadjusted) in active markets for identical assets or liabilities.
Level 2: inputs other than quoted prices included within Level 1 that are observable for the asset or liability, either directly (i.e. as prices) or indirectly (i.e. derived from prices).
Level 3: inputs for the asset or liability that are not based on observable market data (unobservable inputs).
| As at March 31, 2012 | ||||||||||||||||
Particulars | Level 1 | Level 2 | Level 3 | Total | ||||||||||||
| (in USD) | ||||||||||||||||
Other investment | — | — | 4,416,543 | 4,416,543 | ||||||||||||
Derivatives instruments | — | — | 202,054 | 202,054 | ||||||||||||
|
|
|
|
|
|
|
| |||||||||
Total Assets | — | — | 4,618,597 | 4,618,597 | ||||||||||||
|
|
|
|
|
|
|
| |||||||||
Derivatives instruments | — | — | 149,135 | 149,135 | ||||||||||||
|
|
|
|
|
|
|
| |||||||||
Total Liabilities | — | — | 149,135 | 149,135 | ||||||||||||
|
|
|
|
|
|
|
| |||||||||
MAKEMYTRIP LIMITED
NOTES TO THE CONSOLIDATED FINANCIAL STATEMENTS — (Continued)
| As at March 31, 2014 | ||||||||||||||||
Particulars | Level 1 | Level 2 | Level 3 | Total | ||||||||||||
| (in USD) | ||||||||||||||||
Other investments | — | — | 3,973,363 | 3,973,363 | ||||||||||||
|
|
|
|
|
|
|
| |||||||||
Total Assets | — | — | 3,973,363 | 3,973,363 | ||||||||||||
|
|
|
|
|
|
|
| |||||||||
Financial liabilities | — | — | 8,898,697 | 8,898,697 | ||||||||||||
|
|
|
|
|
|
|
| |||||||||
Total Liabilities | — | — | 8,898,697 | 8,898,697 | ||||||||||||
|
|
|
|
|
|
|
| |||||||||
| As at March 31, 2013 | ||||||||||||||||
Particulars | Level 1 | Level 2 | Level 3 | Total | ||||||||||||
| (in USD) | ||||||||||||||||
Other investments | — | — | 4,958,994 | 4,958,994 | ||||||||||||
Derivatives instruments | — | — | 203,651 | 203,651 | ||||||||||||
|
|
|
|
|
|
|
| |||||||||
Total Assets | — | — | 5,162,645 | 5,162,645 | ||||||||||||
|
|
|
|
|
|
|
| |||||||||
Financial liabilities | — | — | 6,829,506 | 6,829,506 | ||||||||||||
|
|
|
|
|
|
|
| |||||||||
Total Liabilities | — | — | 6,829,506 | 6,829,506 | ||||||||||||
|
|
|
|
|
|
|
| |||||||||
The following table shows a reconciliation from the beginning balances to the ending balances for fair value measurementmeasurements in Level 3 of the fair value hierarchy:
| As at March 31, 2014 | ||||||||||||||||||||||||||||
Particulars | Other investments | Derivatives instruments | Derivatives instruments | Financial liabilities | ||||||||||||||||||||||||
| (in USD) | ||||||||||||||||||||||||||||
Opening balances | 4,958,994 | 14,677 | 188,974 | 6,829,506 | ||||||||||||||||||||||||
Arising from acquisition | — | — | — | 1,158,367 | ||||||||||||||||||||||||
Arising from completion of measurement period for business combination | — | — | — | (172,138 | ) | |||||||||||||||||||||||
Total gains and losses recognized in: | ||||||||||||||||||||||||||||
- profit or loss | — | (14,677 | ) | (188,974 | ) | 1,082,962 | ||||||||||||||||||||||
- other comprehensive income | (985,631 | ) | — | — | — | |||||||||||||||||||||||
|
|
|
| |||||||||||||||||||||||||
Closing balances | 3,973,363 | — | — | 8,898,697 | ||||||||||||||||||||||||
|
|
|
| |||||||||||||||||||||||||
| As at March 31, 2012 | As at March 31, 2013 | |||||||||||||||||||||||||||
Particulars | Other investment | Derivatives instruments | Derivatives instruments | Other investments | Derivatives instruments | Derivatives instruments | Financial liabilities | |||||||||||||||||||||
| (in USD) | (in USD) | |||||||||||||||||||||||||||
Opening balances | — | — | — | 4,416,543 | 202,054 | (149,135 | ) | — | ||||||||||||||||||||
Arising from acquisition | 4,845,480 | 246,312 | (127,568 | ) | 83,404 | — | — | 6,412,283 | ||||||||||||||||||||
Total gains and losses recognized in: | ||||||||||||||||||||||||||||
- in profit or loss | — | (44,258 | ) | (21,567 | ) | |||||||||||||||||||||||
- in other comprehensive income | (428,937 | ) | — | — | ||||||||||||||||||||||||
- profit or loss | — | (187,377 | ) | 338,109 | 417,223 | |||||||||||||||||||||||
- other comprehensive income | 459,047 | — | — | — | ||||||||||||||||||||||||
|
|
|
|
|
|
| ||||||||||||||||||||||
Closing balances | 4,416,543 | 202,054 | (149,135 | ) | 4,958,994 | 14,677 | 188,974 | 6,829,506 | ||||||||||||||||||||
|
|
|
|
|
|
| ||||||||||||||||||||||
The basis for determining fair values is disclosed in note 4.
There were no transfers between Level 1, Level 2 and Level 3 during the year.
MAKEMYTRIP LIMITED
NOTES TO THE CONSOLIDATED FINANCIAL STATEMENTS — (Continued)
Valuation Techniques and significant unobservable inputs
The following tables show the valuation techniques used in measuring Level 3 fair values, as well as the significant unobservable inputs used.
Financial Instruments measured at fair value:
| Valuation technique | Significant unobservable inputs | Inter-relationship between | |||
| Other investments | Discounted cash flows: The valuation model considers the present value of expected free cash flow, discounted using a risk adjusted discount rate. | Forecast annual revenue growth rate: 31% - 175% Forecast EBITDA margin: (294%) - 71% Risk adjusted discount rate: 18.5% | The estimated fair value would increase (decrease) if: - the annual revenue growth rate were higher (lower) - the EBITDA margin were higher (lower) - the risk adjusted discount rate were lower (higher) | |||
| Financial liabilities | Discounted cash flows: The valuation model considers the present value of expected payment, discounted using a risk adjusted discount rate. | Risk adjusted discount rate: 13%, 20% | The estimated fair value would increase (decrease) if: - the risk adjusted discount rate were lower (higher) | |||
Sensitivity Analysis
For the fair values of other investments, reasonably possible changes of 100 basis points at the reporting date to one of the significant unobservable inputs, holding other inputs constant, would have the following effects:
| For the year ended March 31, 2014 | ||||||||
| Other Comprehensive Income | ||||||||
| Increase | Decrease | |||||||
| USD | USD | |||||||
Annual revenue growth rate | 183,288 | (178,759 | ) | |||||
EBITDA Margin | 26,271 | (26,271 | ) | |||||
Risk adjusted discount rate | (388,943 | ) | 453,398 | |||||
| For the year ended March 31, 2013 | ||||||||
| Other Comprehensive Income | ||||||||
| Increase | Decrease | |||||||
| USD | USD | |||||||
Annual revenue growth rate | 197,061 | (191,719 | ) | |||||
EBITDA Margin | 26,043 | (26,043 | ) | |||||
Risk adjusted discount rate | (434,964 | ) | 515,590 | |||||
MAKEMYTRIP LIMITED
NOTES TO THE CONSOLIDATED FINANCIAL STATEMENTS — (Continued)
| 36) | OPERATING LEASES |
Leases as lessee
Non cancellable operating lease rentals are payable as follows:
| As at March 31 | As at March 31 | |||||||||||||||
Particulars | 2011 | 2012 | 2013 | 2014 | ||||||||||||
| (in USD) | (in USD) | |||||||||||||||
Less than one year | 1,561,760 | 2,184,098 | 2,371,547 | 2,354,081 | ||||||||||||
Between one and five years | 5,807,590 | 5,861,875 | 6,668,180 | 6,106,247 | ||||||||||||
More than five years | 1,194,632 | 4,435,539 | 3,333,792 | 1,791,388 | ||||||||||||
|
|
|
| |||||||||||||
Total | 8,563,982 | 12,481,512 | 12,373,519 | 10,251,716 | ||||||||||||
|
|
|
| |||||||||||||
The Group leases a number of offices under operating leases. The lease period ranges for a period of three to nine years, with an option to renew the lease after that date. Lease payments are increased after a specified period under such arrangements.
During the year ended March 31, 2012,2014, USD 2,079,1832,850,661 was recognized as rent expense under other operating expense in profit or loss in respect of operating leases (March 31, 2011:2013: USD 1,394,969)2,606,709, March 31, 2012: USD 2,079,183).
| CAPITAL COMMITMENTS |
Estimated amount of contracts remaining to be executed on the capital account and not provided for (net of advances) aggregate USD 1,665,833434,278 as at March 31, 20122014 (March 31, 2011:2013: USD 2,464,731)1,069,315).
MAKEMYTRIP LIMITED
NOTES TO THE CONSOLIDATED FINANCIAL STATEMENTS — (Continued)
| RELATED PARTIES |
For the purpose of the consolidated financial statements, parties are considered to be related to the Group, if the Group has the ability, directly or indirectly, to control the party or exercise significant influence over the party in making financial and operating decisions, or vice versa, or where the Group and the party are subject to common control or common significant influence. Related parties may be individuals or other entities.
Related parties and nature of relationships where control exists:
|
| |
|
Related parties and nature of related party relationships:
| Nature of relationship | Name of related parties | |
| ||
Key management personnel | Deep Kalra | |
Key management personnel | Keyur Joshi | |
Key management personnel | Rajesh Magow | |
Key management personnel | Mohit Kabra | |
Key management personnel | Mohit Gupta | |
Key management personnel | Amit Somani (till May 9, 2014) | |
Key management personnel | Sanket Atal (from June 4, 2012) | |
Key management personnel | Mukesh Singh (till July 22, 2011) | |
Key management personnel | Vivek Gour | |
Key management personnel | Frederic Lalonde | |
Key management personnel | Philip Wolf | |
Key management personnel |
Ranodeb Roy | |
Party controlled by key management personnel | PhoCus Wright Inc. (till December 31, 2012) | |
Party controlled by key management personnel | Chandra Capital | |
Transactions with Holding company:
| For the Year Ended March 31 | ||||||||||||
Transactions | 2010 | 2011 | 2012 | |||||||||
| (in USD) | ||||||||||||
Revenue from air ticketing | 16,901 | 5,367 | — | |||||||||
Transactions with entity having significant influence over the Company:
| For the Year Ended March 31 | ||||||||||||
Transactions | 2010 | 2011 | 2012 | |||||||||
| (in USD) | ||||||||||||
Revenue from air ticketing | — | 17,075 | — | |||||||||
MAKEMYTRIP LIMITED
NOTES TO THE CONSOLIDATED FINANCIAL STATEMENTS — (Continued)
In August 2011, the Company acquired 19.98% equity interest in Le Travenues Technology Private Limited (Ixigo), which owns and operates www.ixigo.com, an online travel meta search engine (refer note 10)9). The holding company of Le Travenues Technology Private Limited is SAIF Partners India IV Limited. As per the agreement, the Company has the right to use the domain and its source data ofwww.ixigo.com and Ixigo has the right to use the domain and its source data ofwww.oktatabyebye.com which is owned and operated by the Company.
Transactions with party controlled by key management personnel:
| For the Year Ended March 31 | ||||||||||||
Transactions | 2010 | 2011 | 2012 | |||||||||
| (in USD) | ||||||||||||
Revenue from air ticketing | — | 4,560 | 45,808 | |||||||||
Purchase of marketing services | 19,300 | 25,100 | 28,998 | |||||||||
| For the Year Ended March 31 | ||||||||||||||||||||
Transactions | 2012 | 2013 | 2014 | |||||||||||||||||
| (in USD) | ||||||||||||||||||||
Revenue from air ticketing | 45,808 | 63,110 | 86,689 | |||||||||||||||||
Purchase of marketing and other services | 28,998 | 42,116 | — | |||||||||||||||||
| As at March 31 | As at March 31 | |||||||||||||||||||
Balance Outstanding | 2011 | 2012 | 2013 | 2014 | ||||||||||||||||
| (in USD) | (in USD) | |||||||||||||||||||
Trade and other payables | 455 | 16,455 | ||||||||||||||||||
Trade and other receivables | 37,077 | 73,849 | 29,961 | 122,236 | ||||||||||||||||
Advance to vendor | 8,000 | — | ||||||||||||||||||
Transactions with Key Management Personnel:
Key Management Personnel Compensation*
Key management personnel compensation comprised:
| For the Year Ended M arch 31 | Year ended March 31, | |||||||||||||||||||||||
Particulars | 2010 | 2011 | 2012 | 2012 | 2013 | 2014 | ||||||||||||||||||
| (in USD) | ||||||||||||||||||||||||
Short-term employee benefits | 208,428 | 473,592 | 1,391,278 | 1,391,278 | 1,009,198 | 2,286,506 | ||||||||||||||||||
Contribution to provident fund | 11,920 | 19,687 | 41,710 | 41,710 | 56,172 | 63,207 | ||||||||||||||||||
Share based payment | 1,880,398 | — | 5,444,578 | 5,444,578 | 9,259,575 | 9,701,585 | ||||||||||||||||||
Legal and professional | — | 10,000 | 85,000 | 85,000 | 95,000 | 111,765 | ||||||||||||||||||
|
|
|
|
|
| |||||||||||||||||||
Total | 2,100,746 | 503,279 | 6,962,566 | 6,962,566 | 10,419,945 | 12,163,063 | ||||||||||||||||||
|
|
|
|
|
| |||||||||||||||||||
| Note: * | Provision for gratuity and compensated absences has not been considered, since the provisions are based on actuarial valuations for the Group’s entities as a whole. |
MAKEMYTRIP LIMITED
NOTES TO THE CONSOLIDATED FINANCIAL STATEMENTS — (Continued)F-69
Subsidiaries
Name of subsidiaries | Country of Incorporation | Ownership interest at March 31 | ||||||||||
| 2011 | 2012 | |||||||||||
MakeMyTrip.com Inc | USA | 100 | % | 100 | % | |||||||
MakeMyTrip (India) Private Limited | India | 99.99 | % | 99.99 | % | |||||||
Luxury Tours & Travel Pte Ltd | Singapore | — | 82.78 | % | ||||||||
Luxury Tours (Malaysia) Sdn Bhd | Malaysia | — | 100 | % | ||||||||
F-67