
As filed with the Securities and Exchange Commission on August 2, 2013July 30, 2015
UNITED STATES
SECURITIES AND EXCHANGE COMMISSION
WASHINGTON, D.C. 20549
FORM 20-F
| ¨ | REGISTRATION STATEMENT PURSUANT TO SECTION 12(b) OR 12(g) OF THE SECURITIES EXCHANGE ACT OF 1934 |
OR
| x | ANNUAL REPORT PURSUANT TO SECTION 13 OR 15(d) OF THE SECURITIES EXCHANGE ACT OF 1934 |
For the Fiscal year ended March 31, 20132015
OR
| ¨ | TRANSITION REPORT PURSUANT TO SECTION 13 OR 15(d) OF THE SECURITIES EXCHANGE ACT OF 1934 |
For the transition period from to
| ¨ | SHELL COMPANY REPORT PURSUANT TO SECTION 13 OR 15(d) OF THE SECURITIES EXCHANGE ACT OF 1934 |
Date of event requiring this shell company report
Commission file number: 001-32294
![]()
TATA MOTORS LIMITED
(Exact name of Registrant as specified in its charter)
Not applicable
(Translation of Registrant’s name into English)
| Republic of India | Bombay House 24, Homi Mody Street Mumbai 400 001, India | |
| (Jurisdiction of incorporation or organization) | (Address of principal executive offices) |
H.K. Sethna
Tel.: +91 22 6665 7219
Facsimile: +91 22 6665 7260
Email:hks@tatamotors.com
Address:
Bombay House
24, Homi Mody Street
Mumbai 400 001, India
(Name, telephone, facsimileTelephone, Facsimile number, Email and addressAddress of company contact person)
Securities registered or to be registered pursuant to Section 12(b) of the Act:
Title of each class | Name of | |
| Ordinary Shares, par value Rs.2 per share * |
Securities registered or to be registered pursuant to Section 12(g) of the Act:
None
(Title of Class)
Securities for which there is a reporting obligation pursuant to Section 15(d) of the Act:
None‘A’ Ordinary Shares, par value Rs.2 per share
(Title of Class)
Indicate the number of outstanding shares of each of the issuer’s classes of capital or common stock as of the close of the period covered by the annual report. — 2,708,156,1512,736,713,122 Ordinary Shares and 481,959,620481,966,945 ‘A’ Ordinary Shares, including 498,041,255582,260,190 Ordinary Shares represented by 99,604,051116,447,836 American Depositary Shares, (ADS)or ADSs, outstanding as ofat March 31, 2013. (Each2015. Each ADS now represents five (5) Ordinary Shares).Shares as at March 31, 2015.
Indicate by check mark if the registrant is a well-known seasoned issuer, as defined in Rule 405 of the Securities Act. x Yes ¨ No
If this report is an annual or transition report, indicate by check mark if the registrant is not required to file reports pursuant to Section 13 or 15(d) of the Securities Exchange Act of 1934. ¨ Yes x No
Indicate by check mark whether the registrant: (1) has filed all reports required to be filed by Section 13 or 15(d) of the Securities Exchange Act of 1934 during the preceding 12 months (or for such shorter period that the registrant was required to file such reports), and (2) has been subject to such filing requirements for the past 90 days. x Yes ¨ No
Indicate by check mark whether the registrant has submitted electronically and posted on its corporate Web site, if any, every Interactive Data File required to be submitted and posted pursuant to Rule 405 of Regulation S-T (§232.405 of this chapter) during the preceding 12 months (or for such shorter period that the registrant was required to submit and post such files). ¨ Yes ¨ NoN/A
Indicate by check mark whether the registrant is a large accelerated filer, an accelerated filer, or a non-accelerated filer. See definition of “accelerated filer and large accelerated filer” in Rule 12b-2 of the Exchange Act. (Check one):
Large accelerated filer x Accelerated filer ¨ Non-accelerated filer ¨
Indicate by check mark which basis of accounting the registrant has used to prepare the financial statements included in this filing.
U.S. GAAP ¨ | International Financial Reporting Standards as issued by the International Accounting Standards Board x | Other ¨ |
If “Other” has been checked in response to the previous question, indicate by check mark which financial statement item the registrant has elected to follow. Item 17 ¨ Item 18 ¨
If this is an annual report, indicate by check mark whether the registrant is a shell company (as defined in Rule 12b-2 of the Exchange Act). ¨ Yes x No
| * | Not for trading, but only in connection with listed American Depositary Shares, each representing five |
In this annual report on Form 20-F:
| • | References to “we”, “our” and “us” are to Tata Motors Limited and its consolidated subsidiaries, except as the context otherwise requires; |
| • | References to “dollar”, |
| • | References |
| • | References to an “ADS” are to an American Depositary Share, each of which represents five of our Ordinary Shares of |
| • | References to |
| • |
|
|
| i. | Micro — length of up to 3,200 mm; |
| ii. | Mini — length of between 3,200 mm and 3,600 mm; |
| iii. | Compact — length of between 3,600 mm and 4,000 mm; |
| iv. | Super Compact — length of between 4,000 mm and 4,250 mm; |
| v. | Mid-size — length of between 4,250 mm and |
| vi. | Executive — length of between |
| vii. | Premium — length of between 4,700 mm and |
| viii. | Luxury — length of above 5,000 mm; |
| • | Utility Vehicles, or UVs, are vehicles that have a seating capacity of five to ten persons, including the driver, which includes sports utility vehicles, or SUVs, multi-purpose vehicles and |
| • |
|
| • |
|
| • | Medium and Heavy Commercial Vehicles, or M&HCVs, are vehicles that have a GVW of over 7.5 metric tons and Intermediate Commercial Vehicles, or ICVs, are a subcategory of M&HCVs with a GVW between 7.5 metric tons and 16 metric tons; |
| • | For our Jaguar Land Rover business, references to premium cars and sports utility vehicles |
| • | Unless otherwise stated, comparative and empirical Indian industry data in this annual report on Form 20-F have been derived from published reports of the Society of Indian Automobile Manufacturers, or SIAM; |
| • | References to a particular “Fiscal” year, such as “Fiscal |
|
| • | “Millimeters” or “mm” are equal to 1/1000 of a meter. A meter is equal to approximately 39.37 inches and a millimeter is equal to approximately 0.039 inch; |
| • | “Kilograms” or “kg” are each equal to approximately 2.2 pounds, and “metric tons” or “tons” are equal to 1,000 kilograms or approximately 2,200 pounds; |
| • | “Liters” are equivalent to 61.02 cubic inches of volume, or approximately 1.057 U.S. quarts of liquid measure; |
| • | “Revenue” refers to Total Revenue net of excise duty unless stated otherwise; and |
| • | “ |
i
| • | Figures in tables may not add up to totals due to rounding. |
SpecialCautionary Note Regarding Forward-looking Statements
All statements contained in thisThis annual report thaton Form 20-F contains certain “forward-looking statements” within the meaning of the Private Securities Litigation Reform Act of 1995, Section 27A of the Securities Act of 1933, as amended, or the Securities Act and Section 21E of the Securities Exchange Act of 1934, as amended, or the Exchange Act. Forward-looking statements are not statements of historical fact constitute “forward-looking statements”. Generally, these statements can be identifiedgenerally identifiable by the use of forward-looking termsterminology such as “may”, “will”, “should”, “potential”, “intend”, “expect”, “seek”, “anticipate”, “estimate”, “believe”, “can”, “could”, “estimate”, “expect”, “intend”, “may”, “plan”, “seek”“project”, “will” and “would”“predict”, “continue”, “future”, “forecast”, “target”, “guideline” or other similar words. However, these words or expressions. Forward-looking statements are not the exclusive meansguarantees of identifying forward-looking statements. All statements regarding our expected financial conditionperformance and are based on certain assumptions, discuss future expectations, describe plans and strategies, contain projections of results of operations business,or of financial condition or state other forward-looking information. Our ability to predict results or the actual effect of plans or strategies is inherently uncertain, particularly given the economic environment. Although we believe that the expectations reflected in such forward-looking statements are based on reasonable assumptions, our actual results and prospects areperformance could differ materially from those set forth in the forward-looking statements and you should not unduly rely on these statements. These forward-looking statements include statements as to our business strategy, our revenue and profitability, planned projects and other matters discussed in this annual report regarding matters that are not historical fact. These forward-looking statements and any other projections contained in this annual report (whether made by us or any third party) involve known and unknown risks, uncertainties and other factors that may cause our actual results performance or achievementsin future periods to bediffer materially different from any futurethose forward-looking statements.
Information regarding important factors that could cause actual results performance or achievements expressed or implied by theseto differ materially from those in our forward-looking statements or other projections. Although we areappear in a reporting company and will have ongoing disclosure obligations under U.S. federal securities laws, we are not undertaking to publicly update or revise any statementsnumber of places in this annual report whether as a result of new information, future events or otherwise.
i
The riskson Form 20-F and factors that could cause our actual results, performances and achievements to be materially different from the forward-looking statements set out in Item 3.D and elsewhere indocuments incorporated by reference into this annual report on Form 20-F, and include, among others:but are not limited to:
changes in general economic, business, political, social, and economicfiscal or other conditions and the competitive environment in India, the United States, the United Kingdom and the rest of Europe, andRussia, China or in any of the other markets in whichcountries where we operate and sell our products;operate;
fluctuations in the currency exchange rate against the functional currency of the respective consolidated entities;
accidents and natural disasters;
terms on which we finance our working capital and capital and product development expenditures and investment requirements;
implementation of new projects, including mergers and acquisitions, planned by management;
contractual arrangements with suppliers;
government policies including those specifically regarding the automotive industry, including industrial licensing, environmental regulations, safety regulations, import restrictions and duties, excise duties, sales taxes, value added taxes, product range restrictions, diesel and gasoline prices and road network enhancement projects;
significant movements in the prices of key inputs such as steel, aluminum, rubber and plastics; and
other factors beyond our control.
All forward-looking statements included herein are based upon information available to us on the date hereof and we are under no duty to update any of the forward-looking statements after the date hereof to conform these statements to actual results.
Certain Non-IFRS Measures
This annual report on Form 20-F contains references to free cash flow, a non-IFRS measure. Free cash flow is not an IFRS measure and should not be construed as an alternative to any IFRS measure such as cash flow from operating activities. “Free cash flow” is defined for purposes of this annual report on Form 20-F as cash flow from operating activities, less payments for property, plant and equipment and intangible assets. Free cash flow should not be considered in isolation and is not a measure of our financial performance or liquidity under IFRS and should not be considered as an alternative to cash flow from operating, investing or financing activities or any other measure of our liquidity derived in accordance with IFRS. Free cash flow does not necessarily indicate whether cash flow will be sufficient or available for cash requirements and may not be indicative of our results of operations. Free cash flow as defined herein may not be comparable to other similarly titled measures used by other companies.
ii
| Item 1. | 1 | |||||||||
| A. | 1 | |||||||||
| B. | 1 | |||||||||
| C. | 1 | |||||||||
| Item 2. | 1 | |||||||||
| A. | 1 | |||||||||
| B. | 1 | |||||||||
| Item 3. | 1 | |||||||||
| A. | 1 | |||||||||
| B. | ||||||||||
| C. | ||||||||||
| D. | ||||||||||
| Item 4. | ||||||||||
| A. | ||||||||||
| B. | ||||||||||
| C. | ||||||||||
| D. | ||||||||||
| Item 4A. | ||||||||||
| Item 5. | ||||||||||
| A. | ||||||||||
| B. | ||||||||||
| 73 | ||||||||||
| ||||||||||
| D. | 84 | |||||||||
| E. | ||||||||||
| F. | ||||||||||
| G. | 85 | |||||||||
| Item 6. | ||||||||||
| 85 | ||||||||||
| A. | 85 | |||||||||
| B. | ||||||||||
| C. | 90 | |||||||||
| D. | 94 | |||||||||
| E. | 96 | |||||||||
| Item 7. | 97 | |||||||||
| A. | 97 | |||||||||
| B. | 99 | |||||||||
| C. | ||||||||||
| Item 8. | ||||||||||
| A. | ||||||||||
| B. | ||||||||||
| Item 9. | ||||||||||
| A. | ||||||||||
| B. | ||||||||||
| C. | ||||||||||
| D. | ||||||||||
| E. | ||||||||||
| F. | ||||||||||
| Item 10. | ||||||||||
| A. | ||||||||||
| B. | ||||||||||
| C. | ||||||||||
| D. | ||||||||||
| E. | ||||||||||
| F. | ||||||||||
| G. | ||||||||||
H. | ||||||||||
I. | ||||||||||
Item 11. | ||||||||||
| Item 12. | ||||||||||
| A. | 120 | |||||||||
| B. | 120 | |||||||||
| C. | 120 | |||||||||
| D. | 120 |
iii
| Item 13. | ||||||||||
| Item 14. | Material Modifications to the Rights of Security Holders and Use of Proceeds | |||||||||
| Item 15. | ||||||||||
| Item 16A. | ||||||||||
| Item 16B. | ||||||||||
| Item 16C. | ||||||||||
| Item 16D. | ||||||||||
| Item 16E. | Purchases of Equity Securities by the Issuer and Affiliated Purchasers | |||||||||
| Item 16F. | ||||||||||
| Item 16G. | ||||||||||
| Item 16H. | 125 | |||||||||
| Item 17. | ||||||||||
| Item 18. | ||||||||||
| Item 19. |
iv
| Item 1. | Identity of Directors, Senior Management and |
A.Directors and Senior Management
Not applicable.
Not applicable.
Not applicable.
| Item 2. | Offer Statistics and Expected |
Not applicable.
B.Method and Expected Timetable
Not applicable.
| Item 3. | Key |
A. Selected Financial Data.Data
The following table setstables set forth selected financial data including selected historical financial information as ofat and for each of the Fiscal years ended March 31, 2015, 2014, 2013, 2012 2011, 2010, and 20092011 in accordance with International Financial Reporting Standards as issued by the International Accounting Standards Board, or IFRS.
The selected IFRS consolidated financial data as ofat March 31, 2013, 20122015 and 20112014 and for each of the Fiscal years ended March 31,2015, 2014 and 2013 2012, and 2011 are derived from our audited IFRS consolidated financial statements included in this annual report.report on Form 20-F. The selected IFRS consolidated financial data as ofat March 31, 20102013, 2012 and 20092011 and for each of the Fiscal years ended March 31, 20102012 and 20092011 are derived from our audited IFRS consolidated financial statements not included in this annual report.report on Form 20-F. We adopted several new and amended standards issued by the IASB with effect from April 1, 2013. As described in Note 2(v) of our annual report on Form 20-F for Fiscal 2014, the earliest period presented in the consolidated financial statement has been retrospectively adjusted in accordance with the transitional provisions of the standards. Accordingly, selected financial data for Fiscal 2013, 2012 and 2011 have been retrospectively adjusted. These retrospective adjustments resulted in decreases in net income by Rs.26.5 million, Rs.1,623.4 million, Rs.2,818.7 million for Fiscals 2013, 2012 and 2011, respectively. The decrease / increase in net income resulted in corresponding increase / decrease in other comprehensive income.
Consolidated financial data as at March 31, 2012 and 2011 for each of Fiscal 2012 and 2011 may differ from the data originally presented in those audited IFRS consolidated financial statements included in prior annual reports.
You should read our selected financial data in conjunction with Item 5 “—Operating and Financial Review and Prospects”Prospects.”
Selected Financial Data Prepared in Accordance with IFRS
| Year ended March 31, | ||||||||||||||||||||||||||||||||||||||||||||||||
| For each of the years ended March 31, | 2015 | 2015 | 2014 | 2013 | 2012 | 2011 | ||||||||||||||||||||||||||||||||||||||||||
| 2013 | 2013 | 2012 | 2011 | 2010 | 2009 | (in US$ millions, except share and per share amounts) | ||||||||||||||||||||||||||||||||||||||||||
(In US$ millions, except share and per share | (in Rs. millions, except share and per share amounts) | (in Rs. millions, except share and per share amounts) | ||||||||||||||||||||||||||||||||||||||||||||||
Revenues | 34,260.8 | 1,859,847.0 | 1,640,512.5 | 1,209,902.6 | 904,465.9 | 702,636.0 | 41,642.2 | 2,602,634.4 | 2,311,884.6 | 1,862,896.7 | 1,637,173.5 | 1,203,479.7 | ||||||||||||||||||||||||||||||||||||
Finance revenues | 552.9 | 30,013.3 | 24,340.4 | 22,231.5 | 21,796.9 | 20,170.3 | 362.1 | 22,630.8 | 29,875.9 | 30,013.3 | 24,340.4 | 22,231.5 | ||||||||||||||||||||||||||||||||||||
|
|
|
|
|
|
|
|
|
|
|
| |||||||||||||||||||||||||||||||||||||
Total revenues | 34,813.7 | 1,889,860.3 | 1,664,852.9 | 1,232,134.1 | 926,262.8 | 722,806.3 | 42,004.3 | 2,625,265.2 | 2,341,760.5 | 1,892,910.0 | 1,661,513.9 | 1,225,711.2 | ||||||||||||||||||||||||||||||||||||
Change in inventories of finished goods and work-in-progress | (555.5 | ) | (30,158.0 | ) | (25,770.1 | ) | (18,874.7 | ) | (9,343.9 | ) | 15,793.3 | (473.8 | ) | (29,610.9 | ) | (28,317.3 | ) | (30,086.8 | ) | (25,861.4 | ) | (18,624.1 | ) | |||||||||||||||||||||||||
Purchase of products for sale | 2,369.3 | 128,615.8 | 124,295.9 | 121,000.6 | 96,839.1 | 71,260.2 | 2,092.8 | 130,803.8 | 109,691.6 | 92,889.5 | 90,204.2 | 78,183.9 | ||||||||||||||||||||||||||||||||||||
Raw materials and consumables | 20,407.0 | 1,107,792.4 | 1,001,950.8 | 694,097.9 | 531,209.4 | 401,679.9 | 23,997.8 | 1,499,862.9 | 1,363,572.1 | 1,138,214.3 | 1,025,448.0 | 723,726.4 | ||||||||||||||||||||||||||||||||||||
Employee cost | 3,058.6 | 166,038.8 | 122,130.2 | 92,249.6 | 87,944.9 | 75,199.7 | 4,006.4 | 250,401.2 | 213,903.0 | 167,169.5 | 125,204.9 | 95,938.2 | ||||||||||||||||||||||||||||||||||||
Depreciation and amortization | 1,358.1 | 73,723.2 | 54,435.1 | 43,445.7 | 36,636.6 | 28,039.8 | 2,151.9 | 134,495.8 | 110,462.6 | 75,767.9 | 56,424.0 | 45,314.3 | ||||||||||||||||||||||||||||||||||||
Other expenses | 7,039.1 | 382,119.6 | 309,380.5 | 232,341.7 | 180,807.7 | 175,613.6 | 8,734.6 | 545,909.5 | 498,777.7 | 384,423.3 | 312,456.1 | 235,583.7 | ||||||||||||||||||||||||||||||||||||
Expenditure capitalized | (1,877.5 | ) | (101,919.7 | ) | (82,659.8 | ) | (57,433.1 | ) | (46,046.7 | ) | (45,310.9 | ) | (2,451.5 | ) | (153,217.5 | ) | (135,246.8 | ) | (101,934.5 | ) | (82,659.8 | ) | (57,462.3 | ) | ||||||||||||||||||||||||
Gain on sale of controlling equity interest in subsidiary | — | — | — | — | (27,565.5 | ) | (1,404.7 | ) | ||||||||||||||||||||||||||||||||||||||||
Other (income) / loss (net) | (221.5 | ) | (12,024.0 | ) | (9,407.1 | ) | 8,218.0 | 418.6 | (14,294.8 | ) | ||||||||||||||||||||||||||||||||||||||
Excess of fair value of net assets acquired over cost of acquisition | — | — | — | — | — | (6,569.6 | ) | |||||||||||||||||||||||||||||||||||||||||
Other (income)/loss (net) | (184.1 | ) | (11,508.4 | ) | (7,732.6 | ) | (12,099.1 | ) | (10,039.4 | ) | 8,067.0 | |||||||||||||||||||||||||||||||||||||
Foreign exchange (gain)/loss (net) | 288.1 | 15,640.0 | 11,154.2 | (3,090.0 | ) | (16,045.3 | ) | 48,142.8 | 202.9 | 12,680.7 | (19,104.2 | ) | 15,774.9 | 11,511.7 | (3,012.1 | ) | ||||||||||||||||||||||||||||||||
Interest income | (142.9 | ) | (7,759.8 | ) | (5,426.8 | ) | (3,669.5 | ) | (2,570.1 | ) | (3,097.2 | ) | (108.2 | ) | (6,763.9 | ) | (6,656.7 | ) | (6,928.0 | ) | (4,953.4 | ) | (3,471.8 | ) | ||||||||||||||||||||||||
Interest expense (net) | 750.7 | 40,751.8 | 38,290.4 | 36,853.5 | 40,396.0 | 34,222.3 | 835.5 | 52,231.6 | 53,094.7 | 40,792.0 | 38,957.7 | 37,728.8 | ||||||||||||||||||||||||||||||||||||
Impairment in equity accounted investees | — | — | 4,981.0 | — | — | — | ||||||||||||||||||||||||||||||||||||||||||
Impairment in an equity accounted investee | — | — | 8,033.7 | — | 4,981.0 | — | ||||||||||||||||||||||||||||||||||||||||||
Share of (profit)/loss of equity accounted investees | (31.9 | ) | (1,733.5 | ) | 351.1 | 458.4 | 1,229.3 | 3,464.0 | 28.0 | 1,748.3 | 1,877.6 | 131.5 | 586.8 | (260.4 | ) | |||||||||||||||||||||||||||||||||
|
|
|
|
|
|
|
|
|
|
|
| |||||||||||||||||||||||||||||||||||||
Net income /(loss) before tax | 2,372.1 | 128,773.7 | 121,147.5 | 86,536.0 | 52,352.7 | (59,932.1 | ) | 3,171.7 | 198,232.1 | 179,405.1 | 128,795.5 | 119,253.5 | 83,999.6 | |||||||||||||||||||||||||||||||||||
Income tax expense | (721.9 | ) | (39,190.5 | ) | (4,707.1 | ) | (12,787.3 | ) | (14,771.6 | ) | (841.8 | ) | (1,106.4 | ) | (69,149.7 | ) | (48,226.5 | ) | (39,238.8 | ) | (4,436.5 | ) | (13,069.6 | ) | ||||||||||||||||||||||||
|
|
|
|
|
|
|
|
|
|
|
| |||||||||||||||||||||||||||||||||||||
Net income /(loss) after tax | 1,650.2 | 89,583.2 | 116,440.4 | 73,748.7 | 37,581.1 | (60,773.9 | ) | 2,065.3 | 129,082.4 | 131,178.6 | 89,556.7 | 114,817.0 | 70,930.0 | |||||||||||||||||||||||||||||||||||
|
|
|
|
|
|
|
|
|
|
|
| |||||||||||||||||||||||||||||||||||||
Net income/(loss) attributable to equity holders | 1,633.9 | 88,697.0 | 115,659.1 | 73,401.8 | 38,028.7 | (60,142.3 | ) | |||||||||||||||||||||||||||||||||||||||||
Net income/(loss) attributable to non-controlling interest | 16.3 | 886.2 | 781.3 | 346.9 | (447.6 | ) | (631.6 | ) | ||||||||||||||||||||||||||||||||||||||||
| For each of the years ended March 31, | Year ended March 31, | |||||||||||||||||||||||||||||||||||||||||||||||
| 2013 | 2013 | 2012 | 2011 | 2010 | 2009 | 2015 | 2015 | 2014 | 2013 | 2012 | 2011 | |||||||||||||||||||||||||||||||||||||
(In US$ millions, except share and per share | (in Rs. millions, except share and per share amounts) | (in US$ millions, except share and per share amounts) | ||||||||||||||||||||||||||||||||||||||||||||||
Dividends per share | US$ | — | Rs. 4.0 | Rs. 20.0 | Rs. 15.0 | Rs. 6.0 | Rs. 15.0 | |||||||||||||||||||||||||||||||||||||||||
| (in US$ millions, except share and per share amounts) | (in Rs. millions, except share and per share amounts) | |||||||||||||||||||||||||||||||||||||||||||||||
| 128,291.2 | 130,717.1 | 88,670.5 | 114,035.7 | 70,583.1 | ||||||||||||||||||||||||||||||||||||||||||||
Net income/(loss) attributable to non-controlling interest | 12.6 | 791.2 | 461.5 | 886.2 | 781.3 | 346.9 | ||||||||||||||||||||||||||||||||||||||||||
Dividends per Ordinary Shares | US$ | — | Rs. 2.0 | Rs. 2.0 | Rs. 4.0 | Rs. 20.0 | Rs. 15.0 | |||||||||||||||||||||||||||||||||||||||||
Dividends per share ‘A’ Ordinary Shares | US$ | — | Rs. 4.1 | Rs. 20.5 | Rs. 15.5 | Rs. 6.5 | Rs. — | US$ | — | Rs. 2.1 | Rs. 2.1 | Rs. 4.1 | Rs. 20.5 | Rs. 15.5 | ||||||||||||||||||||||||||||||||||
Weighted average equity shares outstanding: | ||||||||||||||||||||||||||||||||||||||||||||||||
Weighted average Ordinary Shares outstanding: | ||||||||||||||||||||||||||||||||||||||||||||||||
Basic | 2,706,014,707 | 2,706,014,707 | 2,691,542,867 | 2,588,800,690 | 2,318,682,314 | 2,065,267,345 | 2,765,339,619 | 2,760,961,457 | 2,734,354,019 | 2,719,730,619 | 2,615,912,453 | |||||||||||||||||||||||||||||||||||||
Diluted | 2,706,507,429 | 2,706,507,429 | 2,797,890,724 | 2,590,872,227 | 2,319,432,171 | 2,065,267,345 | 2,765,824,089 | 2,761,450,718 | 2,734,846,741 | 2,826,078,476 | 2,617,983,990 | |||||||||||||||||||||||||||||||||||||
Weighted average ‘A’ equity shares outstanding: | ||||||||||||||||||||||||||||||||||||||||||||||||
Weighted average ‘A’ Ordinary Shares outstanding: | ||||||||||||||||||||||||||||||||||||||||||||||||
Basic | 481,958,717 | 481,958,717 | 481,900,898 | 396,669,199 | 320,880,139 | 137,142,495 | 487,445,041 | 487,440,271 | 487,436,720 | 487,378,244 | 401,177,790 | |||||||||||||||||||||||||||||||||||||
Diluted | 482,206,515 | 482,206,515 | 482,206,416 | 397,166,848 | 321,380,820 | 137,142,495 | 487,684,611 | 487,684,558 | 487,684,518 | 487,683,762 | 401,675,439 | |||||||||||||||||||||||||||||||||||||
Earnings per share: | ||||||||||||||||||||||||||||||||||||||||||||||||
Earnings per Ordinary Shares: | ||||||||||||||||||||||||||||||||||||||||||||||||
Basic | US$ | 0.5 | Rs. 27.8 | Rs. 36.4 | Rs. 24.6 | Rs. 14.4 | Rs. (27.3 | ) | US$ | 0.6 | Rs. 39.4 | Rs. 40.2 | Rs. 27.5 | Rs. 35.5 | Rs. 23.4 | |||||||||||||||||||||||||||||||||
Diluted | US$ | 0.5 | Rs. 27.8 | Rs. 36.0 | Rs. 24.5 | Rs. 14.4 | Rs. (27.3 | ) | US$ | 0.6 | Rs. 39.4 | Rs. 40.2 | Rs. 27.5 | Rs. 35.2 | Rs. 23.4 | |||||||||||||||||||||||||||||||||
Earnings per share of ‘A’ Ordinary Shares: | ||||||||||||||||||||||||||||||||||||||||||||||||
Basic | US$ | 0.5 | Rs. 27.9 | Rs. 36.5 | Rs. 24.7 | Rs. 14.5 | Rs. (27.3 | ) | US$ | 0.6 | Rs. 39.5 | Rs. 40.3 | Rs. 27.6 | Rs. 35.6 | Rs. 23.5 | |||||||||||||||||||||||||||||||||
Diluted | US$ | 0.5 | Rs. 27.9 | Rs. 36.1 | Rs. 24.6 | Rs. 14.5 | Rs. (27.3 | ) | US$ | 0.6 | Rs. 39.5 | Rs. 40.3 | Rs. 27.6 | Rs. 35.3 | Rs. 23.5 | |||||||||||||||||||||||||||||||||
Subsequent to the Fiscal 2015, we conducted a renounceable rights offer of 150,644,759 new Ordinary Shares, including Ordinary Shares represented by ADSs, and 26,530,290 new ‘A’ Ordinary Shares of Rs.2 each to qualifying Tata Motors Shareholders recorded in the shareholders register at the close of business on April 8, 2015, at a subscription price of Rs.450 each for new Ordinary Shares and Rs.271 each for new ‘A’ Ordinary Shares in the ratio of six rights offer Shares for every 109 Tata Motors Limited Shares held. The face valuerights offer was fully subscribed and the shareholders received the new Shares on May 13, 2015. For each of shares was sub-divided with effect from September 14, 2011. Post sub-division,Fiscal 2015, 2014, 2013, 2012 and 2011, basic and diluted earnings per share have been retrospectively adjusted for the bonus element of the rights offer attributable to the difference between the exercise price of the rights and the prevailing market price of the Shares. 154,279 Ordinary Shares and 20,531 ‘A’ Ordinary Shares have been kept in abeyance. See Note 25 to our audited consolidated financial statements included elsewhere in this annual report on Form 20-F for further details.
During Fiscal 2012, Ordinary Shares and ‘A’ Ordinary Shares havewere each been sub-dividedsubdivided from having a face value of Rs.10 each into five sharesShares having a face value of Rs.2 each.
Dividend per shareOrdinary Share and Dividenddividend per ‘A’ Ordinary Share, as givenpresented above for Fiscal 2012 2011, 2010 and 20092011 are before the subdivision of Ordinary Shares and ‘A’ Ordinary Shares and have not been adjusted to reflect the subdivision of Ordinary Shares and ‘A’ Ordinary Shares. Consequently, the number of Shares as at March 31, 2011 is not comparable to the number of Shares as at March 31, 2015, 2014 and 2013 and 2012.
Weighted average equity sharesOrdinary Shares and ‘A’ equity sharesOrdinary Shares outstanding and earnings per share of previous years have been adjusted retrospectively, to make them comparable pursuant tofollowing the sub-division of shares.Shares described above.
| As of March 31, | ||||||||||||||||||||||||
| 2013 | 2013 | 2012 | 2011 | 2010 | 2009 | |||||||||||||||||||
| (in US$ millions, except number of shares) | (in Rs. millions, except number of shares) | |||||||||||||||||||||||
Balance Sheet Data | ||||||||||||||||||||||||
Total Assets | 30,739.8 | 1,668,695.4 | 1,434,536.2 | 1,031,526.9 | 908,410.2 | 782,629.4 | ||||||||||||||||||
Long term debt, net of current portion | 5,995.3 | 325,457.5 | 287,148.1 | 201,471.3 | 198,897.4 | 116,185.9 | ||||||||||||||||||
Total shareholders’ equity | 6,887.9 | 373,905.7 | 331,343.6 | 211,259.3 | 102,222.8 | 38,725.8 | ||||||||||||||||||
Number of Equity shares outstanding | ||||||||||||||||||||||||
-Ordinary Shares | 2,708,156,151 | 2,708,156,151 | 2,691,613,455 | 538,272,284 | 506,381,170 | 449,832,659 | ||||||||||||||||||
-’A’ Ordinary Shares | 481,959,620 | 481,959,620 | 481,933,115 | 96,341,706 | 64,176,374 | 64,175,655 | ||||||||||||||||||
During Fiscal 2012, Ordinary Shares and ‘A’ Ordinary Shares have each been subdivided from having face value of Rs.10 each into five shares having face value of Rs.2 each. Consequently, the number of shares as at March 31, 2011, 2010 and 2009 are not comparable to the number of shares as at March 31, 2013 and 2012.
| As at March 31, | ||||||||||||||||||||||||
| 2015 | 2015 | 2014 | 2013 | 2012 | 2011 | |||||||||||||||||||
| (in US$ millions, except number of shares) | ||||||||||||||||||||||||
| (in Rs. millions, except number of shares) | ||||||||||||||||||||||||
Total Assets | 37,530.3 | 2,345,643.4 | 2,184,775.9 | 1,687,166.5 | 1,455,830.2 | 1,055,411.3 | ||||||||||||||||||
Long term debt, net of current portion | 8,717.8 | 544,862.5 | 454,138.6 | 330,718.1 | 294,497.6 | 211,475.2 | ||||||||||||||||||
Total shareholders’ equity(Net Assets) | 8,629.6 | 539,351.8 | �� | 631,696.3 | 373,905.7 | 331,343.6 | 211,259.3 | |||||||||||||||||
Number of Equity shares outstanding | ||||||||||||||||||||||||
-Ordinary Shares | 2,736,713,122 | 2,736,713,122 | 2,708,156,151 | 2,691,613,455 | 538,272,284 | |||||||||||||||||||
-‘A’ Ordinary Shares | 481,966,945 | 481,966,945 | 481,959,620 | 481,933,115 | 96,341,706 | |||||||||||||||||||
Exchange Rate Information
For convenience, some of the financial amounts presented in this annual report on Form 20-F have been translated from Indian rupee amounts into USU.S. dollar amounts at the rate of Rs.54.2850Rs.62.5000 = US $1.00,US$1.00, based on the fixing rate in the city of Mumbai as published by the Foreign Exchange Dealers’ Association of India on March 30, 2013. However, such translations do not imply that the Indian rupee amounts have been could have been, or could be converted into US dollars at that or any other rate.31, 2015
The following table sets forth, for the Fiscal years ended March 31, 2013, 2012, 2011, 2010 and 2009 information with respect to the exchange rate between the Indian rupee and the US dollar (Rs. per US dollar) as published by Bloomberg L.P.
Fiscal year ended March 31, | Period End | Period Average | High | Low | ||||||||||||
2013 | 54.28 | 54.44 | 57.16 | 50.72 | ||||||||||||
2012 | 50.88 | 47.95 | 53.72 | 44.08 | ||||||||||||
2011 | 44.59 | 44.98 | 45.25 | 44.59 | ||||||||||||
2010 | 44.92 | 47.42 | 50.64 | 44.92 | ||||||||||||
2009 | 50.73 | 45.82 | 51.97 | 39.77 | ||||||||||||
The following table sets forth information with respect to the exchange rate between the Indian rupee and the USU.S. dollar (Rs. per USU.S. dollar) as published by Bloomberg L.P. for Fiscal 2015, 2014, 2013, 2012 and 2011.
Year ended March 31, | Period End | Period Average | High | Low | ||||||||||||
2015 | 62.50 | 61.16 | 63.68 | 58.46 | ||||||||||||
2014 | 59.89 | 60.47 | 68.83 | 53.81 | ||||||||||||
2013 | 54.28 | 54.44 | 57.16 | 50.72 | ||||||||||||
2012 | 50.88 | 47.95 | 53.72 | 44.08 | ||||||||||||
2011 | 44.59 | 44.98 | 45.25 | 44.59 | ||||||||||||
The following table sets forth information with respect to the exchange rate between the Indian rupee and the U.S. dollar (Rs. per U.S. dollar) for the previous six months as published by Bloomberg L.P.
Month | Period End | Period Average | High | Low | ||||||||||||
January 2013 | 53.23 | 54.27 | 55.23 | 53.23 | ||||||||||||
February 2013 | 54.36 | 53.81 | 54.48 | 53.14 | ||||||||||||
March 2013 | 54.28 | 54.42 | 54.93 | 54.03 | ||||||||||||
April 2013 | 53.81 | 54.38 | 54.89 | 53.81 | ||||||||||||
May 2013 | 56.51 | 55.05 | 56.51 | 53.82 | ||||||||||||
June 2013 | 59.39 | 58.38 | 60.73 | 56.45 | ||||||||||||
July 2013 | 60.37 | 59.75 | 60.62 | 59.04 | ||||||||||||
Source: Bloomberg L.P
Month | Period End | Period Average | High | Low | ||||||||||||
January 2015 | 61.87 | 62.24 | 63.57 | 61.41 | ||||||||||||
February 2015 | 61.84 | 62.03 | 62.34 | 61.68 | ||||||||||||
March 2015 | 62.50 | 62.48 | 62.97 | 61.87 | ||||||||||||
April 2015 | 63.42 | 62.76 | 63.56 | 62.19 | ||||||||||||
May 2015 | 63.83 | 63.79 | 64.24 | 63.44 | ||||||||||||
June 2015 | 63.65 | 63.84 | 64.25 | 63.52 | ||||||||||||
As of August 1, 2013,at July 29, 2015, the value of the Indian rupee against the USU.S. dollar was Rs.60.4437Rs.63.9050 per US$1.00, as published by Bloomberg L.P.
B. Capitalization and Indebtedness.Indebtedness
Not applicable.
C. Reasons for the Offer and Use of Proceeds.Proceeds
Not applicable.
This section describes the risks that we currently believe may materially affect our business.business, financial condition and results of operations. The factors below should be considered in connection with any forward-looking statements in this annual report on Form 20-F and the cautionary statements on page i. The risks below are not the only ones we face — some risks may be unknown to us, and some risks that we do not currently believe to be material could later turn out to be material.ii. Although we will be making all reasonable efforts to mitigate or minimize these risks, one or more of a combination of these risks could materially and adversely impact our business, revenues, sales, and net assets, financial condition, results of operations, liquidity, capital resources and capital resources.prospects.
Risk associated with Our Business and the Automotive Industry.Industry
Deterioration in global economic conditions could have a significantmaterial adverse impact on our sales and results of operations.
The impactautomotive industry, and the demand for automobiles are influenced by general economic conditions, including among other things, rates of the fiscal cliffeconomic growth, credit availability, disposable income of consumers, interest rates, environmental and tax policies, safety regulations, freight rates and fuel and commodity prices. Negative trends in the United States, the European sovereign debt crisis and economic challenges in the United Kingdom and Europe continues to be a cause of concern despite concerted efforts to contain the adverse effectany of these events on global recovery.factors impacting the regions where we operate could materially and adversely affect our business, financial condition and results of operations.
In addition to India, we have automotive operations in the United Kingdom, South Africa, South Korea, Spain and Thailand, and have established a presence in Indonesia. The Indian automotive industry is affected materially by the general economic conditions in India and around the world. The demand for automobilesMuted industrial growth in the Indian market is influenced by factors including the growth rate of the Indian economy, easy availability of credit, and increaseIndia in disposable income among Indian consumers, interest rates, freight rates and fuel prices. During the global financial crisis, the Reserve Bank of India, or RBI, had eased its monetary policy stance to stimulate economic activity. Subsequently, as the Indian economy started recovering from the downturn, inflation pressures increased substantially followed by several interest rate hikes by RBI in 2011.
With inflation moderating in 2012, RBI reduced the repo rate and reverse repo rate by 100 basis points in Fiscal 2013 (50 basis points in April 2012, 25 basis points in January 2013 and further 25 basis points in March 2013). However, muted industrial growthrecent years along with continuing higher inflation and interest rates stillcontinue to pose risks to overall growth.growth in this market. The automotive industry in general is cyclical and economic slowdowns in the recent past have affected the manufacturing sector in India, including the automotive and related industries. DeteriorationA continuation of negative economic trends or further deterioration in key economic factorsmetrics such as the growth rate, interest rates and inflation as well as reduced availability of financing for vehicles at competitive rates maycould materially and adversely affect our automotive sales in India and results of operations.
In addition, investors’ reactions to economic developments in one country can have adverse effects on the securities of companies and the economy as a whole, in other countries, including India. A loss of investor confidence in the financial systems of other emerging markets may cause volatility in Indian financial markets and indirectly, in the Indian economy in general. In July 2015, stock markets in China experienced a substantial decline in values, which may have contributed to a drop in the price of our Shares and/or ADSs. Any worldwide financial instability could also have a negative impact on the Indian economy, including the movement of exchange rates and interest rates in India. In the event global economic recovery is slower than expected, or if there is any significant financial disruption, this could have a material adverse effect on our cost of funding, portfolio of financing loans, business, prospects, results of operations, financial condition and the trading price of our Shares and ADSs.
Our Jaguar Land Rover operations havebusiness has significant presenceoperations in the United Kingdom, North America, continental Europe and China as well as sales operations in many majorother countries across the globe. The global economic downturn significantly impactedWhile the global automotive markets, particularlymarket in the United States, United Kingdom and Europe includingexperienced healthy growth in Fiscal 2015, low economic growth in the United Kingdom, where ourEurozone prompted the European Central Bank to engage in quantitative easing beginning in January 2015, and uncertainty over debt negotiations with Greece remains. Economic sanctions and declining energy prices continue to impact Russia. Recessionary concerns are mounting in Brazil while China’s economy is showing signs of slowing. Jaguar Land Rover operations have significant sales exposure. Our strategy with respect to our Jaguar Land Rover operations, which includes new product launches and expansion into growingRovers’ ambitions for growth in emerging markets such as China, India, Russia and Brazil, may not be sufficient to mitigate the decrease in demand for our products in established markets and thismaterialize as expected, which could have a significant adverse impact on our financial performance. Our Jaguar Land Rover business, while increasing its investments towards products, capacity expansion and other initiatives, is also exploring opportunities to reduce its cost base through increased sourcing of materials from low cost countries, reduction in number of suppliers, reduction in number of platforms, reduction in engineering change costs, increased use of off-shoring and several other initiatives. While markets in the United States have shown signs of recovery and stability, the United Kingdom and Europe continue to struggle. If industryautomotive demand softens because of the impact of the debt crisis, or lower or negative economic growth in key markets including China,(notably China) or other factors, our results of operations and financial condition could be materially and adversely affected.
Restrictive covenants in our financing agreements may limit our operations and financial flexibility and materially and adversely impact our futurefinancial condition, results of operations and financial condition.prospects.
Some of our financing agreements and debt arrangements set limits on and/or require us to obtain lender consentsconsent before, among other things, pledging assets as security. In addition, certain financial covenants may limit our ability to borrow additional funds or to incur additional liens. In the past, we have been able to obtain required lender consentsconsent for such activities. However, there can be no assurance that we will be able to obtain such consents in the future. If our financialliquidity needs or growth plans require such consents and such consents are not obtained, we may be forced to forego or alter our plans, which could materially and adversely affect our results of operations and financial condition.
In the event that we breach these covenants, the outstanding amounts due under such financing agreements could become due and payable immediately and/or result in increased costs. A default under one of these financing agreements may also result in cross-defaults under other financing agreements and result in the outstanding amounts under such other financing agreements becoming due and payable immediately. Defaults under one or more of our financing agreements could have a material adverse effect on our financial condition and results of operations and financial condition.operations.
In recent years, including Fiscal 2013,2014, we were in breach of two financial covenants relating to our ratio of total outstanding liabilityliabilities to tangible networthnet worth and the other relating to our debt service coverage ratio in bank guarantees relating to our 2009 non-convertible Indian rupee debentures, which would potentially increase cost. We havevarious financing agreements requested and obtained waivers of our obligations to pay additional costs as a consequence of such breaches. These breaches have not resulted in an event of default in our financing agreements or the payment of penalties. However, we cannot assure you that we will succeed in obtaining consents or waivers in the future from our lenders or guarantors, or that our lenders and guarantors will not impose additional operating and financial restrictions on us, or otherwise seek to modify the terms of our existing loanfinancing agreements in ways that are materially adverse to us. See “ItemItem 5. Operating“Operating and Financial Review and Prospects — Prospects—B. Liquidity and Capital Resources — Resources—Loan Covenants.”
Because of the acquisition of Jaguar Land Rover, our historical financial statements may not be comparable.
On June 2, 2008, we completed the acquisition of Jaguar Land Rover from the Ford Motor Company, or Ford. Therefore, our financial statements for the Fiscal years ended March 31, 2009 include the results of Jaguar Land Rover for the period commencing from June 2, 2008 to March 31, 2009. Neither pro forma nor historical consolidated financial statements showing our combined results of operations and financial condition, including Jaguar Land Rover, have been prepared or are being provided in this annual report.
This may make it difficult to compare our past performance and financial condition or to estimate our consolidated performance in the future. Moreover, the global disruption of the automotive industry during In addition, future non-compliance with the financial crisis in 2009, including in Jaguar Land Rover’s markets, makes past performancecovenants of the business not necessarily indicative ofour agreements may lead to increased cost for future demand, trends or results.financings.
Exchange rate and interest rate fluctuations could materially and adversely affect our financial condition and results of operations.
Our operations are subject to riskrisks arising from fluctuations in exchange rates with reference to countries in which we operate. These risks primarily stem from the relative movements of the GBP, the US dollar, the Euro, the Chinese Renminbi, the Japanese Yen and the Indian rupee. In particular, as of August 1, 2013, the value of the Indian rupee against the US Dollar was Rs. 60.4437 per US$1.00, as published by Bloomberg L.P., a depreciation of approximately 11.4%, as compared to Rs.54.2850 = US $1.00, based on the fixing rate in the city of Mumbai as published by the Foreign Exchange Dealers’ Association of India on March 30, 2013.
We import capital equipment, raw materials and components from, and also sell ourmanufacture vehicles in, and sell vehicles into, various countries. These transactions are denominated primarilycountries, and therefore our revenues and costs have significant exposure to the relative movements of the GBP, the U.S. dollar, the Euro, the Russian Ruble, the Chinese Renminbi, the Singapore dollar, the Japanese Yen, the Australian dollar, the South African rand, the Thai baht, the Korean won and the Indian rupee. In particular, the Indian rupee declined significantly relative to the U.S. dollar in US dollars and Euros. recent years. As published by Bloomberg L.P. the exchange rate expressed in Indian rupees per US$1.00, was Rs.63.65 on June 30, 2015.
Moreover, we have outstanding foreign currency denominated debt and are sensitive to fluctuations in foreign currency exchange rates. We have experienced and expect to continue to experience foreign exchange losses and gains on obligations denominated in foreign currencies in respect of our borrowings and foreign currency assets and liabilities due to currency fluctuations. Our Jaguar Land Rover operations have significant exchange rate exposure considering our vehicle sales in the U.S., Europe and China. In addition, Jaguar Land Rover sources a significant portion of input material from European suppliers.
As compared to the previous year, the GBP has, on average, weakened against the US dollar, and strengthened against the Euro, which has positively influenced the results of our operations The depreciation of the Indian rupee against the US dollar adversely impacted our borrowing cost and consequently, our results of operations. Our Jaguar Land Rover operations have outstanding foreign currency denominated debt in US dollars and are sensitive to fluctuations in foreign currency exchange rates.
Although we engage in currency hedging in order to decrease our foreign exchange risks, a weakening of the Indian rupee against the US dollar or other major foreign currencies may have an adverse effect on our cost of borrowing and consequently may increase our financing costs, which could have a significant adverse impact on our results of operations.
We also have interest-bearing assets (including cash balances) and interest-bearinginterest bearing liabilities, which earnbear interest at variable rates. We are therefore exposed to changes in interest rates in the various markets in which we borrow.
Financial instability Although we engage in other countries could disruptmanaging our businessinterest and cause the trading priceforeign exchange exposure through use of our Sharesfinancial hedging instruments such as forward contracts, swap agreements and ADSs to decrease.
The Indian automotive marketoption contracts, higher interest rates and a weakening of the Indian economy are influenced by economic and market conditions in other countries. Although economic conditions are different in each country, investors’ reactions to economic developments in one country can have adverse effects on the securitiesrupee against major foreign currencies could significantly increase our cost of companies and the economy as a whole, in other countries, including India. A loss of investor confidence in the financial systems of other emerging markets may cause volatility in Indian financial markets and indirectly, in the Indian economy in general. Any worldwide financial instabilityborrowing, which could also have a negative impact on the Indian economy, including the movement of exchange rates and interest rates in India. In the event the recovery of global economy is slower than expected, or if there is any significant financial disruption, this could have anmaterial adverse effect on our cost of funding, loan portfolio, business, prospects,financial condition, results of operations financial condition and the trading price of our Shares and ADSs.liquidity.
Intensifying competition could materially and adversely affect our sales, financial condition and results of operations.
The global automotive industry is highly competitive and competition is likely to further intensify in viewlight of the continuing globalization and consolidation in the worldwide automotive industry.consolidation. Competition is especially likely to increase in the premium automotive categories as each market participant intensifies its efforts to retain its position in established markets while also developing a presenceexpanding in emerging markets, such as China. The factorsChina, India, Russia, Brazil and parts of Asia. Factors affecting competition include product quality and features, innovation and product development time, ability tothe timing of the introduction of new products, cost control, costs, pricing, reliability, safety, fuel economy, environmental impact and perception thereof, customer service and financing terms. There can be no assurance that we will be able to compete successfully in the global automotive industry in the future.
We also face strong competition in the Indian market from domestic as well as foreign automobile manufacturers. Improving infrastructure and robust growth prospects compared to other mature markets are attractinghave attracted a number of international companies to India either through joint ventures with local partners or through independently owned operations in India. International competitors bring with them decades of international experience, global scale, advanced technology and significant financial resources. Consequently, domestic competition is likely to further intensify in the future. There can be no assurance that we will be able to implement our future strategies in a way that will mitigate the effects of increased competition inon the Indian automotive industry.
Designing, manufacturing and selling vehicles is capital intensive and requires substantial investments in facilities, machinery, research and development, product design, engineering, technology and marketing in order to meet both customer preferences and regulatory requirements. If our competitors consolidate or enter into other strategic agreements, they may be able to take better advantage of economies of scale or enhance their competitiveness in other ways. Our competitors may also be able to benefit from the cost savings offered by consolidation or alliances, which could adversely affect our competitiveness with respect to those competitors, which could also materially reduce our sales as well as materially and adversely affect our business, financial condition and results of operations.
Our future success depends on our ability to satisfy changing customer demands by offering innovative products in a timely manner and maintaining such products’ competitiveness.competitiveness and quality.
Our competitors canmay gain significant advantages if they are able to offer products satisfying customer needs earlier than we are able to and this could adversely impact our sales, and results of operations.operations and financial condition. Unanticipated delays or cost overruns in implementing new product launches, expansion plans or capacity enhancements could also materially and adversely impact our financial condition and results of operations.
Customer preferences, especially in many of the developed markets, seem to be moving in favor of more fuel efficient and environmentally friendly vehicles. Further, in many countries thereIn addition, increased government regulations, volatile fuel prices and evolving environment preferences of consumers has beenbrought significant pressure on the automotive industry to reduce carbon dioxide emissions. In many markets these preferences are driven by increased government regulation and rising fuel prices. Our operations may be significantly impacted if there is a delaywe experience delays in developing fuel efficient products that reflect changing customer preferences, especiallypreferences. In addition, a deterioration in the premium automotive category.quality of our vehicles could force us to incur substantial costs and damage our reputation. There can be no assurance that the market acceptance of our future products will meet our sales expectations, in which case we may be unable to realize the intended economic benefits of our investments and our financial condition and results of operations may be materially and adversely affected.
Private and commercial users of transportation increasingly use modes of transportation other than the automobile. The reasons for this include the rising costs of automotive transport, increasing traffic density in major cities and environmental awareness. Furthermore, the increased use of car-sharing concepts and other innovative mobility initiatives facilitates access to other methods of transport, thereby reducing dependency on the private automobile. A shift in consumer preferences away from private automobiles would have a material adverse effect on our general business activity and on our sales, prospects, financial condition and results of operations.
To stimulate demand, competitors in the automotive industry have offered customers and dealers price reductions on vehicles and services, which has led to increased price pressures and sharpened competition within the industry. As a provider of numerous high-volume models, our profitability and cash flows are significantly affected by the risk of rising competitive price pressures. Special sales incentives and increased price pressures in the new car business also influence price levels in the used car market, with a negative effect on vehicle resale values. This may have a negative impact on the profitability of the used car business in our dealer organization.
We are subject to risks associated with product liability, warranty and recall.
We are subject to risks and costs associated with product liability, warranties and recalls, shouldrecalls. Should we supply defective products, parts, or related after-sales services, we are subject to risks and costs associated with product liability, including by generating negative publicity, which may adversely affecthave a material adverse effect on our business, results of operations and financial condition. Such events could also require us to expend considerable resources in correcting these problems and could adversely affectsignificantly reduce demand for our products. In Fiscal 2015 and the first half of Fiscal 2016, we implemented product recalls for Jaguar Land Rover vehicles sold in North America and China. We may also be subject to class actions or other large scale product liability or other lawsuits in various jurisdictions where we have a significant presence.conduct business.
We are subject to riskrisks associated with ourthe automobile financing business in India.business.
WeIn India, we are subject to risks associated with our automobile financing business. During Fiscal 2013, in order to support the sale of our vehicles, our automobile financing business has increased its market share. Any default by our customers or inability to repay installments as due could materially and adversely affect our business, financial condition, results of operations and cash flows. In addition, any downgrade in our credit ratings may increase our borrowing costs and restrict our access to the debt markets. Over time, and particularly in the event of any credit rating downgrade, market volatility, market disruption, regulatory changes or otherwise, we may need to reduce the amount of financing receivables we originate, which could severely disrupt our ability to support the sale of our vehicles.
The sale of our commercial and passenger vehicles is heavily dependent on funding availability for our customers. Rising delinquencies and early defaults have contributed to a reduction in automobile financing, which, in turn, has had an adverse effect on funding availability for potential customers. This reduction in available financing may continue in the future and have a material adverse effect on our business, financial condition and results of operations.
Jaguar Land Rover has consumer financing arrangements in place with local providers in a number of key markets. Any reduction in the supply of available consumer financing for purchase of new vehicles could create additional pressures to increase marketing incentives in order to maintain demand for our vehicles. This could materially reduce our sales and net income. Furthermore, Jaguar Land Rover also offers residual value guarantees on the leases of certain vehicles in some markets. Any significant declines in used car valuations could materially and adversely affect our sales, financial condition and results of operations.
Over time, and particularly in the event of any credit rating downgrade, market volatility, market disruption, regulatory changes or otherwise, we may need to reduce the amount of financing receivables that we originate, which could severely disrupt our ability to support the sale of our vehicles.
Underperformance of our distribution channels and supply chains may adversely affecthave a material adverse effect on our sales and results of operations.
Our products are sold and serviced through a network of authorized dealers and service centers across our domestic market,India and through a network of distributors and local dealers in international markets. We monitor the performance of our dealers and distributors and provide them with support to enable them to perform to our expectations. There can be no assurance, however, that our expectations will be met. Any under-performanceunderperformance by our dealers or distributors could materially and adversely affect our sales and results of operations.
We rely on third parties to supply us with the raw materials, parts and components used in the manufacture of our products. Furthermore, forFor some of these parts and components, we are dependent on a single source. Our ability to procure supplies in a cost effective and timely manner is subject to various factors, some of which are not within our control. While we manage our supply chain as part of our vendor management process, any significant problems with our supply chain in the future could disrupt our business and materially and adversely affect our results of operations in an adverse manner.as well as our sales, net income and financial condition.
Natural disasters and man-made accidents, adverse economic conditions, decline in automobile demand, and lack of access to sufficient financing arrangements, among others things, could have a negative financial impact on our suppliers, and distributors in turnthereby impairing timely availability of components to us or increasingcausing increase in the costs of such components. Similarly impairments toa deterioration in the financial condition of our distributors for any reason may adversely impact our performance in some markets.performance. In addition, if one or more of the other global automotive manufacturers were to become insolvent, this would have an adverse effect on theour supply chains and may further affecthave a material adverse effect on our results of operations in an adverse manner.operations.
In respect of our Jaguar Land Rover operations, as part of a separation agreement from Ford Motor Company, we have entered into long-term supply agreements for critical components with Ford Motor Company for the supply of engines and certain other third parties for critical components.components which requires Jaguar Land Rover to purchase fixed quantities of parts through take-or-pay contracts. Any disruption of such services could have a material adverse effect on our operationsbusiness, financial condition and financial condition.results of operations.
Increases in input prices may have a material adverse effect on our results of operations.
In Fiscal 2015, 2014 and 2013, and 2012,the consumption of raw materials, components and aggregates and purchase of products for sale (including changes in inventory) constituted approximately 63.8%61.0%, 61.7% and 66.1%63.4% respectively, of our total revenues. Prices of commodity items used in manufacturing automobiles, including steel, aluminum, copper, zinc, rubber, platinum, palladium and rhodium have become increasingly volatile in recent years. Further price movements would closely depend on the evolving economic scenarios across the globe. While we continue to pursue cost reduction initiatives, an increase in price of input materials could severely impact our profitability to the extent such increase cannot be absorbed by the market through price increases and/or could have a negative impact on the demand. In addition, becausean increased price and supply risk could arise from the need for rare and frequently sought-after raw materials for which demand is high, such as rare earths, which are predominantly found in China. Rare earth metal prices and supply remain uncertain. In the past, China has limited the export of rare earths from time to time. Due to intense price competition and our high level of fixed costs, we may not be able to adequately address changes in commodity prices even if they are foreseeable. Increases in fuel costs also pose a significant challenge, to automobile manufacturers worldwide, including us, especially in the commercial and premium vehicle segmentscategories where increased fuel prices have an impact on demand. If we are unable to find substitutes for supplies of raw materials or pass price increases on to customers, or to safeguard the supply of scarce raw materials, our vehicle production, business, financial condition and results of operations could be materially and adversely affected.
Deterioration in the performance of any of our subsidiaries, joint ventures and affiliates may adversely affect our results of operations.
We have made and may continue to make capital commitments to our subsidiaries, joint ventures and affiliates, and if the business or operations of any of these subsidiaries, joint ventures and affiliates deteriorates, the value of our investments may decline substantially. We are also subject to risks associated with joint ventures and affiliates wherein we retain only partial or joint control. Our partners may be adversely affected.unable, or unwilling, to fulfill their obligations, or the strategies of our joint ventures or affiliates may not be implemented successfully, which may significantly reduce the value of our investments, and, which may in turn have a material adverse effect on our reputation, business, financial position or results of operations.
The significant reliance of Jaguar Land Rover on key mature markets increases the risk of negative impact of adverse change inreduced customer demand in those countriescountries.
Jaguar Land Rover, which contributes approximately 72%a large portion of our revenues, hasgenerates a significant presenceportion of its sales in China, the United Kingdom, North American and continental European markets. The global economic downturn significantly impactedFurthermore, in the automotive industryfourth quarter of Fiscal 2015, retail sales of Jaguar Land Rover in these marketsChina decreased by 20.4% to 23,526 units from 29,567 units compared to the same period in Fiscal 2009. Even though2014. This decline in retail sales of passenger cars were aided by government-sponsored car-scrap incentives, these incentives primarily benefited the compact and micro-compact car segments and had virtually no slowing effect on the sales declinesJaguar Land Rover has continued in the premium car or all-terrain vehicle segments in which we operate. Although demand in these markets has recovered, anyfirst quarter of Fiscal 2016. A decline in demand for ourJaguar Land Rover vehicles in these majorkey markets, mayincluding China, or inability to maintain its pricing strategy in the futurethese markets, including China, may significantly impair our business, growth prospects, financial position and results of operations. In addition, our strategy, which includes new product launches and expansion into growing markets, such as China, India, Russia and Brazil, may not be sufficient to mitigate a decrease in demand for our products in mature markets in the future, which could have a significant adverse effect on our financial performance.
We are subject to risks associated with growing our business through mergers and acquisitions.
We believe that our acquisitions provide us opportunities to grow significantly in the global automobile markets by offering premium brands and products. Our acquisitions have provided us with access to technology and additional capabilities while also offering potential synergies. However, the scale, scope and nature of the integration required in connection with our acquisitions present significant challenges, and we may be unable to integrate the relevant subsidiaries, divisions and facilities effectively within our expected schedule. An acquisition may not meet our expectations and the realization of the anticipated benefits may be blocked, delayed or reduced as a result of numerous factors, some of which are outside our control.
For example, we acquired the Jaguar Land Rover business from Ford Motor Company in June 2008, and Jaguar Land Rover has become a significant part of our business and accounted for approximately 82.9% of our total revenues for Fiscal 2015. As a result of the acquisition, we are responsible for, among other things, the obligations and liabilities associated with the legacy business of Jaguar Land Rover. There can be no assurances that any legacy issues at Jaguar Land Rover or any other acquisition we have undertaken in the past or will undertake in the future would not have a material adverse effect on our business, financial condition and results of operations, as well as our reputation and prospects.
We will continue to evaluate growth opportunities through suitable mergers and acquisitions in the future. Growth through mergers and acquisitions involves business risks, including unforeseen contingent risks or latent business liabilities that may only become apparent after the merger or acquisition is completed. The key success factors will beare seamless integration, and effective management of the merged/merged and/or acquired entity, retention of key personnel, and generating cash flow generation from synergies in engineering and sourcing, joint sales and marketing efforts, and management of a larger business. If any of these factors fails to materialize or if we are unable to manage any of the associated risks successfully, our business, financial condition and results of operations could be materially and adversely affected.
Our business is seasonal in nature and a substantial decrease in our sales during certain quarters could have a material adverse impact on our financial performance.
The sales volumes and prices for our vehicles are influenced by the cyclicality and seasonality of demand for these products. The automotive industry has been cyclical in the past and we expect this cyclicality to continue.
In the Indian market, demand for our vehicles generally peaks between January and March, although there is a decrease in demand in February just before release of the Indian fiscal budget. Demand is usually lean from April to July and picks up again in the festival season from September onwards, with a decline in December due to year-end. The automotive industry has been cyclical inyear end as customers defer purchases to the past and we expect this cyclicality to continue.new year.
Our Jaguar Land Rover business is impacted by the bi-annualsemi-annual registration of vehicles in the United Kingdom where the vehicle registration number changes every six months,March and September, which, in turn, has an impact on the resale value of vehicles. This leads to an increase in sales during the period when the aforementioned change occurs. Most other markets, such as the United States, are driveninfluenced by the introduction of new model yearnew-model-year products which typically occurs in the autumn of each year. Furthermore, western European markets tend to be impacted byyear, and there is some seasonality around the purchase of vehicles in northern states where the purchase of Jaguar vehicles is concentrated in the spring and summer months, and the purchase of 4x4 vehicles is concentrated in the autumn/winter holidays.months. Markets in China tend to showexperience higher demand for vehicles around the Chinese New Year. Demand in western European automotive markets tends to be reduced during the summer and winter holidays. Furthermore, our cash flows are impacted by the temporary shutdown of three of our manufacturing plants in the United Kingdom during the summer and winter holidays. The resulting sales and cash flow profile influences operating results on a quarter-to-quarterquarter to quarter basis.
We rely on licensing arrangements with Tata Sons Limited to use the “Tata” brand. Any improper use of the associated trademarks by our licensor or any other third parties could materially and adversely affect our business, financial condition and results of operations.
Our rights to our trade names and trademarks are a crucial factor in marketing our products. Establishment of the “Tata” word mark and logo mark in and outside India is material to our operations. We have licensed the use of the “Tata” brand from our Promoter, Tata Sons Limited, or Tata Sons. If Tata Sons, or any of theirits subsidiaries or affiliated entities, or any third party uses the trade name “Tata” in ways that adversely affect such trade name or trademark, our reputation could suffer damage, which in turn could have a material adverse effect on our business, financial condition and results of operations.
Inability to protect or preserve our intellectual property could materially and adversely affect our business, financial condition and results of operations.
With respect to our Jaguar Land Rover business, weWe own or otherwise have rights in respect of a number of patents relating to the products we manufacture, which have been obtained over a period of years.manufacture. In connection with the design and engineering of new vehicles and the enhancement of existing models, we seek to regularly develop new technical designs for use in our vehicles.intellectual property. We also use technical designs which are the intellectual property of third parties with such third parties’ consent. These patents and trademarks have been of value in the growth of our business and may continue to be of value in the future. Although we do not regard any of our businesses as being dependent upon any single patent or related group of patents, an inability to protect this intellectual property generally, or the illegal breach of some or a large group of our intellectual property rights, would have a materially adverse effect on our operations, business, financial condition and / or financial condition.results of operations. We may also be affected by restrictions on the use of intellectual property rights held by third parties and we may be held legally liable for the infringement of the intellectual property rights of others in our products.
Impairment of intangible assets may have a material adverse effect on our results of operations.
Designing, manufacturing and selling vehicles is capital intensive and requires substantial investments in intangible assets such as research and development, product design and engineering technology. We review the value of our intangible assets to assess on an annual basis whether the carrying amount matches the recoverable amount for the asset concerned based on underlying cash-generating units. We may have to take an impairment loss as at a current balance sheet date or future balance sheet date, if the carrying amount exceeds the recoverable amount, which could have a material adverse effect on our financial condition and the results of operations.
We may be adversely affected by labor unrest.
All of our permanent employees in India, other than officers and managers, in India and most of our permanent employees in South Korea Spain and the United Kingdom, including certain officers and managers, in relation to our automotive business, are members of labor unions and are covered by our wage agreements, where applicable, with those labor unions.
In general, we consider our labor relations with all of our employees to be good. However, in the future we may be subject to labor unrest, which may delay or disrupt our operations in the affected regions, including the acquisition of raw materials and parts, the manufacture, sales and distribution of products and the provision of services. If work stoppages or lock-outs at our facilities or at the facilities of our major vendors occur or continue for a long period of time, our business, financial condition and results of operations may be materially and adversely affected.
Our business and prospects could suffer if we lose one or more key personnel or if we are unable to attract and retain our employees.
Our business and future growth depend largely on the skills of our workforce, including executives and officers, and automotive designers and engineers. The loss of the services of one or more of our personnel could impair our ability to implement our business strategy. In view of intense competition, any inability to continue to attract, retain and motivate our workforce could materially and adversely affect our business, financial condition, results of operations and prospects.
Future pension obligations may prove more costly than currently anticipated and the market value of assets in our pension plans could decline.
We provide post-retirement and pension benefits to our employees, including defined benefit plans. Our pension liabilities are generally funded. However, lower returns on pension fund assets, changes in market conditions, interest rates or inflation rates, and adverse changes in other critical actuarial assumptions, may impact our pension liabilities or assets and consequently increase funding requirements, which could materially decrease our net income and cash flows.
Any inability to manage our growing international business may materially and adversely affect our financial condition and results of operations.
Our growth strategy relies on the expansion of our operations by introducing certain automotive products in other parts of the world,markets outside India, including Europe, China, Russia, Brazil, the United States, Africa and other parts of Asia. The costs associated with entering and establishing ourselves in new markets, and expanding such operations, may be higher than expected, and we may face significant competition in those regions. In addition, our international business is subject to many actual and potential risks and challenges, including language barriers, cultural differences and other difficulties in staffing and managing overseas operations, inherent difficulties and delays in contract enforcement and the collection of receivables under the legal systems of some foreign countries, the risk of non-tariff barriers, other restrictions on foreign trade or investment sanctions, and the burdens of complying with a wide variety of foreign laws, rules and regulations.
As part of our global activities, we may engage with third-party dealers and distributors which we do not control but which nevertheless take actions that could have a material adverse impact on our reputation and business. In addition, we cannot assure you that we will not be held responsible for any activities undertaken by such dealers and distributors. If we are unable to manage risks related to our expansion and growth in other parts of the world, our business, financial condition and results of operations could be materially and adversely affected.
Any disruption of the operations of our manufacturing, design, engineering and other facilities could materially and adversely affect our business, financial condition and results of operations.
We have manufacturing facilities and design and engineering centers in India, the United Kingdom, China, South Korea, Thailand, South Africa and Brazil, and have established a presence in Indonesia. We could experience disruptions to our manufacturing, design and engineering capabilities for a variety of reasons, including, among others, extreme weather, fire, theft, system failures, natural catastrophes, mechanical or equipment failures and similar events. Any such disruptions could affect our ability to design, manufacture and sell our products and, if any of these events were to occur, there can be no assurance that we would be able to shift our design, engineering or manufacturing operations to alternate sites in a timely manner or at all, and our business, financial condition and results of operations could be materially and adversely affected.
We are exposed to operational risks, including risks in connection with our use of information technology.
Operational risk is the risk of loss resulting from inadequate or failed internal systems and processes, from either internal or external events. Such risks could stem from inadequacy or failures of controls within internal procedures, violations of internal policies by employees, disruptions or malfunctioning of information technology systems such as computer networks and telecommunication systems, other mechanical or equipment failures, human error, natural disasters or malicious acts by third parties. Any unauthorized access to or misuse of data on our information technology systems, human errors or technological or process failures of any kind could severely disrupt our operations, including our manufacturing, design and engineering processes, and could have a material adverse effect on our reputation, financial condition and results of operations.
We may be materially and adversely affected by the divulgence of confidential information.
Although we have implemented policies and procedures to protect confidential information such as key contractual provisions, future projects, and customer records, such information may be divulged, including as a result of hacking or other threats from cyberspace. If this occurs, we could be subject to claims by affected parties, negative publicity and loss of proprietary information, all of which could have an adverse and material impact our reputation, business, financial condition, results of operations and financial condition could be adversely affected.cash flows.
Future pension obligations may prove more costly than currently anticipated and the market value of assetsAny failures or weaknesses in our pension plansinternal controls could decline.
We provide post retirementmaterially and pension benefits to our employees some of which are defined benefit plans.
Our pension liabilities are generally funded and the pension plan assets are particularly significant in respect of the Jaguar and Land Rover pension plans. All new employees in our Jaguar Land Rover operations from April 19, 2010, participate in a new defined contribution pension plan.
Lower return on pension fund assets, changes in market conditions, changes in interest rates, changes in inflation rates, and adverse changes in other critical actuarial assumptions, may impact the pension liabilities and consequently increase funding requirements, which will adversely affect our financial condition and results of operations.
As discussed in Item 15 “Controls and Procedures,” upon an evaluation of the effectiveness of the design and operation of our internal control over financial reporting conducted as at March 31, 2015, we concluded that there was a material weakness such that our internal control over financial reporting was not effective as at March 31, 2015. Although we have instituted remedial measures to address the material weakness identified and continually review and evaluate our internal control systems to allow management to report on the sufficiency of our internal control over financial reporting, we cannot assure you that we will not discover additional weaknesses in our internal control over financial reporting. Any such additional weaknesses or failure to adequately remediate any existing weakness could materially and adversely affect our financial condition and results of operations as well as our ability to accurately report our financial condition and results of operations in a timely and reliable manner.
Our insurance coverage may not be adequate to protect us against all potential losses to which we may be subject, and this may have a material adverse effect on our business.business, financial condition and results of operations.
While we believe that the insurance coverage that we maintain is reasonably adequate to cover all normal risks associated with the operation of our business, there can be no assurance that our insurance coverage will be sufficient, that any claim under our insurance policies will be honored fully or timely. Also,in a timely manner, or that our insurance premiums will not increase substantially. Accordingly, to the extent that we suffer loss or damage that is not covered by insurance or which exceeds our insurance coverage, or are required to pay higher insurance premiums, our business, financial condition and results of operations may be materially and adversely affected.
Our business could be negatively affected by the actions of activist shareholders.
Certain of our shareholders may from time to time advance shareholder proposals or otherwise attempt to effect changes or acquire control over our business. Campaigns by shareholders to effect changes at publicly listed companies are sometimes led by investors seeking to increase short-term shareholder value by advocating corporate actions such as financial restructuring, increased borrowing, special dividends, stock repurchases or even sales of assets or the entire company, or by voting against proposals put forward by the board of directors and management of the company. If faced with actions by activist shareholders, we may not be able to respond effectively to such actions, which could be disruptive to our business.
We may have to comply with more stringent foreign investment regulations in India in the event of an increase in shareholding of non-residents or if we are considered as engaged in a sector in which foreign investment is restricted.
Indian companies, which are owned or controlled by non-resident persons, are subject to investment restrictions specified in the Consolidated FDI (Foreign Direct Investment) Policy. Under the Consolidated FDI Policy, an Indian company is considered to be “owned” by a non-resident persons if more than 50% of its equity interest is beneficially owned by non-resident persons. Thenon-resident equity shareholding in the our company may, in the near future, exceed 50%, thereby resulting in our company being considered as being “owned” by non-resident entities under the Consolidated FDI Policy. In such an event, any investment by us in existing subsidiaries, associates or joint ventures and new subsidiaries, associates or joint ventures will be considered as indirect foreign investment and shall be subject to various requirements specified under the Consolidated FDI Policy, including sectoral limits, approval requirements and pricing guidelines, as may be applicable.
Furthermore, as part of our automotive business, we supply and have in the past supplied vehicles to Indian military and paramilitary forces and in the course of such activities have obtained an industrial license from the Department of Industrial Policy. The Consolidated FDI policy applies different foreign investment restrictions to companies based upon the sector in which they operate. While we believe we are an automobile company by virtue of the significance of our automobile operations, in the event that foreign investment regulations applicable to the defense sector (including under the Consolidated FDI Policy) are made applicable to us, we may face more stringent foreign investment restrictions and other compliance requirements compared to those applicable to us presently, which in turn could materially affect our business, financial condition and results of operations.
We require certain approvals or licenses in the ordinary course of business, and the failure to obtain or retain them in a timely manner, or at all, could materially and adversely affect its operations.
We require certain statutory and regulatory permits, licenses and approvals to carry out our business operations and applications for their renewal need to be made within certain time frames. For some of the approvals which may have expired, we have either made or are in the process of making an application for obtaining the approval or its renewal. While we have applied for renewal for such approvals, registrations and permits, we cannot assure you that we will receive them in a timely manner or at all. We can make no assurances that the approvals, licenses, registrations and permits issued to us would not be suspended or revoked in the event of non-compliance or alleged non-compliance with any terms or conditions thereof, or pursuant to any regulatory action. Furthermore, if we are unable to renew or obtain necessary permits, licenses and approvals on acceptable terms in a timely manner, or at all, our business, financial condition and results of operations could be materially and adversely affected.
Any downgrading of India’s debt rating by a domestic or international rating agency could negatively impact our business.
Any adverse revisions to India’s credit ratings for domestic and international debt by domestic or international rating agencies could adversely impact our ability to raise additional financing as well as the interest rates and other commercial terms at which such additional financing is available. This could have a material adverse effect on our financial condition may be adversely affected.results, business prospects, ability to obtain financing for capital expenditures and the price of our Shares and ADSs.
Political and Regulatory Risks.Risks
India’s obligations under the World Trade Organization Agreement.Agreement could materially affect our business.
India’s obligations under its World Trade Organization agreement could reduce the present level of tariffs on imports of components and vehicles. Reductions of import tariffs could result in increased competition, which in turn could materially and adversely affect our sales, business, financial condition and results of operations.
New or changing laws, regulations and government policies regarding increased fuel economy, reduced greenhouse gas and other emissions, vehicle safety and taxes may have significant impact on our business.
As an automobile company, we are subject to extensive governmental regulations regarding vehicle emission levels, noise, safety and levels of pollutants generated by our production facilities. These regulations are likely to become more stringent and the resulting higher compliance costs may significantly impact our future results of operations. In particular, the United States and Europe have stringent regulations relating to vehicularvehicle emissions. The proposed tightening of vehicle emissions regulations by the European Union will require significant costs for compliance. While we are pursuing various technologies in order to meet the required standards in the various countries in which we sell our vehicles, the costs for compliance with these required standards canmay be significant to our operations and may adversely impact our results of operations.
In order to comply with current and future safety and environmental norms, we may have to incur additional costs to (i) operate and maintain our production facilities, (ii) install new emissions controls or reduction technologies, (iii) purchase or otherwise obtain allowances to emit greenhouse gases, (iv) administer and manage our greenhouse gas emissions program, and (v) invest in research and development to upgrade products and manufacturing facilities. If we are unable to develop commercially viable technologies or otherwise unable to attain compliance within the time frames set by the new standards, we could face significant civil penalties or be forced to restrict product offerings significantly. Moreover, safety and environmental standards may at times impose conflicting imperatives, which pose engineering challenges and would, among other things, increase our costs. While we are pursuing the development and implementation of various technologies in order meet the required standards in the various countries in which we sell our vehicles, the costs for compliance with these required standards could be significant to our operations and may materially and adversely affect our business, financial condition and results of operations.
In addition, the Road Transport and Safety Bill (RTSB) 2015, which is subject to legislative approval by the Indian Parliament, could expose us to additional liability for vehicle recalls and for manufacturer’s liability for our vehicles.
Imposition of any additional taxes and levies designed to limit the use of automobiles could adversely affectsignificantly reduce the demand for our products as well as our sales and our results of operations.net income. Changes in corporate and other taxation policies as well as changes in export and other incentives given by the various governments could also adversely affect our results of operations. For example, we benefit from excise duty exemptions for manufacturing facilities in the Statestate of Uttarakhand and other incentives such as subsidies or loans from states where we have manufacturing operations. The Government of India had proposed a comprehensive national goods and services tax, or GST, regime that willwould combine taxes and levies by the central and state governments into one unified rate structure. While both the Government of India and other state governments of India have publicly announced that all committed incentives will be protected following the implementation of the GST, given the limited availability of information in the public domain concerning the GST, we are unable to provide any assurance as to this or any other aspect of the tax regime following implementation of the GST. The implementation of this rationalized tax structure may be affected by any disagreement between certain state governments, which could create uncertainty. The timelineGovernment of India has publicly announced its intention to implement the proposed transition is uncertain as at the date hereof.
The Direct Tax Code Bill 2010, or DTC, proposes to replace the existing Income Tax Act, 1961 and other direct tax laws, with a view to simplify and rationalize the tax provisions into one unified code. The various proposals included in DTC bill are subject to review by Indian parliament and as such impact if any, is not quantifiable atGST on April 1, 2016, however, we can make no assurances regarding this stage.timeline.
Regulations in the areas of investments, taxes and levies may also have an impact on Indian securities, including our Shares and ADSs. In this regard it is important to note that DTC bill would likely have a significant impact on the current tax regime, including in respect of our Shares and ADSs. For more information, see Item 4.B “—Business Overview — Overview—Government Regulations — Indian Taxes — Goods and Services Tax”Regulations” of this annual report.report on Form 20-F.
In addition, the antitrust regulator in China, the Bureau of Price Supervision and Anti-Monopoly of the National Development and Reform Commission, or the NDRC, launched an investigation into the pricing practices of more than 1,000 Chinese and international companies in the automotive industry, including Jaguar Land Rover and many of its competitors, in 2014. The NDRC has reportedly imposed fines on certain of our international competitors as a result of anti-competitive practices pertaining to vehicle and spare part pricing. In response to this investigation, we established a process to review our pricing in China and announced reductions in the manufacturer’s suggested retail price for the 5.0 liter V8 models and the price of certain of our spare parts. These and other price reductions on our products sold in China may significantly reduce our revenues and profits generated by operations in China and have a material adverse effect on our financial condition and results of operations. Our attempts to offset the potential decline in revenue and profits by increasing operational efficiencies and leveraging economies of scale (for example, through local production in China through our joint venture with Chery Automobile Company Ltd., or Chery) may fail or not be as successful as expected. Furthermore, any regulatory action taken, or penalties imposed, by the NDRC or other authorities in China, may have significant severe reputational consequences on our business as well as our profitability and prospects.
We may be affected by competition law in India and any adverse application or interpretation of the Competition Act could adversely affect our business.
The Indian Competition Act regulates practices having an appreciable adverse effect on competition, or AAEC, in a given relevant market in India. Under the Competition Act, any formal or informal arrangement, understanding or action in concert which causes or is likely to cause an AAEC is considered void and results in imposition of substantial penalties. Consequently, all agreements entered into by us could be within the purview of the Competition Act. Furthermore, any agreement among competitors which directly or indirectly involves determination of purchase or sale prices, limits or controls production, sharing the market by way of geographical area or number of subscribers in the relevant market or which directly or indirectly results in bid-rigging or collusive bidding is presumed to have an AAEC in the relevant market in India and is considered void. The Competition Act also prohibits abuse of a dominant position by any enterprise. We cannot predict with certainty the impact of the provisions of the Competition Act on our agreements at this stage.
On March 4, 2011, the Government of India issued and brought into force the combination regulation (merger control) provisions under the Competition Act with effect from June 1, 2011. These provisions require acquisitions of shares, voting rights, assets or control or mergers or amalgamations that cross the prescribed asset- and turnover-based thresholds to be mandatorily notified to and pre-approved by the Competition Commission of India, or CCI. Additionally, on May 11, 2011, the CCI issued Competition Commission of India (Procedure for Transaction of Business Relating to Combinations) Regulations, 2011 (as amended), which sets out the mechanism for the implementation of the merger control regime in India.
Furthermore, the CCI has extraterritorial powers and can investigate any agreements, abusive conduct or combination occurring outside India if such agreement, conduct or combination has an AAEC in India. The CCI has initiated an inquiry against us and other car manufacturers, collectively referred to hereinafter as the OEMs, pursuant to an allegation that genuine spare parts of automobiles manufactured by the OEMs were not made freely available in the open market in India and, accordingly, anti-competitive practices were carried out by the OEMs.
If we are adversely affected, directly or indirectly, by the application or interpretation of any provision of the Competition Act, or any enforcement proceedings initiated by the CCI, or any adverse publicity that may be generated due to scrutiny or prosecution by the CCI or if any prohibition or substantial penalties are levied under the Competition Act, it could adversely affect our business, financial condition and results of operations.
We may be adversely impacted by political instability, wars, terrorism, multinational conflicts, natural disasters, fuel shortages/prices, epidemics and labor strikes.
Our products are exported to a number of geographical markets and we plan to further expand our international operations further in the future. Consequently, we are subject to various risks associated with conducting our business outside our domestic markets and our operations in those markets may be subject to political instability, in those markets, wars, terrorism, regional and/or multinational conflicts, natural disasters, fuel shortages, epidemics and labor strikes. In addition, conducting business internationally, especially in emerging markets, exposes us to additional risks, including adverse changes in economic and government policies, unpredictable shifts in regulation, inconsistent application of existing laws, rules and regulations, unclear regulatory and taxation systems and divergent commercial and employment practices and procedures. Any significant or prolonged disruption or delay in our operations related to these risks could materially and adversely impactaffect our business, financial condition and results of operations.
Compliance with new andor changing corporate governance and public disclosure requirements adds uncertainty to our compliance policies and increases our costs of compliance.
We are subject to a complex and continuously changing regime of laws, rules, regulations and standards relating to accounting, corporate governance and public disclosure, including the Sarbanes-Oxley Act of 2002 and U.S. Securities and Exchange Commission, or SEC, regulations, Securities and Exchange Board of India, or SEBI, regulations, New York Stock Exchange, or NYSE, listing rules, andthe Companies Act as well as Indian stock market listing regulations. New or changed laws, rules, regulations and standards may lack specificity and are subject to varying interpretations. As an example, pursuant to the U.S. Dodd-Frank Wall Street Reform and Consumer Protection Act, which contains significant corporate governance and executive compensation-related provisions, the SEC has adopted additional rules and regulations in areas such as “say on pay”. Similarly, under applicable Indian laws, for example, remuneration packages may in certain circumstances require shareholders’ approval. Our management and other personnel may be required to devote a substantial amount of time to such compliance initiatives. Their application in practice may evolve over time as new guidance is provided by regulatory and governing bodies. This could result in continuing uncertainty regarding compliance matters and higher costs of compliance as a result of ongoing revisions to such governance standards. We are committed to maintaining high standards of corporate governance and public disclosure. However, our efforts to comply with evolving laws, rules, regulations and standards in this regard have resulted in, and are likely to continue to result in, increased general and administrative expenses and a diversion of management resources and time.
In addition, new laws,The Companies Act has effected significant changes to the existing Indian company law framework, which may subject us to higher compliance requirements and increase our compliance costs. A majority of the provisions and rules regulationsunder the Companies Act have been notified and standards regardinghave come into effect from the date of their respective notification, resulting in the corresponding provisions of the Companies Act, 1956 ceasing to have effect. The Companies Act has brought into effect significant changes to the Indian company law framework, such as in the provisions related to the issue of capital (including provisions in relation to issue of securities on a private placement basis), disclosures in offering documents, corporate governance may make itnorms, accounting policies and audit matters, related party transactions, introduction of a provision allowing the initiation of class action suits in India against companies by shareholders or depositors, a restriction on investment by an Indian company through more difficultthan two layers of subsidiary investment companies (subject to certain permitted exceptions), prohibitions on loans to directors and insider trading and restrictions on forward dealing by directors and key managerial personnel. We are also required to spend, in each financial year, at least 2% of our average net profits during the three immediately preceding financial years, calculated for us to obtain directorTata Motors Limited on a standalone basis under Indian GAAP, towards corporate social responsibility activities. Furthermore, the Companies Act imposes greater monetary and officerother liability insurance. Further, our Board members, Executive Directorson us and our Chief Financial Officer could face an increased risk of personal liability in connectiondirectors for any non-compliance. To ensure compliance with the performancerequirements of their duties. As a result,the Companies Act, we may need to allocate additional resources, which may increase our regulatory compliance costs and divert management’s attention. Accordingly, we may face challenges in interpreting and complying with certain provisions of the Companies Act due to limited relevant jurisprudence. In the event that our interpretation of the Companies Act differs from, or contradicts with, any judicial pronouncements or clarifications issued by the Government in the future, we may face regulatory actions or be required to undertake remedial steps. In addition, some of the provisions of the Companies Act overlap with other existing laws and regulations (such as corporate governance provisions and insider trading regulations issued by SEBI). Recently, SEBI issued revised corporate governance guidelines which became effective on October 1, 2014. Pursuant to the revised guidelines, we are required to, among other things, ensure that there is at least one woman director on our board of directors at all times, establish a vigilance mechanism for directors and employees and reconstitute certain committees in accordance with the revised guidelines. We may face difficulties attractingin complying with any such overlapping requirements. Furthermore, we cannot currently determine the impact of certain provisions of the Companies Act and retaining qualified Board membersthe revised SEBI corporate governance norms. Any increase in our compliance requirements or in our compliance costs may have an adverse effect on our business, financial condition and senior management, whichresults of operations.
Compliance with the SEC’s rules for disclosures on “conflict minerals” may be time consuming and costly and could harmadversely affect our business. If we failreputation.
Under the Dodd-Frank Act, the SEC has adopted rules that apply to companies that use certain minerals and metals, known as conflict minerals, in their products, including certain products manufactured for them by third parties. The rules require companies to conduct due diligence as to whether or not such minerals originated from the Democratic Republic of Congo or adjoining countries, and further require companies to file certain information with the SEC about the use of these minerals. We expect to incur additional costs to comply with newthese due diligence and disclosure requirements. In addition, depending on our findings or changed laws, rules, regulations or differing standards, our business andinability to make reliable findings about the source of any possible conflict minerals that may be used in any products manufactured for us by third parties, our reputation maycould be harmed.
Risks associated with Investments in an Indian Company.Company
Political changes in the Government of India could delay and/or affect the further liberalization of the Indian economy and materially and adversely affect economic conditions in India generally and our business in particular.
Our business could be significantly influenced by economic policies adopted by the Government of India. Since 1991, successive governments have pursued policies of economic liberalization and financial sector reforms.
The Government of India has at various times announced its general intention to continue India’s current economic and financial liberalization and deregulation policies. However, protests against privatizations,such policies, which have occurred in the past, could slow the pace of liberalization and deregulation. The rate of economic liberalization could change, and specific laws and policies affecting foreign investment, currency exchange rates and other matters affecting investment in India could change as well. While we expect any new government to continue the liberalization of India’s economic and financial sectors and deregulation policies, there can be no assurance that such policies will be continued.
The Government of India has traditionally exercised and continues to exercise influence over many aspects of the economy. Our business and the market price and liquidity of our ADSs and Shares may be affected by interest rates, changes in policy, taxation, social and civil unrest and other political, economic or other developments in or affecting India.
A change in the Government of India’s policies in the future could adversely affect business and economic conditions in India and could also adversely affect our financial condition and results of operations. A significant change in India’s economic liberalization and deregulation policies could disrupt business and economic conditions in India generally, and specifically those of our Company,business and operations, as a substantial portion of our assets are located in India. This could have a material adverse effect on our financial condition and results of operations.
Terrorist attacks, civil disturbances, regional conflicts and other acts of violence, particularly in India, may disrupt or otherwise adversely affect the markets in which we operate, our business and our profitability.
India has from time to time experienced social and civil unrest and hostilities, including terrorist attacks and riots and armed conflict with neighboring countries. Events of this nature in the future could influence the Indian economy and could have a material adverse effect on our business as well as the market for securities of Indian companies, including our ADSs and Shares and ADSs. In addition, any deterioration in international relations, especially between India and its neighboring countries, may result in investor concern regarding regional stability, which could adversely affect the price of our Shares or ADSs. Furthermore, India has witnessed local civil disturbances in recent years, and it is possible that future civil unrest as well as other adverse social, economic or political events in India could have an adverse impact on our business. Such incidents could also create a greater perception that investment in Indian companies involves a higher degree of risk and could have a material adverse effect on our business, results of operations and financial condition, and the market price of our Shares and ADSs.
We may be materially and adversely affected by Reserve Bank of India policies and actions.
In June 2015, after the Reserve Bank of India, or RBI, announced an interest rate reduction coupled with a cautious statement on inflation, the S&P Bombay Stock Exchange Sensitive Index dropped over six hundred (600) points and which may have impacted the price of our Shares and ADSs. We can make no assurances about future market reactions to RBI announcements and their impact on the market forprice of our vehicles.Shares and ADSs. Furthermore, our business could be significantly impacted were the RBI to make major alterations to monetary or financial policy. Certain changes, such as the raising of interest rates, could negatively affect our sales and consequently our revenue, any of which could have a material adverse effect on our financial condition and results of operations.
Rights of shareholders under Indian law may be more limited than under the laws of other jurisdictions.
Our Articles of Association, which include regulations applicable to our Boardboard of Directors,directors, and Indian law govern our corporate affairs. Legal principles relating to these matters and the validity of corporate procedures, directors’ fiduciary duties and liabilities, and shareholders’ rights may differ from those that would apply to a company incorporated in another jurisdiction. shareholders’Shareholders’ rights under Indian law may not be as extensive as shareholders’ rights under the laws of other countries or jurisdictions, including the United States. You may also have more difficulty in asserting your rights as a shareholder of our Companycompany than you would as a shareholder of a corporation organized in another jurisdiction.
The market value of your investment may fluctuate due to the volatility of the Indian securities market.
The Indian stockStock exchanges in India, including the Bombay Stock Exchange, or the BSE, have, in the past, experienced substantial fluctuations in the prices of their listed securities. The Indian stock exchanges, including the Bombay Stock Exchange Limited, or BSE, have experienced problems that,Such fluctuations, if they continue or recur, could affect the market price and liquidity of the securities of Indian companies, including our Shares.Shares and ADSs. These problems in the pasthave included temporary exchange closures, broker defaults, settlement delays and strikes by brokers. Volatility in other stock exchanges, including, but not limited to, those in China, may affect the prices of securities in India, including our Shares, which may in turn affect the price of our ADSs. In addition, the governing bodies of the Indian stock exchanges in India have from time to time imposed restrictions on trading in certain securities, limitations on price movements and margin requirements. Furthermore, from time to time disputes have occurred between listed companies and stock exchanges and other regulatory bodies, which in some cases may have had a negative effect on market sentiment.
There may be a differing level of regulation and monitoring of the Indian securities markets and the activities of investors, brokers and other participants, than in the United States. SEBI received statutory powers in 1992 to assist it in carrying out its responsibility for improving disclosure and other regulatory standards for the Indian securities markets. Subsequently, SEBI has prescribed regulations and guidelines in relation to disclosure requirements, insider dealing and other matters relevant to the Indian securities market. There may, however, be less publicly available information about Indian companies than is regularly made available by public companies in the United States.
Investors may have difficulty enforcing judgments against us or our management.
We are a public limited liability company incorporated under the laws ofin India. The majority of our directors and Executive Officers named in this annual reportexecutive officers are residents of India and substantially all of the assets of those persons and a substantial portion of our assets and the assets of these directors and Executive Officers are located in India. As a result, investorsit may find it difficultnot be possible for you to (i) effect service of process within the United States upon usthose persons or these directors and Executive Officers in jurisdictions outside of India, (ii)us. In addition, you may be unable to enforce court judgments obtained outside of India, including those based upon the civil liability provisionsin courts of the United States against those persons outside the jurisdiction of their residence, including judgments predicated solely upon U.S. federal securities laws, against uslaws. Moreover, it is unlikely that a court in India would award damages on the same basis as a foreign court if an action were brought in India or these directors and Executive Officers, (iii) enforce, inthat an Indian court court judgments obtained outside of India, including those based upon the civil liability provisions of the U.S. federal securities laws, against us or these directors and Executive Officers, and (iv) obtain expeditious adjudication of an original action in an Indian court towould enforce liabilities, including those based upon the civil liability provisions of the U.S. federal securities laws, against us or these directors and Executive Officers.
India is not a party to any international treaty in relation to the recognition or enforcement of foreign judgments. Recognition and enforcement of foreign judgments is provided under Section 13if it viewed the amount of the Code of Civil Procedure,damages as excessive or the Civil Procedure Code.
Section 13 and Section 44A of the Civil Procedure Code provide that a foreign judgment shall be conclusive as to any matter thereby directly adjudicated upon except (i) where it has not been pronounced by a court of competent jurisdiction, (ii) where it has not been given on the merits of the case, (iii) where it appears on the face of the proceedings to be founded on an incorrect view of international law or a refusal to recognize the law of India in cases where Indian law is applicable, (iv) where the proceedings in which the judgment was obtained were opposed to natural justice, (v) where it has been obtained by fraud or (vi) where it sustains a claim founded on a breach of any law in force in India.inconsistent with public policy.
Section 44A of the Indian Code of Civil Procedure, 1908, as amended, or the Civil Code, provides that where a foreign judgment has been rendered by a superior court (within the meaning of the section) in any country or territory outside of India which the Government of India has by notification declared to be a reciprocating territory, itsuch foreign judgment may be enforced in India by proceedings in execution as if the judgment had been rendered by the relevantan appropriate court in India. However, the enforceability of such judgments is subject to the exceptions set forth in Section 13 of the Civil Code.
Section 44A of the Civil Procedure Code is applicable only to monetary decrees not being in the nature of any amounts payable in respect of taxes or other charges of a likesimilar nature or in respect of a finefines or other penalty.penalties and does not include arbitration awards.
TheIf a judgment of a foreign court is not enforceable under Section 44A of the Civil Code as described above, it may be enforced in India only by a suit filed upon the judgment, subject to Section 13 of the Civil Code and not by proceedings in execution. Accordingly, as the United States has not been declared by the Government of India to be a reciprocating territory for the purposepurposes of Section 44A, of the Civil Procedure Code. Accordingly, a judgment ofrendered by a court in the United States may not be enforced onlyin India except by way of a suit filed upon the judgment and not by proceedings in execution. judgment.
The suit must be brought in India within three years from the date of the judgment in the same manner as any other suit filed to enforce a civil liability in India. It is unlikely that a courtGenerally, there are considerable delays in India would award damages on the same basis as a foreign court if an action is brought in India. Furthermore, it is unlikely that andisposition of suits by Indian court would enforce foreign judgments if it viewed the amount of damages awarded as excessive or inconsistent with public policy. courts.
A party seeking to enforce a foreign judgment in India is required to obtain prior approval from the RBI, under the central bankForeign Exchange Management Act, 1999, or FEMA to repatriate any amount recovered pursuant to such enforcement. Any judgment in a foreign currency would be converted into Indian rupees on the date of judgment and not on the date of payment.
We will be required to prepare financial statements under Ind-AS (which is India’s convergence to IFRS). The transition to Ind-AS in India is very recent and there is no clarity on the impact of such transition on us.
We currently prepare annual and interim financial statements under Indian GAAP and annual financial statements under IFRS. We will be required to prepare annual and interim financial statements under Indian Accounting Standard 101 “First-time Adoption of Indian Accounting Standards”, or Ind-AS. On January 2, 2015, the Ministry of Corporate Affairs, Government of India, the MCA, announced the revised roadmap for the implementation of Ind-AS, and on February 16, 2015, released the Companies (Indian Accounting Standards) Rules, 2015 (to be published in the Gazette of India) which will come into effect from April 1, 2016.
There is not yet a significant body of established practice on which to execute such a judgmentdraw informing judgments regarding the implementation and application of Ind-AS. In addition, Ind-AS differs in certain respects from IFRS and therefore financial statements prepared under Ind-AS may be substantially different from financial statements prepared under IFRS. There can be no assurance that our financial condition, results of operation, cash flow or to repatriate outside India any amount recovered.changes in shareholders’ equity will not be presented differently under Ind-AS than under Indian GAAP or IFRS. When we adopt Ind-AS reporting, we may encounter difficulties in the ongoing process of implementing and enhancing our management information systems. There can be no assurance that the adoption of Ind-AS will not materially and adversely affect our financial conditions and results of operations.
Risks associated with our Shares and ADSs.ADSs
Fluctuations in the exchange rate between the Indian rupee and the USU.S. dollar may have a material adverse effect on the market value of our ADSs and Shares, independent of our operating results.
The exchange rate between the Indian rupee and the U.S. dollar has changed materially in the last two decades and may materially fluctuate in the future. Fluctuations in the exchange rate between the Indian rupee and the USU.S. dollar will affect, among others things, the USU.S. dollar equivalents of the price of theour Shares in Indian rupees as quoted on the Indian stock exchanges in India and, as a result, may affect the market price of the ADSs. Such fluctuations will also affect the USU.S. dollar equivalent of any cash dividends in Indian rupees received on the Shares represented by the ADSs and the U.S. dollar equivalent of the proceeds in Indian rupee of a sale of Shares in India.
The exchange rate between the Indian rupee and the US dollar has changed materially in the last two decades and during last year in particular, and may materially fluctuate in the future. The value of the Indian rupee against the US dollar was Rs.60.4437 = US$1.00 as of August 1, 2013.
Holders of ADSs have fewer rights than shareholders and must act through the depositary to exercise those rights.
Although ADS holders of ADSs have a right to receive any dividends declared in respect of the Shares underlying the ADSs, they cannot exercise voting or other direct rights as a shareholder with respect to the Shares underlying the ADSs evidenced by ADRs.ADSs. Citibank, N.A. as depositary, or the depositary, is the registered shareholder of the deposited Shares underlying our ADSs, and therefore only Citibank, N.A. canthe depositary may exercise the rights of shareholders in connection with the deposited Shares. Only if requested by us,The depositary will the depositary notify ADS holders of ADSs of upcoming votes and arrange to deliver our voting materials to ADS holders of ADSs.only if requested by us. The depositary will try, in so far as practicable, subject to Indian laws and the provisions of our Articles of Association, to vote or have its agents vote the deposited securities as instructed by the holders of ADSs.
ADS holders. If the depositary receives voting instructions in time from aan ADS holder of ADSs which failfails to specify the manner in which the depositary is to vote the Shares underlying such ADS holder’s ADSs, such ADS holder will be deemed to have instructed the depositary to vote in favor of the items set forth in such voting instructions. If the depositary has not received timely instructions from aan ADS holder, of ADSs, thesuch ADS holder shall be deemed to have instructed the depositary to give a discretionary proxy to a person designated by us, subject to the conditions set forth in the Amended and Restated Deposit Agreement (as amended).deposit agreement. If requested by us, the depositary is required to represent all sharesShares underlying ADSs, regardless whether timely instructions have been received from thesuch ADS holders, of such ADSs, for the sole purpose of establishing a quorum at a meeting of shareholders. Additionally,In addition, in your capacity as an ADS holder, you will not be able to bring a derivative action, examine our accounting books and records, or exercise appraisal rights. Registered holders of our Shares withdrawn from the depositary arrangements will be entitled to vote and exercise other direct shareholder rights in accordance with Indian law. However, a holder may not know about a meeting sufficiently in advance to withdraw the underlying sharesShares in time. Furthermore, aan ADS holder of ADSs may not receive voting materials, if we do not instruct the depositary to distribute such materials, or may not receive such voting materials in time to instruct the depositary to vote.
Further,For further details on the terms and conditions of our ADSs and the rights and obligations of our ADS holders, please see the amended and restated deposit agreement dated as of September 27, 2004 among us, Citibank, N.A., as depositary, and all holders and beneficial owners of ADSs issued thereunder, as amended and supplemented by Amendment No. 1, dated as of December 16, 2009, hereinafter referred to as the deposit agreement, which is incorporated by reference into this annual report on Form 20-F.
Moreover, pursuant to Indian regulations, we are required to offer our shareholders preemptive rights to subscribe for a proportionate number of sharesShares to maintain their existing ownership percentages prior to the issue of new shares.Shares. These rights may be waived by a resolution passed by at least 75% of our shareholders present and voting at a general meeting. Holders of ADSsADS holders may be unable to exercise preemptive rights for subscribing to these new Shares unless a registration statement under the Securities Act is effective or an exemption from the registration requirements is available to us. Our decision to file a registration statement would be based on the costs, timing, potential liabilities and the perceived benefits associated with any such registration statement and we do not commit that we would file such a registration statement. If any issue of securities is made to our shareholders in the future, such securities may also be issued to the depositary, which may sell such securities in the Indian securities market for the benefit of the holders of ADSs. There can be no assurance as to the value, if any, the depositary would receive upon the sale of these rights/such rights or securities. To the extent that ADS holders of ADSs are unable to exercise preemptive rights, their proportionate ownership interest in the Companyour company would be reduced.
As a resultThe Government of Indian GovernmentIndia’s regulation of foreign ownership could materially reduce the price of the ADSs could decline.ADSs.
Foreign ownership of Indian securities is regulated and is partially restricted. In addition, there are restrictions on the deposit of Shares into our ADS facilities. ADSs issued by companies in certain emerging markets, including India, may trade at a discount to the market price of the underlying equity shares,Shares, in part because of the restrictions on foreign ownership of the underlying equity sharesShares and in part because ADSs are sometimes perceived to offer less liquidity than underlying shares whichShares that can be traded freely in local markets by both local and international investors. See Item 10.D “—Exchange Controls”. The ADSs could trade at a discount to
There are restrictions on daily movements in the market price of the underlying shares.Shares, which may constrain a shareholder’s ability to sell, or the price at which a shareholder can sell, Shares at a particular point in time.
The Shares are subject to a daily circuit breaker imposed by stock exchanges in India on publicly-listed companies, including us, which does not allow transactions causing volatility in the price of the Shares above a certain threshold. This circuit breaker operates independently from the index-based market-wide circuit breakers generally imposed by SEBI on Indian stock exchanges. The percentage limit on our circuit breaker is set by the stock exchanges in India based on the historical volatility in the price and trading volume of our Shares. The stock exchanges in India are not required to inform us of the percentage limit of the circuit breaker from time to time, and may change it without our knowledge. This circuit breaker effectively acts to limit the upward and downward movements in the price of our Shares. As a result of this circuit breaker, we cannot make any assurance regarding the ability of our shareholders to sell their Shares or the price at which such shareholders may be able to sell their Shares.
You may be subject to Indian taxes arising out of capital gains on the sale of the Shares. Capital gains arising from the sale of Shares are generally taxable in India.
Any gain realized on the sale of the Shares on an Indian stock exchange held for more than 12 months will not be subject to capital gains tax in India if the securities transaction tax has been paid on the transaction. The securities transaction tax will be levied on and collected by the Indian stock exchange on which the Shares are sold. Any gain realized on the sale of Shares held for more than 12 months on which no securities transaction tax has been paid, will be subject to capital gains tax in India. Furthermore, any gain realized on the sale of the Shares held for a period of 12 months or less will be subject to capital gains tax in India. See Item 10.E “Additional Information—Taxation—Taxation of Capital Gains and Losses—Indian Taxation—Capital Gains” of this annual report on Form 20-F for further information on the application of capital gains tax in India to our shareholders and ADS holders.
| Item 4. | Information on the |
A. History and Development of the Company.Company
We were incorporated on September 1, 1945 as a public limited liability company under the Indian Companies Act VII of 1913 as Tata Locomotive and Engineering Company Limited.Limited and we received a certificate of commencement of business on November 20, 1945. Our name was changed to Tata Engineering and Locomotive Company Limited on September 24, 1960, and to Tata Motors Limited on July 29, 2003. Tata Motors Limited is incorporated and domiciled in India. We commenced operations as a steam locomotive manufacturer. This business was discontinued in 1971. Since 1954, we have been manufacturing automotive vehicles. The automotive vehicle business commenced with the manufacture of commercial vehicles under financial and technical collaboration with Daimler-Benz AG (now Daimler AG) of Germany. This agreement ended in 1969. We produced only commercial vehicles until 1991, when we started producing passenger vehicles as well. Together with our consolidated subsidiaries we form the Tata Motors Group. Please see Item 4.C “— Organizational Structure” for details
In June 2008, we acquired the Jaguar Land Rover business from Ford Motor Company. Jaguar Land Rover is a global automotive business, which designs, manufactures and sells Jaguar luxury sedans and sports cars and Land Rover premium all-terrain vehicles as well as related parts, accessories and merchandise. The Jaguar Land Rover business has internationally recognized brands, a product portfolio of award-winning luxury performance cars and premium all-terrain vehicles, brand-specific global distribution networks and research and development capabilities. As a part of our subsidiariesacquisition of the Jaguar Land Rover business, we acquired three major manufacturing facilities located in Halewood, Solihull and affiliates.Castle Bromwich and two advanced design and engineering facilities located at Whitley and Gaydon, all in the United Kingdom, together with national sales companies in several countries.
In September 2004, we became the first company from India’s engineeringautomotive sector to be listed on the New York Stock Exchange. Our ADSs are traded on the NYSE under the symbol “TTM”. Our Ordinary Shares and ‘A’ Ordinary Shares are traded on the BSE under the codes 500570 and 570001, respectively, and the National Stock Exchange of India Ltd., or NSE, under the symbols “TATAMOTORS” and “TATAMTRDVR”, respectively.
We offer a broad portfolio of automotive products, ranging from sub-1 ton to 49 ton GVW, trucks (including pickup trucks) to small, medium, and large buses and coaches to passenger cars, including the world’s most affordable car — car—the Tata Nano, premium luxury cars and SUVs. We are India’s leading automobile company and rank as the fifth largest truck manufacturer (6 ton plus) and fourth largest bus manufacturer in the world in each case, as measured by volume of vehicles produced in 2012.
We have a substantial presence in India and also have global operations in connection with production and sale of Jaguar and Land Rover premium brand passenger vehicles. We are the largest automobile manufacturer by revenue in India, the largest commercial vehicle manufacturer in terms of revenue in India and among the top foursix passenger vehicle manufacturers in terms of units sold in India during Fiscal 2013.2015. We estimate that around 7.5over 8 million vehicles produced by us are being operated in India as of the date hereof.of this annual report on Form 20-F.
We operate six principal automotive manufacturing facilities in India: at Jamshedpur in the state of Jharkhand, at Pune in the state of Maharashtra, at Lucknow in the state of Uttar Pradesh, at Pantnagar in the state of Uttarakhand, Sanand in the state of Gujarat and at Dharwad in the state of Karnataka. We also operate three principal automotive manufacturing facilities in the United Kingdom through our Jaguar Land Rover business: at Solihull in the West Midlands,and Castle Bromwich in the West Midlands and at Halewood in Liverpool. Jaguar Land Rover also recently opened its inaugural overseas manufacturing facility in China with its joint venture partner, Chery Automobile Company Ltd., with the Range Rover Evoque the first model built there. Our Jaguar Land Rover business also includes an engine manufacturing center at Wolverhampton in the West Midlands, where, in Fiscal 2015, it began to build the new family of Ingenium engines. Jaguar Land Rover also has two advanced design and engineering facilities located at Whitley in Coventry and at Gaydon in South Warwickshire.
We have expanded our international operations through mergers and acquisitions and in India we have made strategic alliances involving non-Indian companies:companies in recent years, including, but not limited to, the following:
In 2004, we acquired the Daewoo Commercial Vehicles Company (renamed as Tata Daewoo Commercial Vehicle Company Limited, or TDCV), which is South Korea’s second largest truck maker in terms of revenue. Together with TDCV we have developed our next generation trucks called the ‘Prima’ range of trucks (earlier referred to as the World Truck).
In Fiscal 2005, we acquired a 21% equity interest in Hispano Carrocera S.A. (renamed as Tata Hispano Motors Carrocera S.A.), or Hispano, a Spanish bus and coach manufacturer. During Fiscal 2010, we acquired the remaining 79% of the remaining equity interests in Hispano.
We have also been distributing and marketing Fiat branded cars in India since March 2006. We have a joint venture agreement with FCA Italy Spa (earlier called Fiat Group Automobiles S.p.A., Italy), or the Fiat Group. Together with FCA Italy or Fiat GroupSPA, we operate a facility located at Ranjangaon in Maharashtra to manufacture passenger cars, engines and transmissions for the Indian and overseas markets. Established in April 2008, the plant currently manufactures Fiat Linea, Fiat Punto, Tata Manza,Indica, Tata Indica Vista and Tata Indica VistaZest vehicles as well as components for such vehicles, such as engines and transmissions. During May 2012, both the joint-venture partners decided to re-align their Indian joint-venture.joint venture. Accordingly, in March 2013, we and Fiat Group have signed a Restructuring Framework Agreement,restructuring framework agreement, or RFA. As perUnder the revised agreement –RFA:
The joint venture shall manufacture and assemble Fiat products, Tata products and any new products (including for third parties) in accordance with the terms and conditions settled in the RFA. The current third party orders shall continue in accordance with current terms.
The distribution company, owned by Fiat Group, shall be responsible for distribution of the Fiat vehicles and parts from April 1, 2013. |
In May 2006, we entered into a joint venture agreement with Brazil-based Marcopolo S.A., or Marcopolo, to manufacture and assemble fully-built buses and coaches in India, wherein we have a 51% ownership, with the remainder held by Marcopolo. The joint venture, Tata Marcopolo Motors Limited, or Tata Marco Polo, commenced production during Fiscal 2009.
In December 2006, we entered into a joint venture agreement with Thonburi Automotive Assembly Plant Co. Ltd, Thailand, or the Thonburi Group, to manufacture pickup trucks in Thailand. As ofat March 31, 2013,2015, we own 90.82%95.28% of the joint venture, while the Thonburi Group owns the remaining 9.18%4.72%. The joint venture, which began vehicle production in March 2008, enabled us to access the Thailand market, which is a major market for pickup trucks, as well as other potential markets in thatthe ASEAN region.
For some of our products, we are also expanding our international export operations, which commenced in 1961. Our vehicles are being marketed in several countries in Europe, Africa, the Middle East, South East Asia and South Asia. During Fiscal 2008, Tata Motors (SA) Proprietary Ltd, or TMSA, a joint venture company in which we hold a 60% equity interest with the remaining 40% equity interest being held by Tata Africa Holdings (SA) (Pty.) Ltd, was formed for the manufacture and assembly operations of our LCVs and M&HCVs in South Africa. We have set up an assembly plant in South Africa at Rosslyn and commenced operations in July 2011.
In June 2008, we acquired the Jaguar Land Rover business from Ford Motor Company. Jaguar Land Rover is a global automotive business, which designs, manufactures and sells Jaguar luxury performance cars and Land Rover premium all-terrain vehicles. The Jaguar Land Rover business has internationally recognized brands, a product portfolio of award winning luxury performance cars and premium all-terrain vehicles, brand specific global distribution networks and research and development capabilities. We acquired three major manufacturing facilities located in Halewood, Solihull and Castle Bromwich and two advanced design and engineering facilities located at Whitley and Gaydon, all in the United Kingdom together with national sales companies in several countries.
In October 2010, we acquired an 80% equity interest in Trilix Srl., Turin (Italy),or Trilix, a design and engineering company, in line with our objective to enhance our styling/design capabilities to meet global standards. Trilix offers design and engineering services in the automotive sector, including styling, architecture, packaging, surfacing, macro-macro and micro-feasibility studies and detailed engineering development. Trilix continues to implement a strategic growth policy and in March 2013 moved to a new facility as part of its ongoing implementation of this growth policy. In the two years since making this move, Trilix’s sales and profits have increased by over 12% per year
Jaguar Land Rover is committed to its joint venture with Chery, which opened a factory in Changshu, China in October 2014 and recently began manufacturing the Range Rover Evoque. The total investment in the joint venture is expected to be approximately RMB 10.9 billion which is being contributed towards the establishment of the manufacturing plant, R&D center and engine production facility. Jaguar Land Rover is committed to invest RMB 3.5 billion of equity capital in the joint venture company, representing a 50% of the share capital and voting rights of the joint venture company.
In December 2011, PT Tata Motors Indonesia2013, Jaguar Land Rover signed an agreement to invest approximately GBP 240 million, in a production facility in Rio de Janeiro in Brazil with an annual production capacity of 24,000 units. The foundation stone of this manufacturing facility was established as our subsidiary, with the objective and purpose of conducting business activities of import, assembly and wholesale distribution of vehicles in Indonesia and to neighboring countries.
We produce a wide range of automotive products, including:
Passenger Cars. Our passenger cars range includes the Tata Nano, Indica, Tata Indica Vista in the hatch segment, sub-4m Tata Indigo eCS and mid sized Tata Indigo Manza in the sedan category. We have expanded our car lines with several variants and fuel options to suit various customer preferences. In October 2012, we refreshed the styling of the Tata Indica eV2, the most fuel efficient hatchback in its class, and also refreshed the Tata Indigo Manza with technological features such as a touch screen multimedia interface and a built-in GPS. In January 2013, we launched the Tata Vista D90 in the premium hatchback segment, powered by quadrajet diesel engine with Variable Geometry Turbocharger, or VGT technology. We launched the Tata Indigo Manza in South Africa in September 2012.
Jaguar has an established presence in the premium car segment. Jaguar currently produces three car lines, including the Jaguar XK sports car (coupe and convertible), the Jaguar XF sedan and the Jaguar XJ sedan. The 2013 Model Year Jaguar XF range includes for the first time an all-wheel drive version of the new V6 gasoline engine for the United States and European markets and a 2.0-liter gasoline version for the United States and Chinese markets. The 2013 Model Year for Jaguar XJ includes an all-wheel drive version and a 3.0-liter V6 gasoline version for the United States and European markets and a 2.0-liter gasoline version for the Chinese market, which benefits from lower custom duties in that market. In September 2012, the Jaguar F-TYPE was at the Paris Motorshow, a two-seat sports car that was inspired by the 2011 C-X16 concept car. The Jaguar F-TYPE has an all-aluminum structure and combines technological features such as all-aluminum double wishbone suspension and stop/start fuel economy measures with the power of Jaguar’s latest 3.0-liter V6 and 5.0-liter V8 engines. The Jaguar F-TYPE was made available to retail customers from April 2013 in select markets.
Utility Vehicles. We manufacture a number of UVs, including the Sumo, an SUV, Tata Safari, and recently launched Safari Storme, the lifestyle pickup, the Xenon XT, the newly launched premium crossover vehicle, the Tata Aria, and the multipurpose utility vehicle, or MPV, the Venture. The Safari, the Sumo and the Xenon XT meet different consumer preferences such as the Safari DICOR 2.2 VTT range, powered by a new 2.2 L Direct Injection Common Rail, or DICOR, engine, the Tata Safari Storme 2.2L VariCOR engine, the Sumo Grande, an SUV with the comforts of a family car, and the new Sumo Gold, which features a BS4 3.0L diesel CR4 engine, delivering 85 PS power which was launched in November 2011. Tata Aria is India’s first four-wheel drive crossover, a luxurious creation with the finesse of a sedan and the horsepower of an SUV blended in one car. We expanded the existing range of Aria with the launch of Tata Aria Pure LXlaid in December 2012 & the SUV range with the launch of Tata Safari Storme in October 2012.
Land Rover produces six car lines under the brands of Range Rover and Land Rover, and provides us with market share in the premium all-terrain vehicles segment. Range Rover is the premium range consisting of Range Rover, Range Rover Sport and Range Rover Evoque,2014 and the Land Rover brand comprisesDiscovery Sport was named as one of the Defender, Discovery 4 and Freelander 2 vehicles. The Freelander 2 was significantly enhanced forfirst vehicles to be manufactured at the 2013 Model Yearnew facility in Brazil with the introduction of a turbocharged 2.0-liter gasoline engine, offering superior performanceproduction expected to the 3.2-liter engine it replaces while also reducing CO2 emissions. At the 2013 New York International Auto Show,commence in 2016.
In July 2015, Jaguar Land Rover debuted the new 2014 Model Year Range Rover Sport built onagreed to a weight saving aluminum architecture. The Range Rover Sport’s new aluminum architecture achieves a weight savingmanufacturing partnership with Magna Steyr, an operating unit of upMagna International Inc, to 420kg, and when combined with a TDV6 engine, allows for improved agility and performance, with 15 per cent. CO2 reduction and 24 per cent. improved fuel economy. The new Range Rover Sport is the fastest, most agile and most responsivebuild certain future Jaguar Land Rover ever. The new aluminum Range Rover was launchedmodels in the third quarter of Fiscal 2013. A diesel hybrid Range Rover is currently being developed for introduction later in 2013. The new Range Rover was declared the world’s top SUV by The Sunday Times, won Top Gear magazine’s “Luxury Car of the Year” and was recently awarded the maximum 5-star safety rating by Euro NCAP.
Light Commercial Vehicles. We manufacture a variety of LCVs, including pickup trucks, trucks and buses with a GVW (including payload) of between 1.2 tons and 7.5 tons. This also includes the Tata Ace, India’s first indigenously developed mini-truck with a 0.75 ton payload with different fuel options, Super Ace with a 1-ton payload, Ace Zip with a 0.6 ton payload, the Magic and Magic Iris, both passenger variants for commercial transportation developed on the Tata Ace platform, and the Winger.
|
Medium and Heavy Commercial Vehicles We manufacture a variety of M&HCVs, which include trucks, tractors, buses, tippers, and multi-axled vehicles with GVW (including payload) of between 8 tons and 49 tons. In addition, through TDCV we manufacture a range of high horsepower trucks ranging from 215 horsepowerGraz, Austria to 560 horsepower, including dump trucks, tractor-trailers, mixers and cargo vehicles. During Fiscal 2010, we unveiled a new range of trucks, referred to as the ‘Tata Prima’ line, to our customers in India and South Korea, and have partially extended the offering by providing various products off the ‘Prima’ line. We also expect to gradually export these ‘Prima’ products to other countries such as South Africa, Russia, the other SAARC countries, Middle East and various countries in Africa. We showcased at the New Delhi Auto Expo 2012, the Tata LPT 3723, India’s first 5-axle rigid truck, the Tata Paradiso G7 Multi-axle Coach, jointly developed by Tata Motors and Tata Marcopolo Motors Limited, and the Tata Starbus Fuel Cell Concept (Hydrogen). In September 2012, Tata Motors Limited launched 6 first-of-its-kind heavy trucks and an intelligent vehicle and driver management solution – Tata FleetMan Telematics Services. The Tata Prima range has now been further extended with the launch of two new engine capacities of 380HP and 230HP. In the 380HP range, two new models have been launched – the Prima 4938 tractor and the Prima 3138K tipper. The new 230HP LX range has two new products – the Prima 4923 and the Prima 4023 tractors. The Tata Motors Construck range has been further supplemented with the launch of the versatile Tata LPK 3118 tipper. We also introduced a telematics and fleet management service, branded Tata FleetMan. Targeted at commercial vehicle fleet owners and large consigners of goods, the service offers advanced telematics solutions, which will help in increasing productivity and profitability. During Fiscal 2013, in the SIAM International Bus & Utility Vehicles Show, at Greater Noida, we showcased two new exciting applications from our line-up of buses for the MCV market for intercity transportation and staff transportation: including a 45-seater front-engine luxury air-conditioned intercity coach and a luxury non-airconditioned 41-seater staff bus. Other new vehicles on display included the luxurious Divo Coach, Semi Deluxe Starbus Ultra Contract Bus, the all new Starbus Ultra intended for use as school transportation and an ambulance based on the Tata Venture platform. The new MCV buses are fully built offerings catering to both airconditioned and non-airconditioned contract and intercity applications. The world-class body has been built to meet international standards by Tata Motors Marcopolo Limited, on tested Tata LPO 1618 and LPO 1512 chassis, which are reliable and provide strong performance. In January 2013, we introduced a warranty of 4 years, on our entire range of heavy trucks with 25 tons and higher GVW.
support Jaguar Land Rover’s growth plans. We believe that the foundationMagna Steyr has extensive contract manufacturing expertise working with many other car manufacturers globally.
Please see Item 4.B “—Business Overview—Our Strategy—Capital and Product Development Expenditures” and Item 5.B “Operating and Financial Review and Prospect—Liquidity and Capital Resources—Capital Expenditures” of this annual report on Form 20-F for details on our growth over the last five decades has been a deep understanding of economic conditions and customer needs, and the ability to translate this understanding into desirable products though research and development. Our Engineering Research Centre, or ERC, established in 1966, has enabled us to successfully design, develop and produce our own range of vehicles. As a consequence of the acquisition of Jaguar Land Rover, we now have state-of-the-art engineering and design facilities. We believe the ERC along with the capabilities of our Jaguar Land Rover business will enhance our product engineering capability and facilitate rapid introduction of new products. Furthermore, we have a wholly-owned subsidiary, Tata Motors European Technical Centre PLC, or TMETC, in the United Kingdom, which is engaged in automobile research and engineering.principal capital expenditures.
Through our other subsidiary and associate companies, we are engaged in providing engineering and automotive solutions, construction equipment manufacturing, automotive vehicle components manufacturing and supply chain activities, machine tools and factory automation solutions, high-precision tooling and plastic and electronic components for automotive and computer applications, and automotive retailing and service operations.
Tata Technologies Limited, or TTL, our 72.32% owned subsidiary, is engaged in providing specialized engineering and design services, product lifecycle management, or PLM, and product-centric IT services to leading global manufacturers. TTL’s customers are among the world’s premier automotive, aerospace and consumer durables manufacturers. TTL had eight14 subsidiary companies and one joint venture as at March 31, 2013. The consolidated revenue for TTL was Rs.20,324 million in Fiscal 2013 (including revenue from Tata Motors Group), growth of 24.8% from Rs.16,291 million in Fiscal 2012, as worldwide automotive and aerospace markets showed volume traction. TTL recorded profit after tax of Rs.3,008 million in Fiscal 2013, representing an increase of 42.8% over Rs.2,107 million in Fiscal 2012 contributed by higher offshore revenues and cost reduction measures that were implemented.2015.
TML Distribution Company Limited, or TDCL, our wholly-owned subsidiary, was incorporated on March 28, 2008. TDCL provides distribution and logistics support for distribution of our products throughout India. TDCL commenced its operations in Fiscal 2009.
Our wholly-owned subsidiary, Tata Motors Finance Limited, or TMFL, was incorporated on June 1, 2006, with the objective of becoming a preferred financing provider for our dealer’s customers by capturing customer spending over the vehicle life-cycle relating to vehicles sold by us. TMFL commenced operations on September 1, 2006. In India, TMFL is registered with the RBI as a Systemically Important Non-Deposit Taking Non-Banking Financial Company, or NBFC, and is classified as an Asset Finance Company under the RBI’s regulations on Non-Banking Financial Companies.NBFCs. In Fiscal 2015, TMFL has acquired 100% shareholding of Rajasthan Leasing Private Ltd, which subsequently changed its name to Tata Motors Finance Solutions Private Ltd, an NBFC registered with the RBI. On June 4, 2015, Tata Motors Finance Solutions Private Ltd was converted into a public limited company, named Tata Motors Finance Solutions Limited or TMFSL. TMFSL will focus on the used vehicle financing business.
Our wholly-owned subsidiary, Tata Motors Insurance Broking and Advisory Services Limited, undertakesor TMIBASL, is a licensed Direct General Insurance Broker with the Insurance Regulatory and Development Authority of India that operates in the Indian market and has plans to branch out globally to seek additional business of insurance and reinsurance broking, andopportunities. TMIBASL commenced business in Fiscal 2008.2008 and provides end-to-end insurance solutions in the retail sector with a focus on the automobile sector. TMIBASL offers services to various OEMs in the passenger vehicle, commercial and construction equipment markets, including to us.
As ofat March 31, 2013,2015, our operations included 6472 consolidated subsidiaries, 2 joint operations, 3 joint ventures and 2518 equity method affiliates, in respect of which we exercise significant influence.
As ofat March 31, 2013,2015, we had approximately 62,71673,485 permanent employees, including approximately 32,75145,488 permanent employees at our consolidated subsidiaries.subsidiaries and joint operations.
Tata Incorporated serves as our authorized United States representative. The address of Tata Incorporated is 3101 Park Avenue, 27th Floor, New York, NY 10016,10178, United States of America.
Our Registered Office is located at Bombay House, 24, Homi Mody Street, Mumbai 400 001, India. Our telephone number is +91-22-6665-8282 and our website address is www.tatamotors.com. Our website does not constitute a part of this annual report.report on Form 20-F.
We primarily operate in the automotive segment. Our automotive segment operations includeincludes all activities relating to the development, design, manufacture, assembly and sale of vehicles including financing thereof, as well as sale of related parts and accessories. The acquisition of the Jaguar Land Rover business has enabled us to enter the premium car market in developed markets such as the United Kingdom, the United States and Europe as well as in growingemerging markets, likeincluding China, Russia and Brazil, where we were not present earlier.Brazil. Going forward, we expect to focus on profitable growth opportunities in our global automotive business, through new products and market expansion. Within our automotive operations we continue to focus on integration and synergy through sharing of resources, platforms, facilities for product development and manufacturing, sourcing strategy and mutual sharing of best practices.
Our business segments are (i) automotive operations and (ii) all other operations. Our automotive operations include all activities relating to development, design, manufacture, assembly and sale of vehicles including financing thereof, as well as sale of related parts and accessories. We provide financing for vehicles sold by dealers in India. The vehicle financing is intended to drive saleencourage sales of vehicles by providing financing to the dealers’ customers and as such is an integral part of our automotive business. Our automotive operations segment is further divided into Tata and other brand vehicles (including spares and financing thereof) and Jaguar Land Rover. Tata and other brand vehicles consist of vehicles manufactured under our Tata, Daewoo and Fiat brands, and excludes vehicles manufactured by our Jaguar Land Rover operations.
We produce a wide range of automotive products, including:
Passenger Cars: Our range of Tata brand passenger cars include the Nano, a micro, the Indica, the Vista, the Zest and the Bolt, which are compacts and the Indigo eCS and the Manza, which are mid-sized, in the sedan category. We have expanded our passenger car range with several variants and fuel options designed to suit various customer preferences. Our Jaguar Land Rover operations have an established presence in the premium passenger car category under the Jaguar brand name. There are four car lines currently manufactured under the Jaguar brand name, including the F-TYPE two-seater sports car coupe and convertible (including all-wheel drive derivatives) the XF sedan (including the Sportbrake and all-wheel drive derivatives), the XJ saloon, and the new XE sports saloon, which commenced sales in May 2015.
Utility Vehicles: We manufacture a range of Tata brand utility vehicles, including the Sumo and the Safari, which are SUVs, the Xenon XT, a lifestyle pickup, the Tata Aria, a crossover, and the Venture, a multipurpose utility vehicle. We offer two variants of the Safari: the Dicor and the Storme. We also offer a variant of the Sumo, the Sumo Gold, and launched the new Movus in May 2014, which is an entry level UV. There are six car lines under the brands of Range Rover and Land Rover in the premium all-terrain vehicles categories: the Range Rover, Range Rover Sport, including the Range Rover Sport SVR, the Range Rover Evoque (available in 5-door and coupe versions), Land Rover Discovery, including the Discovery 4 which features 7-seat capacity, the Discovery Sport and the Defender, which will cease production in Fiscal 2016.
Light Commercial Vehicles: We manufacture a variety of light commercial vehicles, including pickup trucks and small commercial vehicles. This includes the Tata Ace, India’s first indigenously developed mini-truck, with a 0.75 ton payload with different fuel options, the Super Ace, with a 1-ton payload, the Ace Zip, with a 0.6 ton payload, including a CNG variant launched in Fiscal 2015, the Magic and the Magic Iris, including an electric variant, both of which are passenger variants for commercial transportation developed on the Tata Ace platform, and the Winger. In addition, we introduced a new generation of Ultra LCV trucks, including the Ultra narrow cab, in Fiscal 2015. We also offer the City Ride and Starbus ranges of buses.
Medium and Heavy Commercial Vehicles: We manufacture a variety of medium and heavy commercial vehicles, which include trucks, tractors, buses, tippers, and multi-axled vehicles, with GVWs (including payload) of between 8 tons and 49 tons. In addition, through Tata Daewoo Commercial Vehicles Co. Ltd., or TDCV, we manufacture a wide array of trucks ranging from 215 horsepower to 560 horsepower, including dump trucks, tractor-trailers, mixers and cargo vehicles. Our Prima line of trucks is aimed at its customers in India and South Korea, and we have extended the Prima line by offering Prima LX and multi-axle truck variants. We expect to gradually export our Prima products to other countries such as South Africa, Russia, the other South Asian Association for Regional Cooperation countries, the Middle East and various countries in Africa. We also offer a range of buses, which includes the Divo Coach, the Semi Deluxe Starbus Ultra Contract Bus and the new Starbus Ultra. Our range of buses is intended for a variety of uses, including as intercity coaches (with both air-conditioned and non-air-conditioned luxury variants), as school transportation and as ambulances.
Our other operations business segment includes information technology, or IT services and machine tools and factory automation solutions.
Our Strategy
We believe that we have established a strong position in the Indian automobile industry by launching new products, investing in research and development, strengthening our financial position and expanding our manufacturing and distribution network. We have pursued the strategy of increasing our presence in the global automotive markets and enhancing our product range and capability through strategic acquisitions/acquisitions and alliances. Our goal is to position ourselves as a major international automotive company by offering products across various markets by combining our engineering and other strengths as well as through strategic acquisitions. Our strategy to achieve these goals consists of the following elements:
LeveragingContinued focus on new product development
Our recent product launches and anticipated product launches include the following:
| • | Zest: In August 2014, we launched the Zest, a sub-four meter compact sedan. It is manufactured at the Pimpri and Ranjangaon plants in Pune, India. |
| • | Bolt: In January 2015, we announced the launch of a sporty hatchback, the all-new Bolt, which is manufactured at the Pimpri plant in Pune, India. |
| • | SuperAce Mint: The Tata Ace family of mini trucks offers last mile cargo transport solutions. With the launch of the SuperAce Mint in March 2015, we aim to penetrate further into the small pick-up market. |
| • | Xenon and Prima: In January 2015, we launched new-generation Xenon and Prima commercial vehicles in the Malaysian market, with our partner DRB-HICOM Commercial Vehicles. Furthermore, in Fiscal 2015, we launched the Prima in South Africa, Oman, Dubai and the South Asian Association for Regional Cooperation, or SAARC, countries as well. We extended the Prima LX range of trucks with new variants of multi-axled trucks. |
| • | Buses:We have developed new bus models for the Jawaharlal Nehru National Urban Renewal Mission – II scheme in India in the standard, mini and mid categories |
| • | Ultra: In Fiscal 2015, we launched the Ultra range of trucks in light commercial vehicle and intermediate commercial vehicles categories, which offers superior technology and design that we believe ensures the lowest total cost of ownership through higher uptime because of increased driver comfort, superior aggregates and customized requirements. |
| • | Land Rover Discovery Sport: In September 2014, Jaguar Land Rover revealed to the market the new Discovery Sport, a versatile premium compact sport utility vehicle that is the first member of the new Discovery family. Sales of the new Land Rover Discovery Sport have been underway since early 2015. Starting in Fiscal 2016, the Discovery Sport will feature Jaguar Land Rover’s Ingenium engines. |
| • | Range Rover Evoque: In February 2015, Jaguar Land Rover began sales of the locally-manufactured Evoque through its joint venture with Chery in China. The 2016 Range Rover Evoque made its world debut at the Geneva Motor Show in March 2015 and is the first model from Jaguar Land Rover to feature full-LED adaptive headlamp technology. The 2016 model year Evoque will feature the new 2.0 liter Ingenium diesel engine which will go on sale later this year. |
| • | Range Rover Evoque Convertible: The Range Rover Evoque Convertible, which features a refreshed exterior and the new 2.0 liter Ingenium diesel engine, is expected to go on sale in Fiscal 2016. |
| • | Jaguar XE: The Jaguar XE made its global debut at the 2014 Paris Auto Show and went on sale in May 2015. The XE is being manufactured at a new purpose-built production facility at our Solihull plant in the UK, and it is the first aluminum monocoque vehicle in the midsize vehicle category. The Jaguar XE will feature Jaguar Land Rover’s new Ingenium engines. |
| • | Jaguar XF: The 2016 Jaguar XF made its official world debut at the 2015 New York International Auto Show on April 1, 2015. As with other new Jaguar models, the XF features strengthened, lightweight aluminum-intensive construction. It is anticipated to go on sale during Fiscal 2016. The XFR-S was introduced at the 2014 model year and was Jaguar Land Rover’s fastest ever sports saloon, powered by a 5.0-liter supercharged V8 engine. The XFR-S Sportbrake and the XFR-Sport joined the fleet at the 2015 model year. |
| • | Jaguar F-PACE: The Jaguar F-PACE performance crossover is based on the C-X17 Concept Vehicle, which was revealed to the market at the Frankfurt Motor Show in 2013. It is intended to be an ultimate practical sports car and to offer a combination of Jaguar sports car-inspired exterior design and a practical and spacious luxury interior. The F-PACE will utilize the same aluminum-intensive architecture as the Jaguar XE. |
| • | Range Rover Sport SVR: The Range Rover Sport SVR, which debuted in the United States in August 2015, is the first Land Rover produced from the high performance special operations division and is also the fastest Land Rover ever powered by the 5.0 liter V8 petrol engine, reaching 0-60 mph in just 4.5 seconds and a top speed of 162 mph. |
Our research and development focuses on developing and acquiring the technology, core competences and skill sets required for the timely delivery of our capabilities: We offer an extensiveenvisaged future product portfolio with industry-leading features across our range of commercial vehicles (for both goods and passenger transport)vehicles. For the passenger vehicle product range, our focus is on stunning design, driving pleasure and connected car technologies. For the commercial vehicle product range, our focus is on enhancing fuel-efficiency and minimizing the total cost of ownership. We continue to endeavor to adopt technologies for our product range to meet the requirements of a globally competitive market. We have also undertaken programs for development of vehicles which run on alternate fuels such as well as passenger vehicles. LPG, CNG, bio-diesel, electric-traction and hydrogen.
We have plans to expand the range of our product base further withsupported by our strong brand recognition in India, our understanding of local consumer preferences, well developed in-house engineering capabilities and extensive distribution network. With growing competition, changing technologies and evolving customer expectations, we understand the importance of bringing new platforms to address market gaps and further enhance our existing range of vehicles to ensure customer satisfaction. Our capital expenditures totaled Rs.335,771 million, Rs.272,832 million and Rs.212,078 million during Fiscal 2015, 2014 and 2013, respectively and we currently plan to invest approximately Rs.338 billion in Fiscal 2016 in new products and technologies.
Jaguar Land Rover has aimed to enhance its technological strengths through in-house R&D activities, including the development of its engineering and design centers which centralize Jaguar Land Rover’s capabilities in product design and engineering. Furthermore, Jaguar Land Rover participates in advanced research consortia that bring together leading manufacturers, suppliers or academic specialists in the United Kingdom and are supported by funding from the UK Government’s Technology Strategy Board.
Leveraging our capabilities
We believe that the foundation of our growth over the last five decades has been a deep understanding of economic conditions and customer needs, and the ability to translate this understanding into desirable products though research and development. In India, our Engineering Research Centre, or ERC, established in 1966, has enabled us to successfully design, develop and produce our own range of vehicles. Jaguar Land Rover’s research and development operations are built around engineering facilities that feature an extensive test track, testing centers, design hubs and a recently inaugurated virtual innovation center. The ERC in India and Jaguar Land Rover engineering and development operations in the United Kingdom have identified areas to leverage the facilities and resources to enhance the product development process and achieve economies of scale. Furthermore, we have a wholly-owned subsidiary, Tata Motors European Technical Centre PLC, or TMETC, in the United Kingdom, which is engaged in automobile research and engineering.
We believe that our in-house research and development capabilities, including thatthose of our subsidiaries Jaguar Land Rover TDCV and Hispano,Trilix in Italy, TMETC in the United Kingdom and our joint-venturesjoint ventures with Marcopolo S.A. of Brazil in India, with Thonburi in Thailand and Tata Africa Holdings (SA) (Pty.), Ltd(Proprietary) Ltd. in South Africa, Trilix Srl., Turin (Italy), and TMETC in the United Kingdom and our relationship with Fiat, will enable us to expand our product range and extend our geographical reach.
The launches of Tata Divo Luxury Coach We continually strive to achieve synergy wherever possible with our subsidiaries and Tata Starbus Ultra in Fiscal 2012 using body designs from Hispano and Tata Marcopolo demonstrate continued leveraging of our capabilities. In Fiscal 2012, we showcased at the New Delhi Auto Expo 2012: (i) the Tata Ultra, a new LCV and ICV range platform, allowing flexibility of multiple wheel bases and multiple payload points, (ii) the Tata LPT 3723, India’s first 5-axle rigid truck (launched in September 2012) and the Tata Paradiso G7 multi-axle coach, jointly developed by Tata Motors and Marcopolo and (iii) our alternate fuel technology capability through the following concept vehicles - the Tata Starbus Fuel Cell (hydrogen) and the Tata Magic Iris CNG. Our portfolio already includes CNG-electric hybrid buses. During Fiscal 2013, in the SIAM International Bus & Utility Vehicles Show, at Greater Noida, we showcased two new exciting applications from our line-up of buses for the MCV market for intercity transportation and staff transportation: including a 45-seater front-engine luxury air-conditioned intercity coach and a luxury non-airconditioned 41-seater staff bus. Other new vehicles on display included the luxurious Divo Coach, Semi Deluxe Starbus Ultra Contract Bus, the all new Starbus Ultra intended for use as school transportation and an ambulance based on the Tata Venture platform. The new MCV buses are fully built offerings catering to both air conditioned and non-air conditioned contract and intercity applications. The body has been built to meet international standards by Tata Motors Marcopolo Limited, on tested Tata LPO 1618 and LPO 1512 chassis, which are reliable and provide strong performance.
In September 2012, we launched six first-of-its-kind heavy trucks. The Tata Prima range has now been further extended with the launch of two new engine capacities of 380HP and 230HP. In the 380HP range, two new models have been launched – the Prima 4938 tractor and the Prima 3138K tipper. The new 230HP LX range has two new products – the Prima 4923 and the Prima 4023 tractors. The Tata Motors Construck range has been further supplemented with the launch of the versatile Tata LPK 3118 tipper. We also introduced an intelligent vehicle and driver management telematics solution, branded Tata FleetMan. Targeted at commercial vehicle fleet owners and large consigners of goods, the service offers advanced telematics solutions, which will help in increasing productivity and profitability. In January 2013, we introduced a warranty of four years on our entire range of heavy trucks with GVW of 25 tons or higher.
Our product portfolio of Tata brand vehicles includes the Nano, Indica, Indica Vista, Indigo, Indigo Manza, Sumo, Sumo Grande, Safari, Safari Storme, Aria and Venture, enables us to compete in various market segments. As discussed above, the Company also showcased its alternate fuel technology capability at the New Delhi Auto Expo 2012 by displaying the Tata Nano CNG and the Tata Indigo Manza diesel-electric hybrid concept vehicles. In 2012, we developed the Tata Indica Vista electric vehicle, a fully electric car, in conjunction with the technology from TMETC.joint ventures.
We have continued modernizing our facilities to meet increasing demand for our vehicles. Our Jamshedpur plant, which manufactures our entire range of M&HCVs, including the Tata Prima, both for civilian and defense applications, was our first plant, set up in 1945 to manufacture steam locomotives. It led the Company’s forayour entry into commercial vehicles in 1954. The Jamshedpur plant has been modernized throughthroughout the decades with a particularly intense scaleand in Fiscal 2015, we celebrated 60 years of truck manufacturing at our first manufacturing and engineering facility in Jamshedpur.
Jaguar Land Rover aims to invest substantially to develop new products in new and existing segments by introducing new powertrains and technologies that satisfy both customer preferences and regulatory requirements. Complementing this, Jaguar Land Rover invests in manufacturing capacity in the lastUnited Kingdom and internationally to meet customer demand. In line with other premium automotive manufacturers Jaguar Land Rover aims to maintain an allocation of 10 years. to 12% of revenue on capital expenditure. However, in Fiscal 2016, we anticipate that Jaguar Land Rover will make higher capital spending in order to take advantage of growth opportunities. For Fiscal 2016, capital expenditure at Jaguar Land Rover is expected to be approximately GBP 3.6 billion to GBP 3.8 billion (approximately Rs.332.8 billion to Rs.351.3 billion), allocated approximately 40% for R&D and 60% for expenditure on tangible fixed assets such as facilities, tools and equipment as well as investment in our China joint venture.
In Fiscal 2013, the Jamshedpur plant producedOctober 2014, Jaguar Land Rover opened its two millionth truck. In June 2012, our plantEngine Manufacturing Centre at Dharwad became operational, producing the Tata ACE Zip and the Tata Magic IRIS, a move integral to maintaining market shareWolverhampton, in the commercial vehicles market, particularlyWest Midlands. The plant currently manufactures the 2.0-liter Ingenium diesel engine first introduced into the Jaguar XE and it is expected to produce a 2.0-liter petrol Ingenium engine. We believe that the Wolverhampton facility is ideally located between Jaguar Land Rover’s three principal UK manufacturing sites at Halewood, Castle Bromwich and Solihull. The total investment in the growing LCV market.Engine Manufacturing Centre was approximately GBP 500 million and we expect that the plant will eventually employ almost 1,400 people.
Continuing focus on high quality and enhancing customer satisfaction:satisfaction
One of our principal goals is to achieve international quality standards for our products and services. We have established a procedure for ensuring quality control of outsourced components. Products purchased from approved sources undergo a supplier quality improvement process. We also have a program for assisting vendors from whom we purchase raw materials or components to maintain quality. Each vendor is reviewed on a quarterly basis on parameters of quality, cost and delivery and preference is given to vendors with TS 16949 certification. We are pursuing various quality improvement programs, both internally and at our suppliers’ operations, in an effort to enhance customer satisfaction and reduce our future warranty costs.
We have also established a procedure for ensuringcomprehensive purchasing and quality control of outsourced components,system that is designed to consistently deliver quality products and products purchased from approved sources undergo a supplier quality improvement process. Reliability and other quality targets are built into our new product introduction process. Assurance of quality is further driven by the design team, which interacts with downstream functions like process-planning, manufacturing and supplier management to ensure quality in design processes and manufacturing.services. Through close coordination supported by our IT systems, we monitor quality performance in the field and implement corrections on an ongoing basis to improve the performance of our products thereby improving customer satisfaction. In India, we improved our Customer Service Index, or CSI, score to 796 in 2012 from 779 in 2011. We improved in ranking to 6th in the 2012 J.D. Power India Customer Service Index survey from 7th in 2011. We continue to focus on high quality customer satisfaction. We believe our extensive sales and service network has also enabled us to provide quality and timely customer service. We are drivingencouraging focused initiatives at both sales and service touch points to enhance customer experience and thrivestrive to be best in class.class, and we believe that the reach of our sales, service and maintenance network provides us with a significant advantage over our competitors. In India, we improved our J.D. Power Asia Pacific 2014 India Customer Service Index (CSI) Study score to 834 in 2014 from 799 in 2013, and are the second-most improved company with an increase of 35 points. Overall, we moved up from the sixth ranking last year to the fourth ranking in that survey. Additionally, we won several awards at the Apollo CV awards in January 2015, with the Ultra 812 winning Commercial Vehicle of the Year & LCV Carrier of the Year and our Prima LX 2523.T winning MCV Cargo Carrier of the Year.
Jaguar and Land Rover collectively received over 110220 awards from leading international motoring writers, magazines and commentators in 2012,opinion leaders between 2014 and early 2015, reflecting the strength of itsour model line-up and our design capabilities and distinctive model line-up.engineering capabilities. The Jaguar XF is Jaguar’s best-selling model across the world by volumefollowing table sets out certain of these awards received in 2014 and has received more than 100 international awards since its launch, including being named “Best Executive Car” by What Car? Magazine for four consecutive years. The Jaguar XJ has received more than 20 international awards since its launch, including “Best Luxury Car” from China’s Auto News in 2010, “Annual Limousine King” from Quattroroute (Italy), “Luxury Car of the Year” from Top Gear (UK), Automobile Magazine’s “2011 Design of the Year” and “Best Executive Sedan” at the Bloomberg Awards in the United States.early 2015.
Award | Model/Entity | Awarding Institution | Date | |||
| Best Luxury SUV | Range Rover | What Car? | January 2015 | |||
| Best Car of the Year | Range Rover Sport | Car | January 2015 | |||
| Small SUV | Range Rover Evoque | What Car? Car of the Year Awards | January 2015 | |||
| Safety Award | Land Rover Discovery Sport | What Car? | January 2015 | |||
| First in Middle Class Segment | Jaguar XE | Best Cars 2015 Award | January 2015 | |||
| Best Coupe | Jaguar F-TYPE | Auto Express New Car Awards | July 2014 | |||
| Cabriolet of the Year | Jaguar F-TYPE | BBC Top Gear Awards | February 2014 | |||
| Executive Car of the Year | Jaguar XF | Business Car Awards | January 2014 | |||
| Best Imported Car of the Year | Jaguar XJ | dayoo.com | November 2014 | |||
| Queen’s Award for Enterprise in International Trade | Jaguar Land Rover | Her Royal Highness the Queen | June 2014 | |||
| Best Car Styling Luxury Brand | Jaguar | Kelley Blue Book | April 2014 | |||
| Automotive Performance, Execution and Layout | Land Rover | J.D. Power and Associates | September 2014 |
Products and environmental performance:Environmental performance
Our strategy is to invest in products and technologies that position our products ahead of expected stricter environmental regulations and ensure that we benefit from a shift in consumer awareness of the environmental impact of the vehicles theyconsumers drive. The Company is committed to continued investment in new technologies, including developing sustainable technologies to improve fuel economy and reduce CO2 emissions. We are also committed to investing in automotive research and development in the United Kingdom. We believe that we are the leader in development of automotive green-technology in the United Kingdom. Our environmental vehicle strategy focuses on new propulsion technology, weight reduction and reducing parasitic losses through the driveline. For example,We have developed diesel hybrid versions of the Jaguar Range-e plug-in hybrid demonstration vehicle achieved 89g CO2/km and won the 2011 Society of Moto Manufacturers and Traders Award For Automotive Innovation. The Jaguar C-X75 hybrid supercar was developed in partnership with Williams Advanced Engineering. Its 1.6-litre engine generates an 502bhp and is matched with 390bhp electric motors that give the Jaguar C-X75 a 220mph top speed but also an all-electric range of 60 kilometers and emissions below 89g/km. In addition to these vehicle level projects, Jaguar Land Rover has a number of collaborative research and development projects in systems such as electric motors, power electronics and energy storage. Jaguar Land Rover is also the lead OEM partner in the UK Energy Storage Centre, developing capability in next generation battery technology and alternative mobile energy storage.
Our Jaguar Land Rover business has started to introduce a new premium lightweight architecture for its products, initially launched on the new Range Rover and Range Rover Sport 2. This architecture includeswithout compromising the vehicles’ off-road capability or load space. We believe we are a hostglobal leader in the use of environmentally-friendly technologies including new aluminum alloys, down-sized power trains, sustainableand other lightweight materials bestto reduce vehicle weight and improve fuel and CO2 navigation routes, electronic power steering, aerodynamic featuresefficiency, and we believe we are ahead of many more technologies. These technologies enableof our competitors in the deliveryimplementation of luxurious and high-performance products combined with low CO2 and laid the foundations for efficient hybridization of the platform. Jaguar Land Rover’s initial full-hybrid program is also in advanced stages. Our Jaguar Land Rover business already offers five aluminum vehicles, the Jaguar XJ, Jaguar XK, new Jaguar F-TYPE, the new Range Rover and the new Range Rover Sport and plansconstruction. We plan to continue to deploy its core competency inbuild on this expertise and extend the application of aluminum construction across more modelsas we develop a range of new Jaguar products, including the new Jaguar XE and the recently announced Jaguar performance crossover, the F-PACE. Recognizing the need to use resources responsibly, produce less waste and reduce our carbon footprint, we are also taking measures to reduce emissions, waste and the use of natural resources in its range.all of our operations. We are also developing more efficient vehiclepowertrains and other technologies. This includes smaller and more efficient diesel and petrol engines, stop-start and hybrid engines, starting with a state-of-the-art high-efficiency diesel hybrid engine now on offer in the Range Rover and Range Rover Sport and the introduction of our own Ingenium four cylinder (2.0-liter) engines from 2015, which will first be installed in the new Jaguar XE.
Our current product line-up is the most fuel-efficientefficient it has ever been. The most efficient version of the Range Rover Evoque emits less than 130 g/km of CO2. The all-aluminum Jaguar XJ 3.0 V6 twin-turbo diesel has CO2 emissions rated atof 159 g/km. The most efficient version of the Range Rover Evoque emits less than 130 g/km. The new 3.0-liter TDV6 Range Rover offers similar performance to the previous 4.4-liter TDV8 Range Rover while fuel consumption and CO2 emissions have been reduced to(now 196 g/km from (TDV6 figure) from 253 g/km (TDV8)km). The new “downsized” 2.0-liter turbocharged gasolinepetrol engine options in the Range Rover Evoque the 2013 Model Year Freelander 2, and the Jaguar XF and Jaguar XJ also offer improved fuel efficiency. Equipped with stop-start and an eight-speed automatic transmission, the XF 2.2-liter diesel was further improved for 2014 Model Year with CO2 emissions cut to 129 g/km. In addition, we launched our first hybrid electric vehicles in the caseRange Rover and Range Rover Sport 3.0L TDV6 Hybrid with emissions of 169 g/km. The new Jaguar XE will be the latest Freelander Si4,most fuel-efficient Jaguar yet with expected fuel consumption and CO2 emissions have been reduced overon the outgoing 3.2-liter Freelander Si6. EquippedNEDC combined cycle of 76 mpg and 99g/km, respectively. The new Discovery Sport will be launched with a range of four-cylinder turbocharged petrol and diesel engines. The all-alloy Si4 2.0-liter petrol engine, a 2.2-liter turbo diesel engine featuring stop-start technology and an 8-speed automatic transmission, the Jaguar XF 2.2-litera highly efficient ED4 turbo diesel already the most fuel efficient Jaguar vehicle ever, was further improved for the 2013 Model Yearengine with expected CO2 emissions rate at 135 g/km.of just 119g/km will also join the range later in 2015.
In Fiscal 2011, some of the plug-in hybrid projects of Jaguar Land Rover were completed and have provided the technical foundation for a production development program for plug-in hybrid vehicles on a parallel basis along with traditional gasoline vehicles. In addition, Jaguar Land Rover has made significant progress on a number of ongoing collaborative research and development programs investigating a wide range of CO2 reduction technologies. These include radical combustion engine downsizing/pressure charging, alternative power sources for hybrids, flywheel kinetic energy recovery systems and other waste energy recovery systems.
Our Jaguar Land Rover business isWe are also taking measures to reduce emissions, waste and the use of natural resources from all of itsour operations. Jaguar Land Rover recognizesWe recognize the need to use resources responsibly, produce less waste and reduce itsour carbon footprint. AgainstWe have reduced our Environmental Innovation, or Ei strategy baseline year ofenergy use per vehicle by nearly 30% from 2007 a 21% reduction in operational CO2 has been achieved despite significant project work to expand our facilities. Water use was reduced by 12.7% per unit and waste to landfill was reduced by 75% per unit versus the 2007 baseline. Jaguar Land Rover haslevels. We have implemented life cycle techniques so that we can evaluate and reduce our environmental footprint throughout the value chain. Jaguar Land Rover hasWe have been certified to the international environmental management standard, ISO14001,ISO 14001, since 1998. As part of itsour integrated CO2 management strategy, Jaguar Land Rover haswe have one of the largest voluntary CO2 offset programs and has provided customer programs to enable its customers toprograms. Through CO2 offset the emissions from vehicle use.schemes, we offset all our own UK manufacturing assembly CO2 emissions.
Mitigating cyclicality:cyclicality
The automobile industry is impacted by cyclicality. To mitigate the impact of cyclicality, we plan to continually strengthen our operations through gaining market share across different segments, and offering a wide range of products in diverse geographies. We also plan to continue to strengthen our business operations other than vehicle sales, such as financing of our vehicles, spare part sales, service and maintenance contracts, sales of aggregates for non-vehicle businesses, reconditioning of aggregates and sale of castings, production aids and tooling / tooling/fixtures in order to reduce the impact of cyclicality of the automotive industry.
Expanding our international business:business
Our international expansion strategy involves strategic acquisitions and introducing our product range into select geographies,entering new markets where we have an opportunity to grow and introducing new products to existing markets in markets with similar characteristicsorder to the Indian market.grow our presence in such markets. Our international business strategy has already resulted in the growth of our international operations in select markets and chosen segments over the last 5five years. For example,Based on our internal assessments, in recent years, we were the largest competitor in the LCV bus market for the seven meter category and the second largest competitor in the LCV Truck market in the 7.5 ton category, in terms of unit sales in Ukraine in Fiscal 2013. We have also further consolidatedgrown our market share across various African and Middle East markets such as Kenya, Nigeria, Tanzania, Saudi Arabia, UAE and Qatar in most segmentsaddition to maintaining our dominant market position in the South Asian markets of commercial vehicles in some SAARC countries like Bangladesh, Nepal and Sri Lanka.Lanka based on data compiled by our country managers. In keeping with our strategy to enter and grow in new regions, we have focused on business in the ASEAN countries, where in the past 18 months we entered Indonesia, Malaysia, and the Philippines, and also in Australia.
We have also expanded our range through acquisitions and joint ventures. Our acquisition of Jaguar Land Rover has expanded our geographical presence significantly. Through Jaguar Land Rover we now offer products in the luxurypremium performance car and premium all-terrain vehicle segmentscategories with globally recognized brands and we have diversified our business across markets and product segments.categories. We will continueintend to build upon the internationally recognized brands of Jaguar Land Rover. TDCV continues to be the largest exporter of heavy commercial vehicles from South Korea. We have established aOur joint venture along with the Thonburi Group, Tata Motors (Thailand) Limited, is also focusing on increasing its geographical reach by introducing Thailand manufactured pickup trucks in Thailand to manufactureother Asian markets. Thailand-produced pickup trucks.trucks were introduced in Malaysia in beginning of 2015. During Fiscal 2008, we established a joint venture company to undertake manufacture and assembly operations in South Africa, which has been one of our largest export markets from India in terms of unit volume. The joint venture company, Tata Motors (SA) Proprietary(Proprietary) Limited, commenced operations in July 2011. Currently, Tata Motors (SA) (Proprietary) Limited, caters to the domestic South African market and, in Fiscal 2015 sold 839 chassis.
Reducing operating costs:
We believe that our scale of operations provides us with a significant advantage in reducing costs and we plan to continue to sustain and enhance this cost advantage.
Our ability to leverage our technological capabilities and our manufacturing facilities among our commercial vehicle and passenger vehicle businesses enables us to reduce cost. For example, the diesel engine used in our Indica was modified to engineer a new variant for use in the Ace platform, which helped to reduce the project cost. Similarly, platform sharing for the manufacture of pickup trucks and UVs enables us to reduce capital investment that would otherwise be required, while allowing us to improve the utilization levels at our manufacturing facilities. Where it is advantageous for us to do so, we intend to add our existing low costlow-cost engineering and sourcing capability to vehicles manufactured under the Jaguar and Land Rover brands.vehicles.
Our vendor relationships also contribute to our cost reductions. For example, we believe that the vendor rationalization program that we are undertaking will provide economies of scale to our vendors which would benefit our cost programs. We are also undertaking various internal and external benchmarking exercises that would enable us to improve the cost effectiveness of our components, systems and sub-systems.
We have intensified efforts to review and realign our cost structure through a number of measures such as reduction of manpower costs and rationalization of other fixed costs. Our Jaguar Land Rover business has undertaken severalcontinues to focus on cost control and cost reductionmanagement initiatives such as increased sourcing of materials from low cost countries, reduction in number ofstreamlining its purchasing processes and building on its strong relationships with suppliers rationalization of marketing setup, reduction of manpower costs through increasedwhile increasing employee deployment and flexibility between sites and several other initiatives. Further,across its sites. In addition, our Jaguar Land Rover business is exploring opportunities through reductioncontinues to increase its use of its new modular aluminum architecture across vehicle platforms, which we expect will result in number of platforms,common technology use across products lines and a reduction in engineering costs, increased use of off-shoring and several other initiatives.complexity.
Enhancing capabilities through the adoption of superior processes:processes
Tata Sons and the entities promoted by Tata Sons, including us, aim at improving quality of life through leadership in various sectors of national economic significance. In pursuit of this goal, Tata Sons and the Tata Sons promotedSons-promoted entities have institutionalized an approach, called the Tata Business Excellence Model, or TBEM, which has been formulated along the lines of the Malcolm Baldridge National Quality Award to enable us to improve performance and attain higher levels of efficiency in our businesses and in discharging our social responsibility. The model aims to nurture core values and concepts embodied in various focus areas such as leadership, strategic planning, customers, markets and human resources, and to translate them to operational performance. Our adoption and implementation of this model seeks to ensure that our business is conducted through superior processes.
We have deployed a balance score card or BSC, management system developed by Dr. Robert Kaplan and Dr. David Norton of the Harvard Business School for measurement basedmeasurement-based management and feedback. We have also deployed a new product introduction or NPI, process for systematic product development and a PLM system for effective product data management across our organization. On the human resources front, weWe have adopted various processes to enhance the skills and competencies of our employees. We have also enhanced our performance management system, with appropriate mechanisms to recognize talent and sustain our leadership base. We believe these will enhance our way of doing business, given the dynamic and demanding global business environment.
Customer financing:Expanding customer financing activities
With financing increasingly being a critical factor in vehicle purchases and in light of the rising aspirations of consumers in India, we intend to expand our vehicle financing activities to enhance our vehicle sales. Further, in a scenario where there is a lack of sufficient finance availability for vehicle sales in the Indian market, as was witnessed during the financial crisis, our finance business is expected to play a significant role in filling the gap created when financing from other banks and non banking financial companies dries up. In addition to improving ourits competitiveness in customer attraction and retention, we believe that expansion of ourits financing business would also contribute towards moderating the impact on our financial results from the cyclical nature of vehicle sales. To spur growth in the small commercial vehicles category, we have teamed up with various public sector and cooperative banks and Grameen banks to introduce new finance schemes. TMFL has increased its reach by opening a number of limited services branches in tier 2 and 3 towns. This has reduced turn-around times and, we believe, improved customer satisfaction. TMFL’s channel finance initiative and fee-based insurance support business have also helped improve profitability.
Continuing to invest in technology and technical skills:skills
We believe we are one of the most technologically advanced indigenous vehicle manufacturers in India. Over the years, we have enhanced our technological strengths through extensive in-house research and development activities. Further, our research and development facilities at our subsidiaries, likesuch as TMETC, TDCV, TTL, and Trilix, together with the two advanced engineering and design centers of Jaguar Land Rover, have increased our capabilities in product design and engineering. In our Jaguar Land Rover business, we are committed to continue to invest in new technologies to develop products that meet the opportunities of the premium segment,market, including developing sustainable technologies to improve fuel economy and reduce CO2 emissions. We consider technological leadership to be a significant factor in continued success, and therefore intend to continue to devote significant resources to upgrade our technological base.
Maintaining financial strength:strength
Our cash flow from operating activities in Fiscal 20132015 and 20122014 was Rs.222,933Rs.365,401 million and Rs.218,227Rs.371,432 million, respectively. The improved position in ourOur operating cash flows isare primarily due to an increase in volumes at our Jaguar Land Rover business, implementation of cost reduction programs, and prudent working capital management. We have established processes for project evaluation and capital investment decisions with an objective to enhance our long termlong-term profitability.
Leveraging brand equity:equity
We believe customers associate the Tata name with reliability, trust and ethical value, and that our brand name is gaining significant international recognition due to the international growth strategies of various Tata companies. The Tata brand is used and its benefits are leveraged by Tata companies to their mutual advantage. We recognize the need for enhancing our brand recognition in highly competitive markets in which we compete with internationally recognized brands. We, along with Tata Sons and other Tata companies, will continue to promote the Tata brand and leverage its use in India, as well as in various international markets where we plan to increase our presence. Supported by the corporate level “Tata”Tata brand, we believe our product brands likesuch as the Indica, Indigo, Sumo, Safari, Aria, Venture, Nano, Prima, Ace, Magic along withand Prima, Daewoo, Jaguar, Range Rover and Land Rover are highly regarded, which we intend to continue to nurture and will be nurtured and promoted.promote. At the same time, we will continue to build new brands such as the newly launched Ultra range of LCVs, the Zest and the Bolt to further enhance our brand equity.
Our commercial vehicle initiative, Project Neev, provides a growth program for rural India designed to promote self-employment. Local, unemployed rural youth have been enrolled and trained to work from homes as promoters of our commercial vehicles. Project Neev is currently operational in twelve states of India and has engagement in 365 districts and 2,981 sub-districts, which covers more than 427,000 villages. The rural penetration drive initiated through Project Neev has deployed an approximately 5,000 member dedicated team and 600 dedicated rural outlets in towns and villages with populations of less than 50,000. More than 71,144 small commercial vehicles have been sold since the commencement of this program, to which we attribute a 20% increase in volumes of small commercial vehicle sales. Project Neev currently completed its fourth wave of expansion, and we anticipate that it will operate in all major states across the country within the next couple of years. This program has been appreciated and recognized in various forums such as Rural Marketing Association of India Flame Awards for excellence in the field of rural marketing.
In Fiscal 2015, we launched “Truck World: Advanced Trucking Expo”, an exposition which showcases our offering of medium and heavy commercial vehicles, alongside our own service-related brands such as Tata Genuine Parts, Tata Delight and Tata FleetMan.
Another initiative through our commercial vehicles business is TATA-OK. TATA-OK seeks to promote our commercial vehicles by capturing new customer segments (such as economical and used vehicle buyers), promoting the sale of new vehicles through the exchange of used commercial vehicles at our dealerships, increasing the resale value of its commercial vehicles products, and facilitating deeper customer engagement and thereby promoting brand loyalty. TATA-OK has completed four years of operation, including a pilot year, with retailed over 10,600 transactions in Fiscal 2015 through over 220 retailers.
We offer a variety of support products and services for its customers. Tata FleetMan, our telematics and fleet management service, is designed to enable the commercial sector to boost productivity and profitability. With the goal of bringing the most advanced technology in this area to its customers, we have entered into a partnership with UK-based Microlise Limited to introduce global standards of telematics and fleet management solutions into the Indian logistics and transport industry, to enhance Tata FleetMan’s telematics systems through upgrades of the underlying technology and to develop the next generation of fleet telematics solutions for the Indian transport industry.
In Fiscal 2014, we expanded the Tata Alert service across all national highways. Tata Alert provides breakdown assistance by promising to respond to the breakdown site within four hours of notification and to return the vehicle to the road within 48 hours. This was coupled with the introduction of new services such as the Tata On-site service and parts support through the use of container workshops. These workshops are an onsite service support system that deploy a container on site which houses the repair equipment while the repairs are done in the open. In addition, we offer an on-demand AMC (annual maintenance contracts) service, which provides customized AMC support for significant customers, such as large fleet owners.
We offer triple benefit insurance products for certain of our commercial vehicles which provide coverage for zero depreciation, loss of revenue, and replacement for total loss in case of accident. We offer a warranty of 4 years/4 lakh (which is 400,000) kilometers on drivelines for its entire range of heavy trucks with 25 tons and higher GVW and extended the same to its 16T GVW truck range, effective from March 2014 onwards.
In order to cultivate safe practices of school bus riders, promote our brand image and build connections with school bus riders and stakeholders such as children, parents and school authorities, in Fiscal 2013 we organized the “Dream it to Win it” school bus campaign across 2,070 schools in 11 cities across India. In light of positive responses received to the campaign, in Fiscal 2014 this campaign was further extended to 1,967 schools across 22 Indian cities. Through this event, students from different regions were educated on safety while travelling in school buses. Our flagship safety program, Humare Bus Ki Baat Hain, won several accolades in Fiscal 2015, such as Global Marketing Excellence Awards and Brand Excellence Awards in the Sustainable Marketing Excellence and Effective Use Of Marketing Communication categories from World Marketing Congress, and has reached out to over 15,000 school bus staff on school bus safety. In Fiscal 2015, we launched Tata SKOOLMAN, a student and school bus safety initiative, which is a telematics-based tracking solution, as a standard accessory for Tata Ultra range of school buses.
We also organized the Prima Truck Racing Championship Season 2, which drew in over 45,000 spectators.
In January 2015, in the SIAM International Bus & Utility Vehicles Show, at Greater Noida, we showcased the Tata articulated bus, among other vehicles. The articulated bus upholds one of Tata Motors core values of developing environment-friendly and efficient products for public and private transportation. Articulated buses have a signature single-deck design comprising two rigid sections linked by a pivoting joint.
Overview of Automotive Operations
We sold 1,191,179, 1,269,483,997,550, 1,020,546 and 1,078,814 vehicles1,192,742 units in Fiscal 2013, 20122015, 2014 and 20112013, respectively, consisting of 819,923524,522 units of Tata and other brand vehicles and 372,062473,028 units of Jaguar Land Rover vehicles in Fiscal 2013.2015. In terms of units sold, our largest market is India where we sold 758,175461,513 and 880,825527,378 units during Fiscal 20132015 and 2012,2014 (constituting 63.6%46.3% and 69.4%51.7% of total sales in Fiscal 20132015 and Fiscal 2012,2014, respectively), followed by China in Fiscal 2013 where we sold 79,458119,310 units and 54,532103,910 units in Fiscal 20132015 and Fiscal 20122014, respectively (constituting 6.7%12.0% and 4.3%10.2% of total sales) (In Fiscal 2012 the United Kingdom was our second largest market where we sold 58,558 units and 61,796 unitssales in Fiscal 20132015 and Fiscal 20122014, respectively). A geographical breakdown of our revenuesrevenue is set forth in Item 5.A “—Operating Results — Results—Geographical breakdown”.
Our total sales (including international business sales, and Jaguar Land Rover sales) forsales and sales by our joint venture with Chery) in Fiscal 2013, 20122015, 2014 and 20112013 are set forth in the table below:
Category | Fiscal 2013 | Fiscal 2012 | Fiscal 2011 | Year ended March 31, | ||||||||||||||||||||||||||||||||||||||||||||
| Units | % | Units | % | Units | % | 2015 | 2014 | 2013 | ||||||||||||||||||||||||||||||||||||||||
Passenger Cars | 236,260 | 19.8 | % | 352,981 | 27.8 | % | 322,149 | 29.9 | % | |||||||||||||||||||||||||||||||||||||||
Utility Vehicles | 361,822 | 30.4 | % | 316,589 | 24.9 | % | 243,934 | 22.6 | % | |||||||||||||||||||||||||||||||||||||||
| Units | % | Units | % | Units | % | |||||||||||||||||||||||||||||||||||||||||||
Passenger cars | 199,824 | 20.0 | % | 204,075 | 20.0 | % | 237,023 | 19.9 | % | |||||||||||||||||||||||||||||||||||||||
Utility vehicles | 420,533 | 42.2 | % | 383,871 | 37.6 | % | 361,822 | 30.3 | % | |||||||||||||||||||||||||||||||||||||||
Light Commercial Vehicles | 428,708 | 35.9 | % | 365,677 | 28.8 | % | 311,167 | 28.8 | % | 222,006 | 22.3 | % | 296,873 | 29.1 | % | 428,708 | 35.9 | % | ||||||||||||||||||||||||||||||
Medium and Heavy Commercial Vehicles | 165,189 | 13.9 | % | 234,236 | 18.5 | % | 201,564 | 18.7 | % | 155,187 | 15.5 | % | 135,727 | 13.3 | % | 165,189 | 13.9 | % | ||||||||||||||||||||||||||||||
|
|
|
|
|
| |||||||||||||||||||||||||||||||||||||||||||
Total | 1,191,179 | 100.0 | % | 1,269,483 | 100.0 | % | 1,078,814 | 100.0 | % | 997,550 | 100.0 | % | 1,020,546 | 100.0 | % | 1,192,742 | 100.0 | % | ||||||||||||||||||||||||||||||
|
|
|
|
|
| |||||||||||||||||||||||||||||||||||||||||||
Revenues fromTata and other brand vehicles
The following table sets forth our automotive operations were Rs.1,878,571 million, Rs.1,654,903 milliontotal sales of Tata and Rs.1,223,547 million in Fiscal 2013, 2012 and 2011, respectively.other brand vehicles:
Category | Year ended March 31, | |||||||||||||||||||||||
| 2015 | 2014 | 2013 | ||||||||||||||||||||||
| Units | % | Units | % | Units | % | |||||||||||||||||||
Passenger Cars | 121,741 | 23.2 | % | 123,431 | 21.0 | % | 179,257 | 21.9 | % | |||||||||||||||
Utility Vehicles | 25,588 | 4.9 | % | 32,626 | 5.5 | % | 47,532 | 5.8 | % | |||||||||||||||
Light Commercial Vehicles | 222,006 | 42.3 | % | 296,873 | 50.4 | % | 428,708 | 52.2 | % | |||||||||||||||
Medium and Heavy Commercial Vehicles | 155,187 | 29.6 | % | 135,727 | 23.1 | % | 165,189 | 20.1 | % | |||||||||||||||
|
|
|
|
|
|
|
|
|
|
|
| |||||||||||||
Total | 524,522 | 100.0 | % | 588,657 | 100.0 | % | 820,686 | 100.0 | % | |||||||||||||||
|
|
|
|
|
|
|
|
|
|
|
| |||||||||||||
Our overall vehicle sales for Tata and other brand vehicles (including spares and financing thereof) constituted 27.3% of our total automotive revenues before inter-segment eliminationdecreased by 10.9% to 524,522 units in Fiscal 2013 while Jaguar Land Rover constituted 72.7%.
2015 from 588,657 units in Fiscal 2014. However revenue attributable to Tata and other brand vehicles (including spares(before inter-segment elimination) increased by 2.8% to Rs.447,218 million in Fiscal 2015, compared to Rs.435,012 million in Fiscal 2014.
India is the major market for Tata and financing thereof)other brand vehicles. In India, due to higher spending on gross capital formation, slowing inflation, and lowering interest rates and crude oil price compared to the previous fiscal year, some sectors of the economy have started showing signs of revival and higher growth. Both fiscal and current account deficits in India remained relatively stable, which contributed to overall economic growth.
In Fiscal 2015, the GDP of India increased by 7.3% as compared to an increase of 6.9% in Fiscal 2014, which reflects changes by the Ministry of Statistics and Programme Implementation in the GDP calculation methodology. Growth in Agriculture and Industry decreased in Fiscal 2015 by 1.1% as compared to 3.7% in Fiscal 2014 while growth in the services sector growth increased by 8.4% in Fiscal 2015 as compared to 11.1% in Fiscal 2014. Growth in the Index of Industrial Production, or IIP, has shown signs of revival based on increases in IIP between November 2014 to March 2015. The IIP increased by 2.8% in Fiscal 2015 as compared to a decrease of 0.1% in Fiscal 2014. Significant factors influencing IIP growth in Fiscal 2015 included a 1.4% increase in the mining sector in Fiscal 2015 compared to a decrease of 0.6% in Fiscal 2014 and an increase in the manufacturing sector of 2.3%, compared to a decrease of 0.8% in Fiscal 2014. However, consumer durables decreased by 12.5% in Fiscal 2015 as compared to a decrease of 12.2% in Fiscal 2014.
The Indian automotive industry witnessed growth during Fiscal 2015, compared to a contraction in the previous year. Lower interest rates and inflation in Fiscal 2015 compared to Fiscal 2014 contributed to an improvement in consumer sentiment, which in turn contributed to an increase in automobile purchases. Expectations of higher capital expenditures and revivals in the mining, quarrying and manufacturing sectors contributed to replacements of old vehicles in commercial fleets, which in turn contributed to growth in the domestic auto industry.
We sold 819,923, 955,233,524,522, 588,657, and 835,469820,686 units of Tata and other brand vehicles in Fiscal 2013, 20122015, 2014 and 20112013, respectively. Of the 819,923524,522 units sold overall in Fiscal 2013, 755,6812015, we sold 461,513 units were soldof Tata and other brand vehicles in India while 64,24863,009 units were sold outside of India, compared to 878,551588,657 units and 76,68261,279 units, respectively, forin Fiscal 2012.2014. Our share of the Indian four-wheeler automotive vehicle market, (i.e.which consists of automobile vehicles other than two and three wheeler categories)three-wheeler categories, decreased from 25.1%16.5% in Fiscal 20122014 to 22.0%14.1% in Fiscal 2013.2015. We maintained our leadership position in the commercial vehicle segmentcategory in anthe industry, which experiencedwas characterized by increased competition during the year. The passenger vehicle market also continued to be subject to intense competition.
The following table sets forth our total A principal reason for the decline in volume of sales of Tata and other brand vehicles:vehicles, mainly light commercial vehicles, is the lack of fund availability for potential customers. High default rates in loans alongside early delinquencies has led financiers to tighten lending norms, for example by lowering the loan-to-value ratio on new financings while focusing on collection of existing loans.
Category | Fiscal 2013 | Fiscal 2012 | Fiscal 2011 | |||||||||||||||||||||
| Units | % | Units | % | Units | % | |||||||||||||||||||
Passenger Cars | 178,494 | 21.8 | % | 298,991 | 31.3 | % | 269,194 | 32.2 | % | |||||||||||||||
Utility Vehicles | 47,532 | 5.8 | % | 56,329 | 5.9 | % | 53,544 | 6.4 | % | |||||||||||||||
Light Commercial Vehicles | 428,708 | 52.3 | % | 365,677 | 38.3 | % | 311,167 | 37.2 | % | |||||||||||||||
Medium and Heavy Commercial Vehicles | 165,189 | 20.1 | % | 234,236 | 24.5 | % | 201,564 | 24.2 | % | |||||||||||||||
Total | 819,923 | 100.0 | % | 955,233 | 100.0 | % | 835,469 | 100.0 | % | |||||||||||||||
The following table sets forth our market share in various categories in the Indian market-basedmarket based on wholesale volumes:
Category@ | Fiscal 2013 | Fiscal 2012 | Fiscal 2011 | |||||||||
Passenger Cars* | 9.5 | % | 13.6 | % | 14.4 | % | ||||||
Utility Vehicles** | 7.1 | % | 10.9 | % | 13.2 | % | ||||||
Light Commercial Vehicles*** | 62.2 | % | 60.2 | % | 63.2 | % | ||||||
Medium and Heavy Commercial Vehicles | 53.3 | % | 59.3 | % | 60.1 | % | ||||||
Total Four-Wheel Vehicles | 22.0 | % | 25.1 | % | 24.3 | % | ||||||
Category | Year ended March 31, | |||||||||||
| 2015 | 2014 | 2013 | ||||||||||
Passenger Cars1 | 5.9 | % | 6.1 | % | 9.6 | % | ||||||
Utility Vehicles2 | 3.7 | 5.0 | 7.1 | |||||||||
Light Commercial Vehicles3 | 47.0 | 53.9 | 62.2 | |||||||||
Medium and Heavy Commercial Vehicles | 54.4 | 54.9 | 53.3 | |||||||||
|
|
|
|
|
| |||||||
Overall share of Four-Wheel Vehicles | 14.1 | % | 16.5 | % | 22.1 | % | ||||||
|
|
|
|
|
| |||||||
Source: Society of Indian Automobile Manufacturers Report and the Company’s internal analysis
Passenger |
Utility Vehicles market share |
Light Commercial Vehicles market |
Our performancePassenger vehicles in variousIndia
Industry-wide sales of passenger vehicles grew by 5.5% in Fiscal 2015 compared to a decline of 4.7% in Fiscal 2014. The growth in sales volumes was reflected across both passenger vehicle categories ofand was primarily attributable to reduced fuel prices, improved consumer sentiment, and lower interest rates. Hatchback sales remained flat, but sedans continued to show significant growth with new launches. The utility vehicle category has also shown growth, mainly with strong performances in softroad SUVs and multi-purpose vehicles.
Notwithstanding growth in the Indian market is described below:
Passenger cars: The domestic passenger cars industry grew by 0.9% in Fiscal 2013 compared with an increase of 3.6% in Fiscal 2012. Domesticvehicle sector, our passenger vehicle sales were impactedin India decreased by rising interest rates, fuel price hikes3.7% to 136,653 units in Fiscal 2015 from 141,846 units in Fiscal 2014, due to fewer new-product offerings by us compared to our competitors.
Passenger Cars
During Fiscal 2015, in the passenger car category, our sales increased by 1.2% to 119,203 units from 117,767 units in Fiscal 2014 primarily due to new model launches. Our overall market share of passenger cars in India was lower at 5.9% in Fiscal 2015 as compared to 6.1% during Fiscal 2014 primarily due to industry-wide competition and inflationary pressures.
Customer preferencedeclining demand for diesel vehicles over gasoline vehicles continued. Marketing initiatives and network actions continued with weak industry trends. Our performance within the industry was also impacted unfavorably. During Fiscal 2013, we recorded sales of 172,824 vehicles in the domestic market; a decline of 33.2% over last year. The overall market share was lower at 8.9% as compared to 13.0% during the last fiscal year. In Fiscal 2013, we sold 48,122 Nano cars, compared with 77,394 in Fiscal 2012. We continue to focus on expanding the market penetration of the Nano, including initiatives to appeal to younger customers such as our ‘Art in motion’ and ‘Campus Brand Ambassador’ programs. Furthermore, we continue to identify new markets for the Nano. We are evaluating markets in South Asia, in addition to the current markets in Nepal and Sri Lanka. We also continue to offer products at a low price point in the entry level mid-size sedan market through a portfolio including the old Indigo and the Indigo eCS..
The distribution business of Fiat cars through Tata-Fiat dealer network, which started in March 2006, entered its seventh and final year of operation in Fiscal 2013. During Fiscal 2013, we sold 5,179 Fiat cars, including the Grande Punto and Linea, through our joint venture with Fiat in India. Fiat stood in the 13th position by sales volume among the major car players in India. The Tata-Fiat dealer network was operating through 170 dealer facilities across 129 cities as of March 31, 2013. Fiat was ranked 7th in the J.D. Power 2012 India Customer Service Index Survey. During May 2012, both the joint-venture partners decided to re-align their Indian joint-venture and the management control of distributing and marketing Fiat branded cars, and related commercial activities. With effect from April 1, 2013, FIAL has been restructured to a manufacturing company that manufactures vehicles, powertrains and related spare parts for us and the Fiat Group.
The new distribution company of the Fiat Group will be responsible for distribution and marketing of Fiat branded vehicles. However, we are continuing to provide service support at 82 cities across India until September 30, 2013, where Fiat was unable to establish a network by March 31, 2013.
Since the commencement of distribution of Jaguar and Land Rover vehicles through our exclusive dealerships in India in June 2009, the brands have witnessed positive market responses. The sales volumes in Fiscal 2013 have grown approximately 10% to 2,494 vehicles compared to Fiscal 2012 despite the adverse impact of an increase in customs duty on imported premium cars in the March 2012 Union Budget. We commenced the local assembly of the Jaguar XF model in our facility at Pune in October 2012. We expect that additional efforts towards dealership network expansion and local assembly of Jaguar Land Rover products will enable us to further penetrate the premium/luxury automotive passenger car market in India.
Utility Vehicles: Although,
Our sales in the utility vehicles market recorded a healthy growth of 51.5%category decreased by 22.4% in Fiscal 2013, we registered decline, mainly attributable2015 to absence of a product in the fast growing soft roader utility vehicle segment. The Safari Storme was launched in Fiscal 2013, and has received a positive response24,517 units from the market.
Commercial Vehicles:The commercial vehicles market in India in Fiscal 2013 recorded a modest growth of 1.7% which resulted in sales of 594,73731,583 units in Fiscal 2013. The M&HCV2014. Our share in the overall utility vehicles category has declined mainly due to a lack of presence in the growing compact SUV and softroader categories resulting in our overall market segmentshare of utility vehicles in India decreasing to 4.4% in Fiscal 2015 from 5.5% during Fiscal 2014.
Commercial Vehicles in India
Sales of commercial vehicles in India decreased by 23.3%8.4% in Fiscal 2013,2015 compared to a growthdecrease of 6.5%22.4% in Fiscal 2012. The ban on mining2014. However, in the Indian statesfourth quarter of Karnataka and Goa, coupled withFiscal 2015, sales of our commercial vehicles started to recover due to growth in the slowdownM&HCV category. In Fiscal 2015, we recorded commercial vehicle sales of 317,793 units as compared to 378,028 units in Fiscal 2014 a decrease of 15.9%.
M&HCVs
Industry-wide sales in the M&HCV category increased by 15.9% in Fiscal 2015 as compared to a decrease of 25.2% in Fiscal 2014. Pending fleet replacements, a recent trend in gradual improvement in operating environment for fleet operators due to relatively higher freight rates, a correction in diesel prices, some improvement in cargo availability, market expectations of an increase in investments in infrastructure spending, curtailed growth, especiallyas well as manufacturing space and a renewal of mining and construction activities have contributed to the increase in M&HCV. Slowed industrial growth across many key segments adversely impacted demand. However, we registered a marginal&HCV sales in Fiscal 2015.
In Fiscal 2015, our sales in the M&HCV category increased by 14.9% to 126,368 units in Fiscal 2015 from 109,987 units in Fiscal 2014 primarily due to an industry-wide increase in M&HCV sales.
Our overall market share of M&HCVs sales in India decreased to 54.4% in Fiscal 2015 from 54.9% in Fiscal 2014 primarily due to increased competition.
LCVs
The increase in sales in Fiscal 2013, growingthe M&HCV category was offset by 1.0% to 536,491 units, as focus shifted to growing and consolidating presencea continuing decrease of sales in the LCV segment.
Light Commercial Vehicles (including pickups): Our rangecategory of LCVs includes small commercial vehicles, pickup trucks, trucks and commercial passenger carriers with a GVW (including payload) of between 1.2 tons and 7.5 tons. The LCV market segment grew by 17.9% in Fiscal 2013, mainly aided by the continuing expansion of the small commercial vehicle segment. Our sales increased by 21.5%18.1% to 393,726 units from 324,069406,902 units in Fiscal 2013.2015 from 496,993 units in Fiscal 2014. Demand in the light commercial vehicles category was affected due to lower freight transportation needs due to high-capacity additions to fleets over recent years, financing defaults and tightened lending norms, all of which continue to impede the recovery in sales of small commercial vehicles.
InOur sales in the LCV segment, finance offerings were launchedcategory declined by 28.6% to target specific customer segments. This had tremendous success and is being used selectively191,425 units in Fiscal 2015 from 268,041 units in Fiscal 2014 due to further sales of key models going forward. The new generationthe factors affecting the LCV Starbus Ultra was launched in March 2012
We made good progress in the high growth pickup truck market with new product offerings addressing gaps in the portfolio and financing packages.
Medium and Heavy Commercial Vehicles:industry wide. Our M&HCVs have a wide range of applications and are generally configured as trucks, tippers, buses, tankers, tractors or concrete mixers. We sold 142,765 units during Fiscal 2013, resulting in aoverall market share of 53.3%. We launched several new products and variantsLCV sales in this segmentIndia decreased to 47.0% in 2013, one of which was the five axle rigid truck, the LPT 3723. Furthermore, we launched a four year warranty for our M&HCV products, to underscore the quality and reliability of our offerings.Fiscal 2015 from 53.9% during Fiscal 2014.
Tata and other brand vehicles—Exports
We are expanding our export operations, which have been ongoing since 1961. We market our commercial and passenger vehicles — in several countries in South Africa, Europe, Africa, the Middle East, South East Asia, Ukraine and Russia. We market a range of products including M&HCV trucks, LCV trucks, buses, pickups and small commercial vehicles. Our export business has also been bolstered by the entry into the ASEAN region, including Indonesia, Malaysia, Philippines as well as with the introduction of the new range of world class products Prima and Ultra in various markets during Fiscal 2015, which we anticipate offering in additional markets in Fiscal 2016.
Our overall sales in international markets increased by 2.8% to 63,009 units in Fiscal 2015 from 61,279 units in Fiscal 2014. Our exports of vehicles manufactured in India increased marginally by 2.1% in Fiscal 2015 to 47,961 units from 46,983 units in Fiscal 2014. The improvement of the geopolitical situation in the South Asian Association for Regional Cooperation region has contributed to an increase in investment in capital goods, which has helped us to improve volumes in this region generally, and particularly in Bangladesh. In addition, the launch of new models in the Middle East and Africa region, along with the opening up of new markets in this region contributed to an increase in international sales volumes. Our top five export destinations for vehicles manufactured in India, that is, Bangladesh, Sri Lanka, Nepal, South Africa and Indonesia, accounted for approximately 56% and 79% of the exports of commercial vehicles and passenger vehicles, respectively. We intend to strengthen our position in the geographic areas we are currently operating in and explore possibilities of entering new markets with similar market characteristics to the Indian market.
TDCV, our subsidiary company engaged in the design, development and manufacturing of M&HCVs, recorded a 9.9% increase in its overall vehicle sales to 11,640 units in Fiscal 2015 from 10,594 units in Fiscal 2014. In the South Korean market, TDCV’s sales have increased by 3.4% from 6,584 units in Fiscal 2014 to 6,808 units in Fiscal 2015, primarily due to higher sales in October to December 2014, prompted by emissions norms effective from January 2015. TDCV exported 4,832 units in Fiscal 2015, compared to 4,010 units in Fiscal 2014, an increase of 20.5%. Sluggish market conditions in Russia, South Africa, Algeria and Laos due to adverse sociopolitical conditions were partially offset by increases in sales volumes in Vietnam, the Philippines, and the UAE. The Ukraine crisis and financial sanctions contributed to sluggish market conditions in Russia, which affected currency exchange rates and lessened demand for automobiles and for new large projects. Overall sales in South Africa have been affected by the depreciation of the South African Rand and overall limited economic growth. In Algeria and Laos, vehicle demand has been affected by continued political and economic uncertainties, general economic conditions and the absence of major projects. In Vietnam, TDCV has been able to develop new fleet customers to take advantage of a shift in demand to more lightweight commercial vehicles due to stricter application of vehicle-weight regulations.
Tata and other brand vehicles—Sales and Distribution:Distribution
Our sales and distribution network in India as ofat March 2012,2015 comprises approximately 2,6003,904 contact points for sales contact pointsand service for our passenger and commercial vehicle business. In line with our growth strategy, we formed a 100% ownedOur subsidiary, TML Distribution Company Limited, or TDCL, in March 2008, to actacts as a dedicated distribution and logistics management company to support the sales and distribution operations of our vehicles in India. We believe this has improved the efficiency of our selling and distribution operations and processes. We use a network of service centers on highways and a toll-free customer assistance center to provide 24-hour on-road maintenance, including replacement of parts, to vehicle owners.
TDCL provides distribution and logistics support for vehicles manufactured at our facilities and has set up stocking points at some of our plants and also at different places throughout India. TDCL helps us improve planning, inventory management, transport management and timely delivery. We have completed the initial rollout of a new customer relations management system, or CRM, at all of our dealerships and offices across the country, and have been certified by Oracle as the largest Siebel deployment in the automotive market. The combined CRM initiativewhich supports users both withinat our Companycompany and among our distributors in India and abroad.
Through our vehicle financing division and wholly owned subsidiary, TMFL we also provide financing services to purchasers of our vehicles through our independent dealers, who act as our agents for financing transactions, and through our branch network. TMFL, disbursed Rs.111,800 million and Rs.105,047 million during Fiscal 2013 and 2012 respectively. During Fiscal 2013 and 2012, approximately 33% and 27%, respectively, of our vehicle unit sales in India were made by the dealers through financing arrangements where our captive vehicle financing divisions provided the support. Total vehicle finance receivables outstanding as at March 31, 2013 and 2012 amounted to Rs.198,219 million and Rs.171,241 million respectively.
We also market our commercial and passenger vehicles in several countries in Europe, Africa, the Middle East, South East Asia, South Asia, Australia, Russia and other Africanthe Commonwealth of Independent States countries. We have a network of distributors in almost all of thesuch countries, where we export our vehicles, who work with us in appointingvehicles. Such distributors have created a local dealernetwork of dealers and branch offices and facilities for sales and after-sales servicing of our productproducts in various regions.their respective markets. We have also stationed overseas resident sales and service representatives in various countries to oversee our operations in theirthe respective territories.
We use a network of service centers on highways and a toll-free customer assistance center to provide 24-hour on-road maintenance (including replacement of parts) to vehicle owners.
In Fiscal 2013, we also introduced Tata FleetMan. Targeted at commercial vehicle fleet owners and large consigners of goods, the service offers advanced telematics solutions, which will help in increasing productivity and profitability. The Tata FleetMan has been designed to address pressing concerns of the transport industry, targeted at the commercial vehicle fleet owner.
Through advanced telematics solutions like fuel management, driver management and remote diagnostics, Tata FleetMan combines information technology and telecommunications equipment and software, with Tata Motors Limited expertise in automobile technology, providing features like real time fleet tracking, SMS alerts, geo-fencing and trip management.
We believe that the reach of our sales, service and maintenance network provides us with a significant advantage over our competitors.
Tata and other brand vehicles — Competition:vehicles—Competition
We face competition from various domestic and foreign automotive manufacturers in the Indian automotive market. Improving infrastructure and robust growth prospects compared to other mature markets have attracted a number of international companies to India who have either formed joint-venturesjoint ventures with local partners or have established independently owned operations in India. Global competitors bring with them decades of international experience, global scale, advanced technology and significant financial resources, and as a result, competition is likely to further intensify in the future. We have designed our products to suit the requirements of the Indian market based on specific customer needs such as safety, driving comfort, fuel efficiency and durability. We believe that our vehicles are suited to the general conditions of Indian roads and the local climate. The vehicles have also been designed to comply with applicable environmental regulations currently in effect. We also offer a wide range of optional configurations to meet the specific needs of our customers. We intend to develop and are developing products to strengthen our product portfolio in order to meet the increasing customer expectation of owning world class products.
Tata and other brand vehicles — Seasonality:vehicles—Seasonality
Demand for our vehicles in the Indian market is subject to seasonal variations. Demand generally peaks between January and March, although there is a decrease in demand in February just before release of the Government of India’s fiscal budget. Demand is usually lean from April to July and picks up again in the festival season from September onwards, with a decline in December due to model year change.
Tata and other brand vehicles—Vehicle Financing
Through our vehicle financing division and wholly owned subsidiary, TMFL, we also provide financing services to purchasers of our vehicles — Exports:through our independent dealers, who act as our agents, and through our branch network. The vehicle financing is intended to encourage sale of vehicles by providing financing to the dealers’ customers and as such is an integral part of automotive business.
TMFL disbursed Rs.73,156 million and Rs.87,676 million in vehicle financing during Fiscal 2015 and 2014, respectively. During Fiscal 2015 and 2014, approximately 24% and 30%, respectively, of our vehicle unit sales in India were made by the dealers through financing arrangements where our captive vehicle financing divisions provided the support. Total vehicle finance receivables outstanding as at March 31, 2015 and 2014 amounted to Rs.158,016 million and Rs.185,275 million, respectively. As at March 31, 2015 and 2014 our customer finance receivable portfolio comprised 687,580 and 732,550 contracts, respectively. We follow specified internal procedures, including quantitative guidelines, for selection of our finance customers to assist in managing default and repayment risk in our portfolio. We originate all of the contracts through our authorized dealers and direct marketing agents with whom we have agreements. All our marketing, sales and collection activities are undertaken through dealers or by TMFL.
We securitize or sell our finance receivables on the basis of evaluation of market conditions and funding requirements. The constitution of these pools is based on criteria that are decided by credit rating agencies and/or based on the advice that we receive regarding the marketability of a pool. We undertake these securitizations of our receivables in either or both of the following forms:
Assignment of the receivables due from purchasers under loan agreements; and
Securitization of receivables due from purchasers by means of private placement.
We act as collection agent on behalf of the investors, representatives, special purpose vehicles or banks, in whose favor the receivables have been assigned, for the purpose of collecting receivables from the purchasers on the terms and conditions contained in the applicable deeds of securitization, in respect of which pass-through certificates are issued to investors in case of special purpose vehicles, or SPVs. We also secure the payments to be made by the purchasers of amounts constituting the receivables under the loan agreements to the extent specified by rating agencies by any one or all of the following methods:
Furnishing to the investors collateral, in respect of the obligations of the purchasers and the undertakings to be provided by us;
Furnishing, in favor of the investors, 10.88% to 14.90% of the gross receivables as cash collateral, for securitizations done till Fiscal 2014, either by way of a fixed deposit or bank guarantee to secure the obligations of the purchasers and our obligations as the collection agent, based on the quality of receivables and rating assigned to the individual pool of receivables by the rating agency(ies); and
By way of over-collateralization or by investing in subordinate pass-through certificates to secure the obligations of the purchasers.
For further details see Note 36(b) to our consolidated financial statements included elsewhere in this annual report on Form 20-F.
Jaguar Land Rover
We are expanding our export operations, which have been ongoing since 1961. We market our commercial and passenger vehiclesIn Fiscal 2015, Jaguar Land Rover continued to grow in several countriesall of its geographic markets on an annual basis, although retail sales in Europe, Africa, the Middle East, South East Asia and South Asia. Our exports of vehicles manufactured in IndiaChina decreased by 22.1%20.4% in the fourth quarter of Fiscal 2015 compared to the same period in Fiscal 2014. Growth in volume has been driven by the continued success of the Range Rover, Range Rover Sport and the Jaguar F-TYPE. More established models such as the Range Rover Evoque and the Land Rover Discovery have also been performing well, however more mature products such as the Jaguar XF and XJ experienced lower sales in anticipation of the introduction of the all new Jaguar XE and the new Jaguar XF. Production of Jaguar XK and the Land Rover Freelander were terminated during the year, with the latter replaced by the Land Rover Discovery Sport.
Our total wholesale sales of Jaguar Land Rover in Fiscal 2015, 2014 and 2013 are set forth in the table below:
| Fiscal 2015 | Fiscal 2014 | Fiscal 2013 | ||||||||||||||||||||||
| Units | % | Units | % | Units | % | |||||||||||||||||||
Jaguar | 78,083 | 16.5 | % | 80,644 | 18.7 | % | 57,766 | 15.5 | % | |||||||||||||||
Land Rover | 394,945 | 83.5 | 351,245 | 81.3 | 314,290 | 84.5 | ||||||||||||||||||
Total | 473,028 | 100.0 | % | 431,889 | 100.0 | % | 372,056 | 100.0 | % | |||||||||||||||
Wholesale volumes in Fiscal 2015 increased by 9.5% to 48,145473,028 units from 61,835431,889 units in Fiscal 2012 supported2014. Wholesale volumes for Land Rover in Fiscal 2015 increased by economic improvement in our major international markets such as the Indian sub-continent and Africa.
In Fiscal 2013, our top five export destinations12.4% to 394,945 units from India accounted for approximately 51% and 92% of our exports of commercial vehicles and passenger vehicle units, respectively. We are strengthening our position in the geographic areas we are currently operating in and exploring possibilities of entering new markets with similar market characteristics to the Indian market.
Tata Daewoo Commercial Vehicle Co. Ltd., Korea:TDCV recorded a 6.1% increase in its overall vehicle sales to 10,080351,245 units in Fiscal 2013 from 9,500 units2014. The increase in Fiscal 2012. Insales occurred in a majority of models, most notably the South Korean market, TDCV’s unit sales inRange Rover and Range Rover Sport, which was partially offset by the M&HCV category in Fiscal 2013 decreased by 17.6% to 5,400 units compared to 6,552 units in Fiscal 2012, mainly due to a decrease in overall industry demand as a resultinventory shortages of the economic slowdown. However, TDCV’s export performance in Fiscal 2013 increased by 58.8% to 4,680 units compared to 2,948 units in Fiscal 2012. TDCV’s sales increased significantly in several of its traditional export markets like Algeria, Russia, Laos, South Africa, and Vietnam. TDCV vehicles were also sold into some new markets like Indonesia, Ecuador, and Ghana.
Jaguar Land Rover
We acquiredFreelander (which had ceased production) while Jaguar Land Rover from Ford on June 2, 2008. As partinitiated production of the acquisition, we acquiredDiscovery Sport (which had recently commenced production). However, wholesale volumes for Jaguar in Fiscal 2015 decreased by 3.2% to 78,083 units from 80,644 units sold in Fiscal 2014. Increased sales of the global business relating to Jaguar Land Rover including three major manufacturing facilitiesF-TYPE were offset by a fall in volume of the maturing Jaguar XF and two advanced designXJ models in advance of the introduction of the Jaguar XE and engineering centers in the United Kingdom, a worldwide sales and dealership network, intellectual property rights, patents and trademarks.Jaguar XF.
The strengths of the Jaguar Land Rover business include its internationally recognized brands, strong product portfolio of award winningaward-winning luxury performance cars and premium all-terrain vehicles, global distribution network, strong research and development capabilities, and a strong management team. Our total sales of Jaguar Land Rover for Fiscal 2013, 2012 and 2011 are set forth in the table below:
| Fiscal 2013 | Fiscal 2012 | Fiscal 2011 | ||||||||||||||||||||||
| Units | % | Units | % | Units | % | |||||||||||||||||||
Jaguar | 57,766 | 15.5 | % | 53,990 | 17.2 | % | 52,955 | 21.8 | % | |||||||||||||||
Land Rover | 314,290 | 84.5 | % | 260,260 | 82.8 | % | 190,390 | 78.2 | % | |||||||||||||||
Total | 372,056 | 100.0 | % | 314,250 | 100.0 | % | 243,345 | 100.0 | % | |||||||||||||||
Jaguar:
Jaguar’s principal products are the Jaguar XK sports car (coupe and convertible), Jaguar XF sedan and the Jaguar XJ sedan.
The Jaguar XK is Jaguar’s premium luxury performance, GT, car, launched in 2006 with a high aluminum content to deliver fuel and CO2 efficiency, and is available in coupe and convertible models. The Jaguar XK was significantly updated in 2009 with a new engine and exterior and interior design enhancements and further revised in 2011. The Jaguar XKR-S coupe and convertible models are the sporting flagships for Jaguar Land Rover’s revitalized XK line-up. The Jaguar XKR-S is the fastest and most powerful production sports GT that Jaguar has ever built.
The Jaguar XF, launched in 2008, is a premium executive car that merges sports car styling with the sophistication of a luxury sedan. The Jaguar XF is Jaguar’s best-selling model across the world by volume and has received more than 100 international awards since its launch, including being named “Best Executive Car” by What Car? Magazine for four consecutive years. In 2009, the Jaguar XF underwent a significant engine upgrade, and in 2011, we made fundamental design changes to the front and rear of the Jaguar XF, which we believe is now closer to the original C-XF concept car. In addition, the Jaguar 2012 Model Year line-up included a new four cylinder 2.2-liter diesel version of the Jaguar XF with Intelligent Stop-Start Technology, making it the most fuel-efficient Jaguar yet and allowing Jaguar to compete more effectively with competitors in the United Kingdom and European fleet and company car markets. At the Geneva Motor Show in March 2012, we unveiled the Jaguar XF Sportbrake, with the versatility of an estate car and the spirit of a sports car. The 2013 Model Year Jaguar XF range also includes for the first time an all-wheel drive version of the new V6 gasoline engine for the U.S. and European markets and a 2.0-liter gasoline version for the U.S. and Chinese markets. We started selling the 2013 Model Year Jaguar XF and Jaguar XF Sportbrake at the end of the third quarter of Fiscal 2013.
The Jaguar XJ is Jaguar’s largest luxury sedan, powered by a range of supercharged and naturally aspirated 5.0-liter V8 gasoline engines and a 3.0-liter diesel engine. Using Jaguar’s aerospace inspired aluminum body architecture, the new Jaguar XJ’s lightweight aluminum body provides improved agility and fuel and CO2 efficiency. The Jaguar XJ has received more than 20 international awards since its launch, including “Best Luxury Car” from China’sAuto News, “Annual Limousine King” fromQuattroroute (Italy), “Luxury Car of the Year” fromTop Gear (UK),Automobile Magazine’s “2011 Design of the Year” and “Best Executive Sedan” at theBloomberg Awards in the United States. In 2011, the Jaguar XJ was upgraded to include a new Executive Package and a Rear Seat Comfort Package, to provide an executive limousine experience. The 2013 Model Year also includes an all-wheel drive version and a 3.0-liter V6 gasoline version for the U.S. and European markets and a 2.0-liter gasoline version for the Chinese market, which benefits from lower custom duties in that market. We started selling the 2013 Model Year Jaguar XJ in the second quarter of Fiscal 2013.
In September 2012, Jaguar unveiled the Jaguar F-TYPE at the Paris Motor show, a two-seat sports car that was inspired by the 2011 C-X16 concept cars. Like the Jaguar XK and Jaguar XJ, the Jaguar F-TYPE has an all-aluminum structure and all-aluminum double wishbone suspension and stop/start fuel economy measures, with the power of Jaguar’s latest 3.0-liter V6 and 5.0-liter V8 engines. The Jaguar F-TYPE has been available to retail customers since April 2013.
Land Rover:
Land Rover’s principal products are the Defender, Freelander 2 (LR2), Discovery 4 (LR4), Range Rover Evoque, Range Rover Sport and Range Rover. Land Rover products offer a range of powertrains, including turbocharged V6 diesel, V6 gasoline engines and V8 naturally aspirated and supercharged gasoline engines, with manual and automatic transmissions.
The Defender is one of Land Rover’s most capable SUVs, and targets extreme all-terrain capabilities and payload/towing capability. Work has begun on developing a successor to this vehicle.
The Freelander 2 is a versatile vehicle for active lifestyles, matching style with sophisticated technology and off-road capability. The Freelander 2 was significantly enhanced for the 2013 Model Year with the introduction of a turbocharged 2.0-liter gasoline engine, offering superior performance to the 3.2-liter engine it replaces while also reducing CO2 emissions.
The Discovery 4 is a mid-size SUV that features genuine all-terrain capability and versatility, including full seven-seat capacity. Recent power train innovations for the 2012 Model Year have delivered an improvement in CO2 for the 3.0-liter LR-TDV6 engine. The Discovery has won more than 200 awards since its introduction in 1989.
The Range Rover Evoque is the smallest, lightest and most fuel-efficient Range Rover to date. The Evoque is available in 5-door and coupe body styles and, depending on the market, in both front-wheel drive and all-wheel drive derivatives. Since its launch in September 2011, consumer interest and demand have been consistent across the globe. In its first full year of sales, we sold 103,269 total retail units of the Range Rover Evoque. The Evoque has also won over 120 international awards since its launch, reflecting its blend of design and capability.
The Range Rover Sport combines the performance of a sports tourer with the versatility of a Land Rover. The 2012 Model Year Range Rover Sport introduced a new version of the TDV6 diesel engine with an eight-speed transmission to reduce CO2 emissions. At the 2013, New York International Auto Show, Land Rover debuted the new 2014 Model Year Range Rover Sport built on a weight saving aluminum architecture. The Sport’s all-new, aluminum architecture achieves a weight saving of up to 420kg (as with the TDV6 engine) to bring agility and exceptional performance, with 15 per cent CO2 reduction and 24 per cent improved fuel economy. The new Range Rover Sport is the fastest, most agile and most responsive Land Rover ever.
The Range Rover is the flagship product under the Land Rover brand with a unique blend of British luxury, classic design, high-quality interiors and outstanding all-terrain ability. The new all-aluminum version was launched in the third quarter of Fiscal 2013, the world’s first SUV with a lightweight all-aluminum body, the new Range Rover has enhanced performance and handling on all terrains, and significant advances in environmental sustainability. The all-aluminum body shell has helped reduce the weight of the car substantially. A diesel hybrid Range Rover is currently being developed for introduction later in 2013. The new Range Rover was declared the world’s top SUV by The Sunday Times, won Top Gear magazine’s “Luxury Car of the Year” and was recently awarded the maximum 5-star safety rating by Euro NCAP.
Jaguar and Land Rover achieved relatively strong sales during Fiscal 2013, as total unit sales (wholesales) increased to 372,056 units from sales of 314,250 units in Fiscal 2012, reflecting an increase of 18.4%. Jaguar volumes increased to 57,766 units during Fiscal 2013 from 53,990 units in Fiscal 2012 reflecting an increase of 7.0%. Land Rover volumes increased to 314,290 units in Fiscal 2013 from 260,260 units in Fiscal 2012, reflecting an increase of 20.8%, as a result Range Rover Evoque and Freelander sales. The Jaguar Land Rover exported 301,534 units in Fiscal 2013 compared to 250,180 units in Fiscal 2012, an increase of 20.5%.
Jaguar Land Rover’s performance in key geographical markets on retail basis
United States
Retail volumes in Fiscal 2015 increased by 6.4% to 462,209 units from 434,311 units Fiscal 2014. The U.S. economy has recovered more favorably than other developed economies sinceoverall increase in sales volumes was primarily due to strong sales of the economic downturn, with GDP growthRange Rover, Range Rover Sport and falling unemployment, although the position remains fragile.
United States retail volumes for Fiscal 2013 forJaguar F-TYPE vehicles, which was partially offset by the combined brands totaled 62,959 units. Jaguar retail volumes for Fiscal 2013 fell by 6% compared to Fiscal 2012, leading to a decrease in market share. Despitelack of available Freelander inventory. For Land Rover, retail volumes increased by 8.9% to 385,279 units in Fiscal 2015 from 353,789 units in Fiscal 2014. However, for Jaguar, retail volumes in Fiscal 2013 increasing2015 decreased by 13%4.5% to 76,930 units from 80,522 units in Fiscal 2014, as increased sales of the Jaguar F-TYPE were offset by a decrease in volume of the maturing Jaguar XF and XJ models in advance of the introduction of the Jaguar XE and the all new Jaguar XF. Furthermore, retail sales volumes in China decreased by 20.4% in the fourth quarter of Fiscal 2015 compared to the same period in Fiscal 2012, market share declined slightly.2014. Jaguar Land Rover exports increased by 6.9% to 378,427 units in Fiscal 2015 from 354,005 units in Fiscal 2014.
United Kingdom
InIndustry vehicle sales rose by 7.5% in Fiscal 2013, there was little growth in the economy2015 in the United Kingdom although recent economic data suggests better news ahead. Trading conditions in the United Kingdom remain difficult, although the automotive market has grown in the period.
UK retail volumes for Fiscal 2013 for the combined brands totaled 72,270 units. Jaguar retail volumes for Fiscal 2013 increased by 10% compared to Fiscal 2012, broadly maintaining2014 as economic growth improved inflation and interest rates remained low and labor market share.conditions continued to strengthen. Jaguar Land Rover retail volumes for Fiscal 2013 increased by 24%13.1% to 86,750 units in Fiscal 2015 from 76,721 units in Fiscal 2014, with a strong sales performance from Jaguar, up 7.0% in Fiscal 2015, which was driven by sales of the Jaguar F-TYPE and the XF. Land Rover retail volumes increased by 14.8%, as all models experienced an increase in volumes, most notably the Range Rover Sport and the Discovery.
North America
Economic performance in the United States continued to strengthen over the year as unemployment continued to fall, lower inflation driven by lower energy prices increased disposable incomes and consumer confidence continued to grow contributing to an industry-wide increase in passenger car sales of 6.8% in Fiscal 2015 compared to Fiscal 2012, increasing market share.
Europe (excluding Russia)
The European economy continues to struggle, with austerity measures in place in a number of countries. The economic situation and recent bail out actions continue to create uncertainty around European zone stability, the Euro and borrowing costs. Credit continues to be difficult to obtain for customers and the outlook remains volatile.
European retail volumes for Fiscal 2013 for the combined2014. Jaguar Land Rover brands totaled 80,994retail volumes increased by 3.6% to 78,372 units representingfrom 75,671 units in Fiscal 2014, with a 18%9.5% increase compared to Fiscal 2012. Jaguar retail volume for Fiscal 2013 grew by 5%, andin Land Rover retail volume for Fiscal 2013volumes as Range Rover, Range Rover Sport and Range Rover Evoque continued to perform well. Jaguar volumes in North America decreased by 13.6% as sales of the aging XF and XJ decreased, which was partially offset by strong sales of the popular F-TYPE.
Europe
Passenger car sales increased by 21% compared to Fiscal 2012.
China
The Chinese economy has continued to grow strongly throughout Fiscal 2013. GDP5.5% industry-wide in Europe despite low growth, is likely to slow in future, although projected remain above 7.5% according to general economic consensus from market commentators.
The joint venture established to manufacture cars in China with Chery Automobile Co., Limited, or Chery Automobile, a Chinese automotive manufacturer, was approvedrecessionary pressures and ambiguity over the Greek national debt negotiations, while quantitative easing announced by the National Development and Reform Commission of the People’s Republic of ChinaEuropean Central Bank in October 2012 and GBP 71 million was investedJanuary 2015 has provided a boost in Fiscal 2013.economic activity more recently. Jaguar Land Rover volumes in Europe increased by 6.0% to 87,863 units in Fiscal 2015 from 82,854 units in Fiscal 2014, with sales particularly strong in Germany, Italy and Chery Automobile will now accelerate plans to build a joint venture manufacturing plantFrance. Land Rover volumes increased by 9.2% in Changshu, near Shanghai,Fiscal 2015 as partsales of a 10.9 billion RMB investment that will also include a new researchthe Range Rover Sport and development centerRange Rover grew significantly. Jaguar volumes decreased by 14.2% in Fiscal 2015, as sales of the aging XF sedan and engine production facility. The project includesSportbrake decreased, which was partially offset by solid sales of the creationF-TYPE.
China
Despite continuing signs of a new partnership brand to assemble models tailored specifically forsoftening in the Chinese market, includingeconomy during the marketingyear, GDP still grew over 7.0% and distribution. The two companies plan to complete the Changshu facility in Jiangsu province during 2014. Construction of a new engine plant for production of fuel efficient engines is also contemplated in the joint venture partnership agreement.
The China retail volumes for Fiscal 2013 for the combined brands totaled 77,075 units. Jaguar retail volume for Fiscal 2013passenger car sales increased by 28% compared to Fiscal 2012, improving market share.9.6%. Jaguar Land Rover retail volume for Fiscal 2013volumes, which include sales from our joint venture with Chery increased by 51%12.5% to 115,969 units in Fiscal 2015 from 103,077 units in Fiscal 2014. However, in the fourth quarter of Fiscal 2015, retail sales of Jaguar Land Rover in China decreased by 20.4% to 23,526 units from 29,567 units compared to the same period in Fiscal 2012, again improving market share.2014 due to inventory shortages of the Land Rover Freelander (which had ceased production) and the Land Rover Discovery Sport and the locally produced Range Rover Evoque (which had recently commenced production). This decline in retail sales of Jaguar Land Rover has continued in the first quarter of Fiscal 2016. Retail sales of Land Rover increased by 14.8% in Fiscal 2015 with sales of the majority of models up, most notably the Range Rover and Range Rover Sport, while Jaguar retail sales increased by 2.8% in Fiscal 2014, as both the XF and F-TYPE performed well.
Asia Pacific
The Asia Pacific region main markets aremost notably comprises Australia, Japan Australia and New Zealand. These regions were less affected by the economic crisis compared to the United States, the United Kingdom and Europe, and recovered more favorably during Fiscal 2013, often due to increased trade with China and other growth economies.
The Asia Pacific retail volumesSouth Korea for Fiscal 2013 for the combined brands totaled 17,849 units.purposes of our Jaguar retail volume for Fiscal 2013 increased by 27% compared to Fiscal 2013.Land Rover operations. Jaguar Land Rover retail volume for Fiscal 2013volumes increased by 34% compared16.8% to Fiscal 2012.
Other markets
The major constituents of the other markets category are Russia, South Africa and Brazil, along with the rest of Africa and South America. These economies were not affected as significantly by the economic crisis as more developed economies and have had continued GDP growth in recent years, partially due to increased commodity and oil prices.
The other markets retail volumes for Fiscal 2013 for the combined Jaguar and Land Rover brands totaled 63,489 units, reflecting an increase of 19% from Fiscal 2012. Jaguar retail volumes for Fiscal 2013 increased 17% from 5,46026,619 units in Fiscal 2012 to 6,402 in Fiscal 2013, while Land Rover retail volume increased 19%2015 from 47,91922,795 units in Fiscal 2012 to 57,0872014, most notably in Fiscal 2013.
Jaguar Land Rover — Sales & Distribution:
We marketSouth Korea (increased by 46.7%) and in Australia (increased by 16.4%) as consumer demand for Jaguar Land Rover products continued to rise in 178these markets. Retail sales of the Range Rover, Range Rover Sport, Land Rover Discovery and Jaguar F-TYPE performed particularly well in the Asia Pacific region. Land Rover sales increased by 21.1% and Jaguar retail sales increased by 1.3% in Fiscal 2015.
Other overseas markets
Jaguar Land Rover’s retail volumes in the other overseas markets declined by 9.0% to 66,636 units in Fiscal 2015 from 73,193 units in Fiscal 2014, primarily as a consequence of economic sanctions and low energy prices impacting Russia and slowing economic growth reducing consumer spending in Brazil and South Africa. Slowing economic growth and ongoing recessionary pressures in Brazil have contributed to a decrease in automotive sales industry-wide of 11.0% in Fiscal 2015 compared to Fiscal 2014, and Jaguar Land Rover sales volumes in Brazil have followed suit, decreasing 16.6% in Fiscal 2015 compared to Fiscal 2014. Continuing economic sanctions and softer energy prices have had an adverse effect on passenger car sales industry-wide in Russia, which decreased 17.7% in Fiscal 2015 compared to Fiscal 2014. Jaguar Land Rover sales, however, have fallen comparatively slower, decreasing 9.6% in Fiscal 2015 compared to Fiscal 2014, as Range Rover Sport continued to perform well and F-TYPE volumes increased. South Africa’s persistent slow growth continues to impact the automotive industry as passenger car sales fell by 1.7% in Fiscal 2015 compared to Fiscal 2014 and Jaguar Land Rover retail volumes dropped by 23.2% in Fiscal 2015 compared to Fiscal 2014.
We sold 2,873 units of Jaguar Land Rover vehicles in India through our exclusive dealerships in Fiscal 2015 as compared to 2,805 units in Fiscal 2014, an increase of 1.2%, which was aided by the manufacture of the Jaguar XF, Jaguar XJ and the Range Rover Evoque in India, as vehicles manufactured and sold in India are not subject to certain import duties. We expect that the continued efforts towards dealership network expansion and local manufacturing of Jaguar Land Rover products will enable us to further penetrate the premium/luxury automotive passenger car market in India.
Jaguar Land Rover—Sales & Distribution
Jaguar Land Rover markets products in 170 countries, through a global network of 1719 national sales companies, or NSCs, 8573 importers, 6253 export partners and 2,4852,674 franchise sales dealers, of which 689915 are joint Jaguar and Land Rover dealers.
Sales locations for Jaguar Land Rover vehicles are operated as independent franchises. Jaguar Land Rover is represented in its key markets through national sales companies as well as third party importers.dealers, which operate independently. Jaguar Land Rover has regional offices in certain select countries that manage customer relationships, vehicle supplies and provide marketing and sales support to their regional importer markets. The remaining importer markets are managed from the United Kingdom.
Jaguar Land Rover products are sold to retail customers through our dealerships to retail customers. Jaguar Land Rover products are also soldglobal dealership network and to fleet customers, including daily rental car companies, commercial fleet customers, leasing companies, and governments. As a consequence, Jaguar Land Rover has a diversified customer base, which reduces its independencedependence on any single customer or group of customers.
Jaguar Land Rover — Competition:has established business processes and systems designed to ensure that its production plans meet anticipated retail sales demand and to enable the active management of its inventory of finished vehicles and dealer inventory throughout its network. Jaguar Land Rover has multi-year exclusive branded arrangements in place with Black Horse (part of the Lloyds Bank Group) in the UK, FCA Bank (a joint venture between Fiat Chrysler Auto and Credit Agricole) in Europe and Chase Auto Finance in the United States for the provision of dealer and consumer financial services products. Jaguar Land Rover has similar arrangements with local automotive financial services providers in other key markets. Jaguar Land Rover’s financing partners offer its customers a full range of consumer financing options.
Jaguar Land Rover—Competition
We operateJaguar Land Rover operates in a globally competitive environment and facefaces competition from established premium and other vehicle manufacturers who aspire to move into the premium performance car and premium SUV markets, some of which are much larger than we are. Jaguar vehicles compete primarily against other European brands such as Audi, BMW and Mercedes Benz. Land Rover and Range Rover vehicles compete largely against SUVs manufactured by Audi, BMW, Infiniti, Lexus, Mercedes Benz, Porsche and Volkswagen. The Land Rover Defender competes with vehicles manufactured by Isuzu, Nissan and Toyota.
Jaguar Land Rover — Seasonality:Rover—Seasonality
Jaguar Land Rover sales volume is impacted by the bi-annualsemi-annual registration of vehicles in the United Kingdom where the vehicle registration number changes every six months, which in turn has an impact on the resale value of the vehicles. This leads to a concentration of sales during the periods when the change occurs. Seasonality in most other markets is driven by introduction of new model year derivatives, for example in the USU.S. market. Additionally in the USU.S. market there is some seasonality around the purchase of vehicles in northern states where the purchase of Jaguar vehicles is concentrated in the spring /summer months, and the purchase of 4x4 vehicles is concentrated in the autumn/winter months. In China, there is an increase in vehicle purchases during the fourth Fiscalfiscal quarter, which includes the Chinese New Year holiday. Furthermore, western European markets tend to be impacted by summer and winter holidays. The resulting sales profile influences operating results on a quarterquarter-to-quarter basis.
Other Operations
In addition to quarter basis.our automotive operations, we are also involved in other business activities, including information technology services. Net revenues, before inter-segment elimination, from these activities totaled Rs.27,152 million, Rs.24,989 million and Rs.22,179 million in Fiscal 2015, 2014 and 2013, respectively, representing nearly 1.0%, 1.1% and 1.2% of our total revenues before inter-segment elimination in the corresponding Fiscal periods.
Information Technology Services
As at March 31, 2015, we owned a 72.32% equity interest in our subsidiary, TTL. TTL, founded in 1994 and a part of Tata Motors Group, provides product development IT services solutions for PLM and Enterprise Resource Management, or ERM, to automotive, aerospace and consumer durables manufacturers and their suppliers. TTL’s services include product design, analysis and production engineering, knowledge-based engineering, PLM, ERM and CRM systems. TTL also distributes, implements and supports PLM products from leading solution providers in the world such as Dassault Systems and Autodesk.
TTL has its international headquarters in Singapore, with regional headquarters in the United States, India and the United Kingdom. In Fiscal 2014, TTL acquired Cambric Corporation, an engineering services organization, to achieve greater domain expertise and presence in the industrial equipment sector. TTL has a combined global workforce of around 7,804 professionals serving clients worldwide from facilities in the North America, Europe, and Asia Pacific regions. TTL responds to customers’ needs through its subsidiary companies and through its offshore development centers in India, Thailand and Romania. TTL had 14 functional subsidiary companies and one joint venture as at March 31, 2014.
The consolidated revenues of TTL increased by 10.3% in Fiscal 2015 to Rs.26,170 million (including sales to Tata Motors Limited and its consolidated subsidiaries) from Rs.23,724 million in Fiscal 2014 due to operations in the automotive and aerospace markets. TTL recorded profit after tax of Rs.3,349 million in Fiscal 2015, reflecting an increase of 26.8% over Rs.2,642 million in Fiscal 2014.
Research and Development:Development
Over the years, we have devoted significant resources towards our research and development activities. Our research and product development costs in Fiscal 2015, 2014 and 2013 were Rs. 28,515.3 million, Rs. 25,651 million and Rs. 20,340 million, respectively. Our research and development activities focus on product development, environmental technologies and vehicle safety. OurIn India, our Engineering Research Centre, or ERC, established in 1966, is one of the few in-house automotive research and development centers in India recognized by the Government of India. The ERC is integrated with all of the Tata Motors global automotive product designGlobal Automotive Product Design and development centersDevelopment Centers in South Korea, Spain, Italy and the United Kingdom. In addition to this, we leverage key competencies through various engineering service suppliers and design teams of ourits suppliers.
We have a new passenger car electrical and electronics facility for the development of hardware-in-the-loop systems, labcars and infotainment systems to achieve system and component integration. We have an advance engineering workshop, with a lithium-ion battery module, for the development of electric vehicle and hybrid products. We have a crash test facility for evaluatingpassive safety development in order to meet regulatory and consumer group test requirements and evaluate occupant safety, which includes a vehicle levelfull vehicle-level crash test facility, a sled test facility for simulating the crash environment on subsystems, a pedestrian safety testing facility, a high strain rate machine and a pendulum impact test facility for goods carrier vehicles and other equipment and facilities that aid us in developing products that comply with various safety norms.vehicles. This facility is also supported with computer-aided engineering infrastructure to simulate tests in a digital environment. We haveOur safety development facilities also incorporate other equipment that we believe will help improve the safety and design of our vehicles, such as an emission labs engine development facility, a hemi-anechoic chamber testing facility for developing vehicles with lower noise and vibration levels, and an engine emission and performance development facility that aid us in developing products meeting international standards. We also haveand an eight poster road load simulator for validation of thetest facility that helps to assess structural durability of M&HCVs. In addition, we are installing a new engine noise test facility and transmission control unit which we expect will aid in powertrain development. Other key facilities include a full vehicle environmental testing facility, material pair compatibility equipment, corrosion test facility, heavy duty dynamometers and aggregate endurance test rigs.
Our product design and development centers are equipped with sophisticated hardware, software and other information technology infrastructure, designedaim to create a highly scalable digital product development and virtual testing and validation environment, resultingtargeting a reduction in reduction of product development cycle-time. These centers are growing with increased vehicle development programs in breadthcycle-time, improved quality and depth of technology. Rapid prototype development systems, testing cycle simulators, advanced emission test laboratories and stylingthe ability to create multiple design options. Global design studios are also akey part of our product development infrastructure.conceptualization strategy. We have aligned our end-to-end digital product development objectives and infrastructure with our business goals and have made significant investments to enhance theour capabilities, especially in the areas of product development through computer-aided design, computer-aidedcomputer aided manufacturing, computer-aided engineering, knowledge-based engineering, PLMproduct lifecycle management and manufacturing planning. In specific engineering review processes, likesuch as digital mockup. In ordermock-up and virtual build and validation, we have been able to track various issues arisingprovide capabilities for reduced time and increased quality in vehicleproduct designs. The design IP is managed through a product lifecycle management system, enabling backbone processes, and development processes, we have institutionalized ‘issue tracking’ work flow“issue tracking” work-flow based systems in various domains to manage such issuesthem effectively.
We have begun developing a technology platform for small electric vehicles with a GVW of one ton or greater with the National Automotive Board, SIAM and other OEMs. In addition, our research and development activities also focus on developing vehicles running onthat consume alternative fuels, including CNG, liquefied petroleum gas, bio-diesel, and compressed air and electric cars.electricity. We are continuing to develop green-technology vehicles and are presently developing an electric vehicle on the Indica Vistaa small commercial vehicle platform. We are also pursuing alternative fuel options such as ethanol blending forblending. Furthermore, we are working on development of vehicles fueled by hydrogen.
We are also pursuing various initiatives, such as the introduction of premium lightweight architecture, to enable our business to comply with the existing and evolving emissions legislationlegislations in the developed world, which we believe will be a key enabler of both reduction in CO2 and further efficiencies in manufacturing and engineering.
InitiativesWe have implemented initiatives in the area of vehicle electronics, such as engine management systems, in-vehicle network architecture and multiplexed wiring,wiring. We are in the process of implementing electronic stability programs, automated and automatic transmission systems, telematics for communication and tracking, anti-lock braking systems and other emerging technological areas are also being pursued, which could possibly be deployed on our future range of vehicles.intelligent transportation systems. We have implemented new driver information technologies and high performance infotainment systems with IT enabled services. Likewise, various new technologies and systems including hybrid technologies that would improve the safety, performance and emissions of our product range and are being implemented in our passenger cars and commercial vehicles.
We are developing an enterprise levelenterprise-level vehicle diagnostics system for achievingwith global connectivity in order to achieve faster diagnostics of complex electronics in our vehicles in order to provide prompt service to customers. We are also developing prognostic data collection and analysis for failure prediction to the end customer. Furthermore, our initiative in telematics has spanned into a fleet management, driver information and navigation system, as well as asystems, and vehicle tracking system using Global Navigation Satellite Systems, or GNSS.global navigation satellite systems. We intend to incorporate Wi-Fi and Bluetooth interfaces in our vehicles to facilitate secure and controlled connectivity to third-party IT enabled devices.
We established a wholly-owned subsidiary, TMETC, in 2006, to augment the abilities of our ERC with an objective to obtain access to leading technologies to support our product development activities. In October 2010, we also acquired a design house in Italy, Trilix Srl, that has been working with us on many of our projects and which is now a part of the Tata Motors design organization.
Our Jaguar Land RoverRover’s research and development operations currently consist of a single engineering team, operating within co-managedare built around engineering facilities sharing premium technologies, power train designsthat feature an extensive test track, testing centers, design hubs and vehicle architecture. In our Jaguar Land Rover products, we are pursuing several initiatives including alternative energy technologies to meet the targeted reduction in CO2 emissions in the next 5 years. Over recent years, Jaguar Land Rover has made significant progress in reducing the development cycle times.a recently inaugurated virtual innovation center. The ERC in India and Jaguar Land RoverRover’s engineering and development operations in the United Kingdom have identified areas to leverage the facilities and resources to enhance the product development process and achieve economies of scale.
Jaguar Land Rover’s two design and development centers are equipped with computer-aided design, manufacturing and engineering tools configured to support an ambitious product development cycle plan. In recent years, Jaguar Land Rover has refreshed the entire Jaguar range under a unified concept and design language and has continued to enhance the design of Land Rover’s range of all-terrain vehicles. Jaguar Land Rover’s R&D operations look for synergies through sharing premium technologies, powertrain designs and vehicle architecture. The majority of Jaguar Land Rover’s products are designed and engineered in the United Kingdom. Jaguar Land Rover endeavors to implement the best technologies into its product range to meet the requirements of a globally competitive market and to comply with regulatory requirements. Jaguar Land Rover currently offers hybrid technology on some of its models such as the Range Rover and Range Rover Sport and conducts research and development related to the further application of alternative fuels and technologies to further improve the environmental performance of its vehicles, including the reduction of CO2 emissions.
We endeavor to absorb the best of technologies for our product range to meet the requirements of a globally competitive market. All of our vehicles and engines are compliant with the prevalent regulatory norms in the respective countries in which they are sold. Our strategy to invest and develop our development capabilities have helped us in attaining significant achievements such as the design and development of India’s first indigenously developed compact car, the segment creating mini- truck – the ‘Tata Ace’ and the world’s most affordable family car — the Tata Nano. In collaboration with our subsidiary TDCV, we developed the “World Truck”, now referred to as ‘Prima’, a sophisticated and contemporary M&HCV range with performance standards similar to those in developed markets, which we launched in India and in South Korea during Fiscal 2010. In Fiscal 2011, we launched the Tata Aria, India’s first premium crossover and the Tata Venture, a multipurpose van in India. In Fiscal 2013, we launched the Indigo Manza Club Class, the Vista D90, and the Safari Storme in the passenger cars segment and launched the Xenon Pickup, the Tata LPT 3723, and the Prima tipper and tractor variants in the commercial vehicle segment.
Intellectual Property
We create, own, and maintain a wide array of intellectual property assets throughout the world that are among our most valuable assets. Our intellectual property assets include patents, trademarks, copyrights designs, trade secrets and other intellectual property rights. Patents relate to our innovations and products; trademarks secured relate to our brands and products; copyrights are secured for creative content; and designs are secured for aesthetic features of products/components. We proactively and aggressively seek to protect our intellectual property in India and other countries.
We own a number of patents and have applied for new patents which are pending for grant in India as well as in other countries. We have also filed a number of patent applications outside India under the Patent Cooperation Treaty, which we expect will be effective in other countries going forward. We also obtain new patents as part of our ongoing research and development activities.
We own registrations for a number of trademarks and have pending applications for registration of these in India as well as other countries. The registrations mainly include trademarks for our vehicle models and other promotional initiatives. We use the Tata brand, which has been licensed to us by Tata Sons. We believe that establishment of the Tata word mark and logo mark in India and around the world is material to our operations. As part of our acquisition of TDCV, we have rights to the perpetual and exclusive use of the “Daewoo”Daewoo brand and trademarks in South Korea and overseas markets for the product range of TDCV.
As part of the acquisition of our Jaguar Land Rover business, ownership (or co-ownership, as applicable) of core intellectual property associated with Jaguar Land Rover was transferred to us.us; however such intellectual property is still ultimately owned by Jaguar Land Rover entities. Additionally, perpetual royalty freeroyalty-free licenses to use other essential intellectual property have been granted to us for use in Jaguar and Land Rover vehicles. Jaguar and Land Rover ownowns registered designs to protect the design of theirits vehicles in several countries.
In varying degrees, all of our intellectual property is important to us. In particular, the Tata, brand isJaguar, Land Rover and Range Rover brands are integral to the conduct of our business, a loss of which could lead to dilution of our brand image and have a material adverse effect on our business.
License(s)
On February 22, 2013, RBI released the final guidelines on granting new banking licenses in line with the Indian government’s aim to allow more companies to participate in the banking sector. On July 1, 2013, Tata Group applied to the RBI for a banking license. Tata Group, and in turn, the Company, may be required to reorganize the holding structure of its finance business in order to meet the eligibility requirements for obtaining a banking license, including by way of a divestment by the Company of its interest in TMFL. Any such reorganization or divestment of its financing business could have a material adverse effect on the Company’s financial condition and results of operations. As of the date of this annual report, RBI’s review of Tata Group’s application remains ongoing.
Components and Raw Materials
The principal materials and components required by us for use in Tata and other brand vehicles are steel sheets (forin-house stampings) and plates;plates, iron and steel castings and forgings;forgings, items such as alloy wheels, tires, fuel injection systems, batteries, electrical wiring systems, electronic information systems and displays;displays, interior systems such as seats, cockpits, doors, plastic finishers and plastic functional parts, glass and consumables, (paints,such as paints, oils, thinner, welding consumables, chemicals, adhesives and sealants)sealants, and fuels. We also require aggregates likesuch as axles, engines, gear boxes and cabscams for our vehicles, which are manufactured in-house or by our subsidiaries, affiliates, joint ventures or operations and strategic suppliers. We have long termlong-term purchase agreements for somecertain critical components such as transmissions and engines. We have established contracts with somecertain commodity suppliers to cover our own as well as our suppliers’ requirements in order to moderate the effect of volatility in commodity prices. We have also undertaken special initiatives to reduce material consumption through value engineering and value analysis techniques.
Our sourcing department in India has four divisions, namely, Purchasing, Supplier Quality, Supply Chain and Production and Planning Management or PPM. The reorganization was done with a view to establish and define responsibility and accountability in the sourcing department. Purchasing oversees the commercial aspects of product sourcing, Supplier Quality is primarily responsible for maintaining the quality of supplies that we purchase, Supply Chain oversees the logistics of the supply and delivery of parts for our vendors while PPM oversees execution of new projects.
As part of our strategy to become a low-cost vehicle manufacturer, we have undertaken various initiatives to reduce our fixed and variable costs. In India we started an e-sourcing initiative in 2002, pursuant to which we procure some supplies through reverse auctions. We also use external agencies as third party logistic providers. This has resulted in space and cost savings. Our initiatives to leverage information technology in supply chain activities have resulted in improved efficiency through real time information exchange and processing with our suppliers.
We have an established supplier quality improvementsixteen step process in order to ensure quality of outsourced components. We formalized the component development process using Automotive Industry Action Group guidelines. We also have a program for assisting vendors from whom we purchase raw materials or components to maintain quality. Each vendor is reviewed on a quarterly basis on parameters of quality, cost and delivery. Preference is given to vendors with TS 16949 certification. We also maintain a stringent quality assurance program that includes random testing of production samples, frequent re-calibration of production equipment and analysis of post-production vehicle performance, as well as an ongoing dialogue with workers to reduce production defects. Further, we have established a Strategic Sourcing Group to consolidate, strategize and monitor our supply chain activities with respect to major items of purchase as well as major inputs on new technology and services. The Strategic Sourcing Group is responsible for recommending the long-term strategy, purchase decisions, and negotiations and relationships with vendors with regard to these items. In addition, the Strategic Sourcing Group is responsible for formulating and overseeing our purchasing policies and norms, evolving guidelines for vendor quality improvement, vendor rating and performance monitoring and undertaking company-wide initiatives such as e-sourcing and supply chain management/policies with respect to vehicle spare parts.
We are also exploring opportunities for increasing the global sourcing of parts and components from low cost countries, and have in place a vendor management program that includes vendor base rationalization, vendor quality improvement and vendor satisfaction surveys. We have begun to include our supply chain in our initiatives on social accountability and environment management activities, including supply chain carbon footprint measurement and knowledge sharing on various environmental aspects.
The principal materials and components required by us for use in our Jaguar and Land Rover vehicles are steel and aluminum sheets, (for in-house stamping) or externally pre-stamped form, aluminum castings and extrusions, iron and steel castings and forgings, and items such as alloy wheels, tires, fuel injection systems, batteries, electrical wiring systems, electronic information systems and displays, leather trimmedleather-trimmed interior systems such as seats, cockpits and doors, plastic finishers and plastic functional parts, glass and consumables, (paints,such as paints, oils, thinner, welding consumables, chemicals, adhesives and sealants)sealants, and fuels. WeJaguar Land Rover also requirerequires certain criticalhighly functional components such as axles, engines and gear boxes for ourits vehicles, which are mainly manufactured by externalstrategic suppliers. We have long termlong-term purchase agreements for critical components such as transmissions with key suppliers.ZF Friedrichshafen AG and for engines with Ford and the Ford-PSA Peugeot Citroën joint venture, or the Ford-PSA joint venture. The components and raw materials used in ourJaguar Land Rover cars include steel, aluminum, copper, platinum and other commodities. We have entered intoJaguar Land Rover has established contracts with certain commodity suppliers, such as Novelis, to cover ourits own and ourits suppliers’ requirements to mitigate the effect of volatility in commodity prices.high volatility. Special initiatives wereare also undertaken to reduce material consumption through value engineering and value analysis techniques.
The Jaguar Land Rover business works with a range of strategic suppliers to meet itstheir requirements for parts and components. The Jaguar Land Rover business hascomponents, and we endeavor to work closely with our suppliers to form short- and medium-term plans for our business. We have established quality control programs to ensure that externally purchased raw materials and components are monitored and meet itsour quality standards. Jaguar Land Rover also outsources many of the manufacturing processes and activities to various suppliers. Where this is the case, Jaguar Land Rover provides training to the outside suppliers who design and manufacture the required tooling and fixtures. Such programs include on-sitesite engineers from Jaguar Land Rover who regularly interface with suppliers and carry out visits to supplier sites to ensure that they adhere to applicablerelevant quality standards. On-sitestandards are being met. Site engineers are also supported by persons in other functions, such as program engineers who interface with new model teams as well as resident engineers co-locatedlocated at Jaguar Land Rover plants, who provide the link between the on-sitesite engineers and the plants. Jaguar Land Rover plants.
Although we have commenced production of Ingenium four cylinder (2.0-liter) engines which will be installed in the Jaguar XE from 2015, at present we continue to source all of our engines from Ford or the joint venture between Ford and PSA on an arm’s-length basis.
Suppliers
We have an extensive supply chain for procuring various components. We also outsource many manufacturing processes and activities to various suppliers. In such cases, we provide training to external suppliers who design and manufacture the required tools and fixtures.
Our associate company, Tata AutoComp Systems Ltd., or TACO, manufactures automotive components and encourages the entry of internationally acclaimed automotive component manufacturers into India by setting up joint ventures with them. Some of these joint ventures includes : Tata Toyo Radiators Ltd for radiator assemblies, which supply components for our products in India.
Our other suppliers include some of the large Indian automotive supplier groups with multiple product offerings, such as the Anand Group, the Sona Group, and the TVS Group, as well as large multinational suppliers, such as Bosch, Continental, Delphi and Denso, Tata Johnson Controls Limited for seats Tataand Yazaki AutoComp Limited for wiring harnesses. We continue to work with our suppliers for our Jaguar Land Rover business to optimize procurements and enhance our supplier base, including for the sourcing of certain of our raw material and component requirements from low cost countries. Additionallyrequirements. In addition, the co-development of a few aggregates isvarious components, such as engines, axles and transmissions also beingcontinue to be evaluated, which we believe may lead to the development of a low costlow-cost supplier base for Jaguar Land Rover.
In India, we have established vendor parks in the vicinity of our manufacturing operations and vendor clusters have been formed at our facilities at Pantnagar (Uttarakhand) and Sanand (Gujarat).Sanand. This initiative is aimed at ensuring flowavailability of component supplies on a real-time basis, thereby reducing logistics and inventory costs as well as reducing uncertainties in the long distance supply chain. Efforts are being taken to replicate the model at new upcoming locations as well as a few existing plant locations.
As part of our pursuit of continued improvement in procurement, we have integrated our system for electronic interchange of data with our suppliers with the Enterprise Resource Planning.suppliers. This has facilitated real time information exchange and processing, which enables us to manage our supply chain more effectively.
We have established processes to encourage improvements viathrough knowledge sharing among our vendors through an initiative called the Vendor Council, consistingwhich consists of our senior executives and representatives of major suppliers. The Vendor Council also helps in addressing common concerns through joint deliberations. The Vendor Council works on four critical aspects of engagement between us and the suppliers (i.e.,suppliers: quality, efficiency, relationshiprelationships and new technology development).development.
We import some components that are either not available in the domestic market or when equivalent domestically-available components do not meet our quality standards. We also import products to take advantage of lower prices in foreign markets, such as special steels, wheel rims and power steering assemblies.
Ford has been and continues to be a major supplier of parts and services to Jaguar Land Rover. In connection with our acquisition of Jaguar Land Rover in June 2008, supplylong-term agreements have beenwere entered into with Ford, ranging in duration from seven to nine years, as further set out below:
Long term agreements have been entered with Ford for technology sharing and joint development providing technical support across a range of technologies focused mainly around power train engineering suchso that we may continue to operate according to our existing business plan. Supply agreements, ranging for duration of seven to nine years, were entered into with Ford for (i) the long term supply of engines developed by Ford, (ii) engines developed by us but manufactured by Ford and (iii) engines from the Ford-PSA co-operation.joint venture.
Based on learning fromFollowing the global financial crisis and its cascading effect on the financial health of our suppliers, we have commenced efforts to assess supplier financial risk.
Suppliers are appraised based on or long termour long-term requirements through a number of platforms such as Vendor Council meetings, council regional chapter meetings, national vendor meets and location-specific vendor meets.
Capital and Product Development Expenditures
Our capital expenditure totaled Rs.210,956Rs.335,771 million, Rs.147,164Rs.272,832 million and Rs.90,719Rs.212,078 million during Fiscal 2013, 20122015, 2014 and 2011,2013, respectively. Our capital expenditure during the past three Fiscal years related primarily to new product development and capacity expansion for new and existing products to meet market demand as well as investments towards improving quality, reliability and productivity that are each aimed at increasing operational efficiency.
We intend to continue to invest in our business units in general, and in research and product development in particular, over the next several years in order to improve our existing product range, develop new products and platforms and to build and expand our portfolio in the passenger vehicle and commercial vehicle categories. We believe this wouldwill strengthen our position in the Indian automotive market and help us to grow our market share internationally.
As part of this future growth strategy, we plan to make investments in product development, capital expenditure in capacity enhancement, plant renewal and modernization and to pursue other growth opportunities. Our subsidiaries also have their individual growth plans and related capital expenditure plans. These expenditures are expected to be funded largely through cash generated from operations, existing investible surplus in the form of cash and cash equivalents, investment securities and other external financing sources.
Other Operations
In addition to our automotive operations, we are also involved in other business activities, including information technology services. Net revenues, before inter-segment elimination, from these activities totaled Rs.22,179 million, Rs.18,905 million and Rs.14,916 million in Fiscal 2013, 2012 and 2011, respectively, representing nearly 1.2%, 1.1% and 1.2% of our total revenues before inter-segment elimination in the corresponding Fiscal periods.
Information Technology Services:
As of March 31, 2013, we owned a 72.32% equity interest in our subsidiary, TTL. TTL, founded in 1994 and a part of Tata Group, is a global leader in Engineering Services Outsourcing, and product development IT services solutions for PLM and Enterprise Resource Management, or ERM, to the world’s leading automotive, aerospace and consumer durables manufacturers and their suppliers. The Company’s services include product design, analysis and production engineering, knowledge-based engineering, PLM, ERM and CRM systems. The Company also distributes, implements and supports PLM products from leading solution providers in the world such as Dassault Systems and Autodesk.
TTL has its international headquarters in Singapore, with regional headquarters in the United States (Novi, Michigan), India (Pune) and the United Kingdom (Coventry). TTL has a combined global workforce of around 6,000 professionals serving clients worldwide from facilities in the North America, Europe and Asia-Pacific regions. TTL responds to customers’ needs through its subsidiary companies and through its three offshore development centers. TTL had eight functional subsidiary companies and one joint venture as of March 31, 2013.
The consolidated revenues of TTL for Fiscal 2013 were Rs.20,324 million (including sales to Tata Motors Group) reflecting a growth of 24.8% against Rs.16,291 million in the previous with traction in the automotive and aerospace markets. TTL recorded profit after tax of Rs.3,008 million in Fiscal 2013, reflecting growth of 42.8% over Rs.2,107 million in Fiscal 2012 resulting From higher offshore revenues and cost reduction measures implemented by TTL.
GovernmentGovernmental Regulations
Indian Automotive SectorGovernmental Regulations in India
Automotive Mission Plan, 2006-2016
The automotive mission plan, or Plan 2006, promulgated by the Ministry of Heavy Industries and Public Enterprises of the Government of India in December 2006, consists of recommendations to the task force of the Development Council on Automobile and Allied Industries constituted by the Government of India in relation to the preparation of the mission plan for the Indian automotive industry. Plan 2006 recommends that a negative list of items, such as no duty concessionconcessions for the import of used or re-manufacturedremanufactured vehicles, or treatment of remanufactured automotive products as old products, should be negotiated for free trade agreements or regional trade agreements, on a case-by-case basis with other countries. It recommends the adoption of appropriate tariff policies to attract more investment into the automobile industry, the improvement of power infrastructure to facilitate faster growth of the automotive sector both domestically and internationally, policy initiatives such as encouragement of collaboration between the automotive industry and research and academic institutions, tax concessions and incentives to enhance competitiveness in manufacturing and promotion of research and technology development. For the promotion of exports in the automotive components sector, among other things, it recommends the creation of special automotive component parks in special economic zones and the creation of virtual special economic zones, which would enjoy certain exemptions on sales tax, excise duty and customs duty. StrengtheningOther major recommendations of the plan include strengthening the inspection and certification system by encouraging public-private partnerships and rationalization of the motor vehicles regulations, are also among the major recommendations of the plan.regulations.
A committee set up under the chairmanship of the Secretary of the Ministry of Heavy Industries and Public Enterprises consisting of all stakeholders, including representatives of the Ministry of Finance, and of other interested parties relating to road transport, the environment, commerce, industrial policy and promotion, labor, shipping, railways, human resource development, science and technology, new and renewable energy, petroleum and natural gas and the automotive industry, will monitor the implementation and progress of Plan 2006.
As of the date of this annual report on Form 20-F, Plan 2006 is being reviewed by Ministry of Heavy Industries and Public Enterprises of the Government of India.
The Auto Policy, 2002
The Auto Policy was introduced by the Department of Heavy Industry, Ministry of Heavy Industries and Public Enterprises of the Government of India in March 2002, with the aims, among others,other things, of promoting a globally competitive automotive industry that would emerge as a global source for automotive components, establishing an international hub for manufacturing small, affordable passenger cars, ensuring a balanced transition to open trade at a minimal risk to the Indian economy and local industry, encouraging modernization of the industry and facilitating indigenous design, research and development, as well as developing domestic safety and environment standards on par with international standards.
Auto Fuel Vision & Policy 20032025
In 1992, the Government of India issued emission and safety standards, which were further tightened in April 1996, under the Indian Motor Vehicle Act. Currently Bharat Stage IV norms (equivalent to Euro IV norms) are in force for four wheelers in 13 cities and Bharat Stage III norms (equivalent to Euro III norms) are in effect in the rest of India. Our vehicles comply with these norms. The next change in emission regulations remains to be discussed by Government of India.
The Ministry of Road TransportPetroleum and HighwaysNatural Gas constituted an expert committee under the Chairmanship of GovernmentShri Saumitra Chaudhuri, Member Planning Commission, on December 19, 2012. Its objective was to recommend auto fuel quality applicable through model year 2025. The committee in its draft report has recommended Bharat Stage IV compliant fuel across the country by 2017 and Bharat Stage V compliant fuel with 10 ppm of Indiasulphur to be made available from 2020 onwards. The draft report proposes nationwide Bharat Stage V emission norms for new 4 wheelers from model year 2020 and for all 4 wheelers from model year 2021. It also recommends Bharat Stage VI emissions norms from 2024 onwards. In April 2014, the expert committee submitted its recommendations to the committee empowered by the Ministry of Petroleum and Natural Gas, which has set up a new task force to reviewproposed the Auto Fuel policy.advancement of emission norms by one year earlier than the expert committee’s recommendations, which would result in the implementation of Bharat Stage V emission norms starting in model year 2019 and Bharat Stage VI emissions norms starting in model year 2023.
Central Motors Vehicles Rules, 1989
Chapter V of the Central Motor Vehicle Rules, 1989, or the CMV rules, lays downRules, sets forth provisions relating to construction, equipment and maintenance of motor vehicles. Amongvehicles, including specifications pertaining tofor dimensions, gears, indicators, reflectors, lights, horns, safety belts and others. The CMV rulesRules govern emission standards for vehicles operating on compressed natural gas or CNG, gasoline, liquefied petroleum gas and diesel.
Additionally, pursuant toOn and from the date of commencement of the CMV rules,(Amendment) Rules, 1993, every manufacturer must also submit the prototype of every vehicle to be manufactured by it for testing by the Vehicle Research and Development Establishment of the Ministry of DefenceDefense of the Government of India, orthe Automotive Research Association of India, Pune, or the Central Machinery Testing and Training Institute, Budni (MP), or the Indian Institute of Petroleum, Dehradun, or the Central Institute of Road Transport, Pune, or the International Center for Automotive Technology, Manesar or such other agencies as may be specified by the central government for granting a certificate by that agency as to the compliance of provisions of the Motor Vehicles Act, 1988 and these rules.
In case of CNG fitments by vehicle manufacturers on new gasoline vehicles, each model manufactured must be of a type approved pursuant to the prevailing mass emission norms as applicable for the category of new vehicle in respect of the place of its use.CMV Rules.
The CMV Rules also require the manufacturers to comply with notifications in the Official Gazette, issued by central governmentGovernment of India, to use such parts, components or assemblies in the manufacture of such vehicle, of suchcertain vehicles according to standards as may be specified or the relevant standards as specified by either the Automotive Industry Standards Committee or the Bureau of Indian Standards.
The existing CMV Rules would be replaced by the Road Transport and Safety Bill (RTSB) 2015, which is subject to legislative approval by the Parliament, which could expose us to additional liability for vehicle recalls and for manufacturer’s liability for our vehicles.
Emission and Safety in India
In 1992, the Government of India issued emission and safety standards, which were further tightened in April 1996, under the Indian Motor Vehicle Act. Currently Bharat Stage IV norms, which are equivalent to Euro IV norms, are in force for four-wheelers in 13 cities and Bharat Stage III norms, which are equivalent to Euro III norms, are in effect in the rest of India. Our vehicles comply with these norms. In 2014, the Ministry of Road Transport and Highways has extended Bharat Stage IV norms in 20 additional cities. In its draft GSR No.247 (E), dated April 1, 2015, the Ministry of Road Transport and Highways proposed the further extension of Bharat Stage IV norms in 30 additional cities starting July 1, 2015.
We are also working towards meeting all applicable regulations which we believe are likely to come into effect in various markets in the near future. Our vehicle exports to Europe comply with Euro V norms, and we believe our vehicles also comply with the various safety regulations in effect in the other international markets where we operate.
The Indian automobile industry is progressively harmonizing its safety regulations with international standards in order to facilitate sustained growth of the Indian automobile industry as well as to encourage export of automobiles from India.
India has been a signatory to the 1998 UNECE Agreement on Global Technical Regulations since April 22, 2006 and has voted in favor of all eleven Global Technical Regulations. We work closely with the Government of India to participate in WP 29 World Forum Harmonization activities.
India has a well-established regulatory framework administered by the Indian Ministry of Road Transport and Highways. The Ministry issues notifications under the CMV Rules and the Motor Vehicles Act. Vehicles manufactured in India must comply with applicable Indian standards and automotive industry standards. In January 2002, the Indian Ministry of Road Transport and Highways has finalized plans on implementing on automobile safety standards. The plans are based on traffic conditions, traffic density, driving habits and road user behavior in India and is generally aimed at increasing safety requirements for vehicles under consideration for Indian markets.
The Essential Commodities Act, 1955
The Essential Commodities Act, 1955, as amended by the Essential Commodities (Amendment and Validation) Act, 2009, or the Essential Commodities Act, authorizes the Government of India, if it finds it necessary or expedient to do so, to provide for regulating or prohibiting the production, supply, distribution, trade and commerce in the specified commodities under the Essential Commodities Act, in order to maintain or increase supplies of any essential commodity or to secure their equitable distribution and availability at fair prices, or to secure any essential commodity for the defense of India or the efficient conduct of military operations. The definition of “essential commodity” under the Essential Commodities Act includes “component parts and accessories of automobiles”.
Environmental Regulations
Manufacturing units or plants must ensure compliance with environmental legislation, such as the Water (Prevention and Control of Pollution) Act, 1974, the Air (Prevention and Control of Pollution) Act, 1981, the Environment Protection Act, 1986 and the Hazardous Wastes (Management and Handling)Handling and Transboundary Movement) Rules, 1989.2008. The basic purpose of these statutes is to control, abate and prevent pollution. In order to achieve these objectives, Pollution Control Boards, or PCBs, which are vested with diverse powers to deal with water and air pollution, have been set up in each state. The PCBs are responsible for setting theestablishing standards for maintenance of clean air and water, directing the installation of pollution control devices in industries and undertaking inspection to ensure that units or plants are functioning in compliance with the standards prescribed. These authorities also have the power of search, seizure and investigation.
Our All of our manufacturing plants have receivedare either in possession of current, valid Consents to Operate and Hazardous Waste Authorisations or are in the process of obtainingrenewing their Consents to Operate and Hazardous Waste Authorisations from the Governmentrespective state PCBs of India’s environmental clearances required for our operations. We are fully committed to our role as a responsible corporate citizen with respect to reducing environmental pollution. We treat effluents at our plants and have made significant investments towards lowering the emissions from our products.
In addition, theThe Ministry of Environment and Forests conducts environment impact assessments. The Ministryunder the Government of India receives proposals for expansion, modernization and establishment of projects and the impact of such projects on the environment are assessed by the Ministry, before it grants environmental clearances for the proposed projects.projects under the Environmental Impact Assessment Notification and Rules. All of our manufacturing plants have obtained environmental clearances for specific projects in the past as and when mandated.
We ensure that all prescribed norms are followed for management of waste and we have made significant investments towards pollution control and environmental protection at our manufacturing plants.
Regulation of Imports and Exports
QuantitativeRegulation of quantitative restrictions on imports into India were removedliberalized with effect from April 1, 2001, pursuant to India’s World Trade Organization obligations, and imports of capital goods and automotive components were placed under the open general license category.
Automobiles and automotive components may, generally, be imported into India without a license from the Government of India subject to their meeting Indian standards and regulations, as specified by designated testing agencies. As a general matter, cars, UVs and SUVs in completely built up, or CBU, condition may be imported at 60% basic customs duty. However, cars with CIFcost, insurance and freight value of more than US$40,000 or with engine capacity morecapacities greater than 3000 cc3,000 cubic centimeters for diesel variantvariants and 2500 cc2,500 cubic centimeters for petrol variant,gasoline variants, may be imported at a 100% basic customs duty. Commercial vehicles may be imported at a basic customs duty of 10%20% and components may be imported at basic customs duty ranging from at 10% to 7.5% (for engine component).
The FDI Policy
Automatic approval for foreign equity investments up to 100% is allowed in the automobile manufacturing sector under the FDI Policy. See Item 10.D “—Exchange Controls” for additional information relating to restrictions on foreign investment under Indian law.
Indian Taxes
See Item 10.E “—Taxation” for additional information relating to our taxation.
Excise Duty:Duty
The Government of India imposes excise duty on cars and other motor vehicles and their chassis, which rates vary from time to time and across vehicle categories reflecting the policies of the Government of India. The chart below sets forth a summary of historical changes and the current rates of excise duty.
Change of Tax Rate | Excise Duty (per vehicle or chassis) | |||||||||||||||||||
| Small cars* | Cars other than small cars** | Motor vehicles for more than 13 persons | Chassis fitted with engines for vehicles of more than 13 persons | Trucks | Chassis with engines fitted for trucks | Safari, SUVs and UVs | ||||||||||||||
March 2008 | 12 | % | 22% or 22% + Rs. 15,000* | 12 | % | 12% + Rs. 10,000 | 14 | % | 14% + Rs. 10,000 | 20% + Rs. 20,000 | ||||||||||
December 2008 | 8 | % | - | 8 | % | 8% + Rs. 10,000 | 10 | % | 10%+ Rs. 10,000 | - | ||||||||||
March 2009 | - | - | - | - | 8 | % | 8% + Rs. 10,000 | - | ||||||||||||
July 2009 | - | - | - | - | - | - | 20% + Rs. 15,000 | |||||||||||||
February 2010 | 10 | % | - | 10 | % | 10% + Rs. 10,000 | 10 | % | 10% + Rs. 10,000 | 22% + Rs. 15,000 | ||||||||||
March 2012 | 12 | % | 24% or 27%* | 12 | % | 15% | 12 | % | 15% | 27% | ||||||||||
May 2012 | - | - | - | - | - | 14% | - | |||||||||||||
March 2013 | - | - | - | - | - | 13% | 27% or 30% | |||||||||||||
Change of Tax Rate | Excise Duty (per vehicle or chassis) | |||||||||||||||||||
| Small cars1 | Cars other than small cars2 | Motor vehicles for more than 13 persons | Chassis fitted with engines for vehicles of more than 13 persons | Trucks | Chassis fitted with engines for trucks | Safari, SUVs and UVs | ||||||||||||||
March 2012 | 12 | % | 24% or 27%1 | 12 | % | 15% | 12 | % | 15% | 27% | ||||||||||
May 2012 | - | - | - | 14% | - | 14% | - | |||||||||||||
March 2013 | - | - | - | - | - | 13% | 27% or 30% | |||||||||||||
February 2014 | 8 | % | 20% or 24%1 | 8 | % | 10% | 8 | % | 9% | 24% | ||||||||||
January 2015 | 12 | % | 24% or 27%1 | 12 | % | 14% | 12 | % | 13% | 27% or 30% | ||||||||||
March 2015 onwards | 12.50 | % | - | 12.50 | % | - | 12.50 | % | - | - | ||||||||||
| Small cars |
| Cars other than small cars |
| (-) | indicates no change during the relevant year. |
All vehicles /and chassis are subjected to Automobile Cessthe automobile cess, which is assessed at 0.125%, Education Cess assessed at 2% and Secondary and Higher Education Cess assessed at 1% in addition to the excise duty indicated above.. Certain passenger vehicles are also subject to the National Calamity Contingent Duty, or NCCD, assessed at 1%. The education cess, assessed at 2%, and secondary and higher education cess, assessed at 1%, in addition to the excise duties indicated above, are exempted on goods starting March 1, 2015.
ValuedValue Added Tax:Tax
The Value Added Tax, or VAT, has been implemented throughout India. VAT enables set-off from sales tax paid on inputs by traders and manufacturers against the sales tax collected by them on behalf of the Government of India, thereby eliminating the cascading effect of taxation. Two main brackets of 5% and 12.5%, along with special brackets of 0%, 1%, 3%, 4%, 13.5%, 14% 14.5%, 15%, 20%, 22% and 23% have been announced for various categories of goods and commodities sold in the country and certain states have also introduced additional VAT of 1% to 3% on specified commodities, including automobiles. In some of the states, a surcharge of 5% to 10% on VAT has been introduced on automobiles. Since its implementation, VAT has had a positive impact on us.our business. Prior to the implementation of VAT, a major portion of sales tax paid on purchases formed part of our total cost of materials. However, theThe implementation of VAT has resulted in savings on the sales tax component, as VAT paid on inputs may generally be set-off against tax paid on outputs.
In addition to VAT, a Central Sales Tax however, continues to exist, although it is proposed to be abolished in a phased manner. In the Indian Union Budget 2008-09, the Central Sales Tax rate was reduced to 2%, which remained unchanged forin Fiscal 2013.2015.
Goods and Services Tax:Tax
The Government of India is proposing to reform the indirect tax system in India with a comprehensive national goods and services tax, or GST, covering the manufacture, sale and consumption of goods and services. The date of introduction of GST is not yet known.expected to be as early as April 1, 2016. The proposed GST regime will combine taxes and levies by the central and state governments into one unified rate structure. There is a proposal to levy a 1% Non-Creditable Tax to be collected by the Government of India and will be appropriated to the origin state government on every interstate movement of goods. The Government of India has publicly expressed the view that following the implementation of the GST, the indirect tax on domestically manufactured goods is expected to decrease along with prices on such goods.
We have benefitted and continue to benefit from excise duty exemptions for manufacturing facilities in the state of Uttarakhand and other incentives such as subsidies or loans from other states where we have manufacturing operations. While both the Government of India and other state governments of India have publicly announced that all committed incentives will be protected following the implementation of the GST. GivenGST, given the limited availability of information in the public domain concerning the GST, we are unable to provide any assurance as to the effect of this or any other aspect of the tax regime following implementation of the GST.
Direct Tax Code:
The Direct Tax Code Bill 2010, or DTC, proposes to replace the existing Income Tax Act, 1961Imposition of any additional taxes and other direct tax laws, with a view to simplify and rationalize the tax provisions into one unified code. The various proposals included in DTC bill are subject to review by Indian parliament and as such impact if any, is not quantifiable at this stage.
Insurance Coverage:
The Indian insurance industry is predominantly state-owned and insurance tariffs are regulatedlevies by the Indian Insurance Regulatory and Development Authority. We have insurance coverage which we consider reasonably sufficientGovernment of India designed to cover all normal risks associated withlimit the use of automobiles could adversely affect the demand for our operations (including business interruptions) and which we believe are in accordance with industry standards in India. We have obtained coverage for product liability for some of our vehicle models in several countries to which we export vehicles. TDCV has insurance coverage as is required and applicable to cover all normal risks in accordance with industry standards in South Korea, including product liability. We have also taken insurance coverage on Directors and Officers liability to minimize risks associated with international litigations for usproducts and our subsidiaries.
Jaguar Land Rover has global insurance coverage which we consider to be reasonably sufficient to cover normal risks associated with our operations and insurance risks (including property, business interruption, marine and product/general liability) and which we believe is in accordance with commercial industry standards and statutory requirements.results of operations.
Economic Stimulus Package and Incentives:Incentives
In January 2009, the Government of India announced an economic stimulus package targeting the automotive industry. Public sector banks were encouraged to fund the automotive sector along with providing a line of credit to non-bank financial companies, specifically aimed at commercial vehicles. The states were to be provided a onetime assistance to purchase 15,000 buses for their urban transport systems.
There was a 4% cut in the central value added tax rate, or Cenvat, on cars and trucks and a 2% cut in Cenvat rate on motor vehicles for transport of more than 13 persons, including the driver. Further, in February 2009, the Cenvat rate was reduced from 10% to 8% for Trucks and buses and service tax was also reduced from 12% to 10%. The Government of India has also provided for an accelerated tax depreciation of 50% for commercial vehicles purchased between January 1 and September 30, 2009. The Cenvat rate was restored to 10% since April 1, 2010 and was further revised to 12% with effect from March 16, 2012. The Government of India has made changes in the excise duty in February 2014 which will be in effect until December 31, 2014 as follows: the Cenvat on small cars, trucks and buses reduced to 8% in February, 2014 whereas Cenvat on cars other than small cars has been reduced to 20% or 24% from 24% or 27%. The Cenvat on UVs have been reduced from 27% or 30% to 24%. The Cenvat for chassis which was increased from 12% to 14% in the budget for the Indian fiscal year 2012-2013, has since been revised to 13% in the budget for the Indian fiscal year 2013-2014.
In the United Kingdom, interest rates have been maintained at an historic low of 0.5% since March 2009, interest rates have been kept at this level2013-2014 and further reduced to 9% in order to provide stimulus to the economy. The European Central Bank increased its base rate to 1.25% in April 2011, following no changes for just under two years, in response to the risk of accelerating inflation. Within Europe there is still concern regarding the sovereign debt issues within Greece, Ireland, Portugal, Spain and Italy. Continued high unemployment in the US has led to the use of fiscal stimuli, quantitative easing and lower interest rates despite positive GDP outlook, which could lead to higher inflation.
In June 2010, the Chinese government announced a subsidy program of RMB3,000 for each energy-conserving passenger vehicle with an engine capacity of 1.6 liters or less. The Government of China also provided a subsidy for private purchases of new energy vehicles (hybrid electric vehicle up to RMB 50,000 and battery electric vehicle up to RMB 60,000) along with additional subsidy from local government. Furthermore, a ten-year Development Plan for the Energy-Saving and New Energy Vehicle Industry was approved and will be the blueprint for China automotive industry development until 2020.
For emission reduction and environmental protection, China plans to adopt Fuel Consumption Stage III with stringent fuel economy requirements soon. It requires automakers to invest in and accelerate development of smaller and more fuel efficient vehicles for the Chinese automotive market.February 2014.
The Government of India has launched a National Electric Mobility Mission plan 2020, or NEMMP, to encourage reliable, affordable and efficient Electric Vehicleselectric vehicles that meet consumer performance and price expectations. Through collaboration between the government and industry for promotion and development of indigenous manufacturing capabilities, required infrastructure, consumer awareness and technology, the NEMMP aims to help India to emerge as a leader in the Electric Vehicleelectric vehicle market in the world by 2020 and contribute towards National Fuelnational fuel security.
Furthermore, the Ministry of Road Transport & Highways and the Bureau of Energy Efficiency in India finalized labeling regulations for the M1 category of vehicles, which includes passenger vehicles up to, less than, or equal to 10 seats.
The Government of India’s plan to encourage India’s transition to hybrid /and electric mobility consists of the following initiatives:
Demand Side: Mandate use of electric vehicles in areas such as public transportation and government fleets in order to create initial demand for OEMs and provide incentives for the sales of electric vehicles to consumers.
Supply Side: Link incentives to localization of the production of key components of electric vehicle in a phased manner.
Research and Development: Fund research and development programs along with OEMs and component suppliers to develop optimal solutions for India at low cost.
Infrastructure Support: Development of pilot programs to support hybrid and/or electric vehicles and test their effectiveness and make modest investments to build public charging infrastructure to support electric vehicles, especially for buses.
Environmental, Fiscalfiscal and Other Governmentalother governmental regulations around the world:world
Our Jaguar Land Rover business has significant operations in the United States and Europe, which have stringent regulations relating to vehicular emissions. The proposed tightening of vehicle emissions regulations by the European Union will require significant costs of compliance for Jaguar Land Rover. While we are pursuing various technologies in order to meet the required standards in the various countries in which we operate, the costs of compliance with these required standards can be significant to our operations and may adversely impact our results of operations.
In the United Kingdom, the Bank of England base (interest) rate has been maintained at an historic low of 0.5% despite an improvement in the UK economy. The UK labor market is strengthening as unemployment continues to fall and wages rise while inflation remains low primarily reflecting low energy prices. As a result the outlook is generally positive for UK GDP as higher levels of disposable income are expected to drive consumption and the Bank of England is likely to keep interest rates lower for longer as inflation remains subdued.
Economic growth in the Eurozone remained low during Fiscal 2015 and some member states experienced mild recession. In response the European Central Bank embarked on a quantitative easing program in January 2015 and there are signs of growth as a result; however uncertainty remains over the outcome of the debt negotiations with Greece.
The U.S. economy continues to strengthen despite the adverse effects of another harsh winter impacting in the first three months of 2016. The U.S. Federal Reserve continues to taper off its quantitative easing program and, similarly to the United Kingdom, improving labor market conditions along with lower energy prices are driving increased consumption. The U.S. Federal Reserve also held interest rates at historical lows at around 0.25% during Fiscal 2015 while rates are likely to rise gradually in the near term as confidence in the stronger economic recovery gains momentum.
Greenhouse gas / CO2 / fuel economy legislation:legislation
Legislation is now in place limiting the manufacturerpassenger car fleet average greenhouse gas emissions in Europe to 130 grams of CO2 per kilometer for 100% of new cars in 2015. Different targets apply to each manufacturer based on their respective fleets of vehicles and average weight. We have received a permitted derogation from the weight-based target requirement available to small volume and niche manufacturers. As a result, we are permitted to reduce our emissions by 25% from 2007 levels rather than meeting a specific CO2 emissions by 2015. Jaguar Land Rover now has an overall 2015 target of an average of 178.0 grams of CO2 per kilometer for our full fleet of vehicles registered in the EU that year, with Jaguar Land Rover and Tata Motors Limited monitored as a single “pooled” entity for compliance with this target (for Jaguar Land Rover alone, this would be 179.8 g/km). We are in compliance with the 2013 requirement that the best 75% of our pooled fleet registered in the EU that year has met this target and the 2014 requirement that the best 80% of our pooled fleet registered in the EU has met this target, achieving an average 164.5 grams of CO2 per kilometer and 165.3 grams of CO2 per kilometer (provisional) in calendar 2013 and 2014, respectively.
Furthermore, the European Union has regulated target reductions for 95% of a manufacturer’s full fleet of new passenger cars starting January 2012. Similarly,registered in the U.S. federal government imposesEU in 2020 to average 95 grams of CO2 per kilometer, rising to 100% in 2021. The new rule contains an extension of the small volume and niche manufacturers’ derogation which permits us to reduce our emissions by 45% from 2007 levels rather than meet a specific CO2 emissions target by 2020. Jaguar Land Rover could apply for an overall target of 132 grams of CO2 per kilometer.
The European Union has also adopted an average emissions limit of 175 grams of CO2 per kilometer for light commercial vehicles to be phased in between 2014 and 2017. Implementation of light commercial vehicle CO2 standards affect the Defender and a small number of Freelander and Discovery vehicles. We have been granted a small volume derogation by the European Commission for alternative specific emission targets for 2014-2016 inclusive, which protects the Defender through to end of manufacturing. A further average emissions limit of 147 grams of CO2 per kilometer for light commercial vehicles has been adopted for 2020.
In the United States, both Corporate Average Fuel Economy, or CAFE, standards and greenhouse gas emissions standards that applyare imposed on manufacturers of passenger cars and light trucks. The National Highway Traffic Safety Administration, or NHTSA, has set the federal CAFE standards for passenger cars and light trucks to 2012-2016meet an estimated combined average fuel economy level of 35.5 miles per U.S. gallon for 2016 model year vehicles. Meanwhile, the U.S. Environmental Protection Agency, or EPA, and NHTSA issued a joint rule to reduce the average greenhouse gas emissions from passenger cars, light trucks and medium-duty passenger vehicles for model years 2012-16 to 250 grams of CO2 per mile, which would be equivalent to 35.5 miles per U.S. gallon in model year 2016 if the requirements were met only through fuel economy improvements. The United States federal government extended this program to cars and light trucks for model years 2017 through 2025, targeting an estimated combined average emissions level of 243 grams of CO2 per mile in 2017 and 163 grams per mile in 2025, which is equivalent to 54.5 miles per gallon if achieved exclusively through fuel economy improvements. In addition, many other markets either have or will shortly define similar greenhouse gas emissions standards (some of these include(including Brazil, Canada, China, the European Free Trade Association, India, Japan, Mexico, Saudi Arabia, South Korea Switzerland, Australia, and South Africa)Switzerland).
California is empowered to implement more stringent greenhouse gas emissions standards but has elected to accept the existing U.S. federal standards for compliance with the state’s own requirements. The California Air Resources Board enacted regulations that deem manufacturers of vehicles for model years 2012 through 2016 that are in compliance with the EPA greenhouse gas emissions regulations to also be in compliance with California’s greenhouse gas emission regulations. In Europe, implementationNovember 2012, the California Air Resources Board accepted the federal standard for vehicles with model years 2017-25 for compliance with the state’s own greenhouse gas emission regulations. However, California is moving forward with other stringent emission regulations for vehicles, including the Zero Emission Vehicle regulation, or ZEV. ZEV requires manufacturers to increase their sales of LCV CO2 standards would impactzero emissions vehicles year-on-year, up to an industry average of 16% of vehicles sold in the Defender and a small number of Freelander and Discovery vehicles. In India, fuel efficiency labeling legislation is being finalizedstate by the Ministry of Road Transport and Highways and the Bureau of Energy Efficiency, under the Ministry of Power. This matter is also being discussed under the Auto Policy committee2025. The precise sales required in order to createmeet a framework for implementationmanufacturer’s obligation in 2025.
In Europe, monetary fines are imposed as penalties for non-compliance with emissions standards. Inany given model year depend on the United States, noncompliance results in monetary fines and can result in market exclusion.
California is currently developing a new zero emissions vehicle regulation mandating increased penetration of electric and plug in hybrid electric vehicles from 2018 Model Year above that are more stringent than the requirementssize of the U.S. federal greenhouse gas standards.manufacturer and the level of technology sold (for example, transitional zero emission technologies, such as plug-in hybrids, can account for at least a proportion of a manufacturer’s obligation, but these technologies earn compliance credits at a different rate from pure zero-emissions vehicles). Other compliance mechanisms are available under ZEV, such as banking and trading of credits generated through the sale of eligible vehicles.
Jaguar Land Rover undertakesWe are fully committed to meeting these standards and technology deployment plans incorporated into cycle plans are directed to achieving these standards. These plans include the use of lightweight materials, including aluminum, which will contribute to the manufacture of lighter vehicles with improved fuel-efficiency,fuel efficiency, reducing parasitic losses through the driveline and improvements in aerodynamics. They also include the development and installation of smaller engines in our existing vehicles and other drive traindrivetrain efficiency improvements, including the introduction of eight-speed or nine-speed transmissions in some of our vehicles. We also plancontinue to introduce smaller vehicles commencing withsuch as the introduction of the Range Rover Evoque, theJaguar XE, our most fuel-efficient vehicle in the Land Rover line-up.Jaguar yet. The technology deployment plans also include the research, development and deployment of hybrid electric vehicles initially in Europe and the United States, whichhybrid-electric vehicles. These technology deployment plans require significant investment. Additionally, local excise tax initiatives are also a key consideration in ensuring our products meet customer needs for environmental footprint and cost of ownership concerns.concerns as well as continued access to major city centers, such as London’s Ultra Low Emission Zone and similar low emissions areas being contemplated in Paris, Berlin and Beijing.
Non-greenhouse gas emissions legislation:Existinglegislation
The European Union 5, or EU5 regulations and planned EU6 and EU7 regulationshas adopted the latest in Europe, and existing Low Emission Vehicle 2, or LEV2 regulations and planned LEV3 regulations in California, place ever stricter limits on particulatea series of more-stringent standards for emissions oxides of nitrogen and hydrocarbons forother air pollutants from passenger and light dutycommercial vehicles, such as nitrogen oxides, carbon monoxide, hydrocarbons and particulates. These standards have been or are being phased in from September 2009 (Euro 5) and September 2014 (Euro 6b) and September 2017 (Euro 6c) for passenger cars and from September 2010 (Euro 5), September 2015 (Euro 6b) and September 2018 for light commercial vehicles. September 2015 will see the adoption of driving emissions monitoring, while September 2017 will see such monitoring become mandatory along with a move to the new Worldwide harmonised Light-duty Test Procedure, or WLTP, coincident with Eu6c in Europe to address global concerns on more customer correlated fuel economy certified levels as well as air quality concerns, with other markets to follow. All programs are being fully engineered to enable the adoption of these new requirements.
In the United States, existing California Low-Emission Vehicle regulations and the recently adopted LEV III regulations, as well as the state’s ZEV regulations, place ever-stricter limits on emissions of particulates, nitrogen oxides, hydrocarbons, organics and greenhouse gases from passenger cars and light trucks. These regulations require ever increasingever-increasing levels of technology in engine control systems, on-board diagnostics and after treatment systems that increaseaffecting the base costs of our power trains.powertrains. The new California LEV3 and ZEV regulations cover model years 2015 to 2025. Additional stringency of such evaporative emissions regulations also require more advancedrequires more-advanced materials and joints solutions to eliminate fuel evaporative losses, all for much longer warrantedwarranty periods (up to 150,000 miles in the United States).
In addition, in April 2014, the Tier 3 Motor Vehicle Emission and Fuel Standards issued by the EPA were finalized. With Tier 3, the EPA has established more stringent vehicle emissions standards broadly aligned to California’s LEV III standards for 2017 to 2025 model year vehicles. The EPA made minor amendments to these Tier 3 standards in January 2015.
While Europe and Californiathe United States lead the implementation of these emissions programs, other nations and states tend totypically follow on with adoption of thesesimilar regulations withintwo to four years thereafter. For example, China’s Stage III fuel consumption regulation targets a short period thereafter.national average fuel consumption of 6.9L/100km by 2015 and its Stage IV targets a national average fuel consumption of 5.0L/100km by 2021. In response to severe air quality issues in Beijing and other major Chinese cities, the Chinese government also intends to adopt more stringent emissions standards beginning in 2016.
To comply with the current and future environmental laws, rules, regulations and standards,norms, we may have to incur substantial capital expenditureexpenditures and research and development expenditure,expenditures to upgrade products and manufacturing facilities, which would have an impact on our cost of production and results of operation.
Imposition of any additional taxes and levies by the Government of India designed to limit the use of automobiles could adversely affect the demand for our products and our results of operations.
Noise legislation
The European Commission adopted new rules (which apply to new homologations from July 2016) to reduce noise produced by cars, vans, buses, coaches and light and heavy trucks. Noise limit values would be lowered in two steps of each twoA-weighted decibels for vehicles other than trucks, and one A-weighted decibel in the first step and two in the second step for trucks. Compliance would be achieved over a ten-year period from the introduction of the first phase.
Vehicle safety:safety
Vehicles sold in Europe are subject to vehicle safety regulations established by the European Union or by individual member states.Member States. In 2009, the European Union enacted a new regulation to establish a simplified framework for vehicle safety, repealing more than 50 existing directives and replacing them with a single regulation aimed at incorporating relevant United Nations standards. Further new regulations on advanced safety systems are to be introduced. The incorporation of the United Nations standards commenced in 2012, and the European Commission plans to require (i)requires new model cars from 2011 to have electronic stability control systems; (ii) to introducesystems, has introduced regulations relating to low-rolling resistance tires, in 2013; (iii) to requirerequires tire pressure monitoring systems starting in 2012; and (iv) to requirerequires heavy vehicles to have advanced emergency braking systems and lane departure warning systems from 2013.systems. From April 2009, the criteria for whole vehicle type approval were extended to cover all new road vehicles, to be phased in over five years depending on vehicle category. The extension clarifies the criteria applicable to small commercial vehicles. In the European Union, new safety requirements came into force from November 2012 for new vehicle types and come into force in November 2014 for all new vehicles sold in the EU market. The new mandatory measures include safety belt reminders, electric car safety requirements, easier child seat anchorages, tire pressure monitoring systems and gear shift indicators.
In the United States, the National Highway Traffic Safety Administration, or NHTSA issues federal motor vehicle safety standards covering a wide range of vehicle components and systems such as airbags, seatbelts, brakes, windshields, tires, steering columns, displays, lights, door locks, side impact protection and fuel systems. We are required to test new vehicles and equipment and assure their compliance with these standards before selling them in the United States. We are also required to recall vehicles found to have defects that present an unreasonable risk to safety or which do not conform to the required Federal Motor Vehicle Safety Standards, and to repair them without charge to the owner. The financial cost and impact on consumer confidence of such recalls can be significant depending on the repair required and the number of vehicles affected. We have no pending investigations relating to alleged safety defects or potential compliance issues pending before the NHTSA.
These standards add to the cost and complexity of designing and producing vehicles and equipment. In recent years the NHTSA has mandated, among other things:
aA system for collecting information relating to vehicle performance and customer complaints, and foreign recalls to assist in the early identification of potential vehicle defects as required by the Transportation Recall Enhancement, Accountability, and Documentation (TREAD) Act; and
enhancedEnhanced requirements for frontal and side impact, including a lateral pole impact.
Furthermore, the Cameron Gulbransen Kids Transportation Safety Act of 2007 or Kids(Kids and Cars Safety Act,Act), passed into law in 2008, and requires the NHTSA to enact regulations related to rearward visibility and brake-to-shift interlock and requires the NHTSA to consider regulating the automatic reversal functions on power windows. The costs to meet these proposed regulatory requirements may be significant.
Vehicle safety regulations in Canada are similar to those in the United States. However,States; however, many other countries have vehicle regulatory requirements which differ from those in the United States. The differing requirements among various countries createscreate complexity and increasesincrease costs such that the development and production of a common product that meets the country regulatory requirements of all countries is not possible. Global Technical Regulations, or GTRs, developed under the auspices of the United Nations, continue to have an increasing impact on automotive safety activities, as indicated by EU legislation. In 2008, Global Technical RegulationsGTRs on electronic stability control, head restraints and pedestrian protection were each adopted by the UN World“World Forum for the Harmonization of Vehicle Regulations,Regulations”, and are now in different stages of national implementation. While global harmonization is fundamentally supported by the automobile industry in order to reduce complexity, national implementation may still introduce subtle differences into the system.
At present, India is a signatory of the 1998 UNECE Agreement on Global Technical Regulations, which makes the global technical regulations alternate standards to national regulations. The transition of finalized global technical regulations into national standards remains in progress.
Insurance Coverage
The Indian insurance industry is predominantly state-owned and insurance tariffs are regulated by the Indian Insurance Regulatory and Development Authority. We have insurance coverage which we consider reasonably sufficient to cover all normal risks associated with our operations, including business interruptions, and which we believe are in accordance with industry standards in India. We have obtained coverage for product liability for some of our vehicle models in several countries to which we export vehicles. TDCV has insurance coverage as is required and applicable to cover all normal risks in accordance with industry standards in South Korea, including product liability. We have also taken insurance coverage on directors and officers liability to minimize risks associated with international litigation for us and our subsidiaries.
Jaguar Land Rover has global insurance coverage which we consider to be reasonably sufficient to cover normal risks associated with our operations and insurance risks, including property, business interruption, marine and product/general liability and which we believe is in accordance with commercial industry standards and statutory requirements.
We are insured by insurers of recognized financial standing against such losses and risks and in such amounts as are prudent and customary in the business in which it is engaged. All such insurance is in full force and effect.
We are able to renew our existing insurance coverage, as and when such policies expire or to obtain comparable coverage from similar institutions as may be necessary or appropriate to conduct its business, as now conducted.
Export Promotion Capital Goods:Goods
Since Fiscal 1997, we have benefited from participation in the Export Promotion Capital Goods Scheme, or the EPCG Scheme, which permits us to import capital equipment under a special license at a substantially reduced customs duty. Our participation in this scheme is subject to us fulfilling an obligation to export goods manufactured or produced by the use of capital equipment imported under the EPCG Scheme to the value of a multiple of the cost plus insurance and freight value of these imports or customs duty saved over a period of 6, 8 and 12 years from the date of obtaining the special license. We currently hold 92101 licenses which require us to export our products of a value of approximately Rs.71.71Rs.81.19 billion between the years 2002 to 2019,2021, and we carefully monitor our progress in meeting our incremental milestones. After fulfilling some of the export obligations as per provisions of Foreign Trade Policy, as onat March 31, 20132015 we have remaining obligations to export products of a value of approximately Rs.4.66Rs.7.09 billion by March 2019.2021. In the event that the export obligation under the EPCG Scheme is not fulfilled, we would have to pay the differential between the reduced and normal duty on the goods imported along with interest. In view of our past record of exceeding our export milestones, and our current plans with respect to our export markets, we do not currently foresee any impediments to meeting our export obligation in the required time frame.
Legal ProceedingsOther Operations
In addition to our automotive operations, we are also involved in other business activities, including information technology services. Net revenues, before inter-segment elimination, from these activities totaled Rs.27,152 million, Rs.24,989 million and Rs.22,179 million in Fiscal 2015, 2014 and 2013, respectively, representing nearly 1.0%, 1.1% and 1.2% of our total revenues before inter-segment elimination in the normal coursecorresponding Fiscal periods.
Information Technology Services
As at March 31, 2015, we owned a 72.32% equity interest in our subsidiary, TTL. TTL, founded in 1994 and a part of business,Tata Motors Group, provides product development IT services solutions for PLM and Enterprise Resource Management, or ERM, to automotive, aerospace and consumer durables manufacturers and their suppliers. TTL’s services include product design, analysis and production engineering, knowledge-based engineering, PLM, ERM and CRM systems. TTL also distributes, implements and supports PLM products from leading solution providers in the world such as Dassault Systems and Autodesk.
TTL has its international headquarters in Singapore, with regional headquarters in the United States, India and the United Kingdom. In Fiscal 2014, TTL acquired Cambric Corporation, an engineering services organization, to achieve greater domain expertise and presence in the industrial equipment sector. TTL has a combined global workforce of around 7,804 professionals serving clients worldwide from facilities in the North America, Europe, and Asia Pacific regions. TTL responds to customers’ needs through its subsidiary companies and through its offshore development centers in India, Thailand and Romania. TTL had 14 functional subsidiary companies and one joint venture as at March 31, 2014.
The consolidated revenues of TTL increased by 10.3% in Fiscal 2015 to Rs.26,170 million (including sales to Tata Motors Limited and its consolidated subsidiaries) from Rs.23,724 million in Fiscal 2014 due to operations in the automotive and aerospace markets. TTL recorded profit after tax of Rs.3,349 million in Fiscal 2015, reflecting an increase of 26.8% over Rs.2,642 million in Fiscal 2014.
Research and Development
Over the years, we face claimshave devoted significant resources towards our research and assertionsdevelopment activities. Our research and product development costs in Fiscal 2015, 2014 and 2013 were Rs. 28,515.3 million, Rs. 25,651 million and Rs. 20,340 million, respectively. Our research and development activities focus on product development, environmental technologies and vehicle safety. In India, our Engineering Research Centre, or ERC, established in 1966, is one of the few in-house automotive research and development centers in India recognized by the Government of India. The ERC is integrated with all of the Tata Motors Global Automotive Product Design and Development Centers in South Korea, Italy and the United Kingdom. In addition to this, we leverage key competencies through various parties. engineering service suppliers and design teams of its suppliers.
We assess such claimshave a new passenger car electrical and assertionselectronics facility for the development of hardware-in-the-loop systems, labcars and monitorinfotainment systems to achieve system and component integration. We have an advance engineering workshop, with a lithium-ion battery module, for the legaldevelopment of electric vehicle and hybrid products. We have a crash test facility for passive safety development in order to meet regulatory and consumer group test requirements and evaluate occupant safety, which includes a full vehicle-level crash test facility, a sled test facility for simulating the crash environment on subsystems, a pedestrian safety testing facility, a high strain rate machine and a pendulum impact test facility for goods carrier vehicles. This facility is also supported with computer-aided engineering infrastructure to simulate tests in a digital environment. Our safety development facilities also incorporate other equipment that we believe will help improve the safety and design of our vehicles, such as an ongoing basis,emission labs engine development facility, a testing facility for developing vehicles with lower noise and vibration levels, an engine emission and performance development facility and an eight poster test facility that helps to assess structural durability of M&HCVs. In addition, we are installing a new engine noise test facility and transmission control unit which we expect will aid in powertrain development. Other key facilities include a full vehicle environmental testing facility, material pair compatibility equipment, corrosion test facility, heavy duty dynamometers and aggregate endurance test rigs.
Our product design and development centers aim to create a highly scalable digital product development and virtual testing and validation environment, targeting a reduction in product development cycle-time, improved quality and the ability to create multiple design options. Global design studios are key part of our product conceptualization strategy. We have aligned our end-to-end digital product development objectives and infrastructure with our business goals and have made significant investments to enhance our capabilities, especially in the areas of product development through computer-aided design, computer aided manufacturing, computer-aided engineering, knowledge-based engineering, product lifecycle management and manufacturing planning. In specific engineering review processes, such as digital mock-up and virtual build and validation, we have been able to provide capabilities for reduced time and increased quality in product designs. The design IP is managed through a product lifecycle management system, enabling backbone processes, and we have institutionalized “issue tracking” work-flow based systems in various domains to manage them effectively.
We have begun developing a technology platform for small electric vehicles with a GVW of one ton or greater with the assistanceNational Automotive Board, SIAM and other OEMs. In addition, our research and development activities also focus on developing vehicles that consume alternative fuels, including CNG, liquefied petroleum gas, bio-diesel, compressed air and electricity. We are continuing to develop green-technology vehicles and are presently developing an electric vehicle on a small commercial vehicle platform. We are also pursuing alternative fuel options such as ethanol blending. Furthermore, we are working on development of external legal counsel where appropriate. vehicles fueled by hydrogen.
We recordare also pursuing various initiatives, such as the introduction of premium lightweight architecture, to enable our business to comply with the existing and evolving emissions legislations in the developed world, which we believe will be a liabilitykey enabler of both reduction in CO2 and further efficiencies in manufacturing and engineering.
We have implemented initiatives in vehicle electronics, such as engine management systems, in-vehicle network architecture and multiplexed wiring. We are in the process of implementing electronic stability programs, automated and automatic transmission systems, telematics for any claims where a potential loss is probablecommunication and capabletracking, anti-lock braking systems and intelligent transportation systems. We have implemented new driver information technologies and high performance infotainment systems with IT enabled services. Likewise, various new technologies and systems including hybrid technologies that would improve the safety, performance and emissions of our product range and are being estimated and disclose such mattersimplemented in our financial statements, if material. For potential lossespassenger cars and commercial vehicles.
We are developing an enterprise-level vehicle diagnostics system with global connectivity in order to achieve faster diagnostics of complex electronics in vehicles in order to provide prompt service to customers. We are also developing prognostic data collection and analysis for failure prediction to the end customer. Furthermore, our initiative in telematics has spanned into a fleet management, driver information and navigation systems, and vehicle tracking system using global navigation satellite systems. We intend to incorporate Wi-Fi and Bluetooth interfaces in our vehicles to facilitate secure and controlled connectivity to third-party IT enabled devices.
Jaguar Land Rover’s research and development operations are built around engineering facilities that feature an extensive test track, testing centers, design hubs and a recently inaugurated virtual innovation center. The ERC in India and Jaguar Land Rover’s engineering and development operations in the United Kingdom have identified areas to leverage the facilities and resources to enhance the product development process and achieve economies of scale.
Jaguar Land Rover’s two design and development centers are equipped with computer-aided design, manufacturing and engineering tools configured to support an ambitious product development cycle plan. In recent years, Jaguar Land Rover has refreshed the entire Jaguar range under a unified concept and design language and has continued to enhance the design of Land Rover’s range of all-terrain vehicles. Jaguar Land Rover’s R&D operations look for synergies through sharing premium technologies, powertrain designs and vehicle architecture. The majority of Jaguar Land Rover’s products are designed and engineered in the United Kingdom. Jaguar Land Rover endeavors to implement the best technologies into its product range to meet the requirements of a globally competitive market and to comply with regulatory requirements. Jaguar Land Rover currently offers hybrid technology on some of its models such as the Range Rover and Range Rover Sport and conducts research and development related to the further application of alternative fuels and technologies to further improve the environmental performance of its vehicles, including the reduction of CO2 emissions.
We endeavor to absorb the best of technologies for our product range to meet the requirements of a globally competitive market. All of our vehicles and engines are compliant with the prevalent regulatory norms in the respective countries in which they are sold.
Intellectual Property
We create, own, and maintain a wide array of intellectual property assets throughout the world that are among our most valuable assets. Our intellectual property assets include patents, trademarks, copyrights designs, trade secrets and other intellectual property rights. We proactively and aggressively seek to protect our intellectual property in India and other countries.
We own a number of patents and have applied for new patents which are considered reasonably possible, but not probable,pending for grant in India as well as in other countries. We have also filed a number of patent applications outside India under the Patent Cooperation Treaty, which we provide disclosureexpect will be effective in other countries going forward. We also obtain new patents as part of our ongoing research and development activities.
We own registrations for a number of trademarks and have pending applications for registration of these in India as well as other countries. The registrations mainly include trademarks for our vehicle models and other promotional initiatives. We use the financial statements, but do not recordTata brand, which has been licensed to us by Tata Sons. We believe that establishment of the Tata word mark and logo mark in India and around the world is material to our operations. As part of our acquisition of TDCV, we have rights to the perpetual and exclusive use of the Daewoo brand and trademarks in South Korea and overseas markets for the product range of TDCV.
As part of the acquisition of our Jaguar Land Rover business, ownership (or co-ownership, as applicable) of core intellectual property associated with Jaguar Land Rover was transferred to us; however such intellectual property is still ultimately owned by Jaguar Land Rover entities. Additionally, perpetual royalty-free licenses to use other essential intellectual property have been granted to us for use in Jaguar and Land Rover vehicles. Jaguar Land Rover owns registered designs to protect the design of its vehicles in several countries.
In varying degrees, all of our intellectual property is important to us. In particular, the Tata, Jaguar, Land Rover and Range Rover brands are integral to the conduct of our business, a liability in our financial statements unless the loss becomes probable. Should any new developments arise, such as a change in law or rulings against us, we may need to make provisions in our financial statements,of which could adversely impactlead to dilution of our reported financial conditionbrand image and results of operations. Furthermore, if significant claims are determined against us and we are required to pay all or a portion of the disputed amounts, there could behave a material adverse effect on our business.
Components and Raw Materials
The principal materials and components required by us for use in Tata and other brand vehicles are steel sheets (forin-house stampings) and plates, iron and steel castings and forgings, items such as alloy wheels, tires, fuel injection systems, batteries, electrical wiring systems, electronic information systems and displays, interior systems such as seats, cockpits, doors, plastic finishers and plastic functional parts, glass and consumables, such as paints, oils, thinner, welding consumables, chemicals, adhesives and sealants, and fuels. We also require aggregates such as axles, engines, gear boxes and cams for our vehicles, which are manufactured in-house or by our subsidiaries, affiliates, joint ventures or operations and strategic suppliers. We have long-term purchase agreements for certain critical components such as transmissions and engines. We have established contracts with certain commodity suppliers to cover our own as well as our suppliers’ requirements in order to moderate the effect of volatility in commodity prices. We have also undertaken special initiatives to reduce material consumption through value engineering and value analysis techniques.
Our sourcing department in India has four divisions, namely, Purchasing, Supplier Quality, Supply Chain and Production and Planning Management or PPM. The reorganization was done with a view to establish and define responsibility and accountability in the sourcing department. Purchasing oversees the commercial aspects of product sourcing, Supplier Quality is primarily responsible for maintaining the quality of supplies that we purchase, Supply Chain oversees the logistics of the supply and delivery of parts for our vendors while PPM oversees execution of new projects.
As part of our strategy to become a low-cost vehicle manufacturer, we have undertaken various initiatives to reduce our fixed and variable costs. In India we started an e-sourcing initiative in 2002, pursuant to which we procure some supplies through reverse auctions. We also use external agencies as third party logistic providers. This has resulted in space and cost savings. Our initiatives to leverage information technology in supply chain activities have resulted in improved efficiency through real time information exchange and processing with our suppliers.
We have an established supplier quality sixteen step process in order to ensure quality of outsourced components. We formalized the component development process using Automotive Industry Action Group guidelines. We also have a program for assisting vendors from whom we purchase raw materials or components to maintain quality. Preference is given to vendors with TS 16949 certification. We also maintain a stringent quality assurance program that includes random testing of production samples, frequent re-calibration of production equipment and analysis of post-production vehicle performance, as well as an ongoing dialogue with workers to reduce production defects.
We are also exploring opportunities for increasing the global sourcing of parts and components from low cost countries, and have in place a vendor management program that includes vendor base rationalization, vendor quality improvement and vendor satisfaction surveys. We have begun to include our supply chain in our initiatives on social accountability and environment management activities, including supply chain carbon footprint measurement and knowledge sharing on various environmental aspects.
The principal materials and components required for use in our Jaguar Land Rover vehicles are steel and aluminum sheets, aluminum castings and extrusions, iron and steel castings and forgings, and items such as alloy wheels, tires, fuel injection systems, batteries, electrical wiring systems, electronic information systems and displays, leather-trimmed interior systems such as seats, cockpits and doors, plastic finishers and plastic functional parts, glass and consumables, such as paints, oils, thinner, welding consumables, chemicals, adhesives and sealants, and fuels. Jaguar Land Rover also requires certain highly functional components such as axles, engines and gear boxes for its vehicles, which are mainly manufactured by strategic suppliers. We have long-term purchase agreements for critical components such as transmissions with ZF Friedrichshafen AG and for engines with Ford and the Ford-PSA Peugeot Citroën joint venture, or the Ford-PSA joint venture. The components and raw materials in Jaguar Land Rover cars include steel, aluminum, copper, platinum and other commodities. Jaguar Land Rover has established contracts with certain commodity suppliers, such as Novelis, to cover its own and its suppliers’ requirements to mitigate the effect of high volatility. Special initiatives are also undertaken to reduce material consumption through value engineering and value analysis techniques.
Jaguar Land Rover works with a range of strategic suppliers to meet their requirements for parts and components, and we endeavor to work closely with our suppliers to form short- and medium-term plans for our business. We have established quality control programs to ensure that externally purchased raw materials and components are monitored and meet our quality standards. Jaguar Land Rover also outsources many of the manufacturing processes and activities to various suppliers. Where this is the case, Jaguar Land Rover provides training to the outside suppliers who design and manufacture the required tooling and fixtures. Such programs include site engineers who regularly interface with suppliers and carry out visits to supplier sites to ensure that relevant quality standards are being met. Site engineers are also supported by persons in other functions, such as program engineers who interface with new model teams as well as resident engineers located at Jaguar Land Rover plants, who provide the link between the site engineers and the plants. Jaguar Land Rover has in the past worked, and expect to continue to work, with its suppliers to optimize their procurements, including by sourcing certain raw materials and component requirements from low-cost countries.
Although we have commenced production of Ingenium four cylinder (2.0-liter) engines which will be installed in the Jaguar XE from 2015, at present we continue to source all of our engines from Ford or the joint venture between Ford and PSA on an arm’s-length basis.
Suppliers
We have an extensive supply chain for procuring various components. We also outsource many manufacturing processes and activities to various suppliers. In such cases, we provide training to external suppliers who design and manufacture the required tools and fixtures.
Our associate company, Tata AutoComp Systems Ltd., or TACO, manufactures automotive components and encourages the entry of internationally acclaimed automotive component manufacturers into India by setting up joint ventures with them.
Our other suppliers include some of the large Indian automotive supplier groups with multiple product offerings, such as the Anand Group, the Sona Group, and the TVS Group, as well as large multinational suppliers, such as Bosch, Continental, Delphi and Denso, Johnson Controls Limited for seats and Yazaki AutoComp Limited for wiring harnesses. We continue to work with our suppliers for our Jaguar Land Rover business to optimize procurements and profitability. Certain claimsenhance our supplier base, including for the sourcing of certain of our raw material and component requirements. In addition, the co-development of various components, such as engines, axles and transmissions also continue to be evaluated, which we believe may lead to the development of a low-cost supplier base for Jaguar Land Rover.
In India, we have established vendor parks in the vicinity of our manufacturing operations and vendor clusters have been formed at our facilities at Pantnagar and Sanand. This initiative is aimed at ensuring availability of component supplies on a real-time basis, thereby reducing logistics and inventory costs as well as reducing uncertainties in the long distance supply chain. Efforts are being taken to replicate the model at new upcoming locations as well as a few existing plant locations.
As part of our pursuit of continued improvement in procurement, we have integrated our system for electronic interchange of data with our suppliers. This has facilitated real time information exchange and processing, which enables us to manage our supply chain more effectively.
We have established processes to encourage improvements through knowledge sharing among our vendors through an initiative called the Vendor Council, which consists of our senior executives and representatives of major suppliers. The Vendor Council also helps in addressing common concerns through joint deliberations. The Vendor Council works on four critical aspects of engagement between us and the suppliers: quality, efficiency, relationships and new technology development.
We import some components that are above Rs.200 millioneither not available in value are describedthe domestic market or when equivalent domestically-available components do not meet our quality standards. We also import products to take advantage of lower prices in Note 33foreign markets, such as special steels, wheel rims and power steering assemblies.
Ford has been and continues to be a major supplier of parts and services to Jaguar Land Rover. In connection with our acquisition of Jaguar Land Rover in June 2008, long-term agreements were entered into with Ford for technology sharing and joint development providing technical support across a range of technologies focused mainly around power train engineering so that we may continue to operate according to our consolidatedexisting business plan. Supply agreements, were entered into with Ford for (i) the long term supply of engines developed by Ford, (ii) engines developed by us but manufactured by Ford and (iii) engines from the Ford-PSA joint venture.
Following the global financial statements included in this annual report. Certain claimscrisis and its cascading effect on the financial health of our suppliers, we have commenced efforts to assess supplier financial risk.
Suppliers are appraised based on our long-term requirements through a number of platforms such as Vendor Council meetings, council regional chapter meetings, national vendor meets and location-specific vendor meets.
Capital and Product Development Expenditures
Our capital expenditure totaled Rs.335,771 million, Rs.272,832 million and Rs.212,078 million during Fiscal 2015, 2014 and 2013, respectively. Our capital expenditure during the past three Fiscal years related primarily to new product development and capacity expansion for new and existing products to meet market demand as well as investments towards improving quality, reliability and productivity that are below Rs.200 millioneach aimed at increasing operational efficiency.
We intend to continue to invest in value pertainour business units in general, and in research and product development in particular, over the next several years in order to indirect taxes, laborimprove our existing product range, develop new products and platforms and to build and expand our portfolio in the passenger vehicle and commercial vehicle categories. We believe this will strengthen our position in the Indian automotive market and help us to grow our market share internationally.
As part of this future growth strategy, we plan to make investments in product development, capital expenditure in capacity enhancement, plant renewal and modernization and to pursue other growth opportunities. Our subsidiaries also have their individual growth plans and related capital expenditure plans. These expenditures are expected to be funded largely through cash generated from operations, existing investible surplus in the form of cash and cash equivalents, investment securities and other civil cases. There are other claims against us which pertainexternal financing sources.
Governmental Regulations
Governmental Regulations in India
Automotive Mission Plan, 2006-2016
The automotive mission plan, or Plan 2006, promulgated by the Ministry of Heavy Industries and Public Enterprises of the Government of India in December 2006, consists of recommendations to motor accident claimsthe task force of the Development Council on Automobile and Allied Industries constituted by the Government of India in India (involving vehicles that were damaged in accidents while being transferred from our manufacturing plantsrelation to regional sales offices), product liability claims and consumer complaints. Somethe preparation of these cases relate to replacement of parts of vehicles and/or compensation for deficiency in services provided by us or our dealers.
In June 2011, the newly elected state government of West Bengal, or the West Bengal State Government, enacted legislation to cancel our land lease agreement entered intomission plan for the purposeIndian automotive industry. Plan 2006 recommends that a negative list of establishingitems, such as no duty concessions for the import of used or remanufactured vehicles, or treatment of remanufactured automotive products as old products, should be negotiated for free trade agreements or regional trade agreements, on a manufacturing facility for automobiles at Singur. We subsequently challengedcase-by-case basis with other countries. It recommends the legal validityadoption of appropriate tariff policies to attract more investment into the automobile industry, the improvement of power infrastructure to facilitate faster growth of the legislation. In June 2012,automotive sector both domestically and internationally, policy initiatives such as encouragement of collaboration between the High Courtautomotive industry and research and academic institutions, tax concessions and incentives to enhance competitiveness in manufacturing and promotion of Calcutta, orresearch and technology development. For the Calcutta High Court, ruled againstpromotion of exports in the validityautomotive components sector, among other things, it recommends the creation of special automotive component parks in special economic zones and the creation of virtual special economic zones, which would enjoy certain exemptions on sales tax, excise duty and customs duty. Other major recommendations of the legislationplan include strengthening the inspection and restored our rightscertification system by encouraging public-private partnerships and rationalization of motor vehicles regulations.
A committee set up under the land lease agreement. The West Bengal State Government appealedchairmanship of the Secretary of the Ministry of Heavy Industries and Public Enterprises consisting of all stakeholders, including representatives of the Ministry of Finance, and of other interested parties relating to road transport, the Supreme Courtenvironment, commerce, industrial policy and promotion, labor, shipping, railways, human resource development, science and technology, new and renewable energy, petroleum and natural gas and the automotive industry, will monitor the implementation and progress of India. Proceedings at the Supreme Court are continuing asPlan 2006.
As of the date of this annual report on Form 20-F, Plan 2006 is being reviewed by Ministry of Heavy Industries and Public Enterprises of the Government of India.
The Auto Policy, 2002
The Auto Policy was introduced by the Department of Heavy Industry, Ministry of Heavy Industries and Public Enterprises of the Government of India in March 2002, with the aims, among other things, of promoting a hearingglobally competitive automotive industry that would emerge as a global source for automotive components, establishing an international hub for manufacturing small, affordable passenger cars, ensuring a balanced transition to open trade at a minimal risk to the Indian economy and local industry, encouraging modernization of the industry and facilitating indigenous design, research and development, as well as developing domestic safety and environment standards on par with international standards.
Auto Fuel Vision & Policy 2025
The Ministry of Petroleum and Natural Gas constituted an expert committee under the Chairmanship of Shri Saumitra Chaudhuri, Member Planning Commission, on December 19, 2012. Its objective was to recommend auto fuel quality applicable through model year 2025. The committee in its draft report has been scheduledrecommended Bharat Stage IV compliant fuel across the country by 2017 and Bharat Stage V compliant fuel with 10 ppm of sulphur to be made available from 2020 onwards. The draft report proposes nationwide Bharat Stage V emission norms for Augustnew 4 wheelers from model year 2020 and for all 4 wheelers from model year 2021. It also recommends Bharat Stage VI emissions norms from 2024 onwards. In April 2014, the expert committee submitted its recommendations to the committee empowered by the Ministry of Petroleum and Natural Gas, which has proposed the advancement of emission norms by one year earlier than the expert committee’s recommendations, which would result in the implementation of Bharat Stage V emission norms starting in model year 2019 and Bharat Stage VI emissions norms starting in model year 2023.
Central Motors Vehicles Rules, 1989
Chapter V of the Central Motor Vehicle Rules, 1989, or the CMV Rules, sets forth provisions relating to construction, equipment and maintenance of motor vehicles, including specifications for dimensions, gears, indicators, reflectors, lights, horns, safety belts and others. The CMV Rules govern emission standards for vehicles operating on compressed natural gas or CNG, gasoline, liquefied petroleum gas and diesel.
On and from the date of commencement of the CMV (Amendment) Rules, 1993, every manufacturer must submit the prototype of every vehicle to be manufactured by it for testing by the Vehicle Research and Development Establishment of the Ministry of Defense of the Government of India, the Automotive Research Association of India, Pune, the Central Machinery Testing and Training Institute, Budni (MP), the Indian Institute of Petroleum, Dehradun, the Central Institute of Road Transport, Pune, the International Center for Automotive Technology, Manesar or such other agencies as may be specified by the central government for granting a certificate by that agency as to the compliance of provisions of the Motor Vehicles Act, and the CMV Rules.
The CMV Rules also require the manufacturers to comply with notifications in the Official Gazette, issued by Government of India, to use such parts, components or assemblies in the manufacture of certain vehicles according to standards specified by either the Automotive Industry Standards Committee or the Bureau of Indian Standards.
The existing CMV Rules would be replaced by the Road Transport and Safety Bill (RTSB) 2015, which is subject to legislative approval by the Parliament, which could expose us to additional liability for vehicle recalls and for manufacturer’s liability for our vehicles.
Emission and Safety in India
In 1992, the Government of India issued emission and safety standards, which were further tightened in April 1996, under the Indian Motor Vehicle Act. Currently Bharat Stage IV norms, which are equivalent to Euro IV norms, are in force for four-wheelers in 13 2013. cities and Bharat Stage III norms, which are equivalent to Euro III norms, are in effect in the rest of India. Our vehicles comply with these norms. In 2014, the Ministry of Road Transport and Highways has extended Bharat Stage IV norms in 20 additional cities. In its draft GSR No.247 (E), dated April 1, 2015, the Ministry of Road Transport and Highways proposed the further extension of Bharat Stage IV norms in 30 additional cities starting July 1, 2015.
We expect that the Calcutta High Court’s judgment,are also working towards meeting all applicable regulations which we believe are likely to be basedcome into effect in various markets in the near future. Our vehicle exports to Europe comply with Euro V norms, and we believe our vehicles also comply with the various safety regulations in effect in the other international markets where we operate.
The Indian automobile industry is progressively harmonizing its safety regulations with international standards in order to facilitate sustained growth of the Indian automobile industry as well as to encourage export of automobiles from India.
India has been a signatory to the 1998 UNECE Agreement on an established position of law, will be upheld.
In South Korea, our union employees had filed a lawsuit to include some elements of non-ordinary salaryGlobal Technical Regulations since April 22, 2006 and bonus as part of ordinary wages. The district court ruledhas voted in favor of all eleven Global Technical Regulations. We work closely with the union employeesGovernment of India to participate in WP 29 World Forum Harmonization activities.
India has a well-established regulatory framework administered by the Indian Ministry of Road Transport and Highways. The Ministry issues notifications under the CMV Rules and the Motor Vehicles Act. Vehicles manufactured in India must comply with applicable Indian standards and automotive industry standards. In January 2002, the Indian Ministry of Road Transport and Highways has finalized plans on January 2013 and ordered TDCV to pay the employees KRW 17.2 billion and interest, upto the period of lawsuit. We have recoded a provision of Rs.2,124 million (through March 31, 2013) in Fiscal 2013 in respect of this lawsuit. TDCV has filed an appeal against the order.
We believe that none of the contingencies, would have a material adverse effect on our financial condition, results of operations or cash flows.
I. Tata Sons- Promoter and its Promoted Entities
Tata Sons holds equity interests in a range of businesses.implementing automobile safety standards. The various companies promoted by Tata Sons, including us,plans are based substantiallyon traffic conditions, traffic density, driving habits and road user behavior in India and had combined revenuesis generally aimed at increasing safety requirements for vehicles under consideration for Indian markets.
The Essential Commodities Act, 1955
The Essential Commodities Act, 1955, as amended by the Essential Commodities (Amendment and Validation) Act, 2009, or the Essential Commodities Act, authorizes the Government of approximatelyIndia, if it finds it necessary or expedient to do so, to provide for regulating or prohibiting the production, supply, distribution, trade and commerce in the specified commodities under the Essential Commodities Act, in order to maintain or increase supplies of any essential commodity or to secure their equitable distribution and availability at fair prices, or to secure any essential commodity for the defense of India or the efficient conduct of military operations. The definition of “essential commodity” under the Essential Commodities Act includes “component parts and accessories of automobiles”.
Environmental Regulations
Manufacturing units or plants must ensure compliance with environmental legislation, such as the Water (Prevention and Control of Pollution) Act, 1974, the Air (Prevention and Control of Pollution) Act, 1981, the Environment Protection Act, 1986 and the Hazardous Wastes (Management and Handling and Transboundary Movement) Rules, 2008. The basic purpose of these statutes is to control, abate and prevent pollution. In order to achieve these objectives, Pollution Control Boards, or PCBs, which are vested with diverse powers to deal with water and air pollution, have been set up in each state. The PCBs are responsible for establishing standards for maintenance of clean air and water, directing the installation of pollution control devices in industries and undertaking inspection to ensure that units or plants are functioning in compliance with the standards prescribed. These authorities also have the power of search, seizure and investigation. All of our manufacturing plants are either in possession of current, valid Consents to Operate and Hazardous Waste Authorisations or are in the process of renewing their Consents to Operate and Hazardous Waste Authorisations from the respective state PCBs of the states where they operate.
The Ministry of Environment and Forests under the Government of India receives proposals for expansion, modernization and establishment of projects and the impact of such projects on the environment are assessed by the Ministry, before it grants environmental clearances for the proposed projects under the Environmental Impact Assessment Notification and Rules. All of our manufacturing plants have obtained environmental clearances for specific projects in the past as and when mandated.
We ensure that all prescribed norms are followed for management of waste and we have made significant investments towards pollution control and environmental protection at our manufacturing plants.
Regulation of Imports and Exports
Regulation of quantitative restrictions on imports into India were liberalized with effect from April 1, 2001, pursuant to India’s World Trade Organization obligations, and imports of capital goods and automotive components were placed under the open general license category.
Automobiles and automotive components may, generally, be imported into India without a license from the Government of India subject to their meeting Indian standards and regulations, as specified by designated testing agencies. As a general matter, cars, UVs and SUVs in completely built up, or CBU, condition may be imported at 60% basic customs duty. However, cars with cost, insurance and freight value of more than US$96.79 billion40,000 or with engine capacities greater than 3,000 cubic centimeters for Fiscal 2013. diesel variants and 2,500 cubic centimeters for gasoline variants, may be imported at a 100% basic customs duty. Commercial vehicles may be imported at a basic customs duty of 20% and components may be imported at basic customs duty ranging from at 10% to 7.5%.
The operations of Tata Sons promoted entities are highly diversified and can be categorizedFDI Policy
Automatic approval for foreign equity investments up to 100% is allowed in the automobile manufacturing sector under seven business sectors, namely, engineering, materials, energy, chemicals, consumer products, services, communications andthe FDI Policy. See Item 10.D “—Exchange Controls” for additional information systems. These companies do not constitute a “group”relating to restrictions on foreign investment under Indian Law.law.
Tata Sons promoted entitiesIndian Taxes
See Item 10.E “—Taxation” for additional information relating to our taxation.
Excise Duty
The Government of India imposes excise duty on cars and other motor vehicles and their chassis, which rates vary from time to time and across vehicle categories reflecting the policies of the Government of India. The chart below sets forth a summary of historical changes and the current rates of excise duty.
Change of Tax Rate | Excise Duty (per vehicle or chassis) | |||||||||||||||||||
| Small cars1 | Cars other than small cars2 | Motor vehicles for more than 13 persons | Chassis fitted with engines for vehicles of more than 13 persons | Trucks | Chassis fitted with engines for trucks | Safari, SUVs and UVs | ||||||||||||||
March 2012 | 12 | % | 24% or 27%1 | 12 | % | 15% | 12 | % | 15% | 27% | ||||||||||
May 2012 | - | - | - | 14% | - | 14% | - | |||||||||||||
March 2013 | - | - | - | - | - | 13% | 27% or 30% | |||||||||||||
February 2014 | 8 | % | 20% or 24%1 | 8 | % | 10% | 8 | % | 9% | 24% | ||||||||||
January 2015 | 12 | % | 24% or 27%1 | 12 | % | 14% | 12 | % | 13% | 27% or 30% | ||||||||||
March 2015 onwards | 12.50 | % | - | 12.50 | % | - | 12.50 | % | - | - | ||||||||||
| 1. | Small cars are cars with a length not exceeding 4,000 mm and an engine capacity not exceeding 1,500 cubic centimeters for cars with diesel engines, and not exceeding 1,200 cubic centimeters for cars with gasoline engines. The higher rate is applicable if the engine capacity exceeds 1,500 cubic centimeters. |
| 2. | Cars other than small cars are cars with a length exceeding 4000 mm with an engine capacity exceeding 1,500 cubic centimeters for diesel engines and 1,200 cubic centimeters for gasoline engines. |
| (-) | indicates no change during the relevant year. |
All vehicles and chassis are subjected to the automobile cess, which is assessed at 0.125%. Certain passenger vehicles are also subject to the National Calamity Contingent Duty, or NCCD, assessed at 1%. The education cess, assessed at 2%, and secondary and higher education cess, assessed at 1%, in addition to the excise duties indicated above, are exempted on goods starting March 1, 2015.
Value Added Tax
The Value Added Tax, or VAT, has been implemented throughout India. VAT enables set-off from sales tax paid on inputs by traders and manufacturers against the sales tax collected by them on behalf of the Government of India, thereby eliminating the cascading effect of taxation. Two main brackets of 5% and 12.5%, along with special brackets of 0%, 1%, 3%, 4%, 13.5%, 14% 14.5%, 15%, 20%, 22% and 23% have its originsbeen announced for various categories of goods and commodities sold in the trading business foundedcountry and certain states have also introduced additional VAT of 1% to 3% on specified commodities, including automobiles. In some of the states, a surcharge of 5% to 10% on VAT has been introduced on automobiles. Since its implementation, VAT has had a positive impact on our business. Prior to the implementation of VAT, a major portion of sales tax paid on purchases formed part of our total cost of materials. The implementation of VAT has resulted in savings on the sales tax component, as VAT paid on inputs may generally be set-off against tax paid on outputs.
In addition to VAT, a Central Sales Tax continues to exist, although it is proposed to be abolished in a phased manner. In the Indian Union Budget 2008-09, the Central Sales Tax rate was reduced to 2%, which remained unchanged in Fiscal 2015.
Goods and Services Tax
The Government of India is proposing to reform the indirect tax system in India with a comprehensive national goods and services tax, or GST, covering the manufacture, sale and consumption of goods and services. The date of introduction of GST is expected to be as early as April 1, 2016. The proposed GST regime will combine taxes and levies by Mr. Jamsetji Tata in 1874,the central and state governments into one unified rate structure. There is a proposal to levy a 1% Non-Creditable Tax to be collected by the Government of India and will be appropriated to the origin state government on every interstate movement of goods. The Government of India has publicly expressed the view that was developedfollowing the implementation of the GST, the indirect tax on domestically manufactured goods is expected to decrease along with prices on such goods.
We have benefitted and expanded in furtherance of his ideals by his two sons, Sir Dorabji Tata and Sir Ratan Tata, following their father’s death in 1904. The family interests subsequently vested largelycontinue to benefit from excise duty exemptions for manufacturing facilities in the Sir Ratan Tata Trust, the Sir Dorabji Tata Truststate of Uttarakhand and other related trusts. These trusts were established for philanthropicincentives such as subsidies or loans from other states where we have manufacturing operations. While both the Government of India and charitable purposes and together own a substantial majorityother state governments of India have publicly announced that all committed incentives will be protected following the implementation of the sharesGST, given the limited availability of Tata Sons Limited.information in the public domain concerning the GST, we are unable to provide any assurance as to the effect of this or any other aspect of the tax regime following implementation of the GST.
By 1970,Imposition of any additional taxes and levies by the operationsGovernment of Tata Sons promoted entities had expandedIndia designed to encompasslimit the use of automobiles could adversely affect the demand for our products and our results of operations.
Economic Stimulus Package and Incentives
There was a number4% cut in the central value added tax rate, or Cenvat, on cars and trucks and a 2% cut in Cenvat rate on motor vehicles for transport of major industrialmore than 13 persons, including the driver. Further, in February 2009, the Cenvat rate was reduced from 10% to 8% for Trucks and buses and service tax was also reduced from 12% to 10%. The Government of India has also provided for an accelerated tax depreciation of 50% for commercial enterprises includingvehicles purchased between January 1 and September 30, 2009. The Cenvat rate was restored to 10% since April 1, 2010 and was further revised to 12% with effect from March 16, 2012. The Government of India has made changes in the excise duty in February 2014 which will be in effect until December 31, 2014 as follows: the Cenvat on small cars, trucks and buses reduced to 8% in February, 2014 whereas Cenvat on cars other than small cars has been reduced to 20% or 24% from 24% or 27%. The Cenvat on UVs have been reduced from 27% or 30% to 24%. The Cenvat for chassis which was increased from 12% to 14% in the budget for the Indian Hotels Company Limited (1902), Tata Steel Limited,fiscal year 2012-2013, has since been revised to 13% in the budget for the Indian fiscal year 2013-2014 and further reduced to 9% in February 2014.
The Government of India has launched a National Electric Mobility Mission plan 2020, or Tata Steel (1907), which becameNEMMP, to encourage reliable, affordable and efficient electric vehicles that meet consumer performance and price expectations. Through collaboration between the sixth largest steel makergovernment and industry for promotion and development of indigenous manufacturing capabilities, required infrastructure, consumer awareness and technology, the NEMMP aims to help India to emerge as a leader in the electric vehicle market in the world after it acquired Corus, Tata Power Company Limited (1910), Tata Chemicals Limited,by 2020 and contribute towards national fuel security.
Furthermore, the Ministry of Road Transport & Highways and the Bureau of Energy Efficiency in India finalized labeling regulations for the M1 category of vehicles, which includes passenger vehicles up to, less than, or Tata chemicals (1939),equal to 10 seats.
The Government of India’s plan to encourage India’s transition to hybrid and electric mobility consists of the following initiatives:
Demand Side: Mandate use of electric vehicles in areas such as public transportation and government fleets in order to create initial demand for OEMs and provide incentives for the sales of electric vehicles to consumers.
Supply Side: Link incentives to localization of the production of key components of electric vehicle in a phased manner.
Research and Development: Fund research and development programs along with OEMs and component suppliers to develop optimal solutions for India at low cost.
Infrastructure Support: Development of pilot programs to support hybrid and/or electric vehicles and test their effectiveness and make modest investments to build public charging infrastructure to support electric vehicles, especially for buses.
Environmental, fiscal and other governmental regulations around the world
Our Jaguar Land Rover business has significant operations in the United States and Europe, which have stringent regulations relating to vehicular emissions. The proposed tightening of vehicle emissions regulations by the European Union will require significant costs of compliance for Jaguar Land Rover. While we are pursuing various technologies in order to meet the required standards in the various countries in which we operate, the costs of compliance with these required standards can be significant to our operations and may adversely impact our results of operations.
In the United Kingdom, the Bank of England base (interest) rate has been maintained at an historic low of 0.5% despite an improvement in the UK economy. The UK labor market is strengthening as unemployment continues to fall and wages rise while inflation remains low primarily reflecting low energy prices. As a result the world’s second largestoutlook is generally positive for UK GDP as higher levels of disposable income are expected to drive consumption and the Bank of England is likely to keep interest rates lower for longer as inflation remains subdued.
Economic growth in the Eurozone remained low during Fiscal 2015 and some member states experienced mild recession. In response the European Central Bank embarked on a quantitative easing program in January 2015 and there are signs of growth as a result; however uncertainty remains over the outcome of the debt negotiations with Greece.
The U.S. economy continues to strengthen despite the adverse effects of another harsh winter impacting in the first three months of 2016. The U.S. Federal Reserve continues to taper off its quantitative easing program and, similarly to the United Kingdom, improving labor market conditions along with lower energy prices are driving increased consumption. The U.S. Federal Reserve also held interest rates at historical lows at around 0.25% during Fiscal 2015 while rates are likely to rise gradually in the near term as confidence in the stronger economic recovery gains momentum.
Greenhouse gas / CO2 / fuel economy legislation
Legislation is in place limiting passenger car fleet average greenhouse gas emissions in Europe to 130 grams of CO2 per kilometer for 100% of new cars in 2015. Different targets apply to each manufacturer based on their respective fleets of soda ash,vehicles and average weight. We have received a permitted derogation from the weight-based target requirement available to small volume and niche manufacturers. As a result, we are permitted to reduce our emissions by 25% from 2007 levels rather than meeting a specific CO2 emissions by 2015. Jaguar Land Rover now has an overall 2015 target of an average of 178.0 grams of CO2 per kilometer for our full fleet of vehicles registered in the EU that year, with Jaguar Land Rover and Tata Motors Limited (1945), which is among the top five medium and heavy commercial vehicle manufacturers in the world and which acquiredmonitored as a single “pooled” entity for compliance with this target (for Jaguar Land Rover alone, this would be 179.8 g/km). We are in 2008. Tata Motors Limited made India’s first indigenously developed car,compliance with the Indica,2013 requirement that the best 75% of our pooled fleet registered in 1998,the EU that year has met this target and introduced the world’s lowest-cost car,2014 requirement that the Tata Nanobest 80% of our pooled fleet registered in Fiscal 2010. Other Tata entities include Voltas Limited (1954),the EU has met this target, achieving an average 164.5 grams of CO2 per kilometer and Tata Global Beverages Ltd,165.3 grams of CO2 per kilometer (provisional) in calendar 2013 and 2014, respectively.
Furthermore, the European Union has regulated target reductions for 95% of a manufacturer’s full fleet of new passenger cars registered in the EU in 2020 to average 95 grams of CO2 per kilometer, rising to 100% in 2021. The new rule contains an extension of the small volume and niche manufacturers’ derogation which permits us to reduce our emissions by 45% from 2007 levels rather than meet a specific CO2 emissions target by 2020. Jaguar Land Rover could apply for an overall target of 132 grams of CO2 per kilometer.
The European Union has also adopted an average emissions limit of 175 grams of CO2 per kilometer for light commercial vehicles to be phased in between 2014 and 2017. Implementation of light commercial vehicle CO2 standards affect the Defender and a small number of Freelander and Discovery vehicles. We have been granted a small volume derogation by the European Commission for alternative specific emission targets for 2014-2016 inclusive, which protects the Defender through to end of manufacturing. A further average emissions limit of 147 grams of CO2 per kilometer for light commercial vehicles has been adopted for 2020.
In the United States, both Corporate Average Fuel Economy, or Tata Global Chemicals (1962),CAFE, standards and greenhouse gas emissions standards are imposed on manufacturers of passenger cars and light trucks. The National Highway Traffic Safety Administration, or NHTSA, has set the federal CAFE standards for passenger cars and light trucks to meet an estimated combined average fuel economy level of 35.5 miles per U.S. gallon for 2016 model year vehicles. Meanwhile, the U.S. Environmental Protection Agency, or EPA, and NHTSA issued a joint rule to reduce the average greenhouse gas emissions from passenger cars, light trucks and medium-duty passenger vehicles for model years 2012-16 to 250 grams of CO2 per mile, which would be equivalent to 35.5 miles per U.S. gallon in model year 2016 if the requirements were met only through fuel economy improvements. The United States federal government extended this program to cars and light trucks for model years 2017 through 2025, targeting an estimated combined average emissions level of 243 grams of CO2 per mile in 2017 and 163 grams per mile in 2025, which is equivalent to 54.5 miles per gallon if achieved exclusively through fuel economy improvements. In addition, many other markets either have or will shortly define similar greenhouse gas emissions standards (including Brazil, Canada, China, the second largest branded tea companyEuropean Free Trade Association, India, Japan, Mexico, Saudi Arabia, South Korea and Switzerland).
California is empowered to implement more stringent greenhouse gas emissions standards but has elected to accept the existing U.S. federal standards for compliance with the state’s own requirements. The California Air Resources Board enacted regulations that deem manufacturers of vehicles for model years 2012 through 2016 that are in compliance with the EPA greenhouse gas emissions regulations to also be in compliance with California’s greenhouse gas emission regulations. In November 2012, the California Air Resources Board accepted the federal standard for vehicles with model years 2017-25 for compliance with the state’s own greenhouse gas emission regulations. However, California is moving forward with other stringent emission regulations for vehicles, including the Zero Emission Vehicle regulation, or ZEV. ZEV requires manufacturers to increase their sales of zero emissions vehicles year-on-year, up to an industry average of 16% of vehicles sold in the world,state by 2025. The precise sales required in order to meet a manufacturer’s obligation in any given model year depend on the size of the manufacturer and the level of technology sold (for example, transitional zero emission technologies, such as plug-in hybrids, can account for at least a proportion of a manufacturer’s obligation, but these technologies earn compliance credits at a different rate from pure zero-emissions vehicles). Other compliance mechanisms are available under ZEV, such as banking and trading of credits generated through its UK-based subsidiary Tetley.the sale of eligible vehicles.
Tata SonsWe are fully committed to meeting these standards and technology deployment plans incorporated into cycle plans are directed to achieving these standards. These plans include the use of lightweight materials, including aluminum, which will contribute to the manufacture of lighter vehicles with improved fuel efficiency, reducing parasitic losses through the driveline and improvements in aerodynamics. They also promoted India’s first airline, Tata Airlines, which later became Air India (India’s national carrier),include the development and installation of smaller engines in our existing vehicles and other drivetrain efficiency improvements, including the introduction of eight-speed or nine-speed transmissions in some of our vehicles. We continue to introduce smaller vehicles such as the Jaguar XE, our most fuel-efficient Jaguar yet. The technology deployment plans also include the research, development and deployment of hybrid-electric vehicles. These technology deployment plans require significant investment. Additionally, local excise tax initiatives are a key consideration in ensuring our products meet customer needs for environmental footprint and cost of ownership concerns as well as India’s largest general insurance company, New India Assurance Company Limited, bothcontinued access to major city centers, such as London’s Ultra Low Emission Zone and similar low emissions areas being contemplated in Paris, Berlin and Beijing.
Non-greenhouse gas emissions legislation
The European Union has adopted the latest in a series of which were subsequently taken over bymore-stringent standards for emissions of other air pollutants from passenger and light commercial vehicles, such as nitrogen oxides, carbon monoxide, hydrocarbons and particulates. These standards have been or are being phased in from September 2009 (Euro 5) and September 2014 (Euro 6b) and September 2017 (Euro 6c) for passenger cars and from September 2010 (Euro 5), September 2015 (Euro 6b) and September 2018 for light commercial vehicles. September 2015 will see the governmentadoption of driving emissions monitoring, while September 2017 will see such monitoring become mandatory along with a move to the new Worldwide harmonised Light-duty Test Procedure, or WLTP, coincident with Eu6c in Europe to address global concerns on more customer correlated fuel economy certified levels as partwell as air quality concerns, with other markets to follow. All programs are being fully engineered to enable the adoption of these new requirements.
In the Government of India’s nationalization program. Tata Consultancy Services Limited, or TCS, is Asia’s leading software services providerUnited States, existing California Low-Emission Vehicle regulations and the first Indian software firmrecently adopted LEV III regulations, as well as the state’s ZEV regulations, place ever-stricter limits on emissions of particulates, nitrogen oxides, hydrocarbons, organics and greenhouse gases from passenger cars and light trucks. These regulations require ever-increasing levels of technology in engine control systems, on-board diagnostics and after treatment systems affecting the base costs of our powertrains. The new California LEV3 and ZEV regulations cover model years 2015 to exceed sales2025. Additional stringency of US$4 billion. TCS has delivery centersevaporative emissions also requires more-advanced materials and joints solutions to eliminate fuel evaporative losses, all for much longer warranty periods (up to 150,000 miles in the United States,States).
In addition, in April 2014, the Tier 3 Motor Vehicle Emission and Fuel Standards issued by the EPA were finalized. With Tier 3, the EPA has established more stringent vehicle emissions standards broadly aligned to California’s LEV III standards for 2017 to 2025 model year vehicles. The EPA made minor amendments to these Tier 3 standards in January 2015.
While Europe and the United Kingdom, Hungary, Brazil, UruguayStates lead the implementation of these emissions programs, other nations and China, as well as India.states typically follow on with adoption of similar regulations two to four years thereafter. For example, China’s Stage III fuel consumption regulation targets a national average fuel consumption of 6.9L/100km by 2015 and its Stage IV targets a national average fuel consumption of 5.0L/100km by 2021. In 1999, Tata Sonsresponse to severe air quality issues in Beijing and other major Chinese cities, the Chinese government also investedintends to adopt more stringent emissions standards beginning in several telephone2016.
To comply with the current and telecommunication ventures, including acquiringfuture environmental norms, we may have to incur substantial capital expenditures and research and development expenditures to upgrade products and manufacturing facilities, which would have an impact on our cost of production and results of operations.
Noise legislation
The European Commission adopted new rules (which apply to new homologations from July 2016) to reduce noise produced by cars, vans, buses, coaches and light and heavy trucks. Noise limit values would be lowered in two steps of each twoA-weighted decibels for vehicles other than trucks, and one A-weighted decibel in the first step and two in the second step for trucks. Compliance would be achieved over a portionten-year period from the introduction of the Indian Government’s equity stakefirst phase.
Vehicle safety
Vehicles sold in the state owned Tata Communications Limited which is one of the world’s largest wholesale voice carriers. Tata companiesEurope are building multinational businesses that will achieve growth through excellence and innovation, while balancing the interests of shareholders, employees and society.
We have for many years been a licensed user of the “Tata” brand owned by Tata Sons, and thus have both gained from the use of the Tata brand as well as helped to sustain its brand equity. Tata Sons along with the Tata Sons promoted entities instituted a corporate identity program to re-position the brand to compete in a global environment. A substantial ongoing investment and recurring expenditure is planned to develop and promote a strong, well-recognized and common brand equity, which is intended to represent for the consumer a level of quality, service and reliability associated with products and services offered by the Tata Sons promoted entities.
Each of the Tata Sons promoted consenting entities pays a subscription fee to participate in and gain from the Tata brand identity. We believe that we benefit from the association with the “Tata” brand identity and accordingly, Tata Motors Limited and certain of our subsidiaries have agreed to pay an annual subscription fee to Tata Sons which is equal to 0.15%-0.25% of annual net income (defined as net revenues exclusive of excise duties and other governmental taxes and non-operating income), subject to a ceiling of 5% of annual profit before tax (defined as profit after interest and depreciation but before income tax). In the past, Tata Sons has lowered the subscription fee, considering its requirement of outlay for activities related to brand promotion and protection. In Fiscal 2012 and 2013, Tata Motors Limited on a standalone basis paid an amount less than 0.25% of its annual net income as per Indian GAAP. Pursuant to our licensing agreement with Tata Sons, we have also undertaken certain obligations for the promotion and protection of the new Tata brand identity licensed to us under the agreement. The agreement can be terminated by written agreement between the parties, by Tata Sons upon our breach of the agreement and our failure to remedy the same, or by Tata Sons upon providing six months’ notice for reasons to be recorded in writing. The agreement can also be terminated by Tata Sons upon the occurrence of certain specified events, including liquidation.
The Tata Sons promoted entities have sought to continue to follow the ideals, values and principles of ethics, integrity and fair business practices originallyvehicle safety regulations established by the founderEuropean Union or by individual Member States. In 2009, the European Union enacted a new regulation to establish a simplified framework for vehicle safety, repealing more than 50 existing directives and replacing them with a single regulation aimed at incorporating relevant United Nations standards. The incorporation of Tata Sons, Mr. Jamsetji Tata,the United Nations standards commenced in 2012, and his successors. To further protectthe European Commission requires new model cars to have electronic stability control systems, has introduced regulations relating to low-rolling resistance tires, requires tire pressure monitoring systems and enhancerequires heavy vehicles to have advanced emergency braking systems and lane departure warning systems. From April 2009, the Tata brand equity, these valuescriteria for whole vehicle type approval were extended to cover all new road vehicles, to be phased in over five years depending on vehicle category. The extension clarifies the criteria applicable to small commercial vehicles. In the European Union, new safety requirements came into force from November 2012 for new vehicle types and principles have been articulatedcome into force in November 2014 for all new vehicles sold in the Tata CodeEU market. The new mandatory measures include safety belt reminders, electric car safety requirements, easier child seat anchorages, tire pressure monitoring systems and gear shift indicators.
In the United States, NHTSA issues federal motor vehicle safety standards covering a wide range of Conduct,vehicle components and systems such as airbags, seatbelts, brakes, windshields, tires, steering columns, displays, lights, door locks, side impact protection and fuel systems. We are required to test new vehicles and equipment and assure their compliance with these standards before selling them in the United States. We are also required to recall vehicles found to have defects that present an unreasonable risk to safety or which do not conform to the required Federal Motor Vehicle Safety Standards, and to repair them without charge to the owner. The financial cost and impact on consumer confidence of such recalls can be significant depending on the repair required and the number of vehicles affected. We have no investigations relating to alleged safety defects or potential compliance issues pending before NHTSA.
These standards add to the cost and complexity of designing and producing vehicles and equipment. In recent years NHTSA has beenmandated, among other things:
A system for collecting information relating to vehicle performance and customer complaints, and foreign recalls to assist in the early identification of potential vehicle defects as required by the Transportation Recall Enhancement, Accountability, and Documentation (TREAD) Act; and
Enhanced requirements for frontal and side impact, including a lateral pole impact.
Furthermore, the Cameron Gulbransen Kids Transportation Safety Act of 2007 (Kids and Cars Safety Act), passed into law in 2008, requires NHTSA to enact regulations related to rearward visibility and brake-to-shift interlock and requires NHTSA to consider regulating the automatic reversal functions on power windows. The costs to meet these proposed regulatory requirements may be significant.
Vehicle safety regulations in Canada are similar to those in the United States; however, many other countries have vehicle regulatory requirements which differ from those in the United States. The differing requirements among various countries create complexity and increase costs such that the development and production of a common product that meets the country regulatory requirements of all countries is not possible. Global Technical Regulations, or GTRs, developed under the auspices of the United Nations, continue to have an increasing impact on automotive safety activities, as indicated by EU legislation. In 2008, GTRs on electronic stability control, head restraints and pedestrian protection were each adopted by mostthe UN “World Forum for the Harmonization of Vehicle Regulations”, and are now in different stages of national implementation. While global harmonization is fundamentally supported by the automobile industry in order to reduce complexity, national implementation may still introduce subtle differences into the system.
At present, India is a signatory of the Tata companies that have access1998 UNECE Agreement on Global Technical Regulations, which makes the global technical regulations alternate standards to the larger resourcesnational regulations. The transition of finalized global technical regulations into national standards remains in progress.
Insurance Coverage
The Indian insurance industry is predominantly state-owned and services of the Tata Sons promoted entities. The Tata Sons promoted entities have also made significant contributions towards national causes through promotion of public institutions in the field of science, such asinsurance tariffs are regulated by the Indian Institute of ScienceInsurance Regulatory and the Tata Institute of Fundamental ResearchDevelopment Authority. We have insurance coverage which we consider reasonably sufficient to cover all normal risks associated with our operations, including business interruptions, and which we believe are in the field of social services through the Tata Institute of Social Sciences, the Tata Memorial Hospital and the National Center of the Performing Arts. Tata trusts are among the largest charitable foundationsaccordance with industry standards in India.
A large number of the Tata Sons promoted entities hold shares in one another and We have obtained coverage for product liability for some of our directors hold directorships on the boards of Tata Sons and/or Tata Sons promoted entities. However, there are no voting agreements, material supply or purchase agreements or any other relationships or agreements that have the effect of tying us together with other Tata Sons promoted entities at management, financial or operational levels. With the exception of Tata Steel,vehicle models in several countries to which under our Articles of Association has the right to appoint one director to the Board, Tata Sons and its subsidiaries do not have any special contractual or other power to appoint our directors or management beyond the voting power of their shareholdings in us. Except as set forth in the tables below under the heading “Subsidiaries and Affiliates” and except for approximately a 15.38% equity interest in Tata Services Ltd, a 12.47% equity interest in Tata International Limited, a 9.55% equity interest in Tata Industries Limited and a 6.67% equity interest in Tata Projects Ltd, our shareholdings in other the Tata Sons promoted entities are generally insignificant as a percentage of their respective outstanding shares or in terms of the amount of our investment or the market value of our shares of those companies.
II Tata Motors Group:
Subsidiaries and Affiliates
The subsidiaries and equity method affiliates of Tata Motors Limited that together with Tata Motors Limited form the Tata Motors Group under Indian Law as of March 31, 2013 are set forth in the chart below:-
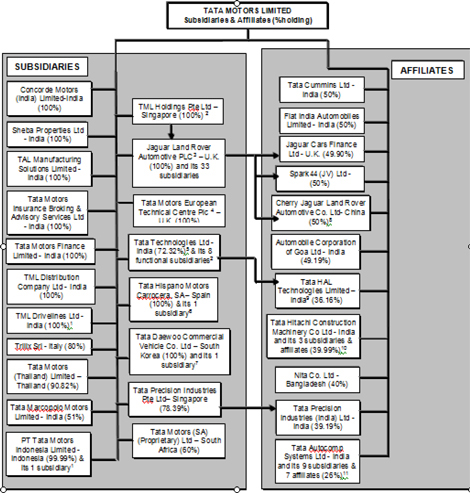
With respect to certain subsidiaries and affiliates, where the Company has a joint venture partner, voting on certain items of business may be based on affirmative voting provisions and Board participation clauses in the relevant joint venture agreement(s).
D. Property, Plants and Equipment.
Facilities: We operate six principal automotive manufacturing facilities in India. The first facility was established in 1945 at Jamshedpur in the State of Jharkhand in eastern India. We commenced construction of the second facility in 1966 (with production commencing in 1976) at Pune, in the State of Maharashtra in western India, the third facility in 1985 (with production commencing in 1992) at Lucknow, in the State of Uttar Pradesh in northern India, the fourth at Pantnagar in the State of Uttarakhand, India, which commenced operations in Fiscal 2008, the fifth at Sanand in Gujarat in western India for manufacturing of the Nano, which commenced operations in June 2010, and the sixth plant for manufacturing Tata Marcopolo buses under our joint venture with Marcopolo and LCV’s at Dharwad in Karnataka (which buses are also produced at Lucknow). The Jamshedpur, Pune, Sanand, Pantnagar and Lucknow manufacturing facilities have been accredited with ISO/TS 16949:2000(E) certification.
The manufacturing facilities of TDCV are based in Gunsan, South Korea.we export vehicles. TDCV has received the ISO/TS 16949 certification, aninsurance coverage as is required and applicable to cover all normal risks in accordance with industry standards in South Korea, including product liability. We have also taken insurance coverage on directors and officers liability to minimize risks associated with international quality systems specification given by SGS UK Ltd., an International Automotive Task Force, or IATF, accredited certification body. It is the first South Korean automobile original equipment manufacturer to be awarded an ISO/TS 16949 certification.
Fiat India Automobiles Limited,litigation for us and our joint venture with Fiat Group, has its manufacturing facility located in Ranjangaon, Maharashtra. The plant is used for manufacturing Tata and Fiat branded cars and engines, and transmissions for use by both partners.
Tata Motors (Thailand) Limited is our joint venture with Thonburi, and has a manufacturing facility located in Samutprakarn province, Thailand. The facility is used for the manufacture and assembly of pickup trucks.
Our 100% equity interest in Hispano provides us with access to two manufacturing units, one in Spain and another in Morocco.
Following our acquisition of Jaguar Land Rover, we currently operate three principal automotive manufacturing facilities in the United Kingdom at Solihull, Castle Bromwich, and Halewood and have two product development facilities in the United Kingdom at Gaydon and Whitley. Most of these facilities are owned as freehold estates or are held through long-term leaseholds, generally with nominal rents. A new advanced engine facility is being established at Wolverhampton in the United Kingdom’s Midlands area to manufacture low-emission engines.subsidiaries.
Jaguar Land Rover and Chery Automobile intend to accelerate plans to build a joint venture manufacturing plant for the Chery Jaguar Land Rover Automotive Co. Limited joint venture in Changshu, near Shanghai, as part of a RMB 10.9 billion investment that will also include a new research and development center and engine production facility. The two companies plan to complete the Changshu facility in Jiangsu province in 2014. Construction of a new engine plant for production of fuel efficient engines is also contemplated under the joint venture agreement.
Jaguar Land Rover’s new Engine Manufacturing Centre in the UK is essential to support the Company’s long-term strategic growth plans and will be the home for a new generation of technologically advanced, lightweight 4-cylinder low emission diesel and gasoline engines. Reinforcing Jaguar Land Rover’s commitment to manufacturing and innovation in the United Kingdom,has global insurance coverage which we will increase its investment in the facility to in excess of GBP 500 million from GBP 355 million. This will almost double the number of highly skilled engineering and manufacturing jobs at the plant, taking the total number of people who will be employed at the site to almost 1,400. The facility is the first in the Jaguar Land Rover’s historyconsider to be entirely designedreasonably sufficient to cover normal risks associated with our operations and specified by Jaguar Land Rover. With an area of almost 100,000 square meters, the plant will include an engine testing center alongside the manufacturinginsurance risks, including property, business interruption, marine and assembly halls.
The facility will endeavor to meet the highest standards of sustainable productionproduct/general liability and will feature a variety of energy efficiency technologies. The new Engine Manufacturing Centrewhich we believe is expected to open later this year with the first engines expected to be produced in 2015.
TMSA, our joint venture with Tata Africa Holdings (SA) (Pty.) Limited for the manufacture and assembly operations of our LCVs and M&HCVs in South Africa, owns and operates a manufacturing facility located in Rosslyn, South Africa.
Description of environmental issues that may affect the Company’s utilization of facilities:
Tata Motors Limited:
As with other participants in the automobile industry around the world, we are exposed to regulatory risks related to climate change. The design and development of fuel efficient vehicles and vehicles running on alternative renewable energy have become a priority as a result of fossil fuel scarcity escalating price and growing awareness about energy efficiency among customers.
We have adopted the Tata Group Climate Change Policy which addresses key climate change issues related to products, processes and services. We are committed to reduction of greenhouse gases emissions throughout the lifecycle of our products and development of fuel efficient and low greenhouse gas emitting vehicles, as an integral part of our product development and manufacturing strategy.
Considering the climate change risk, we are actively involved in partnerships with technology providers to embrace energy efficient technologies not only for products but also for processes and are also participating actively in various national committees in India, which are working on formulating policies and regulations for improvement of the environment, including through reduction of greenhouse gases.
India, as a party to the United Nations Framework Convention on Climate Change, 1992 and its Kyoto Protocol, 1997, has been committed to addressing the global problem on the basis of the principle of “common but differentiated responsibilities and respective capabilities” of the member parties. At present, there are no legally binding targets for greenhouse gas reductions for India as it is a developing country. There are, however, opportunities for minimizing energy consumption through elimination of energy losses during manufacturing, thereby reducing manufacturing costs and increasing productivity.
In order to manage regulatory and general risks of climate change, we are increasingly investing in the design and development of fuel efficient and alternative energy vehicles, in addition to implementing new advanced technologies to increase efficiency of our internal combustion engines. We have manufactured CNG versions of buses, LCVs, and the ACE Xenon, as well as an LPG version of the Indica passenger vehicle.
In September 2010, Tata Motors Limited presented CNG-Electric hybrid low-floor Starbuses to the Delhi Transport Corporation. This was the first time in India that hybrid buses would be used for public transportation. The Tata hybrid Starbus offers substantial improvements in fuel economy compared to a conventional bus. The usage of this technology leads to lower emissions thereby contributing to cleaner air and a greener, more environment-friendly commercial passenger transportation application. Furthermore, we have developed a fuel cell powered bus which will undergo road trials shortly.
Moreover, we are using refrigerants such as R134A in our products in order to minimize our contribution towards greenhouse gas emissions. We also ensure that no refrigerant is released to atmosphere during any service, repair and maintenance of the air-conditioning systems of our vehicles by first recovering the refrigerant charge before the system is serviced and recharged. In addition, since 2009, we have voluntarily disclosed fuel efficiency information for our passenger vehicles in India in accordance with a decision by SIAM. commercial industry standards and statutory requirements.
We are also continuallyinsured by insurers of recognized financial standing against such losses and risks and in such amounts as are prudent and customary in the process of developing products to meet the currentbusiness in which it is engaged. All such insurance is in full force and future emission norms in India and other countries. For example, we offer products which meet the BS III and BS IV norms in India and Euro V norms in International markets.effect.
We also striveare able to increase the proportion of energy sourcedrenew our existing insurance coverage, as and when such policies expire or to obtain comparable coverage from renewables. As one of our prime objectives,similar institutions as may be necessary or appropriate to conduct its business, as now conducted.
Export Promotion Capital Goods
Since Fiscal 1997, we have incorporated environmentally sound practicesbenefited from participation in our processes, products and services.the Export Promotion Capital Goods Scheme, or the EPCG Scheme, which permits us to import capital equipment under a special license at a substantially reduced customs duty. Our manufacturing facilities at Pune, Jamshedpur, Lucknow, Sanand, Dharwad and Pantnagarparticipation in India, each have an Environmental Management System, or EMS, in place and have achieved ISO-14001 certification. We have been implementing various Environment Management Programs, or EMPs, on energy conservation such as reduction in electricity and fuel consumption with resulting reductions in greenhouse gas emissions. We are actively working towards a shift to gas fuels to meet process heat requirements.
Jaguar Land Rover:
Our production facilities arethis scheme is subject to a wide range of environmental, health and safety requirements. These requirements address, among other things, air emissions, wastewater discharges, accidental releases into the environment, human exposureus fulfilling an obligation to hazardous materials, the storage, treatment, transportation and disposal of wastes and hazardous materials, the investigation and clean up of contamination, process safety and the maintenance of safe conditions in the workplace. Many of our operations require permits and controls to monitorexport goods manufactured or prevent pollution. We have incurred, and will continue to incur, substantial ongoing capital and operating expenditures to ensure compliance with current and future environmental, health and safety laws and regulations or their more stringent enforcement. Other environmental, health and safety laws and regulations could impose restrictions or onerous conditions on the availability orproduced by the use of raw materialscapital equipment imported under the Company needs forEPCG Scheme to the value of a multiple of the cost plus insurance and freight value of these imports or customs duty saved over a period of 6, 8 and 12 years from the date of obtaining the special license. We currently hold 101 licenses which require us to export our manufacturing process.
Our manufacturing process resultsproducts of a value of approximately Rs.81.19 billion between the years 2002 to 2021, and we carefully monitor our progress in meeting our incremental milestones. After fulfilling some of the emissionexport obligations as per provisions of greenhouse gases suchForeign Trade Policy, as carbon dioxide. The EU Emissions Tradingat March 31, 2015 we have remaining obligations to export products of a value of approximately Rs.7.09 billion by March 2021. In the event that the export obligation under the EPCG Scheme an EU-wide system in which allowancesis not fulfilled, we would have to emit greenhouse gases are issuedpay the differential between the reduced and traded, is anticipated to cover more industrial facilities and become progressively more stringent over time, including by reducingnormal duty on the number of allowances that will be allocated free of cost to manufacturing facilities.goods imported along with interest. In addition, a number of further legislative and regulatory measures to address greenhouse gas emissions, including national laws and the Kyoto Protocol, 1997 are in various phases of discussion or implementation. These measures could result in increased costs to: (i) operate and maintain our production facilities; (ii) install new emissions controls; (iii) purchase or otherwise obtain allowances to emit greenhouse gases; and (iv) administer and manage the Company’s greenhouse gas emissions program.
Manyview of our sites have an extended historypast record of industrial activity. We may be required to investigateexceeding our export milestones, and remediate contamination at those sites, as well as properties at which we formerly conducted operations, regardless of whether the Company caused the contamination or whether the activity causing the contamination was legal at the time it occurred. In connection with contaminated properties, as well as our operations generally, the Company also could be subject to claims by government authorities, individuals and other third parties seeking damages for alleged personal injury or property damage resulting from hazardous substance contamination or exposure caused by our operations, facilities or products. We could be required to establish or substantially increase financial reserves for such obligations or liabilities and, if we fail to accurately predict the amount or timing of such costs, the related impact on our business, financial condition or results of operations could be material.
We have a good health and safety record. We maintain our plants and facilities with a view to meeting these regulatory requirements and have also put in place a compliance reporting and monitoring process which is intended to help us to mitigate risk.
Production Capacity:
The following table shows our production capacity as of March 31, 2013 and production levels by plant and product type in Fiscal 2013 and 2012:
| Fiscal Year ended March 31, | ||||||||||||
| Production Capacity | Production (Units) | |||||||||||
| 2013 | 2012 | |||||||||||
Tata Motors Plants in India* | ||||||||||||
Medium and Heavy Commercial Vehicles, Light Commercial Vehicles, Utility Vehicles, Passenger Cars, | 1,623,000 | 773,238 | 877,809 | |||||||||
Jaguar Land Rover** | ||||||||||||
Utility Vehicles, Passenger Cars | 514,000 | 385,787 | 320,882 | |||||||||
Other Subsidiary companies plants (excluding Jaguar Land Rover)*** | ||||||||||||
Medium & Heavy Commercial Vehicles, Buses & bus body and Pick-up trucks | 59,088 | 28,272 | 27,843 | |||||||||
Properties:
We produce vehicles and related components and carry out other businesses through various manufacturing facilities. In addition to our manufacturing facilities, our properties include sales offices and other sales facilities in major cities, repair service facilities and research and development facilities.
The following table sets forth information,current plans with respect to our principal facilities, a substantial portion of which are owned by us as of March 31, 2013. The remaining facilities are on leased premises.
|
|
| ||
| ||||
| ||||
| ||||
| ||||
| ||||
| ||||
Notes:
Substantially all ofexport markets, we do not currently foresee any impediments to meeting our owned properties are subject to mortgages in favor of secured lenders and debenture trustees for the benefit of secured debenture holders. A significant portion of our property, plant and equipment except thoseexport obligation in the United Kingdom, is pledged as collateral securing indebtedness incurred by us. We believe that there are no material environmental issues that may affect our utilization of these assets.required time frame.
We have additional property interests in various locations around the world for limited manufacturing, sales offices, and dealer training and testing. The majority of these are housed within leased premises.
Capital work in progress, as at March 31, 2013 includes building of Rs.3,098.8 million on leased land located in the State of West Bengal in India for the purposes of manufacturing automobiles. As a result of the decision to relocate and construct a similar manufacturing facility at, another location, the management was in the process of evaluating several options, under all of which no adjustments to the carrying amount of the buildings was considered necessary. In June 2011, the newly elected Government of West Bengal (referred to as “State Government”) enacted legislation to cancel the land lease agreement.
The Company challenged the legal validity of the legislation. In June 2012, the High Court of Calcutta (referred to as the “High Court”) ruled against the validity of the legislation and restored the Company’s rights under the land lease agreement. The State Government has filed an appeal in the Supreme Court of India. As of the date of the authorization of the financial statements, the Supreme Court has not concluded on the State Government appeal.
The Company reasonably expects that the High Courts’ judgment, based on established law, will be upheld by the Supreme Court. For further details regarding the current legal proceedings with respect to the leased land please refer to Item 4.B “— Business Overview — Legal Proceedings” of this annual report.
We consider all of our principal manufacturing facilities and other significant properties to be in good condition and adequate to meet the needs of our operations.
None.
You should read the following discussion of our financial condition and results of operations together with our consolidated financial statements prepared in conformity with IFRS and information included in this annual report. This discussion and analysis contains forward-looking statements that involve risks, uncertainties and assumptions. Our actual results may differ materially from those anticipated in these forward-looking statements as a result of various factors including, but not limited to, those set forth in Item 3.D and elsewhere in this annual report.
All financial information discussed in this section is derived from our financial statements included in this annual report on Form 20-F, which has been prepared in accordance with International Financial Reporting Standards as issued by International Accounting Standards Board.
Overview
In Fiscal 2013, our total revenue (net of excise duties) including finance revenues increased by 13.5% to Rs.1,889,860 million from Rs.1,664,853 million in Fiscal 2012. We recorded a net income (attributable to shareholders of the Company) of Rs.88,697 million in Fiscal 2013, representing a decline of 23.3% or Rs.26,962 million over net income in Fiscal 2012 of Rs.115,659 million.
Automotive operations
Automotive operations are our most significant segment, accounting for 99.4%, 99.4 % and 99.3% of our total revenues for Fiscal 2013, 2012, and 2011, respectively. For Fiscal 2013, revenue from automotive operations before inter-segment eliminations was Rs.1,878,571 million as compared to Rs.1,654,903 million for Fiscal 2012 and Rs.1,223,547million for Fiscal 2011.
Our automotive operations include:
All activities relating to the development, design, manufacture, assembly and sale of vehicles as well as related spare parts and accessories;
Distribution and service of vehicles; and
Financing of our vehicles in certain markets.
Our automotive operations segment is further divided into Tata and other brand vehicles including spares and financing thereof and the Jaguar Land Rover business. For Fiscal 2013, Jaguar Land Rover contributed 72.7% (63.1% for Fiscal 2012) of our total automotive revenue (before intra segment elimination) and the remaining 27.3% (36.9% or Fiscal 2012) was contributed by Tata and other brand vehicles.
Tata and other brands vehicles (including spares and financing thereof)
India is the major market for Tata and other brand vehicles (including spares and financing thereof). During Fiscal 2013, there was a significant deterioration in terms of macro-economic factors leading to volume contraction and competitive pressures across all major products.
The Indian economy continued to deteriorate in Fiscal 2013, recording a lower GDP growth of 5%, compared to 6.2% for Fiscal 2012 (based on data from the Ministry of Statistics and Programme Implementation). In Fiscal 2011, the inflationary pressures started mounting and the RBI started tightening monetary policy, which impacted growth. During Fiscal 2013, the moderation in growth was primarily attributable to weakness in industry. Furthermore, as the pace of growth started slowing down, government revenues started shrinking, exposing the economy to a higher fiscal deficit. The current account deficit also widened. Beginning in Fiscal 2012, corporate and infrastructure investment started slowing down mainly due to investment bottlenecks and tight monetary policy. Government expenditure on infrastructure and other key sectors declined. With the continued high interest rates and inflation, households were forced to spend more on essentials and discretionary spending was reduced, leading to the deferral of significant purchase decisions. The continued stagnation of industrial growth mainly in the areas of mining and quarrying, and manufacturing and infrastructure, adversely impacted the domestic auto industry. As a result, as compared to prior years, the domestic auto industry recorded an insignificant growth on an overall basis.
Sales of our commercial vehicles in India increased marginally by 1.0% to 536,491 units in Fiscal 2013 from 531,228 units in Fiscal 2012. The demand in the M&HCV category fell by 23.3% from Fiscal 2012, due to lower industrial growth and a significant reduction in infrastructure spending. However, the LCV category grew by 17.9% in Fiscal 2013, largely supported by demand for small commercial vehicles driven by certain niche segments. We also improved LCV volume performance in the pickup truck segment realizing sales of 393,726 units, an increase of 21.5% over 324,069 units sold in Fiscal 2012. Sales of the Tata Ace continued to increase year-on-year.
We launched several products and variants in the M&HCV category in Fiscal 2013, one of which was the first in class five axle rigid truck, the LPT 3723. The new generation LCV Ultra bus was launched during Fiscal 2013. A micro-segmentation effort was used to further grow market share in key markets.
Our passenger vehicle (including UV) sales in India decreased to 219,190 units in Fiscal 2013 from 347,323 units in Fiscal 2012. Domestic passenger vehicle sales were impacted by rising interest rates, fuel price hikes, inflationary pressures and intense competition. We sold 48,123 Nano cars in Fiscal 2013, a decrease of 37.8% over 77,394 units in Fiscal 2012. We have taken many initiatives to generate demand for the Nano, through Special Nano Access Points and ensuring availability of finance. We continue to offer products in the entry level, mid-size sedan market, through a portfolio including the original Indigo, the Indigo eCS, the Indigo Manza and the Indigo Manza club class. Our sales in the mid-size category reduced in Fiscal 2013, as competition severely intensified with multiple new launches from other players in this segment.
In the UV category, we sold 46,366 units in Fiscal 2013, representing a decrease of 16.6% from 55,592 units in Fiscal 2012. The decrease was mainly due to absence of appropriate products in the fast growing soft road UV segment, although this category of the automotive industry in India grew by 51.5% in Fiscal 2013.
Our overall sales in international markets decreased by 16.2% to 64,242 units in Fiscal 2013, as compared to 76,682 units in Fiscal 2012. Our exports of vehicles manufactured in India decreased by 22.1% in Fiscal 2013 to 48,145 units from 61,835 units in Fiscal 2012. The decrease in exports was attributable to the recent unrest in the Middle East and parts of Africa. For Tata Motors, traditionally strong markets in South Asia, such as Bangladesh, also were affected by internal conflict and unrest. Regulatory changes in certain other key markets, such as Sri Lanka, where the duties and taxes increased by approximately 20% to 100% depending on the type of product, introduced by the Sri Lankan Government to curb the imports, also affected our sales.
TDCV, our subsidiary company engaged in design, development and manufacturing of M&HCVs, recorded a 5% increase in its overall vehicle sales to 9,974 units in Fiscal 2013, from 9,500 units in Fiscal 2012. TDCV exported 4,700 units in Fiscal 2013, compared to 2,948 units in Fiscal 2012, an increase of 59.4%. TDCV’s sales increased significantly in some of its traditional export markets like Algeria, Russia, Laos, South Africa, and Vietnam. TDCV has also commenced offering its products in some new markets like Indonesia, Ecuador, and Ghana with a view to diversify its market. In the South Korean market, TDCV’s sales decreased by 17.6% from 6,552 units in Fiscal 2012 to 5,400 units in Fiscal 2013, primarily as a result of a slowdown in the South Korean economy.
Our overall vehicle sales decreased by 14.2% to 819,923 units in Fiscal 2013 from 955,233 units in Fiscal 2012, resulting in a revenue (before inter-segment elimination) decrease of 15.9% to Rs.513,817 million in Fiscal 2013, compared to Rs.611,048 million in Fiscal 2012. The decrease was mainly attributable to significant reduction in volumes on account of adverse economic factors in India and further accentuated by intense competitive pressures.
There was an increase in spares and after sales activity by 10.2% to Rs.38,802 million in Fiscal 2013, compared to Rs.35,221 million in Fiscal 2012.
Revenue from our vehicle financing operations increased by 23.3% to Rs.30,013 million in Fiscal 2013 as compared to Rs.24,340 million in Fiscal 2012. In response to significant competitive pressures, we focused on market penetration, resulting in volume growth of Rs.3,789 million. Revenues from our vehicle financing operations were also favorably impacted by increasing interest rates.
Earnings before other income, interest and tax before inter-segment eliminations from Tata and other brand vehicles/spares and financing thereof decreased by 73.8% to Rs.10,701 million in Fiscal 2013, compared to Rs.40,884 million in Fiscal 2012. Our reduced profitability was mainly a consequence of lower operating margins resulting from the decrease in revenues and the incurrence of fixed costs which were spread over lower volumes. Further, there was an increase in depreciation expense as a result of additions to plant / facility in recent years, and in amortization expense in respect of new products launched.
Automotive operations - Jaguar Land Rover
Jaguar Land Rover had a successful year of continued growth in all markets, including 48% year on year growth in China retail sales. Jaguar Land Rover also significantly improved sales in more developed economies, where, despite uncertain trading conditions, it has increased volumes in all major markets. The volume growth has been driven by a full year of Range Rover Evoque sales, new Jaguar product lines and increasing sales of our existing models.
Retail volumes in Fiscal 2013 were 374,636 units, an increase of 22% compared to the prior year. Retail volumes were 58,593 units for Jaguar and 316,043 units for Land Rover, growth of 8% and 26%, respectively. Retail volumes in Europe were 80,994, a 18% increase on the prior year. Retail volumes in the United Kingdom were 72,270 units, a 20% increase on the prior year, while the North American retail volumes were 62,959, representing an increase of 9%. Retail volumes in key growth markets increased significantly, with China retail volumes of 77,075, a 48% increase, with Asia Pacific of 17,849, a 27% increase and with other markets of 63,489, a 19% increase, respectively, compared to the previous year.
Wholesale volumes for Jaguar in Fiscal 2013 were 57,766 units, representing an increase of 7.0% as compared to 53,990 units sold in Fiscal 2012. Wholesale volumes for Land Rover in Fiscal 2013 were 314,290 units, representing an increase of 20.8% over sales of 260,260 units in Fiscal 2012.
Revenues (before inter-segment eliminations) for Jaguar Land Rover were Rs.1,365,620 million for Fiscal 2013, compared to Rs.1,044,533 million for Fiscal 2012, representing a 30.7% increase over Fiscal 2012. The increase was primarily driven by demand for both brands as well as a strong product and market mix, supported by favourable exchange rates. The revenues were also positively impacted by translation gain, of approximately Rs.140,655 million.
For Fiscal 2013, the Jaguar Land Rover business reported earnings before other income, interest and tax before inter-segment eliminations of Rs.150,687 million, as compared to Rs.118,895 million for Fiscal 2012, representing an increase of 26.7% over Fiscal 2012. The improvement in profitability was mainly attributable to an increase in volumes, introduction of the new Range Rover, a full year of the Range Rover Evoque and the new variants of the Jaguar XF as well as the continued strength of the Range Rover Sport. Further, the performance was also supported by the positive impact of the continuing strength of the US dollar against the GBP and the Euro, improving its revenues against the backdrop of a largely GBP and Euro cost base. The reported earnings before other income, interest and tax also have an element of foreign currency translation gain.
Other Operations
In addition to our automotive operations, we are also involved in other business activities, including information technology services. Net revenues, before inter-segment elimination, from these activities totaled Rs.27,152 million, Rs.24,989 million and Rs.22,179 million in Fiscal 2015, 2014 and 2013, respectively, representing nearly 1.0%, 1.1% and 1.2% of our total revenues before inter-segment elimination in the corresponding Fiscal periods.
Information Technology Services
As at March 31, 2015, we owned a 72.32% equity interest in our subsidiary, TTL. TTL, founded in 1994 and a part of Tata Motors Group, provides product development IT services solutions for PLM and Enterprise Resource Management, or ERM, to automotive, aerospace and consumer durables manufacturers and their suppliers. TTL’s services include product design, analysis and production engineering, knowledge-based engineering, PLM, ERM and CRM systems. TTL also distributes, implements and supports PLM products from leading solution providers in the world such as Dassault Systems and Autodesk.
TTL has its international headquarters in Singapore, with regional headquarters in the United States, India and the United Kingdom. In Fiscal 2014, TTL acquired Cambric Corporation, an engineering services organization, to achieve greater domain expertise and presence in the industrial equipment sector. TTL has a combined global workforce of around 7,804 professionals serving clients worldwide from facilities in the North America, Europe, and Asia Pacific regions. TTL responds to customers’ needs through its subsidiary companies and through its offshore development centers in India, Thailand and Romania. TTL had 14 functional subsidiary companies and one joint venture as at March 31, 2014.
The consolidated revenues of TTL increased by 10.3% in Fiscal 2015 to Rs.26,170 million (including sales to Tata Motors Limited and its consolidated subsidiaries) from Rs.23,724 million in Fiscal 2014 due to operations in the automotive and aerospace markets. TTL recorded profit after tax of Rs.3,349 million in Fiscal 2015, reflecting an increase of 26.8% over Rs.2,642 million in Fiscal 2014.
Research and Development
Over the years, we have devoted significant resources towards our research and development activities. Our research and product development costs in Fiscal 2015, 2014 and 2013 were Rs. 28,515.3 million, Rs. 25,651 million and Rs. 20,340 million, respectively. Our research and development activities focus on product development, environmental technologies and vehicle safety. In India, our Engineering Research Centre, or ERC, established in 1966, is one of the few in-house automotive research and development centers in India recognized by the Government of India. The ERC is integrated with all of the Tata Motors Global Automotive Product Design and Development Centers in South Korea, Italy and the United Kingdom. In addition to this, we leverage key competencies through various engineering service suppliers and design teams of its suppliers.
We have a new passenger car electrical and electronics facility for the development of hardware-in-the-loop systems, labcars and infotainment systems to achieve system and component integration. We have an advance engineering workshop, with a lithium-ion battery module, for the development of electric vehicle and hybrid products. We have a crash test facility for passive safety development in order to meet regulatory and consumer group test requirements and evaluate occupant safety, which includes a full vehicle-level crash test facility, a sled test facility for simulating the crash environment on subsystems, a pedestrian safety testing facility, a high strain rate machine and a pendulum impact test facility for goods carrier vehicles. This facility is also supported with computer-aided engineering infrastructure to simulate tests in a digital environment. Our safety development facilities also incorporate other equipment that we believe will help improve the safety and design of our vehicles, such as an emission labs engine development facility, a testing facility for developing vehicles with lower noise and vibration levels, an engine emission and performance development facility and an eight poster test facility that helps to assess structural durability of M&HCVs. In addition, we are installing a new engine noise test facility and transmission control unit which we expect will aid in powertrain development. Other key facilities include a full vehicle environmental testing facility, material pair compatibility equipment, corrosion test facility, heavy duty dynamometers and aggregate endurance test rigs.
Our product design and development centers aim to create a highly scalable digital product development and virtual testing and validation environment, targeting a reduction in product development cycle-time, improved quality and the ability to create multiple design options. Global design studios are key part of our product conceptualization strategy. We have aligned our end-to-end digital product development objectives and infrastructure with our business goals and have made significant investments to enhance our capabilities, especially in the areas of product development through computer-aided design, computer aided manufacturing, computer-aided engineering, knowledge-based engineering, product lifecycle management and manufacturing planning. In specific engineering review processes, such as digital mock-up and virtual build and validation, we have been able to provide capabilities for reduced time and increased quality in product designs. The design IP is managed through a product lifecycle management system, enabling backbone processes, and we have institutionalized “issue tracking” work-flow based systems in various domains to manage them effectively.
We have begun developing a technology platform for small electric vehicles with a GVW of one ton or greater with the National Automotive Board, SIAM and other OEMs. In addition, our research and development activities also focus on developing vehicles that consume alternative fuels, including CNG, liquefied petroleum gas, bio-diesel, compressed air and electricity. We are continuing to develop green-technology vehicles and are presently developing an electric vehicle on a small commercial vehicle platform. We are also pursuing alternative fuel options such as ethanol blending. Furthermore, we are working on development of vehicles fueled by hydrogen.
We are also pursuing various initiatives, such as the introduction of premium lightweight architecture, to enable our business to comply with the existing and evolving emissions legislations in the developed world, which we believe will be a key enabler of both reduction in CO2 and further efficiencies in manufacturing and engineering.
We have implemented initiatives in vehicle electronics, such as engine management systems, in-vehicle network architecture and multiplexed wiring. We are in the process of implementing electronic stability programs, automated and automatic transmission systems, telematics for communication and tracking, anti-lock braking systems and intelligent transportation systems. We have implemented new driver information technologies and high performance infotainment systems with IT enabled services. Likewise, various new technologies and systems including hybrid technologies that would improve the safety, performance and emissions of our product range and are being implemented in our passenger cars and commercial vehicles.
We are developing an enterprise-level vehicle diagnostics system with global connectivity in order to achieve faster diagnostics of complex electronics in vehicles in order to provide prompt service to customers. We are also developing prognostic data collection and analysis for failure prediction to the end customer. Furthermore, our initiative in telematics has spanned into a fleet management, driver information and navigation systems, and vehicle tracking system using global navigation satellite systems. We intend to incorporate Wi-Fi and Bluetooth interfaces in our vehicles to facilitate secure and controlled connectivity to third-party IT enabled devices.
Jaguar Land Rover’s research and development operations are built around engineering facilities that feature an extensive test track, testing centers, design hubs and a recently inaugurated virtual innovation center. The ERC in India and Jaguar Land Rover’s engineering and development operations in the United Kingdom have identified areas to leverage the facilities and resources to enhance the product development process and achieve economies of scale.
Jaguar Land Rover’s two design and development centers are equipped with computer-aided design, manufacturing and engineering tools configured to support an ambitious product development cycle plan. In recent years, Jaguar Land Rover has refreshed the entire Jaguar range under a unified concept and design language and has continued to enhance the design of Land Rover’s range of all-terrain vehicles. Jaguar Land Rover’s R&D operations look for synergies through sharing premium technologies, powertrain designs and vehicle architecture. The majority of Jaguar Land Rover’s products are designed and engineered in the United Kingdom. Jaguar Land Rover endeavors to implement the best technologies into its product range to meet the requirements of a globally competitive market and to comply with regulatory requirements. Jaguar Land Rover currently offers hybrid technology on some of its models such as the Range Rover and Range Rover Sport and conducts research and development related to the further application of alternative fuels and technologies to further improve the environmental performance of its vehicles, including the reduction of CO2 emissions.
We endeavor to absorb the best of technologies for our product range to meet the requirements of a globally competitive market. All of our vehicles and engines are compliant with the prevalent regulatory norms in the respective countries in which they are sold.
Intellectual Property
We create, own, and maintain a wide array of intellectual property assets throughout the world that are among our most valuable assets. Our intellectual property assets include patents, trademarks, copyrights designs, trade secrets and other intellectual property rights. We proactively and aggressively seek to protect our intellectual property in India and other countries.
We own a number of patents and have applied for new patents which are pending for grant in India as well as in other countries. We have also filed a number of patent applications outside India under the Patent Cooperation Treaty, which we expect will be effective in other countries going forward. We also obtain new patents as part of our ongoing research and development activities.
We own registrations for a number of trademarks and have pending applications for registration of these in India as well as other countries. The registrations mainly include trademarks for our vehicle models and other promotional initiatives. We use the Tata brand, which has been licensed to us by Tata Sons. We believe that establishment of the Tata word mark and logo mark in India and around the world is material to our operations. As part of our acquisition of TDCV, we have rights to the perpetual and exclusive use of the Daewoo brand and trademarks in South Korea and overseas markets for the product range of TDCV.
As part of the acquisition of our Jaguar Land Rover business, ownership (or co-ownership, as applicable) of core intellectual property associated with Jaguar Land Rover was transferred to us; however such intellectual property is still ultimately owned by Jaguar Land Rover entities. Additionally, perpetual royalty-free licenses to use other essential intellectual property have been granted to us for use in Jaguar and Land Rover vehicles. Jaguar Land Rover owns registered designs to protect the design of its vehicles in several countries.
In varying degrees, all of our intellectual property is important to us. In particular, the Tata, Jaguar, Land Rover and Range Rover brands are integral to the conduct of our business, a loss of which could lead to dilution of our brand image and have a material adverse effect on our business.
Components and Raw Materials
The principal materials and components required by us for use in Tata and other brand vehicles are steel sheets (forin-house stampings) and plates, iron and steel castings and forgings, items such as alloy wheels, tires, fuel injection systems, batteries, electrical wiring systems, electronic information systems and displays, interior systems such as seats, cockpits, doors, plastic finishers and plastic functional parts, glass and consumables, such as paints, oils, thinner, welding consumables, chemicals, adhesives and sealants, and fuels. We also require aggregates such as axles, engines, gear boxes and cams for our vehicles, which are manufactured in-house or by our subsidiaries, affiliates, joint ventures or operations and strategic suppliers. We have long-term purchase agreements for certain critical components such as transmissions and engines. We have established contracts with certain commodity suppliers to cover our own as well as our suppliers’ requirements in order to moderate the effect of volatility in commodity prices. We have also undertaken special initiatives to reduce material consumption through value engineering and value analysis techniques.
Our sourcing department in India has four divisions, namely, Purchasing, Supplier Quality, Supply Chain and Production and Planning Management or PPM. The reorganization was done with a view to establish and define responsibility and accountability in the sourcing department. Purchasing oversees the commercial aspects of product sourcing, Supplier Quality is primarily responsible for maintaining the quality of supplies that we purchase, Supply Chain oversees the logistics of the supply and delivery of parts for our vendors while PPM oversees execution of new projects.
As part of our strategy to become a low-cost vehicle manufacturer, we have undertaken various initiatives to reduce our fixed and variable costs. In India we started an e-sourcing initiative in 2002, pursuant to which we procure some supplies through reverse auctions. We also use external agencies as third party logistic providers. This has resulted in space and cost savings. Our initiatives to leverage information technology in supply chain activities have resulted in improved efficiency through real time information exchange and processing with our suppliers.
We have an established supplier quality sixteen step process in order to ensure quality of outsourced components. We formalized the component development process using Automotive Industry Action Group guidelines. We also have a program for assisting vendors from whom we purchase raw materials or components to maintain quality. Preference is given to vendors with TS 16949 certification. We also maintain a stringent quality assurance program that includes random testing of production samples, frequent re-calibration of production equipment and analysis of post-production vehicle performance, as well as an ongoing dialogue with workers to reduce production defects.
We are also exploring opportunities for increasing the global sourcing of parts and components from low cost countries, and have in place a vendor management program that includes vendor base rationalization, vendor quality improvement and vendor satisfaction surveys. We have begun to include our supply chain in our initiatives on social accountability and environment management activities, including supply chain carbon footprint measurement and knowledge sharing on various environmental aspects.
The principal materials and components required for use in our Jaguar Land Rover vehicles are steel and aluminum sheets, aluminum castings and extrusions, iron and steel castings and forgings, and items such as alloy wheels, tires, fuel injection systems, batteries, electrical wiring systems, electronic information systems and displays, leather-trimmed interior systems such as seats, cockpits and doors, plastic finishers and plastic functional parts, glass and consumables, such as paints, oils, thinner, welding consumables, chemicals, adhesives and sealants, and fuels. Jaguar Land Rover also requires certain highly functional components such as axles, engines and gear boxes for its vehicles, which are mainly manufactured by strategic suppliers. We have long-term purchase agreements for critical components such as transmissions with ZF Friedrichshafen AG and for engines with Ford and the Ford-PSA Peugeot Citroën joint venture, or the Ford-PSA joint venture. The components and raw materials in Jaguar Land Rover cars include steel, aluminum, copper, platinum and other commodities. Jaguar Land Rover has established contracts with certain commodity suppliers, such as Novelis, to cover its own and its suppliers’ requirements to mitigate the effect of high volatility. Special initiatives are also undertaken to reduce material consumption through value engineering and value analysis techniques.
Jaguar Land Rover works with a range of strategic suppliers to meet their requirements for parts and components, and we endeavor to work closely with our suppliers to form short- and medium-term plans for our business. We have established quality control programs to ensure that externally purchased raw materials and components are monitored and meet our quality standards. Jaguar Land Rover also outsources many of the manufacturing processes and activities to various suppliers. Where this is the case, Jaguar Land Rover provides training to the outside suppliers who design and manufacture the required tooling and fixtures. Such programs include site engineers who regularly interface with suppliers and carry out visits to supplier sites to ensure that relevant quality standards are being met. Site engineers are also supported by persons in other functions, such as program engineers who interface with new model teams as well as resident engineers located at Jaguar Land Rover plants, who provide the link between the site engineers and the plants. Jaguar Land Rover has in the past worked, and expect to continue to work, with its suppliers to optimize their procurements, including by sourcing certain raw materials and component requirements from low-cost countries.
Although we have commenced production of Ingenium four cylinder (2.0-liter) engines which will be installed in the Jaguar XE from 2015, at present we continue to source all of our engines from Ford or the joint venture between Ford and PSA on an arm’s-length basis.
Suppliers
We have an extensive supply chain for procuring various components. We also outsource many manufacturing processes and activities to various suppliers. In such cases, we provide training to external suppliers who design and manufacture the required tools and fixtures.
Our associate company, Tata AutoComp Systems Ltd., or TACO, manufactures automotive components and encourages the entry of internationally acclaimed automotive component manufacturers into India by setting up joint ventures with them.
Our other suppliers include some of the large Indian automotive supplier groups with multiple product offerings, such as the Anand Group, the Sona Group, and the TVS Group, as well as large multinational suppliers, such as Bosch, Continental, Delphi and Denso, Johnson Controls Limited for seats and Yazaki AutoComp Limited for wiring harnesses. We continue to work with our suppliers for our Jaguar Land Rover business to optimize procurements and enhance our supplier base, including for the sourcing of certain of our raw material and component requirements. In addition, the co-development of various components, such as engines, axles and transmissions also continue to be evaluated, which we believe may lead to the development of a low-cost supplier base for Jaguar Land Rover.
In India, we have established vendor parks in the vicinity of our manufacturing operations and vendor clusters have been formed at our facilities at Pantnagar and Sanand. This initiative is aimed at ensuring availability of component supplies on a real-time basis, thereby reducing logistics and inventory costs as well as reducing uncertainties in the long distance supply chain. Efforts are being taken to replicate the model at new upcoming locations as well as a few existing plant locations.
As part of our pursuit of continued improvement in procurement, we have integrated our system for electronic interchange of data with our suppliers. This has facilitated real time information exchange and processing, which enables us to manage our supply chain more effectively.
We have established processes to encourage improvements through knowledge sharing among our vendors through an initiative called the Vendor Council, which consists of our senior executives and representatives of major suppliers. The Vendor Council also helps in addressing common concerns through joint deliberations. The Vendor Council works on four critical aspects of engagement between us and the suppliers: quality, efficiency, relationships and new technology development.
We import some components that are either not available in the domestic market or when equivalent domestically-available components do not meet our quality standards. We also import products to take advantage of lower prices in foreign markets, such as special steels, wheel rims and power steering assemblies.
Ford has been and continues to be a major supplier of parts and services to Jaguar Land Rover. In connection with our acquisition of Jaguar Land Rover in June 2008, long-term agreements were entered into with Ford for technology sharing and joint development providing technical support across a range of technologies focused mainly around power train engineering so that we may continue to operate according to our existing business plan. Supply agreements, were entered into with Ford for (i) the long term supply of engines developed by Ford, (ii) engines developed by us but manufactured by Ford and (iii) engines from the Ford-PSA joint venture.
Following the global financial crisis and its cascading effect on the financial health of our suppliers, we have commenced efforts to assess supplier financial risk.
Suppliers are appraised based on our long-term requirements through a number of platforms such as Vendor Council meetings, council regional chapter meetings, national vendor meets and location-specific vendor meets.
Capital and Product Development Expenditures
Our capital expenditure totaled Rs.335,771 million, Rs.272,832 million and Rs.212,078 million during Fiscal 2015, 2014 and 2013, respectively. Our capital expenditure during the past three Fiscal years related primarily to new product development and capacity expansion for new and existing products to meet market demand as well as investments towards improving quality, reliability and productivity that are each aimed at increasing operational efficiency.
We intend to continue to invest in our business units in general, and in research and product development in particular, over the next several years in order to improve our existing product range, develop new products and platforms and to build and expand our portfolio in the passenger vehicle and commercial vehicle categories. We believe this will strengthen our position in the Indian automotive market and help us to grow our market share internationally.
As part of this future growth strategy, we plan to make investments in product development, capital expenditure in capacity enhancement, plant renewal and modernization and to pursue other growth opportunities. Our subsidiaries also have their individual growth plans and related capital expenditure plans. These expenditures are expected to be funded largely through cash generated from operations, existing investible surplus in the form of cash and cash equivalents, investment securities and other external financing sources.
Governmental Regulations
Governmental Regulations in India
Automotive Mission Plan, 2006-2016
The automotive mission plan, or Plan 2006, promulgated by the Ministry of Heavy Industries and Public Enterprises of the Government of India in December 2006, consists of recommendations to the task force of the Development Council on Automobile and Allied Industries constituted by the Government of India in relation to the preparation of the mission plan for the Indian automotive industry. Plan 2006 recommends that a negative list of items, such as no duty concessions for the import of used or remanufactured vehicles, or treatment of remanufactured automotive products as old products, should be negotiated for free trade agreements or regional trade agreements, on a case-by-case basis with other countries. It recommends the adoption of appropriate tariff policies to attract more investment into the automobile industry, the improvement of power infrastructure to facilitate faster growth of the automotive sector both domestically and internationally, policy initiatives such as encouragement of collaboration between the automotive industry and research and academic institutions, tax concessions and incentives to enhance competitiveness in manufacturing and promotion of research and technology development. For the promotion of exports in the automotive components sector, among other things, it recommends the creation of special automotive component parks in special economic zones and the creation of virtual special economic zones, which would enjoy certain exemptions on sales tax, excise duty and customs duty. Other major recommendations of the plan include strengthening the inspection and certification system by encouraging public-private partnerships and rationalization of motor vehicles regulations.
A committee set up under the chairmanship of the Secretary of the Ministry of Heavy Industries and Public Enterprises consisting of all stakeholders, including representatives of the Ministry of Finance, and of other interested parties relating to road transport, the environment, commerce, industrial policy and promotion, labor, shipping, railways, human resource development, science and technology, new and renewable energy, petroleum and natural gas and the automotive industry, will monitor the implementation and progress of Plan 2006.
As of the date of this annual report on Form 20-F, Plan 2006 is being reviewed by Ministry of Heavy Industries and Public Enterprises of the Government of India.
The Auto Policy, 2002
The Auto Policy was introduced by the Department of Heavy Industry, Ministry of Heavy Industries and Public Enterprises of the Government of India in March 2002, with the aims, among other things, of promoting a globally competitive automotive industry that would emerge as a global source for automotive components, establishing an international hub for manufacturing small, affordable passenger cars, ensuring a balanced transition to open trade at a minimal risk to the Indian economy and local industry, encouraging modernization of the industry and facilitating indigenous design, research and development, as well as developing domestic safety and environment standards on par with international standards.
Auto Fuel Vision & Policy 2025
The Ministry of Petroleum and Natural Gas constituted an expert committee under the Chairmanship of Shri Saumitra Chaudhuri, Member Planning Commission, on December 19, 2012. Its objective was to recommend auto fuel quality applicable through model year 2025. The committee in its draft report has recommended Bharat Stage IV compliant fuel across the country by 2017 and Bharat Stage V compliant fuel with 10 ppm of sulphur to be made available from 2020 onwards. The draft report proposes nationwide Bharat Stage V emission norms for new 4 wheelers from model year 2020 and for all 4 wheelers from model year 2021. It also recommends Bharat Stage VI emissions norms from 2024 onwards. In April 2014, the expert committee submitted its recommendations to the committee empowered by the Ministry of Petroleum and Natural Gas, which has proposed the advancement of emission norms by one year earlier than the expert committee’s recommendations, which would result in the implementation of Bharat Stage V emission norms starting in model year 2019 and Bharat Stage VI emissions norms starting in model year 2023.
Central Motors Vehicles Rules, 1989
Chapter V of the Central Motor Vehicle Rules, 1989, or the CMV Rules, sets forth provisions relating to construction, equipment and maintenance of motor vehicles, including specifications for dimensions, gears, indicators, reflectors, lights, horns, safety belts and others. The CMV Rules govern emission standards for vehicles operating on compressed natural gas or CNG, gasoline, liquefied petroleum gas and diesel.
On and from the date of commencement of the CMV (Amendment) Rules, 1993, every manufacturer must submit the prototype of every vehicle to be manufactured by it for testing by the Vehicle Research and Development Establishment of the Ministry of Defense of the Government of India, the Automotive Research Association of India, Pune, the Central Machinery Testing and Training Institute, Budni (MP), the Indian Institute of Petroleum, Dehradun, the Central Institute of Road Transport, Pune, the International Center for Automotive Technology, Manesar or such other agencies as may be specified by the central government for granting a certificate by that agency as to the compliance of provisions of the Motor Vehicles Act, and the CMV Rules.
The CMV Rules also require the manufacturers to comply with notifications in the Official Gazette, issued by Government of India, to use such parts, components or assemblies in the manufacture of certain vehicles according to standards specified by either the Automotive Industry Standards Committee or the Bureau of Indian Standards.
The existing CMV Rules would be replaced by the Road Transport and Safety Bill (RTSB) 2015, which is subject to legislative approval by the Parliament, which could expose us to additional liability for vehicle recalls and for manufacturer’s liability for our vehicles.
Emission and Safety in India
In 1992, the Government of India issued emission and safety standards, which were further tightened in April 1996, under the Indian Motor Vehicle Act. Currently Bharat Stage IV norms, which are equivalent to Euro IV norms, are in force for four-wheelers in 13 cities and Bharat Stage III norms, which are equivalent to Euro III norms, are in effect in the rest of India. Our vehicles comply with these norms. In 2014, the Ministry of Road Transport and Highways has extended Bharat Stage IV norms in 20 additional cities. In its draft GSR No.247 (E), dated April 1, 2015, the Ministry of Road Transport and Highways proposed the further extension of Bharat Stage IV norms in 30 additional cities starting July 1, 2015.
We are also working towards meeting all applicable regulations which we believe are likely to come into effect in various markets in the near future. Our vehicle exports to Europe comply with Euro V norms, and we believe our vehicles also comply with the various safety regulations in effect in the other international markets where we operate.
The Indian automobile industry is progressively harmonizing its safety regulations with international standards in order to facilitate sustained growth of the Indian automobile industry as well as to encourage export of automobiles from India.
India has been a signatory to the 1998 UNECE Agreement on Global Technical Regulations since April 22, 2006 and has voted in favor of all eleven Global Technical Regulations. We work closely with the Government of India to participate in WP 29 World Forum Harmonization activities.
India has a well-established regulatory framework administered by the Indian Ministry of Road Transport and Highways. The Ministry issues notifications under the CMV Rules and the Motor Vehicles Act. Vehicles manufactured in India must comply with applicable Indian standards and automotive industry standards. In January 2002, the Indian Ministry of Road Transport and Highways has finalized plans on implementing automobile safety standards. The plans are based on traffic conditions, traffic density, driving habits and road user behavior in India and is generally aimed at increasing safety requirements for vehicles under consideration for Indian markets.
The Essential Commodities Act, 1955
The Essential Commodities Act, 1955, as amended by the Essential Commodities (Amendment and Validation) Act, 2009, or the Essential Commodities Act, authorizes the Government of India, if it finds it necessary or expedient to do so, to provide for regulating or prohibiting the production, supply, distribution, trade and commerce in the specified commodities under the Essential Commodities Act, in order to maintain or increase supplies of any essential commodity or to secure their equitable distribution and availability at fair prices, or to secure any essential commodity for the defense of India or the efficient conduct of military operations. The definition of “essential commodity” under the Essential Commodities Act includes “component parts and accessories of automobiles”.
Environmental Regulations
Manufacturing units or plants must ensure compliance with environmental legislation, such as the Water (Prevention and Control of Pollution) Act, 1974, the Air (Prevention and Control of Pollution) Act, 1981, the Environment Protection Act, 1986 and the Hazardous Wastes (Management and Handling and Transboundary Movement) Rules, 2008. The basic purpose of these statutes is to control, abate and prevent pollution. In order to achieve these objectives, Pollution Control Boards, or PCBs, which are vested with diverse powers to deal with water and air pollution, have been set up in each state. The PCBs are responsible for establishing standards for maintenance of clean air and water, directing the installation of pollution control devices in industries and undertaking inspection to ensure that units or plants are functioning in compliance with the standards prescribed. These authorities also have the power of search, seizure and investigation. All of our manufacturing plants are either in possession of current, valid Consents to Operate and Hazardous Waste Authorisations or are in the process of renewing their Consents to Operate and Hazardous Waste Authorisations from the respective state PCBs of the states where they operate.
The Ministry of Environment and Forests under the Government of India receives proposals for expansion, modernization and establishment of projects and the impact of such projects on the environment are assessed by the Ministry, before it grants environmental clearances for the proposed projects under the Environmental Impact Assessment Notification and Rules. All of our manufacturing plants have obtained environmental clearances for specific projects in the past as and when mandated.
We ensure that all prescribed norms are followed for management of waste and we have made significant investments towards pollution control and environmental protection at our manufacturing plants.
Regulation of Imports and Exports
Regulation of quantitative restrictions on imports into India were liberalized with effect from April 1, 2001, pursuant to India’s World Trade Organization obligations, and imports of capital goods and automotive components were placed under the open general license category.
Automobiles and automotive components may, generally, be imported into India without a license from the Government of India subject to their meeting Indian standards and regulations, as specified by designated testing agencies. As a general matter, cars, UVs and SUVs in completely built up, or CBU, condition may be imported at 60% basic customs duty. However, cars with cost, insurance and freight value of more than US$40,000 or with engine capacities greater than 3,000 cubic centimeters for diesel variants and 2,500 cubic centimeters for gasoline variants, may be imported at a 100% basic customs duty. Commercial vehicles may be imported at a basic customs duty of 20% and components may be imported at basic customs duty ranging from at 10% to 7.5%.
The FDI Policy
Automatic approval for foreign equity investments up to 100% is allowed in the automobile manufacturing sector under the FDI Policy. See Item 10.D “—Exchange Controls” for additional information relating to restrictions on foreign investment under Indian law.
Indian Taxes
See Item 10.E “—Taxation” for additional information relating to our taxation.
Excise Duty
The Government of India imposes excise duty on cars and other motor vehicles and their chassis, which rates vary from time to time and across vehicle categories reflecting the policies of the Government of India. The chart below sets forth a summary of historical changes and the current rates of excise duty.
Change of Tax Rate | Excise Duty (per vehicle or chassis) | |||||||||||||||||||
| Small cars1 | Cars other than small cars2 | Motor vehicles for more than 13 persons | Chassis fitted with engines for vehicles of more than 13 persons | Trucks | Chassis fitted with engines for trucks | Safari, SUVs and UVs | ||||||||||||||
March 2012 | 12 | % | 24% or 27%1 | 12 | % | 15% | 12 | % | 15% | 27% | ||||||||||
May 2012 | - | - | - | 14% | - | 14% | - | |||||||||||||
March 2013 | - | - | - | - | - | 13% | 27% or 30% | |||||||||||||
February 2014 | 8 | % | 20% or 24%1 | 8 | % | 10% | 8 | % | 9% | 24% | ||||||||||
January 2015 | 12 | % | 24% or 27%1 | 12 | % | 14% | 12 | % | 13% | 27% or 30% | ||||||||||
March 2015 onwards | 12.50 | % | - | 12.50 | % | - | 12.50 | % | - | - | ||||||||||
| 1. | Small cars are cars with a length not exceeding 4,000 mm and an engine capacity not exceeding 1,500 cubic centimeters for cars with diesel engines, and not exceeding 1,200 cubic centimeters for cars with gasoline engines. The higher rate is applicable if the engine capacity exceeds 1,500 cubic centimeters. |
| 2. | Cars other than small cars are cars with a length exceeding 4000 mm with an engine capacity exceeding 1,500 cubic centimeters for diesel engines and 1,200 cubic centimeters for gasoline engines. |
| (-) | indicates no change during the relevant year. |
All vehicles and chassis are subjected to the automobile cess, which is assessed at 0.125%. Certain passenger vehicles are also subject to the National Calamity Contingent Duty, or NCCD, assessed at 1%. The education cess, assessed at 2%, and secondary and higher education cess, assessed at 1%, in addition to the excise duties indicated above, are exempted on goods starting March 1, 2015.
Value Added Tax
The Value Added Tax, or VAT, has been implemented throughout India. VAT enables set-off from sales tax paid on inputs by traders and manufacturers against the sales tax collected by them on behalf of the Government of India, thereby eliminating the cascading effect of taxation. Two main brackets of 5% and 12.5%, along with special brackets of 0%, 1%, 3%, 4%, 13.5%, 14% 14.5%, 15%, 20%, 22% and 23% have been announced for various categories of goods and commodities sold in the country and certain states have also introduced additional VAT of 1% to 3% on specified commodities, including automobiles. In some of the states, a surcharge of 5% to 10% on VAT has been introduced on automobiles. Since its implementation, VAT has had a positive impact on our business. Prior to the implementation of VAT, a major portion of sales tax paid on purchases formed part of our total cost of materials. The implementation of VAT has resulted in savings on the sales tax component, as VAT paid on inputs may generally be set-off against tax paid on outputs.
In addition to VAT, a Central Sales Tax continues to exist, although it is proposed to be abolished in a phased manner. In the Indian Union Budget 2008-09, the Central Sales Tax rate was reduced to 2%, which remained unchanged in Fiscal 2015.
Goods and Services Tax
The Government of India is proposing to reform the indirect tax system in India with a comprehensive national goods and services tax, or GST, covering the manufacture, sale and consumption of goods and services. The date of introduction of GST is expected to be as early as April 1, 2016. The proposed GST regime will combine taxes and levies by the central and state governments into one unified rate structure. There is a proposal to levy a 1% Non-Creditable Tax to be collected by the Government of India and will be appropriated to the origin state government on every interstate movement of goods. The Government of India has publicly expressed the view that following the implementation of the GST, the indirect tax on domestically manufactured goods is expected to decrease along with prices on such goods.
We have benefitted and continue to benefit from excise duty exemptions for manufacturing facilities in the state of Uttarakhand and other incentives such as subsidies or loans from other states where we have manufacturing operations. While both the Government of India and other state governments of India have publicly announced that all committed incentives will be protected following the implementation of the GST, given the limited availability of information in the public domain concerning the GST, we are unable to provide any assurance as to the effect of this or any other aspect of the tax regime following implementation of the GST.
Imposition of any additional taxes and levies by the Government of India designed to limit the use of automobiles could adversely affect the demand for our products and our results of operations.
Economic Stimulus Package and Incentives
There was a 4% cut in the central value added tax rate, or Cenvat, on cars and trucks and a 2% cut in Cenvat rate on motor vehicles for transport of more than 13 persons, including the driver. Further, in February 2009, the Cenvat rate was reduced from 10% to 8% for Trucks and buses and service tax was also reduced from 12% to 10%. The Government of India has also provided for an accelerated tax depreciation of 50% for commercial vehicles purchased between January 1 and September 30, 2009. The Cenvat rate was restored to 10% since April 1, 2010 and was further revised to 12% with effect from March 16, 2012. The Government of India has made changes in the excise duty in February 2014 which will be in effect until December 31, 2014 as follows: the Cenvat on small cars, trucks and buses reduced to 8% in February, 2014 whereas Cenvat on cars other than small cars has been reduced to 20% or 24% from 24% or 27%. The Cenvat on UVs have been reduced from 27% or 30% to 24%. The Cenvat for chassis which was increased from 12% to 14% in the budget for the Indian fiscal year 2012-2013, has since been revised to 13% in the budget for the Indian fiscal year 2013-2014 and further reduced to 9% in February 2014.
The Government of India has launched a National Electric Mobility Mission plan 2020, or NEMMP, to encourage reliable, affordable and efficient electric vehicles that meet consumer performance and price expectations. Through collaboration between the government and industry for promotion and development of indigenous manufacturing capabilities, required infrastructure, consumer awareness and technology, the NEMMP aims to help India to emerge as a leader in the electric vehicle market in the world by 2020 and contribute towards national fuel security.
Furthermore, the Ministry of Road Transport & Highways and the Bureau of Energy Efficiency in India finalized labeling regulations for the M1 category of vehicles, which includes passenger vehicles up to, less than, or equal to 10 seats.
The Government of India’s plan to encourage India’s transition to hybrid and electric mobility consists of the following initiatives:
Demand Side: Mandate use of electric vehicles in areas such as public transportation and government fleets in order to create initial demand for OEMs and provide incentives for the sales of electric vehicles to consumers.
Supply Side: Link incentives to localization of the production of key components of electric vehicle in a phased manner.
Research and Development: Fund research and development programs along with OEMs and component suppliers to develop optimal solutions for India at low cost.
Infrastructure Support: Development of pilot programs to support hybrid and/or electric vehicles and test their effectiveness and make modest investments to build public charging infrastructure to support electric vehicles, especially for buses.
Environmental, fiscal and other governmental regulations around the world
Our Jaguar Land Rover business has significant operations in the United States and Europe, which have stringent regulations relating to vehicular emissions. The proposed tightening of vehicle emissions regulations by the European Union will require significant costs of compliance for Jaguar Land Rover. While we are pursuing various technologies in order to meet the required standards in the various countries in which we operate, the costs of compliance with these required standards can be significant to our operations and may adversely impact our results of operations.
In the United Kingdom, the Bank of England base (interest) rate has been maintained at an historic low of 0.5% despite an improvement in the UK economy. The UK labor market is strengthening as unemployment continues to fall and wages rise while inflation remains low primarily reflecting low energy prices. As a result the outlook is generally positive for UK GDP as higher levels of disposable income are expected to drive consumption and the Bank of England is likely to keep interest rates lower for longer as inflation remains subdued.
Economic growth in the Eurozone remained low during Fiscal 2015 and some member states experienced mild recession. In response the European Central Bank embarked on a quantitative easing program in January 2015 and there are signs of growth as a result; however uncertainty remains over the outcome of the debt negotiations with Greece.
The U.S. economy continues to strengthen despite the adverse effects of another harsh winter impacting in the first three months of 2016. The U.S. Federal Reserve continues to taper off its quantitative easing program and, similarly to the United Kingdom, improving labor market conditions along with lower energy prices are driving increased consumption. The U.S. Federal Reserve also held interest rates at historical lows at around 0.25% during Fiscal 2015 while rates are likely to rise gradually in the near term as confidence in the stronger economic recovery gains momentum.
Greenhouse gas / CO2 / fuel economy legislation
Legislation is in place limiting passenger car fleet average greenhouse gas emissions in Europe to 130 grams of CO2 per kilometer for 100% of new cars in 2015. Different targets apply to each manufacturer based on their respective fleets of vehicles and average weight. We have received a permitted derogation from the weight-based target requirement available to small volume and niche manufacturers. As a result, we are permitted to reduce our emissions by 25% from 2007 levels rather than meeting a specific CO2 emissions by 2015. Jaguar Land Rover now has an overall 2015 target of an average of 178.0 grams of CO2 per kilometer for our full fleet of vehicles registered in the EU that year, with Jaguar Land Rover and Tata Motors Limited monitored as a single “pooled” entity for compliance with this target (for Jaguar Land Rover alone, this would be 179.8 g/km). We are in compliance with the 2013 requirement that the best 75% of our pooled fleet registered in the EU that year has met this target and the 2014 requirement that the best 80% of our pooled fleet registered in the EU has met this target, achieving an average 164.5 grams of CO2 per kilometer and 165.3 grams of CO2 per kilometer (provisional) in calendar 2013 and 2014, respectively.
Furthermore, the European Union has regulated target reductions for 95% of a manufacturer’s full fleet of new passenger cars registered in the EU in 2020 to average 95 grams of CO2 per kilometer, rising to 100% in 2021. The new rule contains an extension of the small volume and niche manufacturers’ derogation which permits us to reduce our emissions by 45% from 2007 levels rather than meet a specific CO2 emissions target by 2020. Jaguar Land Rover could apply for an overall target of 132 grams of CO2 per kilometer.
The European Union has also adopted an average emissions limit of 175 grams of CO2 per kilometer for light commercial vehicles to be phased in between 2014 and 2017. Implementation of light commercial vehicle CO2 standards affect the Defender and a small number of Freelander and Discovery vehicles. We have been granted a small volume derogation by the European Commission for alternative specific emission targets for 2014-2016 inclusive, which protects the Defender through to end of manufacturing. A further average emissions limit of 147 grams of CO2 per kilometer for light commercial vehicles has been adopted for 2020.
In the United States, both Corporate Average Fuel Economy, or CAFE, standards and greenhouse gas emissions standards are imposed on manufacturers of passenger cars and light trucks. The National Highway Traffic Safety Administration, or NHTSA, has set the federal CAFE standards for passenger cars and light trucks to meet an estimated combined average fuel economy level of 35.5 miles per U.S. gallon for 2016 model year vehicles. Meanwhile, the U.S. Environmental Protection Agency, or EPA, and NHTSA issued a joint rule to reduce the average greenhouse gas emissions from passenger cars, light trucks and medium-duty passenger vehicles for model years 2012-16 to 250 grams of CO2 per mile, which would be equivalent to 35.5 miles per U.S. gallon in model year 2016 if the requirements were met only through fuel economy improvements. The United States federal government extended this program to cars and light trucks for model years 2017 through 2025, targeting an estimated combined average emissions level of 243 grams of CO2 per mile in 2017 and 163 grams per mile in 2025, which is equivalent to 54.5 miles per gallon if achieved exclusively through fuel economy improvements. In addition, many other markets either have or will shortly define similar greenhouse gas emissions standards (including Brazil, Canada, China, the European Free Trade Association, India, Japan, Mexico, Saudi Arabia, South Korea and Switzerland).
California is empowered to implement more stringent greenhouse gas emissions standards but has elected to accept the existing U.S. federal standards for compliance with the state’s own requirements. The California Air Resources Board enacted regulations that deem manufacturers of vehicles for model years 2012 through 2016 that are in compliance with the EPA greenhouse gas emissions regulations to also be in compliance with California’s greenhouse gas emission regulations. In November 2012, the California Air Resources Board accepted the federal standard for vehicles with model years 2017-25 for compliance with the state’s own greenhouse gas emission regulations. However, California is moving forward with other stringent emission regulations for vehicles, including the Zero Emission Vehicle regulation, or ZEV. ZEV requires manufacturers to increase their sales of zero emissions vehicles year-on-year, up to an industry average of 16% of vehicles sold in the state by 2025. The precise sales required in order to meet a manufacturer’s obligation in any given model year depend on the size of the manufacturer and the level of technology sold (for example, transitional zero emission technologies, such as plug-in hybrids, can account for at least a proportion of a manufacturer’s obligation, but these technologies earn compliance credits at a different rate from pure zero-emissions vehicles). Other compliance mechanisms are available under ZEV, such as banking and trading of credits generated through the sale of eligible vehicles.
We are fully committed to meeting these standards and technology deployment plans incorporated into cycle plans are directed to achieving these standards. These plans include the use of lightweight materials, including aluminum, which will contribute to the manufacture of lighter vehicles with improved fuel efficiency, reducing parasitic losses through the driveline and improvements in aerodynamics. They also include the development and installation of smaller engines in our existing vehicles and other drivetrain efficiency improvements, including the introduction of eight-speed or nine-speed transmissions in some of our vehicles. We continue to introduce smaller vehicles such as the Jaguar XE, our most fuel-efficient Jaguar yet. The technology deployment plans also include the research, development and deployment of hybrid-electric vehicles. These technology deployment plans require significant investment. Additionally, local excise tax initiatives are a key consideration in ensuring our products meet customer needs for environmental footprint and cost of ownership concerns as well as continued access to major city centers, such as London’s Ultra Low Emission Zone and similar low emissions areas being contemplated in Paris, Berlin and Beijing.
Non-greenhouse gas emissions legislation
The European Union has adopted the latest in a series of more-stringent standards for emissions of other air pollutants from passenger and light commercial vehicles, such as nitrogen oxides, carbon monoxide, hydrocarbons and particulates. These standards have been or are being phased in from September 2009 (Euro 5) and September 2014 (Euro 6b) and September 2017 (Euro 6c) for passenger cars and from September 2010 (Euro 5), September 2015 (Euro 6b) and September 2018 for light commercial vehicles. September 2015 will see the adoption of driving emissions monitoring, while September 2017 will see such monitoring become mandatory along with a move to the new Worldwide harmonised Light-duty Test Procedure, or WLTP, coincident with Eu6c in Europe to address global concerns on more customer correlated fuel economy certified levels as well as air quality concerns, with other markets to follow. All programs are being fully engineered to enable the adoption of these new requirements.
In the United States, existing California Low-Emission Vehicle regulations and the recently adopted LEV III regulations, as well as the state’s ZEV regulations, place ever-stricter limits on emissions of particulates, nitrogen oxides, hydrocarbons, organics and greenhouse gases from passenger cars and light trucks. These regulations require ever-increasing levels of technology in engine control systems, on-board diagnostics and after treatment systems affecting the base costs of our powertrains. The new California LEV3 and ZEV regulations cover model years 2015 to 2025. Additional stringency of evaporative emissions also requires more-advanced materials and joints solutions to eliminate fuel evaporative losses, all for much longer warranty periods (up to 150,000 miles in the United States).
In addition, in April 2014, the Tier 3 Motor Vehicle Emission and Fuel Standards issued by the EPA were finalized. With Tier 3, the EPA has established more stringent vehicle emissions standards broadly aligned to California’s LEV III standards for 2017 to 2025 model year vehicles. The EPA made minor amendments to these Tier 3 standards in January 2015.
While Europe and the United States lead the implementation of these emissions programs, other nations and states typically follow on with adoption of similar regulations two to four years thereafter. For example, China’s Stage III fuel consumption regulation targets a national average fuel consumption of 6.9L/100km by 2015 and its Stage IV targets a national average fuel consumption of 5.0L/100km by 2021. In response to severe air quality issues in Beijing and other major Chinese cities, the Chinese government also intends to adopt more stringent emissions standards beginning in 2016.
To comply with the current and future environmental norms, we may have to incur substantial capital expenditures and research and development expenditures to upgrade products and manufacturing facilities, which would have an impact on our cost of production and results of operations.
Noise legislation
The European Commission adopted new rules (which apply to new homologations from July 2016) to reduce noise produced by cars, vans, buses, coaches and light and heavy trucks. Noise limit values would be lowered in two steps of each twoA-weighted decibels for vehicles other than trucks, and one A-weighted decibel in the first step and two in the second step for trucks. Compliance would be achieved over a ten-year period from the introduction of the first phase.
Vehicle safety
Vehicles sold in Europe are subject to vehicle safety regulations established by the European Union or by individual Member States. In 2009, the European Union enacted a new regulation to establish a simplified framework for vehicle safety, repealing more than 50 existing directives and replacing them with a single regulation aimed at incorporating relevant United Nations standards. The incorporation of the United Nations standards commenced in 2012, and the European Commission requires new model cars to have electronic stability control systems, has introduced regulations relating to low-rolling resistance tires, requires tire pressure monitoring systems and requires heavy vehicles to have advanced emergency braking systems and lane departure warning systems. From April 2009, the criteria for whole vehicle type approval were extended to cover all new road vehicles, to be phased in over five years depending on vehicle category. The extension clarifies the criteria applicable to small commercial vehicles. In the European Union, new safety requirements came into force from November 2012 for new vehicle types and come into force in November 2014 for all new vehicles sold in the EU market. The new mandatory measures include safety belt reminders, electric car safety requirements, easier child seat anchorages, tire pressure monitoring systems and gear shift indicators.
In the United States, NHTSA issues federal motor vehicle safety standards covering a wide range of vehicle components and systems such as airbags, seatbelts, brakes, windshields, tires, steering columns, displays, lights, door locks, side impact protection and fuel systems. We are required to test new vehicles and equipment and assure their compliance with these standards before selling them in the United States. We are also required to recall vehicles found to have defects that present an unreasonable risk to safety or which do not conform to the required Federal Motor Vehicle Safety Standards, and to repair them without charge to the owner. The financial cost and impact on consumer confidence of such recalls can be significant depending on the repair required and the number of vehicles affected. We have no investigations relating to alleged safety defects or potential compliance issues pending before NHTSA.
These standards add to the cost and complexity of designing and producing vehicles and equipment. In recent years NHTSA has mandated, among other things:
A system for collecting information relating to vehicle performance and customer complaints, and foreign recalls to assist in the early identification of potential vehicle defects as required by the Transportation Recall Enhancement, Accountability, and Documentation (TREAD) Act; and
Enhanced requirements for frontal and side impact, including a lateral pole impact.
Furthermore, the Cameron Gulbransen Kids Transportation Safety Act of 2007 (Kids and Cars Safety Act), passed into law in 2008, requires NHTSA to enact regulations related to rearward visibility and brake-to-shift interlock and requires NHTSA to consider regulating the automatic reversal functions on power windows. The costs to meet these proposed regulatory requirements may be significant.
Vehicle safety regulations in Canada are similar to those in the United States; however, many other countries have vehicle regulatory requirements which differ from those in the United States. The differing requirements among various countries create complexity and increase costs such that the development and production of a common product that meets the country regulatory requirements of all countries is not possible. Global Technical Regulations, or GTRs, developed under the auspices of the United Nations, continue to have an increasing impact on automotive safety activities, as indicated by EU legislation. In 2008, GTRs on electronic stability control, head restraints and pedestrian protection were each adopted by the UN “World Forum for the Harmonization of Vehicle Regulations”, and are now in different stages of national implementation. While global harmonization is fundamentally supported by the automobile industry in order to reduce complexity, national implementation may still introduce subtle differences into the system.
At present, India is a signatory of the 1998 UNECE Agreement on Global Technical Regulations, which makes the global technical regulations alternate standards to national regulations. The transition of finalized global technical regulations into national standards remains in progress.
Insurance Coverage
The Indian insurance industry is predominantly state-owned and insurance tariffs are regulated by the Indian Insurance Regulatory and Development Authority. We have insurance coverage which we consider reasonably sufficient to cover all normal risks associated with our operations, including business interruptions, and which we believe are in accordance with industry standards in India. We have obtained coverage for product liability for some of our vehicle models in several countries to which we export vehicles. TDCV has insurance coverage as is required and applicable to cover all normal risks in accordance with industry standards in South Korea, including product liability. We have also taken insurance coverage on directors and officers liability to minimize risks associated with international litigation for us and our subsidiaries.
Jaguar Land Rover has global insurance coverage which we consider to be reasonably sufficient to cover normal risks associated with our operations and insurance risks, including property, business interruption, marine and product/general liability and which we believe is in accordance with commercial industry standards and statutory requirements.
We are insured by insurers of recognized financial standing against such losses and risks and in such amounts as are prudent and customary in the business in which it is engaged. All such insurance is in full force and effect.
We are able to renew our existing insurance coverage, as and when such policies expire or to obtain comparable coverage from similar institutions as may be necessary or appropriate to conduct its business, as now conducted.
Export Promotion Capital Goods
Since Fiscal 1997, we have benefited from participation in the Export Promotion Capital Goods Scheme, or the EPCG Scheme, which permits us to import capital equipment under a special license at a substantially reduced customs duty. Our participation in this scheme is subject to us fulfilling an obligation to export goods manufactured or produced by the use of capital equipment imported under the EPCG Scheme to the value of a multiple of the cost plus insurance and freight value of these imports or customs duty saved over a period of 6, 8 and 12 years from the date of obtaining the special license. We currently hold 101 licenses which require us to export our products of a value of approximately Rs.81.19 billion between the years 2002 to 2021, and we carefully monitor our progress in meeting our incremental milestones. After fulfilling some of the export obligations as per provisions of Foreign Trade Policy, as at March 31, 2015 we have remaining obligations to export products of a value of approximately Rs.7.09 billion by March 2021. In the event that the export obligation under the EPCG Scheme is not fulfilled, we would have to pay the differential between the reduced and normal duty on the goods imported along with interest. In view of our past record of exceeding our export milestones, and our current plans with respect to our export markets, we do not currently foresee any impediments to meeting our export obligation in the required time frame.
Legal Proceedings
In the normal course of business, we face claims and assertions by various parties. We assess such claims and assertions and monitor the legal environment on an ongoing basis, with the assistance of external legal counsel where appropriate. We record a liability for any claims where a potential loss is probable and capable of being estimated and disclose such matters in our financial statements, if material. For potential losses which are considered reasonably possible, but not probable, we provide disclosure in the financial statements, but do not record a liability in our financial statements unless the loss becomes probable. Should any new developments arise, such as a change in law or rulings against us, we may need to make provisions in our financial statements, which could adversely impact our reported financial condition and results of operations. Furthermore, if significant claims are determined against us and we are required to pay all or a portion of the disputed amounts, there could be a material adverse effect on our business and profitability. Certain claims that are above Rs.200 million in value are described in Note 34 to our consolidated financial statements included in this annual report on Form 20-F. Certain claims that are below Rs.200 million in value pertain to indirect taxes, labor and other civil cases. There are other claims against us which pertain to motor accident claims in India (involving vehicles that were damaged in accidents while being transferred from our manufacturing plants to regional sales offices), product liability claims and consumer complaints. Some of these cases relate to replacement of parts of vehicles and/or compensation for deficiency in services provided by us or our dealers.
Capital work-in-progress as at March 31, 2014, included building under construction at Singur in West Bengal of Rs.3,098.8 million for the purposes of manufacturing automobiles. In October 2008, we moved the Nano project from Singur in West Bengal to Sanand in Gujarat. In June 2011, the newly elected Government of West Bengal (State Government) enacted a law cancelling the land lease agreement at Singur, and took over possession of the land. We challenged the constitutional validity of the law. In June 2012, the Calcutta High Court declared the law unconstitutional and restored our rights under the land lease agreement. The State Government filed an appeal in the Supreme Court of India in August 2012, which is pending disposal.
Though we continue to rigorously press our rights, contentions and claims in the matter, we have been advised that the time it may take in disposal of the appeal is uncertain. We have also been advised that we have a good case and can strongly defend the appeal, but the questions that arise are issues of constitutional law and thus the result of the appeal cannot be predicted. In these circumstances, in view of the uncertainty on the timing of resolution, following the course of prudence, the management has, in Fiscal 2015, made a provision for carrying capital cost of buildings at Singur amounting to Rs.3,098.8 million, excluding other assets (electrical installations etc.) and expenses written off / provided in earlier years, security expenses, lease rent and claim for interest on the whole amount (including Rs.3,098.8 million). We shall however continue to pursue the case and assert our rights and our claims in the Courts.
In South Korea, our union employees filed a lawsuit to include some elements of non-ordinary salary and bonus as part of “ordinary wages” for the period December 2007 to May 2011. The district court ruled in favor of the union employees on January 2013 and ordered TDCV to pay the employees KRW 17.2 billion and interest, up to the period of payment. We recorded a provision of KRW 45.8 billion (Rs.2,565 million) as at March 31, 2014, in respect of this lawsuit and consequential obligation for all employees (including non-union employees). TDCV filed an appeal against the order to the High Court of Seoul, which gave its verdict on December 24, 2014. The High Court of Seoul, following the decision of the Supreme Court in a case of an unaffiliated company, determined that some elements of non-ordinary salary were part of “ordinary wages” and the need to be paid with retrospective effect. However, based on the “Good Faith Principle” and because any retrospective payment would have high financial impact on the Company, the court determined that the bonuses and work performance salary would not be eligible for retrospective payment. Accordingly, the liability was determined at KRW 99 million and interest of KRW 20 million thereon.
Furthermore, in order to maintain the claim for the period from June 2011 to March 2014, TDCV union employees filed a case in the Seoul district court on November 24, 2014. In addition to the items included in the first lawsuit, one new item for additional 50% allowance for overtime work was added. However, after receipt of the final judgment of the Seoul High Court for the first lawsuit, which was not in their favor, the labor union decided to withdraw the second lawsuit and submitted the case withdrawal confirmation on March 19, 2015. Accordingly, the provision created as at March 31, 2014 of KRW 45.8 billion (Rs.2,643 million) has been reversed in Fiscal 2015.
The Competition Commission of India, or CCI, has initiated an inquiry against us and other car manufacturers (collectively referred to hereinafter as the OEMs) pursuant to an allegation that genuine spare parts of automobiles manufactured by the OEMs were not made freely available in the open market in India and accordingly, anti-competitive practices were carried out by the OEMs. The CCI through its order, dated August 25, 2014, held that the OEMs had violated the provisions of Section 3 and Section 4 of the Competition Act, 2002, and imposed a penalty of 2% of the average turnover for three years. Subsequently, we and other car manufacturers filed a writ petition before the Delhi High Court challenging the constitutional validity of Section 22(3) and 27(b) of the Indian Competition Act under which the order was passed and penalty imposed. The matter is currently pending before the Delhi High Court.
During the year the Group’s Brazilian subsidiary has received a demand for GBP 35 million in relation to additional indirect taxes, that is, PIS (Programa de Integração Social) and COFINS (Contribuição para Financiamento da Seguridade Social) claimed as being due on local vehicle and parts sales made in 2010. The matter is currently being contested before the Brazilian appellate authorities. Professional legal opinions we have obtained in Brazil support our position that the basis of the tax authority’s assertion is incorrect and, as a result, the likelihood of any settlement ultimately having to be made is considered remote.
We believe that none of the contingencies, would have a material adverse effect on our financial condition, results of operations or cash flows.
Tata Sons—Our Promoter and its Promoted Entities
Tata Sons holds equity interests in promoted companies engaged in a wide range of businesses. The various companies promoted by Tata Sons, including Tata Motors Limited, are based substantially in India and had combined consolidated revenues of approximately US$108.78 billion in Fiscal 2015. The businesses of Tata Sons promoted entities can be categorized under seven business sectors, namely, engineering, materials, energy, chemicals, consumer products, services, and communications and information systems.
Tata Sons-promoted entities have their origins in the trading business founded by the founder Mr. Jamsetji Tata in 1868, which was developed and expanded in furtherance of his ideals by his two sons, Sir Dorabji Tata and Sir Ratan Tata, following their father’s death in 1904. The family interests subsequently vested largely in the Sir Ratan Tata Trust, the Sir Dorabji Tata Trust and other related trusts. These trusts have been established for philanthropic and charitable purposes and together own a significant percentage of the share capital of Tata Sons.
Over the years, the operations of Tata Sons promoted entities have expanded to encompass a number of major industrial and commercial enterprises, including Indian Hotels Company Limited (1902), Tata Steel Limited, or Tata Steel (1907), one of the top ten steel manufacturers in the world, Tata Power Company Limited (1910), Tata Chemicals Limited (1939), which is the world’s second largest manufacturer of soda ash and Tata Motors Limited (1945). Other Tata entities include Voltas Limited (1954), and Tata Global Beverages Ltd, or Tata Tea Limited (1962), which is the second largest branded tea company in the world, along with itsUK-based subsidiary Tetley.
Tata Consultancy Services Limited, or TCS, a subsidiary of Tata Sons which started its operations in the 1960s as a division of Tata Sons and later converted to a listed public company, is a leading software service provider in India and exporter and the first Indian software firm to exceed sales of US$4 billion. TCS has delivery centers around the globe including in the United States, the United Kingdom, Hungary, Brazil, Uruguay and China, as well as India.
Tata Sons promoted India’s first airline, Tata Airlines, which later became Air India (India’s national carrier), as well as India’s largest general insurance company, New India Assurance Company Limited, both of which were subsequently taken over by the government as part of the Government of India’s nationalization program. In 1999, entities promoted by Tata Sons also invested in several telephone and telecommunication ventures, including acquiring a significant portion of the Government of India’s equity stake in the then state owned Videsh Sanchar Nigam Limited, which was subsequently renamed Tata Communications Limited and is one of the world’s largest wholesale voice carriers. Tata Sons promoted companies are building multinational businesses that aspire to achieve growth through excellence and innovation, while balancing the interests of shareholders, employees and society.
Some of the emerging companies promoted by Tata Sons include Titan Company, established in 1984, which is manufacturing India’s largest and best-known range of personal accessories such as watches, jewelry, sunglasses, prescription eyewear and excels in precision engineering, Tata Housing Development Company, established in 1984, a real estate developer in India, Tata AIA Life Insurance Company, established in 2001, which is a joint venture between Tata Sons and AIA Life Group Ltd Tata AIG General Insurance Company, established in 2001, which provides non-life insurance solutions to individuals, groups and corporate houses in India and Tata Capital, established in 2007, a systemically important non-deposit taking non-banking financial company, or NBFC, that fulfills the financial needs of retail and institutional customers in India.
We have for many years been a licensed user of the “Tata” brand owned by Tata Sons, and thus have both gained from the use of the Tata brand and common brand equity as well as helped to grow and sustain its brand equity. Tata Sons instituted a corporate identity program to re-position the brand to compete in a global environment. A substantial ongoing investment and recurring expenditure is undertaken by Tata Sons planned to develop and promote a strong, well-recognized and common brand equity, which is intended to represent for the consumer a high level of quality, service and reliability associated with products and services offered by the Tata Sons promoted entities.
Each of the Tata Sons promoted entities which have subscribed to the Tata Brand Equity & Business Promotion Scheme pays a subscription fee to use the “Tata” business name and trademarks and participate in and gain from the Tata brand equity as well as to avail themselves of various services including legal, human resources, economics and statistics, corporate communications and public affairs services of Tata Sons. We believe that we benefit from the use of and association with the “Tata” brand identity and accordingly, Tata Motors Limited and certain of its subsidiaries have subscribed to the Tata Brand Equity & Business Promotion Agreement and agreed to pay an annual subscription fee to Tata Sons which is in the range of 0.15%-0.25% of the annual net income (defined as net revenues exclusive of excise duties and other governmental taxes and non-operating income), subject to a ceiling of 5% of annual profit before tax (defined as profit after interest and depreciation but before income tax), each calculated on a standalone basis for these entities. In some of the past years, Tata Sons has lowered the absolute amount of subscription fee in light of its outlay for activities related to brand promotion and protection in those years. In Fiscal 2013, Tata Motors Limited on a standalone basis paid an amount less than 0.25% of its annual net income calculated in accordance with Indian GAAP and in Fiscal 2014 and 2015 no amount was paid in view of losses of Tata Motors Limited calculated on a standalone basis. Pursuant to our licensing agreement with Tata Sons, we have also undertaken certain obligations for the promotion and protection of the Tata brand identity licensed to us under the agreement. The agreement can be terminated by written agreement between the parties, by Tata Sons upon our breach of the agreement and our failure to remedy such a breach, or by Tata Sons upon providing six months’ notice for reasons to be recorded in writing. The agreement can also be terminated by Tata Sons upon the occurrence of certain specified events, including liquidation of Tata Motors Limited.
The Tata Sons promoted entities have sought to continue to follow the ideals, values and principles of ethics, integrity and fair business practices espoused by the founder of Tata Sons, Mr. Jamsetji Tata, and his successors. To further protect and enhance the Tata brand equity, these values and principles have been articulated in the Tata Code of Conduct, which has been adopted by Tata promoted entities. The Tata Trust has also made significant contributions towards national causes through promotion of public institutions in the field of science, such as the Indian Institute of Science and the Tata Institute of Fundamental Research and in the field of social services through the Tata Institute of Social Sciences, the Tata Memorial Hospital, the National Centre for the Performing Arts in Mumbai and, more recently, the Tata Medical Center at Kolkata for cancer patients set up by the Tata Trusts and supported by Tata Sons and promoted companies. The Tata Trust is one among the largest charitable foundations in India.
Some of the Tata Sons promoted entities hold shares in other companies promoted by Tata Sons. Similarly, some of our directors hold directorships on the boards of Tata Sons and/or other Tata Sons promoted entities. However, there are no voting agreements, material supply or purchase agreements or any other relationships or agreements that have the effect of binding us with other Tata Sons promoted entities at management, financial or operational levels. With the exception of Tata Steel, which under our Articles of Association has the right to appoint one director on our board of directors, neither Tata Sons nor its subsidiaries has any special contractual or other power to appoint our directors or management. They have only the voting power of their shareholdings in Tata Motors. Except as set forth in the tables below under the heading “Subsidiaries and Affiliates” and except for approximately a 16.84% equity interest in Tata Services Ltd, a 19.62% equity interest in Tata International Limited, a 12.85% equity interest in Tata Industries Limited and an 8.79% equity interest in Tata Projects Ltd, our shareholdings in other Tata Sons promoted entities are generally insignificant as a percentage of their respective outstanding shares or in terms of the amount of our investment or the market value of our shares of those companies.
Subsidiaries and Affiliates
The subsidiaries, joint operation and equity method affiliates and joint ventures of Tata Motors Limited that together with Tata Motors Limited form the Tata Motors Group under Indian Law as at March 31, 2015 are set forth in the chart below:
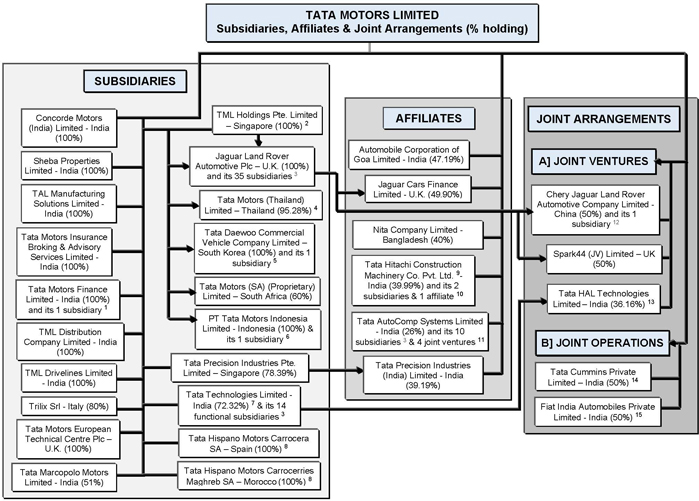
| 1. | Acquired a 100% equity interest in Rajasthan Leasing Private Limited with effect from January 19, 2015 and renamed it Tata Motors Finance Solutions Private Limited with effect from March 18, 2015. On June 4, 2015 was converted into a public limited company, named as Tata Motors Finance Solutions Limited. |
| 2. | Holding company of Jaguar Land Rover Automotive plc, TDCV, Tata Motors (Thailand) Limited, Tata Motors (SA) (Proprietary) Limited and PT Tata Motors Indonesia with effect from October 20, 2014. |
| 3. | These subsidiaries are based in many countries outside India. |
| 4. | Equity interest increased from 94.36% to 95.28% with effect from February 24, 2015. |
| 5. | Equity interest in its subsidiary, Tata Daewoo Commercial Vehicle Sales and Distribution Co. Ltd. is 100%. |
| 6. | Equity interest in PT Tata Motors Distribusi Indonesia subsidiary is 100% |
| 7. | The equity interests in these 14 subsidiaries range between 72.32% and 72.52%. |
| 8. | Tata Hispano Motors Carrocera SA wound down its operations with effect from September 20, 2013 and transferred its 100% equity interest in Tata Hispano Motors Carrocerries Maghreb SA with effect from June 23, 2014. |
| 9. | Converted from a public limited company into a private limited company with effect from March 5, 2015. |
| 10. | With two 100% subsidiaries in Spain of which one is presently under the process of liquidation and one affiliate in China with an equity interest of 22.48%. |
| 11. | Out of the ten subsidiaries with equity interests ranging from 13% to 26%, two are presently under the process of liquidation and four joint ventures with equity interests of 13% in each. |
| 12. | Chery Jaguar Land Rover Auto Sales Company Limited, a wholly-owned subsidiary of Chery Jaguar Land Rover Automotive Co. Ltd., whose name was changed from Suzhou Chery Jaguar Land Rover Trading Co. Ltd. (Interim JV) with effect from November 5, 2014. |
| 13. | An affiliate of Tata Technologies Limited. |
| 14. | Converted from a public limited company into a private limited company with effect from December 16, 2014. |
| 15. | Converted from a public limited company into a private limited company with effect from January 19, 2015. |
Out of the above, the following are our three significant subsidiaries as defined under Regulation S-X:
Name | Country of Incorporation | Ownership Interest / Voting Power | ||||
Jaguar Land Rover Automotive Plc | United Kingdom | 100 | % | |||
Jaguar Land Rover Limited | United Kingdom | 100 | % | |||
Jaguar Land Rover Holdings Limited | United Kingdom | 100 | % | |||
With respect to certain subsidiaries and affiliates, where Tata Motors Limited has a joint venture partner, voting on certain items of business may be based on affirmative voting provisions and board of directors participation clauses in the relevant joint venture agreement(s).
D. Property, Plants and Equipment
Facilities
We operate six principal automotive manufacturing facilities in India. The first facility was established in 1945 at Jamshedpur in the state of Jharkhand in eastern India. We had commenced construction of the second facility in 1966 (with production commencing in 1976) at Pune, in the state of Maharashtra in western India, the third facility in 1985 (with production commencing in 1992) at Lucknow, in the state of Uttar Pradesh in northern India, the fourth at Pantnagar in the state of Uttarakhand, India, which commenced operations in Fiscal 2008, the fifth at Sanand in Gujarat in western India for manufacturing of the Nano, which commenced operations in June 2010, and the sixth plant for manufacturing Tata Marcopolo buses under our joint venture with Marcopolo and LCVs at Dharwad in Karnataka (which buses are also produced at Lucknow). The Jamshedpur, Pune, Sanand, Pantnagar and Lucknow manufacturing facilities have been accredited with a ISO/TS 16949:2000(E) certification.
The manufacturing facilities of TDCV are based in Gunsan, South Korea. TDCV has received the ISO/TS 16949 certification, an international quality systems specification given by SGS UK Ltd., an International Automotive Task Force, or IATF, accredited certification body. It is the first South Korean automobile OEM to be awarded an ISO/TS 16949 certification.
Fiat India Automobiles Private Limited, our joint arrangement with Fiat Group, has its manufacturing facility located in Ranjangaon, Maharashtra. The plant is used for manufacturing Tata and Fiat branded cars and engines, and transmissions for use by both partners.
Tata Motors (Thailand) Limited is our joint venture with Thonburi Automotive Assembly Plant Co. Ltd, and has a manufacturing facility located in Samutprakarn province, Thailand. The facility is used for the manufacture and assembly of pickup trucks. Through our joint venture in Thailand, we intend on offering refreshed versions of Tata brand pickup trucks in Fiscal 2016 and to increase its product range by introducing Tata and TDCV brand M&HCV trucks in Thailand.
Through Jaguar Land Rover, we currently operate three principal automotive manufacturing facilities in the United Kingdom at Solihull, Castle Bromwich, and Halewood and have two product development facilities in the United Kingdom at Gaydon and Whitley. Most of these facilities are owned as freehold estates or are held through long-term leaseholds, generally with nominal rents.
A new advanced engine facility has been established at Wolverhampton in the United Kingdom’s Midlands area to manufacture the new family of Ingenium low-emission engines. The Wolverhampton facility, which opened in October 2014, is essential to our long-term strategic growth plans and is now producing the first of the new family of Ingenium engines, a 4-cylinder 2.0-liter engine first installed into the Jaguar XE. The GBP 500 million investment in this facility reinforces Jaguar Land Rover’s commitment to manufacturing and innovation in the United Kingdom. The facility is the first in Jaguar Land Rover’s history to be entirely designed and specified by Jaguar Land Rover and at full capacity is expected to employ up to 1,400 people. The engine plant includes an engine testing center alongside the manufacturing and assembly halls and endeavors to meet the highest standards of sustainable production, featuring a variety of energy efficiency technologies including the largest rooftop solar panel installation in the UK, comprising no fewer than 21,000 individual panels expected to generate more than 30% of the plant’s energy requirements.
The joint venture manufacturing plant for Chery Jaguar Land Rover Automotive Co. Limited, our joint venture company with Chery, in Changshu, near Shanghai, as part of a RMB 10.9 billion investment that also includes a new research and development center, was opened in October 2014 and began manufacturing the Range Rover Evoque for the local Chinese market. Retail sales began in February 2015. Construction of a new engine plant for production of fuel-efficient engines is also contemplated under the joint venture agreement.
Tata Motors (SA) (Proprietary) Limited, our joint venture with Tata Africa Holdings (SA) Pty Limited for the manufacture and assembly operations of our LCVs and M&HCVs in South Africa, owns and operates a manufacturing facility located in Rosslyn, South Africa.
Description of environmental issues that may affect our utilization of facilities
Tata and other brand vehicles
As with other participants in the automobile industry around the world, we are exposed to regulatory risks related to climate change. The design and development of fuel-efficient vehicles and vehicles running on alternative renewable energy has become a priority as a result of fossil fuel scarcity, escalating price and growing awareness about energy efficiency among customers.
We have adopted the Tata Group Climate Change Policy which addresses key climate change issues related to products, processes and services. We are committed to reduction of greenhouse gas emissions throughout the lifecycle of our products and development of fuel efficient and low greenhouse gas emitting vehicles, as an integral part of our product development and manufacturing strategy.
Considering the climate change risk, we are actively involved in partnerships with technology providers to embrace energy-efficient technologies not only for products but also for processes and are also participating actively in various national committees in India, which are working on formulating policies and regulations for improvement of the environment, including through reduction of greenhouse gases.
India, as a party to the United Nations Framework Convention on Climate Change, 1992 and its Kyoto Protocol, 1997, has been committed to addressing the global problem on the basis of the principle of “common but differentiated responsibilities and respective capabilities” of the member parties. At present, there are no legally binding targets for greenhouse gas reductions for India as it is a developing country. There are, however, opportunities for minimizing energy consumption through elimination of energy losses during manufacturing, thereby reducing manufacturing costs and increasing productivity.
In order to manage regulatory and general risks of climate change, we are increasingly investing in the design and development of fuel efficient and alternative energy vehicles, in addition to implementing new advanced technologies to increase efficiency of our internal combustion engines. We have manufactured CNG and CNG-electric hybrid versions of buses, LCVs, and the ACE Xenon, as well as a liquefied petroleum gas version of the Indica passenger vehicle.
Moreover, we are using refrigerants such as R134A in our products in order to minimize our contribution towards greenhouse gas emissions. We also ensure that no refrigerant is released to the atmosphere during any service, repair and maintenance of the air-conditioning systems of our vehicles by first recovering the refrigerant charge before the system is serviced and recharged. In addition, since 2009, we have voluntarily disclosed fuel-efficiency information for our passenger vehicles in India in accordance with a decision by SIAM. We are also continually in the process of developing products to meet the current and future emission norms in India and other countries. For example, we offer products which meet the Bharat Stage III and Bharat Stage IV norms in India and Euro V norms in International markets.
We also strive to increase the proportion of energy sourced from renewables. As one of our prime objectives, we have endeavored to incorporate environmentally sound practices in our processes, products and services. Our manufacturing facilities at Pune, Jamshedpur, Lucknow, Sanand, Dharwad and Pantnagar in India each have an Environmental Management System in place and have achieved ISO-14001 certification. We have been implementing various Environment Management Programs on energy conservation such as reduction in electricity and fuel consumption with resulting reductions in greenhouse gas emissions. We are actively working towards a shift to gas fuels to meet process heat requirements.
Jaguar Land Rover
Our production facilities are subject to a wide range of environmental, health and safety requirements. These requirements address, among other things, air emissions, wastewater discharges, accidental releases into the environment, human exposure to hazardous materials, the storage, treatment, transportation and disposal of wastes and hazardous materials, the investigation and clean-up of contamination, process safety and the maintenance of safe conditions in the workplace. Many of our operations require permits and controls to monitor or prevent pollution. We have incurred, and will continue to incur, substantial ongoing capital and operating expenditures to ensure compliance with current and future environmental, health and safety laws and regulations or their more stringent enforcement. Violations of these laws and regulations could result in the imposition of significant fines and penalties, the suspension, revocation or non-renewal of our permits, or the closure of our plants. Other environmental, health and safety laws and regulations could impose restrictions or onerous conditions on the availability or the use of raw materials we need for our manufacturing process.
Our manufacturing process results in the emission of greenhouse gases such as CO2. The EU Emissions Trading Scheme, or EUETS, an EU-wide system in which allowances to emit greenhouse gases are issued and traded, is now in Phase 3 (2013 to 2020). We have managed our EUETS allowances during previous phases of the EUETS scheme and use these remaining allowances from these earlier phases to meet our compliance requirements. The automotive sector has also been given recognition of being at risk of carbon leakage in accordance with the EUETS rules. This means that we will receive an increase in free allowances from 2015 and 2019. As a consequence of these actions, we currently project that we will reach the end of Phase 3 without the need to purchase EUETS carbon allowances. In Phase 4 of the scheme, from 2020 to 2027, all organizations in the EUETS scheme will see free allowances diminish to zero by 2027, so we project that we will purchase EUETS allowances in Phase 4 of the scheme.
We have a Climate Change Agreement which covers our manufacturing energy use. This requires us to deliver a 15% reduction in energy use per vehicle by 2020 compared to the 2008 baseline. Our projections show that we are on track to achieve this target and consequently will not need to purchase carbon allowances under this scheme.
We are also registered as a participant in the Carbon Reduction Commitment Energy Efficiency Scheme, which regulates emissions from electricity and gas use primarily in our non-manufacturing activities in the United Kingdom.
Many of our sites have an extended history of industrial activity. We may be required to investigate and remediate contamination at those sites, as well as properties we formerly operated, regardless of whether we caused the contamination or the activity causing the contamination was legal at the time it occurred. For example, some of our buildings at our Solihull plant and other plants in the United Kingdom are undergoing an asbestos-removal program in connection with ongoing refurbishment and rebuilding. In connection with contaminated properties, as well as our operations generally, we also could be subject to claims by government authorities, individuals and other third parties seeking damages for alleged personal injury or property damage resulting from hazardous substance contamination or exposure caused by our operations, facilities or products. The discovery of previously unknown contamination, or the imposition of new obligations to investigate or remediate contamination at our facilities, could result in substantial unanticipated costs. We could be required to establish or substantially increase financial reserves for such obligations or liabilities and, if we fail to accurately predict the amount or timing of such costs, the related adverse impact on our business, financial condition or results of operations could be material.
Production Capacity
The following table shows our production capacity as at March 31, 2015 and production levels by plant and product type in Fiscal 2015 and 2014:
| As at March 31, 2015 | Year ended March 31, | |||||||||||
| Production Capacity | 2015 | 2014 | ||||||||||
| Production (Units) | ||||||||||||
Tata Motors Plants in India1 | ||||||||||||
Medium and Heavy Commercial Vehicles, Light Commercial Vehicles, Utility Vehicles, Passenger Cars, | 1,637,000 | 458,339 | 513,442 | |||||||||
Jaguar Land Rover2 5 | ||||||||||||
Utility Vehicles, Passenger Cars | 638,209 | 470,536 | 439,120 | |||||||||
Other Subsidiary companies plants (excluding Jaguar Land Rover)3 | ||||||||||||
Medium & Heavy Commercial Vehicles, buses, bus bodies and pickup trucks | 58,250 | 23,670 | 22,162 | |||||||||
Joint operations4 (Passenger Vehicles) | 100,000 | 32,298 | 30,702 | |||||||||
| 1. | This refers to estimated production capacity on a double shift basis for all plants (except the Uttarakhand plant for which capacity is on three shift basis) for the manufacture of vehicles and replacement parts. |
| 2. | Production capacity is on a three shift basis. |
| 3. | The plants are located in South Korea, Morocco, South Africa and Thailand. Production capacity of plants at Morocco are on a single-shift basis. |
| 4. | Excludes production of engines/powertrains. |
| 5. | Excludes capacity at Chery Jaguar Land Rover Automotive Company Limited. |
Properties
We produce vehicles and related components and carry out other businesses through various manufacturing facilities. In addition to our manufacturing facilities, our properties include sales offices and other sales facilities in major cities, repair service facilities and research and development facilities.
The following table sets forth information, with respect to our principal facilities, a substantial portion of which are owned by us as at March 31, 2015. The remaining facilities are on leased premises.
Location | Facility or Subsidiary / Joint Operations Name | Principal Products or Functions | ||
| India | ||||
| In the State of Maharashtra | ||||
Pune (Pimpri, Chinchwad, Chikhali1, Maval) | Tata Motors Limited | Automotive vehicles, components and research and development | ||
| Pune (Chinchwad) | TAL Manufacturing Solutions Ltd. | Factory automation equipment and services | ||
| Pune (Hinjewadi)1 | Tata Technologies Ltd. | Software consultancy and services | ||
| Mumbai, Pune | Tata Motors Limited/Concorde Motors (India) Ltd./TMFL | Automobile sales and service and vehicle financing | ||
| Nagpur1 | TAL Manufacturing Solutions Ltd. | Production of advanced composite floor beams, including machining of metal fittings for Boeing 787 Dreamliner | ||
| Satara | Tata Cummins Pvt. Ltd. | Automotive engines | ||
| Pune (Ranjangaon) | Fiat India Automobiles Pvt. Ltd. | Automotive vehicles and components | ||
| In the State of Jharkhand | ||||
| Jamshedpur | Tata Motors Limited | Automotive vehicles, components and research and development | ||
| Jamshedpur | TML Drivelines Ltd. | Axles and transmissions for M&HCVs | ||
| Jamshedpur | Tata Cummins Pvt. Ltd. | Automotive engines | ||
| In the State of Uttar Pradesh | ||||
| Lucknow1 | Tata Motors Limited | Automotive vehicles, parts and research and development | ||
| Tata Marcopolo Motors Ltd. | Bus bodies | |||
| In the State of Karnataka | ||||
| Dharwad | Tata Motors Limited | Automotive vehicles, components, spare parts and warehousing | ||
| Tata Marcopolo Motors Ltd. | Bus body manufacturing | |||
| Bengaluru2 | Concorde Motors (India) Ltd. | Automobile sales and service | ||
| In the State of Uttarakhand | ||||
| Pantnagar1 | Tata Motors Limited | Automotive vehicles and components | ||
| In the State of Gujarat | ||||
| Sanand | Tata Motors Limited | Automotive vehicles and components | ||
| Rest of India | ||||
| Hyderabad2 & Chennai(1) | Concorde Motors (India) Ltd. | Automobile sales and service | ||
| Cochin, Delhi | Concorde Motors (India) Ltd. | Automobile sales and service | ||
| Various other properties in India | Tata Motors Limited/Tata Motors Finance Ltd. | Vehicle financing business (office/ residential) | ||
| Outside India | ||||
| Singapore | Tata Technologies Pte Ltd. | Software consultancy and services | ||
| Republic of Korea | TDCV | Automotive vehicles, components and research and development | ||
| Thailand | Tata Motors (Thailand) Ltd. | Pick-up trucks | ||
| Tata Technologies (Thailand) Ltd. | Software consultancy and services | |||
| United Kingdom | Tata Motors European Technical Centre | Engineering consultancy and services | ||
| United Kingdom | INCAT International PLC, Tata Technologies Europe Ltd and Cambric UK Ltd | Software consultancy and services | ||
Location | Facility or Subsidiary / Joint Operations Name | Principal Products or Functions | ||
| United Kingdom | ||||
Solihull | Jaguar Land Rover Ltd | Automotive vehicles and components | ||
Castle Bromwich | Jaguar Land Rover Ltd | Automotive vehicles and components | ||
Halewood | Jaguar Land Rover Ltd | Automotive vehicles and components | ||
Gaydon | Jaguar Land Rover Ltd | Research and product development | ||
Whitley | Jaguar Land Rover Ltd | Headquarters and research and product development | ||
Wolverhampton | Jaguar Land Rover Ltd | Engine manufacturing | ||
| Spain | Tata Hispano Motors Carrocera S.A. | Bus body service | ||
| Morocco | Tata Hispano Motors Carrocerries Maghreb SA | Bus body manufacturing and service | ||
| South Africa | Tata Motors (SA) (Proprietary) Limited | Manufacture and assembly operations of vehicles | ||
| Indonesia | PT Tata Motors Indonesia | Distribution of vehicles | ||
| Rest of the world | ||||
Various (United States, UK, China, Europe, Australia etc.) | Tata Technologies Ltd. | Software consultancy and services | ||
| Jaguar Land Rover3 | National sales companies | |||
| Regional sales offices |
| Note: | Excludes facilities held by our joint ventures, including the manufacturing plant held by Jaguar Land Rover Automotive Company Limited. |
| 1. | Land at each of these locations is held under an operating lease. |
| 2. | Some of the facilities are held under an operating lease and some are owned. |
| 3. | National sales companies are held by various subsidiaries of the Jaguar Land Rover group of companies. |
Substantially all of our owned properties are subject to mortgages in favor of secured lenders and debenture trustees for the benefit of secured debenture holders. A significant portion of our property, plant and equipment, except those in the United Kingdom, is pledged as collateral securing indebtedness incurred by us. We believe that there are no material environmental issues that may affect our utilization of these assets.
We have additional property interests in various locations around the world for limited manufacturing, sales offices, and dealer training and testing. The majority of these are housed within leased premises.
For further details regarding the current legal proceedings with respect to the leased land in West Bengal, please refer to Item 4.B “—Business Overview—Legal Proceedings” of this annual report on Form 20-F.
We consider all of our principal manufacturing facilities and other significant properties to be in good condition and adequate to meet the needs of our operations.
| Item 4A. | Unresolved Staff Comments |
None.
| Item 5. | Operating and Financial Review and Prospects |
You should read the following discussion of our financial condition and results of operations together with our consolidated financial statements prepared in conformity with IFRS and information included in this annual report on Form 20-F. This discussion and analysis contains forward-looking statements that involve risks, uncertainties and assumptions. Our actual results may differ materially from those anticipated in these forward-looking statements as a result of various factors including, but not limited to, those set forth in Item 3.D and elsewhere in this annual report on Form 20-F.
All financial information discussed in this section is derived from our audited financial statements included in this annual report on Form 20-F, which have been prepared in accordance with International Financial Reporting Standards as issued by the International Accounting Standards Board.
Overview
In Fiscal 2015, our total revenue (net of excise duties), including finance revenues, increased by 12.1% to Rs.2,625,265 million from Rs.2,341,761 million in Fiscal 2014. We recorded a net income (attributable to our shareholders) of Rs.128,291 million in Fiscal 2015, representing a decrease by 1.9% or Rs.2,426 million over net income in Fiscal 2014 of Rs.130,717 million.
Automotive operations
Automotive operations are our most significant segment, accounting for 99.5%, 99.5% and 99.4% of our total revenues in Fiscal 2015, 2014, and 2013, respectively. In Fiscal 2015, revenue from automotive operations before inter-segment eliminations was Rs.2,612,303 million, as compared to Rs.2,329,582 million in Fiscal 2014 and Rs.1,881,621 million in Fiscal 2013.
Our automotive operations include:
All activities relating to the development, design, manufacture, assembly and sale of vehicles as well as related spare parts and accessories;
Distribution and service of vehicles; and
Financing of our vehicles in certain markets.
Our automotive operations segment is further divided into Tata and other brand vehicles (including financing thereof), and Jaguar Land Rover. In Fiscal 2015, Jaguar Land Rover contributed 82.9% of our total automotive revenue compared to 81.3% in Fiscal 2014 and 72.5% in Fiscal 2013 (before intra-segment elimination) and the remaining 17.1% was contributed by Tata and other brand vehicles in Fiscal 2015 compared to 18.7% in Fiscal 2014 and 27.5% in Fiscal 2013. The increase in Jaguar Land Rover revenue includes a translation gain from GBP to Indian rupees. For further detail see Item 5.A “—Operating Results—Fiscal 2015 Compared to Fiscal 2014—Revenue.”
Other Operations
Our other operations business segment mainly includes information technology services, and machine tools and factory automation solutions. Our revenue from other operations before inter-segment eliminations was Rs.22,179Rs.27,152 million in Fiscal 2013,2015, an increase of 17.3%8.7% from Rs.18,905Rs.24,989 million in Fiscal 2012.2014. Revenues from other operations represented 1.2%1.0%, 1.1% and 1.2% of our total revenues, before inter-segment eliminations, in Fiscal 2013, 20122015, 2014 and 2011,2013, respectively. Earnings before other income, interest and tax before inter-segment eliminations (segment earnings), were Rs.3,294 million, Rs.2,443 million and Rs.1,487Rs.3,448 million in Fiscal 2013, 20122015 and 2011,Rs.2,634 million and Rs.3,294 million in Fiscal 2014 and 2013, respectively.
Geographical breakdown
We have pursued a strategy of increasing exports of Tata and other brand vehicles to new and existing markets. Improved market sentiment in certain countries to which we export and a strong portfolio of Jaguar Land Rover products during Fiscal 2013, havevehicles has enabled us to increase our shareits sales in these international markets. Further, Jaguar Land Rover also experienced a changemarkets in market mix, in particular the continued strengthening of businessFiscal 2015. Sales in China, which is ourits second largest single market in terms of volumes, after India.India, increased by 15.5% in Fiscal 2015. However, sales in China decreased by 20.4% in the fourth quarter of Fiscal 2015 to 23,526 units from 29,567 units in the same period in Fiscal 2014. The performance of our subsidiary in South Korea, TDCV, and successful operations of INCATTTL, our specialized subsidiary engaged in engineering, design and information technology services, contributed to its subsidiaries following acquisitions by TTL, facilitated further increase in our revenue from international markets. TDCV’s major export markets are Algeria, Russia, Vietnam, South Africa and countries in the Middle East. Following the acquisition of the Jaguar Land Rover business in Fiscal 2009, theThe proportion of our net sales earned from markets outside of India has increased significantlymarginally to 76.1% and 66.8% for86.2% in Fiscal 2013 and2015 from 84.4% in Fiscal 2012, respectively.2014.
The following table sets forth our revenue from our key geographical markets:
| Year ended March 31, | ||||||||||||||||||||||||||||||||||||||||||||||||
| Fiscal 2013 | Fiscal 2012 | Fiscal 2011 | 2015 | 2014 | 2013 | |||||||||||||||||||||||||||||||||||||||||||
Revenue | Rs. in million | Percentage | Rs. in million | Percentage | Rs. in million | Percentage | Rs. in million | Percentage | Rs. in million | Percentage | Rs. in million | Percentage | ||||||||||||||||||||||||||||||||||||
India | 451,652 | 23.9 | % | 552,513 | 33.2 | % | 464,676 | 37.7 | % | 361,206 | 13.8 | % | 364,591 | 15.6 | % | 453,276 | 23.9 | % | ||||||||||||||||||||||||||||||
China | 445,645 | 23.6 | % | 296,923 | 17.8 | % | 116,459 | 9.4 | % | 758,085 | 28.9 | % | 656,138 | 28.0 | % | 446,508 | 23.6 | % | ||||||||||||||||||||||||||||||
United Kingdom | 224,604 | 11.9 | % | 179,866 | 10.8 | % | 136,906 | 11.1 | % | 351,527 | 13.4 | % | 290,162 | 12.4 | % | 224,604 | 11.9 | % | ||||||||||||||||||||||||||||||
United States of America | 189,007 | 10.0 | % | 157,855 | 9.5 | % | 147,428 | 12.0 | % | 314,009 | 12.0 | % | 266,436 | 11.4 | % | 189,007 | 10.0 | % | ||||||||||||||||||||||||||||||
Rest of Europe | 220,489 | 11.7 | % | 190,057 | 11.4 | % | 150,148 | 12.2 | % | 317,303 | 12.1 | % | 292,378 | 12.4 | % | 221,035 | 11.7 | % | ||||||||||||||||||||||||||||||
Rest of the World | 358,464 | 18.9 | % | 287,640 | 17.3 | % | 216,517 | 17.6 | % | 523,135 | 19.8 | % | 472,056 | 20.2 | % | 358,480 | 18.9 | % | ||||||||||||||||||||||||||||||
|
|
|
|
|
| |||||||||||||||||||||||||||||||||||||||||||
Total | 1,889,860 | 1,664,853 | 1,232,134 | 2,625,265 | 2,341,761 | 1,892,910 | ||||||||||||||||||||||||||||||||||||||||||
|
|
|
|
|
| |||||||||||||||||||||||||||||||||||||||||||
The Rest of Europe market is geographic Europe, excluding the United Kingdom.Kingdom and Russia. The Rest of the World market is any region not included above.
Significant Factors Influencing Our Results of Operations.Operations
Our results of operations are dependent on a number of factors, which mainly include mainly the following:
| • | General economic conditions. We, similar to other participants in the automotive industry, are materially affected by general economic conditions. See Item 3.D “—Risk |
| • | Interest rates and availability of credit for vehicle purchases. Our volumes are significantly dependent on availability of vehicle financing arrangements and |
| • | Excise |
| • | Our competitive position in the market. For a detailed discussion regarding our competitive position, see Item 4.B “—Business |
| • | Cyclicality and seasonality. Our results of operations are also dependent on the cyclicality and seasonality in demand in the automotive |
| • | Environmental Regulations. |
| • | Foreign Currency Rates. Our operations and our financial position are quite sensitive to fluctuations in foreign currency exchange rates. Jaguar Land Rover earns significant revenue in the United States, Europe and China, and also sources a significant portion of its input material from Europe. Thus, any exchange rate fluctuations of GBP to Euro, GBP to |
To the extent that our financial results for a particular period will be affected by changes in the prevailing exchange rates at the end of the period, such fluctuations may have a substantial impact on comparisons with prior periods. Furthermore, Jaguar Land Rover constitutes a major portion of consolidated financial position, the figures of which are translated into Indian rupees. However, the translation effect is a reporting consideration and does not impact our underlying results of operations.Please see Item 11 “Quantitative and Qualitative Disclosures About Market Risk” and Note 36(d) (i) – (a) to our consolidated financial statements included elsewhere in this annual report on Form 20-F for further detail on our exposure to fluctuations in foreign currency exchange rates. |
| • | Political and Regional Factors. As with to the rest of the automotive industry, we are affected by political and regional factors. For a detailed discussion regarding these risks, please see Item 3.D “Key Information—Risk Factors—Political and Regulatory Risks.” |
Transaction risk is the risk that the currency structure of our costs and liabilities will deviate from the currency structure of sales proceeds and assets. However, we enter into hedging instruments to mitigate some of these transaction risks. These instruments enable us to reduce, but not eliminate, the impact of fluctuations in foreign currency exchange rates. Please see Item 11 “— Quantitative and Qualitative Disclosures About Market Risk” for further detail.
Political and Regional Factors. Similar to the rest of the automotive industry, we are affected by political and regional factors. For a detailed discussion regarding these risks, please see Item 3.D “— Risk Factors — Political and Regulatory Risks.”
Results of operations
The following table sets forth selected items from our consolidated statements of income for the periods indicated and shows these items as a percentage of total revenues:
| Percentage of Total Revenue | ||||||||||||||||||||||||||||||||||||||||
| Percentage of Total Revenue | Percentage Change | Year ended March 31, | Percentage Change | |||||||||||||||||||||||||||||||||||||
| Fiscal 2013 | Fiscal 2012 | Fiscal 2011 | 2012 to 2013 | 2011 to 2012 | 2015 | 2014 | 2013 | 2014 to 2015 | 2013 to 2014 | |||||||||||||||||||||||||||||||
Total revenues | 100 | % | 100 | % | 100 | % | 13.5 | 35.1 | 100 | % | 100 | % | 100 | % | 12.1 | % | 23.7 | % | ||||||||||||||||||||||
Raw materials and purchase of product for sale (including change in stock) | 63.8 | 66.1 | 64.6 | 9.6 | 38.2 | |||||||||||||||||||||||||||||||||||
Raw materials, components and purchase of product for sale (including change in inventories) | 61.0 | 61.7 | 63.5 | 10.8 | 20.3 | |||||||||||||||||||||||||||||||||||
Employee cost | 8.8 | 7.3 | 7.5 | 36.0 | 32.4 | 9.5 | 9.1 | 8.8 | 17.1 | 28.0 | ||||||||||||||||||||||||||||||
Other expenses | 20.2 | 18.6 | 18.9 | 23.5 | 33.2 | 20.8 | 21.3 | 20.3 | 9.4 | 29.7 | ||||||||||||||||||||||||||||||
Depreciation and amortization | 3.9 | 3.3 | 3.5 | 35.4 | 25.3 | 5.1 | 4.7 | 4.0 | 21.8 | 45.8 | ||||||||||||||||||||||||||||||
Expenditure capitalized | -5.4 | -5.0 | -4.7 | 23.3 | 43.9 | -5.8 | -5.8 | -5.4 | 13.3 | 32.7 | ||||||||||||||||||||||||||||||
Other (income)/ loss (net) | -0.6 | -0.6 | 0.7 | 27.8 | 214.5 | |||||||||||||||||||||||||||||||||||
Other (income)/loss (net) | -0.4 | -0.3 | -0.6 | 48.8 | -36.1 | |||||||||||||||||||||||||||||||||||
Interest income | -0.4 | -0.3 | -0.3 | 43.0 | 47.9 | -0.3 | -0.3 | -0.4 | 1.6 | -3.9 | ||||||||||||||||||||||||||||||
Interest expense (net) | 2.2 | 2.3 | 3.0 | 6.4 | 3.9 | 2.0 | 2.3 | 2.2 | -1.6 | 30.2 | ||||||||||||||||||||||||||||||
Foreign exchange (gain) / loss (net) | 0.8 | 0.7 | -0.3 | 40.2 | -461.0 | |||||||||||||||||||||||||||||||||||
Impairment in equity accounted investees | — | 0.3 | — | -100.0 | 100.0 | |||||||||||||||||||||||||||||||||||
Share of (profit) / loss of equity accounted investees | -0.1 | — | * | — | * | -593.7 | -23.4 | |||||||||||||||||||||||||||||||||
Foreign exchange (gain)/loss (net) | 0.5 | -0.8 | 0.8 | 166.4 | -221.2 | |||||||||||||||||||||||||||||||||||
Impairment of an equity accounted investee | — | 0.3 | — | -100.0 | 100.0 | |||||||||||||||||||||||||||||||||||
Share of (profit)/loss of equity accounted investees | 0.1 | 0.1 | — | * | -6.9 | 1,327.8 | ||||||||||||||||||||||||||||||||||
Net income before tax | 6.8 | 7.3 | 7.1 | 6.3 | 40.0 | 7.5 | 7.7 | 6.8 | 10.5 | 39.3 | ||||||||||||||||||||||||||||||
Income tax expense | -2.1 | 0.3 | 1.0 | 732.6 | -63.2 | -2.6 | -2.1 | -2.1 | 43.4 | 22.9 | ||||||||||||||||||||||||||||||
Net income | 4.7 | 7.0 | 6.1 | -23.1 | 57.9 | 4.9 | 5.6 | 4.7 | -1.6 | 46.5 | ||||||||||||||||||||||||||||||
Net income attributable to shareholders of Tata Motors Limited | 4.7 | 7.0 | 6.1 | -23.3 | 57.6 | 4.9 | 5.6 | 4.7 | -1.9 | 47.4 | ||||||||||||||||||||||||||||||
Net income attributable to non-controlling interests | — | * | — | * | — | * | 13.4 | 125.2 | — | * | — | * | — | * | 71.4 | % | -47.9 | % | ||||||||||||||||||||||
| * | Less than 0.1 |
The following table sets forth selected data regarding our automotive operations (Tata and other brand vehicles including(including financing thereofthereof) and Jaguar Land Rover) for the periods indicated and the percentage change from period to periodperiod-to-period (before inter-segment eliminations).:
| Percentage Change | ||||||||||||||||||||
| Fiscal 2013 | Fiscal 2012 | Fiscal 2011 | 2012 to 2013 | 2011 to 2012 | ||||||||||||||||
Total Revenues (Rs. million) | 1,878,571 | 1,654,903 | 1,223,547 | 13.5 | 35.3 | |||||||||||||||
Earnings before other income, interest and tax | 161,388 | 159,779 | 124,419 | 1.0 | 28.4 | |||||||||||||||
Earnings before other income, interest and tax (% to total revenue) | 8.6 | % | 9.7 | % | 10.2 | % | ||||||||||||||
| Year ended March 31, | Percentage Change | |||||||||||||||||||
| 2015 | 2014 | 2013 | 2014 to 2015 | 2013 to 2014 | ||||||||||||||||
Total revenues (Rs. million) | 2,612,303 | 2,329,582 | 1,881,621 | 12.1 | % | 23.8 | % | |||||||||||||
Earnings before other income, interest and tax (Rs. million) | 244,551 | 207,396 | 164,207 | 17.9 | % | 26.3 | % | |||||||||||||
Earnings before other income, interest and tax (% to total revenue) | 9.4 | % | 8.9 | % | 8.7 | % | ||||||||||||||
The following table sets forth selected data regarding our other operations for the periods indicated and the percentage change from period to periodperiod-to-period (before inter-segment eliminations).:
| Percentage Change | Year ended March 31, | Percentage Change | ||||||||||||||||||||||||||||||||||||||
| Fiscal 2013 | Fiscal 2012 | Fiscal 2011 | 2012 to 2013 | 2011 to 2012 | 2015 | 2014 | 2013 | 2014 to 2015 | 2013 to 2014 | |||||||||||||||||||||||||||||||
Total revenues (Rs. million) | 22,179 | 18,905 | 14,916 | 17.3 | 26.7 | 27,152 | 24,989 | 22,179 | 8.7 | % | 12.7 | % | ||||||||||||||||||||||||||||
Earnings before other income, interest and tax (Rs. million) | 3,294 | 2,443 | 1,487 | 34.8 | 64.3 | 3,448 | 2,634 | 3,294 | 30.9 | % | -20.0 | % | ||||||||||||||||||||||||||||
Earnings before other income, interest and tax (% to total revenue) | 14.9 | % | 12.9 | % | 10.0 | % | 12.7 | % | 10.5 | % | 14.9 | % | ||||||||||||||||||||||||||||
Fiscal 20132015 Compared to Fiscal 20122014
Revenue
Our total consolidated revenue (net of excise duty, where applicable), including finance revenue, increased by 12.1% to Rs.2,625,265 million in Fiscal 2015 from Rs.2,341,761 million in Fiscal 2014.
The increase in revenue was primarily driven by our Jaguar Land Rover business, where revenue increased by 14.3% to Rs.2,165,673 million in Fiscal 2015 from Rs.1,894,590 million in Fiscal 2014 due to volume increases across products and markets. The increase in revenue also reflects an increase on account of a foreign currency translation gain from GBP to Indian rupees of Rs.30,187 million pertaining to Jaguar Land Rover. The increase in revenue of Rs.240,896 million at our Jaguar Land Rover business (excluding translation impact) was mainly attributable to an increase in sales of the new Range Rover Sport, Range Rover Evoque and new Range Rover from 223,517 units in Fiscal 2014 to 271,043 units in Fiscal 2015, an increase of 21.3%, which was offset by a marginal reduction in sales of Jaguar-brand vehicles to 78,083 units in Fiscal 2015 from 80,644 units in Fiscal 2014. The increase in revenue pertaining to Jaguar Land Rover in Fiscal 2015 was also attributable to an indirect tax incentive by Jaguar Land Rover of Rs.13,054 million as compared to Rs.8,463 million in Fiscal 2014.
The increase in revenue was also attributable to an increase in revenue of Tata and other brand vehicles (including financing thereof) by 2.8% to Rs.447,218 million in Fiscal 2015 from Rs.435,012 million in Fiscal 2014.
Our revenues from sales of vehicles and spares manufactured in India increased by 5.2% to Rs.362,214 million in Fiscal 2015 from Rs.344,369 million in Fiscal 2014. The increase was mainly attributable to increased revenues of M&HCVs (in India), which increased by 28.5% to Rs.166,263 million in Fiscal 2015 from Rs.129,350 in Fiscal 2014. Furthermore, revenue attributable to passenger cars increased by 22.5% to Rs.37,196 million in Fiscal 2015 from Rs.30,370 million in Fiscal 2014. These were offset by a decrease in revenue attributable to LCVs by 8% to Rs.68,890 million in Fiscal 2015 from Rs.74,900 million in Fiscal 2014. Revenue attributable to utility vehicles decreased by 5.5% to Rs.13,051 million in Fiscal 2015 from Rs.13,810 million in Fiscal 2014.
Revenue from our vehicle financing operations decreased by 24.3% to Rs.22,631 million in Fiscal 2015 as compared to Rs.29,876 million in Fiscal 2014, due to lower vehicle financing activity and an increase in defaults.
Revenue attributable to TDCV, our subsidiary company engaged in design, development and manufacturing of M&HCVs, increased by 15.7% to Rs.55,015 million in Fiscal 2015 from Rs.47,533 million in Fiscal 2014.
Revenue (net of excise duty, where applicable) from other operations, before inter-segment eliminations, increased by 8.7% to Rs.27,152 million in Fiscal 2015 from Rs.24,989 million in Fiscal 2014, and represents 1.0% and 1.1% of our total revenues, before inter-segment eliminations, in Fiscal 2015 and 2014, respectively.
Cost and Expenses
Raw Materials, Components and Purchase of Products for Sale (including change in stock) (material costs)
Material costs increased by 10.8% to Rs.1,601,056 million in Fiscal 2015 from Rs.1,444,946 million in Fiscal 2014. The increase in absolute terms in material costs in Fiscal 2015 was mainly attributable to increased volumes at our Jaguar Land Rover business and includes an unfavorable foreign currency translation from GBP to Indian rupees for Jaguar Land Rover operations which resulted in an increase in material costs of Rs.19,432 million in Fiscal 2015 compared to Fiscal 2014.
At our Jaguar Land Rover operations, material costs in Fiscal 2015 increased by 13.0% to Rs.1,304,221 million from Rs.1,154,510 million in Fiscal 2014. Material costs at our Jaguar Land Rover operations as a percentage of revenue decreased to 60.3% in Fiscal 2015 from 61.4% in Fiscal 2014 (in GBP terms). Material costs attributable to our Jaguar Land Rover operations increased by Rs.107,668 million in Fiscal 2015 due to an increase in volume of sales and an increase in duties by Rs.13,340 million, mainly due to increased sales to China. However, as a percentage of revenue attributable to our Jaguar Land Rover operations, duties decreased from 10.4% in Fiscal 2014 to 9.9% in Fiscal 2015, due to an increase in sales in China of our 2.0 liter engines which attracts a lower duty. Furthermore, the decrease in material cost as a percentage to revenue was mainly due to cost reduction programs undertaken by Jaguar Land Rover of approximately GBP 206 million (Rs.20,311 million) and positive movement of foreign currency rates applicable for sourcing countries of GBP 301 million (Rs.29,678 million).
Material costs for Tata and other brand vehicles has also increased by 4.8% to Rs.291,206 million in Fiscal 2015 from Rs.277,820 million in Fiscal 2014. However, material costs as a percentage of revenue (excluding finance revenue) was 68.6% in Fiscal 2015 and 2014.
At our India operations, material costs have increased by 22% to Rs.111,823 million in Fiscal 2015 as compared to Rs.91,673 million in Fiscal 2014 for M&HCVs and by 17.9% to Rs.31,957 million in Fiscal 2015 as compared from Rs.27,105 million in Fiscal 2014 for passenger cars. Material costs has decreased by 25% to Rs.42,531 million in Fiscal 2015 as compared to Rs.56,684 million in Fiscal 2014 for LCVs and by 13.5% to Rs.11,228 million in Fiscal 2015 as compared from Rs.12,979 million in Fiscal 2014 for utility vehicles.
Material costs have increased by 14.9% to Rs.39,177 million in Fiscal 2015 as compared to Rs.34,102 million in Fiscal 2014 for TDCV due to increased sales. The increase is also due to an unfavourable foreign currency translation from KRW to Indian rupees of Rs.1,348 million. However, material costs as a percentage of revenue (excluding finance revenue) were 71.2% in Fiscal 2015 and 71.7% in Fiscal 2014.
Employee Costs
Our employee costs increased by 17.1% in Fiscal 2015 to Rs.250,401 million from Rs.213,903 million in Fiscal 2014, including the foreign currency translation impact from GBP to Indian rupees discussed below. Our permanent headcount increased by 6.7% as at March 31, 2015 to 73,485 employees from 68,889 employees as at March 31, 2014, and the average temporary headcount increased by 14.1% to 40,213 employees in Fiscal 2015 from 35,260 employees in Fiscal 2014.
The employee cost at Jaguar Land Rover increased by 21.4% to Rs.194,467 million in Fiscal 2015 from Rs.160,147 million in Fiscal 2014. This increase includes an unfavorable foreign currency translation from GBP to Indian rupees of Rs.3,076 million. In GBP terms, employee costs at Jaguar Land Rover increased to GBP 1,977 million in Fiscal 2015 from GBP 1,654 million in Fiscal 2014. The employee cost at Jaguar Land Rover as a percentage to revenue increased to 9.0% in Fiscal 2015 from 8.5% in Fiscal 2014. Due to consistent increases in volumes and to support new launches and product development projects, Jaguar Land Rover increased its average permanent headcount by 7.8% as at March 31, 2015 to 24,902 employees from 23,111 employees as at March 31, 2014, and the average temporary headcount increased by 49.2% to 7,225 employees in Fiscal 2015 from 4,842 employees in Fiscal 2014. The increase in employee cost was also due to wage negotiations in November 2014 for Jaguar Land Rover plant workers. Total number of permanent employees as at March 31, 2015 was 27,004 as compared to 22,186 as at March 31, 2014 for Jaguar Land Rover.
The employee cost for Tata and other brand vehicles (including financing thereof) increased by 2.8% to Rs.43,922 million in Fiscal 2015 from Rs.42,739 million in Fiscal 2014.
For our India operations, employee costs increased by 8.5% to Rs.36,547 million in Fiscal 2015 from Rs.33,672 million in Fiscal 2014. We incurred Rs.930 million in Fiscal 2015 towards an employee early-separation scheme, as compared to Rs.535 million in Fiscal 2014. Excluding the employee early-separation charge, the employee cost increased by 7.5% to Rs.35,617 million in Fiscal 2015 from Rs.33,137 million in Fiscal 2014, mainly due to regular annual increases in salary. The permanent headcount decreased marginally by 3.1% as at March 31, 2015 to 37,243 employees from 38,434 employees as at March 31, 2014, which was driven by efforts to rationalize employee costs across our India operations. For our India operations, the average temporary headcount increased by 3.0% to 27,772 employees in Fiscal 2015 from 26,973 employees in Fiscal 2014.
Employee costs at TDCV decreased by 22.1% to Rs.4,493 million in Fiscal 2015 from Rs.5,771 million in Fiscal 2014. The decrease of employee costs attributable to TDCV during Fiscal 2015 was mainly due to the reversal of Rs.2,643 million, following the resolution of the lawsuit filed by TDCV union employees. Please see Item 4.B “—Business Overview—Legal Proceedings” of this annual report on Form 20-F for further details on the lawsuit filed by TDCV union employees.
In Fiscal 2014, we closed the manufacturing operations at Tata Hispano Motors Carrocera S.A. and paid Euro 12.4 million (Rs.1,006 million) as employee separation costs. The closure was triggered by sustained underperformance that was mainly attributable to challenging market conditions in the regions where Hispano operates.
Other Expenses
Other expenses increased by 9.4% to Rs.545,910 million in Fiscal 2015 from Rs.498,778 million in Fiscal 2014. This increase mainly reflects an increase of volumes at Jaguar Land Rover and an unfavorable foreign currency translation of GBP to Indian rupees of Rs.6,694 million pertaining to Jaguar Land Rover. As a percentage of total revenues, these expenses decreased to 20.8% in Fiscal 2015 from 21.3% in Fiscal 2014. The major components of expenses are as follows:
| Percentage of Total Revenue | ||||||||||||||||||||
| Year ended March 31, | Change | Year ended March 31, | ||||||||||||||||||
| 2015 | 2014 | 2015 | 2014 | |||||||||||||||||
| (Rs. in millions) | ||||||||||||||||||||
Freight and transportation expenses | 84,309 | 75,439 | 11.8 | % | 3.2 | % | 3.2 | % | ||||||||||||
Works operation and other expenses | 213,280 | 186,067 | 14.6 | 8.1 | 7.9 | |||||||||||||||
Publicity | 85,773 | 81,425 | 5.3 | 3.3 | 3.5 | |||||||||||||||
Allowance for trade and other receivables, and finance receivables | 25,597 | 26,830 | -4.6 | 1.0 | 1.1 | |||||||||||||||
Warranty and product liability expenses | 60,266 | 57,957 | 4.0 | 2.3 | 2.5 | |||||||||||||||
Research and development expenses | 28,515 | 25,651 | 11.2 | % | 1.1 | % | 1.1 | % | ||||||||||||
| 1. | The increase in freight and transportation expenses corresponds to an increase in volumes at our Jaguar Land Rover operations, predominantly on account of increased China sales on an annual basis. |
| 2. | Our works operation and other expenses represented 8.1% and 7.9% of total revenue in Fiscal 2015 and 2014, respectively. These mainly relate to volume-related expenses at Jaguar Land Rover. Furthermore, engineering expenses at Jaguar Land Rover have increased, reflecting our increased investment in the development of new vehicles by 11.8% to Rs. 61,127 million in Fiscal 2015 from Rs. 54,658 million in Fiscal 2014. A significant portion of these costs are capitalized and shown under the line item “expenditure capitalized” discussed below”. |
| 3. | Publicity expenses decreased to 3.3% of our revenues in Fiscal 2015 from 3.5% in Fiscal 2014. In addition to routine product and brand campaigns, we incurred expenses relating to new product introduction campaigns in Fiscal 2015, namely the new Range Rover, new Range Rover Sport, Range Rover Evoque, Jaguar F-TYPE, smaller powertrain derivatives of the XF and XJ, the XF Sportbrake at Jaguar Land Rover, and the Ultra trucks, Zest and Bolt at our India operations. |
| 4. | Our allowance for trade and other receivables represented 1.0% and 1.1% of total revenues in Fiscal 2015 and Fiscal 2014, respectively. The allowances for trade and other receivables, and finance receivables mainly relate to India operations. These mainly reflect provisions for the impairment of vehicle loans of Rs.23,226 million for Fiscal 2015 as compared to Rs.24,139 million for the same period in 2014. The rate of defaults were due to prolonged unanticipated deterioration in the economic environment in India, which severely affected fleet owners and transporters. Furthermore, based on our assessment of non-recoverability of overdues in trade and other receivables, we have recorded a provision of Rs.2,371 million in Fiscal 2015, a decrease by 11.9% compared to a provision of Rs.2,691 million in Fiscal 2014. |
| 5. | Warranty and product liability expenses represented 2.3% and 2.5% of our revenues in Fiscal 2015 and Fiscal 2014, respectively. The warranty expenses at Jaguar Land Rover represented 2.57% of the revenue as compared to 2.84% last year primarily due to product and market mix, whereas for Tata Motors Indian operations these represent 1.17% of revenue as compared to 0.99% last year. The increased cost for Tata Motors Indian operations represented an increase in warranty period from two years to four years for certain M&HCV models, resulting in an increase in warranty accrual from Rs.438 million in Fiscal 2014 to Rs.652 million in Fiscal 2015. Please refer to Item 5.A “—Critical Accounting Policies” of this annual report for further details. |
| 6. | Research and product development costs represent research costs and costs pertaining to minor product enhancements, refreshes and upgrades to existing vehicle models. These represented 1.1% of total revenues for Fiscal 2015 and 2014. |
Expenditure capitalized
This represents employee costs, stores and other manufacturing supplies and other works expenses incurred mainly towards product development projects. Considering the nature of our industry, we continually invest in the development of new products and invest to address safety, emission and other regulatory norms. The expenditure capitalized increased by 13.3% to Rs.153,218 million in Fiscal 2015 from Rs.135,247 million in Fiscal 2014. The increase includes a favorable foreign currency translation impact from GBP to Indian rupees of Rs.2,654 million pertaining to Jaguar Land Rover. These reflect expenditures on new products and other major product development plans.
Depreciation and Amortization
Our depreciation and amortization expenses increased by 21.8% in Fiscal 2015, the breakdown of which is as follows:
| Year ended March 31, | ||||||||
| 2015 | 2014 | |||||||
| (Rs. in millions) | ||||||||
Depreciation | 65,398 | 52,426 | ||||||
Amortization | 69,098 | 58,037 | ||||||
|
|
|
| |||||
Total | 134,496 | 110,463 | ||||||
|
|
|
| |||||
The increase in depreciation and amortization expenses includes an unfavorable foreign currency translation from GBP to Indian rupees of Rs.1,543 million pertaining to Jaguar Land Rover. The increase in depreciation expenses was on account of asset additions, which primarily include the launch of Ingenium engines at the Wolverhampton facility in the United Kingdom and expenses attributable to plant and equipment and tooling, which are mainly towards capacity and new products. The amortization expenses for Fiscal 2015 mainly related to product development costs capitalized and new products introduced during this period and during Fiscal 2014, primarily the Jaguar F-TYPE coupe and all-wheel drive derivatives, the new Discovery Sport, the Zest and Ultra trucks. Depreciation and amortization expenses represented 5.1% and 4.7% of total revenues in Fiscal 2015 and Fiscal 2014, respectively.
Other income (net)
There was a net gain of Rs.11,508 million in Fiscal 2015, as compared to Rs.7,733 million in Fiscal 2014, representing an increase of 48.8%.
| i. | During Fiscal 2014, we repaid senior notes before maturity and consequently recognized a loss of Rs.4,792 million towards reversal of previously recognized gain of the fair value of prepayment option. Please see Item 5.B “—Liquidity and Capital Resources-Long-term funding” of this annual report on Form 20-F for details on prepayments of senior notes in Fiscal 2014. |
| ii. | There was a loss on the fair value of conversion option relating to foreign currency convertible notes of Rs.838 million in Fiscal 2014. The notes were fully converted in Fiscal 2014. |
| iii. | We recorded a loss on a sale of assets and assets written off of Rs.3,512 million in Fiscal 2015 as compared to Rs.294 million in Fiscal 2014. |
Capital work-in-progress as at March 31, 2014, included building under construction at Singur in the state of West Bengal in India of Rs.3,098.8 million for the purposes of manufacturing automobiles. We have made a provision for carrying capital costs of buildings at Singur amounting to Rs.3,098.8 million in Fiscal 2015, excluding other assets, such as electrical installations, expenses written off/provided for in earlier years, security expenses, lease rent and our claim for the interest on the whole amount (including on the Rs.3,098.8 million carrying capital costs). Please see Item 4.B “Information on the Company—Business Overview—Legal Proceedings” of the annual report on Form 20-F for additional details on the claims related to the Singur facility.
| iv. | Miscellaneous income increased by 10.6% to Rs.13,474 million in Fiscal 2015 from Rs.12,179 million in Fiscal 2014. During Fiscal 2014, legislation was enacted that allows United Kingdom (UK) companies to elect for the Research and Development Expenditure Credit (RDEC) on qualifying expenditures incurred since April 1, 2013, instead of the existing super-deduction rules. Accordingly, the amount not relating to capitalized product development expenditure of Rs.2,909 million and Rs.1,712 million for the Fiscal 2015 and 2014, respectively, have been recognized as miscellaneous income. Further, the increase was due to income earned from services provided to Chery Jaguar Land Rover Automotive Company Limited of Rs.1,134 million in Fiscal 2015 as compared to Rs.179 million in Fiscal 2014. Furthermore, Jaguar Land Rover earned commissions of Rs.1,163 million in Fiscal 2015 as compared to Rs.183 million in Fiscal 2014. In addition, in Fiscal 2015 we recorded an income of Rs.366 million on the sale of occupancy rights. |
For further details see Note 30 to our consolidated financial statements included elsewhere in this annual report onForm 20-F.
Interest expense (net)
Our interest expense (net of interest capitalized) decreased by 1.6% to Rs.52,232 million in Fiscal 2015 from Rs.53,095 million in Fiscal 2014. As a percentage of total revenues, interest expense represented 2.0% in Fiscal 2015 compared to 2.3% in Fiscal 2014. The interest expense (net) for Jaguar Land Rover was GBP 135 million (Rs.12,779 million) in Fiscal 2015 as compared to GBP 138 million (Rs.13,272 million) in Fiscal 2014, which includes prepayment penalties of GBP 77 million as compared to GBP 53 million in Fiscal 2014. The decrease (excluding prepayment penalty) in interest expense is primarily due to the prepayment of higher coupon senior notes during Fiscal 2014 and 2015, offset by an unfavorable foreign currency translation of Rs.1,143 million from GBP to Indian rupees. For our operations of Tata and other brand vehicles (including financing thereof), interest expense increased marginally by 1.8% to Rs.39,665 million in Fiscal 2015 from Rs.38,966 million in Fiscal 2014. See Item 5.B “—Liquidity and Capital Resources” of this annual report on Form 20-F for additional details on our debt financing arrangements.
Foreign exchange (gain)/loss (net)
We had a net foreign exchange loss of Rs.12,681 million in Fiscal 2015, compared to a net gain of Rs.19,104 million in Fiscal 2014. This was primarily attributable to our Jaguar Land Rover operations.
| i. | Jaguar Land Rover recorded an exchange loss of Rs.11,949 million in Fiscal 2015 as compared to gain of Rs.25,244 million in Fiscal 2014. We incurred a net exchange loss on senior notes of Rs.15,387 million in Fiscal 2015, as compared to gain of Rs.8,367 million in Fiscal 2014, mainly due to appreciation of U.S. dollars as compared to GBP as at March 31, 2015. Further, there was a loss of Rs.11,536 million in Fiscal 2015 as compared to gain of Rs.16,253 million in Fiscal 2014, due to fluctuations in foreign currency exchange rates on derivative contracts, mainly reflecting a weaker Chinese RMB, which includes a gain of Rs.4,338 million on cash flow hedges in Fiscal 2015 as compared to Rs.10,771 million in Fiscal 2014. The above loss is offset by revaluation of other assets and liabilities by gain of Rs.11,195 million as compared to Rs.4,979 million. |
| ii. | For India operations, due to depreciation of the Indian rupee mainly against the U.S. dollar, we incurred exchange losses. There was a net exchange loss of Rs.1,777 million in Fiscal 2015 as compared to Rs.4,841 million in Fiscal 2014, attributable to foreign currency denominated borrowings. |
Impairment in respect of equity-accounted investees
In Fiscal 2014, impairment loss in respect of equity-accounted investees were recorded of Rs.8,034 million in respect of our investment in an associate, Tata Hitachi Construction Machinery Co. Pvt Ltd.
Income Taxes
Our income tax expense increased by 43.4% to Rs.69,150 million in Fiscal 2015 from Rs.48,227 million in Fiscal 2014, resulting in consolidated effective tax rates of 34.9% and 26.9%, for Fiscal 2015 and 2014, respectively.
Reasons for significant differences in the company’s recorded income tax expense of Rs.69,150 million as compared to Rs.38,245 million income tax expense computed at the domestic statutory tax rate of respective jurisdictions where entities are domiciled for Fiscal 2015 are as follows:
| i. | During Fiscal 2015, for Tata Motors Limited, on a standalone basis, we have not recognized a deferred tax asset, amounting to Rs.13,844 million, with respect to tax losses, due to the uncertainty of future taxable profit against which tax losses can be utilized. |
| ii. | Furthermore, during Fiscal 2015, deferred tax assets totaling Rs.7,089 million, were not recognized in certain subsidiaries due to uncertainty of realization. |
| iii. | During Fiscal 2015, TML Holdings Pte Ltd, a wholly-owned subsidiary, repurchased 35,000,000 equity shares, par value US$1 each, at a price of US$7.99 each. The resultant gain was subject to capital gains tax in India for Tata Motors Limited, on a standalone basis, resulting in utilization of business losses having a tax effect of Rs.4,469 million. |
| iv. | Income tax expense on undistributed earnings of subsidiaries was Rs.7,805 million in Fiscal 2015 |
| v. | The relevant Indian tax regulations mandate that companies pay tax on book profits, known as the Minimum Alternate Tax, or MAT. MAT may be carried forward and set off against future income tax liabilities computed under normal tax provisions within a period of ten years. We had recognized deferred tax assets in respect of MAT paid in prior years for Tata Motors Limited on a standalone basis. |
In Fiscal 2015, the Government of India amended Indian income tax laws extending the concessional tax rate of 15% on dividends received from foreign subsidiaries indefinitely. This amendment will result in lower utilization of deferred tax assets in respect of MAT paid, due to which we have written off previously recognized deferred tax assets in respect of MAT paid of Rs.7,772 million.
| vi. | The above differences were offset by the change in withholding tax rate in China resulting in credit of Rs.6,269 million in Fiscal 2015, attributable to dividends in China being subject to a reduced withholding tax rate of 5% (rather than 10%), as set out in the new United Kingdom-China tax treaty. |
Reasons for significant differences in the company’s recorded income tax expense of Rs.48,227 million as compared to Rs.35,741 million income tax expense computed at the domestic statutory tax rate of respective jurisdictions where entities are domiciled for Fiscal 2014 are as follows:
| i. | Income tax expense on undistributed earnings of subsidiaries was Rs.12,994 million in Fiscal 2014. |
| ii. | Furthermore, in Fiscal 2014, we recognized Rs.4,676 million tax expenses on dividends from Jaguar Land Rover due to income taxes applicable to Tata Motors Limited on a standalone basis. |
| iii. | In Fiscal 2014, we have recognized net credit of Rs.5,300 million representing reduction in statutory tax rates applicable to a subsidiary in the UK. |
| iv. | In Fiscal 2014, we had written off previously recognized deferred tax assets in respect of MAT paid of Rs.7,318 million in light of lower taxable profit, considering the economic slowdown in India. |
As explained above in the reconciliation from our statutory tax rates to effective tax rates for Fiscal 2015 and Fiscal 2014, our income tax expense in fiscal 2015 increased by Rs.20,923 million mainly due to:
| i. | Non-recognition of deferred tax assets amounting to Rs.20,933 million in Tata Motors Limited and certain subsidiaries due to uncertainty of future taxable profits; |
| ii. | Tax effect on shares purchased by a wholly owned subsidiary of Rs.4,469 million; |
which were offset by:
| i. | a lower charge on undistributed earnings and dividend of subsidiaries, joint operations and equity accounted investees of Rs.9,845 million; and |
| ii. | Reduction due to change in statutory tax rate by Rs.2,700 million to Rs.8,000 million in Fiscal 2015 as compared to Rs.5,300 million in Fiscal 2014. |
For further details see Note 17 to our consolidated financial statements included elsewhere in this annual report on Form 20-F.
Share of profit of equity-accounted investees and non-controlling interests in consolidated subsidiaries, net of tax
In Fiscal 2015, our share of profit of equity-accounted investees reflected a loss of Rs.1,748 million, as compared to Rs.1,878 million in Fiscal 2014, a decrease of 6.9%.
Our share of loss (including other adjustments) in Chery Jaguar Land Rover Automotive Company Limited in Fiscal 2015 was Rs.1,213 million as compared to Rs.807 million in Fiscal 2014.
Our share of loss in Tata Hitachi Construction Machinery Co Private Ltd was Rs.768 million in Fiscal 2015 as compared to Rs.1,354 million in Fiscal 2014.
Our share of non-controlling interests in consolidated subsidiaries increased by 71.2% to Rs.791 million in Fiscal 2015 from Rs.462 million in Fiscal 2014 primarily due to increased profitability of one of our subsidiaries, TTL.
Net income
Our consolidated net income in Fiscal 2015, excluding shares of non-controlling interests, decreased marginally by 1.9% to Rs.128,291 million from Rs.130,717 million in Fiscal 2014. Net income as a percentage of total revenues also decreased from 5.6% in Fiscal 2014 to 4.9% in Fiscal 2015. This decrease was mainly the result of the following factors:
There was a decrease in revenue from our vehicle financing operations by 24.3% to Rs.22,631 million in Fiscal 2015 from Rs.29,876 million in Fiscal 2014.
Negative earnings before other income, interest and tax for Tata and other brand vehicles (including financing thereof) of Rs.29,831 million in Fiscal 2015 from Rs.20,631 million in Fiscal 2014. The losses were mainly attributable to reduction in sales volumes of small commercial vehicles, competitive pressure on pricing as well as a decrease in vehicle financing activity. Furthermore, there was an increase in depreciation expenses as a result of additions to plants and facilities in recent years, and in amortization expenses for product development costs due to new products launched. While we have implemented cost-reduction programs, in the short term, we expect that the level of fixed costs are expected to continue to have a negative impact on earnings.
These were primarily offset by the following factors:
Earnings before other income, interest and tax for Jaguar Land Rover increased by 20.3% to Rs.274,382 million in Fiscal 2015 from Rs.228,027 million in Fiscal 2014 which amounted to 12.7% in Fiscal 2015 of sales as compared to 12.0% in Fiscal 2014. The decrease in net income for Fiscal 2015 was also offset by a favorable foreign currency translation of Rs.698 million from GBP to Indian rupees. The improvement in profitability was mainly attributable to increases in volumes across all markets, introduction of the Jaguar F-TYPE and smaller powertrain derivative of XF and XJ and XF Sportbrake, the New Range Rover, the New Range Rover Sport and Range Rover Evoque. Furthermore, the performance was also supported by the positive impact of the continuing strength of the U.S. dollar against the GBP and the Euro, improving its revenues against the backdrop of a largely GBP and Euro cost base.
Impairment loss of Rs.8,034 million in respect of investment in an associate in Fiscal 2014.
Fiscal 2014 compared to Fiscal 2013
Revenues
Our total consolidated revenuesrevenue (net of excise duty, where applicable) including finance revenues were Rs.1,889,860revenue increased by 23.7% to Rs.2,341,761 million in Fiscal 2013, an increase of Rs.225,007 million or 13.5%,2014 from Rs.1,664,853Rs.1,892,910 million in Fiscal 2012.2013.
The increase in revenuesrevenue was primarily driven by our Jaguar Land Rover business, where revenues increased by 30.7%, from Rs.1,044,53338.7% to Rs.1,894,590 million in Fiscal 2012 to2014 from Rs.1,365,620 million in Fiscal 2013. The increase in revenues was2013, primarily a result ofdue to volume increases across products and markets. The revenues also reflect an increase on account ofa favorable foreign currency translation from GBP to INRIndian rupees of Rs.140,655 million. Rs.150,630Rs.218,417 million or 14.4% of the aggregatepertaining to Jaguar Land Rover. The increase in revenues of Rs.180,432Rs.310,553 million at our Jaguar Land Rover business (excluding translation impact) was mainly attributable to an increase in sales of the Range Rover and Evoque from 59,948146,425 units in Fiscal 20122013 to 115,529166,697 units in Fiscal 2013.2014 and Jaguar vehicles from 57,766 units in Fiscal 2013 to 80,644 units in Fiscal 2014. The increase in revenue in Fiscal 2014 was also attributable to an indirect tax incentive by Jaguar Land Rover of Rs.8,463 million.
The increase in revenuesrevenue at our Jaguar Land Rover business was partly offset by a decrease in revenue for Tata and other brand vehicles including(including financing thereofthereof) by 15.9% from Rs.611,04815.8% to Rs.435,012 million in Fiscal 2012, to Rs.513,8172014 from Rs.516,867 million in Fiscal 2013. The decrease was mainly dueOur revenues from sales in India decreased by 31.1% to challenging market conditions and competition. In particular, theRs.335,009 million in Fiscal 2014 from Rs.439,157 million in Fiscal 2013. A decrease in revenues resultedrevenue from a significant reduction in the vehicle sales volumes in several vehicle categories, including M&HCV in India, which decreased from Rs.246,079 to Rs.168,363 million and passenger cars,&HCVs, which decreased by 37.8% from Rs.81,330 million23.1% to Rs.50,551 million.
The above decrease in revenues was offset by:
an increase in finance revenue by 23.3% from Fiscal 2012, which resulted from increased volume of financing.
an increase in spares sales activity by 10.2% from Fiscal 2012
an increase in vehicle sales in LCV category, in India by 17.6% from Rs.95,805Rs.129,350 million in Fiscal 20122014 from Rs.168,363 million in Fiscal 2013, and LCVs, which decreased by 32.5% to Rs.74,900 million in Fiscal 2014 to Rs.112,631 million in Fiscal 2013 which was largely supportedcontributed to the decrease in revenue from Tata and other brand vehicles (including financing thereof). Similarly, revenue from passenger cars decreased by demand for small commercial vehicles driven by certain niche segments and our market penetration.
an increase in vehicle sales of TDCV by 24.1% from Rs.29,80838.6% to Rs.30,370 million in Fiscal 2012 to Rs.36,9922014 from Rs.50,551 million in Fiscal 2013, primarily asand revenue from utility vehicles decreased by 30.0% to Rs.13,810 million in Fiscal 2014 from Rs.19,729 million in Fiscal 2013. Furthermore, there was a result of significantdecrease in revenue from spares sales activity by 9.6% in Fiscal 2014. These decreases in revenue were offset by an increase in somerevenue of the Company’s traditional export markets like Algeria, Russia, Laos, South Africa, and Vietnam. TDCV has also commenced introducing its productsby 21.3% to Rs.47,533 million in some new markets like Indonesia, Ecuador, and Ghana with a viewFiscal 2014 from Rs.39,204 million in Fiscal 2013.
Revenue from our vehicle financing operations decreased marginally by 0.5% to diversify its market.
RevenuesRevenue (net of excise duty, where applicable) before inter-segment eliminations from other operations wereincreased by 12.7% to Rs.24,989 million in Fiscal 2014 from Rs.22,179 million in Fiscal 2013, an increase of 17.3% from Rs.18,905 million in Fiscal 2012. The increase in revenues from other operations was mainly attributable to traction in the automotivewhich represents 1.1% and aerospace markets. Revenues from other operations represent 1.2% and 1.1% of our total revenues,revenue, before inter-segment eliminations, in Fiscal 2014 and 2013, and 2012, respectively. The increase in revenues net of inter-segment elimination was Rs.889 million, which was mainly attributable to the acquisition of Cambric Holdings Inc by TTL.
Cost and Expenses
Raw Materials, Components and Purchase of Products for Sale (including change in stock): (Material costs)Raw material
Material costs for Fiscal 2013 were Rs.1,206,250 million comparedincreased by 20.3% to Rs.1,100,477Rs.1,444,946 million in Fiscal 2012, reflecting an increase of 9.6%, or Rs.105,7732014 from Rs.1,201,017 million fromin Fiscal 2012.2013. The increase in rawabsolute terms in material costs in Fiscal 2014 was mainly attributable to an increaseincreased volumes at our Jaguar Land Rover business as further discussed below. The increase was also partially attributable to the effect ofand includes an unfavorable foreign currency translation from GBP to Indian rupees for Jaguar Land Rover operations which resulted in an increase of Rs.88,851Rs.133,237 million. This was partly offset by decrease at our India operations, due to reduction in volumes. Raw material
Material costs as a percentage of revenues (excluding finance revenues) decreased to 64.9%62.5% in Fiscal 20132014 from 64.5% in Fiscal 2013. The reduction in material costs as a percentage to revenue was partly on account of a change in the composition of revenue, with a greater proportion of revenue attributable to Jaguar Land Rover revenue as compared to 67.1%India operations in Fiscal 2012.2014.
At our Jaguar Land Rover operations, raw material costs for Fiscal 2013 were Rs.850,372 million comparedincreased by 35.8% to Rs.671,043Rs.1,154,510 million in Fiscal 2012, reflecting an increase of Rs.179,3292014 from Rs.850,372 million, fromin Fiscal 2012 (net of translation increase of Rs.90,478 million).2013. The raw material costcosts as a percentage of revenuesto revenue decreased to 61.4% in Fiscal 2014 from 62.8% in Fiscal 2013 as compared to 64.6% in Fiscal 2012. The raw material costfor Jaguar Land Rover (in GBP terms). Material costs increased by GBP 8961,107 million (Rs.77,081(Rs.106,416 million) due to an increase in volume and an increase in duties by GBP 213163 million (Rs.18,314(Rs.15,676 million) which was mainly due to an increase in sales to China. However, as a percentage to revenue, duties decreased to 10.4% in Fiscal 2014 from 11.7% in Fiscal 2013, due to an increase in sales in China by 32.7%. Theof 2.0 liter engines, on which a lower duty is paid during Fiscal years in which we sold engines separately in China. Furthermore, the decrease in material costcosts as a percentage to revenue was mainly due to cost reductioncost-reduction programs undertaken by Jaguar landLand Rover of approximately GBP 117209 million (Rs.10,060(Rs.20,100 million) and positive. However, that decrease was partially offset by negative movement of foreign currency rates applicable for sourcing countries of GBP 185154 million (Rs.15,907(Rs.14,811 million).
At our IndiaTata and other brand vehicles operations raw(excluding finance revenues), material costs for Fiscal 2013 were Rs.329,621 million compareddecreased by 19.3% to Rs.397,023Rs.277,820 million in Fiscal 2012, reflecting2014 from Rs.344,115 million, which was primarily caused by a decrease of Rs.67,402 millionreduction in sales volume across all vehicle categories at our India operations. The material costs as a percentage to revenue decreased to 68.6% in Fiscal 2014 from 70.7% in Fiscal 2012.2013. The reduction represent volume impact of M&HCV Rs.56,419 million and passenger cars by Rs.27,882 million. This was partly offset by increase in volumes of LCV by Rs.13,273 million. The raw material costcosts as a percentage of revenues increasedrevenue is mainly attributable to 73.5%the composition of revenue, with a greater proportion of revenue attributable to revenue from spares and M&HCVs, which feature a lower percentage of material costs to revenue. Furthermore, in the utility vehicles and LCV categories, average price realization improved over material costs in Fiscal 2013, as compared2014. However, the decreases were offset by reductions in average price realization for passenger cars due to 72.7%the competitive environment.
Employee Cost
Our employee costs increased by 28.0% to Rs.213,903 million in Fiscal 2012 (before inter-segment eliminations). The percentage increase was due to change in proportion of products – lower M&HCV volumes (high contribution models) and higher LCVs (low contribution models).
Employee Cost:Our employee cost was Rs.166,0382014 from Rs.167,170 million in Fiscal 2013, as comparedincluding the foreign currency translation impact from GBP to Rs.122,130 million in Fiscal 2012 and has gone up by 36.0% or Rs.43,908 million.Indian rupees discussed below. Our permanent headcount increased by 7%6.2% as at March 31, 2014 to 68,889 employees, as compared to 64,821 employees as at March 31, 2013, whereas the average temporary headcount decreased by 14.3% to 62,71635,260 employees as compared to 58,618in Fiscal 2014 from 41,118 employees as at March 31, 2012.in Fiscal 2013.
The employee costcosts at Jaguar landLand Rover wasincreased by 39.8% to Rs.160,147 million in Fiscal 2014 from Rs.114,591 million in Fiscal 2013,2013. This includes an unfavorable foreign currency translation from GBP to Indian rupees of Rs.17,987 million. In GBP terms, the employee costs at Jaguar Land Rover were GBP 1,654 million in Fiscal 2014 as compared to Rs.77,813GBP 1,334 million in Fiscal 2012, which reflects an increase of 47.3% or Rs.36,778 million. This includes currency translation of Rs.12,379 million.2013. The employee costcosts at Jaguar Land Rover as a percentage to revenue waswere 8.5% in Fiscal 2014 and 8.4% forin Fiscal 20132013. Due to consistent increases in volumes and 7.5% for Fiscal 2012.to support new launches and product development projects, Jaguar Land Rover increased its permanent and agency headcount to support volume increases, as well as new launches and product development projects. The permanent headcount increased by 9.5%29.6% as at March 31, 20132014 to 17,83223,111 employees as compared to 16,31317,832 employees as at March 31, 2012. The2013. Jaguar Land Rover’s average temporary headcount increaseddecreased by 40.5% for31.6% in Fiscal 20132014 to 4,842 employees from 7,081 employees as compared to 5,041 employees forin Fiscal 2012.2013. The increase in costemployee costs was also attributabledue to a wage agreement in November 2012, resulting in an increase of 4.5% increase in salary. Further increase in cost was due to higher pension charge by GBP 3471 million (Rs.2,889(Rs.6,838 million), due to change in actuarial assumptions, such as discount rate and inflation and other benefits/costs to employees by GBP 40 million (Rs.3,412 million), on account ofa 7.5% increase in salariesemployee salary in Fiscal 2014 compared to an increase of 4.5% in Fiscal 2013.
At our India operations, the employee costs increased by 2.4% to Rs.33,672 million in Fiscal 2014 from Rs.32,880 million in Fiscal 2013. The permanent headcount decreased marginally by 0.5% as at March 31, 2014 to 38,434 employees as compared to 38,627 employees as at March 31, 2013. To address the challenges posed by the business downturn, we introduced an organization-wide cost-optimization program and incurred Rs.535 million towards an employee early-separation scheme. The remaining increase in employee cost was mainly due to regular increases in salary. For our India operations, the average temporary headcount decreased by 23.3% to 26,973 employees in Fiscal 2014 from 35,184 employees in Fiscal 2013.
The employee cost at TDCV decreased by 16.7% to Rs.5,771 million in Fiscal 2014 from Rs.6,916 million in Fiscal 2013. In South Korea, ourFiscal 2013, TDCV recorded a provision of Rs.2,124 million, stemming from the lawsuit filed by the union employees had filed a lawsuit demanding inclusion of some elements of non-ordinary salary and bonus as part of ordinary wages, which hashad been decided by the district court of Seoul against TDCV. This decrease in their favor. We have made a provisionemployee costs at TDCV was offset by an increase of Rs.2,124Rs.979 million in Fiscal 2013 in respect2014 relating to regular salary increases and an unfavorable foreign currency translation from Korean won to Indian rupees of Rs.196 million. Please see Item 4.B “Information on Our Company—Business Overview—Legal Proceedings” of this lawsuit. We have filed an appeal againstannual report on Form 20-F for further details on the order.lawsuit related to employee costs at TDCV.
For our IndiaDuring Fiscal 2014, we closed the manufacturing operations (Tata brand vehicles) theat Tata Hispano Motors Carrocera S.A. and accordingly paid Euro 12.4 million (Rs.1,006 million) as employee costseparation costs. The closure was Rs.31,784 milliontriggered by continuous underperformance that was mainly attributable to challenging market conditions in Fiscal 2013, as compared to Rs.30,079 million in Fiscal 2012, which reflects an increase of 5.7% or Rs.1,705 million. The permanent headcount increased by 4.5% as at March 31, 2013 to 36,522 employees, as compared to 34,593 employees as at March 31, 2012, mainly due to commencement of operations of Dharwad plant in March 2012 and increased product development activity. The increase was due to yearly increments (Rs.1,661 million for Tata Motors) and wage revision at one of the major location (increase of Rs.409 million), due in Fiscal 2013, which was partly offset by reduction in variable pay, due to performance factors (Rs.764 million for Tata Motors).regions where Hispano operates.
Other Expenses:Expenses
Other expenses increased by 23.5%29.7% to Rs.382,120Rs.498,778 million in Fiscal 20132014 from Rs.309,381Rs.384,423 million in Fiscal 2012.2013. This increase mainly reflects the impactan effect of an increase in volumes at Jaguar Land Rover and an unfavorable foreign currency translation of Rs.29,450 million.GBP to Indian rupees of Rs.43,558 million pertaining to Jaguar Land Rover. As a percentage of total revenues, these expenses represented 20.2%21.3% in Fiscal 2013,2014 as compared to 18.6%20.3% in Fiscal 2012.2013. The major components of expenses are as follows:
| Percentage of Total Revenue | ||||||||||||||||||||||||||||||||
| Year ended March 31, | Increase/ (Decrease) | Year ended March 31, | Year ended March 31, | |||||||||||||||||||||||||||||
| 2013 | 2012 | 2014 | 2013 | Change | 2014 | 2013 | ||||||||||||||||||||||||||
| (Rs. in millions) | (Rs. in millions) | |||||||||||||||||||||||||||||||
Freight and transportation expenses | 55,851 | 45,891 | 9,960 | 75,439 | 55,930 | 34.9 | % | 3.2 | % | 3.0 | % | |||||||||||||||||||||
Works operation and other Expenses | 143,224 | 110,719 | 32,505 | |||||||||||||||||||||||||||||
Works operation and other expenses | 186,067 | 143,924 | 29.3 | 7.9 | % | 7.6 | % | |||||||||||||||||||||||||
Publicity | 66,315 | 53,931 | 12,384 | 81,425 | 66,556 | 22.3 | 3.5 | % | 3.5 | % | ||||||||||||||||||||||
Allowance for trade and other receivables, and finance receivables | 10,569 | 6,745 | 3,824 | 26,830 | 10,570 | 153.8 | 1.1 | % | 0.6 | % | ||||||||||||||||||||||
Warranty and product liability expenses | 41,869 | 35,815 | �� | 6,054 | 57,957 | 42,029 | 37.9 | 2.5 | % | 2.2 | % | |||||||||||||||||||||
Research and development expenses | 25,651 | 20,340 | 26.1 | % | 1.1 | % | 1.1 | % | ||||||||||||||||||||||||
| 1. | The increase in freight and transportation expenses |
| 2. | Our works operation and other expenses represented |
| 3. | Publicity expenses were 3.5% of our |
| The allowances for trade and other receivables, and finance receivables mainly relates to India operations. The increase mainly relates to a provision for impairment of vehicle loans. Rates of defaults of vehicle loans increased in |
| 5. | Warranty and product liability expenses represented |
| 6. | Research and product development costs represent research costs and costs pertaining to minor product enhancements, refreshes and upgrades to existing vehicle models. These represented 1.1% of total revenues for each of Fiscal 2014 and 2013. |
Expenditure capitalized:capitalized
These represent employee costs, stores and other manufacturing supplies and other works expenses incurred towards product development projects and also include costs attributable to internally constructed capital items. Considering the nature of our industry, we have to continually invest in the development of new products and must also address safety, emission and other regulatory norms. The expenditure capitalized increased by 32.7% to Rs.135,247 million in Fiscal 2014 as compared to Rs.101,935 million in Fiscal 2013. The increase includes a favorable foreign currency translation impact from GBP to Indian rupees of Rs.13,374 million pertaining to Jaguar Land Rover. The increase reflects expenditure on new products and other major product development plans, including for example, with respect to the new Range Rover, the Range Rover Sport, futurethe Jaguar F-TYPE and new models of LCVs, World TruckPrima trucks and passenger car models.cars.
Depreciation and Amortization:Amortization
Our depreciation and amortization expenses increased by Rs.19,288 million to Rs.73,723 million45.8% in Fiscal 2013, compared to Rs.54,435 million in Fiscal 2012. 2014, the breakdown of which is as follows:
| Year ended March 31, | ||||||||
| 2014 | 2013 | |||||||
| (Rs. in millions) | ||||||||
Depreciation | 52,426 | 39,651 | ||||||
Amortization | 58,037 | 36,117 | ||||||
|
|
|
| |||||
Total | 110,463 | 75,768 | ||||||
|
|
|
| |||||
The increase on account of currency translation from GBP to Indian rupees is Rs.5,401 million.Rs.9,864 million pertaining to Jaguar Land Rover. The increase in depreciation expenses from Rs.31,849 million in Fiscal 2012 to Rs.38,088 million in Fiscal 2013, iswas on account of asset addition in Fiscal 20132014 and plant and equipment and toolings (mainly towards capacity and new products) installed in Fiscal 2012 (production facility for Evoque at Halewood and plant at Dharwad), the full effect of which is reflectedasset additions in the currentprevious year. The increase in amortization ofexpenses mainly relate to product development cost from Rs.22,586 million in Fiscal 2012 to Rs.35,635 million in Fiscal 2013, reflects amortization cost of productscosts capitalized and new products introduced during Fiscal 20122013 and Fiscal 2014, primarily, the new Range Rover, the new Range Rover Sport, Evoque and Jaguar F-TYPE and represented 2.5% and 1.9% of revenue for Fiscal 2014 and Fiscal 2013, primarily, the Range Rover Evoque and Safari Storme.respectively.
Other income (net):
There was a net gain of Rs.12,024Rs.7,733 million in Fiscal 2014, as compared to Rs.12,099 million in Fiscal 2013, as compared to Rs.9,407 million in Fiscal 2012 an increaserepresenting a decrease of Rs.2,617 million.36.1%.
| i. |
| ii. |
| iii. | In Fiscal 2014, there was a gain on a sale of available for sale investments of Rs.1,102 million as compared to loss of Rs.275 million in Fiscal 2013. |
For further details refer notesee Note 30 to our consolidated financial statements included elsewhere in this annual report.report onForm 20-F.
Interest expense (net):
Our interest expense (net of interest capitalized) increased by 6.4%30.2% to Rs.40,752Rs.53,095 million in Fiscal 2013, compared to Rs.38,2902014 from Rs.40,792 million in Fiscal 2012.2013. As a percentage of total revenues, interest expense represented 2.3% in Fiscal 20132014 compared to 2.2% in Fiscal 2012.2013. The gross interest expense increased by 16.7% to Rs.54,112(net) for Jaguar Land Rover was GBP 138 million (Rs. 13,272 million) in Fiscal 2013,2014 as compared to Rs.46,377GBP 65 million (Rs.5,608 million) in Fiscal 2012. Consequent2013. The increase of Rs.12,303 million was due to increase in financing activitythe prepayment of senior notes of GBP 53 million (Rs.5,097 million) as detailed below. Item 5.B “—Liquidity and the rate change interest expense increased by Rs.3,765 million.Capital Resources—Long-term funding” of this annual report on Form 20-F for additional details regarding our prepayment of senior notes. This also includes a currency translation of Rs.2,317 million from GBP to Indian rupees.
Foreign exchange (gain)/loss (net):
We hadrecorded a net foreign exchange lossgain of Rs.15,640Rs.19,104 million in Fiscal 2013,2014, compared to Rs.11,154a loss of Rs.15,775 million in Fiscal 2012.2013. This was primarily dueattributable to the following factors:Jaguar Land Rover operations.
| i. | Jaguar Land Rover |
| ii. | For India operations, due to depreciation of the Indian rupee against all major currencies, we incurred exchange losses |
Income Taxes:Our income tax expense was Rs.39,191 millionImpairment in Fiscal 2013, compared to Rs.4,707 million in Fiscal 2012. In Fiscal 2012. The main reason arerespect of equity-accounted investees
For further details refer to note 16 to our consolidated financial statements included elsewhere in this annual report.
Non-controlling Interests in Consolidated Subsidiaries and Share of profit of equity accounted investees, net of tax:In Fiscal 2013, our share of profit of equity accounted investees reflected a gain of Rs.1,734 million, as compared to loss of Rs.351 million in Fiscal 2012. In Fiscal 2013,
our share of profits increased by Rs.1,101 million in one of equity accounted investees, which recorded gain on divestment of certain joint ventures investment by the affiliate.
in another affiliate our share of earning was Rs.1,538 million (loss of Rs.619 million in Fiscal 2012) consequent to revision in business model and pricing basis.
loss of Rs.1,017 million in the China JV due to start-up cost.
In Fiscal 2013, our share of non-controlling interest reflected a gain of Rs.886 million, as compared to Rs.781 million in Fiscal 2012, primarily due to increased profitability of our subsidiaries, mainly Tata Technologies Ltd.
Net Income
Our consolidated net income for Fiscal 2013 excluding share of non-controlling interests decreased by 23.3% to Rs.88,697 million from Rs.115,659 million in Fiscal 2012. Net income as a percentage of total revenues also decreased to 4.7% in Fiscal 2013 from 7.0% in Fiscal 2012. This decrease was the result of the following factors:
Revenues from the domestic market (India) decreased by 18.3% to Rs.451,652 million in Fiscal 2012 from Rs. 552,513 million in Fiscal 2012, resulting in earnings before other income, interest and tax of Rs.10,701 million in Fiscal 2013 for Tata and other brand vehicles including financing thereof, as compared to Rs.40,844 million in Fiscal 2012; and
higher income tax expense.
Which was offset by
Revenues from market outside India increased by 29.3% to Rs.1,438,238 million in Fiscal 2013 from Rs.1,112,340 million in Fiscal 2012, mainly attributable to our Jaguar Land Rover business. The earnings before other income, interest and tax for Jaguar Land Rover business was Rs.150,687 million in Fiscal 2013 as compared to Rs.118,895 million in Fiscal 2012; and
increase in other income, mainly due to gain on the fair value of prepayment option.
Fiscal 2012 Compared to Fiscal 2011
Revenues
Our total consolidated revenues (net of excise duty, where applicable) including finance revenues were Rs.1,664,853 million in Fiscal 2012, an increase of Rs.432,719 million or 35.1%, from Rs.1,232,134 million in Fiscal 2011. The growth was driven by volumes across all markets and more particularly growth in volumes by 29.1% in premium car segment, supported by new products and significant performance improvement of our Jaguar Land Rover in the Chinese market.
The revenue from Tata and other brand vehicles increased by 16.0% (the figures are before inter-segment eliminations), primarily due to:
15.3% increase in vehicle unit sales in India (mainly M & HCV by Rs.43,327 million);
21.5% increase in spares and after sales activity; and
9.5% increase in automotive financing revenues.
Revenues for the Jaguar Land Rover business increased by 49.3% to Rs.1,044,533 million. The increase is attributable to the launch of the Range Rover Evoque and an increase in sales volumes by 36.7% particularly in China, Russia, South Africa and Brazil. The increase on account of currency translation was Rs.80,712 million.
Revenues (net of excise duty, where applicable) before inter-segment eliminations, from other operations were Rs.18,905 million in Fiscal 2012, an increase of 26.7% from Rs.14,916 million in Fiscal 2011. Revenues from other operations represent 1.1% and 1.2% of our total revenues, before inter-segment eliminations, in Fiscal 2012 and 2011, respectively.
Cost and Expenses
Raw Materials and Purchase of Products for Sale (including change in stock):Raw material costs for Fiscal 2012 were Rs.1,100,477 million compared to Rs.796,224 million in Fiscal 2011, reflecting an increase of Rs.304,253 million or 38.2% from Fiscal 2011, mainly attributable to increase in volumes. The increase in raw material cost was also partly attributable to the effect of currency translation from GBP to Indian rupees, which resulted in an increase of Rs.54,570 million.
Raw material costs as a percentage of revenues (excluding finance revenues) increased to 67.1% in Fiscal 2012 as compared to 65.8% in Fiscal 2011.
At our Jaguar Land Rover operations, raw material costs for Fiscal 2012 were Rs.671,043 million compared to Rs.438,484 million in Fiscal 2011, reflecting an increase of Rs.232,559 million from Fiscal 2011 mainly due to increased volumes. The raw material cost as a percentage of revenues increased to 64.6% in Fiscal 2013, as compared to 62.7% in Fiscal 2012. Duty expense have increased in Fiscal 2012 by GBP 848 million (Rs.65,162 million), mainly due to increase in volumes at China by 137.8%. The raw material cost increased as a percentage to revenue due to exchange loss by GBP 51 million (Rs.3,919 million), change of price of major material cost, namely Steel, Aluminum, copper etc. by GBP 29 million (Rs.2,228 million) and other market related (mix and options) increase by GBP 146 million (Rs.11,219 million).
At our India operations, raw material costs for Fiscal 2012 were Rs.397,023 million compared to Rs.340,668 million in Fiscal 2011, reflecting an increase of Rs.56,355 million from Fiscal 2012. The raw material cost as a percentage of revenues increased to 72.7% in Fiscal 2012, as compared to 72.4% in Fiscal 2011 (before inter-segment eliminations).
Employee Cost:Our employee cost was Rs.122,130 million in Fiscal 2012, an increase of 32.4% or Rs.29,880 million as compared to Rs.92,250 million in Fiscal 2011.
Our employee cost as a percentage of total revenues reduced marginally to 7.3% in Fiscal 2012 from 7.5% in Fiscal 2011, due to revenue growth.
Our permanent headcount increased by 12.2% as at March 31, 2013 to 58,618 employees, as compared to 52,244 employees as at March 31, 2011.
The employee cost at Jaguar Land Rover was Rs. 77,813 million in Fiscal 2012, as compared to Rs.55,923 million in Fiscal 2011, an increase of 39.1% or Rs.21,890 million. Jaguar Land Rover increased its permanent and agency headcount to support volume increases. The permanent headcount increased by 7.0% as at March 31, 2012 to 16,313 employees, as compared to 15,240 employees as at March 31, 2011. Further, Jaguar Land Rover employed temporary headcount 5,041 employees on average during Fiscal 2012. The increase was also due to higher pension charge by Rs.4,388 million on account of change in assumptions. The increase was also partially attributable to the effect of currency translation from GBP to Indian rupees, which resulted in an increase of Rs.5,874 million.
For our India operations, increase was due to normal annual increases (Rs. 2,791 million for Tata Motors) and increase in headcount. The permanent headcount increased as at March 31, 2012 to 34,593 employees, as compared to 30,871 employees as at March 31, 2011. The average temporary headcount increased by 11.7% for Fiscal 2012 to 35,122 employees, as compared to 31,455 employees for Fiscal 2011, to support the volumes. As a consequence of above the employee cost was Rs.30,079 million in Fiscal 2012, as compared to Rs.25,069 million in Fiscal 2011, which reflects an increase of Rs.5,010 million.
Other Expenses: Other expenses increased by 33.2% to Rs.309,381 million in Fiscal 2012 from Rs.232,342 million in Fiscal 2011. The increase mainly relates to increase in volume, size of operations and inflation. As a percentage of total revenues these expenses represented 18.6% in Fiscal 2012, as compared to 18.9% in Fiscal 2011. The major components of expenses are as follows:
| Year ended March 31, | Increase/ (Decrease) | |||||||||||
| 2012 | 2011 | |||||||||||
| (Rs. in millions) | ||||||||||||
Freight and transportation expenses | 45,891 | 30,886 | 15,005 | |||||||||
Works operation and other expenses | 110,719 | 79,765 | 30,954 | |||||||||
Publicity | 53,931 | 40,453 | 13,478 | |||||||||
Allowance for trade and other receivables, and finance receivables | 6,745 | 5,972 | 773 | |||||||||
Warranty and product liability expenses | 35,815 | 29,334 | 6,481 | |||||||||
Expenditure capitalized:These represent employee costs, stores and other manufacturing supplies and other works expenses incurred towards product development projects and also includes costs attributable to internally constructed capital items. The increase reflects expenditure on new products and other major product development plans. Considering the nature of our industry, we have to continually invest in the development of new products and also introduce new models to address changing safety, emission and other regulatory norms.
Depreciation and Amortization: Our depreciation and amortization cost increased by 25.3% to Rs.54,435 million in Fiscal 2012, compared to Rs.43,446 million in Fiscal 2011. The increase in depreciation expenses from Rs.29,382 million in Fiscal 2011 to Rs.31,849 million in Fiscal 2012 was on account of plant and equipment addition (mainly towards capacity and new products). The increase from Rs.14,064 million in Fiscal 2011 to Rs.22,586 million in Fiscal 2012 in amortization of product development cost is consequent to commencement of commercial production of new products mainly Range Rover Evoque and new products in Indian market.
Other income (net):There was a net gain of Rs.9,407 million in Fiscal 2012, representing a swing of Rs.17,625 million, as compared to net loss of Rs.8,218 million in Fiscal 2011.
For further details refer note 31 to our consolidated financial statements included elsewhere in this annual report.
Interest expense (net): Our interest expense (net of interest capitalized) increased by 3.9% to Rs.38,290 million in Fiscal 2012, compared to Rs.36,854 million in Fiscal 2011. The increase represents increase in borrowing cost at Jaguar Land Rover consequent to issue of GBP 1,500 million Senior Notes by Rs.1,527 million and increase in financing activity by Rs.1,778 million.
Foreign exchange (gain)/loss (net): We had a net foreign exchange loss of Rs.11,154 million in Fiscal 2012, compared to gain of Rs.3,090 million in Fiscal 2011. Due to steep depreciation of Indian rupee against all major currencies, we incurred exchange loss on foreign currency payments and borrowings. A portion of the exchange loss in the Fiscal 2012 was on year end valuation of foreign currency borrowings of Rs.9,672 million as compared a net exchange gain to Rs.644 million in Fiscal 2011.
Impairment of equity accounted investees: In Fiscal 2012,2014, we recognized an impairment loss Rs.4,981of Rs.8,034 million in respect of its investment in an associate, triggered by economic slowdown and increased competition from new entrants.Tata Hitachi Construction Machinery Company Ltd. The associate is engaged in the business of manufacture and sale of construction equipment. Its operation was severely affected due to the current economic slowdown and increased competition from new entrants. The recoverable amount of the investment iswas determined based on value in use.
Income Taxes
Income Taxes:TheOur income tax expense was Rs.4,707increased by 22.9% to Rs.48,227 million in Fiscal 2012, compared to Rs.12,7872014 from Rs.39,239 million in Fiscal 2011.
2013, representing 26.9% as compared to 30.5% of net income before tax, respectively. The net decrease of Rs.8,080 million comprises mainly the following:
a) On account of increased profits the incremental tax liability is Rs.9,310 million.
b) There was an increase of Rs.2,366 million in tax on undistributed earnings of subsidiaries and associates (Jaguar Land Rover subsidiaries)
c) The above increases were offset by the following credits:reasons for major reconciliation items are given below:
| i. |
| iii. | We |
| iv. |
| v. | The relevant Indian tax regulations mandate the companies to pay tax on book profits, known as Minimum Alternate Tax or MAT. MAT may be carried forward and set off against future income tax liabilities computed under normal tax provisions within a period of ten years. We had recognized deferred tax assets representing MAT paid in prior years for Tata Motors Limited on standalone basis. In the course of assessment of recoverability of MAT paid, we wrote off previously recognized tax credit of Rs.7,318 million in Fiscal 2014 in light of future taxable profit, considering the continued economic slowdown in India. |
| vi. | The tax on share of profit/loss of equity accounting investees was |
For further details refer note 16to Note 17 to our consolidated financial statements included elsewhere in this annual report.report on Form 20-F.
Non-controlling Interests in Consolidated Subsidiaries and Share of profit of equity accountedequity-accounted investees and non-controlling interests in consolidated subsidiaries, net of tax:tax
In Fiscal 2012,2014, our share of profit of equity accountedequity-accounted investees reflected a loss of Rs.351Rs.1,878 million, as compared to loss of Rs.458Rs.132 million in Fiscal 2011. The increase in profit of some associates was offset2013. This change is primarily due to loss incurred bythe following factors:
The operations of an associate engaged in constructionthe business of industrial equipment, businessTata Hitachi Construction Machinery Co. Ltd, continued to be impacted by adverse economic conditions and competitive pressure. Our share of loss for Fiscal 2014 was Rs.1,354 million as compared to Rs.703 million in Fiscal 2013.
Fiscal 2013 includes a gain of Rs.1,101 million, representing our share of profit in one of the equity-accounted investees, Tata AutoComp Systems Ltd, which recorded gain on accountdivestment of deterioration in the market and competition in India. certain joint venture investments.
In Fiscal 2012,2014, our share of non-controlling interest reflected a gain of Rs.781Rs.462 million, as compared to gain of Rs.347Rs.886 million in Fiscal 2011,2013, primarily due to increasedthe reduced profitability of one of our subsidiaries.subsidiaries, TTL.
Net Income
Our consolidated net income forin Fiscal 20122014, excluding shareshares of non-controlling interests, was Rs.115,659increased by 47.4% to Rs.130,717 million compared to Rs.73,402from Rs.88,671 million in Fiscal 2011.2013. Net income as a percentage of total revenues also increased to 7.0%5.6% in Fiscal 20122014 from 6.1% to total revenues4.7% in Fiscal 2011.2013. This increase was mainly the result of the following factors:
Revenues from the domestic market (India) increased by 18.9% to Rs.552,513 million in Fiscal 2012 from Rs.464,676 million in Fiscal 2011, resulting in earnings before other income, interest and tax of Rs.40,844 million in Fiscal 2012 for Tata and other brand vehicles including financing thereof, as compared to Rs.48,916 million in Fiscal 2011;
Revenues from market outside India increased by 44.9% to Rs.1,112,340 million in Fiscal 2012 from Rs.767,458 million in Fiscal 2011, mainly attributable to our Jaguar Land Rover business. The earningsRover’s performance in terms of volume and profitability contributed significantly. Earnings before other income, interest and tax for Jaguar Land Rover business was Rs.118,895increased by 51.4% to Rs.228,026 million in Fiscal 20122014 from Rs.150,653 million in Fiscal 2013 which amounted to 12.0% of sales as compared to Rs.75,67311.0% for Fiscal 2013. The increase in net income also includes a favorable foreign currency translation of Rs.22,566 million from GBP to Indian rupees. The improvement in profitability was mainly attributable to increases in volumes across all markets and models in Fiscal 2014. The reported earnings before other income, interest and tax also have an element of foreign currency translation gain from GBP to Indian rupees of Rs.27,064 million.
This was primarily offset by:
Revenues from the operations of Tata and other brand vehicles (including financing thereof), which were significantly affected by volume contractions, decreased by 19.6% to Rs.364,591 million in Fiscal 2011;2014 from Rs.453,276 million in Fiscal 2013. This resulted in negative earnings before other income, interest and tax of Rs.20,631 million in Fiscal 2014 for Tata and other brand vehicles (including financing thereof), as compared to positive earnings of Rs.13,554 million in Fiscal 2013. The losses were mainly attributable to a significant reduction in sales volumes. There was an increase in depreciation expenses as a result of additions to plants and facilities in recent years, and in amortization expenses for product development costs due to new products launched.
increaseA decrease in other income, mainly due to gaina loss on the fair value of a prepayment option and loss on a conversion option; andoption on senior notes of Jaguar Land Rover.
lower income tax expense.Impairment loss of Rs.8,034 million in respect of investment in an associate, Tata Hitachi Construction Machinery Co. Ltd.
Recent Accounting Pronouncements
Please refer to Note 2 (v)2(v) to our consolidated financial statements included elsewhere in this annual report on Form 20-F for adopted and yet to be adopted accounting pronouncements as ofat March 31, 2013.2015.
Critical Accounting Policies
The preparation of financial statements in conformity with IFRS requires management to make judgments, estimates and assumptions that affect the application of accounting policies and the reported amounts of assets, liabilities, income, expenses and disclosures of contingent assets and liabilities atas of the date of these financial statementsthis annual report on Form 20-F and the reported amounts of revenues and expenses for the years presented. The actual results may differ from these estimates.
Estimates and underlying assumptions are reviewed on an ongoing basis and at each balance sheet date. Revisions to accounting estimates are recognized in the period in which the estimate is revised and future periods affected.
In particular, information about significant areas of estimation uncertainty and critical judgments in applying accounting policies that have the most significant effect on the amounts recognized in the financial statements are included in the following notes:
Impairment of GoodwillPassenger Cars
Cash generating units to which goodwill is allocated are tested for impairment annually at each balance sheet date, or more frequently when there is an indication that the unit may be impaired. If the recoverable amount of the cash generating unit is less than the carrying amount of the unit, the impairment loss is allocated first to reduce the carrying amount of any goodwill allocated to that unit and then to the other assets of the unit pro rata on the basis of carrying amount of each assetDuring Fiscal 2015, in the unit. Goodwill impairment loss recognized is not reversedpassenger car category, our sales increased by 1.2% to 119,203 units from 117,767 units in subsequent period. Please referFiscal 2014 primarily due to Note 13 to our consolidated financial statements included elsewhere in this annual report for assumptions used for goodwill impairment.
Impairmentnew model launches. Our overall market share of property, plant and equipment and intangible assets
At each balance sheet date, the Company assesses whether there is any indication that any property, plant and equipment and intangible assets with finite lives may be impaired. If any such impairment exists the recoverable amount of an asset is estimated to determine the extent of impairment, if any. Where it is not possible to estimate the recoverable amount of an individual asset, the Company estimates the recoverable amount of the cash-generating unit to which the asset belongs.
Intangible assets with indefinite useful lives and intangible assets not yet available for use are tested for impairment annually at each balance sheet date, or earlier, if there is an indication that the asset may be impaired.
Recoverable amount is the higher of fair value less costs to sell and value in use. In assessing value in use, the estimated future cash flows are discounted to their present value using a pre-tax discount rate that reflects current market assessments of the time value of money and the risks specific to the asset for which the estimates of future cash flows have not been adjusted.
If the recoverable amount of an asset (or cash-generating unit) is estimated to be less than its carrying amount, the carrying amount of the asset (or cash-generating unit) is reduced to its recoverable amount. An impairment loss is recognized immediately in the income statement.
Impairment of equity accounted investees
In Fiscal 2012, the Company had recognized an impairment loss of Rs.4,981 million in respect of its investment in an associate on account of economic slowdown and increased competition from new entrants. The associate is engaged in the business of manufacture and sale of construction equipment. The recoverable amount of the investment is determined based on value in use.
Product Warranty
Vehicle warranties are provided for a specified period of time. Our vehicle warranty obligations vary depending upon the type of the product, geographical location of its sale and other factors.
The estimated liability for vehicle warranties is recorded when products are sold. These estimates are established using historical information on the nature, frequency, and average cost of warranty claims and our estimates regarding possible future incidence based on actions on product failures.
Changes in warranty liability as a result of changes in estimated future warranty costs and any additional costs in excess of estimated costs, can materially affect our net income. Determination of warranty liability is based on the estimated frequency and amount of future claims, which are inherently uncertain. Our policy is to continuously monitor warranty liabilities to determine the adequacy of our estimate of such liabilities. Actual claims incurred in the future may differ from our original estimates, which may materially affect warranty expense.
Employee Benefits
Employee benefit costs and obligations are dependent on assumptions used in calculating such amounts. These assumptions include salary increase, discount rates, health care cost trend rates, benefits earned, interest cost, expected return on plan assets, mortality rates and other factors.
While we believe that the assumptions used are appropriate, differences in actual experience or changes in assumptions may affect our employee benefit costs and obligations.
Recoverability/recognition of deferred tax assets
Deferred tax assets and liabilities are recognized for the future tax consequences of temporary differences between the carrying values of assets and liabilities and their respective tax bases, and unutilized business loss and depreciation carry-forwards and tax credits. Such deferred tax assets and liabilities are computed separately for each taxable entity and for each taxable jurisdiction. Deferred tax assets are recognized to the extent that it is probable that future taxable income will be available against which the deductible temporary differences, unused tax losses, depreciation carry-forwards and unused tax credits could be utilized.
Conversion options valuation
Fair value of conversion option in foreign currency convertible notes/convertible alternative reference securities is determined using various option valuation models such as Black Scholes Merton model, Cox Ross Rubinstein model and Monte Carlo simulation. Management uses its best judgment in estimating the fair value of its financial instruments. However, there are inherent limitations in any valuation technique. Changes in fair valuation of conversion option could have material impact on the results of the Company. However, there are no direct cash flow consequences.
Financial instruments and fair valuation of prepayment options in Senior Notes
Fair valuation of prepayment options and other financial instruments requires judgment around the valuations.
Property, plant and equipment
Capital work in progress, as at March 31, 2013 includes building of Rs.3,098.8 million on leased land located in the State of West Bengalpassenger cars in India for the purposes of manufacturing automobiles. As a result of the decision to relocate and construct a similar manufacturing facilitywas lower at another location, the management was in the process of evaluating several options, under all of which no adjustments to the carrying amount of the buildings was considered necessary. In June 2011, the newly elected Government of West Bengal (referred to as “State Government”) enacted legislation to cancel the land lease agreement.
The Company challenged the legal validity of the legislation. In June 2012, the High Court of Calcutta (referred to as the “High Court”) ruled against the validity of the legislation and restored the Company’s rights under the land lease agreement. The State Government has filed an appeal in the Supreme Court of India. As of the date of the authorization of the financial statements, the Supreme Court has not concluded on the State Government appeal.
The Company reasonably expects that the High Courts’ judgment, based on established law, will be upheld by the Supreme Court. For further details regarding the current legal proceedings with respect to the leased land please refer to Item 4.B “— Business Overview — Legal Proceedings” of this annual report.
B. Liquidity and Capital Resources.
We finance our capital requirements through cash generated from operations, debt and equity funding. We also raise funds through sale of investments including divestment in stakes of subsidiaries on a selective basis.
Our business segments are (i) automotive operations and (ii) all other operations. We provide financing for vehicles sold by dealers in India. Our automotive operations segment is further divided into Tata and other brand vehicles (including spares and financing thereof) and Jaguar Land Rover. Given the nature of our industry and competition, we are required to make significant investments in product development on an ongoing basis.
Principal Sources of Funding Liquidity
Our funding requirements are met through a mixture of equity, convertible or non-convertible debt securities and other long-term/short-term borrowings. We access funds from debt markets through commercial paper programs, convertible and non–convertible debentures, and other debt instruments. We also continually monitor funding options available in the debt and capital markets with a view to maintaining financial flexibility.
See Note 35 to our audited consolidated financial statements included elsewhere in this annual report for additional disclosures on financial instruments related to liquidity, foreign exchange and interest rate exposures and use of derivatives for risk management purposes.
The following table sets forth our short-term and long-term debt position:
| Fiscal 2013 | Fiscal 2012 | |||||||
| (Rs. in millions) | ||||||||
Total short-term debt (excluding current portion of long-term debt) | 116,218 | 111,180 | ||||||
Total current portion of long-term debt | 115,139 | 109,795 | ||||||
Long-term debt net of current portion | 325,457 | 287,148 | ||||||
|
|
|
| |||||
Total Debt | 556,814 | 508,123 | ||||||
During Fiscal 2013 and 2012, the effective weighted average interest rate on our long-term debt was 8.9% and 9.7% per annum, respectively.
The following table sets forth a summary of the maturity profile for our outstanding long-term debt obligations as of March 31, 2013.
| ||||
| ||||
| ||||
| ||||
| ||||
| ||||
We believe that we have sufficient liquidity available to meet our planned capital requirements. However, our sources of funding could be adversely affected by an economic slowdown, as was witnessed5.9% in Fiscal 2009, or other macroeconomic factors in India and abroad, such as in the United Kingdom, the United States, Europe and China, which are beyond our control. A decrease in the demand for our vehicles could lead to an inability to obtain funds from external sources on acceptable terms or in a timely manner.
We plan to continue investing in product development and manage our operations to pursue further growth opportunities and address competitive positioning. Additionally, in the Jaguar Land Rover business, we will be investing in augmenting capacity at the UK plants, developing a new engine facility and establishing the China JV. Further, we are exploring opportunities to expand the manufacturing base in the Jaguar Land Rover business. We expect to meet the part of such investments out of operating cash flows and cash and liquidity available to us. In order to meet the balance requirements, we may be required to raise funds towards the long term plans via additional bank loan markets and capital markets access from time to time, as deemed necessary.
At Tata Motors India operations, we have plan to raise long term funds through debt and equity, to refinance current debt and invest in Product development and plant and equipment.
In order to refinance our acquisition related borrowings and for supporting long term funding needs, we continued to raise funds in Fiscal 2012 and Fiscal 2013. We had in the past issued convertible notes, which were convertible into equity or repayable on maturity. Details of major funding during Fiscal 2009 through Fiscal 2013 are provided below.
Long term funding
On July 12, 2007, we raised funds aggregating US$ 490 million (Rs.19,927.1 million at issue) by issue of Zero Coupon Convertible Alternative Reference Securities, or CARS due on July 12, 2012. The note holders had an option to convert the CARS into qualifying securities as per the terms of issue after appropriate adjustment to the conversion price. During Fiscal 2009, we repurchased and cancelled 170 Notes (principal value of US$ 17 million). There was no conversion of CARS during Fiscal 2011 and Fiscal 2012. In Fiscal 2013, 1 CARS was converted into 22,370 Ordinary Shares and we repaid the entire outstanding amount of CARS in accordance with their terms on July 12, 2012, totaling to US$ 773.9 million (Rs. 35,374 million), including redemption premium.
In May 2009, we issued secured non-convertible credit enhanced Indian rupee debentures in four tranches, having tenors up to seven years, aggregating Rs.42,000 million on a private placement basis. Proceeds were used to prepay part of the short-term bridge loan taken for the acquisition of the Jaguar Land Rover business. As on March 31, 2013 an amount of Rs.30,500 million is outstanding.
On October 15, 2009, we issued 29,904,306 new equity shares in the form of Global Depositary Shares, or GDSs, at a price of US$12.54 per GDS, aggregating US$375 million (Rs.17,941.9 million), and 4% convertible notes due 2014, or FCCN, aggregating US$375 million (Rs.17,941.9 million at time of issue). The holders of the FCCN had an option, subject to the terms and conditions of the issue, to convert these notes into Ordinary Shares, GDSs or ADSs. We utilized the proceeds from the GDS and FCCN to repay the outstanding bridge loan taken for the acquisition of the Jaguar Land Rover business. During Fiscal 2011, 2,576 FCCN were converted into 19,423,734 Ordinary Shares/ADSs. There was no conversion of FCCN during Fiscal 2012. During Fiscal 2013, 433 FCCN were converted into 16,519,201 Ordinary Shares/ADSs. As of March 31, 2013, 741 FCCN remained outstanding, representing the equivalent of 28,549,588 Shares or GDSs or 28,549,588 ADSs as converted. Subsequent to March 31, 2013, the balance of 741 FCCN have been converted into 28,549,566 Ordinary Shares.
In March 2010, we raised funds through further divestments of investments.
In October 2010, we raised funds totaling Rs.33,510 million through an issue of 32,165,000 ‘A’ Ordinary Shares at a price of Rs.764/- per share (face value of Rs.10 each) and 8,320,300 Ordinary Shares at a price of Rs.1,074/- per share (face value of Rs.10 each) to qualified institutional buyers, under a qualified institutional placement or QIP. This financing strategy enabled us to reduce risks by further de-leveraging.
In May 2011, Jaguar Land Rover issued GBP 1,000 million equivalent senior notes, or Notes. The Notes included GBP 500 million Senior Notes due 2018 at a coupon of 8.125% per annum, US$ 410 million Senior Notes due 2018 at a coupon of 7.75% per annum and US$ 410 million Senior Notes due 2021 at a coupon of 8.125% per annum. The proceeds are, or will be used to refinance existing debt and for general corporate purposes. The Notes are callable at a premium for the present value of future interest rates, if called before a specified date for each series of notes and thereafter are callable at fixed premiums.
In September 2011, we raised syndicated foreign currency term loans of US$ 500 million in two tranches with tenors between four to seven years. The proceeds were used to finance general capital expenditure and investments in its overseas subsidiaries in accordance with guidelines on External Commercial Borrowings, or ECB, issued by the RBI.
In March 2012, Jaguar Land Rover issued GBP 500 million Senior Notes due 2020 at a coupon of 8.25% per annum. The proceeds are/or will be used for general corporate purposes. The notes are callable at a premium for the present value of future interest rates, if called before a specified date and thereafter are callable at fixed premiums.
During Fiscal 2013, we issued rated, listed, unsecured non-convertible debentures of Rs.21,000 million with maturities between 2 to 7 years. During April and May 2013, we further issued rated, listed, unsecured non-convertible debentures of Rs 9,000 million with maturity of 3 years. These are steps towards raising long term financing and optimizing our loan maturity profile.
In January 2013, Jaguar Land Rover issued US$ 500 million Senior Notes due 2023 at a coupon of 5.625% per annum. The proceeds have been and will be used for general corporate purposes, including, to support ongoing growth and capital spending plans. The notes are callable at a premium for the present value of future interest rates, if called before a specified date and thereafter are callable at fixed premiums.
In December 2011, Jaguar Land Rover established a 3-5 year committed revolving credit facility for up to GBP 710 million aggregate principal amount from a syndicate of 13 commercial banks. During Fiscal 2013, Jaguar Land Rover received approval to increase the facility to GBP 795 million aggregate principal amount as of March 31, 2013. In July 2013, Jaguar Land Rover increased the size of revolving credit facility from GBP 795 millions to GBP 1.25 billion with 75% of the new facility size (GBP 937.5 million) for 5 years due 2018 and 25% of the new facility size (GBP 312.5 million) for 3 years due 2016.
In May 2013, TML Holdings Pte Ltd. has issued S$ 350 million (approximately Rs. 15,313.3 million), 4.25% Senior Notes due 2018.
We plan to refinance and raise of long term funding through borrowings or equity issuances, on the basis of review of business plans, operating results and covenant requirements of our existing borrowings.
Short term funding
We fund our short-term working capital requirements with cash generated from operations, overdraft facilities with banks, short and medium term borrowings from lending institutions, banks and commercial paper. The maturities of these short and medium term borrowings and debentures are generally matched to particular cash flow requirements.We had short-term borrowings of Rs.116,218 million and Rs. 111,180 million as of March 31, 2013 and 2012, respectively. We had unused short-term credit facilities of Rs.204,498 million and Rs.184,702 million as of March 31, 2013 and 2012, respectively.
During April 2012, we received approvals from our Board to increase our working capital limits to Rs.140,000 million from the existing Rs.120,000 million for our India operations. The working capital limits are secured by hypothecation of existing current assets of the Company including stock of raw material, stock in process, semi-finished goods, stores and spares not relating to plant and machinery (consumable stores and spares), bills receivables and book debts including vehicle finance receivable and all other moveable current assets except cash and bank balances, loans and advances of the Company both present and future. The working capital limits are renewed annually.
Our cash and cash equivalents and short term deposits with the banks, were Rs.185,076 million as at March 31, 2013,2015 as compared to Rs.157,648 million as at March 31, 2012. Of6.1% during Fiscal 2014 primarily due to industry-wide competition and declining demand for diesel vehicles.
Utility Vehicles
Our sales in the cashutility vehicles category decreased by 22.4% in Fiscal 2015 to 24,517 units from 31,583 units in Fiscal 2014. Our share in the overall utility vehicles category has declined mainly due to a lack of presence in the growing compact SUV and cash equivalents and short deposits as at March 31, 2013, Jaguar Land Rover has Rs 166,263 million and Rs 126,804 as at March 31, 2012. Our investmentsoftroader categories resulting in Mutual Funds (available for saleour overall market share of utility vehicles in liquid funds) were Rs.75,327 million as at March 31, 2013,India decreasing to 4.4% in Fiscal 2015 from 5.5% during Fiscal 2014.
Commercial Vehicles in India
Sales of commercial vehicles in India decreased by 8.4% in Fiscal 2015 compared to a decrease of 22.4% in Fiscal 2014. However, in the fourth quarter of Fiscal 2015, sales of our commercial vehicles started to recover due to growth in the M&HCV category. In Fiscal 2015, we recorded commercial vehicle sales of 317,793 units as compared to Rs.75,356 million as at March 31, 2012.These include investments held by Jaguar Land Rover Rs.67,485 million as March 31, 2013 and Rs.71,334 million as at March 31, 2012. These resources enable us to cater to business needs378,028 units in Fiscal 2014 a decrease of 15.9%.
M&HCVs
Industry-wide sales in the event of changes in credit market conditions.
Our cash in India is located at various subsidiaries within the Tata Motors Group. Jaguar Land Rover’s subsidiary in China is subject to foreign exchange controls including transferring cash to other companies of the group outside of China. Brazil, Russia, South Africa and other locations also have regulatory restrictions disincentives or costs on pooling or transferring of cash, which affects our use of those funds.
There may also be legal or economic restrictions on the ability of subsidiaries to transfer funds to us in the form of cash dividends, loans, or advances. However such restrictions have not had and are not estimated to have significant impact on our ability to meet our cash obligations.
Loan Covenants
Some of our financing agreements and debt arrangements set limits on and/or require prior lender consent for, among other things, undertaking new projects, issuing new securities, change in management, mergers, sale of undertakings and investment in subsidiaries. In addition, certain negative covenants may limit our ability to borrow additional funds or to incur additional liens, and/or provide forM&HCV category increased costs in case of breach. Certain of our financing arrangements also include financial covenants to maintain certain debt-to-equity ratios, debt-to-earnings ratios, liquidity ratios, capital expenditure ratios and debt coverage ratios.
We monitor compliance with our financial covenants on an ongoing basis. We also review our refinancing strategy and continue to plan for deployment of long term funds to address any potential non-compliance.
In May 2009, we issued, on a private placement basis, an aggregate amount of Rs.42,000 million in secured non- convertible credit enhanced Indian rupee debentures in four tranches, having tenors up to seven years. Proceeds were used to prepay part of the short-term bridge loan taken for the acquisition of the Jaguar Land Rover business. As of March 31 2013, principal amount of Rs 30,500 million was outstanding of which Rs 18,000 million is due for repaymentby 15.9% in Fiscal 2014.
This credit enhancement2015 as compared to a decrease of the debentures is in the form of bank guarantees and requires us to be in compliance with certain covenants with respect to Tata Motors standalone financials under Indian GAAP and further provide for an increase in costs upon certain specified breaches of the covenants. In Fiscal 2013, we did not comply with two covenants, relating to our ratio of total outstanding liability to tangible networth and our debt service coverage ratio. As a result, the cost of credit enhancement provided by the bank increased by 100 basis points per annum. Pursuant to the terms of the deed of Trust, we requested the Security Trustee to waive the requirements of additional costs amounting to Rs.450.6 million which are due25.2% in Fiscal 2014. We received the approval from the Security Trustee for the waiver of such additional costs. Considering the continuing weakPending fleet replacements, a recent trend in gradual improvement in operating environment for fleet operators due to relatively higher freight rates, a correction in India, we expect that we will be unable to comply with the same covenantsdiesel prices, some improvement in Fiscal 2014 and anticipate seeking the Security Trustee’s waiver of additional costs for Fiscal 2015 totaling Rs.219.0 million. Such non-compliance with loan covenants has not triggered any cross-default provisions under any of our financing documents. Except for the two covenants discussed in this section, we expect to comply with our financial covenants during the 12-month period following the date of this annual report.
We believe that the above non-compliance will not affect our ability to raise funds in future.
Cash Flow Data
The following table sets forth selected items from our consolidated statements of cash flows for the periods indicated.
| Rs. in millions | ||||||||||||
| 2013 | 2012 | 2011 | ||||||||||
Net Cash provided by Operating Activities: | 222,933 | 218,227 | 141,976 | |||||||||
Net income after tax | 89,583 | 116,440 | 73,749 | |||||||||
Adjustments to net income/ (loss) after tax | 162,265 | 116,906 | 109,630 | |||||||||
Changes in Operating Assets and Liabilities | (6,407 | ) | 2,860 | (27,510 | ) | |||||||
Income tax paid | (22,508 | ) | (17,979 | ) | (13,893 | ) | ||||||
Net Cash used in Investing Activities | (236,116 | ) | (203,344 | ) | (74,988 | ) | ||||||
Purchase of Property, Plant and Equipment and Intangible Assets (Net) | (185,045 | ) | (137,818 | ) | (81,714 | ) | ||||||
Net Investment, short term deposit, margin money and loans given | (59,849 | ) | (70,952 | ) | 2,339 | |||||||
Acquisitions | — | — | (119 | ) | ||||||||
Dividend and Interest received | 8,778 | 5,426 | 4,506 | |||||||||
Net Cash provided by / (used in) Financing Activities | (19,338 | ) | 28,983 | (42,999 | ) | |||||||
Equity issuance / Proceeds from issue of shares by a subsidiary to non-controlling shareholders (net of issue expenses) | 9 | 1,384 | 32,537 | |||||||||
Dividends paid (including to non-controlling shareholders of subsidiaries) | (15,057 | ) | (14,894 | ) | (10,230 | ) | ||||||
Purchase of additional equity interest in a subsidiary | — | (3,043 | ) | — | ||||||||
Interest paid | (58,529 | ) | (35,922 | ) | (33,967 | ) | ||||||
Short term (net) borrowings (net of debt issuance cost) | 14,596 | (16,780 | ) | (25,925 | ) | |||||||
Long term (net) borrowings (net of debt issuance cost) | 39,644 | 98,238 | (5,414 | ) | ||||||||
Net change in cash and cash equivalents | (32,521 | ) | 43,866 | 23,989 | ||||||||
Cash and cash equivalents, end of the year | 116,118 | 145,952 | 90,671 | |||||||||
Fiscal 2013 Compared to Fiscal 2012
Cash and cash equivalents on March 31, 2013 decreased by Rs.29,834 million from March 31, 2012, to Rs.116,119 million. The decrease in cash and cash equivalents resulted from the changes to our cash flows in Fiscal 2013 when compared to Fiscal 2012 as described below.
Net cash provided by operating activities totaled Rs.222,933 million in Fiscal 2013. Cash inflows from operating activities increased by Rs.4,706 million in Fiscal 2013 from Rs.218,227 million in Fiscal 2012. The increase in net cash from operations were consequent to higher sales volumes in the Jaguar Land Rover business, which were partially offset by reduced sales volumes for Tata and other brand vehicles. Earnings before other income, interest and tax of Jaguar Land Rover business increased from Rs.118,895 million in Fiscal 2012 to Rs.150,687 million in Fiscal 2013, whereas earnings before other income, interest and tax of Tata and other brand vehicles (including financing thereof) decreased to Rs.10,701 million in Fiscal 2013 as compared to Rs.40,884 million in Fiscal 2012. As a resultcargo availability, market expectations of an increase in volumes at Jaguar Land Rover, the trade receivables and inventories increased by Rs.51,339 million in Fiscal 2013 as compared to Rs.34,032 million in Fiscal 2012. After considering the increase in accounts payable and provisions, there was a net inflow of cash on account of changes in operating assets and liabilities of Rs.26,080 million in Fiscal 2013 as compared to Rs.42,915 million in Fiscal 2012 for Jaguar Land Rover. For Tata and other brand vehicles, the net change represented an outflow of Rs.32,870 million in Fiscal 2013 as compared to Rs.40,055 million in Fiscal 2012. Such outflow includes net increase in vehicle financing receivables of Rs.36,406 million in Fiscal 2013 as compared to Rs.30,660 million in Fiscal 2012, as a result of an increase in financing volumes.
Net cash used in investing activities totaled Rs.236,116 million in Fiscal 2013. Cash outflows from investing activities increased by Rs.32,772 million in Fiscal 2013 from Rs.203,344 in Fiscal 2012, mainly due to investment in property, plant and equipment and product development projects at our Jaguar Land Rover business. In Fiscal 2013, payments for capital expenditure at our Jaguar Land Rover business increased by Rs.49,844 million to Rs.157,458 million from Rs.107,614 million in Fiscal 2012. The increases in these investments are intended to support continued growth in sales volumes at our Jaguar Land Rover business during Fiscal 2013. The following table sets forth a summary of our cash flow on property plant and equipment and intangible assets for the periods indicated.
| Rs. in millions | ||||||||
| 2013 | 2012 | |||||||
Purchase of / payment for Property, Plant and Equipment and Intangible Assets (Net) | ||||||||
Tata and other brand vehicles | 27,587 | 30,204 | ||||||
Jaguar Land Rover | 157,458 | 107,614 | ||||||
Our net investment in short-term deposit margin moneys and loans resulted in an outflow of Rs.59,849 million in Fiscal 2013 as compared to Rs.70,952 million in Fiscal 2012. This outflow mainly related to surplus cash investments in bank deposits by Jaguar Land Roverinfrastructure as well as manufacturing space and a renewal of Rs.66,637 million.
Net cash used in financingmining and construction activities totaled Rs.19,338 million in Fiscal 2013, as compared to cash inflow of Rs.28,983 million in Fiscal 2012, mainly due to increased interest paid in Fiscal 2013, resulting from increased borrowing levels. For Tata and other brand vehicles, the short term debt increased by Rs.12,366 million and long term debt increased by Rs.15,066 million in Fiscal 2013, as compared to net reduction of Rs.7,335 million in short term debt and increase of Rs.16,981 million in long term debt in Fiscal 2012. For Jaguar Land Rover, the short term debt increased by Rs.2,383 million and long term debt increased by Rs.25,375 million in Fiscal 2013, as compared to net reduction of Rs.9,266 million in short term debt and increase of Rs.81,324 million in long term debt in Fiscal 2012.
We paid dividend (including to non-controlling shareholders of subsidiaries) of Rs.15,057 million in Fiscal 2013 as compared to Rs.14,894 million in Fiscal 2012.
Fiscal 2012 Compared with Fiscal 2011
Cash and cash equivalents on March 31, 2012 increased by Rs.55,281 million from March 31, 2011, to Rs.145,952 million. The increase in cash and cash equivalents resulted from the changes to our cash flows in Fiscal 2012 when compared to Fiscal 2011 as described below.
Net cash provided by operating activities totaled Rs.218,227 million in Fiscal 2012. Cash inflows from operating activities increased by Rs.76,251 million in Fiscal 2012 from Rs.141,976 million in Fiscal 2011, mainly due to higher sales volumes in the Jaguar Land Rover business and Tata and other brand vehicles. Earnings before other income, interest and tax of Jaguar Land Rover business increased from Rs.75,673 million in Fiscal 2011 to Rs.118,895 million in Fiscal 2012, whereas earnings before other income, interest and tax of Tata and other brand vehicles (including financing thereof) decreased to Rs.40,844 million in Fiscal 2012 as compared to Rs.48,916 million in Fiscal 2011. At Jaguar Land Rover, the trade receivables and inventories increased by Rs.34,032 million in Fiscal 2012 as compared to Rs.5,654 million in Fiscal 2011. However, there was an increase in accounts payable and provisions, resulting in net inflow of cash on account of changes in operating assets and liabilities of Rs.42,915 million in Fiscal 2012 as compared to Rs.11,649 million in Fiscal 2011 for Jaguar Land Rover. For Tata and other brand vehicles the net change represented an outflow of Rs.40,055 million in Fiscal 2012 as compared to Rs.39,159 million in Fiscal 2011. After considering increased utilization of vehicle financing of Rs.30,660 million, net outflow towards other operating assets and liabilities was Rs.9,395 million in Fiscal 2012.
Net cash used in investing activities totaled Rs.203,344 million in Fiscal 2012. Cash outflows from investing activities increased by Rs.128,356 million in Fiscal 2012 from Rs.74,988 in Fiscal 2011, mainly due to investment in property, plant and equipment and product development projects at our Jaguar Land Rover business. In Fiscal 2012, payments for capital expenditure at our Jaguar Land Rover business increased by Rs.52,579 to Rs.107,614 million from Rs.55,035 million in Fiscal 2011.
| Rs. in millions | ||||||||
| 2012 | 2011 | |||||||
Purchase of / payment for Property, Plant and Equipment and Intangible Assets (Net) | ||||||||
Tata and other brand vehicles | 30,204 | 26,679 | ||||||
Jaguar Land Rover | 107,614 | 55,035 | ||||||
Our net investment in short-term deposit, margin money and loans resulted in an outflow of Rs.70,952 million in Fiscal 2012 as compared to inflow of Rs.2,339 million in Fiscal 2011. This outflow represents mainly surplus cash investments in mutual funds by Jaguar Land Rover of Rs.58,784 million and restricted deposits of Rs.11,272 million.
Net cash from financing activities totaled Rs.28,983 million of cash inflows in Fiscal 2012, resulted from the additional debt incurred. For Tata and other brand vehicles, short term debt decreased by Rs.7,514 million and long term debt increased by Rs.17,227 million in Fiscal 2012, as compared to net increase of Rs.6,611 million in short term debt and reduction of Rs.6,460 million in long term debt in Fiscal 2011. For Jaguar Land Rover, short term debt decreased by Rs.9,266 million and long term debt increased by Rs.81,324 million in Fiscal 2012, as compared to net reduction of Rs.32,537 million in short term debt and increase of Rs.1,337 million in long term debt in Fiscal 2011.
During Fiscal 2011, we raised Rs.32,479 million by way of issue of shares through QIP issue, considering the market conditions and need of own funding to address the leverage.
We paid dividend (including to non-controlling shareholders of subsidiaries) of Rs.14,894 million in Fiscal 2012 as compared to Rs.10,230 million in Fiscal 2011.
Our financial strategy is maintaining a strong financial position that will allow us to fund its product development projects, capital expenditures and financing business (in India) efficiently, even if earnings are subject to short-term fluctuations. We believe that we maintain sufficient liquidity for our present requirements and will continue to be able to access funds from external sources in large amounts and at relatively low costs.
Balance Sheet Data
Please refer the consolidated balance sheet in the enclosed financial statements. We have discussed below major items and variations.
Our total assets were Rs.1,668,695 million and Rs.1,434,536 million as of March 31, 2013 and 2012, respectively. The increase in assets as of March 31, 2013 was partly attributable to foreign currency translation into Indian rupees.
Our total current assets have increased by Rs.70,031 million to Rs.723,261 million as of March 31, 2013, as compared to Rs.653,230 million as of March 31, 2012.
Cash and cash equivalents were Rs.116,119 million as of March 31, 2013, compared to Rs.145,952 million as of March 31, 2012. We hold cash and cash equivalent principally in Indian rupees, GBP, and Chinese Renminbi. It includes Rs.43,053 million as of March 31, 2013 (as compared to Rs.36,974 million as of March 31, 2012) held by Jaguar Land Rovers China subsidiary which is subject to exchange control restrictions that prevent the balances from being available for general use by Tata Motors Limited and other subsidiaries. These are allowed to be utilized for manufacturing and sales activity in China and for making dividend payments. Out of cash and cash equivalents as at March 31, 2013, Jaguar Land Rover holds Rs.102,649 million, which is surplus cash deposits for future use. As of March 31, 2013, we had short term deposits of Rs.68,957 million as compared to Rs.11,695 million as at March 31, 2012. The increase in cash and cash equivalents and deposits was primarily attributable to performance of our Jaguar Land Rover operations.
As of March 31, 2013, we had finance receivables including non-current portion (net of allowances for credit losses) of Rs.198,219 million as compared to Rs.171,241 million as of March 31, 2012, an increase of Rs.26,978 million representing increase in our vehicle financing activity. The vehicle financing integral to our automotive operations in India. For further detail see “— B. Liquidity and Cap. Resources Liabilities and Sources of Financing — Principal Sources of Funding Liquidity — Tata and other brand vehicles — vehicle financing”.
Trade receivables (net of allowance for doubtful receivables) were Rs.104,194 million as of March 31, 2013, representing an increase of Rs.16,539 million over March 31, 2012. As a result of reduction in volumes, the trade receivables for Tata and other brand vehicles have decreased from Rs.32,369 million as at March 31, 2012 to Rs.25,878 million as at March 31, 2013. The past dues for more than six months (gross) have increased from Rs.4,740 million as at March 31, 2012 to Rs.7,242 million as at March 31, 2013 and these mainly represent dues from government-owned transport undertaking and passenger vehicle dealers, for which we are pursuing recovery. The trade receivables of our Jaguar Land Rover business increased from Rs.53,819 million as at March 31, 2012 to Rs.76,116 million as at March 31, 2013, as a result of the growth in revenue by 16.8% (GBP terms).
As of March 31, 2013, inventories were at Rs.208,393 million compared to Rs.180,834 million as of March 31, 2012. The increase in finished goods inventory was Rs.28,012 million in Fiscal 2013 as compared to Fiscal 2012. In terms of number of days to sales, finished goods represented 31 inventory days in Fiscal 2013 sales as compared to 30 inventory days in Fiscal 2012. The increase in finished goods mainly relatescontributed to the increase in volumes, mainly atM&HCV sales in Fiscal 2015.
In Fiscal 2015, our Jaguar Land Rover operations.
Our investments (current and non-current investments) have decreased marginally to Rs.81,473 million as of March 31, 2013 from Rs.82,569 million as of March 31, 2012, representing a decrease of Rs.1,096 million. Our investments mainly comprise mutual fund investments of Rs.75,327 million as of March 31, 2013 as compared to Rs.75,356 million as at March 31, 2012. Of such investments Jaguar Land Rover were Rs.67,485 million as at March 31, 2013 as compared to Rs.71,334 million as at March 31, 2012.
Our other assets (current and non- current) decreased marginally to Rs.64,775 million as at March 31, 2013 from Rs.67,685 million as of March 31, 2012. The decrease mainly is due to decreasesales in VAT, other taxes recoverable, statutory deposits and dues from government of Rs.53,643 million as of March 31, 2013 as compared with Rs.58,581 million as of March 31, 2012 and increase in prepaid expenses of Rs.5,686 million as at March 31, 2013 as compared with Rs.3,529 million as at March 31, 2012.
Our other financial assets (current and non-current) have increased to Rs.39,686 million as of March 31, 2013 from Rs.38,391 million as of March 31, 2012. Derivative financial instrumentsthe M&HCV category increased by Rs.2,916 million14.9% to 126,368 units in Fiscal 2015 from Rs.5,847 million as at March 31, 2012 to Rs.8,763 million as at March 31, 2013. Margin money held as security for securitization of finance receivables has decreased from Rs.2,589 million as at March 31, 2012 to Rs.2,096 million as at March 31, 2013,109,987 units in Fiscal 2014 primarily due to an industry-wide increase in securitization and collectionM&HCV sales.
Our overall market share of receivables.M&HCVs sales in India decreased to 54.4% in Fiscal 2015 from 54.9% in Fiscal 2014 primarily due to increased competition.
LCVs
The income tax assets (both current and non-current) were Rs.9,062 million as of March 31, 2013 as compared to Rs.9,437 million as of March 31, 2012.
The property, plant and equipment (net of depreciation) of Rs.346,663 million as at March 31, 2013, increased by Rs.63,947 million during Fiscal 2013. The increase mainly relates to Jaguar Land Rover towards investment in engine plant to support the growing demand for vehicles.
The intangible assets were Rs.351,236 million as at March 31, 2013, which mainly include product development projects and brands and other intangible assets, an increase by Rs.68,889 million during Fiscal 2013. As at March 31, 2013, there were product development project in process amounting to Rs.141,822 million. We are engaged in automotive business and our products include commercial vehiclessales in the entire range (LCV to M&HCV), passenger cars, and cars or SUV in the premium segment. Considering the nature of industry and competition, we continuously introduce new products and variants to meet the customers’ needs.
Our carrying value of investments in equity accounted investees is Rs.30,392 million as at March 31, 2013, as compared to Rs.23,266 million as at March 31, 2012. In Fiscal 2012, we had recorded impairment loss of Rs.4,981 million in respect of an associate engaged in manufacturing and sale of construction equipment. The impairment&HCV category was on account of economic slowdown and competitive pressures. In Fiscal 2013, Jaguar Land Rover has invested Rs.6,217 million in a joint venture to manufacture cars in China with Chery Automobiles Limited.
A deferred tax liability (net) of Rs.9,937 million was recorded in the income statement. Rs.10,685 million was recorded as asset (net) in other comprehensive income, which mainly include derivative financial instruments of Rs.4,144 million (credit) and Rs.5,932 million (credit) towards post-retirement benefits.
Accounts payable were Rs.409,096 million as of March 31, 2013, as compared to Rs.334,559 million as of March 31, 2012, reflecting increase in operations at Jaguar Land Rover.
Other financial liabilities (current and non-current) were Rs.60,288 million as of March 31, 2013 (Rs.34,771 million as of March 31, 2012), an increase of Rs.25,517 million, mainly include liability towards vehicles sold under repurchase arrangement, derivative instruments, deferred payment liabilities, interest accrued but not due on loans, lease liabilities etc. We have derivative financial instruments representing options and other hedging arrangements; mainly relate to Jaguar Land Rover. We have sold vehicles in certain markets under agreed repurchase arrangements for which we have liability of Rs.15,014 million as of March 31, 2013 (Rs.12,534 million as of March 31, 2012).
The provisions (current and non-current) as of March 2013 and 2012 were Rs.80,314 million and Rs.66,354million, respectively, representing an increase of Rs.13,960 million. The provision for warranty increased by Rs.12,385 million mainly on account of volume growth. Warranty has been estimated on the basis of historical information on the nature, frequency and average costs and estimate regarding future incurrence. We have made a provision of Rs.2,124 million in Fiscal 2013 pursuant to lawsuit filed by employee union in South Korea to include some elements of non-ordinary salary and bonus as part of ordinary wages.
Other liabilities (non-current) have increased to Rs.58,704 million as of March 31, 2013, as compared to Rs.27,962 million as of March 31, 2012. The increase related to an additional employee benefit obligations totaling Rs.55,191 million incurred during this period, mainly pertaining to the Jaguar Land Rover pension plan, consequent to changes in actuarial factors, mainly discount rate.
Our total debt was Rs.556,814 million as of March 31, 2013, as compared to Rs.508,123 million as of March 31, 2012. Short-term debt including the current portion of long-term debt was Rs.231,357 million as of March 31, 2013, as compared to Rs.220,975 million as of March 31, 2012. Our long-term debt, excluding the current portion, increased by Rs.38,309 million to Rs.325,458 million as of March 31, 2013 (Rs.287,148 million as of March 31, 2012). Long-term debt including the current portion increased by Rs.43,653 million to Rs.440,596 million. During Fiscal 2013, we issued rated, listed, unsecured non-convertible debentures of Rs.21,000 million with maturities of 2-7 years as a step to raise long term resources and optimize the loan maturity profile and Jaguar Land Rover issued USD 500 million Senior Notes due 2023 at a coupon of 5.625% per annum. There was a net increase in collateralized debt obligation by Rs.3,057 million as of March 31, 2013, mainly due to securitized finance receivables. Further, Senior notes (EURO MTF listed debt) increased by Rs.26,436 million to Rs.150,087 million as of March 31, 2013 from Rs.123,651 million as of March 31, 2012. Fixed deposits from public and shareholders (unsecured) decreased by Rs.20,018 million, whereas loan from banks/financial institution increased by Rs.27,726 million.
Total shareholders’ equity was Rs.373,906 million and Rs.331,344 million as of March 31, 2013 and 2012, respectively.
Our reserves increased from Rs.146,808 million as of March 31, 2012 to Rs.197,577 million as of March 31, 2013. We paid a dividend of Rs.14,855 million in Fiscal 2013.
Our other components of equity reflected a loss of Rs.12,660 million as of March 31, 2013 against a gain of Rs.1,311 million as of March 31, 2012. We have accounted for an actuarial gains/loss (net) reduction of Rs.23,086 million (after considering the tax credit of Rs.6,156 million) in respect of pension obligations. Further, there was a loss of Rs.15,106 million on cash flow hedges, recorded in comprehensive income. These were offset by a currency translation creditcontinuing decrease of Rs.798 million and gain on available for sale investments of Rs.353 million.
The ratio of net debt to shareholders’ equity (total debt less cash and cash equivalents and liquid marketable securities divided by total shareholders’ equity) under IFRS increased from 0.9 as of March 31, 2012 to 1.0 as of March 31, 2013. Details of the calculation of this ratio are set forth in Exhibit 7.1 to this annual report.
| Fiscal 2013 | Fiscal 2012 | |||||||
| (Rs. in millions) | ||||||||
Income Tax | 1,215 | 1,832 | ||||||
Excise Duties | 10,116 | 4,430 | ||||||
Sales Tax | 4,574 | 5,506 | ||||||
Other Taxes and Claims* | 3,055 | 2,383 | ||||||
Other Contingencies | 467 | 836 | ||||||
Total | 19,426 | 14,986 | ||||||
On an ongoing basis, our legal department reviews pending cases, claims by third parties against us and other contingencies. For the purposes of financial reporting, we periodically classify these matters into gain contingencies and loss contingencies. Gain contingencies are not recognized until the contingency has been resolved and amounts are received or receivable. For loss contingencies that are considered probable, an estimated loss is recorded as an accrual in financial statements and, if the matter is material, the estimated loss is disclosed. We do not consider any of these matters to be individually sufficiently material to warrant disclosure in our financial statements. Loss contingencies that are considered possible are not provided for in our financial statements, but if we consider such contingencies to be material, individually orsales in the aggregate, they are disclosedLCV category of 18.1% to 406,902 units in our financial statements. Most loss contingencies are classified as possible unless clearly frivolous,Fiscal 2015 from 496,993 units in which case they are classified as remote and are monitored by our legal department on an ongoing basis for possible deterioration. We do not disclose remote matters in our financial statements. See note 34 of our audited consolidated financial statements included elsewhere in this annual report for additional information regarding our material claims and contingencies.
Since Fiscal 1997, we have benefited from participation2014. Demand in the EPCG Schemelight commercial vehicles category was affected due to lower freight transportation needs due to high-capacity additions to fleets over recent years, financing defaults and tightened lending norms, all of which permits uscontinue to import capital equipment under a special license at a substantially reduced customs duty. impede the recovery in sales of small commercial vehicles.
Our participationsales in this scheme is subjectthe LCV category declined by 28.6% to us fulfilling an obligation to export goods manufactured or produced by the use of capital equipment imported under the EPCG Scheme191,425 units in Fiscal 2015 from 268,041 units in Fiscal 2014 due to the valuefactors affecting the LCV market industry wide. Our overall market share of a multiple of the cost of insurance and freight value of these imports or customs duty saved over a period of 6, 8 and 12 yearsLCV sales in India decreased to 47.0% in Fiscal 2015 from the date of obtaining the special license.
We currently hold 92 licenses which require us to export our products of a value of approximately Rs.71.71 billion between the years 2002 to 2019, and we carefully monitor our progress in meeting our incremental milestones. After fulfilling some of the export obligations as per provisions of Foreign Trade Policy, as on March 31, 2013 we have remaining obligations to export products of a value of approximately Rs.4.66 billion by March 2019. In the event that the export obligation under the EPCG Scheme is not fulfilled, we would have to pay the differential between the reduced and normal duty on the goods imported along with interest. In view of our past record of exceeding our export milestones, and our current plans with respect to our export markets, we do not currently foresee any impediments to meeting our export obligation in the required time frame.53.9% during Fiscal 2014.
Tata and other brand vehicles—Exports
We are expanding our export operations, which have been ongoing since 1961. We market our commercial and passenger vehicles —in several countries in South Africa, Europe, Africa, the Middle East, South East Asia, Ukraine and Russia. We market a range of products including M&HCV trucks, LCV trucks, buses, pickups and small commercial vehicles. Our export business has also been bolstered by the entry into the ASEAN region, including Indonesia, Malaysia, Philippines as well as with the introduction of the new range of world class products Prima and Ultra in various markets during Fiscal 2015, which we anticipate offering in additional markets in Fiscal 2016.
Our overall sales in international markets increased by 2.8% to 63,009 units in Fiscal 2015 from 61,279 units in Fiscal 2014. Our exports of vehicles manufactured in India increased marginally by 2.1% in Fiscal 2015 to 47,961 units from 46,983 units in Fiscal 2014. The improvement of the geopolitical situation in the South Asian Association for Regional Cooperation region has contributed to an increase in investment in capital goods, which has helped us to improve volumes in this region generally, and particularly in Bangladesh. In addition, the launch of new models in the Middle East and Africa region, along with the opening up of new markets in this region contributed to an increase in international sales volumes. Our top five export destinations for vehicles manufactured in India, that is, Bangladesh, Sri Lanka, Nepal, South Africa and Indonesia, accounted for approximately 56% and 79% of the exports of commercial vehicles and passenger vehicles, respectively. We intend to strengthen our position in the geographic areas we are currently operating in and explore possibilities of entering new markets with similar market characteristics to the Indian market.
TDCV, our subsidiary company engaged in the design, development and manufacturing of M&HCVs, recorded a 9.9% increase in its overall vehicle financing:sales to 11,640 units in Fiscal 2015 from 10,594 units in Fiscal 2014. In the South Korean market, TDCV’s sales have increased by 3.4% from 6,584 units in Fiscal 2014 to 6,808 units in Fiscal 2015, primarily due to higher sales in October to December 2014, prompted by emissions norms effective from January 2015. TDCV exported 4,832 units in Fiscal 2015, compared to 4,010 units in Fiscal 2014, an increase of 20.5%. Sluggish market conditions in Russia, South Africa, Algeria and Laos due to adverse sociopolitical conditions were partially offset by increases in sales volumes in Vietnam, the Philippines, and the UAE. The Ukraine crisis and financial sanctions contributed to sluggish market conditions in Russia, which affected currency exchange rates and lessened demand for automobiles and for new large projects. Overall sales in South Africa have been affected by the depreciation of the South African Rand and overall limited economic growth. In Algeria and Laos, vehicle demand has been affected by continued political and economic uncertainties, general economic conditions and the absence of major projects. In Vietnam, TDCV has been able to develop new fleet customers to take advantage of a shift in demand to more lightweight commercial vehicles due to stricter application of vehicle-weight regulations.
Tata and other brand vehicles—Sales and Distribution
Our sales and distribution network in India as at March 2015 comprises approximately 3,904 contact points for sales and service for our passenger and commercial vehicle business. Our subsidiary, TML Distribution Company Limited, or TDCL, acts as a dedicated distribution and logistics management company to support the sales and distribution operations of our vehicles in India. We believe this has improved the efficiency of our selling and distribution operations and processes. We use a network of service centers on highways and a toll-free customer assistance center to provide 24-hour on-road maintenance, including replacement of parts, to vehicle owners.
TDCL provides distribution and logistics support for vehicles manufactured at our facilities and has set up stocking points at some of our plants and at different places throughout India. TDCL helps us improve planning, inventory management, transport management and timely delivery. We have completed the initial rollout of a new customer relations management system, or CRM, at all of our dealerships and offices across the country, which supports users both at our company and among our distributors in India and abroad.
We market our commercial and passenger vehicles in several countries in Africa, Middle East, South East Asia, South Asia, Australia, Russia and the Commonwealth of Independent States countries. We have a network of distributors in all such countries, where we export our vehicles. Such distributors have created a network of dealers and branch offices and facilities for sales and after-sales servicing of our products in their respective markets. We have also stationed overseas resident sales and service representatives in various countries to oversee our operations in the respective territories.
Tata and other brand vehicles—Competition
We face competition from various domestic and foreign automotive manufacturers in the Indian automotive market. Improving infrastructure and robust growth prospects compared to other mature markets have attracted a number of international companies to India who have either formed joint ventures with local partners or have established independently owned operations in India. Global competitors bring with them decades of international experience, global scale, advanced technology and significant financial resources, and as a result, competition is likely to further intensify in the future. We have designed our products to suit the requirements of the Indian market based on specific customer needs such as safety, driving comfort, fuel efficiency and durability. We believe that our vehicles are suited to the general conditions of Indian roads and the local climate. The vehicles have also been designed to comply with applicable environmental regulations currently in effect. We also offer a wide range of optional configurations to meet the specific needs of our customers. We intend to develop and are developing products to strengthen our product portfolio in order to meet the increasing customer expectation of owning world class products.
Tata and other brand vehicles—Seasonality
Demand for our vehicles in the Indian market is subject to seasonal variations. Demand generally peaks between January and March, although there is a decrease in demand in February just before release of the Government of India’s fiscal budget. Demand is usually lean from April to July and picks up again in the festival season from September onwards, with a decline in December due to model year change.
Tata and other brand vehicles—Vehicle Financing
Through our vehicle financing division and wholly owned subsidiary, TMFL, we also provide financing services to purchasers of our vehicles through our independent dealers, who act as our agents, and through our branch network. The vehicle financing is intended to encourage sale of vehicles by providing financing to the dealers’ customers and as such is an integral part of automotive business.
InTMFL disbursed Rs.73,156 million and Rs.87,676 million in vehicle financing during Fiscal 20132015 and 2012, 33%2014, respectively. During Fiscal 2015 and 27%2014, approximately 24% and 30%, respectively, of our vehicle unit sales volumes in India were financed under loan contracts tomade by the dealers through financing arrangements where our dealer’s customers. As ofcaptive vehicle financing divisions provided the support. Total vehicle finance receivables outstanding as at March 31, 20132015 and 20122014 amounted to Rs.158,016 million and Rs.185,275 million, respectively. As at March 31, 2015 and 2014 our customer finance receivable portfolio comprised 687,580 and 732,550 and 665,169 contracts, respectively, with gross finance receivables of approximately, Rs.212,754 million and Rs.182,330 million as at March 31, 2013 and 2012, respectively. We follow specified internal procedures, including quantitative guidelines, for selection of our finance customers to assist in managing default and repayment risk in our portfolio. We originate all of the contracts through our authorized dealers and direct marketing agents with whom we have agreements. All our marketing, sales and collection activities are undertaken through dealers or by our subsidiary, TMFL.
We securitize or sell our finance receivables on the basis of evaluation of market conditions and funding requirements. The constitution of these pools is based on criteria that are decided by credit rating agencies and/or based on the advice that we receive as toregarding the marketability of a pool. We undertake these securitizations of our receivables in either or both of the following forms:
assignmentAssignment of the receivables due from purchasers under loan agreements; and
securitizationSecuritization of receivables due from purchasers by means of private placement.
We act as collection agent on behalf of the investors, representatives, special purpose vehicles or banks, in whose favor the receivables have been assigned, for the purpose of collecting receivables from the purchasers on the terms and conditions contained in the applicable deeds of securitization, in respect of which pass-through certificates are issued to investors in case of special purpose vehicles, or SPVs. We also secure the payments to be made by the purchasers of amounts constituting the receivables under the loan agreements to the extent specified by rating agencies by any one or all of the following methods:
by furnishingFurnishing to the investors collateral, in respect of the obligations of the purchasers and the undertakings to be provided by us;
by furnishing,Furnishing, in favor of the investors, 16%10.88% to 32%14.90% of the gross receivables as cash collateral, in case of previous year securitization, for securitizations done duringtill Fiscal 2013 the range lies between 11% to 15% of the gross receivables2014, either by way of a fixed deposit or bank guarantee to secure the obligations of the purchasers and our obligations as the collection agent, based on the quality of receivables and rating assigned to the individual pool of receivables by the rating agency(ies); and
byBy way of over-collateralization or by investing in subordinate pass-through certificates to secure the obligations of the purchasers.
For further details refersee Note 36(b) to our consolidated financial statements included elsewhere in this annual report.report on Form 20-F.
Capital ExpenditureJaguar Land Rover
Capital expenditure totaled Rs.210,956 million, Rs.147,164 millionIn Fiscal 2015, Jaguar Land Rover continued to grow in all of its geographic markets on an annual basis, although retail sales in China decreased by 20.4% in the fourth quarter of Fiscal 2015 compared to the same period in Fiscal 2014. Growth in volume has been driven by the continued success of the Range Rover, Range Rover Sport and Rs.90,719 million during Fiscal 2013, 2012the Jaguar F-TYPE. More established models such as the Range Rover Evoque and 2011, respectively. Our automotive operations accounted for a majority of this capital expenditure.
Our capital expenditures, during the past three years in India related mostly to (i) capacity expansion and new production facilities, (ii) the introduction of newLand Rover Discovery have also been performing well, however more mature products such as the Tata Nano, World Truck, Tata 407 Pickup, Tata Super ACE, Tata ACE EX, Tata Magic, WingerJaguar XF and Sumo Grande, (iii)XJ experienced lower sales in anticipation of the developmentintroduction of planned future productsthe all new Jaguar XE and technologies, (iv) qualitythe new Jaguar XF. Production of Jaguar XK and reliability improvements aimed at operating cost reductionsthe Land Rover Freelander were terminated during the year, with the latter replaced by the Land Rover Discovery Sport.
Our total wholesale sales of Jaguar Land Rover in Fiscal 2015, 2014 and (v) modernization.2013 are set forth in the table below:
Capital expenditure
| Fiscal 2015 | Fiscal 2014 | Fiscal 2013 | ||||||||||||||||||||||
| Units | % | Units | % | Units | % | |||||||||||||||||||
Jaguar | 78,083 | 16.5 | % | 80,644 | 18.7 | % | 57,766 | 15.5 | % | |||||||||||||||
Land Rover | 394,945 | 83.5 | 351,245 | 81.3 | 314,290 | 84.5 | ||||||||||||||||||
Total | 473,028 | 100.0 | % | 431,889 | 100.0 | % | 372,056 | 100.0 | % | |||||||||||||||
Wholesale volumes in Fiscal 2015 increased by 9.5% to 473,028 units from 431,889 units in Fiscal 2014. Wholesale volumes for Land Rover in Fiscal 2015 increased by 12.4% to 394,945 units from 351,245 units in Fiscal 2014. The increase in sales occurred in a majority of models, most notably the Range Rover and Range Rover Sport, which was partially offset by the inventory shortages of the Freelander (which had ceased production) while Jaguar Land Rover initiated production of the Discovery Sport (which had recently commenced production). However, wholesale volumes for Jaguar in Fiscal 2015 decreased by 3.2% to 78,083 units from 80,644 units sold in Fiscal 2014. Increased sales of the Jaguar F-TYPE were offset by a fall in volume of the maturing Jaguar XF and XJ models in advance of the introduction of the Jaguar XE and the Jaguar XF.
The strengths of the Jaguar Land Rover business mainly included expenditureinclude its internationally recognized brands, strong product portfolio of award-winning luxury performance cars and premium all-terrain vehicles, global distribution network, strong research and development capabilities, and a strong management team.
Jaguar Land Rover’s performance in key geographical markets on plant at Halewoodretail basis
Retail volumes in Fiscal 2015 increased by 6.4% to 462,209 units from 434,311 units Fiscal 2014. The overall increase in sales volumes was primarily due to strong sales of the Range Rover, Range Rover Sport and the Jaguar F-TYPE vehicles, which was partially offset by the lack of available Freelander inventory. For Land Rover, retail volumes increased by 8.9% to 385,279 units in Fiscal 2015 from 353,789 units in Fiscal 2014. However, for Jaguar, retail volumes in Fiscal 2015 decreased by 4.5% to 76,930 units from 80,522 units in Fiscal 2014, as increased sales of the Jaguar F-TYPE were offset by a decrease in volume of the maturing Jaguar XF and XJ models in advance of the introduction of the Jaguar XE and the all new Jaguar XF. Furthermore, retail sales volumes in China decreased by 20.4% in the fourth quarter of Fiscal 2015 compared to the same period in Fiscal 2014. Jaguar Land Rover exports increased by 6.9% to 378,427 units in Fiscal 2015 from 354,005 units in Fiscal 2014.
United Kingdom
Industry vehicle sales rose by 7.5% in Fiscal 2015 in the United Kingdom compared to Fiscal 2014 as economic growth improved inflation and interest rates remained low and labor market conditions continued to strengthen. Jaguar Land Rover retail volumes increased by 13.1% to 86,750 units in Fiscal 2015 from 76,721 units in Fiscal 2014, with a strong sales performance from Jaguar, up 7.0% in Fiscal 2015, which was driven by sales of the Jaguar F-TYPE and the XF. Land Rover retail volumes increased by 14.8%, as all models experienced an increase in volumes, most notably the Range Rover Sport and the Discovery.
North America
Economic performance in the United States continued to strengthen over the year as unemployment continued to fall, lower inflation driven by lower energy prices increased disposable incomes and consumer confidence continued to grow contributing to an industry-wide increase in passenger car sales of 6.8% in Fiscal 2015 compared to Fiscal 2014. Jaguar Land Rover retail volumes increased by 3.6% to 78,372 units from 75,671 units in Fiscal 2014, with a 9.5% increase in Land Rover retail volumes as Range Rover, Range Rover Sport and Range Rover Evoque manufacturingcontinued to perform well. Jaguar volumes in North America decreased by 13.6% as sales of the aging XF and engine plant at WolverhamptonXJ decreased, which was partially offset by strong sales of the popular F-TYPE.
Europe
Passenger car sales increased by 5.5% industry-wide in Midlands UK,Europe despite low growth, recessionary pressures and ambiguity over the constructionGreek national debt negotiations, while quantitative easing announced by the European Central Bank in January 2015 has provided a boost in economic activity more recently. Jaguar Land Rover volumes in Europe increased by 6.0% to 87,863 units in Fiscal 2015 from 82,854 units in Fiscal 2014, with sales particularly strong in Germany, Italy and France. Land Rover volumes increased by 9.2% in Fiscal 2015 as sales of the Range Rover Sport and Range Rover grew significantly. Jaguar volumes decreased by 14.2% in Fiscal 2015, as sales of the aging XF sedan and Sportbrake decreased, which iswas partially offset by solid sales of theF-TYPE.
China
Despite continuing signs of softening in process.the Chinese economy during the year, GDP still grew over 7.0% and passenger car sales increased by 9.6%. Jaguar Land Rover retail volumes, which include sales from our joint venture with Chery increased by 12.5% to 115,969 units in Fiscal 2015 from 103,077 units in Fiscal 2014. However, in the fourth quarter of Fiscal 2015, retail sales of Jaguar Land Rover in China decreased by 20.4% to 23,526 units from 29,567 units compared to the same period in Fiscal 2014 due to inventory shortages of the Land Rover Freelander (which had ceased production) and the Land Rover Discovery Sport and the locally produced Range Rover Evoque (which had recently commenced production). This decline in retail sales of Jaguar Land Rover has entered intocontinued in the first quarter of Fiscal 2016. Retail sales of Land Rover increased by 14.8% in Fiscal 2015 with sales of the majority of models up, most notably the Range Rover and Range Rover Sport, while Jaguar retail sales increased by 2.8% in Fiscal 2014, as both the XF and F-TYPE performed well.
Asia Pacific
The Asia Pacific region most notably comprises Australia, Japan and South Korea for purposes of our Jaguar Land Rover operations. Jaguar Land Rover retail volumes increased by 16.8% to 26,619 units in Fiscal 2015 from 22,795 units in Fiscal 2014, most notably in South Korea (increased by 46.7%) and in Australia (increased by 16.4%) as consumer demand for Jaguar Land Rover products continued to rise in these markets. Retail sales of the Range Rover, Range Rover Sport, Land Rover Discovery and Jaguar F-TYPE performed particularly well in the Asia Pacific region. Land Rover sales increased by 21.1% and Jaguar retail sales increased by 1.3% in Fiscal 2015.
Other overseas markets
Jaguar Land Rover’s retail volumes in the other overseas markets declined by 9.0% to 66,636 units in Fiscal 2015 from 73,193 units in Fiscal 2014, primarily as a consequence of economic sanctions and low energy prices impacting Russia and slowing economic growth reducing consumer spending in Brazil and South Africa. Slowing economic growth and ongoing recessionary pressures in Brazil have contributed to a decrease in automotive sales industry-wide of 11.0% in Fiscal 2015 compared to Fiscal 2014, and Jaguar Land Rover sales volumes in Brazil have followed suit, decreasing 16.6% in Fiscal 2015 compared to Fiscal 2014. Continuing economic sanctions and softer energy prices have had an adverse effect on passenger car sales industry-wide in Russia, which decreased 17.7% in Fiscal 2015 compared to Fiscal 2014. Jaguar Land Rover sales, however, have fallen comparatively slower, decreasing 9.6% in Fiscal 2015 compared to Fiscal 2014, as Range Rover Sport continued to perform well and F-TYPE volumes increased. South Africa’s persistent slow growth continues to impact the automotive industry as passenger car sales fell by 1.7% in Fiscal 2015 compared to Fiscal 2014 and Jaguar Land Rover retail volumes dropped by 23.2% in Fiscal 2015 compared to Fiscal 2014.
We sold 2,873 units of Jaguar Land Rover vehicles in India through our exclusive dealerships in Fiscal 2015 as compared to 2,805 units in Fiscal 2014, an increase of 1.2%, which was aided by the manufacture of the Jaguar XF, Jaguar XJ and the Range Rover Evoque in India, as vehicles manufactured and sold in India are not subject to certain import duties. We expect that the continued efforts towards dealership network expansion and local manufacturing of Jaguar Land Rover products will enable us to further penetrate the premium/luxury automotive passenger car market in India.
Jaguar Land Rover—Sales & Distribution
Jaguar Land Rover markets products in 170 countries, through a global network of 19 national sales companies, 73 importers, 53 export partners and 2,674 franchise sales dealers, of which 915 are joint Jaguar Land Rover dealers, which operate independently. Jaguar Land Rover has regional offices in certain countries that manage customer relationships, vehicle supplies and provide marketing and sales support to their regional importer markets. The remaining importer markets are managed from the United Kingdom. Jaguar Land Rover products are sold to retail customers through our global dealership network and to fleet customers, including daily rental car companies, commercial fleet customers, leasing companies, and governments. As a consequence, Jaguar Land Rover has a diversified customer base, which reduces its dependence on any single customer or group of customers.
Jaguar Land Rover has established business processes and systems designed to ensure that its production plans meet anticipated retail sales demand and to enable the active management of its inventory of finished vehicles and dealer inventory throughout its network. Jaguar Land Rover has multi-year exclusive branded arrangements in place with Black Horse (part of the Lloyds Bank Group) in the UK, FCA Bank (a joint venture agreementbetween Fiat Chrysler Auto and Credit Agricole) in Europe and Chase Auto Finance in the United States for the provision of dealer and consumer financial services products. Jaguar Land Rover has similar arrangements with Chery Automobilelocal automotive financial services providers in other key markets. Jaguar Land Rover’s financing partners offer its customers a full range of consumer financing options.
Jaguar Land Rover—Competition
Jaguar Land Rover operates in a globally competitive environment and faces competition from established premium and other vehicle manufacturers who aspire to buildmove into the premium performance car and premium SUV markets, some of which are much larger than we are. Jaguar vehicles compete primarily against other European brands such as Audi, BMW and Mercedes Benz. Land Rover and Range Rover vehicles compete largely against SUVs manufactured by Audi, BMW, Infiniti, Lexus, Mercedes Benz, Porsche and Volkswagen. The Land Rover Defender competes with vehicles manufactured by Isuzu, Nissan and Toyota.
Jaguar Land Rover—Seasonality
Jaguar Land Rover sales volume is impacted by the semi-annual registration of vehicles in the United Kingdom where the vehicle registration number changes every six months, which in turn has an impact on the resale value of the vehicles. This leads to a factoryconcentration of sales during the periods when the change occurs. Seasonality in most other markets is driven by introduction of new model year derivatives, for example in the U.S. market. Additionally in the U.S. market there is some seasonality around the purchase of vehicles in northern states where the purchase of Jaguar vehicles is concentrated in the spring /summer months, and the purchase of 4x4 vehicles is concentrated in the autumn/winter months. In China, there is an increase in vehicle purchases during the fourth fiscal quarter, which includes the Chinese New Year holiday. Furthermore, western European markets tend to be impacted by summer and winter holidays. The resulting sales profile influences operating results on a quarter-to-quarter basis.
Other Operations
In addition to our automotive operations, we are also involved in other business activities, including information technology services. Net revenues, before inter-segment elimination, from these activities totaled Rs.27,152 million, Rs.24,989 million and Rs.22,179 million in Fiscal 2015, 2014 and 2013, respectively, representing nearly 1.0%, 1.1% and 1.2% of our total revenues before inter-segment elimination in the corresponding Fiscal periods.
Information Technology Services
As at March 31, 2015, we owned a 72.32% equity interest in our subsidiary, TTL. TTL, founded in 1994 and a part of Tata Motors Group, provides product development IT services solutions for manufacturingPLM and Enterprise Resource Management, or ERM, to automotive, aerospace and consumer durables manufacturers and their suppliers. TTL’s services include product design, analysis and production engineering, knowledge-based engineering, PLM, ERM and CRM systems. TTL also distributes, implements and supports PLM products from leading solution providers in the world such as Dassault Systems and Autodesk.
TTL has its international headquarters in Singapore, with regional headquarters in the United States, India and the United Kingdom. In Fiscal 2014, TTL acquired Cambric Corporation, an engineering services organization, to achieve greater domain expertise and presence in the industrial equipment sector. TTL has a combined global workforce of cars for Chinese marketaround 7,804 professionals serving clients worldwide from facilities in the North America, Europe, and Asia Pacific regions. TTL responds to customers’ needs through its subsidiary companies and through its offshore development centers in India, Thailand and Romania. TTL had 14 functional subsidiary companies and one joint venture as at March 31, 2014.
The consolidated revenues of TTL increased by 10.3% in Fiscal 2015 to Rs.26,170 million (including sales to Tata Motors Limited and its consolidated subsidiaries) from Rs.23,724 million in Fiscal 2014 due to operations in the automotive and aerospace markets. TTL recorded profit after tax of Rs.3,349 million in Fiscal 2015, reflecting an increase of 26.8% over Rs.2,642 million in Fiscal 2014.
Research and Development
Over the years, we have devoted significant resources towards our research and development activities. Our research and product development costs in Fiscal 2015, 2014 and 2013 were Rs. 28,515.3 million, Rs. 25,651 million and Rs. 20,340 million, respectively. Our research and development activities focus on product development, environmental technologies and vehicle safety. In India, our Engineering Research Centre, or ERC, established in 1966, is one of the few in-house automotive research and development centers in India recognized by the Government of India. The ERC is integrated with all of the Tata Motors Global Automotive Product Design and Development Centers in South Korea, Italy and the United Kingdom. In addition to this, we leverage key competencies through various engineering service suppliers and design teams of its suppliers.
We have a new passenger car electrical and electronics facility for proposedthe development of hardware-in-the-loop systems, labcars and infotainment systems to achieve system and component integration. We have an advance engineering workshop, with a lithium-ion battery module, for the development of electric vehicle and hybrid products. We have a crash test facility for passive safety development in order to meet regulatory and consumer group test requirements and evaluate occupant safety, which includes a full vehicle-level crash test facility, a sled test facility for simulating the crash environment on subsystems, a pedestrian safety testing facility, a high strain rate machine and a pendulum impact test facility for goods carrier vehicles. This facility is also supported with computer-aided engineering infrastructure to simulate tests in a digital environment. Our safety development facilities also incorporate other equipment that we believe will help improve the safety and design of our vehicles, such as an emission labs engine development facility, a testing facility for developing vehicles with lower noise and vibration levels, an engine emission and performance development facility and an eight poster test facility that helps to assess structural durability of M&HCVs. In addition, we are installing a new product introductions.engine noise test facility and transmission control unit which we expect will aid in powertrain development. Other key facilities include a full vehicle environmental testing facility, material pair compatibility equipment, corrosion test facility, heavy duty dynamometers and aggregate endurance test rigs.
For details onOur product design and development centers aim to create a highly scalable digital product development and virtual testing and validation environment, targeting a reduction in product development cycle-time, improved quality and the ability to create multiple design options. Global design studios are key part of our product conceptualization strategy. We have aligned our end-to-end digital product development projects, please refer note 14objectives and infrastructure with our business goals and have made significant investments to enhance our consolidated financial statements included elsewherecapabilities, especially in this annual report.the areas of product development through computer-aided design, computer aided manufacturing, computer-aided engineering, knowledge-based engineering, product lifecycle management and manufacturing planning. In specific engineering review processes, such as digital mock-up and virtual build and validation, we have been able to provide capabilities for reduced time and increased quality in product designs. The design IP is managed through a product lifecycle management system, enabling backbone processes, and we have institutionalized “issue tracking” work-flow based systems in various domains to manage them effectively.
Tata Motors continuesWe have begun developing a technology platform for small electric vehicles with a GVW of one ton or greater with the National Automotive Board, SIAM and other OEMs. In addition, our research and development activities also focus on developing vehicles that consume alternative fuels, including CNG, liquefied petroleum gas, bio-diesel, compressed air and electricity. We are continuing to focusdevelop green-technology vehicles and are presently developing an electric vehicle on a small commercial vehicle platform. We are also pursuing alternative fuel options such as ethanol blending. Furthermore, we are working on development of vehicles fueled by hydrogen.
We are also pursuing various initiatives, such as the introduction of premium lightweight architecture, to enable our business to comply with the existing and evolving emissions legislations in the developed world, which we believe will be a key enabler of both reduction in CO2 and further efficiencies in manufacturing and engineering.
We have implemented initiatives in vehicle electronics, such as engine management systems, in-vehicle network architecture and multiplexed wiring. We are in the process of implementing electronic stability programs, automated and automatic transmission systems, telematics for communication and tracking, anti-lock braking systems and intelligent transportation systems. We have implemented new driver information technologies and high performance infotainment systems with IT enabled services. Likewise, various new technologies and systems including hybrid technologies that would improve the safety, performance and emissions of our product range and are being implemented in our passenger cars and commercial vehicles.
We are developing an enterprise-level vehicle diagnostics system with global connectivity in order to achieve faster diagnostics of complex electronics in vehicles in order to provide prompt service to customers. We are also developing prognostic data collection and analysis for failure prediction to the end customer. Furthermore, our initiative in telematics has spanned into a fleet management, driver information and navigation systems, and vehicle tracking system using global navigation satellite systems. We intend to incorporate Wi-Fi and Bluetooth interfaces in our vehicles to facilitate secure and controlled connectivity to third-party IT enabled devices.
Jaguar Land Rover’s research and development operations are built around engineering facilities that feature an extensive test track, testing centers, design hubs and a recently inaugurated virtual innovation center. The ERC in India and Jaguar Land Rover’s engineering and development operations in the United Kingdom have identified areas to leverage the facilities and resources to enhance the product development process and achieve economies of scale.
Jaguar Land Rover’s two design and development centers are equipped with computer-aided design, manufacturing and engineering tools configured to support an ambitious product development cycle plan. In recent years, Jaguar Land Rover has refreshed the entire Jaguar range under a unified concept and design language and has continued to enhance the design of Land Rover’s range of all-terrain vehicles. Jaguar Land Rover’s R&D operations look for synergies through sharing premium technologies, powertrain designs and vehicle architecture. The majority of Jaguar Land Rover’s products are designed and engineered in the United Kingdom. Jaguar Land Rover endeavors to implement the best technologies into its product range to meet the requirements of a globally competitive market and to comply with regulatory requirements. Jaguar Land Rover currently offers hybrid technology on some of its models such as the Range Rover and Range Rover Sport and conducts research and development related to the further application of alternative fuels and technologies to further improve the environmental performance of its vehicles, including the reduction of CO2 emissions.
We endeavor to absorb the best of technologies for our product range to meet the requirements of a globally competitive market. All of our vehicles and engines are compliant with the prevalent regulatory norms in the respective countries in which they are sold.
Intellectual Property
We create, own, and maintain a wide array of intellectual property assets throughout the world that are among our most valuable assets. Our intellectual property assets include patents, trademarks, copyrights designs, trade secrets and other intellectual property rights. We proactively and aggressively seek to protect our intellectual property in India and other countries.
We own a number of patents and have applied for new patents which are pending for grant in India as well as in other countries. We have also filed a number of patent applications outside India under the Patent Cooperation Treaty, which we expect will be effective in other countries going forward. We also obtain new patents as part of our ongoing research and development activities.
We own registrations for a number of trademarks and have pending applications for registration of these in India as well as other countries. The registrations mainly include trademarks for our vehicle models and other promotional initiatives. We use the Tata brand, which has been licensed to us by Tata Sons. We believe that establishment of the Tata word mark and logo mark in India and around the world is material to our operations. As part of our acquisition of TDCV, we have rights to the perpetual and exclusive use of the Daewoo brand and trademarks in South Korea and overseas markets for the Indian market and other international market it serves. Theproduct range of TDCV.
As part of the acquisition of our Jaguar Land Rover business, ownership (or co-ownership, as applicable) of core intellectual property associated with Jaguar Land Rover was transferred to us; however such intellectual property is still ultimately owned by Jaguar Land Rover entities. Additionally, perpetual royalty-free licenses to use other essential intellectual property have been granted to us for use in Jaguar and Land Rover vehicles. Jaguar Land Rover owns registered designs to protect the design of its vehicles in several countries.
In varying degrees, all of our intellectual property is important to us. In particular, the Tata, Jaguar, Land Rover and Range Rover brands are integral to the conduct of our business, a loss of which could lead to dilution of our brand image and have a material adverse effect on our business.
Components and Raw Materials
The principal materials and components required by us for use in Tata and other brand vehicles are steel sheets (forin-house stampings) and plates, iron and steel castings and forgings, items such as alloy wheels, tires, fuel injection systems, batteries, electrical wiring systems, electronic information systems and displays, interior systems such as seats, cockpits, doors, plastic finishers and plastic functional parts, glass and consumables, such as paints, oils, thinner, welding consumables, chemicals, adhesives and sealants, and fuels. We also require aggregates such as axles, engines, gear boxes and cams for our vehicles, which are manufactured in-house or by our subsidiaries, affiliates, joint ventures or operations and strategic suppliers. We have long-term purchase agreements for certain critical components such as transmissions and engines. We have established contracts with certain commodity suppliers to cover our own as well as our suppliers’ requirements in order to moderate the effect of volatility in commodity prices. We have also undertaken special initiatives to reduce material consumption through value engineering and value analysis techniques.
Our sourcing department in India has four divisions, namely, Purchasing, Supplier Quality, Supply Chain and Production and Planning Management or PPM. The reorganization was done with a view to establish and define responsibility and accountability in the sourcing department. Purchasing oversees the commercial aspects of product sourcing, Supplier Quality is primarily responsible for maintaining the quality of supplies that we purchase, Supply Chain oversees the logistics of the supply and delivery of parts for our vendors while PPM oversees execution of new projects.
As part of our strategy to become a low-cost vehicle manufacturer, we have undertaken various initiatives to reduce our fixed and variable costs. In India we started an e-sourcing initiative in 2002, pursuant to which we procure some supplies through reverse auctions. We also use external agencies as third party logistic providers. This has resulted in space and cost savings. Our initiatives to leverage information technology in supply chain activities have resulted in improved efficiency through real time information exchange and processing with our suppliers.
We have an established supplier quality sixteen step process in order to ensure quality of outsourced components. We formalized the component development process using Automotive Industry Action Group guidelines. We also have a program for assisting vendors from whom we purchase raw materials or components to maintain quality. Preference is given to vendors with TS 16949 certification. We also maintain a stringent quality assurance program that includes random testing of production samples, frequent re-calibration of production equipment and analysis of post-production vehicle performance, as well as an ongoing dialogue with workers to reduce production defects.
We are also exploring opportunities for increasing the global sourcing of parts and components from low cost countries, and have in place a vendor management program that includes vendor base rationalization, vendor quality improvement and vendor satisfaction surveys. We have begun to include our supply chain in our initiatives on social accountability and environment management activities, including supply chain carbon footprint measurement and knowledge sharing on various environmental aspects.
The principal materials and components required for use in our Jaguar Land Rover vehicles are steel and aluminum sheets, aluminum castings and extrusions, iron and steel castings and forgings, and items such as alloy wheels, tires, fuel injection systems, batteries, electrical wiring systems, electronic information systems and displays, leather-trimmed interior systems such as seats, cockpits and doors, plastic finishers and plastic functional parts, glass and consumables, such as paints, oils, thinner, welding consumables, chemicals, adhesives and sealants, and fuels. Jaguar Land Rover also requires certain highly functional components such as axles, engines and gear boxes for its vehicles, which are mainly manufactured by strategic suppliers. We have long-term purchase agreements for critical components such as transmissions with ZF Friedrichshafen AG and for engines with Ford and the Ford-PSA Peugeot Citroën joint venture, or the Ford-PSA joint venture. The components and raw materials in Jaguar Land Rover cars include steel, aluminum, copper, platinum and other commodities. Jaguar Land Rover has established contracts with certain commodity suppliers, such as Novelis, to cover its own and its suppliers’ requirements to mitigate the effect of high volatility. Special initiatives are also undertaken to reduce material consumption through value engineering and value analysis techniques.
Jaguar Land Rover works with a range of strategic suppliers to meet their requirements for parts and components, and we endeavor to work closely with our suppliers to form short- and medium-term plans for our business. We have established quality control programs to ensure that externally purchased raw materials and components are monitored and meet our quality standards. Jaguar Land Rover also outsources many of the manufacturing processes and activities to various suppliers. Where this is the case, Jaguar Land Rover provides training to the outside suppliers who design and manufacture the required tooling and fixtures. Such programs include site engineers who regularly interface with suppliers and carry out visits to supplier sites to ensure that relevant quality standards are being met. Site engineers are also supported by persons in other functions, such as program engineers who interface with new model teams as well as resident engineers located at Jaguar Land Rover plants, who provide the link between the site engineers and the plants. Jaguar Land Rover has in the past worked, and expect to continue to work, with its suppliers to optimize their procurements, including by sourcing certain raw materials and component requirements from low-cost countries.
Although we have commenced production of Ingenium four cylinder (2.0-liter) engines which will be installed in the Jaguar XE from 2015, at present we continue to source all of our engines from Ford or the joint venture between Ford and PSA on an arm’s-length basis.
Suppliers
We have an extensive supply chain for procuring various components. We also outsource many manufacturing processes and activities to various suppliers. In such cases, we provide training to external suppliers who design and manufacture the required tools and fixtures.
Our associate company, Tata AutoComp Systems Ltd., or TACO, manufactures automotive components and encourages the entry of internationally acclaimed automotive component manufacturers into India by setting up joint ventures with them.
Our other suppliers include some of the large Indian automotive supplier groups with multiple product offerings, such as the Anand Group, the Sona Group, and the TVS Group, as well as large multinational suppliers, such as Bosch, Continental, Delphi and Denso, Johnson Controls Limited for seats and Yazaki AutoComp Limited for wiring harnesses. We continue to work with our suppliers for our Jaguar Land Rover business to optimize procurements and enhance our supplier base, including for the sourcing of certain of our raw material and component requirements. In addition, the co-development of various components, such as engines, axles and transmissions also continue to be evaluated, which we believe may lead to the development of a low-cost supplier base for Jaguar Land Rover.
In India, we have established vendor parks in the vicinity of our manufacturing operations and vendor clusters have been formed at our facilities at Pantnagar and Sanand. This initiative is aimed at ensuring availability of component supplies on a real-time basis, thereby reducing logistics and inventory costs as well as reducing uncertainties in the long distance supply chain. Efforts are being taken to replicate the model at new upcoming locations as well as a few existing plant locations.
As part of our pursuit of continued improvement in procurement, we have integrated our system for electronic interchange of data with our suppliers. This has facilitated real time information exchange and processing, which enables us to manage our supply chain more effectively.
We have established processes to encourage improvements through knowledge sharing among our vendors through an initiative called the Vendor Council, which consists of our senior executives and representatives of major suppliers. The Vendor Council also helps in addressing common concerns through joint deliberations. The Vendor Council works on four critical aspects of engagement between us and the suppliers: quality, efficiency, relationships and new technology development.
We import some components that are either not available in the domestic market or when equivalent domestically-available components do not meet our quality standards. We also import products to take advantage of lower prices in foreign markets, such as special steels, wheel rims and power steering assemblies.
Ford has been and continues to makebe a major supplier of parts and services to Jaguar Land Rover. In connection with our acquisition of Jaguar Land Rover in June 2008, long-term agreements were entered into with Ford for technology sharing and joint development providing technical support across a range of technologies focused mainly around power train engineering so that we may continue to operate according to our existing business plan. Supply agreements, were entered into with Ford for (i) the long term supply of engines developed by Ford, (ii) engines developed by us but manufactured by Ford and (iii) engines from the Ford-PSA joint venture.
Following the global financial crisis and its cascading effect on the financial health of our suppliers, we have commenced efforts to assess supplier financial risk.
Suppliers are appraised based on our long-term requirements through a number of platforms such as Vendor Council meetings, council regional chapter meetings, national vendor meets and location-specific vendor meets.
Capital and Product Development Expenditures
Our capital expenditure totaled Rs.335,771 million, Rs.272,832 million and Rs.212,078 million during Fiscal 2015, 2014 and 2013, respectively. Our capital expenditure during the past three Fiscal years related primarily to new product development and capacity expansion for new and existing products to meet market demand as well as investments in new technologies through its researchtowards improving quality, reliability and development activities to develop productsproductivity that meet the requirements of the premium segment including developing sustainable technologies to improve fuel economy and reduce CO2 emissions. Please refer to Item 4.B “— Business Overview — Government Regulations” of this annual report for further details.are each aimed at increasing operational efficiency.
We intend to continue to invest in our business units in general, and in research and product development in particular, over the next several years including capital expenditures forin order to improve our ongoing projects,existing product range, develop new projects, product development programs, mergers, acquisitionsproducts and strategic alliancesplatforms and to build and expand our presenceportfolio in the passenger vehicle and commercial vehicle categories. We believe this will strengthen our position in the Indian automotive market and help us to grow our market share internationally.
As part of this future growth strategy, we plan to make investments in product development, capital expenditure in capacity enhancement, plant renewal and modernization and to pursue other growth opportunities. Our subsidiaries also have their individual growth plans and related capital expenditure plans. These expenditures are expected to be funded largely through cash generated from operations, existing investible surplus in the form of cash and cash equivalents, investment securities and other external financing sources.
Governmental Regulations
Governmental Regulations in India
Automotive Mission Plan, 2006-2016
The automotive mission plan, or Plan 2006, promulgated by the Ministry of Heavy Industries and Public Enterprises of the Government of India in December 2006, consists of recommendations to the task force of the Development Council on Automobile and Allied Industries constituted by the Government of India in relation to the preparation of the mission plan for the Indian automotive industry. Plan 2006 recommends that a negative list of items, such as no duty concessions for the import of used or remanufactured vehicles, or treatment of remanufactured automotive products as old products, should be negotiated for free trade agreements or regional trade agreements, on a case-by-case basis with other countries. It recommends the adoption of appropriate tariff policies to attract more investment into the automobile industry, the improvement of power infrastructure to facilitate faster growth of the automotive sector both domestically and internationally, policy initiatives such as encouragement of collaboration between the automotive industry and research and academic institutions, tax concessions and incentives to enhance competitiveness in manufacturing and promotion of research and technology development. For the promotion of exports in the automotive components sector, among other things, it recommends the creation of special automotive component parks in special economic zones and the creation of virtual special economic zones, which would enjoy certain exemptions on sales tax, excise duty and customs duty. Other major recommendations of the plan include strengthening the inspection and certification system by encouraging public-private partnerships and rationalization of motor vehicles regulations.
A committee set up under the chairmanship of the Secretary of the Ministry of Heavy Industries and Public Enterprises consisting of all stakeholders, including representatives of the Ministry of Finance, and of other interested parties relating to road transport, the environment, commerce, industrial policy and promotion, labor, shipping, railways, human resource development, science and technology, new and renewable energy, petroleum and natural gas and the automotive industry, will monitor the implementation and progress of Plan 2006.
As of the date of this annual report on Form 20-F, Plan 2006 is being reviewed by Ministry of Heavy Industries and Public Enterprises of the Government of India.
The Auto Policy, 2002
The Auto Policy was introduced by the Department of Heavy Industry, Ministry of Heavy Industries and Public Enterprises of the Government of India in March 2002, with the aims, among other things, of promoting a globally competitive automotive industry that would emerge as a global source for automotive components, establishing an international hub for manufacturing small, affordable passenger cars, ensuring a balanced transition to open trade at a minimal risk to the Indian economy and local industry, encouraging modernization of the industry and facilitating indigenous design, research and development, as well as developing domestic safety and environment standards on par with international standards.
Auto Fuel Vision & Policy 2025
The Ministry of Petroleum and Natural Gas constituted an expert committee under the Chairmanship of Shri Saumitra Chaudhuri, Member Planning Commission, on December 19, 2012. Its objective was to recommend auto fuel quality applicable through model year 2025. The committee in its draft report has recommended Bharat Stage IV compliant fuel across the country by 2017 and Bharat Stage V compliant fuel with 10 ppm of sulphur to be made available from 2020 onwards. The draft report proposes nationwide Bharat Stage V emission norms for new 4 wheelers from model year 2020 and for all 4 wheelers from model year 2021. It also recommends Bharat Stage VI emissions norms from 2024 onwards. In April 2014, the expert committee submitted its recommendations to the committee empowered by the Ministry of Petroleum and Natural Gas, which has proposed the advancement of emission norms by one year earlier than the expert committee’s recommendations, which would result in the implementation of Bharat Stage V emission norms starting in model year 2019 and Bharat Stage VI emissions norms starting in model year 2023.
Central Motors Vehicles Rules, 1989
Chapter V of the Central Motor Vehicle Rules, 1989, or the CMV Rules, sets forth provisions relating to construction, equipment and maintenance of motor vehicles, including specifications for dimensions, gears, indicators, reflectors, lights, horns, safety belts and others. The CMV Rules govern emission standards for vehicles operating on compressed natural gas or CNG, gasoline, liquefied petroleum gas and diesel.
On and from the date of commencement of the CMV (Amendment) Rules, 1993, every manufacturer must submit the prototype of every vehicle to be manufactured by it for testing by the Vehicle Research and Development Establishment of the Ministry of Defense of the Government of India, the Automotive Research Association of India, Pune, the Central Machinery Testing and Training Institute, Budni (MP), the Indian Institute of Petroleum, Dehradun, the Central Institute of Road Transport, Pune, the International Center for Automotive Technology, Manesar or such other agencies as may be specified by the central government for granting a certificate by that agency as to the compliance of provisions of the Motor Vehicles Act, and the CMV Rules.
The CMV Rules also require the manufacturers to comply with notifications in the Official Gazette, issued by Government of India, to use such parts, components or assemblies in the manufacture of certain vehicles according to standards specified by either the Automotive Industry Standards Committee or the Bureau of Indian Standards.
The existing CMV Rules would be replaced by the Road Transport and Safety Bill (RTSB) 2015, which is subject to legislative approval by the Parliament, which could expose us to additional liability for vehicle recalls and for manufacturer’s liability for our vehicles.
Emission and Safety in India
In 1992, the Government of India issued emission and safety standards, which were further tightened in April 1996, under the Indian Motor Vehicle Act. Currently Bharat Stage IV norms, which are equivalent to Euro IV norms, are in force for four-wheelers in 13 cities and Bharat Stage III norms, which are equivalent to Euro III norms, are in effect in the rest of India. Our vehicles comply with these norms. In 2014, the Ministry of Road Transport and Highways has extended Bharat Stage IV norms in 20 additional cities. In its draft GSR No.247 (E), dated April 1, 2015, the Ministry of Road Transport and Highways proposed the further extension of Bharat Stage IV norms in 30 additional cities starting July 1, 2015.
We are also working towards meeting all applicable regulations which we believe are likely to come into effect in various markets in the near future. Our vehicle exports to Europe comply with Euro V norms, and we believe our vehicles also comply with the various safety regulations in effect in the other international markets where we operate.
The Indian automobile industry is progressively harmonizing its safety regulations with international standards in order to facilitate sustained growth of the Indian automobile industry as well as to encourage export of automobiles from India.
India has been a signatory to the 1998 UNECE Agreement on Global Technical Regulations since April 22, 2006 and has voted in favor of all eleven Global Technical Regulations. We work closely with the Government of India to participate in WP 29 World Forum Harmonization activities.
India has a well-established regulatory framework administered by the Indian Ministry of Road Transport and Highways. The Ministry issues notifications under the CMV Rules and the Motor Vehicles Act. Vehicles manufactured in India must comply with applicable Indian standards and automotive industry standards. In January 2002, the Indian Ministry of Road Transport and Highways has finalized plans on implementing automobile safety standards. The plans are based on traffic conditions, traffic density, driving habits and road user behavior in India and is generally aimed at increasing safety requirements for vehicles under consideration for Indian markets.
The Essential Commodities Act, 1955
The Essential Commodities Act, 1955, as amended by the Essential Commodities (Amendment and Validation) Act, 2009, or the Essential Commodities Act, authorizes the Government of India, if it finds it necessary or expedient to do so, to provide for regulating or prohibiting the production, supply, distribution, trade and commerce in the specified commodities under the Essential Commodities Act, in order to maintain or increase supplies of any essential commodity or to secure their equitable distribution and availability at fair prices, or to secure any essential commodity for the defense of India or the efficient conduct of military operations. The definition of “essential commodity” under the Essential Commodities Act includes “component parts and accessories of automobiles”.
Environmental Regulations
Manufacturing units or plants must ensure compliance with environmental legislation, such as the Water (Prevention and Control of Pollution) Act, 1974, the Air (Prevention and Control of Pollution) Act, 1981, the Environment Protection Act, 1986 and the Hazardous Wastes (Management and Handling and Transboundary Movement) Rules, 2008. The basic purpose of these statutes is to control, abate and prevent pollution. In order to achieve these objectives, Pollution Control Boards, or PCBs, which are vested with diverse powers to deal with water and air pollution, have been set up in each state. The PCBs are responsible for establishing standards for maintenance of clean air and water, directing the installation of pollution control devices in industries and undertaking inspection to ensure that units or plants are functioning in compliance with the standards prescribed. These authorities also have the power of search, seizure and investigation. All of our manufacturing plants are either in possession of current, valid Consents to Operate and Hazardous Waste Authorisations or are in the process of renewing their Consents to Operate and Hazardous Waste Authorisations from the respective state PCBs of the states where they operate.
The Ministry of Environment and Forests under the Government of India receives proposals for expansion, modernization and establishment of projects and the impact of such projects on the environment are assessed by the Ministry, before it grants environmental clearances for the proposed projects under the Environmental Impact Assessment Notification and Rules. All of our manufacturing plants have obtained environmental clearances for specific projects in the past as and when mandated.
We ensure that all prescribed norms are followed for management of waste and we have made significant investments towards pollution control and environmental protection at our manufacturing plants.
Regulation of Imports and Exports
Regulation of quantitative restrictions on imports into India were liberalized with effect from April 1, 2001, pursuant to India’s World Trade Organization obligations, and imports of capital goods and automotive components were placed under the open general license category.
Automobiles and automotive components may, generally, be imported into India without a license from the Government of India subject to their meeting Indian standards and regulations, as specified by designated testing agencies. As a general matter, cars, UVs and SUVs in completely built up, or CBU, condition may be imported at 60% basic customs duty. However, cars with cost, insurance and freight value of more than US$40,000 or with engine capacities greater than 3,000 cubic centimeters for diesel variants and 2,500 cubic centimeters for gasoline variants, may be imported at a 100% basic customs duty. Commercial vehicles may be imported at a basic customs duty of 20% and components may be imported at basic customs duty ranging from at 10% to 7.5%.
The FDI Policy
Automatic approval for foreign equity investments up to 100% is allowed in the automobile manufacturing sector under the FDI Policy. See Item 10.D “—Exchange Controls” for additional information relating to restrictions on foreign investment under Indian law.
Indian Taxes
See Item 10.E “—Taxation” for additional information relating to our taxation.
Excise Duty
The Government of India imposes excise duty on cars and other motor vehicles and their chassis, which rates vary from time to time and across vehicle categories reflecting the policies of the Government of India. The chart below sets forth a summary of historical changes and the current rates of excise duty.
Change of Tax Rate | Excise Duty (per vehicle or chassis) | |||||||||||||||||||
| Small cars1 | Cars other than small cars2 | Motor vehicles for more than 13 persons | Chassis fitted with engines for vehicles of more than 13 persons | Trucks | Chassis fitted with engines for trucks | Safari, SUVs and UVs | ||||||||||||||
March 2012 | 12 | % | 24% or 27%1 | 12 | % | 15% | 12 | % | 15% | 27% | ||||||||||
May 2012 | - | - | - | 14% | - | 14% | - | |||||||||||||
March 2013 | - | - | - | - | - | 13% | 27% or 30% | |||||||||||||
February 2014 | 8 | % | 20% or 24%1 | 8 | % | 10% | 8 | % | 9% | 24% | ||||||||||
January 2015 | 12 | % | 24% or 27%1 | 12 | % | 14% | 12 | % | 13% | 27% or 30% | ||||||||||
March 2015 onwards | 12.50 | % | - | 12.50 | % | - | 12.50 | % | - | - | ||||||||||
| 1. | Small cars are cars with a length not exceeding 4,000 mm and an engine capacity not exceeding 1,500 cubic centimeters for cars with diesel engines, and not exceeding 1,200 cubic centimeters for cars with gasoline engines. The higher rate is applicable if the engine capacity exceeds 1,500 cubic centimeters. |
| 2. | Cars other than small cars are cars with a length exceeding 4000 mm with an engine capacity exceeding 1,500 cubic centimeters for diesel engines and 1,200 cubic centimeters for gasoline engines. |
| (-) | indicates no change during the relevant year. |
All vehicles and chassis are subjected to the automobile cess, which is assessed at 0.125%. Certain passenger vehicles are also subject to the National Calamity Contingent Duty, or NCCD, assessed at 1%. The education cess, assessed at 2%, and secondary and higher education cess, assessed at 1%, in addition to the excise duties indicated above, are exempted on goods starting March 1, 2015.
Value Added Tax
The Value Added Tax, or VAT, has been implemented throughout India. VAT enables set-off from sales tax paid on inputs by traders and manufacturers against the sales tax collected by them on behalf of the Government of India, thereby eliminating the cascading effect of taxation. Two main brackets of 5% and 12.5%, along with special brackets of 0%, 1%, 3%, 4%, 13.5%, 14% 14.5%, 15%, 20%, 22% and 23% have been announced for various categories of goods and commodities sold in the country and certain states have also introduced additional VAT of 1% to 3% on specified commodities, including automobiles. In some of the states, a surcharge of 5% to 10% on VAT has been introduced on automobiles. Since its implementation, VAT has had a positive impact on our business. Prior to the implementation of VAT, a major portion of sales tax paid on purchases formed part of our total cost of materials. The implementation of VAT has resulted in savings on the sales tax component, as VAT paid on inputs may generally be set-off against tax paid on outputs.
In addition to VAT, a Central Sales Tax continues to exist, although it is proposed to be abolished in a phased manner. In the Indian Union Budget 2008-09, the Central Sales Tax rate was reduced to 2%, which remained unchanged in Fiscal 2015.
Goods and Services Tax
The Government of India is proposing to reform the indirect tax system in India with a comprehensive national goods and services tax, or GST, covering the manufacture, sale and consumption of goods and services. The date of introduction of GST is expected to be as early as April 1, 2016. The proposed GST regime will combine taxes and levies by the central and state governments into one unified rate structure. There is a proposal to levy a 1% Non-Creditable Tax to be collected by the Government of India and will be appropriated to the origin state government on every interstate movement of goods. The Government of India has publicly expressed the view that following the implementation of the GST, the indirect tax on domestically manufactured goods is expected to decrease along with prices on such goods.
We have benefitted and continue to benefit from excise duty exemptions for manufacturing facilities in the state of Uttarakhand and other incentives such as subsidies or loans from other states where we have manufacturing operations. While both the Government of India and other state governments of India have publicly announced that all committed incentives will be protected following the implementation of the GST, given the limited availability of information in the public domain concerning the GST, we are unable to provide any assurance as to the effect of this or any other aspect of the tax regime following implementation of the GST.
Imposition of any additional taxes and levies by the Government of India designed to limit the use of automobiles could adversely affect the demand for our products and our results of operations.
Economic Stimulus Package and Incentives
There was a 4% cut in the central value added tax rate, or Cenvat, on cars and trucks and a 2% cut in Cenvat rate on motor vehicles for transport of more than 13 persons, including the driver. Further, in February 2009, the Cenvat rate was reduced from 10% to 8% for Trucks and buses and service tax was also reduced from 12% to 10%. The Government of India has also provided for an accelerated tax depreciation of 50% for commercial vehicles purchased between January 1 and September 30, 2009. The Cenvat rate was restored to 10% since April 1, 2010 and was further revised to 12% with effect from March 16, 2012. The Government of India has made changes in the excise duty in February 2014 which will be in effect until December 31, 2014 as follows: the Cenvat on small cars, trucks and buses reduced to 8% in February, 2014 whereas Cenvat on cars other than small cars has been reduced to 20% or 24% from 24% or 27%. The Cenvat on UVs have been reduced from 27% or 30% to 24%. The Cenvat for chassis which was increased from 12% to 14% in the budget for the Indian fiscal year 2012-2013, has since been revised to 13% in the budget for the Indian fiscal year 2013-2014 and further reduced to 9% in February 2014.
The Government of India has launched a National Electric Mobility Mission plan 2020, or NEMMP, to encourage reliable, affordable and efficient electric vehicles that meet consumer performance and price expectations. Through collaboration between the government and industry for promotion and development of indigenous manufacturing capabilities, required infrastructure, consumer awareness and technology, the NEMMP aims to help India to emerge as a leader in the electric vehicle market in the world by 2020 and contribute towards national fuel security.
Furthermore, the Ministry of Road Transport & Highways and the Bureau of Energy Efficiency in India finalized labeling regulations for the M1 category of vehicles, which includes passenger vehicles up to, less than, or equal to 10 seats.
The Government of India’s plan to encourage India’s transition to hybrid and electric mobility consists of the following initiatives:
Demand Side: Mandate use of electric vehicles in areas such as public transportation and government fleets in order to create initial demand for OEMs and provide incentives for the sales of electric vehicles to consumers.
Supply Side: Link incentives to localization of the production of key components of electric vehicle in a phased manner.
Research and Development: Fund research and development programs along with OEMs and component suppliers to develop optimal solutions for India at low cost.
Infrastructure Support: Development of pilot programs to support hybrid and/or electric vehicles and test their effectiveness and make modest investments to build public charging infrastructure to support electric vehicles, especially for buses.
Environmental, fiscal and other governmental regulations around the world
Our Jaguar Land Rover business has significant operations in the United States and Europe, which have stringent regulations relating to vehicular emissions. The proposed tightening of vehicle emissions regulations by the European Union will require significant costs of compliance for Jaguar Land Rover. While we are pursuing various technologies in order to meet the required standards in the various countries in which we operate, the costs of compliance with these required standards can be significant to our operations and may adversely impact our results of operations.
In the United Kingdom, the Bank of England base (interest) rate has been maintained at an historic low of 0.5% despite an improvement in the UK economy. The UK labor market is strengthening as unemployment continues to fall and wages rise while inflation remains low primarily reflecting low energy prices. As a result the outlook is generally positive for UK GDP as higher levels of disposable income are expected to drive consumption and the Bank of England is likely to keep interest rates lower for longer as inflation remains subdued.
Economic growth in the Eurozone remained low during Fiscal 2015 and some member states experienced mild recession. In response the European Central Bank embarked on a quantitative easing program in January 2015 and there are signs of growth as a result; however uncertainty remains over the outcome of the debt negotiations with Greece.
The U.S. economy continues to strengthen despite the adverse effects of another harsh winter impacting in the first three months of 2016. The U.S. Federal Reserve continues to taper off its quantitative easing program and, similarly to the United Kingdom, improving labor market conditions along with lower energy prices are driving increased consumption. The U.S. Federal Reserve also held interest rates at historical lows at around 0.25% during Fiscal 2015 while rates are likely to rise gradually in the near term as confidence in the stronger economic recovery gains momentum.
Greenhouse gas / CO2 / fuel economy legislation
Legislation is in place limiting passenger car fleet average greenhouse gas emissions in Europe to 130 grams of CO2 per kilometer for 100% of new cars in 2015. Different targets apply to each manufacturer based on their respective fleets of vehicles and average weight. We have received a permitted derogation from the weight-based target requirement available to small volume and niche manufacturers. As a result, we are permitted to reduce our emissions by 25% from 2007 levels rather than meeting a specific CO2 emissions by 2015. Jaguar Land Rover now has an overall 2015 target of an average of 178.0 grams of CO2 per kilometer for our full fleet of vehicles registered in the EU that year, with Jaguar Land Rover and Tata Motors Limited monitored as a single “pooled” entity for compliance with this target (for Jaguar Land Rover alone, this would be 179.8 g/km). We are in compliance with the 2013 requirement that the best 75% of our pooled fleet registered in the EU that year has met this target and the 2014 requirement that the best 80% of our pooled fleet registered in the EU has met this target, achieving an average 164.5 grams of CO2 per kilometer and 165.3 grams of CO2 per kilometer (provisional) in calendar 2013 and 2014, respectively.
Furthermore, the European Union has regulated target reductions for 95% of a manufacturer’s full fleet of new passenger cars registered in the EU in 2020 to average 95 grams of CO2 per kilometer, rising to 100% in 2021. The new rule contains an extension of the small volume and niche manufacturers’ derogation which permits us to reduce our emissions by 45% from 2007 levels rather than meet a specific CO2 emissions target by 2020. Jaguar Land Rover could apply for an overall target of 132 grams of CO2 per kilometer.
The European Union has also adopted an average emissions limit of 175 grams of CO2 per kilometer for light commercial vehicles to be phased in between 2014 and 2017. Implementation of light commercial vehicle CO2 standards affect the Defender and a small number of Freelander and Discovery vehicles. We have been granted a small volume derogation by the European Commission for alternative specific emission targets for 2014-2016 inclusive, which protects the Defender through to end of manufacturing. A further average emissions limit of 147 grams of CO2 per kilometer for light commercial vehicles has been adopted for 2020.
In the United States, both Corporate Average Fuel Economy, or CAFE, standards and greenhouse gas emissions standards are imposed on manufacturers of passenger cars and light trucks. The National Highway Traffic Safety Administration, or NHTSA, has set the federal CAFE standards for passenger cars and light trucks to meet an estimated combined average fuel economy level of 35.5 miles per U.S. gallon for 2016 model year vehicles. Meanwhile, the U.S. Environmental Protection Agency, or EPA, and NHTSA issued a joint rule to reduce the average greenhouse gas emissions from passenger cars, light trucks and medium-duty passenger vehicles for model years 2012-16 to 250 grams of CO2 per mile, which would be equivalent to 35.5 miles per U.S. gallon in model year 2016 if the requirements were met only through fuel economy improvements. The United States federal government extended this program to cars and light trucks for model years 2017 through 2025, targeting an estimated combined average emissions level of 243 grams of CO2 per mile in 2017 and 163 grams per mile in 2025, which is equivalent to 54.5 miles per gallon if achieved exclusively through fuel economy improvements. In addition, many other markets either have or will shortly define similar greenhouse gas emissions standards (including Brazil, Canada, China, the European Free Trade Association, India, Japan, Mexico, Saudi Arabia, South Korea and Switzerland).
California is empowered to implement more stringent greenhouse gas emissions standards but has elected to accept the existing U.S. federal standards for compliance with the state’s own requirements. The California Air Resources Board enacted regulations that deem manufacturers of vehicles for model years 2012 through 2016 that are in compliance with the EPA greenhouse gas emissions regulations to also be in compliance with California’s greenhouse gas emission regulations. In November 2012, the California Air Resources Board accepted the federal standard for vehicles with model years 2017-25 for compliance with the state’s own greenhouse gas emission regulations. However, California is moving forward with other stringent emission regulations for vehicles, including the Zero Emission Vehicle regulation, or ZEV. ZEV requires manufacturers to increase their sales of zero emissions vehicles year-on-year, up to an industry average of 16% of vehicles sold in the state by 2025. The precise sales required in order to meet a manufacturer’s obligation in any given model year depend on the size of the manufacturer and the level of technology sold (for example, transitional zero emission technologies, such as plug-in hybrids, can account for at least a proportion of a manufacturer’s obligation, but these technologies earn compliance credits at a different rate from pure zero-emissions vehicles). Other compliance mechanisms are available under ZEV, such as banking and trading of credits generated through the sale of eligible vehicles.
We are fully committed to meeting these standards and technology deployment plans incorporated into cycle plans are directed to achieving these standards. These plans include the use of lightweight materials, including aluminum, which will contribute to the manufacture of lighter vehicles with improved fuel efficiency, reducing parasitic losses through the driveline and improvements in aerodynamics. They also include the development and installation of smaller engines in our existing vehicles and other drivetrain efficiency improvements, including the introduction of eight-speed or nine-speed transmissions in some of our vehicles. We continue to introduce smaller vehicles such as the Jaguar XE, our most fuel-efficient Jaguar yet. The technology deployment plans also include the research, development and deployment of hybrid-electric vehicles. These technology deployment plans require significant investment. Additionally, local excise tax initiatives are a key consideration in ensuring our products meet customer needs for environmental footprint and cost of ownership concerns as well as continued access to major city centers, such as London’s Ultra Low Emission Zone and similar low emissions areas being contemplated in Paris, Berlin and Beijing.
Non-greenhouse gas emissions legislation
The European Union has adopted the latest in a series of more-stringent standards for emissions of other air pollutants from passenger and light commercial vehicles, such as nitrogen oxides, carbon monoxide, hydrocarbons and particulates. These standards have been or are being phased in from September 2009 (Euro 5) and September 2014 (Euro 6b) and September 2017 (Euro 6c) for passenger cars and from September 2010 (Euro 5), September 2015 (Euro 6b) and September 2018 for light commercial vehicles. September 2015 will see the adoption of driving emissions monitoring, while September 2017 will see such monitoring become mandatory along with a move to the new Worldwide harmonised Light-duty Test Procedure, or WLTP, coincident with Eu6c in Europe to address global concerns on more customer correlated fuel economy certified levels as well as air quality concerns, with other markets to follow. All programs are being fully engineered to enable the adoption of these new requirements.
In the United States, existing California Low-Emission Vehicle regulations and the recently adopted LEV III regulations, as well as the state’s ZEV regulations, place ever-stricter limits on emissions of particulates, nitrogen oxides, hydrocarbons, organics and greenhouse gases from passenger cars and light trucks. These regulations require ever-increasing levels of technology in engine control systems, on-board diagnostics and after treatment systems affecting the base costs of our powertrains. The new California LEV3 and ZEV regulations cover model years 2015 to 2025. Additional stringency of evaporative emissions also requires more-advanced materials and joints solutions to eliminate fuel evaporative losses, all for much longer warranty periods (up to 150,000 miles in the United States).
In addition, in April 2014, the Tier 3 Motor Vehicle Emission and Fuel Standards issued by the EPA were finalized. With Tier 3, the EPA has established more stringent vehicle emissions standards broadly aligned to California’s LEV III standards for 2017 to 2025 model year vehicles. The EPA made minor amendments to these Tier 3 standards in January 2015.
While Europe and the United States lead the implementation of these emissions programs, other nations and states typically follow on with adoption of similar regulations two to four years thereafter. For example, China’s Stage III fuel consumption regulation targets a national average fuel consumption of 6.9L/100km by 2015 and its Stage IV targets a national average fuel consumption of 5.0L/100km by 2021. In response to severe air quality issues in Beijing and other major Chinese cities, the Chinese government also intends to adopt more stringent emissions standards beginning in 2016.
To comply with the current and future environmental norms, we may have to incur substantial capital expenditures and research and development expenditures to upgrade products and manufacturing facilities, which would have an impact on our cost of production and results of operations.
Noise legislation
The European Commission adopted new rules (which apply to new homologations from July 2016) to reduce noise produced by cars, vans, buses, coaches and light and heavy trucks. Noise limit values would be lowered in two steps of each twoA-weighted decibels for vehicles other than trucks, and one A-weighted decibel in the first step and two in the second step for trucks. Compliance would be achieved over a ten-year period from the introduction of the first phase.
Vehicle safety
Vehicles sold in Europe are subject to vehicle safety regulations established by the European Union or by individual Member States. In 2009, the European Union enacted a new regulation to establish a simplified framework for vehicle safety, repealing more than 50 existing directives and replacing them with a single regulation aimed at incorporating relevant United Nations standards. The incorporation of the United Nations standards commenced in 2012, and the European Commission requires new model cars to have electronic stability control systems, has introduced regulations relating to low-rolling resistance tires, requires tire pressure monitoring systems and requires heavy vehicles to have advanced emergency braking systems and lane departure warning systems. From April 2009, the criteria for whole vehicle type approval were extended to cover all new road vehicles, to be phased in over five years depending on vehicle category. The extension clarifies the criteria applicable to small commercial vehicles. In the European Union, new safety requirements came into force from November 2012 for new vehicle types and come into force in November 2014 for all new vehicles sold in the EU market. The new mandatory measures include safety belt reminders, electric car safety requirements, easier child seat anchorages, tire pressure monitoring systems and gear shift indicators.
In the United States, NHTSA issues federal motor vehicle safety standards covering a wide range of vehicle components and systems such as airbags, seatbelts, brakes, windshields, tires, steering columns, displays, lights, door locks, side impact protection and fuel systems. We are required to test new vehicles and equipment and assure their compliance with these standards before selling them in the United States. We are also required to recall vehicles found to have defects that present an unreasonable risk to safety or which do not conform to the required Federal Motor Vehicle Safety Standards, and to repair them without charge to the owner. The financial cost and impact on consumer confidence of such recalls can be significant depending on the repair required and the number of vehicles affected. We have no investigations relating to alleged safety defects or potential compliance issues pending before NHTSA.
These standards add to the cost and complexity of designing and producing vehicles and equipment. In recent years NHTSA has mandated, among other things:
A system for collecting information relating to vehicle performance and customer complaints, and foreign recalls to assist in the early identification of potential vehicle defects as required by the Transportation Recall Enhancement, Accountability, and Documentation (TREAD) Act; and
Enhanced requirements for frontal and side impact, including a lateral pole impact.
Furthermore, the Cameron Gulbransen Kids Transportation Safety Act of 2007 (Kids and Cars Safety Act), passed into law in 2008, requires NHTSA to enact regulations related to rearward visibility and brake-to-shift interlock and requires NHTSA to consider regulating the automatic reversal functions on power windows. The costs to meet these proposed regulatory requirements may be significant.
Vehicle safety regulations in Canada are similar to those in the United States; however, many other countries have vehicle regulatory requirements which differ from those in the United States. The differing requirements among various countries create complexity and increase costs such that the development and production of a common product that meets the country regulatory requirements of all countries is not possible. Global Technical Regulations, or GTRs, developed under the auspices of the United Nations, continue to have an increasing impact on automotive safety activities, as indicated by EU legislation. In 2008, GTRs on electronic stability control, head restraints and pedestrian protection were each adopted by the UN “World Forum for the Harmonization of Vehicle Regulations”, and are now in different stages of national implementation. While global harmonization is fundamentally supported by the automobile industry in order to reduce complexity, national implementation may still introduce subtle differences into the system.
At present, India is a signatory of the 1998 UNECE Agreement on Global Technical Regulations, which makes the global technical regulations alternate standards to national regulations. The transition of finalized global technical regulations into national standards remains in progress.
Insurance Coverage
The Indian insurance industry is predominantly state-owned and insurance tariffs are regulated by the Indian Insurance Regulatory and Development Authority. We have insurance coverage which we consider reasonably sufficient to cover all normal risks associated with our operations, including business interruptions, and which we believe are in accordance with industry standards in India. We have obtained coverage for product liability for some of our vehicle models in several countries to which we export vehicles. TDCV has insurance coverage as is required and applicable to cover all normal risks in accordance with industry standards in South Korea, including product liability. We have also taken insurance coverage on directors and officers liability to minimize risks associated with international litigation for us and our subsidiaries.
Jaguar Land Rover has global insurance coverage which we consider to be reasonably sufficient to cover normal risks associated with our operations and insurance risks, including property, business interruption, marine and product/general liability and which we believe is in accordance with commercial industry standards and statutory requirements.
We are insured by insurers of recognized financial standing against such losses and risks and in such amounts as are prudent and customary in the business in which it is engaged. All such insurance is in full force and effect.
We are able to renew our existing insurance coverage, as and when such policies expire or to obtain comparable coverage from similar institutions as may be necessary or appropriate to conduct its business, as now conducted.
Export Promotion Capital Goods
Since Fiscal 1997, we have benefited from participation in the Export Promotion Capital Goods Scheme, or the EPCG Scheme, which permits us to import capital equipment under a special license at a substantially reduced customs duty. Our participation in this scheme is subject to us fulfilling an obligation to export goods manufactured or produced by the use of capital equipment imported under the EPCG Scheme to the value of a multiple of the cost plus insurance and freight value of these imports or customs duty saved over a period of 6, 8 and 12 years from the date of obtaining the special license. We currently hold 101 licenses which require us to export our products of a value of approximately Rs.81.19 billion between the years 2002 to 2021, and we carefully monitor our progress in meeting our incremental milestones. After fulfilling some of the export obligations as per provisions of Foreign Trade Policy, as at March 31, 2015 we have remaining obligations to export products of a value of approximately Rs.7.09 billion by March 2021. In the event that the export obligation under the EPCG Scheme is not fulfilled, we would have to pay the differential between the reduced and normal duty on the goods imported along with interest. In view of our past record of exceeding our export milestones, and our current plans with respect to our export markets, we do not currently foresee any impediments to meeting our export obligation in the required time frame.
Legal Proceedings
In the normal course of business, we face claims and assertions by various parties. We assess such claims and assertions and monitor the legal environment on an ongoing basis, with the assistance of external legal counsel where appropriate. We record a liability for any claims where a potential loss is probable and capable of being estimated and disclose such matters in our financial statements, if material. For potential losses which are considered reasonably possible, but not probable, we provide disclosure in the financial statements, but do not record a liability in our financial statements unless the loss becomes probable. Should any new developments arise, such as a change in law or rulings against us, we may need to make provisions in our financial statements, which could adversely impact our reported financial condition and results of operations. Furthermore, if significant claims are determined against us and we are required to pay all or a portion of the disputed amounts, there could be a material adverse effect on our business and profitability. Certain claims that are above Rs.200 million in value are described in Note 34 to our consolidated financial statements included in this annual report on Form 20-F. Certain claims that are below Rs.200 million in value pertain to indirect taxes, labor and other civil cases. There are other claims against us which pertain to motor accident claims in India (involving vehicles that were damaged in accidents while being transferred from our manufacturing plants to regional sales offices), product liability claims and consumer complaints. Some of these cases relate to replacement of parts of vehicles and/or compensation for deficiency in services provided by us or our dealers.
Capital work-in-progress as at March 31, 2014, included building under construction at Singur in West Bengal of Rs.3,098.8 million for the purposes of manufacturing automobiles. In October 2008, we moved the Nano project from Singur in West Bengal to Sanand in Gujarat. In June 2011, the newly elected Government of West Bengal (State Government) enacted a law cancelling the land lease agreement at Singur, and took over possession of the land. We challenged the constitutional validity of the law. In June 2012, the Calcutta High Court declared the law unconstitutional and restored our rights under the land lease agreement. The State Government filed an appeal in the Supreme Court of India in August 2012, which is pending disposal.
Though we continue to rigorously press our rights, contentions and claims in the matter, we have been advised that the time it may take in disposal of the appeal is uncertain. We have also been advised that we have a good case and can strongly defend the appeal, but the questions that arise are issues of constitutional law and thus the result of the appeal cannot be predicted. In these circumstances, in view of the uncertainty on the timing of resolution, following the course of prudence, the management has, in Fiscal 2015, made a provision for carrying capital cost of buildings at Singur amounting to Rs.3,098.8 million, excluding other assets (electrical installations etc.) and expenses written off / provided in earlier years, security expenses, lease rent and claim for interest on the whole amount (including Rs.3,098.8 million). We shall however continue to pursue the case and assert our rights and our claims in the Courts.
In South Korea, our union employees filed a lawsuit to include some elements of non-ordinary salary and bonus as part of “ordinary wages” for the period December 2007 to May 2011. The district court ruled in favor of the union employees on January 2013 and ordered TDCV to pay the employees KRW 17.2 billion and interest, up to the period of payment. We recorded a provision of KRW 45.8 billion (Rs.2,565 million) as at March 31, 2014, in respect of this lawsuit and consequential obligation for all employees (including non-union employees). TDCV filed an appeal against the order to the High Court of Seoul, which gave its verdict on December 24, 2014. The High Court of Seoul, following the decision of the Supreme Court in a case of an unaffiliated company, determined that some elements of non-ordinary salary were part of “ordinary wages” and the need to be paid with retrospective effect. However, based on the “Good Faith Principle” and because any retrospective payment would have high financial impact on the Company, the court determined that the bonuses and work performance salary would not be eligible for retrospective payment. Accordingly, the liability was determined at KRW 99 million and interest of KRW 20 million thereon.
Furthermore, in order to maintain the claim for the period from June 2011 to March 2014, TDCV union employees filed a case in the Seoul district court on November 24, 2014. In addition to the items included in the first lawsuit, one new item for additional 50% allowance for overtime work was added. However, after receipt of the final judgment of the Seoul High Court for the first lawsuit, which was not in their favor, the labor union decided to withdraw the second lawsuit and submitted the case withdrawal confirmation on March 19, 2015. Accordingly, the provision created as at March 31, 2014 of KRW 45.8 billion (Rs.2,643 million) has been reversed in Fiscal 2015.
The Competition Commission of India, or CCI, has initiated an inquiry against us and other car manufacturers (collectively referred to hereinafter as the OEMs) pursuant to an allegation that genuine spare parts of automobiles manufactured by the OEMs were not made freely available in the open market in India and accordingly, anti-competitive practices were carried out by the OEMs. The CCI through its order, dated August 25, 2014, held that the OEMs had violated the provisions of Section 3 and Section 4 of the Competition Act, 2002, and imposed a penalty of 2% of the average turnover for three years. Subsequently, we and other car manufacturers filed a writ petition before the Delhi High Court challenging the constitutional validity of Section 22(3) and 27(b) of the Indian Competition Act under which the order was passed and penalty imposed. The matter is currently pending before the Delhi High Court.
During the year the Group’s Brazilian subsidiary has received a demand for GBP 35 million in relation to additional indirect taxes, that is, PIS (Programa de Integração Social) and COFINS (Contribuição para Financiamento da Seguridade Social) claimed as being due on local vehicle and parts sales made in 2010. The matter is currently being contested before the Brazilian appellate authorities. Professional legal opinions we have obtained in Brazil support our position that the basis of the tax authority’s assertion is incorrect and, as a result, the likelihood of any settlement ultimately having to be made is considered remote.
We believe that none of the contingencies, would have a material adverse effect on our financial condition, results of operations or cash flows.
Tata Sons—Our Promoter and its Promoted Entities
Tata Sons holds equity interests in promoted companies engaged in a wide range of businesses. The various companies promoted by Tata Sons, including Tata Motors Limited, are based substantially in India and had combined consolidated revenues of approximately US$108.78 billion in Fiscal 2015. The businesses of Tata Sons promoted entities can be categorized under seven business sectors, namely, engineering, materials, energy, chemicals, consumer products, services, and communications and information systems.
Tata Sons-promoted entities have their origins in the trading business founded by the founder Mr. Jamsetji Tata in 1868, which was developed and expanded in furtherance of his ideals by his two sons, Sir Dorabji Tata and Sir Ratan Tata, following their father’s death in 1904. The family interests subsequently vested largely in the Sir Ratan Tata Trust, the Sir Dorabji Tata Trust and other related trusts. These trusts have been established for philanthropic and charitable purposes and together own a significant percentage of the share capital of Tata Sons.
Over the years, the operations of Tata Sons promoted entities have expanded to encompass a number of major industrial and commercial enterprises, including Indian Hotels Company Limited (1902), Tata Steel Limited, or Tata Steel (1907), one of the top ten steel manufacturers in the world, Tata Power Company Limited (1910), Tata Chemicals Limited (1939), which is the world’s second largest manufacturer of soda ash and Tata Motors Limited (1945). Other Tata entities include Voltas Limited (1954), and Tata Global Beverages Ltd, or Tata Tea Limited (1962), which is the second largest branded tea company in the world, along with itsUK-based subsidiary Tetley.
Tata Consultancy Services Limited, or TCS, a subsidiary of Tata Sons which started its operations in the 1960s as a division of Tata Sons and later converted to a listed public company, is a leading software service provider in India and exporter and the first Indian software firm to exceed sales of US$4 billion. TCS has delivery centers around the globe including in the United States, the United Kingdom, Hungary, Brazil, Uruguay and China, as well as India.
Tata Sons promoted India’s first airline, Tata Airlines, which later became Air India (India’s national carrier), as well as India’s largest general insurance company, New India Assurance Company Limited, both of which were subsequently taken over by the government as part of the Government of India’s nationalization program. In 1999, entities promoted by Tata Sons also invested in several telephone and telecommunication ventures, including acquiring a significant portion of the Government of India’s equity stake in the then state owned Videsh Sanchar Nigam Limited, which was subsequently renamed Tata Communications Limited and is one of the world’s largest wholesale voice carriers. Tata Sons promoted companies are building multinational businesses that aspire to achieve growth through excellence and innovation, while balancing the interests of shareholders, employees and society.
Some of the emerging companies promoted by Tata Sons include Titan Company, established in 1984, which is manufacturing India’s largest and best-known range of personal accessories such as watches, jewelry, sunglasses, prescription eyewear and excels in precision engineering, Tata Housing Development Company, established in 1984, a real estate developer in India, Tata AIA Life Insurance Company, established in 2001, which is a joint venture between Tata Sons and AIA Life Group Ltd Tata AIG General Insurance Company, established in 2001, which provides non-life insurance solutions to individuals, groups and corporate houses in India and Tata Capital, established in 2007, a systemically important non-deposit taking non-banking financial company, or NBFC, that fulfills the financial needs of retail and institutional customers in India.
We have for many years been a licensed user of the “Tata” brand owned by Tata Sons, and thus have both gained from the use of the Tata brand and common brand equity as well as helped to grow and sustain its brand equity. Tata Sons instituted a corporate identity program to re-position the brand to compete in a global environment. A substantial ongoing investment and recurring expenditure is undertaken by Tata Sons planned to develop and promote a strong, well-recognized and common brand equity, which is intended to represent for the consumer a high level of quality, service and reliability associated with products and services offered by the Tata Sons promoted entities.
Each of the Tata Sons promoted entities which have subscribed to the Tata Brand Equity & Business Promotion Scheme pays a subscription fee to use the “Tata” business name and trademarks and participate in and gain from the Tata brand equity as well as to avail themselves of various services including legal, human resources, economics and statistics, corporate communications and public affairs services of Tata Sons. We believe that we benefit from the use of and association with the “Tata” brand identity and accordingly, Tata Motors Limited and certain of its subsidiaries have subscribed to the Tata Brand Equity & Business Promotion Agreement and agreed to pay an annual subscription fee to Tata Sons which is in the range of 0.15%-0.25% of the annual net income (defined as net revenues exclusive of excise duties and other governmental taxes and non-operating income), subject to a ceiling of 5% of annual profit before tax (defined as profit after interest and depreciation but before income tax), each calculated on a standalone basis for these entities. In some of the past years, Tata Sons has lowered the absolute amount of subscription fee in light of its outlay for activities related to brand promotion and protection in those years. In Fiscal 2013, Tata Motors Limited on a standalone basis paid an amount less than 0.25% of its annual net income calculated in accordance with Indian GAAP and in Fiscal 2014 and 2015 no amount was paid in view of losses of Tata Motors Limited calculated on a standalone basis. Pursuant to our licensing agreement with Tata Sons, we have also undertaken certain obligations for the promotion and protection of the Tata brand identity licensed to us under the agreement. The agreement can be terminated by written agreement between the parties, by Tata Sons upon our breach of the agreement and our failure to remedy such a breach, or by Tata Sons upon providing six months’ notice for reasons to be recorded in writing. The agreement can also be terminated by Tata Sons upon the occurrence of certain specified events, including liquidation of Tata Motors Limited.
The Tata Sons promoted entities have sought to continue to follow the ideals, values and principles of ethics, integrity and fair business practices espoused by the founder of Tata Sons, Mr. Jamsetji Tata, and his successors. To further protect and enhance the Tata brand equity, these values and principles have been articulated in the Tata Code of Conduct, which has been adopted by Tata promoted entities. The Tata Trust has also made significant contributions towards national causes through promotion of public institutions in the field of science, such as the Indian Institute of Science and the Tata Institute of Fundamental Research and in the field of social services through the Tata Institute of Social Sciences, the Tata Memorial Hospital, the National Centre for the Performing Arts in Mumbai and, more recently, launchedthe Tata Medical Center at Kolkata for cancer patients set up by the Tata Trusts and supported by Tata Sons and promoted companies. The Tata Trust is one among the largest charitable foundations in India.
Some of the Tata Sons promoted entities hold shares in other companies promoted by Tata Sons. Similarly, some of our directors hold directorships on the boards of Tata Sons and/or other Tata Sons promoted entities. However, there are no voting agreements, material supply or purchase agreements or any other relationships or agreements that have the effect of binding us with other Tata Sons promoted entities at management, financial or operational levels. With the exception of Tata Steel, which under our Articles of Association has the right to appoint one director on our board of directors, neither Tata Sons nor its subsidiaries has any special contractual or other power to appoint our directors or management. They have only the voting power of their shareholdings in Tata Motors. Except as set forth in the tables below under the heading “Subsidiaries and Affiliates” and except for approximately a 16.84% equity interest in Tata Services Ltd, a 19.62% equity interest in Tata International Limited, a 12.85% equity interest in Tata Industries Limited and an 8.79% equity interest in Tata Projects Ltd, our shareholdings in other Tata Sons promoted entities are generally insignificant as a percentage of their respective outstanding shares or in terms of the amount of our investment or the market value of our shares of those companies.
Subsidiaries and Affiliates
The subsidiaries, joint operation and equity method affiliates and joint ventures of Tata Motors Limited that together with Tata Motors Limited form the Tata Motors Group under Indian Law as at March 31, 2015 are set forth in the chart below:
| 1. | Acquired a 100% equity interest in Rajasthan Leasing Private Limited with effect from January 19, 2015 and renamed it Tata Motors Finance Solutions Private Limited with effect from March 18, 2015. On June 4, 2015 was converted into a public limited company, named as Tata Motors Finance Solutions Limited. |
| 2. | Holding company of Jaguar Land Rover Automotive plc, TDCV, Tata Motors (Thailand) Limited, Tata Motors (SA) (Proprietary) Limited and PT Tata Motors Indonesia with effect from October 20, 2014. |
| 3. | These subsidiaries are based in many countries outside India. |
| 4. | Equity interest increased from 94.36% to 95.28% with effect from February 24, 2015. |
| 5. | Equity interest in its subsidiary, Tata Daewoo Commercial Vehicle Sales and Distribution Co. Ltd. is 100%. |
| 6. | Equity interest in PT Tata Motors Distribusi Indonesia subsidiary is 100% |
| 7. | The equity interests in these 14 subsidiaries range between 72.32% and 72.52%. |
| 8. | Tata Hispano Motors Carrocera SA wound down its operations with effect from September 20, 2013 and transferred its 100% equity interest in Tata Hispano Motors Carrocerries Maghreb SA with effect from June 23, 2014. |
| 9. | Converted from a public limited company into a private limited company with effect from March 5, 2015. |
| 10. | With two 100% subsidiaries in Spain of which one is presently under the process of liquidation and one affiliate in China with an equity interest of 22.48%. |
| 11. | Out of the ten subsidiaries with equity interests ranging from 13% to 26%, two are presently under the process of liquidation and four joint ventures with equity interests of 13% in each. |
| 12. | Chery Jaguar Land Rover Auto Sales Company Limited, a wholly-owned subsidiary of Chery Jaguar Land Rover Automotive Co. Ltd., whose name was changed from Suzhou Chery Jaguar Land Rover Trading Co. Ltd. (Interim JV) with effect from November 5, 2014. |
| 13. | An affiliate of Tata Technologies Limited. |
| 14. | Converted from a public limited company into a private limited company with effect from December 16, 2014. |
| 15. | Converted from a public limited company into a private limited company with effect from January 19, 2015. |
Out of the above, the following are our three significant subsidiaries as defined under Regulation S-X:
Name | Country of Incorporation | Ownership Interest / Voting Power | ||||
Jaguar Land Rover Automotive Plc | United Kingdom | 100 | % | |||
Jaguar Land Rover Limited | United Kingdom | 100 | % | |||
Jaguar Land Rover Holdings Limited | United Kingdom | 100 | % | |||
With respect to certain subsidiaries and affiliates, where Tata Motors Limited has a joint venture partner, voting on certain items of business may be based on affirmative voting provisions and board of directors participation clauses in the relevant joint venture agreement(s).
D. Property, Plants and Equipment
Facilities
We operate six principal automotive manufacturing facilities in India. The first facility was established in 1945 at Jamshedpur in the state of Jharkhand in eastern India. We had commenced construction of the second facility in 1966 (with production commencing in 1976) at Pune, in the state of Maharashtra in western India, the third facility in 1985 (with production commencing in 1992) at Lucknow, in the state of Uttar Pradesh in northern India, the fourth at Pantnagar in the state of Uttarakhand, India, which commenced operations in Fiscal 2008, the fifth at Sanand in Gujarat in western India for manufacturing of the Nano, which commenced operations in June 2010, and the sixth plant for manufacturing Tata Marcopolo buses under our joint venture with Marcopolo and LCVs at Dharwad in Karnataka (which buses are also produced at Lucknow). The Jamshedpur, Pune, Sanand, Pantnagar and Lucknow manufacturing facilities have been accredited with a ISO/TS 16949:2000(E) certification.
The manufacturing facilities of TDCV are based in Gunsan, South Korea. TDCV has received the ISO/TS 16949 certification, an international quality systems specification given by SGS UK Ltd., an International Automotive Task Force, or IATF, accredited certification body. It is the first South Korean automobile OEM to be awarded an ISO/TS 16949 certification.
Fiat India Automobiles Private Limited, our joint arrangement with Fiat Group, has its manufacturing facility located in Ranjangaon, Maharashtra. The plant is used for manufacturing Tata and Fiat branded cars and engines, and transmissions for use by both partners.
Tata Motors (Thailand) Limited is our joint venture with Thonburi Automotive Assembly Plant Co. Ltd, and has a manufacturing facility located in Samutprakarn province, Thailand. The facility is used for the manufacture and assembly of pickup trucks. Through our joint venture in Thailand, we intend on offering refreshed versions of Tata brand pickup trucks in Fiscal 2016 and to increase its product range by introducing Tata and TDCV brand M&HCV trucks in Thailand.
Through Jaguar Land Rover, we currently operate three principal automotive manufacturing facilities in the United Kingdom at Solihull, Castle Bromwich, and Halewood and have two product development facilities in the United Kingdom at Gaydon and Whitley. Most of these facilities are owned as freehold estates or are held through long-term leaseholds, generally with nominal rents.
A new advanced engine facility has been established at Wolverhampton in the United Kingdom’s Midlands area to manufacture the new family of Ingenium low-emission engines. The Wolverhampton facility, which opened in October 2014, is essential to our long-term strategic growth plans and is now producing the first of the new family of Ingenium engines, a 4-cylinder 2.0-liter engine first installed into the Jaguar XE. The GBP 500 million investment in this facility reinforces Jaguar Land Rover’s commitment to manufacturing and innovation in the United Kingdom. The facility is the first in Jaguar Land Rover’s history to be entirely designed and specified by Jaguar Land Rover and at full capacity is expected to employ up to 1,400 people. The engine plant includes an engine testing center alongside the manufacturing and assembly halls and endeavors to meet the highest standards of sustainable production, featuring a variety of energy efficiency technologies including the largest rooftop solar panel installation in the UK, comprising no fewer than 21,000 individual panels expected to generate more than 30% of the plant’s energy requirements.
The joint venture manufacturing plant for Chery Jaguar Land Rover Automotive Co. Limited, our joint venture company with Chery, in Changshu, near Shanghai, as part of a RMB 10.9 billion investment that also includes a new research and development center, was opened in October 2014 and began manufacturing the Range Rover Evoque for the local Chinese market. Retail sales began in February 2015. Construction of a new engine plant for production of fuel-efficient engines is also contemplated under the joint venture agreement.
Tata Motors (SA) (Proprietary) Limited, our joint venture with Tata Africa Holdings (SA) Pty Limited for the manufacture and assembly operations of our LCVs and M&HCVs in South Africa, owns and operates a manufacturing facility located in Rosslyn, South Africa.
Description of environmental issues that may affect our utilization of facilities
Tata and other brand vehicles
As with other participants in the automobile industry around the world, we are exposed to regulatory risks related to climate change. The design and development of fuel-efficient vehicles and vehicles running on alternative renewable energy has become a priority as a result of fossil fuel scarcity, escalating price and growing awareness about energy efficiency among customers.
We have adopted the Tata Group Climate Change Policy which addresses key climate change issues related to products, processes and services. We are committed to reduction of greenhouse gas emissions throughout the lifecycle of our products and development of fuel efficient and low greenhouse gas emitting vehicles, as an integral part of our product development and manufacturing strategy.
Considering the climate change risk, we are actively involved in partnerships with technology providers to embrace energy-efficient technologies not only for products but also for processes and are also participating actively in various national committees in India, which are working on formulating policies and regulations for improvement of the environment, including through reduction of greenhouse gases.
India, as a party to the United Nations Framework Convention on Climate Change, 1992 and its Kyoto Protocol, 1997, has been committed to addressing the global problem on the basis of the principle of “common but differentiated responsibilities and respective capabilities” of the member parties. At present, there are no legally binding targets for greenhouse gas reductions for India as it is a developing country. There are, however, opportunities for minimizing energy consumption through elimination of energy losses during manufacturing, thereby reducing manufacturing costs and increasing productivity.
In order to manage regulatory and general risks of climate change, we are increasingly investing in the design and development of fuel efficient and alternative energy vehicles, in addition to implementing new advanced technologies to increase efficiency of our internal combustion engines. We have manufactured CNG and CNG-electric hybrid versions of buses, LCVs, and the ACE Xenon, as well as a liquefied petroleum gas version of the Indica passenger vehicle.
Moreover, we are using refrigerants such as R134A in our products in order to minimize our contribution towards greenhouse gas emissions. We also ensure that no refrigerant is released to the atmosphere during any service, repair and maintenance of the air-conditioning systems of our vehicles by first recovering the refrigerant charge before the system is serviced and recharged. In addition, since 2009, we have voluntarily disclosed fuel-efficiency information for our passenger vehicles in India in accordance with a decision by SIAM. We are also continually in the process of developing products to meet the current and future emission norms in India and other countries. For example, we offer products which meet the Bharat Stage III and Bharat Stage IV norms in India and Euro V norms in International markets.
We also strive to increase the proportion of energy sourced from renewables. As one of our prime objectives, we have endeavored to incorporate environmentally sound practices in our processes, products and services. Our manufacturing facilities at Pune, Jamshedpur, Lucknow, Sanand, Dharwad and Pantnagar in India each have an Environmental Management System in place and have achieved ISO-14001 certification. We have been implementing various Environment Management Programs on energy conservation such as reduction in electricity and fuel consumption with resulting reductions in greenhouse gas emissions. We are actively working towards a shift to gas fuels to meet process heat requirements.
Jaguar Land Rover
Our production facilities are subject to a wide range of environmental, health and safety requirements. These requirements address, among other things, air emissions, wastewater discharges, accidental releases into the environment, human exposure to hazardous materials, the storage, treatment, transportation and disposal of wastes and hazardous materials, the investigation and clean-up of contamination, process safety and the maintenance of safe conditions in the workplace. Many of our operations require permits and controls to monitor or prevent pollution. We have incurred, and will continue to incur, substantial ongoing capital and operating expenditures to ensure compliance with current and future environmental, health and safety laws and regulations or their more stringent enforcement. Violations of these laws and regulations could result in the imposition of significant fines and penalties, the suspension, revocation or non-renewal of our permits, or the closure of our plants. Other environmental, health and safety laws and regulations could impose restrictions or onerous conditions on the availability or the use of raw materials we need for our manufacturing process.
Our manufacturing process results in the emission of greenhouse gases such as CO2. The EU Emissions Trading Scheme, or EUETS, an EU-wide system in which allowances to emit greenhouse gases are issued and traded, is now in Phase 3 (2013 to 2020). We have managed our EUETS allowances during previous phases of the EUETS scheme and use these remaining allowances from these earlier phases to meet our compliance requirements. The automotive sector has also been given recognition of being at risk of carbon leakage in accordance with the EUETS rules. This means that we will receive an increase in free allowances from 2015 and 2019. As a consequence of these actions, we currently project that we will reach the end of Phase 3 without the need to purchase EUETS carbon allowances. In Phase 4 of the scheme, from 2020 to 2027, all organizations in the EUETS scheme will see free allowances diminish to zero by 2027, so we project that we will purchase EUETS allowances in Phase 4 of the scheme.
We have a Climate Change Agreement which covers our manufacturing energy use. This requires us to deliver a 15% reduction in energy use per vehicle by 2020 compared to the 2008 baseline. Our projections show that we are on track to achieve this target and consequently will not need to purchase carbon allowances under this scheme.
We are also registered as a participant in the Carbon Reduction Commitment Energy Efficiency Scheme, which regulates emissions from electricity and gas use primarily in our non-manufacturing activities in the United Kingdom.
Many of our sites have an extended history of industrial activity. We may be required to investigate and remediate contamination at those sites, as well as properties we formerly operated, regardless of whether we caused the contamination or the activity causing the contamination was legal at the time it occurred. For example, some of our buildings at our Solihull plant and other plants in the United Kingdom are undergoing an asbestos-removal program in connection with ongoing refurbishment and rebuilding. In connection with contaminated properties, as well as our operations generally, we also could be subject to claims by government authorities, individuals and other third parties seeking damages for alleged personal injury or property damage resulting from hazardous substance contamination or exposure caused by our operations, facilities or products. The discovery of previously unknown contamination, or the imposition of new obligations to investigate or remediate contamination at our facilities, could result in substantial unanticipated costs. We could be required to establish or substantially increase financial reserves for such obligations or liabilities and, if we fail to accurately predict the amount or timing of such costs, the related adverse impact on our business, financial condition or results of operations could be material.
Production Capacity
The following table shows our production capacity as at March 31, 2015 and production levels by plant and product type in Fiscal 2015 and 2014:
| As at March 31, 2015 | Year ended March 31, | |||||||||||
| Production Capacity | 2015 | 2014 | ||||||||||
| Production (Units) | ||||||||||||
Tata Motors Plants in India1 | ||||||||||||
Medium and Heavy Commercial Vehicles, Light Commercial Vehicles, Utility Vehicles, Passenger Cars, | 1,637,000 | 458,339 | 513,442 | |||||||||
Jaguar Land Rover2 5 | ||||||||||||
Utility Vehicles, Passenger Cars | 638,209 | 470,536 | 439,120 | |||||||||
Other Subsidiary companies plants (excluding Jaguar Land Rover)3 | ||||||||||||
Medium & Heavy Commercial Vehicles, buses, bus bodies and pickup trucks | 58,250 | 23,670 | 22,162 | |||||||||
Joint operations4 (Passenger Vehicles) | 100,000 | 32,298 | 30,702 | |||||||||
| 1. | This refers to estimated production capacity on a double shift basis for all plants (except the Uttarakhand plant for which capacity is on three shift basis) for the manufacture of vehicles and replacement parts. |
| 2. | Production capacity is on a three shift basis. |
| 3. | The plants are located in South Korea, Morocco, South Africa and Thailand. Production capacity of plants at Morocco are on a single-shift basis. |
| 4. | Excludes production of engines/powertrains. |
| 5. | Excludes capacity at Chery Jaguar Land Rover Automotive Company Limited. |
Properties
We produce vehicles and related components and carry out other businesses through various manufacturing facilities. In addition to our manufacturing facilities, our properties include sales offices and other sales facilities in major cities, repair service facilities and research and development facilities.
The following table sets forth information, with respect to our principal facilities, a substantial portion of which are owned by us as at March 31, 2015. The remaining facilities are on leased premises.
Location | Facility or Subsidiary / Joint Operations Name | Principal Products or Functions | ||
| India | ||||
| In the State of Maharashtra | ||||
Pune (Pimpri, Chinchwad, Chikhali1, Maval) | Tata Motors Limited | Automotive vehicles, components and research and development | ||
| Pune (Chinchwad) | TAL Manufacturing Solutions Ltd. | Factory automation equipment and services | ||
| Pune (Hinjewadi)1 | Tata Technologies Ltd. | Software consultancy and services | ||
| Mumbai, Pune | Tata Motors Limited/Concorde Motors (India) Ltd./TMFL | Automobile sales and service and vehicle financing | ||
| Nagpur1 | TAL Manufacturing Solutions Ltd. | Production of advanced composite floor beams, including machining of metal fittings for Boeing 787 Dreamliner | ||
| Satara | Tata Cummins Pvt. Ltd. | Automotive engines | ||
| Pune (Ranjangaon) | Fiat India Automobiles Pvt. Ltd. | Automotive vehicles and components | ||
| In the State of Jharkhand | ||||
| Jamshedpur | Tata Motors Limited | Automotive vehicles, components and research and development | ||
| Jamshedpur | TML Drivelines Ltd. | Axles and transmissions for M&HCVs | ||
| Jamshedpur | Tata Cummins Pvt. Ltd. | Automotive engines | ||
| In the State of Uttar Pradesh | ||||
| Lucknow1 | Tata Motors Limited | Automotive vehicles, parts and research and development | ||
| Tata Marcopolo Motors Ltd. | Bus bodies | |||
| In the State of Karnataka | ||||
| Dharwad | Tata Motors Limited | Automotive vehicles, components, spare parts and warehousing | ||
| Tata Marcopolo Motors Ltd. | Bus body manufacturing | |||
| Bengaluru2 | Concorde Motors (India) Ltd. | Automobile sales and service | ||
| In the State of Uttarakhand | ||||
| Pantnagar1 | Tata Motors Limited | Automotive vehicles and components | ||
| In the State of Gujarat | ||||
| Sanand | Tata Motors Limited | Automotive vehicles and components | ||
| Rest of India | ||||
| Hyderabad2 & Chennai(1) | Concorde Motors (India) Ltd. | Automobile sales and service | ||
| Cochin, Delhi | Concorde Motors (India) Ltd. | Automobile sales and service | ||
| Various other properties in India | Tata Motors Limited/Tata Motors Finance Ltd. | Vehicle financing business (office/ residential) | ||
| Outside India | ||||
| Singapore | Tata Technologies Pte Ltd. | Software consultancy and services | ||
| Republic of Korea | TDCV | Automotive vehicles, components and research and development | ||
| Thailand | Tata Motors (Thailand) Ltd. | Pick-up trucks | ||
| Tata Technologies (Thailand) Ltd. | Software consultancy and services | |||
| United Kingdom | Tata Motors European Technical Centre | Engineering consultancy and services | ||
| United Kingdom | INCAT International PLC, Tata Technologies Europe Ltd and Cambric UK Ltd | Software consultancy and services | ||
Location | Facility or Subsidiary / Joint Operations Name | Principal Products or Functions | ||
| United Kingdom | ||||
Solihull | Jaguar Land Rover Ltd | Automotive vehicles and components | ||
Castle Bromwich | Jaguar Land Rover Ltd | Automotive vehicles and components | ||
Halewood | Jaguar Land Rover Ltd | Automotive vehicles and components | ||
Gaydon | Jaguar Land Rover Ltd | Research and product development | ||
Whitley | Jaguar Land Rover Ltd | Headquarters and research and product development | ||
Wolverhampton | Jaguar Land Rover Ltd | Engine manufacturing | ||
| Spain | Tata Hispano Motors Carrocera S.A. | Bus body service | ||
| Morocco | Tata Hispano Motors Carrocerries Maghreb SA | Bus body manufacturing and service | ||
| South Africa | Tata Motors (SA) (Proprietary) Limited | Manufacture and assembly operations of vehicles | ||
| Indonesia | PT Tata Motors Indonesia | Distribution of vehicles | ||
| Rest of the world | ||||
Various (United States, UK, China, Europe, Australia etc.) | Tata Technologies Ltd. | Software consultancy and services | ||
| Jaguar Land Rover3 | National sales companies | |||
| Regional sales offices |
| Note: | Excludes facilities held by our joint ventures, including the manufacturing plant held by Jaguar Land Rover Automotive Company Limited. |
| 1. | Land at each of these locations is held under an operating lease. |
| 2. | Some of the facilities are held under an operating lease and some are owned. |
| 3. | National sales companies are held by various subsidiaries of the Jaguar Land Rover group of companies. |
Substantially all of our owned properties are subject to mortgages in favor of secured lenders and debenture trustees for the benefit of secured debenture holders. A significant portion of our property, plant and equipment, except those in the United Kingdom, is pledged as collateral securing indebtedness incurred by us. We believe that there are no material environmental issues that may affect our utilization of these assets.
We have additional property interests in various locations around the world for limited manufacturing, sales offices, and dealer training and testing. The majority of these are housed within leased premises.
For further details regarding the current legal proceedings with respect to the leased land in West Bengal, please refer to Item 4.B “—Business Overview—Legal Proceedings” of this annual report on Form 20-F.
We consider all of our principal manufacturing facilities and other significant properties to be in good condition and adequate to meet the needs of our operations.
| Item 4A. | Unresolved Staff Comments |
None.
| Item 5. | Operating and Financial Review and Prospects |
You should read the following discussion of our financial condition and results of operations together with our consolidated financial statements prepared in conformity with IFRS and information included in this annual report on Form 20-F. This discussion and analysis contains forward-looking statements that involve risks, uncertainties and assumptions. Our actual results may differ materially from those anticipated in these forward-looking statements as a result of various factors including, but not limited to, those set forth in Item 3.D and elsewhere in this annual report on Form 20-F.
All financial information discussed in this section is derived from our audited financial statements included in this annual report on Form 20-F, which have been prepared in accordance with International Financial Reporting Standards as issued by the International Accounting Standards Board.
Overview
In Fiscal 2015, our total revenue (net of excise duties), including finance revenues, increased by 12.1% to Rs.2,625,265 million from Rs.2,341,761 million in Fiscal 2014. We recorded a net income (attributable to our shareholders) of Rs.128,291 million in Fiscal 2015, representing a decrease by 1.9% or Rs.2,426 million over net income in Fiscal 2014 of Rs.130,717 million.
Automotive operations
Automotive operations are our most significant segment, accounting for 99.5%, 99.5% and 99.4% of our total revenues in Fiscal 2015, 2014, and 2013, respectively. In Fiscal 2015, revenue from automotive operations before inter-segment eliminations was Rs.2,612,303 million, as compared to Rs.2,329,582 million in Fiscal 2014 and Rs.1,881,621 million in Fiscal 2013.
Our automotive operations include:
All activities relating to the development, design, manufacture, assembly and sale of vehicles as well as related spare parts and accessories;
Distribution and service of vehicles; and
Financing of our vehicles in certain markets.
Our automotive operations segment is further divided into Tata and other brand vehicles (including financing thereof), and Jaguar Land Rover. In Fiscal 2015, Jaguar Land Rover contributed 82.9% of our total automotive revenue compared to 81.3% in Fiscal 2014 and 72.5% in Fiscal 2013 (before intra-segment elimination) and the remaining 17.1% was contributed by Tata and other brand vehicles in Fiscal 2015 compared to 18.7% in Fiscal 2014 and 27.5% in Fiscal 2013. The increase in Jaguar Land Rover revenue includes a translation gain from GBP to Indian rupees. For further detail see Item 5.A “—Operating Results—Fiscal 2015 Compared to Fiscal 2014—Revenue.”
Other Operations
Our other operations business segment mainly includes information technology services, machine tools and factory automation solutions. Our revenue from other operations before inter-segment eliminations was Rs.27,152 million in Fiscal 2015, an increase of 8.7% from Rs.24,989 million in Fiscal 2014. Revenues from other operations represented 1.0%, 1.1% and 1.2% of our total revenues, before inter-segment eliminations, in Fiscal 2015, 2014 and 2013, respectively. Earnings before other income, interest and tax before inter-segment eliminations (segment earnings), were Rs.3,448 million in Fiscal 2015 and Rs.2,634 million and Rs.3,294 million in Fiscal 2014 and 2013, respectively.
Geographical breakdown
We have pursued a strategy of increasing exports of Tata and other brand vehicles to new and existing markets. Improved market sentiment in certain countries to which we export and a strong portfolio of Jaguar Land Rover vehicles has enabled us to increase its sales in these international markets in Fiscal 2015. Sales in China, which is its second largest single market in terms of volumes, after India, increased by 15.5% in Fiscal 2015. However, sales in China decreased by 20.4% in the fourth quarter of Fiscal 2015 to 23,526 units from 29,567 units in the same period in Fiscal 2014. The performance of our subsidiary in South Korea, TDCV, and TTL, our specialized subsidiary engaged in engineering, design and information technology services, contributed to its revenue from international markets. The proportion of our net sales earned from markets outside of India has increased marginally to 86.2% in Fiscal 2015 from 84.4% in Fiscal 2014.
The following table sets forth our revenue from our key geographical markets:
| Year ended March 31, | ||||||||||||||||||||||||
| 2015 | 2014 | 2013 | ||||||||||||||||||||||
Revenue | Rs. in million | Percentage | Rs. in million | Percentage | Rs. in million | Percentage | ||||||||||||||||||
India | 361,206 | 13.8 | % | 364,591 | 15.6 | % | 453,276 | 23.9 | % | |||||||||||||||
China | 758,085 | 28.9 | % | 656,138 | 28.0 | % | 446,508 | 23.6 | % | |||||||||||||||
United Kingdom | 351,527 | 13.4 | % | 290,162 | 12.4 | % | 224,604 | 11.9 | % | |||||||||||||||
United States of America | 314,009 | 12.0 | % | 266,436 | 11.4 | % | 189,007 | 10.0 | % | |||||||||||||||
Rest of Europe | 317,303 | 12.1 | % | 292,378 | 12.4 | % | 221,035 | 11.7 | % | |||||||||||||||
Rest of the World | 523,135 | 19.8 | % | 472,056 | 20.2 | % | 358,480 | 18.9 | % | |||||||||||||||
|
|
|
|
|
| |||||||||||||||||||
Total | 2,625,265 | 2,341,761 | 1,892,910 | |||||||||||||||||||||
|
|
|
|
|
| |||||||||||||||||||
The Rest of Europe market is geographic Europe, excluding the United Kingdom and Russia. The Rest of the World market is any region not included above.
Significant Factors Influencing Our Results of Operations
Our results of operations are dependent on a number of factors, which mainly include the following:
| • | General economic conditions. We, similar to other participants in the automotive industry, are materially affected by general economic conditions. See Item 3.D “—Risk Factors—Risks associated with Our Business and the Automotive Industry”. |
| • | Interest rates and availability of credit for vehicle purchases. Our volumes are significantly dependent on availability of vehicle financing arrangements and their associated costs. For further discussion of our credit support programs, see Item 4.B “—Business Overview—Automotive Operations”. |
| • | Excise duties and sales tax rates. In India, the excise and sales tax rate structures affect the cost of vehicles to the end user and, therefore, impacts demand significantly. For a detailed discussion regarding tax rates applicable to us, please see Item 4.B “—Business Overview—Government Regulations—Excise Duty”. |
| • | Our competitive position in the market. For a detailed discussion regarding our competitive position, see Item 4.B “—Business Overview—Automotive Operations—Tata and other brand vehicles—Competition”. |
| • | Cyclicality and seasonality. Our results of operations are also dependent on the cyclicality and seasonality in demand in the automotive market. For a detailed discussion on seasonal factors affecting our business, please see Item 4.B “Business Overview—Automotive Operations—Tata and other brand vehicles—Seasonality” and 4.B “Business Overview—Automotive Operations—Jaguar Land Rover—Seasonality”. |
| • | Environmental Regulations. Governments in the various countries in which we operate are placing a greater emphasis on raising emission and safety standards for the automobile industry. Compliance with applicable environmental and safety laws, rules, regulations and standards will have a significant impact on costs and product life cycles in the automotive industry. For further details with respect to these regulations, please see Item 4.B “—Business Overview—Government Regulations”. |
| • | Foreign Currency Rates. Our operations and our financial position are quite sensitive to fluctuations in foreign currency exchange rates. Jaguar Land Rover earns significant revenue in the United States, Europe and China, and also sources a significant portion of its input material from Europe. Thus, any exchange rate fluctuations of GBP to Euro, GBP to U.S. dollars and GBP to other currencies would affect our financial results. We have significant borrowings in foreign currencies denominated mainly in U.S. dollars. Our consolidated financial results are affected by foreign currency exchange fluctuations through both translation and transaction risks. Changes in foreign currency exchange rates may positively or negatively affect our revenues, results of operations and net income. To the extent that our financial results for a particular period will be affected by changes in the prevailing exchange rates at the end of the period, such fluctuations may have a substantial impact on comparisons with prior periods. Furthermore, Jaguar Land Rover constitutes a major portion of consolidated financial position, the figures of which are translated into Indian rupees. However, the translation effect is a reporting consideration and does not impact our underlying results of operations.Please see Item 11 “Quantitative and Qualitative Disclosures About Market Risk” and Note 36(d) (i) – (a) to our consolidated financial statements included elsewhere in this annual report on Form 20-F for further detail on our exposure to fluctuations in foreign currency exchange rates. |
| • | Political and Regional Factors. As with to the rest of the automotive industry, we are affected by political and regional factors. For a detailed discussion regarding these risks, please see Item 3.D “Key Information—Risk Factors—Political and Regulatory Risks.” |
Results of operations
The following table sets forth selected items from our consolidated statements of income for the periods indicated and shows these items as a percentage of total revenues:
| Percentage of Total Revenue | ||||||||||||||||||||
| Year ended March 31, | Percentage Change | |||||||||||||||||||
| 2015 | 2014 | 2013 | 2014 to 2015 | 2013 to 2014 | ||||||||||||||||
Total revenues | 100 | % | 100 | % | 100 | % | 12.1 | % | 23.7 | % | ||||||||||
Raw materials, components and purchase of product for sale (including change in inventories) | 61.0 | 61.7 | 63.5 | 10.8 | 20.3 | |||||||||||||||
Employee cost | 9.5 | 9.1 | 8.8 | 17.1 | 28.0 | |||||||||||||||
Other expenses | 20.8 | 21.3 | 20.3 | 9.4 | 29.7 | |||||||||||||||
Depreciation and amortization | 5.1 | 4.7 | 4.0 | 21.8 | 45.8 | |||||||||||||||
Expenditure capitalized | -5.8 | -5.8 | -5.4 | 13.3 | 32.7 | |||||||||||||||
Other (income)/loss (net) | -0.4 | -0.3 | -0.6 | 48.8 | -36.1 | |||||||||||||||
Interest income | -0.3 | -0.3 | -0.4 | 1.6 | -3.9 | |||||||||||||||
Interest expense (net) | 2.0 | 2.3 | 2.2 | -1.6 | 30.2 | |||||||||||||||
Foreign exchange (gain)/loss (net) | 0.5 | -0.8 | 0.8 | 166.4 | -221.2 | |||||||||||||||
Impairment of an equity accounted investee | — | 0.3 | — | -100.0 | 100.0 | |||||||||||||||
Share of (profit)/loss of equity accounted investees | 0.1 | 0.1 | — | * | -6.9 | 1,327.8 | ||||||||||||||
Net income before tax | 7.5 | 7.7 | 6.8 | 10.5 | 39.3 | |||||||||||||||
Income tax expense | -2.6 | -2.1 | -2.1 | 43.4 | 22.9 | |||||||||||||||
Net income | 4.9 | 5.6 | 4.7 | -1.6 | 46.5 | |||||||||||||||
Net income attributable to shareholders of Tata Motors Limited | 4.9 | 5.6 | 4.7 | -1.9 | 47.4 | |||||||||||||||
Net income attributable to non-controlling interests | — | * | — | * | — | * | 71.4 | % | -47.9 | % | ||||||||||
| * | Less than 0.1 |
The following table sets forth selected data regarding our automotive operations (Tata and other brand vehicles (including financing thereof) and Jaguar Land Rover) for the periods indicated and the percentage change from period-to-period (before inter-segment eliminations):
| Year ended March 31, | Percentage Change | |||||||||||||||||||
| 2015 | 2014 | 2013 | 2014 to 2015 | 2013 to 2014 | ||||||||||||||||
Total revenues (Rs. million) | 2,612,303 | 2,329,582 | 1,881,621 | 12.1 | % | 23.8 | % | |||||||||||||
Earnings before other income, interest and tax (Rs. million) | 244,551 | 207,396 | 164,207 | 17.9 | % | 26.3 | % | |||||||||||||
Earnings before other income, interest and tax (% to total revenue) | 9.4 | % | 8.9 | % | 8.7 | % | ||||||||||||||
The following table sets forth selected data regarding our other operations for the periods indicated and the percentage change from period-to-period (before inter-segment eliminations):
| Year ended March 31, | Percentage Change | |||||||||||||||||||
| 2015 | 2014 | 2013 | 2014 to 2015 | 2013 to 2014 | ||||||||||||||||
Total revenues (Rs. million) | 27,152 | 24,989 | 22,179 | 8.7 | % | 12.7 | % | |||||||||||||
Earnings before other income, interest and tax (Rs. million) | 3,448 | 2,634 | 3,294 | 30.9 | % | -20.0 | % | |||||||||||||
Earnings before other income, interest and tax (% to total revenue) | 12.7 | % | 10.5 | % | 14.9 | % | ||||||||||||||
Fiscal 2015 Compared to Fiscal 2014
Revenue
Our total consolidated revenue (net of excise duty, where applicable), including finance revenue, increased by 12.1% to Rs.2,625,265 million in Fiscal 2015 from Rs.2,341,761 million in Fiscal 2014.
The increase in revenue was primarily driven by our Jaguar Land Rover business, where revenue increased by 14.3% to Rs.2,165,673 million in Fiscal 2015 from Rs.1,894,590 million in Fiscal 2014 due to volume increases across products and markets. The increase in revenue also reflects an increase on account of a foreign currency translation gain from GBP to Indian rupees of Rs.30,187 million pertaining to Jaguar Land Rover. The increase in revenue of Rs.240,896 million at our Jaguar Land Rover business (excluding translation impact) was mainly attributable to an increase in sales of the new Range Rover Sport, Range Rover Evoque and new Range Rover from 223,517 units in Fiscal 2014 to 271,043 units in Fiscal 2015, an increase of 21.3%, which was offset by a marginal reduction in sales of Jaguar-brand vehicles to 78,083 units in Fiscal 2015 from 80,644 units in Fiscal 2014. The increase in revenue pertaining to Jaguar Land Rover in Fiscal 2015 was also attributable to an indirect tax incentive by Jaguar Land Rover of Rs.13,054 million as compared to Rs.8,463 million in Fiscal 2014.
The increase in revenue was also attributable to an increase in revenue of Tata and other brand vehicles (including financing thereof) by 2.8% to Rs.447,218 million in Fiscal 2015 from Rs.435,012 million in Fiscal 2014.
Our revenues from sales of vehicles and spares manufactured in India increased by 5.2% to Rs.362,214 million in Fiscal 2015 from Rs.344,369 million in Fiscal 2014. The increase was mainly attributable to increased revenues of M&HCVs (in India), which increased by 28.5% to Rs.166,263 million in Fiscal 2015 from Rs.129,350 in Fiscal 2014. Furthermore, revenue attributable to passenger cars increased by 22.5% to Rs.37,196 million in Fiscal 2015 from Rs.30,370 million in Fiscal 2014. These were offset by a decrease in revenue attributable to LCVs by 8% to Rs.68,890 million in Fiscal 2015 from Rs.74,900 million in Fiscal 2014. Revenue attributable to utility vehicles decreased by 5.5% to Rs.13,051 million in Fiscal 2015 from Rs.13,810 million in Fiscal 2014.
Revenue from our vehicle financing operations decreased by 24.3% to Rs.22,631 million in Fiscal 2015 as compared to Rs.29,876 million in Fiscal 2014, due to lower vehicle financing activity and an increase in defaults.
Revenue attributable to TDCV, our subsidiary company engaged in design, development and manufacturing of M&HCVs, increased by 15.7% to Rs.55,015 million in Fiscal 2015 from Rs.47,533 million in Fiscal 2014.
Revenue (net of excise duty, where applicable) from other operations, before inter-segment eliminations, increased by 8.7% to Rs.27,152 million in Fiscal 2015 from Rs.24,989 million in Fiscal 2014, and represents 1.0% and 1.1% of our total revenues, before inter-segment eliminations, in Fiscal 2015 and 2014, respectively.
Cost and Expenses
Raw Materials, Components and Purchase of Products for Sale (including change in stock) (material costs)
Material costs increased by 10.8% to Rs.1,601,056 million in Fiscal 2015 from Rs.1,444,946 million in Fiscal 2014. The increase in absolute terms in material costs in Fiscal 2015 was mainly attributable to increased volumes at our Jaguar Land Rover business and includes an unfavorable foreign currency translation from GBP to Indian rupees for Jaguar Land Rover operations which resulted in an increase in material costs of Rs.19,432 million in Fiscal 2015 compared to Fiscal 2014.
At our Jaguar Land Rover operations, material costs in Fiscal 2015 increased by 13.0% to Rs.1,304,221 million from Rs.1,154,510 million in Fiscal 2014. Material costs at our Jaguar Land Rover operations as a percentage of revenue decreased to 60.3% in Fiscal 2015 from 61.4% in Fiscal 2014 (in GBP terms). Material costs attributable to our Jaguar Land Rover operations increased by Rs.107,668 million in Fiscal 2015 due to an increase in volume of sales and an increase in duties by Rs.13,340 million, mainly due to increased sales to China. However, as a percentage of revenue attributable to our Jaguar Land Rover operations, duties decreased from 10.4% in Fiscal 2014 to 9.9% in Fiscal 2015, due to an increase in sales in China of our 2.0 liter engines which attracts a lower duty. Furthermore, the decrease in material cost as a percentage to revenue was mainly due to cost reduction programs undertaken by Jaguar Land Rover of approximately GBP 206 million (Rs.20,311 million) and positive movement of foreign currency rates applicable for sourcing countries of GBP 301 million (Rs.29,678 million).
Material costs for Tata and other brand vehicles has also increased by 4.8% to Rs.291,206 million in Fiscal 2015 from Rs.277,820 million in Fiscal 2014. However, material costs as a percentage of revenue (excluding finance revenue) was 68.6% in Fiscal 2015 and 2014.
At our India operations, material costs have increased by 22% to Rs.111,823 million in Fiscal 2015 as compared to Rs.91,673 million in Fiscal 2014 for M&HCVs and by 17.9% to Rs.31,957 million in Fiscal 2015 as compared from Rs.27,105 million in Fiscal 2014 for passenger cars. Material costs has decreased by 25% to Rs.42,531 million in Fiscal 2015 as compared to Rs.56,684 million in Fiscal 2014 for LCVs and by 13.5% to Rs.11,228 million in Fiscal 2015 as compared from Rs.12,979 million in Fiscal 2014 for utility vehicles.
Material costs have increased by 14.9% to Rs.39,177 million in Fiscal 2015 as compared to Rs.34,102 million in Fiscal 2014 for TDCV due to increased sales. The increase is also due to an unfavourable foreign currency translation from KRW to Indian rupees of Rs.1,348 million. However, material costs as a percentage of revenue (excluding finance revenue) were 71.2% in Fiscal 2015 and 71.7% in Fiscal 2014.
Employee Costs
Our employee costs increased by 17.1% in Fiscal 2015 to Rs.250,401 million from Rs.213,903 million in Fiscal 2014, including the foreign currency translation impact from GBP to Indian rupees discussed below. Our permanent headcount increased by 6.7% as at March 31, 2015 to 73,485 employees from 68,889 employees as at March 31, 2014, and the average temporary headcount increased by 14.1% to 40,213 employees in Fiscal 2015 from 35,260 employees in Fiscal 2014.
The employee cost at Jaguar Land Rover increased by 21.4% to Rs.194,467 million in Fiscal 2015 from Rs.160,147 million in Fiscal 2014. This increase includes an unfavorable foreign currency translation from GBP to Indian rupees of Rs.3,076 million. In GBP terms, employee costs at Jaguar Land Rover increased to GBP 1,977 million in Fiscal 2015 from GBP 1,654 million in Fiscal 2014. The employee cost at Jaguar Land Rover as a percentage to revenue increased to 9.0% in Fiscal 2015 from 8.5% in Fiscal 2014. Due to consistent increases in volumes and to support new launches and product development projects, Jaguar Land Rover increased its average permanent headcount by 7.8% as at March 31, 2015 to 24,902 employees from 23,111 employees as at March 31, 2014, and the average temporary headcount increased by 49.2% to 7,225 employees in Fiscal 2015 from 4,842 employees in Fiscal 2014. The increase in employee cost was also due to wage negotiations in November 2014 for Jaguar Land Rover plant workers. Total number of permanent employees as at March 31, 2015 was 27,004 as compared to 22,186 as at March 31, 2014 for Jaguar Land Rover.
The employee cost for Tata and other brand vehicles (including financing thereof) increased by 2.8% to Rs.43,922 million in Fiscal 2015 from Rs.42,739 million in Fiscal 2014.
For our India operations, employee costs increased by 8.5% to Rs.36,547 million in Fiscal 2015 from Rs.33,672 million in Fiscal 2014. We incurred Rs.930 million in Fiscal 2015 towards an employee early-separation scheme, as compared to Rs.535 million in Fiscal 2014. Excluding the employee early-separation charge, the employee cost increased by 7.5% to Rs.35,617 million in Fiscal 2015 from Rs.33,137 million in Fiscal 2014, mainly due to regular annual increases in salary. The permanent headcount decreased marginally by 3.1% as at March 31, 2015 to 37,243 employees from 38,434 employees as at March 31, 2014, which was driven by efforts to rationalize employee costs across our India operations. For our India operations, the average temporary headcount increased by 3.0% to 27,772 employees in Fiscal 2015 from 26,973 employees in Fiscal 2014.
Employee costs at TDCV decreased by 22.1% to Rs.4,493 million in Fiscal 2015 from Rs.5,771 million in Fiscal 2014. The decrease of employee costs attributable to TDCV during Fiscal 2015 was mainly due to the reversal of Rs.2,643 million, following the resolution of the lawsuit filed by TDCV union employees. Please see Item 4.B “—Business Overview—Legal Proceedings” of this annual report on Form 20-F for further details on the lawsuit filed by TDCV union employees.
In Fiscal 2014, we closed the manufacturing operations at Tata Hispano Motors Carrocera S.A. and paid Euro 12.4 million (Rs.1,006 million) as employee separation costs. The closure was triggered by sustained underperformance that was mainly attributable to challenging market conditions in the regions where Hispano operates.
Other Expenses
Other expenses increased by 9.4% to Rs.545,910 million in Fiscal 2015 from Rs.498,778 million in Fiscal 2014. This increase mainly reflects an increase of volumes at Jaguar Land Rover and an unfavorable foreign currency translation of GBP to Indian rupees of Rs.6,694 million pertaining to Jaguar Land Rover. As a percentage of total revenues, these expenses decreased to 20.8% in Fiscal 2015 from 21.3% in Fiscal 2014. The major components of expenses are as follows:
| Percentage of Total Revenue | ||||||||||||||||||||
| Year ended March 31, | Change | Year ended March 31, | ||||||||||||||||||
| 2015 | 2014 | 2015 | 2014 | |||||||||||||||||
| (Rs. in millions) | ||||||||||||||||||||
Freight and transportation expenses | 84,309 | 75,439 | 11.8 | % | 3.2 | % | 3.2 | % | ||||||||||||
Works operation and other expenses | 213,280 | 186,067 | 14.6 | 8.1 | 7.9 | |||||||||||||||
Publicity | 85,773 | 81,425 | 5.3 | 3.3 | 3.5 | |||||||||||||||
Allowance for trade and other receivables, and finance receivables | 25,597 | 26,830 | -4.6 | 1.0 | 1.1 | |||||||||||||||
Warranty and product liability expenses | 60,266 | 57,957 | 4.0 | 2.3 | 2.5 | |||||||||||||||
Research and development expenses | 28,515 | 25,651 | 11.2 | % | 1.1 | % | 1.1 | % | ||||||||||||
| 1. | The increase in freight and transportation expenses corresponds to an increase in volumes at our Jaguar Land Rover operations, predominantly on account of increased China sales on an annual basis. |
| 2. | Our works operation and other expenses represented 8.1% and 7.9% of total revenue in Fiscal 2015 and 2014, respectively. These mainly relate to volume-related expenses at Jaguar Land Rover. Furthermore, engineering expenses at Jaguar Land Rover have increased, reflecting our increased investment in the development of new vehicles by 11.8% to Rs. 61,127 million in Fiscal 2015 from Rs. 54,658 million in Fiscal 2014. A significant portion of these costs are capitalized and shown under the line item “expenditure capitalized” discussed below”. |
| 3. | Publicity expenses decreased to 3.3% of our revenues in Fiscal 2015 from 3.5% in Fiscal 2014. In addition to routine product and brand campaigns, we incurred expenses relating to new product introduction campaigns in Fiscal 2015, namely the new Range Rover, new Range Rover Sport, Range Rover Evoque, Jaguar F-TYPE, smaller powertrain derivatives of the XF and XJ, the XF Sportbrake at Jaguar Land Rover, and the Ultra trucks, Zest and Bolt at our India operations. |
| 4. | Our allowance for trade and other receivables represented 1.0% and 1.1% of total revenues in Fiscal 2015 and Fiscal 2014, respectively. The allowances for trade and other receivables, and finance receivables mainly relate to India operations. These mainly reflect provisions for the impairment of vehicle loans of Rs.23,226 million for Fiscal 2015 as compared to Rs.24,139 million for the same period in 2014. The rate of defaults were due to prolonged unanticipated deterioration in the economic environment in India, which severely affected fleet owners and transporters. Furthermore, based on our assessment of non-recoverability of overdues in trade and other receivables, we have recorded a provision of Rs.2,371 million in Fiscal 2015, a decrease by 11.9% compared to a provision of Rs.2,691 million in Fiscal 2014. |
| 5. | Warranty and product liability expenses represented 2.3% and 2.5% of our revenues in Fiscal 2015 and Fiscal 2014, respectively. The warranty expenses at Jaguar Land Rover represented 2.57% of the revenue as compared to 2.84% last year primarily due to product and market mix, whereas for Tata Motors Indian operations these represent 1.17% of revenue as compared to 0.99% last year. The increased cost for Tata Motors Indian operations represented an increase in warranty period from two years to four years for certain M&HCV models, resulting in an increase in warranty accrual from Rs.438 million in Fiscal 2014 to Rs.652 million in Fiscal 2015. Please refer to Item 5.A “—Critical Accounting Policies” of this annual report for further details. |
| 6. | Research and product development costs represent research costs and costs pertaining to minor product enhancements, refreshes and upgrades to existing vehicle models. These represented 1.1% of total revenues for Fiscal 2015 and 2014. |
Heavy Trucks:Expenditure capitalizedIn September 2012,
This represents employee costs, stores and other manufacturing supplies and other works expenses incurred mainly towards product development projects. Considering the nature of our industry, we launched Tata LPT 3723 — firstcontinually invest in class five axle rigid trucksthe development of new products and invest to address safety, emission and other regulatory norms. The expenditure capitalized increased by 13.3% to Rs.153,218 million in Fiscal 2015 from Rs.135,247 million in Fiscal 2014. The increase includes a favorable foreign currency translation impact from GBP to Indian rupees of Rs.2,654 million pertaining to Jaguar Land Rover. These reflect expenditures on new products and other major product development plans.
Depreciation and Amortization
Our depreciation and amortization expenses increased by 21.8% in Fiscal 2015, the breakdown of which is as follows:
| Year ended March 31, | ||||||||
| 2015 | 2014 | |||||||
| (Rs. in millions) | ||||||||
Depreciation | 65,398 | 52,426 | ||||||
Amortization | 69,098 | 58,037 | ||||||
|
|
|
| |||||
Total | 134,496 | 110,463 | ||||||
|
|
|
| |||||
The increase in depreciation and amortization expenses includes an unfavorable foreign currency translation from GBP to Indian rupees of Rs.1,543 million pertaining to Jaguar Land Rover. The increase in depreciation expenses was on account of asset additions, which primarily include the launch of Ingenium engines at the Wolverhampton facility in the United Kingdom and expenses attributable to plant and equipment and tooling, which are mainly towards capacity and new products. The amortization expenses for Fiscal 2015 mainly related to product development costs capitalized and new products introduced during this period and during Fiscal 2014, primarily the Jaguar F-TYPE coupe and all-wheel drive derivatives, the new Discovery Sport, the Zest and Ultra trucks. Depreciation and amortization expenses represented 5.1% and 4.7% of total revenues in Fiscal 2015 and Fiscal 2014, respectively.
Other income (net)
There was a net gain of Rs.11,508 million in Fiscal 2015, as compared to Rs.7,733 million in Fiscal 2014, representing an increase of 48.8%.
| i. | During Fiscal 2014, we repaid senior notes before maturity and consequently recognized a loss of Rs.4,792 million towards reversal of previously recognized gain of the fair value of prepayment option. Please see Item 5.B “—Liquidity and Capital Resources-Long-term funding” of this annual report on Form 20-F for details on prepayments of senior notes in Fiscal 2014. |
| ii. | There was a loss on the fair value of conversion option relating to foreign currency convertible notes of Rs.838 million in Fiscal 2014. The notes were fully converted in Fiscal 2014. |
| iii. | We recorded a loss on a sale of assets and assets written off of Rs.3,512 million in Fiscal 2015 as compared to Rs.294 million in Fiscal 2014. |
Capital work-in-progress as at March 31, 2014, included building under construction at Singur in the state of West Bengal in India of Rs.3,098.8 million for the purposes of manufacturing automobiles. We have made a provision for carrying capital costs of buildings at Singur amounting to Rs.3,098.8 million in Fiscal 2015, excluding other assets, such as electrical installations, expenses written off/provided for in earlier years, security expenses, lease rent and our claim for the interest on the whole amount (including on the Rs.3,098.8 million carrying capital costs). Please see Item 4.B “Information on the Company—Business Overview—Legal Proceedings” of the annual report on Form 20-F for additional details on the claims related to the Singur facility.
| iv. | Miscellaneous income increased by 10.6% to Rs.13,474 million in Fiscal 2015 from Rs.12,179 million in Fiscal 2014. During Fiscal 2014, legislation was enacted that allows United Kingdom (UK) companies to elect for the Research and Development Expenditure Credit (RDEC) on qualifying expenditures incurred since April 1, 2013, instead of the existing super-deduction rules. Accordingly, the amount not relating to capitalized product development expenditure of Rs.2,909 million and Rs.1,712 million for the Fiscal 2015 and 2014, respectively, have been recognized as miscellaneous income. Further, the increase was due to income earned from services provided to Chery Jaguar Land Rover Automotive Company Limited of Rs.1,134 million in Fiscal 2015 as compared to Rs.179 million in Fiscal 2014. Furthermore, Jaguar Land Rover earned commissions of Rs.1,163 million in Fiscal 2015 as compared to Rs.183 million in Fiscal 2014. In addition, in Fiscal 2015 we recorded an income of Rs.366 million on the sale of occupancy rights. |
For further details see Note 30 to our consolidated financial statements included elsewhere in this annual report onForm 20-F.
Interest expense (net)
Our interest expense (net of interest capitalized) decreased by 1.6% to Rs.52,232 million in Fiscal 2015 from Rs.53,095 million in Fiscal 2014. As a percentage of total revenues, interest expense represented 2.0% in Fiscal 2015 compared to 2.3% in Fiscal 2014. The interest expense (net) for Jaguar Land Rover was GBP 135 million (Rs.12,779 million) in Fiscal 2015 as compared to GBP 138 million (Rs.13,272 million) in Fiscal 2014, which includes prepayment penalties of GBP 77 million as compared to GBP 53 million in Fiscal 2014. The decrease (excluding prepayment penalty) in interest expense is primarily due to the prepayment of higher coupon senior notes during Fiscal 2014 and 2015, offset by an unfavorable foreign currency translation of Rs.1,143 million from GBP to Indian rupees. For our operations of Tata and other brand vehicles (including financing thereof), interest expense increased marginally by 1.8% to Rs.39,665 million in Fiscal 2015 from Rs.38,966 million in Fiscal 2014. See Item 5.B “—Liquidity and Capital Resources” of this annual report on Form 20-F for additional details on our debt financing arrangements.
Foreign exchange (gain)/loss (net)
We had a net foreign exchange loss of Rs.12,681 million in Fiscal 2015, compared to a net gain of Rs.19,104 million in Fiscal 2014. This was primarily attributable to our Jaguar Land Rover operations.
| i. | Jaguar Land Rover recorded an exchange loss of Rs.11,949 million in Fiscal 2015 as compared to gain of Rs.25,244 million in Fiscal 2014. We incurred a net exchange loss on senior notes of Rs.15,387 million in Fiscal 2015, as compared to gain of Rs.8,367 million in Fiscal 2014, mainly due to appreciation of U.S. dollars as compared to GBP as at March 31, 2015. Further, there was a loss of Rs.11,536 million in Fiscal 2015 as compared to gain of Rs.16,253 million in Fiscal 2014, due to fluctuations in foreign currency exchange rates on derivative contracts, mainly reflecting a weaker Chinese RMB, which includes a gain of Rs.4,338 million on cash flow hedges in Fiscal 2015 as compared to Rs.10,771 million in Fiscal 2014. The above loss is offset by revaluation of other assets and liabilities by gain of Rs.11,195 million as compared to Rs.4,979 million. |
| ii. | For India operations, due to depreciation of the Indian rupee mainly against the U.S. dollar, we incurred exchange losses. There was a net exchange loss of Rs.1,777 million in Fiscal 2015 as compared to Rs.4,841 million in Fiscal 2014, attributable to foreign currency denominated borrowings. |
Impairment in respect of equity-accounted investees
In Fiscal 2014, impairment loss in respect of equity-accounted investees were recorded of Rs.8,034 million in respect of our investment in an associate, Tata Hitachi Construction Machinery Co. Pvt Ltd.
Income Taxes
Our income tax expense increased by 43.4% to Rs.69,150 million in Fiscal 2015 from Rs.48,227 million in Fiscal 2014, resulting in consolidated effective tax rates of 34.9% and 26.9%, for Fiscal 2015 and 2014, respectively.
Reasons for significant differences in the 10 x 4 configuration,company’s recorded income tax expense of Rs.69,150 million as compared to Rs.38,245 million income tax expense computed at the domestic statutory tax rate of respective jurisdictions where entities are domiciled for Fiscal 2015 are as follows:
| i. | During Fiscal 2015, for Tata Motors Limited, on a standalone basis, we have not recognized a deferred tax asset, amounting to Rs.13,844 million, with respect to tax losses, due to the uncertainty of future taxable profit against which tax losses can be utilized. |
| ii. | Furthermore, during Fiscal 2015, deferred tax assets totaling Rs.7,089 million, were not recognized in certain subsidiaries due to uncertainty of realization. |
| iii. | During Fiscal 2015, TML Holdings Pte Ltd, a wholly-owned subsidiary, repurchased 35,000,000 equity shares, par value US$1 each, at a price of US$7.99 each. The resultant gain was subject to capital gains tax in India for Tata Motors Limited, on a standalone basis, resulting in utilization of business losses having a tax effect of Rs.4,469 million. |
| iv. | Income tax expense on undistributed earnings of subsidiaries was Rs.7,805 million in Fiscal 2015 |
| v. | The relevant Indian tax regulations mandate that companies pay tax on book profits, known as the Minimum Alternate Tax, or MAT. MAT may be carried forward and set off against future income tax liabilities computed under normal tax provisions within a period of ten years. We had recognized deferred tax assets in respect of MAT paid in prior years for Tata Motors Limited on a standalone basis. |
In Fiscal 2015, the Government of India amended Indian income tax laws extending the concessional tax rate of 15% on dividends received from foreign subsidiaries indefinitely. This amendment will result in lower utilization of deferred tax assets in respect of MAT paid, due to which we have written off previously recognized deferred tax assets in respect of MAT paid of Rs.7,772 million.
| vi. | The above differences were offset by the change in withholding tax rate in China resulting in credit of Rs.6,269 million in Fiscal 2015, attributable to dividends in China being subject to a reduced withholding tax rate of 5% (rather than 10%), as set out in the new United Kingdom-China tax treaty. |
Reasons for significant differences in the company’s recorded income tax expense of Rs.48,227 million as compared to Rs.35,741 million income tax expense computed at the domestic statutory tax rate of respective jurisdictions where entities are domiciled for Fiscal 2014 are as follows:
| i. | Income tax expense on undistributed earnings of subsidiaries was Rs.12,994 million in Fiscal 2014. |
| ii. | Furthermore, in Fiscal 2014, we recognized Rs.4,676 million tax expenses on dividends from Jaguar Land Rover due to income taxes applicable to Tata Motors Limited on a standalone basis. |
| iii. | In Fiscal 2014, we have recognized net credit of Rs.5,300 million representing reduction in statutory tax rates applicable to a subsidiary in the UK. |
| iv. | In Fiscal 2014, we had written off previously recognized deferred tax assets in respect of MAT paid of Rs.7,318 million in light of lower taxable profit, considering the economic slowdown in India. |
As explained above in the reconciliation from our statutory tax rates to effective tax rates for Fiscal 2015 and Fiscal 2014, our income tax expense in fiscal 2015 increased by Rs.20,923 million mainly due to:
| i. | Non-recognition of deferred tax assets amounting to Rs.20,933 million in Tata Motors Limited and certain subsidiaries due to uncertainty of future taxable profits; |
| ii. | Tax effect on shares purchased by a wholly owned subsidiary of Rs.4,469 million; |
which were offset by:
| i. | a lower charge on undistributed earnings and dividend of subsidiaries, joint operations and equity accounted investees of Rs.9,845 million; and |
| ii. | Reduction due to change in statutory tax rate by Rs.2,700 million to Rs.8,000 million in Fiscal 2015 as compared to Rs.5,300 million in Fiscal 2014. |
For further details see Note 17 to our consolidated financial statements included elsewhere in this annual report on Form 20-F.
Share of profit of equity-accounted investees and non-controlling interests in consolidated subsidiaries, net of tax
In Fiscal 2015, our share of profit of equity-accounted investees reflected a loss of Rs.1,748 million, as compared to Rs.1,878 million in Fiscal 2014, a decrease of 6.9%.
Our share of loss (including other adjustments) in Chery Jaguar Land Rover Automotive Company Limited in Fiscal 2015 was Rs.1,213 million as compared to Rs.807 million in Fiscal 2014.
Our share of loss in Tata Prima 3138.K Tipper,Hitachi Construction Machinery Co Private Ltd was Rs.768 million in Fiscal 2015 as compared to Rs.1,354 million in Fiscal 2014.
Our share of non-controlling interests in consolidated subsidiaries increased by 71.2% to Rs.791 million in Fiscal 2015 from Rs.462 million in Fiscal 2014 primarily due to increased profitability of one of our subsidiaries, TTL.
Net income
Our consolidated net income in Fiscal 2015, excluding shares of non-controlling interests, decreased marginally by 1.9% to Rs.128,291 million from Rs.130,717 million in Fiscal 2014. Net income as a percentage of total revenues also decreased from 5.6% in Fiscal 2014 to 4.9% in Fiscal 2015. This decrease was mainly the result of the following factors:
There was a decrease in revenue from our vehicle financing operations by 24.3% to Rs.22,631 million in Fiscal 2015 from Rs.29,876 million in Fiscal 2014.
Negative earnings before other income, interest and tax for Tata Prima 4938.S tractorand other brand vehicles (including financing thereof) of Rs.29,831 million in Fiscal 2015 from Rs.20,631 million in Fiscal 2014. The losses were mainly attributable to reduction in sales volumes of small commercial vehicles, competitive pressure on pricing as well as a decrease in vehicle financing activity. Furthermore, there was an increase in depreciation expenses as a result of additions to plants and facilities in recent years, and in amortization expenses for product development costs due to new products launched. While we have implemented cost-reduction programs, in the short term, we expect that the level of fixed costs are expected to continue to have a negative impact on earnings.
These were primarily offset by the following factors:
Earnings before other income, interest and tax for Jaguar Land Rover increased by 20.3% to Rs.274,382 million in Fiscal 2015 from Rs.228,027 million in Fiscal 2014 which amounted to 12.7% in Fiscal 2015 of sales as compared to 12.0% in Fiscal 2014. The decrease in net income for Fiscal 2015 was also offset by a favorable foreign currency translation of Rs.698 million from GBP to Indian rupees. The improvement in profitability was mainly attributable to increases in volumes across all markets, introduction of the Jaguar F-TYPE and smaller powertrain derivative of XF and XJ and XF Sportbrake, the New Range Rover, the New Range Rover Sport and Range Rover Evoque. Furthermore, the performance was also supported by the positive impact of the continuing strength of the U.S. dollar against the GBP and the Tata Prima 230 HP – LX range consistingEuro, improving its revenues against the backdrop of Tata Prima LX 4923.S, Tata Prima LX4023.Sa largely GBP and Tata LPK 3118 tipper.Euro cost base.
Impairment loss of Rs.8,034 million in respect of investment in an associate in Fiscal 2014.
Fiscal 2014 compared to Fiscal 2013
Buses:RevenuesWe launched MCV buses
Our total consolidated revenue (net of excise duty, where applicable) including finance revenue increased by 23.7% to Rs.2,341,761 million in Fiscal 2014 from Rs.1,892,910 million in Fiscal 2013.
The increase in revenue was primarily driven by our Jaguar Land Rover business, where revenues increased by 38.7% to Rs.1,894,590 million in Fiscal 2014 from Rs.1,365,620 million in Fiscal 2013, primarily due to volume increases across products and markets. The revenues also reflect a favorable foreign currency translation from GBP to Indian rupees of Rs.218,417 million pertaining to Jaguar Land Rover. The increase in revenues of Rs.310,553 million at our Jaguar Land Rover business (excluding translation impact) was mainly attributable to an increase in sales of the Range Rover and Evoque from 146,425 units in Fiscal 2013 to 166,697 units in Fiscal 2014 and Jaguar vehicles from 57,766 units in Fiscal 2013 to 80,644 units in Fiscal 2014. The increase in revenue in Fiscal 2014 was also attributable to an indirect tax incentive by Jaguar Land Rover of Rs.8,463 million.
The increase in revenue at our Jaguar Land Rover business was partly offset by a decrease in revenue for intercity (AC – 45 Seater)Tata and staff transportation (Non AC – 41 Seater), LP/ LPO Starbus Ultra with bestother brand vehicles (including financing thereof) by 15.8% to Rs.435,012 million in class features and fuel efficiency tailored to suit Indian conditions with highest capacity school busFiscal 2014 from Rs.516,867 million in ICV platformFiscal 2013. Our revenues from sales in India (56 seats)decreased by 31.1% to Rs.335,009 million in Fiscal 2014 from Rs.439,157 million in Fiscal 2013. A decrease in revenue from M&HCVs, which decreased by 23.1% to Rs.129,350 million in Fiscal 2014 from Rs.168,363 million in Fiscal 2013, and LCVs, which decreased by 32.5% to Rs.74,900 million in Fiscal 2014 to Rs.112,631 million in Fiscal 2013 contributed to the decrease in revenue from Tata and other brand vehicles (including financing thereof). Similarly, revenue from passenger cars decreased by 38.6% to Rs.30,370 million in Fiscal 2014 from Rs.50,551 million in Fiscal 2013, and revenue from utility vehicles decreased by 30.0% to Rs.13,810 million in Fiscal 2014 from Rs.19,729 million in Fiscal 2013. Furthermore, there was a decrease in revenue from spares sales activity by 9.6% in Fiscal 2014. These decreases in revenue were offset by an increase in revenue of TDCV by 21.3% to Rs.47,533 million in Fiscal 2014 from Rs.39,204 million in Fiscal 2013.
Revenue from our vehicle financing operations decreased marginally by 0.5% to Rs.29,876 million in Fiscal 2014 as compared to Rs.30,013 million in Fiscal 2013.
Revenue (net of excise duty, where applicable) before inter-segment eliminations from other operations increased by 12.7% to Rs.24,989 million in Fiscal 2014 from Rs.22,179 million in Fiscal 2013, which represents 1.1% and 1.2% of our total revenue, before inter-segment eliminations, in Fiscal 2014 and 2013, respectively. The increase in revenues net of inter-segment elimination was Rs.889 million, which was mainly attributable to the acquisition of Cambric Holdings Inc by TTL.
Cost and Expenses
Raw Materials, Components and Purchase of Products for Sale (including change in stock) (Material costs)
Material costs increased by 20.3% to Rs.1,444,946 million in Fiscal 2014 from Rs.1,201,017 million in Fiscal 2013. The increase in absolute terms in material costs in Fiscal 2014 was mainly attributable to increased volumes at our Jaguar Land Rover business and includes an unfavorable foreign currency translation from GBP to Indian rupees for Jaguar Land Rover operations which resulted in an increase of Rs.133,237 million.
Material costs as a percentage of revenues (excluding finance revenues) decreased to 62.5% in Fiscal 2014 from 64.5% in Fiscal 2013. The reduction in material costs as a percentage to revenue was partly on account of a change in the composition of revenue, with a greater proportion of revenue attributable to Jaguar Land Rover revenue as compared to India operations in Fiscal 2014.
At our Jaguar Land Rover operations, material costs increased by 35.8% to Rs.1,154,510 million in Fiscal 2014 from Rs.850,372 million, in Fiscal 2013. The material costs as a percentage to revenue decreased to 61.4% in Fiscal 2014 from 62.8% in Fiscal 2013 for Jaguar Land Rover (in GBP terms). Material costs increased by GBP 1,107 million (Rs.106,416 million) due to an increase in volume and an increase in duties by GBP 163 million (Rs.15,676 million) which was mainly due to an increase in sales to China. However, as a percentage to revenue, duties decreased to 10.4% in Fiscal 2014 from 11.7% in Fiscal 2013, due to an increase in sales in China of 2.0 liter engines, on which a lower duty is paid during Fiscal years in which we sold engines separately in China. Furthermore, the decrease in material costs as a percentage to revenue was mainly due to cost-reduction programs undertaken by Jaguar Land Rover of approximately GBP 209 million (Rs.20,100 million). However, that decrease was partially offset by negative movement of foreign currency rates applicable for sourcing countries of GBP 154 million (Rs.14,811 million).
At our Tata and other brand vehicles operations (excluding finance revenues), material costs decreased by 19.3% to Rs.277,820 million in Fiscal 2014 from Rs.344,115 million, which was primarily caused by a reduction in sales volume across all vehicle categories at our India operations. The material costs as a percentage to revenue decreased to 68.6% in Fiscal 2014 from 70.7% in Fiscal 2013. The reduction of material costs as a percentage of revenue is mainly attributable to the composition of revenue, with a greater proportion of revenue attributable to revenue from spares and M&HCVs, which feature a lower percentage of material costs to revenue. Furthermore, in the utility vehicles and LCV categories, average price realization improved over material costs in Fiscal 2014. However, the decreases were offset by reductions in average price realization for passenger cars due to the competitive environment.
Employee Cost
Our employee costs increased by 28.0% to Rs.213,903 million in Fiscal 2014 from Rs.167,170 million in Fiscal 2013, including the foreign currency translation impact from GBP to Indian rupees discussed below. Our permanent headcount increased by 6.2% as at March 31, 2014 to 68,889 employees, as compared to 64,821 employees as at March 31, 2013, whereas the average temporary headcount decreased by 14.3% to 35,260 employees in Fiscal 2014 from 41,118 employees in Fiscal 2013.
The employee costs at Jaguar Land Rover increased by 39.8% to Rs.160,147 million in Fiscal 2014 from Rs.114,591 million in Fiscal 2013. This includes an unfavorable foreign currency translation from GBP to Indian rupees of Rs.17,987 million. In GBP terms, the employee costs at Jaguar Land Rover were GBP 1,654 million in Fiscal 2014 as compared to GBP 1,334 million in Fiscal 2013. The employee costs at Jaguar Land Rover as a percentage to revenue were 8.5% in Fiscal 2014 and 8.4% in Fiscal 2013. Due to consistent increases in volumes and to support new launches and product development projects, Jaguar Land Rover increased its permanent headcount by 29.6% as at March 31, 2014 to 23,111 employees as compared to 17,832 employees as at March 31, 2013. Jaguar Land Rover’s average temporary headcount decreased by 31.6% in Fiscal 2014 to 4,842 employees from 7,081 employees in Fiscal 2013. The increase in employee costs was also due to a higher pension charge by GBP 71 million (Rs.6,838 million) and a 7.5% increase in employee salary in Fiscal 2014 compared to an increase of 4.5% in Fiscal 2013.
At our India operations, the employee costs increased by 2.4% to Rs.33,672 million in Fiscal 2014 from Rs.32,880 million in Fiscal 2013. The permanent headcount decreased marginally by 0.5% as at March 31, 2014 to 38,434 employees as compared to 38,627 employees as at March 31, 2013. To address the challenges posed by the business downturn, we introduced an organization-wide cost-optimization program and incurred Rs.535 million towards an employee early-separation scheme. The remaining increase in employee cost was mainly due to regular increases in salary. For our India operations, the average temporary headcount decreased by 23.3% to 26,973 employees in Fiscal 2014 from 35,184 employees in Fiscal 2013.
The employee cost at TDCV decreased by 16.7% to Rs.5,771 million in Fiscal 2014 from Rs.6,916 million in Fiscal 2013. In Fiscal 2013, TDCV recorded a provision of Rs.2,124 million, stemming from the lawsuit filed by the union employees demanding inclusion of some elements of non-ordinary salary and bonus as part of ordinary wages, which had been decided by the district court of Seoul against TDCV. This decrease in employee costs at TDCV was offset by an increase of Rs.979 million in Fiscal 2014 relating to regular salary increases and an unfavorable foreign currency translation from Korean won to Indian rupees of Rs.196 million. Please see Item 4.B “Information on Our Company—Business Overview—Legal Proceedings” of this annual report on Form 20-F for further details on the lawsuit related to employee costs at TDCV.
During Fiscal 2014, we closed the manufacturing operations at Tata Hispano Motors Carrocera S.A. and accordingly paid Euro 12.4 million (Rs.1,006 million) as employee separation costs. The closure was triggered by continuous underperformance that was mainly attributable to challenging market conditions in regions where Hispano operates.
Other Expenses
Other expenses increased by 29.7% to Rs.498,778 million in Fiscal 2014 from Rs.384,423 million in Fiscal 2013. This increase mainly reflects an effect of volumes at Jaguar Land Rover and an unfavorable foreign currency translation of GBP to Indian rupees of Rs.43,558 million pertaining to Jaguar Land Rover. As a percentage of total revenues, these expenses represented 21.3% in Fiscal 2014 as compared to 20.3% in Fiscal 2013. The major components of expenses are as follows:
| Percentage of Total Revenue | ||||||||||||||||||||
| Year ended March 31, | Year ended March 31, | |||||||||||||||||||
| 2014 | 2013 | Change | 2014 | 2013 | ||||||||||||||||
(Rs. in millions) | ||||||||||||||||||||
Freight and transportation expenses | 75,439 | 55,930 | 34.9 | % | 3.2 | % | 3.0 | % | ||||||||||||
Works operation and other expenses | 186,067 | 143,924 | 29.3 | 7.9 | % | 7.6 | % | |||||||||||||
Publicity | 81,425 | 66,556 | 22.3 | 3.5 | % | 3.5 | % | |||||||||||||
Allowance for trade and other receivables, and finance receivables | 26,830 | 10,570 | 153.8 | 1.1 | % | 0.6 | % | |||||||||||||
Warranty and product liability expenses | 57,957 | 42,029 | 37.9 | 2.5 | % | 2.2 | % | |||||||||||||
Research and development expenses | 25,651 | 20,340 | 26.1 | % | 1.1 | % | 1.1 | % | ||||||||||||
| 1. | The increase in freight and transportation expenses corresponds to an increase in volumes at our Jaguar Land Rover operations, predominantly on account of increased China sales. |
| 2. | Our works operation and other expenses represented 7.9% and 7.6% of total revenue in Fiscal 2014 and 2013, respectively. These mainly relate to volume-related expenses at Jaguar Land Rover. |
| 3. | Publicity expenses were 3.5% of our revenue in Fiscal 2014 and Fiscal 2013. In addition to routine product and brand campaigns, we incurred expenses relating to new product introduction campaigns, namely for the new Range Rover, new Range Rover Sport, Range Rover Evoque, Jaguar F-TYPE, smaller powertrain derivatives of the XF and XJ, the XF Sportbrake, at Jaguar Land Rover, and the Prima LX series of trucks, and the Vista tech and Sumo Gold. |
| 4. | The allowances for trade and other receivables, and finance receivables mainly relates to India operations. The increase mainly relates to a provision for impairment of vehicle loans. Rates of defaults of vehicle loans increased in Fiscal 2014, as consistent deterioration in the economic environment in India severely affected fleet owners and transporters. In turn, due to overcapacity and slowing industrial activity, freight rates stagnated. As a result, the increased diesel prices and other cost could not be fully recovered by the transporters. Both large and small fleet operators suffered due to lack of cargos, which reduced trips and waiting periods. The situation was further accentuated on account of delays in payments by customers, which affected the cash flow and financial condition of small fleet operators which generally use vehicle financing to obtain fleet vehicles. Increased vehicle repossessions in Fiscal 2014 also led to downward pressures on realization of resales of these vehicles. In accordance with our policy for recognition of allowances for finance receivables upon an event of default, we made provision of Rs.24,139 million in Fiscal 2014 compared to Rs.9,428 million in Fiscal 2013. Furthermore, based on our assessment of the non-recoverability of overdues in trade and other receivables, we recorded a provision of Rs.2,691 million in Fiscal 2014 compared to Rs.1,142 million in Fiscal 2013. |
| 5. | Warranty and product liability expenses represented 2.5% and 2.2% of our revenue in Fiscal 2014 and Fiscal 2013, respectively. The warranty expenses at Jaguar Land Rover represented 2.84% of the revenue as compared to 2.80% last year, whereas warranty expenses for Tata and other brand vehicles (excluding vehicle financing) represented 0.99% of revenue as compared to 0.78% last year. The increased cost for Tata and other brand vehicles (excluding vehicle financing) represented an increase in warranty period from two years to four years for certain M&HCV models, resulting in an increase in warranty accrual from Rs.116 million in Fiscal 2013 to Rs.438 million in Fiscal 2014. Please refer to Item 5.A “Operating Results—Critical Accounting Policies—Product Warranty” of this annual report on Form 20-F for further details. |
| 6. | Research and product development costs represent research costs and costs pertaining to minor product enhancements, refreshes and upgrades to existing vehicle models. These represented 1.1% of total revenues for each of Fiscal 2014 and 2013. |
Expenditure capitalized
These represent employee costs, stores and other manufacturing supplies and other works expenses incurred towards product development projects and also include costs attributable to internally constructed capital items. Considering the nature of our industry, we continually invest in the development of new products and must also address safety, emission and other regulatory norms. The expenditure capitalized increased by 32.7% to Rs.135,247 million in Fiscal 2014 as compared to Rs.101,935 million in Fiscal 2013. The increase includes a favorable foreign currency translation impact from GBP to Indian rupees of Rs.13,374 million pertaining to Jaguar Land Rover. The increase reflects expenditure on new products and other major product development plans, for example, with respect to the new Range Rover, the Range Rover Sport, the Jaguar F-TYPE and new models of LCVs, Prima trucks and passenger cars.
Depreciation and Amortization
Our depreciation and amortization expenses increased by 45.8% in Fiscal 2014, the breakdown of which is as follows:
| Year ended March 31, | ||||||||
| 2014 | 2013 | |||||||
| (Rs. in millions) | ||||||||
Depreciation | 52,426 | 39,651 | ||||||
Amortization | 58,037 | 36,117 | ||||||
|
|
|
| |||||
Total | 110,463 | 75,768 | ||||||
|
|
|
| |||||
The increase on account of currency translation from GBP to Indian rupees is Rs.9,864 million pertaining to Jaguar Land Rover. The increase in depreciation expenses was on account of asset addition in Fiscal 2014 and plant and equipment and toolings (mainly towards capacity and new products) and the full effect of asset additions in the previous year. The amortization expenses mainly relate to product development costs capitalized and new products introduced during Fiscal 2013 and Fiscal 2014, primarily, the new Range Rover, the new Range Rover Sport, Evoque and Jaguar F-TYPE and represented 2.5% and 1.9% of revenue for Fiscal 2014 and Fiscal 2013, respectively.
Other income (net)
There was a net gain of Rs.7,733 million in Fiscal 2014, as compared to Rs.12,099 million in Fiscal 2013, representing a decrease of 36.1%.
| i. | In Fiscal 2013, we recorded a gain of Rs.3,933 million on account of the fair value of prepayment option to the holders of senior notes, which we prepaid before maturity. Consequently, we recognized a loss of Rs.4,792 million in Fiscal 2014, towards reversal of previously recognized gain. Please see Item 5.B “—Liquidity and CapitalResources—Long-term funding” for details on our prepayment of senior notes. |
| ii. | There was a loss on fair value of conversion option relating to foreign currency convertible notes of Rs.838 million in Fiscal 2014 as compared to a gain of Rs.802 million in Fiscal 2013. The notes were fully converted in Fiscal 2014. |
| iii. | In Fiscal 2014, there was a gain on a sale of available for sale investments of Rs.1,102 million as compared to loss of Rs.275 million in Fiscal 2013. |
For further details see Note 30 to our consolidated financial statements included elsewhere in this annual report onForm 20-F.
Interest expense (net)
Our interest expense (net of interest capitalized) increased by 30.2% to Rs.53,095 million in Fiscal 2014 from Rs.40,792 million in Fiscal 2013. As a percentage of total revenues, interest expense represented 2.3% in Fiscal 2014 compared to 2.2% in Fiscal 2013. The interest expense (net) for Jaguar Land Rover was GBP 138 million (Rs. 13,272 million) in Fiscal 2014 as compared to GBP 65 million (Rs.5,608 million) in Fiscal 2013. The increase of Rs.12,303 million was due to the prepayment of senior notes of GBP 53 million (Rs.5,097 million) as detailed below. Item 5.B “—Liquidity and Capital Resources—Long-term funding” of this annual report on Form 20-F for additional details regarding our prepayment of senior notes. This also includes a currency translation of Rs.2,317 million from GBP to Indian rupees.
Foreign exchange (gain)/loss (net)
We recorded a net foreign exchange gain of Rs.19,104 million in Fiscal 2014, compared to a loss of Rs.15,775 million in Fiscal 2013. This was primarily attributable to Jaguar Land Rover operations.
| i. | Jaguar Land Rover recorded an exchange gain of Rs.25,244 million in Fiscal 2014 as compared to a loss of Rs.12,680 million in Fiscal 2013. There was a gain of Rs.10,771 million on cash flow hedges in Fiscal 2014 as compared to a loss of Rs.5,047 million in Fiscal 2013. We incurred a net exchange gain on senior notes of Rs.8,367 million in Fiscal 2014, as compared to Rs.3,405 million in Fiscal 2013. The gain was mainly due to a depreciation of the U.S. dollar as compared to GBP. |
| ii. | For India operations, due to depreciation of the Indian rupee against all major currencies, we incurred exchange losses in Fiscal 2014. There was a net exchange loss of Rs.4,841 million in Fiscal 2014 as compared to Rs.5,467 million in Fiscal 2013, attributable to foreign currency denominated borrowings. |
Impairment in respect of equity-accounted investees
In Fiscal 2014, we recognized an impairment loss of Rs.8,034 million in respect of its investment in an associate, Tata Hitachi Construction Machinery Company Ltd. The associate is engaged in the business of manufacture and sale of construction equipment. Its operation was severely affected due to the current economic slowdown and increased competition from new entrants. The recoverable amount was determined based on value in use.
Income Taxes
Our income tax expense increased by 22.9% to Rs.48,227 million in Fiscal 2014 from Rs.39,239 million in Fiscal 2013, representing 26.9% as compared to 30.5% of net income before tax, respectively. The reasons for major reconciliation items are given below:
| i. | Considering the statutory tax rates applicable for each company in our group, the effective tax rate decreased from 23.7% in Fiscal 2013 to 19.9% in Fiscal 2014. The net increase in tax expense by Rs.5,280 million represents a gross increase in tax expense of Rs.11,970 million due to increase in income offset by decrease in the statutory tax rate of Rs.6,690 million. |
| ii. | We recognized net credit of Rs.5,300 million representing a reduction in statutory tax rates applicable to Jaguar Land Rover. We had recognized a net debit of Rs.1,548 million during Fiscal 2013 due to changes in tax rates in our Indian operations. |
| iii. | We recognized net credit of Rs.3,257 million in Fiscal 2014 in respect of utilization/credit of unrecognized tax losses, unabsorbed depreciation and other tax benefits as compared to Rs.518 million in Fiscal 2013. |
| iv. | Income tax expenses on undistributed earnings of subsidiaries increased by Rs.7,383 million in Fiscal 2014 mainly due to dividends paid in Fiscal 2015 out of profits of Fiscal 2014 declared by Jaguar Land Rover and an increase in profits in our overseas subsidiaries. |
| v. | The relevant Indian tax regulations mandate the companies to pay tax on book profits, known as Minimum Alternate Tax or MAT. MAT may be carried forward and set off against future income tax liabilities computed under normal tax provisions within a period of ten years. We had recognized deferred tax assets representing MAT paid in prior years for Tata Motors Limited on standalone basis. In the course of assessment of recoverability of MAT paid, we wrote off previously recognized tax credit of Rs.7,318 million in Fiscal 2014 in light of future taxable profit, considering the continued economic slowdown in India. |
| vi. | The tax on share of profit/loss of equity accounting investees was Rs.537 million in Fiscal 2014 as compared to a credit of Rs.34 million in Fiscal 2013. |
For further details refer to Note 17 to our consolidated financial statements included elsewhere in this annual report on Form 20-F.
Share of profit of equity-accounted investees and non-controlling interests in consolidated subsidiaries, net of tax
In Fiscal 2014, our share of profit of equity-accounted investees reflected a loss of Rs.1,878 million, as compared to Rs.132 million in Fiscal 2013. This change is primarily due to the following factors:
The operations of an associate engaged in the business of industrial equipment, Tata Hitachi Construction Machinery Co. Ltd, continued to be impacted by adverse economic conditions and competitive pressure. Our share of loss for Fiscal 2014 was Rs.1,354 million as compared to Rs.703 million in Fiscal 2013.
Fiscal 2013 includes a gain of Rs.1,101 million, representing our share of profit in one of the equity-accounted investees, Tata AutoComp Systems Ltd, which recorded gain on divestment of certain joint venture investments.
In Fiscal 2014, our share of non-controlling interest reflected a gain of Rs.462 million, as compared to Rs.886 million in Fiscal 2013, primarily due to the reduced profitability of one of our subsidiaries, TTL.
Net Income
Our consolidated net income in Fiscal 2014, excluding shares of non-controlling interests, increased by 47.4% to Rs.130,717 million from Rs.88,671 million in Fiscal 2013. Net income as a percentage of total revenues also increased to 5.6% in Fiscal 2014 from 4.7% in Fiscal 2013. This increase was mainly the result of the following factors:
Jaguar Land Rover’s performance in terms of volume and profitability contributed significantly. Earnings before other income, interest and tax for Jaguar Land Rover increased by 51.4% to Rs.228,026 million in Fiscal 2014 from Rs.150,653 million in Fiscal 2013 which amounted to 12.0% of sales as compared to 11.0% for Fiscal 2013. The increase in net income also includes a favorable foreign currency translation of Rs.22,566 million from GBP to Indian rupees. The improvement in profitability was mainly attributable to increases in volumes across all markets and models in Fiscal 2014. The reported earnings before other income, interest and tax also have an element of foreign currency translation gain from GBP to Indian rupees of Rs.27,064 million.
This was primarily offset by:
Revenues from the operations of Tata and other brand vehicles (including financing thereof), which were significantly affected by volume contractions, decreased by 19.6% to Rs.364,591 million in Fiscal 2014 from Rs.453,276 million in Fiscal 2013. This resulted in negative earnings before other income, interest and tax of Rs.20,631 million in Fiscal 2014 for Tata and other brand vehicles (including financing thereof), as compared to positive earnings of Rs.13,554 million in Fiscal 2013. The losses were mainly attributable to a significant reduction in sales volumes. There was an increase in depreciation expenses as a result of additions to plants and facilities in recent years, and in amortization expenses for product development costs due to new products launched.
A decrease in other income, mainly due to a loss on the fair value of a prepayment option and loss on a conversion option on senior notes of Jaguar Land Rover.
Impairment loss of Rs.8,034 million in respect of investment in an associate, Tata Hitachi Construction Machinery Co. Ltd.
Recent Accounting Pronouncements
Please refer to Note 2(v) to our consolidated financial statements included elsewhere in this annual report on Form 20-F for adopted and yet to be adopted accounting pronouncements as at March 31, 2015.
Critical Accounting Policies
The preparation of financial statements in conformity with IFRS requires management to make judgments, estimates and assumptions that affect the application of accounting policies and the reported amounts of assets, liabilities, income, expenses and disclosures of contingent assets and liabilities as of the date of this annual report on Form 20-F and the reported amounts of revenues and expenses for the years presented. The actual results may differ from these estimates.
Estimates and underlying assumptions are reviewed on an ongoing basis and at each balance sheet date. Revisions to accounting estimates are recognized in the period in which the estimate is revised and future periods affected.
In particular, information about significant areas of estimation uncertainty and critical judgments in applying accounting policies that have the most significant effect on the amounts recognized in the financial statements are included in the following notes:
Passenger Cars
During Fiscal 2015, in the passenger car category, our sales increased by 1.2% to 119,203 units from 117,767 units in Fiscal 2014 primarily due to new model launches. Our overall market share of passenger cars in India was lower at 5.9% in Fiscal 2015 as compared to 6.1% during Fiscal 2014 primarily due to industry-wide competition and declining demand for diesel vehicles.
:Utility Vehicles
Our sales in the utility vehicles category decreased by 22.4% in Fiscal 2015 to 24,517 units from 31,583 units in Fiscal 2014. Our share in the overall utility vehicles category has declined mainly due to a lack of presence in the growing compact SUV and softroader categories resulting in our overall market share of utility vehicles in India decreasing to 4.4% in Fiscal 2015 from 5.5% during Fiscal 2014.
Commercial Vehicles in India
Sales of commercial vehicles in India decreased by 8.4% in Fiscal 2015 compared to a decrease of 22.4% in Fiscal 2014. However, in the fourth quarter of Fiscal 2015, sales of our commercial vehicles started to recover due to growth in the M&HCV category. In Fiscal 2015, we recorded commercial vehicle sales of 317,793 units as compared to 378,028 units in Fiscal 2014 a decrease of 15.9%.
M&HCVs
Industry-wide sales in the M&HCV category increased by 15.9% in Fiscal 2015 as compared to a decrease of 25.2% in Fiscal 2014. Pending fleet replacements, a recent trend in gradual improvement in operating environment for fleet operators due to relatively higher freight rates, a correction in diesel prices, some improvement in cargo availability, market expectations of an increase in investments in infrastructure as well as manufacturing space and a renewal of mining and construction activities have contributed to the increase in M&HCV sales in Fiscal 2015.
In Fiscal 2015, our sales in the M&HCV category increased by 14.9% to 126,368 units in Fiscal 2015 from 109,987 units in Fiscal 2014 primarily due to an industry-wide increase in M&HCV sales.
Our overall market share of M&HCVs sales in India decreased to 54.4% in Fiscal 2015 from 54.9% in Fiscal 2014 primarily due to increased competition.
LCVs
The increase in sales in the M&HCV category was offset by a continuing decrease of sales in the LCV category of 18.1% to 406,902 units in Fiscal 2015 from 496,993 units in Fiscal 2014. Demand in the light commercial vehicles category was affected due to lower freight transportation needs due to high-capacity additions to fleets over recent years, financing defaults and tightened lending norms, all of which continue to impede the recovery in sales of small commercial vehicles.
Our sales in the LCV category declined by 28.6% to 191,425 units in Fiscal 2015 from 268,041 units in Fiscal 2014 due to the factors affecting the LCV market industry wide. Our overall market share of LCV sales in India decreased to 47.0% in Fiscal 2015 from 53.9% during Fiscal 2014.
Tata and other brand vehicles—Exports
We launchedare expanding our export operations, which have been ongoing since 1961. We market our commercial and passenger vehicles in several countries in South Africa, Europe, Africa, the all-new Vista D90;Middle East, South East Asia, Ukraine and refreshed Tata Indica eV2,Russia. We market a range of products including M&HCV trucks, LCV trucks, buses, pickups and small commercial vehicles. Our export business has also been bolstered by the most efficient carentry into the ASEAN region, including Indonesia, Malaysia, Philippines as well as with the introduction of the new range of world class products Prima and Ultra in various markets during Fiscal 2015, which we anticipate offering in additional markets in Fiscal 2016.
Our overall sales in international markets increased by 2.8% to 63,009 units in Fiscal 2015 from 61,279 units in Fiscal 2014. Our exports of vehicles manufactured in India increased marginally by 2.1% in Fiscal 2015 to 47,961 units from 46,983 units in Fiscal 2014. The improvement of the geopolitical situation in the South Asian Association for Regional Cooperation region has contributed to an increase in investment in capital goods, which has helped us to improve volumes in this region generally, and particularly in Bangladesh. In addition, the launch of new models in the Middle East and Africa region, along with the opening up of new markets in this region contributed to an increase in international sales volumes. Our top five export destinations for vehicles manufactured in India, that is, Bangladesh, Sri Lanka, Nepal, South Africa and Indonesia, accounted for approximately 56% and 79% of the exports of commercial vehicles and passenger vehicles, respectively. We intend to strengthen our position in the geographic areas we are currently operating in and explore possibilities of entering new markets with similar market characteristics to the Indian market.
TDCV, our subsidiary company engaged in the design, development and manufacturing of M&HCVs, recorded a 9.9% increase in its overall vehicle sales to 11,640 units in Fiscal 2015 from 10,594 units in Fiscal 2014. In the South Korean market, TDCV’s sales have increased by 3.4% from 6,584 units in Fiscal 2014 to 6,808 units in Fiscal 2015, primarily due to higher sales in October to December 2014, prompted by emissions norms effective from January 2015. TDCV exported 4,832 units in Fiscal 2015, compared to 4,010 units in Fiscal 2014, an increase of 20.5%. Sluggish market conditions in Russia, South Africa, Algeria and Laos due to adverse sociopolitical conditions were partially offset by increases in sales volumes in Vietnam, the Philippines, and the UAE. The Ukraine crisis and financial sanctions contributed to sluggish market conditions in Russia, which affected currency exchange rates and lessened demand for automobiles and for new large projects. Overall sales in South Africa have been affected by the depreciation of the South African Rand and overall limited economic growth. In Algeria and Laos, vehicle demand has been affected by continued political and economic uncertainties, general economic conditions and the absence of major projects. In Vietnam, TDCV has been able to develop new fleet customers to take advantage of a shift in demand to more lightweight commercial vehicles due to stricter application of vehicle-weight regulations.
Tata and other brand vehicles—Sales and Distribution
Our sales and distribution network in India as at March 2015 comprises approximately 3,904 contact points for sales and service for our passenger and commercial vehicle business. Our subsidiary, TML Distribution Company Limited, or TDCL, acts as a dedicated distribution and logistics management company to support the sales and distribution operations of our vehicles in India. We believe this has improved the efficiency of our selling and distribution operations and processes. We use a network of service centers on highways and a toll-free customer assistance center to provide 24-hour on-road maintenance, including replacement of parts, to vehicle owners.
TDCL provides distribution and logistics support for vehicles manufactured at our facilities and has set up stocking points at some of our plants and at different places throughout India. TDCL helps us improve planning, inventory management, transport management and timely delivery. We have completed the initial rollout of a new customer relations management system, or CRM, at all of our dealerships and offices across the country, which supports users both at our company and among our distributors in India and abroad.
We market our commercial and passenger vehicles in several countries in Africa, Middle East, South East Asia, South Asia, Australia, Russia and the Commonwealth of Independent States countries. We have a network of distributors in all such countries, where we export our vehicles. Such distributors have created a network of dealers and branch offices and facilities for sales and after-sales servicing of our products in their respective markets. We have also stationed overseas resident sales and service representatives in various countries to oversee our operations in the respective territories.
Tata and other brand vehicles—Competition
We face competition from various domestic and foreign automotive manufacturers in the Indian automotive market. Improving infrastructure and robust growth prospects compared to other mature markets have attracted a number of international companies to India who have either formed joint ventures with local partners or have established independently owned operations in India. Global competitors bring with them decades of international experience, global scale, advanced technology and significant financial resources, and as a result, competition is likely to further intensify in the future. We have designed our products to suit the requirements of the Indian market based on specific customer needs such as safety, driving comfort, fuel efficiency and durability. We believe that our vehicles are suited to the general conditions of Indian roads and the local climate. The vehicles have also been designed to comply with applicable environmental regulations currently in effect. We also offer a wide range of optional configurations to meet the specific needs of our customers. We intend to develop and are developing products to strengthen our product portfolio in order to meet the increasing customer expectation of owning world class products.
Tata and other brand vehicles—Seasonality
Demand for our vehicles in the Indian market is subject to seasonal variations. Demand generally peaks between January and March, although there is a decrease in demand in February just before release of the Government of India’s fiscal budget. Demand is usually lean from April to July and picks up again in the festival season from September onwards, with a mileagedecline in December due to model year change.
Tata and other brand vehicles—Vehicle Financing
Through our vehicle financing division and wholly owned subsidiary, TMFL, we also provide financing services to purchasers of 25 kmpl,our vehicles through our independent dealers, who act as our agents, and through our branch network. The vehicle financing is intended to encourage sale of vehicles by providing financing to the dealers’ customers and as such is an integral part of automotive business.
TMFL disbursed Rs.73,156 million and Rs.87,676 million in vehicle financing during Fiscal 2015 and 2014, respectively. During Fiscal 2015 and 2014, approximately 24% and 30%, respectively, of our vehicle unit sales in India were made by the dealers through financing arrangements where our captive vehicle financing divisions provided the support. Total vehicle finance receivables outstanding as at March 31, 2015 and 2014 amounted to Rs.158,016 million and Rs.185,275 million, respectively. As at March 31, 2015 and 2014 our customer finance receivable portfolio comprised 687,580 and 732,550 contracts, respectively. We follow specified internal procedures, including quantitative guidelines, for selection of our finance customers to assist in managing default and repayment risk in our portfolio. We originate all of the contracts through our authorized dealers and direct marketing agents with new exteriorswhom we have agreements. All our marketing, sales and additional convenience features, launchedcollection activities are undertaken through dealers or by TMFL.
We securitize or sell our finance receivables on the Manza Club Class with firstbasis of evaluation of market conditions and funding requirements. The constitution of these pools is based on criteria that are decided by credit rating agencies and/or based on the advice that we receive regarding the marketability of a pool. We undertake these securitizations of our receivables in class features like 6.5” infotainment screen with voice enabled GPS guidance system, infinity roof, premium Italian leather seating systemeither or both of the following forms:
Assignment of the receivables due from purchasers under loan agreements; and plush interiors
Securitization of receivables due from purchasers by means of private placement.
We act as collection agent on behalf of the investors, representatives, special purpose vehicles or banks, in whose favor the receivables have been assigned, for the purpose of collecting receivables from the purchasers on the terms and conditions contained in the applicable deeds of securitization, in respect of which pass-through certificates are issued to investors in case of special purpose vehicles, or SPVs. We also secure the payments to be made by the purchasers of amounts constituting the receivables under the loan agreements to the extent specified by rating agencies by any one or all of the following methods:
Furnishing to the investors collateral, in respect of the obligations of the purchasers and the Nano MY13 with features like music system with Bluetooth/USB, glove box, refreshed interiors, etc.,undertakings to be provided by us;
Furnishing, in an arrayfavor of colours.
Utility vehicles: We launched the Tata Safari Storme with new interiorsinvestors, 10.88% to 14.90% of the gross receivables as cash collateral, for securitizations done till Fiscal 2014, either by way of a fixed deposit or bank guarantee to secure the obligations of the purchasers and improved performance with features like disc brakeour obligations as the collection agent, based on all wheelthe quality of receivables and projector lens head lamp, we also launched Tata Aria Pure LX, a new variant with a bouquetrating assigned to the individual pool of features.receivables by the rating agency(ies); and
By way of over-collateralization or by investing in subordinate pass-through certificates to secure the obligations of the purchasers.
For further details see Note 36(b) to our consolidated financial statements included elsewhere in this annual report on Form 20-F.
Jaguar F-Type:Land Rover We launched
In Fiscal 2015, Jaguar Land Rover continued to grow in all of its geographic markets on an annual basis, although retail sales in China decreased by 20.4% in the fourth quarter of Fiscal 2015 compared to the same period in Fiscal 2014. Growth in volume has been driven by the continued success of the Range Rover, Range Rover Sport and the Jaguar F-TYPE. More established models such as the Range Rover Evoque and the Land Rover Discovery have also been performing well, however more mature products such as the Jaguar XF and XJ experienced lower sales in anticipation of the introduction of the all new Jaguar XE and the new Jaguar XF. Production of Jaguar XK and the Land Rover Freelander were terminated during the year, with the latter replaced by the Land Rover Discovery Sport.
Our total wholesale sales of Jaguar Land Rover in Fiscal 2015, 2014 and 2013 are set forth in the table below:
| Fiscal 2015 | Fiscal 2014 | Fiscal 2013 | ||||||||||||||||||||||
| Units | % | Units | % | Units | % | |||||||||||||||||||
Jaguar | 78,083 | 16.5 | % | 80,644 | 18.7 | % | 57,766 | 15.5 | % | |||||||||||||||
Land Rover | 394,945 | 83.5 | 351,245 | 81.3 | 314,290 | 84.5 | ||||||||||||||||||
Total | 473,028 | 100.0 | % | 431,889 | 100.0 | % | 372,056 | 100.0 | % | |||||||||||||||
Wholesale volumes in Fiscal 2015 increased by 9.5% to 473,028 units from 431,889 units in Fiscal 2014. Wholesale volumes for Land Rover in Fiscal 2015 increased by 12.4% to 394,945 units from 351,245 units in Fiscal 2014. The increase in sales occurred in a majority of models, most notably the Range Rover and Range Rover Sport, which was partially offset by the inventory shortages of the Freelander (which had ceased production) while Jaguar Land Rover initiated production of the Discovery Sport (which had recently commenced production). However, wholesale volumes for Jaguar in Fiscal 2015 decreased by 3.2% to 78,083 units from 80,644 units sold in Fiscal 2014. Increased sales of the Jaguar F-TYPE convertible,were offset by a fall in volume of the maturing Jaguar XF and XJ models in advance of the introduction of the Jaguar XE and the Jaguar XF.
The strengths of the Jaguar Land Rover business include its internationally recognized brands, strong product portfolio of award-winning luxury performance cars and premium all-terrain vehicles, global distribution network, strong research and development capabilities, and a strong management team.
Jaguar Land Rover’s performance in key geographical markets on retail basis
Retail volumes in Fiscal 2015 increased by 6.4% to 462,209 units from 434,311 units Fiscal 2014. The overall increase in sales volumes was primarily due to strong sales of the Range Rover, Range Rover Sport and the Jaguar F-TYPE vehicles, which was partially offset by the lack of available Freelander inventory. For Land Rover, retail volumes increased by 8.9% to 385,279 units in Fiscal 2015 from 353,789 units in Fiscal 2014. However, for Jaguar, retail volumes in Fiscal 2015 decreased by 4.5% to 76,930 units from 80,522 units in Fiscal 2014, as increased sales of the Jaguar F-TYPE were offset by a decrease in volume of the maturing Jaguar XF and XJ models in advance of the introduction of the Jaguar XE and the all new Jaguar XF. Furthermore, retail sales volumes in China decreased by 20.4% in the fourth quarter of Fiscal 2015 compared to the same period in Fiscal 2014. Jaguar Land Rover exports increased by 6.9% to 378,427 units in Fiscal 2015 from 354,005 units in Fiscal 2014.
United Kingdom
Industry vehicle sales rose by 7.5% in Fiscal 2015 in the United Kingdom compared to Fiscal 2014 as economic growth improved inflation and interest rates remained low and labor market conditions continued to strengthen. Jaguar Land Rover retail volumes increased by 13.1% to 86,750 units in Fiscal 2015 from 76,721 units in Fiscal 2014, with a strong sales performance from Jaguar, up 7.0% in Fiscal 2015, which was driven by sales of the Jaguar F-TYPE and the XF. Land Rover retail volumes increased by 14.8%, as all models experienced an increase in volumes, most notably the Range Rover Sport and the Discovery.
North America
Economic performance in the United States continued to strengthen over the year as unemployment continued to fall, lower inflation driven by lower energy prices increased disposable incomes and consumer confidence continued to grow contributing to an industry-wide increase in passenger car sales of 6.8% in Fiscal 2015 compared to Fiscal 2014. Jaguar Land Rover retail volumes increased by 3.6% to 78,372 units from 75,671 units in Fiscal 2014, with a 9.5% increase in Land Rover retail volumes as Range Rover, Range Rover Sport and Range Rover Evoque continued to perform well. Jaguar volumes in North America decreased by 13.6% as sales of the aging XF and XJ decreased, which was partially offset by strong sales of the popular F-TYPE.
Europe
Passenger car sales increased by 5.5% industry-wide in Europe despite low growth, recessionary pressures and ambiguity over the Greek national debt negotiations, while quantitative easing announced by the European Central Bank in January 2015 has provided a boost in economic activity more recently. Jaguar Land Rover volumes in Europe increased by 6.0% to 87,863 units in Fiscal 2015 from 82,854 units in Fiscal 2014, with sales particularly strong in Germany, Italy and France. Land Rover volumes increased by 9.2% in Fiscal 2015 as sales of the Range Rover Sport and Range Rover grew significantly. Jaguar volumes decreased by 14.2% in Fiscal 2015, as sales of the aging XF sedan and Sportbrake decreased, which was partially offset by solid sales of theF-TYPE.
China
Despite continuing signs of softening in the Chinese economy during the year, GDP still grew over 7.0% and passenger car sales increased by 9.6%. Jaguar Land Rover retail volumes, which include sales from our joint venture with Chery increased by 12.5% to 115,969 units in Fiscal 2015 from 103,077 units in Fiscal 2014. However, in the fourth quarter of Fiscal 2015, retail sales of Jaguar Land Rover in China decreased by 20.4% to 23,526 units from 29,567 units compared to the same period in Fiscal 2014 due to inventory shortages of the Land Rover Freelander (which had ceased production) and the Land Rover Discovery Sport and the locally produced Range Rover Evoque (which had recently commenced production). This decline in retail sales of Jaguar Land Rover has continued in the first quarter of Fiscal 2016. Retail sales of Land Rover increased by 14.8% in Fiscal 2015 with sales of the majority of models up, most notably the Range Rover and Range Rover Sport, while Jaguar retail sales increased by 2.8% in Fiscal 2014, as both the XF and F-TYPE performed well.
Asia Pacific
The Asia Pacific region most notably comprises Australia, Japan and South Korea for purposes of our Jaguar Land Rover operations. Jaguar Land Rover retail volumes increased by 16.8% to 26,619 units in Fiscal 2015 from 22,795 units in Fiscal 2014, most notably in South Korea (increased by 46.7%) and in Australia (increased by 16.4%) as consumer demand for Jaguar Land Rover products continued to rise in these markets. Retail sales of the Range Rover, Range Rover Sport, Land Rover Discovery and Jaguar F-TYPE performed particularly well in the Asia Pacific region. Land Rover sales increased by 21.1% and Jaguar retail sales increased by 1.3% in Fiscal 2015.
Other overseas markets
Jaguar Land Rover’s retail volumes in the other overseas markets declined by 9.0% to 66,636 units in Fiscal 2015 from 73,193 units in Fiscal 2014, primarily as a consequence of economic sanctions and low energy prices impacting Russia and slowing economic growth reducing consumer spending in Brazil and South Africa. Slowing economic growth and ongoing recessionary pressures in Brazil have contributed to a decrease in automotive sales industry-wide of 11.0% in Fiscal 2015 compared to Fiscal 2014, and Jaguar Land Rover sales volumes in Brazil have followed suit, decreasing 16.6% in Fiscal 2015 compared to Fiscal 2014. Continuing economic sanctions and softer energy prices have had an adverse effect on passenger car sales industry-wide in Russia, which decreased 17.7% in Fiscal 2015 compared to Fiscal 2014. Jaguar Land Rover sales, however, have fallen comparatively slower, decreasing 9.6% in Fiscal 2015 compared to Fiscal 2014, as Range Rover Sport continued to perform well and F-TYPE volumes increased. South Africa’s persistent slow growth continues to impact the automotive industry as passenger car sales fell by 1.7% in Fiscal 2015 compared to Fiscal 2014 and Jaguar Land Rover retail volumes dropped by 23.2% in Fiscal 2015 compared to Fiscal 2014.
We sold 2,873 units of Jaguar Land Rover vehicles in India through our exclusive dealerships in Fiscal 2015 as compared to 2,805 units in Fiscal 2014, an increase of 1.2%, which was aided by the manufacture of the Jaguar XF, Jaguar XJ and the Range Rover Evoque in India, as vehicles manufactured and sold in India are not subject to certain import duties. We expect that the continued efforts towards dealership network expansion and local manufacturing of Jaguar Land Rover products will enable us to further penetrate the premium/luxury automotive passenger car market in India.
Jaguar Land Rover—Sales & Distribution
Jaguar Land Rover markets products in 170 countries, through a global network of 19 national sales companies, 73 importers, 53 export partners and 2,674 franchise sales dealers, of which 915 are joint Jaguar Land Rover dealers, which operate independently. Jaguar Land Rover has regional offices in certain countries that manage customer relationships, vehicle supplies and provide marketing and sales support to their regional importer markets. The remaining importer markets are managed from the United Kingdom. Jaguar Land Rover products are sold to retail customers through our global dealership network and to fleet customers, including daily rental car companies, commercial fleet customers, leasing companies, and governments. As a consequence, Jaguar Land Rover has a diversified customer base, which reduces its dependence on any single customer or group of customers.
Jaguar Land Rover has established business processes and systems designed to ensure that its production plans meet anticipated retail sales demand and to enable the active management of its inventory of finished vehicles and dealer inventory throughout its network. Jaguar Land Rover has multi-year exclusive branded arrangements in place with Black Horse (part of the Lloyds Bank Group) in the UK, FCA Bank (a joint venture between Fiat Chrysler Auto and Credit Agricole) in Europe and Chase Auto Finance in the United States for the provision of dealer and consumer financial services products. Jaguar Land Rover has similar arrangements with local automotive financial services providers in other key markets. Jaguar Land Rover’s financing partners offer its customers a full range of consumer financing options.
Jaguar Land Rover—Competition
Jaguar Land Rover operates in a globally competitive environment and faces competition from established premium and other vehicle manufacturers who aspire to move into the premium performance car and premium SUV markets, some of which are much larger than we are. Jaguar vehicles compete primarily against other European brands such as Audi, BMW and Mercedes Benz. Land Rover and Range Rover vehicles compete largely against SUVs manufactured by Audi, BMW, Infiniti, Lexus, Mercedes Benz, Porsche and Volkswagen. The Land Rover Defender competes with vehicles manufactured by Isuzu, Nissan and Toyota.
Jaguar Land Rover—Seasonality
Jaguar Land Rover sales volume is impacted by the semi-annual registration of vehicles in the United Kingdom where the vehicle registration number changes every six months, which in turn has an impact on the resale value of the vehicles. This leads to a concentration of sales during the periods when the change occurs. Seasonality in most other markets is driven by introduction of new model year derivatives, for example in the U.S. market. Additionally in the U.S. market there is some seasonality around the purchase of vehicles in northern states where the purchase of Jaguar vehicles is concentrated in the spring /summer months, and the purchase of 4x4 vehicles is concentrated in the autumn/winter months. In China, there is an increase in vehicle purchases during the fourth fiscal quarter, which includes the Chinese New Year holiday. Furthermore, western European markets tend to be impacted by summer and winter holidays. The resulting sales profile influences operating results on a quarter-to-quarter basis.
Other Operations
In addition to our automotive operations, we are also involved in other business activities, including information technology services. Net revenues, before inter-segment elimination, from these activities totaled Rs.27,152 million, Rs.24,989 million and Rs.22,179 million in Fiscal 2015, 2014 and 2013, respectively, representing nearly 1.0%, 1.1% and 1.2% of our total revenues before inter-segment elimination in the corresponding Fiscal periods.
Information Technology Services
As at March 31, 2015, we owned a 72.32% equity interest in our subsidiary, TTL. TTL, founded in 1994 and a part of Tata Motors Group, provides product development IT services solutions for PLM and Enterprise Resource Management, or ERM, to automotive, aerospace and consumer durables manufacturers and their suppliers. TTL’s services include product design, analysis and production engineering, knowledge-based engineering, PLM, ERM and CRM systems. TTL also distributes, implements and supports PLM products from leading solution providers in the world such as Dassault Systems and Autodesk.
TTL has its international headquarters in Singapore, with regional headquarters in the United States, India and the United Kingdom. In Fiscal 2014, TTL acquired Cambric Corporation, an engineering services organization, to achieve greater domain expertise and presence in the industrial equipment sector. TTL has a combined global workforce of around 7,804 professionals serving clients worldwide from facilities in the North America, Europe, and Asia Pacific regions. TTL responds to customers’ needs through its subsidiary companies and through its offshore development centers in India, Thailand and Romania. TTL had 14 functional subsidiary companies and one joint venture as at March 31, 2014.
The consolidated revenues of TTL increased by 10.3% in Fiscal 2015 to Rs.26,170 million (including sales to Tata Motors Limited and its consolidated subsidiaries) from Rs.23,724 million in Fiscal 2014 due to operations in the automotive and aerospace markets. TTL recorded profit after tax of Rs.3,349 million in Fiscal 2015, reflecting an increase of 26.8% over Rs.2,642 million in Fiscal 2014.
Research and Development
Over the years, we have devoted significant resources towards our research and development activities. Our research and product development costs in Fiscal 2015, 2014 and 2013 were Rs. 28,515.3 million, Rs. 25,651 million and Rs. 20,340 million, respectively. Our research and development activities focus on product development, environmental technologies and vehicle safety. In India, our Engineering Research Centre, or ERC, established in 1966, is one of the few in-house automotive research and development centers in India recognized by the Government of India. The ERC is integrated with all of the Tata Motors Global Automotive Product Design and Development Centers in South Korea, Italy and the United Kingdom. In addition to this, we leverage key competencies through various engineering service suppliers and design teams of its suppliers.
We have a new passenger car electrical and electronics facility for the development of hardware-in-the-loop systems, labcars and infotainment systems to achieve system and component integration. We have an advance engineering workshop, with a lithium-ion battery module, for the development of electric vehicle and hybrid products. We have a crash test facility for passive safety development in order to meet regulatory and consumer group test requirements and evaluate occupant safety, which includes a full vehicle-level crash test facility, a sled test facility for simulating the crash environment on subsystems, a pedestrian safety testing facility, a high strain rate machine and a pendulum impact test facility for goods carrier vehicles. This facility is also supported with computer-aided engineering infrastructure to simulate tests in a digital environment. Our safety development facilities also incorporate other equipment that we believe will help improve the safety and design of our vehicles, such as an emission labs engine development facility, a testing facility for developing vehicles with lower noise and vibration levels, an engine emission and performance development facility and an eight poster test facility that helps to assess structural durability of M&HCVs. In addition, we are installing a new engine noise test facility and transmission control unit which we expect will aid in powertrain development. Other key facilities include a full vehicle environmental testing facility, material pair compatibility equipment, corrosion test facility, heavy duty dynamometers and aggregate endurance test rigs.
Our product design and development centers aim to create a highly scalable digital product development and virtual testing and validation environment, targeting a reduction in product development cycle-time, improved quality and the ability to create multiple design options. Global design studios are key part of our product conceptualization strategy. We have aligned our end-to-end digital product development objectives and infrastructure with our business goals and have made significant investments to enhance our capabilities, especially in the areas of product development through computer-aided design, computer aided manufacturing, computer-aided engineering, knowledge-based engineering, product lifecycle management and manufacturing planning. In specific engineering review processes, such as digital mock-up and virtual build and validation, we have been able to provide capabilities for reduced time and increased quality in product designs. The design IP is managed through a product lifecycle management system, enabling backbone processes, and we have institutionalized “issue tracking” work-flow based systems in various domains to manage them effectively.
We have begun developing a technology platform for small electric vehicles with a GVW of one ton or greater with the National Automotive Board, SIAM and other OEMs. In addition, our research and development activities also focus on developing vehicles that consume alternative fuels, including CNG, liquefied petroleum gas, bio-diesel, compressed air and electricity. We are continuing to develop green-technology vehicles and are presently developing an electric vehicle on a small commercial vehicle platform. We are also pursuing alternative fuel options such as ethanol blending. Furthermore, we are working on development of vehicles fueled by hydrogen.
We are also pursuing various initiatives, such as the introduction of premium lightweight architecture, to enable our business to comply with the existing and evolving emissions legislations in the developed world, which we believe will be a key enabler of both reduction in CO2 and further efficiencies in manufacturing and engineering.
We have implemented initiatives in vehicle electronics, such as engine management systems, in-vehicle network architecture and multiplexed wiring. We are in the process of implementing electronic stability programs, automated and automatic transmission systems, telematics for communication and tracking, anti-lock braking systems and intelligent transportation systems. We have implemented new driver information technologies and high performance infotainment systems with IT enabled services. Likewise, various new technologies and systems including hybrid technologies that would improve the safety, performance and emissions of our product range and are being implemented in our passenger cars and commercial vehicles.
We are developing an enterprise-level vehicle diagnostics system with global connectivity in order to achieve faster diagnostics of complex electronics in vehicles in order to provide prompt service to customers. We are also developing prognostic data collection and analysis for failure prediction to the end customer. Furthermore, our initiative in telematics has spanned into a fleet management, driver information and navigation systems, and vehicle tracking system using global navigation satellite systems. We intend to incorporate Wi-Fi and Bluetooth interfaces in our vehicles to facilitate secure and controlled connectivity to third-party IT enabled devices.
Jaguar Land Rover’s research and development operations are built around engineering facilities that feature an extensive test track, testing centers, design hubs and a recently inaugurated virtual innovation center. The ERC in India and Jaguar Land Rover’s engineering and development operations in the United Kingdom have identified areas to leverage the facilities and resources to enhance the product development process and achieve economies of scale.
Jaguar Land Rover’s two design and development centers are equipped with computer-aided design, manufacturing and engineering tools configured to support an ambitious product development cycle plan. In recent years, Jaguar Land Rover has refreshed the entire Jaguar range under a unified concept and design language and has continued to enhance the design of Land Rover’s range of all-terrain vehicles. Jaguar Land Rover’s R&D operations look for synergies through sharing premium technologies, powertrain designs and vehicle architecture. The majority of Jaguar Land Rover’s products are designed and engineered in the United Kingdom. Jaguar Land Rover endeavors to implement the best technologies into its product range to meet the requirements of a globally competitive market and to comply with regulatory requirements. Jaguar Land Rover currently offers hybrid technology on some of its models such as the Range Rover and Range Rover Sport and conducts research and development related to the further application of alternative fuels and technologies to further improve the environmental performance of its vehicles, including the reduction of CO2 emissions.
We endeavor to absorb the best of technologies for our product range to meet the requirements of a globally competitive market. All of our vehicles and engines are compliant with the prevalent regulatory norms in the respective countries in which they are sold.
Intellectual Property
We create, own, and maintain a wide array of intellectual property assets throughout the world that are among our most valuable assets. Our intellectual property assets include patents, trademarks, copyrights designs, trade secrets and other intellectual property rights. We proactively and aggressively seek to protect our intellectual property in India and other countries.
We own a number of patents and have applied for new patents which are pending for grant in India as well as in other countries. We have also filed a number of patent applications outside India under the Patent Cooperation Treaty, which we expect will be effective in other countries going forward. We also obtain new patents as part of our ongoing research and development activities.
We own registrations for a number of trademarks and have pending applications for registration of these in India as well as other countries. The registrations mainly include trademarks for our vehicle models and other promotional initiatives. We use the Tata brand, which has been engineeredlicensed to us by Tata Sons. We believe that establishment of the Tata word mark and logo mark in India and around the world is material to our operations. As part of our acquisition of TDCV, we have rights to the perpetual and exclusive use of the Daewoo brand and trademarks in South Korea and overseas markets for the product range of TDCV.
As part of the acquisition of our Jaguar Land Rover business, ownership (or co-ownership, as applicable) of core intellectual property associated with Jaguar Land Rover was transferred to us; however such intellectual property is still ultimately owned by Jaguar Land Rover entities. Additionally, perpetual royalty-free licenses to use other essential intellectual property have been granted to us for use in Jaguar and Land Rover vehicles. Jaguar Land Rover owns registered designs to protect the design of its vehicles in several countries.
In varying degrees, all of our intellectual property is important to us. In particular, the Tata, Jaguar, Land Rover and Range Rover brands are integral to the conduct of our business, a loss of which could lead to dilution of our brand image and have a material adverse effect on our business.
Components and Raw Materials
The principal materials and components required by us for use in Tata and other brand vehicles are steel sheets (forin-house stampings) and plates, iron and steel castings and forgings, items such as alloy wheels, tires, fuel injection systems, batteries, electrical wiring systems, electronic information systems and displays, interior systems such as seats, cockpits, doors, plastic finishers and plastic functional parts, glass and consumables, such as paints, oils, thinner, welding consumables, chemicals, adhesives and sealants, and fuels. We also require aggregates such as axles, engines, gear boxes and cams for our vehicles, which are manufactured in-house or by our subsidiaries, affiliates, joint ventures or operations and strategic suppliers. We have long-term purchase agreements for certain critical components such as transmissions and engines. We have established contracts with certain commodity suppliers to cover our own as well as our suppliers’ requirements in order to moderate the effect of volatility in commodity prices. We have also undertaken special initiatives to reduce material consumption through value engineering and value analysis techniques.
Our sourcing department in India has four divisions, namely, Purchasing, Supplier Quality, Supply Chain and Production and Planning Management or PPM. The reorganization was done with a view to establish and define responsibility and accountability in the sourcing department. Purchasing oversees the commercial aspects of product sourcing, Supplier Quality is primarily responsible for maintaining the quality of supplies that we purchase, Supply Chain oversees the logistics of the supply and delivery of parts for our vendors while PPM oversees execution of new projects.
As part of our strategy to become a low-cost vehicle manufacturer, we have undertaken various initiatives to reduce our fixed and variable costs. In India we started an e-sourcing initiative in 2002, pursuant to which we procure some supplies through reverse auctions. We also use external agencies as third party logistic providers. This has resulted in space and cost savings. Our initiatives to leverage information technology in supply chain activities have resulted in improved efficiency through real time information exchange and processing with our suppliers.
We have an established supplier quality sixteen step process in order to ensure quality of outsourced components. We formalized the component development process using Automotive Industry Action Group guidelines. We also have a program for assisting vendors from whom we purchase raw materials or components to maintain quality. Preference is given to vendors with TS 16949 certification. We also maintain a stringent quality assurance program that includes random testing of production samples, frequent re-calibration of production equipment and analysis of post-production vehicle performance, as well as an ongoing dialogue with workers to reduce production defects.
We are also exploring opportunities for increasing the global sourcing of parts and components from low cost countries, and have in place a vendor management program that includes vendor base rationalization, vendor quality improvement and vendor satisfaction surveys. We have begun to include our supply chain in our initiatives on social accountability and environment management activities, including supply chain carbon footprint measurement and knowledge sharing on various environmental aspects.
The principal materials and components required for use in our Jaguar Land Rover vehicles are steel and aluminum sheets, aluminum castings and extrusions, iron and steel castings and forgings, and items such as alloy wheels, tires, fuel injection systems, batteries, electrical wiring systems, electronic information systems and displays, leather-trimmed interior systems such as seats, cockpits and doors, plastic finishers and plastic functional parts, glass and consumables, such as paints, oils, thinner, welding consumables, chemicals, adhesives and sealants, and fuels. Jaguar Land Rover also requires certain highly functional components such as axles, engines and gear boxes for its vehicles, which are mainly manufactured by strategic suppliers. We have long-term purchase agreements for critical components such as transmissions with ZF Friedrichshafen AG and for engines with Ford and the Ford-PSA Peugeot Citroën joint venture, or the Ford-PSA joint venture. The components and raw materials in Jaguar Land Rover cars include steel, aluminum, copper, platinum and other commodities. Jaguar Land Rover has established contracts with certain commodity suppliers, such as Novelis, to cover its own and its suppliers’ requirements to mitigate the effect of high volatility. Special initiatives are also undertaken to reduce material consumption through value engineering and value analysis techniques.
Jaguar Land Rover works with a range of strategic suppliers to meet their requirements for parts and components, and we endeavor to work closely with our suppliers to form short- and medium-term plans for our business. We have established quality control programs to ensure that externally purchased raw materials and components are monitored and meet our quality standards. Jaguar Land Rover also outsources many of the manufacturing processes and activities to various suppliers. Where this is the case, Jaguar Land Rover provides training to the outside suppliers who design and manufacture the required tooling and fixtures. Such programs include site engineers who regularly interface with suppliers and carry out visits to supplier sites to ensure that relevant quality standards are being met. Site engineers are also supported by persons in other functions, such as program engineers who interface with new model teams as well as resident engineers located at Jaguar Land Rover plants, who provide the link between the site engineers and the plants. Jaguar Land Rover has in the past worked, and expect to continue to work, with its suppliers to optimize their procurements, including by sourcing certain raw materials and component requirements from low-cost countries.
Although we have commenced production of Ingenium four cylinder (2.0-liter) engines which will be installed in the Jaguar XE from 2015, at present we continue to source all of our engines from Ford or the joint venture between Ford and PSA on an arm’s-length basis.
Suppliers
We have an extensive supply chain for procuring various components. We also outsource many manufacturing processes and activities to various suppliers. In such cases, we provide training to external suppliers who design and manufacture the required tools and fixtures.
Our associate company, Tata AutoComp Systems Ltd., or TACO, manufactures automotive components and encourages the entry of internationally acclaimed automotive component manufacturers into India by setting up joint ventures with them.
Our other suppliers include some of the large Indian automotive supplier groups with multiple product offerings, such as the Anand Group, the Sona Group, and the TVS Group, as well as large multinational suppliers, such as Bosch, Continental, Delphi and Denso, Johnson Controls Limited for seats and Yazaki AutoComp Limited for wiring harnesses. We continue to work with our suppliers for our Jaguar Land Rover business to optimize procurements and enhance our supplier base, including for the sourcing of certain of our raw material and component requirements. In addition, the co-development of various components, such as engines, axles and transmissions also continue to be evaluated, which we believe may lead to the development of a low-cost supplier base for Jaguar Land Rover.
In India, we have established vendor parks in the vicinity of our manufacturing operations and vendor clusters have been formed at our facilities at Pantnagar and Sanand. This initiative is aimed at ensuring availability of component supplies on a real-time basis, thereby reducing logistics and inventory costs as well as reducing uncertainties in the long distance supply chain. Efforts are being taken to replicate the model at new upcoming locations as well as a few existing plant locations.
As part of our pursuit of continued improvement in procurement, we have integrated our system for electronic interchange of data with our suppliers. This has facilitated real time information exchange and processing, which enables us to manage our supply chain more effectively.
We have established processes to encourage improvements through knowledge sharing among our vendors through an initiative called the Vendor Council, which consists of our senior executives and representatives of major suppliers. The Vendor Council also helps in addressing common concerns through joint deliberations. The Vendor Council works on four critical aspects of engagement between us and the suppliers: quality, efficiency, relationships and new technology development.
We import some components that are either not available in the domestic market or when equivalent domestically-available components do not meet our quality standards. We also import products to take advantage of lower prices in foreign markets, such as special steels, wheel rims and power steering assemblies.
Ford has been and continues to be a major supplier of parts and services to Jaguar Land Rover. In connection with our acquisition of Jaguar Land Rover in June 2008, long-term agreements were entered into with Ford for technology sharing and joint development providing technical support across a range of technologies focused mainly around power train engineering so that we may continue to operate according to our existing business plan. Supply agreements, were entered into with Ford for (i) the long term supply of engines developed by Ford, (ii) engines developed by us but manufactured by Ford and (iii) engines from the Ford-PSA joint venture.
Following the global financial crisis and its cascading effect on the financial health of our suppliers, we have commenced efforts to assess supplier financial risk.
Suppliers are appraised based on our long-term requirements through a number of platforms such as Vendor Council meetings, council regional chapter meetings, national vendor meets and location-specific vendor meets.
Capital and Product Development Expenditures
Our capital expenditure totaled Rs.335,771 million, Rs.272,832 million and Rs.212,078 million during Fiscal 2015, 2014 and 2013, respectively. Our capital expenditure during the past three Fiscal years related primarily to new product development and capacity expansion for new and existing products to meet market demand as well as investments towards improving quality, reliability and productivity that are each aimed at increasing operational efficiency.
We intend to continue to invest in our business units in general, and in research and product development in particular, over the next several years in order to improve our existing product range, develop new products and platforms and to build and expand our portfolio in the passenger vehicle and commercial vehicle categories. We believe this will strengthen our position in the Indian automotive market and help us to grow our market share internationally.
As part of this future growth strategy, we plan to make investments in product development, capital expenditure in capacity enhancement, plant renewal and modernization and to pursue other growth opportunities. Our subsidiaries also have their individual growth plans and related capital expenditure plans. These expenditures are expected to be funded largely through cash generated from operations, existing investible surplus in the form of cash and cash equivalents, investment securities and other external financing sources.
Governmental Regulations
Governmental Regulations in India
Automotive Mission Plan, 2006-2016
The automotive mission plan, or Plan 2006, promulgated by the Ministry of Heavy Industries and Public Enterprises of the Government of India in December 2006, consists of recommendations to the task force of the Development Council on Automobile and Allied Industries constituted by the Government of India in relation to the preparation of the mission plan for the Indian automotive industry. Plan 2006 recommends that a negative list of items, such as no duty concessions for the import of used or remanufactured vehicles, or treatment of remanufactured automotive products as old products, should be negotiated for free trade agreements or regional trade agreements, on a case-by-case basis with other countries. It recommends the adoption of appropriate tariff policies to attract more investment into the automobile industry, the improvement of power infrastructure to facilitate faster growth of the automotive sector both domestically and internationally, policy initiatives such as encouragement of collaboration between the automotive industry and research and academic institutions, tax concessions and incentives to enhance competitiveness in manufacturing and promotion of research and technology development. For the promotion of exports in the automotive components sector, among other things, it recommends the creation of special automotive component parks in special economic zones and the creation of virtual special economic zones, which would enjoy certain exemptions on sales tax, excise duty and customs duty. Other major recommendations of the plan include strengthening the inspection and certification system by encouraging public-private partnerships and rationalization of motor vehicles regulations.
A committee set up under the chairmanship of the Secretary of the Ministry of Heavy Industries and Public Enterprises consisting of all stakeholders, including representatives of the Ministry of Finance, and of other interested parties relating to road transport, the environment, commerce, industrial policy and promotion, labor, shipping, railways, human resource development, science and technology, new and renewable energy, petroleum and natural gas and the automotive industry, will monitor the implementation and progress of Plan 2006.
As of the date of this annual report on Form 20-F, Plan 2006 is being reviewed by Ministry of Heavy Industries and Public Enterprises of the Government of India.
The Auto Policy, 2002
The Auto Policy was introduced by the Department of Heavy Industry, Ministry of Heavy Industries and Public Enterprises of the Government of India in March 2002, with the aims, among other things, of promoting a globally competitive automotive industry that would emerge as a global source for automotive components, establishing an international hub for manufacturing small, affordable passenger cars, ensuring a balanced transition to open trade at a minimal risk to the Indian economy and local industry, encouraging modernization of the industry and facilitating indigenous design, research and development, as well as developing domestic safety and environment standards on par with international standards.
Auto Fuel Vision & Policy 2025
The Ministry of Petroleum and Natural Gas constituted an expert committee under the Chairmanship of Shri Saumitra Chaudhuri, Member Planning Commission, on December 19, 2012. Its objective was to recommend auto fuel quality applicable through model year 2025. The committee in its draft report has recommended Bharat Stage IV compliant fuel across the country by 2017 and Bharat Stage V compliant fuel with 10 ppm of sulphur to be made available from 2020 onwards. The draft report proposes nationwide Bharat Stage V emission norms for new 4 wheelers from model year 2020 and for all 4 wheelers from model year 2021. It also recommends Bharat Stage VI emissions norms from 2024 onwards. In April 2014, the expert committee submitted its recommendations to the committee empowered by the Ministry of Petroleum and Natural Gas, which has proposed the advancement of emission norms by one year earlier than the expert committee’s recommendations, which would result in the implementation of Bharat Stage V emission norms starting in model year 2019 and Bharat Stage VI emissions norms starting in model year 2023.
Central Motors Vehicles Rules, 1989
Chapter V of the Central Motor Vehicle Rules, 1989, or the CMV Rules, sets forth provisions relating to construction, equipment and maintenance of motor vehicles, including specifications for dimensions, gears, indicators, reflectors, lights, horns, safety belts and others. The CMV Rules govern emission standards for vehicles operating on compressed natural gas or CNG, gasoline, liquefied petroleum gas and diesel.
On and from the date of commencement of the CMV (Amendment) Rules, 1993, every manufacturer must submit the prototype of every vehicle to be manufactured by it for testing by the Vehicle Research and Development Establishment of the Ministry of Defense of the Government of India, the Automotive Research Association of India, Pune, the Central Machinery Testing and Training Institute, Budni (MP), the Indian Institute of Petroleum, Dehradun, the Central Institute of Road Transport, Pune, the International Center for Automotive Technology, Manesar or such other agencies as may be specified by the central government for granting a certificate by that agency as to the compliance of provisions of the Motor Vehicles Act, and the CMV Rules.
The CMV Rules also require the manufacturers to comply with notifications in the Official Gazette, issued by Government of India, to use such parts, components or assemblies in the manufacture of certain vehicles according to standards specified by either the Automotive Industry Standards Committee or the Bureau of Indian Standards.
The existing CMV Rules would be replaced by the Road Transport and Safety Bill (RTSB) 2015, which is subject to legislative approval by the Parliament, which could expose us to additional liability for vehicle recalls and for manufacturer’s liability for our vehicles.
Emission and Safety in India
In 1992, the Government of India issued emission and safety standards, which were further tightened in April 1996, under the Indian Motor Vehicle Act. Currently Bharat Stage IV norms, which are equivalent to Euro IV norms, are in force for four-wheelers in 13 cities and Bharat Stage III norms, which are equivalent to Euro III norms, are in effect in the rest of India. Our vehicles comply with these norms. In 2014, the Ministry of Road Transport and Highways has extended Bharat Stage IV norms in 20 additional cities. In its draft GSR No.247 (E), dated April 1, 2015, the Ministry of Road Transport and Highways proposed the further extension of Bharat Stage IV norms in 30 additional cities starting July 1, 2015.
We are also working towards meeting all applicable regulations which we believe are likely to come into effect in various markets in the near future. Our vehicle exports to Europe comply with Euro V norms, and we believe our vehicles also comply with the various safety regulations in effect in the other international markets where we operate.
The Indian automobile industry is progressively harmonizing its safety regulations with international standards in order to facilitate sustained growth of the Indian automobile industry as well as to encourage export of automobiles from India.
India has been a signatory to the 1998 UNECE Agreement on Global Technical Regulations since April 22, 2006 and has voted in favor of all eleven Global Technical Regulations. We work closely with the Government of India to participate in WP 29 World Forum Harmonization activities.
India has a well-established regulatory framework administered by the Indian Ministry of Road Transport and Highways. The Ministry issues notifications under the CMV Rules and the Motor Vehicles Act. Vehicles manufactured in India must comply with applicable Indian standards and automotive industry standards. In January 2002, the Indian Ministry of Road Transport and Highways has finalized plans on implementing automobile safety standards. The plans are based on traffic conditions, traffic density, driving habits and road user behavior in India and is generally aimed at increasing safety requirements for vehicles under consideration for Indian markets.
The Essential Commodities Act, 1955
The Essential Commodities Act, 1955, as amended by the Essential Commodities (Amendment and Validation) Act, 2009, or the Essential Commodities Act, authorizes the Government of India, if it finds it necessary or expedient to do so, to provide for regulating or prohibiting the production, supply, distribution, trade and commerce in the specified commodities under the Essential Commodities Act, in order to maintain or increase supplies of any essential commodity or to secure their equitable distribution and availability at fair prices, or to secure any essential commodity for the defense of India or the efficient conduct of military operations. The definition of “essential commodity” under the Essential Commodities Act includes “component parts and accessories of automobiles”.
Environmental Regulations
Manufacturing units or plants must ensure compliance with environmental legislation, such as the Water (Prevention and Control of Pollution) Act, 1974, the Air (Prevention and Control of Pollution) Act, 1981, the Environment Protection Act, 1986 and the Hazardous Wastes (Management and Handling and Transboundary Movement) Rules, 2008. The basic purpose of these statutes is to control, abate and prevent pollution. In order to achieve these objectives, Pollution Control Boards, or PCBs, which are vested with diverse powers to deal with water and air pollution, have been set up in each state. The PCBs are responsible for establishing standards for maintenance of clean air and water, directing the installation of pollution control devices in industries and undertaking inspection to ensure that units or plants are functioning in compliance with the standards prescribed. These authorities also have the power of search, seizure and investigation. All of our manufacturing plants are either in possession of current, valid Consents to Operate and Hazardous Waste Authorisations or are in the process of renewing their Consents to Operate and Hazardous Waste Authorisations from the respective state PCBs of the states where they operate.
The Ministry of Environment and Forests under the Government of India receives proposals for expansion, modernization and establishment of projects and the impact of such projects on the environment are assessed by the Ministry, before it grants environmental clearances for the proposed projects under the Environmental Impact Assessment Notification and Rules. All of our manufacturing plants have obtained environmental clearances for specific projects in the past as and when mandated.
We ensure that all prescribed norms are followed for management of waste and we have made significant investments towards pollution control and environmental protection at our manufacturing plants.
Regulation of Imports and Exports
Regulation of quantitative restrictions on imports into India were liberalized with effect from April 1, 2001, pursuant to India’s World Trade Organization obligations, and imports of capital goods and automotive components were placed under the open general license category.
Automobiles and automotive components may, generally, be imported into India without a license from the Government of India subject to their meeting Indian standards and regulations, as specified by designated testing agencies. As a general matter, cars, UVs and SUVs in completely built up, or CBU, condition may be imported at 60% basic customs duty. However, cars with cost, insurance and freight value of more than US$40,000 or with engine capacities greater than 3,000 cubic centimeters for diesel variants and 2,500 cubic centimeters for gasoline variants, may be imported at a 100% basic customs duty. Commercial vehicles may be imported at a basic customs duty of 20% and components may be imported at basic customs duty ranging from at 10% to 7.5%.
The FDI Policy
Automatic approval for foreign equity investments up to 100% is allowed in the automobile manufacturing sector under the FDI Policy. See Item 10.D “—Exchange Controls” for additional information relating to restrictions on foreign investment under Indian law.
Indian Taxes
See Item 10.E “—Taxation” for additional information relating to our taxation.
Excise Duty
The Government of India imposes excise duty on cars and other motor vehicles and their chassis, which rates vary from time to time and across vehicle categories reflecting the policies of the Government of India. The chart below sets forth a summary of historical changes and the current rates of excise duty.
Change of Tax Rate | Excise Duty (per vehicle or chassis) | |||||||||||||||||||
| Small cars1 | Cars other than small cars2 | Motor vehicles for more than 13 persons | Chassis fitted with engines for vehicles of more than 13 persons | Trucks | Chassis fitted with engines for trucks | Safari, SUVs and UVs | ||||||||||||||
March 2012 | 12 | % | 24% or 27%1 | 12 | % | 15% | 12 | % | 15% | 27% | ||||||||||
May 2012 | - | - | - | 14% | - | 14% | - | |||||||||||||
March 2013 | - | - | - | - | - | 13% | 27% or 30% | |||||||||||||
February 2014 | 8 | % | 20% or 24%1 | 8 | % | 10% | 8 | % | 9% | 24% | ||||||||||
January 2015 | 12 | % | 24% or 27%1 | 12 | % | 14% | 12 | % | 13% | 27% or 30% | ||||||||||
March 2015 onwards | 12.50 | % | - | 12.50 | % | - | 12.50 | % | - | - | ||||||||||
| 1. | Small cars are cars with a length not exceeding 4,000 mm and an engine capacity not exceeding 1,500 cubic centimeters for cars with diesel engines, and not exceeding 1,200 cubic centimeters for cars with gasoline engines. The higher rate is applicable if the engine capacity exceeds 1,500 cubic centimeters. |
| 2. | Cars other than small cars are cars with a length exceeding 4000 mm with an engine capacity exceeding 1,500 cubic centimeters for diesel engines and 1,200 cubic centimeters for gasoline engines. |
| (-) | indicates no change during the relevant year. |
All vehicles and chassis are subjected to the automobile cess, which is assessed at 0.125%. Certain passenger vehicles are also subject to the National Calamity Contingent Duty, or NCCD, assessed at 1%. The education cess, assessed at 2%, and secondary and higher education cess, assessed at 1%, in addition to the excise duties indicated above, are exempted on goods starting March 1, 2015.
Value Added Tax
The Value Added Tax, or VAT, has been implemented throughout India. VAT enables set-off from sales tax paid on inputs by traders and manufacturers against the sales tax collected by them on behalf of the Government of India, thereby eliminating the cascading effect of taxation. Two main brackets of 5% and 12.5%, along with special brackets of 0%, 1%, 3%, 4%, 13.5%, 14% 14.5%, 15%, 20%, 22% and 23% have been announced for various categories of goods and commodities sold in the country and certain states have also introduced additional VAT of 1% to 3% on specified commodities, including automobiles. In some of the states, a surcharge of 5% to 10% on VAT has been introduced on automobiles. Since its implementation, VAT has had a positive impact on our business. Prior to the implementation of VAT, a major portion of sales tax paid on purchases formed part of our total cost of materials. The implementation of VAT has resulted in savings on the sales tax component, as VAT paid on inputs may generally be set-off against tax paid on outputs.
In addition to VAT, a Central Sales Tax continues to exist, although it is proposed to be abolished in a phased manner. In the Indian Union Budget 2008-09, the Central Sales Tax rate was reduced to 2%, which remained unchanged in Fiscal 2015.
Goods and Services Tax
The Government of India is proposing to reform the indirect tax system in India with a comprehensive national goods and services tax, or GST, covering the manufacture, sale and consumption of goods and services. The date of introduction of GST is expected to be as early as April 1, 2016. The proposed GST regime will combine taxes and levies by the central and state governments into one unified rate structure. There is a proposal to levy a 1% Non-Creditable Tax to be collected by the Government of India and will be appropriated to the origin state government on every interstate movement of goods. The Government of India has publicly expressed the view that following the implementation of the GST, the indirect tax on domestically manufactured goods is expected to decrease along with prices on such goods.
We have benefitted and continue to benefit from excise duty exemptions for manufacturing facilities in the state of Uttarakhand and other incentives such as subsidies or loans from other states where we have manufacturing operations. While both the Government of India and other state governments of India have publicly announced that all committed incentives will be protected following the implementation of the GST, given the limited availability of information in the public domain concerning the GST, we are unable to provide any assurance as to the effect of this or any other aspect of the tax regime following implementation of the GST.
Imposition of any additional taxes and levies by the Government of India designed to limit the use of automobiles could adversely affect the demand for our products and our results of operations.
Economic Stimulus Package and Incentives
There was a 4% cut in the central value added tax rate, or Cenvat, on cars and trucks and a 2% cut in Cenvat rate on motor vehicles for transport of more than 13 persons, including the driver. Further, in February 2009, the Cenvat rate was reduced from 10% to 8% for Trucks and buses and service tax was also reduced from 12% to 10%. The Government of India has also provided for an accelerated tax depreciation of 50% for commercial vehicles purchased between January 1 and September 30, 2009. The Cenvat rate was restored to 10% since April 1, 2010 and was further revised to 12% with effect from March 16, 2012. The Government of India has made changes in the excise duty in February 2014 which will be in effect until December 31, 2014 as follows: the Cenvat on small cars, trucks and buses reduced to 8% in February, 2014 whereas Cenvat on cars other than small cars has been reduced to 20% or 24% from 24% or 27%. The Cenvat on UVs have been reduced from 27% or 30% to 24%. The Cenvat for chassis which was increased from 12% to 14% in the budget for the Indian fiscal year 2012-2013, has since been revised to 13% in the budget for the Indian fiscal year 2013-2014 and further reduced to 9% in February 2014.
The Government of India has launched a National Electric Mobility Mission plan 2020, or NEMMP, to encourage reliable, affordable and efficient electric vehicles that meet consumer performance and responsive handlingprice expectations. Through collaboration between the government and industry for promotion and development of indigenous manufacturing capabilities, required infrastructure, consumer awareness and technology, the NEMMP aims to help India to emerge as a leader in the electric vehicle market in the world by 2020 and contribute towards national fuel security.
Furthermore, the Ministry of Road Transport & Highways and the Bureau of Energy Efficiency in India finalized labeling regulations for the M1 category of vehicles, which includes passenger vehicles up to, less than, or equal to 10 seats.
The Government of India’s plan to encourage India’s transition to hybrid and electric mobility consists of the following initiatives:
Demand Side: Mandate use of electric vehicles in areas such as public transportation and government fleets in order to create initial demand for OEMs and provide incentives for the sales of electric vehicles to consumers.
Supply Side: Link incentives to localization of the production of key components of electric vehicle in a phased manner.
Research and Development: Fund research and development programs along with OEMs and component suppliers to develop optimal solutions for India at low cost.
Infrastructure Support: Development of pilot programs to support hybrid and/or electric vehicles and test their effectiveness and make modest investments to build public charging infrastructure to support electric vehicles, especially for buses.
Environmental, fiscal and other governmental regulations around the world
Our Jaguar Land Rover business has significant operations in the United States and Europe, which have stringent regulations relating to vehicular emissions. The proposed tightening of vehicle emissions regulations by the European Union will require significant costs of compliance for Jaguar Land Rover. While we are pursuing various technologies in order to meet the required standards in the various countries in which we operate, the costs of compliance with these required standards can be significant to our operations and may adversely impact our results of operations.
In the United Kingdom, the Bank of England base (interest) rate has been maintained at an historic low of 0.5% despite an improvement in the UK economy. The UK labor market is strengthening as unemployment continues to fall and wages rise while inflation remains low primarily reflecting low energy prices. As a result the outlook is generally positive for UK GDP as higher levels of disposable income are expected to drive consumption and the Bank of England is likely to keep interest rates lower for longer as inflation remains subdued.
Economic growth in the Eurozone remained low during Fiscal 2015 and some member states experienced mild recession. In response the European Central Bank embarked on a quantitative easing program in January 2015 and there are signs of growth as a result; however uncertainty remains over the outcome of the debt negotiations with Greece.
The U.S. economy continues to strengthen despite the adverse effects of another harsh winter impacting in the first three months of 2016. The U.S. Federal Reserve continues to taper off its quantitative easing program and, similarly to the United Kingdom, improving labor market conditions along with lower energy prices are driving increased consumption. The U.S. Federal Reserve also held interest rates at historical lows at around 0.25% during Fiscal 2015 while rates are likely to rise gradually in the near term as confidence in the stronger economic recovery gains momentum.
Greenhouse gas / CO2 / fuel economy legislation
Legislation is in place limiting passenger car fleet average greenhouse gas emissions in Europe to 130 grams of CO2 per kilometer for 100% of new cars in 2015. Different targets apply to each manufacturer based on their respective fleets of vehicles and average weight. We have received a permitted derogation from the weight-based target requirement available to small volume and niche manufacturers. As a result, we are permitted to reduce our emissions by 25% from 2007 levels rather than meeting a specific CO2 emissions by 2015. Jaguar Land Rover now has an overall 2015 target of an average of 178.0 grams of CO2 per kilometer for our full fleet of vehicles registered in the EU that year, with Jaguar Land Rover and Tata Motors Limited monitored as a single “pooled” entity for compliance with this target (for Jaguar Land Rover alone, this would be 179.8 g/km). We are in compliance with the 2013 requirement that the best 75% of our pooled fleet registered in the EU that year has met this target and the 2014 requirement that the best 80% of our pooled fleet registered in the EU has met this target, achieving an average 164.5 grams of CO2 per kilometer and 165.3 grams of CO2 per kilometer (provisional) in calendar 2013 and 2014, respectively.
Furthermore, the European Union has regulated target reductions for 95% of a manufacturer’s full fleet of new passenger cars registered in the EU in 2020 to average 95 grams of CO2 per kilometer, rising to 100% in 2021. The new rule contains an extension of the small volume and niche manufacturers’ derogation which permits us to reduce our emissions by 45% from 2007 levels rather than meet a specific CO2 emissions target by 2020. Jaguar Land Rover could apply for an overall target of 132 grams of CO2 per kilometer.
The European Union has also adopted an average emissions limit of 175 grams of CO2 per kilometer for light commercial vehicles to be phased in between 2014 and 2017. Implementation of light commercial vehicle CO2 standards affect the Defender and a small number of Freelander and Discovery vehicles. We have been granted a small volume derogation by the European Commission for alternative specific emission targets for 2014-2016 inclusive, which protects the Defender through features like supercharged V6to end of manufacturing. A further average emissions limit of 147 grams of CO2 per kilometer for light commercial vehicles has been adopted for 2020.
In the United States, both Corporate Average Fuel Economy, or CAFE, standards and V8greenhouse gas emissions standards are imposed on manufacturers of passenger cars and light trucks. The National Highway Traffic Safety Administration, or NHTSA, has set the federal CAFE standards for passenger cars and light trucks to meet an estimated combined average fuel economy level of 35.5 miles per U.S. gallon for 2016 model year vehicles. Meanwhile, the U.S. Environmental Protection Agency, or EPA, and NHTSA issued a joint rule to reduce the average greenhouse gas emissions from passenger cars, light trucks and medium-duty passenger vehicles for model years 2012-16 to 250 grams of CO2 per mile, which would be equivalent to 35.5 miles per U.S. gallon in model year 2016 if the requirements were met only through fuel economy improvements. The United States federal government extended this program to cars and light trucks for model years 2017 through 2025, targeting an estimated combined average emissions level of 243 grams of CO2 per mile in 2017 and 163 grams per mile in 2025, which is equivalent to 54.5 miles per gallon if achieved exclusively through fuel economy improvements. In addition, many other markets either have or will shortly define similar greenhouse gas emissions standards (including Brazil, Canada, China, the European Free Trade Association, India, Japan, Mexico, Saudi Arabia, South Korea and Switzerland).
California is empowered to implement more stringent greenhouse gas emissions standards but has elected to accept the existing U.S. federal standards for compliance with the state’s own requirements. The California Air Resources Board enacted regulations that deem manufacturers of vehicles for model years 2012 through 2016 that are in compliance with the EPA greenhouse gas emissions regulations to also be in compliance with California’s greenhouse gas emission regulations. In November 2012, the California Air Resources Board accepted the federal standard for vehicles with model years 2017-25 for compliance with the state’s own greenhouse gas emission regulations. However, California is moving forward with other stringent emission regulations for vehicles, including the Zero Emission Vehicle regulation, or ZEV. ZEV requires manufacturers to increase their sales of zero emissions vehicles year-on-year, up to an industry average of 16% of vehicles sold in the state by 2025. The precise sales required in order to meet a manufacturer’s obligation in any given model year depend on the size of the manufacturer and the level of technology sold (for example, transitional zero emission technologies, such as plug-in hybrids, can account for at least a proportion of a manufacturer’s obligation, but these technologies earn compliance credits at a different rate from pure zero-emissions vehicles). Other compliance mechanisms are available under ZEV, such as banking and trading of credits generated through the sale of eligible vehicles.
We are fully committed to meeting these standards and technology deployment plans incorporated into cycle plans are directed to achieving these standards. These plans include the use of lightweight materials, including aluminum, which will contribute to the manufacture of lighter vehicles with improved fuel efficiency, reducing parasitic losses through the driveline and improvements in aerodynamics. They also include the development and installation of smaller engines lightweight bodyin our existing vehicles and other drivetrain efficiency improvements, including the introduction of eight-speed or nine-speed transmissions in some of our vehicles. We continue to introduce smaller vehicles such as the Jaguar XE, our most fuel-efficient Jaguar yet. The technology deployment plans also include the research, development and deployment of hybrid-electric vehicles. These technology deployment plans require significant investment. Additionally, local excise tax initiatives are a key consideration in ensuring our products meet customer needs for environmental footprint and cost of ownership concerns as well as continued access to major city centers, such as London’s Ultra Low Emission Zone and similar low emissions areas being contemplated in Paris, Berlin and Beijing.
Non-greenhouse gas emissions legislation
The European Union has adopted the latest in a series of more-stringent standards for emissions of other air pollutants from passenger and light commercial vehicles, such as nitrogen oxides, carbon monoxide, hydrocarbons and particulates. These standards have been or are being phased in from September 2009 (Euro 5) and September 2014 (Euro 6b) and September 2017 (Euro 6c) for passenger cars and from September 2010 (Euro 5), September 2015 (Euro 6b) and September 2018 for light commercial vehicles. September 2015 will see the adoption of driving emissions monitoring, while September 2017 will see such monitoring become mandatory along with a move to the new Worldwide harmonised Light-duty Test Procedure, or WLTP, coincident with Eu6c in Europe to address global concerns on more customer correlated fuel economy certified levels as well as air quality concerns, with other markets to follow. All programs are being fully engineered to enable the adoption of these new requirements.
In the United States, existing California Low-Emission Vehicle regulations and the recently adopted LEV III regulations, as well as the state’s ZEV regulations, place ever-stricter limits on emissions of particulates, nitrogen oxides, hydrocarbons, organics and greenhouse gases from passenger cars and light trucks. These regulations require ever-increasing levels of technology in engine control systems, on-board diagnostics and after treatment systems affecting the base costs of our powertrains. The new California LEV3 and ZEV regulations cover model years 2015 to 2025. Additional stringency of evaporative emissions also requires more-advanced materials and joints solutions to eliminate fuel evaporative losses, all for much longer warranty periods (up to 150,000 miles in the United States).
In addition, in April 2014, the Tier 3 Motor Vehicle Emission and Fuel Standards issued by the EPA were finalized. With Tier 3, the EPA has established more stringent vehicle emissions standards broadly aligned to California’s LEV III standards for 2017 to 2025 model year vehicles. The EPA made minor amendments to these Tier 3 standards in January 2015.
While Europe and the United States lead the implementation of these emissions programs, other nations and states typically follow on with adoption of similar regulations two to four years thereafter. For example, China’s Stage III fuel consumption regulation targets a national average fuel consumption of 6.9L/100km by 2015 and its Stage IV targets a national average fuel consumption of 5.0L/100km by 2021. In response to severe air quality issues in Beijing and other major Chinese cities, the Chinese government also intends to adopt more stringent emissions standards beginning in 2016.
To comply with the current and future environmental norms, we may have to incur substantial capital expenditures and research and development expenditures to upgrade products and manufacturing facilities, which would have an impact on our cost of production and results of operations.
Noise legislation
The European Commission adopted new rules (which apply to new homologations from July 2016) to reduce noise produced by cars, vans, buses, coaches and light and heavy trucks. Noise limit values would be lowered in two steps of each twoA-weighted decibels for vehicles other than trucks, and one A-weighted decibel in the first step and two in the second step for trucks. Compliance would be achieved over a ten-year period from the introduction of the first phase.
Vehicle safety
Vehicles sold in Europe are subject to vehicle safety regulations established by the European Union or by individual Member States. In 2009, the European Union enacted a new regulation to establish a simplified framework for vehicle safety, repealing more than 50 existing directives and replacing them with a single regulation aimed at incorporating relevant United Nations standards. The incorporation of the United Nations standards commenced in 2012, and the European Commission requires new model cars to have electronic stability control systems, has introduced regulations relating to low-rolling resistance tires, requires tire pressure monitoring systems and requires heavy vehicles to have advanced emergency braking systems and lane departure warning systems. From April 2009, the criteria for whole vehicle type approval were extended to cover all new road vehicles, to be phased in over five years depending on vehicle category. The extension clarifies the criteria applicable to small commercial vehicles. In the European Union, new safety requirements came into force from November 2012 for new vehicle types and come into force in November 2014 for all new vehicles sold in the EU market. The new mandatory measures include safety belt reminders, electric car safety requirements, easier child seat anchorages, tire pressure monitoring systems and gear shift indicators.
In the United States, NHTSA issues federal motor vehicle safety standards covering a wide range of vehicle components and systems such as airbags, seatbelts, brakes, windshields, tires, steering columns, displays, lights, door locks, side impact protection and fuel systems. We are required to test new vehicles and equipment and assure their compliance with these standards before selling them in the United States. We are also required to recall vehicles found to have defects that present an unreasonable risk to safety or which do not conform to the required Federal Motor Vehicle Safety Standards, and to repair them without charge to the owner. The financial cost and impact on consumer confidence of such recalls can be significant depending on the repair required and the number of vehicles affected. We have no investigations relating to alleged safety defects or potential compliance issues pending before NHTSA.
These standards add to the cost and complexity of designing and producing vehicles and equipment. In recent years NHTSA has mandated, among other things:
A system for collecting information relating to vehicle performance and customer complaints, and foreign recalls to assist in the early identification of potential vehicle defects as required by the Transportation Recall Enhancement, Accountability, and Documentation (TREAD) Act; and
Enhanced requirements for frontal and side impact, including a lateral pole impact.
Furthermore, the Cameron Gulbransen Kids Transportation Safety Act of 2007 (Kids and Cars Safety Act), passed into law in 2008, requires NHTSA to enact regulations related to rearward visibility and brake-to-shift interlock and requires NHTSA to consider regulating the automatic reversal functions on power windows. The costs to meet these proposed regulatory requirements may be significant.
Vehicle safety regulations in Canada are similar to those in the United States; however, many other countries have vehicle regulatory requirements which differ from those in the United States. The differing requirements among various countries create complexity and increase costs such that the development and production of a common product that meets the country regulatory requirements of all countries is not possible. Global Technical Regulations, or GTRs, developed under the auspices of the United Nations, continue to have an increasing impact on automotive safety activities, as indicated by EU legislation. In 2008, GTRs on electronic stability control, head restraints and pedestrian protection were each adopted by the UN “World Forum for the Harmonization of Vehicle Regulations”, and are now in different stages of national implementation. While global harmonization is fundamentally supported by the automobile industry in order to reduce complexity, national implementation may still introduce subtle differences into the system.
At present, India is a signatory of the 1998 UNECE Agreement on Global Technical Regulations, which makes the global technical regulations alternate standards to national regulations. The transition of finalized global technical regulations into national standards remains in progress.
Insurance Coverage
The Indian insurance industry is predominantly state-owned and insurance tariffs are regulated by the Indian Insurance Regulatory and Development Authority. We have insurance coverage which we consider reasonably sufficient to cover all normal risks associated with our operations, including business interruptions, and which we believe are in accordance with industry standards in India. We have obtained coverage for product liability for some of our vehicle models in several countries to which we export vehicles. TDCV has insurance coverage as is required and applicable to cover all normal risks in accordance with industry standards in South Korea, including product liability. We have also taken insurance coverage on directors and officers liability to minimize risks associated with international litigation for us and our subsidiaries.
Jaguar Land Rover has global insurance coverage which we consider to be reasonably sufficient to cover normal risks associated with our operations and insurance risks, including property, business interruption, marine and product/general liability and which we believe is in accordance with commercial industry standards and statutory requirements.
We are insured by insurers of recognized financial standing against such losses and risks and in such amounts as are prudent and customary in the business in which it is engaged. All such insurance is in full force and effect.
We are able to renew our existing insurance coverage, as and when such policies expire or to obtain comparable coverage from similar institutions as may be necessary or appropriate to conduct its business, as now conducted.
Export Promotion Capital Goods
Since Fiscal 1997, we have benefited from participation in the Export Promotion Capital Goods Scheme, or the EPCG Scheme, which permits us to import capital equipment under a special license at a substantially reduced customs duty. Our participation in this scheme is subject to us fulfilling an obligation to export goods manufactured or produced by the use of capital equipment imported under the EPCG Scheme to the value of a multiple of the cost plus insurance and freight value of these imports or customs duty saved over a period of 6, 8 and 12 years from the date of obtaining the special license. We currently hold 101 licenses which require us to export our products of a value of approximately Rs.81.19 billion between the years 2002 to 2021, and we carefully monitor our progress in meeting our incremental milestones. After fulfilling some of the export obligations as per provisions of Foreign Trade Policy, as at March 31, 2015 we have remaining obligations to export products of a value of approximately Rs.7.09 billion by March 2021. In the event that the export obligation under the EPCG Scheme is not fulfilled, we would have to pay the differential between the reduced and normal duty on the goods imported along with interest. In view of our past record of exceeding our export milestones, and our current plans with respect to our export markets, we do not currently foresee any impediments to meeting our export obligation in the required time frame.
Legal Proceedings
In the normal course of business, we face claims and assertions by various parties. We assess such claims and assertions and monitor the legal environment on an ongoing basis, with the assistance of external legal counsel where appropriate. We record a liability for any claims where a potential loss is probable and capable of being estimated and disclose such matters in our financial statements, if material. For potential losses which are considered reasonably possible, but not probable, we provide disclosure in the financial statements, but do not record a liability in our financial statements unless the loss becomes probable. Should any new developments arise, such as a change in law or rulings against us, we may need to make provisions in our financial statements, which could adversely impact our reported financial condition and results of operations. Furthermore, if significant claims are determined against us and we are required to pay all or a portion of the disputed amounts, there could be a material adverse effect on our business and profitability. Certain claims that are above Rs.200 million in value are described in Note 34 to our consolidated financial statements included in this annual report on Form 20-F. Certain claims that are below Rs.200 million in value pertain to indirect taxes, labor and other civil cases. There are other claims against us which pertain to motor accident claims in India (involving vehicles that were damaged in accidents while being transferred from our manufacturing plants to regional sales offices), product liability claims and consumer complaints. Some of these cases relate to replacement of parts of vehicles and/or compensation for deficiency in services provided by us or our dealers.
Capital work-in-progress as at March 31, 2014, included building under construction at Singur in West Bengal of Rs.3,098.8 million for the purposes of manufacturing automobiles. In October 2008, we moved the Nano project from Singur in West Bengal to Sanand in Gujarat. In June 2011, the newly elected Government of West Bengal (State Government) enacted a law cancelling the land lease agreement at Singur, and took over possession of the land. We challenged the constitutional validity of the law. In June 2012, the Calcutta High Court declared the law unconstitutional and restored our rights under the land lease agreement. The State Government filed an appeal in the Supreme Court of India in August 2012, which is pending disposal.
Though we continue to rigorously press our rights, contentions and claims in the matter, we have been advised that the time it may take in disposal of the appeal is uncertain. We have also been advised that we have a good case and can strongly defend the appeal, but the questions that arise are issues of constitutional law and thus the result of the appeal cannot be predicted. In these circumstances, in view of the uncertainty on the timing of resolution, following the course of prudence, the management has, in Fiscal 2015, made a provision for carrying capital cost of buildings at Singur amounting to Rs.3,098.8 million, excluding other assets (electrical installations etc.) and expenses written off / provided in earlier years, security expenses, lease rent and claim for interest on the whole amount (including Rs.3,098.8 million). We shall however continue to pursue the case and assert our rights and our claims in the Courts.
In South Korea, our union employees filed a lawsuit to include some elements of non-ordinary salary and bonus as part of “ordinary wages” for the period December 2007 to May 2011. The district court ruled in favor of the union employees on January 2013 and ordered TDCV to pay the employees KRW 17.2 billion and interest, up to the period of payment. We recorded a provision of KRW 45.8 billion (Rs.2,565 million) as at March 31, 2014, in respect of this lawsuit and consequential obligation for all employees (including non-union employees). TDCV filed an appeal against the order to the High Court of Seoul, which gave its verdict on December 24, 2014. The High Court of Seoul, following the decision of the Supreme Court in a case of an unaffiliated company, determined that some elements of non-ordinary salary were part of “ordinary wages” and the need to be paid with retrospective effect. However, based on the “Good Faith Principle” and because any retrospective payment would have high financial impact on the Company, the court determined that the bonuses and work performance salary would not be eligible for retrospective payment. Accordingly, the liability was determined at KRW 99 million and interest of KRW 20 million thereon.
Furthermore, in order to maintain the claim for the period from June 2011 to March 2014, TDCV union employees filed a case in the Seoul district court on November 24, 2014. In addition to the items included in the first lawsuit, one new item for additional 50% allowance for overtime work was added. However, after receipt of the final judgment of the Seoul High Court for the first lawsuit, which was not in their favor, the labor union decided to withdraw the second lawsuit and submitted the case withdrawal confirmation on March 19, 2015. Accordingly, the provision created as at March 31, 2014 of KRW 45.8 billion (Rs.2,643 million) has been reversed in Fiscal 2015.
The Competition Commission of India, or CCI, has initiated an inquiry against us and other car manufacturers (collectively referred to hereinafter as the OEMs) pursuant to an allegation that genuine spare parts of automobiles manufactured by the OEMs were not made freely available in the open market in India and accordingly, anti-competitive practices were carried out by the OEMs. The CCI through its order, dated August 25, 2014, held that the OEMs had violated the provisions of Section 3 and Section 4 of the Competition Act, 2002, and imposed a penalty of 2% of the average turnover for three years. Subsequently, we and other car manufacturers filed a writ petition before the Delhi High Court challenging the constitutional validity of Section 22(3) and 27(b) of the Indian Competition Act under which the order was passed and penalty imposed. The matter is currently pending before the Delhi High Court.
During the year the Group’s Brazilian subsidiary has received a demand for GBP 35 million in relation to additional indirect taxes, that is, PIS (Programa de Integração Social) and COFINS (Contribuição para Financiamento da Seguridade Social) claimed as being due on local vehicle and parts sales made in 2010. The matter is currently being contested before the Brazilian appellate authorities. Professional legal opinions we have obtained in Brazil support our position that the basis of the tax authority’s assertion is incorrect and, as a result, the likelihood of any settlement ultimately having to be made is considered remote.
We believe that none of the contingencies, would have a material adverse effect on our financial condition, results of operations or cash flows.
Tata Sons—Our Promoter and its Promoted Entities
Tata Sons holds equity interests in promoted companies engaged in a wide range of businesses. The various companies promoted by Tata Sons, including Tata Motors Limited, are based substantially in India and had combined consolidated revenues of approximately US$108.78 billion in Fiscal 2015. The businesses of Tata Sons promoted entities can be categorized under seven business sectors, namely, engineering, materials, energy, chemicals, consumer products, services, and communications and information systems.
Tata Sons-promoted entities have their origins in the trading business founded by the founder Mr. Jamsetji Tata in 1868, which was developed and expanded in furtherance of his ideals by his two sons, Sir Dorabji Tata and Sir Ratan Tata, following their father’s death in 1904. The family interests subsequently vested largely in the Sir Ratan Tata Trust, the Sir Dorabji Tata Trust and other related trusts. These trusts have been established for philanthropic and charitable purposes and together own a significant percentage of the share capital of Tata Sons.
Over the years, the operations of Tata Sons promoted entities have expanded to encompass a number of major industrial and commercial enterprises, including Indian Hotels Company Limited (1902), Tata Steel Limited, or Tata Steel (1907), one of the top ten steel manufacturers in the world, Tata Power Company Limited (1910), Tata Chemicals Limited (1939), which is the world’s second largest manufacturer of soda ash and Tata Motors Limited (1945). Other Tata entities include Voltas Limited (1954), and Tata Global Beverages Ltd, or Tata Tea Limited (1962), which is the second largest branded tea company in the world, along with itsUK-based subsidiary Tetley.
Tata Consultancy Services Limited, or TCS, a subsidiary of Tata Sons which started its operations in the 1960s as a division of Tata Sons and later converted to a listed public company, is a leading software service provider in India and exporter and the first Indian software firm to exceed sales of US$4 billion. TCS has delivery centers around the globe including in the United States, the United Kingdom, Hungary, Brazil, Uruguay and China, as well as India.
Tata Sons promoted India’s first airline, Tata Airlines, which later became Air India (India’s national carrier), as well as India’s largest general insurance company, New India Assurance Company Limited, both of which were subsequently taken over by the government as part of the Government of India’s nationalization program. In 1999, entities promoted by Tata Sons also invested in several telephone and telecommunication ventures, including acquiring a significant portion of the Government of India’s equity stake in the then state owned Videsh Sanchar Nigam Limited, which was subsequently renamed Tata Communications Limited and is one of the world’s largest wholesale voice carriers. Tata Sons promoted companies are building multinational businesses that aspire to achieve growth through excellence and innovation, while balancing the interests of shareholders, employees and society.
Some of the emerging companies promoted by Tata Sons include Titan Company, established in 1984, which is manufacturing India’s largest and best-known range of personal accessories such as watches, jewelry, sunglasses, prescription eyewear and excels in precision engineering, Tata Housing Development Company, established in 1984, a real estate developer in India, Tata AIA Life Insurance Company, established in 2001, which is a joint venture between Tata Sons and AIA Life Group Ltd Tata AIG General Insurance Company, established in 2001, which provides non-life insurance solutions to individuals, groups and corporate houses in India and Tata Capital, established in 2007, a systemically important non-deposit taking non-banking financial company, or NBFC, that fulfills the financial needs of retail and institutional customers in India.
We have for many years been a licensed user of the “Tata” brand owned by Tata Sons, and thus have both gained from the use of the Tata brand and common brand equity as well as helped to grow and sustain its brand equity. Tata Sons instituted a corporate identity program to re-position the brand to compete in a global environment. A substantial ongoing investment and recurring expenditure is undertaken by Tata Sons planned to develop and promote a strong, well-recognized and common brand equity, which is intended to represent for the consumer a high level of quality, service and reliability associated with products and services offered by the Tata Sons promoted entities.
Each of the Tata Sons promoted entities which have subscribed to the Tata Brand Equity & Business Promotion Scheme pays a subscription fee to use the “Tata” business name and trademarks and participate in and gain from the Tata brand equity as well as to avail themselves of various services including legal, human resources, economics and statistics, corporate communications and public affairs services of Tata Sons. We believe that we benefit from the use of and association with the “Tata” brand identity and accordingly, Tata Motors Limited and certain of its subsidiaries have subscribed to the Tata Brand Equity & Business Promotion Agreement and agreed to pay an annual subscription fee to Tata Sons which is in the range of 0.15%-0.25% of the annual net income (defined as net revenues exclusive of excise duties and other governmental taxes and non-operating income), subject to a ceiling of 5% of annual profit before tax (defined as profit after interest and depreciation but before income tax), each calculated on a standalone basis for these entities. In some of the past years, Tata Sons has lowered the absolute amount of subscription fee in light of its outlay for activities related to brand promotion and protection in those years. In Fiscal 2013, Tata Motors Limited on a standalone basis paid an amount less than 0.25% of its annual net income calculated in accordance with Indian GAAP and in Fiscal 2014 and 2015 no amount was paid in view of losses of Tata Motors Limited calculated on a standalone basis. Pursuant to our licensing agreement with Tata Sons, we have also undertaken certain obligations for the promotion and protection of the Tata brand identity licensed to us under the agreement. The agreement can be terminated by written agreement between the parties, by Tata Sons upon our breach of the agreement and our failure to remedy such a breach, or by Tata Sons upon providing six months’ notice for reasons to be recorded in writing. The agreement can also be terminated by Tata Sons upon the occurrence of certain specified events, including liquidation of Tata Motors Limited.
The Tata Sons promoted entities have sought to continue to follow the ideals, values and principles of ethics, integrity and fair business practices espoused by the founder of Tata Sons, Mr. Jamsetji Tata, and his successors. To further protect and enhance the Tata brand equity, these values and principles have been articulated in the Tata Code of Conduct, which has been adopted by Tata promoted entities. The Tata Trust has also made significant contributions towards national causes through promotion of public institutions in the field of science, such as the Indian Institute of Science and the Tata Institute of Fundamental Research and in the field of social services through the Tata Institute of Social Sciences, the Tata Memorial Hospital, the National Centre for the Performing Arts in Mumbai and, more recently, the Tata Medical Center at Kolkata for cancer patients set up by the Tata Trusts and supported by Tata Sons and promoted companies. The Tata Trust is one among the largest charitable foundations in India.
Some of the Tata Sons promoted entities hold shares in other companies promoted by Tata Sons. Similarly, some of our directors hold directorships on the boards of Tata Sons and/or other Tata Sons promoted entities. However, there are no voting agreements, material supply or purchase agreements or any other relationships or agreements that have the effect of binding us with other Tata Sons promoted entities at management, financial or operational levels. With the exception of Tata Steel, which under our Articles of Association has the right to appoint one director on our board of directors, neither Tata Sons nor its subsidiaries has any special contractual or other power to appoint our directors or management. They have only the voting power of their shareholdings in Tata Motors. Except as set forth in the tables below under the heading “Subsidiaries and Affiliates” and except for approximately a 16.84% equity interest in Tata Services Ltd, a 19.62% equity interest in Tata International Limited, a 12.85% equity interest in Tata Industries Limited and an 8.79% equity interest in Tata Projects Ltd, our shareholdings in other Tata Sons promoted entities are generally insignificant as a percentage of their respective outstanding shares or in terms of the amount of our investment or the market value of our shares of those companies.
Subsidiaries and Affiliates
The subsidiaries, joint operation and equity method affiliates and joint ventures of Tata Motors Limited that together with Tata Motors Limited form the Tata Motors Group under Indian Law as at March 31, 2015 are set forth in the chart below:
| 1. | Acquired a 100% equity interest in Rajasthan Leasing Private Limited with effect from January 19, 2015 and renamed it Tata Motors Finance Solutions Private Limited with effect from March 18, 2015. On June 4, 2015 was converted into a public limited company, named as Tata Motors Finance Solutions Limited. |
| 2. | Holding company of Jaguar Land Rover Automotive plc, TDCV, Tata Motors (Thailand) Limited, Tata Motors (SA) (Proprietary) Limited and PT Tata Motors Indonesia with effect from October 20, 2014. |
| 3. | These subsidiaries are based in many countries outside India. |
| 4. | Equity interest increased from 94.36% to 95.28% with effect from February 24, 2015. |
| 5. | Equity interest in its subsidiary, Tata Daewoo Commercial Vehicle Sales and Distribution Co. Ltd. is 100%. |
| 6. | Equity interest in PT Tata Motors Distribusi Indonesia subsidiary is 100% |
| 7. | The equity interests in these 14 subsidiaries range between 72.32% and 72.52%. |
| 8. | Tata Hispano Motors Carrocera SA wound down its operations with effect from September 20, 2013 and transferred its 100% equity interest in Tata Hispano Motors Carrocerries Maghreb SA with effect from June 23, 2014. |
| 9. | Converted from a public limited company into a private limited company with effect from March 5, 2015. |
| 10. | With two 100% subsidiaries in Spain of which one is presently under the process of liquidation and one affiliate in China with an equity interest of 22.48%. |
| 11. | Out of the ten subsidiaries with equity interests ranging from 13% to 26%, two are presently under the process of liquidation and four joint ventures with equity interests of 13% in each. |
| 12. | Chery Jaguar Land Rover Auto Sales Company Limited, a wholly-owned subsidiary of Chery Jaguar Land Rover Automotive Co. Ltd., whose name was changed from Suzhou Chery Jaguar Land Rover Trading Co. Ltd. (Interim JV) with effect from November 5, 2014. |
| 13. | An affiliate of Tata Technologies Limited. |
| 14. | Converted from a public limited company into a private limited company with effect from December 16, 2014. |
| 15. | Converted from a public limited company into a private limited company with effect from January 19, 2015. |
Out of the above, the following are our three significant subsidiaries as defined under Regulation S-X:
Name | Country of Incorporation | Ownership Interest / Voting Power | ||||
Jaguar Land Rover Automotive Plc | United Kingdom | 100 | % | |||
Jaguar Land Rover Limited | United Kingdom | 100 | % | |||
Jaguar Land Rover Holdings Limited | United Kingdom | 100 | % | |||
With respect to certain subsidiaries and affiliates, where Tata Motors Limited has a joint venture partner, voting on certain items of business may be based on affirmative voting provisions and board of directors participation clauses in the relevant joint venture agreement(s).
D. Property, Plants and Equipment
Facilities
We operate six principal automotive manufacturing facilities in India. The first facility was established in 1945 at Jamshedpur in the state of Jharkhand in eastern India. We had commenced construction of the second facility in 1966 (with production commencing in 1976) at Pune, in the state of Maharashtra in western India, the third facility in 1985 (with production commencing in 1992) at Lucknow, in the state of Uttar Pradesh in northern India, the fourth at Pantnagar in the state of Uttarakhand, India, which commenced operations in Fiscal 2008, the fifth at Sanand in Gujarat in western India for manufacturing of the Nano, which commenced operations in June 2010, and the sixth plant for manufacturing Tata Marcopolo buses under our joint venture with Marcopolo and LCVs at Dharwad in Karnataka (which buses are also produced at Lucknow). The Jamshedpur, Pune, Sanand, Pantnagar and Lucknow manufacturing facilities have been accredited with a ISO/TS 16949:2000(E) certification.
The manufacturing facilities of TDCV are based in Gunsan, South Korea. TDCV has received the ISO/TS 16949 certification, an international quality systems specification given by SGS UK Ltd., an International Automotive Task Force, or IATF, accredited certification body. It is the first South Korean automobile OEM to be awarded an ISO/TS 16949 certification.
Fiat India Automobiles Private Limited, our joint arrangement with Fiat Group, has its manufacturing facility located in Ranjangaon, Maharashtra. The plant is used for manufacturing Tata and Fiat branded cars and engines, and transmissions for use by both partners.
Tata Motors (Thailand) Limited is our joint venture with Thonburi Automotive Assembly Plant Co. Ltd, and has a manufacturing facility located in Samutprakarn province, Thailand. The facility is used for the manufacture and assembly of pickup trucks. Through our joint venture in Thailand, we intend on offering refreshed versions of Tata brand pickup trucks in Fiscal 2016 and to increase its product range by introducing Tata and TDCV brand M&HCV trucks in Thailand.
Through Jaguar Land Rover, we currently operate three principal automotive manufacturing facilities in the United Kingdom at Solihull, Castle Bromwich, and Halewood and have two product development facilities in the United Kingdom at Gaydon and Whitley. Most of these facilities are owned as freehold estates or are held through long-term leaseholds, generally with nominal rents.
A new advanced driving technologies.engine facility has been established at Wolverhampton in the United Kingdom’s Midlands area to manufacture the new family of Ingenium low-emission engines. The Wolverhampton facility, which opened in October 2014, is essential to our long-term strategic growth plans and is now producing the first of the new family of Ingenium engines, a 4-cylinder 2.0-liter engine first installed into the Jaguar XE. The GBP 500 million investment in this facility reinforces Jaguar Land Rover’s commitment to manufacturing and innovation in the United Kingdom. The facility is the first in Jaguar Land Rover’s history to be entirely designed and specified by Jaguar Land Rover and at full capacity is expected to employ up to 1,400 people. The engine plant includes an engine testing center alongside the manufacturing and assembly halls and endeavors to meet the highest standards of sustainable production, featuring a variety of energy efficiency technologies including the largest rooftop solar panel installation in the UK, comprising no fewer than 21,000 individual panels expected to generate more than 30% of the plant’s energy requirements.
The joint venture manufacturing plant for Chery Jaguar Land Rover Automotive Co. Limited, our joint venture company with Chery, in Changshu, near Shanghai, as part of a RMB 10.9 billion investment that also includes a new research and development center, was opened in October 2014 and began manufacturing the Range Rover Evoque for the local Chinese market. Retail sales began in February 2015. Construction of a new engine plant for production of fuel-efficient engines is also contemplated under the joint venture agreement.
Tata Motors (SA) (Proprietary) Limited, our joint venture with Tata Africa Holdings (SA) Pty Limited for the manufacture and assembly operations of our LCVs and M&HCVs in South Africa, owns and operates a manufacturing facility located in Rosslyn, South Africa.
Description of environmental issues that may affect our utilization of facilities
Tata and other brand vehicles
As with other participants in the automobile industry around the world, we are exposed to regulatory risks related to climate change. The design and development of fuel-efficient vehicles and vehicles running on alternative renewable energy has become a priority as a result of fossil fuel scarcity, escalating price and growing awareness about energy efficiency among customers.
We have adopted the Tata Group Climate Change Policy which addresses key climate change issues related to products, processes and services. We are committed to reduction of greenhouse gas emissions throughout the lifecycle of our products and development of fuel efficient and low greenhouse gas emitting vehicles, as an integral part of our product development and manufacturing strategy.
Considering the climate change risk, we are actively involved in partnerships with technology providers to embrace energy-efficient technologies not only for products but also for processes and are also participating actively in various national committees in India, which are working on formulating policies and regulations for improvement of the environment, including through reduction of greenhouse gases.
India, as a party to the United Nations Framework Convention on Climate Change, 1992 and its Kyoto Protocol, 1997, has been committed to addressing the global problem on the basis of the principle of “common but differentiated responsibilities and respective capabilities” of the member parties. At present, there are no legally binding targets for greenhouse gas reductions for India as it is a developing country. There are, however, opportunities for minimizing energy consumption through elimination of energy losses during manufacturing, thereby reducing manufacturing costs and increasing productivity.
In order to manage regulatory and general risks of climate change, we are increasingly investing in the design and development of fuel efficient and alternative energy vehicles, in addition to implementing new advanced technologies to increase efficiency of our internal combustion engines. We have manufactured CNG and CNG-electric hybrid versions of buses, LCVs, and the ACE Xenon, as well as a liquefied petroleum gas version of the Indica passenger vehicle.
Moreover, we are using refrigerants such as R134A in our products in order to minimize our contribution towards greenhouse gas emissions. We also ensure that no refrigerant is released to the atmosphere during any service, repair and maintenance of the air-conditioning systems of our vehicles by first recovering the refrigerant charge before the system is serviced and recharged. In addition, since 2009, we have voluntarily disclosed fuel-efficiency information for our passenger vehicles in India in accordance with a decision by SIAM. We are also continually in the process of developing products to meet the current and future emission norms in India and other countries. For example, we offer products which meet the Bharat Stage III and Bharat Stage IV norms in India and Euro V norms in International markets.
We also strive to increase the proportion of energy sourced from renewables. As one of our prime objectives, we have endeavored to incorporate environmentally sound practices in our processes, products and services. Our manufacturing facilities at Pune, Jamshedpur, Lucknow, Sanand, Dharwad and Pantnagar in India each have an Environmental Management System in place and have achieved ISO-14001 certification. We have been implementing various Environment Management Programs on energy conservation such as reduction in electricity and fuel consumption with resulting reductions in greenhouse gas emissions. We are actively working towards a shift to gas fuels to meet process heat requirements.
Jaguar Land Rover
Our production facilities are subject to a wide range of environmental, health and safety requirements. These requirements address, among other things, air emissions, wastewater discharges, accidental releases into the environment, human exposure to hazardous materials, the storage, treatment, transportation and disposal of wastes and hazardous materials, the investigation and clean-up of contamination, process safety and the maintenance of safe conditions in the workplace. Many of our operations require permits and controls to monitor or prevent pollution. We have incurred, and will continue to incur, substantial ongoing capital and operating expenditures to ensure compliance with current and future environmental, health and safety laws and regulations or their more stringent enforcement. Violations of these laws and regulations could result in the imposition of significant fines and penalties, the suspension, revocation or non-renewal of our permits, or the closure of our plants. Other environmental, health and safety laws and regulations could impose restrictions or onerous conditions on the availability or the use of raw materials we need for our manufacturing process.
Our manufacturing process results in the emission of greenhouse gases such as CO2. The EU Emissions Trading Scheme, or EUETS, an EU-wide system in which allowances to emit greenhouse gases are issued and traded, is now in Phase 3 (2013 to 2020). We have managed our EUETS allowances during previous phases of the EUETS scheme and use these remaining allowances from these earlier phases to meet our compliance requirements. The automotive sector has also been given recognition of being at risk of carbon leakage in accordance with the EUETS rules. This means that we will receive an increase in free allowances from 2015 and 2019. As a consequence of these actions, we currently project that we will reach the end of Phase 3 without the need to purchase EUETS carbon allowances. In Phase 4 of the scheme, from 2020 to 2027, all organizations in the EUETS scheme will see free allowances diminish to zero by 2027, so we project that we will purchase EUETS allowances in Phase 4 of the scheme.
We have a Climate Change Agreement which covers our manufacturing energy use. This requires us to deliver a 15% reduction in energy use per vehicle by 2020 compared to the 2008 baseline. Our projections show that we are on track to achieve this target and consequently will not need to purchase carbon allowances under this scheme.
We are also registered as a participant in the Carbon Reduction Commitment Energy Efficiency Scheme, which regulates emissions from electricity and gas use primarily in our non-manufacturing activities in the United Kingdom.
Many of our sites have an extended history of industrial activity. We may be required to investigate and remediate contamination at those sites, as well as properties we formerly operated, regardless of whether we caused the contamination or the activity causing the contamination was legal at the time it occurred. For example, some of our buildings at our Solihull plant and other plants in the United Kingdom are undergoing an asbestos-removal program in connection with ongoing refurbishment and rebuilding. In connection with contaminated properties, as well as our operations generally, we also could be subject to claims by government authorities, individuals and other third parties seeking damages for alleged personal injury or property damage resulting from hazardous substance contamination or exposure caused by our operations, facilities or products. The discovery of previously unknown contamination, or the imposition of new obligations to investigate or remediate contamination at our facilities, could result in substantial unanticipated costs. We could be required to establish or substantially increase financial reserves for such obligations or liabilities and, if we fail to accurately predict the amount or timing of such costs, the related adverse impact on our business, financial condition or results of operations could be material.
Production Capacity
The following table shows our production capacity as at March 31, 2015 and production levels by plant and product type in Fiscal 2015 and 2014:
| As at March 31, 2015 | Year ended March 31, | |||||||||||
| Production Capacity | 2015 | 2014 | ||||||||||
| Production (Units) | ||||||||||||
Tata Motors Plants in India1 | ||||||||||||
Medium and Heavy Commercial Vehicles, Light Commercial Vehicles, Utility Vehicles, Passenger Cars, | 1,637,000 | 458,339 | 513,442 | |||||||||
Jaguar Land Rover2 5 | ||||||||||||
Utility Vehicles, Passenger Cars | 638,209 | 470,536 | 439,120 | |||||||||
Other Subsidiary companies plants (excluding Jaguar Land Rover)3 | ||||||||||||
Medium & Heavy Commercial Vehicles, buses, bus bodies and pickup trucks | 58,250 | 23,670 | 22,162 | |||||||||
Joint operations4 (Passenger Vehicles) | 100,000 | 32,298 | 30,702 | |||||||||
| 1. | This refers to estimated production capacity on a double shift basis for all plants (except the Uttarakhand plant for which capacity is on three shift basis) for the manufacture of vehicles and replacement parts. |
| 2. | Production capacity is on a three shift basis. |
| 3. | The plants are located in South Korea, Morocco, South Africa and Thailand. Production capacity of plants at Morocco are on a single-shift basis. |
| 4. | Excludes production of engines/powertrains. |
| 5. | Excludes capacity at Chery Jaguar Land Rover Automotive Company Limited. |
Properties
We produce vehicles and related components and carry out other businesses through various manufacturing facilities. In addition to our manufacturing facilities, our properties include sales offices and other sales facilities in major cities, repair service facilities and research and development facilities.
The following table sets forth information, with respect to our principal facilities, a substantial portion of which are owned by us as at March 31, 2015. The remaining facilities are on leased premises.
Location | Facility or Subsidiary / Joint Operations Name | Principal Products or Functions | ||
| India | ||||
| In the State of Maharashtra | ||||
Pune (Pimpri, Chinchwad, Chikhali1, Maval) | Tata Motors Limited | Automotive vehicles, components and research and development | ||
| Pune (Chinchwad) | TAL Manufacturing Solutions Ltd. | Factory automation equipment and services | ||
| Pune (Hinjewadi)1 | Tata Technologies Ltd. | Software consultancy and services | ||
| Mumbai, Pune | Tata Motors Limited/Concorde Motors (India) Ltd./TMFL | Automobile sales and service and vehicle financing | ||
| Nagpur1 | TAL Manufacturing Solutions Ltd. | Production of advanced composite floor beams, including machining of metal fittings for Boeing 787 Dreamliner | ||
| Satara | Tata Cummins Pvt. Ltd. | Automotive engines | ||
| Pune (Ranjangaon) | Fiat India Automobiles Pvt. Ltd. | Automotive vehicles and components | ||
| In the State of Jharkhand | ||||
| Jamshedpur | Tata Motors Limited | Automotive vehicles, components and research and development | ||
| Jamshedpur | TML Drivelines Ltd. | Axles and transmissions for M&HCVs | ||
| Jamshedpur | Tata Cummins Pvt. Ltd. | Automotive engines | ||
| In the State of Uttar Pradesh | ||||
| Lucknow1 | Tata Motors Limited | Automotive vehicles, parts and research and development | ||
| Tata Marcopolo Motors Ltd. | Bus bodies | |||
| In the State of Karnataka | ||||
| Dharwad | Tata Motors Limited | Automotive vehicles, components, spare parts and warehousing | ||
| Tata Marcopolo Motors Ltd. | Bus body manufacturing | |||
| Bengaluru2 | Concorde Motors (India) Ltd. | Automobile sales and service | ||
| In the State of Uttarakhand | ||||
| Pantnagar1 | Tata Motors Limited | Automotive vehicles and components | ||
| In the State of Gujarat | ||||
| Sanand | Tata Motors Limited | Automotive vehicles and components | ||
| Rest of India | ||||
| Hyderabad2 & Chennai(1) | Concorde Motors (India) Ltd. | Automobile sales and service | ||
| Cochin, Delhi | Concorde Motors (India) Ltd. | Automobile sales and service | ||
| Various other properties in India | Tata Motors Limited/Tata Motors Finance Ltd. | Vehicle financing business (office/ residential) | ||
| Outside India | ||||
| Singapore | Tata Technologies Pte Ltd. | Software consultancy and services | ||
| Republic of Korea | TDCV | Automotive vehicles, components and research and development | ||
| Thailand | Tata Motors (Thailand) Ltd. | Pick-up trucks | ||
| Tata Technologies (Thailand) Ltd. | Software consultancy and services | |||
| United Kingdom | Tata Motors European Technical Centre | Engineering consultancy and services | ||
| United Kingdom | INCAT International PLC, Tata Technologies Europe Ltd and Cambric UK Ltd | Software consultancy and services | ||
Location | Facility or Subsidiary / Joint Operations Name | Principal Products or Functions | ||
| United Kingdom | ||||
Solihull | Jaguar Land Rover Ltd | Automotive vehicles and components | ||
Castle Bromwich | Jaguar Land Rover Ltd | Automotive vehicles and components | ||
Halewood | Jaguar Land Rover Ltd | Automotive vehicles and components | ||
Gaydon | Jaguar Land Rover Ltd | Research and product development | ||
Whitley | Jaguar Land Rover Ltd | Headquarters and research and product development | ||
Wolverhampton | Jaguar Land Rover Ltd | Engine manufacturing | ||
| Spain | Tata Hispano Motors Carrocera S.A. | Bus body service | ||
| Morocco | Tata Hispano Motors Carrocerries Maghreb SA | Bus body manufacturing and service | ||
| South Africa | Tata Motors (SA) (Proprietary) Limited | Manufacture and assembly operations of vehicles | ||
| Indonesia | PT Tata Motors Indonesia | Distribution of vehicles | ||
| Rest of the world | ||||
Various (United States, UK, China, Europe, Australia etc.) | Tata Technologies Ltd. | Software consultancy and services | ||
| Jaguar Land Rover3 | National sales companies | |||
| Regional sales offices |
| Note: | Excludes facilities held by our joint ventures, including the manufacturing plant held by Jaguar Land Rover Automotive Company Limited. |
| 1. | Land at each of these locations is held under an operating lease. |
| 2. | Some of the facilities are held under an operating lease and some are owned. |
| 3. | National sales companies are held by various subsidiaries of the Jaguar Land Rover group of companies. |
Substantially all of our owned properties are subject to mortgages in favor of secured lenders and debenture trustees for the benefit of secured debenture holders. A significant portion of our property, plant and equipment, except those in the United Kingdom, is pledged as collateral securing indebtedness incurred by us. We believe that there are no material environmental issues that may affect our utilization of these assets.
We have additional property interests in various locations around the world for limited manufacturing, sales offices, and dealer training and testing. The majority of these are housed within leased premises.
For further details regarding the current legal proceedings with respect to the leased land in West Bengal, please refer to Item 4.B “—Business Overview—Legal Proceedings” of this annual report on Form 20-F.
We consider all of our principal manufacturing facilities and other significant properties to be in good condition and adequate to meet the needs of our operations.
| Item 4A. | Unresolved Staff Comments |
None.
| Item 5. | Operating and Financial Review and Prospects |
You should read the following discussion of our financial condition and results of operations together with our consolidated financial statements prepared in conformity with IFRS and information included in this annual report on Form 20-F. This discussion and analysis contains forward-looking statements that involve risks, uncertainties and assumptions. Our actual results may differ materially from those anticipated in these forward-looking statements as a result of various factors including, but not limited to, those set forth in Item 3.D and elsewhere in this annual report on Form 20-F.
All financial information discussed in this section is derived from our audited financial statements included in this annual report on Form 20-F, which have been prepared in accordance with International Financial Reporting Standards as issued by the International Accounting Standards Board.
Overview
In Fiscal 2015, our total revenue (net of excise duties), including finance revenues, increased by 12.1% to Rs.2,625,265 million from Rs.2,341,761 million in Fiscal 2014. We recorded a net income (attributable to our shareholders) of Rs.128,291 million in Fiscal 2015, representing a decrease by 1.9% or Rs.2,426 million over net income in Fiscal 2014 of Rs.130,717 million.
Automotive operations
Automotive operations are our most significant segment, accounting for 99.5%, 99.5% and 99.4% of our total revenues in Fiscal 2015, 2014, and 2013, Model Year Sportbrake:respectively. In Fiscal 2015, revenue from automotive operations before inter-segment eliminations was Rs.2,612,303 million, as compared to Rs.2,329,582 million in Fiscal 2014 and Rs.1,881,621 million in Fiscal 2013.
Our automotive operations include:
All activities relating to the development, design, manufacture, assembly and sale of vehicles as well as related spare parts and accessories;
Distribution and service of vehicles; and
Financing of our vehicles in certain markets.
Our automotive operations segment is further divided into Tata and other brand vehicles (including financing thereof), and Jaguar Land Rover. In Fiscal 2015, Jaguar Land Rover contributed 82.9% of our total automotive revenue compared to 81.3% in Fiscal 2014 and 72.5% in Fiscal 2013 (before intra-segment elimination) and the remaining 17.1% was contributed by Tata and other brand vehicles in Fiscal 2015 compared to 18.7% in Fiscal 2014 and 27.5% in Fiscal 2013. The increase in Jaguar Land Rover revenue includes a translation gain from GBP to Indian rupees. For further detail see Item 5.A “—Operating Results—Fiscal 2015 Compared to Fiscal 2014—Revenue.”
Other Operations
Our other operations business segment mainly includes information technology services, machine tools and factory automation solutions. Our revenue from other operations before inter-segment eliminations was Rs.27,152 million in Fiscal 2015, an increase of 8.7% from Rs.24,989 million in Fiscal 2014. Revenues from other operations represented 1.0%, 1.1% and 1.2% of our total revenues, before inter-segment eliminations, in Fiscal 2015, 2014 and 2013, respectively. Earnings before other income, interest and tax before inter-segment eliminations (segment earnings), were Rs.3,448 million in Fiscal 2015 and Rs.2,634 million and Rs.3,294 million in Fiscal 2014 and 2013, respectively.
Geographical breakdown
We have pursued a strategy of increasing exports of Tata and other brand vehicles to new and existing markets. Improved market sentiment in certain countries to which we export and a strong portfolio of Jaguar Land Rover vehicles has enabled us to increase its sales in these international markets in Fiscal 2015. Sales in China, which is its second largest single market in terms of volumes, after India, increased by 15.5% in Fiscal 2015. However, sales in China decreased by 20.4% in the fourth quarter of Fiscal 2015 to 23,526 units from 29,567 units in the same period in Fiscal 2014. The performance of our subsidiary in South Korea, TDCV, and TTL, our specialized subsidiary engaged in engineering, design and information technology services, contributed to its revenue from international markets. The proportion of our net sales earned from markets outside of India has increased marginally to 86.2% in Fiscal 2015 from 84.4% in Fiscal 2014.
The following table sets forth our revenue from our key geographical markets:
| Year ended March 31, | ||||||||||||||||||||||||
| 2015 | 2014 | 2013 | ||||||||||||||||||||||
Revenue | Rs. in million | Percentage | Rs. in million | Percentage | Rs. in million | Percentage | ||||||||||||||||||
India | 361,206 | 13.8 | % | 364,591 | 15.6 | % | 453,276 | 23.9 | % | |||||||||||||||
China | 758,085 | 28.9 | % | 656,138 | 28.0 | % | 446,508 | 23.6 | % | |||||||||||||||
United Kingdom | 351,527 | 13.4 | % | 290,162 | 12.4 | % | 224,604 | 11.9 | % | |||||||||||||||
United States of America | 314,009 | 12.0 | % | 266,436 | 11.4 | % | 189,007 | 10.0 | % | |||||||||||||||
Rest of Europe | 317,303 | 12.1 | % | 292,378 | 12.4 | % | 221,035 | 11.7 | % | |||||||||||||||
Rest of the World | 523,135 | 19.8 | % | 472,056 | 20.2 | % | 358,480 | 18.9 | % | |||||||||||||||
|
|
|
|
|
| |||||||||||||||||||
Total | 2,625,265 | 2,341,761 | 1,892,910 | |||||||||||||||||||||
|
|
|
|
|
| |||||||||||||||||||
The Rest of Europe market is geographic Europe, excluding the United Kingdom and Russia. The Rest of the World market is any region not included above.
Significant Factors Influencing Our Results of Operations
Our results of operations are dependent on a number of factors, which mainly include the following:
| • | General economic conditions. We, similar to other participants in the automotive industry, are materially affected by general economic conditions. See Item 3.D “—Risk Factors—Risks associated with Our Business and the Automotive Industry”. |
| • | Interest rates and availability of credit for vehicle purchases. Our volumes are significantly dependent on availability of vehicle financing arrangements and their associated costs. For further discussion of our credit support programs, see Item 4.B “—Business Overview—Automotive Operations”. |
| • | Excise duties and sales tax rates. In India, the excise and sales tax rate structures affect the cost of vehicles to the end user and, therefore, impacts demand significantly. For a detailed discussion regarding tax rates applicable to us, please see Item 4.B “—Business Overview—Government Regulations—Excise Duty”. |
| • | Our competitive position in the market. For a detailed discussion regarding our competitive position, see Item 4.B “—Business Overview—Automotive Operations—Tata and other brand vehicles—Competition”. |
| • | Cyclicality and seasonality. Our results of operations are also dependent on the cyclicality and seasonality in demand in the automotive market. For a detailed discussion on seasonal factors affecting our business, please see Item 4.B “Business Overview—Automotive Operations—Tata and other brand vehicles—Seasonality” and 4.B “Business Overview—Automotive Operations—Jaguar Land Rover—Seasonality”. |
| • | Environmental Regulations. Governments in the various countries in which we operate are placing a greater emphasis on raising emission and safety standards for the automobile industry. Compliance with applicable environmental and safety laws, rules, regulations and standards will have a significant impact on costs and product life cycles in the automotive industry. For further details with respect to these regulations, please see Item 4.B “—Business Overview—Government Regulations”. |
| • | Foreign Currency Rates. Our operations and our financial position are quite sensitive to fluctuations in foreign currency exchange rates. Jaguar Land Rover earns significant revenue in the United States, Europe and China, and also sources a significant portion of its input material from Europe. Thus, any exchange rate fluctuations of GBP to Euro, GBP to U.S. dollars and GBP to other currencies would affect our financial results. We have significant borrowings in foreign currencies denominated mainly in U.S. dollars. Our consolidated financial results are affected by foreign currency exchange fluctuations through both translation and transaction risks. Changes in foreign currency exchange rates may positively or negatively affect our revenues, results of operations and net income. To the extent that our financial results for a particular period will be affected by changes in the prevailing exchange rates at the end of the period, such fluctuations may have a substantial impact on comparisons with prior periods. Furthermore, Jaguar Land Rover constitutes a major portion of consolidated financial position, the figures of which are translated into Indian rupees. However, the translation effect is a reporting consideration and does not impact our underlying results of operations.Please see Item 11 “Quantitative and Qualitative Disclosures About Market Risk” and Note 36(d) (i) – (a) to our consolidated financial statements included elsewhere in this annual report on Form 20-F for further detail on our exposure to fluctuations in foreign currency exchange rates. |
| • | Political and Regional Factors. As with to the rest of the automotive industry, we are affected by political and regional factors. For a detailed discussion regarding these risks, please see Item 3.D “Key Information—Risk Factors—Political and Regulatory Risks.” |
Results of operations
The following table sets forth selected items from our consolidated statements of income for the periods indicated and shows these items as a percentage of total revenues:
| Percentage of Total Revenue | ||||||||||||||||||||
| Year ended March 31, | Percentage Change | |||||||||||||||||||
| 2015 | 2014 | 2013 | 2014 to 2015 | 2013 to 2014 | ||||||||||||||||
Total revenues | 100 | % | 100 | % | 100 | % | 12.1 | % | 23.7 | % | ||||||||||
Raw materials, components and purchase of product for sale (including change in inventories) | 61.0 | 61.7 | 63.5 | 10.8 | 20.3 | |||||||||||||||
Employee cost | 9.5 | 9.1 | 8.8 | 17.1 | 28.0 | |||||||||||||||
Other expenses | 20.8 | 21.3 | 20.3 | 9.4 | 29.7 | |||||||||||||||
Depreciation and amortization | 5.1 | 4.7 | 4.0 | 21.8 | 45.8 | |||||||||||||||
Expenditure capitalized | -5.8 | -5.8 | -5.4 | 13.3 | 32.7 | |||||||||||||||
Other (income)/loss (net) | -0.4 | -0.3 | -0.6 | 48.8 | -36.1 | |||||||||||||||
Interest income | -0.3 | -0.3 | -0.4 | 1.6 | -3.9 | |||||||||||||||
Interest expense (net) | 2.0 | 2.3 | 2.2 | -1.6 | 30.2 | |||||||||||||||
Foreign exchange (gain)/loss (net) | 0.5 | -0.8 | 0.8 | 166.4 | -221.2 | |||||||||||||||
Impairment of an equity accounted investee | — | 0.3 | — | -100.0 | 100.0 | |||||||||||||||
Share of (profit)/loss of equity accounted investees | 0.1 | 0.1 | — | * | -6.9 | 1,327.8 | ||||||||||||||
Net income before tax | 7.5 | 7.7 | 6.8 | 10.5 | 39.3 | |||||||||||||||
Income tax expense | -2.6 | -2.1 | -2.1 | 43.4 | 22.9 | |||||||||||||||
Net income | 4.9 | 5.6 | 4.7 | -1.6 | 46.5 | |||||||||||||||
Net income attributable to shareholders of Tata Motors Limited | 4.9 | 5.6 | 4.7 | -1.9 | 47.4 | |||||||||||||||
Net income attributable to non-controlling interests | — | * | — | * | — | * | 71.4 | % | -47.9 | % | ||||||||||
| * | Less than 0.1 |
The following table sets forth selected data regarding our automotive operations (Tata and other brand vehicles (including financing thereof) and Jaguar Land Rover) for the periods indicated and the percentage change from period-to-period (before inter-segment eliminations):
| Year ended March 31, | Percentage Change | |||||||||||||||||||
| 2015 | 2014 | 2013 | 2014 to 2015 | 2013 to 2014 | ||||||||||||||||
Total revenues (Rs. million) | 2,612,303 | 2,329,582 | 1,881,621 | 12.1 | % | 23.8 | % | |||||||||||||
Earnings before other income, interest and tax (Rs. million) | 244,551 | 207,396 | 164,207 | 17.9 | % | 26.3 | % | |||||||||||||
Earnings before other income, interest and tax (% to total revenue) | 9.4 | % | 8.9 | % | 8.7 | % | ||||||||||||||
The following table sets forth selected data regarding our other operations for the periods indicated and the percentage change from period-to-period (before inter-segment eliminations):
| Year ended March 31, | Percentage Change | |||||||||||||||||||
| 2015 | 2014 | 2013 | 2014 to 2015 | 2013 to 2014 | ||||||||||||||||
Total revenues (Rs. million) | 27,152 | 24,989 | 22,179 | 8.7 | % | 12.7 | % | |||||||||||||
Earnings before other income, interest and tax (Rs. million) | 3,448 | 2,634 | 3,294 | 30.9 | % | -20.0 | % | |||||||||||||
Earnings before other income, interest and tax (% to total revenue) | 12.7 | % | 10.5 | % | 14.9 | % | ||||||||||||||
Fiscal 2015 Compared to Fiscal 2014
Revenue
Our total consolidated revenue (net of excise duty, where applicable), including finance revenue, increased by 12.1% to Rs.2,625,265 million in Fiscal 2015 from Rs.2,341,761 million in Fiscal 2014.
The increase in revenue was primarily driven by our Jaguar Land Rover business, where revenue increased by 14.3% to Rs.2,165,673 million in Fiscal 2015 from Rs.1,894,590 million in Fiscal 2014 due to volume increases across products and markets. The increase in revenue also reflects an increase on account of a foreign currency translation gain from GBP to Indian rupees of Rs.30,187 million pertaining to Jaguar Land Rover. The increase in revenue of Rs.240,896 million at our Jaguar Land Rover business (excluding translation impact) was mainly attributable to an increase in sales of the new Range Rover Sport, Range Rover Evoque and new Range Rover from 223,517 units in Fiscal 2014 to 271,043 units in Fiscal 2015, an increase of 21.3%, which was offset by a marginal reduction in sales of Jaguar-brand vehicles to 78,083 units in Fiscal 2015 from 80,644 units in Fiscal 2014. The increase in revenue pertaining to Jaguar Land Rover in Fiscal 2015 was also attributable to an indirect tax incentive by Jaguar Land Rover of Rs.13,054 million as compared to Rs.8,463 million in Fiscal 2014.
The increase in revenue was also attributable to an increase in revenue of Tata and other brand vehicles (including financing thereof) by 2.8% to Rs.447,218 million in Fiscal 2015 from Rs.435,012 million in Fiscal 2014.
Our revenues from sales of vehicles and spares manufactured in India increased by 5.2% to Rs.362,214 million in Fiscal 2015 from Rs.344,369 million in Fiscal 2014. The increase was mainly attributable to increased revenues of M&HCVs (in India), which increased by 28.5% to Rs.166,263 million in Fiscal 2015 from Rs.129,350 in Fiscal 2014. Furthermore, revenue attributable to passenger cars increased by 22.5% to Rs.37,196 million in Fiscal 2015 from Rs.30,370 million in Fiscal 2014. These were offset by a decrease in revenue attributable to LCVs by 8% to Rs.68,890 million in Fiscal 2015 from Rs.74,900 million in Fiscal 2014. Revenue attributable to utility vehicles decreased by 5.5% to Rs.13,051 million in Fiscal 2015 from Rs.13,810 million in Fiscal 2014.
Revenue from our vehicle financing operations decreased by 24.3% to Rs.22,631 million in Fiscal 2015 as compared to Rs.29,876 million in Fiscal 2014, due to lower vehicle financing activity and an increase in defaults.
Revenue attributable to TDCV, our subsidiary company engaged in design, development and manufacturing of M&HCVs, increased by 15.7% to Rs.55,015 million in Fiscal 2015 from Rs.47,533 million in Fiscal 2014.
Revenue (net of excise duty, where applicable) from other operations, before inter-segment eliminations, increased by 8.7% to Rs.27,152 million in Fiscal 2015 from Rs.24,989 million in Fiscal 2014, and represents 1.0% and 1.1% of our total revenues, before inter-segment eliminations, in Fiscal 2015 and 2014, respectively.
Cost and Expenses
Raw Materials, Components and Purchase of Products for Sale (including change in stock) (material costs)
Material costs increased by 10.8% to Rs.1,601,056 million in Fiscal 2015 from Rs.1,444,946 million in Fiscal 2014. The increase in absolute terms in material costs in Fiscal 2015 was mainly attributable to increased volumes at our Jaguar Land Rover business and includes an unfavorable foreign currency translation from GBP to Indian rupees for Jaguar Land Rover operations which resulted in an increase in material costs of Rs.19,432 million in Fiscal 2015 compared to Fiscal 2014.
At our Jaguar Land Rover operations, material costs in Fiscal 2015 increased by 13.0% to Rs.1,304,221 million from Rs.1,154,510 million in Fiscal 2014. Material costs at our Jaguar Land Rover operations as a percentage of revenue decreased to 60.3% in Fiscal 2015 from 61.4% in Fiscal 2014 (in GBP terms). Material costs attributable to our Jaguar Land Rover operations increased by Rs.107,668 million in Fiscal 2015 due to an increase in volume of sales and an increase in duties by Rs.13,340 million, mainly due to increased sales to China. However, as a percentage of revenue attributable to our Jaguar Land Rover operations, duties decreased from 10.4% in Fiscal 2014 to 9.9% in Fiscal 2015, due to an increase in sales in China of our 2.0 liter engines which attracts a lower duty. Furthermore, the decrease in material cost as a percentage to revenue was mainly due to cost reduction programs undertaken by Jaguar Land Rover of approximately GBP 206 million (Rs.20,311 million) and positive movement of foreign currency rates applicable for sourcing countries of GBP 301 million (Rs.29,678 million).
Material costs for Tata and other brand vehicles has also increased by 4.8% to Rs.291,206 million in Fiscal 2015 from Rs.277,820 million in Fiscal 2014. However, material costs as a percentage of revenue (excluding finance revenue) was 68.6% in Fiscal 2015 and 2014.
At our India operations, material costs have increased by 22% to Rs.111,823 million in Fiscal 2015 as compared to Rs.91,673 million in Fiscal 2014 for M&HCVs and by 17.9% to Rs.31,957 million in Fiscal 2015 as compared from Rs.27,105 million in Fiscal 2014 for passenger cars. Material costs has decreased by 25% to Rs.42,531 million in Fiscal 2015 as compared to Rs.56,684 million in Fiscal 2014 for LCVs and by 13.5% to Rs.11,228 million in Fiscal 2015 as compared from Rs.12,979 million in Fiscal 2014 for utility vehicles.
Material costs have increased by 14.9% to Rs.39,177 million in Fiscal 2015 as compared to Rs.34,102 million in Fiscal 2014 for TDCV due to increased sales. The increase is also due to an unfavourable foreign currency translation from KRW to Indian rupees of Rs.1,348 million. However, material costs as a percentage of revenue (excluding finance revenue) were 71.2% in Fiscal 2015 and 71.7% in Fiscal 2014.
Employee Costs
Our employee costs increased by 17.1% in Fiscal 2015 to Rs.250,401 million from Rs.213,903 million in Fiscal 2014, including the foreign currency translation impact from GBP to Indian rupees discussed below. Our permanent headcount increased by 6.7% as at March 31, 2015 to 73,485 employees from 68,889 employees as at March 31, 2014, and the average temporary headcount increased by 14.1% to 40,213 employees in Fiscal 2015 from 35,260 employees in Fiscal 2014.
The employee cost at Jaguar Land Rover increased by 21.4% to Rs.194,467 million in Fiscal 2015 from Rs.160,147 million in Fiscal 2014. This increase includes an unfavorable foreign currency translation from GBP to Indian rupees of Rs.3,076 million. In 2012,GBP terms, employee costs at Jaguar Land Rover increased to GBP 1,977 million in Fiscal 2015 from GBP 1,654 million in Fiscal 2014. The employee cost at Jaguar Land Rover as a percentage to revenue increased to 9.0% in Fiscal 2015 from 8.5% in Fiscal 2014. Due to consistent increases in volumes and to support new launches and product development projects, Jaguar Land Rover increased its average permanent headcount by 7.8% as at March 31, 2015 to 24,902 employees from 23,111 employees as at March 31, 2014, and the average temporary headcount increased by 49.2% to 7,225 employees in Fiscal 2015 from 4,842 employees in Fiscal 2014. The increase in employee cost was also due to wage negotiations in November 2014 for Jaguar Land Rover plant workers. Total number of permanent employees as at March 31, 2015 was 27,004 as compared to 22,186 as at March 31, 2014 for Jaguar Land Rover.
The employee cost for Tata and other brand vehicles (including financing thereof) increased by 2.8% to Rs.43,922 million in Fiscal 2015 from Rs.42,739 million in Fiscal 2014.
For our India operations, employee costs increased by 8.5% to Rs.36,547 million in Fiscal 2015 from Rs.33,672 million in Fiscal 2014. We incurred Rs.930 million in Fiscal 2015 towards an employee early-separation scheme, as compared to Rs.535 million in Fiscal 2014. Excluding the employee early-separation charge, the employee cost increased by 7.5% to Rs.35,617 million in Fiscal 2015 from Rs.33,137 million in Fiscal 2014, mainly due to regular annual increases in salary. The permanent headcount decreased marginally by 3.1% as at March 31, 2015 to 37,243 employees from 38,434 employees as at March 31, 2014, which was driven by efforts to rationalize employee costs across our India operations. For our India operations, the average temporary headcount increased by 3.0% to 27,772 employees in Fiscal 2015 from 26,973 employees in Fiscal 2014.
Employee costs at TDCV decreased by 22.1% to Rs.4,493 million in Fiscal 2015 from Rs.5,771 million in Fiscal 2014. The decrease of employee costs attributable to TDCV during Fiscal 2015 was mainly due to the reversal of Rs.2,643 million, following the resolution of the lawsuit filed by TDCV union employees. Please see Item 4.B “—Business Overview—Legal Proceedings” of this annual report on Form 20-F for further details on the lawsuit filed by TDCV union employees.
In Fiscal 2014, we closed the manufacturing operations at Tata Hispano Motors Carrocera S.A. and paid Euro 12.4 million (Rs.1,006 million) as employee separation costs. The closure was triggered by sustained underperformance that was mainly attributable to challenging market conditions in the regions where Hispano operates.
Other Expenses
Other expenses increased by 9.4% to Rs.545,910 million in Fiscal 2015 from Rs.498,778 million in Fiscal 2014. This increase mainly reflects an increase of volumes at Jaguar Land Rover and an unfavorable foreign currency translation of GBP to Indian rupees of Rs.6,694 million pertaining to Jaguar Land Rover. As a percentage of total revenues, these expenses decreased to 20.8% in Fiscal 2015 from 21.3% in Fiscal 2014. The major components of expenses are as follows:
| Percentage of Total Revenue | ||||||||||||||||||||
| Year ended March 31, | Change | Year ended March 31, | ||||||||||||||||||
| 2015 | 2014 | 2015 | 2014 | |||||||||||||||||
| (Rs. in millions) | ||||||||||||||||||||
Freight and transportation expenses | 84,309 | 75,439 | 11.8 | % | 3.2 | % | 3.2 | % | ||||||||||||
Works operation and other expenses | 213,280 | 186,067 | 14.6 | 8.1 | 7.9 | |||||||||||||||
Publicity | 85,773 | 81,425 | 5.3 | 3.3 | 3.5 | |||||||||||||||
Allowance for trade and other receivables, and finance receivables | 25,597 | 26,830 | -4.6 | 1.0 | 1.1 | |||||||||||||||
Warranty and product liability expenses | 60,266 | 57,957 | 4.0 | 2.3 | 2.5 | |||||||||||||||
Research and development expenses | 28,515 | 25,651 | 11.2 | % | 1.1 | % | 1.1 | % | ||||||||||||
| 1. | The increase in freight and transportation expenses corresponds to an increase in volumes at our Jaguar Land Rover operations, predominantly on account of increased China sales on an annual basis. |
| 2. | Our works operation and other expenses represented 8.1% and 7.9% of total revenue in Fiscal 2015 and 2014, respectively. These mainly relate to volume-related expenses at Jaguar Land Rover. Furthermore, engineering expenses at Jaguar Land Rover have increased, reflecting our increased investment in the development of new vehicles by 11.8% to Rs. 61,127 million in Fiscal 2015 from Rs. 54,658 million in Fiscal 2014. A significant portion of these costs are capitalized and shown under the line item “expenditure capitalized” discussed below”. |
| 3. | Publicity expenses decreased to 3.3% of our revenues in Fiscal 2015 from 3.5% in Fiscal 2014. In addition to routine product and brand campaigns, we incurred expenses relating to new product introduction campaigns in Fiscal 2015, namely the new Range Rover, new Range Rover Sport, Range Rover Evoque, Jaguar F-TYPE, smaller powertrain derivatives of the XF and XJ, the XF Sportbrake at Jaguar Land Rover, and the Ultra trucks, Zest and Bolt at our India operations. |
| 4. | Our allowance for trade and other receivables represented 1.0% and 1.1% of total revenues in Fiscal 2015 and Fiscal 2014, respectively. The allowances for trade and other receivables, and finance receivables mainly relate to India operations. These mainly reflect provisions for the impairment of vehicle loans of Rs.23,226 million for Fiscal 2015 as compared to Rs.24,139 million for the same period in 2014. The rate of defaults were due to prolonged unanticipated deterioration in the economic environment in India, which severely affected fleet owners and transporters. Furthermore, based on our assessment of non-recoverability of overdues in trade and other receivables, we have recorded a provision of Rs.2,371 million in Fiscal 2015, a decrease by 11.9% compared to a provision of Rs.2,691 million in Fiscal 2014. |
| 5. | Warranty and product liability expenses represented 2.3% and 2.5% of our revenues in Fiscal 2015 and Fiscal 2014, respectively. The warranty expenses at Jaguar Land Rover represented 2.57% of the revenue as compared to 2.84% last year primarily due to product and market mix, whereas for Tata Motors Indian operations these represent 1.17% of revenue as compared to 0.99% last year. The increased cost for Tata Motors Indian operations represented an increase in warranty period from two years to four years for certain M&HCV models, resulting in an increase in warranty accrual from Rs.438 million in Fiscal 2014 to Rs.652 million in Fiscal 2015. Please refer to Item 5.A “—Critical Accounting Policies” of this annual report for further details. |
| 6. | Research and product development costs represent research costs and costs pertaining to minor product enhancements, refreshes and upgrades to existing vehicle models. These represented 1.1% of total revenues for Fiscal 2015 and 2014. |
Expenditure capitalized
This represents employee costs, stores and other manufacturing supplies and other works expenses incurred mainly towards product development projects. Considering the nature of our industry, we continually invest in the development of new products and invest to address safety, emission and other regulatory norms. The expenditure capitalized increased by 13.3% to Rs.153,218 million in Fiscal 2015 from Rs.135,247 million in Fiscal 2014. The increase includes a favorable foreign currency translation impact from GBP to Indian rupees of Rs.2,654 million pertaining to Jaguar Land Rover. These reflect expenditures on new products and other major product development plans.
Depreciation and Amortization
Our depreciation and amortization expenses increased by 21.8% in Fiscal 2015, the breakdown of which is as follows:
| Year ended March 31, | ||||||||
| 2015 | 2014 | |||||||
| (Rs. in millions) | ||||||||
Depreciation | 65,398 | 52,426 | ||||||
Amortization | 69,098 | 58,037 | ||||||
|
|
|
| |||||
Total | 134,496 | 110,463 | ||||||
|
|
|
| |||||
The increase in depreciation and amortization expenses includes an unfavorable foreign currency translation from GBP to Indian rupees of Rs.1,543 million pertaining to Jaguar Land Rover. The increase in depreciation expenses was on account of asset additions, which primarily include the launch of Ingenium engines at the Wolverhampton facility in the United Kingdom and expenses attributable to plant and equipment and tooling, which are mainly towards capacity and new products. The amortization expenses for Fiscal 2015 mainly related to product development costs capitalized and new products introduced during this period and during Fiscal 2014, primarily the Jaguar F-TYPE coupe and all-wheel drive derivatives, the new Discovery Sport, the Zest and Ultra trucks. Depreciation and amortization expenses represented 5.1% and 4.7% of total revenues in Fiscal 2015 and Fiscal 2014, respectively.
Other income (net)
There was a net gain of Rs.11,508 million in Fiscal 2015, as compared to Rs.7,733 million in Fiscal 2014, representing an increase of 48.8%.
| i. | During Fiscal 2014, we repaid senior notes before maturity and consequently recognized a loss of Rs.4,792 million towards reversal of previously recognized gain of the fair value of prepayment option. Please see Item 5.B “—Liquidity and Capital Resources-Long-term funding” of this annual report on Form 20-F for details on prepayments of senior notes in Fiscal 2014. |
| ii. | There was a loss on the fair value of conversion option relating to foreign currency convertible notes of Rs.838 million in Fiscal 2014. The notes were fully converted in Fiscal 2014. |
| iii. | We recorded a loss on a sale of assets and assets written off of Rs.3,512 million in Fiscal 2015 as compared to Rs.294 million in Fiscal 2014. |
Capital work-in-progress as at March 31, 2014, included building under construction at Singur in the state of West Bengal in India of Rs.3,098.8 million for the purposes of manufacturing automobiles. We have made a provision for carrying capital costs of buildings at Singur amounting to Rs.3,098.8 million in Fiscal 2015, excluding other assets, such as electrical installations, expenses written off/provided for in earlier years, security expenses, lease rent and our claim for the interest on the whole amount (including on the Rs.3,098.8 million carrying capital costs). Please see Item 4.B “Information on the Company—Business Overview—Legal Proceedings” of the annual report on Form 20-F for additional details on the claims related to the Singur facility.
| iv. | Miscellaneous income increased by 10.6% to Rs.13,474 million in Fiscal 2015 from Rs.12,179 million in Fiscal 2014. During Fiscal 2014, legislation was enacted that allows United Kingdom (UK) companies to elect for the Research and Development Expenditure Credit (RDEC) on qualifying expenditures incurred since April 1, 2013, instead of the existing super-deduction rules. Accordingly, the amount not relating to capitalized product development expenditure of Rs.2,909 million and Rs.1,712 million for the Fiscal 2015 and 2014, respectively, have been recognized as miscellaneous income. Further, the increase was due to income earned from services provided to Chery Jaguar Land Rover Automotive Company Limited of Rs.1,134 million in Fiscal 2015 as compared to Rs.179 million in Fiscal 2014. Furthermore, Jaguar Land Rover earned commissions of Rs.1,163 million in Fiscal 2015 as compared to Rs.183 million in Fiscal 2014. In addition, in Fiscal 2015 we recorded an income of Rs.366 million on the sale of occupancy rights. |
For further details see Note 30 to our consolidated financial statements included elsewhere in this annual report onForm 20-F.
Interest expense (net)
Our interest expense (net of interest capitalized) decreased by 1.6% to Rs.52,232 million in Fiscal 2015 from Rs.53,095 million in Fiscal 2014. As a percentage of total revenues, interest expense represented 2.0% in Fiscal 2015 compared to 2.3% in Fiscal 2014. The interest expense (net) for Jaguar Land Rover was GBP 135 million (Rs.12,779 million) in Fiscal 2015 as compared to GBP 138 million (Rs.13,272 million) in Fiscal 2014, which includes prepayment penalties of GBP 77 million as compared to GBP 53 million in Fiscal 2014. The decrease (excluding prepayment penalty) in interest expense is primarily due to the prepayment of higher coupon senior notes during Fiscal 2014 and 2015, offset by an unfavorable foreign currency translation of Rs.1,143 million from GBP to Indian rupees. For our operations of Tata and other brand vehicles (including financing thereof), interest expense increased marginally by 1.8% to Rs.39,665 million in Fiscal 2015 from Rs.38,966 million in Fiscal 2014. See Item 5.B “—Liquidity and Capital Resources” of this annual report on Form 20-F for additional details on our debt financing arrangements.
Foreign exchange (gain)/loss (net)
We had a net foreign exchange loss of Rs.12,681 million in Fiscal 2015, compared to a net gain of Rs.19,104 million in Fiscal 2014. This was primarily attributable to our Jaguar Land Rover operations.
| i. | Jaguar Land Rover recorded an exchange loss of Rs.11,949 million in Fiscal 2015 as compared to gain of Rs.25,244 million in Fiscal 2014. We incurred a net exchange loss on senior notes of Rs.15,387 million in Fiscal 2015, as compared to gain of Rs.8,367 million in Fiscal 2014, mainly due to appreciation of U.S. dollars as compared to GBP as at March 31, 2015. Further, there was a loss of Rs.11,536 million in Fiscal 2015 as compared to gain of Rs.16,253 million in Fiscal 2014, due to fluctuations in foreign currency exchange rates on derivative contracts, mainly reflecting a weaker Chinese RMB, which includes a gain of Rs.4,338 million on cash flow hedges in Fiscal 2015 as compared to Rs.10,771 million in Fiscal 2014. The above loss is offset by revaluation of other assets and liabilities by gain of Rs.11,195 million as compared to Rs.4,979 million. |
| ii. | For India operations, due to depreciation of the Indian rupee mainly against the U.S. dollar, we incurred exchange losses. There was a net exchange loss of Rs.1,777 million in Fiscal 2015 as compared to Rs.4,841 million in Fiscal 2014, attributable to foreign currency denominated borrowings. |
Impairment in respect of equity-accounted investees
In Fiscal 2014, impairment loss in respect of equity-accounted investees were recorded of Rs.8,034 million in respect of our investment in an associate, Tata Hitachi Construction Machinery Co. Pvt Ltd.
Income Taxes
Our income tax expense increased by 43.4% to Rs.69,150 million in Fiscal 2015 from Rs.48,227 million in Fiscal 2014, resulting in consolidated effective tax rates of 34.9% and 26.9%, for Fiscal 2015 and 2014, respectively.
Reasons for significant differences in the company’s recorded income tax expense of Rs.69,150 million as compared to Rs.38,245 million income tax expense computed at the domestic statutory tax rate of respective jurisdictions where entities are domiciled for Fiscal 2015 are as follows:
| i. | During Fiscal 2015, for Tata Motors Limited, on a standalone basis, we have not recognized a deferred tax asset, amounting to Rs.13,844 million, with respect to tax losses, due to the uncertainty of future taxable profit against which tax losses can be utilized. |
| ii. | Furthermore, during Fiscal 2015, deferred tax assets totaling Rs.7,089 million, were not recognized in certain subsidiaries due to uncertainty of realization. |
| iii. | During Fiscal 2015, TML Holdings Pte Ltd, a wholly-owned subsidiary, repurchased 35,000,000 equity shares, par value US$1 each, at a price of US$7.99 each. The resultant gain was subject to capital gains tax in India for Tata Motors Limited, on a standalone basis, resulting in utilization of business losses having a tax effect of Rs.4,469 million. |
| iv. | Income tax expense on undistributed earnings of subsidiaries was Rs.7,805 million in Fiscal 2015 |
| v. | The relevant Indian tax regulations mandate that companies pay tax on book profits, known as the Minimum Alternate Tax, or MAT. MAT may be carried forward and set off against future income tax liabilities computed under normal tax provisions within a period of ten years. We had recognized deferred tax assets in respect of MAT paid in prior years for Tata Motors Limited on a standalone basis. |
In Fiscal 2015, the Government of India amended Indian income tax laws extending the concessional tax rate of 15% on dividends received from foreign subsidiaries indefinitely. This amendment will result in lower utilization of deferred tax assets in respect of MAT paid, due to which we have written off previously recognized deferred tax assets in respect of MAT paid of Rs.7,772 million.
| vi. | The above differences were offset by the change in withholding tax rate in China resulting in credit of Rs.6,269 million in Fiscal 2015, attributable to dividends in China being subject to a reduced withholding tax rate of 5% (rather than 10%), as set out in the new United Kingdom-China tax treaty. |
Reasons for significant differences in the company’s recorded income tax expense of Rs.48,227 million as compared to Rs.35,741 million income tax expense computed at the domestic statutory tax rate of respective jurisdictions where entities are domiciled for Fiscal 2014 are as follows:
| i. | Income tax expense on undistributed earnings of subsidiaries was Rs.12,994 million in Fiscal 2014. |
| ii. | Furthermore, in Fiscal 2014, we recognized Rs.4,676 million tax expenses on dividends from Jaguar Land Rover due to income taxes applicable to Tata Motors Limited on a standalone basis. |
| iii. | In Fiscal 2014, we have recognized net credit of Rs.5,300 million representing reduction in statutory tax rates applicable to a subsidiary in the UK. |
| iv. | In Fiscal 2014, we had written off previously recognized deferred tax assets in respect of MAT paid of Rs.7,318 million in light of lower taxable profit, considering the economic slowdown in India. |
As explained above in the reconciliation from our statutory tax rates to effective tax rates for Fiscal 2015 and Fiscal 2014, our income tax expense in fiscal 2015 increased by Rs.20,923 million mainly due to:
| i. | Non-recognition of deferred tax assets amounting to Rs.20,933 million in Tata Motors Limited and certain subsidiaries due to uncertainty of future taxable profits; |
| ii. | Tax effect on shares purchased by a wholly owned subsidiary of Rs.4,469 million; |
which were offset by:
| i. | a lower charge on undistributed earnings and dividend of subsidiaries, joint operations and equity accounted investees of Rs.9,845 million; and |
| ii. | Reduction due to change in statutory tax rate by Rs.2,700 million to Rs.8,000 million in Fiscal 2015 as compared to Rs.5,300 million in Fiscal 2014. |
For further details see Note 17 to our consolidated financial statements included elsewhere in this annual report on Form 20-F.
Share of profit of equity-accounted investees and non-controlling interests in consolidated subsidiaries, net of tax
In Fiscal 2015, our share of profit of equity-accounted investees reflected a loss of Rs.1,748 million, as compared to Rs.1,878 million in Fiscal 2014, a decrease of 6.9%.
Our share of loss (including other adjustments) in Chery Jaguar Land Rover Automotive Company Limited in Fiscal 2015 was Rs.1,213 million as compared to Rs.807 million in Fiscal 2014.
Our share of loss in Tata Hitachi Construction Machinery Co Private Ltd was Rs.768 million in Fiscal 2015 as compared to Rs.1,354 million in Fiscal 2014.
Our share of non-controlling interests in consolidated subsidiaries increased by 71.2% to Rs.791 million in Fiscal 2015 from Rs.462 million in Fiscal 2014 primarily due to increased profitability of one of our subsidiaries, TTL.
Net income
Our consolidated net income in Fiscal 2015, excluding shares of non-controlling interests, decreased marginally by 1.9% to Rs.128,291 million from Rs.130,717 million in Fiscal 2014. Net income as a percentage of total revenues also decreased from 5.6% in Fiscal 2014 to 4.9% in Fiscal 2015. This decrease was mainly the result of the following factors:
There was a decrease in revenue from our vehicle financing operations by 24.3% to Rs.22,631 million in Fiscal 2015 from Rs.29,876 million in Fiscal 2014.
Negative earnings before other income, interest and tax for Tata and other brand vehicles (including financing thereof) of Rs.29,831 million in Fiscal 2015 from Rs.20,631 million in Fiscal 2014. The losses were mainly attributable to reduction in sales volumes of small commercial vehicles, competitive pressure on pricing as well as a decrease in vehicle financing activity. Furthermore, there was an increase in depreciation expenses as a result of additions to plants and facilities in recent years, and in amortization expenses for product development costs due to new products launched. While we have implemented cost-reduction programs, in the short term, we expect that the level of fixed costs are expected to continue to have a negative impact on earnings.
These were primarily offset by the following factors:
Earnings before other income, interest and tax for Jaguar Land Rover increased by 20.3% to Rs.274,382 million in Fiscal 2015 from Rs.228,027 million in Fiscal 2014 which amounted to 12.7% in Fiscal 2015 of sales as compared to 12.0% in Fiscal 2014. The decrease in net income for Fiscal 2015 was also offset by a favorable foreign currency translation of Rs.698 million from GBP to Indian rupees. The improvement in profitability was mainly attributable to increases in volumes across all markets, introduction of the Jaguar F-TYPE and smaller powertrain derivative of XF and XJ and XF Sportbrake, the New Range Rover, the New Range Rover Sport and Range Rover Evoque. Furthermore, the performance was also supported by the positive impact of the continuing strength of the U.S. dollar against the GBP and the Euro, improving its revenues against the backdrop of a largely GBP and Euro cost base.
Impairment loss of Rs.8,034 million in respect of investment in an associate in Fiscal 2014.
Fiscal 2014 compared to Fiscal 2013
Revenues
Our total consolidated revenue (net of excise duty, where applicable) including finance revenue increased by 23.7% to Rs.2,341,761 million in Fiscal 2014 from Rs.1,892,910 million in Fiscal 2013.
The increase in revenue was primarily driven by our Jaguar Land Rover business, where revenues increased by 38.7% to Rs.1,894,590 million in Fiscal 2014 from Rs.1,365,620 million in Fiscal 2013, primarily due to volume increases across products and markets. The revenues also reflect a favorable foreign currency translation from GBP to Indian rupees of Rs.218,417 million pertaining to Jaguar Land Rover. The increase in revenues of Rs.310,553 million at our Jaguar Land Rover business (excluding translation impact) was mainly attributable to an increase in sales of the Range Rover and Evoque from 146,425 units in Fiscal 2013 to 166,697 units in Fiscal 2014 and Jaguar vehicles from 57,766 units in Fiscal 2013 to 80,644 units in Fiscal 2014. The increase in revenue in Fiscal 2014 was also attributable to an indirect tax incentive by Jaguar Land Rover of Rs.8,463 million.
The increase in revenue at our Jaguar Land Rover business was partly offset by a decrease in revenue for Tata and other brand vehicles (including financing thereof) by 15.8% to Rs.435,012 million in Fiscal 2014 from Rs.516,867 million in Fiscal 2013. Our revenues from sales in India decreased by 31.1% to Rs.335,009 million in Fiscal 2014 from Rs.439,157 million in Fiscal 2013. A decrease in revenue from M&HCVs, which decreased by 23.1% to Rs.129,350 million in Fiscal 2014 from Rs.168,363 million in Fiscal 2013, and LCVs, which decreased by 32.5% to Rs.74,900 million in Fiscal 2014 to Rs.112,631 million in Fiscal 2013 contributed to the decrease in revenue from Tata and other brand vehicles (including financing thereof). Similarly, revenue from passenger cars decreased by 38.6% to Rs.30,370 million in Fiscal 2014 from Rs.50,551 million in Fiscal 2013, and revenue from utility vehicles decreased by 30.0% to Rs.13,810 million in Fiscal 2014 from Rs.19,729 million in Fiscal 2013. Furthermore, there was a decrease in revenue from spares sales activity by 9.6% in Fiscal 2014. These decreases in revenue were offset by an increase in revenue of TDCV by 21.3% to Rs.47,533 million in Fiscal 2014 from Rs.39,204 million in Fiscal 2013.
Revenue from our vehicle financing operations decreased marginally by 0.5% to Rs.29,876 million in Fiscal 2014 as compared to Rs.30,013 million in Fiscal 2013.
Revenue (net of excise duty, where applicable) before inter-segment eliminations from other operations increased by 12.7% to Rs.24,989 million in Fiscal 2014 from Rs.22,179 million in Fiscal 2013, which represents 1.1% and 1.2% of our total revenue, before inter-segment eliminations, in Fiscal 2014 and 2013, respectively. The increase in revenues net of inter-segment elimination was Rs.889 million, which was mainly attributable to the acquisition of Cambric Holdings Inc by TTL.
Cost and Expenses
Raw Materials, Components and Purchase of Products for Sale (including change in stock) (Material costs)
Material costs increased by 20.3% to Rs.1,444,946 million in Fiscal 2014 from Rs.1,201,017 million in Fiscal 2013. The increase in absolute terms in material costs in Fiscal 2014 was mainly attributable to increased volumes at our Jaguar Land Rover business and includes an unfavorable foreign currency translation from GBP to Indian rupees for Jaguar Land Rover operations which resulted in an increase of Rs.133,237 million.
Material costs as a percentage of revenues (excluding finance revenues) decreased to 62.5% in Fiscal 2014 from 64.5% in Fiscal 2013. The reduction in material costs as a percentage to revenue was partly on account of a change in the composition of revenue, with a greater proportion of revenue attributable to Jaguar Land Rover revenue as compared to India operations in Fiscal 2014.
At our Jaguar Land Rover operations, material costs increased by 35.8% to Rs.1,154,510 million in Fiscal 2014 from Rs.850,372 million, in Fiscal 2013. The material costs as a percentage to revenue decreased to 61.4% in Fiscal 2014 from 62.8% in Fiscal 2013 for Jaguar Land Rover (in GBP terms). Material costs increased by GBP 1,107 million (Rs.106,416 million) due to an increase in volume and an increase in duties by GBP 163 million (Rs.15,676 million) which was mainly due to an increase in sales to China. However, as a percentage to revenue, duties decreased to 10.4% in Fiscal 2014 from 11.7% in Fiscal 2013, due to an increase in sales in China of 2.0 liter engines, on which a lower duty is paid during Fiscal years in which we sold engines separately in China. Furthermore, the decrease in material costs as a percentage to revenue was mainly due to cost-reduction programs undertaken by Jaguar Land Rover of approximately GBP 209 million (Rs.20,100 million). However, that decrease was partially offset by negative movement of foreign currency rates applicable for sourcing countries of GBP 154 million (Rs.14,811 million).
At our Tata and other brand vehicles operations (excluding finance revenues), material costs decreased by 19.3% to Rs.277,820 million in Fiscal 2014 from Rs.344,115 million, which was primarily caused by a reduction in sales volume across all vehicle categories at our India operations. The material costs as a percentage to revenue decreased to 68.6% in Fiscal 2014 from 70.7% in Fiscal 2013. The reduction of material costs as a percentage of revenue is mainly attributable to the composition of revenue, with a greater proportion of revenue attributable to revenue from spares and M&HCVs, which feature a lower percentage of material costs to revenue. Furthermore, in the utility vehicles and LCV categories, average price realization improved over material costs in Fiscal 2014. However, the decreases were offset by reductions in average price realization for passenger cars due to the competitive environment.
Employee Cost
Our employee costs increased by 28.0% to Rs.213,903 million in Fiscal 2014 from Rs.167,170 million in Fiscal 2013, including the foreign currency translation impact from GBP to Indian rupees discussed below. Our permanent headcount increased by 6.2% as at March 31, 2014 to 68,889 employees, as compared to 64,821 employees as at March 31, 2013, whereas the average temporary headcount decreased by 14.3% to 35,260 employees in Fiscal 2014 from 41,118 employees in Fiscal 2013.
The employee costs at Jaguar Land Rover increased by 39.8% to Rs.160,147 million in Fiscal 2014 from Rs.114,591 million in Fiscal 2013. This includes an unfavorable foreign currency translation from GBP to Indian rupees of Rs.17,987 million. In GBP terms, the employee costs at Jaguar Land Rover were GBP 1,654 million in Fiscal 2014 as compared to GBP 1,334 million in Fiscal 2013. The employee costs at Jaguar Land Rover as a percentage to revenue were 8.5% in Fiscal 2014 and 8.4% in Fiscal 2013. Due to consistent increases in volumes and to support new launches and product development projects, Jaguar Land Rover increased its permanent headcount by 29.6% as at March 31, 2014 to 23,111 employees as compared to 17,832 employees as at March 31, 2013. Jaguar Land Rover’s average temporary headcount decreased by 31.6% in Fiscal 2014 to 4,842 employees from 7,081 employees in Fiscal 2013. The increase in employee costs was also due to a higher pension charge by GBP 71 million (Rs.6,838 million) and a 7.5% increase in employee salary in Fiscal 2014 compared to an increase of 4.5% in Fiscal 2013.
At our India operations, the employee costs increased by 2.4% to Rs.33,672 million in Fiscal 2014 from Rs.32,880 million in Fiscal 2013. The permanent headcount decreased marginally by 0.5% as at March 31, 2014 to 38,434 employees as compared to 38,627 employees as at March 31, 2013. To address the challenges posed by the business downturn, we introduced an organization-wide cost-optimization program and incurred Rs.535 million towards an employee early-separation scheme. The remaining increase in employee cost was mainly due to regular increases in salary. For our India operations, the average temporary headcount decreased by 23.3% to 26,973 employees in Fiscal 2014 from 35,184 employees in Fiscal 2013.
The employee cost at TDCV decreased by 16.7% to Rs.5,771 million in Fiscal 2014 from Rs.6,916 million in Fiscal 2013. In Fiscal 2013, TDCV recorded a provision of Rs.2,124 million, stemming from the lawsuit filed by the union employees demanding inclusion of some elements of non-ordinary salary and bonus as part of ordinary wages, which had been decided by the district court of Seoul against TDCV. This decrease in employee costs at TDCV was offset by an increase of Rs.979 million in Fiscal 2014 relating to regular salary increases and an unfavorable foreign currency translation from Korean won to Indian rupees of Rs.196 million. Please see Item 4.B “Information on Our Company—Business Overview—Legal Proceedings” of this annual report on Form 20-F for further details on the lawsuit related to employee costs at TDCV.
During Fiscal 2014, we closed the manufacturing operations at Tata Hispano Motors Carrocera S.A. and accordingly paid Euro 12.4 million (Rs.1,006 million) as employee separation costs. The closure was triggered by continuous underperformance that was mainly attributable to challenging market conditions in regions where Hispano operates.
Other Expenses
Other expenses increased by 29.7% to Rs.498,778 million in Fiscal 2014 from Rs.384,423 million in Fiscal 2013. This increase mainly reflects an effect of volumes at Jaguar Land Rover and an unfavorable foreign currency translation of GBP to Indian rupees of Rs.43,558 million pertaining to Jaguar Land Rover. As a percentage of total revenues, these expenses represented 21.3% in Fiscal 2014 as compared to 20.3% in Fiscal 2013. The major components of expenses are as follows:
| Percentage of Total Revenue | ||||||||||||||||||||
| Year ended March 31, | Year ended March 31, | |||||||||||||||||||
| 2014 | 2013 | Change | 2014 | 2013 | ||||||||||||||||
(Rs. in millions) | ||||||||||||||||||||
Freight and transportation expenses | 75,439 | 55,930 | 34.9 | % | 3.2 | % | 3.0 | % | ||||||||||||
Works operation and other expenses | 186,067 | 143,924 | 29.3 | 7.9 | % | 7.6 | % | |||||||||||||
Publicity | 81,425 | 66,556 | 22.3 | 3.5 | % | 3.5 | % | |||||||||||||
Allowance for trade and other receivables, and finance receivables | 26,830 | 10,570 | 153.8 | 1.1 | % | 0.6 | % | |||||||||||||
Warranty and product liability expenses | 57,957 | 42,029 | 37.9 | 2.5 | % | 2.2 | % | |||||||||||||
Research and development expenses | 25,651 | 20,340 | 26.1 | % | 1.1 | % | 1.1 | % | ||||||||||||
| 1. | The increase in freight and transportation expenses corresponds to an increase in volumes at our Jaguar Land Rover operations, predominantly on account of increased China sales. |
| 2. | Our works operation and other expenses represented 7.9% and 7.6% of total revenue in Fiscal 2014 and 2013, respectively. These mainly relate to volume-related expenses at Jaguar Land Rover. |
| 3. | Publicity expenses were 3.5% of our revenue in Fiscal 2014 and Fiscal 2013. In addition to routine product and brand campaigns, we incurred expenses relating to new product introduction campaigns, namely for the new Range Rover, new Range Rover Sport, Range Rover Evoque, Jaguar F-TYPE, smaller powertrain derivatives of the XF and XJ, the XF Sportbrake, at Jaguar Land Rover, and the Prima LX series of trucks, and the Vista tech and Sumo Gold. |
| 4. | The allowances for trade and other receivables, and finance receivables mainly relates to India operations. The increase mainly relates to a provision for impairment of vehicle loans. Rates of defaults of vehicle loans increased in Fiscal 2014, as consistent deterioration in the economic environment in India severely affected fleet owners and transporters. In turn, due to overcapacity and slowing industrial activity, freight rates stagnated. As a result, the increased diesel prices and other cost could not be fully recovered by the transporters. Both large and small fleet operators suffered due to lack of cargos, which reduced trips and waiting periods. The situation was further accentuated on account of delays in payments by customers, which affected the cash flow and financial condition of small fleet operators which generally use vehicle financing to obtain fleet vehicles. Increased vehicle repossessions in Fiscal 2014 also led to downward pressures on realization of resales of these vehicles. In accordance with our policy for recognition of allowances for finance receivables upon an event of default, we made provision of Rs.24,139 million in Fiscal 2014 compared to Rs.9,428 million in Fiscal 2013. Furthermore, based on our assessment of the non-recoverability of overdues in trade and other receivables, we recorded a provision of Rs.2,691 million in Fiscal 2014 compared to Rs.1,142 million in Fiscal 2013. |
| 5. | Warranty and product liability expenses represented 2.5% and 2.2% of our revenue in Fiscal 2014 and Fiscal 2013, respectively. The warranty expenses at Jaguar Land Rover represented 2.84% of the revenue as compared to 2.80% last year, whereas warranty expenses for Tata and other brand vehicles (excluding vehicle financing) represented 0.99% of revenue as compared to 0.78% last year. The increased cost for Tata and other brand vehicles (excluding vehicle financing) represented an increase in warranty period from two years to four years for certain M&HCV models, resulting in an increase in warranty accrual from Rs.116 million in Fiscal 2013 to Rs.438 million in Fiscal 2014. Please refer to Item 5.A “Operating Results—Critical Accounting Policies—Product Warranty” of this annual report on Form 20-F for further details. |
| 6. | Research and product development costs represent research costs and costs pertaining to minor product enhancements, refreshes and upgrades to existing vehicle models. These represented 1.1% of total revenues for each of Fiscal 2014 and 2013. |
Expenditure capitalized
These represent employee costs, stores and other manufacturing supplies and other works expenses incurred towards product development projects and also include costs attributable to internally constructed capital items. Considering the nature of our industry, we continually invest in the development of new products and must also address safety, emission and other regulatory norms. The expenditure capitalized increased by 32.7% to Rs.135,247 million in Fiscal 2014 as compared to Rs.101,935 million in Fiscal 2013. The increase includes a favorable foreign currency translation impact from GBP to Indian rupees of Rs.13,374 million pertaining to Jaguar Land Rover. The increase reflects expenditure on new products and other major product development plans, for example, with respect to the new Range Rover, the Range Rover Sport, the Jaguar F-TYPE and new models of LCVs, Prima trucks and passenger cars.
Depreciation and Amortization
Our depreciation and amortization expenses increased by 45.8% in Fiscal 2014, the breakdown of which is as follows:
| Year ended March 31, | ||||||||
| 2014 | 2013 | |||||||
| (Rs. in millions) | ||||||||
Depreciation | 52,426 | 39,651 | ||||||
Amortization | 58,037 | 36,117 | ||||||
|
|
|
| |||||
Total | 110,463 | 75,768 | ||||||
|
|
|
| |||||
The increase on account of currency translation from GBP to Indian rupees is Rs.9,864 million pertaining to Jaguar Land Rover. The increase in depreciation expenses was on account of asset addition in Fiscal 2014 and plant and equipment and toolings (mainly towards capacity and new products) and the full effect of asset additions in the previous year. The amortization expenses mainly relate to product development costs capitalized and new products introduced during Fiscal 2013 and Fiscal 2014, primarily, the new Range Rover, the new Range Rover Sport, Evoque and Jaguar F-TYPE and represented 2.5% and 1.9% of revenue for Fiscal 2014 and Fiscal 2013, respectively.
Other income (net)
There was a net gain of Rs.7,733 million in Fiscal 2014, as compared to Rs.12,099 million in Fiscal 2013, representing a decrease of 36.1%.
| i. | In Fiscal 2013, we recorded a gain of Rs.3,933 million on account of the fair value of prepayment option to the holders of senior notes, which we prepaid before maturity. Consequently, we recognized a loss of Rs.4,792 million in Fiscal 2014, towards reversal of previously recognized gain. Please see Item 5.B “—Liquidity and CapitalResources—Long-term funding” for details on our prepayment of senior notes. |
| ii. | There was a loss on fair value of conversion option relating to foreign currency convertible notes of Rs.838 million in Fiscal 2014 as compared to a gain of Rs.802 million in Fiscal 2013. The notes were fully converted in Fiscal 2014. |
| iii. | In Fiscal 2014, there was a gain on a sale of available for sale investments of Rs.1,102 million as compared to loss of Rs.275 million in Fiscal 2013. |
For further details see Note 30 to our consolidated financial statements included elsewhere in this annual report onForm 20-F.
Interest expense (net)
Our interest expense (net of interest capitalized) increased by 30.2% to Rs.53,095 million in Fiscal 2014 from Rs.40,792 million in Fiscal 2013. As a percentage of total revenues, interest expense represented 2.3% in Fiscal 2014 compared to 2.2% in Fiscal 2013. The interest expense (net) for Jaguar Land Rover was GBP 138 million (Rs. 13,272 million) in Fiscal 2014 as compared to GBP 65 million (Rs.5,608 million) in Fiscal 2013. The increase of Rs.12,303 million was due to the prepayment of senior notes of GBP 53 million (Rs.5,097 million) as detailed below. Item 5.B “—Liquidity and Capital Resources—Long-term funding” of this annual report on Form 20-F for additional details regarding our prepayment of senior notes. This also includes a currency translation of Rs.2,317 million from GBP to Indian rupees.
Foreign exchange (gain)/loss (net)
We recorded a net foreign exchange gain of Rs.19,104 million in Fiscal 2014, compared to a loss of Rs.15,775 million in Fiscal 2013. This was primarily attributable to Jaguar Land Rover operations.
| i. | Jaguar Land Rover recorded an exchange gain of Rs.25,244 million in Fiscal 2014 as compared to a loss of Rs.12,680 million in Fiscal 2013. There was a gain of Rs.10,771 million on cash flow hedges in Fiscal 2014 as compared to a loss of Rs.5,047 million in Fiscal 2013. We incurred a net exchange gain on senior notes of Rs.8,367 million in Fiscal 2014, as compared to Rs.3,405 million in Fiscal 2013. The gain was mainly due to a depreciation of the U.S. dollar as compared to GBP. |
| ii. | For India operations, due to depreciation of the Indian rupee against all major currencies, we incurred exchange losses in Fiscal 2014. There was a net exchange loss of Rs.4,841 million in Fiscal 2014 as compared to Rs.5,467 million in Fiscal 2013, attributable to foreign currency denominated borrowings. |
Impairment in respect of equity-accounted investees
In Fiscal 2014, we recognized an impairment loss of Rs.8,034 million in respect of its investment in an associate, Tata Hitachi Construction Machinery Company Ltd. The associate is engaged in the business of manufacture and sale of construction equipment. Its operation was severely affected due to the current economic slowdown and increased competition from new entrants. The recoverable amount was determined based on value in use.
Income Taxes
Our income tax expense increased by 22.9% to Rs.48,227 million in Fiscal 2014 from Rs.39,239 million in Fiscal 2013, representing 26.9% as compared to 30.5% of net income before tax, respectively. The reasons for major reconciliation items are given below:
| i. | Considering the statutory tax rates applicable for each company in our group, the effective tax rate decreased from 23.7% in Fiscal 2013 to 19.9% in Fiscal 2014. The net increase in tax expense by Rs.5,280 million represents a gross increase in tax expense of Rs.11,970 million due to increase in income offset by decrease in the statutory tax rate of Rs.6,690 million. |
| ii. | We recognized net credit of Rs.5,300 million representing a reduction in statutory tax rates applicable to Jaguar Land Rover. We had recognized a net debit of Rs.1,548 million during Fiscal 2013 due to changes in tax rates in our Indian operations. |
| iii. | We recognized net credit of Rs.3,257 million in Fiscal 2014 in respect of utilization/credit of unrecognized tax losses, unabsorbed depreciation and other tax benefits as compared to Rs.518 million in Fiscal 2013. |
| iv. | Income tax expenses on undistributed earnings of subsidiaries increased by Rs.7,383 million in Fiscal 2014 mainly due to dividends paid in Fiscal 2015 out of profits of Fiscal 2014 declared by Jaguar Land Rover and an increase in profits in our overseas subsidiaries. |
| v. | The relevant Indian tax regulations mandate the companies to pay tax on book profits, known as Minimum Alternate Tax or MAT. MAT may be carried forward and set off against future income tax liabilities computed under normal tax provisions within a period of ten years. We had recognized deferred tax assets representing MAT paid in prior years for Tata Motors Limited on standalone basis. In the course of assessment of recoverability of MAT paid, we wrote off previously recognized tax credit of Rs.7,318 million in Fiscal 2014 in light of future taxable profit, considering the continued economic slowdown in India. |
| vi. | The tax on share of profit/loss of equity accounting investees was Rs.537 million in Fiscal 2014 as compared to a credit of Rs.34 million in Fiscal 2013. |
For further details refer to Note 17 to our consolidated financial statements included elsewhere in this annual report on Form 20-F.
Share of profit of equity-accounted investees and non-controlling interests in consolidated subsidiaries, net of tax
In Fiscal 2014, our share of profit of equity-accounted investees reflected a loss of Rs.1,878 million, as compared to Rs.132 million in Fiscal 2013. This change is primarily due to the following factors:
The operations of an associate engaged in the business of industrial equipment, Tata Hitachi Construction Machinery Co. Ltd, continued to be impacted by adverse economic conditions and competitive pressure. Our share of loss for Fiscal 2014 was Rs.1,354 million as compared to Rs.703 million in Fiscal 2013.
Fiscal 2013 includes a gain of Rs.1,101 million, representing our share of profit in one of the equity-accounted investees, Tata AutoComp Systems Ltd, which recorded gain on divestment of certain joint venture investments.
In Fiscal 2014, our share of non-controlling interest reflected a gain of Rs.462 million, as compared to Rs.886 million in Fiscal 2013, primarily due to the reduced profitability of one of our subsidiaries, TTL.
Net Income
Our consolidated net income in Fiscal 2014, excluding shares of non-controlling interests, increased by 47.4% to Rs.130,717 million from Rs.88,671 million in Fiscal 2013. Net income as a percentage of total revenues also increased to 5.6% in Fiscal 2014 from 4.7% in Fiscal 2013. This increase was mainly the result of the following factors:
Jaguar Land Rover’s performance in terms of volume and profitability contributed significantly. Earnings before other income, interest and tax for Jaguar Land Rover increased by 51.4% to Rs.228,026 million in Fiscal 2014 from Rs.150,653 million in Fiscal 2013 which amounted to 12.0% of sales as compared to 11.0% for Fiscal 2013. The increase in net income also includes a favorable foreign currency translation of Rs.22,566 million from GBP to Indian rupees. The improvement in profitability was mainly attributable to increases in volumes across all markets and models in Fiscal 2014. The reported earnings before other income, interest and tax also have an element of foreign currency translation gain from GBP to Indian rupees of Rs.27,064 million.
This was primarily offset by:
Revenues from the operations of Tata and other brand vehicles (including financing thereof), which were significantly affected by volume contractions, decreased by 19.6% to Rs.364,591 million in Fiscal 2014 from Rs.453,276 million in Fiscal 2013. This resulted in negative earnings before other income, interest and tax of Rs.20,631 million in Fiscal 2014 for Tata and other brand vehicles (including financing thereof), as compared to positive earnings of Rs.13,554 million in Fiscal 2013. The losses were mainly attributable to a significant reduction in sales volumes. There was an increase in depreciation expenses as a result of additions to plants and facilities in recent years, and in amortization expenses for product development costs due to new products launched.
A decrease in other income, mainly due to a loss on the fair value of a prepayment option and loss on a conversion option on senior notes of Jaguar Land Rover.
Impairment loss of Rs.8,034 million in respect of investment in an associate, Tata Hitachi Construction Machinery Co. Ltd.
Recent Accounting Pronouncements
Please refer to Note 2(v) to our consolidated financial statements included elsewhere in this annual report on Form 20-F for adopted and yet to be adopted accounting pronouncements as at March 31, 2015.
Critical Accounting Policies
The preparation of financial statements in conformity with IFRS requires management to make judgments, estimates and assumptions that affect the application of accounting policies and the reported amounts of assets, liabilities, income, expenses and disclosures of contingent assets and liabilities as of the date of this annual report on Form 20-F and the reported amounts of revenues and expenses for the years presented. The actual results may differ from these estimates.
Estimates and underlying assumptions are reviewed on an ongoing basis and at each balance sheet date. Revisions to accounting estimates are recognized in the period in which the estimate is revised and future periods affected.
In particular, information about significant areas of estimation uncertainty and critical judgments in applying accounting policies that have the most significant effect on the amounts recognized in the financial statements are included in the following notes:
Impairment of Goodwill
Cash-generating units to which goodwill is allocated are tested for impairment annually at each balance sheet date, or more frequently when there is an indication that the unit may be impaired. If the recoverable amount of the cash-generating unit is less than the carrying amount of the unit, the impairment loss is allocated first to reduce the carrying amount of any goodwill allocated to that unit and then to the other assets of the unitpro rata on the basis of carrying amount of each asset in the unit. Goodwill impairment loss recognized is not reversed in subsequent period. Please refer to Note 14 to our consolidated financial statements included elsewhere in this annual report on Form 20-F for assumptions used for goodwill impairment.
Impairment
Property, plant and equipment and intangible assets
At each balance sheet date, we assess whether there is any indication that any property, plant and equipment and intangible assets with finite lives may be impaired. If any such impairment exists, the recoverable amount of an asset is estimated to determine the extent of impairment, if any. Where it is not possible to estimate the recoverable amount of an individual asset, we estimate the recoverable amount of the cash-generating unit to which the asset belongs.
Intangible assets with indefinite useful lives and intangible assets not yet available for use are tested for impairment annually at each balance sheet date, or earlier, if there is an indication that the asset may be impaired.
Recoverable amount is the higher of fair value less costs to sell and value in use. In assessing value in use, the estimated future cash flows are discounted to their present value using a pre-tax discount rate that reflects current market assessments of the time value of money and the risks specific to the asset for which the estimates of future cash flows have not been adjusted.
If the recoverable amount of an asset (or cash-generating unit) is estimated to be less than its carrying amount, the carrying amount of the asset (or cash-generating unit) is reduced to its recoverable amount. An impairment loss is recognized immediately in the income statement.
Finance receivables
We provide allowances for credit losses in finance receivables based on historical loss experience, current economic conditions and events and the estimated collateral values for repossessed vehicles. This requires estimates, including the amounts and timing of future cash flows expected to be received which reflect changes in related observable data from period to period that may be susceptible to changes.
Impairment of equity-accounted investees
In Fiscal 2014, we recognized an impairment loss of Rs.8,034 million in respect of its investment in an associate, Tata Hitachi Construction Machinery Company Ltd, on account of economic slowdown and increased competition from new entrants. The associate is engaged in the business of manufacture and sale of construction equipment. The recoverable amount of the investment is determined based on value in use.
Product Warranty
Vehicle warranties are provided for a specified period of time. Our vehicle warranty obligations vary depending upon the type of the product, geographical location of its sale and other factors.
The estimated liability for vehicle warranties is recorded when products are sold. These estimates are established using historical information on the nature, frequency and average cost of warranty claims and our estimates regarding possible future incidence based on actions on product failures.
Changes in warranty liability as a result of changes in estimated future warranty costs and any additional costs in excess of estimated costs, can materially affect our net income. Determination of warranty liability is based on the estimated frequency and amount of future claims, which are inherently uncertain. Our policy is to continuously monitor warranty liabilities to determine the adequacy of our estimate of such liabilities. Actual claims incurred in the future may differ from our original estimates, which may materially affect warranty expense.
Employee Benefits
Employee benefit costs and obligations are dependent on assumptions used in calculating such amounts. These assumptions include salary increase, discount rates, health care cost trend rates, benefits earned, interest cost, expected return on plan assets, mortality rates and other factors.
While we believe that the assumptions used are appropriate, differences in actual experience or changes in assumptions may affect our employee benefit costs and obligations.
Recoverability/recognition of deferred tax assets
Deferred tax assets and liabilities are recognized for the future tax consequences of temporary differences between the carrying values of assets and liabilities and their respective tax bases, and unutilized business loss and depreciation carry-forwards and tax credits. Such deferred tax assets and liabilities are computed separately for each taxable entity and for each taxable jurisdiction. Deferred tax assets are recognized to the extent that it is probable that future taxable income will be available against which the deductible temporary differences, unused tax losses, depreciation carry-forwards and unused tax credits could be utilized.
Recent Developments
On May 13, 2015, the board of directors approved the issuance and allotment of 150,490,480 Ordinary Shares (including 32,049,820 Ordinary Shares represented by ADSs) and 26,509,759 ‘A’ Ordinary Shares in connection with a rights issue. As approved by our board of directors, 154,279 Ordinary Shares and 20,531 ‘A’ Ordinary Shares have been kept in abeyance.
The net proceeds from the rights offering were approximately Rs.74,905 million, which is being used mainly for repayment, in full or part, of certain long-term and short-term borrowings, funding of capital expenditure towards plant and machinery and funding expenditure relating to research and product development, towards general corporate purposes and issue expenses. Up to June 30, 2015, we have used Rs.33,000 million towards repayment of long-term and short-term borrowings and Rs.13,130 million towards general corporate purposes.
Subsequent to the Fiscal 2015, we conducted a renounceable rights offer of 150,644,759 new Ordinary Shares, including Ordinary Shares represented by ADSs, and 26,530,290 new ‘A’ Ordinary Shares of Rs.2 each to qualifying Tata Motors Shareholders recorded in the shareholders register at the close of business on April 8, 2015, at a subscription price of Rs.450 each for new Ordinary Shares and Rs.271 each for new ‘A’ Ordinary Shares in the ratio of six rights offer Shares for every 109 Tata Motors Limited Shares held. The rights offer was fully subscribed and the shareholders received the new Shares on May 13, 2015. For each of Fiscal 2015, 2014 and 2013, basic and diluted earnings per share have been retrospectively adjusted for the bonus element of the rights offer attributable to the difference between the exercise price of the rights and the prevailing market price of the Shares. 154,279 Ordinary Shares and 20,531 ‘A’ Ordinary Shares have been kept in abeyance. See Note 25 to our audited consolidated financial statements included elsewhere in this annual report on Form 20-F for further details.
B. Liquidity and Capital Resources
We finance our capital expenditures and research and development investments through cash generated from operations, cash and cash equivalents, debt and equity funding. We also raise funds through the sale of investments, including divestments in stakes of subsidiaries on a selective basis.
The key element of the financing strategy is maintaining a strong financial position that allows us to fund our capital expenditures and research and development investments efficiently even if earnings are subject to short-term fluctuations. Our treasury policies for liquidity and capital resources are appropriate for the automotive operations and are set through business specific sensitive analysis and by benchmarking our competitors. These are reviewed periodically by our board of directors.
Our business segments are (i) automotive operations and (ii) all other operations. We provide financing for vehicles sold by dealers in India. Our automotive operations segment is further divided into Tata and other brand vehicles (including financing thereof) and Jaguar Land Rover. Furthermore, given the nature of our industry and competition, we are required to make significant investments in product development on an ongoing basis.
Principal Sources of Funding Liquidity
Our funding requirements are met through a mixture of equity, convertible or non-convertible debt securities and other long-term and short-term borrowings. We access funds from debt markets through commercial paper programs, convertible and non–convertible debentures, and other debt instruments. We continually monitor funding options available in the debt and equity capital markets with a view to maintaining financial flexibility.
See Note 36 to our audited consolidated financial statements included elsewhere in this annual report on Form 20-F for additional disclosures on financial instruments related to liquidity, foreign exchange and interest rate exposures and use of derivatives for risk management purposes.
The following table sets forth our short-term and long-term debt position:
| Year ended March 31, | ||||||||
| 2015 | 2014 | |||||||
| (Rs. in millions) | ||||||||
Total short-term debt (excluding current portion of long-term debt) | 131,547 | 100,465 | ||||||
Total current portion of long-term debt | 48,919 | 65,496 | ||||||
Long-term debt net of current portion | 544,862 | 454,139 | ||||||
|
|
|
| |||||
Total Debt | 725,328 | 620,100 | ||||||
During Fiscal 2015 and 2014, the effective weighted average interest rate on our long-term debt was 7.6% and 8.2% per annum, respectively.
The following table sets forth a summary of long-term debt outstanding as at March 31, 2015.
Details of Long-term debt | Currency | Initial Principal amounts (millions) | Redeemable on | Interest Rate | Amount of Repayment (Rs. millions) | Outstanding (Rs. millions) | ||||||||||||||||||
| Year ended March 31, | ||||||||||||||||||||||||
| 2015 | 2014 | |||||||||||||||||||||||
Non-Convertible Debentures | INR | Various | 33,882 | 127,728 | 115,755 | |||||||||||||||||||
Collateralized debt obligations | INR | Various | 9,249 | 6,168 | 15,413 | |||||||||||||||||||
Buyers credit from bank | Various | Various | 1,946 | 16,425 | 13,350 | |||||||||||||||||||
Loan from banks / financial institutions | Various | Various | 76,736 | 140,048 | 172,254 | |||||||||||||||||||
Others | 160 | 2,615 | 3,055 | |||||||||||||||||||||
Senior Notes | ||||||||||||||||||||||||
Tata Motors Limited | USD | 250 | due 2024 | 5.750 | % | — | 15,450 | — | ||||||||||||||||
Jaguar Land Rover Automotive plc | USD | 500 | due 2023 | 5.625 | % | — | 30,936 | 29,424 | ||||||||||||||||
Jaguar Land Rover Automotive plc | GBP | 400 | due 2023 | 3.875 | % | — | 36,600 | — | ||||||||||||||||
Jaguar Land Rover Automotive plc | GBP | 400 | due 2022 | 5.000 | % | — | 36,630 | 39,326 | ||||||||||||||||
Jaguar Land Rover Automotive plc | USD | 410 | due 2021 | 8.125 | % | 19,937 | 5,171 | 24,112 | ||||||||||||||||
TML Holdings Pte Ltd | USD | 300 | due 2021 | 5.750 | % | — | 18,557 | — | ||||||||||||||||
Jaguar Land Rover | GBP | 500 | due 2020 | 8.250 | % | 44,487 | 5,350 | 49,122 | ||||||||||||||||
Tata Motors Limited | USD | 500 | due 2020 | 4.625 | % | — | 30,899 | — | ||||||||||||||||
Jaguar Land Rover Automotive plc | USD | 500 | due 2020 | 3.500 | % | 30,931 | — | |||||||||||||||||
Jaguar Land Rover Automotive plc | USD | 500 | due 2019 | 4.250 | % | — | 31,013 | — | ||||||||||||||||
Jaguar Land Rover Automotive plc | USD | 700 | due 2018 | 4.125 | % | — | 43,519 | 41,417 | ||||||||||||||||
TML Holdings Pte Ltd | SGD | 350 | due 2018 | 4.250 | % | — | 15,741 | 16,407 | ||||||||||||||||
| 64,424 | 300,797 | 199,808 | ||||||||||||||||||||||
|
|
|
|
|
| |||||||||||||||||||
Total Long-term debt | 186,397 | 593,781 | 519,635 | |||||||||||||||||||||
|
|
|
|
|
| |||||||||||||||||||
The following table sets forth a summary of the maturity profile for our outstanding long-term debt obligations as at March 31, 2015.
Payments Due by Period1 | Rs. in millions | |||
Within one year | 87,357 | |||
After one year and up to two years | 112,883 | |||
After two year and up to five years2 | 320,095 | |||
After five year and up to ten years2 | 254,109 | |||
Total | 774,444 | |||
| 1. | Including interest |
| 2. | Jaguar Land Rover has only senior notes as long-term debt obligations as at March 31, 2015 of Rs.220,149 million. |
The following table sets forth our total liquid assets, namely cash and cash equivalents, short-term deposits and investments in mutual funds:
| Year ended March 31, | ||||||||
| 2015 | 2014 | |||||||
| (Rs. in millions) | ||||||||
Total cash and cash equivalents | 197,431 | 159,922 | ||||||
Total short-term deposits | 104,391 | 125,150 | ||||||
Total mutual funds investments | 140,686 | 95,016 | ||||||
|
|
|
| |||||
Total liquid assets | 442,508 | 380,088 | ||||||
|
|
|
| |||||
These resources enable us to address business needs in the event of changes in credit market conditions. Of the above liquid assets, Jaguar Land Rover holds Rs.394,092 million and Rs.344,228 million as at March 31, 2015 and as at March 31, 2014, respectively. Most of the Jaguar Land Rover’s liquid assets are maintained in GBP and smaller balances are maintained in USD, EUR and RMB and other currencies to meet operational requirements in those geographies.
We expect to invest in property, plant and equipment and product development of approximately Rs.388 billion during Fiscal 2016.
We will continue to invest in new products and technologies to meet consumer and regulatory requirements. We are currently investing in a new assembly plant in Brazil, our joint venture in China, our Ingenium engine plant at Wolverhampton, United Kingdom, a capacity expansion at Solihull, United Kingdom, and construction of a GBP 400 million aluminum body shop at Castle Bromwich, United Kingdom for manufacturing of the new Jaguar XF, Sportbrake took Jaguar’s globally acclaimed sporting saloonamong other projects. We are investing in manufacturing facilities through our joint venture with Chery Automobile Company Ltd. in China and extendedin Brazil. We expect that these investments will enable us to pursue further growth opportunities and address competitive positioning. We expect to meet most of our investments out of operating cash flows and cash liquidity available to us. In order to meet the balance of the requirements of our investments, we may be required to raise funds through additional loan and by accessing the capital markets from time to time, as deemed necessary.
In view of the continuing prolonged economic downturn in the Indian economy, the operating margins for Tata Motors Limited on a standalone basis are expected to remain under pressure. With the ongoing need for investments in products and technologies, Tata Motors Limited was free cash flow (which is a non-IFRS measure that equals cash flow from operating activities, less payment for property, plant and equipment and intangible assets) negative in Fiscal 2015, calculated on a standalone basis, and expects to be free cash flow negative in Fiscal 2016. We expect that with the improvement in macro-economic conditions and business performance, through other steps like raising funds at subsidiary levels, review of non-core investments, and through appropriate actions for raising additional long-term resources at Tata Motors Limited on a standalone basis, the funding gap can be appropriately addressed.
The following table provides information for the credit ratings of Tata Motors Limited for short-term borrowing and long-term borrowing from the following rating agencies as at March 31, 2015: Credit Analysis & Research Limited, or CARE, ICRA Limited, or ICRA, CRISIL Ltd, or CRISIL, Standard & Poor’s Ratings Group, or S&P and Moody’s Investors Service, or Moody’s. A credit rating is not a recommendation to buy, sell or hold securities. A credit rating may be subject to withdrawal or revision at any time. Each rating should be evaluated separately of any other rating:
| CARE | ICRA | CRISIL | S&P | Moody’s | ||||||||||||||||
Long-term borrowings | AA+ | AA | AA | BB | Ba2 | |||||||||||||||
Short-term borrowings | — | A1+ | A1+ | — | — | |||||||||||||||
We believe that we have sufficient liquidity available to meet our planned capital requirements. However, our sources of funding could be materially and adversely affected by an economic slowdown, as was witnessed in Fiscal 2009, or other macroeconomic factors in India and abroad, such as in the United Kingdom, the United States, Europe and China, which are beyond our control. A decrease in the demand for our vehicles could affect our ability to obtain funds from external sources on acceptable terms or in a timely manner.
Our cash is located at various subsidiaries. There may be legal, contractual or economic restrictions on the ability of subsidiaries to transfer funds to us in the form of cash dividends, loans, or advances. Brazil, Russia, South Africa and other jurisdictions have regulatory restrictions disincentives or costs on pooling or transferring of cash. However such restrictions have not had and are not estimated to have a significant impact on our ability to meet our cash obligations.
Long-term funding
In order to refinance our acquisition related borrowings and for supporting long-term funding needs, we continued to raise funds during Fiscal 2014 and Fiscal 2015. We had in the past issued convertible notes, which were convertible into equity or repayable on maturity. Details of major funding during Fiscal 2011 through Fiscal 2015 are provided below.
In May 2011, Jaguar Land Rover issued GBP 1,000 million equivalent senior notes. The senior notes included GBP 500 million senior notes due 2018 at a coupon of 8.125% per annum, US$410 million senior notes due 2018 at a coupon of 7.75% per annum and US$410 million senior notes due 2021 at a coupon of 8.125% per annum. The 2018 senior notes were callable in May 2014 and Jaguar Land Rover subsequently redeemed them in full through a tender offer/deposit with the agent in March 2014. In March 2015, senior notes due 2021 were prepaid for US$326 million.
In September 2011, we raised syndicated foreign currency term loans of US$500 million in two tranches with tenors between four to seven years. The proceeds were used to finance general capital expenditure and investments in its versatilityoverseas subsidiaries in accordance with guidelines on External Commercial Borrowings, or ECB, issued by the RBI. These have been prepaid fully in Fiscal 2015.
In March 2012, Jaguar Land Rover issued GBP 500 million senior notes due 2020 at a coupon of 8.25% per annum. The proceeds were used for general corporate purposes. The notes are callable at a premium for the present value of future interest rates, if called before a specified date and practicality.thereafter are callable at fixed premiums. In March 2015, these notes were prepaid for GBP 442 million.
During Fiscal 2013, we issued rated, listed, unsecured non-convertible debentures of Rs.21,000 million with maturities between two to seven years.
In January 2013, Jaguar Land Rover issued US$500 million senior notes due 2023 at a coupon of 5.625% per annum. The proceeds have been used for general corporate purposes, including to support ongoing growth and capital spending plans. The notes are callable at a premium for the present value of future interest rates, if called before a specified date and thereafter are callable at fixed premiums.
In May 2013, TML Holdings Pte Ltd. issued SGD 350 million, senior notes due 2018 at a coupon of 4.25% per annum. During Fiscal 2014, TML Holdings Pte Ltd. further raised US$600 million equivalent (US$460 million and SGD 176.8 million) through a syndicated loan facility with US$300 million equivalent (US$250 million and SGD 62.8 million) maturing in November 2017 and US$300 million equivalent (US$210 million and SGD 114 million) in November 2019. This fund has been utilized for the general corporate purposes of Tata Motors Limited’s Indian operations.
In December 2013 and January 2014, Jaguar Land Rover Automotive plc issued US$ 700 million senior notes due 2018 at a coupon of 4.125% per annum and GBP 400 million senior notes due 2022 at a coupon of 5% per annum. The proceeds have been utilized to refinance the GBP 500 million senior notes due 2018 at a coupon of 8.125% per annum and US$410 million senior notes due 2018 at a coupon of 7.75% per annum, which were callable in May 2014.
During Fiscal 2014, we issued rated, listed, unsecured, non-convertible debentures, or NCDs, of Rs.11,000 million. The proceeds have been utilized for general corporate purposes.
Jaguar Land Rover Automotive plc as borrower had entered into a committed revolving credit facility for three and five years under a facility agreement in December 2011 with a syndicate of banks. In July 2013, Jaguar Land Rover Automotive plc amended and restated the facility to GBP 1,250 million at better pricing and terms and conditions, which has since been upsized to GBP 1,290 million. As at March 2015, the facility is fully undrawn. The facility has two tranches, a three-year tranche of GBP 323 million (maturing in 2016) and a five-year tranche of GBP 967 million (maturing in 2018). Jaguar Land Rover is subject to certain customary financial and other covenants under this facility. On July 29, 2015, Jaguar Land Rover refinanced the facility, increasing the size to GBP 1.8 billion, all maturing in 5 years (2020).
In Fiscal 2015, TMFL and its subsidiary TMFSL continued its efforts and focus on issuing NCDs and commercial paper and raised Rs.26,043 million and Rs.114,832 million, respectively. Bank borrowings through secured and unsecured term loans continued to remain as the major source of funds for long-term borrowing. Furthermore, during Fiscal 2015, TMFL issued unsecured perpetual NCDs worth Rs.503 million towards Tier 1 Capital and unsecured long-term NCDs worth Rs.2,350 million as Tier 2 Capital to enhance its capital adequacy ratio based on the RBI guidelines.
In Fiscal 2015, Jaguar Land Rover Automotive plc issued US$500 million senior notes due 2019 at a coupon of 4.250% per annum, US$500 million senior notes due 2020 at a coupon of 3.50% per annum and GBP 400 million senior notes due 2023 at a coupon of 3.875% per annum. The proceeds were used for part prepayment of US$326 million senior notes due 2021 at a coupon of 8.125% per annum and GBP 442 million senior notes due 2020 at a coupon of 8.250% per annum and are being used for general corporate purposes, including support for our ongoing growth and capital spending plan.
In Fiscal 2015, TML Holdings Pte. Ltd. issued US$300 million senior notes due 2021 at a coupon of 5.750% per annum.
In Fiscal 2015, we issued US$500 million senior unsecured notes due 2020 at a coupon of 4.625% per annum and US$250 million senior unsecured notes due 2024 at a coupon of 5.750% per annum. The proceeds have been used to refinance existing ECB of US$500 million and the balance of the proceeds is being used to incur new additional capital expenditure and other permitted purposes as per RBI ECB guidelines.
During Fiscal 2015, Tata Motors Limited, issued rated, listed, unsecured NCDs of Rs.26,000 million. The proceeds have been utilized for general corporate purposes.
We plan to refinance and raise long-term funding through borrowings or equity issuances, on the basis of review of business plans, operating results and covenant requirements of our existing borrowings.
Short-term funding
We fund our short-term working capital requirements with cash generated from operations, overdraft facilities with banks, short- and medium-term borrowings from lending institutions, banks and commercial paper. The maturities of these short- and medium-term borrowings and debentures are generally matched to particular cash flow requirements. We had borrowings of Rs.131,547 million and Rs.100,465 million as at March 31, 2015 and 2014, respectively.
Our working capital limit for our India operations is Rs.140,000 million. The working capital limits are secured by hypothecation of existing current assets of Tata Motors Limited including stock of raw material, stock in process, semi-finished goods, stores and spares not relating to plant and machinery (consumable stores and spares), bills receivables and book debts, including vehicle financing receivables and all other moveable current assets except cash and bank balances, loans and advances of Tata Motors Limited, both present and future. The working capital limit is renewed annually for Tata Motors Limited.
We had unused credit facilities of Rs.290,655 million and Rs.250,392 million as at March 31, 2015 and 2014, respectively.
Loan Covenants
Some of our financing agreements and debt arrangements set limits on and/or require prior lender consent for, among other things, undertaking new projects, issuing new securities, changes in management, mergers, sales of undertakings and investments in subsidiaries. In addition, certain negative covenants may limit our ability to borrow additional funds or to incur additional liens, and/or provide for increased costs in case of breach. Certain of our financing arrangements also include financial covenants to maintain certain debt-to-equity ratios, debt-to-earnings ratios, liquidity ratios, capital expenditure ratios and debt coverage ratios.
We monitor compliance with our financial covenants on an ongoing basis. We also review our refinancing strategy and continue to plan for deployment of long term funds to address any potential non-compliance.
In Fiscal 2014, we were not in compliance with one covenant contained in our 2009 NCDs relating to our ratio of total outside liabilities to tangible net worth, which was waived by the lenders and did not result in any default or penalties. Under the terms of the bank guarantee agreement, a breach of one covenant is not an event of default and also does not require us to pay increased costs. Such non-compliance with loan covenants has not triggered and is not expected to trigger any cross-default provisions under any of our other financing documents. However, it may lead to payment of additional costs as a consequence of such breaches unless waived by the lenders. We believe that the above non-compliance will not affect our ability to raise funds in the future, but may possibly increase the cost of borrowings and/or offerings and credit enhancements. These NCDs were prepaid for Rs.19,941 million (including premium on redemption) in Fiscal 2015 and therefore there is no ongoing breach of these financial covenants.
Certain debt issued at Jaguar Land Rover Automotive plc is subject to customary covenants and events of default which include, among other things, restrictions or limitations on the amount of cash which can be transferred outside the Jaguar Land Rover group of companies in the form of dividends, loans or investments. These are referred to as restricted payments in relevant financing documentation. In general, the amount of cash which can be transferred outside the Jaguar Land Rover group is limited to 50% of its cumulative consolidated net income, as defined in the relevant financing documentation from January 2011. As at March 31, 2015, the estimated amount that is available for dividend payments, other distributions and restricted payments outside the Jaguar Land Rover group of companies is approximately GBP 2,797 million.
Cash Flow Data
The following table sets forth selected items from our consolidated statements of cash flows for the periods indicated.
| Year ended March 31, | ||||||||||||
| 2015 | 2014 | 2013 | ||||||||||
| (Rs. in millions) | ||||||||||||
Net cash provided by operating activities | 365,401 | 371,432 | 225,549 | |||||||||
Net income after tax | 129,082 | 131,179 | 89,557 | |||||||||
Adjustments to net income after tax | 316,600 | 245,410 | 167,201 | |||||||||
Changes in operating assets and liabilities | (38,048 | ) | 39,608 | (8,191 | ) | |||||||
Income tax paid | (42,233 | ) | (44,765 | ) | (23,018 | ) | ||||||
Net cash used in investing activities | (344,177 | ) | (296,330 | ) | (238,188 | ) | ||||||
Purchase of property, plant and equipment and intangible assets (net) | (300,899 | ) | (258,335 | ) | (186,315 | ) | ||||||
Net investment, short term deposit, margin money and loans given | (50,395 | ) | (43,401 | ) | (59,593 | ) | ||||||
Acquisitions | — | (1,294 | ) | — | ||||||||
Dividend and interest received | 7,115 | 6,700 | 7,720 | |||||||||
Net cash provided by/(used in) financing activities | 30,610 | (48,248 | ) | (20,696 | ) | |||||||
Equity issuance/proceeds from issue of shares by a subsidiary to non-controlling shareholders (net of issue expenses) | — | (3 | ) | 9 | ||||||||
Dividends paid (including to non-controlling shareholders of subsidiaries) | (7,207 | ) | (7,213 | ) | (15,057 | ) | ||||||
Interest paid | (69,131 | ) | (67,619 | ) | (58,577 | ) | ||||||
Short term (net) borrowings (net of debt issuance cost) | 30,110 | (25,509 | ) | 14,769 | ||||||||
Long term (net) borrowings (net of debt issuance cost) | 76,838 | 52,096 | 38,160 | |||||||||
Net change in cash and cash equivalents | 51,834 | 26,854 | (33,335 | ) | ||||||||
|
|
|
|
|
| |||||||
Cash and cash equivalents, end of the year | 197,431 | 159,922 | 116,910 | |||||||||
|
|
|
|
|
| |||||||
Fiscal 2015 compared to Fiscal 2014
Cash and cash equivalents increased by Rs.37,509 million in Fiscal 2015 (offset by an unfavorable currency translation of Rs.11,949 million from GBP to Indian rupees) from Rs.159,922 million in Fiscal 2014, to Rs.197,431 million. The increase in cash and cash equivalents resulted from the changes to our cash flows in Fiscal 2015 when compared to Fiscal 2014 as described below.
Net cash provided by operating activities totaled Rs.365,401 million in Fiscal 2015, which decreased by Rs.6,031 million as compared to Fiscal 2014.
The earnings before other income, interest and tax of Jaguar Land Rover increased from Rs.228,027 million in Fiscal 2014 to Rs.274,382 million in Fiscal 2015, whereas there was a loss before other income, interest and tax of Tata and other brand vehicles (including financing thereof) of Rs.29,831 million in Fiscal 2015 as compared to a loss of Rs.20,631 million in Fiscal 2014. Therefore the net income after tax (after adjustments) increased from Rs.376,589 million in Fiscal 2014 to Rs.445,682 million in Fiscal 2015.
The changes in operating assets and liabilities resulted in a net outflow of Rs.38,048 million in Fiscal 2015 as compared to an inflow of Rs.39,608 million in Fiscal 2014. As a result of an increase in volumes at Jaguar Land Rover, inventories increased by Rs.29,447 million in Fiscal 2015 as compared to Rs.36,430 million in Fiscal 2014 and trade receivables increased by Rs.25,246 million as compared to a decrease of Rs.10,526 million. After considering the increase in accounts payable and provisions, mainly driven by increase in volumes, there was a net outflow of cash on account of changes in operating assets and liabilities of Rs.13,261 million in Fiscal 2015 as compared to an inflow of Rs.37,762 million in Fiscal 2014, at Jaguar Land Rover.
For Tata and other brand vehicles (including financing thereof), there was a net outflow of cash on account of changes in operating assets and liabilities of Rs.20,915 million in Fiscal 2015, as compared to an inflow of Rs.319 in Fiscal 2014. In Fiscal 2015, the net inflow in vehicle finance receivables was Rs.4,033 million as compared to net outflow in vehicle financing receivables of Rs.11,195 million in Fiscal 2014. Excluding finance receivables, there was an outflow of Rs.24,949 million in Fiscal 2015 compared to an inflow of Rs.11,514 million in Fiscal 2014, which was primarily attributable to an increase in trade receivables, inventory and other financial assets and increases in acceptances (bill discounting).
Income tax paid has decreased to Rs.42,233 million in Fiscal 2015 as compared to Rs.44,765 million in Fiscal 2014 which was primarily attributable to tax payments by Jaguar Land Rover’s foreign subsidiaries in their respective tax jurisdictions.
Net cash used in investing activities totaled Rs.344,177 million in Fiscal 2015 as compared to Rs.296,330 million for Fiscal 2014, an increase of Rs.47,847 million, mainly due to investment in property, plant and equipment by Jaguar Land Rover and product development projects both at our Jaguar Land Rover and India operations. In Fiscal 2015, payments for capital expenditure at Jaguar Land Rover increased by 21.0% to Rs.272,703 million from Rs.225,398 million in Fiscal 2014. The increases in the capital expenditure were intended to support continued growth in sales volumes at Jaguar Land Rover and setting up new engine manufacturing facilities in the UK.
The following table sets forth a summary of our cash flow on property plant and equipment and intangible assets for the periods indicated.
| For the year ended, | ||||||||
| 2015 | 2014 | |||||||
| (Rs. in millions) | ||||||||
Tata and other brand vehicles | 27,477 | 32,237 | ||||||
Jaguar Land Rover | 272,703 | 225,398 | ||||||
Our net investment in short-term deposit margin moneys and loans resulted in an outflow of Rs.50,395 million in Fiscal 2015 as compared to Rs.43,401 million in Fiscal 2014, which mainly related to investment of surplus cash in bank deposits and mutual funds mainly by Jaguar Land Rover of Rs.40,151 million. In Fiscal 2015, Jaguar Land Rover invested Rs.12,259 million in the joint venture Chery Jaguar Land Rover Automotive Company Limited, as compared to Rs.9,008 in Fiscal 2014.
Net cash from financing activities totaled Rs.30,610 million in Fiscal 2015, as compared to an outflow of Rs.48,248 million in Fiscal 2014, mainly due to increased short-term borrowings.
For Tata and other brand vehicles (including financing thereof), the short-term debt increased by Rs.31,636 million and long-term debt (net) increased by Rs.25,690 million, which includes debts raised by TML Holdings Pte Ltd of Rs.18,041 million in Fiscal 2015. The funds raised by TML Holdings Pte Ltd have been utilized for our India operations. This includes an increase in debt (short-term and long-term) of Rs.3,541 million in Fiscal 2015 at TMFL, as compared to Rs.2,005 million in Fiscal 2014.
For Jaguar Land Rover, the short-term debt (net) decreased by Rs.3,237 million due to repayment of loans in some of the overseas subsidiary, however, long-term debt (net) increased by Rs.55,539 million in Fiscal 2015 due to further issuance of senior notes.
Interest paid is Rs.69,131 million in Fiscal 2015 as compared to Rs.67,619 million in Fiscal 2014. For Jaguar Land Rover interest paid is Rs.23,509 million in Fiscal 2015 as compared to Rs.23,725 million in Fiscal 2014. This includes prepayment charges on senior notes of GBP 77 million (Rs.7,592 million) in Fiscal 2015 as compared to GBP 53 million (Rs.5,097 million) in Fiscal 2014. For Tata and other brand vehicles, interest paid was Rs.38,074 million in Fiscal 2015 as compared to Rs.43,157 million in Fiscal 2014. Please see Item 5.B “—Liquidity and Capital Resources—Long-term funding” of this annual report on Form 20-F for additional details on our prepayments of senior notes.
Fiscal 2014 compared to Fiscal 2013
Cash and cash equivalents on March 31, 2014 increased by Rs.43,012 million (including a favorable currency translation of Rs.24,123 million from GBP to Indian rupees) from Rs.116,910 million in Fiscal 2013, to Rs.159,922 million. The increase in cash and cash equivalents resulted from the changes to our cash flows in Fiscal 2014 as described below.
Net cash provided by operating activities totaled Rs.371,432 million in Fiscal 2014, which increased by Rs.145,883 million as compared to Fiscal 2014. The increase was mainly attributable to performance of the Jaguar Land Rover, which had an increase in earnings before other income, interest and tax from Rs.150,653 million in Fiscal 2013 to Rs.228,027 million in Fiscal 2014. The increase was offset by a loss before other income, interest and tax of Tata and other brand vehicles (including financing thereof) of Rs.20,630 million in Fiscal 2014 as compared to a profit of Rs.13,554 million in Fiscal 2013.
The changes in operating assets and liabilities resulted in a net inflow of Rs.39,608 million in Fiscal 2014 as compared to an outflow of Rs.8,191 million in Fiscal 2013. As a result of increase in volumes at Jaguar Land Rover, inventories increased by Rs.36,430 million in Fiscal 2014 as compared to Rs.28,447 million in Fiscal 2013. On the back of volume increase in retail, trade receivables at Jaguar Land Rover decreased by Rs.10,526 million as compared to an increase of Rs.22,892 million. After considering the increase in accounts payable and provisions, mainly driven by increase in volumes, there was a net inflow of cash on account of changes in operating assets and liabilities of Rs.37,762 million in Fiscal 2014 as compared to Rs.26,080 million in Fiscal 2013 at Jaguar Land Rover.
For Tata and other brand vehicles (including financing thereof), there was a net inflow of Rs.319 million in Fiscal 2014, as compared to an outflow of Rs.34,653 in Fiscal 2013. In Fiscal 2013, such outflow included a net increase in vehicle financing receivables of Rs.36,406 million due to an increase in vehicle financing activity. In Fiscal 2014, the net outflow in vehicle finance receivables was Rs.11,195 million. Excluding finance receivables, there was an inflow of Rs.11,514 million in Fiscal 2014 compared to Rs.1,753 million in Fiscal 2013, which was primarily attributable to a decrease in trade receivables and inventory resulting from lower volumes and partly collection of overdue amounts.
Income tax paid increased to Rs.44,765 million in Fiscal 2014 as compared to Rs.23,018 million, which was primarily attributable to tax payments by Jaguar Land Rover’s foreign subsidiaries in their respective tax jurisdictions.
Net cash used in investing activities totaled Rs.296,330 million in Fiscal 2014 as compared to Rs.238,188 million for Fiscal 2013, an increase of Rs.58,142 million, mainly due to investment in property, plant and equipment by Jaguar Land Rover and product development projects both at our Jaguar Land Rover and Tata and other brand vehicles (including financing thereof) operations. In Fiscal 2014, payments for capital expenditure at Jaguar Land Rover increased by Rs.67,940 million to Rs.225,398 million from Rs.157,458 million in Fiscal 2013. The increases in the capital expenditure were intended to support continued growth in sales volumes at Jaguar Land Rover and setting up of new engine manufacturing facilities in the United Kingdom. The following table sets forth a summary of our cash flow on property plant and equipment and intangible assets for the periods indicated.
| Year ended March 31, | ||||||||
| 2014 | 2013 | |||||||
| (Rs. in millions) | ||||||||
Tata and other brand vehicles | 32,237 | 28,857 | ||||||
Jaguar Land Rover | 225,398 | 157,458 | ||||||
Our net investment in short-term deposit margin moneys and loans resulted in an outflow of Rs.43,401 million in Fiscal 2014 as compared to Rs.59,953 million in Fiscal 2013, which mainly related to investment of surplus cash in bank deposits mainly by Jaguar Land Rover of Rs.45,080 million. In Fiscal 2014, Jaguar Land Rover invested Rs.9,008 million in the joint venture Chery Jaguar Land Rover Automotive Company Limited compared to Rs.6,217 million in Fiscal 2013.
Net cash used in financing activities totaled Rs.48,248 million in Fiscal 2014, as compared to Rs.20,696 million in Fiscal 2013, mainly due to increased short-term borrowings, which was partly offset by lower dividend payments.
For Tata and other brand vehicles, the short-term debt decreased by Rs.10,878 million and long-term debt (net) increased by Rs.46,441 million, which includes debts raised by TML Holdings Pte Ltd of Rs.38,827 million in Fiscal 2014. The funds raised by TML Holdings Pte Ltd have been utilized for the general corporate purposes of Tata Motors Limited. This includes an increase in debt (both short-term and long-term) of Rs.2,005 million in Fiscal 2014 at TMFL, as compared to net increase of Rs.55,710 million in Fiscal 2013, due to a decrease in financing activity in Fiscal 2014. In Fiscal 2013, there was a repayment of convertible alternative reference securities of Rs.35,374 million.
For Jaguar Land Rover, the short-term debt (net) decreased by Rs.15,128 million due to repayment of loans in certain overseas subsidiaries and long-term debt (net) increased by Rs.7,913 million in Fiscal 2014.
Interest paid was Rs.67,619 million in Fiscal 2014 as compared to Rs.58,577 million in Fiscal 2013. For Jaguar Land Rover interest paid was Rs.23,725 million in Fiscal 2014 as compared to Rs.13,723 million in Fiscal 2013, due to prepayment charges on senior notes. For Tata and other brand vehicles (including financing thereof), the interest paid was Rs.43,157 million in Fiscal 2014 as compared to Rs.44,719 million in Fiscal 2013.
We paid dividends (including to non-controlling shareholders of subsidiaries) of Rs.7,213 million in Fiscal 2014 as compared to Rs.15,057 million in Fiscal 2013. The reduction was attributable to decrease in profits of Tata Motors Limited on a standalone basis.
Balance Sheet Data
Below is a discussion of major items and variations in our consolidated balance sheet as at March 31, 2015 and March 31, 2014, included elsewhere in this annual report on Form 20-F.
Our total assets were Rs.2,345,643 million and Rs.2,184,776 million as at March 31, 2015 and 2014, respectively. The increase by 7.4% in assets as at March 31, 2015 was after considering an unfavorable foreign currency translation from GBP into Indian rupees as described below.
Our total current assets have increased by Rs.39,782 million to Rs.993,491 million as at March 31, 2015 or 4.2%, as compared to Rs.953,709 million as at March 31, 2014.
Cash and cash equivalents were Rs.197,431 million as at March 31, 2015, compared to Rs.159,922 million as at March 31, 2014, an increase of 23.5%. This increase is offset by an unfavorable foreign currency translation of Rs.11,949 million from GBP to Indian rupees. We hold cash and cash equivalents principally in Indian rupees, GBP, and Chinese Renminbi. Out of cash and cash equivalents as at March 31, 2015, Jaguar Land Rover holds Rs.160,187 million, which is surplus cash deposits for future use. As at March 31, 2015, we had short-term deposits of Rs.104,391 million as compared to Rs.125,150 million as at March 31, 2014, a decrease of 16.6%. The net increase in cash and cash equivalents and deposits was primarily attributable to performance of our Jaguar Land Rover operations.
As at March 31, 2015, we had finance receivables including non-current portion (net of allowances for credit losses) of Rs.158,016 million as compared to Rs.185,275 million as at March 31, 2014, a decrease of 14.7%, primarily due to a reduction in financing activity in Fiscal 2015. Furthermore, the increase in allowances for our vehicle financing activity due to defaults and overdues have decreased the net finance receivables. Gross finance receivables were Rs.204,570 million as at March 31, 2015 as compared to Rs.216,863 million as at March 31, 2014. Vehicle financing is integral to our automotive operations in India. For further detail see Item 4.B Business Overview—Our Automobile Operations—Tata and other brand vehicles (including financing thereof)—Tata and other brand vehicles—Vehicle Financing”.
Trade receivables (net of allowance for doubtful receivables) were Rs.130,994 million as at March 31, 2015, representing an increase of 19.5% over March 31, 2014. The increase is offset by an unfavorable foreign currency translation of Rs.7,619 million from GBP to Indian rupees. The past dues for more than six months (gross) have increased from Rs.9,519 million as at March 31, 2014 to Rs.9,836 million or 3.3% as at March 31, 2015 and these mainly represent dues from government-owned transport undertakings and passenger vehicle dealers, for which we are pursuing recovery. Trade receivables for Tata and other brand vehicles have increased by 4.8% to Rs.27,985 million as at March 31, 2015 from Rs.26,709 million as at March 31, 2014. The trade receivables of Jaguar Land Rover increased from Rs.82,753 million as at March 31, 2014 to Rs.100,054 million as at March 31, 2015, as a result of the growth in revenue by 12.8% (measured in GBP).
As at March 31, 2015, inventories were at Rs.287,280 million compared to Rs.272,736 million as at March 31, 2014, an increase of 5.3%. The increase in finished goods inventory was Rs.7,018 million as at March 31, 2015 to Rs.224,705 million as compared to Rs.217,687 million as at March 31, 2014. This increase is offset by an unfavorable currency translation of Rs.16,890 million from GBP to Indian rupees. In terms of number of days to sales, finished goods represented 31 inventory days in sales in Fiscal 2015 as compared to 34 inventory days in Fiscal 2014. The increase in finished goods mainly relates to the increase in volumes, mainly at our Jaguar Land Rover.
Our investments (current and non-current investments) have increased to Rs.146,824 million as at March 31, 2015 from Rs.101,877 million as at March 31, 2014, representing an increase of 44.1%. This increase is offset by an unfavorable foreign currency translation of Rs.9,890 million from GBP to Indian rupees. Our investments mainly comprise mutual fund investments of Rs.140,686 million as at March 31, 2015 as compared to Rs.95,016 million as at March 31, 2014, of which, investments attributable to Jaguar Land Rover were Rs.136,362 million as at March 31, 2015 as compared to Rs.87,093 million as at March 31, 2014, an increase of 56.6%.
Our other assets (current and non-current) increased by 5.7% to Rs.72,051 million as at March 31, 2015 from Rs.68,144 million as at March 31, 2014. The increase mainly is attributable to prepaid expenses which were Rs.13,282 million as at March 31, 2015 as compared with Rs.11,692 million as at March 31, 2014 and VAT and other taxes recoverable which were Rs.53,021 million as at March 31, 2015 from Rs.51,595 million as at March 31, 2014. Furthermore, in Fiscal 2015, we have invested Rs.1,600 million in optionally convertible preference shares of Tata Hitachi Construction Co. Pvt. Ltd. These increases were offset by an unfavorable foreign currency translation of Rs.2,963 million from GBP to Indian rupees.
Our other financial assets (current and non-current) have decreased to Rs.40,062 million as at March 31, 2015 from Rs.96,418 million as at March 31, 2014. This includes an unfavorable currency translation impact of Rs.2,433 million from GBP to Indian rupees. Derivative financial instruments have decreased from Rs.79,559 million as at March 31, 2014 to Rs.19,260 million as at March 31, 2015, representing options and other hedging arrangements, mainly related to Jaguar Land Rover predominantly due to an increase in the volume of U.S. dollar forward foreign exchange contracts enacted coupled with the strengthening of the U.S. dollar compared to GBP and therefore decreasing the fair value of these derivative contracts.
Income tax assets (both current and non-current) decreased by 6.0% to Rs.11,261 million as at March 31, 2015 from Rs.11,979 million as at March 31, 2014. This includes an unfavorable foreign currency translation of Rs.74 million from GBP to Indian rupees.
Property, plant and equipment (net of depreciation) increased by 18.7% from Rs.494,610 million as at March 31, 2014 to Rs.586,899 million as at March 31, 2015. The increase mainly represented additions towards new product plans and the Ingenium engine facility at Jaguar Land Rover, which is offset by an unfavorable foreign currency translation of Rs.25,053 million from GBP to Indian rupees.
Goodwill as at March 31, 2015 decreased by 1.7% to Rs.7,320 million as compared to Rs.7,449 million as at March 31, 2014.
Intangible assets increased by 7.9% from Rs.492,184 million as at March 31, 2014 to Rs.530,901 million as at March 31, 2015, which mainly include product development projects, brands and other intangible assets. This increase is offset by an unfavorable foreign currency translation of Rs.22,523 million from GBP to Indian rupees. As at March 31, 2015, there were product development projects in process amounting to Rs.192,045 million.
Carrying value of investments in equity-accounted investees increased by 56.8% to Rs.31,737 million as at March 31, 2015, from Rs.20,237 million as at March 31, 2014. In Fiscal 2015, we invested Rs.12,259 million in Chery Jaguar Land Rover Automotive Company Limited, which is offset by an unfavorable currency translation of Rs.1,862 million from GBP to Indian rupees.
A deferred tax liability (net) of Rs.30,474 million was recorded in our income statement. Rs.43,608 million was recorded in other comprehensive income, which mainly includes derivative financial instruments of Rs.34,287 million and Rs.6,166 million (credit) (including translation) towards post-retirement benefits. The net deferred tax asset of Rs.17,012 million was recorded as at March 31, 2015 as compared to Rs.3,879 million as at March 31, 2014.
Accounts payable (including acceptances) were Rs.610,151 million as at March 31, 2015, as compared to Rs.595,818 million as at March 31, 2014, an increase of 2.4%, reflecting an increase in operations at Jaguar Land Rover and decreased by a favorable foreign currency translation of Rs.37,945 million from GBP to Indian rupees.
Other financial liabilities (current and non-current) were Rs.175,345 million as at March 31, 2015, as compared to Rs.44,097 million as at March 31, 2014, net of a favorable currency translation impact of Rs.11,001 million, mainly include liabilities towards vehicles sold under repurchase arrangements, derivative instruments, deferred payment liabilities, interest accrued but not due on loans and lease liabilities. We have derivative financial instruments representing options and other hedging arrangements which mainly relate to Jaguar Land Rover, which have increased to Rs.141,679 million as at March 31, 2015 from Rs.11,922 million as at March 31, 2014. Furthermore, interest accrued but not due increased by Rs.1,736 million to Rs.10,048 million as at March 31, 2015 as compared to Rs.8,312 million as at March 31, 2014.
Provisions (current and non-current) increased by 5.9% to Rs.119,153 million as at March 31, 2015 from Rs.112,524 million as at March 31, 2014. Provisions for warranties increased by Rs.6,574 million mainly on account of volume growth at Jaguar Land Rover, offset by a favorable foreign currency translation impact of Rs.7,826 million from GBP to Indian rupees. Furthermore, provisions for employee benefits obligations have increased by 17.7% to Rs.9,209 million as at March 31, 2015 as compared to Rs.7,823 million as at March 31, 2014. The increase was offset by a reversal in Fiscal 2015 of the provision for the employee law suit at TDCV of Rs.2,565 million as at March 31, 2014.
Other liabilities (current and non-current) increased by 10.1% to Rs.144,607 million as at March 31, 2015, as compared to Rs.131,283 million as at March 31, 2014. The increase related to an additional employee benefit obligations of Rs.14,843 million totaling Rs.82,554 million as at March 31, 2015 as compared to Rs.67,711 million as at March 31, 2014, mainly pertaining to the Jaguar Land Rover pension plan, consequent to changes in actuarial assumptions, primarily including the discount rate. Deferred revenue has increased by 59.0% to Rs.15,452 million as at March 31, 2015 to Rs.9,720 million as at March 31, 2014, due to the introduction of new service plans at Jaguar Land Rover. These increases were offset by a favorable currency translation of Rs.9,550 million from GBP to Indian rupees. Furthermore, the liability for advances received has decreased by 28.9% to Rs.22,884 million as at March 31, 2015 from Rs.32,180 million as at March 31, 2014.
Our total debt was Rs.725,328 million as at March 31, 2015, as compared to Rs.620,099 million as at March 31, 2014, an increase of 17.0%, which includes a favorable currency translation of Rs.17,956 million from GBP to Indian rupees. Short-term debt (including the current portion of long-term debt) increased by 8.7% to Rs.180,465 million as at March 31, 2015, as compared to Rs.165,961 million as at March 31, 2014. Long-term debt (excluding the current portion) increased by 20.0% to Rs.544,863 million as at March 31, 2015 from Rs.454,139 million as at March 31, 2014. Long-term debt (including the current portion) increased by 14.3% to Rs.593,781 million as at March 31, 2015 as compared to Rs.519,635 million as at March 31, 2014. Please see Item 5.B “—Liquidity and Capital Resources—Long term funding” for further details.
Total shareholders’ equity was Rs.539,352 million as at March 31, 2015 and Rs.631,696 million as at March 31, 2014, respectively.
Our reserves increased from Rs. 308,089 million as at March 31, 2014 to Rs.400,659 million as at March 31, 2015. We paid a dividend of Rs.7,207 million in Fiscal 2015.
Our other components of equity reflected a loss of Rs.59,435 million as at March 31, 2015 against a gain of Rs.125,609 million as at March 31, 2014. We have accounted for an actuarial gains/loss (net) reduction of Rs.28,986 million in respect of pension obligations as at March 31, 2015. In Fiscal 2015, a loss of Rs.142,801 million on cash flow hedges (net), recorded in comprehensive income and currency translation debit of Rs.41,723 million and loss on available for sale investments (net) of Rs.520 million.
The ratio of net debt to shareholders’ equity (total debt less cash and cash equivalents and liquid marketable securities divided by total shareholders’ equity) under IFRS increased from 0.6 as at March 31, 2014 to 0.7 as at March 31, 2015. Details of the calculation of this ratio are set forth in Exhibit 7.1 to this annual report on Form 20-F.
The following table sets forth our contingent liabilities as at the dates indicated.
| As at March 31, | ||||||||
| 2015 | 2014 | |||||||
| (Rs. in millions) | ||||||||
Income Tax | 1,346 | 1,237 | ||||||
Excise Duties | 14,042 | 9,942 | ||||||
Sales Tax | 9,331 | 9,605 | ||||||
Other Taxes and Claims1 | 3,851 | 5,209 | ||||||
Other Contingencies | 621 | 457 | ||||||
Total | 29,191 | 26,450 | ||||||
| 1. | Other taxes and claims include claims by other revenue authorities and distributors. See Item 4.B “—Business Overview—Legal Proceedings” of this annual report on Form 20-F. |
Rs.91,807 million and Rs.129,474 million in Fiscal 2015 and 2014, respectively, represent executory contracts on capital accounts otherwise provided for.
Under the joint venture agreement for Chery Jaguar Land Rover Automotive Co. Limited, we are committed to contribute Rs.35,282 million of capital towards our share in the capital of the joint venture. As at March 31, 2015, we have an outstanding commitment of Rs.6,300 million.
On an ongoing basis, our legal department reviews pending cases, claims by third parties against us and other contingencies. For the purposes of financial reporting, we periodically classify these matters into gain contingencies and loss contingencies. Gain contingencies are not recognized until the contingency has been resolved and amounts are received or receivable. For loss contingencies that are considered probable, an estimated loss is recorded as an accrual in financial statements and, if the matter is material, the estimated loss is disclosed. We do not consider any of these matters to be individually sufficiently material to warrant disclosure in our financial statements. Loss contingencies that are considered possible are not provided for in our financial statements, but if we consider such contingencies to be material, individually or in the aggregate, they are disclosed in our financial statements. Most loss contingencies are classified as possible unless clearly frivolous, in which case they are classified as remote and are monitored by our legal department on an ongoing basis for possible deterioration. We do not disclose remote matters in our financial statements. See Note 34 of our audited consolidated financial statements included elsewhere in this annual report on Form 20-F for additional information regarding our material claims and contingencies.
Since Fiscal 1997, we have benefited from participation in the EPCG Scheme which permits us to import capital equipment under a special license at a substantially reduced customs duty. Our participation in this scheme is subject to us fulfilling an obligation to export goods manufactured or produced by the use of capital equipment imported under the EPCG Scheme to the value of a multiple of the cost of insurance and freight value of these imports or customs duty saved over a period of six, eight and 12 years from the date of obtaining the special license. We currently hold 101 licenses which require us to export our products of a value of approximately Rs.81.19 billion between the years 2002 to 2021, and we carefully monitor our progress in meeting our incremental milestones. After fulfilling some of the export obligations as per provisions of Foreign Trade Policy, as at March 31, 2015 we have remaining obligations to export products of a value of approximately Rs.7.09 billion by March 2021. In the event that the export obligation under the EPCG Scheme is not fulfilled, we would have to pay the differential between the reduced and normal duty on the goods imported along with interest. In view of our past record of exceeding our export milestones, and our current plans with respect to our export markets, we do not currently foresee any impediments to meeting our export obligation in the required time frame.
Capital Expenditure
Capital expenditure totaled Rs.335,771 million, Rs.272,832 million and Rs.212,078 million during Fiscal 2015, 2014 and 2013, respectively. Our automotive operations accounted for a majority of this capital expenditure. We currently plan to invest approximately Rs.338 billion in Fiscal 2016 in new products and technologies. Please see Item 5.B “—Liquidity and Capital Resources” of this annual report on Form 20-F for additional details
Our capital expenditures in India during Fiscal 2015 related mostly to (i) the introduction of new products such as the Tata Zest, Bolt and Ultra Trucks, (ii) the development of planned future products and technologies, and (iii) quality and reliability improvements aimed at operating cost reductions.
Capital expenditure for Jaguar Land Rover mainly included expenditure for the launch on the New Range Rover:Rover Sport and Jaguar F-TYPE, product development costs on various future products, and expenditure on construction of the Ingenium engine plant at Wolverhampton, United Kingdom. The all new Rangemanufacturing plant at Chery Jaguar Land Rover Automotive Company Limited started operations in October 2014. We have committed to contribute Rs.35,282 million towards our share in the capital of the joint venture of which was launched in September 2012,Rs.28,982 million has been developed fromcontributed as at March 31, 2015. Our capital expenditures relating to the ground upIngenium engine plant at Wolverhampton were GBP 500 million.
We continue to focus on development of new products for the Indian market and other international markets it serves. Through Jaguar Land Rover, we continue to make investments in new technologies through its research and development activities to develop products that meet the requirements of the premium market including developing sustainable technologies to improve fuel economy and reduce carbon dioxide emissions. Please refer to Item 4.B “—Business Overview—Government Regulations” of this annual report on Form 20-F for further details.
We intend to continue investing in our business units and research and development over the next several years, including capital expenditures for our ongoing projects, new projects, product development programs, mergers, acquisitions and strategic alliances in order to build and expand our presence in the passenger vehicle and commercial vehicle categories.
Jaguar Land Rover has affirmed its GBP 600 million investment plan across three sites in the West Midlands, United Kingdom. The largest single investment has been made at its Castle Bromwich plant to upgrade the facility for the production of Jaguar XF, which consists of a GBP 320 million aluminum body shop to facilitate lightweight vehicle manufacturing. In addition, Jaguar Land Rover has completed the purchase of 62 acres of land to double the size of its Advanced Design and Engineering Centre in Whitley, United Kingdom to support development and production of ultra-low emission vehicles. An investment of GBP 150 million is also being made for the construction of the National Automotive Innovation Centre, or NAIC, which will open in Spring 2017. The NAIC is expected to provide a luxurious driving experience. Its elegant styling is a fresh interpretationtechnology hub for Jaguar Land Rover’s research team to work collaboratively with academics and R&D specialists from across the automotive supply chain.
Please see Item 4.A “Information on the Company—History and Development of the car’s iconic design cuesCompany” for more information on some of our recently launched and while instantly recognizable as a Range Rover, theanticipated new vehicle takes a significant step forward with a bold evolution of the characteristic design.products.
We engaged in additional financing activities during Fiscal 20122014 and 20132015 as described above in the introduction to this Item 5.B. “—Liquidity and Capital Resources”.
C. Research and Development, Patents and Licenses, etc.
Please see Item 4.B “—Business Overview” of this annual report for the information required by this item.
Please see Item 5.A “—Operating Results” of this annual report for the information required by this item.
E. Off-balance Sheet Arrangements
None
F. Tabular Disclosure of Contractual Obligations
The following table summarizes payments due under significant contractual commitments as at March 31, 2015:
| Payment due by period | ||||||||||||||||||||
| (Rs. in millions) | ||||||||||||||||||||
| Type | Total | Less than 1 year | 1 to 3 years | 3 to 5 years | More than 5 years | |||||||||||||||
Long Term Debts* | 440,596 | 143,383 | 168,273 | 53,519 | 221,045 | |||||||||||||||
Capital Lease | 2,849 | 732 | 1,339 | 620 | 158 | |||||||||||||||
Operating Lease | 12,483 | 988 | 1,100 | 763 | 9,632 | |||||||||||||||
Capital Commitments | 41,052 | 40,479 | 553 | 2 | 19 | |||||||||||||||
Purchase Commitments | 194,229 | 52,401 | 109,738 | 32,091 | — | |||||||||||||||
Other Liabilities | 168,784 | 91,604 | 23,765 | 4,420 | 49,688 | |||||||||||||||
Provisions | 80,314 | 34,301 | 36,681 | 5,108 | 4,224 | |||||||||||||||
|
|
|
|
|
|
|
|
|
| |||||||||||
Total | 940,307 | 363,888 | 341,449 | 96,522 | 284,765 | |||||||||||||||
|
|
|
|
|
|
|
|
|
| |||||||||||
| Payment due by period | ||||||||||||||||||||
| (Rs. in millions) | ||||||||||||||||||||
| Type | Total | Less than 1 year | 1 to 3 years | 3 to 5 years | More than 5 years | |||||||||||||||
Long-Term Debts1 | 593,781 | 87,535 | 189,326 | 243,652 | 253,660 | |||||||||||||||
Capital Lease | 1,675 | 755 | 579 | 341 | — | |||||||||||||||
Operating Lease | 21,530 | 4,627 | 4,023 | 1,753 | 11,127 | |||||||||||||||
Capital Commitments | 91,807 | 72,393 | 18,158 | 1,102 | 154 | |||||||||||||||
Purchase Commitments | 91,278 | 41,685 | 48,718 | 863 | 12 | |||||||||||||||
Other Liabilities | 318,473 | 145,831 | 73,102 | 59,807 | 56,202 | |||||||||||||||
Provisions | 119,152 | 50,032 | 55,518 | 8,337 | 5,265 | |||||||||||||||
|
|
|
|
|
|
|
|
|
| |||||||||||
Total | 1,237,696 | 402,858 | 389,424 | 315,855 | 326,420 | |||||||||||||||
|
|
|
|
|
|
|
|
|
| |||||||||||
| Includes interest |
See the section entitled “Cautionary Note on Forward-looking Statements” at the beginning of this annual report on Form 20-F.
| Item 6. | Directors, Senior Management and |
A. Directors and Senior Management.Management
Board of Directors.Directors
Under our Articles of Association, we cannot have less than three or more than fifteen directors. At present, our board of directors comprises ten directors. Our directors are not required to hold any of our Shares by way of qualification.
Under our Articles of Association, the numberboard of our directors cannot be less than three or more than fifteen. At present, there are twelve directors.
Article 127 of our Articles of Association provide that the Board of Directors of Tata Steel, which, with its subsidiary, owns, as ofat June 30, 2013,2015, 5.54% of our Ordinary Shares and none of our ‘A’ Ordinary Shares, has the right to nominate one director, or the “Steel Director”Steel Director, to the Board.our board of directors. Mr. Cyrus P. Mistry was appointed as a nominee director of Tatathe Steel Director with effect from May 29, 2013.
In addition, our Articles of Association provide that (a) our debenture holders have the right to nominate one director; adirector, or the Debenture Director, if the trust deeds relating to outstanding debentures require the holders to nominate a director;director and (b) financial institutions in India have the right to nominate two directors, or the “FinancialFinancial Institutions Directors”,Directors, to the Boardour board of directors pursuant to the terms of the relevant loan agreements. Currently, there is no Debenture Director or Financial Institutions Director on the Board. Ourour board of directors and there are not requiredno relevant debentures or loan agreements outstanding that would empower financial institutions in India to hold anynominate directors to our board of our Shares by way of qualification.directors.
As ofat June 30, 2013,2015, our directors and senior management, in their sole and joint names, beneficially held an aggregate of 1,369,19021,129 Ordinary Shares (approximately 0.05%0.0007% of our issued share capital) and 120,860’A’3,088 ‘A’ Ordinary Shares (approximately 0.03%0.0006% of our issued share capital). In addition, some
The position of Managing Director is vacant as of the date of this annual report on Form 20-F. Our board of directors is actively engaged in a talent search and recruitment process for filling up this critical leadership position. As an interim measure, a Corporate Steering Committee, or CSC, was constituted in Fiscal 2014 to provide oversight of strategy and key aspects of our directors holdoperations.
Mr. Cyrus P. Mistry chairs the CSC, comprising Mr. Pisharody, Mr. Borwankar and other officers of Tata Motors Limited, as trustees for various non-affiliated trusts, an aggregate of 1,774,880 Shares (representing approximately 0.07% of our issued share capital).well as the New Product Design and Engineering Review meetings.
The following table provides information about our directors, Executive Officersexecutive officers and Chief Financial Officer as at June 30, 2013:2015:
Name(2) | Position | Date of birth/ business address(1) | Year appointed as director or Executive Officer or Chief Financial Officer | Expiration of term | Number of ordinary shares of Rs. 2 each beneficially owned as of June 30, 2013 | Number of ‘A’ ordinary shares of Rs.2 each beneficially owned as of June 30, 2013 | ||||||||||||||
Ratan N. Tata3 | Chairman, Emeritus | Dec 28, 1937 | 1981 | 1,361,730 | 109,180 | |||||||||||||||
Cyrus P. Mistry | Chairman | July 4, 1968 | 2012 | Non-rotational | NIL | NIL | ||||||||||||||
Ravi Kant | Vice-Chairman | Jun 01, 1944 | 2000 | 2014 | NIL | NIL | ||||||||||||||
N.N. Wadia | Director | Feb 15, 1944 | 1998 | 2013 | NIL | NIL | ||||||||||||||
S. M. Palia4 | Director | Apr 25, 1938 | 2006 | — | 1,500 | 12,500 | ||||||||||||||
R.A. Mashelkar | Director | Jan 01, 1943 | 2007 | 2013 | NIL | NIL | ||||||||||||||
Nasser Munjee | Director | Nov 18, 1952 | 2008 | 2014 | NIL | NIL | ||||||||||||||
Subodh Bhargava | Director | Mar 30, 1942 | 2008 | 2014 | NIL | NIL | ||||||||||||||
V K Jairath | Director | Dec 27, 1958 | 2009 | 2014 | 250 | NIL | ||||||||||||||
Ranendra Sen5 | Director | Apr 09,1944 | 2010 | — | NIL | NIL | ||||||||||||||
Ralf Speth | Director | Sep 09, 1955 | 2010 | 2015 | NIL | NIL | ||||||||||||||
Falguni Nayar | Additional Director | Feb 19, 1963 | 2013 | 2015 | NIL | NIL | ||||||||||||||
Karl Slym6 | Managing Director | Feb 9, 1962 | 2012 | Non-rotational | NIL | NIL | ||||||||||||||
Ravindra Pisharody | Executive Director (Commercial Vehicles) | | November 24, 1955 | | 2012 | Non-rotational | NIL | 50 | ||||||||||||
S B Borwankar | Executive Director (Quality) | July 15, 1952 | 2012 | Non-rotational | NIL | NIL | ||||||||||||||
C. Ramakrishnan(7) | Chief Financial Officer | Jun 27,1955 | 2007 | 2015 | 5,000 | 2,880 | ||||||||||||||
Name | Position | Date of birth/ business address1 | Year appointed as Director, Executive Officer or Chief Financial Officer | Expiration of term | Ordinary Shares beneficially owned as at June 30, 20152 | ‘A’ Ordinary Shares beneficially owned as at June 30, 2015 2 | ||||||||||||
Mr. Cyrus P. Mistry | Non-Executive Chairman | July 4, 1968 | 2012 | Non-rotational | 15,855 | — | ||||||||||||
Mr. Ravi Kant3 | Vice-Chairman | June 1, 1944 | 2000 | 2014 | — | — | ||||||||||||
Mr. N.N. Wadia | Independent Director | February 15, 1944 | 1998 | 2019 | — | — | ||||||||||||
Dr. R.A. Mashelkar | Independent Director | January 1, 1943 | 2007 | 2017 | — | — | ||||||||||||
Mr. Nasser Munjee | Independent Director | November 18, 1952 | 2008 | 2019 | — | — | ||||||||||||
Mr. Subodh Bhargava | Independent Director | March 30, 1942 | 2008 | 2017 | — | — | ||||||||||||
Mr. V. K. Jairath | Independent Director | December 27, 1958 | 2009 | 2019 | — | — | ||||||||||||
Ms. Falguni Nayar | Independent Director | February 19, 1963 | 2013 | 2019 | — | — | ||||||||||||
Dr. Ralf Speth | Non-Executive Director | September 9, 1955 | 2010 | 20174 | — | — | ||||||||||||
Mr. Ravindra Pisharody | Executive Director (Commercial Vehicles) | November 24, 1955 | 2012 | 20164 | — | 50 | ||||||||||||
Mr. S. B. Borwankar | Executive Director (Quality) | July 15, 1952 | 2012 | 20154 | — | — | ||||||||||||
Mr. C. Ramakrishnan5 | Chief Financial Officer | June 27, 1955 | 2007 | 2017 | 5,274 | 3,038 | ||||||||||||
The business address of each of our directors, Executive Officers and Chief Financial Officer, other than as described immediately below, is Bombay House, 24 Homi Mody Street, Mumbai 400 001. The business address of Mr. N.N. Wadia is The Wadia Group, C-1, Wadia International Centre (Bombay Dyeing), Pandurang Budhkar Marg, Worli, Mumbai 400 025, India; the business address of Dr. R. A. Mashelkar is “Raghunath”, D-4, Varsha Park, Baner, Pune 411045, India; the business address of Mr. Nasser Munjee is Development Credit Bank Ltd, Peninsula Business Park, Tower ‘A’ 6th Floor, Senapati Bapat Marg, Lower Parel, Mumbai 400 013, India; the business address of Mr. Subhodh Bhargava is Tata Communications Limited, 4th Floor, VSB Bangla Sahib Road, New Delhi |
| Each of our |
| 4. | Subject to |
| 5. | Appointed as Tata Motors’ Group Chief Financial Officer with effect from |
Biographies
Set forth below is a short biography of each of our directors senior management and our Chief Financial Officer:
Mr. Cyrus P. Mistry (Chairman): Mr. Cyrus P. Mistry is the Chairman of Tata Sons. He has been a director of Tata Sons since 2006. In addition to being Chairman of Tata Sons,
Mr. Mistry is also Chairman of all major Tata companies, including Tata Industries, Tata Steel, Tata Motors Limited, TCS, Tata Power, Tata Teleservices, Indian Hotels, Tata Global Beverages and Tata Chemicals.
He was appointed as a director of Tata Motors Limited with effect from May 29, 2012, and as a Deputy Chairman of the CompanyTata Motors Limited with effect from November 7, 2012. Mr. Mistry took over as Chairman from Mr. Ratan N. Tata on his retirement with effect from December 28, 2012.
Mr. Mistry was previously a Managing Director of the Shapoorji Pallonji group. Under Mr. Mistry’s guidance, Shapoorji Pallonji’s construction business grew from a turnover of US$20 million to approximately US$1.5 billion. The group’s companies have evolved from pure construction to executing projects under designgroup and build and EPC delivery methodologies, implementing complex projects in the marine, oil and gas, and rail sectors. Under Mr. Mistry’s stewardship, the companies executed many landmark projects in India — construction of the tallest residential towers, the longest rail bridge, the largest dry dock and the largest affordable housing project. The group’s international construction business is now present in over 10 countries.
Mr. Mistry was also responsible for building theits infrastructure development vertical indivision. Mr. Mistry is the Shapoorji Pallonji group, beginning in 1995 with a 106MW power project in Tamil Nadu, followed byGroup Chairman of the developmentTata Group of India’s largest biotech park near Hyderabad, in partnership with the Andhra Pradesh government. The infrastructure vertical has also developed two large road projects totaling an investment of US$550 million.companies.
Mr. Mistry is a graduateGraduate of civil engineeringCivil Engineering from the Imperial College London (1990) and has an MSc in managementManagement from the London Business School (1997). He was recently bestowed with the Alumni Achievement Award by the London Business School.
On the untimely and tragic demise of Mr. Ratan N. Tata:Mr. Tata holds a B.Sc. (Architecture) degree in structural engineering from Cornell University, USA, and completed the Advanced Management Program at Harvard Business School, USA. He joined the Tata Group in 1962. In 1991, Mr. Tata was appointed ChairmanKarl Slym, Managing Director of Tata Sons.Motors Limited, on January 26, 2014, the CSC was constituted as an interim measure in order to provide greater focus and attention to our management of operations. Mr. Tata is associated with various organizations in India and overseas significant being Alcoa, Mitsubishi Corporation, the American International Group, JP Morgan Chase and Rolls Royce. Mr. Tata is also affiliated with the Indian Institute of Science, the Tata Institute of Fundamental Research andMistry is the Chairman of the two of the largest private sector promoted philanthropic trusts in India. During his tenure, the combined revenues of Tata entities have grown over ten-fold to annualized revenues of over US$100 billion.CSC.
The Government of India honored Mr. Tata with its second highest civilian award, the Padma Vibhushan, in 2008. Earlier, in 2000, he had been awarded the Padma Bhushan. Mr. Tata has also been conferred honorary doctorates in business administration by the Ohio State University, in technology by the Asian Institute of Technology, Bangkok, in science by the University of Warwick and a fellowship of the London School of Economics.
Mr. Tata joined the Company’s Board in 1981, became Executive Chairman in 1988 and was appointed as the Non Executive Chairman in 2001. Under his leadership, the Company has transformed from being a leader in the domestic commercial vehicle market to being India’s largest automobile company, with strong businesses in both the commercial vehicles and passenger car segments and a growing international footprint. Some of his achievements include the design and development of India’s first indigenously produced car, the Indica, and the Nano, among the world’s cheapest cars and the acquisition of Jaguar Land Rover. He retired on December 28, 2012, on attaining the age of 75 as per the retirement policy and was appointed as Chairman Emeritus with immediate effect.
Mr. Ravi Kant (Vice-Chairman):Mr. Kant had his education at the Mayo College, Ajmer, the Indian Institute of Technology, Kharagpur and did his Masters in Management (Industry) from the Aston University, UK. He was conferred with an Honorary D.Sc. by the Aston University, UK and is an Honorary Industrial Professor at the University of Warwick, UK.
Mr. Kant has extensive experience in the manufacturing and marketing fields, particularly in the automobile industry. Prior to joining the Company, he wasbeen with Philips India Limited as the director of the Consumer Electronics business.
He was awarded the Bombay Management Association Management Man of the Year Award 2008-09. The Indian Institute of Metals conferred him with the Honorary Membership of the Institute in the year 2010. He is also on the governing Board of Vale Columbia Center on Sustainable International Investment, SIFE Worldwide, the National Institute of Design, Ahmedabad, Chairman of IIM, Rohtak. He is the recipient of the Golden Peacock Corporate Award for Business Leadership for the year 2010 for his outstanding contribution in transforming Tata Motors Limited.
Mr. Kant joined the CompanyLimited since February 1999, joining as Senior Vice President in February 1999(Commercial Vehicles), and was appointedinducted onto our board of directors as an Executive Director (Commercial Vehicle Business Unit) in July 2000 and asbecame the Managing Director in July 2005. Upon retiring from his Executiveexecutive position on June 1, 2009, Mr. Kant continued on the Company’s Boardto be a member of Directorsour board of directors as Vice-Chairman.
Prior to joining Tata Motors Limited, he served as Director of Consumers Electronics for Philips India Limited, prior to which he served as Senior Executive Director (Marketing) of LML Limited and as Vice President (Sales & Marketing) of Titan Watches Limited.
Mr. Kant holds a Bachelor of Technology degree in Metallurgical Engineering from the Institute of Technology, Kharagpur and a Master’s degree in Science from the University of Aston, Birmingham, UK.
He retired as the Vice-Chairman of Tata Motors Limited on June 1, 2014 in accordance with our retirement age policy.
Mr. Nusli N. Wadia:Wadia
Educated in the United Kingdom, Mr. Wadia is the Chairman of the Bombay Dyeing & Manufacturing Company Limited and heads the Wadia Group.
He was appointed on the Prime Minister’s Council on Trade & Industry in 1998, 1999 and 2000-04. Mr. Wadia has a distinct presence in public affairs and has been actively associated with leading charitable institutions. He is also on the Managing Committee of the Nehru Centre, Mumbai. He is also the Chairman/TrusteeChairman and trustee of various charitable institutions and non-profit organizations.
He was appointed as aan independent director of the CompanyTata Motors Limited with effect from December 22, 1998.
Mr. S. M. Palia: Mr. Palia, a B.Com. LL.B. CAIIB and AIB (London), is a development banker by profession. He was with Industrial Development Bank of India, or IDBI, from 1964-1989. During this period, he held various positions including that of an Executive Director. He was also the Managing Director of Kerala Industrial and Technical Consultancy Organisation Limited, set up to provide consultancy services to micro enterprises and small and medium enterprises. Mr. Palia is on the Boards of various companies in the industrial and financial service sectors and is also actively involved as a trustee in various NGOs and trusts.
He was appointed as a director of the Company with effect from May 19, 2006. He retired with effect from April 25, 2013 on attaining the age 75 as per the retirement policy.
Dr. R. A. Mashelkar:Mashelkar
Dr. Mashelkar is an eminent chemical engineering scientist. Hescientist retired from the post of Director General from the Council of Scientific and Industrial Research or CSIR in 2006, after tenure of over 11 years. His leadership transformed CSIR into a user-focused, performance-driven and accountable organization.
Dr. Mashelkar is the President of the Indian National Science Academy, or INSA,the National Innovation Foundation, the Institution of Chemical Engineers, UKUnited Kingdom and the Global Research Alliance, a networkAlliance.The President of 60,000 scientists from five continents andIndia has been honored with honorary doctorates from 26 universities, including Universities of London, Salford, Pretoria, Wisconsin and Delhi. Dr. Mashelkar has also been elected as Fellow/ Associate of Royal Society, or FRS, London National Academy of Science (USA), US National Academy of Engineering, Royal Academy of Engineering, UK, World Academy of Art and Science, USA and the Academy of the Developing World, Trieste, Italy.
Dr. Mashelkar has won over 50 awards and medals at national and international levels, including the JRD Tata Corporate Leadership Award and the Stars of Asia Award (2005). In the post liberalized India, Dr. Mashelkar through leadership of various organizations/ Government Committees has played a critical role in shaping India’s Science & Technology policies. The Government of India honored Dr. Mashelkar with the PadmashriPadma Shri (1991), the Padma Bhushan (2000) and the Padma Bhushan (2000)Vibhushan (2014). Dr. Mashelkar is alsoholds a director of several well-known companies.Ph.D. in Chemical Engineering from the Bombay University.
He was appointed as aan independent director of the CompanyTata Motors Limited with effect from August 28, 2007.
Mr. Nasser Munjee:Munjee Mr. Munjee was educated at the Leys School, Cambridge, UK and holds Bachelor’s and Master’s degrees from the London School of Economics, UK. He joined Mr. H. T. Parekh, Chairman, ICICI, to establish, HDFC, the first housing finance company in India.
Mr. Munjee served with HDFC Bank Limited for over 20 years at various positions including as its Executive Director. He was the Managing Director of IDFC up toInfrastructure Development Finance Company Ltd. until March 2004. Since June 2005,Presently, he is the Chairman of the Development Credit Bank or DCB. Hesince June 2005 and is onalso a member of the Boardboard of directors of various multinationalother companies, andincluding ABB India Limited, Ambuja Cements Limited, Britannia Industries Limited, Cummins India Limited, HDFC Limited, Jaguar Land Rover Automotive plc, Tata Chemicals Limited, Tata Chemicals North America Inc, TMFL, Go Airlines (India) Limited, Strategic Foods International Co. (LLC), as well as various trusts.
Mr. Munjee is a Technical Advisor on the World Bank – Public PrivatePublic-Private Partnership Infrastructure Advisory Facility. Mr. Munjee holds a bachelor’s degree and Advisory Fund.a master’s degree from the London School of Economics.
He was appointed as aan independent director of the CompanyTata Motors Limited with effect from June 27, 2008.
Mr. Subodh Bhargava:Bhargava
Mr. Bhargava retired from Eicher group of companies as Group Chairman and Chief Executive in March 2000. He was the past President of the Confederation of Indian Industry and the Association of Indian Automobile Manufacturers, and the Vice President of the Tractor Manufacturers Association.
He is currently a member of the board of directors of several Indian companies, including Tata Communications Limited, Tata Steel and Larsen & Toubro Limited. Mr. Bhargava holds a degree in Mechanical Engineering from the University of Roorkee. He served the Eicher Group of companies since 1975. He retired as the Group Chairman and Chief Executive in March 2000 but continues as Chairman Emeritus, Eicher Group. He was the past President of the Confederation of Indian Industry, or CII, and the Association of Indian Automobile Manufacturers; and the Vice President of the Tractor Manufacturers Association. He was also a member of the Insurance Tariff Advisory Committee, the Economic Development Board of the Government of Rajasthan. He has held various prominent positions on various Chambers/Associations in the field of research in engineering and technology; and technical and management education and is currently associated as a director of several Indian corporates, including Tata Communications Limited and Tata Steel.
He was appointed as aan independent director of the CompanyTata Motors Limited with effect from June 27, 2008.
Mr. V. K. Jairath: Mr. V. K. Jairath holds Bachelor of Arts Degree in Public Administration and Bachelor of Laws Degree, both, from the Punjab University, Masters in Economics from the University of Manchester, UK and joined Indian Administrative Service in 1982.
Mr. Jairath served as the Principal Secretary (Industries), Government of the state government of Maharashtra before he took voluntary retirement from Government Services on March 31, 2008. He is presently providing Consultancy and Advisory Services on Legal, Financial and Regulatory issues related to Infrastructure Development and Industrial Investment.
Mr. Jairath has over 25 years of experience in public administration, rural development, poverty alleviation, infrastructure, finance, industry, urban development and environmental management, occupying various important positions in the Government of India and the State Governmentstate government of Maharashtra.
He has held various positions as Mr. Jairath is the Joint Managing Director of SICOM, Secretary toIndiabulls Real Estate Limited since September 29, 2014.
Mr. Jairath holds a Bachelor of Arts Degree in Public Administration and Bachelor of Laws Degree, both from the GovernorPunjab University, a Masters in Economics from the University of Maharashtra, Municipal Commissioner of Kolhapur, Collector of Wardha, besides being an Independent Director onManchester and joined the Boards of Public Sector Companies and Banks.Indian Administrative Service in 1982.
He was appointed as aan independent director of the CompanyTata Motors Limited with effect from March 31, 2009.
Mr. Ranendra Sen: Mr. Sen, graduated from St. Xavier’s College and joined the Indian Foreign Service in 1966. He served in various capacities at Embassies and Consulates in Moscow, San Francisco and Dhaka; as Deputy Secretary and Joint Secretary in the Ministry of External Affairs and as Secretary to the Atomic Energy Commission. He was also the Joint Secretary to successive Prime Ministers responsible for foreign and defense policies, atomic energy, space and other tasks.
Mr. Sen was assigned as the Ambassador to Mexico (1991-1992), Russia (1992-1998) and reunified Germany (1998-2002), as the High Commissioner to the United Kingdom (2002-2004) and as the Ambassador to the United States (2004-2009). He is the first Indian to serve as envoy to three P-5 and four G-8 capitals and has participated in about 180 multilateral and bilateral summits.
He was appointed as a director of the Company with effect from June 1, 2010 and ceased to be director with effect from October 16, 2012.
Dr. Ralf Speth: Dr. Speth is a Doctorate of Engineering in Mechanical Engineering and Business Administration from Warwick University, UK and holds a degree in engineering from Rosenheim University, Germany. Dr. Speth worked as a business consultant for a number of years before joining BMW in 1980. After serving BMW for 20 years, Dr. Speth joined Ford’s Premier Automotive Group as Director of Production, Quality and Product Planning.
Dr. Speth was appointed to the post of Chief Executive Officer at Jaguar Land Rover on February 18, 2010. He is on the Board of Jaguar Land Rover Automotive PLC, UK and is also the Chairman and Chief Executive Officer of the two wholly-owned subsidiary companies, Jaguar Land Rover Limited and Land Rover in the United Kingdom. Prior to this appointment, Dr. Speth was Head of Global Operations at the International Industrial Gases and Engineering Company, The Linde Group.
He was appointed as a director of the Company with effect from November 10, 2010.
Mr. R Pisharody:Mr. Pisharody is an alumni of IIT Kharagpur and IIM Calcutta. He joined the Company in 2007 as Vice-President (Sales and Marketing, CVBU) and was later elevated to President (CVBU) in 2009. Mr. Pisharody played a significant role in doubling commercial vehicle volumes and also oversaw the launch of commercial vehicles, including the Company’s entry into world class product platforms such as the Prima and Ultra. Prior to joining the Company, he worked in various roles with M/s Castrol India Ltd., BP Singapore Pte. Limited and Philips India Limited. He has over 30 years’ experience in sales, marketing and business development.
Mr. Pisharody was appointed as Executive Director (Commercial Vehicles) of the Company with effect from June 21, 2012.
Mr. S. B. Borwankar:Mr. Borwankar is a Mechanical Engineer with honors from IIT, Kanpur. He joined the Company in August 1974 and has been responsible in various executive positions for overseeing and implementing product development, manufacturing operations and quality control initiatives. He played a significant role in setting up greenfield projects for M&HCVs, axle components, designing and production of trims and chassis. He has over 37 years of experience in manufacturing and quality control with the Company.
Prior to his induction on the Board, Mr. Borwankar was Senior Vice President (Manufacturing Operations, CVBU).
Mr. Borwankar was appointed as Executive Director (Quality, Vendor Development & Strategic Sourcing) of the Company with effect from June 21, 2012.
Ms. Falguni Nayar:Ms. Falguni Nayar holds a B.Com, PGDM (from IIM, Ahmedabad) and
Ms. Nayar has been an investment banker having spent over 19 years with Kotak Mahindra Bank with the last 6six years as Managing Director and CEO of Kotak Investment Bank. Prior to this, she was with A F Ferguson & Co. as Manager. She is currently the founder and CEO of Nykaa.com, an online shopping website for beauty and wellness products andwhich also offers an online magazine, expert advice and virtual makeover tools. She is alsoa member of the Corporate Advisor to Temasek Holdings Advisorsboard of directors of several other Indian companies, including ACC Limited, Dabur India Pvt. Ltd., a Singapore based investment company supported by affiliates in AsiaLimited and Latin America. She has also held varied positions such as Director — Business Standard, Founding Member of Asia Society and Member of BSE’s CEO Selection Committee. Aviva Life Insurance Company India Limited.
She was recognized as the ‘Top“Top Business Woman’Woman” by Business Today in 2009 and 2011 and has received the FICCI Ladies Organisation award for ‘Top“Top Woman Achiever’Achiever” in the field of banking in 2008. She holds a bachelor of commerce degree from the Mumbai University and a PGDM from the Indian Institute of Management, Ahmedabad.
She was appointed as aan independent director of the CompanyTata Motors Limited with effect from May 29, 2013.
Dr. Ralf Speth
Dr. Speth was appointed to the post of Chief Executive Officer at Jaguar Land Rover Automotive plc on February 18, 2010. He is a member of the board of directors of Jaguar Land Rover Automotive plc. Dr. Speth earned a degree in Engineering from Rosenheim University and holds a Doctorate of Engineering in Mechanical Engineering and Business Administration from Warwick University.
Having served BMW for 20 years, Dr. Speth joined Ford Motor Company’s Premier Automotive Group and served as Director of Production, Quality and Product Planning.
He was appointed as a non-executive and non-independent director of the Tata Motors Limited with effect from November 10, 2010.
Mr. Karl Slym (Managing Director):Ravindra Pisharody
Mr. Karl SlymPisharody is the Executive Director (Commercial Vehicles) since June 21, 2012, having joined Tata Motors Limited as Vice President Commercial Vehicles (Sales & Marketing), in 2007. He is also on the Managing Director from September 13, 2012. He leads all operationsboard of several of our subsidiaries and affiliates, such as Tata Marcopolo Motors Limited, Tata Cummins Private Limited, TMFL, Automobile Corporation of Goa Limited, Tata International Limited, Tata Hispano Motors Carrocera SA, Tata Hispano Motors Carrocerries Maghreb SA, Tata International Singapore Pte Limited, Nita Company Limited, TDCV, Tata Motors in India(SA) (Proprietary) Limited and international markets.
Tata Motors (Thailand) Limited. Before joining Tata Motors Mr. Slym was the Executive Vice PresidentLimited, he worked with Castrol Ltd., a subsidiary of BP plc, and Board Member, SGMW Motors, China (a General Motors Joint Venture), prior to which he was President, Managing Director and Board Memberwith Philips India, a subsidiary of General Motors in India. For over two decades, Mr. Slym has been with Toyota and General MotorsKoninklijke Philips N.V., in various positions across geographies.roles. Mr. SlymPisharody is an alumnus of Stanford Universitythe Indian Institute of Technology, Kharagpur and the Indian Institute of Management, Kolkata.
Mr. S. B. Borwankar
Mr. Borwankar started his career with Tata Motors Limited in 1974, as a Sloan Fellow.Graduate Engineer Trainee and is currently the Executive Director (Quality) with effect from June 21, 2012. He has worked in various executive positions for overseeing and implementing product development, manufacturing operations and quality control initiatives of the Commercial Vehicles Business Unit. He is also on the board of directors of certain of our subsidiaries, including Tata Cummins Private Limited, TML Drivelines Limited, Jaguar Land Rover India Limited, TAL Manufacturing Solutions Limited, Tata Motors (Thailand) Limited and TDCV. He has played a significant role in establishing our greenfield projects. Mr. Borwankar is a Mechanical Engineer from the Indian Institute of Technology, Kanpur.
Mr. C. Ramakrishnan (Chief Financial Officer):
Mr. Ramakrishnan joinedstarted his career with Tata Motors Limited in 1980. He handled corporate treasuryAs Chief Financial Officer, he is responsible for our Finance, Accounts, Taxation, Business Planning, Investor Relations, Treasury, CRM & DMS and accounting functions as well as management accounting. After a two-year company-wide IT project responsibility covering R&D, manufacturing, sourcing and sales and service, he had worked in the Chairman’s office. Mr. Ramakrishnan holds a B.Com. degree and is a qualified Chartered Accountant and Cost Accountant.divisions.
Before becoming Chief Financial Officer of Tata Motors Limited, Mr. Ramakrishnan was with the Chairman’s Office for seven years.
Mr. Ramakrishnan is on the board of directors of several of our subsidiaries, including TTL, Tata Cummins Private Limited, TMFL, TMFSL, Jaguar Land Rover Automotive plc, Tata Hispano Motors Carrocera, S.A., Tata Motors (Thailand) Limited, TDCV, Tata Motors (SA) (Proprietary) Limited, Sheba Properties Ltd., Fiat India Automobiles Private Limited and TML Holdings Pte. Limited.
Mr. Ramakrishnan is a chartered accountant and a cost accountant. Mr. Ramakrishnan was appointed as Chief Financial Officer of Tata Motors Limited with effect from September 18, 2007. With effect from July 1, 2015, Mr. Ramakrishnan has been appointed as Tata Motors’ Group Chief Financial Officer and will continue as the Chief Financial Officer of Tata Motors with effect from September 18, 2007.Limited for a term of two years. As a result of this appointment, the chief financial officers of our subsidiaries report directly to Mr. Ramakrishnan.
There is no family relationship between any of our directors, Executive Officers orexecutive directors and the Chief Financial Officer.
The following table provides the annual compensation paid/accrued to our directors, and Executive Officers and Chief Financial Officer in Fiscal 2015. For full-time directors, the retirement benefits exclude provision for Fiscal 2013.encashable leave and gratuity as a separate actuarial valuation is not available. We have not issued any stock options to our directors/employees.
Name | Position | Remuneration (in Rs.) | ||||
| ||||||
Mr. Cyrus P. Mistry | Non-Executive Chairman | |||||
Mr. Ravi Kant | ||||||
Mr. N.N. Wadia | Independent Director | |||||
Dr. R. A. Mashelkar | Independent Director | 470,000 | ||||
| Independent Director | |||||
| Independent Director | |||||
| Independent Director | |||||
| Independent Director | |||||
| Non-Executive Director | |||||
| ||||||
| ||||||
| ||||||
| ||||||
| Executive Director (Commercial Vehicles) | |||||
Mr. Satish Borwankar | Executive Director (Quality) | |||||
Mr. C. Ramakrishnan | Tata Motors’ Group Chief Financial Officer | |||||
| 1. | Includes salary, allowance, taxable value of perquisites, commission and our contribution to provident fund and superannuation fund for |
| 2. |
| 3. | The remuneration of Mr. |
| 4. |
| Dr. Ralf Speth’s remuneration |
| 5. | The remuneration includes directors’ fees and commissions received from Automobile Corporation of Goa Limited and directors’ fees paid by Tata International Limited and Nita Company Limited. |
| 6. | The remuneration also includes |
| 7. | The remuneration |
| Rounded to nearest thousands of Indian |
Apart from the above, the Managing andThe Executive Directors are also eligible to receive special retirement benefits at the discretion of the Board,our board of directors, which include a monthly pension, ex-gratia and medical benefits.
The Indian Companies Act, 1956 required shareholders’ approval by special resolution for remuneration in excess of Rs.4,800,000 per year for each director, if a company on a standalone basis records no profits or inadequate profits, as defined under the Indian Companies Act, 1956 for a given fiscal year.
The remuneration paid during Fiscal 2014 in excess of the statutory limit of Rs.31,950,227 for Mr. Pisharody and other benefits. Besides these,Rs.22,836,518 for Mr. Borwankar is currently held by the Managing Director also gets housing or compensationrespective directors in lieu thereof.trust for Tata Motors Limited. Through a postal ballot notice dated December 9, 2014, our shareholders approved and ratified the payment of the minimum remuneration to Mr. Pisharody and Mr. Borwankar as per the agreement in view of inadequacy of profits for Fiscal 2014, 2015 and 2016. However, we are awaiting for the Government of India’s approval in respect of Fiscal 2014. In respect of Fiscal 2015, the said minimum remuneration of the Executive Directors is within the limits prescribed under the companies Act 2013.
The BoardOur board of director’s size of twelveten directors is commensurate with our size and consistent with other companies in the industry. The BoardOur board of directors consists of Executive, Non-Executiveexecutive, non-executive and independent directors. Appointments of new directors are considered by the full Boardboard of directors and our shareholders at each year’s Annual General Meeting.annual general meeting.
The roles of the Chairman and the Chief Executive Officer are distinct and separate with appropriate powers being delegated to the Managing Director to perform the day to dayday-to-day activities of managing our company. As of the Company.date of this annual report on Form 20-F, the CSC is delegated with operational oversight of our company while the position of Managing Director remains vacant.
The Board,Our board of directors, along with its Committees, providecommittees, provides leadership and guidance to our management, in particular with respect to corporate governance, business strategies and, growth plans, the identification of risks and their mitigation strategies, entry into new businesses, product launches, demand fulfillment and capital expenditure requirements, and the review of our plans and targets.
The BoardOur board of directors has delegated powers to the Committees of the Boardits committees through written/specific written and stated specific terms of reference/reference and scope, and oversees the functioning operations of the Committeescommittees through various circulars/minutes circulated to it.circulars and minutes. The Committeescommittees operate as empowered agents of the Board as perboard of directors in accordance with their charter/respective charters and/or terms of reference.
The BoardOur board of directors also undertakes our subsidiaries’ oversight functions through review of their performance against their set targets, advises them on growth plans and, where necessary, gives strategic guidelines. While all of our subsidiaries have their respective Boardboards of Directorsdirectors, and their management is responsible for their performance, our Boardboard of directors oversees the performance of our subsidiaries on a quarterly basis in order to have anexercise oversight over the performance and functioning of our subsidiary companies. Oursubsidiaries. In a specific annual meeting of our Audit Committee, also has a meeting wherein the CEOchief executive officers and the CFOchief financial officers of our subsidiary companies meet annually andsubsidiaries make presentations on significant issues in audit, internal control and risk management.management in our subsidiaries. The minutes of the meetings of our subsidiary companiessubsidiaries are also placed before our Boardboard of Directorsdirectors and attention is drawn to significant transactions and arrangements entered into by our subsidiary companies.subsidiaries.
Please see Item 6.A “—Directors and Senior Management” for details regarding the terms of office for our board of directors.
Committees.Committees
Audit Committee
The Audit Committee comprises four independent directors: N.Mr. Munjee, Chairman, Falguni Nayar (appointed with effect from May 29, 2013), R. A.Dr. Mashelkar, Mr. Jairath, and V. K. Jairath.Ms. Nayar. The scope of the Audit Committee includes:
| a. | Reviewing the quarterly/annual financial statements before submission to our board of directors, focusing primarily on: |
Overseeing our financial reporting process and the disclosure of our financial information, including earnings and press releases, to ensure that the financial statements before submission to the Board, focusing primarily on:are correct, sufficient and credible;
anyReviewing reports on the management’s discussion and analysis of financial condition, results of operations and the directors’ responsibility statement;
Compliance with accounting standards and changes in accounting policies and practices and reasons for any such change;practices;
majorMajor accounting entries involving estimates based on an exercise of judgment by management;
qualifications inReviewing the draft audit reports;
report, qualifications, if any and significant adjustments arising out of audits;
compliance with accounting standards;audit;
analysisAnalysis of the effects of alternative GAAP requirementsmethods on the financial statements;
complianceCompliance with listing and other legal requirements concerning financial statements;
disclosureScrutiny of related party transactions;
review Reports on the Management Discussioninter-corporate loans and Analysis of financial condition, Results of Operations and the Directors’ Responsibility Statement;
overseeing our financial reporting process and the disclosure of its financial information, including any earnings press release, to ensure that the financial statements are correct, sufficient and credible;investments; and
disclosuresDisclosures made under the CEOprincipal executive officer and CFO certificationprincipal financial officer certifications and related party transactions to the Boardour board of directors and investors.our shareholders.
Reviewing with the management, external auditors and internal auditors, the adequacy of our internal control systems and recommending improvements to the management.
| b. | Reviewing, alongside management, our external auditors and internal auditors, the adequacy of internal control systems and recommending improvements to management, |
Reviewing, with the management, the statement of uses / application of funds raised through an issue (public issue, rights issue, preferential issue, etc.), the statement of funds utilized for purposes other than those stated in the offer document/ prospectus/ notice and the report submitted by the monitoring agency monitoring the utilization of proceeds of a public or rights issue and making appropriate recommendations to the Board to take up steps in this matter.
| c. | Reviewing, alongside management, statements of uses and applications of funds raised through issues (such as public issues, rights issues, preferential issues), the statement of funds utilized for purposes other than those stated in the relevant offer document and/or notice and the report submitted by the monitoring agency that monitors the utilization of proceeds of a public or rights issue and making appropriate recommendations to our board of directors in light of those reviews, |
Recommending the appointment / removal of the statutory auditors, fixing audit fees and approving non-audit, consulting services provided by the firms of statutory auditors to us and our subsidiaries; and evaluating auditors’ performance, qualifications and independence.
| d. | Recommending the appointment and/or removal of the statutory auditor, cost auditor, fixing audit fees and approving non-audit/consulting services provided by the statutory auditors’ firms to Tata Motors Limited and its subsidiaries; evaluating auditors’ performance, qualifications, experience, independence and pending proceedings relating to professional misconduct, if any. Our Audit Committee shall also ensure that the cost auditors are independent, have an arm’s-length relationship with us and are also not otherwise disqualified at the time of their appointment or during their tenure, |
Recommending the appointment/re-appointment/ removal of the cost auditors, fixation of audit fee, nature and scope of cost audit and approving other services provided by the firms of cost auditors to us and fees pertaining thereto; and ensure that the cost auditors are independent and have an arm’s length relationship and are also not otherwise disqualified at the time of their appointment or during their tenure.
| e. | Reviewing the adequacy of our internal audit, the coverage and frequency of our internal audit and the appointment, removal, performance and terms of remuneration of our chief internal auditor, |
Review and recommend the Cost Audit Report to the Board.
| f. | Discussing with the internal auditor and senior management significant internal audit findings and follow-up thereon, |
Reviewing the adequacy of the internal audit function, including the structure of the internal audit department, coverage and frequency of internal audits, appointment, removal, performance and terms of remuneration of the chief internal auditor.
| g. | Reviewing the findings of any internal investigation by the internal auditor into matters involving suspected fraud or irregularity or a failure of internal control systems of a material nature and reporting the matter to our board of directors, |
Reviewing the adequacy of the internal audit structure and function of the subsidiaries, their status of audit plan and its execution, key internal audit observations along with management response thereto and the status on compliance with the Tata Code of Conduct (concern resolution), risk management and the control environment.
| h. | Discussing with the external auditor, before the audit commences, the nature and scope of audit and conducting post-audit discussions to ascertain any area of concern, |
Oversight of our external financial reporting and monitoring components of internal control over financial reporting.
| i. | Reviewing our financial and risk management policies, |
Discussing with the internal auditors and senior management, significant internal audit findings and following thereon.
| j. | Establishing and reviewing the functioning of our vigil mechanism under our whistle-blower policy and reviewing the functioning of the legal compliance mechanism, |
Reviewing the findings of any internal investigation by the internal auditors into matters involving suspected fraud or irregularity or a failure of internal control systems of a material nature and reporting any such matters to the Board.
| k. | Reviewing the financial statements and investments made by subsidiary companies and subsidiary oversight relating to areas such as the adequacy of the internal audit structure and function of the subsidiaries, the status of their audit plans and their execution, key internal audit observations, risk management and the control environment, |
Discussing with the external auditors before the audit commences the nature and scope of such audit, as well as conducting post-audit discussions to ascertain any areas of concern.
| l. | Review of the causes of any substantial defaults in payment to the depositors, debenture holders, shareholders (in case of non-payment of declared dividend) and creditors, if any, |
Reviewing our financial and risk management policies.
| m. | Reviewing the effectiveness of the system for monitoring compliance with laws and regulations, |
Reviewing the functioning of the Whistle-Blower mechanism (which is an extension of the Tata Code of Conduct).
| n. | Approving the appointment of our Chief Financial Officer after assessing the qualification, experience and background of a candidate, |
Reviewing the financial statements and investments made by our subsidiary companies.
| o. | Engaging a registered valuer in case valuations are required in respect of any of our property, stocks, shares, debentures, securities, goodwill, assets, liabilities or net worth, |
Look into the reasons for any substantial defaults in payment to the depositors, debenture-holders, shareholders (in case of non-payment of declared dividend) and creditors, if any.
| p. | Reviewing and replying to any reports forwarded by the auditors on the matters where auditors have sufficient reason to believe that an offense involving fraud, is being or has been committed against us by our officers or employees, |
Reviewing the effectiveness of the system for monitoring compliance with laws and regulations.
| q. | Reviewing the system of storage, retrieval, display or printout of books of accounts maintained in electronic copies during the required period under law, |
Approving the appointment of the Chief Financial Officer.
| r. | Approving all or any subsequent modification of transactions with related parties, |
| s. | Approving policies in relation to the implementation of the Tata Code of Conduct for Prevention of Insider Trading and Code of Corporate Disclosure Practices, or the Insider Trading Code, and to supervise its implementation, and |
| t. | To note and take on record the status reports, detailing the dealings by designated persons in securities of Tata Motors Limited, as submitted by our compliance officer on a quarterly basis and to provide directions on any penalties for any violations of the Insider Trading Code. Mr. Ramakrishnan, our Chief Financial Officer, is the Compliance Officer under the Insider Trading Code. |
The Audit Committee has also adopted policies for the approval of services to be rendered by our independent statutory auditors, based on a procedure for ensuring such auditor’s independence and objectivity, as well as for the oversight of audit work for streamlining the audit process across our subsidiaries.
TheNomination and Remuneration Committee
The Nomination and Remuneration Committee comprises three independent directors, Mr. Wadia, Chairman, Mr. Bhargava and Dr. Mashelkar (appointed on December 15, 2014) and one Non-Executive Director, Mr. Mistry. Mr. Kant retired during Fiscal 2015. The Nomination and Remuneration Committee functions according to its charter, which defines its objective, composition, meeting requirements, authority, power, responsibilities and reporting and evaluation functions in accordance with the Companies Act and Indian listing requirements. The following is a summary of the principal terms of reference of the Nomination and Remuneration Committee:
| a. | To make recommendations to the board of directors of Tata Motors Limited regarding the establishment and composition of the board of directors and its committees including the formulation of the criteria for determining qualifications, positive attributes and independence of a director. The Nomination and Remuneration Committee will consider periodically reviewing the composition of the board of directors with the objective of achieving an optimum balance of size, skills, independence, knowledge, age, gender and experience; |
| b. | Devising a policy on board diversity; |
| c. | Recommending to the board the appointment or reappointment of directors; |
| d. | Recommending to the board on voting pattern for appointment and remuneration of directors of our material subsidiaries. |
| e. | Recommending to the board the appointment of Key Managerial Personnel, or KMP, as defined under the Companies Act as the chief executive officer, chief financial officer and company secretary, and executive team members of Tata Motors Limited as defined by the Nomination and Remuneration Committee; |
| f. | Carrying out an evaluation of every director’s performance and supporting the board and independent directors in evaluation of the performance of the board, its committees and individual directors. This shall include the formulation of criteria for evaluation of independent directors and the board. |
| g. | Overseeing the performance review process for KMP and the executive team of Tata Motors Limited; |
| h. | Recommending the remuneration policy for directors, KMP, the executive team of Tata Motors Limited and other employees; |
| i. | On an annual basis, recommending to the board the remuneration payable to the directors, KMP and the executive team of Tata Motors Limited; |
| j. | Reviewing matters related to voluntary retirement and early separation schemes for Tata Motors Limited; |
| k. | Providing guidelines for remuneration of directors of material subsidiaries of Tata Motors Limited; |
| l. | Overseeing the familiarization program for directors; |
| m. | Overseeing our human resources philosophy, human resources strategy and the efficacy of human resources practices, including those for leadership development, rewards and recognition, talent management and succession planning (specifically for the board of directors, KMP and executive team of Tata Motors Limited); and |
| n. | Performing such other duties and responsibilities as may be consistent with the provisions of the committee’s charter. |
Stakeholders Relationship Committee
The Stakeholders Relationship Committee comprises two independent directors, namely N. N. WadiaMr. Jairath and S. Bhargava and two non-Executive Directors, namely Cyrus P. Mistry (appointed with effect from February 14, 2013) and Ravi Kant. The committee is empowered to review the remuneration of whole-time directors, retirement benefitsMs. Nayar. Mr. Kant ceased to be paid to them and dealing with matters pertaining to Employees’ Stock Option Scheme.a member of the Stakeholders Relationship Committee in Fiscal 2015. The principal functions of the Stakeholders Relationship Committee are the following:
| a. | Reviewing statutory compliance matters relating to all security holders; |
| b. | Considering and resolving the grievances of security holders of the company including complaints related to transfer of securities, non-receipt of our annual report, declared dividends, notices and/or our balance sheet; |
| c. | Overseeing compliances in respect of dividend payments and transfer of unclaimed amounts to the investor education and protection fund; |
| d. | Overseeing and reviewing all matters related to the transfer of securities of Tata Motors Limited; |
| e. | Approving the issue of duplicate certificates of Tata Motors Limited; |
| f. | Reviewing movements in shareholding and ownership structures of Tata Motors Limited; |
| g. | Ensuring proper controls over and overseeing performance of our registrar and share transfer agent; and |
| h. | Recommending measures for the overall improvement of the quality of investor services. |
Executive Committee of the Board of Directors
We have not issued any stock options to our directors/employees.
The Investor Grievance Committeecomprises Ms. Falguni Nayar (appointed with effect from May 29, 2013), Karl Slym (appointed with effect from February 14, 2013), Ravi Kant and V. K. Jairath, and oversees the redressing of investors’ complaints pertaining and to securities transfers, interest/dividend payments, non-receipt of annual reports, issue of duplicate certificates, transmission of shares and debentures, matters pertaining to our Fixed Deposit Program and other miscellaneous complaints. Its scope also includes delegation of powers to our executives or the share transfer agents to process share transfers and other investor-related matters.
The Executive Committee of the Boardboard of directors comprises Cyrus P.Mr. Mistry, (appointed with effectas Chairman, Mr. Wadia, Mr. Munjee, Mr. Bhargava, Mr. Pisharody and Mr. Borwankar. Mr. Kant retired from May 29, 2012) Chairman Ravi Kant, S. Bhargava, N. N. Wadia, N. Munjee, Ravindra Pisharody Satish Borwankar, and Karl Slym (appointed with effect from. September 13, 2012). Thisthe Executive Committee came into effect on July 25, 2006, upon the dissolution of the Finance Committee and the Committee of the Board.in Fiscal 2015. The Executive Committee reviews revenue and capital expenditure budgets, long-term business strategy, thestrategies and plans, our organizational structure, raising of finance, property relatedproperty-related issues, review and sale of investments and the allotment of securities within established limits.
Corporate Steering Committee
The Corporate Steering Committee, or CSC, comprises Mr. Mistry, Chairman, Mr. Pisharody, Mr. Borwankar and Mr. Ramakrishnan, as well as our chief human resources officer, the president of our Passenger vehicles business unit and the head of advanced and product engineering. The CSC was constituted as an interim measure to provide oversight on strategy and key aspects of our operations until a Managing Director is appointed, a position which remains vacant as of the date of this annual report onForm 20-F.
Ethics and Compliance Committee
The Ethics and Compliance Committee sets set forth policies relating to the implementation of the Tata Code of Conduct for Prevention of Insider Trading and takes on recordCode, the recordation of monthly reports and dealings in securities by specified persons and made decisions regarding penal action in respect of violations of the “Specified Persons”.Insider Trading Code and applicable regulations. It also implementsimplemented appropriate actions in respect of violations of the Tata Code of Conduct.Insider Trading Code. The Ethics and Compliance Committee comprises, Falguni Nayar (appointed with effect from May 29, 2013), Ravi Kant, V. K.comprised Mr. Jairath and Karl Slym (appointed with effectMs. Nayar. Mr. Kant retired from February 14, 2013)the Ethics and C.Compliance Committee in Fiscal 2015.
Mr. Ramakrishnan, our Chief Financial Officer, who isacts as the Compliance Officercompliance officer under the saidInsider Trading Code.
The NominationsFollowing the notification of the SEBI (Prohibition of Insider Trading) Regulations, 2015 dated January 15, 2015, the function of the Ethics and Compliance Committee was constituted withrendered redundant. Therefore the objective of identifying independent directors to be inducted on the Board from time to time to refresh its membership. The NominationsEthics and Compliance Committee comprises N. N. Wadia, Chairman, Cyrus P. Mistry (appointedwas dissolved with effect from FebruaryMay 14, 2013)2015 and Ravi Kant.accordingly the reporting, monitoring and governance aspect of the Insider Trading Regulations, is vested within the purview of the Audit Committee.
Safety, Health & Environment Committee
The Safety, Health & Environment, or SHE Committee, comprises Dr. Mashelkar, Chairman, Mr. Jairath, Mr. Pisharody and Mr. Borwankar. The SHE Committee’s objective is to review our safety, health and environmental practices. The terms of reference of the SHE Committee include the following:
| a. | To take a holistic approach to safety, health and environmental matters in decision making; |
| b. | To provide direction to us in carrying out our safety, health and environment functions; |
| c. | To frame broad guidelines and policies with regard to safety, health and environment; |
| d. | To oversee the implementation of these guidelines/policies; and |
| e. | To review our safety, health and environmental policies, processes and systems periodically and recommend improvements from time to time. |
Corporate Social Responsibility Committee
The Corporate Social Responsibility Committee or CSR Committee, comprises Dr. Mashelkar, Chairman, Ms. Nayar and Mr. Borwankar. The terms of reference of the CSR Committee are to:
| a. | Formulate and recommend to our board of directors a Corporate Social Responsibility Policy which shall indicate the activities to be undertaken by us as specified in Schedule VII of the Companies Act; |
| b. | Recommend the amount of expenditure to be incurred on the activities referred to in clause a.; and |
| c. | Monitor our Corporate Social Responsibility Policy from time to time. |
Risk Management Committee
The Risk Management Committee was constituted with the objectiveby our board of reviewing Safety, Health and Environment practices. The Board of Directors indirectors at its meeting held on February 14, 2013, constituted a CommitteeOctober 8, 2014 pursuant to the provisions of our listing agreements with the BSE and adopted a Charter for the same. The SHE CommitteeNSE and comprises R.A.four of our independent directors: Mr. Munjee, Chairman, Dr. Mashelkar, Mr. Jairath and Ms. Nayar. Its terms of reference are as Chairman, V.K. Jairath, Karl Slym, Ravindra Pisharody and Satish Borwankar as members of the said Committee.follows:
| a. | Establishing principles and objectives for assisting the our board of directors in overseeing our risk management process and controls, risk tolerance, capital liquidity and funding levels, and providing a periodic review to our board of directors; |
| b. | The Risk Management Committee shall be appointed by our board of directors and may be staffed with directors and/or our executives. Our company secretary shall act as the secretary to the Risk Management Committee meetings; |
| c. | The Risk Management Committee’s quorum shall be any two members or one-third of the members, whichever is higher. The Risk Management Committee shall meet at least once every quarter and our chief internal auditor shall be the permanent invitee to its meetings; |
| d. | The Risk Management Committee shall act and have powers in accordance with the terms of reference, specified in writing by our board of directors, and shall be responsible for reviewing our risk governance structure, practices and guidelines; and |
| e. | The Risk Management Committee will report to our board of directors periodically on various matters and shall undergo an annual self-evaluation of its performance and report the results to our board of directors. |
Apart from the Committeescommittees described above, the Boardour board of Directorsdirectors may also constitutes committee(s)constitute committees of directors with specific terms of reference as it may deem fit.
We consider our human capital as a critical factor to our success. Under the aegis of Tata Sons and the Tata Sons promotedSons-promoted entities, we have drawn up a comprehensive human resource strategy which addresses key aspects of human resource development such as:
CodeA code of conduct and fair business practices.practices;
A fair and objective performance management system linked to the performance of the businesses which identifies and differentiates high performers while offering separation avenues for non-performers.non-performers;
Creation of a common pool of talented managers across Tata Sons and the Tata Sons promotedSons-promoted entities with a view to increasing their mobility through inter-company job rotation.rotation;
Evolution of performance based compensation packages to attract and retain talent within Tata Sons and the Tata Sons promoted entities.Sons-promoted entities; and
Development of comprehensive training programs to impart and continuously upgrade the industry/function specificimprove industry- and/or function-specific skills.
In line with our human resource strategy, we, in turn, have implemented various initiatives in order to build better organizational capabilitycapabilities that we believe will enable us to sustain competitiveness in the global market place. Our human resources focus is to attract talent, retain the better and advance the best.
Some of the initiatives to meet this objective include:
Extensive process mapping exercise to benchmark and align the human resource processes with global best practices.practices;
Introduction of a globally benchmarked employee engagement programme.
Succession planning through identificationthe Global Delivery Centre to handle all human resources transactional activities with the aim of second level of managers for all units, locations, functions.cost reduction and process standardization;
Implementation of a “Fast Track Selection Scheme”, which is a system for identifying potential talent in the areas of general, commercial and operations management and offering them opportunities for growth within the organization.
Our “Talent Management Scheme” which includes the identification of high performers and high potentials through various routes such as our Performance Management System and Development Centers. Subsequent to the identification process, we provide them with challenging assignments for faster development.
Introduction of performance rating based salary review and quality linked variable payment for supervisory category of employees.
Restructuring the top level organization and creation of new verticals for greater functional focus and moving towards creating a matrix organization.
Creation of a powerful employer brand to attract talent, —including our “Lead the Future” has become our Employee Value Proposition statement.proposition statement for employee value;
Driving cultural transformation — Wetransformation—we have reframed the mission, vision, values and culture of the organization and introduced the concept of ACES — Accountability, Customer & Product“ACES”, that is, accountability, customer and product focus, Excellenceexcellence and Speed.speed;
Extensive brand building initiatives at university campuses to increase recruiting from premium universities.top-level universities; and
Jaguar Land Rover launchedFocusing on skill and capability building of our blue-collar workforce, for example by developing a new “Team Talk Online” portal to its production workers, which provides them with business updates alongside information on employee benefits,common curriculum, infrastructure and training and development.methods.
We employed approximately 62,716 and 58,61873,485 permanent employees as ofat March 31, 2013 and 2012 respectively,2015, including as part of our Jaguar Land Rover business.business and joint operations. The average number of temporaryflexible (temporary, trainee and contractual) employees for the Fiscal 20132015 was approximately 39,009.40,213 (including joint operations).
The following table set forth a breakdown of persons employed by our business segments and by geographic location as of March 31, 2013.the following dates.
| ||||
| ||||
| ||||
| ||||
Segment | As at March 31, | |||||||||||
| 2015 | 2014 | 2013 | ||||||||||
| (No. of Employees) | ||||||||||||
Automotive | 66,101 | 63,051 | 56,393 | |||||||||
Other | 7,384 | 5,838 | 6,323 | |||||||||
|
|
|
|
|
| |||||||
Total | 73,485 | 68,889 | 62,716 | |||||||||
|
|
|
|
|
| |||||||
| ||||
| ||||
| ||||
| ||||
| As at March 31, | ||||||||||||
| 2015 | 2014 | 2013 | ||||||||||
Location | (No. of Employees) | |||||||||||
India | 43,313 | 43,986 | 41,597 | |||||||||
Outside of India | 30,172 | 24,903 | 21,119 | |||||||||
|
|
|
|
|
| |||||||
Total | 73,485 | 68,889 | 62,716 | |||||||||
|
|
|
|
|
| |||||||
Training and Development
We are committed to building the competencestraining and development of our employeesemployees. We have a focused approach with the objective of addressing all capability gaps and improving their performance through training and development. Our focus is on identifying gaps inpreparing our employees’ competencies and preparing employees for changes in competitive environments, as well as to meet organizational challenges.
Some of the focus areas in training in the last year centered on leadership, innovation management and internationalization besides other training programs to drive a change in our employees’ outlook as we continue to develop as a global competitor. Developmental initiatives for our senior leadership were undertaken through international programs at various premier institutions around the world. The entire senior leadership was also taken through a cultural sensitivity program conducted by world renowned faculty. Certain employees have also been selected for the Fulbright fellowships for leadership in management. In addition,external environment in order to emphasize the sharing of skills acrossmeet our locations and functions extensive technical training programs were organized in Pune, Jamshedpur and Lucknow. strategic objectives.
The technical exposure was enhanced further through international training and participation at international seminars.
At Jamshedpur, Pune and Lucknow in India, we have also established training divisions that impart basic skills indevelopment system addresses development needs of various trades like milling, grinding and welding to our young apprentices. We receivedsegments of the Best Learning Organization in Asia award from Learning & Organization Development Roundtable in June 2012.
workforce through the Tata Motors Academy. The Tata Motors Academy has created two initiatives inis supported by our Centre of Excellence and our Competency Delivery Centre. The Centre of Excellence focuses on the Learningintroduction of best-in-class frameworks, models and Development space. “iTeach” is an innovative practiceglobal practices. The Competency Delivery Centre ensures the implementation of getting line managers to take ownership in sharing their knowledgethese frameworks, models and experience.practices across the organization. We have switchedintroduced functional academies to e-enabledsupplement the Competency Delivery Centre and focus on particular areas of expertise and skills. These academies include the Engineering Excellence Academy, Operational Excellence Academy, Customer Excellence Academy, Human Resource Academy and Information Technology Academy, which will be responsible for designing and implementing comprehensive learning throughcurriculums for these. Similarly, the Management Education Academy aims to address the diverse behavioral needs of different categories of employees.
In addition to the Tata Motors Academy, our Learning Management Systems, or LMSs. Programs like “Autonova”, “Project Leap” were introduced in Fiscal 2013.Advisory Council, which includes senior leaders from different parts of our organization, aims to more closely align our learning and development with our business needs and priorities. The Learning Advisory Council is responsible for designing, implementing and reviewing the learning agenda.
We are now migrating from a Jaguar Land Rover launchednew higher apprenticeship programme offering 55 places this year in key pathways,trade-based training approach to a process-based training approach wherein it is more important for the team member to know skills related to his actual work in addition to its current intermediatethe general trade-based skills which are learned at the training institutes. These skills are very specific and advanced apprenticeship portfolio, whichnot currently has over 1,500 apprentices on programme in 2012. Jaguar Land Rover moved from 60th in 2011taught at the training institutes. We are implementing a Fundamental Skills Training initiative throughout our organization. Its objective is to 26th in 2012 on the listaddress key employee performance issues, such as inconsistent quality, poor craftsmanship, high frequencies of Times Top 100 Graduate employers. This was then followed by a move in the Guardian Top 300 Graduate employers from a positionrepairing reworking and low productivity levels through training of 127th in 2011our front-line team members. The Fundamental Skills Training initiative aims to 30th in 2012.address industry-specific skills that are not currently taught at training institutes.
Union Wage Settlements
AllWe have Labor Unions for operative/worker grade employees inat all our plants across India, belonging toexcept the operative grades are members of labor unions except at our Sanand and Dharwad plants. We have generally enjoyed cordial relations with our employees and unions at our factories and offices. We have generally received union support in our implementation of reforms that impact quality, cost erosion and productivity improvements across all locations.
Employee wages are paid in accordance with wage agreements that have varying terms (typically three years) at different locations. The expiration dates of the wage agreements with respect to various locations/subsidiariesunits are as follows:
Location/ | Wage Agreement valid until | |||
Pune | August 31, 2015 | |||
Pune | March 31, | |||
Jamshedpur | March 31, | |||
Mumbai | December 31, 2015 | |||
Lucknow | March 31, | |||
Pantnagar | March 31, 2015 | |||
Jaguar Land Rover | October 31, | |||
| ||||
A cordial industrial relations environment has been maintained in all our manufacturing units.
The variabilitywage agreement at Pantnagar has expired and negotiations are in progress for the new wage settlements was builtagreement. The Pune Commercial Vehicle Business Unit agreement will expire in by introducing vehiclesAugust 2015 and profit linked payment schemepreparations for a new agreement are underway.
Our wage agreements link an employee’s compensation to certain performance criteria which are based on the index of various parametersfactors such as quality, productivity, operating profit and an individual’s performance and attendance. As a result,
Please see Item 4.B “Information on the payment was high if company did well and low if it did not.
Union support in implementation of reforms that impact quality, cost erosion and productivity improvements across all locations is commendable.
TDCVCompany—Business Overview—Legal Proceedings” for details related to the lawsuit filed by our union employees had filed a lawsuit againstat TDCV in March 2011, for including some elements of non- ordinary salary and bonus as part of ordinaryrelated to wages. The District court gave a judgment in the union employees’ favor on January 2013, and ordered TDCV to pay the employees KRW 17.2 billion and interest. TDCV has filed an appeal against the order.
The information required by this item is set forth in Item 6.A “—Directors, Senior Management and Employees” of this annual report.report on Form 20-F.
| Item 7. | Major Shareholders and Related Party |
A. Major Shareholders.Shareholders
We are a widely held, listed company with approximately 396,528410,929, shareholders for Ordinary Shares and 46,76185,986 shareholders for ‘A’ Ordinary Shares ofon record. To our knowledge, as ofon June 30, 2013,2015, the following persons beneficially owned 1% or more of 2,736,705,7172,887,203,602 Ordinary Shares and 481,959,620508,476,704 ‘A’ Ordinary Shares outstanding at that time:
Ordinary Shares
Name of Shareholder | Holding | Percentage | ||||||
Ordinary Shares | ||||||||
Tata Sons Limited and Subsidiary | 715,781,955 | 26.16 | ||||||
Tata Steel Limited and Subsidiary | 151,687,515 | 5.54 | ||||||
Tata Industries Limited | 68,436,485 | 2.50 | ||||||
Europacific Growth Fund | 71,282,662 | 2.60 | ||||||
Citibank N.A.(1) | 526,720,980 | 19.24 | ||||||
ICICI Prudential Life Insurance Company Limited | 30,232,452 | 1.10 | ||||||
Life Insurance Corporation of India | 144,241,405 | 5.27 | ||||||
‘A’ Ordinary Shares* | ||||||||
Name of Shareholder | Holding | Percentage | ||||||
HDFC Trustee Company Limited - HDFC Top 200 Fund | 28,548,461 | 5.92 | ||||||
HDFC Trustee Company Limited - HDFC Equity Fund | 25,223,932 | 5.23 | ||||||
Eastspring Investments India Equity Open Limited | 11,239,310 | 2.33 | ||||||
Swiss Finance Corporation (Mauritius) Limited | 15,197,783 | 3.15 | ||||||
HDFC Trustee Company Limited - HDFC Prudence Fund | 9,846,027 | 2.04 | ||||||
Dragon Peacock Investments Limited | 5,296,068 | 1.10 | ||||||
Merill Lynch Capital Markets Espana S.A.S.V | 9,459,748 | 1.96 | ||||||
ICICI Prudential Focused Bluechip Equity Fund | 7,345,749 | 1.52 | ||||||
SBI Magnum Tax gain Scheme - 1993 | 7,200,000 | 1.49 | ||||||
DSP Blackrock Top 100 Equity Fund | 8,023,784 | 1.66 | ||||||
HSBC Global Investment Funds A/C HSBC Global Investment Funds Mauritius Limited | 30,825,680 | 6.40 | ||||||
Government Pension Fund Global | 8,980,145 | 1.86 | ||||||
HDFC Trustee Company Limited - HDFC Tax Saver fund | 6,685,418 | 1.39 | ||||||
Government Of Singapore | 10,727,978 | 2.23 | ||||||
Robeco Capital Growth Funds | 5,720,000 | 1.19 | ||||||
Mathews Asia Dividend Fund | 25,410,000 | 5.27 | ||||||
Reliance Life Insurance Company Limited | 5,784,420 | 1.20 | ||||||
The Master Trust Bank of Japan, Limited A/c HSBC Indian Equity Mother Fund | 8,192,143 | 1.70 | ||||||
HSBC Global Investment Fund A/c HSBC Global Investment Funds BRIC Equity | 7,530,455 | 1.56 | ||||||
D.E. Shaw Oculus Investments BI-FI Mauritius Limited | 5,128,000 | 1.06 | ||||||
Franklin Templeton Investment Funds | 4,900,000 | 1.02 | ||||||
Franklin Templeton Mutual fund A/c Franklin India Bluechip Fund | 5,700,000 | 1.18 | ||||||
Name of Shareholder | Holding | Percentage | ||||||
Tata Sons Limited and Subsidiaries1 | 827,400,794 | 28.66 | % | |||||
Tata Steel Limited | 160,037,285 | 5.54 | ||||||
Life Insurance Corporation of India | 119,747,762 | 4.15 | ||||||
Citibank N.A.2 | 617,718,025 | 21.40 | ||||||
ICICI Prudential Life Insurance Company Limited | 46,328,051 | 1.60 | ||||||
‘A’ Ordinary Shares3
Name of Shareholder | Holding | Percentage | ||||||
HSBC Global Investment Funds A/C HSBC GIF Mauritius Limited | 26,248,131 | 5.16 | ||||||
Franklin Templeton Investment Funds | 22,793,446 | 4.48 | ||||||
HDFC Trustee Company Limited-HDFC Equity Fund | 22,713,593 | 4.47 | ||||||
Goldman Sachs (Singapore) Pte | 16,849,254 | 3.31 | ||||||
HDFC Trustee Company Limited - HDFC Top 200 Fund | 15,252,858 | 3.00 | ||||||
Swiss Finance Corporation (Mauritius) Limited | 12,517,624 | 2.46 | ||||||
Government of Singapore | 11,822,405 | 2.33 | ||||||
Skagen Global Verdipapirfond | 11,563,913 | 2.27 | ||||||
Government Pension Fund Global | 10,274,048 | 2.02 | ||||||
SBI Magnum Taxgain Scheme | 8,018,348 | 1.58 | ||||||
HSBC Indian Equity Mother Fund | 7,388,060 | 1.45 | ||||||
Matthews Asia Dividend Fund | 7,302,106 | 1.44 | ||||||
Eastspring Investments India Equity Open Limited | 7,056,596 | 1.39 | ||||||
HDFC Trustee Company Limited - HDFC Tax Saverfund | 7,053,422 | 1.39 | ||||||
Nordea Emerging Market Equities Fund | 6,638,016 | 1.31 | ||||||
DB International (Asia) Ltd | 6,635,862 | 1.31 | ||||||
Copthall Mauritius Investment Limited | 6,551,165 | 1.29 | ||||||
HDFC Trustee Company Limited - HDFC Prudence Fund | 5,829,008 | 1.15 | ||||||
D. E. Shaw Oculus Investments Bi-Fi 1 Mauritius Limited | 5,802,752 | 1.14 | ||||||
Merrill Lynch Capital Markets Espana S.A. S.V. | 5,507,103 | 1.08 | ||||||
Franklin Templeton Mutual Fund A/C Franklin India High Growth Companies Fund | 5,400,000 | 1.06 | ||||||
DSP Blackrock Top 100 Equity Fund | 5,152,726 | 1.01 | % | |||||
As of June 30, 2015, the combined Ordinary and ‘A’ Ordinary Shareholding of Tata Sons along with its subsidiaries as on June 30, 2015 was 829,947,212, representing 28.22% of the total voting rights in Tata Motors Limited. Tata Sons’ subsidiaries, Tata Investment Corp Ltd., Tata Industries Ltd. and Simto Investment Company Ltd. hold 10,961,448, 72,203,630 and 59,583 Ordinary Shares of Tata Motors Limited, respectively, and Ewart Investments Limited holds 3,084,542 Ordinary Shares and 440,645 ‘A’ Ordinary Shares of Tata Motors Limited. |
| 2 | Citibank, N.A., as depositary for our |
The ‘A’ Ordinary Shareholders are entitled to receive a dividend for any financial year at five percentage points more than the aggregate rate of dividend declared on Ordinary Shares for that financial year but are entitled to one vote for every ten ‘A’ Ordinary Shares held as per the terms of its issue and |
From March 31, 2010Over the last three years, that is from June 30, 2012 to June 30, 2013,2015, the holdings of our largest shareholder, Tata Sons Limited (togetheralong with its subsidiaries),subsidiaries, have decreased from 27.85%28.96% to 26.16%28.66%. The holdings of Tata Steel Ltd. (together with its subsidiaries) have decreased from 6.93%5.60% as of March 31, 2010at June 30, 2012 to 5.54% as ofat June 30, 2013. The shareholding of Citibank N.A. as depositary for our ADRs and GDRs has increased from 11.89 % to 19.24 %.2015. The shareholding of Life Insurance Corporation of India Ltd. has decreased from 10.83%6.22% to 5.27%4.15%. The shareholding of Citibank N.A. as depositary for our ADSs has increased from 16.48% to 21.40%.
We delisted our global depositary shares from the Luxemburg Stock Exchange on December 25, 2014. The remaining 8,872 global depositary shares were delisted and 44,360 underlying shares were delivered to the respective global depositary share holders. According to our register of shareholders and register of beneficial shareholders,depositary, as ofat June 30, 2013, there were 742015, we had 63 registered holders of our sharesADSs with addresses in the United States, whose shareholdingsshareholding represented approximately 0.03%0.02% of our outstanding Ordinary Shares onas of that date, excluding any of our sharesADSs held by United States residents in the form of depositary shares.Cede & Co. as a nominee for The Depository Trust Company. Because some of these shares wereour ADSs are held bythrough brokers or other nominees, the number of record holders of our ADSs with addresses in the United States may be fewer than the number of beneficial owners of ADSs in the United States.
The total permitted holding of Foreign Institutional Investors, or FIIs, in our paid up sharethe Ordinary Share paid-up capital has been increased to 35% by a resolution passed by our shareholders on January 22, 2004.2004 and to 75% of the ‘A’ Ordinary Share paid-up Capital approved by the Reserve Bank of India pursuant to their letter dated October 31, 2013. The FII holding of FIIs in us as ofon June 30, 20132015 was approximately 30.68%.20.74% in Ordinary Shares and 56.09% in ‘A’ Ordinary Shares. See Item 10.D “—Exchange Controls” for further details.
None ofNeither our shares of common stockOrdinary Shares nor ‘A’ Ordinary Shares entitles the holder to any preferential voting rights.
Under the new Takeover Regulations of India, in the event of any acquisition of shares or voting rights, which, taken together with shares or voting rights held by the acquirer and by personpersons acting in concert with such acquirer, aggregate to 5% or more of the shares or voting rights, or any acquisition or disposal of 2% or more shares or voting rights, or a change in the shareholding or voting rights (even if such change results in the shareholding falling below 5%) such person must file a report with us concerning the shareholding or the voting rights with us and the stock exchanges on which our Shares are traded. Please see Item 9.A “—Offer and Listing Details — Details—Markets” for information with respect to these stock exchanges. Disclosures
In addition, disclosures would be applicable under the Insider Trading Regulations of India with respect to (i) any person who holds more than 5% sharesevery promoter, employee or voting rights and any changedirector that executes a trade in his holdings by 2% or more (ii) any person, who is a director or officer of the company on becoming a director or an officer of the company and any person who is a promoter or partexcess of a promoter group on becomingmonetary threshold of Rs.1 million over a promoter or belonging tocalendar quarter, within two days of reaching such threshold. Such a promoter group, shall disclose any change in the holdings exceeding Rs.5 lacs in value or 25,000 shares or 1% of the total shareholdings or voting rights whichever is lower. The above disclosure under Insider Trading Regulations would be made to us and we would in turn disclosemake a disclosure to the relevant stock exchanges. Furthermore, under our listing agreementagreements with the stock exchanges where our Shares are listed,BSE and NSE we are required to periodically disclose to such stock exchanges the name and percentage of shares held by persons or entities that hold more than 1% of our Shares. For the purposes of the above, reporting and takeover requirements under our listing agreements, sharesShares withdrawn from our ADS/GDSADS facility will be included as part of a person’s shareholding in us.shareholding.
To our knowledge, we are not, directly or indirectly, owned or controlled by any other corporation or by any government or by any other natural or legal persons severally or jointly. We are not aware of any arrangements the operation of which may at a later time result in our change of control.
For details regarding voting rights, please refer to Item 10.B “—Memorandum and Articles of Association — Association—Voting Rights”.
B. Related Party Transactions.Transactions
Our related parties principally consist of Tata Sons, subsidiaries and joint ventures of Tata Sons, our joint ventures and our associates and their subsidiaries. We routinely enter into transactions with these related parties in the ordinary course of business. We enter into transactions for sale and purchase of products with our associates and joint ventures.
The following table summarizes related party transactions and balances included in our consolidated financial statements included elsewhere in this annual report on Form 20-F for the year ended /and as ofat March 31, 2013:2015:
| With associates and their subsidiaries | With joint ventures | With Tata Sons Ltd and its subsidiaries and joint ventures | Notes | With associates and their subsidiaries | With joint Operations | With joint ventures | With Tata Sons and its subsidiaries and joint ventures | Notes | ||||||||||||||||||||||||||||
| (Rs. in millions) | (Rs. in millions) | |||||||||||||||||||||||||||||||||||
Purchase of products | 49,206 | 29,264 | 1,354 | (Note a | ) | 15,311 | 26,645 | — | 649 | (Note a | ) | |||||||||||||||||||||||||
Sale of products | 2,079 | 6,232 | 8,304 | 1,906 | 6,217 | 14,710 | 9,110 | |||||||||||||||||||||||||||||
Services received | 2 | 5 | 5,178 | (Note b | ) | 24 | 4 | 961 | 18,036 | (Note b | ) | |||||||||||||||||||||||||
Services rendered | 154 | 258 | 576 | 101 | 26 | 2,223 | 1,099 | |||||||||||||||||||||||||||||
Interest Income | 42 | 1,895 | 9 | (Note c | ) | |||||||||||||||||||||||||||||||
Bill discounted | — | — | — | 20,041 | (Note c | ) | ||||||||||||||||||||||||||||||
Purchase of property, plant and equipment | 155 | — | — | 32 | ||||||||||||||||||||||||||||||||
Interest income | — | 130 | — | 47 | (Note d | ) | ||||||||||||||||||||||||||||||
Interest expenses | 17 | 1,519 | 213 | 47 | 32 | — | 350 | |||||||||||||||||||||||||||||
Dividend Income | 589 | — | 115 | |||||||||||||||||||||||||||||||||
Dividend income | 153 | — | — | 102 | ||||||||||||||||||||||||||||||||
Dividend paid | — | — | 2,898 | — | — | — | 1,760 | |||||||||||||||||||||||||||||
Amount receivable in respect of Loans and interest thereon | 38 | 3,251 | 53 | (Note c | ) | |||||||||||||||||||||||||||||||
Amount payable in respect of Loans and interest thereon | 295 | — | 1,431 | (Note d | ) | |||||||||||||||||||||||||||||||
Amount receivable in respect of loans and interest thereon | 1,857 | 1,840 | — | 1,006 | (Note d | ) | ||||||||||||||||||||||||||||||
Amount payable in respect of loans and interest thereon | 35 | — | — | 78 | ||||||||||||||||||||||||||||||||
Loans given | — | 710 | 100 | 1,600 | — | — | 950 | (Note e | ) | |||||||||||||||||||||||||||
Loans repaid by related parties | 238 | — | 310 | |||||||||||||||||||||||||||||||||
Loans taken | 710 | — | 3,291 | 640 | — | — | — | |||||||||||||||||||||||||||||
Loans repaid by us | 505 | — | 5,277 | (Note d | ) | 300 | — | — | — | |||||||||||||||||||||||||||
Notes:
The details of major items are as follows:
| a. | During Fiscal |
| b. | i) | The services received from Tata Sons | ||
| ii) | We | |||
| iii) | ||||
| c. | During Fiscal 2015, we have paid discounting charges for invoice discounting facility availed by vendors, with one of the subsidiary of Tata Sons. These services are in the normal course of business and the transaction price (discounting charges) represents fair market price, considering commercial and market terms. |
| As at March 31, |
| ii) | During Fiscal 2015, we have given inter-corporate deposits amounting to Rs.950 million to certain subsidiaries of Tata Sons, |
Please refer tosee Note 3839 to our consolidated financial statements included elsewhere in this annual report on Form 20-F for further detail.details on our related-party transactions.
C. Interests of Experts and Counsel.Counsel
Not applicable.
| Item 8. | Financial |
A. Consolidated Statements and Other Financial Information.Information
Consolidated Financial Statements
The information required by this item is set forth beginning on page F-1 of this annual report.report on Form 20-F.
Legal or Arbitration Proceedings.Proceedings
The information on legal or arbitration proceedings required by this item is set forth in Item 4.B “—Business Overview — Overview—Legal Proceedings”.
Dividend Policy.Policy
Any dividend declared by Tata Motors Limited is based on the profits available for distribution as reported in the unconsolidated statutory financial statements of Tata Motors Limited prepared in accordance with Indian GAAP. Further,Furthermore, Indian law mandates that dividenddividends be declared out of distributable profits only after the transfer of a specified percentage of net income computed in accordance with current regulations to a general reserve. Based on the net income available for appropriation, dividends are recommended by the Boardour board of Directorsdirectors for approval by the shareholders at our Annual General Meeting. Further, the Boardannual general meeting. Furthermore, our board of Directorsdirectors may also pay an interim dividend at its discretion. SinceUnder Indian law, no dividend was permitted to be paid for Fiscal year 1956, we have had an uninterrupted dividend distribution except for the Fiscal years 2001 and 2002. We returned to dividend distribution2015. Considering Tata Motors Limited’s financial performance in Fiscal 2003. In view of our profitable performance,2014 and 2013, we declared dividends (excluding dividend tax) totaling Rs.12,807 million, 12,742Rs.6,485 million and 8,590Rs.12,807 million for Fiscal 2014 and 2013 2012to our shareholders. Since Fiscal 1956, we have made dividend distributions in each Fiscal year except for Fiscal 2001, 2002 and 2011 to the shareholders.2015.
B. Significant Changes.Changes
Other than as set forth in this annual report on Form 20-F, no significant change has occurred with respect to us since the date of our audited consolidated IFRS financial statements included elsewhere in this annual report.report on Form 20-F.
| Item 9. | The Offer and |
A. Offer and Listing Details.Details
There has been no SEC-registered offering of our Shares in the United States.
The details on our shareShare and ADS price history are included in Item 9.C “—Markets”.
B. Plan of Distribution.Distribution
Not applicable.
Ordinary Shares and ADSs
| NSE | BSE | NYSE | National Stock Exchange of India Limited or NSE | BSE Limited or BSE | NYSE | |||||||||||||||||||||||||||||||||||||||||||||||||||||||||||||||||||
| Closing Price per Ordinary Share | Closing Price per Ordinary Share | Closing Price per ADS | Closing Price per Ordinary Share | Closing Price per Ordinary Share | Closing Price per ADS | |||||||||||||||||||||||||||||||||||||||||||||||||||||||||||||||||||
| Period High | Period Low | Period High | Period Low | Period High | Period Low | Period High | Period Low | Period High | Period Low | Period High | Period Low | |||||||||||||||||||||||||||||||||||||||||||||||||||||||||||||
| (Rs. Per Share) | Avg. Daily Trading Volume (in ‘000) | (Rs. Per Share) | Avg. Daily Trading Volume (in ‘000) | (US$ Per ADS) | Avg. Daily Trading Volume (in ‘000) | (Rs. per Share) | Average Daily Trading Volume (in ‘000) | (Rs. per Share) | Average Daily Trading Volume (in ‘000) | (US$ per ADS) | Average Daily Trading Volume (in ‘000) | |||||||||||||||||||||||||||||||||||||||||||||||||||||||||||||
Fiscal | ||||||||||||||||||||||||||||||||||||||||||||||||||||||||||||||||||||||||
2015 | 598.13 | 398.87 | 5,274.10 | 605.10 | 403.00 | 416.51 | 50.89 | 35.61 | 1,277.24 | |||||||||||||||||||||||||||||||||||||||||||||||||||||||||||||||
2014 | 416.95 | 255.20 | 7,227.83 | 417.05 | 255.30 | 820.41 | 35.41 | 22.25 | 495.69 | |||||||||||||||||||||||||||||||||||||||||||||||||||||||||||||||
2013 | 333.70 | 205.10 | 10,275.70 | 333.40 | 204.85 | 1,321.40 | 30.74 | 18.94 | 562.27 | 333.70 | 205.10 | 10,275.70 | 333.40 | 204.85 | 1,321.40 | 30.74 | 18.94 | 562.27 | ||||||||||||||||||||||||||||||||||||||||||||||||||||||
2012 | 1,298.70 | 139.60 | 9,367.10 | 1,295.05 | 139.65 | 1,459.06 | 28.87 | 14.89 | 833.79 | 1,298.70 | 139.60 | 9,367.10 | 1,295.05 | 139.65 | 1,459.06 | 28.87 | 14.89 | 833.79 | ||||||||||||||||||||||||||||||||||||||||||||||||||||||
2011 | 1,365.15 | 673.45 | 3,667.12 | 1,365.60 | 673.70 | 693.39 | 36.00 | 15.65 | 849.69 | 1,365.15 | 673.45 | 3,667.12 | 1,365.60 | 673.70 | 693.39 | 36.00 | 15.65 | 849.69 | ||||||||||||||||||||||||||||||||||||||||||||||||||||||
2010 | 826.45 | 180.00 | 4,987.09 | 827.40 | 179.85 | 1,388.76 | 18.77 | 5.36 | 580.72 | 826.45 | 180.00 | 4,987.09 | 827.40 | 179.85 | 1,388.76 | 18.77 | 5.36 | 580.72 | ||||||||||||||||||||||||||||||||||||||||||||||||||||||
2009 | 691.55 | 126.20 | 1,734.36 | 690.45 | 126.45 | 502.91 | 17.15 | 3.14 | 466.25 | 691.55 | 126.20 | 1,734.36 | 690.45 | 126.45 | 502.91 | 17.15 | 3.14 | 466.25 | ||||||||||||||||||||||||||||||||||||||||||||||||||||||
2008 | 830.55 | 609.40 | 1,311.00 | 830.40 | 606.35 | 305.71 | 20.85 | 14.98 | 518.73 | |||||||||||||||||||||||||||||||||||||||||||||||||||||||||||||||
Fiscal | ||||||||||||||||||||||||||||||||||||||||||||||||||||||||||||||||||||||||
2015 | ||||||||||||||||||||||||||||||||||||||||||||||||||||||||||||||||||||||||
1st Quarter | 448.59 | 398.87 | 5,336.36 | 452.30 | 403.00 | 432.52 | 40.48 | 35.61 | 1,381.22 | |||||||||||||||||||||||||||||||||||||||||||||||||||||||||||||||
2nd Quarter | 534.32 | 428.31 | 6,217.26 | 539.40 | 433.00 | 444.90 | 47.77 | 37.81 | 1,299.81 | |||||||||||||||||||||||||||||||||||||||||||||||||||||||||||||||
3rd Quarter | 539.46 | 470.75 | 4,401.74 | 545.10 | 475.75 | 415.19 | 47.14 | 39.60 | 1,097.07 | |||||||||||||||||||||||||||||||||||||||||||||||||||||||||||||||
4th Quarter | 598.13 | 488.61 | 5,139.29 | 605.10 | 494.00 | 373.40 | 50.89 | 40.35 | 1,335.21 | |||||||||||||||||||||||||||||||||||||||||||||||||||||||||||||||
2014 | ||||||||||||||||||||||||||||||||||||||||||||||||||||||||||||||||||||||||
1st Quarter | 317.05 | 255.20 | 8,109.06 | 316.90 | 255.30 | 869.55 | 28.67 | 22.71 | 558.77 | |||||||||||||||||||||||||||||||||||||||||||||||||||||||||||||||
2nd Quarter | 349.60 | 278.80 | 8,029.33 | 349.20 | 278.70 | 950.28 | 27.67 | 22.25 | 486.56 | |||||||||||||||||||||||||||||||||||||||||||||||||||||||||||||||
3rd Quarter | 399.90 | 335.65 | 7,013.72 | 399.85 | 335.50 | 905.39 | 32.72 | 27.30 | 482.00 | |||||||||||||||||||||||||||||||||||||||||||||||||||||||||||||||
4th Quarter | 416.95 | 336.40 | 5,755.81 | 417.05 | 336.60 | 557.76 | 35.41 | 26.74 | 453.61 | |||||||||||||||||||||||||||||||||||||||||||||||||||||||||||||||
Fiscal | ||||||||||||||||||||||||||||||||||||||||||||||||||||||||||||||||||||||||
2013 | ||||||||||||||||||||||||||||||||||||||||||||||||||||||||||||||||||||||||
1st Quarter | 319.25 | 221.65 | 11,691.75 | 319.35 | 221.55 | 1,733.27 | 30.28 | 20.07 | 735.90 | 319.25 | 221.65 | 11,691.75 | 319.35 | 221.55 | 1,733.27 | 30.28 | 20.07 | 735.90 | ||||||||||||||||||||||||||||||||||||||||||||||||||||||
2nd Quarter | 277.85 | 205.10 | 10,026.14 | 277.65 | 204.85 | 1,378.32 | 25.68 | 18.94 | 493.38 | 277.85 | 205.10 | 10,026.14 | 277.65 | 204.85 | 1,378.32 | 25.68 | 18.94 | 493.38 | ||||||||||||||||||||||||||||||||||||||||||||||||||||||
3rd Quarter | 312.65 | 247.65 | 9,859.39 | 312.40 | 247.70 | 1,125.91 | 28.72 | 23.88 | 402.16 | 312.65 | 247.65 | 9,859.39 | 312.40 | 247.70 | 1,125.91 | 28.72 | 23.88 | 402.16 | ||||||||||||||||||||||||||||||||||||||||||||||||||||||
4th Quarter | 333.70 | 269.15 | 9,499.97 | 333.40 | 269.30 | 1,037.39 | 30.74 | 24.41 | 617.75 | 333.70 | 269.15 | 9,499.97 | 333.40 | 269.30 | 1,037.39 | 30.74 | 24.41 | 617.75 | ||||||||||||||||||||||||||||||||||||||||||||||||||||||
Fiscal | ||||||||||||||||||||||||||||||||||||||||||||||||||||||||||||||||||||||||
2012 | ||||||||||||||||||||||||||||||||||||||||||||||||||||||||||||||||||||||||
1st Quarter | 1,298.70 | 931.00 | 2,111.76 | 1,295.05 | 930.25 | 349.93 | 28.58 | 21.10 | 927.20 | 1,298.70 | 931.00 | 2,111.76 | 1,295.05 | 930.25 | 349.93 | 28.58 | 21.10 | 927.20 | ||||||||||||||||||||||||||||||||||||||||||||||||||||||
2nd Quarter | 1,068.10 | 139.60 | 5,594.62 | 1,063.95 | 139.65 | 874.00 | 24.05 | 14.89 | 978.63 | 1,068.10 | 139.60 | 5,594.62 | 1,063.95 | 139.65 | 874.00 | 24.05 | 14.89 | 978.63 | ||||||||||||||||||||||||||||||||||||||||||||||||||||||
3rd Quarter | 206.80 | 147.70 | 15,312.45 | 206.20 | 147.25 | 2,549.26 | 21.34 | 15.00 | 719.66 | 206.80 | 147.70 | 15,312.45 | 206.20 | 147.25 | 2,549.26 | 21.34 | 15.00 | 719.66 | ||||||||||||||||||||||||||||||||||||||||||||||||||||||
4th Quarter | 290.45 | 183.95 | 14,535.50 | 289.40 | 183.80 | 2,087.37 | 28.87 | 18.11 | 705.00 | 290.45 | 183.95 | 14,535.50 | 289.40 | 183.80 | 2,087.37 | 28.87 | 18.11 | 705.00 | ||||||||||||||||||||||||||||||||||||||||||||||||||||||
Fiscal | ||||||||||||||||||||||||||||||||||||||||||||||||||||||||||||||||||||||||
2011 | ||||||||||||||||||||||||||||||||||||||||||||||||||||||||||||||||||||||||
1st Quarter | 872.60 | 673.45 | 4,858.74 | 872.85 | 673.70 | 924.54 | 20.60 | 15.65 | 508.24 | 872.60 | 673.45 | 4,858.74 | 872.85 | 673.70 | 924.54 | 20.60 | 15.65 | 508.24 | ||||||||||||||||||||||||||||||||||||||||||||||||||||||
2nd Quarter | 1,106.45 | 750.95 | 3,569.12 | 1,106.65 | 750.90 | 798.15 | 25.52 | 17.16 | 654.94 | 1,106.45 | 750.95 | 3,569.12 | 1,106.65 | 750.90 | 798.15 | 25.52 | 17.16 | 654.94 | ||||||||||||||||||||||||||||||||||||||||||||||||||||||
3rd Quarter | 1,365.15 | 1,102.95 | 3,263.50 | 1,365.60 | 1,104.90 | 511.13 | 36.00 | 25.59 | 1,062.97 | 1,365.15 | 1,102.95 | 3,263.50 | 1,365.60 | 1,104.90 | 511.13 | 36.00 | 25.59 | 1,062.97 | ||||||||||||||||||||||||||||||||||||||||||||||||||||||
4th Quarter | 1,308.45 | 1,054.40 | 2,982.49 | 1,306.45 | 1,058.25 | 536.80 | 30.06 | 23.93 | 1,177.51 | 1,308.45 | 1,054.40 | 2,982.49 | 1,306.45 | 1,058.25 | 536.80 | 30.06 | 23.93 | 1,177.51 | ||||||||||||||||||||||||||||||||||||||||||||||||||||||
Fiscal | ||||||||||||||||||||||||||||||||||||||||||||||||||||||||||||||||||||||||
2010 | ||||||||||||||||||||||||||||||||||||||||||||||||||||||||||||||||||||||||
1st Quarter | 389.20 | 180.00 | 5,552.20 | 389.05 | 179.85 | 1,412.28 | 10.58 | 5.36 | 673.98 | |||||||||||||||||||||||||||||||||||||||||||||||||||||||||||||||
2nd Quarter | 614.85 | 262.65 | 6,184.43 | 614.50 | 262.05 | 1,600.82 | 13.33 | 7.64 | 485.31 | |||||||||||||||||||||||||||||||||||||||||||||||||||||||||||||||
3rd Quarter | 791.55 | 529.30 | 4,344.56 | 792.60 | 529.4 | 1,004.88 | 17.19 | 11.38 | 593.37 | |||||||||||||||||||||||||||||||||||||||||||||||||||||||||||||||
4th Quarter | 826.45 | 667.40 | 3,798.06 | 827.40 | 668.70 | 1,529.71 | 18.77 | 14.28 | 571.24 | |||||||||||||||||||||||||||||||||||||||||||||||||||||||||||||||
Month | ||||||||||||||||||||||||||||||||||||||||||||||||||||||||||||||||||||||||
March 2013 | 309.40 | 269.15 | 10,126.55 | 309.25 | 269.30 | 969.18 | 28.49 | 24.41 | 585.69 | |||||||||||||||||||||||||||||||||||||||||||||||||||||||||||||||
February 2013 | 306.75 | 281.65 | 8,655.31 | 306.90 | 285.00 | 922.75 | 29.12 | 26.73 | 615.07 | |||||||||||||||||||||||||||||||||||||||||||||||||||||||||||||||
January 2013 | 333.70 | 293.45 | 9,716.85 | 333.40 | 293.55 | 1,193.42 | 30.74 | 26.99 | 650.71 | |||||||||||||||||||||||||||||||||||||||||||||||||||||||||||||||
December 2012 | 312.65 | 271.55 | 9,747.96 | 312.40 | 271.30 | 1,386.00 | 28.72 | 25.02 | 355.23 | |||||||||||||||||||||||||||||||||||||||||||||||||||||||||||||||
November 2012 | 283.95 | 258.75 | 12,527.20 | 284.10 | 258.85 | 1,122.87 | 25.73 | 23.88 | 455.28 | |||||||||||||||||||||||||||||||||||||||||||||||||||||||||||||||
October 2012 | 280.55 | 247.65 | 7,424.74 | 280.35 | 247.70 | 881.09 | 26.81 | 24.13 | 393.74 | |||||||||||||||||||||||||||||||||||||||||||||||||||||||||||||||
September 2012 | 277.85 | 228.70 | 10,366.80 | 277.65 | 228.70 | 1,294.80 | 25.68 | 20.72 | 565.94 | |||||||||||||||||||||||||||||||||||||||||||||||||||||||||||||||
August 2012 | 248.10 | 220.95 | 10,182.98 | 247.90 | 220.90 | 1,398.22 | 22.13 | 19.88 | 472.21 | |||||||||||||||||||||||||||||||||||||||||||||||||||||||||||||||
July 2012 | 246.50 | 205.10 | 9,566.73 | 246.40 | 204.85 | 1,435.24 | 22.42 | 18.94 | 450.93 | |||||||||||||||||||||||||||||||||||||||||||||||||||||||||||||||
June 2012 | 248.20 | 221.65 | 13,774.30 | 248.10 | 221.55 | 2225.67 | 22.25 | 20.07 | 571.70 | |||||||||||||||||||||||||||||||||||||||||||||||||||||||||||||||
May 2012 | 308.40 | 233.00 | 12,891.74 | 308.30 | 233.20 | 1700.60 | 29.88 | 20.79 | 906.59 | |||||||||||||||||||||||||||||||||||||||||||||||||||||||||||||||
April 2012 | 319.25 | 275.60 | 8,185.10 | 319.35 | 275.75 | 1252.18 | 30.28 | 27.00 | 720.56 | |||||||||||||||||||||||||||||||||||||||||||||||||||||||||||||||
March 2012 | 290.45 | 267.00 | 11,261.60 | 289.40 | 266.00 | 1517.36 | 28.87 | 26.22 | 582.59 | |||||||||||||||||||||||||||||||||||||||||||||||||||||||||||||||
February 2012 | 287.85 | 246.45 | 16,624.52 | 286.40 | 246.10 | 2568.69 | 28.14 | 24.98 | 769.89 | |||||||||||||||||||||||||||||||||||||||||||||||||||||||||||||||
January 2012 | 243.75 | 183.95 | 15,910.29 | 243.60 | 183.80 | 2219.83 | 24.08 | 18.11 | 775.77 | |||||||||||||||||||||||||||||||||||||||||||||||||||||||||||||||
December 2011 | 191.90 | 172.40 | 13,366.53 | 191.60 | 172.25 | 2165.71 | 18.59 | 15.94 | 553.18 | |||||||||||||||||||||||||||||||||||||||||||||||||||||||||||||||
November 2011 | 193.45 | 161.55 | 17,111.74 | 193.50 | 161.45 | 2951.16 | 19.52 | 15.41 | 794.74 | |||||||||||||||||||||||||||||||||||||||||||||||||||||||||||||||
October 2011 | 206.80 | 146.70 | 15,569.22 | 206.20 | 147.25 | 2550.13 | 21.34 | 15.00 | 811.05 | |||||||||||||||||||||||||||||||||||||||||||||||||||||||||||||||
September 2011 | 790.65 | 139.60 | 11,580.86 | 788.95 | 139.65 | 1885.45 | 17.10 | 14.89 | 970.23 | |||||||||||||||||||||||||||||||||||||||||||||||||||||||||||||||
August 2011 | 961.50 | 698.50 | 3,283.56 | 960.30 | 699.20 | 495.39 | 21.50 | 15.46 | 1,132.33 | |||||||||||||||||||||||||||||||||||||||||||||||||||||||||||||||
July 2011 | 1,068.10 | 948.10 | 1,919.63 | 1,063.95 | 947.40 | 241.16 | 24.05 | 21.26 | 810.68 | |||||||||||||||||||||||||||||||||||||||||||||||||||||||||||||||
June 2011 | 1,079.90 | 931.00 | 2,466.39 | 1,079.45 | 930.25 | 412.63 | 23.50 | 21.10 | 1,100.19 | |||||||||||||||||||||||||||||||||||||||||||||||||||||||||||||||
May 2011 | 1,225.35 | 1,077.35 | 2,247.23 | 1,228.55 | 1,078.15 | 369.54 | 27.26 | 24.23 | 966.56 | |||||||||||||||||||||||||||||||||||||||||||||||||||||||||||||||
April 2011 | 1,298.70 | 1,201.30 | 1,512.76 | 1,295.05 | 1,203.30 | 249.34 | 28.58 | 26.89 | 695.58 | |||||||||||||||||||||||||||||||||||||||||||||||||||||||||||||||
March 2011 | 1,249.00 | 1,117.45 | 2,212.23 | 1,247.50 | 1,117.95 | 408.68 | 28.16 | 25.02 | 981.71 | |||||||||||||||||||||||||||||||||||||||||||||||||||||||||||||||
February 2011 | 1,248.60 | 1,054.40 | 3,773.63 | 1,250.80 | 1,058.25 | 739.16 | 27.07 | 23.93 | 1,322.09 | |||||||||||||||||||||||||||||||||||||||||||||||||||||||||||||||
January 2011 | 1,308.45 | 1,147.05 | 3,038.65 | 1,306.45 | 1,145.70 | 475.37 | 30.06 | 24.26 | 1,265.33 | |||||||||||||||||||||||||||||||||||||||||||||||||||||||||||||||
March-15 | 578.79 | 518.69 | 4,560.81 | 584.15 | 526.15 | 311.54 | 48.36 | 42.85 | 1,090.53 | |||||||||||||||||||||||||||||||||||||||||||||||||||||||||||||||
February-15 | 596.90 | 536.89 | 4,961.40 | 602.05 | 542.60 | 397.01 | 50.89 | 45.91 | 1,170.41 | |||||||||||||||||||||||||||||||||||||||||||||||||||||||||||||||
January-15 | 598.13 | 488.61 | 5,687.22 | 605.10 | 494.00 | 412.80 | 50.86 | 40.35 | 1,760.90 | |||||||||||||||||||||||||||||||||||||||||||||||||||||||||||||||
December-14 | 530.31 | 470.75 | 4,054.11 | 536.15 | 475.80 | 331.37 | 46.51 | 39.60 | 938.62 | |||||||||||||||||||||||||||||||||||||||||||||||||||||||||||||||
November-14 | 539.46 | 514.43 | 4,440.32 | 545.10 | 518.55 | 601.55 | 47.14 | 44.32 | 1,039.56 | |||||||||||||||||||||||||||||||||||||||||||||||||||||||||||||||
October-14 | 530.16 | 470.75 | 4,788.04 | 535.65 | 475.75 | 331.25 | 46.57 | 41.29 | 1,296.14 | |||||||||||||||||||||||||||||||||||||||||||||||||||||||||||||||
September-14 | 534.32 | 494.45 | 6,391.18 | 539.40 | 499.60 | 415.50 | 47.77 | 42.40 | 1,496.42 | |||||||||||||||||||||||||||||||||||||||||||||||||||||||||||||||
August-14 | 519.48 | 428.31 | 6,588.61 | 524.40 | 433.00 | 553.86 | 47.65 | 37.81 | 1,279.67 | |||||||||||||||||||||||||||||||||||||||||||||||||||||||||||||||
July-14 | 481.54 | 441.22 | 5,722.64 | 485.60 | 445.50 | 380.20 | 42.15 | 38.88 | 1,131.35 | |||||||||||||||||||||||||||||||||||||||||||||||||||||||||||||||
June-14 | 448.59 | 416.29 | 5,416.55 | 452.30 | 420.45 | 435.13 | 39.46 | 37.00 | 1,240.61 | |||||||||||||||||||||||||||||||||||||||||||||||||||||||||||||||
May-14 | 445.08 | 410.05 | 5,833.51 | 449.80 | 414.25 | 437.83 | 40.48 | 36.82 | 1,625.22 | |||||||||||||||||||||||||||||||||||||||||||||||||||||||||||||||
April-14 | 427.51 | 398.87 | 4,662.81 | 431.95 | 403.00 | 423.29 | 37.87 | 35.61 | 1,277.82 | |||||||||||||||||||||||||||||||||||||||||||||||||||||||||||||||
March-14 | 412.90 | 379.70 | 5,019.14 | 412.90 | 380.10 | 415.06 | 35.41 | 32.48 | 366.17 | |||||||||||||||||||||||||||||||||||||||||||||||||||||||||||||||
February-14 | 416.95 | 336.40 | 7,499.63 | 417.05 | 336.60 | 776.00 | 35.05 | 26.74 | 615.29 | |||||||||||||||||||||||||||||||||||||||||||||||||||||||||||||||
January-14 | 386.10 | 348.25 | 4,987.88 | 385.30 | 347.80 | 507.76 | 31.33 | 27.25 | 394.78 | |||||||||||||||||||||||||||||||||||||||||||||||||||||||||||||||
December-13 | 399.90 | 360.45 | 6,340.33 | 399.85 | 360.60 | 732.49 | 32.28 | 29.50 | 417.64 | |||||||||||||||||||||||||||||||||||||||||||||||||||||||||||||||
November-13 | 399.20 | 360.00 | 6,978.14 | 399.25 | 360.05 | 954.56 | 32.72 | 28.46 | 480.40 | |||||||||||||||||||||||||||||||||||||||||||||||||||||||||||||||
October-13 | 390.45 | 335.65 | 7,721.00 | 390.85 | 335.50 | 1,031.46 | 32.32 | 27.30 | 542.16 | |||||||||||||||||||||||||||||||||||||||||||||||||||||||||||||||
September-13 | 349.60 | 297.35 | 7,459.98 | 349.20 | 297.25 | 1,011.19 | 27.67 | 22.31 | 475.01 | |||||||||||||||||||||||||||||||||||||||||||||||||||||||||||||||
August-13 | 319.10 | 278.80 | 10,196.20 | 319.30 | 278.70 | 1,003.89 | 25.58 | 22.25 | 591.23 | |||||||||||||||||||||||||||||||||||||||||||||||||||||||||||||||
July-13 | 299.90 | 284.05 | 6,640.17 | 299.85 | 284.15 | 850.69 | 25.25 | 23.41 | 392.39 | |||||||||||||||||||||||||||||||||||||||||||||||||||||||||||||||
June-13 | 314.05 | 270.30 | 8,749.01 | 313.80 | 269.50 | 1,014.97 | 27.53 | 22.71 | 524.80 | |||||||||||||||||||||||||||||||||||||||||||||||||||||||||||||||
May-13 | 317.05 | 285.60 | 7,235.69 | 316.90 | 285.30 | 788.35 | 28.67 | 25.60 | 498.68 | |||||||||||||||||||||||||||||||||||||||||||||||||||||||||||||||
April-13 | 300.00 | 255.20 | 8,473.50 | 299.45 | 255.30 | 817.51 | 27.54 | 23.62 | 649.73 | |||||||||||||||||||||||||||||||||||||||||||||||||||||||||||||||
March-13 | 309.40 | 269.15 | 10,126.55 | 309.25 | 269.30 | 969.18 | 28.49 | 24.41 | 585.69 | |||||||||||||||||||||||||||||||||||||||||||||||||||||||||||||||
February-13 | 306.75 | 281.65 | 8,655.31 | 306.90 | 285.00 | 922.75 | 29.12 | 26.73 | 615.07 | |||||||||||||||||||||||||||||||||||||||||||||||||||||||||||||||
January-13 | 333.70 | 293.45 | 9,716.85 | 333.40 | 293.55 | 1,193.42 | 30.74 | 26.99 | 650.71 | |||||||||||||||||||||||||||||||||||||||||||||||||||||||||||||||
December-12 | 312.65 | 271.55 | 9,747.96 | 312.40 | 271.30 | 1,386.00 | 28.72 | 25.02 | 355.23 | |||||||||||||||||||||||||||||||||||||||||||||||||||||||||||||||
November-12 | 283.95 | 258.75 | 12,527.20 | 284.10 | 258.85 | 1,122.87 | 25.73 | 23.88 | 455.28 | |||||||||||||||||||||||||||||||||||||||||||||||||||||||||||||||
October-12 | 280.55 | 247.65 | 7,424.74 | 280.35 | 247.70 | 881.09 | 26.81 | 24.13 | 393.74 | |||||||||||||||||||||||||||||||||||||||||||||||||||||||||||||||
September-12 | 277.85 | 228.70 | 10,366.80 | 277.65 | 228.70 | 1,294.80 | 25.68 | 20.72 | 565.94 | |||||||||||||||||||||||||||||||||||||||||||||||||||||||||||||||
August-12 | 248.10 | 220.95 | 10,182.98 | 247.90 | 220.90 | 1,398.22 | 22.13 | 19.88 | 472.21 | |||||||||||||||||||||||||||||||||||||||||||||||||||||||||||||||
July-12 | 246.50 | 205.10 | 9,566.73 | 246.40 | 204.85 | 1,435.24 | 22.42 | 18.94 | 450.93 | |||||||||||||||||||||||||||||||||||||||||||||||||||||||||||||||
June-12 | 248.20 | 221.65 | 13,774.30 | 248.10 | 221.55 | 2,225.67 | 22.25 | 20.07 | 571.70 | |||||||||||||||||||||||||||||||||||||||||||||||||||||||||||||||
May-12 | 308.40 | 233.00 | 12,891.74 | 308.30 | 233.20 | 1,700.60 | 29.88 | 20.79 | 906.59 | |||||||||||||||||||||||||||||||||||||||||||||||||||||||||||||||
April-12 | 319.25 | 275.60 | 8,185.10 | 319.35 | 275.75 | 1,252.18 | 30.28 | 27.00 | 720.56 | |||||||||||||||||||||||||||||||||||||||||||||||||||||||||||||||
March-12 | 290.45 | 267.00 | 11,261.60 | 289.40 | 266.00 | 1,517.36 | 28.87 | 26.22 | 582.59 | |||||||||||||||||||||||||||||||||||||||||||||||||||||||||||||||
February-12 | 287.85 | 246.45 | 16,624.52 | 286.40 | 246.10 | 2,568.69 | 28.14 | 24.98 | 769.89 | |||||||||||||||||||||||||||||||||||||||||||||||||||||||||||||||
January-12 | 243.75 | 183.95 | 15,910.29 | 243.60 | 183.80 | 2,219.83 | 24.08 | 18.11 | 775.77 | |||||||||||||||||||||||||||||||||||||||||||||||||||||||||||||||
Notes:
On August 1, 2013July 29, 2015 the reported closing price of our Shares on the BSE and NSE was Rs.289.15Rs.376.25 per shareShare and Rs.288.95Rs.376.45 per share,Share, respectively. On August 1, 2013July 29, 2015 the ADS closing price on the NYSE was US$24.0429.21 per ADS.
At the Annual General Meeting of the Companyour annual general meeting held on August 12, 2011, our shareholders approved the shareholderssub-division of Ordinary and ‘A’ Ordinary Shares from face value of Rs.10 each to face value of Rs.2 each. The face value of the CompanyShares was sub-divided with effect from September 14, 2011. Following the sub-division, each ADS represents five underlying Ordinary Shares of Rs.2 each. The reported high and low sales prices of our Shares on the NSE, BSE and NYSE have not been adjusted to reflect the sub-division.
‘A’ Ordinary Shares
| NSE | BSE | |||||||||||||||||||||||
| Closing Price per ‘A’ Ordinary Share | Closing Price per ‘A’ Ordinary Share | |||||||||||||||||||||||
| Period High | Period Low | Period High | Period Low | |||||||||||||||||||||
| (Rs. per Share) | Avg. Daily Trading Volume (in ‘000) | (Rs. per Share) | Avg. Daily Trading Volume (in ‘000) | |||||||||||||||||||||
Fiscal | ||||||||||||||||||||||||
2015 | 383.98 | 209.06 | 2,570.50 | 388.25 | 211.20 | 179.78 | ||||||||||||||||||
2014 | 208.10 | 124.50 | 1,943.08 | 207.95 | 124.55 | 145.12 | ||||||||||||||||||
2013 | 187.60 | 117.05 | 2,922.63 | 187.10 | 117.65 | 358.41 | ||||||||||||||||||
2012 | 711.20 | 81.65 | 1,954.66 | 711.50 | 81.60 | 306.83 | ||||||||||||||||||
2011 | 909.65 | 450.05 | 405.58 | 909.45 | 450.00 | 113.53 | ||||||||||||||||||
2010 | 513.55 | 175.35 | 121.36 | 515.00 | 258.00 | 72.21 | ||||||||||||||||||
Fiscal | ||||||||||||||||||||||||
2015 | ||||||||||||||||||||||||
1st Quarter | 313.47 | 209.06 | 3,106.90 | 316.75 | 211.20 | 224.71 | ||||||||||||||||||
2nd Quarter | 383.98 | 280.22 | 3,112.05 | 388.25 | 283.35 | 236.76 | ||||||||||||||||||
3rd Quarter | 351.57 | 301.15 | 2,065.21 | 354.95 | 304.35 | 142.47 | ||||||||||||||||||
4th Quarter | 377.70 | 305.56 | 1,973.80 | 381.50 | 309.10 | 113.29 | ||||||||||||||||||
2014 | ||||||||||||||||||||||||
1st Quarter | 172.90 | 132.35 | 2,045.81 | 173.05 | 132.35 | 256.44 | ||||||||||||||||||
2nd Quarter | 170.40 | 124.50 | 2,587.87 | 170.40 | 124.55 | 139.58 | ||||||||||||||||||
3rd Quarter | 208.10 | 165.25 | 1,841.14 | 207.95 | 165.55 | 103.23 | ||||||||||||||||||
4th Quarter | 204.15 | 170.05 | 1,295.88 | 203.90 | 170.20 | 80.57 | ||||||||||||||||||
Fiscal | ||||||||||||||||||||||||
2013 | ||||||||||||||||||||||||
1st Quarter | 185.85 | 130.60 | 4,286.02 | 185.70 | 130.70 | 572.97 | ||||||||||||||||||
2nd Quarter | 161.10 | 117.05 | 2,782.86 | 161.05 | 117.65 | 333.08 | ||||||||||||||||||
3rd Quarter | 174.20 | 153.70 | 2,427.22 | 174.20 | 153.70 | 331.66 | ||||||||||||||||||
4th Quarter | 187.60 | 152.75 | 2,166.67 | 187.10 | 152.95 | 192.44 | ||||||||||||||||||
Fiscal | ||||||||||||||||||||||||
2012 | ||||||||||||||||||||||||
1st Quarter | 711.20 | 530.10 | 453.73 | 711.50 | 530.75 | 95.12 | ||||||||||||||||||
2nd Quarter | 595.45 | 83.40 | 742.53 | 595.45 | 83.45 | 164.04 | ||||||||||||||||||
3rd Quarter | 111.05 | 81.65 | 1,914.00 | 111.00 | 81.60 | 256.47 | ||||||||||||||||||
4th Quarter | 168.05 | 88.00 | 4,640.00 | 167.95 | 87.90 | 699.71 | ||||||||||||||||||
Fiscal | ||||||||||||||||||||||||
2011 | ||||||||||||||||||||||||
1st Quarter | 600.70 | 450.05 | 359.73 | 600.35 | 450.00 | 192.47 | ||||||||||||||||||
2nd Quarter | 799.15 | 489.20 | 306.18 | 793.60 | 488.35 | 79.70 | ||||||||||||||||||
3rd Quarter | 909.65 | 754.00 | 607.69 | 909.45 | 752.50 | 134.58 | ||||||||||||||||||
4th Quarter | 789.00 | 588.30 | 344.49 | 788.30 | 586.50 | 47.06 | ||||||||||||||||||
Month | ||||||||||||||||||||||||
March-15 | 365.73 | 305.56 | 1,974.99 | 370.00 | 309.10 | 104.92 | ||||||||||||||||||
February-15 | 377.70 | 326.14 | 1,863.71 | 381.50 | 329.60 | 105.85 | ||||||||||||||||||
January-15 | 376.56 | 325.35 | 2,093.30 | 380.20 | 329.00 | 128.76 | ||||||||||||||||||
December-14 | 351.57 | 314.76 | 1,779.47 | 354.95 | 318.15 | 147.59 | ||||||||||||||||||
November-14 | 336.18 | 318.02 | 1,853.25 | 339.40 | 321.30 | 106.47 | ||||||||||||||||||
October-14 | 340.54 | 301.15 | 2,626.41 | 343.90 | 304.35 | 172.20 | ||||||||||||||||||
September-14 | 383.98 | 338.36 | 3,331.78 | 388.25 | 342.70 | 245.70 | ||||||||||||||||||
August-14 | 373.35 | 292.15 | 3,425.27 | 377.70 | 295.00 | 281.21 | ||||||||||||||||||
July-14 | 320.15 | 280.22 | 2,621.82 | 323.70 | 283.35 | 189.44 | ||||||||||||||||||
June-14 | 313.47 | 257.51 | 4,911.07 | 316.75 | 259.85 | 431.28 | ||||||||||||||||||
May-14 | 261.81 | 219.95 | 1,924.74 | 264.60 | 222.20 | 89.68 | ||||||||||||||||||
April-14 | 235.29 | 209.06 | 2,381.23 | 239.20 | 211.20 | 141.26 | ||||||||||||||||||
March-14 | 202.40 | 188.20 | 1,464.68 | 202.55 | 188.20 | 84.53 | ||||||||||||||||||
February-14 | 204.15 | 170.05 | 1,414.05 | 203.90 | 170.20 | 84.48 | ||||||||||||||||||
January-14 | 198.20 | 174.90 | 1,044.13 | 198.35 | 174.70 | 73.71 | ||||||||||||||||||
December-13 | 204.10 | 185.90 | 1,460.86 | 204.20 | 185.75 | 54.54 | ||||||||||||||||||
November-13 | 208.10 | 190.45 | 2,138.07 | 207.95 | 190.10 | 144.19 | ||||||||||||||||||
October-13 | 194.35 | 165.25 | 1,938.64 | 194.35 | 165.55 | 112.91 | ||||||||||||||||||
September-13 | 170.40 | 149.00 | 1,944.36 | 170.40 | 149.45 | 161.59 | ||||||||||||||||||
August-13 | 148.90 | 124.50 | 3,687.50 | 148.85 | 124.55 | 167.03 | ||||||||||||||||||
July-13 | 147.00 | 129.15 | 2,191.25 | 146.80 | 129.50 | 96.57 | ||||||||||||||||||
June-13 | 172.00 | 132.35 | 2,898.51 | 171.85 | 132.35 | 240.36 | ||||||||||||||||||
May-13 | 172.90 | 159.70 | 1,536.37 | 172.80 | 159.80 | 134.34 | ||||||||||||||||||
April-13 | 172.85 | 148.50 | 1,778.98 | 173.05 | 148.65 | 412.92 | ||||||||||||||||||
March-13 | 173.40 | 152.75 | 2,191.04 | 173.20 | 152.95 | 208.64 | ||||||||||||||||||
February-13 | 170.75 | 158.90 | 2,071.31 | 170.80 | 159.10 | 147.33 | ||||||||||||||||||
January-13 | 187.60 | 166.45 | 2,229.45 | 187.10 | 166.25 | 218.28 | ||||||||||||||||||
December-12 | 174.20 | 162.45 | 2,542.86 | 174.20 | 162.50 | 193.63 | ||||||||||||||||||
November-12 | 172.10 | 157.10 | 2,563.10 | 172.15 | 157.00 | 496.91 | ||||||||||||||||||
October-12 | 171.55 | 153.70 | 2,187.68 | 171.15 | 153.70 | 305.74 | ||||||||||||||||||
September-12 | 161.10 | 136.20 | 2,664.10 | �� | 161.05 | 136.35 | 353.99 | |||||||||||||||||
August-12 | 145.85 | 123.50 | 2,784.24 | 145.40 | 123.40 | 294.54 | ||||||||||||||||||
July-12 | 136.95 | 117.05 | 2,889.52 | 136.85 | 117.65 | 350.85 | ||||||||||||||||||
June-12 | 142.00 | 130.60 | 3,107.23 | 142.05 | 130.70 | 450.96 | ||||||||||||||||||
May-12 | 171.85 | 135.95 | 4,796.16 | 172.15 | 136.10 | 617.68 | ||||||||||||||||||
April-12 | 185.85 | 153.90 | 4,962.60 | 185.70 | 154.60 | 651.90 | ||||||||||||||||||
March-12 | 168.05 | 143.55 | 6,302.74 | 167.95 | 143.50 | 1,244.85 | ||||||||||||||||||
February-12 | 153.85 | 118.10 | 5,200.23 | 154.05 | 118.20 | 572.87 | ||||||||||||||||||
January-12 | 118.65 | 88.00 | 2,467.97 | 118.75 | 87.90 | 269.89 | ||||||||||||||||||
Notes:
On July 29, 2015, the reported closing price of our ‘A’ Ordinary Shares on the BSE and NSE was Rs. 241.80 per Share and Rs. 241.85 per Share, respectively.
At our annual general meeting held on August 12, 2011, our shareholders approved sub-division of Ordinary and ‘A’ Ordinary Shares from face value of Rs.10/-Rs.10 each to face value of Rs.2/-Rs.2 each. The face value of shares was sub-divided with effect from September 14, 2011 as per the circulars issued by the Stock Exchanges. Post sub-division, both the ADSs and GDSs represent five underlying Ordinary Shares of Rs.2/- each.
| NSE | BSE | |||||||||||||||||||||||
| Closing Price per ’A’ Ordinary Share | Closing Price ’A’ Ordinary Share | |||||||||||||||||||||||
| Period High | Period Low | Period High | Period Low | |||||||||||||||||||||
| (Rs. Per Share) | Avg. Daily Trading Volume (in ‘000) | (Rs. Per Share) | Avg. Daily Trading Volume (in ‘000) | |||||||||||||||||||||
Fiscal | ||||||||||||||||||||||||
2013 | 187.60 | 117.05 | 2,922.63 | 187.10 | 117.65 | 358.41 | ||||||||||||||||||
2012 | 711.20 | 81.65 | 1,954.66 | 711.50 | 81.60 | 306.83 | ||||||||||||||||||
2011 | 909.65 | 450.05 | 405.58 | 909.45 | 450.00 | 113.53 | ||||||||||||||||||
2010 | 513.55 | 175.35 | 121.36 | 515.00 | 258.00 | 72.21 | ||||||||||||||||||
2009 | 278.40 | 113.35 | 0.18 | 293.00 | 136.00 | 0.19 | ||||||||||||||||||
Fiscal | ||||||||||||||||||||||||
2013 | ||||||||||||||||||||||||
1st Quarter | 185.85 | 130.60 | 4,286.02 | 185.70 | 130.70 | 572.97 | ||||||||||||||||||
2nd Quarter | 161.10 | 117.05 | 2,782.86 | 161.05 | 117.65 | 333.08 | ||||||||||||||||||
3rd Quarter | 174.20 | 153.70 | 2,427.22 | 174.20 | 153.70 | 331.66 | ||||||||||||||||||
4th Quarter | 187.60 | 152.75 | 2,166.67 | 187.10 | 152.95 | 192.44 | ||||||||||||||||||
Fiscal | ||||||||||||||||||||||||
2012 | ||||||||||||||||||||||||
1st Quarter | 711.20 | 530.10 | 453.73 | 711.50 | 530.75 | 95.12 | ||||||||||||||||||
2nd Quarter | 595.45 | 83.4 | 742.53 | 595.45 | 83.45 | 164.04 | ||||||||||||||||||
3rd Quarter | 111.05 | 81.65 | 1,914.00 | 111.00 | 81.60 | 256.47 | ||||||||||||||||||
4th Quarter | 168.05 | 88.00 | 4,640.00 | 167.95 | 87.90 | 699.71 | ||||||||||||||||||
Fiscal | ||||||||||||||||||||||||
2011 | ||||||||||||||||||||||||
1st Quarter | 600.70 | 450.05 | 359.73 | 600.35 | 450.00 | 192.47 | ||||||||||||||||||
2nd Quarter | 799.15 | 489.20 | 306.18 | 793.60 | 488.35 | 79.70 | ||||||||||||||||||
3rd Quarter | 909.65 | 754.00 | 607.69 | 909.45 | 752.50 | 134.58 | ||||||||||||||||||
4th Quarter | 789.00 | 588.30 | 344.49 | 788.30 | 586.50 | 47.06 | ||||||||||||||||||
Fiscal | ||||||||||||||||||||||||
2010 | ||||||||||||||||||||||||
1st Quarter | 320.00 | 175.35 | 0.10 | 318.00 | 270.35 | 0.16 | ||||||||||||||||||
2nd Quarter | 437.95 | 235.25 | 62.22 | 437.95 | 258.00 | 63.99 | ||||||||||||||||||
3rd Quarter | 513.55 | 413.75 | 283.89 | 515.00 | 417.35 | 151.77 | ||||||||||||||||||
4th Quarter | 511.35 | 379.35 | 98.41 | 509.95 | 379.00 | 40.53 | ||||||||||||||||||
Month | ||||||||||||||||||||||||
March 2013 | 173.40 | 152.75 | 2,191.04 | 173.20 | 152.95 | 208.64 | ||||||||||||||||||
February 2013 | 170.75 | 158.90 | 2,071.31 | 170.80 | 159.10 | 147.33 | ||||||||||||||||||
January 2013 | 187.60 | 166.45 | 2,229.45 | 187.10 | 166.25 | 218.28 | ||||||||||||||||||
December 2012 | 174.20 | 162.45 | 2,542.86 | 174.20 | 162.50 | 193.63 | ||||||||||||||||||
November 2012 | 172.10 | 157.10 | 2,563.10 | 172.15 | 157.00 | 496.91 | ||||||||||||||||||
October 2012 | 171.55 | 153.70 | 2,187.68 | 171.15 | 153.70 | 305.74 | ||||||||||||||||||
September 2012 | 161.10 | 136.20 | 2,664.10 | 161.05 | 136.35 | 353.99 | ||||||||||||||||||
August 2012 | 145.85 | 123.50 | 2,784.24 | 145.40 | 123.40 | 294.54 | ||||||||||||||||||
July 2012 | 136.95 | 117.05 | 2,889.52 | 136.85 | 117.65 | 350.85 | ||||||||||||||||||
June 2012 | 142.00 | 130.60 | 3,107.23 | 142.05 | 130.70 | 450.96 | ||||||||||||||||||
May 2012 | 171.85 | 135.95 | 4,796.16 | 172.15 | 136.10 | 617.68 | ||||||||||||||||||
April 2012 | 185.85 | 153.90 | 4,962.60 | 185.70 | 154.60 | 651.90 | ||||||||||||||||||
March 2012 | 168.05 | 143.55 | 6,302.74 | 167.95 | 143.50 | 1244.85 | ||||||||||||||||||
February 2012 | 153.85 | 118.10 | 5,200.23 | 154.05 | 118.20 | 572.87 | ||||||||||||||||||
January 2012 | 118.65 | 88.00 | 2,467.97 | 118.75 | 87.90 | 269.89 | ||||||||||||||||||
December 2011 | 101.15 | 85.50 | 1,441.96 | 100.95 | 85.15 | 198.44 | ||||||||||||||||||
November 2011 | 103.40 | 86.90 | 1,989.51 | 103.40 | 86.80 | 262.69 | ||||||||||||||||||
October 2011 | 111.05 | 81.65 | 2,356.23 | 111.00 | 81.60 | 314.05 | ||||||||||||||||||
September 2011 | 462.90 | 83.40 | 1,081.47 | 462.15 | 83.45 | 165.05 | ||||||||||||||||||
August 2011 | 546.95 | 401.65 | 569.53 | 545.75 | 402.65 | 119.38 | ||||||||||||||||||
July 2011 | 595.45 | 539.05 | 576.60 | 595.45 | 541.10 | 207.69 | ||||||||||||||||||
June 2011 | 623.90 | 530.10 | 489.19 | 624.55 | 530.75 | 77.19 | ||||||||||||||||||
May 2011 | 704.70 | 612.10 | 471.44 | 704.50 | 610.95 | 73.86 | ||||||||||||||||||
April 2011 | 711.20 | 673.45 | 388.73 | 711.50 | 673.50 | 143.01 | ||||||||||||||||||
March 2011 | 719.90 | 628.40 | 301.33 | 718.90 | 627.55 | 59.35 | ||||||||||||||||||
February 2011 | 727.65 | 588.30 | 351.14 | 727.75 | 586.50 | 41.31 | ||||||||||||||||||
January 2011 | 789.00 | 683.90 | 385.31 | 788.30 | 682.10 | 39.29 | ||||||||||||||||||
Notes:
On August 1, 2013, the reported closing price of our ‘A’ Ordinary Shares on BSE and NSE was Rs.132.35 per share and Rs.132.60 per share, respectively.
At the Annual General Meeting of the Company held on August 12, 2011, the shareholders of the Company approved sub-division of Ordinary and ‘A’ Ordinary Shares from face value of Rs.10/- each to face value of Rs.2/- each. The face value of Shares was sub-divided with effect from September 14, 2011 as per2011. The reported high and low sales prices of our Shares on the circulars issued byNSE and BSE have not been adjusted to reflect the Stock Exchanges.sub-division.
D. Selling Shareholders.Shareholders
Not applicable.
Not applicable.
F. Expenses of the Issue.Issue
Not applicable.
Item 10. Additional Information
Not applicable.
B. Memorandum and Articles of Association
General
The following description of our share capital is a summary of the material terms of our Memorandum and Articles of Association and Indian corporate law regarding our Shares and the holders thereof. They may not contain all of the information that is important to you. To understand them fully, you should read our Memorandum of Association and Articles of Association, as amended, which are incorporated by reference into this annual report on Form 20-F as Exhibit 1.2. The following description is qualified in its entirety by reference to our Memorandum and Articles of Association and applicable law.
Authorized and Issued Share Capital
Our authorized share capital is Rs.39 billion divided into into:
3.5 billion Ordinary Shares of Rs.2/-par value Rs.2 each, of which 2,887,203,602 are issued, subscribed and fully paid, 638,749 are issued but held in abeyance and 68,750 are issued but partially paid-up as of the date of this annual report on Form 20-F;
1 billion ‘A’ Ordinary Shares of Rs.2/-par value Rs.2 each, (the Ordinary Sharesof which 508,476,704 are issued, subscribed and fully paid and 260,101 are issued but held in abeyance as of the ‘A’ Ordinary Shares are hereinafter together referred to as Ordinary Shares or Shares unless otherwise specifically mentioned to the contrary)date of this annual report on Form 20-F; and
300 million Convertible Cumulative Preference Shares of Rs.100/- each.
Underpar value Rs.100 each; however, the Companies Act, as well asConvertible Cumulative Preference Shares have not been issued.
None of our Articles of Association, if our share capital is divided into different classes of shares, all or any of the rights or privileges attached to each class of shares may be varied, modified or abrogated with the consent in writing of the holders of not less than three-fourths of the issued shares of that class, or with the sanction of a special resolution passed at a separate meeting of the holders of the issued shares of that class. Our Articles of Association further provide that the rights conferred upon the holders of the shares of any class issued with preferential or other rights shall not, unless otherwise expressly prohibited by the terms of the issue of the shares of that class, be deemed to be varied by the creation or issue of further shares ranking pari passu thereto.
In accordance with the Articles and under the Companies Act, we may issue Ordinary Shares with differential rights as to voting and/or dividend up to an amount not exceeding 25% of the total issued Ordinary Share capital of the Company or such other limit as may be prescribed by applicable laws/regulations.
Details of history and changes in our capital structure in the last three years
The following table sets out the details of the equity shares allottedare held by us in the last three years:
Description of Paid up Capital | Ordinary Shares | Description of Paid up Capital | ‘A’ Ordinary Shares | |||||||
Capital as on March 31, 2010 | 506,381,170 | Capital as on March 31, 2010 | 64,176,374 | |||||||
Abeyance cases | 306 | Abeyance cases | 306 | |||||||
Capital as on July 31, 2010 | 506,381,476 | Capital as on July 31, 2010 | 64,176,680 | |||||||
Capital as on August 31, 2010 | 506,381,476 | Capital as on August 31, 2010 | 64,176,680 | |||||||
QIP Issuance | 8,320,300 | QIP Issuance | 32,165,000 | |||||||
Capital as on October 11, 2010 | 514,701,776 | Capital as on October 11, 2010 | 96,341,680 | |||||||
FCCN Conversion | 7,758,937 | |||||||||
Capital as on November 15, 2010 | 522,460,713 | Capital as on November 15, 2010 | 96,341,680 | |||||||
FCCN Conversion | 8,511,861 | |||||||||
Capital as on November 30, 2010 | 530,972,574 | Capital as on November 30, 2010 | 96,341,680 | |||||||
FCCN Conversion | 5,751,162 | |||||||||
Capital as on December 20, 2010 | 536,723,736 | Capital as on December 20, 2010 | 96,341,680 | |||||||
Abeyance cases | 82 | Abeyance cases | 26 | |||||||
Capital as on December 21, 2010 | 536,723,818 | Capital as on December 21, 2010 | 96,341,706 | |||||||
FCCN Conversion | 445,411 | |||||||||
Capital as on January 17, 2011 | 537,169,229 | Capital as on January 17, 2011 | 96,341,706 | |||||||
FCCN Conversion | 47,641 | |||||||||
Capital as on February 28, 2011 | 537,216,870 | Capital as on February 28, 2011 | 96,341,706 | |||||||
FCCN Conversion | 1,055,414 | |||||||||
Capital as on March 31, 2011 | 538,272,284 | Capital as on March 31, 2011 | 96,341,706 | |||||||
Abeyance cases | 50,199 | Abeyance cases | 44,765 | |||||||
Capital as on May 23, 2011 | 538,322,483 | Capital as on May 23, 2011 | 96,386,471 | |||||||
Capital as on May 31, 2011 | 538,322,483 | Capital as on May 31, 2011 | 96,386,471 | |||||||
Capital as on June 30, 2011 | 538,322,483 | Capital as on June 30, 2011 | 96,386,471 | |||||||
Sub-division of shares to face value of Rs.2 each with effect from September 14, 2011 | 2,691,612,415 | Sub-division of shares to face value of Rs.2 each with effect from September 14, 2011 | 481,932,355 | |||||||
Capital as on September 30, 2011 | 2,691,612,415 | Capital as on September 30, 2011 | 481,932,355 | |||||||
Abeyance cases | 665 | Abeyance cases | 665 | |||||||
Capital as on October 10, 2011 | 26,91,613,080 | Capital as on October 10, 2011 | 481,933,020 | |||||||
Abeyance cases | 375 | Abeyance cases | 95 | |||||||
Capital as on December 19, 2011 | 2,691,613,455 | Capital as on December 19, 2011 | 481,933,115 | |||||||
Capital as on March 31, 2012 | 2,691,613,455 | Capital as on March 31, 2012 | 481,933,115 | |||||||
Abeyance cases | 25 | Abeyance cases | 26,075 | |||||||
Capital as on April 9, 2012 | 2,691,613,480 | Capital as on April 9, 2012 | 481,959,190 | |||||||
FCCN Conversion | 22,370 | |||||||||
Capital as on April 30, 2012 | 2,691,635,850 | Capital as on April 30, 2012 | 481,959,190 | |||||||
FCCN Conversion | 16,095,391 | |||||||||
Capital as on May 11, 2012 | 2,707,731,241 | Capital as on May 11, 2012 | 481,959,190 | |||||||
Capital as on June 30, 2012 | 2,707,731,241 | Capital as on June 30, 2012 | 481,959,190 | |||||||
Capital as on September 30, 2012 | 2,707,731,241 | Capital as on September 30, 2012 | 481,959,190 | |||||||
4% FCCN allotment dated November 20, 2012 | 115,585 | |||||||||
Abeyance allotment on January 7, 2013 | 1,100 | Abeyance allotment on January 7, 2013 | 430 | |||||||
Capital as on January 7, 2013 | 2,707,847,926 | Capital as on January 7, 2013 | 481,959,620 | |||||||
4% FCCN allotment dated February 11, 2013 | 308,225 | |||||||||
Capital as on March 31, 2013 | 2,708,156,151 | Capital as on March 31, 2013 | 481,959,620 | |||||||
4% FCCN allotment dated May 14, 2013 | 11,789,695 | |||||||||
Capital as on May 14, 2013 | 2,719,945,846 | Capital as on May 14, 2013 | 481,959,620 | |||||||
4% FCCN allotment dated June 4, 2013 | 16,759,871 | |||||||||
Capital as on June 30, 2013 | 2,736,705,717 | Capital as on June 30, 2013 | 481,959,620 | |||||||
B. Memorandum and Articles of Association.or on our behalf.
Objects and Purposes
Our principal objects, as provided by Clause 3 of our Memorandum of Association, include:
manufacturing,Manufacturing, marketing, import, export, hiring and letting on hire of commercial vehicles, automobile cars, two wheeler vehicles, heavy and construction equipment including components, accessories and spare parts in relation thereto;
toTo carry on the business as manufacturers and dealers of machinery articles and goods of all classes;
toTo carry on the business of manufacturing materials which may be usefully combined with our manufacturing and engineering business; and
toTo carry on the business of financing and re-financing of all types of vehicles, construction equipment, capital equipment and services by way of credit, hire purchases, leases and loans.
Directors
Under our Articles of Association, the number of our directors may not be less than three or more than 15. Our board of directors comprises ten members as of the date of this annual report on Form 20-F. Appointments of new directors are made through a majority vote of the full board of directors and approved by a simple majority of our shareholders in attendance at each year’s annual general meeting, provided that a quorum is met.
Under the Companies Act, as well as our Articles of Association, each of our directors, who is in any way directly or indirectly concerned or interested in a contract or arrangement or proposed contract or arrangement entered into or to be entered into by or on our behalf is required to disclose the nature of his concern or interest at a meeting of the board of directors in which the contract or arrangement is discussed and shall not vote or participate at such meeting or the first meeting of the Boardboard of directors held after the director becomes concerned. Under the Companies Act, as well as the Articles of Association, an interested Director is not allowed to take part in the discussion of,concerned or vote on, any contract, arrangement or proposal in which the director is interested.
Under the Companies Act and our Articles of Association, we are restricted from, making loans to directors and the prior approval of the Central Government is required before we can make any loans, directly or indirectly, advancing any loan, including any loan represented by a book debt, to any of our directors or to any other person in whom the director is interested or give any guarantee or provide directly or indirectly, any guarantees or security in connection with any loan madetaken by a third party to a director.the director or such other person.
Under our Articles of Association, a director is not required to hold any qualification shares. Our Articles of Association do not prescribe an age limit for the retirement of the directors. As perUnder the Revised Guidelines (2012)governance guidelines adopted by our Board, Executive Directorsboard of directors,executive directors retire at the age of 65, independent directors retire at the age of 75 and other non-Executive Directorsnon-executive directors retire at the age of 70 (subject to them meeting70. Under the transition clause). Further, as per the broadgovernance guidelines, the maximum tenure in case of non-Executive Directorsan independent director is ninefive years and the Board may,or until retirement age, whichever is earlier, extendable for up to a total of two terms, basedinter alia, on, among other things, the merit and contribution of each director.
At the annual general meeting in each year, one-third of the directors, being those who have held their position the longest since their appointment, retire by rotation. Under the Companies Act, an independent director grant further tenure/s.
Underholds office for a term of up to five consecutive years on the board of a company and would not be liable to retire by rotation. An independent director would be eligible to be re-appointed for an additional five-year term upon passing of a special resolution by our Articlescompany. Re-appointment of Association,an independent director is effective upon fulfilling the number of our directors cannot be less than three orconditions to appoint a director as described above. No independent director may hold office for more than fifteen.two consecutive terms of five years each. An independent director may become eligible for re-appointment after the expiration of three years of ceasing to become an independent director, provided that he/she is not directly or indirectly associated with us during such three-year period.
In addition, under the Companies Act, every listed company in India is required to appoint at least one female director on the board of directors of the company by April 1, 2015. We are in compliance with this requirement as of the date of this annual report on Form 20-F.
Dividends
Subject to certain conditions laid down under the Companies Act, no dividend can be declared or paid by a company for any fiscal year except out of the profits of the company for that fiscal year and/or any previous fiscal year(s) that remain undistributed or out of money provided by the Government of India or state government in India for payment of dividends by the company through a guarantee given by that government.
Under the Companies Act, unless the Boardboard of directors of a company recommends the payment of a dividend, the shareholders at a general meeting have no power to declare any dividend. Subject to certain conditions laid down by Section 205 of the Companies Act, no dividend can be declared or paid by a company for any Fiscal year except out of the profits of the company calculated in accordance with the provisions of the Companies Act or out of the profits of the company for any previous Fiscal year(s) calculated pursuant to the provisions of the Companies Act.
Under our Articles of Association, the shareholders at a general meeting may declare a lower, but not higher, dividend than that recommended by the Board.board of directors. Dividends are generally declared as a percentage of the par value. The dividend recommended by the Board and approved by the shareholders at a general meeting is distributed and paid to shareholders in proportion to the paid-up valueboard of their shares as on the record date for which such dividend is payable. In addition, the Boarddirectors may declare and pay interim dividends. The shares to be issued upon the conversion of the ADSs will be fully paid-up when delivered as provided herein.
Under the Companies Act, dividends can only be paid in cash to shareholders listed on the register of shareholders on the date which is specified as the “record date” or “book closure date”. No shareholder is entitled to a dividend while any lien in respect of unpaid calls on any of their shares is outstanding.
Shares issued upon conversion of ADSs will rankpari passu with our existing Ordinary Shares of Rs.2/- each in all respects including entitlement of the dividend declared.
Dividends must be paid within 30 days from the date of the declaration and any dividend which remains unpaid or unclaimed after that period must be transferred within seven days to a special unpaid dividend account held at a scheduled bank. Any money which remains unpaid or unclaimed for seven years from the date of such transfer must be transferred by us to the Investor Education and Protection Fund established by the Government of India pursuant to which no claim shall lie against us or the said fund.
Under the Companies Act, wein the event of inadequacy or absence of profits during a fiscal year, the board of directors may only pay adeclare an interim dividend in excess of 10% of paid-up capital in respect of any year out ofnot exceeding the profits of that year after we have transferred to our reserves a percentage of our non consolidated Indian GAAP profits for that year ranging between 2.5% to 10% depending on the rate of dividend proposed to be declared in that year. The Companies Act further provides that if the profit for a year is insufficient, the dividend for that year may be declared out of the non consolidated Indian GAAP accumulated profits earned in previous years and transferred to reserves, subject to the following conditions: (i) the rate of dividend to be declared may not exceed the lesser of the average of the rates at which dividends werewas declared by it in the five years immediately preceding three years, calculated on a standalone basis. Dividends payable out of the year, orundistributed, accumulated profits of a company from any prior fiscal year(s) should not exceed 10% of paid-up capital; (ii) the total amount to be drawn from the accumulated profits from previous years may not exceed an amount equivalent to 10% of paid-up capital and free reserves andas stated in the amount so drawn is first to be used to setlatest audited financial statement, after setting off the losses incurred in the financialfiscal year before any dividends in respect of preference or equity shares; and (iii)which the dividend is declared, on a standalone basis. The balance of reserves after withdrawalssuch withdrawal must not be below 15% of the paid-up capital.share capital as stated in the latest audited financial statements on a standalone basis. Furthermore, no company may declare a dividend unless carried over previous losses and depreciation not provided for in previous years are set off against profits of the company of the current year on a standalone basis.
The holders of ‘A’ Ordinary Shares willare entitled to receive dividends for any financialfiscal year at a rate that is five percentage points more than the aggregate rate of dividend declared on Ordinary Shares for that financialfiscal year.
Capitalization of Reserves and Issue of Bonus Shares
Our Articles of Association permit us to act by a resolution of our shareholders inat a general meeting to resolve thatcapitalize amounts standing to the credit of reserves or securities premium can be capitalized by the issue ofissuing fully paid bonus shares (also referred to as a stockshare dividend) or by crediting unpaid amounts on shares that have not been fully paid-up withpaid-up. However, any amount standing to the wholecredit of a share premium account or partcapital redemption reserve account may only be applied in crediting payment of any sum outstanding.capital on shares of our company to be issued to shareholders as fully paid bonus shares. Bonus shares must be issuedpro rata to the amount of capital paid-up on existing shareholdings. Any issue of bonus shares would be subject to the guidelines issued by the SEBI in this regard.
Calls on Shares, Pre-Emptive Rights and Alteration of Share Capital
Under the Companies Act, as well as our Articles of Association, the Board of Directors may from time to time make such calls as they think fit upon the members of the Company in respect of all moneys unpaid on the shares held by them respectively and each member is required to pay the amount of every call so made on him to the Company.
Subject to the provisions of the Companies Act,Act.
Alteration of Share Capital and Pre-Emptive Rights
Our authorized capital is set forth in Clause V of our Memorandum of Association and may be increased by a special resolution passed by our shareholders.
In accordance with the Articles of Association, we may increase our subscribed share capital by issuing new shares on such terms and with such rights as we, by action of shareholders in a general meeting, determine. These newSuch shares willare generally required to be offered to existing shareholders listed on the members’ register on theapplicable record date in proportion to the amount paid-up on these shares at that date. TheHowever, we may also offer will be made by notice specifying the number ofsuch shares offered and the date (being not less than 15 days from the date of the offer) after which the offer, if not accepted, will be deemed to have been declined. After this date, the Board may dispose of the shares offered in respect of which no acceptance has been received, in such manner as the Board thinks most beneficial to us. The offer is deemed to include a right exercisable by the person concerned to renounce the shares offered to such person in favor of any other person provided that the person in whose favor these shares have been renounced is approved by the Board in their absolute discretion.
Under the Companies Act, new shares may be offered to any persons whether or not those persons include existing shareholders, if authorized pursuant to a special resolution to that effect is passed by the shareholders of the company in a general meeting.resolution. The issuance of shares upon conversion of our outstanding Convertible Notesconvertible notes has been duly approved by a special resolution of our shareholders and our shareholders have waived their pre-emptive rights with respect to these shares.
The Company can also alter its share capital by way of a reduction of capital or by undertaking a buy-back of shares under the prescribed SEBI guidelines.
Our Articles of Association provide that, by a special resolution passed at the general meeting, we may consolidate or subdivide our share capital, convert all or any of our fully paid-up shares into stock and re-convert that stock into fully paid-up shares or cancel shares which have not been taken up by any person. The CompanyWe may also from time to time by special resolution reduce itsour share capital. Our board of directors may also alter our share capital through a buy-back of shares as prescribed under SEBI regulations and guidelines and the Companies Act. Please see “—Acquisition of Our Own Shares” for further details on our ability to buy back shares.
Under the Companies Act, as well as our Articles of Association, if our share capital is divided into different classes of shares, all or any of the rights or privileges attached to each class of shares may be varied, modified, abrogated or dealt with, with the consent in writing of the holders of not less than three-fourths of the issued shares of that class, or with the sanction of a special resolution passed at a separate meeting of the holders of the issued shares of that class. Our Articles of Association further provide that the rights conferred upon the holders of the shares of any class issued with preferred or other rights shall not, unless otherwise expressly prohibited by the terms of the issue of the shares of that class, be deemed to be varied by the creation or issue of further shares rankingpari passu thereto.
The Company had vide resolution passedCompanies Act allows a company to issue shares with differential rights as to dividends, voting or otherwise subject to the authority in its articles of association and other conditions prescribed under the applicable law. In this regard, the applicable laws in India provide that a company may issue shares with differential voting rights, if:
Such issuance is authorized by the Shareholders at the Annual General Meeting held on August 12, 2011 altered the Capital Clause i.e. clause Vits shareholders through a postal ballot;
The company has distributable profits in terms of the MemorandumCompanies Act for a period of Association.three financial years;
The company has not defaulted in filing financial statements and annual returns for the immediately preceding three years;
Clause V
The articles of association of such company allow for the issuance of such shares with differential voting rights; and
Certain other conditions set forth in the Companies (Share Capital and Debentures) Rules, 2014 are fulfilled.
In accordance with our Articles of Association, we may issue Ordinary Shares with differential rights as to voting and/or dividends up to an amount not exceeding 25% of our Articles,total issued Ordinary Share capital or such other limit as amended, reads as follows -
“The Capital ofmay be prescribed by applicable laws, rules or regulations. This is stricter than the Company is Rs.39,00,00,00,000 divided into 3,50,00,00,000 Ordinary Shares of Rs.2/- each, 1,00,00,00,000 ‘A’ Ordinary Shares of Rs.2/- each (The Ordinary Sharesrequirement under the Companies Act and the ‘A’ Ordinary Shares are hereinafter together referredCompanies (Share Capital and Debenture) Rule, 2014, according to as Ordinary Shares orwhich no company may issue shares unless otherwise specifically mentionedwith differential rights exceeding 26% of its totalpost-issue paid up equity share capital including equity shares with differential rights issued at any point of time. An amendment to the contrary)Companies (Share Capital and 30,00,00,000 Convertible Cumulative PreferenceDebenture) Rules, 2014 on June 18, 2014 clarified that the Companies Act, 1956 continues to govern equity shares with differential rights issued thereunder.
Calls on Shares of Rs.100/- each.
WeUnder the several persons whose names and addresses are subscribed are desirous of being formed into a Company, in pursuance of this MemorandumCompanies Act, as well as our Articles of Association, our board of directors may from time to time make such calls as they think fit upon our members in respect of all moneys unpaid on the shares held by them respectively and respectively agreeeach member is required to takepay the numberamount of every call so made on them to our company. Under the Companies Act, a capital call on a particular class of shares in the Capital of the Company set opposite our respective names.”shall be made on a uniform basis on all shares falling under such class.
General Meetings of Shareholders
We must hold our Annual General MeetingMeetings
We are required to hold an annual general meeting each year withinand not more than 15 months should elapse between each annual general meeting. The annual general meeting should be held within a period of six months from the date of closing of the previous Annual General Meeting and in any event not later than six months after the end of each accountingfiscal year, unless extended by a period not exceeding three months by the Registrar of Companies at our request for any special reason.
Extraordinary General Meetings
Our Boardboard of Directorsdirectors may convene an Extraordinary General Meetingextraordinary general meeting of shareholders when necessary or at the request of a shareholder or shareholders holding in the aggregate not less than 10%one-tenth of our paid-up share capital.
Notices
Written notices convening a meeting (including an annual general meeting or an extraordinary general meeting) setting outforth the date, place and agenda of the meeting must be given to members at least 21 days prior to the date of the proposed meeting. A general meeting may be called after giving shorter notice if consent is received from all shareholders in the case of an Annual General Meeting, and from shareholders holdingwriting or in electronic mode by not less than 95% of our paid-up capital in the case of any other generalshareholders entitled to vote at such meeting. Currently, we giveWe provide written notices of general meetings to all membersshareholders and, in addition, giveprovide public notice of general meetings of shareholders in a daily newspaper of general circulation in Mumbai. General meetings are generally held at some place in Mumbai. India as prescribed under the Companies Act.
Quorum
The quorum required for a general meeting of theour company is five shareholders personally present.
A company intending to pass a resolution relating to matters such as, but not limited to, amendment in the objects clause of the memorandum, buy back of shares under the Companies Act givingis five, 15 or 30 shareholders personally present, depending on whether the total number of shareholders on the date of the meeting is less than 1,000, is between 1,000 and 5,000, or exceeds 5,000, respectively.
Scope of General Meetings
Certain matters may not be transacted at a general meeting and instead must be authorized by a resolution passed by means of a postal ballot. These matters include, among others:
Alteration of the objects clause in a memorandum of association;
Alteration of articles of association in order to constitute as a private company;
Change in place of registered office outside the local limits of any city, town or village;
Change in objects for which a company has raised money from public through a prospectus;
Issue of shares with differential rights as to voting, dividends or otherwise;
Variation in the rights attached to a class of shares or debentures or other securities;
Sale of the whole or substantially the whole of an undertaking of a company;
Buy-back of shares of a company; and
Granting loans or extending guaranteeguarantees in excess of limits prescribed under the Companies Act and guidelinesthe rules issued thereunder, is required to obtain the resolution passed by means of a postal ballot instead of transacting the business in the general meeting of the company. thereunder.
A notice to all the shareholders shall be sent along with a draft resolution explaining the reasons thereforefor the action and requesting them to send their assent or dissent in writing on a postal ballot form or through an electronic voting facility within a periodprescribed number of 30 days from the date of posting the letter. Postalnotice. Such notice shall also be placed on the website of a company after such notice is sent to shareholders and shall remain on the website until the last date of receipt of the postal ballot voting also allows shareholders to cast their votes by electronic means.from members.
Voting Rights
Methods of Voting
At a general meeting, uponunless a poll is demanded or voting is carried out electronically (including when mandated by Indian law), resolutions at a general meeting are decided by a show of hands, everywhere each member holding shares and entitled to vote and present in person has one vote. UponBefore or upon the declaration of the result of the voting on any resolution on a show of hands, a poll may be ordered to be taken by the chairman of the meeting or demanded by shareholder(s) holding at least one-tenth of the voting rights in respect of the resolution or aggregate paid-up capital of at least Rs.500,000. Upon a poll, each shareholder entitled to vote and present in person or by proxy isshall have voting rights in the same proportion as the capital paid-up on each share held by such holder bears to theour total paid-up capital. Voting
Under the provisions of the listing agreements with the BSE and NSE, every listed company in India is required to provide its shareholders with the facility to exercise their right to vote by electronic means either at a general meeting of the company or by means of a postal ballot. Furthermore, pursuant to the Companies Act, any company having not less than 1,000 shareholders shall provide its members facility to exercise right at general meetings by electronic means. Accordingly, we provide such electronic voting facility to all of our shareholders.
Where a resolution is put to vote on a poll, such voting entitlement (excluding fractions, if any), will be applicable to holders of ‘A’ Ordinary Shares. As per the terms of issue, holders of the outstanding ‘A’ Ordinary Shares shall be entitled to one vote for every ten ‘A’ Ordinary Shares held. Where a resolution is put to vote in the meeting and is to be decided on a show of hands, unless a poll is ordered by the Chairmanholders of the meeting or demanded by shareholder or shareholders holding at least 10% of the voting rights in respect of the resolution or by those holding paid-up capital of at least Rs.50,000. The Chairman of the meeting has a casting vote.
Holders of ADSs and of GDSs are not‘A’ Ordinary Shares shall be entitled to attend or vote at shareholders meetings. Holdersthe same number of ADSs may exercise voting rights with respect to the Ordinary Shares represented by ADSs only in accordance with the provisions of our ADS deposit agreement (as amended) and Indian law. A holder of ADSs may withdraw from the ADS facility the related underlying shares and votevotes as a direct shareholder, but there may not be sufficient time to do so after the announcement of an upcoming vote. If requested by us, the depositary will notify holders of ADSs of upcoming votes and arrange to deliver our voting materialsavailable to holders of ADSs. The materials will describe the matters to be voted onOrdinary Shares.
Ordinary and explain how holders of ADSs on a record date specified by the depositary may instruct the depositary to vote on the deposited securities underlying the ADSs as directed by the holders of ADSs. For the instructions to be valid, the depositary must receive them in writing on or before a date specified by the depositary. The depositary will try, insofar as practicable, subject to Indian laws and the provisions of our Articles of Association, to vote or have its agents vote the deposited securities as instructed. The depositary will only vote as instructed and is not entitled to exercise any voting discretion. If the depositary timely receives voting instructions from a holder of ADSs and which fails to specify the manner in which the depositary is to vote the shares underlying such holder’s ADSs, such holder will be deemed to have instructed the depositary to vote in favor of the items set forth in such voting instructions. If the depositary does not receive timely instructions from a holder of ADSs, the holder shall be deemed to have instructed the depositary to give a discretionary proxy to a person designated by us, subject to the conditions set forth in the deposit agreement (as amended). If requested by us, the depositary is required to represent all shares underlying the outstanding ADSs, regardless whether timely instructions have been received from the holders of such ADSs, for the sole purpose of establishing a quorum at a meeting of shareholders.Special Resolutions
The Depositary for the holders of the GDRs shall exercise voting rights in respect of the GDSs by issue of an appropriate proxy or power of attorney in terms of the deposit agreement pertaining to the GDRs.
Ordinary resolutions may be passed by simple majority of those shareholders present and voting at the meeting. SpecialCertain matters are required to be authorized by special resolutions, which require that the votes cast in favor of the resolution must be at least three times the votes cast against the resolution. The Companies Act provides that in order to amend the Articles of Association, a special resolution is required to be passed in a general meeting. Dissolutions, mergers or consolidations, transfers of the whole or a significant part of our business to another company or taking over the whole of the business of any other company and, in any case where shareholding of public financial institutions and banks exceeds 25%, appointment of statutory auditors, each require a special resolution. Our Articles of Association do not permit cumulative voting for the election of our directors. Matters requiring action by special resolution include the following:
Alteration of the Memorandum of Association and Articles of Association;
Varying the terms of contract or objects in a prospectus;
Issuance of global depositary receipts or sweat equity shares;
Variation of shareholders’ rights;
Reduction of share capital;
Buy-back of our shares;
Sale, lease or other disposal of the whole or substantially the whole of the undertaking of our company;
Investment in trust securities of the amount of compensation received by us as a result of any merger or amalgamation;
Borrowing money in excess of our paid-up share capital and free reserves;
Winding-up or schemes of amalgamation; and
Removal of statutory auditors.
Voting by Proxy
A person may act as proxy on behalf of members not exceeding 50 and holding in the aggregate not more than 10% of our total share capital carrying voting rights, provided that a member holding more than 10% of our total share capital carrying voting rights may appoint a single person as a proxy and such person shall not act as a proxy for any other person or shareholder. A shareholder may exercise his or her voting rights by proxy to be given in the form required by our Articles of Association.prescribed under the Companies Act. The instrument appointing a proxy is required to be lodged with the companyus at least 48 hours before the time of the meeting. A shareholder may, by a single power of attorney, grant a general power of representation regarding several general meetings of shareholders. Any of our shareholders may appoint a proxy. A corporate shareholder is also entitled to nominate a representative to attend and vote on its behalf at general meetings. A proxy may not vote except on a poll and does not have a right to speak at meetings. A shareholder which is a legal entity may appoint anAn authorized representative who can vote in all respects as if a shareholder both on a show of hands and a poll.
The Companies Act allows for a company to issue shares with differential rights as to dividend, voting or otherwise subject to other conditions prescribed under applicable law. In this regard, the laws require that for a company to issue shares with differential voting rights the company must have had distributable profits in terms of the Companies Act for a period of three financial years, the company has not defaulted in filing annual accounts and annual returns for the immediately preceding three years, the articles of association of such company must allow for the issuance of such shares with differential voting rights and such other conditions set forth in the Companies (Issue of Share Capital with Differential Voting Rights) Rules, 2001 must be fulfilled.
In the case where a resolution is put to vote on a poll, such voting entitlement (excluding fractions, if any), will be applicable to holders of ‘A’ Ordinary Shares. As per the terms of issue, the outstanding ‘A’ Ordinary Shares shall be entitled to one vote for every ten ‘A’ Ordinary Shares held.
In the case where a resolution is putexercise same rights and powers, including right to vote in the meetingby proxy and is to be decidedby postal ballot on behalf of a show of hands, the holders of ‘A’ Ordinary Shares shall be entitled to the same number of votes as available to holders of Ordinary Shares.body corporate which it represents.
Convertible Securities/Warrants
We may issue from time to time debt instrumentsdebentures that are partly andor fully convertible into shares and/or warrants to purchase shares.at the time of redemption, provided that such issuance is approved by a special resolution passed at a general meeting of our company as prescribed under the Companies Act.
Register of Shareholders and Record Dates
We are obliged to maintain a register of shareholders at our registered office in Mumbai or at some other place in the same city.Mumbai. The register and index of our beneficial owners maintained by a depository under the Depositories Act, 1996 is deemed to be a part of the index of members and register of shareholders. We recognize as shareholders only those persons who appear on our register of shareholders and we cannot recognize any person holding any Shareshare or part of it upon any trust, express, implied or constructive, except as permitted by law. In the case of shares held in physical form, we register transfers of shares on the register of shareholders upon lodgment of the share transfer form duly completestamped and completed in all respects accompanied by a share certificate, or if there is no certificate, the letter of allotment in respect of shares transferred together with duly stamped and completed transfer forms. In respect of electronic transfers, the depository transfers shares by entering the name of the purchaser in its books as the beneficial owner of the shares. In turn, we enter the name of the depository in our records as the registered owner of the shares. The beneficial owner is entitled to all the rights and benefits as well as the liabilities with respect to the shares that are held by the depository. This activity is done by our registrar and transfer agent.
For the purpose of determining the shareholders, the register may be closed for periods not exceeding 45 days in any oneeach year orand not exceeding 30 days at any one time.time, subject to prior notice of at least seven days or such lesser period as may be specified by SEBI for listed companies in India. In order to determine the shareholders entitled to dividends, we generally keep the register of shareholders closed for approximately 21 days generally in June or July of each year. Under the listing regulations of the stock exchanges on which our outstanding shares are listed, we may, upon at least 15seven working days’ advance notice to thesesuch stock exchanges, set a record date and/or close the register of shareholders in order to ascertain the identity of shareholders entitled to the dividend. The trading of shares and the delivery of certificates in respect thereof may continue while the register of shareholders is closed.
Annual Report and Financial Results
Our Indian GAAP audited financial statements for the relevant Fiscalfiscal year, the directors’ report and the auditors’ report, (collectivelywhich are collectively referred to hereafter as the AGM Report),Indian Annual Report, must be prepared before the annual general meeting. The Indian Annual General Meeting. TheseReport also includeincludes other financial information, a corporate governance section, and management’sa management discussion and analysis report, and general shareholders’ information and are alsois made available for inspection at our registered office during normal working hours for 21 days prior to our Annual General Meeting.annual general meeting.
Under the Companies Act, we mustare required to file the AGM Reportan annual general meeting report with the Registrar of Companies within seven months from the close of the accounting year or within 30 days from the date of the annual general meeting, whichever is earlier.meeting. As required under the listing agreements with the applicable stock exchanges,BSE and NSE, copies of the annual general meeting report are required to be simultaneously sent to all the stock exchanges on which our Sharesshares are listed. The annual general meeting report details shall include, among other things, the number of shareholders attending the meeting, the business that was transacted, the time and location of the meeting, a confirmation of quorum and a summary of the proceedings of the meeting. We must also publish our financial results in at least one national English language daily newspaper circulating in the whole or substantially the whole of India, and also in aone newspaper published in the language of the region where our registered office is situated.situated, as well as on our website.
We submit information, including our AGMIndian Annual Report and half yearlyhalf-yearly financial statements, in accordance with the requirements of theour listing agreementagreements with the Singapore Stock Exchange.BSE and the NSE.
Transfer of Shares
Shares held through depositories are transferred in book-entry form or in electronic form in accordance with theSEBI regulations, laid down by the SEBI. These regulations provide the regime forwhich govern the functioning of the depositories and the participants, prescribe record keeping requirements and set out the manner in which the records are to be kept and maintained and the safeguards to be followed in this system. Transfers of beneficial ownership of shares held through a depository are exempt from stamp duty. We have entered into an agreement for these depository services with National Securities Depository Limited and the Central Depository Services (India) Limited.
The SEBI requires that all investors hold our Shares in book-entry form for trading and settlement purposes, except for transactions that are not made on a stock exchange and transactions that are not required to be reported to the stock exchange.
The requirement to hold shares in book-entry form will apply to ADS holders when the shares are withdrawn from the depositary facility upon surrender of the ADSs. In order to trade in our Shares in the Indian market, the withdrawing ADS holder will be required to comply with the procedures above.
Our Ordinary Shares are freely transferable, subject only to the provisions of the Companies Act under which, if a transfer of shares contravenessecurities is in contravention of any of the SEBI provisions of the Securities Contracts (Regulation) Act, 1956, the Securities and Exchange Board of India Act, 1992 or the regulations issued under itCompanies Act or any other law for the time being in force, or the Sick Industrial Companies (Special Provisions) Act, 1985, or SICA, or any other similar law, the Indian Company Law Board, or CLB, may, on an application made by the depository, company, depository participant, the holder of the securities or the SEBI, direct any company or a depository incorporated in India, an investor,to set right the SEBIcontravention and rectify its register or other parties, direct a rectification of the register of records.records concerned. If a company without sufficient cause refuses to register a transfer of sharesShares within two monthsone month from the date on which the instrument of transfer is delivered to the company, the transferee may appeal to the Indian Company Law BoardCLB seeking to register the transfer of equity shares.Shares. The Indian Company Law BoardCLB may in its discretion, issue an interimafter hearing the parties, either dismiss the appeal, or by order suspendingdirect that the voting rights attached totransfer or transmission shall be registered by the relevant equity shares before completing its investigationcompany and the company shall comply with such order within a period of ten days of the alleged contravention. Underreceipt of the Companies (Second Amendment) Act, 2002,order; or direct rectification of the operative provisions of which are yetregister and also direct the company to come into force, the Indian Company Law Board is proposed to be replaced with the National Company Law Tribunal. Further, under the Sick Industrial Companies (Special Provisions) Repeal Act, 2003, or the SICA. The SICA is sought to be repealed and the Board of Industrial and Financial Reconstruction, as constituted under the SICA, is to be replaced with the National Company Law Tribunal.pay damages, if any, sustained by any party aggrieved.
Pursuant to the Listing Agreement,listing agreements with the BSE and NSE, in the event we have not effected the transfer of sharesShares within one month15 days or where the Issuer haswe have failed to communicate to the transferee any valid objection to the transfer within the stipulated time period of one month, the Issuer is15 days, we are required to compensate the aggrieved party for the opportunity loss caused during the period of the delay.
The Companies Act provides that the sharessecurities or debenturesother interest of theany member of a public listed company (like the Issuer)(such as our company) shall be freely transferable. Our Articles of Association provide for restrictions on the transfer of shares, including granting power to the Boardboard of Directorsdirectors in certain circumstances to refuse to register or acknowledge transfer of shares or other securities issued by us. However, under the Companies Act the enforceability of these transfer restrictions is unclear.are not enforceable; however, transfer restrictions may be enforceable under contract law as between two or more parties to a contract or an arrangement.
Please see Item 7.A “Major Shareholders and Related Party Transactions—Major Shareholders” for a description of obligations under Indian law to disclose significant shareholdings to us.
Acquisition of Our Own Shares
The Company is prohibited from acquiring its own shares unless the consequent reduction of capital is effected by an approval of at least 75% of its shareholders voting on the matter in accordance with the Companies Act, 1956 and is also sanctioned by a High Court of competent jurisdiction. Moreover, subject to certain conditions, a company is prohibited from giving, whether directly or indirectly and whether by means of a loan, guarantee, the provision of security or otherwise, any financial assistance for the purpose of or in connection with a purchase or subscription made or to be made by any person of or for any shares in the company or its holding company. However, pursuant to amendments toUnder the Companies Act, companies have been empowered tomay purchase itstheir own shares or other specified securities out of their free reserves or thetheir securities premium account or the proceeds of any shares or other specified securities (other than the kind of shares or other specified securities proposed to be bought back) subject to the following conditions:
| The buy-back is 25% or less of the |
| iv. | The ratio of the aggregate of secured and unsecured debts owed by the company after buy-back is not more than twice the paid-up capital and its free reserves; |
| All the |
| vi. | The buy-back of the shares or other specified securities listed on any recognized stock exchange is in accordance with the regulations made by |
The condition mentioned above in (ii)clause ii. above would not be applicable if the buy-back is for less than 10% of the total paid-up equity capital and free reserves of the company and provided that this buy-backit has been authorized by the Boardboard of Directorsdirectors of the company. A company buying back its securities is required to extinguish and physically destroy the securities so bought back within seven days of the last date of completion of the buy-back. Further,Moreover, a company buying back its securities is not permitted to buy-back any securities for a period of one year from the buy-back andor to issue further securities of the same kind for six months. The aforesaid restriction relating tomonths except by way of bonus issue or in the one year period does not apply to a buyback authorized by a special resolutiondischarge of the shareholders in general meeting.subsisting obligations such as conversion of warrants, share option schemes, sweat equity or conversion of preference shares or debentures into equity. Every buy- backbuy-back has to be completed within a period of one year from the date of passing of the special resolution or resolution of the Board,board of directors, as the case may be.
A company is also prohibited from purchasing its own shares or specified securities through any subsidiary company including its own subsidiary companies or through any investment company, (other than a purchase of shares in accordance with a scheme for the purchase of shares by trustees of or for shares to be held by or for the benefit of employees of the company) or if the company is defaultinghas defaulted on the repayment of deposit or interest, redemption of debentures or preference shares, or payment of dividend to a shareholder, or repayment of any term loan or interest payable thereon to any financial institution or bank, or in the event of non- compliancenon-compliance with other provisions of the Companies Act. However, if the default in relation to any such repayment has been remedied and a period of three years has lapsed after the default has been remedied, buy-back is not prohibited.
Rights of Holders of ‘A’ Ordinary Shares
Holders of ‘A’ Ordinary Shares are entitled to enjoy all rights and privileges that are enjoyed by holders of Ordinary Shares pursuant to applicable law and under our Articles of Association, with certain differences with respect to dividend and voting entitlements as further summarized below. Holders of our ‘A’ Ordinary Shares have the following rights:
Right to receive dividends, if declared. ‘A’ Ordinary Shareholders are entitled to receive dividends for any fiscal year at a rate that is five percentage points higher than the aggregate rate of dividends declared on Ordinary Shares for that fiscal year.
Right to attend general meetings and class meetings of all Ordinary Shareholders (including a meeting called in relation to any scheme under Sections 391/394 of the Companies Act) and exercise voting powers, unless prohibited by law.
If any resolution at any such meeting is put to vote by a show of hands, each ‘A’ Ordinary Shareholder is entitled to one vote, which is the same number of votes as available to holders of Ordinary Shares.
If any resolution at any such meeting is put to vote on a poll, or if any resolution is put to vote by postal ballot, each ‘A’ Ordinary Shareholder is entitled to one vote for every ten ‘A’ Ordinary Shares held. Fractional voting rights of ‘A’ Ordinary Shareholders are disregarded. For example, if an ‘A’ Ordinary Shareholder holds 39 ‘A’ Ordinary Shares, such holder will be entitled to three votes. If an ‘A’ Ordinary Shareholder holds less than ten Ordinary Shares, such holder will not be entitled to vote on a poll. The class of Ordinary Shareholders includes Ordinary Shareholders and ‘A’ Ordinary Shareholders.
The right to vote may be exercised by the ‘A’ Ordinary Shareholders in person or by proxy.
Right to receive offers for shares through a rights issue and be allotted bonus shares. Holders of ‘A’ Ordinary Shares are only entitled to further ‘A’ Ordinary Shares and such rights or bonus issue shall be made to holders of ‘A’ Ordinary Shares in amounts required to maintain the proportion of ‘A’ Ordinary Shares to Ordinary Shares prior to the issue.
In any scheme for amalgamation of Tata Motors Limited with or into any other entity which results in a share swap or exchange, holders of ‘A’ Ordinary Shares shall receive allotment as per the terms of such scheme and as far as possible receive shares with differential rights to voting or dividend of such other entity.
Where an offer is made to purchase the outstanding shares, voting rights, equity capital, share capital or voting capital of our company in accordance with SEBI (Substantial Acquisition of Shares and Takeovers) (Amendment) Regulation, 2013, or the Takeover Code, and other applicable laws, holders of ‘A’ Ordinary Shares shall have the right to receive an offer to purchase ‘A’ Ordinary Shares in the same proportion as offered to the holders of Ordinary Shares.
For example, where an offer is made under the Takeover Code to purchase 20% of our outstanding shares or voting rights or equity capital or share capital or voting capital, such offer shall also include an offer for 20% of the outstanding Ordinary Shares and 20% of the outstanding ‘A’ Ordinary Shares.
Furthermore, the pricing guidelines as specified under the Takeover Code or any other applicable laws in respect of offer for Ordinary Shares shall apply to an offer for ‘A’ Ordinary Shares and the percentage premium offered for the ‘A’ Ordinary Shares to its floor price shall be equal to the percentage premium offered for the Ordinary Shares to its floor price. The floor price for the Ordinary Shares and the floor price for the ‘A’ Ordinary Shares shall be determined in accordance with the Takeover Code.
All consideration to be received by the holders of ‘A’ Ordinary Shares in accordance with any such offer shall be paid in the same form and at the same time as that to be received by holders of Ordinary Shares.
For the purposes of the Takeover Code, the terms “shares”, “voting rights”, “equity capital”, “share capital” or “voting capital” means and includes Ordinary Shares and ‘A’ Ordinary Shares.
Where our company’s promoters or any other acquirer of our company proposes at any time to voluntarily delist the Ordinary Shares in accordance with the SEBI (Delisting of Securities) Guidelines, 2003 from the stock exchanges on which the Ordinary Shares are listed, such promoter or acquirer shall also make a delisting offer for the ‘A’ Ordinary Shares and the percentage premium offered for the ‘A’ Ordinary Shares to its floor price shall be equal to the percentage premium offered for Ordinary Shares to its floor price.
Where we make an offer to purchase our securities in accordance with the SEBI (Buy-Back) of Securities Regulations, 1998 and other applicable laws, holders of ‘A’ Ordinary Shares shall have the right to receive an offer in the same proportion and on equitable pricing terms as offered to the holders of Ordinary Shares.
Right to receive surplus on liquidation as available to holders of Ordinary Shares and in accordance with the proportion of Ordinary Shares to ‘A’ Ordinary Shares;
Right to free transferability of ‘A’ Ordinary Shares; and
Such other rights as may be available to an ordinary shareholder of a listed public company under the Companies Act and articles of association.
The ‘A’ Ordinary Shares are not convertible into Ordinary Shares at any time. The ‘A’ Ordinary Shares will not at any time exceed 25% of our total issued share capital.
Liquidation Rights
Subject to our statutory duties, the rights of creditors, workmen and of the holders of any other shares entitled by their terms of issue to preferential repayment over theour shares, in the event of our winding up,winding-up, the holders of our Sharesshares are entitled to be repaid the amounts of capital paid-up or credited as paid-up on thesesuch shares, or in case of shortfall, proportionately. All surplus assets after paymentspayment of our statutory duties, amounts due to workmen, the holders of any preference shares and other creditors belong to the holders of the equity shares in proportion to the amount paid uppaid-up or credited as paid-up on these shares respectively at the commencement of the winding-up.
Except as given below, neither Tata Motors Limited nor any of its consolidated subsidiaries or associated companies iswe are not a party to any material contract other than contracts entered into in the ordinary course of business:business as of the date of this annual report on Form 20-F:
The Tata Brand Equity and Business Promotion Agreement, dated December 18, 1998, incorporated by reference into this annual report on Form 20-F as Exhibit 4.1. Tata Motors Limited and certain of our subsidiaries have agreed to pay an annual subscription fee to Tata Sons which is equal to 0.15%-0.25% of annual net income (defined as net revenues exclusive of excise duties and other governmental taxes and non-operating income), subject to a ceiling of 5% of annual profit before tax (defined as profit after interest and depreciation but before income tax) based on Tata Motors Limited’s standalone financial statements prepared in accordance with Indian GAAP for participation and gain from promotion and protection of the Tata brand identity. Pursuant to the agreement, we have also undertaken certain obligations for the promotion and protection of the Tata brand licensed to us under the agreement.
The agreement dated August 24, 2012, entered into by us with Mr. Karl Slym for his appointment as Managing Director. The compensation drawn by him pursuant to this agreement is shown in Item 6B “— compensation”.
The agreement dated January 26, 2010, entered into by Jaguar Land Rover with Dr. Ralf Speth in connection with his appointment as CEO and director. The compensation drawn by him pursuant to this agreement is shown in Item 6 B “— compensation”6.B “Directors, Senior Management and Employees—Compensation”.
General
Prior to June 1, 2000, foreign investment in Indian securities, including the acquisition, sale and transfer of securities of Indian companies, was regulated by the Foreign Exchange Regulation Act, 1973 or FERA, and the notifications issued by the RBI thereunder.
With effect from June 1, 2000, foreign investment in Indian securities is regulated by the Foreign Exchange Management Act 1999, or FEMA (asas amended from time to time),time, or FEMA, and the rules, regulations and notifications made under FEMA. A person resident outside India can transfer any security of an Indian company or any other security to an Indian resident only under the terms and conditions specified in FEMA and the rules and regulations made thereunder or as permitted by the RBI.
The RBI issued the Foreign Exchange Management (Transfer or issueIssue of Security by a Person Resident Outside India) Regulations 2000, or the Foreign Exchange Regulations, to regulate the issue of Indian securities, including American depository receiptsADSs, to persons resident outside India and the transfer of Indian securities by or to persons resident outside India. The Foreign Exchange Regulations provide that an Indian entity may issue securities to a person resident outside India or record in its books any transfer of security from or to such person only in the manner set forth in FEMA and the rules and regulations made thereunder or as permitted by the RBI.
Foreign Direct Investment
The Government of India, pursuant to its liberalization policy, set up the Foreign Investment Promotion Board, or the FIPB, to regulate all foreign direct investment into India. Foreign Direct Investment, or FDI, means investment by way of subscription and/or purchase of securities of an Indian company by a non-resident investor. Regulatory approval is required for investment in some sectors, including housing, petroleum (other than refining), defense and strategic industries. Also, the following investments would require the prior regulatory permission:
Foreign investments, including a transfer of shares, in excess of specified sectoral caps;foreign investment limits;
investmentsInvestments by an unincorporated entity;
investmentInvestment in industries for which industrial licensing is compulsory; and
allAll proposals relating to acquisitiontransfer of sharescontrol and/or ownership pursuant to amalgamation, merger or acquisition of an Indian company currently owned or controlled by resident Indian citizens and Indian companies, which are owned or controlled by resident Indian citizens to a foreign investor (including individuals of Indian nationality or origin residing outside India (a “Non-Resident Indian”),non-resident entity, the activities of which company are not under the “automatic” route under existing Indian foreign investment policy.
Prior no-objection certificates of the relevant financial regulator are required for transfers of shares from residents to non-residents in the financial services sector.
Subject to certain exceptions, Foreign Direct InvestmentFDI and investment by individuals of Indian nationality or origin residing outside India, or Non-Residentnon-resident Indians in Indian companies doesdo not require the prior approval of the FIPB or the RBI. The Government of India has indicated that in all cases where Foreign Direct InvestmentFDI is allowed on an automatic basis without FIPB approval, the RBI would continue to be the primary agency for the purposes of monitoring and regulating foreign investment. In cases where FIPB approval is obtained, no approval of the RBI is required, althoughrequired. In both cases, the prescribed applicable norms with respect to determining the price at which the shares may be issued by the Indian company to the non-resident investor would need to be complied with and a declaration in the prescribed form, detailing the foreign investment, must be filed with the RBI once the foreign investment is made in the Indian company. The foregoing description applies only to an issuance of shares by, and not to a transfer of shares of, Indian companies.
The GovernmentPricing
Under the requirements of India has set up the Foreign Investment Implementation Authority,Consolidated FDI Policy of 2014, or the FIIA inFDI Policy, the Ministry of Commerce and Industry. The FIIA has been mandated to (i) translate foreign direct investment approvals into implementation, (ii) provide a proactive one-stop after-care service to foreign investors by helping them obtain necessary approvals, (iii) sort out operational problems and (iv) meet with various government agencies to find solutions to foreign investment problems and maximize opportunities through a co-operative approach.
Pricing
The price of shares of a listed Indian company issued to non-residents under the foreign direct investment scheme on an automatic basis cannot be less than the price worked out in accordance with the guidelines issued by the SEBI for the preferential allotment of shares where the shares of such company are listed.
Every Indian company issuing shares or convertible debentures in accordance with the Foreign Exchange Regulations is required to submit a report to the RBI within 30 days of receipt of the consideration and another report within 30 days from the date of issue of the shares to the non-residentnonresident purchaser.
The above description applies only to a primary issue of shares or convertible debentures by an Indian company.
Portfolio Investment by Foreign InstitutionalPortfolio Investors
In September 1992, the GovernmentThe Securities and Exchange Board of India issued guidelines that enable foreign institutional investors, including institutions such as pension funds, investment trusts, asset management companies, nominee companies and incorporated/institutional portfolio managers referred to as FIIs, to make portfolio investments in all securities of listed and unlisted companies in India. Investments by registered Foreign Institutional Investors(Foreign Portfolio Investors) Regulations, 2014, or Non-Resident Indians made through a stock exchange are known as Portfolio Investments. Foreign investors wishing to invest and trade in Indian securities in India under these guidelines are required to register with the SEBI and obtain a general permission from the RBI under the Foreign Exchange Management Act, 1999. However, since the SEBI provides a single window clearance, a single application must be made to the SEBI. Foreign investors are not necessarily required to register with the SEBI underFPI Regulations, have replaced the Securities and Exchange Board of India (Foreign Institutional Investors) Regulations 1995 (the “Foreignand the regime for investments by qualified institutional investors.
The FPI Regulations came into effect on June 1, 2014. Under the FPI Regulations, a Foreign Institutional Investor, Regulations”)or FII, who holds a valid certificate of registration from SEBI shall be deemed to be a registered Foreign Portfolio Investor, or FPI, until the expiry of the block of three years for which fees have been paid as Foreign Institutional Investors and mayper the FII Regulations. An FII shall not be eligible to invest in securities of Indian companies pursuant toas an FII after registering as an FPI under the Foreign Direct Investment route discussed above.
Foreign Institutional InvestorsFPIs who are registered with the SEBI are required to comply with the provisions of the Securities and Exchange Board of India (Foreign Institutional Investors) Regulations, 1995, or Foreign Institutional InvestorFPI Regulations. A registered foreign institutional investorFPI may buy, subject to the ownership restrictions discussed below, and sell freely securities issued by any Indian company, realize capital gains on investments made through the initial amount invested in India, subscribe to or renounce rights offerings for shares, appoint a domestic custodian for custody of investments made and repatriate the capital, capital gains, dividends, income received by way of interest and any compensation received towards sale or renunciation of rights offerings of shares. A Foreign Institutional InvestorAn FPI may not hold more than 10% of the total issued capital of a company in its own name; a corporate/individual sub-account of the Foreign Institutional Investor may not hold more than 5% of the total issued capital of a company, and a broad based sub-account may not hold more than 10% of the total issued capital of a company.name. The total holding of all Foreign Institutional InvestorsFPIs in a company is subject to a cap of 24% of the total paid uppaid-up capital of a company, which can be increased to the relevant sectoralindustry sector cap/ceiling applicable to the saidparticular company under the Foreign Direct Investment Regime, with the passing of a special resolution by the shareholders of thea company in a general meeting.meeting and subject to prior intimation to the RBI. Pursuant to resolutions of the board of directors and special resolutions passed by our shareholders, the FII and FPI limits have been increased to 35% of the paid-up capital of Ordinary Shares and 75% of the paid-up capital of ‘A’ Ordinary Shares.
FIIsFPIs are permitted to purchase shares and convertible debentures, subject to the FIIs limits, of an Indian company either through:
aA public offer, where the price of the shares to be issued is not less than the price at which the shares are issued to Indian residents, or
aA private placement, where the price of the shares to be issued is not less than the price according to the terms of the relevant guidelines or the guidelines issued by the former Controller of Capital Issues.
The FPI Regulations specify that the shares purchased by a single FPI or an investor group (which means the same set of ultimate beneficial person(s) investing through multiple entities) must be below 10% of the issued capital of a company. All existing investments by FIIs, qualified foreign investors, which are persons who have opened a dematerialized account with a qualified depository participant as a qualified foreign investor and sub-accounts thereof are grandfathered, thus, if an FPI already holds 10% of the issued capital of a company, it is not required to divest its existing holdings to comply with the stipulation to hold “below 10%”.
Under the FPI Regulations, Offshore Derivative Instruments, or ODIs, may be issued to only those entities that are regulated by an appropriate foreign regulatory authority. Furthermore, such ODIs may only be issued after compliance with applicable know-your-client norms. However, entities that are themselves unregulated but managed by a regulated entity will be eligible counterparties for ODIs under the FPI Regulations if such entities (i) have previously entered into an ODI with an FII at any time prior to January 7, 2014, and (ii) are registered as a client of the FII. Hence, all outstanding ODI transactions and counterparties under the FII Regulations will be treated as permitted ODI transactions and counterparties under the FPI Regulations. SEBI issued a circular on November 24, 2014 aligning the applicable eligibility and investment norms between the FPI regime and subscription through the ODI regime. An FPI shall issue ODIs only to those subscribers who: (i) meet the eligibility criteria that are applicable to an FPI under the FPI Regulations and (ii) do not have “opaque structures”, as defined under the FPI Regulations. The investment restrictions applicable to FPIs under the FPI Regulations apply to subscribers of ODIs as well. Existing ODI positions which are not in accordance with the SEBI circular dated November 24, 2014 may continue until the ODI contract expires.
Investors in ADSs do not need to seek the specific approval from the Government of India to purchase, hold or dispose of their ADSs. Notwithstanding the foregoing, if an FII, non-resident Indian or overseas corporate body were to withdraw its equity shares from an ADS program, its investment in the equity shares would be subject to the general restrictions on foreign ownership.
Registered FIIs are generally subject to tax under Section 115AD of the Income Tax Act of 1961. There is uncertainty under Indian law as to the tax regime applicable to FIIs that hold and trade in ADSs and Shares. See Item 10.E “— Taxation — “Additional Information—Taxation—Taxation of Capital Gains and Losses — Losses—Indian Taxation”.
Investment by Qualified Foreign Investors
The RBI has allowed Qualified Foreign Investors, or QFIs to purchase equity shares and certain other securities of Indian companies on a repatriation basis subject to certain conditions. The individual and aggregate investment limits for QFIs are 5% and 10%, respectively of the paid up capital of Indian company. These limits are over and above the FII and NRI investment ceilings prescribed under the PIS route for foreign investment in India. Only QFIs from jurisdictions which are compliant with Financial Action Task Force, or FATF, standards and that are signatories to the International Organization of Securities Commission’s, or IOSCO’s, Multilateral Memorandum of Understanding, or MMOU, are eligible to invest as QFIs.
Portfolio Investment by Non-Resident Indians
A variety of methods for investing in shares of Indian companies are available to Non-Residentnon-resident Indians. These methods allow Non-Residentnon-resident Indians to make Portfolio Investmentsportfolio investments in shares and other securities of Indian companies on a basis not generally available to other foreign investors. In addition to Portfolio Investmentsportfolio investments in Indian companies, non-resident Indians may also make foreign direct investments in Indian companies pursuant to the FDI. See “—Foreign Direct Investment route discussed above.Investment”.
Transfer of sharesShares and convertible debenturesConvertible Debentures of an Indian companyCompany by a person resident outsidePerson Resident Outside India
The Government of India has granted general permission to persons residing outside India to transfer shares and convertible debentures held by them to an Indian resident, subject to compliance with certain terms and conditions and reporting requirements. A resident who wishes to purchase shares from a non-resident must, pursuant to the relevant notice requirements, file a declaration with an authorized dealer in the prescribed Form FC-TRS, together with the relevant documents and file an acknowledgment thereof with the Indian company to effect transfer of the shares to his name.
Moreover, the transfer of shares between an Indian resident and a non-resident (except(other than a non-resident Indian, or NRI) does not require the prior approval of the Government of India or RBI, provided that:that (i) the activities of the investee company are under the automatic route pursuant to the FDI Policy, and the transfer is not subject to regulations under the Indian Takeover Code;Code, (ii) the non-resident shareholding complies with sector limits under the FDI Policy;Policy and (iii) the pricing is in accordance with the guidelines prescribed by the SEBI and RBI.
Indirect Foreign Investment
In April 2010, the Indian Government issued the ConsolidatedThe FDI Policy, or the Policy, setting out guidelines for foreign investment in India. The policy used to be reissued every six months and is now to be reissued annually. The Policyinter aliaamong other things, prescribes the guidelines for (i) the calculation of total indirect foreign investment in Indian companies, (ii) transfer of ownership or control of Indian companies in sectors with caps from resident Indian citizens to non-resident entities and (iii) guidelines on downstream investments by Indian companies. Pursuant to the Consolidated FDI Policy, for the purposes of computation of indirect foreign investment in an Indian company, foreign investments in its parent company, by FIIsFPI (holding as ofat March 31 of the relevant year), NRIs, ADRs, GDRs, FCCBs,ADSs, global depositary shares, foreign currency convertible bonds, FDI, convertible preference shares and convertible currency debentures are required to be taken together. The FDI Policy is reissued annually.
Issue of Securities Through the Depository Receipt Mechanism
Sponsored ADR Schemes
By notification dated November 23, 2002,Issue of securities through the RBI has permitted existing shareholders ofdepository receipt mechanism by Indian companies to sell their shares throughis governed by the issuanceCompanies Act, 2013, the Companies (Issue of ADRs against the block of existing shares of the Indian company, subject to the following conditions:
|
The sponsoring company whose shareholders propose to divest existing shares in the overseas market through issue of ADRs will give an option to all its shareholders indicating the number of shares to be divestedGlobal Depository Receipts) Rules, 2014 and the mechanism howDepository Receipts Scheme, 2014, or the price will be determined under the ADR norms. If the shares offered for divestment are more than the pre-specified number to be divested, shares would be accepted from the existing shareholders in proportion to their existing shareholdings.
The proposal for divestment of the shares would have to be approved by a special resolution of the Indian company.
The proceeds of the ADR issue raised abroad shall be repatriated into India within a period of one month from the closure of the issue. However, the proceeds of the ADR issue can also be retained abroad to meet the future foreign exchange requirements of the company and by a recent notification this facility has been extended indefinitely until further notice.
|
Transfer of ADRs by Non-residentsDR Scheme.
The Ministry of Finance, Government of India has granted general permission fornotified the transfer of ADRs outside India and also permitted non-resident holders of ADRs to surrender ADRs in exchange forDR Scheme on October 21, 2014, which came into force on December 15, 2014. Consequently, the underlying shares. Pursuant to the terms of the relevant deposit agreement (as amended) an investor who surrenders ADRs and withdraws shares is permitted to re-deposit such shares subject to the total issued ADRs and obtains ADRs at a later time.
Fungibility of ADRs/GDRs
In March 2001, the RBI permitted the re-conversion of shares of Indian companies into ADRs/GDRs, subject to the following conditions:
the Indian company has issued ADRs/GDRs;
the shares of the Indian company are purchased by a registered stock broker in India in the name of the Depository, on behalf of the non-resident investor who wishes to convert such shares into ADRs/GDRs;
shares are purchased on a recognized stock exchange;
the shares are purchased with the permission of the custodian of the ADRs/GDRs of the Indian company and are deposited with the custodian;
the issuer company has authorized the custodian to accept shares from non-resident investors for re-issuance of ADRs/GDRs;
the number of shares so purchased do not exceed the ADRs/GDRs converted into underlying shares, and are in compliance with the sectoral caps applicable under the Foreign Direct Investment regime; and
the non-resident investor, broker, custodian and the overseas depository comply with the provisions of the Depository Receipt Mechanism and the guidelines issued thereunder from time to time.
Also the RBI has prescribed that the domestic custodians are the entity required to ensure compliance with the RBI guidelines and to file reports with the RBI from time to time. The domestic custodian is also required to perform the following functions:
provide a certificate to the RBI and the SEBI stating that the sectoral caps for foreign investment in the relevant company have not been breached;
monitor the total number of ADRs/GDRs that have been converted into underlying shares by non-resident investors;
liaise with the issuer company to ensure that the foreign investment restrictions, if any, are not being breached; and
file a monthly report about the ADRs/GDRs transactions under the two-way fungibility arrangement with the RBI and the SEBI.
Two-way Fungibility of Depositary Receipts
We offer foreign investors a limited facility for conversion of Ordinary Shares into American Depositary Receipts within the limits permissible for two-way Fungibility, as announced by the Reserve Bank of India vide its operative guidelines for the limited two way fungibility under the “IssueIssue of Foreign Currency Convertible BondBonds and Ordinary Shares (Through Depository Receipt Mechanism) Scheme, 1993, dated February 13, 2002”.or the 1993 Scheme, has been repealed except to the extent relating to foreign currency convertible bonds. The RBI has issued a circular on December 15, 2014 amending the Foreign Exchange Management (Transfer or Issue of Security by a Person Resident outside India) Regulations, 2000 to bring it in line with the DR Scheme. The RBI also issued a circular on January 22, 2015 highlighting the salient features of the DR Scheme.
Under the DR Scheme, an Indian company, listed or unlisted, private or public, is permitted to issue securities, including equity shares, through the depository receipt mechanism if such company has not been specifically prohibited from accessing capital markets or dealing in securities. Permissible securities that may be issued by an Indian company through the depository receipt mechanism are “securities” as defined under the Securities Contracts (Regulation) Act, 1956, which includes, among other things, shares, bonds, derivatives, units of mutual funds and similar instruments issued by private companies, provided that such securities are in dematerialized form.
An Indian company may issue securities to a foreign depository for the purpose of issuing depository receipts through any mode permissible for the issue of such securities to other investors. The foreign depository may issue depository receipts by way of a public offering or private placement or in any other manner prevalent in the permissible jurisdiction. A “permissible jurisdiction” is defined as a foreign jurisdiction which is a member of the Financial Action Task Force on Money Laundering and whose securities regulator is a member of the International Organization of Securities Commissions.
Under the DR Scheme, securities may be issued through the depository receipt mechanism up to such a limit that the aggregate underlying securities issued to foreign depositories for issuance of depository receipts along with securities already held by persons resident outside India does not exceed the applicable foreign investment limits prescribed by regulations framed under the FEMA. The depository receipts and the underlying securities may be converted into each other subject to the applicable foreign investment limit. For our company, there is no investment limit.
Under the 1993 Scheme, the pricing of deposit receipts for listed companies could not have been less than the average of the weekly high and low closing prices of the related shares quoted on the relevant stock exchange during the two weeks preceding the relevant date. However, the DR Scheme provides that underlying securities shall not be issued to a foreign depository for issuance of depository receipts at a price which is less than the price applicable to a corresponding mode of issuance to domestic investors.
In terms of the DR Scheme, the foreign depository is entitled to exercise voting rights, if any, associated with the underlying securities whether pursuant to voting instructions from the holder of depository receipts or otherwise. Furthermore, a holder of depository receipts issued against underlying equity shares shall have the same obligations as if it is the holder of the equity shares if it has the right to issue voting instructions.
This section describes the material U.S. federal income tax consequences to “U.S. holders” (as defined below) and the Indian stamp duty and income and service tax consequences to “non-residents” (as defined below) of owning sharesShares or ADSs. It applies to you only if you hold your sharesShares or ADSs as capital assets for tax purposes. This section does not apply to you if you are a member of a special class of holders subject to special rules, including:
aA dealer in securities,
aA trader in securities that elects to use a mark-to-market method of accounting for securities holdings,
aA tax-exempt organization,
aA life insurance company,
aA person liable for alternative minimum tax,
aA person that actually or constructively owns 10% or more of our voting stock,
aA person that holds sharesShares or ADSs as part of a straddle or a hedging or conversion transaction,
aA person that purchases or sells sharesShares or ADSs as part of a wash sale for tax purposespurposes; or
aA U.S. holder (as defined below) whose functional currency is not the USU.S. dollar.
With regard to United States tax, the following discussion addresses only the material U.S. federal income tax consequences for persons that are “U.S. holders”. You are a U.S. holder if you are a beneficial owner of sharesShares or ADSs and you are, for U.S. federal income tax purposes:
aAn individual citizen or resident of the United States,
A corporation, or other entity taxable as a domestic corporation, created or organized in or under the laws of the United States, any state therein or the District of Colombia;
anAn estate whose income is subject to U.S. federal income tax regardless of its source, or
aA trust if (i) a United StatesU.S. court can exercise primary supervision over the trust’s administration and one or more United StatesU.S. persons are authorized to control all substantial decisions of the trust.trust, or (ii) it has a valid election in effect under applicable Treasury Regulations to be treated as a U.S. person.
With regard to Indian tax, the following discussion addresses only the tax consequences for persons that are “non-residents” of India, as defined in the Indian Income Tax Act of 1961, as amended by the “IncomeFinance Act, 2015, or the Income Tax Act”,Act, and is based on the provisions of Section 115AC and other applicable provisions of the Income Tax Act and the Depository Receipts Scheme 2014, or the 2014 Scheme, which has replaced the Issue of Foreign Currency Convertible Bonds and Ordinary Shares (Through Depository Receipt Mechanism) Scheme, 1993 promulgated by the Government of India.
For purposes of the Income Tax Act, a non-resident means a person who is not a “resident” of India. An individual is a resident of India (together,during any fiscal year, if such person: (i) is in India in that year for 182 days or more or (ii) was in India for 365 days or more during the “Section 115AC Regime)”.four preceding years and is in India for 60 days or more in that year. A firm or other association of persons is resident in India except where the control and the management of its affairs are situated wholly outside India. A company is said to be resident in India in any fiscal year if it is an Indian company or its “place of effective management”, in that year, is in India. “Place of effective management” means a place where key management and commercial decisions that are necessary for the conduct of the business of an entity as a whole are, in substance made.
With regard to U.S. federal income tax, the following discussion is based upon the Internal Revenue Code of 1986, as amended, its legislative history, administrative pronouncements, judicial decisions and final, temporary and proposed Treasury Regulations, all as of the date hereof, changes to any of which may affect the tax consequences described herein, possibly with retroactive effect.
If an entity classified as a partnership for U.S. federal income tax purposes holds sharesShares or ADSs, the U.S. federal income tax treatment of a partner will generally depend on the status of the partner and the tax treatment of the partnership. If you hold sharesShares or ADSs as a partner in a partnership, you should consult your tax advisor with regard to the U.S. federal income tax treatment of an investment in our Shares or ADSs.
This discussion addresses only U.S. federal income taxation and Indian stamp duty and income and service taxation. In addition, this section is based in part upon the representations of the depositary and the assumption that each obligation in the deposit agreement (as amended) and any related agreement will be performed in accordance with its terms.
The DTC, proposes to replace the existing Income Tax Act, 1961, and other direct tax laws, with a view to simplify and rationalize the tax provisions into one unified code. The Indian Government has placed before the parliament the proposed DTC. The various proposals included in DTC are subject to review by Indian parliament and, as such, the impact, if any, is not quantifiable at this stage.
This summary is not intended to constitute a complete analysis of the individual tax consequences to nonresidentnon-resident holders for the acquisition, ownership and sale of ADSs and equity shares.Shares.
Taxation of Dividends
In the descriptions below relating to Indian taxation, references to “you” are to a person resident outside India, subscribing to ADSs or Shares.
Indian Taxation
Dividends paid to non-residents of Indiayou will not be subject to Indian tax. However, the Company haswe have to pay a “dividend distribution tax”, as applicable, currently at the rate of 15% (plus a surcharge at 10% and an education cess at the rate of 3% on the sum of the dividend distribution tax and surcharge) on the total amount distributed as a dividend. The effective rate of 20.36% (inclusive of applicable surcharge and cess) on the amount of dividend distribution tax is 16.995%.paid out.
Distributions to non-residentsIf you are a non-resident of India, the distributions made to you of additional ADSs or shares or rights to subscribe for such sharesShares made with respect to ADSs or shares areShares should not be subject to Indian tax.
U.S. Federal Income Taxation
Under the U.S. federal income tax laws, and subject to the Passive Foreign Investment Company,passive foreign investment company, or PFIC, rules described below, if you are a U.S. holder, the gross amount of any dividenddistribution we pay out of our current or accumulated earnings and profits (as determined for U.S. federal income tax purposes) with respect to Shares or ADSs will be a dividend that is subject to U.S. federal income taxation. If you are a non-corporate U.S. holder, dividends that constitute qualified dividend income will be taxable to you at the preferential rates applicable to long-term capital gains provided that you hold the sharesShares or ADSs for more than 60 days during the 121-day period beginning 60 days before the ex-dividend date and meet other holding period requirements. Dividends we pay with respect to our Shares or ADSs will generally will be qualified dividend income.
The dividend is taxable to you when you, in the case of shares,Shares, or the Depositary,depositary, in the case of ADSs, receive the dividend, actually or constructively. The dividend will not be eligible for the dividends-received deduction generally allowed to United States corporations in respect of dividends received from other United States corporations. The amount of the dividend distribution that you must include in your income as a U.S. holder will be the USU.S. dollar value of the Indian rupee payments made, determined at the spot Indian rupee/USU.S. dollar rate on the date the dividend distribution is includible in your income, regardless of whether the payment is in fact converted into USU.S. dollars. Generally, any gain or loss resulting from currency exchange fluctuations during the period from the date you include the dividend payment in your income to the date you convert the payment into USU.S. dollars will be treated as ordinary income or loss and will not be eligible for the special tax rate applicable to qualified dividend income. The gain or loss generally will be income or loss from sources within the United States for foreign tax credit limitation purposes. Distributions in excess of current and accumulated earnings and profits, as determined for U.S. federal income tax purposes, will be treated as a non-taxable return of capital to the extent of your basis in the sharesShares or ADSs and thereafter as capital gain. However, we do not expect to calculate earnings and profits in accordance with United StatesU.S. federal income tax principles. Accordingly, you should expect to generally treat distributions we make as dividends for U.S. federal income tax purposes.
Dividends that we pay with respect to Shares and ADSs will generally be income from sources outside the United States and will, depending on your circumstances, be either “passive” or “general” income for purposes of computing the foreign tax credit limitation allowable to you.
Distributions of additional shares to you with respect to shares or ADSs that are made as part of a pro rata distribution to all of our shareholders generally You will not be subjectentitled to claim a U.S. federal income tax.foreign tax credit for any Indian dividend distribution taxes paid by us on a distribution to you.
Taxation of Capital Gains and Losses
Indian Taxation
Capital Gains:Gains Under
If you are a non-resident of India, any gain realized by you on the sale of ADSs to another non-resident will not be subject to Indian capital gains tax under Section 115AC and other applicable provisions of the Income Tax Act, any gain realized on the sale outside India of the ADSs from one non-resident of India to another non-resident of India is not subject to Indian capital gains tax. However, it is unclear whether a capital gain derived from the sale of rights by a non-resident of India to another non-resident of India outside of India may be subject to Indian capital gains tax.Act.
Capital gains arising to the non-resident investorrealized by you on the transfer of equity sharesShares (including sharesShares received in exchange of the ADSs) whether in India or outside India to a non-resident investorof India or Indian resident, will be liable for income tax under the provisions of the Income Tax Act.
Equity sharesShares (including sharesShares issuable on the exchange of the ADSs) held by a non-resident investoryou for a period of more than 12 months arewill be treated as long-term capital assets and the capital gains arising on the sale thereof arewill be treated as long-term capital gains. If the equity sharesShares are held by you for a period of 12 months or less, it aresuch Shares will be treated as short-term capital assets and the capital gains arising on the sale thereof are treated as short-term capital gains. A non-resident holder’s holding period (for purposes of determining the applicable Indian capital gains tax rate) in respect of sharesShares received in an exchange or redemption for ADSs commences on the date ofon which the advice of withdrawal ofrequest for such shares by the relevant depository to its custodian.redemption is made.
For the purpose of computing capital gains tax on the sale of the equity shares,Shares or ADSs, the cost of acquisition of equity sharessuch Shares received in exchange for ADSs will be determined on the basis of the prevailing price of the sharesShares on the Indian Stock ExchangesBSE or NSE, as applicable, as on the date on which the relevant depository gives notice to its custodianrequest for the delivery of such equity shares upon redemption of the ADSs,is made, while the cost of acquisition of shares directly converted from the ADSs will be determined on the basis of the price prevailing on the Indian Stock ExchangesBSE or NSE, as applicable, on the date of conversion into equity shares.
Gain realized by you on the sale of listed equity sharesShares held for more than 12 months will not be subject to Indian capital gains tax if the Securities Transaction Tax, or STT has been paid on the transaction. The STT will be levied on and collected by a domestic stock exchangethe BSE or NSE, as applicable, on which equity shares are sold at the rate of 0.025% to 0. 1%0.1% depending upon the nature of the transaction.
Any gain realized by you on the sale of listed equity sharesShares held for more than 12 months on which no STT has been paid will be subject to Indian capital gains tax at the rate of 10% plus applicable surcharge on income tax and education cess at the applicable rates.
Capital gains realized in respect of equity sharesShares held by you (calculated in the manner set forth in the prior paragraph)above) for 12 months or less (short-term gain) on which STT is paid in the manner and rates set outforth above, is subject to tax at the rate of 15% plus applicable surcharge on income tax and an education cess at the applicable rate. In the event that noyou do not pay STT, is paid, short-term gain iswill be subject to tax at variable rates with the maximum rate of 40% plus applicable rate of surcharge on income tax and education cess at the applicable rate. The actual rate of tax on short-term gains depends on a number of factors, including theyour legal status of the non-resident holder and the type of income chargeable in India.
Tax on capital gains is to be deducted at source by the person paying for the shares in accordance with the relevant provisions of the Income Tax Act.
Capital Losses:Losses The
Section 115AC Regime does not deal withaddress capital losses arising on a transfer of shares.Shares. In general terms, losses arising from a transfer of a capital asset in India canmay only be set off against capital gains and not against any other income. A short-term capital loss canmay be set off against a capital gain, whether short-term or long-term. However, long-term capital loss canmay only be set off against long-term capital gain and not against short-term capital gain. To the extent that the losses are not absorbed in the year of transfer, theyyou may be carriedcarry it forward for a period of eight assessment years immediately succeeding the assessment year for which the loss was first determined and may be set off against the capital gains assessable for such subsequent assessment years. In order to set off capital losses in this manner, the non-resident investoryou would be required to file appropriate and timely tax returns in India. The long-term capital loss arising on a sale of equity shares in respect of which STT is paid may not be available for set-off against any capital gains.
U.S. Federal Income Taxation
Generally, subject to the PFIC rules discussed below, if you are a U.S. holder and you sell or otherwise dispose of your sharesShares or ADSs, you will recognize capital gain or loss for U.S. federal income tax purposes equal to the difference between the USU.S. dollar value of the amount that you realize and your tax basis, determined in USU.S. dollars, in your sharesShares or ADSs. Capital gain ofIf you are a non-corporate U.S. holder, your capital gain is generally taxed at preferential rates where the holder hasyou have a holding period greater than one year. Theyear in the applicable Shares or ADSs at the time of the sale or other disposition. If you are a U.S. holder, certain limitations exist on your ability to deduct capital losses for U.S. federal income tax purposes. Your gain or loss willfrom the disposition or other sale of Shares or ADSs generally be income or loss from sources within the United States for foreign tax credit limitation purposes.
As discussed under “Taxation of Capital Gains and Losses—Indian Taxation”, above, you may be subject to Indian tax upon a sale or other disposition of Shares or ADSs. If you are a U.S. holder, it is possible that you will be entitled to claim a foreign tax credit for U.S. federal income tax purposes with respect to such taxes. U.S. holders should consult their tax advisors regarding the availability of the foreign tax credit in respect of any such taxes imposed.
Passive Foreign Investment Companies: Companies
We believe that the Shares and ADSs should not be treated as stock of a PFIC for U.S. federal income tax purposes, but this conclusion is a factual determination that is made annually and thus may be subject to change.
If we were to be treated as a PFIC, then unless you elect to be taxed annually on a mark-to-market basis with respect to your shares or ADSs, gain realized on the sale or other disposition of your sharesShares or ADSs would in general not be treated as capital gain. Instead, if you are a U.S. holder that has not made a mark-to-market election with respect to your ADSs or Shares, you would be treated as if you had realized such gain and certain “excess distributions” ratably over your holding period for the sharesShares or ADSs and would be taxed at the highest tax rate in effect for each such year to which the gain was allocated, together with an interest charged in respect of the tax attributable to each such year. With certain exceptions, your sharesShares or ADSs will be treated as stock in a PFIC if we were a PFIC at any time during your holding period in your sharesShares or ADSs. Dividends that you receive from us will not be eligible for the special tax rates applicable to qualified dividend income if we are treated as a PFIC with respect to you either in the taxable year of the distribution or the preceding taxable year, but instead will be taxable at rates applicable to ordinary income.
Indian Tax Treaties
The provisions of the tax treaty entered into by India and the country of your residence of the non-resident investor will be applicable to the extent they are more beneficial to you. There is a Double Tax Avoidance Agreement between the non-resident investor.United States and India. The Government of India has introduced a provision related to General Anti Avoidance Rules, or GAAR, under which will be applicable from April 1, 2015. As per the provisions of GAAR, an arrangement entered into by the assesse maycertain arrangements could be declared by the Income Tax Authorities to be an impermissible avoidance arrangement if it satisfies the specified conditions and consequentlyarrangement. The consequences of such arrangements include denial of a tax benefit or benefit under a tax treaty couldtreaty. As per the Income Tax Act, the GAAR provisions are applicable from the Government of India’s fiscal year 2017. The Finance Minister of India in his speech presenting the Finance Bill 2015 has indicated that the investments made through March 31, 2017 will not be denied.subject to GAAR. Also, the Government of India has introduced a provision as perby which the non-residentyou would not be entitled to claim any relief under the tax treaty unless thea tax residency certificate is obtained by himyou from the government of the country of which he is a taxyou are resident. Furthermore, you shall be required to provide such other required information as has been publicly stated by the Government of India.
Dividend income iswill not be subject to tax in India in the hands of the non-resident holder of the shares.your hands. If any sharesShares are held by a non-resident investoryou following withdrawal thereof from the depository facilitydepositary under the deposit agreement, (as amended), the provisions of a tax treaty, if any, entered into by India and the country of which you are residence of such non-resident investor will be applicable to determine the taxation of any capital gain arising from a transfer of such shares.Shares.
However,Under the 1993 Scheme, during the period of fiduciary ownership of sharesShares in the hands of the overseas depository bank,depositary, the provisions of the tax treaty entered into by India and the country of residence of the overseas depository bankdepositary will be applicable to determine the taxation of any capital gains in respect of ADSs.
Indian Stamp Duty
Under Indian law, any transfer of ADSs will be exempt from liability to Indian stamp duty. Purchasers of sharesShares who seek to register such sharesShares on theour share register of the company are required to pay Indian stamp duty at the rate of Rs.0.25 for every Rs.100 or part thereof of the market value of such shares.Shares. In order to register a transfer of sharesShares in physical form with the company, it is necessary to present a stamped deed of transfer. An acquisition of sharesShares in physical form from the Depositorydepositary in exchange for ADSs representing such sharesShares will not render an investor liable to Indian stamp duty but the companywe will be required to pay stamp duty at the applicable rate on the share certificate. However, since our sharesShares are compulsorily deliverable in dematerialized form (except for trades of up to 500 sharesShares which may be delivered in physical form), no stamp duty is payable on the acquisition or transfer of sharesShares in dematerialized form.
Indian Service Tax
Brokerage or commission fees paid to stockbrokers in India in connection with the sale or purchase of sharesShares are now subject to an Indian service tax of 12% (plus a 3% education cess)14%. A stockbroker is responsible for collecting such service tax at such rate and for paying the same to the relevant authorityauthority.
F. Dividends and Paying Agents.Agents
Not applicable.
G. Statement by Experts.Experts
Not applicable.
H. Documents on Display.Display
You may review a copy of this annual report on Form 20-F at the SEC’s public reference room at 100 F Street, N.E., Washington, D.C. 20549. You may call the SEC at 1-800-732-0330 for additional information on how to obtain copies of all or any portion of the documents we file with or furnish to the SEC. The Securities and Exchange CommissionSEC also maintains a web site www.sec.gov that contains reports, proxy statements and other information regarding registrants that file electronically with the Securities and Exchange Commission.SEC.
We are subject to the information requirements of the Securities Exchange Act of 1934 and, in accordance therewith, willare obligated to file annual reports on Form 20-F within the time specified by the SEC and furnish other reports and information on Form 6-K withto the SEC. These reports and other information can be inspected at the public reference room at the SEC. You can also obtain copies of this material from the public reference room or by calling or writing the SEC upon payment of a prescribed fee. As a foreign private issuer, we are exempt from the rules under the Securities Exchange Act of 1934 prescribing the furnishing and content of proxy statements to shareholders.
I. Subsidiary Information.Information
Not applicable.
| Item 11. | Quantitative and Qualitative Disclosures about Market |
Our exposure to financial risks derives primarily from changes in interest rates and foreign exchange rates. To mitigate these risks, we utilize derivative financial instruments, including interest rate option contracts and currency swap agreements, the application of which is primarily for hedging purposes and not for speculative purposes.
Commodity price risk
Commodity price risk is the possibility of impact from changes in the price of commodities, such as non-ferrous metals (like aluminum), ferrous alloys (like steel) and others (like rubber, platinum and rhodium), which we use in production of automotive vehicles and their components.
See Note 3736 of our audited consolidated financial statements included elsewhere in this annual report on Form 20-F for additional disclosures on market risk and financial instruments, including disclosure on the fair value of financial instruments.
| Item 12. | Description of Securities Other than Equity |
Not applicable.
B. WarrantsB.Warrants and Rights.Rights
Not applicable.
C. Other Securities.C.Other Securities
Not applicable.
D. AmericanD.American Depositary Shares.Shares
Fees Payable by ADS Holders
Citibank, N.A., theas depositary ofunder our ADRADS program, collects fees for issuance and cancellation of ADSs directly from investors depositing shares or surrendering ADSs for the purpose of withdrawal or from intermediaries acting for them on such fees as per the Depositarydeposit agreement.
An ADS holder is required to pay the following service fees to the depositary:
Service | Fees | |||
| Issuance of ADSs, | Up to US$0.05 per ADS issued or surrendered or held, as applicable | |||
| Distribution of cash dividends or other cash distributions | Up to US$0.02 per ADS held | |||
| Depositary services | Up to US$0.02 per ADS held on the
| |||
An ADS holder or beneficial owner will also be responsible to pay certain fees and expenses incurred by the depositary bank and certain taxes and governmental charges such as:
|
| |||
Taxes (including applicable interest and penalties) and other governmental charges;
Such registration fees as may from time to time be in effect for the registration of shares or other deposited securities on the share register and applicable to transfers of Ordinary Shares or other deposited securities to or from the name of the custodian, the depositary or any nominees upon the making of deposits and withdrawals, respectively;
Such cable, telex and facsimile transmission and delivery expenses as are expressly provided in the deposit agreement;
The expenses and charges incurred by the depositary in the conversion of foreign currency;
Such fees and expenses as are incurred by the depositary in connection with compliance with exchange control regulations and other regulatory requirements applicable to shares, deposited securities, ADSs and ADRs; and
The fees and expenses incurred by the depositary, the custodian or any nominee in connection with the servicing or delivery of deposited securities.
The fees and charges an ADS holder may be required to pay may vary over time and may be changed by us and by the depositary bank.depositary. ADS holders will receive prior notice of increases in such changes.fees and charges.
Fees and Other Payments Made by the Depositary to U.S.us
ForIn Fiscal 2013,2015, we have received US$2.3 million 3,048,655.64 from the Depositarydepositary for standard out of pocketout-of-pocket maintenance costs of our ADR Program consisting ofADS program, including, but not limited to, continuing annual stock exchange listing fees, special investor promotion activities, and issue relatedissue-related expenses, cost for preparing and audit of IFRS accounts, legal/legal and accounting fees associated with listing on the foreign listing,New York Stock Exchange, miscellaneous expenses such as costs associated with voting of ADRsvotes by ADS holders paymentand payments made to proxy firms, etc.firms.
| Item 13. | Defaults, Dividend Arrearages and |
None.
| Item 14. | Material Modifications to the Rights of Security Holders and Use of |
None.
| Item 15. | Controls and |
Disclosure Controls and Procedures
Tata Motors LimitedWe performed an evaluation of the effectiveness of the design and operation of its disclosure controls and procedures as ofat March 31, 2013.2015. Based on this evaluation, our Managing Director, Karl Slym,management, identified a material weakness in our internal control over financial reporting, and our Chief Financial Officer, C. Ramakrishnan haveconsequently concluded that our disclosure controls and procedures, as defined in Rules 13a-15(e) and 15d-15(e) under the Securities Exchange Act of 1934, as amended, or the Exchange Act, are effective.
Based on this evaluation, our Managing Director and Chief Financial Officer concluded that our disclosure controls and procedures arewere not effective as ofat March 31, 2013, to provide reasonable assurance that the information required to be disclosed in filings and submissions under the Exchange Act is recorded, processed, summarized, and reported within the time periods specified by the SEC’s rules and forms, and that such information is accumulated and communicated to our management, including our Managing Director and Chief Financial Officer, as appropriate to allow timely decisions about required disclosure.2015.
There are inherent limitations to the effectiveness of any system of disclosure controls and procedures, including the possibility of human error and the circumvention or overriding of the controls and procedures. Accordingly, even effective disclosure controls and procedures can only provide reasonable assurance of achieving their control objectives.
Management’s Annual Report on Internal Control Over Financial Reporting
Our managementManagement is responsible for establishing and maintaining adequate internal control over financial reporting as defined in Rules 13a-15(f) and 15d -15(f) under the Securities Exchange Act of 1934.Act. Our internal control over financial reporting is a process designed to provide reasonable assurance regarding the reliability of financial reporting and the preparation of our financial statements for external reporting purposes in accordance with IFRS. Our internal control over financial reporting includes policies and procedures that:
| i. |
| ii. |
| iii. |
OurAs at March 31, 2015, management conducted an assessment of the effectiveness of ourthe internal control over financial reporting based onusing the framework establishedcriteria inInternal Control —– Integrated Framework (1992) issued(2013), established by the Committee of Sponsoring OrganizationsOrganisations of the Treadway Commission. Based on this assessment, management has determinedidentified a deficiency in the internal control over financial reporting, as defined in Rules 13a-15(f) and 15d-15(f) under the Exchange Act that constitutes a material weakness, and therefore concluded that our internal control over financial reporting was not effective as at March 31, 20132015. A material weakness is effective.a deficiency, or a combination of deficiencies, in internal control over financial reporting, such that there is a reasonable possibility that a material misstatement of the annual or interim financial statements will not be prevented or detected on a timely basis.
BecauseThe material weakness identified pertains to a deficiency in the design of internal controls relating to technical accounting of complex derivative instruments designated in hedge relationships. Specifically, the design of the review controls relating to complex derivative instruments designated in hedge relationship during the year ended March 31, 2015 were not sufficiently direct and precise, and, as a result, an inappropriate method for prospective hedge effectiveness testing was used at inception for these complex derivative instruments. Our management determined that these complex derivative instruments did not qualify for hedge accounting in accordance with IAS 39,Financial Instruments, under IFRS. As a result of the deficiency, changes in the fair value of these complex derivative instruments were initially recorded in the hedging reserve as part of other comprehensive income. Following identification of the deficiency, the amount has been appropriately recorded in our consolidated income statement for the year ended March 31, 2015, and not under other comprehensive income.
Due to its inherent limitations, however, internal control over financial reporting may not prevent or detect misstatements. Also, projections of any evaluation of effectiveness to future periods are subject to the risk that controls may become inadequate because of changes in conditions or that the degree of compliance with the policies or procedures may deteriorate.
The effectivenessattestation report of Deloitte Haskins & Sells LLP, an independent registered public accounting firm, on management’s assessment of our internal control over financial reporting is included in our consolidated financial statements, beginning on page F-3 of this annual report on Form 20-F.
Remediation efforts to address material weakness identified as at March 31, 20132015
Following the identification of the deficiency relating to complex derivatives designated in hedge transactions described above in the first quarter of Fiscal 2016, management designed and implemented a preventive control consisting of a review at inception of all complex derivative instruments designated in hedge relationships by technical accounting specialists. This control is subject to formal remediation testing.
Remediation efforts to address material weakness identified as at March 31, 2014
The material weakness disclosed in our annual report on Form 20-F for the Fiscal 2014 pertaining to a deficiency in the design of controls over the change management procedures relating to an information technology system has been auditedremediated in Fiscal 2015.The specific remediation actions taken by Deloitte Haskins & Sells, an independent registered public accounting firm, as statedmanagement included:
| i. | The design and implementation of a new management process for amendments to financially significant applications used in our internal control over financial reporting, supported by the provision of additional training for relevant personnel; |
| ii. | The implementation of additional detective controls to identify invalid data table changes; and |
| iii. | The strengthening of controls related to payment authorization, including a new control mandating senior management approval of all manual and accounts payable payments in excess of specified thresholds prior to payment. |
Changes in their report appearing on the accompanying consolidated financial statements in Item 18, which expresses an unqualified opinion on the effectiveness of our internal control over financial reporting as at March 31, 2013.
Changes in Internal Control over Financial Reportingduring Fiscal 2015
DuringExcept for the period covered by this annual report,remediation efforts described above in respect of the material weakness identified with respect to Fiscal 2014, there were no changeshas not been any other change in our internal control over financial reporting that haveoccurred during Fiscal 2015 that has materially affected, or areis reasonably likely to materially affect, our internal control over financial reporting.
| Item 16A. | Audit Committee Financial |
Our Boardboard of directors has determined that Mr. Nasser Munjee, an independent director and a member of our Audit Committee, is an Audit Committee“audit committee financial expertexpert” as defined under the applicable rules of the SEC issued pursuant to Section 407 of the Sarbanes – OxleySarbanes-Oxley Act of 2002. Mr Munjee is independent under NYSE standards.
| Item 16B. | Code of |
We have adopted the “Tata Code of Conduct”, hereinafter referred as to ‘the Code’,the Code, which is a written code of ethics which is applicable to all our employees. The Code is available at all our offices and on our websitewww.tatamotors.com.
In August 2004, our Audit Committee adopted a Whistle Blower Policy, or the Policy, that providedwhich provides a formal mechanism for all our directors and employees to approach our management (or the Audit Committee in cases where the concern involves the senior management) and make protectiveprotected disclosures to the Managementmanagement about unethical behavior, actual or suspected fraud or violations of the Company’s Code or our ethics policy.policies. The Policy was updated on JanuaryMay 29, 2009.2014, pursuant to the provisions of the Companies Act. The Policy is an extension of the Code, which requires every employee to promptly report to the Managementmanagement any actual or possible violation of the Code or an event such director or employee becomes aware of that could affect our business or reputation. The disclosures reported are addressed in the manner and within the time frames prescribed in the Policy. The Policy is available on our websitewww.tatamotors.com.
The information contained in our website does not constitute a part of this annual report on Form 20-F.
| Item 16C. | Principal Accountant Fees and |
Our financial statements, prepared in accordance with IFRS, are audited by Deloitte Haskins & Sells LLP, or DHS, a firm registered with the Public Company Accounting Oversight Board in the United States and which is also registered with the Institute of Chartered Accountants of India.
DHS has served as our independent public accountant for each of the years ended March 31, 20132015 and March 31, 2012,2014, for which audited financial statements appear in this annual report.report on Form 20-F. The following table presents the aggregate fees for professional services and other services rendered by DHS and the various member firms of Deloitte to us, including some of our subsidiaries in Fiscal 20132015 and 2012.
| Year ended March 31, | ||||||||||||||||||||||||||||
| 2013 | 2013 | 2012 | 2015 | 2015 | 2014 | |||||||||||||||||||||||
| US$ in million | Rs. in million | US$ in million | Rs. in million | |||||||||||||||||||||||||
Audit Fees | 7.3 | 393.8 | 344.9 | Audit and review of financial statements | 8.6 | 537.9 | 496.8 | Audit and review of financial statements | ||||||||||||||||||||
Tax Fees | 0.4 | 20.2 | 13.2 | Tax audit, certification of foreign remittances and tax advisory services | 0.2 | 15.5 | 15.7 | Tax audit, certification of foreign remittances and tax advisory services | ||||||||||||||||||||
All Other Fees | 0.6 | 30.2 | 64.3 | Other certifications and advisory services | 1.7 | 107.3 | 57.1 | Other certifications and advisory services | ||||||||||||||||||||
|
|
|
|
|
| |||||||||||||||||||||||
Total | 8.3 | 444.2 | 422.4 | 10.5 | 660.7 | 569.6 | ||||||||||||||||||||||
|
|
|
|
|
| |||||||||||||||||||||||
Audit Committee pre-approval for services rendered by independent accountants:
We have adopted a policy for pre-approval of services to be rendered by our independent accountants for us and our subsidiaries based on an elaborate procedure for ensuring auditor independence and objectivity.
At the beginning of each year, the Audit Committee approves the proposed services, including the nature, type and scope of services contemplated and/or the related fees to be rendered by these firms during the year.
In addition, Audit Committee pre-approval is also required for those engagements that may arise during the course of the year that are outside the scope of the initial services, and such fees are pre-approved by the auditAudit Committee.
We do not engage our independent accountants for ‘prohibited services’.
Our Audit Committee recommends the appointment and compensation of independent accountants.
In case of urgent requirements, our CFOChief Financial Officer and the Chairman of our Audit Committee jointly approve any services that may be rendered by our independent accountants or their member firms, and such services are subsequently ratified at the next Audit Committee meeting.
The pre-approval is not required where the fees proposed to be paid for the non-audit services do not exceed 5% of the total amount of fees paid by us to our independent accountants and their member firms during the Fiscal year, provided that such services were not recognized as non auditnon-audit services at the time of the engagement of services. Such services are also brought to the attention of the Audit Committee at the next meeting. However, in Fiscal 2015 and 2014, we obtained pre-approval for all services rendered by our independent accountant and fees from the Audit Committee.
| Item 16D. | Exemptions from the Listing Standards for Audit |
Not applicable.
| Item 16E. | Purchases of Equity Securities by the Issuer and Affiliated |
None.
| Item 16F. | Change in Registrant’s Certifying |
None.
| Item 16G. | Corporate |
As a foreign private issuer, as defined under Rule 3b-4 of the Exchange Act, Tata Motors Limited is permitted under the NYSE listing standards to follow applicable Indian corporate governance practices with regard to various corporate governance matters. The following is a summary comparison of significant differences between our corporate governance practices and those required by the NYSE for non-U.S. issuers.
Independent directors: The Board
Our board of directors has determined the independence of its directors pursuant to applicable Indian listing requirements. Six directors of the Boardour board of Directorsdirectors are independent directors pursuant to such requirements. Under such requirements, a non-Executive Directornon-executive director is considered independent if he:he/she:
apartApart from receiving director’s remuneration, does not have any material pecuniary relationships or transactions with us or our promoters, our directors, our senior management or our holding company, its subsidiaries and associates which may affect the independence of the director;
isIs not related to promoters or personpersons occupying a management position at the board level or at one level below the board;
hasHas not been an executive of the CompanyTata Motors Limited in the immediately preceding three financial years;
isIs not a partner or an executive, or was not a partner or an executive during the preceding three years, of our statutory audit firm or internal audit firm or a legal/consulting firm that has a material association with us.us;
isIs not a material supplier, service provider or customer or a lessor or lessee of the Company,company, which may affect their independence; and
isIs not one of our substantial shareholders, owning two percent or more of our voting shares.shares; and
isIs not belowunder 21 years of age.
Non-management directors meetings: Directors’ Meetings
The NYSE listing standards require regularly scheduled executive sessions of non-management directors without management participation or regularly scheduled executive sessions consisting of only independent directors. There is no such requirement under applicable Indian legal requirements.
Please refer to Item 10.B “Additional Information—Memorandum and Articles of Association—Directors” for more information regarding our directors.
Nomination and Remuneration Committee
Remuneration Committee: The NYSE listing standards require a listed company to maintain a Remuneration Committee,remuneration committee, composed entirely of independent directors. Our Nomination and Remuneration Committee comprises twothree independent members and twoone non-independent members,member, which is in compliance with the requirement regarding the number of independent members of the Nomination and Remuneration Committee under applicable Indian laws. TheWe believe the constitution and main functions of this committee as approved by our Board are described aboveNomination and we believe,Remuneration Committee generally comply with the spirit of the NYSE requirements for non-U.S. issuers. Please see Item 6.C “Directors, Senior Management and Employees—Board Practices—Committees” for more information regarding our Nomination and Remuneration Committee.
| Item 16H. | Mine Safety Disclosure |
Not applicable.
| Item 17. | Financial |
We have electedresponded to provide the financial statements and related information specified in Item 18 in lieu of Item 17.
| Item 18. | Financial |
The information required by this item is set forth beginning on page F-1 of this annual report.report on Form 20-F.
| Schedule 1 | Tata Motors Limited (“Parent Company”) – condensed financial information as at March 31, 2015 and 2014 and for the year ended March 31, 2015, 2014 and 2013 on page F-89 of this annual report on Form 20-F. |
| Item 19. |
Exhibit | Description | |
| | Our Certificate of Incorporation. | |
| | Our Memorandum and Articles of Association, | |
| | Form of Amended and Restated Deposit Agreement among Tata Motors Limited, Citibank, N.A., as Depositary and | |
| | Tata Brand Equity & Business Promotion Agreement, dated December 18, 1998, between Tata Sons Limited and Tata Engineering and Locomotive Company Limited (now Tata Motors Limited). | |
| | ||
| Computation of Net Debt to Shareholders’ Equity | ||
| | List of our | |
| The Tata Code of Conduct. | ||
| Certification of the Principal Executive Officer required by Rule 13a – 14(a) | ||
| Certification of the Principal Financial Officer required by Rule 13a – 14(a) | ||
| Certification of the Chief Executive Officer and Chief Financial Officer required by Rule 13a – 14(b) and Section 1350 of Chapter 63 of Title 18 of the United States | ||
| 15.1 | Consent of Independent Registered Public Accounting Firm.6 | |
We have not included as exhibits certain instruments with respect to our long-term debt, the amount of debt authorized under each of which does not exceed 10% of our total assets, and we agree to furnish a copy of any such instrument to the Securities Exchange Commission upon request.
Incorporated by reference to our Registration Statement on Form 20-F File No. 001-32294 filed on September 15, 2004. |
Incorporated by reference to our Registration Statement on Form F-6 File No 333-119066 filed on September 16, 2004. |
Incorporated by reference to our |
Incorporated by reference to our |
Incorporated by reference to our |
Filed with this |
SIGNATURES
The registrant hereby certifies that it meets all of the requirements for filing on Form 20-F and that it has duly caused and authorized the undersigned to sign this annual report on its behalf.
August 2, 2013July 30, 2015
| TATA MOTORS LIMITED | ||
| By | /s/ | |
| Name: | ||
| Title: | ||
| By | /s/ C. Ramakrishnan | |
| Name: | C. Ramakrishnan | |
| Title: | Tata Motors’ Group Chief Financial Officer | |
INDEX TO CONSOLIDATED FINANCIAL STATEMENTS
| Page | ||
Consolidated Financial Statements of Tata Motors Limited and | ||
| F-2-F-3 | ||
Consolidated balance sheets as | F-4 | |
Consolidated income statements for the years ended March 31, | F-5 | |
| F-6 | ||
| F-12 | ||
| F-89 | ||
REPORT OF INDEPENDENT REGISTERED PUBLIC ACCOUNTING FIRM
To the Board of Directors and Shareholders of
Tata Motors Limited
Mumbai, India
We have audited the accompanying consolidated balance sheets of Tata Motors Limited and subsidiaries (the “Company” or “Tata Motors”) as of March 31, 20132015 and 2012,2014, and the related consolidated income statements, consolidated statements of comprehensive income, consolidated statements of cash flows, and consolidated statements of changes in equity for each of the three years in the period ended March 31, 2013.2015. Our audits also included the financial statement schedule included as Schedule 1 at Item 18. These consolidated financial statements and financial statement schedule are the responsibility of the Company’s management. Our responsibility is to express an opinion on these consolidated financial statements and financial statement schedule based on our audits.
We conducted our audits in accordance with the standards of the Public Company Accounting Oversight Board (United States). Those standards require that we plan and perform the audit to obtain reasonable assurance about whether the financial statements are free of material misstatement. An audit includes examining, on a test basis, evidence supporting the amounts and disclosures in the financial statements. An audit also includes assessing the accounting principles used and significant estimates made by management, as well as evaluating the overall financial statement presentation. We believe that our audits provide a reasonable basis for our opinion.
In our opinion, such consolidated financial statements present fairly, in all material respects, the financial position of Tata Motors Limited and subsidiaries as of March 31, 20132015 and 2012,2014, and the results of their operations and their cash flows for each of the three years in the period ended March 31, 2013,2015, in conformity with International Financial Reporting Standards as issued by the International Accounting Standards Board. Also, in our opinion, such financial statement schedule, when considered in relation to the basic consolidated financial statements taken as a whole, present fairly, in all material respects, the information set forth therein.
We have also audited, in accordance with the standards of the Public Company Accounting Oversight Board (United States), the Company’s internal control over financial reporting as of March 31, 2013,2015, based on the criteria established inInternal Control — Integrated Framework (1992) (2013)issued by the Committee of Sponsoring Organizations of the Treadway Commission and our report dated August 2, 2013,July 30, 2015 expressed an unqualifiedadverse opinion on the Company’s internal control over financial reporting.reporting because of a material weakness.
Our audit for the year ended and as of March 31, 2013,2015 also comprehended the translation of Indian rupee amounts into United States dollar amounts and in our opinion, such translation has been made in conformity with the basis stated in Note 2(w). to the consolidated financial statements. The translation of the consolidated financial statements amounts into United States dollars have been made solely for the convenience of the readers.readers outside India.
/s/ Deloitte HaskinsDELOITTE HASKINS & SellsSELLS LLP
Mumbai, India
August 2, 2013July 30, 2015
REPORT OF INDEPENDENT REGISTERED PUBLIC ACCOUNTING FIRM
To the Board of Directors and Shareholders of
Tata Motors Limited
Mumbai, India
We have audited the internal control over financial reporting of Tata Motors Limited and subsidiaries (the “Company” or “Tata Motors”“Company’s”) internal control over financial reporting as of March 31, 2013,2015, based on criteria established inInternal Control — Integrated Framework (1992) (2013)issued by the Committee of Sponsoring Organizations of the Treadway Commission. The Company’s management is responsible for maintaining effective internal control over financial reporting and for its assessment of the effectiveness of internal control over financial reporting, included in Item 15 under Controls and Procedures of the accompanying Form 20-F titled Management’s Annual Report on Internal Control Overover Financial Reporting. Our responsibility is to express an opinion on the Company’s internal control over financial reporting based on our audit.
We conducted our audit in accordance with the standards of the Public Company Accounting Oversight Board (United States). Those standards require that we plan and perform the audit to obtain reasonable assurance about whether effective internal control over financial reporting was maintained in all material respects. Our audit included obtaining an understanding of internal control over financial reporting, assessing the risk that a material weakness exists, testing and evaluating the design and operating effectiveness of internal control based on the assessedthat risk, and performing such other procedures as we considered necessary in the circumstances. We believe that our audit provides a reasonable basis for our opinion.
A company’s internal control over financial reporting is a process designed by, or under the supervision of, the company’s principal executive and principal financial officers, or persons performing similar functions, and effected by the company’s board of directors, management, and other personnel to provide reasonable assurance regarding the reliability of financial reporting and the preparation of financial statements for external purposes in accordance with generally accepted accounting principles. A company’s internal control over financial reporting includes those policies and procedures that (1) pertain to the maintenance of records that, in reasonable detail, accurately and fairly reflect the transactions and dispositions of the assets of the company; (2) provide reasonable assurance that transactions are recorded as necessary to permit preparation of financial statements in accordance with generally accepted accounting principles, and that receipts and expenditures of the company are being made only in accordance with authorizations of management and directors of the company; and (3) provide reasonable assurance regarding prevention or timely detection of unauthorized acquisition, use, or disposition of the company’s assets that could have a material effect on the financial statements.
Because of the inherent limitations of internal control over financial reporting, including the possibility of collusion or improper management override of controls, material misstatements due to error or fraud may not be prevented or detected on a timely basis. Also, projections of any evaluation of the effectiveness of the internal control over financial reporting to future periods are subject to the risk that the controls may become inadequate because of changes in conditions, or that the degree of compliance with the policies or procedures may deteriorate.
A material weakness is a deficiency, or a combination of deficiencies, in internal control over financial reporting, such that there is a reasonable possibility that a material misstatement of the company’s annual financial statements will not be prevented or detected on a timely basis.Management’s assessment identified a material weakness relating to design of internal controls over management’s review of technical accounting of complex derivative instruments designated in hedge relationships. This material weakness was considered in determining the nature, timing, and extent of audit tests applied in our audit of the consolidated financial statements and financial statement schedule as of and for the year ended March 31, 2015, of the Company and this report does not affect our report on such financial statements and financial statement schedule.
In our opinion, because of the effect of the material weakness described above on the achievement of the objectives of the control criteria, the Company has not maintained in all material respects, effective internal control over financial reporting as of March 31, 2013,2015, based on the criteria established inInternal Control — Integrated Framework (1992) (2013)issued by the Committee of Sponsoring Organizations of the Treadway Commission.
We have also audited, in accordance with the standards of the Public Company Accounting Oversight Board (United States), the consolidated financial statements and financial statement schedule as of and for the year ended March 31, 20132015, of the Company and our report dated August 2, 2013,July 30, 2015 expressed an unqualified opinion on those financial statements.statements and financial statement schedule.
/s/ Deloitte HaskinsDELOITTE HASKINS & SellsSELLS LLP
Mumbai, India
August 2, 2013July 30, 2015
Tata Motors Limited and subsidiaries
| As of March 31, | As at March 31, | |||||||||||||||||||||||||||||||
| Notes | 2013 | 2013 | 2012 | Notes | 2015 | 2015 | 2014 | |||||||||||||||||||||||||
| (In millions) | (In millions) | |||||||||||||||||||||||||||||||
ASSETS: | ||||||||||||||||||||||||||||||||
Current assets: | ||||||||||||||||||||||||||||||||
Cash and cash equivalents | 3 | US$ | 2,139.1 | Rs. | 116,118.5 | Rs. | 145,952.4 | 3 | US$ | 3,158.9 | Rs. | 197,430.9 | Rs. | 159,921.5 | ||||||||||||||||||
Short-term deposits with banks | 1,270.3 | 68,957.0 | 11,695.3 | |||||||||||||||||||||||||||||
Short-term deposits | 1,670.3 | 104,391.0 | 125,150.4 | |||||||||||||||||||||||||||||
Finance receivables | 4 | 1,316.4 | 71,460.5 | 68,438.8 | 4 | 793.1 | 49,568.5 | 90,832.5 | ||||||||||||||||||||||||
Trade receivables | 1,919.4 | 104,193.6 | 87,654.9 | 2,095.9 | 130,994.3 | 109,644.8 | ||||||||||||||||||||||||||
Investments | 6 | 1,385.1 | 75,191.2 | 75,299.3 | 6 | 2,252.0 | 140,747.8 | 95,337.5 | ||||||||||||||||||||||||
Other financial assets | 7 | 393.2 | 21,342.8 | 21,301.0 | 7 | 431.9 | 26,991.2 | 43,974.3 | ||||||||||||||||||||||||
Inventories | 8 | 3,838.9 | 208,393.2 | 180,834.0 | 9 | 4,596.5 | 287,279.8 | 272,735.9 | ||||||||||||||||||||||||
Other current assets | 9 | 1,012.2 | 54,945.8 | 57,550.3 | 10 | 868.7 | 54,301.7 | 52,692.2 | ||||||||||||||||||||||||
Current income tax assets | 49.0 | 2,658.3 | 4,504.2 | 28.6 | 1,786.1 | 3,420.3 | ||||||||||||||||||||||||||
|
|
|
|
|
| |||||||||||||||||||||||||||
Total current assets | 13,323.6 | 723,260.9 | 653,230.2 | 15,895.9 | 993,491.3 | 953,709.4 | ||||||||||||||||||||||||||
|
|
|
|
|
| |||||||||||||||||||||||||||
Non-current assets: | ||||||||||||||||||||||||||||||||
Finance receivables | 4 | 2,335.1 | 126,758.7 | 102,802.0 | 4 | 1,735.2 | 108,447.1 | 94,442.7 | ||||||||||||||||||||||||
Investments | 6 | 115.7 | 6,282.2 | 7,269.7 | 6 | 97.2 | 6,075.8 | 6,539.3 | ||||||||||||||||||||||||
Other financial assets | 10 | 337.9 | 18,343.6 | 17,089.9 | 8 | 209.0 | 13,070.7 | 52,444.0 | ||||||||||||||||||||||||
Property, plant and equipment | 11 | 6,386.0 | 346,663.0 | 282,716.1 | 12 | 9,390.4 | 586,899.1 | 494,609.9 | ||||||||||||||||||||||||
Goodwill | 13 | 79.6 | 4,320.3 | 4,253.0 | 14 | 117.1 | 7,319.5 | 7,449.2 | ||||||||||||||||||||||||
Intangible assets | 14 | 6,470.2 | 351,236.1 | 282,347.4 | 15 | 8,494.4 | 530,900.8 | 492,184.1 | ||||||||||||||||||||||||
Investment in equity accounted investees | 15 | 559.9 | 30,391.7 | 23,265.9 | ||||||||||||||||||||||||||||
Investments in equity accounted investees | 16 | 507.8 | 31,736.6 | 20,236.7 | ||||||||||||||||||||||||||||
Non-current income tax assets | 118.0 | 6,404.1 | 4,933.0 | 151.6 | 9,474.6 | 8,558.2 | ||||||||||||||||||||||||||
Deferred income taxes | 16 | 832.7 | 45,205.2 | 46,493.9 | 17 | 647.7 | 40,478.8 | 39,150.5 | ||||||||||||||||||||||||
Other non-current assets | 17 | 181.1 | 9,829.6 | 10,135.1 | 11 | 284.0 | 17,749.1 | 15,451.9 | ||||||||||||||||||||||||
|
|
|
|
|
| |||||||||||||||||||||||||||
Total non-current assets | 17,416.2 | 945,434.5 | 781,306.0 | 21,634.4 | 1,352,152.1 | 1,231,066.5 | ||||||||||||||||||||||||||
|
|
|
|
|
| |||||||||||||||||||||||||||
Total assets | US$ | 30,739.8 | Rs. | 1,668,695.4 | Rs. | 1,434,536.2 | US$ | 37,530.3 | Rs. | 2,345,643.4 | Rs. | 2,184,775.9 | ||||||||||||||||||||
|
|
|
|
|
| |||||||||||||||||||||||||||
LIABILITIES AND EQUITY: | ||||||||||||||||||||||||||||||||
Liabilities: | ||||||||||||||||||||||||||||||||
Current liabilities: | ||||||||||||||||||||||||||||||||
Accounts payable | US$ | 7,536.4 | Rs. | 409,096.3 | Rs. | 334,558.9 | 9,110.1 | 569,383.4 | 544,197.3 | |||||||||||||||||||||||
Acceptances | 809.3 | 43,931.3 | 40,787.4 | 652.3 | 40,767.5 | 51,620.4 | ||||||||||||||||||||||||||
Short-term borrowings and current portion of long-term debt | 18 | 4,261.9 | 231,356.9 | 220,975.1 | 18 | 2,887.4 | 180,465.4 | 165,960.6 | ||||||||||||||||||||||||
Other financial liabilities | 19 | 705.7 | 38,308.7 | 27,238.2 | 20 | 1,510.2 | 94,388.8 | 34,924.2 | ||||||||||||||||||||||||
Provisions | 20 | 621.7 | 33,750.6 | 28,112.0 | 22 | 790.0 | 49,372.7 | 45,713.8 | ||||||||||||||||||||||||
Other current liabilities | 21 | 961.9 | 52,218.4 | 61,429.5 | 23 | 800.6 | 50,035.4 | 54,186.5 | ||||||||||||||||||||||||
Current income tax liabilities | 327.1 | 17,754.5 | 11,501.5 | 131.9 | 8,241.5 | 13,986.7 | ||||||||||||||||||||||||||
|
|
|
|
|
| |||||||||||||||||||||||||||
Total current liabilities | 15,224.0 | 826,416.7 | 724,602.6 | 15,882.5 | 992,654.7 | 910,589.5 | ||||||||||||||||||||||||||
|
|
|
|
|
| |||||||||||||||||||||||||||
Non-current liabilities: | ||||||||||||||||||||||||||||||||
Long-term debt | 22 | 5,995.3 | 325,457.5 | 287,148.1 | 19 | 8,717.8 | 544,862.5 | 454,138.6 | ||||||||||||||||||||||||
Other financial liabilities | 23 | 404.9 | 21,979.1 | 7,532.6 | 21 | 1,295.3 | 80,956.5 | 9,172.7 | ||||||||||||||||||||||||
Deferred income taxes | 16 | 288.5 | 15,668.1 | 17,704.8 | 17 | 375.5 | 23,466.8 | 35,271.8 | ||||||||||||||||||||||||
Provisions | 20 | 857.8 | 46,563.5 | 38,242.4 | 22 | 1,116.5 | 69,779.8 | 66,810.2 | ||||||||||||||||||||||||
Other liabilities | 24 | 1,081.4 | 58,704.8 | 27,962.1 | 24 | 1,513.1 | 94,571.3 | 77,096.8 | ||||||||||||||||||||||||
|
|
|
|
|
| |||||||||||||||||||||||||||
Total non-current liabilities | 8,627.9 | 468,373.0 | 378,590.0 | 13,018.2 | 813,636.9 | 642,490.1 | ||||||||||||||||||||||||||
|
|
|
|
|
| |||||||||||||||||||||||||||
Total liabilities | 23,851.9 | 1,294,789.7 | 1,103,192.6 | 28,900.7 | 1,806,291.6 | 1,553,079.6 | ||||||||||||||||||||||||||
|
|
|
|
|
| |||||||||||||||||||||||||||
Equity: | ||||||||||||||||||||||||||||||||
Ordinary shares | 25 | 99.8 | 5,416.7 | 5,383.6 | 25 | 87.6 | 5,473.8 | 5,473.8 | ||||||||||||||||||||||||
‘A’ Ordinary shares | 25 | 17.8 | 964.0 | 963.9 | 25 | 15.4 | 964.0 | 964.0 | ||||||||||||||||||||||||
Additional paid-in capital | 3,296.9 | 178,971.7 | 173,946.6 | 2,996.5 | 187,280.1 | 187,341.3 | ||||||||||||||||||||||||||
Reserves | 3,639.6 | 197,576.5 | 146,807.5 | 6,410.5 | 400,658.5 | 308,089.4 | ||||||||||||||||||||||||||
Other components of equity | 26 | (233.2 | ) | (12,660.4 | ) | 1,311.0 | 26 | (951.0 | ) | (59,434.7 | ) | 125,609.2 | ||||||||||||||||||||
|
|
|
|
|
| |||||||||||||||||||||||||||
Equity attributable to shareholders of Tata Motors Limited | 6,820.9 | 370,268.5 | 328,412.6 | 8,559.0 | 534,941.7 | 627,477.7 | ||||||||||||||||||||||||||
Non-controlling interests | 67.0 | 3,637.2 | 2,931.0 | 70.6 | 4,410.1 | 4,218.6 | ||||||||||||||||||||||||||
|
|
|
|
|
| |||||||||||||||||||||||||||
Total equity | 6,887.9 | 373,905.7 | 331,343.6 | 8,629.6 | 539,351.8 | 631,696.3 | ||||||||||||||||||||||||||
|
|
|
|
|
| |||||||||||||||||||||||||||
Total liabilities and equity | US$ | 30,739.8 | Rs. | 1,668,695.4 | Rs. | 1,434,536.2 | US$ | 37,530.3 | Rs. | 2,345,643.4 | Rs. | 2,184,775.9 | ||||||||||||||||||||
|
|
|
|
|
| |||||||||||||||||||||||||||
See accompanying notes to consolidated financial statements
Tata Motors Limited and subsidiaries
Consolidated Income Statements
| Year ended March 31, | Year ended March 31, | |||||||||||||||||||||||||||||||||||||||
| Notes | 2013 | 2013 | 2012 | 2011 | Notes | 2015 | 2015 | 2014 | 2013 | |||||||||||||||||||||||||||||||
| (In millions, except per share amounts) | (In millions, except per share amounts) | |||||||||||||||||||||||||||||||||||||||
Revenues | US$ | 34,260.8 | Rs. | 1,859,847.0 | Rs. | 1,640,512.5 | Rs. | 1,209,902.6 | US$ | 41,642.2 | Rs. | 2,602,634.4 | Rs. | 2,311,884.6 | Rs. | 1,862,896.7 | ||||||||||||||||||||||||
Finance revenues | 552.9 | 30,013.3 | 24,340.4 | 22,231.5 | 362.1 | 22,630.8 | 29,875.9 | 30,013.3 | ||||||||||||||||||||||||||||||||
|
|
|
|
|
|
|
| |||||||||||||||||||||||||||||||||
Total revenues | 34,813.7 | 1,889,860.3 | 1,664,852.9 | 1,232,134.1 | 42,004.3 | 2,625,265.2 | 2,341,760.5 | 1,892,910.0 | ||||||||||||||||||||||||||||||||
Change in inventories of finished goods and work-in- progress | (555.5 | ) | (30,158.0 | ) | (25,770.1 | ) | (18,874.7 | ) | ||||||||||||||||||||||||||||||||
Change in inventories of finished goods and work-in-progress | (473.8 | ) | (29,610.9 | ) | (28,317.3 | ) | (30,086.8 | ) | ||||||||||||||||||||||||||||||||
Purchase of products for sale | 2,369.3 | 128,615.8 | 124,295.9 | 121,000.6 | 2,092.8 | 130,803.8 | 109,691.6 | 92,889.5 | ||||||||||||||||||||||||||||||||
Raw materials and consumables | 20,407.0 | 1,107,792.4 | 1,001,950.8 | 694,097.9 | ||||||||||||||||||||||||||||||||||||
Raw materials, components, and consumables | 23,997.8 | 1,499,862.9 | 1,363,572.1 | 1,138,214.3 | ||||||||||||||||||||||||||||||||||||
Employee cost | 28 | 3,058.6 | 166,038.8 | 122,130.2 | 92,249.6 | 28 | 4,006.4 | 250,401.2 | 213,903.0 | 167,169.5 | ||||||||||||||||||||||||||||||
Depreciation and amortization | 1,358.1 | 73,723.2 | 54,435.1 | 43,445.7 | 2,151.9 | 134,495.8 | 110,462.6 | 75,767.9 | ||||||||||||||||||||||||||||||||
Other expenses | 29 | 7,039.1 | 382,119.6 | 309,380.5 | 232,341.7 | 29 | 8,734.6 | 545,909.5 | 498,777.7 | 384,423.3 | ||||||||||||||||||||||||||||||
Expenditure capitalized | (1,877.5 | ) | (101,919.7 | ) | (82,659.8 | ) | (57,433.1 | ) | (2,451.5 | ) | (153,217.5 | ) | (135,246.8 | ) | (101,934.5 | ) | ||||||||||||||||||||||||
Other (income) / loss (net) | 30 | (221.5 | ) | (12,024.0 | ) | (9,407.1 | ) | 8,218.0 | ||||||||||||||||||||||||||||||||
Other (income)/loss (net) | 30 | (184.1 | ) | (11,508.4 | ) | (7,732.6 | ) | (12,099.1 | ) | |||||||||||||||||||||||||||||||
Foreign exchange (gain)/loss (net) | 288.1 | 15,640.0 | 11,154.2 | (3,090.0 | ) | 202.9 | 12,680.7 | (19,104.2 | ) | 15,774.9 | ||||||||||||||||||||||||||||||
Interest income | (142.9 | ) | (7,759.8 | ) | (5,426.8 | ) | (3,669.5 | ) | (108.2 | ) | (6,763.9 | ) | (6,656.7 | ) | (6,928.0 | ) | ||||||||||||||||||||||||
Interest expense (net) | 31 | 750.7 | 40,751.8 | 38,290.4 | 36,853.5 | 31 | 835.8 | 52,231.6 | 53,094.7 | 40,792.0 | ||||||||||||||||||||||||||||||
Impairment in respect of equity accounted investees | 15 | — | — | 4,981.0 | — | |||||||||||||||||||||||||||||||||||
Share of (profit)/loss of equity accounted investees | 15 | (31.9 | ) | (1,733.5 | ) | 351.1 | 458.4 | |||||||||||||||||||||||||||||||||
|
|
|
| |||||||||||||||||||||||||||||||||||||
Impairment in respect of an equity accounted investee | 16 | — | — | 8,033.7 | — | |||||||||||||||||||||||||||||||||||
Share of (profit)/loss of equity accounted investees (net) | 16 | 28.0 | 1,748.3 | 1,877.6 | 131.5 | |||||||||||||||||||||||||||||||||||
|
|
|
| |||||||||||||||||||||||||||||||||||||
Net income before tax | US$ | 2,372.1 | Rs. | 128,773.7 | Rs. | 121,147.5 | Rs. | 86,536.0 | 3,171.7 | 198,232.1 | 179,405.1 | 128,795.5 | ||||||||||||||||||||||||||||
Income tax expense | 16 | (721.9 | ) | (39,190.5 | ) | (4,707.1 | ) | (12,787.3 | ) | 17 | (1,106.4 | ) | (69,149.7 | ) | (48,226.5 | ) | (39,238.8 | ) | ||||||||||||||||||||||
|
|
|
|
|
|
|
| |||||||||||||||||||||||||||||||||
Net income | US$ | 2,065.3 | Rs. | 129,082.4 | Rs. | 131,178.6 | Rs. | 89,556.7 | ||||||||||||||||||||||||||||||||
|
|
|
| |||||||||||||||||||||||||||||||||||||
Net income | US$ | 1,650.2 | Rs. | 89,583.2 | Rs. | 116,440.4 | Rs. | 73,748.7 | ||||||||||||||||||||||||||||||||
Attributable to: | ||||||||||||||||||||||||||||||||||||||||
Shareholders of Tata Motors Limited | 1,633.9 | 88,697.0 | 115,659.1 | 73,401.8 | 2,052.7 | 128,291.2 | 130,717.1 | 88,670.5 | ||||||||||||||||||||||||||||||||
Non-controlling interests | 16.3 | 886.2 | 781.3 | 346.9 | 12.6 | 791.2 | 461.5 | 886.2 | ||||||||||||||||||||||||||||||||
Earnings per share: | 40 | 40 | ||||||||||||||||||||||||||||||||||||||
Ordinary shares: | ||||||||||||||||||||||||||||||||||||||||
Basic | US$ | 0.5 | Rs. | 27.8 | Rs. | 36.4 | Rs. | 24.6 | US$ | 0.6 | Rs. | 39.4 | Rs. | 40.2 | Rs. | 27.5 | ||||||||||||||||||||||||
Diluted | US$ | 0.5 | Rs. | 27.8 | Rs. | 36.0 | Rs. | 24.5 | US$ | 0.6 | Rs. | 39.4 | Rs. | 40.2 | Rs. | 27.5 | ||||||||||||||||||||||||
‘A’ Ordinary shares: | ||||||||||||||||||||||||||||||||||||||||
Basic | US$ | 0.5 | Rs. | 27.9 | Rs. | 36.5 | Rs. | 24.7 | US$ | 0.6 | Rs. | 39.5 | Rs. | 40.3 | Rs. | 27.6 | ||||||||||||||||||||||||
Diluted | US$ | 0.5 | Rs. | 27.9 | Rs. | 36.1 | Rs. | 24.6 | US$ | 0.6 | Rs. | 39.5 | Rs. | 40.3 | Rs. | 27.6 | ||||||||||||||||||||||||
See accompanying notes to consolidated financial statements
Tata Motors Limited and subsidiaries
Consolidated Statements of Comprehensive Income
| Year ended March 31, | Year ended March 31, | |||||||||||||||||||||||||||||||
| 2013 | 2013 | 2012 | 2011 | 2015 | 2015 | 2014 | 2013 | |||||||||||||||||||||||||
| (In millions) | (In millions) | |||||||||||||||||||||||||||||||
Net income | US$ | 1,650.2 | Rs. 89,583.2 | Rs. 116,440.4 | Rs. 73,748.7 | US$ | 2,065.3 | Rs. | 129,082.4 | Rs. | 131,178.6 | Rs. | 89,556.7 | |||||||||||||||||||
Other comprehensive income | ||||||||||||||||||||||||||||||||
Other comprehensive income : | ||||||||||||||||||||||||||||||||
(i) Items that will not be reclassified subsequently to profit and loss : | ||||||||||||||||||||||||||||||||
Remeasurement gains and (losses) on defined benefit obligations (net) | (582.4 | ) | (36,402.8 | ) | (12,940.5 | ) | (29,207.2 | ) | ||||||||||||||||||||||||
Share of remeasurement gains and (losses) on defined benefit obligations (net) of equity accounted investees | (0.5 | ) | (32.1 | ) | 10.9 | 12.5 | ||||||||||||||||||||||||||
Income tax relating to items that will not be reclassified subsequently | 119.2 | 7,449.4 | (455.6 | ) | 6,147.9 | |||||||||||||||||||||||||||
|
|
|
| |||||||||||||||||||||||||||||
| (463.7 | ) | (28,985.5 | ) | (13,385.2 | ) | (23,046.8 | ) | |||||||||||||||||||||||||
|
|
|
| |||||||||||||||||||||||||||||
(ii) Items that may be reclassified subsequently to profit and loss : | ||||||||||||||||||||||||||||||||
Currency translation differences | 14.7 | 797.6 | 23,500.3 | 5,613.3 | (689.5 | ) | (43,094.9 | ) | 66,678.4 | 797.6 | ||||||||||||||||||||||
Gain/(loss) on cash flow hedges (net) | (278.3 | ) | (15,106.0 | ) | (3,224.0 | ) | 1,528.7 | (2,855.9 | ) | (178,491.6 | ) | 89,657.1 | (19,690.1 | ) | ||||||||||||||||||
Actuarial gains and (losses) (net)* | (425.3 | ) | (23,085.8 | ) | 667.3 | (22,436.0 | ) | |||||||||||||||||||||||||
Available-for-sale investments | 6.5 | 352.9 | (797.4 | ) | 38.8 | (8.5 | ) | (531.2 | ) | 441.9 | 408.0 | |||||||||||||||||||||
Share of other comprehensive income of equity accounted investees | 0.5 | 27.4 | 41.7 | 7.3 | 18.8 | 1,175.1 | 419.1 | 14.9 | ||||||||||||||||||||||||
Income tax relating to items that may be reclassified subsequently | 571.3 | 35,708.5 | (18,628.9 | ) | 4,529.0 | |||||||||||||||||||||||||||
|
|
|
|
|
|
|
| |||||||||||||||||||||||||
Other comprehensive income/(loss) for the year, net of tax | (681.9 | ) | (37,013.9 | ) | 20,187.9 | (15,247.9 | ) | |||||||||||||||||||||||||
| (2,963.8 | ) | (185,234.1 | ) | 138,567.6 | (13,940.6 | ) | ||||||||||||||||||||||||||
|
|
|
| |||||||||||||||||||||||||||||
Other comprehensive income/(loss) for the year, net of tax (i+ii) | (3,427.5 | ) | (214,219.6 | ) | 125,182.4 | (36,987.4 | ) | |||||||||||||||||||||||||
|
|
|
|
|
|
|
| |||||||||||||||||||||||||
Total comprehensive income for the year | US$ | 968.3 | Rs. 52,569.3 | Rs. 136,628.3 | Rs. 58,500.8 | US$ | (1,362.2 | ) | Rs. | (85,137.2 | ) | Rs. | 256,361.0 | Rs. | 52,569.3 | |||||||||||||||||
|
|
|
|
|
|
|
| |||||||||||||||||||||||||
Attributable to: | ||||||||||||||||||||||||||||||||
Shareholders of Tata Motors Limited | 951.4 | 51,652.6 | 135,751.2 | 58,115.5 | (1,371.7 | ) | (85,730.6 | ) | 255,605.1 | 51,652.6 | ||||||||||||||||||||||
Non-controlling interests | 16.9 | 916.7 | 877.1 | 385.3 | 9.5 | 593.4 | 755.9 | 916.7 | ||||||||||||||||||||||||
See accompanying notes to consolidated financial statements
Tata Motors Limited and subsidiaries
Consolidated Statements of Cash Flows
| Year ended March 31, | ||||||||||||||||
| 2015 | 2015 | 2014 | 2013 | |||||||||||||
| (In millions) | ||||||||||||||||
Cash flows from operating activities: | ||||||||||||||||
Net income | US$ | 2,065.3 | Rs. 129,082.4 | Rs. 131,178.6 | Rs. 89,556.7 | |||||||||||
Adjustments for: | ||||||||||||||||
Depreciation and amortization | 2,151.9 | 134,495.8 | 110,462.6 | 75,767.9 | ||||||||||||
Inventory write-down | 88.4 | 5,527.2 | 3,354.5 | 3,721.0 | ||||||||||||
Allowances for finance receivables | 371.6 | 23,226.2 | 24,138.9 | 9,427.9 | ||||||||||||
Allowances for trade and other receivables | 37.9 | 2,371.0 | 2,691.0 | 1,141.6 | ||||||||||||
Impairment in respect of an equity accounted investee | — | — | 8,033.7 | — | ||||||||||||
Share of (profit)/loss of equity accounted investees (net) | 28.0 | 1,748.3 | 1,877.6 | 131.5 | ||||||||||||
Loss on sale of assets/assets written off and others (net) | 56.2 | 3,512.2 | 294.1 | 229.0 | ||||||||||||
(Gain) on sale/loss on fair valuation of available-for-sale investments (net) | (19.1 | ) | (1,195.0 | ) | (1,102.1 | ) | 275.2 | |||||||||
(Gain)/loss on change in the fair value of conversion options | — | — | 838.2 | (801.6 | ) | |||||||||||
(Gain)/loss on change in fair value of prepayment option on senior notes | — | — | 4,791.6 | (3,932.6 | ) | |||||||||||
Acquisition related cost | — | — | 27.6 | — | ||||||||||||
Foreign exchange (gain)/loss (net) | 530.3 | 33,146.3 | (2,131.3 | ) | 9,985.1 | |||||||||||
Income tax expense | 1,106.4 | 69,149.7 | 48,226.5 | 39,238.8 | ||||||||||||
Interest expense (net) | 835.8 | 52,231.6 | 53,094.7 | 40,792.0 | ||||||||||||
Interest income | (108.2 | ) | (6,763.9 | ) | (6,656.7 | ) | (6,928.0 | ) | ||||||||
Dividend income | (5.7 | ) | (355.6 | ) | (244.9 | ) | (384.0 | ) | ||||||||
Gain on fair value of below market interest loans | (8.0 | ) | (498.4 | ) | (2,155.2 | ) | (1,462.8 | ) | ||||||||
Non-cash dividend income on mutual funds | 0.1 | 4.3 | (130.2 | ) | — | |||||||||||
|
|
|
|
|
|
|
| |||||||||
Cash flows from operating activities before changes in following assets and liabilities | 7,130.9 | 445,682.1 | 376,589.2 | 256,757.7 | ||||||||||||
Trade receivables | (505.8 | ) | (31,612.9 | ) | 11,055.8 | (17,527.8 | ) | |||||||||
Finance receivables | 64.5 | 4,033.3 | (11,194.9 | ) | (36,406.2 | ) | ||||||||||
Other financial assets | (27.7 | ) | (1,731.2 | ) | 1,620.5 | (5,591.9 | ) | |||||||||
Other current assets | (6.7 | ) | (417.3 | ) | 16,252.4 | 1,980.3 | ||||||||||
Inventories | (591.4 | ) | (36,962.9 | ) | (31,763.6 | ) | (30,006.3 | ) | ||||||||
Other non-current assets | (44.9 | ) | (2,805.9 | ) | (4,205.0 | ) | 283.7 | |||||||||
Accounts payable | 644.1 | 40,256.2 | 47,075.4 | 63,474.1 | ||||||||||||
Acceptances | (173.8 | ) | (10,859.7 | ) | 7,548.5 | 3,087.5 | ||||||||||
Other current liabilities | (23.3 | ) | (1,455.1 | ) | (5,948.4 | ) | (9,705.8 | ) | ||||||||
Other financial liabilities | 37.5 | 2,343.6 | (159.7 | ) | 5,648.0 | |||||||||||
Other non-current liabilities | 390.3 | 24,396.7 | (7,159.6 | ) | 2,182.9 | |||||||||||
Provisions | (371.7 | ) | (23,232.4 | ) | 16,486.3 | 14,390.9 | ||||||||||
|
|
|
|
|
|
|
| |||||||||
Cash generated from operations | 6,522.0 | 407,634.5 | 416,196.9 | 248,567.1 | ||||||||||||
Income tax paid (net) | (675.7 | ) | (42,233.2 | ) | (44,765.2 | ) | (23,017.8 | ) | ||||||||
|
|
|
|
|
|
|
| |||||||||
Net cash provided by operating activities | 5,846.3 | 365,401.3 | 371,431.7 | 225,549.3 | ||||||||||||
|
|
|
|
|
|
|
| |||||||||
Cash flows from investing activities: | ||||||||||||||||
Deposits with banks | (4,600.0 | ) | (287,502.2 | ) | (265,986.1 | ) | (122,546.4 | ) | ||||||||
Realization of deposits with banks | 4,891.7 | 305,732.7 | 220,905.9 | 62,053.9 | ||||||||||||
Loan given to equity accounted investees | (25.6 | ) | (1,600.0 | ) | — | — | ||||||||||
(Purchase)/sale of available-for-sale investments (net) | (872.0 | ) | (54,501.0 | ) | (4,252.2 | ) | 1,817.6 | |||||||||
Purchases of available-for-sale investments/other investments | (1.6 | ) | (100.5 | ) | (38.8 | ) | (33.3 | ) | ||||||||
Proceeds from sale of available-for-sale investments | 6.8 | 423.4 | 43.7 | 27.5 | ||||||||||||
Proceeds from sale of investments classified as loans and receivables | — | — | — | 257.5 | ||||||||||||
Deposits of margin money and other restricted deposits Realization of margin money and other restricted deposits (Increase)/decrease in short term inter-corporate deposits Investments in equity accounted investees Dividends received from equity accounted investees Interest received Dividend received Payments for property, plant and equipment Proceeds from sale of property, plant and equipment Payments for intangible assets Payments for acquisitions, net of cash acquired Net cash used in investing activities Cash flows from financing activities: Proceeds from issuance of shares Shares issuance costs and foreign currency convertible notes (FCCNs) conversion expenses Proceeds from issue of shares by a subsidiary to non-controlling interests shareholders (net of share issue expenses) Dividends paid (including dividend distribution tax) Dividends paid to non-controlling interests shareholders of subsidiaries (including dividend distribution tax) Interest paid Proceeds from issuance of short-term debt Repayment of short-term debt Net change in other short-term debt (with maturity up to three months) Proceeds from issuance of long-term debt Repayments of long-term debt Debt issuance cost Net cash provided by/(used in) financing activities Net change in cash and cash equivalents Effect of foreign exchange on cash and cash equivalents Cash and cash equivalents, beginning of the year Cash and cash equivalents, end of the year Non-cash transactions: Liability towards property, plant and equipment and intangible assets purchased on credit/deferred credit FCCN/CARS converted to Ordinary shares * Year ended March 31, 2015 2015 2014 2013 (In millions) US$ — Rs. — Rs. (7,262.4 ) Rs. (3,068.6 ) 5.8 361.7 22,196.5 7,613.8 (15.2 ) (950.0 ) — 501.2 (196.1 ) (12,258.6 ) (9,007.6 ) (6,216.6 ) 2.5 153.4 145.1 209.6 105.7 6,606.7 6,310.2 7,126.1 5.7 355.6 244.9 384.0 (2,741.8 ) (171,361.8 ) (134,114.1 ) (91,692.8 ) 11.3 704.3 479.2 633.0 (2,083.9 ) (130,241.3 ) (124,699.7 ) (95,254.7 ) — — (1,294.3 ) — (5,506.7 ) (344,177.6 ) (296,329.7 ) (238,188.2 ) — — 0.9 1.7 — — (3.5 ) 2.0 — — — 5.1 (107.9 ) (6,744.2 ) (6,822.6 ) (14,841.8 ) (7.4 ) (463.1 ) (390.1 ) (215.6 ) (1,106.1 ) (69,130.7 ) (67,619.1 ) (58,577.4 ) 1,392.8 87,050.2 113,642.8 145,658.4 (1,563.5 ) (97,716.4 ) (125,763.5 ) (133,377.4 ) 652.4 40,776.2 (13,388.4 ) 2,487.9 4,272.3 267,018.8 237,843.9 148,362.9 (3,004.1 ) (187,755.8 ) (183,701.5 ) (109,737.8 ) (38.8 ) (2,424.7 ) (2,046.6 ) (464.3 ) 489.7 30,610.3 (48,247.7 ) (20,696.3 ) 829.3 51,834.0 26,854.3 (33,335.2 ) (229.1 ) (14,324.6 ) 16,157.3 2,688.0 2,558.7 159,921.5 116,909.9 147,557.1 US$ 3,158.9 Rs. 197,430.9 Rs. 159,921.5 Rs. 116,909.9 US$ 787.8 Rs. 49,236.6 Rs. 29,779.1 Rs. 23,964.5 — — 8,644.9 5,058.6
| * |
See accompanying notes to consolidated financial statements
Tata Motors Limited and subsidiaries
Consolidated Statements of Cash Flows
| Year ended March 31, | ||||||||||||||||
| 2013 | 2013 | 2012 | 2011 | |||||||||||||
| ( In millions) | ||||||||||||||||
Cash flows from operating activities: | ||||||||||||||||
Net income | US$ | 1,650.2 | Rs. | 89,583.2 | Rs. | 116,440.4 | Rs. | 73,748.7 | ||||||||
Adjustments for: | ||||||||||||||||
Depreciation and amortization | 1,358.1 | 73,723.2 | 54,435.1 | 43,445.7 | ||||||||||||
Inventory write-down | 67.7 | 3,675.1 | 2,098.8 | 1,512.5 | ||||||||||||
Allowances for finance receivables | 173.6 | 9,427.9 | 5,747.3 | 4,872.7 | ||||||||||||
Allowances for trade and other receivables | 21.0 | 1,141.3 | 997.3 | 1,099.4 | ||||||||||||
Impairment in respect of equity accounted investees | — | — | 4,981.0 | — | ||||||||||||
Share of (profit)/ loss of equity accounted investees | (31.9 | ) | (1,733.5 | ) | 351.1 | 458.4 | ||||||||||
Loss on sale of assets / assets written off | 4.1 | 222.8 | 701.6 | 284.7 | ||||||||||||
Goodwill impairment | — | — | 45.7 | — | ||||||||||||
(Gain) on sale / loss on fair valuation of available-for-sale investments (net) | 5.1 | 277.6 | (484.5 | ) | (166.6 | ) | ||||||||||
(Gain)/loss on conversion option | (14.8 | ) | (801.6 | ) | (2,432.4 | ) | 13,850.1 | |||||||||
Gain on fair value of prepayment options on Senior Notes | (72.4 | ) | (3,932.6 | ) | — | — | ||||||||||
Foreign exchange (gain) / loss | 182.8 | 9,922.8 | 13,275.8 | (1,030.2 | ) | |||||||||||
Income tax expense | 721.9 | 39,190.5 | 4,707.1 | 12,787.3 | ||||||||||||
Interest expense | 750.7 | 40,751.8 | 38,290.4 | 36,853.5 | ||||||||||||
Interest income | (142.9 | ) | (7,759.8 | ) | (5,426.8 | ) | (3,669.5 | ) | ||||||||
Dividend income | (7.0 | ) | (377.8 | ) | (236.1 | ) | (654.3 | ) | ||||||||
Discounting of below market loans from government | (26.8 | ) | (1,462.8 | ) | — | — | ||||||||||
Non-cash dividend income on mutual funds | — | — | (145.6 | ) | (13.3 | ) | ||||||||||
|
|
|
|
|
|
|
| |||||||||
Cash flows from operating activities before changes in following assets and liabilities | 4,639.4 | 251,848.1 | 233,346.2 | 183,379.1 | ||||||||||||
Trade receivable | (328.0 | ) | (17,807.0 | ) | (13,946.8 | ) | 3,512.1 | |||||||||
Finance receivable | (670.6 | ) | (36,406.2 | ) | (30,660.4 | ) | (3,890.5 | ) | ||||||||
Other financial assets | (95.5 | ) | (5,186.0 | ) | (1,302.0 | ) | 170.6 | |||||||||
Other current assets | 57.0 | 3,093.2 | (12,906.2 | ) | (6,702.7 | ) | ||||||||||
Inventories | (562.3 | ) | (30,526.4 | ) | (29,083.5 | ) | (27,569.9 | ) | ||||||||
Other non-current assets | 5.2 | 283.7 | 482.3 | (2,070.9 | ) | |||||||||||
Accounts payable | 1,187.5 | 64,461.4 | 78,936.3 | 33,498.4 | ||||||||||||
Acceptances | 56.9 | 3,087.5 | (12,890.4 | ) | (19,151.7 | ) | ||||||||||
Other current liabilities | (179.1 | ) | (9,724.6 | ) | 14,205.1 | 4,776.5 | ||||||||||
Other financial liabilities | 106.0 | 5,755.0 | 8,578.6 | (2,561.9 | ) | |||||||||||
Other non-current liabilities | 39.6 | 2,148.5 | (8,553.2 | ) | (9,612.6 | ) | ||||||||||
Provisions | 265.5 | 14,413.4 | 10,000.3 | 2,092.5 | ||||||||||||
|
|
|
|
|
|
|
| |||||||||
Cash generated from operations | 4,521.6 | 245,440.6 | 236,206.3 | 155,869.0 | ||||||||||||
Income tax paid | (414.6 | ) | (22,507.8 | ) | (17,979.4 | ) | (13,892.6 | ) | ||||||||
|
|
|
|
|
|
|
| |||||||||
Net cash provided by operating activities | 4,107.0 | 222,932.8 | 218,226.9 | 141,976.4 | ||||||||||||
|
|
|
|
|
|
|
| |||||||||
Cash flows from investing activities: | ||||||||||||||||
Deposits with banks | (1,267.5 | ) | (68,807.1 | ) | (13,102.6 | ) | (12,451.5 | ) | ||||||||
Realization of deposits with banks | 153.1 | 8,313.0 | 8,830.1 | 8,903.3 | ||||||||||||
Repayment of loans / Loans (given) to equity accounted investees and others | 9.2 | 501.2 | (29.6 | ) | 48.0 | |||||||||||
(Purchase) / sale of available-for-sale investments (net) | 28.8 | 1,563.5 | (58,464.6 | ) | (332.0 | ) | ||||||||||
Purchases of other investments | (0.6 | ) | (33.3 | ) | (355.7 | ) | (1,139.0 | ) | ||||||||
Proceeds from sale of available-for-sale investments | 0.5 | 27.5 | 20.2 | 64.3 | ||||||||||||
Proceeds from sale of investments classified as loans and receivables | 4.7 | 257.5 | 7.5 | 69.0 | ||||||||||||
Tata Motors Limited and subsidiaries
Consolidated Statements of Cash Flows
| Year ended March 31, | ||||||||||||||||
| 2013 | 2013 | 2012 | 2011 | |||||||||||||
| ( In millions) | ||||||||||||||||
Proceeds from sale of other investments | US $ | — | Rs. | — | Rs. | — | Rs. | 2.0 | ||||||||
Deposits of margin money and other restricted deposits | (56.5 | ) | (3,068.6 | ) | (12,404.5 | ) | (9,053.8 | ) | ||||||||
Realization of margin money and other restricted deposits | 140.3 | 7,613.8 | 5,062.3 | 18,285.2 | ||||||||||||
Investments in equity accounted investees | (114.5 | ) | (6,216.6 | ) | (514.1 | ) | (2,056.8 | ) | ||||||||
Dividends received from equity accounted investees | 10.5 | 569.6 | 465.9 | 399.9 | ||||||||||||
Interest received | 144.3 | 7,830.9 | 4,723.5 | 3,451.7 | ||||||||||||
Dividend received | 7.0 | 377.8 | 236.1 | 654.3 | ||||||||||||
Payments for property, plant and equipment | (1,665.6 | ) | (90,419.5 | ) | (65,543.8 | ) | (33,852.8 | ) | ||||||||
Proceeds from sale of property, plant and equipment | 11.6 | 629.5 | 926.3 | 384.4 | ||||||||||||
Payments for intangible assets | (1,754.7 | ) | (95,254.7 | ) | (73,200.7 | ) | (48,245.2 | ) | ||||||||
Payments for acquisitions, net of cash acquired | — | — | — | (119.4 | ) | |||||||||||
|
|
|
|
|
|
|
| |||||||||
Net cash used in investing activities | (4,349.4 | ) | (236,115.5 | ) | (203,343.7 | ) | (74,988.4 | ) | ||||||||
|
|
|
|
|
|
|
| |||||||||
Cash flows from financing activities: | ||||||||||||||||
Proceeds from issuance of shares | — | 1.7 | — | 33,510.0 | ||||||||||||
Shares issuance costs and FCCN conversion expenses | — | 2.0 | — | (1,030.8 | ) | |||||||||||
Proceeds from issue of shares by a subsidiary to non-controlling interests shareholders (net of share issue expenses) | 0.1 | 5.1 | 1,383.9 | 57.6 | ||||||||||||
Purchase of additional equity interest in a subsidiary | — | — | (3,043.4 | ) | — | |||||||||||
Dividends paid (including dividend tax) | (273.4 | ) | (14,841.8 | ) | (14,648.5 | ) | (10,042.3 | ) | ||||||||
Dividends paid to non-controlling interests shareholders of subsidiaries | (4.0 | ) | (215.6 | ) | (245.5 | ) | (187.7 | ) | ||||||||
Interest paid | (1,078.2 | ) | (58,529.2 | ) | (35,921.5 | ) | (33,966.5 | ) | ||||||||
Proceeds from issuance of short-term debt | 2,681.5 | 145,566.9 | 82,489.1 | 132,814.8 | ||||||||||||
Repayment of short-term debt | (2,457.0 | ) | (133,377.4 | ) | (103,472.3 | ) | (144,556.0 | ) | ||||||||
Net change in other short-term debt (with maturity up to three months) | 44.3 | 2,406.7 | 4,202.9 | (14,184.3 | ) | |||||||||||
Proceeds from issuance of long-term debt | 2,720.4 | 147,678.3 | 191,148.5 | 66,745.3 | ||||||||||||
Repayments of long-term debt | (1,981.6 | ) | (107,570.3 | ) | (88,878.7 | ) | (72,159.3 | ) | ||||||||
Debt issuance cost | (8.6 | ) | (464.3 | ) | (4,031.8 | ) | — | |||||||||
|
|
|
|
|
|
|
| |||||||||
Net cash provided by / (used in) financing activities | (356.5 | ) | (19,337.9 | ) | 28,982.7 | (42,999.2 | ) | |||||||||
|
|
|
|
|
|
|
| |||||||||
Net change in cash and cash equivalents | (598.9 | ) | (32,520.6 | ) | 43,865.9 | 23,988.8 | ||||||||||
Effect of foreign exchange on cash and cash equivalents | 49.4 | 2,686.7 | 11,415.6 | 3,219.2 | ||||||||||||
Cash and cash equivalents, beginning of the year | 2,688.5 | 145,952.4 | 90,670.9 | 63,462.9 | ||||||||||||
|
|
|
|
|
|
|
| |||||||||
Cash and cash equivalents, end of the year | US$ | 2,139.0 | Rs. | 116,118.5 | Rs | . 145,952.4 | Rs. | 90,670.9 | ||||||||
|
|
|
|
|
|
|
| |||||||||
Non-cash transactions: | ||||||||||||||||
Liability towards property, plant and equipment and intangible assets purchased on credit / deferred credit | US$ | 441.5 | Rs. | 23,964.5 | Rs. | 14,026.6 | Rs. | 12,734.8 | ||||||||
4% Foreign Currency Convertible Notes (USD) due 2014 and Zero coupon Convertible Alternative Reference Securities (USD) due 2012 (CARS) converted into 16,519,201 and 22,370 Ordinary Shares (face value of Rs.2) respectively during the year ended March 31, 2013 and 1% foreign currency convertible notes (USD) due 2011, 4% Foreign Currency Convertible Notes (USD) due 2014 and Zero coupon foreign currency convertible notes (JPY) due 2011 converted into 4,134,763, 19,423,734 and 11,929 Ordinary Shares (face value of Rs.10) respectively during the year ended March 31, 2011 | 93.2 | 5,058.6 | Rs. | — | Rs. | 28,230.2 | ||||||||||
See accompanying notes to consolidated financial statements
Tata Motors Limited and subsidiaries
Consolidated statements of changes in equity
For each of the years ended March 31, 2013, 20122015, 2014 and 20112013
| Other components of equity | Reserves* | |||||||||||||||||||||||||||||||||||||||||||||||||||||||
| Share capital | Additional paid-in capital | Currency translation reserve | Available- for -sale investments | Hedging Reserve | Capital redemption reserve | Debenture redemption reserve | Reserve for research and human resource development | Special reserve | Earned surplus reserve | Retained earnings | Equity attributable to shareholders of Tata Motors Limited | Non- controlling interests | Total equity | |||||||||||||||||||||||||||||||||||||||||||
| (In millions) | ||||||||||||||||||||||||||||||||||||||||||||||||||||||||
Balance as of April 1, 2012 | Rs. | 6,347.5 | Rs. | 173,946.6 | Rs. | 3,033.0 | Rs. | (26.7 | ) | Rs. | (1,695.3 | ) | Rs. | 22.8 | Rs. | 11,721.6 | Rs. | 1,644.3 | Rs. | 1,452.4 | Rs. | 140.0 | Rs. | 131,826.4 | Rs. | 328,412.6 | Rs. | 2,931.0 | Rs. | 331,343.6 | ||||||||||||||||||||||||||
Income for the year | 88,697.0 | 88,697.0 | 886.2 | 89,583.2 | ||||||||||||||||||||||||||||||||||||||||||||||||||||
Other comprehensive income /(loss) for the year | 787.6 | 347.0 | (15,106.0 | ) | (23,073.0 | ) | (37,044.4 | ) | 30.5 | (37,013.9 | ) | |||||||||||||||||||||||||||||||||||||||||||||
Shares issued upon conversion of Foreign Currency Convertible Notes (net of issue expenses of Rs.2.0 million) | 33.1 | 5,023.5 | 5,056.6 | 5,056.6 | ||||||||||||||||||||||||||||||||||||||||||||||||||||
Issue of shares held in abeyance | 0.1 | 1.6 | 1.7 | 1.7 | ||||||||||||||||||||||||||||||||||||||||||||||||||||
Shares issued to non-controlling interests | 5.1 | 5.1 | ||||||||||||||||||||||||||||||||||||||||||||||||||||||
Dividend paid (including dividend tax) | (14,855.0 | ) | (14,855.0 | ) | (215.6 | ) | (15,070.6 | ) | ||||||||||||||||||||||||||||||||||||||||||||||||
Transfer to special reserve | 631.4 | (631.4 | ) | — | — | |||||||||||||||||||||||||||||||||||||||||||||||||||
Transfer from debenture redemption reserve | (1,300.0 | ) | 1,300.0 | — | — | |||||||||||||||||||||||||||||||||||||||||||||||||||
|
|
|
|
|
|
|
|
|
|
|
|
|
|
|
|
|
|
|
|
|
|
|
|
|
|
|
| |||||||||||||||||||||||||||||
Balance as of March 31, 2013 | Rs. | 6,380.7 | Rs. | 178,971.7 | Rs. | 3,820.6 | Rs. | 320.3 | Rs. | (16,801.3 | ) | Rs. | 22.8 | Rs. | 10,421.6 | Rs. | 1,644.3 | Rs. | 2,083.8 | Rs. | 140.0 | Rs. | 183,264.0 | Rs. | 370,268.5 | Rs. | 3,637.2 | Rs. | 373,905.7 | |||||||||||||||||||||||||||
|
|
|
|
|
|
|
|
|
|
|
|
|
|
|
|
|
|
|
|
|
|
|
|
|
|
|
| |||||||||||||||||||||||||||||
| Rs. | (12,660.4 | ) | Rs. | 197,576.6 | ||||||||||||||||||||||||||||||||||||||||||||||||||||
|
|
|
|
|
|
|
|
|
|
|
|
|
|
|
|
|
|
|
|
|
|
|
|
|
|
|
| |||||||||||||||||||||||||||||
| US$ | 117.6 | US$ | 3,296.9 | US$ | 70.4 | US$ | 5.9 | US$ | (309.5 | ) | US$ | 0.4 | US$ | 191.9 | US$ | 30.3 | US$ | 38.4 | US$ | 2.6 | US$ | 3,376.0 | US$ | 6,820.9 | US$ | 67.0 | US$ | 6,887.9 | ||||||||||||||||||||||||||||
|
|
|
|
|
|
|
|
|
|
|
|
|
|
|
|
|
|
|
|
|
|
|
|
|
|
|
| |||||||||||||||||||||||||||||
| US$ | (233.2 | ) | US$ | 3,639.6 | ||||||||||||||||||||||||||||||||||||||||||||||||||||
|
|
|
| |||||||||||||||||||||||||||||||||||||||||||||||||||||
| Other components of equity | Reserves* | |||||||||||||||||||||||||||||||||||||||||||||||||||||||
| Share capital | Additional paid-in capital | Currency translation reserve | Available- for-sale invest- ments | Hedging Reserve | Capital redem- ption reserve | Debenture redemption reserve | Reserve for research and human resource develop- ment | Special reserve | Earned surplus reserve | Retained earnings | Equity attribu- table to share- holders of Tata Motors Limited | Non- controlling interests | Total equity | |||||||||||||||||||||||||||||||||||||||||||
| (In millions) | ||||||||||||||||||||||||||||||||||||||||||||||||||||||||
Balance as at April 1, 2014 | Rs. | 6,437.8 | Rs. | 187,341.3 | Rs. | 70,610.8 | Rs. | 800.2 | Rs. | 54,198.2 | Rs. | 22.8 | Rs. | 10,421.6 | Rs. | 1,644.3 | Rs. | 2,301.7 | Rs. | 140.0 | Rs. | 293,559.0 | Rs. | 627,477.7 | Rs. | 4,218.6 | Rs. | 631,696.3 | ||||||||||||||||||||||||||||
Income for the year | 128,291.2 | 128,291.2 | 791.2 | 129,082.4 | ||||||||||||||||||||||||||||||||||||||||||||||||||||
Other comprehensive income/(loss) for the year | (41,722.9 | ) | (519.6 | ) | (142,801.4 | ) | (28,977.9 | ) | (214,021.8 | ) | (197.8 | ) | (214,219.6 | ) | ||||||||||||||||||||||||||||||||||||||||||
|
|
|
|
|
|
|
|
|
|
|
|
|
|
|
|
|
|
|
|
|
|
|
|
|
|
|
| |||||||||||||||||||||||||||||
Total comprehensive income/(loss) for the year | — | — | (41,722.9 | ) | (519.6 | ) | (142,801.4 | ) | — | — | — | — | — | 99,313.3 | (85,730.6 | ) | 593.4 | (85,137.2 | ) | |||||||||||||||||||||||||||||||||||||
|
|
|
|
|
|
|
|
|
|
|
|
|
|
|
|
|
|
|
|
|
|
|
|
|
|
|
| |||||||||||||||||||||||||||||
Dividend paid (including dividend tax) | (6,744.2 | ) | (6,744.2 | ) | (463.1 | ) | (7,207.3 | ) | ||||||||||||||||||||||||||||||||||||||||||||||||
Transfer to special reserve | 394.1 | (394.1 | ) | — | — | |||||||||||||||||||||||||||||||||||||||||||||||||||
Changes in ownership interests in subsidiaries that do not result in a loss of control | (61.2 | ) | (61.2 | ) | 61.2 | — | ||||||||||||||||||||||||||||||||||||||||||||||||||
|
|
|
|
|
|
|
|
|
|
|
|
|
|
|
|
|
|
|
|
|
|
|
|
|
|
|
| |||||||||||||||||||||||||||||
Balance as at March 31, 2015 | Rs. | 6,437.8 | Rs. | 187,280.1 | Rs. | 28,887.9 | Rs. | 280.6 | Rs. | (88,603.2 | ) | Rs. | 22.8 | Rs. | 10,421.6 | Rs. | 1,644.3 | Rs. | 2,695.8 | Rs. | 140.0 | Rs. | 385,734.0 | Rs. | 534,941.7 | Rs. | 4,410.1 | Rs. | 539,351.8 | |||||||||||||||||||||||||||
|
|
|
|
|
|
|
|
|
|
|
|
|
|
|
|
|
|
|
|
|
|
|
|
|
|
|
| |||||||||||||||||||||||||||||
| Rs. | (59,434.7 | ) | Rs. | 400,658.5 | ||||||||||||||||||||||||||||||||||||||||||||||||||||
|
|
|
|
|
|
|
|
|
|
|
|
|
|
|
|
|
|
|
|
|
|
|
|
|
|
|
| |||||||||||||||||||||||||||||
| US$ | 103.0 | US$ | 2,996.5 | US$ | 462.2 | US$ | 4.5 | US$ | (1,417.7 | ) | US$ | 0.4 | US$ | 166.7 | US$ | 26.3 | US$ | 43.2 | US$ | 2.2 | US$ | 6,171.7 | US$ | 8,559.0 | US$ | 70.6 | US$ | 8,629.6 | ||||||||||||||||||||||||||||
|
|
|
|
|
|
|
|
|
|
|
|
|
|
|
|
|
|
|
|
|
|
|
|
|
|
|
| |||||||||||||||||||||||||||||
| US$ | (951.0 | ) | US$ | 6,410.5 | ||||||||||||||||||||||||||||||||||||||||||||||||||||
|
|
|
| |||||||||||||||||||||||||||||||||||||||||||||||||||||
| * | Refer to note 27 |
See accompanying notes to consolidated financial statements
Balance as of April 1, 2011 Income for the year Other comprehensive income /(loss) for the year (net of tax) Issue of shares held in abeyance Dividend paid (including dividend tax) Transfer to debenture redemption reserve Transfer to earned surplus reserve Transfer to special reserve Transfer to reserve for human resource development Changes in ownership interests in subsidiaries that do not result in a loss of control Balance as of March 31, 2012 Balance as at April 1, 2013 Income for the year Other comprehensive income/(loss) for the year Total comprehensive income for the year Shares issued upon conversion of foreign currency convertible notes (net of issue expenses of Rs. 3.5 million) Issue of shares held in abeyance Dividend paid (including dividend tax) Transfer to special reserve Changes in ownership interests in subsidiaries that do not result in a loss of control Balance as at March 31, 2014 Other components of equity Reserves* Share
capital Additional
paid-in
capital Currency
translation
reserve Available-
for -sale
investments Hedging
Reserve Capital
redemption
reserve Debenture
redemption
reserve Reserve
for
research
and
human
resource
development Special
reserve Earned
surplus
reserve Retained
earnings Equity
attributable
to
shareholders
of
Tata
Motors
Limited Non-
controlling
interests Total
equity (In millions) Rs. 6,346.5 Rs. 175,484.7 Rs. (20,399.1 ) Rs. 772.0 Rs. 1,528.7 Rs. 22.8 Rs. 11,021.6 Rs. 1,510.2 Rs. 959.5 Rs. 113.2 Rs. 31,508.9 Rs. 208,869.0 Rs. 2,390.3 Rs. 211,259.3 115,659.1 115,659.1 781.3 116,440.4 �� 23,432.1 (798.7 ) (3,224.0 ) 682.7 20,092.1 95.8 20,187.9 1.0 29.8 30.8 30.8 (14,670.5 ) (14,670.5 ) (245.5 ) (14,916.0 ) 700.0 (700.0 ) — — 26.8 (26.8 ) — — 492.9 (492.9 ) — — 134.1 (134.1 ) — — (1,567.9 ) (1,567.9 ) (90.9 ) (1,658.8 ) Rs. 6,347.5 Rs. 173,946.6 Rs. 3,033.0 Rs. (26.7 ) Rs. (1,695.3 ) Rs. 22.8 Rs. 11,721.6 Rs. 1,644.3 Rs. 1,452.4 Rs. 140.0 Rs. 131,826.4 Rs. 328,412.6 Rs. 2,931.0 Rs. 331,343.6 Rs. 1,311.0 Rs. 146,807.5 Other components of equity Reserves* Share
capital Additional
paid-in
capital Currency
translation
reserve Available-
for-sale
investments Hedging
Reserve Capital
redemption
reserve Debenture
redemption
reserve Reserve
for
research
and
human
resource
development Special
reserve Earned
surplus
reserve Retained
earnings Equity
attributable
to
shareholders
of
Tata
Motors
Limited Non-
controlling
interests Total
equity (In millions) Rs. 6,380.7 Rs. 178,971.7 Rs. 3,820.6 Rs. 320.3 Rs. (16,801.3 ) Rs. 22.8 Rs. 10,421.6 Rs. 1,644.3 Rs. 2,083.8 Rs. 140.0 Rs. 183,264.0 Rs. 370,268.5 Rs. 3,637.2 Rs. 373,905.7 130,717.1 130,717.1 461.5 131,178.6 66,790.2 479.9 70,999.5 (13,381.6 ) 124,888.0 294.4 125,182.4 — — 66,790.2 479.9 70,999.5 — — — — — 117,335.5 255,605.1 755.9 256,361.0 57.1 8,584.3 8,641.4 8,641.4 — 0.9 0.9 0.9 (6,822.6 ) (6,822.6 ) (390.1 ) (7,212.7 ) 217.9 (217.9 ) — — (215.6 ) — — (215.6 ) 215.6 — Rs. 6,437.8 Rs. 187,341.3 Rs. 70,610.8 Rs. 800.2 Rs. 54,198.2 Rs. 22.8 Rs. 10,421.6 Rs. 1,644.3 Rs. 2,301.7 Rs. 140.0 Rs. 293,559.0 Rs. 627,477.7 Rs. 4,218.6 Rs. 631,696.3 Rs. 125,609.2 Rs. 308,089.4
| * | Refer to note 27 |
See accompanying notes to consolidated financial statements
Balance as of April 1, 2010 Income for the year Other comprehensive income /(loss) for the year (net of tax) Shares issued upon conversion of Foreign Currency Convertible Notes (net of issue expenses of Rs. 18.7 million) Issue of shares (net of issue expenses of Rs. 1,012.1 million) Shares issued to non –controlling interests Dividend paid (including dividend tax) Transfer to earned surplus reserve Transfer to special reserve Transfer to reserve for human resource development Non- controlling interest arising due to business combination Changes in ownership interests in subsidiaries that do not result in a loss of control Balance as of March 31, 2011 Balance as at April 1, 2012 Income for the year Other comprehensive income/(loss) for the year Total comprehensive income for the year Shares issued upon conversion of foreign currency convertible notes (net of issue expenses of Rs. 2.0 million) Issue of shares held in abeyance Shares issued to non-controlling interests Dividend paid (including dividend tax) Transfer to special reserve Transfer from debenture redemption reserve Balance as at March 31, 2013 Other components of equity Reserves* Share
capital Additional
paid-in
capital Currency
translation
reserve Available-
for -sale
investments Hedging
Reserve Capital
redemption
reserve Debenture
redemption
reserve Reserve
for
research
and
human
resource
development Special
reserve Earned
surplus
reserve Retained
earnings Equity
attributable
to
shareholders
of
Tata
Motors
Limited Non-
controlling
interests Total
equity (In millions) Rs. 5,706.0 Rs. 115,496.7 Rs. (25,982.3) Rs. 733.5 Rs. — Rs. 22.8 Rs. 11,021.6 Rs. 948.3 Rs. 691.5 Rs. 101.1 Rs. (8,561.5) Rs. 100,177.7 Rs. 2,045.1 Rs. 102,222.8 73,401.8 73,401.8 346.9 73,748.7 5,583.2 38.5 1,528.7 (22,436.7 ) (15,286.3 ) 38.4 (15,247.9 ) 235.7 27,975.8 28,211.5 28,211.5 404.8 32,093.1 32,497.9 32,497.9 57.6 57.6 (10,052.7 ) (10,052.7 ) (187.7 ) (10,240.4 ) 12.1 (12.1 ) — — 268.0 (268.0 ) — — 561.9 (561.9 ) — — — 9.1 9.1 (80.9 ) (80.9 ) 80.9 — Rs. 6,346.5 Rs. 175,484.7 Rs. (20,399.1) Rs. 772.0. Rs. 1,528.7 Rs. 22.8 Rs. 11,021.6 Rs. 1,510.2 Rs. 959.5 Rs. 113.2 Rs. 31,508.9 Rs. 208,869.0 Rs. 2,390.3 Rs. 211,259.3 Rs. (18,098.4) Rs. 45,136.2 Other components of equity Reserves* Share
capital Additional
paid-in
capital Currency
translation
reserve Available-
for-sale
investments Hedging
Reserve Capital
redemption
reserve Debenture
redemption
reserve Reserve
for
research
and
human
resource
development Special
reserve Earned
surplus
reserve Retained
earnings Equity
attributable
to
shareholders
of
Tata
Motors
Limited Non-
controlling
interests Total
equity (In millions) Rs. 6,347.5 Rs. 173,946.6 Rs. 3,033.0 Rs. (26.7 ) Rs. (1,695.3 ) Rs. 22.8 Rs. 11,721.6 Rs. 1,644.3 Rs. 1,452.4 Rs. 140.0 Rs. 131,826.4 Rs. 328,412.6 Rs. 2,931.0 Rs. 331,343.6 88,670.5 88,670.5 886.2 89,556.7 787.6 347.0 (15,106.0 ) (23,046.5 ) (37,017.9 ) 30.5 (36,987.4 ) — — 787.6 347.0 (15,106.0 ) — — — — — 65,624.0 51,652.6 916.7 52,569.3 33.1 5,023.5 5,056.6 5,056.6 0.1 1.6 1.7 1.7 — 5.1 5.1 (14,855.0 ) (14,855.0 ) (215.6 ) (15,070.6 ) 631.4 (631.4 ) — — (1,300.0 ) 1,300.0 — — Rs. 6,380.7 Rs. 178,971.7 Rs. 3,820.6 Rs. 320.3 Rs. (16,801.3 ) Rs. 22.8 Rs. 10,421.6 Rs. 1,644.3 Rs. 2,083.8 Rs. 140.0 Rs. 183,264.0 Rs. 370,268.5 Rs. 3,637.2 Rs. 373,905.7 Rs. (12,660.4 ) Rs. 197,576.5
| * | Refer to note 27 |
See accompanying notes to consolidated financial statements
Tata Motors Limited and subsidiaries
Notes to Consolidated Financial Statements
| 1. | Background and operations |
Tata Motors Limited and its subsidiaries, collectively referred to as (“the Company” or “Tata Motors”), designs, manufactures and sells a wide range of automotive vehicles. The Company provides financing for the vehicles sold by dealers of the Company in certain markets. The Company also manufactures engines for industrial and marine applications, aggregates such as axles and transmissions for commercial vehicles and factory automation equipment, and provides information technology services.
Tata Motors Limited is a public limited company incorporated and domiciled in India and has its registered office at Mumbai, Maharashtra, India.
The consolidated financial statements were approved by the Board of Directors and authorised for issue on August 2, 2013.
The Company’s subsidiaries includes the Jaguar Land Rover business (referred to as JLR) which has three manufacturing facilities and two advanced engineering centres in the UK and a world wide sales network.JLR or Jaguar Land Rover).
As on March 31, 2013,2015, Tata Sons Limited (or Tata Sons), together with its subsidiaries, owns 28.96%28.64% of the ordinaryOrdinary shares and 0.87%0.50% of ‘A’ ordinaryOrdinary shares of Tata Motors Limited, and has the ability to significantly influence the Company’s operations (refer note 25 for voting rights relating to ordinaryOrdinary shares and ‘A’ ordinaryOrdinary shares).
The consolidated financial statements were approved by the Board of Directors and authorised for issue on July 30, 2015.
| 2. | Significant accounting policies |
| a. | Statement of compliance |
These consolidated financial statements have been prepared in accordance with International Financial Reporting Standards (referred to as “IFRS”) as issued by the International Accounting Standards Board (referred to as “IASB”).
| b. | Basis of preparation |
The consolidated financial statements have been prepared on historical cost basis except for certain financial instruments measured at fair value.
| c. | Basis of consolidation |
Subsidiaries
The consolidated financial statements include Tata Motors Limited and its subsidiaries. Subsidiaries are entities controlled by the Company. Control exists when the Company (a) has power over the investee, (b) it is exposed, or has rights, to variable returns from its involvement with the investee and (c) has the ability to affect those returns through its power over the investee. The Company reassess whether or not it controls an investee if facts and circumstances indicate that there are changes to governone or more of the financial and operating policies of an entity so as to obtain benefits from its activities.three elements listed above. In assessing control, potential voting rights that currently are exercisable are taken into account. The results of subsidiaries acquired or disposed of during the year are included in the consolidated financial statements from the effective date of acquisition and up to the effective date of disposal, as appropriate.
Inter-company transactions and balances including unrealized profits are eliminated in full on consolidation.
Non-controlling interests in the net assets (excluding goodwill) of consolidated subsidiaries are identified separately from the Company’s equity. The interest of non-controlling shareholders may be initially measured either at fair value or at the non-controlling interests’ proportionate share of the fair value of the acquiree’s identifiable net assets. The choice of measurement basis is made on an acquisition –by- acquisitionacquisition-by-acquisition basis. Subsequent to acquisition, the carrying amount of non-controlling interests is the amount of those interests at initial recognition plus the non-controlling interests’ share of subsequent changes in equity. Total comprehensive income is attributed to non-controlling interests even if it results in the non-controlling interest having a deficit balance.
Changes in the Company’s interests in subsidiaries that do not result in a loss of control are accounted for as equity transactions. The carrying amount of the Company’s interests and the non-controlling interests are adjusted to reflect the changes in their relative interests in the subsidiaries. Any difference between the amount by which the non-controlling interests are adjusted and the fair value of the consideration paid or received is recognized directly in equity and attributed to owners of the Company.
When the Company loses control of a subsidiary, the profit or loss on disposal is calculated as the difference between (i) the aggregate of the fair value of consideration received and the fair value of any retained interest and (ii) the previous carrying amount of the assets (including goodwill), and liabilities of the subsidiary and any non-controlling interests. Amounts previously recognized in other comprehensive income in relation to the subsidiary are accounted for (i.e., reclassified to profit or loss or transferred directly to retained earnings)loss) in the same manner as would be required if the relevant assets or liabilities were disposed of.off. The fair value of any investment retained in the former subsidiary at the date when control is lost is regarded as the fair value on initial recognition for subsequent accounting under IAS 39Financial Instruments: Recognition and Measurementor, when applicable, the cost on initial recognition of an investment in an associate or jointly controlled entity.
AssociatesInterests in joint arrangements
A joint arrangement is an arrangement of which two or more parties have joint control. Joint control is the contractually agreed sharing of control of an arrangement, which exists only when decisions about the relevant activities require the unanimous consent of the parties sharing control.
Joint operations
Certain of the Company’s activities, are conducted through joint operations, which are joint arrangements whereby the parties that have joint control of the arrangement have rights to the assets, and obligations for the liabilities, relating to the arrangement. The Company recognizes, in the consolidated financial statements, its share of the assets, liabilities, income and expenses of these joint operations incurred jointly controlled entities (equity accounted investees)with the other partners, along with its share of income from the sale of the output and any liabilities and expenses that it has incurred in relation to the joint operation.
Joint ventures
A joint venture is a joint arrangement whereby the parties that have joint control of the arrangement have rights to the net assets of the arrangement. The results, assets and liabilities of a joint venture are incorporated in these financial statements using the equity method of accounting as described below.
Associates
Associates are those entities in which the Company has significant influence. Significant influence is the power to participate in the financial and operating policy decisions of the investee but not control over the financial and operatingor joint control those policies. Significant influence is presumed to exist when the Company holds between 20 and 50 percent of the voting power of another entity. Jointly controlled entitiesThe results, assets and liabilities of associates are those entities over whose activitiesincorporated in these financial statements using the Company hasequity method of accounting as described below.
Equity method of accounting (equity accounted investees)
An interest in an associate or joint control, established by contractual agreement and requiring unanimous consent for strategic financial and operating decisions.
Equity accounted investees areventure is accounted for using the equity method from the date in which the investee becomes an associate or a joint venture and are recognized initially at cost. The Company’s investment includes goodwill identified on acquisition, net of any accumulated impairment losses. The consolidated financial statements include the Company’s share of profits or losses and equity movements of equity accounted investees, from the date that significant influence or joint control commences until the date that significant influence or joint control ceases. When the Company’s share of losses exceeds its interest in an equity accounted investee, the carrying amount of that interest (including any long-term investments in the nature of net investments) is reduced to nil and the recognition of further losses is discontinued except to the extent that the Company has an obligation or has made payments on behalf of the investee.
When the Company transacts with an associate or jointly controlled entityjoint venture of the Company, unrealized profits and losses are eliminated to the extent of the Company’s interest in its associate or jointly controlled entity.joint venture.
| d. | Business combination |
Acquisitions of subsidiaries and businesses are accounted for using the acquisition method. Acquisition related costs are recognized in profit or loss as incurred. The acquiree’s identifiable assets, liabilities and contingent liabilities that meet the conditions for recognition are recognized at their fair value at the acquisition date, except certain assets and liabilities required to be measured as per the applicable standard.
Purchase consideration in excess of the Company’s interest in the acquiree’s net fair value of identifiable assets, liabilities and contingent liabilities is recognized as goodwill. Excess of the Company’s interest in the net fair value of the acquiree’s identifiable assets, liabilities and contingent liabilities over the purchase consideration is recognized, after reassessment of fair value of net assets acquired, in the income statement.
| e. | Use of estimates and judgments |
The preparation of financial statements in conformity with IFRS requires management to make judgments, estimates and assumptions, that affect the application of accounting policies and the reported amounts of assets, liabilities, income, expenses and disclosures of contingent assets and liabilities at the date of these financial statements and the reported amounts of revenues and expenses for the years presented. Actual results may differ from these estimates.
Estimates and underlying assumptions are reviewed at each balance sheet date. Revisions to accounting estimates are recognised in the period in which the estimate is revised and future periods affected.
In particular, information about significant areas of estimation uncertainty and critical judgments in applying accounting policies that have the most significant effect on the amounts recognized in the financial statements are included in the following notes:
| i) | Note |
As described in Note 11(3), the Company reasonably expects that the outcome of any legal proceeding in the Supreme Court of India, in respect of decision by the High Court of Calcutta, relating to the cancellation of the lease land will be upheld in the Company’s favor.
| ii) | Note |
| iii) | Note |
| iv) | Note |
| v) | Note |
| vi) | Note |
| vii) | Note 32 – Assets and obligations relating to employee benefits |
| f. | Revenue recognition |
Revenue is measured at fair value of consideration received or receivable.
i.i) Sale of products
The Company recognizes revenues on the sale of products, net of discounts, sales incentives, customer bonuses and rebates granted, when products are delivered to dealers or when delivered to a carrier for export sales, which is when title and risks and rewards of ownership pass to the customer. Sale of products includes export and other recurring and non-recurring incentives from Governmentsgovernments (referred to as “incentives”). Sale of products is presented net of excise duty where applicable and other indirect taxes.
Revenues are recognized when collectability of the resulting receivable is reasonably assured.
If the sale of products includes a determinable amount for subsequent services (multiple component contracts) the related revenues are deferred and recognized as income over the relevant service period. Amounts are normally recognized as income by reference to the pattern of related expenditure.
Incentives are recognized when there is reasonable assurance that the Company will comply with the conditions and the incentive will be received. Incentives are recorded at fair value where applicable. Revenues include incentives of Rs. 8,361.123,263.1 million, Rs. 4,402.522,575.8 million and Rs. 8,112.89,986.1 million for the years ended March 31, 2015, March 31, 2014 and March 31, 2013, respectively.
During the years ended March 31, 2015 and 2014, Rs. 13,054.3 million and Rs. 8,751.7 million, respectively, were received by a foreign subsidiary as an indirect tax incentive that requires the subsidiary to meet certain criteria relating to vehicle efficiency and investment in engineering and research and development. The incentive is provided as a partial off set to the higher sales tax payable following implementation of new legislation. Rs. 13,054.3 million and Rs. 8,463.2 million (included above) for the years ended March 31, 2015 and 2014, respectively, have been recognized in revenue and Rs. 288.5 million for the year ended March 31, 2013, March 31, 2012 and March 31, 2011, respectively.2014 has been deferred to off set against capital expenditure, when incurred.
ii.ii) Finance revenues
Finance and service charges are accrued on the unpaid principal balance of finance receivables using the effective interest method.
| g. | Cost recognition |
Costs and expenses are recognized when incurred and are classified according to their nature.
Expenditure capitalized represents employee costs, stores and other manufacturing supplies, and other expenses incurred for construction including product development undertaken by the Company.
| h. | Provisions |
A provision is recognized if, as a result of a past event, the Company has a present legal or constructive obligation that can be estimated reliably, and it is probable that an outflow of economic benefits will be required to settle the obligation. Provisions are determined by discounting the expected future cash flows at a pre-tax rate that reflects current market assessments of the time value of money and the risks specific to the liability.
i) Product warranty expenses
The estimated liability for product warranties is recorded when products are sold. These estimates are established using historical information on the nature, frequency and average cost of warranty claims and management estimates regarding possible future incidences based on actions on product failures. The timing of outflows will vary as and when warranty claim will arise, being typically up to fourfive years.
ii) Residual risk
In certain markets, the Company is responsible for the residual risk arising on vehicles sold by dealers under leasing arrangements. The provision is based on the latest available market expectations of future residual value trends. The timing of the outflows will be at the end of the lease arrangements – being typically up to three years.
| i. | Foreign currency |
These consolidated financial statements are presented in Indian Rupees,rupees, which is the functional currency of Tata Motors Limited.
Transactions in foreign currencies are recorded at the exchange rate prevailing on the date of transaction. Foreign currency denominated monetary assets and liabilities are remeasuredre-measured into the functional currency at the exchange rate prevailing on the balance sheet date. Exchange differences are recognized in the income statement except to the extent, exchange differences which are regarded as an adjustment to interest costs on foreign currency borrowings, are capitalized as part of borrowing costs.
For the purpose of consolidation, the assets and liabilities of the Company’s foreign operations are translated to Indian Rupeerupees at the exchange rate prevailing on the balance sheet date, and the income and expenses at the average rate of exchange for the respective month.months. Exchange differences arising are recognized as currency translation reserve under equity.
| j. | Income taxes |
Income tax expense comprises current and deferred taxes. Income tax expense is recognized in the income statement except when they relate to items that are recognized outside profit or loss (whether in other comprehensive income or directly in equity), in which case tax is also recognized outside profit or loss, or where they arise from the initial accounting for business combination. In the case of a business combination the tax effect is included in the accounting for the business combination.
Current income taxes are determined based on respective taxable income of each taxable entity and tax rules applicable for respective tax jurisdictions.
Deferred tax assets and liabilities are recognized for the future tax consequences of temporary differences between the carrying values of assets and liabilities and their respective tax bases, and unutilized business loss and depreciation carry-forwards and tax credits. Such deferred tax assets and liabilities are computed separately for each taxable entity and for each taxable jurisdiction. Deferred tax assets are recognized to the extent that it is probable that future taxable income will be available against which the deductible temporary differences, unused tax losses, depreciation carry-forwards and unused tax credits could be utilized.
Deferred tax assets and liabilities are measured based on the tax rates that are expected to apply in the period when the asset is realized or the liability is settled, based on tax rates and tax laws that have been enacted or substantively enacted by the balance sheet date.
Deferred tax assets and liabilities are offset when there is a legally enforceable right to set off current tax assets against current tax liabilities and when they relate to income taxes levied by the same taxation authority and the Company intends to settle its current tax assets and liabilities on a net basis.
| k. | Earnings per share |
Basic earnings per share has been computed by dividing net income by the weighted average number of shares outstanding during the year. Partly paid up shares are included as fully paid equivalents according to the fraction paid up. Diluted earnings per share has been computed using the weighted average number of shares and dilutive potential shares, except where the result would be antidilutive.anti-dilutive.
| l. | Inventories |
Inventories (other than those recognized consequent to the sale of vehicles subject to repurchase arrangements) are valued at the lower of cost and net realizable value. Cost of raw materials, components and consumables are ascertained on a first in first out basis. Cost, including fixed and variable production overheads, are allocated to work-in-progress and finished goods determined on a full absorption cost basis. Net realizable value is the estimated selling price in the ordinary course of business less estimated cost of completion and selling expenses.
Inventories include vehicles sold subject to repurchase arrangements. These vehicles are carried at cost to the Company and are amortized in changes in inventories of finished goods to their residual values (i.e., estimated second hand sale value) over the term of the arrangement.
| m. | Property, plant and equipment |
Property, plant and equipment are stated at cost of acquisition or construction less accumulated depreciation less accumulated impairment, if any.
Freehold land is measured at cost and is not depreciated.
Heritage assets, comprising antique vehicles purchased by the Company, are not depreciated as they are considered to have a residual value in excess of cost. Residual values are re-assessed on an annual basis.
Cost includes purchase price, taxes and duties, labor cost and direct overheads for self constructedself-constructed assets and other direct costs incurred up to the date the asset is ready for its intended use.
Interest cost incurred for constructed assets is capitalized up to the date the asset is ready for its intended use, based on borrowings incurred specifically for financing the asset or the weighted average rate of all other borrowings, if no specific borrowings have been incurred for the asset.
Depreciation is provided on a straight-line basis over estimated useful lives of the assets. Estimated useful lives of the assets are as follows:
| Estimated useful life (years) | ||
Buildings | 20 to 40 | |
Plant and equipment | 3 to 30 | |
Computers | 3 to 6 | |
Vehicles | 3 to 10 | |
Furniture and fixtures | 3 to 20 |
Assets held under finance leases are depreciated over their expected useful lives on the same basis as owned assets or, where shorter, the term of the relevant lease.
Depreciation is not recorded on capital work-in-progress until construction and installation are complete and the asset is ready for its intended use. Capital-work-in-progress includes capital advances.
| n. | Intangible assets |
Intangible assets purchased, including those acquired in business combination,combinations, are measured at cost or fair value as of the date of acquisition where applicable less accumulated amortization and accumulated impairment, if any. Intangible assets with indefinite lives are reviewed annually to determine whether indefinite-life assessment continues to be supportable. If not, the change in the useful-life assessment from indefinite to finite is made on a prospective basis.
Amortization is provided on a straight-line basis over estimated useful lives of the intangible assets as per details below
| Estimated amortization period | ||
Patents and technological know-how | 2 to 12 years | |
Dealer network | 20 years | |
Intellectual property rights | 7 to 9 years | |
Software | 2 to 8 years |
The amortization period for intangible assets with finite useful lives is reviewed at least at each year-end. Changes in expected useful lives are treated as changes in accounting estimates.
Capital work-in-progress includes capital advances.
Customer related intangible assets consists of the Company’s dealer network.
Internally generated intangible asset
Research costs are charged to the income statement in the year in which they are incurred.
Product development costs incurred on new vehicle platform, engines, transmission and new products are recognized as intangible assets, when feasibility has been established, the Company has committed technical, financial and other resources to complete the development and it is probable that asset will generate probable future economic benefits.
The costs capitalized include the cost of materials, direct labor and directly attributable overhead expenditure incurred up to the date the asset is available for use.
Interest cost incurred is capitalized up to the date the asset is ready for its intended use, based on borrowings incurred specifically for financing the asset or the weighted average rate of all other borrowings if no specific borrowings have been incurred for the asset.
Product development cost is amortized over a period of 24 months to 120 months or on the basis of actual production toor planned production volume over such period.
Capitalized development expenditure is measured at cost less accumulated amortization and accumulated impairment, if any.
| o. | Leases |
At the inception of a lease, the lease arrangement is classified as either a finance lease or an operating lease, based on the substance of the lease arrangement.
Assets taken on finance lease
A finance lease is recognized as an asset and a liability at the commencement of the lease, at the lower of the fair value of the asset and the present value of the minimum lease payments. Initial direct costs, if any, are also capitalized and, subsequent to initial recognition, the asset is accounted for in accordance with the accounting policy applicable to that asset. Minimum lease payments made under finance leases are apportioned between the finance expense and the reduction of the outstanding liability. The finance expense is allocated to each period during the lease term so as to produce a constant periodic rate of interest on the remaining balance of the liability.
Assets taken on operating lease
Leases other than finance leases are operating leases, and the leased assets are not recognized on the Company’s balance sheet. Payments made under operating leases are recognized in the income statement on a straight-line basis over the term of the lease.
| p. | Impairment |
| i) | Goodwill |
Cash generating unitunits to which goodwill is allocated are tested for impairment annually at each balance sheet date, or more frequently when there is an indication that the unit may be impaired. If the recoverable amount of the cash generating unit is less than the carrying amount of the unit, the impairment loss is allocated first to reduce the carrying amount of any goodwill allocated to that unit and then to the other assets of the unit pro rata on the basis of carrying amount of each asset in the unit. Goodwill impairment loss recognized is not reversed in subsequent period.
| ii) | Property, plant and equipment and other intangible assets |
At each balance sheet date, the Company assesses whether there is any indication that any property, plant and equipment and intangible assets with finite lives may be impaired. If any such impairment exists the recoverable amount of an asset is estimated to determine the extent of impairment, if any. Where it is not possible to estimate the recoverable amount of an individual asset, the Company estimates the recoverable amount of the cash-generating unit to which the asset belongs.
Intangible assets with indefinite useful lives and intangible assets not yet available for use, are tested for impairment annually at each balance sheet date, or earlier, if there is an indication that the asset may be impaired.
Recoverable amount is the higher of fair value less costs to sell and value in use. In assessing value in use, the estimated future cash flows are discounted to their present value using a pre-tax discount rate that reflects current market assessments of the time value of money and the risks specific to the asset for which the estimates of future cash flows have not been adjusted.
If the recoverable amount of an asset (or cash-generating unit) is estimated to be less than its carrying amount, the carrying amount of the asset (or cash-generating unit) is reduced to its recoverable amount. An impairment loss is recognized immediately in the income statement.
As ofat March 31, 20132015 and 2012,2014, none of the Company’s property, plant and equipment and intangible assets were considered impaired.
| q. | Employee benefits |
| i) | Pension plans |
The Jaguar Land Rover subsidiaries operate several defined benefit pension plans, which are contracted out of the second state pension scheme. The assets of the plan are held in separate trustee administered funds. The plans provide for monthly pension after retirement as per salary drawn and service period as set out in rules of each fund.
Contributions to the plans by the subsidiary group take into consideration the results of actuarial valuations. The plans with a surplus position at the year endyear-end have been limited to the maximum economic benefit available from unconditional rights to refund from the scheme or reduction in future contributions. Where the subsidiary group is considered to have a contractual obligation to fund the pension plan above the accounting value of the liabilities, an onerous obligation is recognized.
A separate defined contribution plan is available to employees of a major subsidiary group, Jaguar Land Rover. Costs in respect of this plan are charged to the income statement as incurred.
| ii) | Gratuity |
Tata Motors Limited and its subsidiaries in India have an obligation towards gratuity, a defined benefit retirement plan covering eligible employees. The plan provides for a lump sumlump-sum payment to vested employees at retirement, death while in employment or on termination of employment of an amount equivalent to 15 to 30 days salary payable for each completed year of service. Vesting occurs upon completion of five years of service. Tata Motors Limited and such subsidiaries make annual contributions to gratuity funds established as trusts or insurance companies. Tata Motors Limited and its subsidiaries in India account for the liability for gratuity benefits payable in the future based on an actuarial valuation.
| iii) | Superannuation |
Tata Motors Limited and some of its subsidiaries in India have two superannuation plans, a defined benefit plan and a defined contribution plan. An eligible employee on April 1, 1996 could elect to be a member of either plan.
Employees who are members of the defined benefit superannuation plan are entitled to benefits depending on the years of service and salary drawn. The monthly pension benefits after retirement range from 0.75% to 2% of the annual basic salary for each year of service. Tata Motors Limited and such subsidiaries account for superannuation benefits payable in future under the plan based on an actuarial valuation.
With effect from April 1, 2003, this plan was amended and benefits earned by covered employees have been protected as at March 31, 2003. Employees covered by this plan are prospectively entitled to benefits computed on a basis that ensures that the annual cost of providing the pension benefits would not exceed 15% of salary.
During the year ended March 31, 2015, the employees covered by this plan were given a one-time option to exit from the plan prospectively. Furthermore, the employees who opted for exit were given one- time option to withdraw accumulated balances from the superannuation plan.
Separate irrevocable trusts are maintained for employees covered and entitled to benefits. Tata Motors Limited and its subsidiaries contribute up to 15% or Rs.100,000, whichever is lower, of the eligible employees’ salary to the trust every year. Such contributions are recognized as an expense when incurred. Tata Motors Limited and such subsidiaries have no further obligation beyond this contribution.
| iv) | Bhavishya |
Bhavishya Kalyan Yojana is an unfunded defined benefit plan for employees of Tata Motors Limited and some of its subsidiaries. The benefits of the plan include pension in certain cases, payable uptoup to the date of normal superannuation had the employee been in service, to an eligible employee at the time of death or permanent disablement, while in service, either as a result of an injury or as certified by the appropriate authority. The monthly payment to dependents of the deceased/disabled employee under the plan equals 50% of the salary drawn at the time of death or accident or a specified amount, whichever is higher.greater. Tata Motors Limited and these subsidiaries account for the liability for BKY benefits payable in the future based on an actuarial valuation.
| v) | Provident fund and family pension |
In accordance with Indian law, eligible employees of Tata Motors Limited and some of its subsidiaries are entitled to receive benefits in respect of provident fund, a defined contribution plan, in which both employees and the Company make monthly contributions at a specified percentage of the covered employees’ salary (currently 12% of employees’ salary). The contributions, as specified under the law, are made to the provident fund and pension fund set up as an irrevocable trust by Tata Motors Limited and its subsidiaries or to respective Regional Provident Fund Commissioner and the Central Provident Fund under the State Pension scheme.
| vi) | Severance indemnity |
Tata Daewoo Commercial Vehicle Company Limited, (TDCV),or TDCV, a subsidiary company incorporated in KoreaKorea; has an obligation towards severance indemnity, a defined benefit retirement plan, covering eligible employees. The plan provides for a lump sum payment to all employees with more than one year of employment equivalent to 30 days’ salary payable for each completed year of service.
| vii) | Post-retirement medicare scheme |
Under this unfunded scheme, employees of Tata Motors Limited and some of its subsidiaries receive medical benefits subject to certain limits on amounts of amount,benefits, periods after retirement and types of benefits, depending on their grade and location at the time of retirement. Employees separated from the Company as part of an Early Separation Scheme, on medical grounds or due to permanent disablement are also covered under the scheme. Tata Motors Limited and such subsidiaries account for the liability for post-retirement medical scheme based on an actuarial valuation.
Actuarial
| viii) | Remeasurement gains and losses |
Remeasurement comprising actuarial gains and losses,
Actuarial gains the effect of the asset ceiling and lossesthe return on assets (excluding interest) relating to retirement benefit plans, are recognized directly in other comprehensive income in the period in which they arise. Remeasurement recorded in other comprehensive income is not reclassified to income statement.
Actuarial gains and losses relating to long-term employee benefits are recognized in the income statement in the period in which they arise.
Measurement date
| ix) | Measurement date |
The measurement date of retirement plans is March 31.
| r. | Dividends |
Any dividend declared by Tata Motors Limited is based on the profits available for distribution as reported in the unconsolidated statutory financial statements of Tata Motors Limited prepared in accordance with Generally Accepted Accounting Principles in India, (Indian GAAP). Further,or Indian GAAP. Indian law mandates that dividend be declared out of distributable profits, only after setting off un-provided losses and depreciation of previous years. In case of inadequacy or absence of profits in a particular year, a company may pay dividend out of accumulated profits of previous years transferred to Profit and Loss Account. However in the transferabsence of accumulated profits a specified percentagecompany may declare dividend out of net income computed in accordance with current regulationsfree reserves, subject to a general reserve.certain conditions. Accordingly, in certain years the net income reported in these financial statements may not be fully distributable. AsIn view of March 31, 2013the losses in Fiscal 2015 and March 31, 2012,also inadequate balance in the amountsfree reserves in the Company’s Standalone Financials, the amount available for distribution wereis Rs. 69,481.9Nil as at March 31, 2015 (Rs. 68,550.3 million and Rs. 79,752.6 million respectively.as at March 31, 2014).
| s. | Segments |
The Company primarily operates in the automotive segment. The automotive segment comprises of two reportable segments i.e. Tata and other brand vehicles, including financing thereof and Jaguar Land Rover. Other operating segments do not meet the quantitative thresholds for disclosure and have been aggregated.
| t. | Financial instruments |
| i) | Classification, initial recognition and measurement |
A financial instrument is any contract that gives rise to a financial asset of one entity and a financial liability or equity instrument of another entity. Financial assets are classified into categories: financial assets at fair value through profit or loss, held-to-maturity investments, loans and receivables and available-for-sale financial assets. Financial liabilities are classified into financial liabilities at fair value through profit or loss and other financial liabilities.
Financial instruments are recognized on the balance sheet when the Company becomes a party to the contractual provisions of the instrument.
Initially, a financial instrument is recognized at its fair value. Transaction costs directly attributable to the acquisition or issue of financial instruments are recognized in determining the carrying amount, if it is not classified as at fair value through profit or loss. Subsequently, financial instruments are measured according to the category in which they are classified.
Financial assets and financial liabilities at fair value through profit or loss: Derivatives, including embedded derivatives separated from the host contract, unless they are designated as hedging instruments, for which hedge accounting is applied, are classified into this category. These are measured at fair value with changes in fair value recognized in the income statement.
Loans and receivables: Loans and receivables are non-derivative financial assets with fixed or determinable payments that are not quoted in an active market and which are not classified as financial assets at fair value through profit or loss or financial assets available-for-sale. Subsequently, these are measured at amortized cost using the effective interest method less any impairment losses.
These include trade receivables, finance receivables, balances with banks, short-term deposits with banks, other financial assets and investments with fixed or determinable payments.
Available-for-sale financial assets: Available-for-sale financial assets are those non-derivative financial assets that are either designated as such upon initial recognition or are not classified in any of the other financial assets categories. Subsequently, these are measured at fair value and changes therein, other than impairment losses are recognized directly in other comprehensive income, net of applicable deferred income taxes.
Dividends from available-for-sale debt securities are recognized in the income statement when the right to receive payment has been established.
Equity instruments that do not have a quoted market price in an active market and whose fair value cannot be reliably measured, are measured at cost.
When the financial asset is derecognized, the cumulative gain or loss in equity is transferred to the income statement.
Foreign currency convertible notes: Convertible notes issued in foreign currency are convertible at the option of the holder into Ordinary Shares,shares, Global Depository Shares, American DepositoryDepositary Shares or Qualified Securities of the Company as per the terms of the issue. ConversionA conversion option which is not settled by exchanging a fixed amount of cash for a fixed number of shares is accounted for separately from the liability component as derivative and initially accounted for at fair value. The liability component is recognized initially at the difference between the fair value of the note and the fair value of the conversion option. Directly attributable costs are allocated to the liability component and the conversion option in proportion to their initial carrying amounts.
Subsequent to initial recognition, the liability component of the foreign currency convertible notes is measured at amortized cost using the effective interest method. The conversion option is subsequently measured at fair value at each reporting date or on the date of conversion, as applicable, with changes in fair value recognized in income statement.
The conversion option is presented together with the related liability.
Fair valuation of prepayment options in Senior Notes:senior notes: Embedded derivatives relating to prepayment options in Senior Notessenior notes are not considered as closely related and are separately accounted unless the exercise price of these options are approximately equal on each exercise date to the amortized cost of the Senior Notes.senior notes.
The embedded derivative is initially accounted for separately from the liability component as derivative at fair value. The fair value represents the difference in the traded market price of the Notesnotes and the expected price of the Notesnotes would trade at if they did not contain any prepayment features. The expected price is based on market inputs including credit spreads and interest rates. Directly attributable costs are allocated to the liability component and the prepayment option in proportion to their initial carrying amounts.
Subsequent to initial recognition, the liability component of the Senior Notessenior notes are measured at amortized cost using the effective interest method. The prepayment option is subsequently measured at fair value at each reporting date with changes in fair value recognized in income statement.
Thestatement.The prepayment option is presented together with the related liability.
Equity instruments: An equity instrument is any contract that evidences residual interests in the assets of the Company after deducting all of its liabilities. Equity instruments issued by the Company are recorded at the proceeds received, net of direct issue costs.
Other financial liabilities: These are measured at amortized cost using the effective interest method.
| ii) | Determination of fair value: |
The fair value of a financial instrument on initial recognition is normally the transaction price (fair value of the consideration given or received). Subsequent to initial recognition, the Company determines the fair value of financial instruments that are quoted in active markets using the quoted bid prices (financial assets held) or quoted ask prices (financial liabilities held) and using valuation techniques for other instruments. Valuation techniques include discounted cash flow method and other valuation models.
| iii) | Derecognition of financial assets and financial liabilities: |
The Company derecognizes a financial asset only when the contractual rights to the cash flows from the asset expires or it transfers the financial asset and substantially all the risks and rewards of ownership of the asset to another entity. If the Company neither transfers nor retains substantially all the risks and rewards of ownership and continues to control the transferred asset, the Company recognizes its retained interest in the asset and an associated liability for amounts it may have to pay. If the Company retains substantially all the risks and rewards of ownership of a transferred financial asset, the Company continues to recognize the financial asset and also recognizes a collateralized borrowing for the proceeds received.
Financial liabilities are derecognized when these are extinguished, that is when the obligation is discharged, cancelled or has expired.
| iv) | Impairment of financial assets: |
The Company assesses at each balance sheet date whether there is objective evidence that a financial asset or a group of financial assets is impaired. A financial asset is considered to be impaired if objective evidence indicates that one or more events have had a negative effect on the estimated future cash flows of that asset.
Loans and receivables:
Objective evidence of impairment includes default in payments with respect to amounts receivable from customers.
Impairment loss in respect of loans and receivables is calculated as the difference between their carrying amount and the present value of the estimated future cash flows discounted at the original effective interest rate. Such impairment loss is recognised in the income statement. If the amount of an impairment loss decreases in a subsequent period, and the decrease can be related objectively to an event occurring after the impairment was recognized, the previously recognized impairment loss is reversed. The reversal is recognized in the income statement.
Available-for-sale financial assets:
If the available-for-sale financial assetsasset is impaired, the difference between the financial asset’s acquisition cost (net of any principal repayments and amortization) and the current fair value, less any previous impairment loss recognized in the income statement, is reclassified from equity to income statement. If, in a subsequent period, the fair value of a debt instrument classified as available-for-sale increases and the increase can be objectively related to an event occurring after the impairment loss was recognized, the impairment loss is reversed. The reversal is recognized in the income statement. Reversal of impairment loss on equity investments classified as available-for-sale is not recognized in the income statement. Increase in their fair value after impairment is recognized in other comprehensive income.
Impairment loss on equity investments carried at cost is not reversed.
| u. | Hedge |
The Company uses foreign currency forward and option contracts to hedge its risks associated with foreign currency fluctuations relating to highly probable forecast transactions. The Company designates these forward and option contracts in a cash flow hedging relationship by applying the hedge accounting principles.
These forward and option contracts are stated at fair value at each reporting date. Changes in the fair value of these forward and option contracts that are designated and effective as hedges of future cash flows are recognized in other comprehensive income (net of tax), and the ineffective portion is recognized immediately in the consolidated income statement. Amounts accumulated in equity are reclassified to the consolidated income statement in the periods in which the forecasted transactions occurs.
For options, the time value is not considered part of the hedge, and this is treated as an ineffective hedge portion and recognisedrecognized immediately in the consolidated income statement.
Hedge accounting is discontinued when the hedging instrument expires or is sold, terminated, or exercised, or no longer qualifies for hedge accounting. For forecast transactions, any cumulative gain or loss on the hedging instrument recognized in equity is retained there until the forecast transaction occurs.
If the forecast transaction is no longer expected to occur, the net cumulative gain or loss recognized in equity is immediately transferred to the consolidated income statement for the year.
| v. |
New Accounting pronouncements affecting amounts reported and /or disclosures in the financial statements.
The Company has not applied the following pronouncements,new and revised IFRSs that have been issued by the IASB,but are not yet effective:
IFRS 9 | Financial Instruments4 | |
Amendments to IAS 16 & IAS 38 | Property, Plant & Equipment and Intangible Assets2 | |
IFRS 15 | Revenue from Contracts with Customers3 | |
Amendments to IFRS 11 | Joint Arrangements2 | |
Amendments to IAS 19 | Defined Benefit Plans: Employee Contributions1 | |
Amendments to IFRS 10 & IAS 28 | Sale or Contribution of Assets between an Investor and its Associate or Joint Venture2 | |
Amendments to IAS 1 | Presentation of Financial Statements2 | |
Annual Improvements to IFRSs 2010-2012 Cycle | IFRS 3, IFRS 8, IAS 16, IAS 241 | |
Annual Improvements to IFRSs 2011-2013 Cycle | IFRS 31 | |
Annual Improvements to IFRSs 2012-2014 Cycle | IFRS 5, IFRS 7, IAS 19, IAS 342 |
| 1 | Effective for annual periods beginning on or after July 1, 2014. |
| 2 | Effective for annual periods beginning on or after January 1, 2016. |
| 3 | Effective for annual periods beginning on or after January 1, 2017. |
| 4 | Effective for annual periods beginning on or after January 1, 2018. |
IFRS 9 – Financial Instruments
In July 2014, the IASB completed the final element of its comprehensive response to the financial crisis by issuing IFRS 9Financial Instruments. The package of improvements introduced by IFRS 9 includes a logical model for classification and measurement, a single, forward-looking “expected loss” impairment model and a substantially-reformed approach to hedge accounting. The new standard will come into effect on January 1, 2018, with early application permitted.
Amendment to IAS 16 – Property, Plant and Equipment and IAS 38 – Intangible Assets
In May 2014, the IASB issued “Amendments to IAS 16 and IAS 38”, clarifying that the use of methods based on revenue to calculate depreciation is not appropriate because revenue generated by an activity that includes the use of an asset typically reflects factors that are not directly linked to the consumption of the economic benefits embodied in the asset. Revenue is generally presumed to be an inappropriate basis for measuring the consumption of the economic benefits embodied in an intangible asset. This presumption, however, can be rebutted in certain limited circumstances.
IFRS 15 – Revenue from Contracts with Customers
The standard outlines a single comprehensive model for entities to use in accounting for revenue arising from contracts with customers and supersedes most current revenue recognition guidance, including industry-specific guidance. The core principle of the new standard is for companies to recognize revenue to depict the transfer of goods or services to customers in amounts that reflect the consideration (that is, payment) to which the company expects to be entitled in exchange for those goods or services. The new standard also will result in enhanced disclosures about revenue, provide guidance for transactions that were not previously addressed comprehensively (for example, service revenue and contract modifications) and improve guidance for multiple-element arrangements.
Amendments to IFRS 11 – Joint Arrangements
When an entity acquires an interest in a joint operation in which the activity of the joint operation constitutes a business, as defined in IFRS 3, it shall apply, to the extent of its share in accordance with this standard, all of the principles on business combinations accounting in IFRS 3, and other IFRSs, that do not conflict with the guidance in this standard and disclose the information that is required in those IFRSs in relation to business combinations.
Amendments to IAS 19 – Defined Benefit Plans: Employee Contributions
In November 2013, IASB issued an Amendment to IAS 19 to clarify the requirements that relate to how contributions from employees or third parties that are linked to service should be attributed to periods of service. In addition, it permits a practical expedient if the amount of the contributions is independent of the number of years of service, in which case, those contributions, can, but are not required to, be recognized as a reduction in the service cost in the period in which the related service is rendered. This amendment is effective for annual periods beginning on or after July 1, 2014.
Amendments to IFRS 10 – Consolidated Financial Statements and haveIAS 28 – Investments in Associates and Joint Ventures: Sale or Contribution of Assets between an Investor and its Associate or Joint Venture
In September 2014, IASB issued an amendment to IFRS 10 and IAS 28 to clarify the treatment of the sale or contribution of assets from an investor to its associate or joint venture, as follows:
Requires full recognition in the investor’s financial statements of gains and losses arising on the sale or contribution of assets that constitute a business (as defined in IFRS 3 Business Combinations)
Requires the partial recognition of gains and losses where the assets do not yet been adoptedconstitute a business, i.e., a gain or loss is recognized only to the extent of the unrelated investors’ interests in that associate or joint venture.
These requirements apply regardless of the legal form of the transaction, for example, whether the sale or contribution of assets occurs by an investor transferring shares in a subsidiary that holds the assets (resulting in loss of control of the subsidiary), or by the Company. The Companydirect sale of the assets themselves.
This amendment is evaluating the impact of these pronouncementseffective for annual periods beginning on the consolidated financial statements:or after January 1, 2016.
Amendments to IAS 1 – Presentation of Financial Statements was amended
In December 2014, IASB issued an amendment to IAS 1 to address perceived impediments to preparers exercising their judgment in June 2011presenting their financial reports by making the following changes:
Clarification that information should not be obscured by aggregating or by providing immaterial information, and that materiality considerations apply to requireall the parts of the financial statements, and even when a standard requires a specific disclosure, materiality considerations do apply;
Clarification that the list of line items to be presented in these statements can be disaggregated and aggregated as relevant and additional guidance on subtotals in these statements and clarification that an entity’s share of other comprehensive income toof equity-accounted associates and joint ventures should be grouped into those thatpresented in aggregate as single line items based on whether or not it will and will not subsequently be reclassified to profit or loss with taxloss; and
Additional examples of possible ways of ordering the notes to clarify that understandability and comparability should be considered when determining the order of the notes and to demonstrate that the notes need not be presented in the order so far listed in paragraph 114 of IAS 1.
This amendment is effective for annual periods beginning on itemsor after January 1, 2016.
Annual Improvements to IFRSs 2010-2012 and 2011-2013 Cycle
In December 2013, the IASB issued “Annual Improvements to IFRSs: 2010-2012 Cycle” and “Annual Improvements to IFRSs: 2011-2013 Cycle”, as part of other comprehensive income required to be allocated on the same basis. The amendmentsits annual process of revising and improving existing standards. These are effective for annual periods beginning on or after July 1, 2012.2014.
IFRS 8 (Operating Segments) requires disclosure of judgments made by management in applying aggregation criteria to segments.
IAS 16 (Property, Plant and Equipment) and IAS 38 (Intangible Assets) clarify the method used to determine accumulated depreciation and amortization under the revaluation model.
IAS 24 (Related Party Disclosures) expands the definition of “related party” to include an entity, or any member of a group of which it is a part, that provides key management personnel services to the reporting entity.
IFRS 3 (Business Combinations) and IFRS 13 (Fair Value Measurement) clarify certain definitions.
Annual Improvements to IFRSs 2012-2014 Cycle
IFRS 7 Financial Instruments: DisclosuresIn September 2014, the IASB issued “Annual Improvements to IFRSs: 2012-2014 Cycle” andIAS 32 Financial Instruments: Presentation were amended in December 2011 “Annual Improvements to clarify requirements for offsetting financial assetsIFRSs: 2012-2014 Cycle”, as part of its annual process of revising and financial liabilities and amend disclosures. The new disclosures are required for annual or interim periods beginning on or after January 1, 2013 and the clarifying amendments to IAS 32improving existing standards. These are effective for annual periods beginning on or after January 1, 2014.2016.
IFRS 9 Financial Instruments was issued by IASB5 – Adds specific guidance in November 2009IFRS 5 for cases in which an entity reclassifies an asset from held-for-sale to held-for-distribution or vice versa and revisedcases in November 2010 as part of its project for revision of thewhich held-for-distribution accounting is discontinued
IFRS 7 – Additional guidance for financial instruments. The new standard provides guidance with respect to classificationclarify whether a servicing contract is continuing involvement in a transferred asset, and measurement of financial assets and financial liabilities. The standard will be effective for annual periods beginningclarification on or after January 1, 2015.
IFRS 10 Consolidated Financial Statements establishes principles for the presentation and preparation of consolidatedoffsetting disclosures in condensed interim financial statements when an entity controls one or more other entities. The standard will
IAS 19 – Clarifies that the high quality corporate bonds used in estimating the discount rate for post-employment benefits should be effective for annual periods beginning on or after January 1, 2013.
IFRS 11 Joint Arrangements classifies joint arrangementsdenominated in the same currency as either joint operations (combining the existing conceptsbenefits to be paid
IAS 34 – Clarifies the meaning of jointly controlled assets and jointly controlled operations) or joint ventures (equivalent to“elsewhere in the existing concept of a jointly controlled entity). Joint operation is a joint arrangement whereby the parties that have joint control have rights to the assets and obligations for the liabilities. Joint venture is a joint arrangement whereby the parties that have joint control of the arrangement have rights to the net assets of the arrangement. IFRS 11 requires the use of the equity method of accounting for interests in joint ventures thereby eliminating the proportionate consolidation method. The standard will be effective for annual periods beginning on or after January 1, 2013.
IFRS 12 Disclosure of Interests in Other Entities applies to entities that have an interest in a subsidiary, a joint arrangement, an associate or an unconsolidated structured entity. The IFRS requires an entity to disclose information that enables users of financial statements to evaluate the nature of, and risks associated with, its interests in other entities; and the effects of those interests on its financial position, financial performance and cash flows. The standard will be effective for annual periods beginning on or after January 1, 2013.
IFRS 13 Fair value measurement defines ‘fair value’ and sets out in a single IFRS a framework for measuring fair valueinterim report” and requires disclosures about fair value measurements. It seeks to increase consistency and comparability in fair value measurements and related disclosures through a fair value hierarchy. IFRS 13 is applicable prospectively from the beginning of the annual period in which the Standard is adopted. The standard will be effective for annual periods beginning on or after January 1, 2013.cross-reference
In June 2011, the IASB issuedIAS 19, Employee Benefits, the amended IAS 19 eliminates the corridor approach and requires recognition of actuarial gains and losses in line item Other Comprehensive Income. These changes will have no impact on the Company because the Company does not apply the corridor approach and already recognizes changes in actuarial gains and losses in line item Other Comprehensive Income.
Further, the amended IAS 19, replaces the expected return on assets and interest costs on the defined benefit obligation with a single net interest component. Past service costs will be recognized fully in the period of the related plan amendment. The amendments to IAS 19 also change the requirements for termination benefits and include enhanced presentation and disclosure requirements. The standard will be effective for annual periods beginning on or after January 1, 2013.
The Annual improvements to IFRSs 2009 – 2011 Cycle issued in May 2012 include a number of amendments to various IFRSs. The amendments are effective for annual periods beginning on or after January 1, 2013. These amendments include:
|
|
|
| Convenience translation |
The consolidated financial statements have been expressed in Indian rupees (“Rs.”), Tata Motors LimitedLimited’s functional currency. For the convenience of the reader, the financial statements as at and for the year ended March 31, 2013,2015, have been translated into U.S. dollars at US$1.00 = Rs. 54.285,Rs.62.500, based on fixing rate in the City of Mumbai on March 31, 2013,2015, for cable transfers in Indian rupees as published by the Foreign Exchange Dealers’ Association of India (FEDAI).
Such translation should not be construed as representation that the rupee amounts have been or could be converted into U.S. dollars at that or any other rate, or at all.
| 3. | Cash and cash equivalents |
Cash and cash equivalents consist of the following:
| As of March 31, | ||||||||||||
| 2013 | 2013 | 2012 | ||||||||||
| (In millions) | ||||||||||||
Cash balances | US$ | 7.7 | Rs. | 414.4 | Rs. | 215.5 | ||||||
Balances with banks (including deposits with original maturity of upto three months) | 2,131.4 | 115,704.1 | 145,736.9 | |||||||||
|
|
|
|
|
| |||||||
Total | US$ | 2,139.1 | Rs. | 116,118.5 | Rs. | 145,952.4 | ||||||
|
|
|
|
|
| |||||||
Cash and cash equivalents includes Rs. 43,052.5 million and Rs. 36,974.1 million as of March 31, 2013 and 2012 respectively, held by a subsidiary that operates in a country where exchange control restrictions prevent the balances being available for general use by Tata Motors Limited and other subsidiaries. As at March 31, 2013, it is considered that all of this cash could be utilised against current liabilities in that country and therefore the exchange control restrictions on movement of cash do not curtail the group’s liquidity position.
| As at March 31, | ||||||||||||
| 2015 | 2015 | 2014 | ||||||||||
| (In millions) | ||||||||||||
Cash balances | US$ | 5.9 | Rs. | 369.7 | Rs. | 386.3 | ||||||
Balances with banks (including deposits with original maturity of up to three months) | 3,153.0 | 197,061.2 | 159,535.2 | |||||||||
|
|
|
|
|
| |||||||
Total | US$ | 3,158.9 | Rs. | 197,430.9 | Rs. | 159,921.5 | ||||||
|
|
|
|
|
| |||||||
| 4. | Finance receivables |
Finance receivables consist of vehicle loans, the details of which are as follows:
| As of March 31, | As at March 31, | |||||||||||||||||||||||
| 2013 | 2013 | 2012 | 2015 | 2015 | 2014 | |||||||||||||||||||
| (In millions) | (In millions) | |||||||||||||||||||||||
Finance receivables | US$ | 3,919.2 | Rs. | 212,754.0 | Rs. | 182,330.4 | US$ | 3,273.2 | Rs. | 204,569.9 | Rs. | 216,862.7 | ||||||||||||
Less: allowance for credit losses | 267.7 | 14,534.8 | 11,089.6 | 744.9 | 46,554.3 | 31,587.5 | ||||||||||||||||||
|
|
|
|
|
| |||||||||||||||||||
Total | US$ | 3,651.5 | Rs. | 198,219.2 | Rs. | 171,240.8 | US$ | 2,528.3 | Rs. | 158,015.6 | Rs. | 185,275.2 | ||||||||||||
|
|
|
|
|
| |||||||||||||||||||
Current portion | 1,316.4 | 71,460.5 | 68,438.8 | 793.1 | 49,568.5 | 90,832.5 | ||||||||||||||||||
Non-current portion | 2,335.1 | 126,758.7 | 102,802.0 | 1,735.2 | 108,447.1 | 94,442.7 | ||||||||||||||||||
|
|
|
|
|
| |||||||||||||||||||
Total | US$ | 3,651.5 | Rs. | 198,219.2 | Rs. | 171,240.8 | US$ | 2,528.3 | Rs. | 158,015.6 | Rs. | 185,275.2 | ||||||||||||
|
|
|
|
|
| |||||||||||||||||||
Changes in the allowance for credit losses in finance receivables are as follows:
| Year ended March 31, | Year ended March 31, | |||||||||||||||||||||||||||||||
| 2013 | 2013 | 2012 | 2011 | 2015 | 2015 | 2014 | 2013 | |||||||||||||||||||||||||
| (In millions) | (In millions) | |||||||||||||||||||||||||||||||
Balance at the beginning | US$ | 204.3 | Rs. | 11,089.6 | Rs. | 9,070.9 | Rs. | 8,481.1 | US$ | 505.4 | Rs. | 31,587.5 | Rs. | 14,534.8 | Rs. | 11,089.6 | ||||||||||||||||
Allowances made during the year | 173.6 | 9,427.9 | 5,747.3 | 4,872.7 | 371.6 | 23,226.2 | 24,138.9 | 9,427.9 | ||||||||||||||||||||||||
Written off | (110.2 | ) | (5,982.7 | ) | (3,728.6 | ) | (4,282.9 | ) | (132.1 | ) | (8,259.4 | ) | (7,086.2 | ) | (5,982.7 | ) | ||||||||||||||||
|
|
|
|
|
|
|
| |||||||||||||||||||||||||
Balance at the end | US$ | 267.7 | Rs. | 14,534.8 | Rs. | 11,089.6 | Rs. | 9,070.9 | US$ | 744.9 | Rs. | 46,554.3 | Rs. | 31,587.5 | Rs. | 14,534.8 | ||||||||||||||||
|
|
|
|
|
|
|
| |||||||||||||||||||||||||
| 5. | Allowance for trade and other receivables |
Change in the allowances for trade and other receivables are as follows:
| Year ended March 31, | Year ended March 31, | |||||||||||||||||||||||||||||||
| 2013 | 2013 | 2012 | 2011 | 2015 | 2015 | 2014 | 2013 | |||||||||||||||||||||||||
| (In millions) | (In millions) | |||||||||||||||||||||||||||||||
Balance at the beginning | US$ | 70.9 | Rs. | 3,847.2 | Rs. | 2,963.3 | Rs. | 3,023.7 | US$ | 117.1 | Rs. | 7,321.8 | Rs. | 4,813.7 | Rs. | 3,884.5 | ||||||||||||||||
Allowance made during the year (net) | 21.0 | 1,141.3 | 997.3 | 1,099.4 | ||||||||||||||||||||||||||||
Allowances made during the year | 37.9 | 2,371.0 | 2,691.0 | 1,141.6 | ||||||||||||||||||||||||||||
Written off | (4.0 | ) | (218.8 | ) | (211.5 | ) | (1,216.6 | ) | (13.4 | ) | (839.3 | ) | (408.2 | ) | (219.7 | ) | ||||||||||||||||
Foreign exchange translation differences | 0.1 | 7.3 | 98.1 | 56.8 | (2.0 | ) | (125.7 | ) | 225.3 | 7.3 | ||||||||||||||||||||||
|
|
|
|
|
|
|
| |||||||||||||||||||||||||
Balance at the end | US$ | 88.0 | Rs. | 4,777.0 | Rs. | 3,847.2 | Rs. | 2,963.3 | US$ | 139.6 | Rs. | 8,727.8 | Rs. | 7,321.8 | Rs. | 4,813.7 | ||||||||||||||||
|
|
|
|
|
|
|
| |||||||||||||||||||||||||
| 6. | Investments |
Investments consist of the following:
| As of March 31, | As at March 31, | |||||||||||||||||||||||
| 2013 | 2013 | 2012 | 2015 | 2015 | 2014 | |||||||||||||||||||
| (In millions) | (In millions) | |||||||||||||||||||||||
Available-for-sale, at fair value | US$ | 1,428.0 | Rs. | 77,516.4 | Rs. | 78,365.0 | US$ | 2,284.9 | Rs. | 142,806.8 | Rs. | 97,882.1 | ||||||||||||
Unquoted equity investments, at cost | 71.4 | 3,877.0 | 3,866.4 | 63.0 | 3,936.8 | 3,919.7 | ||||||||||||||||||
Loans and receivables | 1.4 | 80.0 | 337.6 | 1.3 | 80.0 | 75.0 | ||||||||||||||||||
|
|
|
|
|
| |||||||||||||||||||
Total | US$ | 1,500.8 | Rs. | 81,473.4 | Rs. | 82,569.0 | US$ | 2,349.2 | Rs. | 146,823.6 | Rs. | 101,876.8 | ||||||||||||
|
|
|
|
|
| |||||||||||||||||||
Available-for-sale, financial assets (investments) are as follows:
| As of March 31, | As at March 31, | |||||||||||||||||||||||
| 2013 | 2013 | 2012 | 2015 | 2015 | 2014 | |||||||||||||||||||
| (In millions) | (In millions) | |||||||||||||||||||||||
Quoted equity shares | US$ | 38.1 | Rs. | 2,067.2 | Rs. | 2,885.3 | US$ | 33.7 | Rs. | 2,106.1 | Rs. | 2,770.1 | ||||||||||||
Mutual funds | 1,387.7 | 75,327.0 | 75,356.3 | 2,251.0 | 140,685.7 | 95,016.2 | ||||||||||||||||||
Corporate bonds and other debt instruments | 2.2 | 122.2 | 123.4 | 0.2 | 15.0 | 95.8 | ||||||||||||||||||
|
|
|
|
|
| |||||||||||||||||||
Total available for sale securities | US$ | 1,428.0 | Rs. | 77,516.4 | Rs. | 78,365.0 | US$ | 2,284.9 | Rs. | 142,806.8 | Rs. | 97,882.1 | ||||||||||||
|
|
|
|
|
| |||||||||||||||||||
The current and non-current classifications of investments are as follows:
| As of March 31, | As at March 31, | |||||||||||||||||||||||
| 2013 | 2013 | 2012 | 2015 | 2015 | 2014 | |||||||||||||||||||
| (In millions) | (In millions) | |||||||||||||||||||||||
Current investments | US$ | 1,385.1 | Rs. | 75,191.2 | Rs. | 75,299.3 | US$ | 2,252.0 | Rs. | 140,747.8 | Rs. | 95,337.5 | ||||||||||||
Non-current investments | 115.7 | 6,282.2 | 7,269.7 | 97.2 | 6,075.8 | 6,539.3 | ||||||||||||||||||
|
|
|
|
|
| |||||||||||||||||||
Total | US$ | 1,500.8 | Rs. | 81,473.4 | Rs. | 82,569.0 | US$ | 2,349.2 | Rs. | 146,823.6 | Rs. | 101,876.8 | ||||||||||||
|
|
|
|
|
| |||||||||||||||||||
The fair value of the unquoted equity investments cannot be reliably measured as the variability in the range of fair value estimates is significant and the probabilities of the various estimates cannot be reasonably assessed.
| 7. | Other financial assets - current |
Other financial assets - current consist of the following:
| As of March 31, | As at March 31, | |||||||||||||||||||||||
| 2013 | 2013 | 2012 | 2015 | 2015 | 2014 | |||||||||||||||||||
| (In millions) | (In millions) | |||||||||||||||||||||||
Derivative financial instruments | US$ | 47.3 | Rs. | 2,568.1 | Rs. | 3,950.4 | US$ | 267.6 | Rs. | 16,726.7 | Rs. | 35,912.4 | ||||||||||||
Advances and other receivables recoverable in cash | 108.4 | 5,884.6 | 3,764.7 | 111.5 | 6,964.1 | 5,530.6 | ||||||||||||||||||
Inter corporate deposits | 0.1 | 3.1 | 504.2 | |||||||||||||||||||||
Inter-corporate deposits | 15.2 | 953.1 | 3.1 | |||||||||||||||||||||
Margin money with banks | 25.8 | 1,402.9 | 405.0 | — | — | 352.6 | ||||||||||||||||||
Restricted bank deposits | 211.6 | 11,484.1 | 12,676.7 | 37.6 | 2,347.3 | 2,175.6 | ||||||||||||||||||
|
|
|
|
|
| |||||||||||||||||||
Total | US$ | 393.2 | Rs. | 21,342.8 | Rs. | 21,301.0 | US$ | 431.9 | Rs. | 26,991.2 | Rs. | 43,974.3 | ||||||||||||
|
|
|
|
|
| |||||||||||||||||||
Margin money with banks is restricted cash deposits and consists of collateral provided for transfer of finance receivables. Restricted bank deposits include Rs. 9,002.42,045.6 million and Rs. 10,709.11,928.9 million as ofat March 31, 20132015 and 20122014, respectively, held as security in relation to debt service and repayment of bank borrowings. The deposits are pledged till the maturity of the respective borrowings.
| 8. | Other financial assets (non-current) |
Other financial assets - non-current consist of the following:
| As at March 31, | ||||||||||||
| 2015 | 2015 | 2014 | ||||||||||
| (In millions) | ||||||||||||
Margin money with banks | US$ | 16.0 | Rs. | 1,001.3 | Rs. | 1,008.3 | ||||||
Restricted deposits | 36.3 | 2,267.0 | 2,524.5 | |||||||||
Loans to employees | 6.4 | 400.6 | 448.0 | |||||||||
Loan to joint operation | 21.2 | 1,325.0 | 1,325.0 | |||||||||
Loan to equity accounted investee | 25.6 | 1,600.0 | — | |||||||||
Derivative financial instruments | 40.5 | 2,532.8 | 43,646.9 | |||||||||
Others | 63.0 | 3,944.0 | 3,491.3 | |||||||||
|
|
|
|
|
| |||||||
Total | US$ | 209.0 | Rs. | 13,070.7 | Rs. | 52,444.0 | ||||||
|
|
|
|
|
| |||||||
Margin money with banks is restricted cash deposits and consists of collateral provided for transfer of finance receivables.
Restricted deposits relate to the Company’s residual risk arising on vehicles sold by dealer under leasing arrangement.
Loan to joint operation is subordinated to other borrowings of the joint operation. Subject to certain conditions, the loan is convertible into equity of the joint operation at fair value, at the option of the joint operation.
Loan to equity accounted investee is 9% optionally convertible preference shares (OCPS) from the rights offered by the equity accounted investee to existing equity shareholders at a ratio of 4 OCPS for every 10 equity shares. These OCPS are redeemable at par or may be converted into equity shares of equity accounted investee at fair value after a period of seven years.
| 9. | Inventories |
Inventories consist of the following:
| As of March 31, | As at March 31, | |||||||||||||||||||||||
| 2013 | 2013 | 2012 | 2015 | 2015 | 2014 | |||||||||||||||||||
| (In millions) | (In millions) | |||||||||||||||||||||||
Raw materials and consumables | US$ | 462.6 | Rs. | 25,112.3 | Rs. | 27,980.5 | ||||||||||||||||||
Raw materials, components and consumables | US$ | 462.8 | Rs. | 28,924.4 | Rs. | 28,468.3 | ||||||||||||||||||
Work-in-progress | 397.2 | 21,563.6 | 19,148.5 | 538.4 | 33,650.3 | 26,580.8 | ||||||||||||||||||
Finished goods | 2,979.1 | 161,717.3 | 133,705.0 | 3,595.3 | 224,705.1 | 217,686.8 | ||||||||||||||||||
|
|
|
|
|
| |||||||||||||||||||
Total | US$ | 3,838.9 | Rs. | 208,393.2 | Rs. | 180,834.0 | US$ | 4,596.5 | Rs. | 287,279.8 | Rs. | 272,735.9 | ||||||||||||
|
|
|
|
|
| |||||||||||||||||||
Inventories of finished goods include Rs. 14,055.317,287.9 million and Rs. 10,916.117,319.1 million as ofat March 31, 20132015 and March 31, 2012,2014, respectively, relating to vehicles sold subject to repurchase arrangements.
Cost of inventories (including cost of purchased products) recognisedrecognized as expense during the years ended March 31, 2013,2015, March 31, 20122014 and March 31, 20112013 amounted to Rs. 1,382,008.91,864,306.0 million, Rs. 1,221,929.51,662,646.2 million and Rs. 908,917.61,376,589.1 million, respectively.
During the years ended March 31, 2013,2015, March 31, 20122014 and March 31, 20112013, the Company recorded inventory write-down expenseexpenses of Rs. 3,675.15,527.2 million, Rs. 2,098.83,354.5 million and Rs. 1,512.53,721.0 million, respectively.
| Other current assets |
Other current assets consist of the following:
| As of March 31, | As at March 31, | |||||||||||||||||||||||
| 2013 | 2013 | 2012 | 2015 | 2015 | 2014 | |||||||||||||||||||
| (In millions) | (In millions) | |||||||||||||||||||||||
Advances to suppliers and contractors | US$ | 44.9 | Rs. | 2,435.5 | Rs. | 2,624.9 | US$ | 29.4 | Rs. | 1,837.3 | Rs. | 1,311.1 | ||||||||||||
VAT, other taxes recoverable, statutory deposits and dues from government | 859.0 | 46,627.7 | 51,334.8 | 660.6 | 41,291.6 | 42,233.0 | ||||||||||||||||||
Prepaid expenses | 104.7 | 5,686.0 | 3,529.0 | 169.5 | 10,590.8 | 9,003.7 | ||||||||||||||||||
Others | 3.6 | 196.6 | 61.6 | 9.2 | 582.0 | 144.4 | ||||||||||||||||||
|
|
|
|
|
| |||||||||||||||||||
Total | US$ | 1,012.2 | Rs. | 54,945.8 | Rs. | 57,550.3 | US$ | 868.7 | Rs. | 54,301.7 | Rs. | 52,692.2 | ||||||||||||
|
|
|
|
|
| |||||||||||||||||||
| Other |
Other financialnon-current assets - non-current consist of the following:
| As of March 31, | ||||||||||||
| 2013 | 2013 | 2012 | ||||||||||
| (In millions) | ||||||||||||
Margin money with banks | US$ | 12.8 | Rs. | 693.1 | Rs. | 2,184.4 | ||||||
Restricted deposits | 74.4 | 4,036.9 | 6,577.2 | |||||||||
Loans to employees | 8.1 | 437.0 | 476.1 | |||||||||
Loan to the equity accounted investee | 48.8 | 2,650.0 | 2,650.0 | |||||||||
Derivative financial instruments | 114.1 | 6,194.7 | 1,897.0 | |||||||||
Others | 79.7 | 4,331.9 | 3,305.2 | |||||||||
|
|
|
|
|
| |||||||
Total | US$ | 337.9 | Rs. | 18,343.6 | Rs. | 17,089.9 | ||||||
|
|
|
|
|
| |||||||
| As at March 31, | ||||||||||||
| 2015 | 2015 | 2014 | ||||||||||
| (In millions) | ||||||||||||
Taxes recoverable, statutory deposits and dues from government | US$ | 187.7 | Rs. | 11,729.1 | Rs. | 9,361.8 | ||||||
Prepaid rentals on operating leases | 15.3 | 955.2 | 871.9 | |||||||||
Prepaid expenses | 43.1 | 2,691.5 | 2,688.4 | |||||||||
Others | 37.9 | 2,373.3 | 2,529.8 | |||||||||
|
|
|
|
|
| |||||||
Total | US$ | 284.0 | Rs. | 17,749.1 | Rs. | 15,451.9 | ||||||
|
|
|
|
|
| |||||||
Margin money with banks is restricted cash deposits,Others include Rs. 36.1 million and consists of collateral provided for transfer of finance receivables. Restricted deposits are heldRs. 45.0 million towards pension assets pertaining to Jaguar Land Rover businesses as security on vehicles sold by dealers under leasing arrangements. The amount is pledged until the leases reach their respective conclusion.
Loan to the equity accounted investee represents loan given to a joint venture of the Company. This loan is subordinated to other borrowings of the joint venture. Subject to certain conditions, the loan is convertible into equity of the joint venture at the option of the joint venture.March 31, 2015 and March 31, 2014, respectively.
| Property, plant and equipment |
Property, plant and equipment consists of the following:
| Land and buildings | Plant and equipment | Vehicles | Computers | Furniture and fixtures | Total | |||||||||||||||||||
| (In millions) | ||||||||||||||||||||||||
Cost as of April 1, 2012 | Rs. | 66,706.1 | Rs. | 317,654.8 | Rs. | 3,300.8 | Rs. | 9,521.7 | Rs. | 4,615.8 | Rs. | 401,799.2 | ||||||||||||
Additions | 4,978.9 | 86,245.2 | 773.1 | 973.0 | 1,613.6 | 94,583.8 | ||||||||||||||||||
Currency translation differences | 716.1 | (1,218.2 | ) | 81.9 | 69.4 | 22.7 | (328.1 | ) | ||||||||||||||||
Disposal | (1,279.0 | ) | (6,193.5 | ) | (1,868.3 | ) | (342.2 | ) | (465.7 | ) | (10,148.7 | ) | ||||||||||||
|
|
|
|
|
|
|
|
|
|
|
| |||||||||||||
Cost as of March 31, 2013 | 71,122.1 | 396,488.3 | 2,287.5 | 10,221.9 | 5,786.4 | 485,906.2 | ||||||||||||||||||
Accumulated depreciation (net of Rs.8,079.8 million in respect of disposals) | (11,369.1 | ) | (159,978.5 | ) | (1,166.6 | ) | (7,274.2 | ) | (2,385.6 | ) | (182,174.0 | ) | ||||||||||||
|
|
|
|
|
|
|
|
|
|
|
| |||||||||||||
Net carrying amount as of March 31, 2013 | Rs. | 59,753.0 | Rs. | 236,509.8 | Rs. | 1,120.9 | Rs. | 2,947.7 | Rs. | 3,400.8 | Rs. | 303,732.2 | ||||||||||||
Capital work-in –progress | 42,930.8 | |||||||||||||||||||||||
|
| |||||||||||||||||||||||
Total | Rs. | 346,663.0 | ||||||||||||||||||||||
|
| |||||||||||||||||||||||
| US$ | 6,386.0 | |||||||||||||||||||||||
|
| |||||||||||||||||||||||
Depreciation for the year | Rs. | (1,941.8 | ) | Rs. | (34,258.1 | ) | Rs. | (475.6 | ) | Rs. | (1,006.4 | ) | Rs. | (405.9 | ) | Rs. | (38,087.8 | ) | ||||||
|
|
|
|
|
|
|
|
|
|
|
| |||||||||||||
| US$ | (701.6) | |||||||||||||||||||||||
| Land and buildings | Plant and equipment | Vehicles | Computers | Furniture and fixtures | Total | Land and buildings | Plant and equipment | Vehicles | Computers | Furniture and fixtures | Heritage Assets | Total | ||||||||||||||||||||||||||||||||||||||||
| (In millions) | (In millions) | |||||||||||||||||||||||||||||||||||||||||||||||||||
Cost as of April 1, 2011 | Rs. | 57,367.9 | Rs. | 249,757.9 | Rs. | 2,312.4 | Rs. | 8,213.2 | Rs. | 3,414.1 | Rs. | 321,065.5 | ||||||||||||||||||||||||||||||||||||||||
Cost as at April 1, 2014 | Rs. | 101,083.9 | Rs. | 535,561.7 | Rs. | 2,567.3 | Rs. | 12,154.3 | Rs. | 8,731.0 | Rs. | — | Rs. | 660,098.2 | ||||||||||||||||||||||||||||||||||||||
Additions | 5,316.2 | 53,617.0 | 1,430.7 | 1,305.3 | 1,061.0 | 62,730.2 | 29,215.2 | 146,494.3 | 500.9 | 2,852.7 | 2,199.3 | 5,141.8 | 186,404.2 | |||||||||||||||||||||||||||||||||||||||
Currency translation differences | 4,166.1 | 16,415.9 | 166.2 | 214.3 | 262.1 | 21,224.6 | (5,411.2 | ) | (30,282.3 | ) | (36.4 | ) | (434.4 | ) | (462.5 | ) | (320.6 | ) | (36,947.4 | ) | ||||||||||||||||||||||||||||||||
Disposal | (144.1 | ) | (2,136.0 | ) | (608.5 | ) | (211.1 | ) | (121.4 | ) | (3,221.1 | ) | (1,172.5 | ) | (6,403.2 | ) | (374.5 | ) | (133.6 | ) | (386.6 | ) | — | (8,470.4 | ) | |||||||||||||||||||||||||||
|
|
|
|
|
|
|
|
|
|
|
|
| ||||||||||||||||||||||||||||||||||||||||
Cost as of March 31, 2012 | 66,706.1 | 317,654.8 | 3,300.8 | 9,521.7 | 4,615.8 | 401,799.2 | ||||||||||||||||||||||||||||||||||||||||||||||
Accumulated depreciation (net of Rs. 1,593.2 million in respect of disposals) | (10,509.4 | ) | (131,216.6 | ) | (1,253.3 | ) | (6,437.6 | ) | (2,376.8 | ) | (151,793.7 | ) | ||||||||||||||||||||||||||||||||||||||||
Cost as at March 31, 2015 | 123,715.4 | 645,370.5 | 2,657.3 | 14,439.0 | 10,081.2 | 4,821.2 | 801,084.6 | |||||||||||||||||||||||||||||||||||||||||||||
Accumulated depreciation (net of Rs. 7,461.5 million in respect of disposals) | (17,460.8 | ) | (272,264.0 | ) | (1,526.0 | ) | (9,302.6 | ) | (4,318.5 | ) | — | (304,871.9 | ) | |||||||||||||||||||||||||||||||||||||||
|
|
|
|
|
|
|
|
|
|
|
|
| ||||||||||||||||||||||||||||||||||||||||
Net carrying amount as of March 31, 2012 | Rs. | 56,196.7 | Rs. | 186,438.2 | Rs. | 2,047.5 | Rs. | 3,084.1 | Rs. | 2,239.0 | Rs. | 250,005.5 | ||||||||||||||||||||||||||||||||||||||||
Capital work-in –progress | 32,710.6 | |||||||||||||||||||||||||||||||||||||||||||||||||||
Net carrying amount as at March 31, 2015 | Rs. | 106,254.6 | Rs. | 373,106.5 | Rs. | 1,131.3 | Rs. | 5,136.4 | Rs. | 5,762.7 | Rs. | 4,821.2 | Rs. | 496,212.7 | ||||||||||||||||||||||||||||||||||||||
Capital work-in-progress | 90,686.4 | |||||||||||||||||||||||||||||||||||||||||||||||||||
|
| |||||||||||||||||||||||||||||||||||||||||||||||||||
Total | Rs. | 282,716.1 | Rs. | 586,899.1 | ||||||||||||||||||||||||||||||||||||||||||||||||
|
| |||||||||||||||||||||||||||||||||||||||||||||||||||
| US$ | 9,390.4 | |||||||||||||||||||||||||||||||||||||||||||||||||||
| ||||||||||||||||||||||||||||||||||||||||||||||||||||
Depreciation for the year | Rs. | (1,574.1 | ) | Rs. | (28,473.5 | ) | Rs. | (529.2 | ) | Rs. | (810.3 | ) | Rs. | (462.2 | ) | Rs. | (31,849.3 | ) | Rs. | (3,350.8 | ) | Rs. | (58,945.8 | ) | Rs. | (391.6 | ) | Rs. | (1,188.2 | ) | Rs. | (1,521.7 | ) | Rs. | — | Rs. | (65,398.1 | ) | ||||||||||||||
|
|
|
|
|
|
|
|
|
|
|
|
| ||||||||||||||||||||||||||||||||||||||||
| US$ | (1,046.4 | ) | ||||||||||||||||||||||||||||||||||||||||||||||||||
| ||||||||||||||||||||||||||||||||||||||||||||||||||||
Cost as at April 1, 2013 | Rs. | 74,900.7 | Rs. | 416,609.7 | Rs. | 2,396.3 | Rs. | 10,382.3 | Rs. | 5,922.8 | Rs. | — | Rs. | 510,211.8 | ||||||||||||||||||||||||||||||||||||||
Additions | 18,158.9 | 73,781.1 | 443.7 | 1,725.8 | 2,347.0 | — | 96,456.5 | |||||||||||||||||||||||||||||||||||||||||||||
Acquisition through business combination | 6.1 | — | 0.4 | 17.3 | 2.6 | — | 26.4 | |||||||||||||||||||||||||||||||||||||||||||||
Currency translation differences | 8,334.8 | 47,862.8 | 73.0 | 538.3 | 627.4 | — | 57,436.3 | |||||||||||||||||||||||||||||||||||||||||||||
Disposal | (316.6 | ) | (2,691.9 | ) | (346.1 | ) | (509.4 | ) | (168.8 | ) | — | (4,032.8 | ) | |||||||||||||||||||||||||||||||||||||||
|
|
|
|
|
|
| ||||||||||||||||||||||||||||||||||||||||||||||
Cost as at March 31, 2014 | 101,083.9 | 535,561.7 | 2,567.3 | 12,154.3 | 8,731.0 | — | 660,098.2 | |||||||||||||||||||||||||||||||||||||||||||||
Accumulated depreciation (net of Rs. 3,462.6 million in respect of disposals) | (15,727.9 | ) | (230,644.3 | ) | (1,428.7 | ) | (8,295.4 | ) | (3,219.1 | ) | — | (259,315.4 | ) | |||||||||||||||||||||||||||||||||||||||
|
|
|
|
|
|
| ||||||||||||||||||||||||||||||||||||||||||||||
Net carrying amount as at March 31, 2014 | Rs. | 85,356.0 | Rs. | 304,917.4 | Rs. | 1,138.6 | Rs. | 3,858.9 | Rs. | 5,511.9 | Rs. | — | Rs. | 400,782.8 | ||||||||||||||||||||||||||||||||||||||
Capital work-in-progress | 93,827.1 | |||||||||||||||||||||||||||||||||||||||||||||||||||
| ||||||||||||||||||||||||||||||||||||||||||||||||||||
Total | Rs. | 494,609.9 | ||||||||||||||||||||||||||||||||||||||||||||||||||
| ||||||||||||||||||||||||||||||||||||||||||||||||||||
Depreciation for the year | Rs. | (2,644.6 | ) | Rs. | (47,604.4 | ) | Rs. | (464.7 | ) | Rs. | (1,115.8 | ) | Rs. | (596.4 | ) | Rs. | — | Rs. | (52,425.9 | ) | ||||||||||||||||||||||||||||||||
|
|
|
|
|
|
| ||||||||||||||||||||||||||||||||||||||||||||||
Notes:
| 1. | Net carrying amounts of property, plant and equipment under finance lease arrangements |
| As of March 31, | As at March 31, | |||||||||||||||||||||||
| 2013 | 2013 | 2012 | 2015 | 2015 | 2014 | |||||||||||||||||||
| ( In millions) | (In millions) | |||||||||||||||||||||||
Land | US$ | 3.3 | Rs. | 180.9 | Rs. | 184.5 | US$ | 3.2 | Rs. | 200.8 | Rs. | 202.9 | ||||||||||||
Buildings | 7.6 | 414.1 | 314.6 | 20.2 | 1,264.3 | 588.2 | ||||||||||||||||||
Plant and equipment | 37.5 | 2,034.0 | 1,728.1 | 23.9 | 1,495.5 | 2,179.4 | ||||||||||||||||||
Computers | 10.4 | 566.7 | 508.3 | 4.6 | 290.2 | 406.0 | ||||||||||||||||||
|
|
|
|
|
| |||||||||||||||||||
Total | US$ | 58.8 | Rs. | 3,195.7 | Rs. | 2,735.5 | US$ | 51.9 | Rs. | 3,250.8 | Rs. | 3,376.5 | ||||||||||||
|
|
|
|
|
| |||||||||||||||||||
| 2. | Land and buildings |
| 3. | Capital |
The Company challenged the legal validity of the legislation. In June 2012, the High Court of Calcutta (referred to as the “High Court”) ruled against the validity of the legislation and restored the Company’s rights under the land lease agreement. The State Government has filed an appeal in the Supreme Court of India. As of the date of the authorization of the financial statements, the Supreme Court has not concluded on the State Government appeal.
| Though the Company continues to rigorously press its rights, contentions and claims in the matter, the Company has been advised that the time it may take in disposal of the appeal is uncertain. The Company has also been advised that it has a good case to defend the appeal and will continue to pursue the case and assert its rights and its claims in the Court. |
The Company reasonably expects that the High Courts’ judgment, based on established law, will be upheld by the Supreme Court.
| In these circumstances, because of the unanticipated considerable lapse in the passage of time for resolution and in view of the uncertainty on the timing of resolution, the management has during the year ended March 31, 2015, made a provision for carrying capital cost of buildings at Singur amounting to Rs. 3,098.8 million. |
| Leases |
The Company has taken land, buildings, plant and equipment, computers and furniture and fixtures under operating and finance leases. The following is the summary of future minimum lease rental payments under non-cancellable operating leases and finance leases entered into by the Company:
| As of March 31, | As at March 31, | |||||||||||||||||||||||||||||||||||||||||||||||
| 2013 | 2012 | 2015 | 2014 | |||||||||||||||||||||||||||||||||||||||||||||
| (In millions) | Operating | Finance | Operating | Finance | ||||||||||||||||||||||||||||||||||||||||||||
| Operating | Finance | Operating | Finance | Minimum Lease Payments | Minimum Lease Payments | Present value of minimum lease payments | Minimum Lease Payments | Minimum Lease Payments | Present value of minimum lease payments | |||||||||||||||||||||||||||||||||||||||
| Minimum Lease Payments | Minimum Lease Payments | Present value of minimum lease payments | Minimum Lease Payments | Minimum Lease Payments | Present value of minimum lease payments | (In millions) | ||||||||||||||||||||||||||||||||||||||||||
Not later than one year | Rs.988.1 | Rs. | 732.0 | Rs. | 592.8 | Rs. | 926.4 | Rs. | 585.9 | Rs. | 524.7 | Rs. | 4,626.7 | Rs. | 755.1 | Rs. | 571.7 | Rs. | 2,973.7 | Rs. | 844.6 | Rs. | 711.9 | |||||||||||||||||||||||||
Later than one year but not later than five years | 1,863.1 | 1,959.0 | 1,684.3 | 2,375.9 | 1,760.7 | 1,550.5 | 5,775.6 | 919.9 | 907.5 | 4,401.5 | 1,567.4 | 1,497.0 | ||||||||||||||||||||||||||||||||||||
Later than five years | 9,632.0 | 157.8 | 149.5 | 9,288.3 | 3.7 | 3.3 | 11,127.2 | — | — | 10,545.8 | — | — | ||||||||||||||||||||||||||||||||||||
|
|
|
|
|
|
|
|
|
|
|
| |||||||||||||||||||||||||||||||||||||
Total minimum lease commitments | Rs. | 12,483.2 | Rs. | 2,848.8 | Rs. | 2,426.6 | Rs. | 12,590.6 | Rs. | 2,350.3 | Rs. | 2,078.5 | Rs. | 21,529.5 | Rs. | 1,675.0 | Rs. | 1,479.2 | Rs. | 17,921.0 | Rs. | 2,412.0 | Rs. | 2,208.9 | ||||||||||||||||||||||||
| US$ | 230.0 | US$ | 52.5 | US$ | 44.7 | US$ | 344.5 | US$ | 26.8 | US$ | 23.7 | |||||||||||||||||||||||||||||||||||||
Less: future finance charges | (422.2 | ) | (271.8 | ) | Rs. | (195.8 | ) | Rs. | (203.1 | ) | ||||||||||||||||||||||||||||||||||||||
|
|
|
| |||||||||||||||||||||||||||||||||||||||||||||
Present value of minimum lease payments | Rs. | 2,426.6 | Rs. | 2,078.5 | Rs. | 1,479.2 | Rs. | 2,208.9 | ||||||||||||||||||||||||||||||||||||||||
|
|
|
| |||||||||||||||||||||||||||||||||||||||||||||
Included in the financial statements as: | ||||||||||||||||||||||||||||||||||||||||||||||||
Other current financial liabilities (refer note 19) | Rs. | 592.8 | Rs. | 524.7 | ||||||||||||||||||||||||||||||||||||||||||||
Other non-current financial liabilities (refer note 23) | 1,833.8 | 1,553.8 | ||||||||||||||||||||||||||||||||||||||||||||||
Other financial liabilities – current (refer note 20) | Rs. | 571.7 | Rs. | 711.9 | ||||||||||||||||||||||||||||||||||||||||||||
Other financial liabilities – non-current (refer note 21) | 907.5 | 1,497.0 | ||||||||||||||||||||||||||||||||||||||||||||||
|
|
|
| |||||||||||||||||||||||||||||||||||||||||||||
| Rs. | 2,426.6 | Rs. | 2,078.5 | Rs. | 1,479.2 | Rs. | 2,208.9 | |||||||||||||||||||||||||||||||||||||||||
|
|
|
| |||||||||||||||||||||||||||||||||||||||||||||
| US$ | 44.7 | US$ | 23.7 | |||||||||||||||||||||||||||||||||||||||||||||
|
| |||||||||||||||||||||||||||||||||||||||||||||||
Total operating lease rent expense wasexpenses were Rs. 3,992.07,185.6 million, Rs. 2,863.66,521.6 million and Rs. 2,297.24,012.6 million for the years ended March 31, 2013, 20122015, 2014 and 2011,2013, respectively.
Significant leasing arrangements include lease of land under an operating lease for a period of 90 years with a renewal option for a further period of 90 years. Minimum lease payments for a period ‘later than five years’ includes Rs. 8,429.78,398.4 million relating to this leasing arrangement.
| Goodwill |
| As of March 31, | As at March 31, | |||||||||||||||||||||||
| 2013 | 2013 | 2012 | 2015 | 2015 | 2014 | |||||||||||||||||||
| (In millions) | (In millions) | |||||||||||||||||||||||
Balance at the beginning | US$ | 78.3 | Rs.4,253.0 | Rs.3,760.8 | US$ | 119.2 | Rs. 7,449.2 | Rs. 5,311.2 | ||||||||||||||||
Write off of goodwill | — | — | (45.7 | ) | ||||||||||||||||||||
Additions | — | — | 1,153.8 | |||||||||||||||||||||
Currency translation differences | 1.3 | 67.3 | 537.9 | (2.1 | ) | (129.7 | ) | 984.2 | ||||||||||||||||
|
|
|
|
|
| |||||||||||||||||||
Balance at the end | US$ | 79.6 | Rs. 4,320.3 | Rs. 4,253.0 | US$ | 117.1 | Rs. 7,319.5 | Rs. 7,449.2 | ||||||||||||||||
|
|
|
|
|
| |||||||||||||||||||
As ofat March 31, 2013,2015, goodwill of Rs. 229.81,307.0 million and Rs. 4,090.56,012.5 million relates to the automotive and related activity segment (Tata and other brand vehicles including financing thereof) and ‘others’“others” segment, respectively. As ofat March 31, 2012,2014, goodwill of Rs. 229.81,220.7 million and Rs. 4,023.26,228.5 million relates to the automotive and related activity segment (Tata and other brand vehicles including financing thereof) and ‘others’“others” segment, respectively.
As ofat March 31, 2013,2015, goodwill of Rs. 4,090.56,012.5 million has been allocated to software consultancy and services cash generating unit. The recoverable amount of the cash generating unit has been determined based on value in use. Value in use has been determined based on future cash flows, after considering current economic conditions and trends, estimated future operating results, growth rates and anticipated future economic conditions.
As ofat March 31, 2013,2015, the estimated cash flows for a period of 5 years were developed using internal forecasts, and a pre-tax discount rate of 16.91 %.11.05%. The cash flows beyond 5 years have been extrapolated assuming zero2% growth rates. The management believes that any reasonably possible change in the key assumptions would not cause the carrying amount to exceed the recoverable amount of the cash generating unit.
| Intangible assets |
Intangible assets consist of the following:
| Software | Patents and technological know how | Customer related | Intellectual property rights and other intangibles | Product development | Indefinite life trademarks and brands | Total | ||||||||||||||||||||||
| (In millions) | ||||||||||||||||||||||||||||
Cost as of April 1, 2012 | Rs. | 17,134.1 | Rs. | 12,434.2 | Rs. | 7,232.9 | Rs. | 207.8 | Rs. | 121,687.8 | Rs. | 50,407.5 | Rs. | 209,104.3 | ||||||||||||||
Additions through internal development | — | — | — | — | 87,930.1 | — | 87,930.1 | |||||||||||||||||||||
Other additions | 4,264.5 | 8.1 | — | — | — | — | 4,272.6 | |||||||||||||||||||||
Currency translation differences | 137.5 | 86.7 | 50.9 | — | (3,551.8 | ) | 354.9 | (2,921.8 | ) | |||||||||||||||||||
Disposal | (3,176.9 | ) | — | — | (152.7 | ) | — | — | (3,329.6 | ) | ||||||||||||||||||
|
|
|
|
|
|
|
|
|
|
|
|
|
| |||||||||||||||
Cost as of March 31, 2013 | 18,359.2 | 12,529.0 | 7,283.8 | 55.1 | 206,066.1 | 50,762.4 | 295,055.6 | |||||||||||||||||||||
Accumulated amortization (net of Rs.3,329.6 million in respect of disposals) | (9,578.0 | ) | (6,196.2 | ) | (3,480.1 | ) | (16.2 | ) | (66,370.5 | ) | — | (85,641.0 | ) | |||||||||||||||
|
|
|
|
|
|
|
|
|
|
|
|
|
| |||||||||||||||
Net carrying amount as of March 31, 2013 | Rs. | 8,781.2 | Rs. | 6,332.8 | Rs. | 3,803.7 | Rs. | 38.9 | Rs. | 139,695.6 | Rs. | 50,762.4 | Rs. | 209,414.6 | ||||||||||||||
Capital work-in-progress | 141,821.5 | |||||||||||||||||||||||||||
|
| |||||||||||||||||||||||||||
Total | Rs. | 351,236.1 | ||||||||||||||||||||||||||
|
| |||||||||||||||||||||||||||
| US$ | 6,470.2 | |||||||||||||||||||||||||||
|
|
|
|
|
|
|
|
|
|
|
|
|
| |||||||||||||||
Amortization for the year | Rs. | (3,267.0) | Rs. | (1,376.0) | Rs. | (257.9) | Rs. | — | Rs. | (30,734.5) | Rs. | — | Rs. | (35,635.4) | ||||||||||||||
|
|
|
|
|
|
|
|
|
|
|
|
|
| |||||||||||||||
| US$ | (656.5) | |||||||||||||||||||||||||||
|
| |||||||||||||||||||||||||||
Cost as of April 1, 2011 Additions through internal development Other additions Currency translation differences Disposal Cost as of March 31, 2012 Accumulated amortization (net of Rs. 165.6 million in respect of disposals) Net carrying amount as of March 31, 2012 Capital work-in-progress Total Amortization for the year Cost as at April 1, 2014 Additions Currency translation differences Disposal Fully amortized not in use Cost as at March 31, 2015 Accumulated amortization (net of Rs. 18,550.5 million in respect of disposals/fully amortized not in use) Net carrying amount as at March 31, 2015 Capital work-in-progress Total Amortization for the year Cost as at April 1, 2013 Acquisition through business combination Additions Currency translation differences Fully amortized not in use Cost as at March 31, 2014 Accumulated amortization (net of Rs. 14,788.0 million in respect of disposals/fully amortized not in use) Net carrying amount as at March 31, 2014 Capital work-in-progress Total Amortization for the year Software Patents and
technological
know how Customer
related Intellectual
property
rights and
other
intangibles Product
development Indefinite life
trademarks
and brands Total (In millions) Rs. 12,118.6 Rs. 10,954.5 Rs. 6,340.6 Rs. 177.3 Rs. 66,800.3 Rs. 44,188.7 Rs. 140,580.0 — — — — 47,027.8 — 47,027.8 3,793.1 1.2 — — — — 3,794.3 1,388.0 1,478.5 892.3 30.5 7,859.7 6,218.8 17,867.8 (165.6 ) — — — — — (165.6 ) 17,134.1 12,434.2 7,232.9 207.8 121,687.8 50,407.5 209,104.3 (9,418.2 ) (4,844.7 ) (3,212.1 ) (16.2 ) (38,045.9 ) — (55,537.1 ) Rs. 7,715.9 Rs. 7,589.5 Rs. 4,020.8 Rs. 191.6 Rs. 83,641.9 Rs. 50,407.5 Rs. 153,567.2 128,780.2 Rs. 282,347.4 Rs. (2,870.9 ) Rs. (959.8 ) Rs. (238.3 ) Rs. (3.6 ) Rs. (18,513.2 ) Rs. — Rs. (22,585.8 ) Software Patents and
technological
know how Customer
related Intellectual
property
rights and
other
intangibles Product
development Indefinite life
trademarks
and brands Total (In millions) Rs. 29,605.0 Rs. 15,283.8 Rs. 9,075.5 Rs. 780.1 Rs. 291,062.9 Rs. 61,543.6 Rs. 407,350.9 17,472.0 287.9 — 33.2 151,835.9 — 169,629.0 (2,802.4 ) (1,041.1 ) (459.1 ) (1.9 ) (24,898.4 ) (4,378.8 ) (33,581.7 ) (691.8 ) — — — — — (691.8 ) — — (2,748.9 ) — (15,637.6 ) — (18,386.5 ) 43,582.8 14,530.6 5,867.5 811.4 402,362.8 57,164.8 524,319.9 (18,085.1 ) (9,783.4 ) (1,952.8 ) (349.4 ) (155,293.7 ) — (185,464.4 ) Rs. 25,497.7 Rs. 4,747.2 Rs. 3,914.7 Rs. 462.0 Rs. 247,069.1 Rs. 57,164.8 Rs. 338,855.5 192,045.3 Rs. 530,900.8 US$ 8,494.4 Rs. (5,061.1 ) Rs. (1,354.9 ) Rs. (317.1 ) Rs. (99.1 ) Rs. (62,265.5 ) Rs. — Rs. (69,097.7 ) US$ (1,105.5 ) Rs. 18,513.5 Rs. 12,718.5 Rs. 7,283.8 Rs. 55.1 Rs. 208,300.0 Rs. 50,762.4 Rs. 297,633.3 62.0 — 219.7 — — — 281.7 8,697.8 2.2 — 659.7 60,677.9 — 70,037.6 3,084.1 2,563.1 1,572.0 65.3 36,120.6 10,781.2 54,186.3 (752.4 ) — — — (14,035.6 ) — (14,788.0 ) 29,605.0 15,283.8 9,075.5 780.1 291,062.9 61,543.6 407,350.9 (14,045.6 ) (9,092.3 ) (4,601.0 ) (198.0 ) (116,913.5 ) — (144,850.4 ) Rs. 15,559.4 Rs. 6,191.5 Rs. 4,474.5 Rs. 582.1 Rs. 174,149.4 Rs. 61,543.6 Rs. 262,500.5 229,683.6 Rs. 492,184.1 Rs. (3,487.2 ) Rs. (1,489.8 ) Rs. (343.8 ) Rs. (73.7 ) Rs. (52,642.2 ) Rs. — Rs. (58,036.7 )
The useful life of trademarks and brands in respect of the acquired Jaguar Land Rover businesses have been determined to be indefinite as the Company expects to generate future economic benefits indefinitely from these assets.
The indefinite life intangible assets have been allocated to the Jaguar Land Rover businesses. The recoverable amount of the cash generating unit has been determined based on value in use. Value in use has been determined based on future cash flows after considering current economic conditions and trends, estimated future operating results, growth rates and anticipated future economic conditions.
The estimated cash flows for a period of five years were developed using internal forecasts, and a pre-tax discount rate of 10.2%11.2%. The cash flows beyond five years have been extrapolated assuming zero2.2% growth rate. The management believes that any reasonably possible change in the key assumptions would not cause the carrying amount to exceed the recoverable amount of the cash generating unit.
During the year ended March 31, 2014, legislation was enacted that allows United Kingdom (UK) companies to elect for the Research and Development Expenditure Credit (RDEC) on qualifying expenditures incurred since April 1, 2013, instead of the existing super-deduction rules. As a result of this election by the Company’s subsidiary in the UK, Rs. 6,458.1 million and Rs. 4,308.6 million of the RDEC, for the years ended March 31, 2015 and 2014, respectively, the proportion relating to capitalized product development expenditure, have been off set against these assets. The remaining Rs. 2,908.6 million and Rs. 1,711.9 million for the years ended March 31, 2015 and 2014, respectively, have been recognized as miscellaneous income, a component of other income / (loss) (net).
| Investments in equity accounted investees: |
| Associates: |
SummarizedThe Company has no material associates as at March 31, 2015. The aggregate summarized financial information in respect of the Company’s immaterial associates that are accounted for using the equity method is as follows:set forth below.
| As of March 31, | ||||||||||||
| 2013 | 2013 | 2012 | ||||||||||
| (In millions) | ||||||||||||
Total assets | US$ | 1,034.6 | Rs. | 56,161.9 | Rs. | 58,339.7 | ||||||
Total liabilities | 677.4 | 36,772.8 | 42,151.4 | |||||||||
Carrying amount of investment in associates | US$ | 346.9 | Rs. | 18,830.2 | Rs. | 18,151.0 | ||||||
| As at March 31, | ||||||||||||
| 2015 | 2015 | 2014 | ||||||||||
| (In millions) | ||||||||||||
Carrying amount of the Company’s interest in associates | US$ | 91.5 | Rs. | 5,718.4 | Rs. | 6,409.4 | ||||||
| Year ended March 31, | ||||||||||||||||
| 2013 | 2013 | 2012 | 2011 | |||||||||||||
| (In millions) | ||||||||||||||||
Total revenue | US$ | 1,495.8 | Rs. | 81,199.7 | Rs. | 101,269.6 | Rs. | 75,392.7 | ||||||||
Total profits for the period | 100.6 | 5,462.5 | 1,788.5 | 3,210.9 | ||||||||||||
Company’s share in profit* | US$ | 22.3 | Rs. | 1,211.8 | Rs. | 275.8 | Rs. | 856.2 | ||||||||
| Year ended March 31, | ||||||||||||||||
| 2015 | 2015 | 2014 | 2013 | |||||||||||||
| (In millions) | ||||||||||||||||
Company’s share of profit/(loss) in associates* | US$ | (10.2 | ) | Rs. (632.7 | ) | Rs. (1,142.0 | ) | Rs. 884.2 | ||||||||
Company’s share of other comprehensive income in associates | 1.5 | 95.1 | (151.8 | ) | 26.4 | |||||||||||
Company’s share of total comprehensive income in associates | US$ | (8.7 | ) | Rs. (537.6 | ) | Rs. (1,293.8 | ) | Rs. 910.6 | ||||||||
| (i) |
| Fair value of investment in an equity accounted associate for which published price quotation is available, which is a level 1 input, was |
Summarized financial information in respect of the Company’s jointly controlled entities (adjusted for the percentage of the ownership held by the Company) is as follows:
| As of March 31, | ||||||||||||
| 2013 | 2013 | 2012 | ||||||||||
| (In millions) | ||||||||||||
Current assets | US$ | 271.2 | Rs. 14,722.6 | Rs. 7,229.1 | ||||||||
Non-current assets | 285.3 | 15,489.3 | 15,587.3 | |||||||||
Current liabilities | 230.5 | 12,510.0 | 10,448.7 | |||||||||
Non-current liabilities | 128.4 | 6,971.2 | 8,313.9 | |||||||||
Carrying amount of investment in jointly controlled entities | US$ | 213.0 | Rs. 11,561.5 | Rs. 5,114.9 | ||||||||
| Year ended March 31, | ||||||||||||||||
| 2013 | 2013 | 2012 | 2011 | |||||||||||||
| (In millions) | ||||||||||||||||
Income | US$ | 338.8 | Rs. 18,393.4 | Rs. | 17,810.3 | Rs. | 19,515.1 | |||||||||
Expenses | 329.1 | 17,865.6 | 18,319.5 | 20,764.7 | ||||||||||||
Company’s share of profit/ (loss)* | US$ | 9.6 | Rs. 521.7 | Rs. | (626.9) | Rs. | (1,314.6) | |||||||||
| (i) |
| Principal activity | Principal place of the business | % holding as at March 31, | ||||||||||||
Name of joint venture | 2015 | 2014 | ||||||||||||
Chery Jaguar Land Rover Automotive Co. Limited (Chery) | Manufacture and assembly of vehicles | China | 50 | % | 50 | % | ||||||||
Chery is a limited liability company, whose legal form confers separation between the parties to the joint arrangement. There is no contractual arrangement or any other facts and circumstances that indicate that the parties to the joint venture have rights to the assets and obligations for the liabilities of the joint arrangement. Accordingly, Chery is classified as a joint venture. The summarized financial information in respect of Chery that is accounted for using the equity method is set forth below.
| As at March 31, | ||||||||||||
| 2015 | 2015 | 2014 | ||||||||||
| (In millions) | ||||||||||||
Current assets | US$ | 770.0 | Rs. | 48,122.3 | Rs. | 16,879.4 | ||||||
Non-current assets | 867.7 | 54,232.8 | 23,490.3 | |||||||||
Current liabilities | (511.8 | ) | (31,987.3 | ) | (6,668.9 | ) | ||||||
Non-current liabilities | (285.5 | ) | (17,842.6 | ) | (6,469.8 | ) | ||||||
The above amounts of assets and liabilities include the following: | ||||||||||||
Cash and cash equivalents | 436.4 | 27,272.4 | 12,143.3 | |||||||||
Non-current financial liabilities (excluding trade and other payables and provisions) | (285.5 | ) | (17,842.6 | ) | (6,469.8 | ) | ||||||
Share of net assets of material joint venture | 420.2 | 26,262.6 | 13,615.5 | |||||||||
Other consolidation adjustments | (8.5 | ) | (530.1 | ) | — | |||||||
Carrying amount of the Company’s interest in joint venture | US$ | 411.7 | Rs. | 25,732.5 | Rs. | 13,615.5 | ||||||
Revenue Net income/(loss) Other comprehensive income Total comprehensive income for the year The above net income includes the following: Depreciation and amortization Interest income Interest expense (net) income tax expense/(credit) Year ended March 31, 2015 2015 2014 2013 (In millions) US$ 249.3 Rs. 15,578.4 Rs. — Rs. — (21.8 ) (1,365.2 ) (1,614.4 ) (1,632.8 ) 34.3 2,142.2 1,016.8 — 12.5 777.0 (597.6 ) (1,632.8 ) 25.2 1,577.6 96.2 — (12.6 ) (788.8 ) (192.3 ) — 4.7 295.8 96.2 — (9.5 ) (591.6 ) (1,250.2 ) —
Reconciliation of above summarized financial information to the carrying amount of the interest in the joint venture recognized in the consolidated financial statements:
| As at March 31, | ||||||||||||
| 2015 | 2015 | 2014 | ||||||||||
| (In millions) | ||||||||||||
Net assets of the joint venture | US$ | 840.4 | Rs. | 52,525.2 | Rs. | 27,231.0 | ||||||
Proportion of the Company’s interest in joint venture | 420.2 | 26,262.6 | 13,615.5 | |||||||||
Other consolidation adjustments | (8.5 | ) | (530.1 | ) | — | |||||||
|
|
|
|
|
| |||||||
Carrying amount of the Company’s interest in joint venture | US$ | 411.7 | Rs. | 25,732.5 | Rs. | 13,615.5 | ||||||
|
|
|
|
|
| |||||||
During the years ended March 31, 2015 and 2014, the Company has made additional investment of Rs. 12,258.6 million and Rs. 9,007.6 million, respectively in Chery.
| (ii) |
| As at March 31, | ||||||||||||
| 2015 | 2015 | 2014 | ||||||||||
| (In millions) | ||||||||||||
Carrying amount of the Company’s interest in joint ventures | US$ | 4.6 | Rs. | 285.7 | Rs. | 211.8 | ||||||
| Year ended March 31, | ||||||||||||||||
| 2015 | 2015 | 2014 | 2013 | |||||||||||||
| (In millions) | ||||||||||||||||
Company’s share of profit/(loss) in joint ventures* | US$ | 1.6 | Rs. | 97.1 | Rs. | 71.6 | Rs. | (199.3 | ) | |||||||
Company’s share of other comprehensive income in joint ventures | (0.4 | ) | (23.2 | ) | 73.4 | 1.0 | ||||||||||
Company’s share of total comprehensive income in joint ventures | US$ | 1.2 | Rs. | 73.9 | Rs. | 145.0 | Rs. | (198.3 | ) | |||||||
| Summary of carrying amount of |
| As of March 31, | ||||||||||||
| 2013 | 2013 | 2012 | ||||||||||
| (In millions) | ||||||||||||
Carrying amount of investment in associates | US$ | 346.9 | Rs.18,830.2 | Rs. 18,151.0 | ||||||||
Carrying amount of investment in jointly controlled entities | 213.0 | 11,561.5 | 5,114.9 | |||||||||
|
|
|
|
|
| |||||||
Total | US$ | 559.9 | Rs.30,391.7 | Rs. 23,265.9 | ||||||||
|
|
|
|
|
| |||||||
| As at March 31, | ||||||||||||
| 2015 | 2015 | 2014 | ||||||||||
| (In millions) | ||||||||||||
Carrying amount in immaterial associates | US$ | 91.5 | Rs. | 5,718.4 | Rs. | 6,409.4 | ||||||
Carrying amount in material joint venture | 411.7 | 25,732.5 | 13,615.5 | |||||||||
Carrying amount in immaterial joint ventures | 4.6 | 285.7 | 211.8 | |||||||||
|
|
|
|
|
| |||||||
Total | US$ | 507.8 | Rs. | 31,736.6 | Rs. | 20,236.7 | ||||||
|
|
|
|
|
| |||||||
| (d) | Summary of Company’s share of profit/(loss) in equity accounted investees: |
| Year ended March 31, | ||||||||||||||||
| 2015 | 2015 | 2014 | 2013 | |||||||||||||
| (In millions) | ||||||||||||||||
Share of profit/(loss) in immaterial associates | US$ | (10.2 | ) | Rs. | (632.7 | ) | Rs. | (1,142.0 | ) | Rs. | 884.2 | |||||
Share of profit/(loss) in material joint venture | (10.9 | ) | (682.6 | ) | (807.2 | ) | (816.4 | ) | ||||||||
Share of profit/(loss) on other adjustments in material joint venture | (8.5 | ) | (530.1 | ) | — | — | ||||||||||
Share of profit/(loss) in immaterial joint ventures | 1.6 | 97.1 | 71.6 | (199.3 | ) | |||||||||||
|
|
|
|
|
|
|
| |||||||||
| US$ | (28.0 | ) | Rs. | (1,748.3 | ) | Rs. | (1,877.6 | ) | Rs. | (131.5 | ) | |||||
|
|
|
|
|
|
|
| |||||||||
| (e) | Summary of Company’s share of other comprehensive income in equity accounted investees: |
| Year ended March 31, | ||||||||||||||||
| 2015 | 2015 | 2014 | 2013 | |||||||||||||
| (In millions) | ||||||||||||||||
Share of other comprehensive income in immaterial associates | US$ | 1.5 | Rs. | 95.1 | Rs. | (151.8 | ) | Rs. | 26.4 | |||||||
Share of other comprehensive income in material joint venture | 17.2 | 1,071.1 | 508.4 | — | ||||||||||||
Share of other comprehensive income in immaterial joint ventures | (0.4 | ) | (23.2 | ) | 73.4 | 1.0 | ||||||||||
|
|
|
|
|
|
|
| |||||||||
| US$ | 18.3 | Rs. | 1,143.0 | Rs. | 430.0 | Rs. | 27.4 | |||||||||
|
|
|
|
|
|
|
| |||||||||
| * | Company’s share of profit/(loss) of the equity accounted investees has been determined after giving effect for the subsequent amortization/depreciation and other adjustments arising on account of fair value adjustments made to the identifiable net |
| Income taxes |
The domestic and foreign components of net income before income tax:
| Year ended March 31, | Year ended March 31, | |||||||||||||||||||||||||||||||
| 2013 | 2013 | 2012 | 2011 | 2015 | 2015 | 2014 | 2013 | |||||||||||||||||||||||||
| (In millions) | (In millions) | |||||||||||||||||||||||||||||||
Net income before income taxes | ||||||||||||||||||||||||||||||||
India | US$ | (175.3 | ) | Rs. | (9,512.9 | ) | Rs. | 8,164.7 | Rs. | 8,956.3 | US$ | (999.2 | ) | Rs. | (62,451.7 | ) | Rs. | (61,601.7 | ) | Rs. | (9,456.7 | ) | ||||||||||
Other than India | 2,547.4 | 138,286.6 | 112,982.8 | 77,579.7 | 4,170.9 | 260,683.8 | 241,006.8 | 138,252.2 | ||||||||||||||||||||||||
|
|
|
|
|
|
|
| |||||||||||||||||||||||||
Total | US$ | 2,372.1 | Rs. | 128,773.7 | Rs. | 121,147.5 | Rs. | 86,536.0 | US$ | 3,171.7 | Rs. | 198,232.1 | Rs. | 179,405.1 | Rs. | 128,795.5 | ||||||||||||||||
|
|
|
|
|
|
|
| |||||||||||||||||||||||||
The domestic and foreign components of income tax expense:
| Year ended March 31, | Year ended March 31, | |||||||||||||||||||||||||||||||
| 2013 | 2013 | 2012 | 2011 | 2015 | 2015 | 2014 | 2013 | |||||||||||||||||||||||||
| (In millions) | (In millions) | |||||||||||||||||||||||||||||||
Current taxes | ||||||||||||||||||||||||||||||||
India | US$ | 55.0 | Rs. | 2,986.1 | Rs. | 5,410.9 | Rs. | 6,615.3 | US$ | 16.2 | Rs. | 1,014.9 | Rs. | 1,770.4 | Rs. | 3,016.2 | ||||||||||||||||
Other than India | 483.9 | 26,267.3 | 15,603.8 | 10,603.7 | 602.6 | 37,660.5 | 34,797.8 | 26,267.3 | ||||||||||||||||||||||||
Deferred taxes | ||||||||||||||||||||||||||||||||
India | (46.9 | ) | (2,543.0 | ) | (2,834.1 | ) | 362.1 | 146.2 | 9,134.7 | (14,102.7 | ) | (2,516.9 | ) | |||||||||||||||||||
Other than India | 229.9 | 12,480.1 | (13,473.5 | ) | (4,793.8 | ) | 341.4 | 21,339.6 | 25,761.0 | 12,472.2 | ||||||||||||||||||||||
|
|
|
|
|
|
|
| |||||||||||||||||||||||||
Total income tax expense | US$ | 721.9 | Rs. | 39,190.5 | Rs. | 4,707.1 | Rs. | 12,787.3 | US$ | 1,106.4 | Rs. | 69,149.7 | Rs. | 48,226.5 | Rs. | 39,238.8 | ||||||||||||||||
|
|
|
|
|
|
|
| |||||||||||||||||||||||||
The reconciliation of estimated income tax to income tax expense is as follows:
| For the years ended March 31, | Year ended March 31, | |||||||||||||||||||||||||||||||
| 2013 | 2013 | 2012 | 2011 | 2015 | 2015 | 2014 | 2013 | |||||||||||||||||||||||||
| (In millions) | (In millions) | |||||||||||||||||||||||||||||||
Income before income taxes | US$ | 2,372.1 | Rs. | 128,773.7 | Rs. | 121,147.5 | Rs. | 86,536.0 | US$ | 3,171.7 | Rs. | 198,232.1 | Rs. | 179,405.1 | Rs. | 128,795.5 | ||||||||||||||||
Income tax expense at tax rates applicable to individual entities | 560.9 | 30,450.6 | 32,581.0 | 24,034.5 | 611.9 | 38,245.2 | 35,741.4 | 30,460.9 | ||||||||||||||||||||||||
Additional deduction for research and product development cost | (145.4 | ) | (7,892.5 | ) | (7,501.4 | ) | (5,583.5 | ) | (115.2 | ) | (7,202.9 | ) | (8,561.7 | ) | (7,936.3 | ) | ||||||||||||||||
Items (net) not deductible for tax / not liable to tax : | ||||||||||||||||||||||||||||||||
- foreign currency (gain) / loss relating to loans and deposits (net) | 6.3 | 340.9 | 487.5 | 305.5 | ||||||||||||||||||||||||||||
Items (net) not deductible for tax/not liable to tax: | ||||||||||||||||||||||||||||||||
- foreign currency (gain)/loss relating to loans and deposits (net) | 16.7 | 1,046.3 | 227.3 | 340.9 | ||||||||||||||||||||||||||||
- interest, loss on conversion option and other expenses relating to borrowings for investment | 43.3 | 2,350.6 | 1,698.6 | 7,545.4 | 24.6 | 1,536.5 | 2,302.3 | 2,350.6 | ||||||||||||||||||||||||
- Dividend from subsidiary and others | 76.1 | 4,132.6 | — | — | ||||||||||||||||||||||||||||
Undistributed earnings of subsidiaries and associates | 103.4 | 5,611.1 | 4,497.9 | 2,131.6 | ||||||||||||||||||||||||||||
Loss in respect of which deferred tax assets not recognized due to uncertainty | 10.7 | 582.0 | 990.1 | 579.5 | ||||||||||||||||||||||||||||
Utilization / credit of unrecognised tax losses and unabsorbed depreciation | (0.3 | ) | (18.9 | ) | (29,528.7 | ) | (17,070.3 | ) | ||||||||||||||||||||||||
Tax on share of loss of equity accounted investees | (11.8 | ) | (638.4 | ) | 111.3 | 152.3 | ||||||||||||||||||||||||||
- Dividend from subsidiaries, joint operations, equity accounted investees and available-for-sale investments | (1.3 | ) | (83.8 | ) | 4,572.2 | 4,132.6 | ||||||||||||||||||||||||||
Tax effect on shares repurchased by a wholly-owned subsidiary | 71.5 | 4,468.7 | — | — | ||||||||||||||||||||||||||||
Undistributed earnings of subsidiaries, joint operations and equity accounted investees | 124.9 | 7,804.6 | 12,993.6 | 5,611.1 | ||||||||||||||||||||||||||||
Deferred tax assets not recognized because realization is not probable | 334.9 | 20,932.5 | 684.8 | 582.0 | ||||||||||||||||||||||||||||
Utilization/credit of unrecognized tax losses, unabsorbed depreciation and other tax benefits | (9.5 | ) | (596.8 | ) | (3,257.0 | ) | (517.6 | ) | ||||||||||||||||||||||||
Previously recognized deferred tax assets written down | 124.3 | 7,771.8 | 7,318.0 | — | ||||||||||||||||||||||||||||
Tax on share of (profit)/loss of equity accounted investees (net) | 5.3 | 333.7 | 537.3 | (33.7 | ) | |||||||||||||||||||||||||||
Impact of change in statutory tax rates | 28.2 | 1,533.2 | — | — | (128.0 | ) | (7,999.7 | ) | (5,299.9 | ) | 1,548.1 | |||||||||||||||||||||
Others | 50.5 | 2,739.3 | 1,370.8 | 692.3 | 46.3 | 2,893.6 | 968.2 | 2,700.2 | ||||||||||||||||||||||||
|
|
|
|
|
|
|
| |||||||||||||||||||||||||
Income tax expense reported | US$ | 721.9 | Rs. | 39,190.5 | Rs. | 4,707.1 | Rs. | 12,787.3 | US$ | 1,106.4 | Rs. | 69,149.7 | Rs. | 48,226.5 | Rs. | 39,238.8 | ||||||||||||||||
|
|
|
|
|
|
|
| |||||||||||||||||||||||||
The United Kingdom (UK) corporation tax rate changed from 23% to 21% with effect from April 1, 2014 and to 20% with effect from April 1, 2015. Accordingly, UK deferred tax has been recognized at 20% as at March 31, 2015 and 2014, as the majority of the temporary differences are expected to reverse at that rate.
Significant components of deferred tax assetassets and liabilityliabilities for the year ended March 31, 20132015 are as follows:
| Opening balance | Recognised in profit or loss | Recognised in / reclassified from other comprehensive income | Closing balance | Opening balance | Recognized in profit or loss | Recognized in /reclassified from other comprehensive income | Closing balance | |||||||||||||||||||||||||
(In millions) | (In millions) | |||||||||||||||||||||||||||||||
Deferred tax assets: | ||||||||||||||||||||||||||||||||
Depreciation carry forwards | Rs. | 5,284.8 | Rs. | 4,857.0 | Rs. | — | Rs. | 10,141.8 | Rs. | 15,428.6 | Rs. | 415.8 | Rs. | — | Rs. | 15,844.4 | ||||||||||||||||
Business loss carry forwards | 50,545.8 | (2,964.8 | ) | 611.5 | 48,192.5 | 59,116.8 | (19,369.2 | ) | (1,563.6 | ) | 38,184.0 | |||||||||||||||||||||
Expenses deductible in future years | ||||||||||||||||||||||||||||||||
– provisions, allowances for doubtful receivables, finance receivables | 13,445.5 | 7,121.0 | (246.9 | ) | 20,319.6 | |||||||||||||||||||||||||||
– Interest and fair value change on conversion option | 1,711.1 | (1,711.1 | ) | — | — | |||||||||||||||||||||||||||
Expenses deductible in future years: | ||||||||||||||||||||||||||||||||
- provisions, allowances for doubtful receivables and others | 30,192.5 | 4,330.8 | (420.6 | ) | 34,102.7 | |||||||||||||||||||||||||||
Compensated absences and retirement benefits | 9,307.5 | (266.9 | ) | 5,932.5 | 14,973.1 | 14,627.8 | (2,100.3 | ) | 6,165.6 | 18,693.1 | ||||||||||||||||||||||
Minimum alternate tax carry- forward | 14,513.0 | 627.0 | — | 15,140.0 | ||||||||||||||||||||||||||||
Minimum alternate tax carry-forward | 7,879.2 | (6,980.5 | ) | — | 898.7 | |||||||||||||||||||||||||||
Property, plant and equipment | 11,841.8 | 25.7 | 82.1 | 11,949.6 | 7,416.6 | (6,496.1 | ) | (58.7 | ) | 861.8 | ||||||||||||||||||||||
Derivative financial instruments | 1,491.9 | (677.3 | ) | 4,144.1 | 4,958.7 | — | 3,192.5 | 20,958.5 | 24,151.0 | |||||||||||||||||||||||
Others | 7,131.6 | (199.9 | ) | 27.4 | 6,959.1 | 16,471.1 | 2,448.9 | (1,192.2 | ) | 17,727.8 | ||||||||||||||||||||||
|
|
|
|
|
|
|
| |||||||||||||||||||||||||
Total deferred tax asset | Rs. | 115,273.0 | Rs. | 6,810.7 | Rs. | 10,550.7 | Rs. | 132,634.4 | ||||||||||||||||||||||||
Total deferred tax assets | Rs. | 151,132.6 | Rs. | (24,558.1 | ) | Rs. | 23,889.0 | Rs. | 150,463.5 | |||||||||||||||||||||||
|
|
|
|
|
|
|
| |||||||||||||||||||||||||
Deferred tax liabilities: | ||||||||||||||||||||||||||||||||
Property, plant and equipment | 12,196.1 | 807.9 | 10.2 | 13,014.2 | 15,231.1 | 595.4 | (6.6 | ) | 15,819.9 | |||||||||||||||||||||||
Intangible assets | 61,537.3 | 13,659.0 | (165.1 | ) | 75,031.2 | 93,076.0 | 15,601.4 | (6,036.2 | ) | 102,641.2 | ||||||||||||||||||||||
Undistributed earnings in subsidiaries and associates | 9,213.4 | 2,120.6 | * | (36.2 | ) | 11,297.8 | ||||||||||||||||||||||||||
Undistributed earnings in subsidiaries, joint operations and equity accounted investees | 24,096.4 | (9,414.2 | )* | (416.8 | ) | 14,265.4 | ||||||||||||||||||||||||||
Fair valuation of retained interest in a subsidiary subsequent to disposal of controlling equity interest | 2,843.0 | — | — | 2,843.0 | 169.5 | — | — | 169.5 | ||||||||||||||||||||||||
Derivative financial instruments | 13,342.1 | 3.1 | (13,327.7 | ) | 17.5 | |||||||||||||||||||||||||||
Others | 694.1 | 160.3 | 56.7 | 911.1 | 1,338.8 | (869.5 | ) | 68.7 | 538.0 | |||||||||||||||||||||||
|
|
|
|
|
|
|
| |||||||||||||||||||||||||
Total deferred tax liability | Rs. | 86,483.9 | Rs. | 16,747.8 | Rs. | (134.4 | ) | Rs. | 103,097.3 | |||||||||||||||||||||||
Total deferred tax liabilities | Rs. | 147,253.9 | Rs. | 5,916.2 | Rs. | (19,718.6 | ) | Rs. | 133,451.5 | |||||||||||||||||||||||
|
|
|
|
|
|
|
| |||||||||||||||||||||||||
Net assets / (liability) | Rs. | 28,789.1 | Rs. | (9,937.1 | ) | Rs. | 10,685.1 | Rs. | 29,537.1 | |||||||||||||||||||||||
Net assets/(liabilities) | Rs. | 3,878.7 | Rs. | (30,474.3 | ) | Rs. | 43,607.6 | Rs. | 17,012.0 | |||||||||||||||||||||||
|
|
|
|
|
|
|
| |||||||||||||||||||||||||
| US$ | 530.3 | US$ | (183.0 | ) | US$ | 196.9 | US$ | 544.2 | US$ | 62.1 | US$ | (487.6 | ) | US$ | 697.7 | US$ | 272.2 | |||||||||||||||
|
|
|
|
|
|
|
| |||||||||||||||||||||||||
Deferred tax asset | US$ | 832.7 | Rs. | 45,205.2 | ||||||||||||||||||||||||||||
Deferred tax liability | US$ | (288.5 | ) | Rs. | (15,668.1 | ) | ||||||||||||||||||||||||||
Deferred tax assets | US$ | 647.7 | Rs. | 40,478.8 | ||||||||||||||||||||||||||||
Deferred tax liabilities | US$ | (375.5 | ) | Rs. | (23,466.8 | ) | ||||||||||||||||||||||||||
| * | Net |
In fiscal 2012, the Group recognised all previously unrecognised unused tax losses and other temporary differences pertaining to the subsidiary company in the UK of Rs. 38,934.2 million in light of the planned consolidation of the UK manufacturing business in fiscal 2013 and business forecasts showing continuing profitability. Accordingly, Rs. 11,553.4 million of previously unrecognised deductible temporary differences has been utilised to reduce current tax expense and previously unrecognized deferred tax benefit of Rs.17,975.3 million and Rs. 9,405.5 million has been recognized in the income statement and other comprehensive income respectively during the year ended
As at March 31, 2012.
As of March 31, 2013,2015, unrecognized deferred tax assets amount to Rs. 776.317,547.5 million and Rs. 6,534.4Rs.15,243.1 million, which can be carried forward indefinitely and uptoup to a specified period, respectively. These relate primarily to business and capital losses.losses, and other deductible temporary differences. The deferred tax asset has not been recognized on the basis that its recovery is not probable in the foreseeable future.
Tata Motors Limited (on standalone basis, being its tax status) is liable to pay Minimum Alternate Tax (MAT). Under the Indian Income tax laws, the tax paid under MAT provisions can be carried forward and set-off against future income tax liabilities computed under normal tax provisions within a period of ten years. Deferred tax assets of Tata Motors Limited (on standalone basis, being its tax status) as at March 31, 2013 of Rs. 10,031.2 million towards depreciation, Rs. 2,450.4 million towards business loss and Rs. 15,089.8 million towards credit for MAT paid, have been recognized on the basis of estimated taxable income for future years and computation of tax liability.
Unrecognized deferred tax assets expire unutilized based on the year of origination as follows:
March 31, | In millions | In millions | ||||||||||||||
2014 | Rs. | 338.8 | US$ | 6.2 | ||||||||||||
2015 | 393.8 | 7.3 | ||||||||||||||
2016 | 239.3 | 4.4 | Rs. | 435.9 | US$ | 7.0 | ||||||||||
2017 | 308.7 | 5.7 | 4,011.0 | 64.2 | ||||||||||||
2018 | 257.6 | 4.7 | 236.1 | 3.8 | ||||||||||||
2019 | 644.8 | 10.3 | ||||||||||||||
2020 | 304.4 | 4.9 | ||||||||||||||
Thereafter | Rs. | 4,996.2 | US$ | 92.1 | Rs. | 9,610.9 | US$ | 153.8 | ||||||||
The Company has not recognized deferred tax liability on undistributed profits of certain subsidiaries amounting to Rs. 153,647.3395,442.1 million because it is able to control the timing of the reversal of temporary differences associated with such undistributed profits and it is probable that such differences will not reverse in the foreseeable future.
Significant components of deferred tax assetassets and liabilityliabilities for the year ended March 31, 20122014 are as follows:
| Opening balance | Recognised in profit or loss | Recognised in / reclassified from other comprehensive income | Closing balance | Opening balance | Recognized in profit or loss | Recognized in /reclassified from other comprehensive income | Acquisition of subsidiary | Closing balance | ||||||||||||||||||||||||||||
| (In millions) | (In millions) | |||||||||||||||||||||||||||||||||||
Deferred tax assets: | ||||||||||||||||||||||||||||||||||||
Depreciation carry forwards | Rs. | 2,330.5 | Rs. | 2,954.3 | Rs. | — | Rs. | 5,284.8 | Rs. | 10,184.6 | Rs. | 5,244.0 | Rs. | — | Rs. | — | Rs. | 15,428.6 | ||||||||||||||||||
Business loss carry forwards | 610.6 | 48,131.9 | 1,803.3 | 50,545.8 | 49,983.4 | (926.1 | ) | 9,992.3 | 67.2 | 59,116.8 | ||||||||||||||||||||||||||
Expenses deductible in future years | ||||||||||||||||||||||||||||||||||||
– provisions, allowances for doubtful receivables, finance receivables | 10,957.6 | 1,341.3 | 1,146.6 | 13,445.5 | ||||||||||||||||||||||||||||||||
– interest and fair value change on conversion option | 1,263.9 | 447.2 | — | 1,711.1 | ||||||||||||||||||||||||||||||||
Expenses deductible in future years: | ||||||||||||||||||||||||||||||||||||
- provisions, allowances for doubtful receivables and others | 20,319.6 | 8,807.4 | 1,065.5 | — | 30,192.5 | |||||||||||||||||||||||||||||||
Compensated absences and retirement benefits | 4,929.0 | (8,817.7 | ) | 13,196.2 | 9,307.5 | 14,985.6 | (2,902.7 | ) | 2,541.2 | 3.7 | 14,627.8 | |||||||||||||||||||||||||
Minimum alternate tax carry- forward | 11,581.6 | 2,931.4 | — | 14,513.0 | ||||||||||||||||||||||||||||||||
Minimum alternate tax carry-forward | 15,170.6 | (7,291.4 | ) | — | — | 7,879.2 | ||||||||||||||||||||||||||||||
Property, plant and equipment | 15,994.3 | (6,175.8 | ) | 2,023.3 | 11,841.8 | 11,981.4 | (7,168.1 | ) | 2,603.3 | — | 7,416.6 | |||||||||||||||||||||||||
Derivative financial instruments | — | 762.3 | 729.6 | 1,491.9 | 4,958.7 | — | (4,958.7 | ) | — | — | ||||||||||||||||||||||||||
Others | 4,124.8 | 2,457.9 | 548.9 | 7,131.6 | 6,963.9 | 7,956.2 | 1,551.0 | — | 16,471.1 | |||||||||||||||||||||||||||
|
|
|
|
|
|
|
|
| ||||||||||||||||||||||||||||
Total deferred tax asset | Rs. | 51,792.3 | Rs. | 44,032.8 | Rs. | 19,447.9 | Rs. | 115,273.0 | ||||||||||||||||||||||||||||
Total deferred tax assets | Rs. | 134,547.8 | Rs. | 3,719.3 | Rs. | 12,794.6 | Rs. | 70.9 | Rs. | 151,132.6 | ||||||||||||||||||||||||||
|
|
|
|
|
|
|
|
| ||||||||||||||||||||||||||||
Deferred tax liabilities: | ||||||||||||||||||||||||||||||||||||
Property, plant and equipment | 11,598.2 | 573.7 | 24.2 | 12,196.1 | 15,216.8 | 5.6 | 7.4 | 1.3 | 15,231.1 | |||||||||||||||||||||||||||
Intangible assets | 33,912.3 | 24,067.8 | 3,557.2 | 61,537.3 | 75,031.2 | 6,231.5 | 11,738.6 | 74.7 | 93,076.0 | |||||||||||||||||||||||||||
Undistributed earnings in subsidiaries and associates | 4,364.7 | 4,497.9 | 350.8 | 9,213.4 | ||||||||||||||||||||||||||||||||
Undistributed earnings of subsidiaries, joint operations and equity accounted investees | 11,297.8 | 11,387.7 | * | 1,410.9 | — | 24,096.4 | ||||||||||||||||||||||||||||||
Fair valuation of retained interest in a subsidiary subsequent to disposal of controlling equity interest | 3,991.2 | (1,148.2 | ) | — | 2,843.0 | 2,843.0 | (2,673.5 | ) | — | — | 169.5 | |||||||||||||||||||||||||
Derivative financial instruments | — | 14.4 | 13,327.7 | — | 13,342.1 | |||||||||||||||||||||||||||||||
Others | 1,248.2 | (266.0 | ) | (288.1 | ) | 694.1 | 1,010.2 | 411.9 | (83.3 | ) | — | 1,338.8 | ||||||||||||||||||||||||
|
|
|
|
|
|
|
|
| ||||||||||||||||||||||||||||
Total deferred tax liability | Rs. | 55,114.6 | Rs. | 27,725.2 | Rs. | 3,644.1 | Rs. | 86,483.9 | ||||||||||||||||||||||||||||
Total deferred tax liabilities | Rs. | 105,399.0 | Rs. | 15,377.6 | Rs. | 26,401.3 | Rs. | 76.0 | Rs. | 147,253.9 | ||||||||||||||||||||||||||
|
|
|
|
|
|
|
|
| ||||||||||||||||||||||||||||
Net assets / (liability) | Rs. | (3,322.3 | ) | Rs. | 16,307.6 | Rs. | 15,803.8 | Rs. | 28,789.1 | |||||||||||||||||||||||||||
|
|
|
| |||||||||||||||||||||||||||||||||
Deferred tax asset | Rs. | 46,493.9 | ||||||||||||||||||||||||||||||||||
Deferred tax liability | Rs. | (17,704.8 | ) | |||||||||||||||||||||||||||||||||
Net assets/(liabilities) | Rs. | 29,148.8 | Rs. | (11,658.3 | ) | Rs. | (13,606.7 | ) | Rs. | (5.1 | ) | Rs. | 3,878.7 | |||||||||||||||||||||||
Deferred tax assets | Rs. | 39,150.5 | ||||||||||||||||||||||||||||||||||
Deferred tax liabilities | Rs. | (35,271.8 | ) | |||||||||||||||||||||||||||||||||
| * | Net of Rs. 497.7 million reversed on dividend distributions by subsidiaries and Rs. 1,108.2 million reversed due to changes in tax rate in subsidiaries. |
Deferred tax assets of Tata Motors Limited (on standalone basis, being its tax status) as at March 31, 2014 amounted to Rs.15,250.9 million, Rs.19,897.8 million and Rs.7,771.8 million relating to unabsorbed depreciation, unutilized business loss and MAT credit, respectively, have been assessed as probable of realization on the basis of estimated taxable income for future years including dividends from subsidiaries.
Significant components of deferred tax assetassets and liabilityliabilities for the year ended March 31, 20112013 are as follows:
| Opening balance | Recognised in profit or loss | Recognised in / reclassified from other comprehensive income | Recognised direcctly in equity | Closing balance | Opening balance | Recognized in profit or loss | Recognized in /reclassified from other comprehensive income | Closing balance | ||||||||||||||||||||||||||||
| (In millions) | (In millions) | |||||||||||||||||||||||||||||||||||
Deferred tax assets: | ||||||||||||||||||||||||||||||||||||
Depreciation carry forwards | Rs. | 2,471.8 | Rs. | (141.3 | ) | Rs. | — | — | Rs. | 2,330.5 | Rs. | 5,284.8 | Rs. | 4,899.8 | Rs. | — | Rs. | 10,184.6 | ||||||||||||||||||
Business loss carry forwards | 2,055.4 | (1,530.6 | ) | 85.8 | — | 610.6 | 52,224.1 | (2,852.2 | ) | 611.5 | 49,983.4 | |||||||||||||||||||||||||
Expenses deductible in future years | ||||||||||||||||||||||||||||||||||||
– provisions, allowances for doubtful receivables, finance receivables | 6,126.1 | 4,728.3 | 103.2 | — | 10,957.6 | |||||||||||||||||||||||||||||||
– Interest and fair value change on conversion option | 1,700.8 | (250.0 | ) | — | (186.9 | ) | 1,263.9 | |||||||||||||||||||||||||||||
Expenses deductible in future years: | ||||||||||||||||||||||||||||||||||||
- provisions, allowances for doubtful receivables and others | 13,445.5 | 7,121.0 | (246.9 | ) | 20,319.6 | |||||||||||||||||||||||||||||||
- Interest and fair value change on conversion option | 1,711.1 | (1,711.1 | ) | — | — | |||||||||||||||||||||||||||||||
Compensated absences and retirement benefits | 4,342.5 | (183.6 | ) | 770.1 | — | 4,929.0 | 9,320.0 | (259.0 | ) | 5,924.6 | 14,985.6 | |||||||||||||||||||||||||
Minimum alternate tax carry- forward | 7,318.0 | 4,263.6 | — | — | 11,581.6 | |||||||||||||||||||||||||||||||
Minimum alternate tax carry-forward | 14,513.0 | 657.6 | — | 15,170.6 | ||||||||||||||||||||||||||||||||
Property, plant and equipment | 12,211.2 | 3,215.0 | 568.1 | — | 15,994.3 | 11,861.5 | 37.8 | 82.1 | 11,981.4 | |||||||||||||||||||||||||||
Derivative financial instruments | 1,491.9 | (677.3 | ) | 4,144.1 | 4,958.7 | |||||||||||||||||||||||||||||||
Others | 1,637.9 | 2,472.4 | 14.5 | — | 4,124.8 | 7,131.6 | (195.1 | ) | 27.4 | 6,963.9 | ||||||||||||||||||||||||||
|
|
|
|
|
|
|
|
| ||||||||||||||||||||||||||||
Total deferred tax asset | Rs. | 37,863.7 | Rs. | 12,573.8 | Rs. | 1,541.7 | Rs. | (186.9 | ) | Rs. | 51,792.3 | |||||||||||||||||||||||||
Total deferred tax assets | Rs. | 116,983.5 | Rs. | 7,021.5 | Rs. | 10,542.8 | Rs. | 134,547.8 | ||||||||||||||||||||||||||||
|
|
|
|
|
|
|
|
| ||||||||||||||||||||||||||||
Deferred tax liabilities: | ||||||||||||||||||||||||||||||||||||
Property, plant and equipment | 9,556.0 | 2,042.9 | (0.7 | ) | — | 11,598.2 | 14,147.1 | 1,059.5 | 10.2 | 15,216.8 | ||||||||||||||||||||||||||
Intangible assets | 29,440.9 | 3,642.7 | 828.7 | — | 33,912.3 | 61,537.3 | 13,659.0 | (165.1 | ) | 75,031.2 | ||||||||||||||||||||||||||
Undistributed earnings in subsidiaries and associates | 2,243.4 | 2,131.6 | (10.3 | ) | — | 4,364.7 | ||||||||||||||||||||||||||||||
Undistributed earnings in subsidiaries, joint operations and equity accounted investees | 9,213.4 | 2,120.6 | * | (36.2 | ) | 11,297.8 | ||||||||||||||||||||||||||||||
Fair valuation of retained interest in a subsidiary subsequent to disposal of controlling equity interest | 3,991.2 | — | — | — | 3,991.2 | 2,843.0 | — | — | 2,843.0 | |||||||||||||||||||||||||||
Others | 327.6 | 324.9 | 595.7 | — | 1,248.2 | 815.8 | 137.7 | 56.7 | 1,010.2 | |||||||||||||||||||||||||||
|
|
|
|
|
|
|
|
| ||||||||||||||||||||||||||||
Total deferred tax liability | Rs. | 45,559.1 | Rs. | 8,142.1 | Rs. | 1,413.4 | Rs. | — | Rs. | 55,114.6 | ||||||||||||||||||||||||||
Total deferred tax liabilities | Rs. | 88,556.6 | Rs. | 16,976.8 | Rs. | (134.4 | ) | Rs. | 105,399.0 | |||||||||||||||||||||||||||
|
|
|
|
|
|
|
|
| ||||||||||||||||||||||||||||
Net assets / (liability) | Rs. | (7,695.4 | ) | Rs. | 4,431.7 | Rs. | 128.3 | Rs. | (186.9 | ) | Rs. | (3,322.3 | ) | |||||||||||||||||||||||
|
|
|
|
| ||||||||||||||||||||||||||||||||
Deferred tax asset | Rs. | 10,640.7 | ||||||||||||||||||||||||||||||||||
Deferred tax liability | Rs. | (13,963.0 | ) | |||||||||||||||||||||||||||||||||
Net assets/(liabilities) | Rs. | 28,426.9 | Rs. | (9,955.3 | ) | Rs. | 10,677.2 | Rs. | 29,148.8 | |||||||||||||||||||||||||||
Deferred tax assets | Rs. | 45,205.2 | ||||||||||||||||||||||||||||||||||
Deferred tax liabilities | Rs. | (16,056.4 | ) | |||||||||||||||||||||||||||||||||
| * |
Other non-currentDeferred tax assets consist of the following:
| As of March 31, | ||||||||||||
| 2013 | 2013 | 2012 | ||||||||||
| (In millions) | ||||||||||||
Taxes recoverable, statutory deposits and dues from government | US$ | 129.2 | Rs. | 7,015.3 | Rs. | 7,246.0 | ||||||
Prepaid rentals on operating leases | 16.3 | 882.8 | 892.1 | |||||||||
Others | 35.6 | 1,931.5 | 1,997.0 | |||||||||
|
|
|
|
|
| |||||||
Total | US$ | 181.1 | Rs. | 9,829.6 | Rs. | 10,135.1 | ||||||
|
|
|
|
|
| |||||||
Others include Rs. 36.1 million and Rs. 154.9 million towards pension assets pertaining to Jaguar Land Rover businessesTata Motors Limited (on standalone basis, being its tax status) as ofat March 31, 2013 amounted to Rs.10,031.2 million, Rs.2,450.4 million and March 31, 2012, respectively.Rs.15,089.8 million relating to unabsorbed depreciation, unutilized business loss and MAT credit, respectively, have been assessed as probable of realization on the basis of estimated taxable income for future years including dividends from subsidiaries.
| 18. | Short-term borrowings and current portion of long-term debt |
Short-term borrowings and current portion of long-term debt consist of the following:
| As of March 31, | As at March 31, | |||||||||||||||||||||||
| 2013 | 2013 | 2012 | 2015 | 2015 | 2014 | |||||||||||||||||||
| (In millions) | (In millions) | |||||||||||||||||||||||
Commercial paper | US$ | 507.6 | Rs. | 27,553.0 | Rs. | 12,529.5 | US$ | 794.0 | Rs. | 49,626.7 | Rs. | 18,919.4 | ||||||||||||
Loans from banks / financial institutions | 1,627.9 | 88,370.1 | 98,350.3 | |||||||||||||||||||||
Loans from banks/financial institutions | 1,301.1 | 81,320.1 | 81,285.3 | |||||||||||||||||||||
Inter-corporate deposits | 5.4 | 295.0 | 300.0 | 9.6 | 600.0 | 260.0 | ||||||||||||||||||
Current portion of long-term debt (refer note 22) | 2,121.0 | 115,138.8 | 109,795.3 | |||||||||||||||||||||
Current portion of long-term debt (refer note 19) | 782.7 | 48,918.6 | 65,495.9 | |||||||||||||||||||||
|
|
|
|
|
| |||||||||||||||||||
Total | US$ | 4,261.9 | Rs. | 231,356.9 | Rs. | 220,975.1 | US$ | 2,887.4 | Rs. | 180,465.4 | Rs. | 165,960.6 | ||||||||||||
|
|
|
|
|
| |||||||||||||||||||
For details of carrying amount of assets pledged as security for secured borrowings refer note 36.37.
| 19. |
Other current financial liabilities consist of the following:
| As of March 31, | ||||||||||||
| 2013 | 2013 | 2012 | ||||||||||
| (In millions) | ||||||||||||
Liability towards vehicles sold under repurchase arrangements | US$ | 276.6 | Rs. | 15,013.8 | Rs. | 12,534.4 | ||||||
Interest accrued but not due | 73.1 | 3,970.8 | 2,436.5 | |||||||||
Lease liabilities | 10.9 | 592.8 | 524.7 | |||||||||
Derivative financial instruments | 314.1 | 17,049.7 | 9,061.3 | |||||||||
Deferred payment liability | 11.8 | 638.2 | 753.0 | |||||||||
Unclaimed matured fixed deposits | 14.1 | 767.8 | 1,716.9 | |||||||||
Others | 5.1 | 275.6 | 211.4 | |||||||||
|
|
|
|
|
| |||||||
Total | US$ | 705.7 | Rs. | 38,308.7 | Rs. | 27,238.2 | ||||||
|
|
|
|
|
| |||||||
Provisions consist of the following:
| As of March 31, | ||||||||||||
| 2013 | 2013 | 2012 | ||||||||||
| (In millions) | ||||||||||||
Current | ||||||||||||
Product warranty | US$ | 548.6 | Rs. 29,780.3 | Rs. 25,922.6 | ||||||||
Product liability | 24.1 | 1,306.1 | 1,324.8 | |||||||||
Provision for residual risk | 2.5 | 134.0 | 175.8 | |||||||||
Employee related and other provisions | 46.5 | *2,530.2 | 688.8 | |||||||||
|
|
|
|
|
| |||||||
Total-Current | US$ | 621.7 | Rs. 33,750.6 | Rs. 28,112.0 | ||||||||
|
|
|
|
|
| |||||||
Non-current | ||||||||||||
Employee benefits obligations | US$ | 133.3 | Rs. 7,234.0 | Rs. 7,626.3 | ||||||||
Product warranty | 667.3 | 36,222.2 | 27,695.0 | |||||||||
Provision for residual risk | 19.6 | 1,062.7 | 1,134.0 | |||||||||
Provision for environmental liability | 33.0 | 1,793.2 | 1,648.6 | |||||||||
Other provisions | 4.6 | 251.4 | 138.5 | |||||||||
|
|
|
|
|
| |||||||
Total-Non-current | US$ | 857.8 | Rs. 46,563.5 | Rs. 38,242.4 | ||||||||
|
|
|
|
|
| |||||||
| Year ended March 31, | ||||||||||||||||
| 2013 | 2013 | 2013 | 2013 | |||||||||||||
| Product Warranty | Product Liability | |||||||||||||||
| (In millions) | ||||||||||||||||
Balance at the beginning | US$ | 987.7 | Rs. | 53,617.6 | US$ | 24.4 | Rs. | 1,324.8 | ||||||||
Provision made during the year | 763.6 | 41,452.9 | 7.7 | 416.5 | ||||||||||||
Provision used during the year | (530.3 | ) | (28,785.8 | ) | (10.3 | ) | (558.1 | ) | ||||||||
Impact of discounting | (4.3 | ) | (241.0 | ) | — | — | ||||||||||
Impact of foreign exchange translation | (0.8 | ) | (41.2 | ) | 2.3 | 122.9 | ||||||||||
|
|
|
|
|
|
|
| |||||||||
Balance at the end | US$ | 1,215.9 | Rs. | 66,002.5 | US$ | 24.1 | Rs. | 1,306.1 | ||||||||
|
|
|
|
|
|
|
| |||||||||
Current | US$ | 548.6 | Rs. | 29,780.3 | US$ | 24.1 | Rs. | 1,306.1 | ||||||||
Non-current | US$ | 667.3 | Rs. | 36,222.2 | US$ | — | Rs. | — | ||||||||
| Year ended March 31, | ||||||||||||||||
| 2013 | 2013 | 2013 | 2013 | |||||||||||||
| Provision for residual risk | Provision for environmental liability | |||||||||||||||
| (In millions) | ||||||||||||||||
Balance at the beginning | US$ | 24.1 | Rs. | 1,309.8 | US$ | 30.3 | Rs. | 1,648.6 | ||||||||
Provision made during the year | — | — | 4.8 | 257.9 | ||||||||||||
Provision used during the year | (1.4 | ) | (77.4 | ) | (2.2 | ) | (120.4 | ) | ||||||||
Unused amounts released in the year | (1.1 | ) | (60.2 | ) | — | — | ||||||||||
Impact of foreign exchange translation | 0.5 | 24.5 | 0.1 | 7.1 | ||||||||||||
|
|
|
|
|
|
|
| |||||||||
Balance at the end | US$ | 22.1 | Rs. | 1,196.7 | US$ | 33.0 | Rs. | 1,793.2 | ||||||||
|
|
|
|
|
|
|
| |||||||||
Current | US$ | 2.5 | Rs. | 134.0 | US$ | — | Rs. | — | ||||||||
Non-current | US$ | 19.6 | Rs. | 1,062.7 | US$ | 33.0 | Rs. | 1,793.2 | ||||||||
Other current liabilities consist of the following:
| As of March 31, | ||||||||||||
| 2013 | 2013 | 2012 | ||||||||||
| (In millions) | ||||||||||||
Liability for advances received | US$ | 386.5 | Rs. | 20,979.1 | Rs. | 23,682.5 | ||||||
Statutory dues | 547.2 | 29,709.7 | 36,613.6 | |||||||||
Others | 28.2 | 1,529.6 | 1,133.4 | |||||||||
|
|
|
|
|
| |||||||
Total | US$ | 961.9 | Rs. | 52,218.4 | Rs. | 61,429.5 | ||||||
|
|
|
|
|
| |||||||
Statutory dues include sales tax, excise duty and other taxes payable.
| Long-term debt |
Long-term debt consists of the following:
| As of March 31, | ||||||||||||
| 2013 | 2013 | 2012 | ||||||||||
| (In millions) | ||||||||||||
Non Convertible Debentures | US$ | 2,118.0 | Rs. | 114,976.7 | Rs. | 73,984.8 | ||||||
Foreign currency convertible notes (including fair value of conversion option): | ||||||||||||
Zero Coupon Convertible Alternative Reference Securities (USD) due 2012 (CARS) | — | — | 32,775.7 | |||||||||
4% Foreign Currency Convertible Notes (USD) due 2014 | 141.9 | 7,704.8 | 12,016.8 | |||||||||
Collateralized debt obligation | 383.5 | 20,820.0 | 17,762.7 | |||||||||
Buyers credit from banks at floating interest rate | 166.3 | 9,027.6 | 7,194.0 | |||||||||
Fixed deposits from public and shareholders | 57.9 | 3,141.4 | 23,159.5 | |||||||||
Loan from banks / financial institutions | 2,458.5 | 133,452.7 | 105,726.1 | |||||||||
Senior Notes (EURO MTF listed debt) (including fair value of prepayment option) | 2,764.8 | 150,087.3 | 123,650.8 | |||||||||
Others | 25.4 | 1,385.8 | 673.0 | |||||||||
|
|
|
|
|
| |||||||
Total | US$ | 8,116.3 | Rs. | 440,596.3 | Rs. | 396,943.4 | ||||||
Less: current portion (refer note 18) | 2,121.0 | 115,138.8 | 109,795.3 | |||||||||
|
|
|
|
|
| |||||||
Long-term debt | US$ | 5,995.3 | Rs. | 325,457.5 | Rs. | 287,148.1 | ||||||
|
|
|
|
|
| |||||||
Non-convertible debentures Collateralized debt obligations Buyers credit from banks at floating interest rate Loan from banks/financial institutions Senior notes Others Total Less: current portion (refer note 18) Long-term debt Foreign currency convertible notes As at March 31, 2015 2015 2014 (In millions) US$ 2,043.6 Rs. 127,727.7 Rs. 115,755.2 98.7 6,168.0 15,413.2 262.8 16,424.6 13,350.2 2,240.8 140,048.4 172,254.1 4,812.8 300,797.2 199,807.1 41.8 2,615.2 3,054.7 9,500.5 593,781.1 519,634.5 782.7 48,918.6 65,495.9 US$ 8,717.8 Rs. 544,862.5 Rs. 454,138.6
Zero coupon convertible alternative reference securities (USD) due 2012(CARS)
On July 12, 2007, Tata Motors Limited raised funds aggregating USD 490 million (Rs.19,927.1 million at issue) by issue of Zero Coupon Convertible Alternative Reference Securities (CARS) due on July 12, 2012, which allow Tata Motors Limited to give the noteholders an option to convert the notes into qualifying securities as per the terms of issue after appropriate adjustment to the conversion price. If Tata Motors Limited does not exercise this option, the conversion may be made by the noteholders from and including October 11, 2011 to and including June 12, 2012, into ordinary shares or ADSs of Tata Motors Limited, at an initial conversion price of Rs. 960.96 per share (face value of Rs. 10) (equivalent to USD 23.67 at a fixed rate of exchange on conversion of Rs. 40.59 per USD) which is subject to adjustment in certain circumstances. The conversion price of the notes was reset to a price of Rs.907.87 per share (face value of Rs. 10) on account of our rights issue in fiscal 2009 and further to a price of Rs.907.17 per share (face value of Rs. 10) on account of our GDS issue in fiscal 2010, at a fixed rate of conversion of Rs. 40.59 per USD. Tata Motors Limited has a right to redeem in whole, but not in part, these Notes at any time on or after October 11, 2011, subject to certain conditions. Unless previously converted, redeemed or purchased and cancelled as per the terms of issue, these were to be redeemed on July 12, 2012 at 131.82% of the outstanding principal amount.
During the year ended March 31, 2009, the Company bought back and cancelled 170 Notes (Principal value of USD 17 million).
There were no conversion till March 31, 2012.
During the year ended March 31, 2012, the conversion price of the notes have been reset to a price of Rs. 181.434 per share on account of sub-division of shares at a fixed rate of conversion of Rs. 40.59 per USD (refer note 25).
During the year ended March 31, 2013, one Note was converted into 22,370 equity shares of face value of Rs.2 each and the Company has redeemed 4,729 notes including redemption premium, totaling Rs. 35,374.2 million on due date.
4% foreign currency convertible notes (USD) due 2014
On October 15, 2009, Tata Motors Limited raised funds aggregating USD 375 million (Rs. 17,941.9 million at issue) by issue of 4% Convertible Notes due on October 16, 2014. The noteholders have an option to convert these Notes into ordinary shares or GDSs or ADSs of Tata Motors Limited. The conversion may be made by the noteholders, in the case of Shares or GDSs, at any time during the period from and including November 25, 2009 to and including October 9, 2014 and, in the case of ADSs, at any time from and including October 15, 2010 to and including October 9, 2014, at an initial conversion price of Rs. 623.88 per share (face value of Rs 10 each) (equivalent to USD13.48 per share at a fixed rate of exchange on conversion of Rs. 46.28 per USD). The conversion price of the notes was reset to a price of Rs. 613.77 (face value of Rs. 10 each) per share on account of cash dividend distribution anti dilution adjustment as per terms of issue in fiscal 2011, at fixed rate of conversion of Rs. 46.28 per USD. The conversion price is subject to adjustment in certain circumstances. Tata Motors Limited has a right to redeem in whole but not in part, these Notes at any time on or after October 15, 2012, subject to certain conditions. In the event of certain changes affecting taxation, Tata Motors Limited has an option to redeem in whole but not in part, these Notes at any time. Unless previously converted, redeemed or purchased and cancelled as per the terms of issue, these Notes will be due for redemption on October 16, 2014 at 108.505 % of the principal amount.
There has been no conversion during the year ended March 31, 2010.
During the year ended March 31, 2011, Notes 2,576 were converted into 19,423,734 equity shares of face value of Rs.10 each.
There has been no conversion during the year ended March 31, 2012.
During the year ended March 31, 2013, the conversion price of the notes have been reset to a price of Rs. 120.119 per share on account of anti-dilution adjustment of shares at a fixed rate of conversion of Rs. 46.28 per USD.
During the year ended March 31, 2013, Notes 433 were converted into 16,519,201 equity shares of face value of Rs.2 each.
Further, as of March 31, 2013, 741 outstanding Notes may at the option of the noteholders be converted into 28,549,588 Shares at any time upto October 9, 2014.
The embedded conversion option in foreign currency convertible notes/ convertible alternative reference securities is not clearly and closely related to the host debt contracts as the conversion options will be settled by delivery of fixed number of shares for fixed amounts of foreign currency which represents variable amount of cash in Indian Rupees, the functional currency of Tata Motors Limited. Change in the fair value of the conversion option is recognized in the income statement.
Collateralized debt obligationobligations
These represent amount received against finance receivables securitized/assigned, which does not qualify for derecognition.
Non-convertible debentures
The interest rate on non-convertible debentures range from 8.60% to 11.50%.
Buyers credit
The buyers line of credit from banks is repayable within three years from drawdown dates.
Fixed deposits from public and shareholders
These are unsecured deposits for a fixed tenor of up to three years bearing interest rates ranging from 8% to 12.25%.
Loan from banks / banks/financial institutions
Certain loans availed by some of the subsidiary companiesCompany’s loans set limits on and/or require prior lender consent for, among other things, undertaking new projects, issuing new securities, changes in management, mergers, sales of undertakings and investment in subsidiaries. In addition, certain negative covenants may limit Company’s ability to borrow additional funds or to incur additional liens, and/or provide for increased costs in case of breach. Certain of the financing arrangements also include financial covenants to maintain certain debt-to-equity ratios, debt-to-earnings ratios, liquidity ratios, capital expenditure ratios and debt coverage ratios.
Senior notes (Euro MTF listed debt)
The senior notes of Jaguar Land Rover Automotive plc are listed on the Euro MTF market, which is a listed market regulated by the Luxembourg Stock Exchange.
Details of the tranches of the senior notes outstanding as at March 31, 2015 are as follows:
Issued on | Currency | Initial Principal amounts (In millions) | Outstanding Principal amounts (In millions) | Outstanding (In millions) | Interest Rate | Redeemable on | ||||||||||||||||||||
| As at March 31, | ||||||||||||||||||||||||||
| 2015 | 2014 | |||||||||||||||||||||||||
May 2011 | USD | 410 | 84 | Rs. | 5,170.7 | Rs. | 24,112.3 | 8.125 | % | May 2021 | ||||||||||||||||
March 2012 | GBP | 500 | 58 | 5,349.8 | 49,121.8 | 8.250 | % | March 2020 | ||||||||||||||||||
January 2013 | USD | 500 | 500 | 30,936.3 | 29,424.4 | 5.625 | % | February 2023 | ||||||||||||||||||
December 2013 | USD | 700 | 700 | 43,519.1 | 41,416.5 | 4.125 | % | December 2018 | ||||||||||||||||||
January 2014 | GBP | 400 | 400 | 36,629.6 | 39,325.5 | 5.000 | % | February 2022 | ||||||||||||||||||
October 2014 | USD | 500 | 500 | 31,013.3 | — | 4.250 | % | November 2019 | ||||||||||||||||||
February 2015 | GBP | 400 | 400 | 36,600.2 | — | 3.875 | % | March 2023 | ||||||||||||||||||
March 2015 | USD | 500 | 500 | 30,930.6 | — | 3.500 | % | March 2020 | ||||||||||||||||||
|
|
|
| |||||||||||||||||||||||
Total | Rs. | 220,149.6 | Rs. | 183,400.5 | ||||||||||||||||||||||
|
|
|
| |||||||||||||||||||||||
Senior notes issued during the year were used to repay both long-term and short-term debts and provide additional cash facilities.
Details of the tranches of the senior notes repaid in the year ended March 31, 2015 are as follows:
US$ 326 million senior notes due 2021 at a coupon of 8.125% per annum – issued May 2011
GBP 442 million senior notes due 2020 at a coupon of 8.250% per annum – issued March 2012
Details of the tranches of the senior notes repaid in the year ended March 31, 2014 are as follows:
GBP 500 million senior notes due 2018 at a coupon of 8.125% per annum – issued May 2011
US$ 410 million senior notes due 2018 at a coupon of 7.75% per annum – issued May 2011
These senior notes are subject to customary covenants and events of default, which placeinclude, among other things, restrictions or limitations on liens or pledges, restrictions on the quantumamount of dividend payment, investmentscash which can be transferred outside the Jaguar Land Rover group and further borrowings.of companies in the form of dividends, loans or investments.
Senior Notes (EURO MTFnotes (SGX-ST listed debt)
During the year ended March 31, 2013, Jaguar Land Rover Plc has issued USD 500 million Senior Notes (Notes) due 2023 at a couponThe senior notes of 5.625% per annum.
During the year ended March 31, 2012, Jaguar Land Rover Plc has issued GBP 1,500 million equivalent Senior Notes (Notes). The Notes issued includes GBP 500 million Senior Notes due 2018 at a coupon of 8.125% per annum, GBP 500 million Senior Notes due 2020 at a coupon of 8.25% per annum, USD 410 million Senior Notes due 2018 at a coupon of 7.75% per annumTata Motors Limited and USD 410 million Senior Notes due 2021 at a coupon of 8.125% per annum. These notesTML Holdings Pte Ltd are listed on the Euro MTFSGX-ST market, which is a listed market regulated by the LuxembourgSingapore Stock Exchange.
AsDetails of the tranches of the senior notes outstanding as at March 31, 2013,2015 are as follows:
Issued on | Currency | Initial Principal amounts (In millions) | Outstanding Principal amounts (In millions) | Outstanding (In millions) | Interest Rate | Redeemable on | ||||||||||||||||||||
| As at March 31, | ||||||||||||||||||||||||||
| 2015 | 2014 | |||||||||||||||||||||||||
May 2013 | SGD | 350 | 350 | Rs. 15,741.4 | Rs. 16,406.6 | 4.250 | % | May 2018 | ||||||||||||||||||
May 2014 | USD | 300 | 300 | 18,557.1 | — | 5.750 | % | May 2021 | ||||||||||||||||||
October 2014 | USD | 250 | 250 | 15,449.7 | — | 5.750 | % | October 2024 | ||||||||||||||||||
October 2014 | USD | 500 | 500 | 30,899.4 | — | 4.625 | % | April 2020 | ||||||||||||||||||
|
|
|
| |||||||||||||||||||||||
Total | Rs. 80,647.6 | Rs. 16,406.6 | ||||||||||||||||||||||||
|
|
|
| |||||||||||||||||||||||
The senior notes issued in October 2014 were used to refinance existing External Commercial Borrowings (ECB) of the carrying valueCompany of Senior Notes is netUS$ 500 million and the balance of fair value of prepayment options of Rs. 3,857.8 million which have been separately accounted for as derivatives.the proceeds are being used to incur new additional capital expenditures and other permitted purposes in accordance with the RBI ECB guidelines.
For details of carrying amount of assets pledged as security for secured borrowings refer note 36.37.
| Other financial liabilities – |
Other current financial liabilities consist of the following:
| As at March 31, | ||||||||||||
| 2015 | 2015 | 2014 | ||||||||||
| (In millions) | ||||||||||||
Liability towards vehicles sold under repurchase arrangements | US$ | 291.3 | Rs.18,206.0 | Rs.18,277.4 | ||||||||
Interest accrued but not due | 160.8 | 10,047.5 | 8,312.3 | |||||||||
Lease liabilities | 9.1 | 571.7 | 711.9 | |||||||||
Derivative financial instruments | 1,031.4 | 64,459.8 | 6,438.7 | |||||||||
Deferred payment liability | 9.6 | 597.5 | 658.3 | |||||||||
Unclaimed matured fixed deposits | 3.1 | 194.3 | 287.4 | |||||||||
Others | 4.9 | 312.0 | 238.2 | |||||||||
|
|
|
|
|
| |||||||
Total | US$ | 1,510.2 | Rs.94,388.8 | Rs.34,924.2 | ||||||||
|
|
|
|
|
| |||||||
| 21. | Other financial liabilities – non-current |
Other financial liabilities non-current consist of the followingfollowing:
| As of March 31, | As at March 31, | |||||||||||||||||||||||
| 2013 | 2013 | 2012 | 2015 | 2015 | 2014 | |||||||||||||||||||
| (In millions) | (In millions) | |||||||||||||||||||||||
Lease liabilities | US$ | 33.8 | Rs. | 1,833.8 | Rs. | 1,553.8 | US$ | 14.6 | Rs. | 907.5 | Rs.1,497.0 | |||||||||||||
Deferred payment liability | 43.7 | 2,370.0 | 2,862.5 | 20.2 | 1,264.1 | 1,838.3 | ||||||||||||||||||
Derivative financial instruments | 319.3 | 17,335.0 | 2,713.2 | 1,235.5 | 77,219.4 | 5,483.6 | ||||||||||||||||||
Employee separation liability | 14.3 | 894.2 | 98.2 | |||||||||||||||||||||
Retention money, security deposits and others | 8.1 | 440.3 | 403.1 | 10.7 | 671.3 | 255.6 | ||||||||||||||||||
|
|
|
|
|
| |||||||||||||||||||
Total | US$ | 404.9 | Rs. | 21,979.1 | Rs. | 7,532.6 | US$ | 1,295.3 | Rs. | 80,956.5 | Rs.9,172.7 | |||||||||||||
|
|
|
|
|
| |||||||||||||||||||
| 22. | Provisions |
Provisions consist of the following:
| As at March 31, | ||||||||||||
| 2015 | 2015 | 2014 | ||||||||||
| (In millions) | ||||||||||||
Current | ||||||||||||
Product warranty | US$ | 699.7 | Rs. | 43,732.9 | Rs. | 37,925.2 | ||||||
Product liability | 43.9 | 2,748.5 | 1,841.7 | |||||||||
Provision for residual risk | 6.8 | 427.2 | 179.5 | |||||||||
Provision for environmental liability | 7.1 | 441.8 | — | |||||||||
Employee related and other provisions | 32.5 | 2,022.3 | * | 5,767.4 | * | |||||||
|
|
|
|
|
| |||||||
Total-Current | US$ | 790.0 | Rs. | 49,372.7 | Rs. | 45,713.8 | ||||||
|
|
|
|
|
| |||||||
Non-current | ||||||||||||
Employee benefits obligations | US$ | 147.3 | Rs. | 9,208.8 | Rs. | 7,822.9 | ||||||
Product warranty | 896.9 | 56,051.6 | 55,285.2 | |||||||||
Provision for residual risk | 22.8 | 1,425.5 | 1,309.9 | |||||||||
Provision for environmental liability | 39.2 | 2,448.8 | 2,066.8 | |||||||||
Other provisions | 10.3 | 645.1 | 325.4 | |||||||||
|
|
|
|
|
| |||||||
Total-Non-current | US$ | 1,116.5 | Rs. | 69,779.8 | Rs. | 66,810.2 | ||||||
|
|
|
|
|
| |||||||
| * | Includes provision towards employee claims in foreign subsidiaries. |
| Year ended March 31, | ||||||||||||||||
| 2015 | 2015 | 2015 | 2015 | |||||||||||||
| Product Warranty | Product Liability | |||||||||||||||
| (In millions) | ||||||||||||||||
Balance at the beginning | US$ | 1,491.4 | Rs. | 93,210.4 | US$ | 29.5 | Rs. | 1,841.7 | ||||||||
Provision made during the year | 934.7 | 58,419.0 | 29.5 | 1,846.5 | ||||||||||||
Provision used during the year | (709.1 | ) | (44,319.6 | ) | (12.1 | ) | (753.3 | ) | ||||||||
Impact of discounting | 19.5 | 1,217.6 | — | — | ||||||||||||
Impact of foreign exchange translation | (139.9 | ) | (8,742.9 | ) | (3.0 | ) | (186.4 | ) | ||||||||
|
|
|
|
|
|
|
| |||||||||
Balance at the end | US$ | 1,596.6 | Rs. | 99,784.5 | US$ | 43.9 | Rs. | 2,748.5 | ||||||||
|
|
|
|
|
|
|
| |||||||||
Current | US$ | 699.7 | Rs. | 43,732.9 | US$ | 43.9 | Rs. | 2,748.5 | ||||||||
Non-current | US$ | 896.9 | Rs. | 56,051.6 | US$ | — | Rs. | — | ||||||||
| Year ended March 31, | ||||||||||||||||
| 2015 | 2015 | 2015 | 2015 | |||||||||||||
| Provision for residual risk | Provision for environmental liability | |||||||||||||||
| (In millions) | ||||||||||||||||
Balance at the beginning | US$ | 23.8 | Rs. | 1,489.4 | US$ | 33.1 | Rs. | 2,066.8 | ||||||||
Provision made during the year | 7.0 | 439.8 | 15.7 | 982.9 | ||||||||||||
Impact of foreign exchange translation | (1.2 | ) | (76.5 | ) | (2.5 | ) | (159.1 | ) | ||||||||
|
|
|
|
|
|
|
| |||||||||
Balance at the end | US$ | 29.6 | Rs. | 1,852.7 | US$ | 46.3 | Rs. | 2,890.6 | ||||||||
|
|
|
|
|
|
|
| |||||||||
Current | US$ | 6.8 | Rs. | 427.2 | US$ | 7.1 | Rs. | 441.8 | ||||||||
Non-current | US$ | 22.8 | Rs. | 1,425.5 | US$ | 39.2 | Rs. | 2,448.8 | ||||||||
| 23. | Other current liabilities |
Other current liabilities consist of the following:
| As at March 31, | ||||||||||||
| 2015 | 2015 | 2014 | ||||||||||
| (In millions) | ||||||||||||
Liability for advances received | US$ | 366.1 | Rs. | 22,883.5 | Rs. | 32,180.1 | ||||||
Statutory dues | 292.9 | 18,304.8 | 18,152.3 | |||||||||
Deferred revenue | 99.4 | 6,215.6 | 3,313.4 | |||||||||
Others | 42.2 | 2,631.5 | 540.7 | |||||||||
|
|
|
|
|
| |||||||
Total | US$ | 800.6 | Rs. | 50,035.4 | Rs. | 54,186.5 | ||||||
|
|
|
|
|
| |||||||
Statutory dues include sales tax, excise duty and other taxes payable.
| 24. | Other liabilities - non-current |
Other liabilities - non-current consist of the followingfollowing:
| As of March 31, | As at March 31, | |||||||||||||||||||||||
| 2013 | 2013 | 2012 | 2015 | 2015 | 2014 | |||||||||||||||||||
| (In millions) | (In millions) | |||||||||||||||||||||||
Employee benefit obligations | US$ | 1,016.7 | Rs. | 55,191.4 | Rs. | 27,444.5 | US$ | 1,320.9 | Rs. | 82,554.3 | Rs. | 67,710.9 | ||||||||||||
Deferred revenue | 147.8 | 9,236.2 | 6,406.4 | |||||||||||||||||||||
Others | 64.7 | 3,513.4 | 517.6 | 44.4 | 2,780.8 | 2,979.5 | ||||||||||||||||||
|
|
|
|
|
| |||||||||||||||||||
Total | US$ | 1,081.4 | Rs. | 58,704.8 | Rs. | 27,962.1 | US$ | 1,513.1 | Rs. | 94,571.3 | Rs. | 77,096.8 | ||||||||||||
|
|
|
|
|
| |||||||||||||||||||
| 25. | Equity |
Ordinary shares and ‘A’ ordinaryOrdinary shares
The movement of number of shares and share capital is as follows.follows:
| Year ended March 31, | ||||||||||||||||||||||||||||||||||||||||||||||||
| 2013 | 2012 | 2011 | ||||||||||||||||||||||||||||||||||||||||||||||
| Ordinary shares | ‘A’ Ordinary shares | Ordinary shares | ‘A’Ordinary shares | Ordinary shares | ‘A’Ordinary shares | |||||||||||||||||||||||||||||||||||||||||||
| No. of shares | Rs. in million | No. of shares | Rs. in million | No. of shares | Rs. in million | No. of shares | Rs. in million | No. of shares | Rs. in million | No. of shares | Rs. in million | |||||||||||||||||||||||||||||||||||||
Shares at the beginning | 2,691,613,455 | Rs. | 5,383.6 | 481,933,115 | Rs. | 963.9 | 538,272,284 | Rs. | 5,383.1 | 96,341,706 | Rs. | 963.4 | 506,381,170 | Rs. | 5,064.2 | 64,176,374 | Rs. | 641.8 | ||||||||||||||||||||||||||||||
Share issued on conversion of foreign currency convertible notes | 16,541,571 | 33.1 | — | — | — | — | — | — | 23,570,426 | 235.7 | — | — | ||||||||||||||||||||||||||||||||||||
Shares issued (note a) | 1,125 | — | 26,505 | 0.1 | 50,199 | 0.5 | 44,765 | 0.5 | 388 | — | 332 | — | ||||||||||||||||||||||||||||||||||||
Shares issued | — | — | — | — | | 8,320,300 (note b) | | 83.2 | | 32,165,000 (note b) | | 321.6 | ||||||||||||||||||||||||||||||||||||
Before Sub-division | 538,322,483 | 5,383.6 | 96,386,471 | 963.9 | ||||||||||||||||||||||||||||||||||||||||||||
Subdivision of Shares (note c) | 2,691,612,415 | 5,383.6 | 481,932,355 | 963.9 | ||||||||||||||||||||||||||||||||||||||||||||
Shares issued (note a) | 1,040 | — | 760 | — | ||||||||||||||||||||||||||||||||||||||||||||
Shares at the end | 2,708,156,151 | Rs. | 5,416.7 | 481,959,620 | Rs. | 964.0 | 2,691,613,455 | Rs. | 5,383.6 | 481,933,115 | Rs. | 963.9 | 538,272,284 | Rs. | 5,383.1 | 96,341,706 | Rs. | 963.4 | ||||||||||||||||||||||||||||||
| US$ | 99.8 | US$ | 17.8 | |||||||||||||||||||||||||||||||||||||||||||||
| Year ended March 31, | ||||||||||||||||||||||||||||||||||||||||||||||||
| 2015 | 2014 | 2013 | ||||||||||||||||||||||||||||||||||||||||||||||
| Ordinary shares | ‘A’ Ordinary shares | Ordinary shares | ‘A’ Ordinary shares | Ordinary shares | ‘A’ Ordinary shares | |||||||||||||||||||||||||||||||||||||||||||
| No. of shares | (In millions) | No. of shares | (In millions) | No. of shares | (In millions) | No. of shares | (In millions) | No. of shares | (In millions) | No. of shares | (In millions) | |||||||||||||||||||||||||||||||||||||
Shares at the beginning | 2,736,713,122 | Rs. | 5,473.8 | 481,966,945 | Rs. | 964.0 | 2,708,156,151 | Rs. | 5,416.7 | 481,959,620 | Rs. | 964.0 | 2,691,613,455 | Rs. | 5,383.6 | 481,933,115 | Rs. | 963.9 | ||||||||||||||||||||||||||||||
Share issued on conversion of foreign currency convertible notes and convertible alternative reference securities | — | — | — | — | 28,549,566 | 57.1 | — | — | 16,541,571 | 33.1 | — | — | ||||||||||||||||||||||||||||||||||||
Shares issued # | — | — | — | — | 7,405 | — | * | 7,325 | — | * | 1,125 | — | * | 26,505 | 0.1 | |||||||||||||||||||||||||||||||||
|
|
|
|
|
|
|
|
|
|
|
|
|
|
|
|
|
|
|
|
|
|
|
| |||||||||||||||||||||||||
Shares at the end | 2,736,713,122 | Rs. | 5,473.8 | 481,966,945 | Rs. | 964.0 | 2,736,713,122 | Rs. | 5,473.8 | 481,966,945 | Rs. | 964.0 | 2,708,156,151 | Rs. | 5,416.7 | 481,959,620 | Rs. | 964.0 | ||||||||||||||||||||||||||||||
|
|
|
|
|
|
|
|
|
|
|
|
|
|
|
|
|
|
|
|
|
|
|
| |||||||||||||||||||||||||
| US$ | 87.6 | US$ | 15.4 | |||||||||||||||||||||||||||||||||||||||||||||
|
|
|
| |||||||||||||||||||||||||||||||||||||||||||||
| Less than Rs. 50,000 |
| # | Out of shares held in abeyance - |
Authorized share capital
Authorized share capital includes 3,500,000,000 ordinaryOrdinary shares of Rs. 2 each as ofat March 31, 20132015 (3,500,000,000 ordinaryOrdinary shares of Rs. 2 each as ofat March 31, 2012)2014 and 2013 ), 1,000,000,000 ‘A’ ordinaryOrdinary shares of Rs. 2 each as ofat March 31, 20132015 (1,000,000,000 ‘A’ ordinaryOrdinary shares of Rs. 2 each as ofat March 31, 2012)2014 and 2013) and 300,000,000 convertible cumulative preference shares of Rs. 100 each as ofat March 31, 20132015 (300,000,000 convertible cumulative preference shares of Rs. 100 each as ofat March 31, 2012)2014 and 2013).
Issued and subscribed share capital
Share issued includes partly paid up shares of 68,750 ordinaryOrdinary shares of Rs. 2 each as ofat March 31, 2013 and2015, March 31, 20122014 and 13,750 ordinary shares of Rs. 10 each as of March 31, 2011, respectively.2013.
Ordinary share capitalshares and ‘A’ ordinary shares:
The Company has two classes of shares – the Ordinary shares and the ‘A’ Ordinary shares both of Rs.2 each (together referred to as shares). In respect of every Ordinary Shareshare (whether fully paid or partly paid), voting rightrights shall be in the same proportion as the capital paid up on such Ordinary Shareshare bears to the total paid up ordinaryOrdinary share capital of the Company.
‘A’ ordinary share capital
The shareholders In case of every ‘A’ Ordinary shares are entitled to receive dividend of five percentage points more than the aggregate rate of dividend determined by Tata Motors Limited on ordinary shares for the financial year.
If any resolution at any general meeting of shareholders is put to vote on poll, orshare, if any resolution is put to vote on a poll or by postal ballot each ‘A’ Ordinaryat any general meeting of shareholders, the holder shall be entitled to one vote for every ten ‘A’ Ordinary Shares held.
Inshares held as per the case thereterms of its issue.
Under the provisions of the revised Indian Listing Agreement with domestic Indian Stock Exchanges, every listed company is a resolution is putrequired to provide its shareholders with the facility to exercise their right to vote, by electronic means, either at a general meeting of the company or by means of a postal ballot.
The dividend, if any, proposed by Tata Motors Limited’s Board of Directors is subject to the approval of the shareholders in the shareholders meeting and isensuing Annual General Meeting. Further, the Board of Directors may also announce an interim dividend which would need to be decided on a show of hands,confirmed by the shareholders at the forthcoming Annual General Meeting. The holders of ‘A’ Ordinary shares shall be entitled to receive dividend for each financial year at five percentage point more than the same numberaggregate rate of votes as availabledividend declared on Ordinary shares for that financial year.
In the event of liquidation, the shareholders are eligible to holdersreceive the remaining assets of the Company after distribution of all preferential amounts, in proportion to their shareholdings.
Rights issue subsequent to the year ended March 31, 2015
Subsequent to the year ended March 31, 2015, the Company alloted 150,490,480 (including 32,049,820 shares underlying the ADSs) Ordinary shares.shares at a premium of Rs. 448 per share aggregating Rs. 67,720.7 million and 26,509,759 ‘A’ Ordinary shares at a premium of Rs. 269 per share, aggregating to Rs. 7,184.1 million, pursuant to the Rights issue. 1,54,279 Ordinary shares and 20,531 ‘A’ Ordinary shares have been kept in abeyance.
The rights offer raised Rs.74,904.8 million which is being used, net of issue expenses, for repayment in full or part, of certain long-term and short-term borrowings, funding of capital expenditure towards property plant and equipment and expenditure relating to research and product development and for general corporate purposes.
Accordingly, basic and diluted earnings per share for all periods presented have been retrospectively adjusted for the bonus element. Refer to note 40.
| 26. | Other components of equity |
| The movement of Currency translation reserve is as follows: |
| Year ended March 31, | Year ended March 31, | |||||||||||||||||||||||||||||||
| 2013 | 2013 | 2012 | 2011 | 2015 | 2015 | 2014 | 2013 | |||||||||||||||||||||||||
| (In millions) | (In millions) | |||||||||||||||||||||||||||||||
Balance at the beginning | US$ | 55.9 | Rs. | 3,033.0 | Rs. | (20,399.1 | ) | Rs. | (25,982.3 | ) | US$ | 1,129.8 | Rs. | 70,610.8 | Rs. | 3,820.6 | Rs. | 3,033.0 | ||||||||||||||
Exchange differences arising on translating the net assets of foreign operations (net) | 14.2 | 774.2 | 23,398.1 | 5,571.5 | (686.5 | ) | (42,905.3 | ) | 66,376.4 | 774.2 | ||||||||||||||||||||||
Net change in translation reserve - equity accounted investees (net) | 0.3 | 13.4 | 34.0 | 11.7 | ||||||||||||||||||||||||||||
Net change in translation reserve – equity accounted investees (net) | 18.9 | 1,182.4 | 413.8 | 13.4 | ||||||||||||||||||||||||||||
|
|
|
|
|
|
|
| |||||||||||||||||||||||||
Balance at the end | US$ | 70.4 | Rs. | 3,820.6 | Rs. | 3,033.0 | Rs. | (20,399.1 | ) | US$ | 462.2 | Rs. | 28,887.9 | Rs. | 70,610.8 | Rs. | 3,820.6 | |||||||||||||||
|
|
|
|
|
|
|
| |||||||||||||||||||||||||
| The movement of Available-for-sale investments reserve is as follows: |
| Year ended March 31, | Year ended March 31, | |||||||||||||||||||||||||||||||
| 2013 | 2013 | 2012 | 2011 | 2015 | 2015 | 2014 | 2013 | |||||||||||||||||||||||||
| (In millions) | (In millions) | |||||||||||||||||||||||||||||||
Balance at the beginning | US$ | (0.5 | ) | Rs. | (26.7 | ) | Rs. | 772.0 | Rs. | 733.5 | US$ | 12.8 | Rs. | 800.2 | Rs. | 320.3 | Rs. | (26.7 | ) | |||||||||||||
Gain/(loss) arising on revaluation of available-for-sale investments (net) | (11.3 | ) | (623.1 | ) | (770.6 | ) | 44.6 | |||||||||||||||||||||||||
Gain/(loss) arising on revaluation of available-for sale investments (net) | (5.5 | ) | (340.0 | ) | 589.9 | (623.1 | ) | |||||||||||||||||||||||||
Income tax relating to gain/loss arising on revaluation of available-for-sale investments (net), where applicable | (1.3 | ) | (72.3 | ) | (18.4 | ) | (4.5 | ) | (0.3 | ) | (18.1 | ) | (36.1 | ) | (72.3 | ) | ||||||||||||||||
Cumulative (gain)/loss reclassified to profit or loss on available-for-sale investments (net) | 18.7 | 1,023.7 | (17.1 | ) | (2.4 | ) | (3.0 | ) | (190.3 | ) | (142.7 | ) | 1,023.7 | |||||||||||||||||||
Income tax relating to cumulative gain/loss reclassified to profit or loss on available-for-sale investments (net), where applicable | 0.3 | 17.2 | 5.5 | 0.8 | 0.6 | 36.1 | 63.5 | 17.2 | ||||||||||||||||||||||||
Net change in share of available-for-sale investments reserves – equity accounted investees (net) | — | 1.5 | 1.9 | — | (0.1 | ) | (7.3 | ) | 5.3 | 1.5 | ||||||||||||||||||||||
|
|
|
|
|
|
|
| |||||||||||||||||||||||||
Balance at the end | US$ | 5.9 | Rs. | 320.3 | Rs. | (26.7 | ) | Rs. | 772.0 | US$ | 4.5 | Rs. | 280.6 | Rs. | 800.2 | Rs. | 320.3 | |||||||||||||||
|
|
|
|
|
|
|
| |||||||||||||||||||||||||
| The movement of Hedging reserve is as follows: |
| Year ended March 31, | Year ended March 31, | |||||||||||||||||||||||||||||||
| 2013 | 2013 | 2012 | 2011 | 2015 | 2015 | 2014 | 2013 | |||||||||||||||||||||||||
| (In millions) | (In millions) | |||||||||||||||||||||||||||||||
Balance at the beginning | US$ | (31.2 | ) | Rs. | (1,695.3 | ) | Rs. | 1,528.7 | Rs. | — | US$ | 867.2 | Rs. | 54,198.2 | Rs. | (16,801.3 | ) | Rs. | (1,695.3 | ) | ||||||||||||
Gain/(loss) recognised on cash flow hedges | (455.7 | ) | (24,737.3 | ) | (2,748.5 | ) | 3,021.7 | (2,786.5 | ) | (174,153.2 | ) | 100,428.5 | (24,737.3 | ) | ||||||||||||||||||
Income tax relating to gain/loss recognized on cash flow hedges | 105.6 | 5,736.3 | 696.8 | (558.9 | ) | 557.1 | 34,821.0 | (21,158.1 | ) | 5,736.3 | ||||||||||||||||||||||
(Gain)/loss reclassified to profit or loss | 93.0 | 5,047.2 | (1,615.0 | ) | (934.1 | ) | (69.4 | ) | (4,338.4 | ) | (10,771.4 | ) | 5,047.2 | |||||||||||||||||||
Income tax relating to gain/loss reclassified to profit or loss | (21.2 | ) | (1,152.2 | ) | 442.7 | — | 13.9 | 869.2 | 2,500.5 | (1,152.2 | ) | |||||||||||||||||||||
|
|
|
|
|
|
|
| |||||||||||||||||||||||||
Balance at the end | US$ | (309.5 | ) | Rs. | (16,801.3 | ) | Rs. | (1,695.3 | ) | Rs. | 1,528.7 | US$ | (1,417.7 | ) | Rs. | (88,603.2 | ) | Rs. | 54,198.2 | Rs. | (16,801.3 | ) | ||||||||||
|
|
|
|
|
|
|
| |||||||||||||||||||||||||
| Summary of Other components of equity: |
| As of March 31, | As at March 31, | |||||||||||||||||||||||||||||||
| 2013 | 2013 | 2012 | 2011 | 2015 | 2015 | 2014 | 2013 | |||||||||||||||||||||||||
| (In millions) | (In millions) | |||||||||||||||||||||||||||||||
Currency translation reserve | US$ | 70.4 | Rs. | 3,820.6 | Rs. | 3,033.0 | Rs. | (20,399.1 | ) | US$ | 462.2 | Rs. | 28,887.9 | Rs. | 70,610.8 | Rs. | 3,820.6 | |||||||||||||||
Available-for-sale investments reserve | 5.9 | 320.3 | (26.7 | ) | 772.0 | 4.5 | 280.6 | 800.2 | 320.3 | |||||||||||||||||||||||
Hedging reserve | (309.5 | ) | (16,801.3 | ) | (1,695.3 | ) | 1,528.7 | (1,417.7 | ) | (88,603.2 | ) | 54,198.2 | (16,801.3 | ) | ||||||||||||||||||
|
|
|
|
|
|
|
| |||||||||||||||||||||||||
Total | US$ | (233.2 | ) | Rs. | (12,660.4 | ) | Rs. | 1,311.0 | Rs. | (18,098.4 | ) | US$ | (951.0 | ) | Rs. | (59,434.7 | ) | Rs. | 125,609.2 | Rs. | (12,660.4 | ) | ||||||||||
|
|
|
|
|
|
|
| |||||||||||||||||||||||||
| 27. | Notes to reserves and dividends |
Capital redemption reserve
The Indian Companies Act, 19562013 (the “Companies Act”) requires that where a company purchases its own shares not out of proceeds of a fresh issue but out of free reserves thenor securities premium account, a sum equal to the nominal value of the shares so purchased shall be transferred to athe capital redemption reserve account whichand details of such transfer shall be disclosed in the balance sheet. The capital redemption reserve account may be applied by the company, in paying up unissued shares of the company to issuebe issued to shareholders of the company as fully paid bonus shares. Tata Motors Limited established this reserve pursuant to the redemption of preference shares issued in earlier years.
Debenture redemption reserve
The Companies Act requires that where a company issues debentures, it shall create a debenture redemption reserve fromout of profits every year until such debentures are redeemed. Manufacturing companies areof the company available for payment of dividend. The Company is required to maintain a minimum proportionDebenture Redemption Reserve of 25% of the outstanding redeemablevalue of debentures asissued, either by a reserve.public issue or on a private placement basis. The amounts credited to the debenture redemption reserve may not be utilized by the company except to redeem debentures.
Reserve for research and human resource development
In terms of Article 9 of the Act on Special Taxation Restriction in Korea, Tata Daewoo Commercial Vehicle Company Limited (TDCV, a subsidiary company)of Tata Motors Limited) is entitled for deferment of tax in respect of expenditureexpenditures incurred on product development cost subject to fulfillment of certain conditions, by way of deduction from the taxable income, provided that TDCV appropriates an equivalent amount from ‘Retained Earnings’“Retained Earnings” to ‘Reserve“Reserve for Research and Human Resource Development’Development”.
The deferment is for a period of three years and from the fourth year onwards one-third of the reserve is offered to tax and an equal amount is then transferred from the reserve to ‘Retained“Retained earnings available for appropriation’appropriation”.
Special reserve
The special reserve represents the reserve created by two subsidiaries of Tata Motors Limited pursuant to the Reserve Bank of India Act, 1934 (the “RBI Act”) and related regulations applicable to those companies. Under the RBI Act, a non-bankingnonbanking finance company is required to transfer an amount not less than 20 per cent20% of its net profit to a reserve fund before declaring any dividend. Appropriation from this reserve fund is permitted only for the purposes specified by the RBI.
Earned surplus reserve
Under the Korean commercial code, Tata Daewoo Commercial Vehicle Company Limited (TDCV, a subsidiary company)TDCV is required to appropriate at least 10% of cash dividend declared each year to a legal reserve until such reserves equal to 50% of capital stock. This reserve may not be utilized for cash dividends, but may only be used to offset against future deficit,deficits, if any, or may be transferred to capital stock.
Dividends
The final dividend is recommended by the Board of Directors and is recorded in the books of account upon its approval by the shareholders. Tata Motors Limited is liable to income tax on distribution of profits. Tata Motors Limited paid dividend per share of Rs. 4/-2 for Ordinary Shares (face value of Rs. 2 each) and Rs. 4.1/-2.10 for ‘A’ Ordinary Shares (face value of Rs. 2 each) during the yearyears ended March 31, 2013, Rs. 20/- for Ordinary Shares (face value of Rs. 10 each)2015 and Rs. 20.50 for ‘A’ Ordinary Shares (face value of Rs. 10 each) during the year ended March 31, 2012. In the meeting of Board of Directors of Tata Motors Limited held on May 29, 2013, the Board recommended a dividend of Rs. 2/- per Ordinary Share (face value of Rs. 2 each) and Rs.2.1/- per ‘A’ Ordinary Share (face value of Rs. 2 each), which will be subject to approval by the shareholders in their Annual General Meeting to be held on August 21, 2013.2014, respectively.
| 28. | Employee |
Employee cost consists of the following:
| Years ended March 31, | ||||||||||||||||
| 2013 | 2013 | 2012 | 2011 | |||||||||||||
| (In millions) | ||||||||||||||||
Salaries, wages and welfare expenses | US$ | 2,742.8 | Rs. | 148,893.3 | Rs. | 109,287.8 | Rs. | 83,795.1 | ||||||||
Contribution to provident fund and other funds | 315.8 | 17,145.5 | 12,842.4 | 8,454.5 | ||||||||||||
|
|
|
|
|
|
|
| |||||||||
Total | US$ | 3,058.6 | Rs. | 166,038.8 | Rs. | 122,130.2 | Rs. | 92,249.6 | ||||||||
|
|
|
|
|
|
|
| |||||||||
Salaries, wages and welfare expenses Contribution to provident fund and other funds Total Year ended March 31, 2015 2015 2014 2013 (In millions) US$ 3,577.5 Rs. 223,594.3 Rs. 187,862.2 Rs. 149,928.7 428.9 26,806.9 26,040.8 17,240.8 US$ 4,006.4 Rs. 250,401.2 Rs. 213,903.0 Rs. 167,169.5
A subsidiary of the Company operates a Long Term Incentive Plan (LTIP) arrangement for certain employees. The scheme provides a cash payment to the employee based on a specific number of phantom shares at grant and the share price of Tata Motors Limited (TML) at the vesting date. The cash payment is dependent on the performance of the underlying TML shares of Tata Motors Limited over the 3 year vesting period and continued employment at the end of the vesting period. The fair value of the awards is calculated using a Black ScholesBlack-Scholes model at the grant date. The fair value is updated at each reporting date as the awards are accounted for as cash settledcash-settled plan. The inputs into the model are based on the Tata Motors Limited historic data, the risk-free rate and the weighted average fair value of shares, in the scheme at the reporting date. The amount expensed in relation to the long term incentive planLTIP was Rs.464.3Rs. 1,577.6 million, Rs.328.3Rs. 1,057.9 million and Rs.198.3Rs. 464.3 million for the yearyears ended March 31, 2013, 20122015, 2014 and 20112013, respectively. The Company considers these amounts as not material and accordingly has not provided further disclosures as required by IFRS 2 “Share-based payment”.
| 29. | Other |
Other expenses consist of the following:
| Year ended March 31, | Year ended March 31, | |||||||||||||||||||||||||||||||
| 2013 | 2013 | 2012 | 2011 | 2015 | 2015 | 2014 | 2013 | |||||||||||||||||||||||||
| (In millions) | (In millions) | |||||||||||||||||||||||||||||||
Stores, spare parts and tools consumed | US$ | 253.8 | Rs. | 13,775.5 | Rs. | 12,044.7 | Rs. | 11,753.1 | US$ | 285.1 | Rs. | 17,818.5 | Rs. | 16,823.4 | Rs. | 14,241.2 | ||||||||||||||||
Freight and transportation expenses | 1,028.9 | 55,851.2 | 45,891.2 | 30,886.3 | 1,348.9 | 84,309.2 | 75,438.5 | 55,930.4 | ||||||||||||||||||||||||
Research and product development cost | 372.0 | 20,193.1 | 13,859.6 | 9,590.4 | 456.2 | 28,515.3 | 25,651.2 | 20,339.5 | ||||||||||||||||||||||||
Warranty and product liability expenses | 771.3 | 41,869.4 | 35,814.5 | 29,334.3 | 964.2 | 60,265.5 | 57,957.3 | 42,028.7 | ||||||||||||||||||||||||
Allowance for trade and other receivables, and finance receivables | 194.7 | 10,569.2 | 6,744.6 | 5,972.1 | 409.5 | 25,597.2 | 26,829.9 | 10,569.5 | ||||||||||||||||||||||||
Works operation and other expenses | 2,638.2 | 143,224.3 | 110,718.7 | 79,765.2 | 3,412.6 | 213,280.0 | 186,066.6 | 143,923.5 | ||||||||||||||||||||||||
Repairs to building and plant and machinery | 56.9 | 3,087.1 | 2,707.1 | 2,925.0 | 93.4 | 5,837.4 | 3,549.1 | 3,252.3 | ||||||||||||||||||||||||
Processing charges | 267.2 | 14,505.6 | 15,391.4 | 11,733.2 | 168.1 | 10,504.8 | 10,935.3 | 14,505.6 | ||||||||||||||||||||||||
Power and fuel | 192.7 | 10,460.6 | 9,986.7 | 8,301.4 | 177.9 | 11,116.0 | 11,278.0 | 10,777.2 | ||||||||||||||||||||||||
Insurance | 41.8 | 2,268.5 | 2,291.5 | 1,627.8 | 46.3 | 2,892.7 | 2,823.0 | 2,299.2 | ||||||||||||||||||||||||
Publicity | 1,221.6 | 66,315.1 | 53,930.5 | 40,452.9 | 1,372.4 | 85,772.9 | 81,425.4 | 66,556.2 | ||||||||||||||||||||||||
|
|
|
|
|
|
|
| |||||||||||||||||||||||||
Total | US$ | 7,039.1 | Rs. | 382,119.6 | Rs. | 309,380.5 | Rs. | 232,341.7 | US$ | 8,734.6 | Rs. | 545,909.5 | Rs. | 498,777.7 | Rs. | 384,423.3 | ||||||||||||||||
|
|
|
|
|
|
|
| |||||||||||||||||||||||||
| 30. | Other income/(loss) (net) |
Other income/(loss) (net) consistconsists of the following:
| Year ended March 31, | Year ended March 31, | |||||||||||||||||||||||||||||||
| 2013 | 2013 | 2012 | 2011 | 2015 | 2015 | 2014 | 2013 | |||||||||||||||||||||||||
| (In millions) | (In millions) | |||||||||||||||||||||||||||||||
Miscellaneous income | US$ | 136.5 | Rs. | 7,412.4 | Rs. | 6,810.1 | Rs. | 5,082.6 | US$ | 215.6 | Rs. | 13,474.3 | Rs. | 12,179.3 | Rs. | 7,485.1 | ||||||||||||||||
Dividend income and income on mutual funds | 7.0 | 377.8 | �� | 381.7 | 667.6 | 5.6 | 351.3 | 375.1 | 384.0 | |||||||||||||||||||||||
Gain on sale / (loss) on fair valuation of available-for-sale investments (net) | (5.1 | ) | (277.6 | ) | 484.5 | 166.6 | ||||||||||||||||||||||||||
Gain/(loss) on sale, change in fair value of available-for-sale investments (net) | 19.1 | 1,195.0 | 1,102.1 | (275.2 | ) | |||||||||||||||||||||||||||
Gain/(loss) on change in the fair value of conversion options | 14.8 | 801.6 | 2,432.4 | (13,850.1 | ) | — | — | (838.2 | ) | 801.6 | ||||||||||||||||||||||
Gain on fair value of prepayment options on Senior Notes | 72.4 | 3,932.6 | — | — | ||||||||||||||||||||||||||||
Loss on sale of assets/assets written off and others (net) | (4.1 | ) | (222.8 | ) | (701.6 | ) | (284.7 | ) | ||||||||||||||||||||||||
Gain/(loss) on change in fair value of prepayment options on senior notes | — | — | (4,791.6 | ) | 3,932.6 | |||||||||||||||||||||||||||
Loss on sale of assets/assets written off and others (net) * | (56.2 | ) | (3,512.2 | ) | (294.1 | ) | (229.0 | ) | ||||||||||||||||||||||||
|
|
|
|
|
|
|
| |||||||||||||||||||||||||
Total | US$ | 221.5 | Rs. | 12,024.0 | Rs. 9,407.1 | Rs. | (8,218.0 | ) | US$ | 184.1 | Rs. | 11,508.4 | Rs. | 7,732.6 | Rs. | 12,099.1 | ||||||||||||||||
|
|
|
|
|
|
|
| |||||||||||||||||||||||||
| * | Includes provision of Rs. 3,098.8 million as described in note 12. |
| 31. | Interest expense (net) |
Interest expense (net) consists of the following:
| Year ended March 31, | ||||||||||||||||
| 2013 | 2013 | 2012 | 2011 | |||||||||||||
| (In millions) | ||||||||||||||||
Gross interest expense | US$ | 996.8 | Rs. | 54,111.9 | Rs. | 46,377.3 | Rs. | 42,360.1 | ||||||||
Less: Interest capitalized * | (246.1 | ) | (13,360.1 | ) | (8,086.9 | ) | (5,506.6 | ) | ||||||||
|
|
|
|
|
|
|
| |||||||||
Total | US$ | 750.7 | Rs. | 40,751.8 | Rs. | 38,290.4 | Rs. | 36,853.5 | ||||||||
|
|
|
|
|
|
|
| |||||||||
The weighted average rate for capitalization of interest relating to general borrowings was approximately 8.7%, 8.3% and 7.1% for the year ended March 31, 2013, 2012 and 2011, respectively.
| Year ended March 31, | ||||||||||||||||
| 2015 | 2015 | 2014 | 2013 | |||||||||||||
| (In millions) | ||||||||||||||||
Gross interest expense | US$ | 1,098.2 | Rs. | 68,634.7 | Rs. | 68,075.3 | Rs. | 54,152.1 | ||||||||
Less: Interest capitalized * | (262.4 | ) | (16,403.1 | ) | (14,980.6 | ) | (13,360.1 | ) | ||||||||
|
|
|
|
|
|
|
| |||||||||
Total | US$ | 835.8 | Rs. | 52,231.6 | Rs. | 53,094.7 | Rs. | 40,792.0 | ||||||||
|
|
|
|
|
|
|
| |||||||||
| * | Represents borrowing costs capitalized during the year on qualifying assets (property, plant and equipment and product development). |
The weighted average rate for capitalization of interest relating to general borrowings was approximately 7.1%, 7.9% and 8.7% for the years ended March 31, 2015, 2014 and 2013, respectively.
| 32. | Employee benefits |
Defined Benefit Plan
Pension and post retirement medical plans
The following table sets out the funded and unfunded status and the amounts recognized in the financial statements for the pension and the post retirement medical plans in respect of Tata Motors andLimited, its Indian subsidiaries:subsidiaries and joint operations:
| As of March 31, | As at March 31, | |||||||||||||||||||||||||||||||||||||||||||||||
| Pension Benefits | Post retirement medical Benefits | Pension benefits | Post retirement medical benefits | |||||||||||||||||||||||||||||||||||||||||||||
| 2013 | 2013 | 2012 | 2013 | 2013 | 2012 | 2015 | 2015 | 2014 | 2015 | 2015 | 2014 | |||||||||||||||||||||||||||||||||||||
| (In millions) | (In millions) | |||||||||||||||||||||||||||||||||||||||||||||||
Change in defined benefit obligations : | ||||||||||||||||||||||||||||||||||||||||||||||||
Change in defined benefit obligations: | ||||||||||||||||||||||||||||||||||||||||||||||||
Defined benefit obligation, beginning of the year | US$ | 138.2 | Rs. | 7,504.0 | Rs. | 6,861.2 | US$ | 18.4 | Rs. | 1,001.2 | Rs. | 976.8 | US$ | 132.4 | Rs. | 8,277.6 | Rs. | 8,148.3 | US$ | 19.9 | Rs. | 1,239.9 | Rs. | 1,104.5 | ||||||||||||||||||||||||
Transfers | — | 0.4 | 4.2 | — | — | — | ||||||||||||||||||||||||||||||||||||||||||
Service cost | 9.5 | 517.6 | 461.4 | 0.7 | 40.6 | 42.2 | ||||||||||||||||||||||||||||||||||||||||||
Current service cost | 9.0 | 564.3 | 585.3 | 0.9 | 57.1 | 51.8 | ||||||||||||||||||||||||||||||||||||||||||
Interest cost | 11.1 | 595.6 | 550.5 | 1.5 | 83.4 | 81.4 | 11.0 | 690.5 | 638.1 | 1.8 | 113.1 | 90.6 | ||||||||||||||||||||||||||||||||||||
Actuarial (gain)/ loss | 4.6 | 251.5 | 187.8 | 0.4 | 20.0 | (60.2 | ) | |||||||||||||||||||||||||||||||||||||||||
Benefits paid | (15.0 | ) | (812.3 | ) | (561.1 | ) | (0.7 | ) | (40.7 | ) | (39.0 | ) | ||||||||||||||||||||||||||||||||||||
Remeasurements (gains)/losses | ||||||||||||||||||||||||||||||||||||||||||||||||
Actuarial (gains)/losses arising from changes in demographic assumptions | 0.1 | 5.9 | (4.3 | ) | — | — | — | |||||||||||||||||||||||||||||||||||||||||
Actuarial (gains)/losses arising from changes in financial assumptions | 12.2 | 760.0 | (464.8 | ) | 3.2 | 199.8 | (8.1 | ) | ||||||||||||||||||||||||||||||||||||||||
Actuarial (gains)/losses arising from changes in experience adjustments | 1.5 | 93.7 | 231.9 | (0.6 | ) | (38.3 | ) | 34.6 | ||||||||||||||||||||||||||||||||||||||||
Past service cost | — | — | 1.6 | 0.1 | 7.0 | 5.5 | ||||||||||||||||||||||||||||||||||||||||||
Benefits paid from plan assets | (21.1 | ) | (1,321.6 | ) | (809.4 | ) | — | — | — | |||||||||||||||||||||||||||||||||||||||
Benefits paid directly by employer | (0.8 | ) | (52.3 | ) | (49.1 | ) | (0.4 | ) | (22.0 | ) | (39.0 | ) | ||||||||||||||||||||||||||||||||||||
|
|
|
|
|
|
|
|
|
|
|
| |||||||||||||||||||||||||||||||||||||
Defined benefit obligation, end of the year | US$ | 148.4 | Rs. | 8,056.8 | Rs. | 7,504.0 | US$ | 20.3 | Rs. | 1,104.5 | Rs. | 1,001.2 | US$ | 144.3 | Rs. | 9,018.1 | Rs. | 8,277.6 | US$ | 24.9 | Rs. | 1,556.6 | Rs. | 1,239.9 | ||||||||||||||||||||||||
|
|
|
|
|
|
|
|
|
|
|
| |||||||||||||||||||||||||||||||||||||
Change in plan assets: | ||||||||||||||||||||||||||||||||||||||||||||||||
Fair value of plan assets, beginning of the year | US$ | 123.7 | Rs. | 6,713.7 | Rs. | 6,139.8 | — | — | — | US$ | 115.3 | Rs. | 7,206.0 | Rs. | 7,373.7 | US$ | — | Rs. | — | Rs. | — | |||||||||||||||||||||||||||
Transfers | — | 0.4 | — | — | — | — | ||||||||||||||||||||||||||||||||||||||||||
Expected return on plan assets | 9.8 | 531.6 | 495.6 | — | — | — | ||||||||||||||||||||||||||||||||||||||||||
Actuarial gain / (loss) | 3.8 | 205.8 | (31.9 | ) | — | — | — | |||||||||||||||||||||||||||||||||||||||||
Interest income | 9.0 | 564.2 | 584.8 | — | — | — | ||||||||||||||||||||||||||||||||||||||||||
Remeasurements gains/(losses) | ||||||||||||||||||||||||||||||||||||||||||||||||
Return on plan assets, (excluding amount included in net Interest expense) | 4.3 | 268.7 | (248.5 | ) | — | — | — | |||||||||||||||||||||||||||||||||||||||||
Employer’s contributions | 12.4 | 672.4 | 671.3 | 0.7 | 40.7 | 39.0 | 18.8 | 1,174.0 | 374.7 | — | — | — | ||||||||||||||||||||||||||||||||||||
Benefits paid | (15.0 | ) | (812.3 | ) | (561.1 | ) | (0.7 | ) | (40.7 | ) | (39.0 | ) | (21.1 | ) | (1,321.6 | ) | (809.4 | ) | — | — | — | |||||||||||||||||||||||||||
Others | — | — | (69.3 | ) | — | — | — | |||||||||||||||||||||||||||||||||||||||||
|
|
|
|
|
|
|
|
|
|
|
| |||||||||||||||||||||||||||||||||||||
Fair value of plan assets, end of the year | US$ | 134.7 | Rs. | 7,311.6 | Rs. | 6,713.7 | — | — | — | US$ | 126.3 | Rs. | 7,891.3 | Rs. | 7,206.0 | US$ | — | Rs. | — | Rs. | — | |||||||||||||||||||||||||||
|
|
|
|
|
|
|
|
|
|
|
| |||||||||||||||||||||||||||||||||||||
| As of March 31, | As at March 31, | |||||||||||||||||||||||||||||||||||||||||||||||
| Pension Benefits | Post retirement medical Benefits | Pension benefits | Post retirement medical benefits | |||||||||||||||||||||||||||||||||||||||||||||
| 2013 | 2013 | 2012 | 2013 | 2013 | 2012 | 2015 | 2015 | 2014 | 2015 | 2015 | 2014 | |||||||||||||||||||||||||||||||||||||
| (In millions) | (In millions) | |||||||||||||||||||||||||||||||||||||||||||||||
Amount recognized in the balance sheet consists of: | ||||||||||||||||||||||||||||||||||||||||||||||||
Present value of defined benefit obligation | 148.4 | Rs. | 8,056.8 | Rs. | 7,504.0 | 20.3 | Rs. | 1,104.5 | Rs. | 1,001.2 | US$ | 144.3 | Rs. | 9,018.1 | Rs. | 8,277.6 | US$ | 24.9 | Rs. | 1,556.6 | Rs. | 1,239.9 | ||||||||||||||||||||||||||
Fair value of plan assets | 134.7 | 7,311.6 | 6,713.7 | — | — | — | 126.3 | 7,891.3 | 7,206.0 | — | — | — | ||||||||||||||||||||||||||||||||||||
|
|
|
|
|
|
|
|
|
|
|
| |||||||||||||||||||||||||||||||||||||
Net liability | US$ | (13.7 | ) | Rs. | (745.2 | ) | Rs. | (790.3 | ) | US$ | (20.3 | ) | Rs. | (1,104.5 | ) | Rs. | (1,001.2 | ) | US$ | (18.0 | ) | Rs. | (1,126.8 | ) | Rs. | (1,071.6 | ) | US$ | (24.9 | ) | Rs. | (1,556.6 | ) | Rs. | (1,239.9 | ) | ||||||||||||
|
|
|
|
|
|
|
|
|
|
|
| |||||||||||||||||||||||||||||||||||||
Amounts in the balance sheet: | ||||||||||||||||||||||||||||||||||||||||||||||||
Non–current assets | US$ | 1.7 | Rs. | 93.9 | Rs. | 37.3 | US$ | — | Rs. | — | Rs. | — | US$ | 1.7 | Rs. | 108.5 | Rs. | 33.1 | US$ | — | Rs. | — | Rs. | — | ||||||||||||||||||||||||
Non–current liabilities | (15.4 | ) | (839.1 | ) | (827.6 | ) | (20.3 | ) | (1,104.5 | ) | (1,001.2 | ) | (19.7 | ) | (1,235.3 | ) | (1,104.7 | ) | (24.9 | ) | (1,556.6 | ) | (1,239.9 | ) | ||||||||||||||||||||||||
|
|
|
|
|
|
|
|
|
|
|
| |||||||||||||||||||||||||||||||||||||
Net liability | US$ | (13.7 | ) | Rs. | (745.2 | ) | Rs. | (790.3 | ) | US$ | (20.3 | ) | Rs. | (1,104.5 | ) | Rs. | (1,001.2 | ) | US$ | (18.0 | ) | Rs. | (1,126.8 | ) | Rs. | (1,071.6 | ) | US$ | (24.9 | ) | Rs. | (1,556.6 | ) | Rs. | (1,239.9 | ) | ||||||||||||
|
|
|
|
|
|
|
|
|
|
|
| |||||||||||||||||||||||||||||||||||||
Experience adjustments Present value of defined benefit obligation Fair value of plan assets Surplus/ (deficit) Experience adjustments on plan liabilities - loss/(gain) Experience adjustments on plan assets - (loss)/ gain As of March 31, Pension Benefits Post retirement medical Benefits 2013 2013 2012 2011 2010 2009 2013 2013 2012 2011 2010 2009 (In millions) US$ 148.4 Rs. 8,056.8 Rs. 7,504.0 Rs. 6,861.2 Rs. 6,051.0 Rs. 5,731.8 US$ 20.3 Rs. 1,104.5 Rs. 1,001.2 Rs. 976.8 Rs. 871.2 Rs. 851.3 134.7 7,311.6 6,713.7 6,139.8 5,473.5 5,148.5 — — — — — — (13.7 ) (745.2 ) (790.3 ) (721.4 ) (577.5 ) (583.3 ) (20.3 ) (1,104.5 ) (1,001.2 ) (976.8 ) (871.2 ) (851.3 ) 4.3 233.6 (78.9 ) (375.3 ) (47.3 ) (464.0 ) (1.6 ) (87.6 ) (28.3 ) 53.2 3.9 48.7 US$ 3.8 Rs. 205.8 Rs. (31.9 ) Rs. 26.1 Rs. (51.4 ) Rs. 105.7 US$ — Rs. — — — — —
AmountTotal amount recognized in other comprehensive income consists of:
| As of March 31, | ||||||||||||||||||||||||||||||||
| Pension Benefits | Post retirement medical Benefits | |||||||||||||||||||||||||||||||
| 2013 | 2013 | 2012 | 2011 | 2013 | 2013 | 2012 | 2011 | |||||||||||||||||||||||||
| (In millions) | ||||||||||||||||||||||||||||||||
Actuarial loss /(gain) | US$ | 33.8 | Rs. 1,833.6 | Rs. 1,787.9 | Rs. 1,568.2 | US$ | 2.6 | Rs. 142.5 | Rs. 122.5 | Rs. 182.7 | ||||||||||||||||||||||
|
|
|
|
|
|
|
|
|
|
|
|
|
|
|
| |||||||||||||||||
| US$ | 33.8 | Rs. 1,833.6 | Rs. 1,787.9 | Rs. 1,568.2 | US$ | 2.6 | Rs. 142.5 | Rs. 122.5 | Rs. 182.7 | |||||||||||||||||||||||
|
|
|
|
|
|
|
|
|
|
|
|
|
|
|
| |||||||||||||||||
| As at March 31, | ||||||||||||||||||||||||||||||
| Pension benefits | Post retirement medical benefits | |||||||||||||||||||||||||||||
| 2015 | 2015 | 2014 | 2013 | 2015 | 2015 | 2014 | 2013 | |||||||||||||||||||||||
| (In millions) | ||||||||||||||||||||||||||||||
Remeasurements (gains)/losses | US$ 39.0 | Rs. | 2,439.1 | Rs. | 1,848.2 | Rs. | 1,836.9 | US$ | 5.3 | Rs. | 330.5 | Rs. | 169.0 | Rs. | 142.5 | |||||||||||||||
|
|
|
|
|
|
|
|
|
|
|
|
|
|
| ||||||||||||||||
| US$ 39.0 | Rs. | 2,439.1 | Rs. | 1,848.2 | Rs. | 1,836.9 | US$ | 5.3 | Rs. | 330.5 | Rs. | 169.0 | Rs. | 142.5 | ||||||||||||||||
|
|
|
|
|
|
|
|
|
|
|
|
|
|
| ||||||||||||||||
Information for funded plans with a defined benefit obligation in excess of plan assets:
| As of March 31, | As at March 31, | |||||||||||||||||||||||
| Pension Benefits | Pension benefits | |||||||||||||||||||||||
| (In millions) | 2015 | 2015 | 2014 | |||||||||||||||||||||
| 2013 | 2013 | 2012 | (In millions) | |||||||||||||||||||||
Defined benefit obligation | US$ 12.6 | Rs. 682.8 | Rs. 6,281.5 | US$ | 117.4 | Rs. | 7,335.9 | Rs. | 6,830.3 | |||||||||||||||
Fair value of plan assets | US$ 10.9 | Rs. 589.3 | Rs. 6,120.5 | US$ | 112.9 | Rs. | 7,057.5 | Rs. | 6,517.0 | |||||||||||||||
Information for funded plans with a defined benefit obligation less than plan assets:
| As of March 31, | As at March 31, | |||||||||||||||||||||||
| Pension Benefits | Pension benefits | |||||||||||||||||||||||
| (In millions) | 2015 | 2015 | 2014 | |||||||||||||||||||||
| 2013 | 2013 | 2012 | (In millions) | |||||||||||||||||||||
Defined benefit obligation | US$ 122.1 | Rs. 6,628.3 | Rs. 555.9 | US$ | 11.6 | Rs. | 725.4 | Rs. | 655.9 | |||||||||||||||
Fair value of plan assets | US$ 123.8 | Rs. 6,722.3 | Rs. 593.2 | US$ | 13.4 | Rs. | 833.8 | Rs. | 689.0 | |||||||||||||||
Information for unfunded plans:
| As of March 31, | ||||||||||||||||||||||||
| Pension Benefits | Post retirement medical Benefits | |||||||||||||||||||||||
| 2013 | 2013 | 2012 | 2013 | 2013 | 2012 | |||||||||||||||||||
| (In millions) | ||||||||||||||||||||||||
Defined benefit obligation | US$ 13.7 | Rs. 745.7 | Rs. 666.6 | US$ 20.3 | Rs. 1,104.5 | Rs. 1,001.2 | ||||||||||||||||||
| As at March 31, | ||||||||||||||||||||||||
| Pension benefits | Post retirement medical benefits | |||||||||||||||||||||||
| 2015 | 2015 | 2014 | 2015 | 2015 | 2014 | |||||||||||||||||||
| (In millions) | ||||||||||||||||||||||||
Defined benefit obligation | US$ | 15.3 | Rs. | 956.8 | Rs. | 791.4 | US$ | 24.9 | Rs. | 1,556.6 | Rs. | 1,239.9 | ||||||||||||
Net pension and post retirement medical cost consistsconsist of the following components:
| Year ended March 31, | ||||||||||||||||||||||||||||||||||||||||||||||||||||||||||||||||
| Pension Benefits | Post retirement medical Benefits | Year ended March 31, | ||||||||||||||||||||||||||||||||||||||||||||||||||||||||||||||
| 2013 | 2013 | 2012 | 2011 | 2013 | 2013 | 2012 | 2011 | Pension benefits | Post retirement medical benefits | |||||||||||||||||||||||||||||||||||||||||||||||||||||||
| (In millions) | 2015 | 2015 | 2014 | 2013 | 2015 | 2015 | 2014 | 2013 | ||||||||||||||||||||||||||||||||||||||||||||||||||||||||
| (In millions) | ||||||||||||||||||||||||||||||||||||||||||||||||||||||||||||||||
Service cost | US$ | 9.5 | Rs. | 517.6 | Rs. | 461.4 | Rs. | 352.9 | US$ | 0.7 | Rs. | 40.6 | Rs. | 42.2 | Rs. | 36.7 | US$ | 9.0 | Rs. | 564.3 | Rs. | 585.3 | Rs. | 528.4 | US$ | 0.9 | Rs. | 57.1 | Rs. | 51.8 | Rs. | 40.6 | ||||||||||||||||||||||||||||||||
Interest cost | 11.1 | 595.6 | 550.5 | 477.7 | 1.5 | 83.4 | 81.4 | 72.3 | ||||||||||||||||||||||||||||||||||||||||||||||||||||||||
Expected return on plan assets | (9.8 | ) | (531.6 | ) | (495.6 | ) | (445.7 | ) | — | — | — | — | ||||||||||||||||||||||||||||||||||||||||||||||||||||
Past service cost | — | — | 1.6 | — | 0.1 | 7.0 | 5.5 | — | ||||||||||||||||||||||||||||||||||||||||||||||||||||||||
Net interest cost/(income) | 2.0 | 126.3 | 53.3 | 65.5 | 1.8 | 113.1 | 90.6 | 83.4 | ||||||||||||||||||||||||||||||||||||||||||||||||||||||||
|
|
|
|
|
|
|
|
|
|
|
|
|
|
|
| |||||||||||||||||||||||||||||||||||||||||||||||||
Net periodic cost | US$ | 10.8 | Rs. | 581.6 | Rs. | 516.3 | Rs. | 384.9 | US$ | 2.2 | Rs. | 124.0 | Rs. | 123.6 | Rs. | 109.0 | US$ | 11.0 | Rs. | 690.6 | Rs. | 640.2 | Rs. | 593.9 | US$ | 2.8 | Rs. | 177.2 | Rs. | 147.9 | Rs. | 124.0 | ||||||||||||||||||||||||||||||||
|
|
|
|
|
|
|
|
|
|
|
|
|
|
|
| |||||||||||||||||||||||||||||||||||||||||||||||||
Other changes in plan assets and benefit obligation recognized in other comprehensive income.income:
| Year ended March 31, | Year ended March 31, | |||||||||||||||||||||||||||||||||||||||||||||||||||||||||||||||
| Pension Benefits | Post retirement medical Benefits | Pension benefits | Post retirement medical benefits | |||||||||||||||||||||||||||||||||||||||||||||||||||||||||||||
| 2013 | 2013 | 2012 | 2011 | 2013 | 2013 | 2012 | 2011 | 2015 | 2015 | 2014 | 2013 | 2015 | 2015 | 2014 | 2013 | |||||||||||||||||||||||||||||||||||||||||||||||||
| (In millions) | (In millions) | |||||||||||||||||||||||||||||||||||||||||||||||||||||||||||||||
Actuarial loss/ (gain) | US$ | 0.8 | Rs. | 45.7 | Rs. | 219.7 | Rs. | 595.7 | US$ | 0.4 | Rs. | 20.0 | Rs. | (60.2 | ) | Rs. | 38.0 | |||||||||||||||||||||||||||||||||||||||||||||||
Remeasurements | ||||||||||||||||||||||||||||||||||||||||||||||||||||||||||||||||
Return on plan assets, (excluding amount included in net Interest expense) | US$ | (4.3 | ) | Rs. | (268.7 | ) | Rs. | 248.5 | Rs. | (206.2 | ) | US$ | — | Rs. | — | Rs. | — | Rs. | — | |||||||||||||||||||||||||||||||||||||||||||||
Actuarial (gains)/losses arising from changes in demographic assumptions | 0.1 | 5.9 | (4.3 | ) | (70.9 | ) | — | — | — | (2.2 | ) | |||||||||||||||||||||||||||||||||||||||||||||||||||||
Actuarial (gains)/losses arising from changes in financial assumptions | 12.2 | 760.0 | (464.8 | ) | 95.7 | 3.2 | 199.8 | (8.1 | ) | 109.8 | ||||||||||||||||||||||||||||||||||||||||||||||||||||||
Actuarial (gains)/losses arising from changes in experience adjustments on plan liabilities | 1.5 | 93.7 | 231.9 | 231.1 | (0.6 | ) | (38.3 | ) | 34.6 | (87.6 | ) | |||||||||||||||||||||||||||||||||||||||||||||||||||||
|
|
|
|
|
|
|
|
|
|
|
|
|
|
|
| |||||||||||||||||||||||||||||||||||||||||||||||||
Total recognized in other comprehensive income | US$ | 0.8 | Rs. | 45.7 | Rs. | 219.7 | Rs. | 595.7 | US$ | 0.4 | Rs. | 20.0 | Rs. | (60.2 | ) | Rs. | 38.0 | US$ | 9.5 | Rs. | 590.9 | Rs. | 11.3 | Rs. | 49.7 | US$ | 2.6 | Rs. | 161.5 | Rs. | 26.5 | Rs. | 20.0 | |||||||||||||||||||||||||||||||
|
|
|
|
|
|
|
|
|
|
|
|
|
|
|
| |||||||||||||||||||||||||||||||||||||||||||||||||
Total recognized in statement of operations and other comprehensive income | US$ | 11.6 | Rs. | 627.3 | Rs. | 736.0 | Rs. | 980.6 | US$ | 2.7 | Rs. | 144.0 | Rs. | 63.4 | Rs. | 147.0 | US$ | 20.5 | Rs. | 1,281.5 | Rs. | 651.5 | Rs. | 643.6 | US$ | 5.4 | Rs. | 338.7 | Rs. | 174.4 | Rs. | 144.0 | ||||||||||||||||||||||||||||||||
The assumptions used in accounting for the pension and post retirement medical plans are set out below:
| As of March 31, | ||||||||||||
| Pension Benefits | Post retirement medical Benefits | |||||||||||
| 2013 | 2012 | 2011 | 2013 | 2012 | 2011 | |||||||
Discount rate | 6.75% - 8.35% | 6.75% - 8.50% | 6.75% - 8.50% | 8.35% | 8.50% | 8.50% | ||||||
Rate of increase in compensation level of covered employees | 5.00% - 11.00% | 5.00% - 10.00% | 5.00% - 10.00% | NA | NA | NA | ||||||
Increase in health care cost | NA | NA | NA | 5.00% | 4.00% | 4.00% | ||||||
Expected rate of return on plan assets | 8.00% | 8.00% | 8.00% | NA | NA | NA | ||||||
The expected return on plan assets is determined considering several applicable factors mainly including the composition of the plan assets held, assessed risks of asset management, historical results of the return on plan assets and the Company’s policy for plan asset management.
| As at March 31, | ||||||||||||
| Pension benefits | Post retirement medical benefits | |||||||||||
| 2015 | 2014 | 2013 | 2015 | 2014 | 2013 | |||||||
Discount rate | 6.75% - 8.00% | 6.75% - 9.30% | 6.75% - 8.35% | 8.00% | 9.20% | 8.35% | ||||||
| Rate of increase in compensation level of covered employees | 5.00% - 11.00% | 5.00% - 11.00% | 5.00% - 11.00% | NA | NA | NA | ||||||
Increase in health care cost | NA | NA | NA | 6.00% | 6.00% | 5.00% | ||||||
Plan Assets
The fair value of Company’s pension plan asset allocationassets as ofat March 31, 20132015 and 20122014 by category are as follows:
| Pension benefits | ||||||||
| Plan assets as of March 31 | ||||||||
| 2013 | 2012 | |||||||
Asset category: | ||||||||
Debt securities | 73 | % | 77 | % | ||||
Balances with banks | 4 | % | 4 | % | ||||
Deposits with insurance companies | 23 | % | 19 | % | ||||
|
|
|
| |||||
| 100 | % | 100 | % | |||||
|
|
|
| |||||
| Pension benefits | ||||||||
| Plan assets as of March 31, | ||||||||
| 2015 | 2014 | |||||||
Asset category: | ||||||||
Cash and cash equivalents | 6 | % | 1 | % | ||||
Debt instruments (quoted) | 67 | % | 65 | % | ||||
Debt instruments | 6 | % | 6 | % | ||||
Insured benefits | 21 | % | 28 | % | ||||
|
|
|
| |||||
| 100 | % | 100 | % | |||||
|
|
|
| |||||
The Company’s policy is driven by considerations of maximizing returns while ensuring credit quality of the debt instruments. The asset allocation for plan assets is determined based on investment criteria prescribed under the Indian Income Tax Act, 1961, and is also subject to other exposure limitations. The Company evaluates the risks, transaction costs and liquidity for potential investments. To measure plan asset performance, the Company compares actual returns for each asset category with published bench marks.benchmarks.
The weighted average duration of the defined benefit obligation as at March 31, 2015 is 16.0 years (as at March 31, 2014: 15.6 years)
The Company expects to contribute Rs. 922.0Rs.893.2 million to the funded pension plans in fiscal 2014.
The table below outlinesduring the effect on the service cost, the interest cost and the defined benefit obligation in the event of an increase of 1% in the assumed rate of increase in health care cost:year ending March 31, 2016.
| Year ended March 31, | ||||||||||||
| 2013 | 2013 | 2012 | ||||||||||
| (In millions) | ||||||||||||
Effect on defined benefit obligation | US$ 1.9 | Rs. | 105.6 | Rs. | 83.2 | |||||||
Effect on service cost and interest cost | US$ 0.3 | Rs. | 17.7 | Rs. | 13.7 | |||||||
The table below outlines the effect on the service cost, the interest cost and the defined benefit obligation in the event of a decreasedecrease/increase of 1% in the assumed rate of decrease indiscount rate, salary escalation and health care cost:
| Year ended March 31, | ||||||||||||
| 2013 | 2013 | 2012 | ||||||||||
| (In millions) | ||||||||||||
Effect on defined benefit obligation | US$ | (1.7 | ) | Rs. | (91.1 | ) | Rs. | (185.0 | ) | |||
Effect on service cost and interest cost | US$ | (0.3 | ) | Rs. | (14.4 | ) | Rs. | (25.1 | ) | |||
Assumption | Change in assumption | Impact on defined benefit obligation | Impact on service cost and interest cost | |||
Discount rate | Increase by 1% Decrease by 1% | Decrease by Rs. 786.9 million Increase by Rs. 921.3 million | Decrease by Rs. 188.3 million Increase by Rs. 220.4 million | |||
Salary escalation rate | Increase by 1% Decrease by 1% | Increase by Rs. 662.6 million Decrease by Rs. 583.4 million | Increase by Rs. 190.9 million Decrease by Rs. 164.1 million | |||
Health care cost | Increase by 1% Decrease by 1% | Increase by Rs. 206.1 million Decrease by Rs. 167.4 million | Increase by Rs. 48.3 million Decrease by Rs. 38.9 million | |||
Severance indemnity plan
Severance indemnity is an unfundeda funded plan of Tata Daewoo Commercial Vehicles Limited (TDCV), a subsidiary of Tata Motors Limited.
The following table sets out, the amounts recognized in the financial statements for the severance indemnity plan.
| As of March 31, | ||||||||||||
| 2013 | 2013 | 2012 | ||||||||||
| (In millions) | ||||||||||||
Change in defined benefit obligation: | ||||||||||||
Defined benefit obligation, beginning of the year | US$ | 46.5 | Rs. | 2,525.5 | Rs. | 2,205.9 | ||||||
Service cost | 6.9 | 372.4 | 211.8 | |||||||||
Interest cost | 1.7 | 93.0 | 102.6 | |||||||||
Past service cost | (1.1 | ) | (61.7 | ) | — | |||||||
Actuarial loss / (gain) | (11.5 | ) | (624.0 | ) | (83.9 | ) | ||||||
Benefits paid | (16.2 | ) | (879.7 | ) | (146.4 | ) | ||||||
Foreign currency translation | 4.0 | 218.9 | 235.5 | |||||||||
|
|
|
|
|
| |||||||
Defined benefit obligation, end of the year | US$ | 30.3 | Rs. | 1,644.4 | Rs. | 2,525.5 | ||||||
|
|
|
|
|
| |||||||
Change in plan assets: | ||||||||||||
Fair value of plan assets, beginning of the year | US$ | — | Rs | — | Rs | — | ||||||
Expected return on plan assets | — | — | — | |||||||||
Actuarial (loss) / gain | — | — | — | |||||||||
Employer’s contributions | 16.2 | 879.7 | 146.4 | |||||||||
Benefits paid | (16.2 | ) | (879.7 | ) | (146.4 | ) | ||||||
|
|
|
|
|
| |||||||
Fair value of plan assets, end of the year | US$ | — | Rs | — | Rs | — | ||||||
|
|
|
|
|
| |||||||
| As of March 31, | ||||||||||||
| 2013 | 2013 | 2012 | ||||||||||
| (In millions) | ||||||||||||
Amount recognized in the balance sheet consist of: | ||||||||||||
Present value of defined benefit obligation | US$ | 30.3 | Rs. | 1,644.4 | Rs. | 2,525.5 | ||||||
|
|
|
|
|
| |||||||
Net liability | US$ | (30.3 | ) | Rs. | (1,644.4 | ) | Rs. | (2,525.5 | ) | |||
|
|
|
|
|
| |||||||
Amounts in the balance sheet: | ||||||||||||
Non- current liabilities | US$ | (30.3 | ) | Rs. | (1,644.4 | ) | Rs. | (2,525.5 | ) | |||
| As of March 31, | ||||||||||||||||||||||||
| Pension Benefits | ||||||||||||||||||||||||
| 2013 | 2013 | 2012 | 2011 | 2010 | 2009 | |||||||||||||||||||
| (In millions) | ||||||||||||||||||||||||
Experience adjustments | ||||||||||||||||||||||||
Present value of defined benefit obligation | US$ | 30.3 | Rs. 1,644.4 | Rs. 2,525.5 | Rs. 2,205.9 | Rs. 2,172.1 | Rs. 1,748.1 | |||||||||||||||||
Fair value of plan assets | — | — | — | — | — | — | ||||||||||||||||||
Surplus/ (deficit) | (30.3 | ) | (1,644.4 | ) | (2,525.5 | ) | (2,205.9 | ) | (2,172.1 | ) | (1,748.1 | ) | ||||||||||||
Experience adjustments on plan liabilities - loss/(gain) | (14.7 | ) | (796.2 | ) | (190.1 | ) | 55.6 | (200.9 | ) | (154.2 | ) | |||||||||||||
Experience adjustments on plan assets | — | — | — | — | — | — | ||||||||||||||||||
| As at March 31, | ||||||||||||
| 2015 | 2015 | 2014 | ||||||||||
| (In millions) | ||||||||||||
Change in defined benefit obligation: | ||||||||||||
Defined benefit obligation, beginning of the year | US$ | 35.1 | Rs. | 2,195.4 | Rs. | 1,644.4 | ||||||
Service cost | 6.7 | 421.6 | 387.5 | |||||||||
Interest cost | 1.3 | 80.5 | 56.4 | |||||||||
Remeasurements (gains)/losses | ||||||||||||
Actuarial (gains)/losses arising from changes in financial assumptions | 7.6 | 474.6 | (136.8 | ) | ||||||||
Actuarial (gains)/losses arising from changes in experience adjustments on plan liabilities | 3.2 | 198.3 | 65.4 | |||||||||
Benefits paid from plan assets | (0.5 | ) | (33.7 | ) | — | |||||||
Benefits paid directly by employer | (0.2 | ) | (13.6 | ) | (68.3 | ) | ||||||
Foreign currency translation | (0.3 | ) | (15.9 | ) | 246.8 | |||||||
|
|
|
|
|
| |||||||
Defined benefit obligation, end of the year | US$ | 52.9 | Rs. | 3,307.2 | Rs. | 2,195.4 | ||||||
|
|
|
|
|
| |||||||
Change in plan assets: | ||||||||||||
Fair value of plan assets, beginning of the year | US$ | 20.7 | Rs. | 1,294.3 | Rs. | — | ||||||
Interest income | 1.0 | 60.7 | 0.4 | |||||||||
Remeasurements gain/(loss) | ||||||||||||
Return on plan assets, (excluding amount included in net Interest expense) | (0.4 | ) | (26.3 | ) | — | |||||||
Employer’s contributions | 11.9 | 741.2 | 1,350.3 | |||||||||
Benefits paid | (0.5 | ) | (33.7 | ) | (68.3 | ) | ||||||
Foreign currency translation | (0.2 | ) | (11.1 | ) | 11.9 | |||||||
|
|
|
|
|
| |||||||
Fair value of plan assets, end of the year | US$ | 32.5 | Rs. | 2,025.1 | Rs. | 1,294.3 | ||||||
|
|
|
|
|
| |||||||
| As at March 31, | ||||||||||||
| 2015 | 2015 | 2014 | ||||||||||
| (In millions) | ||||||||||||
Amount recognized in the balance sheet consist of: |
| |||||||||||
Present value of defined benefit obligation | US$ | 52.9 | Rs. | 3,307.2 | Rs. | 2,195.4 | ||||||
Fair value of plan assets | 32.5 | 2,025.1 | 1,294.3 | |||||||||
|
|
|
|
|
| |||||||
Net liability | US$ | (20.4 | ) | Rs. | (1,282.1 | ) | Rs. | (901.1 | ) | |||
|
|
|
|
|
| |||||||
Amounts in the balance sheet: | ||||||||||||
Non- current liabilities | US$ | (20.4 | ) | Rs. | (1,282.1 | ) | Rs. | (901.1 | ) | |||
AmountTotal amount recognized in other comprehensive income for severance indemnity consists of:
| As of March 31, | ||||||||||||||||
| 2013 | 2013 | 2012 | 2011 | |||||||||||||
| (In millions) | ||||||||||||||||
Actuarial loss / (gain) | US$ | (8.6 | ) | Rs.(467.7) | Rs. 156.3 | Rs. 240.2 | ||||||||||
| As at March 31, | ||||||||||||||||
| 2015 | 2015 | 2014 | 2013 | |||||||||||||
| (In millions) | ||||||||||||||||
Remeasurements (gains)/losses | US$ | 2.6 | Rs. | 160.1 | Rs. | (539.1 | ) | Rs. | (467.7 | ) | ||||||
|
|
|
|
|
|
|
| |||||||||
| US$ | 2.6 | Rs. | 160.1 | Rs. | (539.1 | ) | Rs. | (467.7 | ) | |||||||
|
|
|
|
|
|
|
| |||||||||
Net severance indemnity cost consistsconsist of the following components:
| As of March 31, | As at March 31, | |||||||||||||||||||||||||||||||
| 2013 | 2013 | 2012 | 2011 | 2015 | 2015 | 2014 | 2013 | |||||||||||||||||||||||||
| (In millions) | (In millions) | |||||||||||||||||||||||||||||||
Service cost | US$ | 6.9 | Rs. | 372.4 | Rs. | 211.8 | Rs. | 203.2 | US$ | 6.7 | Rs. | 421.6 | Rs. | 387.5 | Rs. | 372.4 | ||||||||||||||||
Interest cost | 1.7 | 93.0 | 102.6 | 102.8 | ||||||||||||||||||||||||||||
Past service cost | �� | (1.1 | ) | (61.7 | ) | — | — | — | — | — | (61.7 | ) | ||||||||||||||||||||
Net interest cost | 0.3 | 19.8 | 56.0 | 93.0 | ||||||||||||||||||||||||||||
|
|
|
|
|
|
|
| |||||||||||||||||||||||||
Net periodic pension cost | US$ | 7.5 | Rs. | 403.7 | Rs. | 314.4 | Rs. | 306.0 | US$ | 7.0 | Rs. | 441.4 | Rs. | 443.5 | Rs. | 403.7 | ||||||||||||||||
|
|
|
|
|
|
|
| |||||||||||||||||||||||||
Other changes in plan assets and benefit obligation recognized in other comprehensive income for severance indemnity plan:
| Year ended March 31, | Year ended March 31, | |||||||||||||||||||||||||||||||
| 2013 | 2013 | 2012 | 2011 | 2015 | 2015 | 2014 | 2013 | |||||||||||||||||||||||||
| (In millions) | (In millions) | |||||||||||||||||||||||||||||||
Actuarial loss / (gain) | US$ | (11.5 | ) | Rs. | (624.0 | ) | Rs. | (83.9 | ) | Rs. | (233.8 | ) | ||||||||||||||||||||
Remeasurements (gains)/losses | ||||||||||||||||||||||||||||||||
Return on plan assets, (excluding amount included in net Interest expense) | US$ | 0.4 | Rs. | 26.3 | Rs. | — | Rs. | — | ||||||||||||||||||||||||
Actuarial (gains)/losses arising from changes in demographic assumptions | — | — | — | 0.9 | ||||||||||||||||||||||||||||
Actuarial (gains)/losses arising from changes in financial assumptions | 7.6 | 474.6 | (136.8 | ) | 171.4 | |||||||||||||||||||||||||||
Actuarial (gains)/losses arising from changes in experience adjustments on plan liabilities | 3.2 | 198.3 | 65.4 | (796.3 | ) | |||||||||||||||||||||||||||
|
|
|
|
|
|
|
| |||||||||||||||||||||||||
Total recognized in other comprehensive income | US$ | (11.5 | ) | Rs. | (624.0 | ) | Rs. | (83.9 | ) | Rs. | (233.8 | ) | US$ | 11.2 | Rs. | 699.2 | Rs. | (71.4 | ) | Rs. | (624.0 | ) | ||||||||||
|
|
|
|
|
|
|
| |||||||||||||||||||||||||
Total recognized in statement of operations and other comprehensive income | US$ | (4.1 | ) | Rs. | (220.3 | ) | Rs. | 230.5 | Rs. | 72.2 | US$ | 18.2 | Rs. | 1,140.6 | Rs. | 372.1 | Rs. | (220.3 | ) | |||||||||||||
|
|
|
|
|
|
|
| |||||||||||||||||||||||||
The assumptions used in accounting for the Severanceseverance indemnity plan is set out below:
| Year ended March 31, | ||||||||||||||||||
| 2013 | 2012 | 2011 | Year ended March 31, | |||||||||||||||
| (In millions) | 2015 | 2014 | 2013 | |||||||||||||||
Discount rate | 3.07% | 4.03% | 4.53% | 2.30 | % | 3.60 | % | 3.07 | % | |||||||||
Rate of increase in compensation level of covered employees | 5% | 5%-7% | 5%-7% | 5 | % | 5 | % | 5 | % | |||||||||
The table below outlines the effect on the service cost, the interest cost and the defined benefit obligation in the event of a decrease/increase of 1% in the assumed rate of discount rate and salary escalation rate:
Assumption | Change in assumption | Impact on scheme liabilities | Impact on service cost and interest cost | |||
| Discount rate | Increase by 1% | Decrease by Rs.365.0 million | Decrease by Rs.131.3 million | |||
| Decrease by 1% | Increase by Rs.433.0 million | Increase by Rs.151.1 million | ||||
| Salary escalation rate | Increase by 1% | Increase by Rs.416.7 million | Increase by Rs.167.5 million | |||
| Decrease by 1% | Decrease by Rs.359.6 million | Decrease by Rs.142.6 million |
Severance indemnity plans asset allocation by category is as follows:
| As at March 31, | ||||||||
| 2015 | 2014 | |||||||
Deposit with banks | 100 | % | 100 | % | ||||
The weighted average duration of the defined benefit obligation as at March 31, 2015 is 12.6 years (as at March 31, 2014: 11.3 years)
The Company expects to contribute Rs.703.8 million to the funded severance indemnity plans during the year ending March 31, 2016.
Jaguar Land Rover Pension Plan
Jaguar Land Rover Ltd UK, haveLimited has pension arrangements providing employees with defined benefits related to pay and service as set out in the rules of each fund.
The defined benefit schemes are administered by a separate fund that is legally separated from the Company. The trustees of the pension schemes are required by law to act in the interest of the fund and of all relevant stakeholders in the scheme are responsible for the investment policy with regard to the assets of the schemes and all other governance matters. The board of trustees must be composed of representatives of the company and plan participants in accordance with the plan’s regulations.
Through its defined benefit pension plans, the Company is exposed to a number of risks, the most significant of which are detailed below:
Asset volatility
The plan liabilities are calculated using a discount rate set with references to corporate bond yields; if plan assets underperform compared to the corporate bonds discount rate, this will create a deficit. The defined benefit plans hold a significant proportion of equity-type assets, on the basis that these are expected to outperform corporate bonds in the long-term while providing volatility and risk in the short-term.
As the plans mature, the Company intends to reduce the level of investment risk by investing more in assets that better match the liabilities.
However, the Company believes that due to the long-term nature of the plan liabilities and the strength of the supporting group, a level of continuing equity-type investments is an appropriate element of the Company’s long-term strategy to manage the plans efficiently.
Changes in bond yields
A decrease in corporate bond yields will increase plan liabilities, although this is expected to be partially offset by an increase in the value of the plans’ bond holdings and interest rate hedging instruments.
Inflation risk
Some of the Company’s pension obligations are linked to inflation, and higher inflation will lead to higher liabilities (although, in most cases, caps on the level of inflationary increases are in place to protect the plan against extreme inflation). The plans hold a significant proportion of assets in index-linked gilts, together with other inflation hedging instruments and also assets which are more loosely correlated with inflation. However an increase in inflation will also increase the deficit to some degree.
Life expectancy
The majority of the plan’s obligations are to provide benefits for the life of the member, so increases in life expectancy will result in an increase in the plan’s liabilities. This is particularly significant in the UK defined benefit plans, where inflationary increases result in higher sensitivity to changes in life expectancy.
The following table sets out the disclosure pertaining to employee benefits of Jaguar Land Rover Limited, UK.Limited:
| As of March 31, | ||||||||||||
| Pension benefits | ||||||||||||
| 2013 | 2013 | 2012 | ||||||||||
| (In millions) | ||||||||||||
Change in defined benefit obligation: | ||||||||||||
Defined benefit obligation, beginning of the year | US$ | 7,380.6 | Rs. 400,656.7 | Rs. 307,233.6 | ||||||||
Service cost | 185.9 | 10,092.7 | 7,805.3 | |||||||||
Interest cost | 401.1 | 21,773.4 | 18,298.7 | |||||||||
Actuarial (gain) /loss | 1,347.4 | 73,143.9 | 27,974.4 | |||||||||
Benefits paid | (205.0 | ) | (11,126.2 | ) | (8,667.2 | ) | ||||||
Member contributions | 11.0 | 599.3 | 515.3 | |||||||||
Expenses paid | (0.1 | ) | (7.7 | ) | (12.2 | ) | ||||||
Past service cost | 9.0 | 491.0 | 1,129.9 | |||||||||
Foreign currency translation | (24.8 | ) | (1,353.7 | ) | 46,378.9 | |||||||
|
|
|
|
|
| |||||||
Defined benefit obligation, end of the year | US$ | 9,105.1 | Rs. 494,269.4 | Rs. 400,656.7 | ||||||||
|
|
|
|
|
| |||||||
Change in plan assets: | ||||||||||||
Fair value of plan assets, beginning of the year | US$ | 7,068.8 | Rs. 383,729.0 | Rs. 298,160.2 | ||||||||
Expected return on plan assets | 353.3 | 19,177.6 | 18,339.9 | |||||||||
Actuarial gain /(loss) | 615.6 | 33,418.9 | 13,073.0 | |||||||||
Employer’s contributions | 265.7 | 14,423.6 | 17,605.5 | |||||||||
Members contributions | 11.0 | 599.3 | 515.3 | |||||||||
Benefits paid | (205.0 | ) | (11,126.2 | ) | (8,667.2 | ) | ||||||
Expenses paid | (0.1 | ) | (7.7 | ) | (12.2 | ) | ||||||
Foreign currency translation | 4.6 | 248.2 | 44,714.5 | |||||||||
|
|
|
|
|
| |||||||
Fair value of plan assets, end of the year | US$ | 8,113.9 | Rs. 440,462.7 | Rs. 383,729.0 | ||||||||
|
|
|
|
|
| |||||||
Amount recognized in the balance sheet consist of: Present value of defined benefit obligation Fair value of plan Assets Surplus/ (deficit) Restriction of pension asset (as per IFRIC 14) Onerous obligation Net liability Amount recognized in the balance sheet consist of: Non- current assets Non -current liabilities Net liability Change in defined benefit obligation: Defined benefit obligation, beginning of the year Service cost Interest cost Remeasurements (gains)/losses Actuarial (gains)/losses arising from changes in demographic assumptions Actuarial (gains)/losses arising from changes in financial assumptions Actuarial (gains)/losses arising from changes in experience adjustments on plan liabilities Past service cost Plan curtailment Plan settlement Plan combinations Benefits paid Member contributions Foreign currency translation Defined benefit obligation, end of the year Change in plan assets: Fair value of plan assets, beginning of the year Interest income Remeasurements gains/(losses) Return on plan assets, (excluding amount included in net interest expense) Plan settlement Employer’s contributions Members contributions Benefits paid Expenses paid Foreign currency translation Fair value of plan assets, end of the year Year ended March 31, Pension benefits 2013 2013 2012 (In millions) US$ 9,105.1 Rs. 494,269.4 Rs. 400,656.7 8,113.9 440,462.7 383,729.0 (991.2 ) (53,806.7 ) (16,927.7 ) (1.1 ) (61.1 ) (2,289.7 ) — — (7,174.2 ) US$ (992.3 ) Rs. (53,867.8 ) Rs. (26,391.6 ) US$ 0.7 Rs. 36.1 Rs. 154.9 (993.0 ) (53,903.9 ) (26,546.5 ) US$ (992.3 ) Rs. (53,867.8 ) Rs. (26,391.6 ) As at March 31, Pension benefits 2015 2015 2014 (In millions) US$ 9,639.8 Rs. 602,488.9 Rs. 494,269.4 264.9 16,555.5 16,926.4 432.3 27,015.7 25,216.6 (31.6 ) (1,971.9 ) (3,750.7 ) 2,294.3 143,396.1 (23,370.0 ) 159.3 9,958.3 827.1 0.8 51.3 557.8 (0.2 ) (9.6 ) (9.6 ) (2.1 ) (131.1 ) — (0.3 ) (15.8 ) — (234.7 ) (14,670.3 ) (13,146.8 ) 2.9 183.4 125.0 (866.3 ) (54,159.0 ) 104,843.7 US$ 11,659.1 Rs. 728,691.5 Rs. 602,488.9 US$ 8,572.4 Rs. 535,777.5 Rs. 440,462.7 387.5 24,215.5 22,793.0 1,858.4 116,147.7 (39,132.8 ) (1.8 ) (110.4 ) — 545.4 34,090.1 32,025.6 2.9 183.4 134.6 (234.7 ) (14,670.3 ) (13,146.8 ) (12.9 ) (806.5 ) (769.4 ) (766.9 ) (47,931.5 ) 93,410.6 US$ 10,350.3 Rs. 646,895.5 Rs. 535,777.5
| Year ended March 31, | ||||||||||||||||||||||||
| Pension benefits | ||||||||||||||||||||||||
| 2013 | 2013 | 2012 | 2011 | 2010 | 2009 | |||||||||||||||||||
| (In millions) | ||||||||||||||||||||||||
Experience adjustments | ||||||||||||||||||||||||
Present value of defined benefit obligation | US$ | 9,105.1 | Rs. | 494,269.4 | Rs. | 400,656.7 | Rs. | 307,233.6 | Rs. | 263,402.4 | Rs. | 221,195.4 | ||||||||||||
Fair value of plan assets | 8,113.9 | 440,462.7 | 383,729.0 | 298,160.2 | 259,088.6 | 225,918.1 | ||||||||||||||||||
|
|
|
|
|
|
|
|
|
|
|
| |||||||||||||
Surplus/ (deficit) | (991.2 | ) | (53,806.7 | ) | (16,927.7 | ) | (9,073.4 | ) | (4,313.8 | ) | 4,722.7 | |||||||||||||
Experience adjustments on plan | 10.5 | 567.5 | 6,106.2 | 6,968.0 | 44,042.5 | 2,412.6 | ||||||||||||||||||
Experience adjustments on plan | US$ | 615.8 | Rs. | 33,430.1 | Rs. | 13,924.4 | Rs. | 2,179.7 | Rs. | 38,266.3 | Rs. | 48,909.7 | ||||||||||||
| As at March 31, | ||||||||||||
| Pension benefits | ||||||||||||
| 2015 | 2015 | 2014 | ||||||||||
| (In millions) | ||||||||||||
Amount recognized in the balance sheet consists of: | ||||||||||||
Present value of defined benefit obligation | US$ | 11,659.1 | Rs. | 728,691.5 | Rs. | 602,488.9 | ||||||
Fair value of plan assets | 10,350.3 | 646,895.5 | 535,777.5 | |||||||||
|
|
|
|
|
| |||||||
Surplus/(deficit) | (1,308.8 | ) | (81,796.0 | ) | (66,711.4 | ) | ||||||
Restriction of pension asset (as per IFRIC 14) | (0.6 | ) | (35.1 | ) | (298.6 | ) | ||||||
|
|
|
|
|
| |||||||
Net liability | US$ | (1,309.4 | ) | Rs. | (81,831.1 | ) | Rs. | (67,010.0 | ) | |||
|
|
|
|
|
| |||||||
Amount recognized in the balance sheet consists of: | ||||||||||||
Non-current assets | US$ | 0.5 | Rs. | 36.1 | Rs. | 45.0 | ||||||
Non-current liabilities | (1,309.9 | ) | (81,867.2 | ) | (67,055.0 | ) | ||||||
|
|
|
|
|
| |||||||
Net liability | US$ | (1,309.4 | ) | Rs. | (81,831.1 | ) | Rs. | (67,010.0 | ) | |||
|
|
|
|
|
| |||||||
AmountTotal amount recognized in other comprehensive incomeincome:
| As of March 31, | ||||||||||||||||
| Pension benefits | ||||||||||||||||
| 2013 | 2013 | 2012 | 2011 | |||||||||||||
| (In millions) | ||||||||||||||||
Actuarial loss/ (gain) | US$ | 1,858.8 | Rs. | 100,902.2 | Rs. | 61,177.2 | Rs. | 46,275.8 | ||||||||
Restriction of pension asset (as per IFRIC 14) | (255.5 | ) | (13,871.5 | ) | (11,520.7 | ) | (11,093.2 | ) | ||||||||
Onerous obligation | (106.4 | ) | (5,773.1 | ) | 1,793.4 | 4,831.9 | ||||||||||
|
|
|
|
|
|
|
| |||||||||
| US$ | 1,496.9 | Rs. | 81,257.6 | Rs. | 51,449.9 | Rs. | 40,014.5 | |||||||||
|
|
|
|
|
|
|
| |||||||||
| As at March 31, | ||||||||||||||||
| Pension benefits | ||||||||||||||||
| 2015 | 2015 | 2014 | 2013 | |||||||||||||
| (In millions) | ||||||||||||||||
Remeasurements (gains)/losses | US$ 2,314.1 | Rs. | 144,633.3 | Rs. | 109,398.5 | Rs. | 96,559.3 | |||||||||
Restriction of Pension asset (as per IFRIC 14) | (222.8 | ) | (13,928.1 | ) | (13,659.9 | ) | (13,871.5 | ) | ||||||||
Onerous obligations, excluding amounts included in interest expenses | (137.2 | ) | (8,573.7 | ) | (8,573.7 | ) | (8,573.7 | ) | ||||||||
|
|
|
|
|
|
|
| |||||||||
| US$ 1,954.1 | Rs. | 122,131.5 | Rs. | 87,164.9 | Rs. | 74,114.1 | ||||||||||
|
|
|
|
|
|
|
| |||||||||
Net pension and post retirement cost consistsconsist of the following components:
| Year ended March 31, | ||||||||||||||||
| Pension benefits | ||||||||||||||||
| 2013 | 2013 | 2012 | 2011 | |||||||||||||
| (In millions) | ||||||||||||||||
Service cost | US$ | 185.9 | Rs. | 10,092.7 | Rs. | 7,805.3 | Rs. | 7,526.3 | ||||||||
Interest cost | 401.1 | 21,773.4 | 18,298.7 | 15,294.0 | ||||||||||||
Expected return on plan assets | (353.3 | ) | (19,177.6 | ) | (18,339.9 | ) | (17,112.0 | ) | ||||||||
Past service cost | 9.0 | 491.0 | 1,129.9 | 354.1 | ||||||||||||
|
|
|
|
|
|
|
| |||||||||
Net periodic pension cost | US$ | 242.7 | Rs. | 13,179.5 | Rs. | 8,894.0 | Rs. | 6,062.4 | ||||||||
|
|
|
|
|
|
|
| |||||||||
Current service cost Past service cost Administrative expenses Interest cost on onerous obligations Net interest cost/(income) Net periodic pension cost Year ended March 31, Pension benefits 2015 2015 2014 2013 (In millions) US$ 264.9 Rs. 16,555.5 Rs. 16,926.4 Rs. 10,584.5 0.8 51.3 557.8 490.1 12.9 806.5 769.4 851.2 — — — 507.3 44.8 2,800.2 2,423.6 816.8 US$ 323.4 Rs. 20,213.5 Rs. 20,677.2 Rs. 13,249.9
Other changes in plan assets and benefit obligationsAmount recognized in other comprehensive income:
| Year ended March 31, | ||||||||||||||||
| Pension benefits | ||||||||||||||||
| 2013 | 2013 | 2012 | 2011 | |||||||||||||
| (In millions) | ||||||||||||||||
Actuarial loss | US$ | 731.8 | Rs. 39,725.0 | Rs. 14,901.4 | Rs. 13,919.4 | |||||||||||
Restriction on pension asset (as per IFRIC 14) | (43.3 | ) | (2,350.8 | ) | (427.5 | ) | 2,182.0 | |||||||||
Onerous obligation | (139.4 | ) | (7,566.5 | ) | (3,038.5 | ) | 6,692.7 | |||||||||
|
|
|
|
|
|
|
| |||||||||
Total recognized in other comprehensive income | US$ | 549.1 | Rs. 29,807.7 | Rs. 11,435.4 | Rs. 22,794.1 | |||||||||||
|
|
|
|
|
|
|
| |||||||||
Total recognized in statement of operations and other comprehensive income | US$ | 791.9 | | Rs. 42,987.2 | | | Rs. 20,329.4 | | | Rs. 28,856.5 | | |||||
|
|
|
|
|
|
|
| |||||||||
| Year ended March 31, | ||||||||||||||||
| Pension benefits | ||||||||||||||||
| 2015 | 2015 | 2014 | 2013 | |||||||||||||
| (In millions) | ||||||||||||||||
Remeasurements (gains) / losses | ||||||||||||||||
Actuarial (gains)/losses arising from changes in demographic assumptions | US$ | (31.6 | ) | Rs. | (1,971.9 | ) | Rs. | (3,750.7 | ) | Rs. | (9,888.0 | ) | ||||
Actuarial (gains)/losses arising from changes in financial assumptions | 2,294.3 | 143,396.1 | (23,370.0 | ) | 81,769.6 | |||||||||||
Actuarial (gains)/losses arising from changes in experience adjustments on plan liabilities | 159.3 | 9,958.3 | 827.1 | 1,263.9 | ||||||||||||
Return on plan assets, (excluding amount included in net interest expense) | (1,858.4 | ) | (116,147.7 | ) | 39,132.8 | (33,000.2 | ) | |||||||||
Change in restriction of pension asset (as per IFRIC 14) | (4.3 | ) | (268.2 | ) | 211.6 | (2,350.8 | ) | |||||||||
Change in onerous obligation, excluding amounts included in interest expenses | — | — | — | (8,073.8 | ) | |||||||||||
|
|
|
|
|
|
|
| |||||||||
Total recognized in other comprehensive income | US$ | 559.3 | Rs. | 34,966.6 | Rs. | 13,050.8 | Rs. | 29,720.7 | ||||||||
|
|
|
|
|
|
|
| |||||||||
Total recognized in statement of operations and other comprehensive income | US$ | 882.7 | Rs. | 55,180.1 | Rs. | 33,728.0 | Rs. | 42,970.6 | ||||||||
|
|
|
|
|
|
|
| |||||||||
The expected return on assets assumptions are derived by considering the expected long-term rates of return on plan investments. The overall rate of return is a weighted average of the expected returns of the individual investments made in the group plans. The long-term rates of return on equities are derived from considering current risk free rates of return with the addition of an appropriate future risk premium from an analysis of historic returns in various countries. The long-term rates of return on bonds are set in line with market yields currently available at the statement of financial position date.
The assumptions used in accounting for the pension plans are set out below:
| Year ended March 31, | Year ended March 31, | |||||||||||||||||||||||
| Pension benefits | Pension benefits | |||||||||||||||||||||||
| 2013 | 2012 | 2011 | 2015 | 2014 | 2013 | |||||||||||||||||||
Discount rate | 3.69%-4.40% | 4.38%-5.10% | 5.19%-5.50% | 3.40 | % | 4.60 | % | 4.40 | % | |||||||||||||||
Rate of increase in compensation level of covered employees | 2.07%-3.90% | 2.07%-3.80% | 2.07%-3.90% | |||||||||||||||||||||
Expected rate of increase in compensation level of covered employees | 3.60 | % | 3.90 | % | 3.90 | % | ||||||||||||||||||
Inflation increase | 2.00%-3.40% | 2.00%-3.30% | 2.00%-3.40% | 3.10 | % | 3.40 | % | 3.40 | % | |||||||||||||||
Expected rate of return on plan assets | 4.74%-6.34% | 4.85%-6.34% | 5.75%-6.57% | |||||||||||||||||||||
The assumed life expectations on retirement at age 65 are (years) | ||||||||||||||||||||||||
Retiring today: | ||||||||||||||||||||||||
Males | 21.4 | 20.0 | 22.2 | |||||||||||||||||||||
Females | 23.9 | 24.5 | 24.6 | |||||||||||||||||||||
Retiring in 20 years: | ||||||||||||||||||||||||
Males | 23.1 | 23.8 | 23.9 | |||||||||||||||||||||
Females | 25.8 | 26.4 | 26.6 | |||||||||||||||||||||
In fiscalFor the valuation as at March 31, 2015, 2014 and 2013, the mortality assumptions used are the SAPS base table, in particular S1NxA tables and the Light table for members of the Jaguar Executive Pension Plan. A scaling factor of 115% has been used for the Jaguar Pension Plan, 110% for the Land Rover revised its mortality assumption which resultedPension Scheme and 105% for males and 90% for females for Jaguar Executive Pension Plan. There is an allowance for future improvements in a decrease in pension liability by Rs. 12,467.5 million. The revision in mortality assumptions has been made consequent toline with the mortality analysis performed as partCMI (2014) projections (2014: CMI (2013) projections, 2013: CMI (2012) projections) and an allowance for long term improvements of the latest funding valuation of the benefit schemes. The revised mortality assumptions reflect the latest available tables/experience available for United Kingdom Pension Schemes.1.25% per annum.
Pension plans asset allocation by category is as follows:
| As of March 31, | ||||||||
| 2013 | 2012 | |||||||
Asset category: | ||||||||
Debt | 64% | 64% | ||||||
Equities | 19% | 22% | ||||||
Others | 17% | 14% | ||||||
| As at March 31, | ||||||||||||||||||||||||
| 2015 | 2014 | |||||||||||||||||||||||
| Quoted * | Unquoted | Total | Quoted * | Unquoted | Total | |||||||||||||||||||
Equity Instruments | ||||||||||||||||||||||||
Information Technology | 1.6 | % | 0.0 | % | 1.6 | % | 1.4 | % | 0.0 | % | 1.4 | % | ||||||||||||
Energy | 1.0 | % | 0.0 | % | 1.0 | % | 1.1 | % | 0.0 | % | 1.1 | % | ||||||||||||
Manufacturing | 1.4 | % | 0.0 | % | 1.4 | % | 1.2 | % | 0.0 | % | 1.2 | % | ||||||||||||
Financials | 2.6 | % | 0.0 | % | 2.6 | % | 2.4 | % | 0.0 | % | 2.4 | % | ||||||||||||
Others | 6.0 | % | 0.0 | % | 6.0 | % | 5.2 | % | 0.0 | % | 5.2 | % | ||||||||||||
|
|
|
|
|
|
|
|
|
|
|
| |||||||||||||
| 12.6 | % | 0.0 | % | 12.6 | % | 11.3 | % | 0.0 | % | 11.3 | % | |||||||||||||
|
|
|
|
|
|
|
|
|
|
|
| |||||||||||||
Debt Instruments | ||||||||||||||||||||||||
Government | 38.5 | % | 0.2 | % | 38.7 | % | 39.4 | % | 0.0 | % | 39.4 | % | ||||||||||||
Corporate Bonds (Investment Grade) | 0.6 | % | 17.1 | % | 17.7 | % | 21.7 | % | 0.0 | % | 21.7 | % | ||||||||||||
Corporate Bonds (Non Investment Grade) | 0.8 | % | 6.8 | % | 7.6 | % | 0.0 | % | 5.2 | % | 5.2 | % | ||||||||||||
|
|
|
|
|
|
|
|
|
|
|
| |||||||||||||
| 39.9 | % | 24.1 | % | 64.0 | % | 61.1 | % | 5.2 | % | 66.3 | % | |||||||||||||
|
|
|
|
|
|
|
|
|
|
|
| |||||||||||||
Property Funds | ||||||||||||||||||||||||
UK | 1.9 | % | 1.6 | % | 3.5 | % | 0.0 | % | 3.2 | % | 3.2 | % | ||||||||||||
Other | 0.8 | % | 0.2 | % | 1.0 | % | 0.0 | % | 1.2 | % | 1.2 | % | ||||||||||||
|
|
|
|
|
|
|
|
|
|
|
| |||||||||||||
| 2.7 | % | 1.8 | % | 4.5 | % | 0.0 | % | 4.4 | % | 4.4 | % | |||||||||||||
|
|
|
|
|
|
|
|
|
|
|
| |||||||||||||
Cash and Cash equivalents | 1.9 | % | 0.0 | % | 1.9 | % | 6.7 | % | 0.0 | % | 6.7 | % | ||||||||||||
|
|
|
|
|
|
|
|
|
|
|
| |||||||||||||
Other | ||||||||||||||||||||||||
Hedge Funds | 0.0 | % | 5.6 | % | 5.6 | % | 0.0 | % | 5.7 | % | 5.7 | % | ||||||||||||
Private Markets | 0.0 | % | 0.8 | % | 0.8 | % | 0.0 | % | 1.4 | % | 1.4 | % | ||||||||||||
Alternatives | 2.4 | % | 2.1 | % | 4.5 | % | 0.0 | % | 4.1 | % | 4.1 | % | ||||||||||||
|
|
|
|
|
|
|
|
|
|
|
| |||||||||||||
| 2.4 | % | 8.5 | % | 10.9 | % | 0.0 | % | 11.2 | % | 11.2 | % | |||||||||||||
|
|
|
|
|
|
|
|
|
|
|
| |||||||||||||
Derivatives | ||||||||||||||||||||||||
Foreign exchange contracts | 0.0 | % | -0.2 | % | -0.2 | % | 0.0 | % | 0.1 | % | 0.1 | % | ||||||||||||
Interest Rate and inflation | 0.0 | % | 6.3 | % | 6.3 | % | 0.0 | % | 0.0 | % | 0.0 | % | ||||||||||||
|
|
|
|
|
|
|
|
|
|
|
| |||||||||||||
| 0.0 | % | 6.1 | % | 6.1 | % | 0.0 | % | 0.1 | % | 0.1 | % | |||||||||||||
|
|
|
|
|
|
|
|
|
|
|
| |||||||||||||
Total | 59.5 | % | 40.5 | % | 100.0 | % | 79.1 | % | 20.9 | % | 100.0 | % | ||||||||||||
|
|
|
|
|
|
|
|
|
|
|
| |||||||||||||
Significant actuarial assumptions used
| * | Determined on the basis of quoted prices for identical assets or liabilities in active markets. |
The table below outlines the determinationeffect on the service cost and the defined benefit obligation in the event of a decrease/increase of 0.25% in the assumed discount rate and inflation rate and increase/decrease in mortality rate by 1 year. When calculating the sensitivity of the defined benefit obligation and service cost are discount rate and inflation rate. The sensitivity analysis below has been determined based on reasonable possible changesto significant actuarial assumptions the same method (present value of the assumptions occurringdefined benefit obligation calculated with the projected unit credit method at the end of the reporting period assuming that all other assumptions are held constant.period) has been applied as when calculating the pension liability recognized within the balance sheet.
Assumption | Change in assumption | Impact on scheme liabilities | Impact on service cost | |||||||
Discount rate | | | | | ||||||
Inflation rate | | | | | ||||||
Mortality rate | Increase/decrease by 1 year | Increase/decrease by Rs.19,599.2 million | Increase/decrease by Rs.591.6 million | |||||||
The Company has agreed that it will aim to eliminate the pension plan funding deficit over the next 7 years. Funding levels are monitored on an annual basis and the current agreed contribution rate is 22.3% of pensionable salaries in the UK. The next triennial valuation is due to be carried out as at June 5, 2016 and will reflect the positions as at April 5, 2015. The Company considers that the contribution rates set at the last valuation date are sufficient to eliminate the deficit over the agreed period and that regular contributions, which are based on service costs, will not increase significantly.
The average duration of the defined benefit obligation as at March 31, 2015 is 23.5 years (as at March 31, 2014: 22.5 Years)
The expected net periodic pension cost for the year ended March 31, 2016 is Rs.24,036.7 million. In March 2015, Jaguar Land Rover paid a substantial part of contributions originally scheduled for the Fiscal 2016 to its UK defined benefit plans given its positive cash flow position. The Company expects to contribute Rs. 17,511.6Rs.832.0 million to the funded pension plans of Jaguar Land Rover Limited, UK in fiscal 2014.during the year ending March 31, 2016.
Defined contribution plan
The Company’s contribution to defined contribution plans aggregated Rs. 3,338.1Rs.5,346.2 million, Rs. 3,099.974,928.0 million and Rs. 2,136.33,338.1 million for years ended March 31, 2015, 2014 and 2013 2012respectively.
| 33. | Acquisitions |
In May 2013, the Company, through a subsidiary, acquired 100% equity stake in Cambric Holdings Inc, for a cash consideration of Rs.1,630.6 million. The fair value of net assets acquired was Rs. 476.8 million resulting in a goodwill of Rs.1,153.8 million. The goodwill is mainly attributable to the skilled work force with engineering and 2011 respectively.technological experience. For the year ended March 31, 2014, the effect of the acquisition on the consolidated revenues, net income and other comprehensive income, is insignificant.
The goodwill arising on this acquisition is not expected to be deductible for tax purposes.
| Commitments and contingencies |
In the normalordinary course of business, the Company faces claims and assertions by various parties. The Company assesses such claims and assertions and monitors the legal environment on an ongoing basis, with the assistance of external legal counsel, wherever necessary. The Company records a liability for any claims where a potential loss is probable and capable of being estimated and discloses such matters in its financial statements, if material. For potential losses that are considered possible, but not probable, the Company provides disclosure in the financial statements but does not record a liability in its accounts unless the loss becomes probable.
The following is a description of claims and assertions where a potential loss is possible, but not probable. ManagementThe Company believes that none of the contingencies described below would have a material adverse effect on the Company’s financial condition, results of operations or cash flows.
Litigation
The Company is involved in legal proceedings, both as plaintiff and as defendant. There are claims which managementthe Company does not believe to be of material nature, other than those described below.
Income Tax
The Company has ongoing disputes with income tax authorities relating to tax treatment of certain items. These mainly include disallowed expenses, the tax treatment of certain expenses claimed by the Company as deductions and the computation of, or eligibility of, the Company’s use of certain tax incentives or allowances.
Most of these disputes/disputes and/or disallowances, being repetitive in nature, have been raised by the income tax authorities consistently in most of the years.
The Company has a right of appeal to the Commissioner of Income Tax (Appeals), or CIT (A), the Dispute Resolution Panel, or DRP, and to the Income Tax Appellate Tribunal, or ITAT, against adverse decisions by the assessing officer, DRP or CIT (A), as applicable. The income tax authorities have similar rights of appeal to the ITAT against adverse decisions by the CIT (A) or DRP. The Company has a further right of appeal to the High Court of Bombay or Supreme Court against adverse decisions by the appellate authorities for matters involving substantial question of law. The income tax authorities have similar rights of appeal. Also, the Company has a right of appeal to the Commissioner of Income Tax (Appeals) [CIT(A)] or Income Tax Appellate Tribunal [ITAT] against adverse decisions by the income tax authorities or CIT(A). The income tax authorities have similar rights of appeal to the ITAT against adverse decisions by the CIT(A).
As ofat March 31, 2013,2015, there are matters aggregating Rs.119and/or disputes pending in appeal amounting to Rs.1,343 million, which includes Rs.99Rs.157 million in respect of equity accounted investees (Rs.135(Rs.1,214 million, which includes Rs.135Rs.137 million in respect of equity accounted investees as ofat March 31, 2012), which are being contested by the Company in appeal and in respect of which the Company expects to succeed based on favorable decisions in earlier assessment years. There are matters of Rs.36 million, which includes Rs. Nil in respect of equity accounted investees (Rs.42 million, which includes Rs.18 million in respect of equity accounted investees, as of March 31, 2012) in respect of which the Company has won in appeals which have been further contested by the income tax authorities before the higher appellate authorities. There are other matters/disputes pending in appeal aggregating Rs.1,060 million, which includes Rs.10 million in respect of equity accounted investees (Rs.1,655 million, which includes Rs.10 million in respect of equity accounted investees as of March 31, 2012)2014).
Customs, Excise Duty and Service Tax
As ofat March 31, 2013,2015, there werewas pending litigations onlitigation for various countsmatters relating to Customs, Excise Dutycustoms, excise duty and Service Taxservice taxes involving demanddemands, including interest and penalties, of Rs.10,116Rs.14,042 million, which includes Rs.68Rs.61 million in respect of equity accounted investees (Rs.4,430(Rs.9,942 million, which includes Rs.111Rs.48 million in respect of equity accounted investees, as ofat March 31, 2012)2014). These demands challenged the basis of valuation of the Company’s products and denialdenied the Company’s claims of the ‘CentralCentral Value Added Tax’ (“CENVAT”)Tax, or CENVAT, credit on inputs. The details of the demands for more than Rs.200 million are as follows:
TheAs at March 31, 2015, the Excise Authorities had denied a CENVAT credit of Rs.759Rs.524 million (Rs.230and imposed a penalty of Rs.230 million for the period between April 2011 to September 2012 (Rs.524 million and a Rs.230 million CENVAT credit and penalty, respectively, as ofat March 31, 2012)2014) in respect of consulting engineering services alleged to have been availedused exclusively for producing prototypes at the Engineering Research Centre, in Pune. The contention of the departmentExcise Authorities is that since the Company claims exemptionexemptions from CENVAT under Notification No.167/71-CE, dt 11.09.1971,dated September 11, 1971, the Company is not entitled to avail service tax creditcredits on consulting engineering services used in the Engineering Research Centre. The matter is being contested by the Company before the Appellate Authorities.appellate authorities. The Company based on merits, is of the opinion thatbelieves it has sustainablea merit in its case, since the consulting engineering services are not exclusively used in the manufacture of prototypes and they form part of the assessable value of final products manufactured by the Company on which CENVAT is paid. The Company has won in appeals for Rs.362 million as on March 31, 2013 (Rs.362 million as on March 31, 2012), which have been further contested by the department before the Appellate Tribunal.
The Excise Authorities have raised a demand for Rs.1,014amounting to Rs.907 million as onat March 31, 2013 (Rs.1,0142015 (Rs.907 million as onat March 31, 2012). The demand is2014), on account of alleged undervaluation to the extentundervaluation’s of ex-factory discountdiscounts given by Company on passenger vehicles through invoice.invoices. The matter is being contested by the Company before the appellate authority.High Court of Bombay.
As at March 31, 2015, the Excise Authorities have raised a demand and penalty of Rs.1,876 million, (Rs.Nil as at March 31, 2014), due to the classification of certain chassis (as dumpers instead of goods transport vehicles) which were sent to automotive body builders by the Company, which the Excise Authorities claim requires the payment of the National Calamity Contingent Duty, or NCCD. The Company has obtained a technical expert certificate on the classification. The appeal is pending before the Custom Excise & Service Tax Appellate Tribunal.
The Excise Authorities had denied the Company’s claim of a CENVAT credit of Rs.813Rs.228 million (Rs.1,005(Rs.837 million as ofat March 31, 2012) in earlier years,2014) claimed by the Company from Fiscal 1992 to Fiscal 2013, on technical grounds. The matter is being contested by the Company before the appellate authorities.
TheAs at March 31, 2015, the Excise Authorities had levied penaltypenalties and interest of Rs.4,560amounting to Rs.6,799 million (Rs. Nil(Rs.4,557 million as ofat March 31, 2012) in the matter of2014) with respect to CENVAT credit in earlier years,claimed by the Company from March 2010 to November 2012, on inputs, stating that vehicles manufactured at Uttarakhand plant are “Exempted Products” and the Company ismay not eligible forclaim a CENVAT Credit.credit on these vehicles. The Company has challenged this demand as vehicle suffers National Calamity Contingent Duty (NCCD)NCCD and Auto Cess,the automobile cess is assessed on those vehicles, which are `duties“duties of excise’excise”. Therefore, the Company asserts that these vehicles cannot be called as exempted products.are not “Exempted Products”. The matter is being contested by the Company before the appellate authorities.
TheAs at March 31, 2015, the Excise Authorities have raised a demand ofamounting to Rs.295 million (Rs.275(Rs.295 million as ofat March 31, 2012)2014) on pre deliverypre-delivery inspection charges and free after salesafter-sales service charges incurred by dealers on certain of the Company’s products on the alleged groundgrounds that the pre deliverypre-delivery inspection charges and free after salesafter-sales services are provided by the dealer on behalf of the Company and should be included in excisable value of the vehicle. The case is pending before Tribunal, which has granted an unconditional stay.
TheAs at March 31, 2015, the Excise Authorities have raised a demand ofamounting to Rs.219 million (Rs.Nil(Rs.219 million as ofat March 31, 2012) of Customs Duty2014) with respect to customs duties on dies and fixtures imported under the EPCG Scheme and, in the case of the fixtures, are installed at premises of a vendor. The Company has filed reply tomatter is pending with the Show Cause Notice.adjudicating authority.
Sales Tax
The total sales tax demands (including interest and penalty)penalties), whichthat are being contested by the Company amount to Rs.4,574Rs.9,331 million, which includes Rs.468Rs.227 million in respect of equity accounted investees as ofat March 31, 2013 (Rs.5,5062015 (Rs.9,605 million, which includes Rs.755Rs.190 million in respect of equity accounted investees, as ofat March 31, 2012)2014). The details of the demands for more than Rs.200 million are as follows:
TheAs at March 31, 2015, the Sales Tax Authorities have raised a demand of Rs.166amounting to Rs.1,755 million (Rs.332(Rs.1,652 million as ofat March 31, 2012) towards2014) relating to the rejection by the Sales Tax Authorities of the Company’s use of certain statutory forms for lower/nil tax rate (Form F and Form C) for a concessional lower or zero tax rate on technical grounds such as late submission,submissions, the use of a single form issued against two months dispatches, etc.for different periods, and the denial of exemptionthe Company’s claims for exemptions from sales tax in absence of proof of export for certain years.years (Fiscal 2002 to Fiscal 2012). The Company has contended that the benefitconcessional or lower taxes rates cannot be denied on technicalities, which are being complied.complied with. The matter is pending at various levels.
In some of the states in India, the Sales Tax Authorities have raised disputes totaling upamounting to Rs.431Rs.411 million as ofat March 31, 2013 (Rs.4062015 (Rs.431 million as ofat March 31, 2012)2014), treating the stock transfers of vehicles from the Company’s manufacturing plants to regional sales offices and the transfers between two regional sales offices as sales liable for levylevies of sales tax. The Company has strong case and is contesting this issue.
Under the notification (valid upto May 10, 2002) issued by theThe Sales Tax Authority, in one of the state in India, the rate of salesauthorities have denied input tax was reducedcredits and have levied interest and penalties thereon due to 4%varied reasons amounting to Rs.2,390 million as at March 31, 2015 (Rs.3,348 million as at March 31, 2014). Consequently, the interstate sales tax also became 4% and since it was not concessional rate, submission of prescribed declaration forms was not mandatory in the opinion of the Company. However,The reasons for the Sales Tax Authorities raiseddenial of the demand aggregating Rs.309 millionCompany’s use of the input tax credits were mainly due to taxes not paid by vendors, an incorrect method of calculation of set off as per the Sales Tax department, and allege suppression of March 31, 2013 (Rs.696 millionsales as of March 31, 2012), onper the ground that prescribed declaration forms were not collected.Sales Tax department. The Company expects to get reliefmatter is contested in appeal on submission of prescribed declaration forms.appeal.
Sales tax demand aggregating Rs.1,611 million as of March 31, 2013 (Rs.1,611 million as of March 31, 2012) has been raised byThe Sales Tax Authorities have made a sales tax demand amounting to Rs.2,584 million as at March 31, 2015 (Rs.2,615 million as at March 31, 2014) disallowing thea concessional rate of 2% on certain of the Company’s purchases of raw materials in caseinstances where the final product is stock transferred for sale outside the relevant state. The Sales Tax Authorities are relying on a notification issued by the State Government. Based on submissions, the Commercial Tax Tribunal has remanded the issue for fresh adjudication.
One of the equity accounted investee is contesting for the local sales tax exemption in view of notifications for the period January 1, 1996 to December 31, 2003, which has been denied by the authorities on technical grounds. The equity accounted investee has filed a writ petition against this demand and presently this matter is pending in the High Court of Jharkhand with the stay order on the demand. Share of the Company in the claim amount is Rs.193 million (Rs.234 million as of March 31, 2012).various authorities.
Other Taxes and Dues
Other amounts for which the Company may contingently be liable aggregateamount to Rs.3,055Rs.3,851 million, which includes Rs.77Rs.12 million in respect of equity accounted investees as ofat March 31, 2013 (Rs.2,3832015 (Rs.5,209 million, which includes Rs.69Rs.14 million in respect of equity accounted investees, as ofat March 31, 2012)2014). Following are the casesThe details of matters involving more than Rs.200 million:million are as follows:
The municipal authorities in certain states levy octroi duty, (aa local indirect tax)tax, on goods brought inside the municipal limits at rates based on the classification of goods. Demands aggregatingamounting to Rs.617 million as ofat March 31, 20132015 (Rs.617 million as ofat March 31, 2012)2014) had been raised demanding higher octroi duties on account ofdue to classification disputes relating to components purchased for the manufacture of vehicles and a retrospective increase in octroi rates relating to past periods.periods between April 1997 to May 2002. The dispute relating to classification is presently pending before the Supreme Court and the other dispute relating to the retrospective increase in octroi rates is pending before the Bombay High Court on remand by the Supreme Court.
As ofat March 31, 2013,2015, property taxtaxes amounting to Rs.394 million (Rs.300Rs.491 million, as ofcompared to (Rs.440 million as at March 31, 2012) has2014) have been demanded by the local municipal authorities in respect of the Company’s vacant land of the Company inat the plant in Pimpri, Pune. The Company has filed a Special Leave Petition, (SLP)or SLP, before the Supreme Court against an unfavorable decision of the Bombay High Court. The Supreme Court has disposed offof the SLP and remanded the matter back to the local municipal corporation for fresh adjudication.readjudication.
As at March 31, 2015, a penalty of Rs.562 million (Rs.562 million as at March 31, 2014) is likely to be imposed relating to a matter of regularization of construction of certain buildings in respect of which approvals from appropriate authorities are awaited. However, the Company believes that it will be able to obtain waivers from the approvals, because the buildings were constructed in accordance with the applicable development rules.
Other claims
There are other claims against the Company, the majority of which pertain to motor accident claims, and product liability claims/claims and consumer complaints. Some of the cases also relate to the replacement of parts of vehicles and/or the compensation for deficiencydeficiencies in the services by the Company or its dealers.
Commitments
The Company has entered into various contracts with vendors and contractors for the acquisition of plant and machinery, equipment and various civil contracts of a capital nature aggregating Rs.39,092amounting to Rs.89,291 million, which includes Rs.1,855Rs.92 million in respect of equity accounted investees as ofat March 31, 2013 (Rs.61,2772015 (Rs.126,348 million, which includes Rs.2,369Rs.316 million in respect of equity accounted investees, as ofat March 31, 2012)2014), which are yet to be executed.
The Company has entered into various contracts with vendors and contractors for the acquisition of intangible assets of a capital nature aggregating Rs.1,959amounting to Rs.2,517 million as ofat March 31, 2013 (Rs.6872015, (Rs.3,126 million as ofat March 31, 2012)2014), which are yet to be executed.
For commitments relatedUnder the joint venture agreement with Chery Jaguar Land Rover Automotive Co. Limited, the Company is committed to leases, refer note 12.contribute Rs.35,282 million as at March 31, 2015 (Rs.33,741 million as at March 31, 2014) towards its share in the capital of the joint venture of which Rs.28,982 million (Rs.15,665 million as at March 31, 2014) has been contributed as at March 31, 2015. As at March 31, 2015, the Company has an outstanding commitment of Rs.6,300 million (Rs.18,076 million as at March 31, 2014).
| Capital Management |
The Company’s capital management is intended to create value for shareholders by facilitating the meeting of long termlong-term and short termshort-term goals of the Company.
The Company determines the amount of capital required on the basis of annual operating plans and long-term product and other strategic investment plans. The funding requirements are met through equity, convertible and non-convertible debt securities, senior notes and other long-term/short-term borrowings. The Company’s policy is aimed at combination of short-term and long-term borrowings.
The Company monitors the capital structure on the basis of total debt to equity ratio and maturity profile of the overall debt portfolio of the Company.
Total debt includes all long and short-term debts as disclosed in notes 18 and 2219 to the consolidated financial statements. Equity comprises all components excluding (profit)/loss on cash flow hedges and foreign currency translation reserve.
The following table summarizes the capital of the Company:
| As of March 31, | ||||||||||||
| 2013 | 2013 | 2012 | ||||||||||
| (In millions) | ||||||||||||
Equity* | US$ | 7,126.6 | Rs. | 386,862.5 | Rs. | 330,005.4 | ||||||
Short- term borrowings and current portion of long term debt | 4,261.9 | 231,356.9 | 220,975.1 | |||||||||
Long- term debt | 5,995.3 | 325,457.5 | 287,148.1 | |||||||||
|
|
|
|
|
| |||||||
Total debt | 10,257.2 | 556,814.4 | 508,123.2 | |||||||||
|
|
|
|
|
| |||||||
Total capital ( Debt + Equity) | US$ | 17,383.8 | Rs. | 943,676.9 | Rs. | 838,128.6 | ||||||
|
|
|
|
|
| |||||||
| As at March 31, | ||||||||||||
| 2015 | 2015 | 2014 | ||||||||||
| (In millions) | ||||||||||||
Equity* | US$ | 9,582.9 | Rs. | 598,930.8 | Rs. | 506,561.4 | ||||||
Short-term borrowings and current portion of long-term debt | 2,887.4 | 180,465.4 | 165,960.6 | |||||||||
Long-term debt | 8,717.8 | 544,862.5 | 454,138.6 | |||||||||
|
|
|
|
|
| |||||||
Total debt | 11,605.2 | 725,327.9 | 620,099.2 | |||||||||
|
|
|
|
|
| |||||||
Total capital (Debt + Equity) | US$ | 21,188.1 | Rs. | 1,324,258.7 | Rs. | 1,126,660.6 | ||||||
|
|
|
|
|
| |||||||
| * | Details of equity : |
| As of March 31, | As at March 31, | |||||||||||||||||||||||
| 2013 | 2013 | 2012 | 2015 | 2015 | 2014 | |||||||||||||||||||
| (In millions) | (In millions) | |||||||||||||||||||||||
Total equity as reported in balance sheet | US$ | 6,887.9 | Rs. | 373,905.7 | Rs. | 331,343.6 | US$ | 8,629.6 | Rs. | 539,351.8 | Rs. | 631,696.3 | ||||||||||||
Currency translation reserve attributable to | ||||||||||||||||||||||||
- shareholders of Tata Motors Limited | (70.4 | ) | (3,820.6 | ) | (3,033.0 | ) | ||||||||||||||||||
- Shareholders of Tata Motors Limited | (462.2 | ) | (28,887.9 | ) | (70,610.8 | ) | ||||||||||||||||||
- Non-controlling interests | (0.4 | ) | (23.9 | ) | (0.5 | ) | (2.2 | ) | (136.3 | ) | (325.9 | ) | ||||||||||||
Hedging reserve | 309.5 | 16,801.3 | 1,695.3 | 1,417.7 | 88,603.2 | (54,198.2 | ) | |||||||||||||||||
|
|
|
|
|
| |||||||||||||||||||
Equity as reported above | US$ | 7,126.6 | Rs. | 386,862.5 | Rs. | 330,005.4 | US$ | 9,582.9 | Rs. | 598,930.8 | Rs. | 506,561.4 | ||||||||||||
|
|
|
|
|
| |||||||||||||||||||
| Disclosures on financial instruments |
This section gives an overview of the significance of financial instruments for the Company and provides additional information on balance sheet items that contain financial instruments.
The details of significant accounting policies, including the criteria for recognition, the basis of measurement and the basis on which income and expenses are recognized, in respect of each class of financial asset, financial liability and equity instrument are disclosed in note 2 to the consolidated financial statements.
| Financial assets and liabilities |
The following table presents the carrying amounts and fair value of each category of financial assets and liabilities as ofat March 31, 2013.2015.
Financial assets | Cash and loans and receivables | Available- for-sale financial assets | Derivatives in other than hedging relationship | Derivatives in hedging relationship | Total carrying value | Total fair value | Total carrying value | Total fairvalue | ||||||||||||||||||||||||
| (In millions) | ||||||||||||||||||||||||||||||||
Cash and cash equivalents | Rs. | 116,118.5 | Rs. | — | Rs. | — | Rs. — | Rs. | 116,118.5 | Rs. | 116,118.5 | US$ | 2,139.1 | US$ | 2,139.1 | |||||||||||||||||
Short-term deposits with bank | 68,957.0 | — | — | — | 68,957.0 | 68,957.0 | 1,270.3 | 1,270.3 | ||||||||||||||||||||||||
Finance receivables | 198,219.2 | — | — | — | 198,219.2 | 201,119.5 | 3,651.5 | 3,704.9 | ||||||||||||||||||||||||
Trade receivables | 104,193.6 | — | — | — | 104,193.6 | 104,193.6 | 1,919.4 | 1,919.4 | ||||||||||||||||||||||||
Unquoted equity investments* | — | 3,877.0 | — | — | 3,877.0 | — | 71.4 | — | ||||||||||||||||||||||||
Other investments | 80.0 | 77,516.4 | — | — | 77,596.4 | 77,596.4 | 1,429.4 | 1,429.4 | ||||||||||||||||||||||||
Other financial assets | ||||||||||||||||||||||||||||||||
– current | 18,774.7 | — | 138.0 | 2,430.1 | 21,342.8 | 21,342.8 | 393.2 | 393.2 | ||||||||||||||||||||||||
– non-current | 12,148.9 | — | 1,983.0 | 4,211.7 | 18,343.6 | 18,189.7 | 337.9 | 335.1 | ||||||||||||||||||||||||
|
|
|
|
|
|
|
|
|
|
|
|
|
|
|
| |||||||||||||||||
Total | Rs. | 518,491.9 | Rs. | 81,393.4 | Rs. | 2,121.0 | Rs. | 6,641.8 | Rs. | 608,648.1 | Rs. | 607,517.5 | US$ | 11,212.2 | US$ | 11,191.4 | ||||||||||||||||
|
|
|
|
|
|
|
|
|
|
|
|
|
|
|
| |||||||||||||||||
Financial liabilities | Derivatives other than in hedging relationship | Derivatives in hedging relationship | Other financial liabilities | Total carrying value | Total fairvalue | Total carrying value | Total fair value | |||||||||||||||||||||
| (In millions) | ||||||||||||||||||||||||||||
Accounts payable | Rs. | — | — | Rs. | 409,096.3 | Rs. | 409,096.3 | Rs. | 409,096.3 | US$ | 7,536.4 | US$ | 7,536.4 | |||||||||||||||
Acceptances | — | — | 43,931.3 | 43,931.3 | 43,931.3 | 809.3 | 809.3 | |||||||||||||||||||||
Short-term debt (excluding current portion of long-term debt) | — | — | 116,218.1 | 116,218.1 | 116,218.1 | 2,140.9 | 2,140.9 | |||||||||||||||||||||
Long-term debt (including current portion of long-term debt) | *(92.3 | ) | — | 440,688.6 | 440,596.3 | 463,069.0 | 8,116.3 | 8,530.3 | ||||||||||||||||||||
Other financial liabilities | ||||||||||||||||||||||||||||
– current | 2,345.9 | 14,703.8 | 21,259.0 | 38,308.7 | 38,308.7 | 705.7 | 705.7 | |||||||||||||||||||||
– non-current | 4,486.6 | 12,848.4 | 4,644.1 | 21,979.1 | 21,860.0 | 404.9 | 402.7 | |||||||||||||||||||||
|
|
|
|
|
|
|
|
|
|
|
|
|
| |||||||||||||||
Total | Rs. | 6,740.2 | Rs. | 27,552.2 | Rs. | 1,035,837.4 | Rs. | 1,070,129.8 | Rs. | 1,092,483.4 | US$ | 19,713.5 | US$ | 20,125.3 | ||||||||||||||
|
|
|
|
|
|
|
|
|
|
|
|
|
| |||||||||||||||
The following table presents the carrying amounts and fair value of each category of financial assets and liabilities as of March 31, 2012.
Financial assets | Cash and loans and receivables | Available- for-sale financial assets | Derivatives other than in hedging relationship | Derivatives in hedging relationship | Total carrying value | Total fair value | Cash, and loans and receivables | Available for-sale financial assets | Derivatives in other than hedging relationship | Derivatives in hedging relationship | Total carrying value | Total fair value | Total carrying value | Total fair value | ||||||||||||||||||||||||||||||||||||||||||
| (In millions) | (In millions) | |||||||||||||||||||||||||||||||||||||||||||||||||||||||
Cash and cash equivalents | Rs. | 145,952.4 | Rs. | — | Rs. | — | Rs. | — | Rs. | 145,952.4 | Rs. | 145,952.4 | Rs. | 197,430.9 | Rs. | — | Rs. | — | Rs. | — | Rs. | 197,430.9 | Rs. | 197,430.9 | US$ | 3,158.9 | US$ | 3,158.9 | ||||||||||||||||||||||||||||
Short-term deposits with bank | 11,695.3 | — | — | — | 11,695.3 | 11,695.3 | ||||||||||||||||||||||||||||||||||||||||||||||||||
Short-term deposits | 104,391.0 | — | — | — | 104,391.0 | 104,391.0 | 1,670.3 | 1,670.3 | ||||||||||||||||||||||||||||||||||||||||||||||||
Finance receivables | 171,240.8 | — | — | — | 171,240.8 | 171,687.9 | 158,015.6 | — | — | — | 158,015.6 | 157,409.9 | 2,528.3 | 2,518.6 | ||||||||||||||||||||||||||||||||||||||||||
Trade receivables | 87,654.9 | — | — | — | 87,654.9 | 87,654.9 | 130,994.3 | — | — | — | 130,994.3 | 130,994.3 | 2,095.9 | 2,095.9 | ||||||||||||||||||||||||||||||||||||||||||
Unquoted equity investments* | — | 3,866.4 | — | — | 3,866.4 | — | — | 3,936.8 | — | — | 3,936.8 | — | 63.0 | — | ||||||||||||||||||||||||||||||||||||||||||
Other investments | 337.6 | 78,365.0 | — | — | 78,702.6 | 78,702.6 | 80.0 | 142,806.8 | — | — | 142,886.8 | 142,886.8 | 2,286.2 | 2,286.2 | ||||||||||||||||||||||||||||||||||||||||||
Other financial assets - current | 17,350.6 | — | 69.8 | 3,880.6 | 21,301.0 | 21,301.0 | ||||||||||||||||||||||||||||||||||||||||||||||||||
Other financial assets - non-current | 15,192.9 | — | 13.8 | 1,883.2 | 17,089.9 | 16,957.4 | ||||||||||||||||||||||||||||||||||||||||||||||||||
Other financial assets: | ||||||||||||||||||||||||||||||||||||||||||||||||||||||||
-current | 10,264.5 | — | 548.1 | 16,178.6 | 26,991.2 | 26,991.2 | 431.9 | 431.9 | ||||||||||||||||||||||||||||||||||||||||||||||||
-non-current | 10,537.9 | — | 683.8 | 1,849.0 | 13,070.7 | 12,976.3 | 209.0 | 207.6 | ||||||||||||||||||||||||||||||||||||||||||||||||
|
|
|
|
|
|
|
|
|
|
|
|
|
| |||||||||||||||||||||||||||||||||||||||||||
Total | Rs. | 449,424.5 | Rs. | 82,231.4 | Rs. | 83.6 | Rs. | 5,763.8 | Rs. | 537,503.3 | Rs. | 533,951.5 | Rs. | 611,714.2 | Rs. | 146,743.6 | Rs. | 1,231.9 | Rs. | 18,027.6 | Rs. | 777,717.3 | Rs. | 773,080.4 | US$ | 12,443.5 | US$ | 12,369.4 | ||||||||||||||||||||||||||||
|
|
|
|
|
|
|
|
|
|
|
|
|
| |||||||||||||||||||||||||||||||||||||||||||
| * | The fair value in respect of the unquoted equity investments cannot be reliably measured. |
Financial liabilities | Derivatives other than in hedging relationship | Derivatives in hedging relationship | Other financial liabilities | Total carrying value | Total fair value | Derivatives other than in hedging relationship | Derivatives in hedging relationship | Other financial liabilities | Total carrying value | Total fair value | Total carrying value | Total fair value | ||||||||||||||||||||||||||||||||||||
| (In millions) | ||||||||||||||||||||||||||||||||||||||||||||||||
| (In millions) | (In millions) | |||||||||||||||||||||||||||||||||||||||||||||||
Accounts payable | Rs. | — | Rs. | — | Rs. | 334,558.9 | Rs. | 334,558.9 | Rs. | 334,558.9 | Rs. | — | Rs. | — | Rs. | 569,383.4 | Rs. | 569,383.4 | Rs. | 569,383.4 | US$ | 9,110.1 | US$ | 9,110.1 | ||||||||||||||||||||||||
Acceptances | — | — | 40,787.4 | 40,787.4 | 40,787.4 | — | — | 40,767.5 | 40,767.5 | 40,767.5 | 652.3 | 652.3 | ||||||||||||||||||||||||||||||||||||
Short-term debt (excluding current portion of long-term debt) | — | — | 111,179.8 | 111,179.8 | 111,179.8 | — | — | 131,546.8 | 131,546.8 | 131,546.8 | 2,104.7 | 2,104.7 | ||||||||||||||||||||||||||||||||||||
Long-term debt (including current portion of long-term debt) | 7,540.4 | — | 389,403.0 | 396,943.4 | 399,200.3 | — | — | 593,781.1 | 593,781.1 | 608,359.3 | 9,500.5 | 9,733.7 | ||||||||||||||||||||||||||||||||||||
Other financial liabilities – current | 2,131.7 | 6,929.6 | 18,176.9 | 27,238.2 | 27,238.2 | |||||||||||||||||||||||||||||||||||||||||||
Other financial liabilities – non-current | 1,783.8 | 929.4 | 4,819.4 | 7,532.6 | 7,297.0 | |||||||||||||||||||||||||||||||||||||||||||
Other financial liabilities: | ||||||||||||||||||||||||||||||||||||||||||||||||
-current | 2,611.5 | 61,848.3 | 29,929.0 | 94,388.8 | 94,388.8 | 1,510.2 | 1,510.2 | |||||||||||||||||||||||||||||||||||||||||
-non-current | 4,277.2 | 72,942.2 | 3,737.1 | 80,956.5 | 81,177.7 | 1,295.3 | 1,298.8 | |||||||||||||||||||||||||||||||||||||||||
|
|
|
|
|
|
|
|
|
|
|
| |||||||||||||||||||||||||||||||||||||
Total | Rs. | 11,455.9 | Rs. | 7,859.0 | Rs. | 898,925.4 | Rs. | 918,240.3 | Rs. | 920,261.6 | Rs. | 6,888.7 | Rs. | 134,790.5 | Rs. | 1,369,144.9 | Rs. | 1,510,824.1 | Rs. | 1,525,623.5 | US$ | 24,173.1 | US$ | 24,409.8 | ||||||||||||||||||||||||
|
|
|
|
|
|
|
|
|
|
|
| |||||||||||||||||||||||||||||||||||||
The following table presents the carrying amounts and fair value of each category of financial assets and liabilities as at March 31, 2014.
Financial assets | Cash, and loans and receivables | Available for-sale financial assets | Derivatives in other than hedging relationship | Derivatives in hedging relationship | Total carrying value | Total fair value | ||||||||||||||||||
| (In millions) | ||||||||||||||||||||||||
Cash and cash equivalents | Rs. | 159,921.5 | Rs. | — | Rs. | — | Rs. | — | Rs. | 159,921.5 | Rs. | 159,921.5 | ||||||||||||
Short-term deposits | 125,150.4 | — | — | — | 125,150.4 | 125,150.4 | ||||||||||||||||||
Finance receivables | 185,275.2 | — | — | — | 185,275.2 | 185,007.6 | ||||||||||||||||||
Trade receivables | 109,644.8 | — | — | — | 109,644.8 | 109,644.8 | ||||||||||||||||||
Unquoted equity investments* | — | 3,919.7 | — | — | 3,919.7 | — | ||||||||||||||||||
Other investments | 75.0 | 97,882.1 | — | — | 97,957.1 | 97,957.1 | ||||||||||||||||||
Other financial assets: | ||||||||||||||||||||||||
-current | 8,061.9 | — | 1,174.7 | 34,737.7 | 43,974.3 | 43,974.3 | ||||||||||||||||||
-non-current | 8,797.1 | — | 2,339.8 | 41,307.1 | 52,444.0 | 52,355.4 | ||||||||||||||||||
|
|
|
|
|
|
|
|
|
|
|
| |||||||||||||
Total | Rs. | 596,925.9 | Rs. | 101,801.8 | Rs. | 3,514.5 | Rs. | 76,044.8 | Rs. | 778,287.0 | Rs. | 774,011.1 | ||||||||||||
|
|
|
|
|
|
|
|
|
|
|
| |||||||||||||
| * | The fair value in respect of the unquoted equity investments cannot be reliably measured. |
Financial liabilities | Derivatives other than in hedging relationship | Derivatives in hedging relationship | Other financial liabilities | Total carrying value | Total fair value | |||||||||||||||
| (In millions) | ||||||||||||||||||||
Accounts payable | Rs. | — | Rs. | — | Rs. | 544,197.3 | Rs. | 544,197.3 | Rs. | 544,197.3 | ||||||||||
Acceptances | — | — | 51,620.4 | 51,620.4 | 51,620.4 | |||||||||||||||
Short-term debt (excluding current portion of long-term debt) | — | — | 100,464.7 | 100,464.7 | 100,464.7 | |||||||||||||||
Long-term debt (including current portion of long-term debt) | — | — | 519,634.5 | 519,634.5 | 538,824.4 | |||||||||||||||
Other financial liabilities: | ||||||||||||||||||||
-current | 1,063.8 | 5,374.9 | 28,485.5 | 34,924.2 | 34,924.2 | |||||||||||||||
-non-current | 1,800.8 | 3,682.8 | 3,689.1 | 9,172.7 | 9,305.6 | |||||||||||||||
|
|
|
|
|
|
|
|
|
| |||||||||||
Total | Rs. | 2,864.6 | Rs. | 9,057.7 | Rs. | 1,248,091.5 | Rs. | 1,260,013.8 | Rs. | 1,279,336.6 | ||||||||||
|
|
|
|
|
|
|
|
|
| |||||||||||
The following table provides an analysis of financial instruments that are measured subsequent to initial recognition at fair value, grouped into Level 1 to Level 3, as described below.
Quoted prices in an active market (Level 1): This level of hierarchy includes financial assets that are measured by reference to quoted prices (unadjusted) in active markets for identical assets or liabilities. This category consists quoted equity shares, quoted corporate debt instruments and mutual fund investments.
Valuation techniques with observable inputs (Level 2): This level of hierarchy includes financial assets and liabilities, measured using inputs other than quoted prices included within Level 1 that are observable for the asset or liability, either directly (i.e., as prices) or indirectly (i.e., derived from prices). This level of hierarchy includes Company’s over-the-counter (OTC) derivative contracts and fair value of prepayment options embedded within Senior Notes.senior notes.
Valuation techniques with significant unobservable inputs (Level 3): This level of hierarchy includes financial assets and liabilities measured using inputs that are not based on observable market data (unobservable inputs). Fair values are determined in whole or in part, using a valuation model based on assumptions that are neither supported by prices from observable current market transactions in the same instrument nor are they based on available market data. The main items in this category are conversion option liabilityliabilities in foreign currency convertible notes and unquoted available-for-sale financial assets, measured at fair value.
Financial assets measured at fair value Available-for-sale financial assets Fair value of prepayment option# Derivative assets Total Financial liabilities measured at fair value Conversion option liability Derivative liabilities Total As of March 31, 2013 Level 1 Level 2 Level 3 Total (In millions) Rs. 77,431.8 Rs. — Rs. 84.6 Rs. 77,516.4 — 3,857.8 — 3,857.8 — 8,762.8 — 8,762.8 Rs. 77,431.8 Rs. 12,620.6 Rs. 84.6 Rs. 90,137.0 US$ 1,426.4 US$ 232.5 US$ 1.6 US$ 1,660.5 — — 3,765.5 3,765.5 — 34,384.7 — 34,384.7 — 34,384.7 3,765.5 38,150.2 US$ — US$ 633.4 US$ 69.4 US$ 702.8
| As at March 31, 2015 | ||||||||||||||||
| Level 1 | Level 2 | Level 3 | Total | |||||||||||||
| (In millions) | ||||||||||||||||
Financial assets measured at fair value | ||||||||||||||||
Available-for-sale financial assets | Rs. | 142,791.8 | Rs. | — | Rs. | 15.0 | Rs. | 142,806.8 | ||||||||
Derivative assets | — | 19,259.5 | — | 19,259.5 | ||||||||||||
|
|
|
|
|
|
|
| |||||||||
Total | Rs. | 142,791.8 | Rs. | 19,259.5 | Rs. | 15.0 | Rs. | 162,066.3 | ||||||||
|
|
|
|
|
|
|
| |||||||||
| US$ | 2,284.7 | US$ | 308.1 | US$ | 0.2 | US$ | 2,593.0 | |||||||||
|
|
|
|
|
|
|
| |||||||||
Financial liabilities measured at fair value | ||||||||||||||||
Derivative liabilities | Rs. | — | Rs. | 141,679.2 | Rs. | — | Rs. | 141,679.2 | ||||||||
|
|
|
|
|
|
|
| |||||||||
Total | Rs. | — | Rs. | 141,679.2 | Rs. | — | Rs. | 141,679.2 | ||||||||
|
|
|
|
|
|
|
| |||||||||
| US$ | — | US$ | 2,266.9 | US$ | — | US$ | 2,266.9 | |||||||||
|
|
|
|
|
|
|
| |||||||||
Reconciliation of Level 3 category of financial assets and financial liabilities:
| For the year ended March31, 2013 | Year ended March 31, 2015 | |||||||||||||||||||||||
| Conversion option liability | Available-for-sale financial assets | Available-for-sale financial assets | ||||||||||||||||||||||
| (In millions) | (In millions) | |||||||||||||||||||||||
Balance at the beginning | US$ | 139.0 | Rs. | 7,540.4 | US$ | 1.6 | Rs. | 82.3 | US$ | 1.0 | Rs. | 62.0 | ||||||||||||
Total losses: | ||||||||||||||||||||||||
- gain recognized in income statement (refer note 30)* | (14.8 | ) | (801.6 | ) | — | — | ||||||||||||||||||
- recognized in other comprehensive income | — | — | — | 2.3 | ||||||||||||||||||||
Conversion of notes during the year | (54.8 | ) | (2,973.3 | ) | — | — | ||||||||||||||||||
- loss recognized in income statement | (0.1 | ) | (7.4 | ) | ||||||||||||||||||||
Sale of investments | (0.7 | ) | (39.6 | ) | ||||||||||||||||||||
|
|
|
|
|
| |||||||||||||||||||
Balance at the end | US$ | 69.4 | Rs. | 3,765.5 | US$ | 1.6 | Rs. | 84.6 | US$ | 0.2 | Rs. | 15.0 | ||||||||||||
|
|
|
|
|
| |||||||||||||||||||
| As of March 31, 2012 | As at March 31, 2014 | |||||||||||||||||||||||||||||||
| Level 1 | Level 2 | Level 3 | Total | Level 1 | Level 2 | Level 3 | Total | |||||||||||||||||||||||||
| (In millions) | (In millions) | |||||||||||||||||||||||||||||||
Financial assets measured at fair value | ||||||||||||||||||||||||||||||||
Available-for-sale financial assets | Rs. | 78,282.7 | Rs. | — | Rs. | 82.3 | Rs. | 78,365.0 | Rs. | 97,820.1 | Rs. | — | Rs. | 62.0 | Rs. | 97,882.1 | ||||||||||||||||
Derivative assets | — | 5,847.4 | — | 5,847.4 | — | 79,559.3 | — | 79,559.3 | ||||||||||||||||||||||||
|
|
|
|
|
|
|
| |||||||||||||||||||||||||
Total | Rs. | 78,282.7 | Rs. | 5,847.4 | Rs. | 82.3 | Rs. | 84,212.4 | Rs. | 97,820.1 | Rs. | 79,559.3 | Rs. | 62.0 | Rs. | 177,441.4 | ||||||||||||||||
|
|
|
|
|
|
|
| |||||||||||||||||||||||||
Financial liabilities measured at fair value | ||||||||||||||||||||||||||||||||
Conversion option liability | — | — | 7,540.4 | 7,540.4 | ||||||||||||||||||||||||||||
Derivative liabilities | — | 11,774.5 | — | 11,774.5 | Rs. | — | Rs. | 11,922.3 | Rs. | — | Rs. | 11,922.3 | ||||||||||||||||||||
|
|
|
|
|
|
|
| |||||||||||||||||||||||||
Total | Rs. | — | Rs. | 11,774.5 | Rs. | 7,540.4 | Rs. | 19,314.9 | Rs. | — | Rs. | 11,922.3 | Rs. | — | Rs. | 11,922.3 | ||||||||||||||||
|
|
|
|
|
|
|
| |||||||||||||||||||||||||
Reconciliation of Level 3 category of financial assets and financial liabilities:
| For the year ended March 31, 2012 | Year ended March 31, 2014 | |||||||||||||||||||
| Conversion option liability | Available-for-sale financial assets | Conversion option liability | Available-for-sale financial assets | |||||||||||||||||
| (In millions) | (In millions) | |||||||||||||||||||
Balance at the beginning | Rs. | 9,972.8 | Rs. | 101.5 | Rs. | 3,765.5 | Rs. | 84.6 | ||||||||||||
Total losses: | ||||||||||||||||||||
- recognized in income statement (refer note 30)* | (2,432.4 | ) | — | |||||||||||||||||
- loss recognized in income statement (refer note 30) | 838.2 | — | ||||||||||||||||||
- recognized in other comprehensive income | — | (1.0 | ) | — | 24.0 | |||||||||||||||
Sales during the year | — | (18.2 | ) | |||||||||||||||||
Sale of investments | — | (46.6 | ) | |||||||||||||||||
Conversion of notes during the year | — | — | (4,603.7 | ) | — | |||||||||||||||
|
|
|
| |||||||||||||||||
Balance at the end | Rs. | 7,540.4 | Rs. | 82.3 | Rs. | — | Rs. | 62.0 | ||||||||||||
|
|
|
| |||||||||||||||||
There have been no transfers between level 1 and level 2 for the years ended March 31, 2015 and 2014.
The following table provides an analysis of fair value of financial instruments that are not measured at fair value on recurring basis, grouped into Level 1 to Level 3 categories:
| As at March 31, 2015 | ||||||||||||||||
| Level 1 | Level 2 | Level 3 | Total | |||||||||||||
| (In millions) | ||||||||||||||||
Financial assets not measured at fair value | ||||||||||||||||
Finance receivables | — | — | 157,409.9 | 157,409.9 | ||||||||||||
Other investments | — | 80.0 | — | 80.0 | ||||||||||||
|
|
|
|
|
|
|
| |||||||||
Total | Rs. | — | Rs. | 80.0 | Rs. | 157,409.9 | Rs. | 157,489.9 | ||||||||
|
|
|
|
|
|
|
| |||||||||
| US$ | — | US$ | 1.3 | US$ | 2,518.6 | US$ | 2,519.9 | |||||||||
|
|
|
|
|
|
|
| |||||||||
Financial liabilities not measured at fair value | ||||||||||||||||
Short-term debt (excluding current portion of long-term debt) | — | 131,546.8 | — | 131,546.8 | ||||||||||||
Long-term debt (including current portion of long-term debt) | 311,696.8 | 296,662.5 | — | 608,359.3 | ||||||||||||
|
|
|
|
|
|
|
| |||||||||
Total | Rs. | 311,696.8 | Rs. | 428,209.3 | Rs. | — | Rs. | 739,906.1 | ||||||||
|
|
|
|
|
|
|
| |||||||||
| US$ | 4,987.1 | US$ | 6,851.3 | US$ | — | US$ | 11,838.4 | |||||||||
|
|
|
|
|
|
|
| |||||||||
| As at March 31, 2014 | ||||||||||||||||
| Level 1 | Level 2 | Level 3 | Total | |||||||||||||
| (In millions) | ||||||||||||||||
Financial assets not measured at fair value | ||||||||||||||||
Finance receivables | — | — | 185,007.6 | 185,007.6 | ||||||||||||
Other investments | — | 75.0 | — | 75.0 | ||||||||||||
|
|
|
|
|
|
|
| |||||||||
Total | Rs. | — | Rs. | 75.0 | Rs. | 185,007.6 | Rs. | 185,082.6 | ||||||||
|
|
|
|
|
|
|
| |||||||||
Financial liabilities not measured at fair value | ||||||||||||||||
Short-term debt (excluding current portion of long-term debt) | — | 100,464.7 | — | 100,464.7 | ||||||||||||
Long-term debt (including current portion of long-term debt) | 213,685.7 | 325,138.7 | — | 538,824.4 | ||||||||||||
|
|
|
|
|
|
|
| |||||||||
Total | Rs. | 213,685.7 | Rs. | 425,603.4 | Rs. | — | Rs. | 639,289.1 | ||||||||
|
|
|
|
|
|
|
| |||||||||
Notes
The short termshort-term financial assets and liabilities are stated at amortized cost which is approximately equal to their fair value.
Derivatives are fair valued using market observable rates and published prices together with forecast cash flow information where applicable.
The fair value of finance receivables havehas been estimated by discounting expected cash flows using rates at which loans of similar credit quality and maturity would be made and internal assumptions such as ofexpected credit losses and estimated collateral value for repossessed vehicles as at March 31, 20132015 and March 31, 2012.2014. As unobservable inputs are applied, finance receivables are classified in Level 3.
Available-for-sale securities are carried at their fair values, which are generally based on market price quotations. The fair value in respect of the unquoted equity investments cannot be reliably measured.
The fair value of borrowings which have a quoted market price in an active market is based on its market price and for other borrowings the fair value is estimated by discounting expected future cash flows, using a discount rate equivalent to the risk freerisk-free rate of return, adjusted for the credit spread considered by the lenders for instruments of the similar maturity.
Management uses its best judgment in estimating the fair value of its financial instruments. However, there are inherent limitations in any estimation technique. Therefore, for substantially all financial instruments, the fair value estimates presented above are not necessarily indicative of all the amounts that the Company could have realized or paid in sale transactions as of respective dates. As such, the fair value of the financial instruments subsequent to the respective reporting dates may be different from the amounts reported at each year end.
Offsetting
Certain financial assets and financial liabilities are subject to offsetting where there is currently a legally enforceable right to set off recognized amounts and the Company intends to either settle on a net basis, or to realize the asset and settle the liability, simultaneously.
Certain derivative financial assets and financial liabilities are subject to master netting arrangements, whereby in the case of insolvency, derivative financial assets and financial liabilities will be settled on a net basis.
The following table discloses the amounts that have been offset, in arriving at the balance sheet presentation and the amounts that are available for offset only under certain conditions as at March 31, 2015:
| Gross amount recognized | Gross amount recognized as set off in the balance sheet | Net amount presented in the balance sheet | Amounts subject to an enforceable master netting arrangement | Net amount after offsetting | ||||||||||||||||||||
Financial assets | Financial instruments | Cash collateral | ||||||||||||||||||||||
| (In millions) | ||||||||||||||||||||||||
Derivative financial instruments | Rs. | 76,485.4 | Rs. | (57,225.9 | ) | Rs. | 19,259.5 | Rs. | (18,304.9 | ) | Rs. | — | Rs. | 954.6 | ||||||||||
Trade receivables | 131,458.6 | (464.3 | ) | 130,994.3 | — | — | 130,994.3 | |||||||||||||||||
Cash and cash equivalents | 206,028.6 | (8,597.7 | ) | 197,430.9 | — | — | 197,430.9 | |||||||||||||||||
|
|
|
|
|
|
|
|
|
|
|
| |||||||||||||
Total | Rs. | 413,972.6 | Rs. | (66,287.9 | ) | Rs. | 347,684.7 | Rs. | (18,304.9 | ) | Rs. | — | Rs. | 329,379.8 | ||||||||||
|
|
|
|
|
|
|
|
|
|
|
| |||||||||||||
| US$ | 6,623.6 | US$ | (1,060.7 | ) | US$ | 5,562.9 | US$ | (292.9 | ) | US$ | — | US$ | 5,270.0 | |||||||||||
|
|
|
|
|
|
|
|
|
|
|
| |||||||||||||
Financial liabilities | ||||||||||||||||||||||||
Derivative financial instruments | Rs. | 198,905.1 | Rs. | (57,225.9 | ) | Rs. | 141,679.2 | Rs. | (18,304.9 | ) | Rs. | — | Rs. | 123,374.3 | ||||||||||
Accounts payable | 569,847.7 | (464.3 | ) | 569,383.4 | — | — | 569,383.4 | |||||||||||||||||
Loans from banks/financial institutions (short-term) | 89,917.8 | (8,597.7 | ) | 81,320.1 | — | — | 81,320.1 | |||||||||||||||||
|
|
|
|
|
|
|
|
|
|
|
| |||||||||||||
Total | Rs. | 858,670.6 | Rs. | (66,287.9 | ) | Rs. | 792,382.7 | Rs. | (18,304.9 | ) | Rs. | — | Rs. | 774,077.8 | ||||||||||
|
|
|
|
|
|
|
|
|
|
|
| |||||||||||||
| US$ | 13,738.8 | US$ | (1,060.7 | ) | US$ | 12,678.1 | US$ | (292.9 | ) | US$ | — | US$ | 12,385.2 | |||||||||||
|
|
|
|
|
|
|
|
|
|
|
| |||||||||||||
The following table discloses the amounts that have been offset in arriving at the balance sheet presentation and the amounts that are available for offset only under certain conditions as at March 31, 2014:
| Gross amount recognized | Gross amount recognized as set off in the balance sheet | Net amount presented in the balance sheet | Amounts subject to an enforceable master netting arrangement | Net amount after offsetting | ||||||||||||||||||||
Financial assets | Financial instruments | Cash collateral | ||||||||||||||||||||||
| (In millions) | ||||||||||||||||||||||||
Derivative financial instruments | Rs. | 85,332.3 | Rs. | (5,773.0 | ) | Rs. | 79,559.3 | Rs. | (11,944.2 | ) | Rs. | — | Rs. | 67,615.1 | ||||||||||
Trade receivables | 110,093.7 | (448.9 | ) | 109,644.8 | — | — | 109,644.8 | |||||||||||||||||
Cash and cash equivalents | 162,111.3 | (2,189.8 | ) | 159,921.5 | — | — | 159,921.5 | |||||||||||||||||
|
|
|
|
|
|
|
|
|
|
|
| |||||||||||||
Total | Rs. | 357,537.3 | Rs. | (8,411.7 | ) | Rs. | 349,125.6 | Rs. | (11,944.2 | ) | Rs. | — | Rs. | 337,181.4 | ||||||||||
|
|
|
|
|
|
|
|
|
|
|
| |||||||||||||
Financial liabilities | ||||||||||||||||||||||||
Derivative financial instruments | Rs. | 17,695.3 | Rs. | (5,773.0 | ) | Rs. | 11,922.3 | Rs. | (11,944.2 | ) | Rs. | — | Rs. | (21.9 | ) | |||||||||
Accounts payable | 544,646.2 | (448.9 | ) | 544,197.3 | — | — | 544,197.3 | |||||||||||||||||
Loans fron banks/financial institutions (short-term) | 83,475.1 | (2,189.8 | ) | 81,285.3 | — | — | 81,285.3 | |||||||||||||||||
|
|
|
|
|
|
|
|
|
|
|
| |||||||||||||
Total | Rs. | 645,816.6 | Rs. | (8,411.7 | ) | Rs. | 637,404.9 | Rs. | (11,944.2 | ) | Rs. | — | Rs. | 625,460.7 | ||||||||||
|
|
|
|
|
|
|
|
|
|
|
| |||||||||||||
| Transfer of financial assets |
The Company transfers finance receivables in securitization transactions /and direct assignments. In such transactions the Company surrenders control over the receivables, though it continues to act as an agent for the collection of receivables. In most of thethese transactions, the Company also provides credit enhancements to the transferee.
Consequent toBecause of the existence of credit enhancements in such transactions, the Company continues to have the obligation to pay to the transferee, limited to the extent of credit enhancement, even if it does not collect the equivalent amounts from the original asset and continues to retain substantially all risks and rewards associated with the receivables, and hence, such transfer /assignments door assignment does not meet the derecognition criteria resulting into the transfer not being recorded as sale. Consequently, the proceeds received from the transfer are recorded as collateralized debt obligation.
Further the Company transfers certain trade receivables under the debt factoring arrangements. These do not qualify for derecognition, due to the recourse arrangement in place. Consequently the proceeds received from transfer are recorded as loans from banks/banks / financial institutions and classified under short termshort-term borrowings.
The carrying amount of trade receivables and finance receivables along with the associated liabilities is as follows:
| As of March 31, | As at March 31, | |||||||||||||||||||||||||||||||||||||||||||||||
| 2013 | 2013 | 2012 | 2015 | 2015 | 2014 | |||||||||||||||||||||||||||||||||||||||||||
Nature of Asset | Carrying amount of asset sold | Carrying amount of associated liabilities | Carrying amount of asset sold | Carrying amount of associated liabilities | Carrying amount of asset sold | Carrying amount of associated liabilities | Carrying amount of asset sold | Carrying amount of associated liabilities | Carrying amount of asset sold | Carrying amount of associated liabilities | Carrying amount of asset sold | Carrying amount of associated liabilities | ||||||||||||||||||||||||||||||||||||
| (In millions) | (In millions) | |||||||||||||||||||||||||||||||||||||||||||||||
Trade receivables | US$ | 412.1 | US$ | 412.1 | Rs. | 22,373.3 | Rs. | 22,373.3 | Rs. | 13,138.5 | Rs. | 13,138.5 | US$ | 274.5 | US$ | 274.5 | Rs. | 17,154.3 | Rs. | 17,154.3 | Rs. | 20,135.9 | Rs. | 20,135.9 | ||||||||||||||||||||||||
Finance receivables | US$ | 366.7 | US$ | 383.5 | Rs. | 19,907.6 | Rs. | 20,820.0 | Rs. | 15,375.4 | Rs. | 17,762.7 | US$ | 93.3 | US$ | 98.7 | Rs. | 5,833.3 | * | Rs. | 6,168.0 | Rs. | 15,790.2 | * | Rs. | 15,413.2 | ||||||||||||||||||||||
| * | Net of provision of Rs. 1,137.2 million and Rs. 546.2 million as at March 31, 2015 and 2014, respectively. |
| Cash flow hedges |
As ofat March 31, 2013,2015, the Company has acquireda number of cash flow hedging instruments.instruments in a hedging relationship. The Company and its subsidiaries uses both USD/GBPU.S. dollar/Pounds sterling forward and option contracts, USD/U.S. dollar/Euro forward contracts and other currency forwards and options to hedge future cash flows from sales and purchases. Cash flow hedges are expected to be recognisedrecognized in profit or loss during the years ending March 31, 20142016 to 2017.2020.
The Company and its subsidiaries also hashave a number of USD/Euro options and otherforeign currency options,derivative contracts, which are entered into as an economic hedge of the financial risks of the Company. These contracts do not meet the hedge accounting criteria of IAS 39, sohence the change in fair value is recognisedrecognized immediately in the income statement.
The time value of options is considered ineffective in the hedge relationship and thus the change in time value is recognised immediately in the income statement.
Changes in fair value of forward exchangeforeign currency derivative contracts, to the extent determined to be an effective hedge, is recognized in other comprehensive income and the ineffective portion of the fair value change is recognized in income statement. Accordingly, the fair value change of (net loss) Rs. 19,001.0 million (net of tax), (net loss) Rs. 2,051.7139,332.2 million (net of tax), (net gain) Rs.2,462.8Rs. 79,270.4 million (net of tax) and (net loss) Rs. 19,001.0 million (net of tax), was recognized in other comprehensive income during the yearyears ended March 31, 2013,2015, March 31, 20122014 and March 31, 2011,2013, respectively. AmountAmounts reclassified from hedging reserve of (net loss)gain) Rs. 3,895.03,863.6 million (net of tax), (net gain) Rs. 1,172.37,900.6 million (net of tax) and (net gain)loss) Rs. 934.13,828.8 million (net of tax) during the yearyears ended March 31,2013,31, 2015, 2014, and 2013, respectively, have been classified as foreign exchange gain/loss in the income statement on occurrence of forecast transactions.
Amounts reclassified from hedging reserve, where forecast transactions are no longer expected to occur, amount to (net loss) of Rs. 394.4 million (net of tax), (net gain) of Rs. 370.3 million (net of tax) and (net loss) of Rs. 66.2 million (net of tax) during the years ended March 31, 2012,2015, 2014 and March 31, 2011,2013, respectively, hashave been classified as foreign exchange gain/loss in the income statement.
| Financial risk management |
In the course of its business, the Company is exposed primarily to fluctuations in foreign currency exchange rates, interest rates, equity price,prices, liquidity and credit risk, which may adversely impact the fair value of its financial instruments.
The Company has a risk management policy which not only covers the foreign exchange risks but also other risks associated with the financial assets and liabilities likesuch as interest rate risks and credit risks. The risk management policy is approved by the board of directors. The risk management framework aims to:
Create a stable business planning environment – by reducing the impact of currency and interest rate fluctuations on the Company’s business plan.
Achieve greater predictability to earnings – by determining the financial value of the expected earnings in advance.
| Market risk |
Market risk is the risk of any loss in future earnings, in realizable fair values or in future cash flows that may result from a change in the price of a financial instrument. The value of a financial instrument may change as a result of changes in the interest rates, foreign currency exchange rate,rates, equity price fluctuations, liquidity and other market changes. Future specific market movements cannot be normally predicted with reasonable accuracy.
i)(i) – (a) Foreign currency exchange rate risk:
The fluctuation in foreign currency exchange rates may have potential impact on the income statement and equity, where any transaction references more than one currency or where assets/liabilities are denominated in a currency other than the functional currency of the respective consolidated entities.
Considering the countries and economic environment in which the Company operates, its operations are subject to risks arising from fluctuations in exchange rates in those countries. The risks primarily relate to fluctuations in US Dollar,U.S. dollar, Chinese Renminbi,renminbi, Japanese Yenyen, Singapore dollar and Euro, against the respective functional currencies of Tata Motors Limited and its subsidiaries.
The Company, as per its risk management policy, uses forexforeign exchange and other derivative instruments primarily to hedge foreign exchange and interest rate exposure. Further,Furthermore, any movement in the functional currencies of the various operations of the Company against major foreign currencies may impact the Company’s revenues infrom its international business.operations. Any weakening of the functional currency may impact the Company’s cost of imports and cost of borrowings and consequently may increase the cost of financing ourthe Company’s capital expenditures.
The Company evaluates the impact of foreign exchange rate fluctuations by assessing its exposure to exchange rate risks. It hedges a part of these risks by using derivative financial instruments in accordance with its risk management policies.
The foreign exchange rate sensitivity is calculated for each currency by aggregation of the net foreign exchange rate exposure of a currency and a simultaneous parallel foreign exchange rates shift in the foreign exchange rates of all the currencieseach currency by 10%.
The following analysis has been worked outis based on the gross exposure as of the Balance Sheet daterelevant balance sheet dates, which could affect the income statement. There is no exposure to the income statement on account of translation of financial statements of consolidated foreign entities. FurtherFurthermore, the exposure as indicated below is mitigated by some of the derivative contracts entered into by the Company as disclosed at clause (iv) below.
The following table setsets forth information relating to foreign currency exposure (other than risk arising from derivatives disclosed at clause (iv) below) as ofat March 31, 2013:2015:
| US Dollar | Euro | Chinese Renminbi | JPY | Others* | Total | U.S. dollar | Euro | Chinese Renminbi | SGD | Others* | Total | |||||||||||||||||||||||||||||||||||||
| (In millions) | (In millions) | |||||||||||||||||||||||||||||||||||||||||||||||
Financial assets | Rs. | 31,668.6 | Rs. | 22,032.6 | Rs. | 54,809.0 | Rs. | 2,891.8 | Rs. | 29,474.5 | Rs. | 140,876.5 | Rs. | 89,508.3 | Rs. | 45,441.1 | Rs. | 68,607.8 | Rs. | 1,977.9 | Rs. | 38,542.1 | Rs. | 244,077.2 | ||||||||||||||||||||||||
Financial liabilities | 163,664.9 | 102,045.9 | 54,144.3 | 9,076.0 | 20,923.6 | 349,854.7 | Rs. | 307,376.4 | Rs. | 106,703.0 | Rs. | 69,901.6 | Rs. | 24,214.1 | Rs. | 23,277.2 | Rs. | 531,472.3 | ||||||||||||||||||||||||||||||
| * | Others mainly include currencies such as the Russian |
10% appreciation / appreciation/depreciation of the respective foreign currencies with respect to functional currency of Tata Motors Limited and its subsidiariesthe Company would result in decrease / decrease/increase in the Company’s net income before tax by approximately Rs. 24,407.7 million and Rs. 53,147.2 million for financial assets and financial liabilities respectively, for the year ended March 31, 2015.
The following table sets forth information relating to foreign currency exposure (other than risk arising from derivatives disclosed at clause (iv) below) as at March 31, 2014:
| U.S. dollar | Euro | Chinese Renminbi | SGD | JPY | Others* | Total | ||||||||||||||||||||||
| (In millions) | ||||||||||||||||||||||||||||
Financial assets | Rs. | 60,850.2 | Rs. | 31,938.5 | Rs. | 83,609.6 | Rs. | 13,191.2 | Rs. | 1,692.9 | Rs. | 41,198.6 | Rs. | 232,481.0 | ||||||||||||||
Financial liabilities | Rs. | 232,914.3 | Rs. | 140,077.3 | Rs. | 71,172.2 | Rs. | 25,311.6 | Rs. | 6,793.5 | Rs. | 24,105.3 | Rs. | 500,374.2 | ||||||||||||||
| * | Others mainly include currencies such as the Russian rouble, Swiss franc, Australian dollar, South African rand, Thai baht and Korean won. |
10% appreciation/depreciation of the respective foreign currencies with respect to functional currency of the Company would result in decrease/increase in the Company’s net income before tax by approximately Rs. 23,248.1 million and Rs. 50,037.4 million for financial assets and financial liabilities respectively, for the year ended March 31, 2014.
The following table sets forth information relating to foreign currency exposure (other than risk arising from derivatives disclosed at clause (iv) below) as at March 31, 2013:
| U.S. dollar | Euro | Chinese Renminbi | JPY | Others* | Total | |||||||||||||||||||
| (In millions) | ||||||||||||||||||||||||
Financial assets | Rs. | 31,668.6 | Rs. | 22,032.6 | Rs. | 54,809.0 | Rs. | 2,891.8 | Rs. | 29,474.5 | Rs. | 140,876.5 | ||||||||||||
Financial liabilities | Rs. | 163,664.9 | Rs. | 102,045.9 | Rs. | 54,144.3 | Rs. | 9,076.0 | Rs. | 20,923.6 | Rs. | 349,854.7 | ||||||||||||
| * | Others mainly include currencies such as the Russian rouble, Singapore dollar, Swiss franc, Australian dollar, South African rand, Thai baht and Korean won. |
10% appreciation/depreciation of the respective foreign currencies with respect to functional currency of the Company would result in decrease/increase in the Company’s net income before tax by approximately Rs. 14,087.6 million and Rs. 34,985.5 million for financial assets and financial liabilities respectively, for the year ended March 31, 2013.
The following table set forth information relating to foreign currency exposure (other than risk arising from derivatives disclosed at clause (iv) below) as of March 31, 2012:
| US Dollar | Euro | Chinese Renminbi | JPY | Others* | Total | |||||||||||||||||||
| (In millions) | ||||||||||||||||||||||||
Financial assets | Rs. | 35,772.6 | Rs. | 19,787.0 | Rs. | 47,675.6 | Rs. | 2,607.9 | Rs. | 18,708.2 | Rs. | 124,551.3 | ||||||||||||
Financial liabilities | 169,425.1 | 76,832.2 | 30,164.1 | 12,261.5 | 17,136.3 | 305,819.2 | ||||||||||||||||||
10% appreciation / depreciation of the respective foreign currencies with respect to functional currency of Tata Motors Limited and its subsidiaries would result in decrease / increase in the Company’s net income before tax by approximately Rs. 12,455.1 million and Rs. 30,581.9 million for financial assets and financial liabilities respectively for the year ended March 31, 2012.
The following table set forth information relating to foreign currency exposure (other than risk arising from derivatives disclosed at clause (iv) below) as of March 31, 2011:
| US Dollar | Euro | Chinese Renminbi | JPY | Others* | Total | |||||||||||||||||||
| (In millions) | ||||||||||||||||||||||||
Financial assets | Rs. | 20,225.9 | Rs. | 16,061.2 | Rs. | 19,960.7 | Rs. | 2,887.7 | Rs. | 26,630.3 | Rs. | 85,765.8 | ||||||||||||
Financial liabilities | 88,927.6 | 32,306.5 | 20,146.5 | 3,037.2 | 23,708.7 | 168,126.5 | ||||||||||||||||||
10% appreciation / depreciation of the respective foreign currencies with respect to functional currency of Tata Motors Limited and its subsidiaries would result in decrease / increase in the Company’s net income before tax by approximately Rs. 8,576.6 million and Rs. 16,812.6 million for financial assets and financial liabilities respectively for the year ended March 31, 2011.
(Note: The impact is indicated on the income/loss before tax basis).
i)(i) – (b) Interest rate risk
Interest rate risk is measured by using the cash flow sensitivity for changes in variable interest rates. Any movement in the reference rates could have an impact on the Company’s cash flows as well as costs.
The Company is subject to variable interest rates on some of its interest bearing liabilities. The Company’s interest rate exposure is mainly related to debt obligations. The Company also uses a mix of interest rate sensitive financial instruments to manage the liquidity and fund requirements for its day to day operations like short term non-convertible bonds and short term loans.
In its financing business, the Company enters into transactions with customers which primarily result in receivables at fixed rates. In order to manage this risk, the Company has a policy to match funding in terms of maturities and interest rates and also for certain part of the portfolio, the Company does not match funding with maturities, in order to take advantage of market opportunities.
The Company also enters into arrangements of securitization of receivables in order to reduce the impact of interest rate movements.
As ofat March 31, 2013, March 31, 20122015, 2014 and March 31, 2011, net2013, financial liability of Rs. 205,923.0215,830.7 million, Rs. 176,156.7223,225.2 million and Rs.103, 521.8Rs. 206,495.4 million, respectively, was subject to the variable interest rate.rates. Increase/decrease of 100 basis points in interest rates at the balance sheet date would result in an impact (decrease/increase in case of net income) of Rs.2,059.2Rs. 2,158.3 million, Rs. 1,761.62,232.3 million and Rs. 1,035.22,065.0 million on income for the yearyears ended March 31, 2015, 2014 and 2013, March 31, 2012 and March 31, 2011, respectively.
The model assumes that interest rate changes are instantaneous parallel shifts in the yield curve. Although some assets and liabilities may have similar maturities or periods to re-pricing, these may not react correspondingly to changes in market interest rates. Also, the interest rates on some types of assets and liabilities may fluctuate with changes in market interest rates, while interest rates on other types of assets may change with a lag.
The risk estimates provided assume a parallel shift of 100 basis points interest rate across all yield curves. This calculation also assumes that the change occurs at the balance sheet date and has been calculated based on risk exposures outstanding as at that date. The period end balances are not necessarily representative of the average debt outstanding during the period.
This analysis assumes that all other variables, in particular foreign currency rates, remain constant.
(Note: The impact is indicated on the income/loss before tax basis).
i)(i) – (c) Equity Priceprice risk
Equity Price Risk is related to the change in market reference price of the investments in equity securities.
The fair value of some of the Company’s investments in available-for-sale securities exposes the Company to equity price risks. In general, these securities are not held for trading purposes. These investments are subject to changes in the market price of securities. The fair value of available- for- saleavailable-for-sale equity securities as ofat March 31, 2015, 2014 and 2013, March 31, 2012was Rs. 2,106.1 million, Rs. 2,770.1 million and March 31, 2011, was Rs. 2,067.2 million, Rs. 2,885.3 million and Rs. 3,645.4 million, respectively. A 10 %10% change in equity prices of available -for- saleavailable-for-sale securities held as ofat March 31, 2013, March 31, 20122015, 2014 and March 31, 2011,2013, would result in an impact of Rs.206.7Rs. 210.6 million, Rs. 288.5277.0 million and Rs. 364.5206.7 million on equity, respectively.
The Company has investments in unquoted equity shares of Rs. 3,936.8 million, Rs. 3,919.7 million and Rs.3,877.0 million as at March 31, 2015, 2014 and 2013, respectively, the fair value of which cannot be reliably measured of Rs. 3,877.0 million as of March 31, 2013 and Rs. 3,866.4 million as of March 31, 2012..
(Note: The impact is indicated on equity before consequential tax impact, if any).
| Credit risk |
Credit risk is the risk of financial loss arising from counterparty failure to repay or service debt according to the contractual terms or obligations. Credit risk encompasses both the direct risk of default and the risk of deterioration of creditworthiness as well as concentration risks.
Financial instruments that are subject to concentrations of credit risk, principally consist of investments classified as loans and receivables, available for sale debt instruments, trade receivables, finance receivables, loans and advances and derivative financial instruments. None of the financial instruments of the Company result in material concentrations of credit risks.
Exposure to credit risk
The carrying amount of financial assets represents the maximum credit exposure. The maximum exposure to credit risk was Rs. 602,289.5771,304.7 million and Rs. 771,210.9 million as ofat March 31, 20132015 and Rs. 530,536.2 million as of March 31, 2012,2014, respectively, being the total of the carrying amount of balances with banks, short term deposits with banks, trade receivables, finance receivables, margin money and other financial assets excluding equity investments.
Financial assets that are neither past due nor impaired
None of the Company’s cash equivalents, including time deposits with banks, are past due or impaired. Regarding trade receivables and other receivables, and other loans or receivables that are neither impaired nor past due, there were no indications as ofat March 31, 2013,2015, that defaults in payment obligations will occur.
Credit quality of financial assets and impairment loss
The ageing of trade receivables and finance receivables as of balance sheet date is given below. The age analysis have been considered from the due date.
| As of March 31, | ||||||||||||||||||||||||||||||||||||||||||||||||||||||||||||
| 2013 | 2013 | 2013 | 2013 | 2012 | 2012 | As at March 31, | ||||||||||||||||||||||||||||||||||||||||||||||||||||||
| ( In millions) | 2015 | 2015 | 2015 | 2015 | 2015 | 2015 | 2014 | 2014 | 2014 | |||||||||||||||||||||||||||||||||||||||||||||||||||
Trade receivables | Gross | Allowance | Gross | Allowance | Gross | Allowance | Gross | Allowance | Net | Gross | Allowance | Net | Gross | Allowance | Net | |||||||||||||||||||||||||||||||||||||||||||||
| (In millions) | ||||||||||||||||||||||||||||||||||||||||||||||||||||||||||||
Period (in months) | ||||||||||||||||||||||||||||||||||||||||||||||||||||||||||||
Not due | US$ | 1,497.1 | US$ | (1.1 | ) | Rs. | 81,268.2 | Rs. | (60.3 | ) | Rs. | 61,770.5 | Rs. | (25.6 | ) | US$ | 1,841.2 | US$ | (1.5 | ) | US$ | 1,839.7 | Rs. | 115,072.2 | Rs. | (90.9 | ) | Rs. | 114,981.3 | Rs. | 94,964.1 | Rs. | (82.5 | ) | Rs. | 94,881.6 | ||||||||||||||||||||||||
Overdue 1-3 months | 282.0 | (1.2 | ) | 15,306.2 | (64.3 | ) | 20,319.4 | (2.4 | ) | |||||||||||||||||||||||||||||||||||||||||||||||||||
Overdue up to 3 months | 174.4 | (4.5 | ) | 169.9 | 10,900.0 | (280.8 | ) | 10,619.2 | 9,022.1 | (47.0 | ) | 8,975.1 | ||||||||||||||||||||||||||||||||||||||||||||||||
Overdue 3-6 months | 59.3 | (3.7 | ) | 3,218.5 | (202.8 | ) | 3,247.0 | (278.9 | ) | 41.3 | (3.9 | ) | 37.4 | 2,582.2 | (241.1 | ) | 2,341.1 | 2,319.9 | (158.0 | ) | 2,161.9 | |||||||||||||||||||||||||||||||||||||||
Overdue more than 6 months | 147.0 | (59.9 | ) | *7,979.8 | (3251.8 | ) | *5,542.5 | (2,917.6 | ) | 157.4 | (108.5 | ) | 48.9 | * | 9,836.3 | (6,783.6 | ) | 3,052.7 | * | 9,518.5 | (5,892.3 | ) | 3,626.2 | |||||||||||||||||||||||||||||||||||||
|
|
|
|
|
|
|
|
|
|
|
|
|
|
| ||||||||||||||||||||||||||||||||||||||||||||||
Total | US$ | 1,985.4 | US$ | (65.9 | ) | Rs. | 107,772.7 | Rs. | (3,579.2 | ) | Rs. | 90,879.4 | Rs. | (3,224.5 | ) | US$ | 2,214.3 | US$ | (118.4 | ) | US$ | 2,095.9 | Rs. | 138,390.7 | Rs. | (7,396.4 | ) | Rs. | 130,994.3 | Rs. | 115,824.6 | Rs. | (6,179.8 | ) | Rs. | 109,644.8 | ||||||||||||||||||||||||
|
|
|
|
|
|
|
|
| ||||||||||||||||||||||||||||||||||||||||||||||||||||
| * | Trade receivables overdue more than six months include Rs. |
| As of March 31, | ||||||||||||||||||||||||||||||||||||||||||||||||||||||||||||
| 2013 | 2013 | 2013 | 2013 | 2012 | 2012 | As at March 31, | ||||||||||||||||||||||||||||||||||||||||||||||||||||||
| ( In millions) | 2015 | 2015 | 2015 | 2015 | 2015 | 2015 | 2014 | 2014 | 2014 | |||||||||||||||||||||||||||||||||||||||||||||||||||
Finance receivables # | Gross | Allowance | Gross | Allowance | Gross | Allowance | Gross | Allowance | Net | Gross | Allowance | Net | Gross | Allowance | Net | |||||||||||||||||||||||||||||||||||||||||||||
| (In millions) | ||||||||||||||||||||||||||||||||||||||||||||||||||||||||||||
Period (in months) | ||||||||||||||||||||||||||||||||||||||||||||||||||||||||||||
Not due* | US$ | 3,705.5 | US$ | (129.9 | ) | Rs. | 201,154.3 | Rs. | (7,053.1 | ) | Rs. | 171,016.2 | Rs. | (3,464.2 | ) | US$ | 2,800.7 | US$ | (498.1 | ) | US$ | 2,302.6 | Rs. | 175,045.5 | Rs. | (31,130.5 | ) | Rs. | 143,915.0 | Rs. | 195,470.3 | Rs. | (22,183.4 | ) | Rs. | 173,286.9 | ||||||||||||||||||||||||
Overdue up to 11 months | 123.5 | (66.7 | ) | 6,704.0 | (3,621.0 | ) | 3,796.8 | (1,659.6 | ) | 175.5 | (21.3 | ) | 154.2 | 10,971.8 | (1,329.9 | ) | 9,641.9 | 14,574.5 | (4,189.9 | ) | 10,384.6 | |||||||||||||||||||||||||||||||||||||||
Overdue more than 11 months | 90.2 | (71.1 | ) | 4,895.7 | (3,860.7 | ) | 7,517.4 | (5,965.8 | ) | 297.0 | (225.5 | ) | 71.5 | 18,552.6 | (14,093.9 | ) | 4,458.7 | 6,817.9 | (5,214.2 | ) | 1,603.7 | |||||||||||||||||||||||||||||||||||||||
|
|
|
|
|
|
|
|
|
|
|
|
|
|
| ||||||||||||||||||||||||||||||||||||||||||||||
Total | US$ | 3,919.2 | US$ | (267.7 | ) | Rs. | 212,754.0 | Rs. | (14,534.8 | ) | Rs. | 182,330.4 | Rs. | (11,089.6 | ) | US$ | 3,273.2 | US$ | (744.9 | ) | US$ | 2,528.3 | Rs. | 204,569.9 | Rs. | (46,554.3 | ) | Rs. | 158,015.6 | Rs. | 216,862.7 | Rs. | (31,587.5 | ) | Rs. | 185,275.2 | ||||||||||||||||||||||||
|
|
|
|
|
|
|
|
|
|
|
|
|
|
| ||||||||||||||||||||||||||||||||||||||||||||||
| * | Allowance in the |
| # | Finance receivables originated in India. |
| Liquidity risk |
Liquidity risk refers to the risk that the Company cannot meet its financial obligations. The objective of liquidity risk management is to maintain sufficient liquidity and ensure that funds are available for use as per requirements.
The Company has obtained fund and non fundnon-fund based working capital lines from various banks. Further,Furthermore, the Company has access to funds from debt markets through commercial paper programs, non -convertiblenon-convertible debentures, fixed deposits from public, senior notes and other debt instruments. The Company invests its surplus funds in bank fixed deposit and liquid and liquid plus schemes of mutual funds, which carry no/low mark to market risks. The Company has also invested 15% of the public depositsdeposits/non-convertible debentures (taken by the Company) falling due for repayment in the next 12 months in bank deposits, to meet the regulatory norms of liquidity requirements.
The Company also constantly monitors funding options available in the debt and capital markets with a view to maintaining financial flexibility.
The table below provides details regarding the contractual maturities of financial liabilities, including estimated interest payments as ofat March 31, 2013:2015:
| Carrying amount | Due in 1st Year | Due in 2nd Year | Due in 3rd to 5th Year | Due after 5 Years | Total contractual cash flows | Total contractual cash flows | Carrying amount | Due in 1st Year | Due in 2nd Year | Due in 3rd to 5th Year | Due after 5th Year | Total contractual cash flows | ||||||||||||||||||||||||||||||||||||||||||||
| (In millions) | (In millions) | |||||||||||||||||||||||||||||||||||||||||||||||||||||||
Non derivative financial liabilities | ||||||||||||||||||||||||||||||||||||||||||||||||||||||||
Financial liabilities | ||||||||||||||||||||||||||||||||||||||||||||||||||||||||
Accounts payable and acceptances | Rs. | 453,027.6 | Rs. | 453,027.6 | Rs. | — | Rs. | — | Rs. | — | Rs. | 453,027.6 | US$ | 8,345.7 | Rs. | 610,150.9 | Rs. | 610,150.9 | Rs. | — | Rs. | — | Rs. | — | Rs. | 610,150.9 | US$ | 9,762.4 | ||||||||||||||||||||||||||||
Borrowings and interest thereon | 560,785.2 | 261,103.4 | 86,783.1 | 135,009.7 | 221,045.3 | 703,941.5 | 12,967.5 | 735,375.4 | 221,073.5 | 112,882.9 | 320,095.1 | 254,109.5 | 908,161.0 | 14,530.6 | ||||||||||||||||||||||||||||||||||||||||||
Other financial liabilities | 21,932.3 | 17,288.3 | 1,777.8 | 3576.6 | 321.8 | 22,964.5 | 423.0 | 23,618.6 | 19,881.5 | 2,015.5 | 1,589.2 | 807.5 | 24,293.7 | 388.7 | ||||||||||||||||||||||||||||||||||||||||||
Derivative liabilities | 34,384.7 | 17,049.7 | 9,996.2 | 7,338.8 | — | 34,384.7 | 633.4 | 141,679.2 | 69,674.4 | 57,035.3 | 49,453.4 | 129.1 | 176,292.2 | 2,820.7 | ||||||||||||||||||||||||||||||||||||||||||
|
|
|
|
|
|
|
|
|
|
|
|
|
| |||||||||||||||||||||||||||||||||||||||||||
Total | Rs. | 1,070,129.8 | Rs. | 748,469.0 | Rs. | 98,557.1 | Rs. | 145,925.1 | Rs. | 221,367.1 | Rs. | 1,214,318.3 | US$ | 22,369.6 | Rs. | 1,510,824.1 | Rs. | 920,780.3 | Rs. | 171,933.7 | Rs. | 371,137.7 | Rs. | 255,046.1 | Rs. | 1,718,897.8 | US$ | 27,502.4 | ||||||||||||||||||||||||||||
|
|
|
|
|
|
|
|
|
|
|
|
|
| |||||||||||||||||||||||||||||||||||||||||||
Contractual maturitymaturities of borrowings includes cash flows relating to collateralized debt obligation.obligations. This represents the amount received against the transfer of finance receivables in securitization transactions/transactions and/or direct assignments, which do not qualify for derecognition. The liability of the Company in such cases is limited to the extent of credit enhancements provided. The contractual maturitymaturities of such collateralized debt obligation isobligations are as follows:
| Carrying amount | Due in 1st Year | Due in 2nd Year | Due in 3rd to 5th Year | Total contractual cash flows | ||||||||||||||||||||||||
| (In millions) | ||||||||||||||||||||||||||||
Collateralized debt | US$ | |||||||||||||||||||||||||||
For the purpose of compiling the contractual cash flows, it has been assumed that the foreign currency convertible notes will be repaid on maturity. If these are converted, the amount repayable will reduce as follows:
| ||||||||||||||||||||||||
The table below provides details regarding the contractual maturities of financial liabilities, including estimated interest payments as ofat March 31, 2012:2014:
| Carrying amount | Due in 1st Year | Due in 2nd Year | Due in 3rd to 5th Year | Due after 5 Years | Total contractual cash flows | Carrying amount | Due in 1st Year | Due in 2nd Year | Due in 3rd to 5th Year | Due after 5th Year | Total contractual cash flows | |||||||||||||||||||||||||||||||||||||
| (In millions) | (In millions) | |||||||||||||||||||||||||||||||||||||||||||||||
Non derivative financial liabilities | ||||||||||||||||||||||||||||||||||||||||||||||||
Financial liabilities | ||||||||||||||||||||||||||||||||||||||||||||||||
Accounts payable and acceptances | Rs. 375,346.3 | Rs. 375,346.3 | Rs. — | Rs. — | Rs. — | Rs. 375,346.3 | Rs. | 595,817.7 | Rs. | 595,817.7 | Rs. | — | Rs. | — | Rs. | — | Rs. | 595,817.7 | ||||||||||||||||||||||||||||||
Borrowings and interest thereon | 510,559.7 | 244,187.4 | 110,823.0 | 84,233.7 | 193,495.2 | 632,739.3 | 628,411.5 | 195,668.5 | 108,082.5 | 250,009.6 | 220,964.5 | 774,725.1 | ||||||||||||||||||||||||||||||||||||
Other financial Liabilities | 20,559.8 | 15,740.4 | 1,411.3 | 3,695.8 | 849.0 | 21,696.5 | ||||||||||||||||||||||||||||||||||||||||||
Other financial liabilities | 23,862.3 | 20,173.2 | 1,754.2 | 2,444.8 | 112.8 | 24,485.0 | ||||||||||||||||||||||||||||||||||||||||||
Derivative liabilities | 11,774.5 | 9,061.3 | 1,995.8 | 717.4 | — | 11,774.5 | 11,922.3 | 7,067.0 | 4,802.7 | 1,094.9 | — | 12,964.6 | ||||||||||||||||||||||||||||||||||||
|
|
|
|
|
|
|
|
|
|
|
| |||||||||||||||||||||||||||||||||||||
Total | Rs. 918,240.3 | Rs. 644,335.4 | Rs. 114,230.1 | Rs. 88,646.9 | Rs. 194,344.2 | Rs. 1,041,556.6 | Rs. | 1,260,013.8 | Rs. | 818,726.4 | Rs. | 114,639.4 | Rs. | 253,549.3 | Rs. | 221,077.3 | Rs. | 1,407,992.4 | ||||||||||||||||||||||||||||||
|
|
|
|
|
|
|
|
|
|
|
| |||||||||||||||||||||||||||||||||||||
Contractual maturitymaturities of borrowings includes cash flows relating to collateralized debt obligation.obligations. This represents the amount received against the transfer of finance receivables in securitization transactions/transactions and/or direct assignments, which do not qualify for derecognition. The liability of the Company in such cases is limited to the extent of credit enhancements provided. The contractual maturitymaturities of such collateralized debt obligation isobligations are as follows:
| Carrying amount | Due in 1st Year | Due in 2nd Year | Due in 3rd to 5th Year | Total contractual cash flows | ||||||||||||||||
| (In millions) | ||||||||||||||||||||
Collateralized debt obligations | Rs. | 15,413.2 | Rs. | 9,767.8 | Rs. | 5,722.1 | Rs. | 1,149.3 | Rs. | 16,639.2 | ||||||||||
| ||||||||||||||||||||
For the purpose of compiling the contractual cash flows, it has been assumed that the foreign currency convertible notes will be repaid on maturity. If these are converted, the amount repayable will reduce as follows:
| ||||||||||||||||||||
| Derivative financial instruments and risk management |
The Company has entered into variety of interest rate and foreign currency, interest rates and commodity forward contracts and options to manage its exposure to fluctuations in foreign exchange rates, interest rates and interest rates. The counter party is generally a bank.commodity price risk. These financial exposures are managed in accordance with itsthe Company’s risk management policies and procedures.
The Company also enters into interest rate swaps and interest rate currency swap agreements, mainly to manage exposure on its fixed rate or variable rate debt. The Company uses interest rate derivatives or currency swaps to hedge exposure to exchange rate fluctuations on principal and interest payments for borrowings denominated in foreign currencies.
Specific transactional risks include risks like liquidity and pricing risks, interest rate and exchange rate fluctuation risks, volatility risks, counterparty risks, settlement risks and gearing risks.
The Company is also exposed to equity price risk, interest rate risk and currency risk on embedded derivative, i.e., conversion option in foreign currency convertible notes/convertible alternative reference securities which are accounted for separately.
Fair value of derivative financial instruments other than conversion options are determined using valuation techniques based on information derived from observable market data.
Fair value of conversion option in foreign currency convertible notes/convertible alternative reference securities is determined using various option valuation models such as Black Scholes Merton model, Cox Ross Rubinstein model and Monte Carlo simulation. These models consider various inputs, such as stock price as at the date of valuation, strike price of the option as per terms of issue of the instrument, time to expiry, volatility of the underlying share price, risk free interest rate and expected dividend rate.
Main assumptions used in valuation of conversion option in foreign currency convertible notes (FCCN) as of March 31, 2013:
| Assumptions | ||||||||||||
| Share price in foreign currency | Volatility in share price | Risk free interest rate | ||||||||||
FCCN due in 2014 | US$ | 4.96 | 35 | % | 0.6 | % | ||||||
Main assumptions used in valuation of conversion option in foreign currency convertible notes (FCCN)/ convertible alternative reference securities (CARS) as of March 31, 2012:
| Assumptions | ||||||||||||
| Share price in foreign currency | Volatility in share price | Risk free interest rate | ||||||||||
CARS due in 2012 | US$ | 5.41 | 36 | % | 0.5 | % | ||||||
FCCN due in 2014 | US$ | 5.41 | 45 | % | 0.7 | % | ||||||
The fair value of derivative financial instruments including embedded derivative is as follows:
| As of March 31, | ||||||||||||
| 2013 | 2013 | 2012 | ||||||||||
| (In millions) | ||||||||||||
Forward exchange contracts, options and interest rate swaps | US$ | (472.0 | ) | Rs. | (25,621.9 | ) | Rs. | (5,927.1 | ) | |||
Embedded derivative-conversion option | (69.4 | ) | (3,765.5 | ) | (7,540.4 | ) | ||||||
Embedded derivative- prepayment option | 71.1 | 3,857.8 | — | |||||||||
|
|
|
|
|
| |||||||
Total | US$ | (470.3 | ) | Rs. | (25,529.6 | ) | Rs. | (13,467.5 | ) | |||
|
|
|
|
|
| |||||||
| As at March 31, | ||||||||||||
| 2015 | 2015 | 2014 | ||||||||||
| (In millions) | ||||||||||||
Foreign currency forward exchange contracts and options | US$ | (1,895.6 | ) | Rs. | (118,472.2 | ) | Rs. | 68,695.5 | ||||
Commodity Derivatives | (62.2 | ) | (3,890.1 | ) | (1,247.1 | ) | ||||||
Others including interest rate and currency swaps | (0.9 | ) | (57.4 | ) | 188.6 | |||||||
|
|
|
|
|
| |||||||
Total | US$ | (1,958.7 | ) | Rs. | (122,419.7 | ) | Rs. | 67,637.0 | ||||
|
|
|
|
|
| |||||||
The gain/loss due to fluctuation in foreign currency exchange rates on derivative contracts recognized in the income statement was Rs. 2,471.311,419.2 million (loss), Rs. 1,316.416,281.7 million Rs.12,667.3(gain), Rs. 6,028.1 million (loss) for the yearyears ended March 31, 2015, 2014 and 2013, respectively.
The gain/loss on commodity derivative contracts recognized in the income statement was Rs. 3,626.5 million (loss), Rs. 1,797.5 million (loss), Rs. 859.8 million (loss) for the years ended March 31, 2012,2015, 2014 and March 31, 2011,2013, respectively.
In respect of the Company’s foreign currency forward and option contracts, (excluding conversion option and prepayment options), a 10% appreciation/ depreciationdepreciation/appreciation of the foreign currency underlying such contracts, would have resulted in an approximate gain/ loss(loss) of Rs. 2,364.4 million123,345.3 million/(Rs. 136,261.6 million) in the Company’s hedging reserve and an approximate gain / lossgain/(loss) of Rs. 733.9 million16,268.6 million/(Rs. 8,972.4 million) respectively, in the Company’s income statement for the year ended March 31, 2015.
In respect of the Company’s foreign currency forward and option contracts, a 10% depreciation/appreciation of the foreign currency underlying such contracts, would have resulted in an approximate gain/(loss) of Rs. 70,591.0 million/ (Rs. 85,882.5 million) in the Company’s hedging reserve and an approximate gain/(loss) of Rs. 4,904.8 million/ (Rs. 2,981.4 million) respectively, in the Company’s income statement for the year ended March 31, 2014.
In respect of the Company’s foreign currency forward and option contracts a 10% depreciation/appreciation of the foreign currency underlying such contracts, would have resulted in an approximate gain/(loss) of Rs. 52,621.5 million/(Rs. 71,451.7 million) in the Company’s hedging reserve and an approximate gain/(loss) of Rs. 3,009.4 million/(Rs. 2,407.5 million) respectively, in the Company’s income statement for the year ended March 31, 2013.
In respect of the Company’s forward and optioncommodity derivative contracts, (excluding conversion option), a 10% appreciation/ depreciationdepreciation/appreciation of the foreign currencyall commodity prices underlying such contracts, would have resulted in an approximate gain / lossgain/(loss) of Rs. 448.4 million in Company’s hedging reserveRs.5,127.1 million/(Rs.5,127.1 million), an approximate gain/(loss) of Rs.3,462.2 million/ (Rs.3,462.2 million) and an approximate gain / lossgain/(loss) of Rs. 222.2 million respectively, in the Company’s income statementRs.1,461.7 million/ (Rs.1,461.7 million), for the yearyears ended March 31, 2012.
In respect of Company’s forward2015, 2014 and option contracts (excluding conversion option), a 10% appreciation/ depreciation of the foreign currency underlying such contracts would have resulted in an approximate gain of Rs. 212.5 million and an approximate loss of Rs.7.1 million respectively, in the Company’s income statement for the year ended March 31, 20112013 respectively.
Exposure to gain/loss on derivative instruments offset to some extent the exposure to foreign currency risk, interest rate risk as disclosed above.
In respect of embedded derivative, prepayment option:
The Company is exposed to interest rate risk with regards to the fair value of the prepayment option. As at March 31, 2013, a 25 basis points increase / decrease in interest rates would have resulted in an approximate gain / loss of Rs. 771.7 million, for the year ended March 31, 2013.
The Company is exposed to the impact of volatility with its own credit risk with regard to the fair value of prepayment option. As at March 31, 2013, a 25 basis points decrease / increase in credit spreads would have resulted in an approximate gain of Rs. 755.3 million and an approximate loss of Rs. 197.0 million respectively for the year ended March 31, 2013.
In respect of embedded derivative, conversion option:
A 10% increase/decrease in Company’s share price volatility would have resulted in an approximate loss of Rs. 31.2 million and an approximate gain of Rs. 27.7 million respectively, for the year ended March 31, 2013.
A 10% increase/decrease in Company’s share price volatility would have resulted in an approximate loss of Rs. 714.2 million and an approximate gain of Rs. 634.5 million respectively, for the year ended March 31, 2012.
A 10% increase/decrease in Company’s share price volatility would have resulted in an approximate loss of Rs. 1,339.7 million and an approximate gain of Rs. 1,203.2 million respectively, for the year ended March 31, 2011.
A 10% appreciation/depreciation in the underlying foreign currency would have resulted in an approximate gain of Rs. 661.3 million and an approximate loss of Rs. 825.8 million respectively, for the year ended March 31, 2013.
A 10% appreciation/depreciation in the underlying foreign currency would have resulted in an approximate gain of Rs. 1,566.2 million and an approximate loss of Rs. 2,748.3 million respectively, for the year ended March 31, 2012.
A 10% appreciation/depreciation in the underlying foreign currency would have resulted in an approximate gain of Rs. 2,052.6 million and an approximate loss of Rs. 2,783.0 million respectively, for the year ended March 31, 2011.
A 50 basis points increase/decrease in US interest rates would have resulted in an approximate loss of Rs. 27.6 million and an approximate gain of Rs. 27.8 million respectively, for the year ended March 31, 2013.
A 50 basis points increase/decrease in US interest rates would have resulted in an approximate loss of Rs. 73.5 million and an approximate gain of Rs. 73.5 million respectively, for the year ended March 31, 2012.
A 50 basis points increase/decrease in US interest rates would have resulted in an approximate loss of Rs. 137.4 million and an approximate gain of Rs. 136.0 million respectively, for the year ended March 31, 2011.
The above analysis assumes that all other variables (other than variable under consideration) remain constant.
(Note: The impact is indicated on the income/loss before tax basis).
| Collaterals |
Inventory, trade receivables, finance receivables, other financial assets, property, plant and equipment with a carrying amountsamount of Rs. 298,914.0210,565.9 million and Rs.248,597.8Rs. 239,650.1 million are pledged as collateral/security against the borrowings and contingent liability as ofat March 31, 20132015 and March 31, 2012,2014, respectively.
Fair value of collaterals forover which the Company has taken possession and held as ofat March 31, 20132015 and March 31, 2012,2014, amounted to Rs.1,659.0Rs. 3,569.5 million and 566.0Rs. 1,563.0 million, respectively. The collateral represents vehicles financed by the Company and the Company normally undertakes disposal of these vehicles through an auction process.
| Segment reporting |
Tata MotorsThe Company primarily operates in the Automotive segment. The Automotive segment includes all activities relating to development, design, manufacture, assembly and sale of vehicles including financing thereof, as well as sale of related parts and accessories. The Company provides financing for vehicles sold by dealers in India. The vehicle financing is intended to drive sale of vehicles by providing financing to the dealers’ customers and as such, is an integral part of automotive business. The financing activity is assessed as an integral part of the overall automotive business. The operating results of the financing activity does not include all of the interest or cost of funds employed for the purposes of financing, and therefore the operating results of this activity is not used to make decisions about resources to be allocated or to assess performance.
The Company’s products mainly include Tata and other brand vehicles and Jaguar and Land Rover vehicles.
The Company is in the process of managingmanages the automotive business globally with an integrated and synergic strategy.
Towards this objective, various steps have been initiated/being taken which mainly include sharing of resources, platforms, facilities for product development and manufacturing, sourcing strategy and mutual sharing of best practices.
As of March 31, 2013,2015, the Automotive segment is bifurcated into the following two reportable segments.-segments:
Tata and other brand vehicles, including financing thereof and Jaguar Land Rover.
The Company’s other segment comprises primarily activities relating to information technology or IT services, machine tools and factory automation solutions. None of the other operating segments meets the quantitative thresholds, specified in IFRS 8, and accordingly, have been aggregated.to be separately disclosed as a reportable segment.
The segment information presented is in accordance with the accounting policies adopted for preparing the consolidated financial statements of the Company. Segment revenues, expenses and results include transfer between segments.inter-segment transfers. Such transfers are undertaken either at competitive market prices charged to unaffiliated customers for similar goods or at contracted rates. These transfers are eliminated on consolidation.
| For the year ended / as of March 31, 2013 | For the year ended/as at March 31, 2015 | |||||||||||||||||||||||||||||||||||||||||||||||||||||||||||||||
| Automotive and related activity | Others | Automotive and related activity | ||||||||||||||||||||||||||||||||||||||||||||||||||||||||||||||
| * Tata and other brand vehicles including financing thereof | Jaguar Land Rover | Intra-segment eliminations | Total | Others | Inter-segment eliminations | Total | Total | Tata and other brand vehicles (including financing thereof) * | Jaguar Land Rover | Intra-segment eliminations | Total | Others | Inter-segment eliminations | Total | ||||||||||||||||||||||||||||||||||||||||||||||||||
| (In millions) | (In millions) | |||||||||||||||||||||||||||||||||||||||||||||||||||||||||||||||
Revenues | ||||||||||||||||||||||||||||||||||||||||||||||||||||||||||||||||
Revenues: | ||||||||||||||||||||||||||||||||||||||||||||||||||||||||||||||||
External revenue | Rs. | 512,942.9 | Rs. | 1,365,619.8 | Rs. | — | Rs. | 1,878,562.7 | Rs. | 11,297.6 | Rs. | — | Rs. | 1,889,860.3 | US$ | 34,813.7 | Rs. | 446,636.4 | Rs. | 2,165,673.1 | Rs. | — | Rs. | 2,612,309.5 | Rs. | 12,955.7 | Rs. | — | Rs. | 2,625,265.2 | US$ | 42,004.3 | ||||||||||||||||||||||||||||||||
Inter-segment / intra-segment revenue | 874.1 | — | (865.9 | ) | 8.2 | 10,881.2 | (10,889.4 | ) | — | — | ||||||||||||||||||||||||||||||||||||||||||||||||||||||
Inter-segment/intra-segment revenue | 581.5 | — | (588.1 | ) | (6.6 | ) | 14,196.5 | (14,189.9 | ) | — | — | |||||||||||||||||||||||||||||||||||||||||||||||||||||
|
|
|
|
|
|
|
|
|
|
|
|
|
|
|
| |||||||||||||||||||||||||||||||||||||||||||||||||
Total revenues | Rs. | 513,817.0 | Rs. | 1,365,619.8 | Rs. | (865.9 | ) | Rs. | 1,878,570.9 | Rs. | 22,178.8 | Rs. | (10,889.4 | ) | Rs. | 1,889,860.3 | US$ | 34,813.7 | Rs. | 447,217.9 | Rs. | 2,165,673.1 | Rs. | (588.1 | ) | Rs. | 2,612,302.9 | Rs. | 27,152.2 | Rs. | (14,189.9 | ) | Rs. | 2,625,265.2 | US$ | 42,004.3 | ||||||||||||||||||||||||||||
|
|
|
|
|
|
|
|
|
|
|
|
|
|
|
| |||||||||||||||||||||||||||||||||||||||||||||||||
Earnings before other income, interest and tax | 10,700.7 | 150,687.2 | — | 161,387.9 | 3,294.1 | (1,033.8 | ) | 163,648.2 | 3,014.6 | (29,831.3 | ) | 274,382.1 | — | 244,550.8 | 3,447.5 | (1,377.9 | ) | 246,620.4 | 3,946.1 | |||||||||||||||||||||||||||||||||||||||||||||
Share of profit/ (loss) of equity accounted investees | 3,461.4 | (1,016.4 | ) | — | 2,445.0 | (711.5 | ) | — | 1,733.5 | 31.9 | ||||||||||||||||||||||||||||||||||||||||||||||||||||||
Share of profit/(loss) of equity accounted investees (net) | 135.3 | (1,122.9 | ) | — | (987.6 | ) | (760.7 | ) | — | (1,748.3 | ) | (28.0 | ) | |||||||||||||||||||||||||||||||||||||||||||||||||||
Reconciliation to net income: | ||||||||||||||||||||||||||||||||||||||||||||||||||||||||||||||||
Other income / (loss) (net) | 12,024.0 | 221.5 | ||||||||||||||||||||||||||||||||||||||||||||||||||||||||||||||
Foreign exchange gain/ (loss) (net) | (15,640.0 | ) | (288.1 | ) | ||||||||||||||||||||||||||||||||||||||||||||||||||||||||||||
Other income/(loss) (net) | 11,508.4 | 184.1 | ||||||||||||||||||||||||||||||||||||||||||||||||||||||||||||||
Foreign exchange gain/(loss) (net) | (12,680.7 | ) | (202.9 | ) | ||||||||||||||||||||||||||||||||||||||||||||||||||||||||||||
Interest income | 7,759.8 | 142.9 | 6,763.9 | 108.2 | ||||||||||||||||||||||||||||||||||||||||||||||||||||||||||||
Interest expense (net) | (40,751.8 | ) | (750.7 | ) | (52,231.6 | ) | (835.8 | ) | ||||||||||||||||||||||||||||||||||||||||||||||||||||||||
Income tax expense | (39,190.5 | ) | (721.9 | ) | (69,149.7 | ) | (1,106.4 | ) | ||||||||||||||||||||||||||||||||||||||||||||||||||||||||
|
|
|
| |||||||||||||||||||||||||||||||||||||||||||||||||||||||||||||
Net Income | Rs. | 89,583.2 | US$ | 1,650.2 | Rs. | 129,082.4 | US$ | 2,065.3 | ||||||||||||||||||||||||||||||||||||||||||||||||||||||||
|
|
|
| |||||||||||||||||||||||||||||||||||||||||||||||||||||||||||||
Depreciation and amortization | Rs. | 30,871.3 | Rs. | 103,040.3 | Rs. | — | Rs. | 133,911.6 | Rs. | 584.2 | Rs. | — | Rs. | 134,495.8 | US$ | 2,151.9 | ||||||||||||||||||||||||||||||||||||||||||||||||
Capital expenditure | 34,416.2 | 302,087.8 | — | 336,504.0 | 737.1 | (1,470.1 | ) | 335,771.0 | 5,372.3 | |||||||||||||||||||||||||||||||||||||||||||||||||||||||
|
|
|
|
|
|
|
| |||||||||||||||||||||||||||||||||||||||||||||||||||||||||
Segment assets | Rs. | 558,623.8 | Rs. | 1,402,756.6 | Rs. | — | Rs. | 1,961,380.4 | Rs. | 20,056.4 | Rs. | (10,869.9 | ) | Rs. | 1,970,566.9 | US$ | 31,529.1 | |||||||||||||||||||||||||||||||||||||||||||||||
Investment in equity accounted investees | 3,670.9 | 26,029.9 | 29,700.8 | 2,035.8 | 31,736.6 | 507.8 | ||||||||||||||||||||||||||||||||||||||||||||||||||||||||||
Reconciliation to total assets: | ||||||||||||||||||||||||||||||||||||||||||||||||||||||||||||||||
Investments | 146,823.6 | 2,349.2 | ||||||||||||||||||||||||||||||||||||||||||||||||||||||||||||||
Current and non-current income tax assets | 11,260.7 | 180.2 | ||||||||||||||||||||||||||||||||||||||||||||||||||||||||||||||
Deferred income taxes | 40,478.8 | 647.7 | ||||||||||||||||||||||||||||||||||||||||||||||||||||||||||||||
Other unallocated financial assets1 | 144,776.8 | 2,316.3 | ||||||||||||||||||||||||||||||||||||||||||||||||||||||||||||||
|
| |||||||||||||||||||||||||||||||||||||||||||||||||||||||||||||||
Total assets | Rs. | 2,345,643.4 | US$ | 37,530.3 | ||||||||||||||||||||||||||||||||||||||||||||||||||||||||||||
|
| |||||||||||||||||||||||||||||||||||||||||||||||||||||||||||||||
Segment liabilities | Rs. | 139,351.1 | Rs. | 750,707.3 | Rs. | — | Rs. | 890,058.4 | Rs. | 6,308.7 | Rs. | (2,808.9 | ) | Rs. | 893,558.2 | US$ | 14,296.9 | |||||||||||||||||||||||||||||||||||||||||||||||
Reconciliation to total liabilities: | ||||||||||||||||||||||||||||||||||||||||||||||||||||||||||||||||
Borrowings | 725,327.9 | 11,605.2 | ||||||||||||||||||||||||||||||||||||||||||||||||||||||||||||||
Current income tax liabilities | 8,241.5 | 131.9 | ||||||||||||||||||||||||||||||||||||||||||||||||||||||||||||||
Deferred income taxes | 23,466.8 | 375.5 | ||||||||||||||||||||||||||||||||||||||||||||||||||||||||||||||
Other unallocated financial liabilities2 | 155,697.2 | 2,491.2 | ||||||||||||||||||||||||||||||||||||||||||||||||||||||||||||||
|
| |||||||||||||||||||||||||||||||||||||||||||||||||||||||||||||||
Total liabilities | Rs. | 1,806,291.6 | US$ | 28,900.7 | ||||||||||||||||||||||||||||||||||||||||||||||||||||||||||||
|
| |||||||||||||||||||||||||||||||||||||||||||||||||||||||||||||||
| * | Tata and other brand vehicles include Tata Daewoo and Fiat |
Depreciation and amortization Capital expenditure Segment assets Investment in equity accounted investees Reconciliation to total assets: Investments Current and non-current income tax assets Deferred income taxes Other unallocated financial assets1 Total assets Segment liabilities Reconciliation to total liabilities: Borrowings Current income tax liabilities Deferred income taxes Other unallocated financial liabilities2 Total liabilities For the year ended / as of March 31, 2013 Automotive and related activity Others * Tata and other
brand
vehicles
including
financing thereof Jaguar
Land Rover Intra-segment
eliminations Total Others Inter-segment
eliminations Total Total (In millions) Rs. 20,536.2 Rs. 53,040.5 Rs. — Rs. 73,576.7 Rs. 146.5 Rs. — Rs. 73,723.2 US$ 1,358.1 30,384.7 181,313.2 (9.4 ) 211,688.5 375.5 (1,107.6 ) 210,956.4 3,886.1 542,544.0 853,814.1 — 1,396,358.1 15,475.4 (6,446.9 ) 1,405,386.6 25,889.0 13,170.8 4,959.9 — 18,130.7 12,261.0 — 30,391.7 559.9 81,473.4 1,500.8 9,062.4 167.0 45,205.2 832.7 97,176.1 1,790.4 Rs. 1,668,695.4 US$ 30,739.8 Rs. 130,797.4 Rs. 523,970.2 Rs. — Rs. 654,767.6 Rs. 6,613.4 Rs. (1,650.8 ) Rs. 659,730.2 US$ 12,153.1 556,814.4 10,257.2 17,754.5 327.1 15,668.1 288.5 44,822.5 826.0 Rs. 1,294,789.7 US$ 23,851.9
| 1. | Includes |
| 2. | Includes interest accrued and other interest bearing liabilities. |
| For the year ended / as of March 31, 2012 | For the year ended/as at March 31, 2014 | |||||||||||||||||||||||||||||||||||||||||||||||||||||||
| Automotive and related activity | Others | Automotive and related activity | ||||||||||||||||||||||||||||||||||||||||||||||||||||||
| * Tata and other brand vehicles including financing thereof | Jaguar Land Rover | Intra-segment eliminations | Total | Others | Inter-segment eliminations | Total | Tata and other brand vehicles (including financing thereof) * | Jaguar Land Rover | Intra-segment eliminations | Total | Others | Inter-segment eliminations | Total | |||||||||||||||||||||||||||||||||||||||||||
| (In millions) | (In millions) | |||||||||||||||||||||||||||||||||||||||||||||||||||||||
Revenues | ||||||||||||||||||||||||||||||||||||||||||||||||||||||||
Revenues: | ||||||||||||||||||||||||||||||||||||||||||||||||||||||||
External revenue | Rs. | 610,356.9 | Rs. | 1,044,533.2 | Rs. | — | Rs. | 1,654,890.1 | Rs. | 9,962.8 | Rs. | — | Rs. | 1,664,852.9 | Rs. | 434,922.1 | Rs. | 1,894,589.8 | Rs. | — | Rs. | 2,329,511.9 | Rs. | 12,248.6 | Rs. | — | Rs. | 2,341,760.5 | ||||||||||||||||||||||||||||
Inter-segment / intra-segment revenue | 691.5 | — | (678.9 | ) | 12.6 | 8,941.9 | (8,954.5 | ) | — | |||||||||||||||||||||||||||||||||||||||||||||||
Inter-segment/intra-segment revenue | 89.6 | — | (20.0 | ) | 69.6 | 12,740.2 | (12,809.8 | ) | — | |||||||||||||||||||||||||||||||||||||||||||||||
|
|
|
|
|
|
|
|
|
|
|
|
|
| |||||||||||||||||||||||||||||||||||||||||||
Total revenues | Rs. | 611,048.4 | Rs. | 1,044,533.2 | Rs. | (678.9 | ) | Rs. | 1,654,902.7 | Rs. | 18,904.7 | Rs. | (8,954.5 | ) | Rs. | 1,664,852.9 | Rs. | 435,011.7 | Rs. | 1,894,589.8 | Rs. | (20.0 | ) | Rs. | 2,329,581.5 | Rs. | 24,988.8 | Rs. | (12,809.8 | ) | Rs. | 2,341,760.5 | ||||||||||||||||||||||||
|
|
|
|
|
|
|
|
|
|
|
|
|
| |||||||||||||||||||||||||||||||||||||||||||
Earnings before other income, interest and tax | 40,884.0 | 118,894.6 | — | 159,778.6 | 2,442.8 | (1,131.1 | ) | 161,090.3 | (20,630.6 | ) | 228,026.6 | — | 207,396.0 | 2,633.9 | (1,112.3 | ) | 208,917.6 | |||||||||||||||||||||||||||||||||||||||
Share of profit/ (loss) of equity accounted investees | 606.7 | — | — | 606.7 | (957.8 | ) | — | (351.1 | ) | |||||||||||||||||||||||||||||||||||||||||||||||
Impairment in respect of equity accounted investees | — | — | — | — | (4,981.0 | ) | — | (4,981.0 | ) | |||||||||||||||||||||||||||||||||||||||||||||||
Share of profit/(loss) of equity accounted investees (net) | 211.6 | (727.7 | ) | — | (516.1 | ) | (1,361.5 | ) | — | (1,877.6 | ) | |||||||||||||||||||||||||||||||||||||||||||||
Impairment in respect of an equity accounted investee | — | — | — | — | (8,033.7 | ) | — | (8,033.7 | ) | |||||||||||||||||||||||||||||||||||||||||||||||
Reconciliation to net income: | ||||||||||||||||||||||||||||||||||||||||||||||||||||||||
Other income/ (loss) (net) | 9,407.1 | |||||||||||||||||||||||||||||||||||||||||||||||||||||||
Foreign exchange gain/ (loss) (net) | (11,154.2 | ) | ||||||||||||||||||||||||||||||||||||||||||||||||||||||
Other income/(loss) (net) | 7,732.6 | |||||||||||||||||||||||||||||||||||||||||||||||||||||||
Foreign exchange gain/(loss) (net) | 19,104.2 | |||||||||||||||||||||||||||||||||||||||||||||||||||||||
Interest income | 5,426.8 | 6,656.7 | ||||||||||||||||||||||||||||||||||||||||||||||||||||||
Interest expense (net) | (38,290.4 | ) | (53,094.7 | ) | ||||||||||||||||||||||||||||||||||||||||||||||||||||
Income tax expense | (4,707.1 | ) | (48,226.5 | ) | ||||||||||||||||||||||||||||||||||||||||||||||||||||
|
| |||||||||||||||||||||||||||||||||||||||||||||||||||||||
Net Income | Rs. | 116,440.4 | Rs. | 131,178.6 | ||||||||||||||||||||||||||||||||||||||||||||||||||||
|
| |||||||||||||||||||||||||||||||||||||||||||||||||||||||
Depreciation and amortization | Rs. | 25,046.5 | Rs. | 84,941.8 | Rs. | — | Rs. | 109,988.3 | Rs. | 474.3 | Rs. | — | Rs. | 110,462.6 | ||||||||||||||||||||||||||||||||||||||||||
Capital expenditure | 37,806.0 | 235,384.1 | — | 273,190.1 | 819.6 | (1,177.7 | ) | 272,832.0 | ||||||||||||||||||||||||||||||||||||||||||||||||
|
|
|
|
|
|
| ||||||||||||||||||||||||||||||||||||||||||||||||||
Segment assets | Rs. | 563,864.4 | Rs. | 1,223,005.6 | Rs. | — | Rs. | 1,786,870.0 | Rs. | 19,086.6 | Rs. | (7,937.1 | ) | Rs. | 1,798,019.5 | |||||||||||||||||||||||||||||||||||||||||
Investment in equity accounted investees | 3,690.6 | 13,848.9 | — | 17,539.5 | 2,697.2 | — | 20,236.7 | |||||||||||||||||||||||||||||||||||||||||||||||||
Reconciliation to total assets: | ||||||||||||||||||||||||||||||||||||||||||||||||||||||||
Investments | 101,876.8 | |||||||||||||||||||||||||||||||||||||||||||||||||||||||
Current and non-current income tax assets | 11,978.5 | |||||||||||||||||||||||||||||||||||||||||||||||||||||||
Deferred income taxes | 39,150.5 | |||||||||||||||||||||||||||||||||||||||||||||||||||||||
Other unallocated financial assets1 | 213,513.9 | |||||||||||||||||||||||||||||||||||||||||||||||||||||||
| ||||||||||||||||||||||||||||||||||||||||||||||||||||||||
Total assets | Rs. | 2,184,775.9 | ||||||||||||||||||||||||||||||||||||||||||||||||||||||
| ||||||||||||||||||||||||||||||||||||||||||||||||||||||||
Segment liabilities | Rs. | 146,968.7 | Rs. | 706,413.2 | Rs. | — | Rs. | 853,381.9 | Rs. | 6,874.1 | Rs. | (1,961.8 | ) | Rs. | 858,294.2 | |||||||||||||||||||||||||||||||||||||||||
Reconciliation to total liabilities: | ||||||||||||||||||||||||||||||||||||||||||||||||||||||||
Borrowings | 620,099.2 | |||||||||||||||||||||||||||||||||||||||||||||||||||||||
Current income tax liabilities | 13,986.7 | |||||||||||||||||||||||||||||||||||||||||||||||||||||||
Deferred income taxes | 35,271.8 | |||||||||||||||||||||||||||||||||||||||||||||||||||||||
Other unallocated financial liabilities2 | 25,427.7 | |||||||||||||||||||||||||||||||||||||||||||||||||||||||
| ||||||||||||||||||||||||||||||||||||||||||||||||||||||||
Total liabilities | Rs. | 1,553,079.6 | ||||||||||||||||||||||||||||||||||||||||||||||||||||||
| ||||||||||||||||||||||||||||||||||||||||||||||||||||||||
| * | Tata and other brand vehicles include Tata Daewoo and Fiat |
Depreciation and amortization Capital expenditure Segment assets Investment in equity accounted investees Reconciliation to total assets: Investments Current and non-current income tax assets Deferred income taxes Other unallocated financial assets1 Total assets Segment liabilities Reconciliation to total liabilities: Borrowings Current income tax liabilities Deferred income taxes Other unallocated financial liabilities2 Total liabilities For the year ended / as of March 31, 2012 Automotive and related activity Others * Tata and other
brand
vehicles
including
financing thereof Jaguar
Land Rover Intra-segment
eliminations Total Others Inter-segment
eliminations Total (In millions) Rs. 18,751.6 Rs. 35,576.9 Rs. — Rs. 54,328.5 Rs. 106.6 Rs. — Rs. 54,435.1 35,062.7 113,242.5 — 148,305.2 55.7 (1,197.0 ) 147,163.9 516,734.0 707,109.6 (400.9 ) 1,223,442.7 14,021.4 (5,803.9 ) 1,231,660.2 10,241.1 39.1 — 10,280.2 12,985.7 — 23,265.9 82,569.0 9,437.2 46,493.9 41,110.0 Rs. 1,434,536.2 Rs. 134,583.6 Rs. 406,813.6 Rs. (400.9 ) Rs. 540,996.3 Rs. 5,013.8 Rs. (1,510.6 ) Rs. 544,499.5 508,123.2 11,501.5 17,704.8 21,363.6 Rs. 1,103,192.6
| Includes |
| Includes interest accrued and other interest bearing liabilities. |
| For the year ended / as of March 31, 2011 | For the year ended March 31, 2013 | |||||||||||||||||||||||||||||||||||||||||||||||||||||||
| Automotive and related activity | Others | Automotive and related activity | ||||||||||||||||||||||||||||||||||||||||||||||||||||||
| * Tata and other brand vehicles including financing thereof | Jaguar Land Rover | Intra-segment eliminations | Total | Others | Inter-segment eliminations | Total | Tata and other brand vehicles (including financing thereof) * | Jaguar Land Rover | Intra-segment eliminations | Total | Others | Inter-segment eliminations | Total | |||||||||||||||||||||||||||||||||||||||||||
| (In millions) | (In millions) | |||||||||||||||||||||||||||||||||||||||||||||||||||||||
Revenues | ||||||||||||||||||||||||||||||||||||||||||||||||||||||||
Revenues: | ||||||||||||||||||||||||||||||||||||||||||||||||||||||||
External revenue | Rs. | 526,550.0 | Rs. | 696,987.7 | Rs. | — | Rs. | 1,223,537.7 | Rs. | 8,596.4 | Rs. | — | Rs. | 1,232,134.1 | Rs. | 515,992.6 | Rs. | 1,365,619.8 | Rs. | — | Rs. | 1,881,612.4 | Rs. | 11,297.6 | Rs. | — | Rs. | 1,892,910.0 | ||||||||||||||||||||||||||||
Inter-segment / intra-segment revenue | 297.1 | 2,766.2 | (3,054.0 | ) | 9.3 | 6,319.5 | (6,328.8 | ) | — | |||||||||||||||||||||||||||||||||||||||||||||||
Inter-segment/intra-segment revenue | 874.1 | — | (865.9 | ) | 8.2 | 10,881.2 | (10,889.4 | ) | — | |||||||||||||||||||||||||||||||||||||||||||||||
|
|
|
|
|
|
|
|
|
|
|
|
|
| |||||||||||||||||||||||||||||||||||||||||||
Total revenues | Rs. | 526,847.1 | Rs. | 699,753.9 | Rs. | (3,054.0 | ) | Rs. | 1,223,547.0 | Rs. | 14,915.9 | Rs. | (6,328.8 | ) | Rs. | 1,232,134.1 | Rs. | 516,866.7 | Rs. | 1,365,619.8 | Rs. | (865.9 | ) | Rs. | 1,881,620.6 | Rs. | 22,178.8 | Rs. | (10,889.4 | ) | Rs. | 1,892,910.0 | ||||||||||||||||||||||||
|
|
|
|
|
|
|
|
|
|
|
|
|
| |||||||||||||||||||||||||||||||||||||||||||
Earnings before other income, interest and tax | 48,916.4 | 75,672.9 | (170.6 | ) | 124,418.7 | 1,486.6 | (598.9 | ) | 125,306.4 | 13,553.7 | 150,652.8 | — | 164,206.5 | 3,294.1 | (1,033.8 | ) | 166,466.8 | |||||||||||||||||||||||||||||||||||||||
Share of profit/ (loss) of equity accounted investees | (318.2 | ) | — | — | (318.2 | ) | (140.2 | ) | — | (458.4 | ) | |||||||||||||||||||||||||||||||||||||||||||||
Share of profit/(loss) of equity accounted investees (net) | 1,596.4 | (1,016.4 | ) | — | 580.0 | (711.5 | ) | — | (131.5 | ) | ||||||||||||||||||||||||||||||||||||||||||||||
Reconciliation to net income: | ||||||||||||||||||||||||||||||||||||||||||||||||||||||||
Other income/ (loss) (net) | (8,218.0 | ) | ||||||||||||||||||||||||||||||||||||||||||||||||||||||
Foreign exchange gain/ (loss) (net) | 3,090.0 | |||||||||||||||||||||||||||||||||||||||||||||||||||||||
Other income /(loss) (net) | 12,099.1 | |||||||||||||||||||||||||||||||||||||||||||||||||||||||
Foreign exchange gain/(loss) (net) | (15,774.9 | ) | ||||||||||||||||||||||||||||||||||||||||||||||||||||||
Interest income | 3,669.5 | 6,928.0 | ||||||||||||||||||||||||||||||||||||||||||||||||||||||
Interest expense (net) | (36,853.5 | ) | (40,792.0 | ) | ||||||||||||||||||||||||||||||||||||||||||||||||||||
Income tax expense | (12,787.3 | ) | (39,238.8 | ) | ||||||||||||||||||||||||||||||||||||||||||||||||||||
|
| |||||||||||||||||||||||||||||||||||||||||||||||||||||||
Net Income | Rs. | 73,748.7 | Rs. | 89,556.7 | ||||||||||||||||||||||||||||||||||||||||||||||||||||
|
| |||||||||||||||||||||||||||||||||||||||||||||||||||||||
Depreciation and amortization | Rs. | 22,580.9 | Rs. | 53,040.5 | Rs. | — | Rs. | 75,621.4 | Rs. | 146.5 | Rs. | — | Rs. | 75,767.9 | ||||||||||||||||||||||||||||||||||||||||||
Capital expenditure | 31,506.2 | 181,313.2 | (9.4 | ) | 212,810.0 | 375.5 | (1,107.6 | ) | 212,077.9 | |||||||||||||||||||||||||||||||||||||||||||||||
|
|
|
|
|
|
| ||||||||||||||||||||||||||||||||||||||||||||||||||
| * | Tata and other brand vehicles include Tata Daewoo and Fiat |
| For the year ended / as of March 31, 2011 | ||||||||||||||||||||||||||||
| Automotive and related activity | Others | |||||||||||||||||||||||||||
| * Tata and other brand vehicles including financing thereof | Jaguar Land Rover | Intra-segment eliminations | Total | Others | Inter-segment eliminations | Total | ||||||||||||||||||||||
| (In millions) | ||||||||||||||||||||||||||||
Depreciation and amortization | Rs. | 15,074.0 | Rs. | 28,173.8 | Rs. | — | Rs. | 43,247.8 | Rs. | 197.9 | Rs. | — | Rs. | 43,445.7 | ||||||||||||||
Capital expenditure | 27,412.5 | 63,608.6 | — | 91,021.1 | 359.3 | (661.9 | ) | 90,718.5 | ||||||||||||||||||||
Entity wideEntity-wide disclosures
Information concerning principal geographic areas is as follows:
Net sales to external customers by geographic area by location of customers:
| Year ended March 31, | Year ended March 31, | |||||||||||||||||||||||||||||||||||||||||||||||
| 2013 | 2013 | 2012 | 2011 | 2015 | 2015 | 2014 | 2013 | |||||||||||||||||||||||||||||||||||||||||
| (In millions) | (In millions) | |||||||||||||||||||||||||||||||||||||||||||||||
India | US$ | 8,320.0 | Rs. | 451,652.0 | Rs. | 552,512.9 | Rs. | 464,676.1 | US$ | 5,779.3 | Rs. | 361,206.0 | Rs. | 364,590.6 | Rs. | 453,275.6 | ||||||||||||||||||||||||||||||||
United States of America | 3,481.7 | 189,006.6 | 157,854.7 | 147,427.9 | 5,024.1 | 314,008.8 | 266,436.5 | 189,006.6 | ||||||||||||||||||||||||||||||||||||||||
United Kingdom | 4,137.5 | 224,604.0 | 179,865.6 | 136,905.6 | 5,624.4 | 351,527.1 | 290,161.9 | 224,604.0 | ||||||||||||||||||||||||||||||||||||||||
Rest of Europe | 4,061.7 | 220,488.8 | 190,056.5 | 150,147.9 | 5,076.8 | 317,302.7 | 292,377.8 | 221,035.4 | ||||||||||||||||||||||||||||||||||||||||
China | 8,209.4 | 445,644.7 | 296,923.2 | 116,459.1 | 12,129.4 | 758,085.1 | 656,138.0 | 446,508.4 | ||||||||||||||||||||||||||||||||||||||||
Rest of the World | 6,603.4 | 358,464.2 | 287,640.0 | 216,517.5 | 8,370.3 | 523,135.5 | 472,055.7 | 358,480.0 | ||||||||||||||||||||||||||||||||||||||||
|
|
|
|
|
|
|
|
|
|
|
| |||||||||||||||||||||||||||||||||||||
Total | US$ | 34,813.7 | Rs. | 1,889,860.3 | Rs. | 1,664,852.9 | Rs. | 1,232,134.1 | ||||||||||||||||||||||||||||||||||||||||
Total revenues | US$ | 42,004.3 | Rs. | 2,625,265.2 | Rs. | 2,341,760.5 | Rs. | 1,892,910.0 | ||||||||||||||||||||||||||||||||||||||||
|
|
|
|
|
|
|
| |||||||||||||||||||||||||||||||||||||||||
Non-current assets (Property, plant and equipment, Intangible assets, other non-current assets and Goodwill) by geographic area:
| Year ended March 31, | ||||||||||||
| 2013 | 2013 | 2012 | ||||||||||
| (In millions) | ||||||||||||
India | US$ | 3,785.7 | Rs. | 205,506.5 | Rs. | 194,802.0 | ||||||
United States of America | 97.2 | 5,274.4 | 1,133.2 | |||||||||
United Kingdom | 8,780.2 | 476,632.8 | 357,018.1 | |||||||||
Rest of Europe | 26.1 | 1,417.4 | 2,650.5 | |||||||||
China | 6.7 | 361.2 | 1,532.6 | |||||||||
Rest of the World | 256.2 | 13,909.9 | 13,072.2 | |||||||||
|
|
|
|
|
| |||||||
Total | US$ | 12,952.1 | Rs. | 703,102.2 | Rs. | 570,208.6 | ||||||
|
|
|
|
|
| |||||||
India United States of America United Kingdom Rest of Europe China Rest of the World Total As at March 31, 2015 2015 2014 (In millions) US$ 3,779.6 Rs. 236,222.2 Rs. 236,588.0 54.1 3,381.0 3,013.5 13,853.0 865,811.9 732,920.0 19.3 1,206.1 1,568.7 16.3 1,017.1 796.3 294.9 18,436.3 20,228.6 US$ 18,017.2 Rs. 1,126,074.6 Rs. 995,115.1
Information about product revenues:
| Year ended March 31, | Year ended March 31, | |||||||||||||||||||||||||||||||||||||||||||||||
| 2013 | 2013 | 2012 | 2011 | 2015 | 2015 | 2014 | 2013 | |||||||||||||||||||||||||||||||||||||||||
| (In millions) | (In millions) | |||||||||||||||||||||||||||||||||||||||||||||||
Tata and Fiat vehicles | US$ | 8,148.5 | Rs. | 442,343.1 | Rs. | 552,261.2 | Rs. | 468,554.8 | US$ | 5,888.6 | Rs. | 368,038.2 | Rs. | 356,514.0 | Rs. | 445,392.8 | ||||||||||||||||||||||||||||||||
Tata Daewoo commercial vehicles | 722.2 | 39,204.1 | 31,648.4 | 28,181.4 | 880.2 | 55,015.5 | 47,532.3 | 39,204.1 | ||||||||||||||||||||||||||||||||||||||||
Hispano buses and coaches | 25.2 | 1,365.7 | 2,164.4 | 2,260.5 | 15.2 | 951.9 | 999.9 | 1,365.7 | ||||||||||||||||||||||||||||||||||||||||
Finance revenues | 552.9 | 30,013.3 | 24,340.4 | 22,231.5 | 362.1 | 22,630.8 | 29,875.9 | 30,013.3 | ||||||||||||||||||||||||||||||||||||||||
Jaguar Land Rover vehicles | 25,156.5 | 1,365,619.8 | 1,044,533.2 | 702,315.4 | 34,650.8 | 2,165,673.1 | 1,894,589.8 | 1,365,619.8 | ||||||||||||||||||||||||||||||||||||||||
Others | 208.4 | 11,314.3 | 9,905.3 | 8,590.5 | 207.4 | 12,955.7 | 12,248.6 | 11,314.3 | ||||||||||||||||||||||||||||||||||||||||
|
|
|
|
|
|
|
|
|
|
|
| |||||||||||||||||||||||||||||||||||||
Total revenues | US$ | 34,813.7 | Rs. | 1,889,860.3 | Rs. | 1,664,852.9 | Rs. | 1,232,134.1 | US$ | 42,004.3 | Rs. | 2,625,265.2 | Rs. | 2,341,760.5 | Rs. | 1,892,910.0 | ||||||||||||||||||||||||||||||||
|
|
|
|
|
|
|
|
|
|
|
| |||||||||||||||||||||||||||||||||||||
The Company’s related parties principally consist of Tata Sons Ltd.,Limited, subsidiaries and joint ventures of Tata Sons Ltd,Limited, the Company’s associates and their subsidiaries, joint operations and joint ventures of the Company. The Company routinely enters into transactions with these related parties in the ordinary course of business. The Company enters into transactions for sale and purchase of products and services with its associates, joint operations and joint ventures. Transactions and balances with its own subsidiaries are eliminated on consolidation.
The following table summarizes related partyrelated-party transactions and balances included in the consolidated financial statements for the year ended /and as ofat March 31, 2013:2015:
| With associates and its subsidiaries | With joint ventures | Tata Sons Ltd, its subsidiaries and joint ventures | Total | Total | Associates and its subsidiaries | Joint ventures | Joint operations | Tata Sons Ltd, its subsidiaries and joint ventures | Total | Total | ||||||||||||||||||||||||||||||||||||||||||||||||||||||||||
| (In millions) | (In millions) | |||||||||||||||||||||||||||||||||||||||||||||||||||||||||||||||||||
Purchase of products | Rs. | 49,205.8 | Rs. | 29,263.6 | Rs. | 1,354.4 | Rs. | 79,823.8 | US$ | 1,470.5 | Rs. | 15,311.1 | Rs. | — | Rs. | 26,645.0 | Rs. | 648.9 | Rs. | 42,605.0 | US$ | 681.7 | ||||||||||||||||||||||||||||||||||||||||||||||
Sale of products | 2,078.8 | 6,232.0 | 8,303.6 | 16,614.4 | 306.1 | 1,906.3 | 14,709.6 | 6,216.5 | 9,109.8 | 31,942.2 | 511.1 | |||||||||||||||||||||||||||||||||||||||||||||||||||||||||
Services received | 1.5 | 5.2 | 5,178.0 | 5,184.7 | 95.5 | 24.0 | 961.0 | 4.3 | 18,036.2 | 19,025.5 | 304.4 | |||||||||||||||||||||||||||||||||||||||||||||||||||||||||
Services rendered | 153.7 | 258.3 | 575.7 | 987.7 | 18.2 | 100.9 | 2,223.0 | 26.1 | 1,099.2 | 3,449.2 | 55.2 | |||||||||||||||||||||||||||||||||||||||||||||||||||||||||
Interest (income) / expense, dividend (income) / paid, net | (613.1 | ) | (375.5 | ) | 2,986.7 | 1,998.1 | 36.8 | |||||||||||||||||||||||||||||||||||||||||||||||||||||||||||||
Bills discounted | — | — | — | 20,040.7 | 20,040.7 | 320.7 | ||||||||||||||||||||||||||||||||||||||||||||||||||||||||||||||
Purchase of property, plant and equipment | 154.5 | — | — | 31.5 | 186.0 | 3.0 | ||||||||||||||||||||||||||||||||||||||||||||||||||||||||||||||
Interest (income)/expense, dividend (income)/paid, (net) | (106.1 | ) | — | (97.9 | ) | 1,961.8 | 1,757.8 | 28.1 | ||||||||||||||||||||||||||||||||||||||||||||||||||||||||||||
Amounts receivable in respect of loans and interest thereon | 38.0 | 3,251.4 | 53.3 | 3,342.7 | 61.6 | 1,856.6 | — | 1,839.7 | 1,006.4 | 4,702.7 | 75.2 | |||||||||||||||||||||||||||||||||||||||||||||||||||||||||
Amounts payable in respect of loans and interest thereon* | 295.0 | — | 1,431.1 | 1,726.1 | 31.8 | |||||||||||||||||||||||||||||||||||||||||||||||||||||||||||||||
Amounts payable in respect of loans and interest thereon | 34.9 | — | — | 78.1 | 113.0 | 1.8 | ||||||||||||||||||||||||||||||||||||||||||||||||||||||||||||||
Trade and other receivables | 246.6 | 1,435.6 | 1,858.0 | 3,540.2 | 65.2 | 152.2 | 4,361.8 | — | 1,595.8 | 6,109.8 | 97.8 | |||||||||||||||||||||||||||||||||||||||||||||||||||||||||
Accounts payable | 1,097.4 | — | 2,321.3 | 3,418.7 | 63.0 | 764.9 | 11.4 | 1,436.8 | 3,358.7 | 5,571.8 | 89.1 | |||||||||||||||||||||||||||||||||||||||||||||||||||||||||
Loans given / repaid | 238.4 | 710.3 | 410.0 | 1,358.7 | 25.0 | |||||||||||||||||||||||||||||||||||||||||||||||||||||||||||||||
Loans given/repaid | 1,600.0 | — | — | 950.0 | 2,550.0 | 40.8 | ||||||||||||||||||||||||||||||||||||||||||||||||||||||||||||||
Purchase of unquoted equity shares | — | — | 18.4 | 18.4 | 0.3 | — | 12,258.6 | — | — | 12,258.6 | 196.1 | |||||||||||||||||||||||||||||||||||||||||||||||||||||||||
Loans taken / repaid | 1,215.0 | — | 8,567.1 | 9,782.1 | 180.2 | |||||||||||||||||||||||||||||||||||||||||||||||||||||||||||||||
Loans taken/repaid | 940.0 | — | — | — | 940.0 | 15.0 | ||||||||||||||||||||||||||||||||||||||||||||||||||||||||||||||
Deposits receivable | — | — | 30.0 | 30.0 | 0.6 | — | — | — | 30.0 | 30.0 | 0.5 | |||||||||||||||||||||||||||||||||||||||||||||||||||||||||
The following table summarizes related-party transactions and balances included in the consolidated financial statements for the year ended/as at March 31, 2014:
| Associates and its subsidiaries | Joint ventures | Joint operations | Tata Sons Ltd, its subsidiaries and joint ventures | Total | ||||||||||||||||||||||||||||||||||||
| (In millions) | ||||||||||||||||||||||||||||||||||||||||
Purchase of products | Rs. | 13,275.6 | Rs. | — | Rs. | 21,597.7 | Rs. | 497.1 | Rs. | 35,370.4 | ||||||||||||||||||||||||||||||
Sale of products | 1,828.6 | 32.8 | 5,553.2 | 10,642.4 | 18,057.0 | |||||||||||||||||||||||||||||||||||
Services received | 98.6 | 910.4 | 2.0 | 10,858.2 | 11,869.2 | |||||||||||||||||||||||||||||||||||
Services rendered | 124.5 | 2,510.1 | 58.0 | 929.0 | 3,621.6 | |||||||||||||||||||||||||||||||||||
Bills discounted | — | — | — | 16,015.4 | 16,015.4 | |||||||||||||||||||||||||||||||||||
Redemption/buy back of investments | — | 96.2 | — | — | 96.2 | |||||||||||||||||||||||||||||||||||
Purchase of property, plant and equipment | — | — | — | 8.0 | 8.0 | |||||||||||||||||||||||||||||||||||
Interest (income)/expense, dividend (income)/paid, (net) | (119.0 | ) | — | (113.5 | ) | 1,556.6 | 1,324.1 | |||||||||||||||||||||||||||||||||
Amounts receivable in respect of loans and interest thereon | 1.1 | — | 1,733.0 | 89.7 | 1,823.8 | |||||||||||||||||||||||||||||||||||
Amounts payable in respect of loans and interest thereon* | 160.0 | — | — | 289.4 | 449.4 | |||||||||||||||||||||||||||||||||||
Trade and other receivables | 207.2 | 1,471.3 | 81.3 | 2,820.1 | 4,579.9 | |||||||||||||||||||||||||||||||||||
Accounts payable | 715.2 | 22.1 | 1,749.1 | 2,268.3 | 4,754.7 | |||||||||||||||||||||||||||||||||||
Accounts payable (in respect of bills discounted) | — | — | — | 1,359.8 | 1,359.8 | |||||||||||||||||||||||||||||||||||
Loans given/repaid | 268.6 | — | — | 5.0 | 273.6 | |||||||||||||||||||||||||||||||||||
Purchase of unquoted equity shares | — | 9,007.6 | — | 3.0 | 9,010.6 | |||||||||||||||||||||||||||||||||||
Loans taken/repaid | 705.0 | — | — | 578.1 | 1,283.1 | |||||||||||||||||||||||||||||||||||
Deposits receivable | — | — | — | 30.0 | 30.0 | |||||||||||||||||||||||||||||||||||
| * | Amounts payable in respect of loans and interest consist of collateralized debt obligation for financial assets transferred to a related party that does not meet the derecognition criteria because of credit enhancement features. |
The following table summarizes related partyrelated-party transactions and balances included in the consolidated financial statements for the year ended / ended/as ofat March 31, 2012:2013:
| With associates and its subsidiaries | With joint ventures | Tata Sons Ltd, its subsidiaries and joint ventures | Total | |||||||||||||
| (In millions) | ||||||||||||||||
Purchase of products | Rs. 66,545.1 | Rs. 37,284.1 | Rs. 1,819.5 | Rs. 105,648.7 | ||||||||||||
Sale of products | 5,573.6 | 4,790.9 | 8,388.4 | 18,752.9 | ||||||||||||
Services received | 21.8 | 6.0 | 4,428.3 | 4,456.1 | ||||||||||||
Services rendered | 232.3 | 86.5 | 504.7 | 823.5 | ||||||||||||
Issue of shares by a subsidiary to non controlling interests shareholders | — | — | 1,410.6 | 1,410.6 | ||||||||||||
Interest (income) / expense, dividend (income) / paid, net | (476.7 | ) | (328.9 | ) | 3,576.6 | 2,771.0 | ||||||||||
Amounts receivable in respect of loans and interest thereon | 276.3 | 3,037.5 | 263.2 | 3,577.0 | ||||||||||||
Amounts payable in respect of loans and interest thereon* | 302.0 | — | 3,962.6 | 4,264.6 | ||||||||||||
Trade and other receivables | 1,094.3 | 45.4 | 1,917.3 | 3,057.0 | ||||||||||||
Accounts payable | 1,288.6 | 1,126.8 | 1,344.0 | 3,759.4 | ||||||||||||
Loans given / repaid | 710.0 | — | 10,106.3 | 10,816.3 | ||||||||||||
Purchase of shares in subsidiary | — | — | 3,043.4 | 3,043.4 | ||||||||||||
Purchase of unquoted equity shares | — | — | 346.8 | 346.8 | ||||||||||||
Loans taken / repaid | 940.0 | — | 4,019.8 | 4,959.8 | ||||||||||||
Deposits receivable | — | — | 30.0 | 30.0 | ||||||||||||
The following table summarizes related party transactions and balances included in the consolidated financial statements for the year ended / as of March 31, 2011
| With associates and its subsidiaries | With joint ventures | Tata Sons Ltd, its subsidiaries and joint ventures | Total | Associates and its subsidiaries | Joint ventures | Joint operations | Tata Sons Ltd, its subsidiaries and joint ventures | Total | ||||||||||||||||||||||||||||||||||||||||||||||||
| (In millions) | (In millions) | |||||||||||||||||||||||||||||||||||||||||||||||||||||||
Purchase of products | Rs. 43,872.4 | Rs. 44,008.8 | Rs. 911.9 | Rs. 88,793.1 | Rs. | 26,224.5 | Rs. | — | Rs. | 26,126.3 | Rs. | 1,354.4 | Rs. | 53,705.2 | ||||||||||||||||||||||||||||||||||||||||||
Purchase of property, plant and equipment | — | — | 6.9 | 6.9 | ||||||||||||||||||||||||||||||||||||||||||||||||||||
Sale of products | 4,078.4 | 4,569.2 | 3,619.4 | 12,267.0 | 2,078.8 | 9.8 | 3,111.1 | 8,303.6 | 13,503.3 | |||||||||||||||||||||||||||||||||||||||||||||||
Services received | 3.0 | 27.0 | 3,528.3 | 3,558.3 | 1.5 | 0.4 | 2.4 | 5,181.1 | 5,185.4 | |||||||||||||||||||||||||||||||||||||||||||||||
Services rendered | 227.7 | 30.6 | 1,267.9 | 1,526.2 | 153.7 | 745.0 | 23.0 | 575.7 | 1,497.4 | |||||||||||||||||||||||||||||||||||||||||||||||
Interest (income) / expense, dividend (income) / paid, net | (535.7 | ) | (213.0 | ) | 3,974.1 | 3,225.4 | ||||||||||||||||||||||||||||||||||||||||||||||||||
Interest (income) / expense, dividend (income) / paid, (net) | (253.1 | ) | (25.4 | ) | (355.1 | ) | 2,986.7 | 2,353.1 | ||||||||||||||||||||||||||||||||||||||||||||||||
Amounts receivable in respect of loans and interest thereon | 308.3 | 2,985.4 | 233.3 | 3,527.0 | 38.0 | — | 1,625.7 | 53.3 | 1,717.0 | |||||||||||||||||||||||||||||||||||||||||||||||
Amounts payable in respect of loans and interest thereon* | — | — | 10,037.0 | 10,037.0 | 295.0 | — | — | 1,431.1 | 1,726.1 | |||||||||||||||||||||||||||||||||||||||||||||||
Trade and other receivables | 579.6 | 26.6 | 1,621.6 | 2,227.8 | 246.6 | 636.4 | 399.6 | 1,858.0 | 3,140.6 | |||||||||||||||||||||||||||||||||||||||||||||||
Accounts payable | 795.8 | 7.1 | 1,235.3 | 2,038.2 | 729.3 | — | 184.4 | 2,321.5 | 3,235.2 | |||||||||||||||||||||||||||||||||||||||||||||||
Loans given / repaid | 890.0 | — | 14,919.8 | 15,809.8 | ||||||||||||||||||||||||||||||||||||||||||||||||||||
Loans given/repaid | 238.4 | 710.3 | — | 410.0 | 1,358.7 | |||||||||||||||||||||||||||||||||||||||||||||||||||
Purchase of unquoted equity shares | — | 2,015.8 | 1,094.8 | 3,110.6 | — | 6,216.6 | — | 18.4 | 6,235.0 | |||||||||||||||||||||||||||||||||||||||||||||||
Loans taken / repaid | 830.0 | — | 10,686.0 | 11,516.0 | ||||||||||||||||||||||||||||||||||||||||||||||||||||
Deposits given | — | — | 30.0 | 30.0 | ||||||||||||||||||||||||||||||||||||||||||||||||||||
Loans taken/repaid | 1,215.0 | — | — | 8,567.1 | 9,782.1 | |||||||||||||||||||||||||||||||||||||||||||||||||||
Deposits receivable | — | — | — | 30.0 | 30.0 | |||||||||||||||||||||||||||||||||||||||||||||||||||
| * | Amounts payable in respect of loans and interest consist of collateralized debt obligation for financial assets transferred to a related party that does not meet the derecognition criteria because of credit enhancement features. |
Compensation of key management personnel:
| Year ended March 31, | Year ended March 31, | |||||||||||||||||||||||||||||||||||||||||||||||
| 2013 | 2013 | 2012 | 2011 | 2015 | 2015 | 2014 | 2013 | |||||||||||||||||||||||||||||||||||||||||
| (In millions) | (In millions) | |||||||||||||||||||||||||||||||||||||||||||||||
Short-term benefits | US$ | 6.6 | Rs. 357.5 | Rs. 487.9 | Rs. 345.6 | US$ | 5.7 | Rs. | 354.2 | Rs. | 417.6 | Rs. | 357.5 | |||||||||||||||||||||||||||||||||||
Termination benefits | — | — | 276.5 | — | — | — | — | — | ||||||||||||||||||||||||||||||||||||||||
Post-employment benefits* | 2.7 | 148.9 | 219.3 | 46.1 | 3.3 | 208.2 | 95.3 | # | 148.9 | |||||||||||||||||||||||||||||||||||||||
| * | Excludes provision for encashable leave and gratuity for certain key management personnels as a separate actuarial valuation is not available. |
| # | Excludes statutory dues paid on the demise of Mr. Karl Slym to his legal heirs namely social security benefit and gratuity, aggregating Rs. 24.1 million for the year ended March 31, 2014. |
Other transactions with key management personnel:
| Year ended March 31, | ||||||||||||||||
| 2013 | 2013 | 2012 | 2011 | |||||||||||||
| (In millions) | ||||||||||||||||
Interest (income) / expense, dividend (income) / paid, net | US$ | 0.1 | Rs. 5.9 | Rs. 16.2 | Rs. 17.1 | |||||||||||
Amounts receivable in respect of loans and interest thereon | — | — | 0.9 | 1.0 | ||||||||||||
Fixed deposits repaid | — | — | 129.0 | — | ||||||||||||
Amounts payable in respect of fixed deposits and interest thereon | — | — | 2.0 | 131.0 | ||||||||||||
| Year ended March 31, | ||||||||||||||||||||||||||||||||
| 2015 | 2015 | 2014 | 2013 | |||||||||||||||||||||||||||||
| (In millions) | ||||||||||||||||||||||||||||||||
Interest (income)/expense, dividend (income)/paid, net | US$ | — | Rs. | — | Rs. | — | Rs. | 5.9 | ||||||||||||||||||||||||
Refer note 32 for information on transactions with post-employment benefit plans.
Subsequent to the year ended March 31, 2013:
| 40. | Earnings per share (“EPS”) |
| Net income attributable to shareholders of Tata Motors Limited (In millions) | Weighted average shares (Nos.) | Earnings per share | ||||||||||
For the year ended March 31, 2013: | ||||||||||||
Ordinary Shares | ||||||||||||
Basic net earnings per share | Rs. | 75,246.9 | 2,706,014,707 | Rs. | 27.8 | |||||||
| US$ | 1,386.2 | US$ | 0.5 | |||||||||
Effect of shares kept in abeyance | Rs. | (3.8 | ) | 492,722 | Rs. | (7.7 | ) | |||||
| US$ | (0.1 | ) | US$ | (0.1 | ) | |||||||
Diluted earnings per share | Rs. | 75,243.1 | 2,706,507,429 | Rs. | 27.8 | |||||||
| US$ | 1,386.1 | US$ | 0.5 | |||||||||
‘A’ Ordinary Shares | ||||||||||||
Basic net earnings per share | Rs. | 13,450.1 | 481,958,717 | Rs. | 27.9 | |||||||
| US$ | 247.7 | US$ | 0.5 | |||||||||
Effect of shares kept in abeyance | Rs. | 3.8 | 247,798 | Rs. | 15.3 | |||||||
| US$ | 0.1 | US$ | 0.3 | |||||||||
Diluted earnings per share | Rs. | 13,453.9 | 482,206,515 | Rs. | 27.9 | |||||||
| US$ | 247.8 | US$ | 0.5 | |||||||||
For the year ended March 31, 2012: | ||||||||||||
Ordinary Shares | ||||||||||||
Basic net earnings per share | Rs. | 98,054.9 | 2,691,542,867 | Rs. | 36.4 | |||||||
Effect of shares kept in abeyance | Rs. | (6.5 | ) | 529,377 | Rs. | (12.3 | ) | |||||
Effect of Zero Coupon Convertible Alternative Reference Securities (USD) due 2012 (CARS) | Rs. | 2,738.7 | 105,818,480 | Rs. | 25.9 | |||||||
Diluted earnings per share | Rs. | 100,787.1 | 2,797,890,724 | Rs. | 36.0 | |||||||
‘A’ Ordinary Shares | ||||||||||||
Basic net earnings per share | Rs. | 17,604.2 | 481,900,898 | Rs. | 36.5 | |||||||
Effect of shares kept in abeyance | Rs. | 6.5 | 305,518 | Rs. | 21.3 | |||||||
Effect of Zero Coupon Convertible Alternative Reference Securities (USD) due 2012 (CARS) | Rs. | (192.2 | ) | — | Rs. | — | ||||||
Diluted earnings per share | Rs. | 17,418.5 | 482,206,416 | Rs. | 36.1 | |||||||
For the year ended March 31, 2011: | ||||||||||||
Ordinary Shares | ||||||||||||
Basic net earnings per share | Rs. | 63,614.8 | 2,588,800,690 | Rs. | 24.6 | |||||||
Effect of zero Coupon Convertible Foreign Currency Convertible Notes (JPY) due 2011 | Rs. | (9.9 | ) | 1,325,246 | Rs. | (7.5 | ) | |||||
Effect of shares kept in abeyance | Rs. | (8.2 | ) | 746,291 | Rs. | (11.0 | ) | |||||
Diluted earnings per share | Rs. | 63,596.7 | 2,590,872,227 | Rs. | 24.5 | |||||||
‘A’ Ordinary Shares | ||||||||||||
Basic net earnings per share | Rs. | 9,787.0 | 396,669,199 | Rs. | 24.7 | |||||||
Effect of zero Coupon Convertible Foreign Currency Convertible Notes (JPY) due 2011 | Rs. | (6.5 | ) | — | Rs. | — | ||||||
Effect of shares kept in abeyance | Rs. | 8.3 | 497,649 | Rs. | 16.7 | |||||||
Diluted earnings per share | Rs. | 9,788.8 | 397,166,848 | Rs. 24.6 | ||||||||
Earnings per share have been adjusted retrospectively for the sub-division of shares in fiscal 2012.
| Net income attributable to shareholders of Tata Motors Limited (In millions) | Weighted average shares (Nos.) | Earnings per share | ||||||||||||||
For the year ended March 31, 2015:1 | ||||||||||||||||
Ordinary shares | ||||||||||||||||
Basic net earnings per share | Rs. | 109,024.7 | 2,765,339,619 | Rs. | 39.4 | |||||||||||
| US$ | 1,744.4 | US$ | 0.6 | |||||||||||||
Effect of shares kept in abeyance | Rs. | (5.2 | ) | 484,470 | Rs. | (10.7 | ) | |||||||||
| US$ | (0.1 | ) | US$ | (0.2 | ) | |||||||||||
Diluted earnings per share | Rs. | 109,019.5 | 2,765,824,089 | Rs. | 39.4 | |||||||||||
| US$ | 1,744.3 | US$ | 0.6 | |||||||||||||
‘A’ Ordinary shares | ||||||||||||||||
Basic net earnings per share | Rs. | 19,266.5 | 487,445,041 | Rs. | 39.5 | |||||||||||
| US$ | 308.3 | US$ | 0.6 | |||||||||||||
Effect of shares kept in abeyance | Rs. | 5.2 | 239,570 | Rs. | 21.7 | |||||||||||
| US$ | 0.1 | US$ | 0.3 | |||||||||||||
Diluted earnings per share | Rs. | 19,271.7 | 487,684,611 | Rs. | 39.5 | |||||||||||
| US$ | 308.4 | US$ | 0.6 | |||||||||||||
For the year ended March 31, 2014:1 | ||||||||||||||||
Ordinary shares | ||||||||||||||||
Basic net earnings per share | Rs. | 111,060.8 | 2,760,961,457 | Rs. | 40.2 | |||||||||||
Effect of shares kept in abeyance | Rs. | (5.4 | ) | 489,261 | Rs. | (11.0 | ) | |||||||||
Diluted earnings per share | Rs. | 111,055.4 | 2,761,450,718 | Rs. | 40.2 | |||||||||||
‘A’ Ordinary shares | ||||||||||||||||
Basic net earnings per share | Rs. | 19,656.3 | 487,440,271 | Rs. | 40.3 | |||||||||||
Effect of shares kept in abeyance | Rs. | 5.4 | 244,287 | Rs. | 22.1 | |||||||||||
Diluted earnings per share | Rs. | 19,661.7 | 487,684,558 | Rs. | 40.3 | |||||||||||
For the year ended March 31, 2013:1 | ||||||||||||||||
Ordinary shares | ||||||||||||||||
Basic net earnings per share | Rs. | 75,213.9 | 2,734,354,019 | Rs. | 27.5 | |||||||||||
Effect of shares kept in abeyance | Rs. | (3.8 | ) | 492,722 | Rs. | (7.7 | ) | |||||||||
Diluted earnings per share | Rs. | 75,210.1 | 2,734,846,741 | Rs. | 27.5 | |||||||||||
‘A’ Ordinary shares | ||||||||||||||||
Basic net earnings per share | Rs. | 13,456.6 | 487,436,720 | Rs. | 27.6 | |||||||||||
Effect of shares kept in abeyance | Rs. | 3.8 | 247,798 | Rs. | 15.3 | |||||||||||
Diluted earnings per share | Rs. | 13,460.4 | 487,684,518 | Rs. | 27.6 | |||||||||||
‘A’ Ordinary shares holdersshareholders are entitled to receive dividend at 5 percentage points more than the aggregate rate of dividend determined by the Company on Ordinary shares for the financial year.
The effect of 28,549,588 Ordinary shares issuable as of March 31, 2013, on conversion of 4% Foreign Currency Convertible Notesforeign currency convertible notes (USD) due 2014, is anti-dilutive for the year ended March 31, 2013 and havehas not been considered in the computation of diluted EPS.
| 1 | Basic and diluted earnings per share for all periods presented have been retrospectively adjusted for the bonus element in respect of the rights issue as described in note 25 to the consolidated financial statements. |
Condensed financial information of Tata Motors Limited (“Parent Company”) on a standalone basis
| A. | Balance Sheet |
| �� | As at March 31, | |||||||||||
| 2015 | 2015 | 2014 | ||||||||||
| (In millions) | ||||||||||||
EQUITY AND LIABILITIES | ||||||||||||
Shareholders’ funds: | ||||||||||||
Share Capital | US$ | 103.0 | Rs. | 6,437.8 | Rs. | 6,437.8 | ||||||
Reserves and surplus | 2,275.0 | 142,188.1 | 185,328.7 | |||||||||
|
|
|
|
|
| |||||||
Total shareholders’ funds | 2,378.0 | 148,625.9 | 191,766.5 | |||||||||
|
|
|
|
|
| |||||||
Non-current liabilities: | ||||||||||||
Long-term borrowings | 1,971.0 | 123,189.6 | 97,464.5 | |||||||||
Deferred tax liabilities (net) | — | — | 431.1 | |||||||||
Other long-term liabilities | 45.9 | 2,868.0 | 11,554.8 | |||||||||
Long-term provisions | 336.7 | 21,041.9 | 8,152.0 | |||||||||
|
|
|
|
|
| |||||||
Total non-current liabilities | 2,353.6 | 147,099.5 | 117,602.4 | |||||||||
|
|
|
|
|
| |||||||
Current liabilities: | ||||||||||||
Short-term borrowings | 1,241.9 | 77,620.1 | 47,690.8 | |||||||||
Trade payables | 1,416.4 | 88,526.5 | 96,723.6 | |||||||||
Other current liabilities | 502.9 | 31,428.8 | 24,631.8 | |||||||||
Short-term provisions | 98.1 | 6,130.9 | 18,929.1 | |||||||||
|
|
|
|
|
| |||||||
Total current liabilities | 3,259.3 | 203,706.3 | 187,975.3 | |||||||||
|
|
|
|
|
| |||||||
Total liabilities | 5,612.9 | 350,805.8 | 305,577.7 | |||||||||
|
|
|
|
|
| |||||||
Total equity and liabilities | US$ | 7,990.9 | Rs. | 499,431.7 | Rs. | 497,344.2 | ||||||
|
|
|
|
|
| |||||||
ASSETS: | ||||||||||||
Non-current assets: | ||||||||||||
Fixed assets | ||||||||||||
Tangible assets | 1,961.7 | 122,605.0 | 121,335.0 | |||||||||
Intangible assets | 563.6 | 35,227.3 | 31,070.7 | |||||||||
Capital work-in-progress | 216.0 | 13,499.5 | 17,168.5 | |||||||||
Intangible assets under development | 750.5 | 46,908.4 | 46,382.2 | |||||||||
|
|
|
|
|
| |||||||
| 3,491.8 | 218,240.2 | 215,956.4 | ||||||||||
Non-current investments | 2,714.7 | 169,669.5 | 183,575.7 | |||||||||
Long-term loans and advances | 384.6 | 24,035.6 | 29,183.0 | |||||||||
Other non-current assets | 28.1 | 1,756.7 | 1,238.5 | |||||||||
|
|
|
|
|
| |||||||
Total non-current assets | 6,619.2 | 413,702.0 | 429,953.6 | |||||||||
|
|
|
|
|
| |||||||
Current assets: | ||||||||||||
Current investments | 3.2 | 202.2 | 1,008.5 | |||||||||
Inventories | 768.3 | 48,020.8 | 38,625.3 | |||||||||
Trade receivables | 178.3 | 11,144.8 | 12,167.0 | |||||||||
Cash and bank balances | 151.2 | 9,447.5 | 2,261.5 | |||||||||
Short-term loans and advances | 251.9 | 15,744.1 | 12,237.7 | |||||||||
Other current assets | 18.8 | 1,170.3 | 1,090.6 | |||||||||
|
|
|
|
|
| |||||||
Total current assets | 1,371.7 | 85,729.7 | 67,390.6 | |||||||||
|
|
|
|
|
| |||||||
Total assets | US$ | 7,990.9 | Rs. | 499,431.7 | Rs. | 497,344.2 | ||||||
|
|
|
|
|
| |||||||
| B. | Statement of Profit and Loss |
| Year ended March 31, | ||||||||||||||||
| 2015 | 2015 | 2014 | 2013 | |||||||||||||
| (In millions) | ||||||||||||||||
Revenue from operations | US$ | 6,323.9 | Rs. | 395,243.4 | Rs. | 377,580.0 | Rs. | 493,197.3 | ||||||||
Less: Excise duty | (516.7 | ) | (32,296.0 | ) | (34,698.9 | ) | (45,540.1 | ) | ||||||||
|
|
|
|
|
|
|
| |||||||||
Net revenue from operations | 5,807.2 | 362,947.4 | 342,881.1 | 447,657.2 | ||||||||||||
Other income | 301.0 | 18,814.1 | 38,330.3 | 20,882.0 | ||||||||||||
|
|
|
|
|
|
|
| |||||||||
Total revenues | 6,108.2 | 381,761.5 | 381,211.4 | 468,539.2 | ||||||||||||
|
|
|
|
|
|
|
| |||||||||
Expenses: | ||||||||||||||||
Cost of materials consumed | 3,544.8 | 221,552.3 | 204,928.7 | 272,442.8 | ||||||||||||
Purchase of products for sale | 922.4 | 57,652.4 | 50,498.2 | 58,644.5 | ||||||||||||
Changes in inventories of finished goods, work-in-progress and products for sale | (140.6 | ) | (8,788.2 | ) | 3,717.2 | (1,436.0 | ) | |||||||||
Employee cost/benefits expense | 494.6 | 30,914.6 | 28,776.9 | 28,370.0 | ||||||||||||
Finance cost | 257.9 | 16,116.8 | 13,531.8 | 14,010.0 | ||||||||||||
Depreciation and amortization expense | 416.5 | 26,032.2 | 20,703.0 | 18,176.2 | ||||||||||||
Product development expense/Engineering expenses | 70.0 | 4,374.7 | 4,287.4 | 4,257.6 | ||||||||||||
Other expenses | 1,292.9 | 80,803.9 | 69,718.7 | 77,700.8 | ||||||||||||
Expenditure transferred to capital and other accounts | (179.0 | ) | (11,187.5 | ) | (10,091.1 | ) | (9,538.0 | ) | ||||||||
|
|
|
|
|
|
|
| |||||||||
Total expenses | 6,679.5 | 417,471.2 | 386,070.8 | 462,627.9 | ||||||||||||
|
|
|
|
|
|
|
| |||||||||
Profit/(Loss) before exceptional items, extraordinary items and tax | (571.3 | ) | (35,709.7 | ) | (4,859.4 | ) | 5,911.3 | |||||||||
Exceptional items : | ||||||||||||||||
Exchange loss (net) including on revaluation of foreign currency borrowings, deposits and loans | 51.3 | 3,205.0 | 2,730.6 | 2,631.2 | ||||||||||||
Provision for loan given and costs associated with closure of operations of a subsidiary | — | — | 2,020.0 | 2,450.0 | ||||||||||||
Diminution in the value of investment in a subsidiary | — | — | 175.2 | (96.7 | ) | |||||||||||
Employee separation cost | 13.3 | 832.5 | 472.8 | — | ||||||||||||
Profit on sale of a division | — | — | — | (822.5 | ) | |||||||||||
|
|
|
|
|
|
|
| |||||||||
| 64.6 | 4,037.5 | 5,398.6 | 4,162.0 | |||||||||||||
|
|
|
|
|
|
|
| |||||||||
Profit/(Loss) before extraordinary items and tax | (635.9 | ) | (39,747.2 | ) | (10,258.0 | ) | 1,749.3 | |||||||||
Extraordinary items | — | — | — | — | ||||||||||||
|
|
|
|
|
|
|
| |||||||||
Profit/(Loss) before tax from continuing operations | (635.9 | ) | (39,747.2 | ) | (10,258.0 | ) | 1,749.3 | |||||||||
Tax expenses/(credit) (net) | 122.3 | 7,642.3 | (13,603.2 | ) | (1,268.8 | ) | ||||||||||
|
|
|
|
|
|
|
| |||||||||
Profit/(Loss) after tax for the year from continuing operations | US$ | (758.2 | ) | Rs. | (47,389.5 | ) | Rs. | 3,345.2 | Rs. | 3,018.1 | ||||||
|
|
|
|
|
|
|
| |||||||||
| C. | Statements of Cash Flows |
| Year ended March 31, | ||||||||||||||||
| 2015 | 2015 | 2014 | 2013 | |||||||||||||
| (In millions) | ||||||||||||||||
Cash flows from operating activities: | ||||||||||||||||
Profit/(loss) after tax | US$ | (758.2 | ) | Rs. | (47,389.5) | Rs. | 3,345.2 | Rs. | 3,018.1 | |||||||
Adjustments for: | ||||||||||||||||
Depreciation/amortization | 416.5 | 26,032.2 | 20,703.0 | 18,176.2 | ||||||||||||
Lease equalization adjusted in income | (0.4 | ) | (22.7 | ) | (45.2 | ) | (45.2 | ) | ||||||||
Profit on sale of a division | — | — | — | (822.5 | ) | |||||||||||
Provision for loans and inter corporate deposits (net) | — | — | — | 52.9 | ||||||||||||
Provision/(reversal) for dimunition in value of investments | — | — | 175.2 | (96.7 | ) | |||||||||||
Provision for loan given and cost associated with closure of operations of a subsidiary | — | — | 2,020.0 | 2,450.0 | ||||||||||||
Provision for doubtful trade receivable and advances | 21.1 | 1,316.4 | 3,760.3 | 1,163.7 | ||||||||||||
(Profit)/loss on sale of assets (net), including assets scrapped/written off | 49.5 | 3,095.7 | 202.9 | 29.6 | ||||||||||||
Tax expenses/(credit) (net) | 122.3 | 7,642.3 | (13,603.2 | ) | (1,268.8 | ) | ||||||||||
Sale of occupancy rights | (5.9 | ) | (366.0 | ) | — | — | ||||||||||
Profit on sale of investments (net) | (12.9 | ) | (804.8 | ) | (20,523.3 | ) | (439.1 | ) | ||||||||
Exchange differences (net) | 43.3 | 2,709.3 | 2,769.0 | 1,993.9 | ||||||||||||
Interest/dividend (net) | (30.3 | ) | (1,892.5 | ) | (4,431.8 | ) | (6,565.2 | ) | ||||||||
|
|
|
|
|
|
|
| |||||||||
Operating profit/(loss) before working capital changes | (155.0 | ) | (9,679.6 | ) | (5,627.9 | ) | 17,646.9 | |||||||||
Trade receivables | (3.4 | ) | (212.2 | ) | 3,657.6 | 7,862.3 | ||||||||||
Finance receivables | 0.2 | 13.8 | 150.0 | 647.6 | ||||||||||||
Other current and non-current assets | (97.1 | ) | (6,070.7 | ) | 9.2 | (1,506.2 | ) | |||||||||
Inventories | (150.3 | ) | (9,395.5 | ) | 5,925.0 | 1,294.2 | ||||||||||
Trade payable and acceptances | (134.9 | ) | (8,432.2 | ) | 12,128.3 | (2,499.3 | ) | |||||||||
Other current and non-current liabilities | 18.3 | 1,146.8 | 2,492.5 | (3,815.0 | ) | |||||||||||
Provisions | 124.5 | 7,779.0 | 6,460.5 | 1,880.6 | ||||||||||||
|
|
|
|
|
|
|
| |||||||||
Cash generated from/(used in) operations | (397.7 | ) | (24,850.6 | ) | 25,195.2 | 21,511.1 | ||||||||||
Income taxes (paid)/credit (net) | (12.4 | ) | (776.1 | ) | (560.6 | ) | 1,073.3 | |||||||||
|
|
|
|
|
|
|
| |||||||||
Net cash from/(used in) operating activities | (410.1 | ) | (25,626.7 | ) | 24,634.6 | 22,584.4 | ||||||||||
|
|
|
|
|
|
|
| |||||||||
Cash flows from investing activities: | ||||||||||||||||
Fixed/restricted deposits with scheduled banks made | (80.8 | ) | (5,052.8 | ) | (5,301.5 | ) | (2,058.5 | ) | ||||||||
Fixed/restricted deposits with scheduled banks realized | 72.0 | 4,498.5 | 7,604.0 | 7,800.0 | ||||||||||||
Fixed deposit with financial institution made | (32.0 | ) | (2,000.0 | ) | (2,000.0 | ) | — | |||||||||
Fixed deposit with financial institution realized | 32.0 | 2,000.0 | 2,000.0 | — | ||||||||||||
Realization of loans to associates and subsidiaries | — | — | 2,978.3 | — | ||||||||||||
Investment in subsidiary companies | (17.7 | ) | (1,105.6 | ) | (4,431.8 | ) | (1,861.2 | ) | ||||||||
Investment in associate companies | (25.4 | ) | (1,590.0 | ) | — | (0.1 | ) | |||||||||
Investment-others | — | — | — | (8.4 | ) | |||||||||||
Investment in mutual fund (purchased)/sold (net) | 10.7 | 669.8 | 4,456.3 | (3,155.1 | ) | |||||||||||
Loans to associates and subsidiaries | — | — | (1,462.8 | ) | (1,943.6 | ) | ||||||||||
Proceeds from sale of a division | — | — | — | 1,100.0 | ||||||||||||
Sale/redemption of investments in subsidiary companies | 288.6 | 18,039.0 | 39,784.8 | 13,789.5 | ||||||||||||
Advance towards investment in subsidiary companies | (4.2 | ) | (260.8 | ) | (1,351.5 | ) | (168.2 | ) | ||||||||
Redemption of investments in associate companies | — | — | — | 210.0 | ||||||||||||
Redemption of investments-others | — | — | — | 107.5 | ||||||||||||
Deposits of margin money/cash collateral Realization of margin money/cash collateral Investments in joint venture (Increase)/decrease in short term inter-corporate deposits Interest received Dividend received Payments for fixed assets Proceeds from sale of fixed assets Sale of occupancy rights Decrease in investments in retained interests in securitization transactions Net cash from investing activities Cash flows from financing activities: Expenses on foreign currency convertible notes (FCCN)/convertible alternative reference securities (CARS) conversion Proceeds from issue of shares held in abeyance Dividends paid (including dividend distribution tax) Interest paid (including discounting charges paid, Rs. 4,341.6 million (2013-14 Rs. 3,737.8 million and 2012-13 Rs. 3,450.6 million)) Brokerage and other expenses on non-convertible debentures (NCD) Premium paid on redemption of non-convertible debentures (NCD) Premium on redemption of FCCN/CARS (including tax) Repayment of fixed deposits Proceeds from short-term borrowings Repayment of short-term borrowings Net change in other short-term borrowing (with maturity up to three months) Proceeds from long-term borrowings Repayments of long-term borrowings Net cash from/(used in) financing activities Net increase/(decrease) in cash and cash equivalents Cash and cash equivalents as at April 01, (opening balance) Exchange fluctuation on foreign currency bank balances Cash and cash equivalents as at March 31, (closing balance) Non-cash transactions: FCCN/CARS converted to Ordinary shares Year ended March 31, 2015 2015 2014 2013 (In millions) US$ — Rs. — Rs. — Rs. (13.8 ) — 1.0 — 912.5 — — (3,250.0 ) — (0.8 ) (50.0 ) (400.0 ) 435.3 12.8 801.3 1,817.0 4,040.7 271.8 16,984.8 16,026.8 16,606.5 (437.0 ) (27,309.4 ) (31,054.2 ) (26,053.9 ) 3.9 245.2 113.7 169.5 2.3 146.4 — — — — — 6.3 96.2 6,017.4 25,529.1 9,915.0 — — (3.5 ) (2.3 ) — — 0.9 1.6 (103.8 ) (6,487.4 ) (6,488.1 ) (14,604.1 ) (295.2 ) (18,449.3 ) (17,499.0 ) (18,094.2 ) (7.7 ) (479.5 ) (875.4 ) (930.2 ) (119.1 ) (7,441.9 ) (6,580.5 ) (965.5 ) — — — (8,869.5 ) (1.5 ) (93.1 ) (3,621.9 ) (18,683.8 ) 800.9 50,057.9 85,480.0 118,737.9 (1,067.3 ) (66,709.1 ) (86,798.6 ) (101,778.0 ) 739.2 46,202.0 (14,734.1 ) 12,877.5 1,249.8 78,112.3 23,105.9 25,628.4 (774.3 ) (48,396.6 ) (22,323.8 ) (33,774.7 ) 421.0 26,315.3 (50,338.1 ) (40,456.9 ) 107.1 6,706.0 (174.4 ) (7,957.5 ) 31.8 1,986.8 2,055.7 9,196.4 (1.2 ) (73.3 ) 105.5 816.8 US$ 137.7 Rs. 8,619.5 Rs. 1,986.8 Rs. 2,055.7 US$ — Rs. — Rs. 4,133.4 Rs. 2,328.3
| D. | Supplementary information of Tata Motors Limited (“Parent Company”) prepared in accordance with Indian GAAP |
The effectParent Company’s long-term debt consists of 44,777,255 Ordinary shares issuablethe following:
| As at March 31, | ||||||||||||
| 2015 | 2015 | 2014 | ||||||||||
| (In millions) | ||||||||||||
Non-convertible debentures | US$ | 1,056.0 | Rs. | 66,000.0 | Rs. | 55,500.0 | ||||||
External commercial borrowings | — | — | 29,950.0 | |||||||||
Buyers credit from banks at floating interest rate | 252.7 | 15,792.4 | 12,824.5 | |||||||||
Term loan from others | 76.7 | 4,795.0 | 4,195.4 | |||||||||
Senior notes | 750.0 | 46,875.0 | — | |||||||||
Others | 4.2 | 261.6 | 367.3 | |||||||||
|
|
|
|
|
| |||||||
Total | 2,139.6 | 133,724.0 | 102,837.2 | |||||||||
Less: current portion | 168.6 | 10,534.4 | 5,372.7 | |||||||||
|
|
|
|
|
| |||||||
Long-term debt | US$ | 1,971.0 | Rs. | 123,189.6 | Rs. | 97,464.5 | ||||||
|
|
|
|
|
| |||||||
The table below provides details regarding the contractual maturities of long-term debt:
| As at March 31, | ||||||||||||
| 2015 | 2015 | 2014 | ||||||||||
| (In millions) | ||||||||||||
Due in 1st year | US$ | 168.6 | Rs. | 10,534.4 | Rs. | 5,372.7 | ||||||
Due in 2nd year | 295.2 | 18,449.8 | 28,962.0 | |||||||||
Due in 3rd to 5th year | 385.1 | 24,069.8 | 50,807.1 | |||||||||
Due after 5th year | 1,290.7 | 80,670.0 | 17,695.4 | |||||||||
|
|
|
|
|
| |||||||
Total | US$ | 2,139.6 | Rs. | 133,724.0 | Rs. | 102,837.2 | ||||||
|
|
|
|
|
| |||||||
| E. | Significant accounting policies |
| (a) | Basis of preparation |
The financial statements of the Parent Company have been prepared under the historical cost convention on an accrual basis of accounting in accordance with the Generally Accepted Accounting Principles in India (Indian GAAP) to comply with the Accounting Standards notified under Section 133 of the Companies Act, 2013 read with Rule 7 of the Companies (Accounts) Rules, 2014 and relevant provisions of the Companies Act, 2013 (“the Companies Act”).
| (b) | Use of estimates |
The preparation of financial statements requires management to make judgments, estimates and assumptions that affect the application of accounting policies and the reported amounts of assets, liabilities, income, expenses and disclosures of contingent liabilities at the date of these financial statements. Actual results may differ from these estimates. Estimates and underlying assumptions are reviewed at each balance sheet date. Revisions to accounting estimates are recognized in the period in which the estimate is revised and future periods affected.
| (c) | Revenue recognition |
The Parent Company recognizes revenues on the sale of products, net of discounts and sales incentives, when the products are delivered to the dealer/customer or when delivered to the carrier for export sales, which is when risks and rewards of ownership pass to the dealer/customer.
Sales include income from services, and exchange fluctuations relating to export receivables. Sales include export and other recurring and non-recurring incentives from the Government of India at the national and state levels. Sale of products is presented gross of excise duty where applicable, and net of other indirect taxes.
Revenues are recognized when collectability of the resulting receivables is reasonably assured.
Dividend from investments is recognized when the right to receive the payment is established and when no significant uncertainty as to measurability or collectability exists.
Interest income is recognized on the time basis determined by the amount outstanding and the rate applicable and where no significant uncertainty as to measurability or collectability exists.
| (d) | Depreciation and amortization |
| (i) | Depreciation is provided on a Straight-Line Method (SLM) over the estimated useful lives of the assets considering the nature, estimated usage, operating conditions, past history of replacement, anticipated technological changes, manufacturers warranties and maintenance support. Taking into account these factors, the Parent Company has decided to retain the useful life hitherto adopted for various categories of fixed assets, which are different from those prescribed in Schedule II of the Companies Act. Estimated useful lives of assets are as follows : |
Type of Asset | Estimated useful life | |||
• Leasehold land | Amortized over the period of the lease | |||
• Buildings, roads, bridges and culverts | 4 to 60 years | |||
• Plant, machinery and equipment | 8 to 20 years | |||
• Computers and other IT assets | 4 to 6 years | |||
• Vehicles | 4 to 10 years | |||
• Furniture, fixture and office appliances | 5 to 15 years | |||
• Technical know-how | 5 to 6 years | |||
• Computer software | 4 years | |||
• Water system and sanitation | 20 years | |||
• Assets taken on lease are amortized over the period of lease | 10 years | |||
| (ii) | Product development costs are amortized over a period of upto 120 months for new generation vehicles and powertrains on the basis of higher of the volumes between planned and actuals and on a straight-line method over a period of 36 months for vehicle variants, derivatives and other regulatory projects. |
| (iii) | In respect of assets whose useful life has been revised, the unamortized depreciable amount has been charged over the revised remaining useful life. |
| (iv) | Depreciation is not recorded on capital work-in-progress until construction and installation are complete and asset is ready for its intended use. |
| (v) | Capital assets, the ownership of which does not vest with the Parent Company, other than leased assets, are depreciated over the estimated period of their utility or five years, whichever is less. |
| (e) | Fixed assets |
| (i) | Fixed assets are stated at cost of acquisition or construction less accumulated depreciation/amortization and accumulated impairment, if any. |
| (ii) | Product development cost incurred on new vehicle platform, engines, transmission and new products are recognized as fixed assets, when feasibility has been established, the Parent Company has committed technical, financial and other resources to complete the development and it is probable that the asset will generate probable future benefits. |
| (iii) | Cost includes purchase price, taxes and duties, labor cost and directly attributable overhead expenditure for self-constructed assets incurred up to the date the asset is ready for its intended use. Borrowing costs incurred for qualifying assets is capitalized up to the date the asset is ready for intended use, based on borrowings incurred specifically for financing the asset or the weighted average rate of all other borrowings, if no specific borrowings have been incurred for the asset. The cost of acquisition is further adjusted for exchange differences relating to long term foreign currency borrowings attributable to the acquisition of depreciable asset with effect from April 1, 2007. |
| (iv) | Software not exceeding Rs. 25,000 and product development costs relating to minor product enhancements, facelifts and upgrades are charged off to the Statement of Profit and Loss as and when incurred. |
| (f) | Impairment |
At each Balance Sheet date, the Parent Company assesses whether there is any indication that the fixed assets with finite lives may be impaired. If any such indication exists, the recoverable amount of the asset is estimated in order to determine the extent of the impairment, if any. Where it is not possible to estimate the recoverable amount of individual asset, the Parent Company estimates the recoverable amount of the cash-generating unit to which the asset belongs.
As at March 31, 2012,2015 none of the fixed assets were considered impaired.
| (g) | Leases |
| (i) | Finance lease |
Assets acquired under finance leases are recognized as an asset and a liability at the commencement of the lease, at the lower of the fair value of the assets and the present value of minimum lease payments. The finance expense is allocated to each period during the lease term so as to produce a constant periodic rate of interest on conversionthe remaining balance of 4%the liability. Assets given under finance leases are recognised as receivables at an amount equal to the net investment in the lease and the finance income is based on a constant rate of return on the outstanding net investment.
| (ii) | Operating lease |
Leases other than finance lease, are operating leases, and the leased assets are not recognized on the Parent Company’s Balance Sheet. Payments under operating leases are recognized in the Statement of Profit and Loss on a straight-line basis over the term of the lease.
| (h) | Transactions in foreign currencies and accounting of derivatives |
| (i) | Exchange differences |
Transactions in foreign currencies are recorded at the exchange rates prevailing on the date of the transaction. Foreign Currency Convertible Notes (USD)currency monetary assets and liabilities are translated at year end exchange rates.
| (1) | Exchange differences arising on settlement of transactions and translation of monetary items other than those covered by (2) below are recognized as income or expense in the year in which they arise. Exchange differences considered as borrowing cost are capitalized to the extent these relate to the acquisition/construction of qualifying assets and the balance amount is recognized in the Statement of Profit and Loss. |
| (2) | Exchange differences relating to long term foreign currency monetary assets/liabilities are accounted for with effect from April 1, 2007 in the following manner: |
Differences relating to borrowings attributable to the acquisition of depreciable capital assets are added to/deducted from the cost of such capital assets.
Other differences were accumulated in foreign currency monetary item translation difference account and amortized over the period, beginning April 1, 2007 or date of inception of such item, as applicable, and ending on March 31, 2011 or the date of its maturity, whichever was earlier.
Pursuant to notification issued by the Ministry of Corporate Affairs on December 29, 2011, the exchange differences on long-term foreign currency monetary items (other than those relating to acquisition of depreciable assets) are amortized over the period till the date of maturity or March 31, 2020, whichever is earlier.
| (ii) | Hedge accounting |
The Parent Company uses foreign currency forward contracts to hedge its risks associated with foreign currency fluctuations relating to highly probable forecast transactions. With effect from April 1, 2008, the Parent Company designates such forward contracts in a cash flow hedging relationship by applying the hedge accounting principles set out in Accounting Standard 30- Financial Instruments: Recognition and Measurement.
These forward contracts are stated at fair value at each reporting date. Changes in the fair value of these forward and option contracts that are designated and effective as hedges of future cash flows are recognized directly in hedging reserve account under reserves and surplus, net of applicable deferred income taxes and the ineffective portion is recognized immediately in the Statement of Profit and Loss.
Amounts accumulated in the hedging reserve account are reclassified to Profit and Loss in the periods during which the forecasted transaction occurs.
Hedge accounting is discontinued when the hedging instrument expires or is sold, terminated, or exercised, or no longer qualifies for hedge accounting. For forecasted transactions, any cumulative gain or loss on the hedging instrument recognised in Hedging reserve account is retained there until the forecasted transaction occurs.
If the forecasted transaction is no longer expected to occur, the net cumulative gain or loss recognized in hedging reserve account is immediately transferred to the Statement of Profit and Loss. Foreign currency options and other derivatives are stated at fair value as at the year end with changes in fair value recognized in the Statement of Profit and Loss.
| (iii) | Premium or discount on forward contracts other than those covered in (ii) above is amortised over the life of such contracts and is recognized as income or expense. |
| (i) | Product warranty expenses |
The estimated liability for product warranties is recorded when products are sold. These estimates are established using historical information on the nature, frequency and average cost of warranty claims and management estimates regarding possible future incidence based on corrective actions on product failures. The timing of outflows will vary as and when warranty claim will arise - being typically up to 3 to 4 years.
| (j) | Income on vehicle loan |
Interest income from loan contracts are accounted for by using the internal rate of return method. Consequently, a constant rate of return on the net outstanding amount is accrued over the period of contract. The Parent Company provides an allowance for hire purchase and loan receivables that are in arrears for more than 11 months, to the extent of an amount equivalent to the outstanding principal and amounts due 2014but unpaid, considering probable inherent loss including estimated realization based on past performance trends. In respect of loan contracts that are in arrears for more than 6 months but not more than 11 months, allowance is anti-dilutiveprovided to the extent of 10% of the outstanding and amount due but unpaid.
| (k) | Inventories |
Inventories are valued at the lower of cost and net realizable value. Cost of raw materials and consumables are ascertained on a moving weighted average/monthly moving weighted average basis. Cost, including variable and fixed overheads, are allocated to work-in-progress, stock-in-trade and finished goods determined on full absorption cost basis. Net realizable value is estimated selling price in the ordinary course of business less estimated cost of completion and selling expenses.
| (l) | Employee benefits |
| (i) | Gratuity |
The Parent Company has an obligation towards gratuity, a defined benefit retirement plan covering eligible employees. The plan provides for a lump sum payment to vested employees at retirement, death while in employment or on termination of employment of an amount equivalent to 15 to 30 days salary payable for each completed year of service. Vesting occurs upon completion of five years of service. The Parent Company makes annual contributions to gratuity fund established as trust. The Parent Company accounts for the liability for gratuity benefits payable in future based on an independent actuarial valuation carried out at each Balance Sheet date using the projected unit credit method.
| (ii) | Superannuation |
The Parent Company has two superannuation plans, a defined benefit plan and a defined contribution plan. An eligible employee on April 1, 1996 could elect to be a member of either plan.
Employees who are members of the defined benefit superannuation plan are entitled to benefits depending on the years of service and salary drawn. The monthly pension benefits after retirement range from 0.75% to 2% of the annual basic salary for each year of service. The Parent Company accounts for the liability for superannuation benefits payable in future under the plan based on an independent actuarial valuation as at Balance Sheet date.
With effect from April 1, 2003, this plan was amended and benefits earned by covered employees have been protected as at March 31, 2003. Employees covered by this plan are prospectively entitled to benefits computed on a basis that ensures that the annual cost of providing the pension benefits would not exceed 15% of salary.
During the year ended March 31, 20122015, the employees covered by this plan were given a one time option to exit from the plan prospectively. Further, the employees who opted for exit were given a one time option to withdraw accumulated balances from the superannuation plan.
The Parent Company maintains a separate irrevocable trust for employees covered and have notentitled to benefits. The Parent Company contributes up to 15% or Rs.100,000, whichever is lower, of the eligible employees’ salary to the trust every year. The Parent Company recognizes such contributions as an expense when incurred. The Parent Company has no further obligation beyond this contribution.
| (iii) | Bhavishya Kalyan Yojana (BKY) |
Bhavishya Kalyan Yojana is an unfunded defined benefit plan for employees of the Parent Company. The benefits of the plan include pension in certain case, payable up to the date of normal superannuation had the employee been consideredin service, to an eligible employee at the time of death or permanent disablement, while in service, either as a result of an injury or as certified by the appropriate authority. The monthly payment to dependents of the deceased/disabled employee under the plan equals 50% of the salary drawn at the time of death or accident or a specified amount, whichever is higher. The Parent Company accounts for the liability for BKY benefits payable in future based on an independent actuarial valuation as at Balance Sheet date.
| (iv) | Post-retirement medicare scheme |
Under this scheme, employees of the Parent Company receive medical benefits subject to certain limits of amount, periods after retirement and types of benefits, depending on their grade and location at the time of retirement. Employees separated from the Parent Company as part of the Early Separation Scheme, on medical grounds or due to permanent disablement are also covered under the scheme. The liability for post-retirement medical scheme is based on an independent actuarial valuation as at Balance Sheet date.
| (v) | Provident fund |
The eligible employees of the Parent Company are entitled to receive benefits in respect of provident fund, a defined contribution plan, in which both employees and the Parent Company make monthly contributions at a specified percentage of the covered employees’ salary (currently 12% of employees’ salary). The contributions as specified under the law are made to the provident fund and pension fund set up as irrevocable trust by the Parent Company . The Parent Company is generally liable for annual contributions and any shortfall in the computationfund assets based on the government specified minimum rates of diluted EPS.return or pension and recognizes such contributions and shortfall, if any, as an expense in the year incurred.
| (vi) | Compensated absences |
The effectParent Company provides for the encashment of 150,079,945 Ordinary shares issuable asleave or leave with pay subject to certain rules. The employees are entitled to accumulate leave subject to certain limits, for future encashment. The liability is provided based on the number of March 31, 2011,days of unutilised leave at each balance sheet date on conversionthe basis of Zero Coupon Convertible Alternative Reference Securitiesan independent actuarial valuation.
| (m) | Investments |
Long-term investments are stated at cost less other than temporary diminution in value, if any. Current investments are stated at lower of cost and other Foreign Currency Convertible Notes,fair value. Fair value of investments in mutual funds are determined on a portfolio basis.
| (n) | Income taxes |
Tax expense comprises current and deferred taxes.
Current tax is anti-dilutivethe amount of tax payable on the taxable income for the year as determined in accordance with the provisions of the Income Tax Act, 1961. Current tax is net of credit for entitlement for Minimum Alternative Tax (MAT).
Deferred tax is recognized, on timing differences, being the difference between taxable income and accounting income that originate in one period and are capable of reversal in one or more subsequent periods.
Deferred tax assets in respect of unabsorbed depreciation and carry forward of losses are recognized if there is virtual certainty that there will be sufficient future taxable income available to realize such losses. Other deferred tax assets are recognized if there is reasonable certainity that there will be sufficient future taxable income to realize such assets.
Deferred tax assets and liabilities are measured based on the tax rates that are expected to apply in the period when asset is realized or the liability is settled, based on tax rates and tax laws that have been enacted or substantively enacted by the balance sheet date.
| (o) | Redemption premium on non-convertible debentures (NCD) |
Premium payable on redemption of NCD as per the terms of issue, is provided fully in the year of issue by adjusting against the securities premium account (SPA) (net of tax).
| (p) | Borrowing costs |
Fees towards structuring/arrangements and underwriting and other incidental costs incurred in connection with borrowings are amortized over the period of the loan
| (q) | Liabilities and contingent liabilities |
The Parent Company records a liability for any claims where a potential loss is probable and capable of being estimated and discloses such matters in its financial statements, if material. For potential losses that are considered possible, but not probable, the Parent Company provides disclosure in the financial statements but does not record a liability in its accounts unless the loss becomes probable.
| (r) | Business segments |
The Parent Company is engaged mainly in the business of automobile products consisting of all types of commercial and passenger vehicles including financing of the vehicles sold by the Parent Company. These, in the context of Accounting Standard 17 on Segment Reporting, as specified in the Companies (Accounting Standards) Rules, 2006, are considered to constitute one single primary segment. Furthermore, there is no reportable secondary segment i.e. Geographical Segment.
F. Reconciliation from Indian GAAP to Consolidated IFRS net income
| Year ended March 31, | ||||||||||||||||||
| Notes | 2015 | 2015 | 2014 | 2013 | ||||||||||||||
| (In millions) | ||||||||||||||||||
Net income as per Indian GAAP parent only financial statements | US$ | (758.2 | ) | Rs. | (47,389.5 | ) | Rs. | 3,345.2 | Rs. | 3,018.1 | ||||||||
IFRS adjustments to parent only financial statements (net of consequential tax impact): | ||||||||||||||||||
Foreign currency convertible notes – conversion options and interest thereon | [a] | — | — | (1,170.2 | ) | (941.5 | ) | |||||||||||
Gain on fair value of below market interest loan (net of effective interest rate adjustment) | [b] | 6.9 | 434.1 | 2,107.9 | 1,427.8 | |||||||||||||
Reversal of exchange gain/(loss) accumulated in foreign currency monetary item translation difference account | [c] | 29.8 | 1,862.9 | 137.7 | 433.5 | |||||||||||||
Property, plant and equipment and intangible assets: | [d] | |||||||||||||||||
(i) Foreign exchange (net of depreciation) | (14.5 | ) | (904.1 | ) | (1,073.5 | ) | (1,326.5 | ) | ||||||||||
(ii) Pre-operative expenses (net of depreciation) | 0.3 | 20.4 | 20.4 | 57.3 | ||||||||||||||
(iii) Interest capitalized (net of depreciation) | (2.8 | ) | (175.2 | ) | (75.4 | ) | 217.8 | |||||||||||
Interest including debt issue expenses | [e] | (33.2 | ) | (2,073.6 | ) | (4,121.6 | ) | (3,969.4 | ) | |||||||||
Loss on available-for-sale investments | [g] | — | — | — | (1,063.8 | ) | ||||||||||||
Others (net) | 11.3 | 708.9 | 65.3 | 32.6 | ||||||||||||||
|
|
|
|
|
|
|
| |||||||||||
Total IFRS adjustments to parent only financial statements | (2.2 | ) | (126.6 | ) | (4,109.4 | ) | (5,132.2 | ) | ||||||||||
|
|
|
|
|
|
|
| |||||||||||
Net income/(loss) as per IFRS parent only financial statements | US$ | (760.4 | ) | Rs. | (47,516.1 | ) | Rs. | (764.2 | ) | Rs. | (2,114.1 | ) | ||||||
Share of net income of subsidiaries and joint operations | 2,856.2 | 178,500.2 | 141,998.6 | 92,030.8 | ||||||||||||||
Share of net Income/(loss) and impairment of equity accounted investees (net) | (30.5 | ) | (1,901.7 | ) | (10,055.8 | ) | (360.0 | ) | ||||||||||
|
|
|
|
|
|
|
| |||||||||||
Net income as per consolidated income statement under IFRS | US$ | 2,065.3 | Rs. | 129,082.4 | Rs. | 131,178.6 | Rs. | 89,556.7 | ||||||||||
|
|
|
|
|
|
|
| |||||||||||
G. Reconciliation from Indian GAAP to consolidated IFRS total comprehensive income Net income as per consolidated income statement under IFRS IFRS adjustments to parent only financial statements (net of consequential tax impact): Fair value gain/(loss) on available-for-sale investments Others (net) Total IFRS adjustments to parent only financial statements Share of other comprehensive income of subsidiaries and joint operations Share of other comprehensive income of equity accounted investees Consolidated other comprehensive income/(loss) for the year under IFRS Consolidated total comprehensive income/(loss) for the year under IFRS Year ended March 31, Notes 2015 2015 2014 2013 (In millions) US$ 2,065.3 Rs. 129,082.4 Rs. 131,178.6 Rs. 89,556.7 [g] (5.3 ) (331.2 ) 294.2 420.5 (3.6 ) (222.3 ) (53.2 ) (9.2 ) US$ (8.9 ) Rs. (553.5 ) Rs. 241.0 Rs. 411.3 (3,436.9 ) (214,809.1 ) 124,511.4 (37,426.1 ) 18.3 1,143.0 430.0 27.4 (3,427.5 ) (214,219.6 ) 125,182.4 (36,987.4 ) US$ (1,362.2 ) Rs. (85,137.2 ) Rs. 256,361.0 Rs. 52,569.3
H. Reconciliation from Indian GAAP to consolidated IFRS total shareholders’ equity
| Year ended March 31, | ||||||||||||||
Notes | 2015 | 2015 | 2014 | |||||||||||
| (In millions) | ||||||||||||||
Shareholders’ equity as per Indian GAAP parent only financial statements | US$ | 2,378.0 | Rs. | 148,625.9 | Rs. | 191,766.5 | ||||||||
IFRS adjustments to parent only financial statements (net of consequential tax impact): | ||||||||||||||
Gain on fair value of below market interest loan | [b] | 63.5 | 3,969.8 | 3,535.7 | ||||||||||
Property, plant and equipment and intangible assets: | [c],[d] | |||||||||||||
(i) Foreign exchange (net of depreciation) | (87.8 | ) | (5,487.1 | ) | (4,583.0 | ) | ||||||||
(ii) Pre-operative expenses (net of depreciation) | (5.4 | ) | (335.9 | ) | (356.3 | ) | ||||||||
(iii) Interest capitalized (net of depreciation) | 19.7 | 1,232.9 | 1,408.1 | |||||||||||
Interest including debt issue expenses | [e] | — | — | 3,359.0 | ||||||||||
Dividend | [f] | — | — | 7,419.5 | ||||||||||
Fair value losses on available-for-sale investments | [g] | (16.3 | ) | (1,017.7 | ) | (686.5 | ) | |||||||
Others (net) | 12.9 | 805.5 | 485.7 | |||||||||||
|
|
|
|
|
| |||||||||
Total IFRS adjustments to parent only financial statements | (13.4 | ) | (832.5 | ) | 10,582.2 | |||||||||
|
|
|
|
|
| |||||||||
Shareholders’ equity as per IFRS parent only financial statements | US$ | 2,364.6 | Rs. | 147,793.4 | Rs. | 202,348.7 | ||||||||
Share of equity of subsidiaries and joint operations | 6,241.7 | 390,099.8 | 427,130.3 | |||||||||||
Share of retained earnings and fair value adjustment of equity accounted investees | 23.3 | 1,458.6 | 2,217.3 | |||||||||||
|
|
|
|
|
| |||||||||
Shareholders’ equity as per consolidated balance sheet under IFRS | US$ | 8,629.6 | Rs. | 539,351.8 | Rs. | 631,696.3 | ||||||||
|
|
|
|
|
| |||||||||
I. Notes to reconciliation between Indian GAAP to IFRS
| [a] | Foreign currency convertible notes |
Under IFRS, the conversion option embedded in foreign currency convertible notes (FCCNs) is accounted for separately as derivative instrument. At the inception, issue proceeds from the FCCNs are allocated to conversion option with residual allocated to the FCCNs to establish its initial carrying cost.
Subsequently the conversion option is measured at fair value through profit or loss with changes in fair value recognized in the income statement and the FCCNs are carried at amortized cost.
Under Indian GAAP the conversion option is not separately accounted for and full proceeds are allocated to the FCCNs. Furthermore, the entire redemption premium and debt issue expenses associated with the FCCNs are charged directly to additional paid-in capital. This results into following differences between IFRS and Indian GAAP in addition to fair value movements of conversion option recorded in the income statement under IFRS:
| (i) | Higher interest costs under IFRS; and |
| (ii) | Higher interest capitalization as described below (refer to note [d]). |
| [b] | Gain on fair value of below market interest loan |
Under IFRS, if the Company has received below market interest rate loan, it is required to be recorded in the books at the fair value by discounting with borrowing rate as on date of obtaining the loan. Accordingly, a gain has been recorded in the income statement. The gain recorded will reverse through income statement going forward till maturity of the loan as interest expense through the effective interest rate method.
Under Indian GAAP, the loan is recorded same as the amount received.
| [c] | Reversal of exchange gain/(loss) accumulated in foreign currency monetary item translation difference account |
Under IFRS, all exchange differences are accounted for in the income statement in the period in which they arise.
Under Indian GAAP, exchange differences relating to long term foreign currency monetary assets/liabilities are accounted for in the following manner:
| (i) | Differences relating to borrowings attributable to the acquisition of the depreciable capital asset are added to/deducted from the cost of such capital assets; |
| (ii) | Other differences are accumulated in foreign currency monetary item translation difference account, to be amortized over the period, beginning April 1, 2011 or date of inception of such item, as applicable, and ending on March 31, 2020 or the date of its maturity, whichever is earlier. |
| [d] | Property, plant and equipment and intangible assets |
Under IFRS, all foreign exchange transaction gains and losses are included in net income except to the extent these are treated as an adjustment to interest cost and considered for capitalization.
Under Indian GAAP, foreign exchange gains and losses arising on foreign currency denominated borrowings that are incurred to acquire property, plant and equipment and intangible assets are included in the cost of the asset and depreciated over their remaining useful life.
Furthermore under Indian GAAP, the cost of property, plant and equipment and intangible assets also includes indirectly attributable expenses that are incurred before a property, plant and equipment and intangible assets is ready for its intended use.
Under IFRS, such costs are expensed as incurred. Under IFRS, interest costs are higher than under Indian GAAP resulting into higher interest capitalization (refer to note [a] above and note [e] below).
Consequently, depreciation relating to the above differences in the cost of property, plant and equipment under IFRS and Indian GAAP has also been adjusted.
| [e] | Interest including debt issue expenses |
Under IFRS, redemption premium and debt issue expenses are recognized as interest cost over the life of the debt instrument/ borrowing using the effective interest method.
Under Indian GAAP, the entire redemption premium associated with the debt instruments is charged directly to additional paid-in capital and issue expenses are either charged directly to the additional paid-in capital and/or are deferred and amortized over the life of the debt instruments.
| [f] | Dividends |
Under IFRS, dividends payable are recorded as a liability in the year in which these are declared and approved.
Under Indian GAAP, dividends payable are recorded as a liability in the year to which they relate.
| [g] | Investments |
Under IFRS, available-for-sale investments consisting of debt securities and equity securities are measured at fair value at each reporting date, except for investment in equity instruments which do not have quoted market price in an active market and whose fair value cannot be reliably measured. Unrealized gains or losses (net of tax) are recognized directly in statement of other comprehensive income. Impairment losses are reclassified to income statement.
Under Indian GAAP, investments are classified into current and long-term investments. Current investments are carried at lower of cost or market value, while long term investments are carried at cost less any impairment that is other than temporary.
Notes to Schedule 1
Schedule 1 has been provided pursuant to the requirements of Rule 12-04 (a) of Regulation S-X, which requires condensed financial information as to financial position, cash flows and results of operations of the Parent Company as of the same dates and for the same periods for which audited consolidated financial statements have been presented because restricted net assets of the consolidated subsidiaries exceed 25% of the consolidated net assets as at March 31, 2015.
As at March 31, 2015 and 2014, Rs.344,346.3 million and Rs.245,349.0 million respectively, of restricted net assets were not available for distribution.
Basis of preparation:
The separate condensed financial information of Tata Motors Limited on a standalone basis (parent only) has been presented in accordance with generally accepted accounting principles in India (“Indian GAAP”) and includes a reconciliation of shareholders’ equity, net income and total comprehensive income to the consolidated financial statements prepared under IFRS.
There are no material differences between Indian GAAP and IFRS as it relates to the separate cash flow statement of Tata Motors Limited on a standalone basis.
Tata Motors Limited maintains its accounting records under Indian GAAP and does not provide separate financial information using IFRS on a standalone basis for any other purpose.
During the years ended March 31, 20112015, 2014 and have not been considered in2013, cash dividends amounting to Rs.16,538.2 million, Rs.15,884.0 million and Rs.16,424.0 million were paid to the computation of diluted EPS.Parent Company by its subsidiaries, joint operations and equity accounted investees, respectively.
F-86F-103